Table of Contents
Letter to Shareholders
Dear Shareholder,
Over the past year, the ETF business has grown and Emerging Global Advisors has grown with it. In the last quarter of 2010, global ETF assets passed the $1 trillion mark. The majority of the most recent flows found their way into emerging markets strategies. We continue to believe that as developed markets investors learn more about the emerging markets (EMs) investment story, the more interesting the opportunity becomes. We also believe that the natural and sensible progression for institutional and other professional investors in emerging markets is trending towards the application of tools that provide more specific exposures. ETFs have proven to be an effective way to express investor opinions in these difficult to trade countries. We have focused on, and will continue to provide, what we feel are the most appropriate tools given the economic drivers in these regions.
As is the case in most equity investing, gaining exposure to emerging market economies comes with some risks. Some of these risks are broad equity-based and others are specific to EMs. We believe that certain risk factors such as political risk actually exist to a large degree in developed markets and not just in emerging markets. As I have stated in our previous reports, we believe this continues to favor emerging market investments and the weapon of choice continues to be the exchange traded fund.
From an investor’s point of view, we see the global investment opportunity for growth investing in its simplest terms. We see the United States, the United Kingdom, Japan, Western Europe, Korea and Taiwan as slower growers (in terms of GDP and locally domiciled company earnings growth) and Southeast Asia, Latin America, The Middle East/North Africa region and Eastern Europe as faster growing regions. As such, we believe investors now need to look globally for their exposure to what many investors refer to as “Growth” investment opportunities. There are a handful of notable fast growing companies that are domiciled in the slower growth regions around the world, but it is uncertain if any sectors or industries, as a group, are likely to grow with any significance over the longer term. Although the past is not always indicative of the future, strong growth rates require what we refer to as a population dividend, or demand driven economy. The US and Japan were once such economies, but a slower growing and aging population, an unsustainable ratio of government debt to GDP and a large amount of consumer debt have put a drag on developed market economic growth. Although there can be no assurances of future growth rates, Emerging Global Advisors has positioned itself squarely in front of the faster growing global economic trends.
To that end, we believe our funds represent asset categories that could provide great potential for active managers to provide accretive exposures to their EM portfolios. For example, it is not enough that we provide investors with a Brazilian ETF. Our Brazil Infrastructure ETF is positioned to potentially benefit from the Brazilian government’s commitment over the next five to ten years. Other EGA ETFs specifically target the domestic EM consumer, another primary driver of these economies.
Ongoing research related to the specific purpose of further product development efforts has been and always will be a focus of our firm. Innovation in our product lineup and a deep appreciation and understanding of the EM opportunity provides us with an edge to make products attractive to investors. We will continue to introduce products in areas we believe will provide a competitive advantage to our firm.
In the first quarter of 2011, I made a very important decision to help better assure our rate of growth will continue to outpace our peers in the asset management industry. On February 7th, I hired Marten Hoekstra who joined the firm as Chief Executive Officer. Mr. Hoekstra was most recently CEO of UBS Wealth Management Americas and a member of parent company UBS’ Group Executive Board. Mr. Hoekstra spent 26 years at UBS, which includes his executive positions with a predecessor firm, PaineWebber. After 2001, he held various management roles in Zurich and the United States on the executive committee of the firm's Global Wealth Management & Business Banking unit, including Deputy CEO. He was also Head of Market Strategy and Development for UBS’ wealth management businesses outside of North America. He became a member of UBS' Group Managing Board in July 2002. He assumes the CEO position from me. I will continue as president and concentrate on investment product development, a discipline that has been a primary focus throughout my career. We strive to be the leading brand for emerging market investing and Mr. Hoekstra has the global vision and experience to help us reach that goal. We are significantly advantaged having him lead our team.
Thank you for your support of Emerging Global Advisors ETFs.
Sincerely,

Robert C. Holderith
President & Founder
Emerging Global Advisors, LLC
EGA Emerging Global Shares Trust 1
Comments from CIO/Director of Research
Dear Shareholder:
The bull market which commenced in March of 2009 continued for most of the 12-month period ending March 31, 2011. Interestingly, various capital markets behaved quite differently in the second half of this 12-month period. Investors went from a risk taking to risk aversion stance and exited from positions many of which had performed well during the bull rally. Emerging market investments of various asset categories (equities, fixed income, currency) underperformed those of developed markets. Whether it be because of a positive outlook for the future affects of Quantitative Easing 21 or other rationales, the US market was relatively strong in the calendar year 2010. This was especially true in the latter half of 2010. With the large cap S&P 5002 underperforming US small caps, investors were not only bullish on the US economy but on the potential for US consumers. This despite lingering concerns of high unemployment, unsustainable debt levels and partisan government muddling through towards the next presidential election.
European concerns regarding sovereign risk remain. The concern is well beyond Greece with every single member of Portugal, Ireland, Italy, Greece and Spain (PIIGS) getting significant press time. Austerity plans and implementation seem unimpressive and various participants talk of default. The Japanese earthquake and resulting tsunami has yet again introduced the X-factor or “black swan” to investors and their portfolios. Although the damage in terms of life and property will have lingering affects, the long-term consideration revolves around energy policy. Do nuclear power plants on the Pacific Rim’s “ring of fire” make sense especially when considering population density?
This is just the developed markets. Add uncertainty from the emerging markets and investors are bombarded with added risks to consider.
The primary concern seems not to be social unrest and armed conflict (Libya) in the Mideast/North Africa (MENA) region. The spread of peaceful uprising is certainly what the region needs so as to compete globally with other emerging markets. Eastern Europe had its “solidarity movement” to spark a chain of events leading to the fall of the Berlin Wall, the end of Soviet sponsored communism and the spread of capitalism over socialism. Concerns on the MENA region’s ability to convert when such conversion has tinges of internal theological turmoil is an interesting debate. Given the success of Indonesia and Malaysia in the east, and progress in certain Gulf Cooperation Council (GCC) states (Qatar, UAE), there must be a path to transition.
With plenty of stand-offs (Iran-Saudi Arabia, Israel-Gaza/West Bank/Lebanon), investors have an eye on oil prices. However, we observe that during the social unrest originating in Tunis of all places there was little movement in traditional gauges of negative crowd psychology: oil prices did not spike nor did gold or VIX.3 Only in the latter half of March and into April 2011 did oil prices hit a distinctly parabolic trajectory. Fueled by a falling dollar over the latter half of the 2011 calendar year and uncertainty of the US government to keep budget deficits reasonable, it appears to be less about turmoil in the Mideast.
MENA trades little with anyone other than those within MENA. That is the cost of being behind the curve. The benefit for global investors is that MENA is quite insulated. They sneeze and we don’t catch a cold. Not true with other emerging market regions or the major economies like China.
One of the most interesting market developments in Q4 2010 and Q1 2011 was the incredible outperformance of developed markets over emerging markets. True, EMs outperformed since the bull market began in March 2009. Many reasons were cited to the strong pullback from EMs while the US market and certain other developed markets continued on a slightly positive trend.
The number one concern from emerging markets was and still is inflation. Certainly commodity inflation whether it be in oil prices, metal prices or food prices are concerns. These are input costs that affect governments, companies and households in emerging markets much more than in the developed world. Mindful of history, central banks have been prudent in applying measures to curb inflation. Monetary policy has been stringent. Controlling the money supply with interest rate movements and discussions on controls relating to currency volatility (some say, manipulation) seem to be signaling to the market that their concerns are real and their resolve is equally strong. Furthermore, money supply control domestically through limitations on the banking system’s “multiplier effect4” is clearly an effort being watched in China. With the potential for divergence between the “haves” and “have not”, but without the ability to vote someone else in, a 1-party system has no choice but to put the controls on hard. China is good at putting the controls on hard. We observe India’s continued interest rate hikes and Brazil’s ongoing public relations effort to dissuade excessive fund flows from fueling inflation within its borders as good signs that they know what’s at stake.
There were other reasons for investors to pull back from emerging markets. With India, a series of corruption scandals was enough to finally break a strong bull market there. Continued rate hikes by India’s central bank given heightened inflation fears especially related to food was not able to do what the scandals did. However, at the time of this writing such news is simply history. As with other emerging markets, corruption fears last a very short time. It’s important that the existence of corruption is not one to be dismissed. But as important is to note a simple reality. Three former emerging markets that have been very strong over the past decades leading to their re-classification now as developed markets have colorful modern histories full of corruption scandals. Even today, South Korea, Taiwan and Israel continue to be troubled with ongoing front-page scandals both in the
2 EGA Emerging Global Shares Trust
Comments from CIO/Director of Research (concluded)
realms of government and industry… but of course often in combination. These realities, although disturbing, did not prevent their rise as economic powers. One would be naïve to think that such behavior did not exist during the rise of western economies such as the US, continental Europe or Japan. Surely, it still exists today regardless of location.
In my opinion, corruption scandals are not what investors are concerned with nor should they be. The bigger picture is what needs to be considered: We had a global financial crisis but the global financial system wasn’t fixed. Huge concerns revolve around the fact that the global economy stands on a foundation built on the US, Europe and Japan. Each has its own political puzzle, debt burdens, decreasing growth outlook and decreasing geo-political influence. The timing of the rise of emerging markets is not only welcome… it is of critical necessity. We need to look for slack somewhere when the aging developed markets are incentivized to spend less and save more. The demographic scale of this situation only make the numbers more dramatic and the resulting trends self-evident. Many institutional investors such as state pension plans in the US, simply do not have enough contributors while many beneficiaries are taking too much out. While aging demographics are a burden here, such entitlement programs do not generally exist in emerging markets while at the same time they have some back stops such as government sponsored Sovereign Wealth Funds.5 A recent meeting of the BRICS (Brazil, Russia, India, China, which now includes South Africa for “S”) provides a glimpse of the future. It is not enough that they have created their own meeting to take the spotlight off the G86 annual meeting that yields little but a big expense bill for the host city. Could it be a coincidence that their talk of movement away from the US dollar and towards a basket of world currencies/commodities to represent a new global reserve standard happened a week before a credit rating agency warned of the sovereign risk associated with the USA? Re-alignment could be on the horizon. Textbooks may have to be greatly revised to re-define what a “risk free return” instrument is. Likewise, investors may have to re-calibrate their portfolios for a world where the developed markets mean just a little bit less and the emerging markets mean just a bit more. How this transition happens and its rate of acceleration is something we monitor with great interest.
Danny Quah of the London School of Economics has given a new point of view of this transition geographically. On a world map, he describes the global economy’s center of gravity. On a single point on the map he aims to find the average location of economic activity by taking into account the origination of all GDP on our planet. In 1980, this point was in the mid-Atlantic. Today it is closer to Egypt and by 2050 should be at a point near where China and India meet. Further evidence that the global shift of economic might is moving eastward.
We care less about the raw numbers and more about the trends. Significant growth is likely to be found there in the emerging economies and not here in the developed economies. We are incentivized to save; they spend more. Our aging population is a burden to our system. Their youth is hungry for a better lifestyle and embracing capitalism. We are trying to save blue collar jobs. They compete well for those same jobs (with currency and wages on their side) but are raising the bar on education and thus innovation. As Fareed Zakaria has said, it’s not about the fall of the West but the rise of the others.
Our funds are tools that seek to allow investors to participate in these important trends.

Richard C. Kang
Chief Investment Officer & Director of Research
April 27, 2011
Investors should carefully consider the investment objectives, risks, charges and expenses of the Funds before investing. To obtain a prospectus containing this and other important information, please call (888) 800-4347 or visit www.emergingglobaladvisors.com to view or download a prospectus online. Read the prospectus carefully before you invest.
Emerging market investments involve risk of capital loss from unfavorable fluctuation in currency values, from differences in generally accepted accounting principles, from economic or political instability in other nations or increased volatility and lower trading volume. This fund will concentrate its investments in issuers of one or more particular industries to the same extent that its Underlying Index is so concentrated and to the extent permitted by applicable regulatory guidance. Concentration risk results from maintaining exposure to issuers conducting business in a specific industry.
The above commentary is for informational purposes only. Nothing in this commentary should be construed as an offer or recommendation to buy or sell a particular security. The opinions and estimates noted herein are accurate as of April 27, 2011 and are subject to change.
| 1 | The second round of the Federal Reserve’s monetary policy used to stimulate the U.S. economy following the recession that began in 2007/08. QE2 was initiated in the fourth quarter of 2010 in order to jump-start the sluggish economic recovery. |
| |
| 2 | An index of 500 stocks chosen for market size, liquidity and industry grouping, among other factors. The S&P 500 is designed to be a leading indicator of U.S. equities and is meant to reflect the risk/return characteristics of the large cap universe. |
| |
| 3 | The ticker symbol for the Chicago Board Options Exchange (CBOE) Volatility Index, which shows the market’s expectation of 30-day volatility. |
| |
| 4 | The expansion of a country’s money supply that results from banks being able to lend. The size of the multiplier effect depends on the percentage of deposits that banks are required to hold as reserves. |
| |
| 5 | Pools of money derived from a country’s reserves, which are set aside for investment purposes that will benefit the country’s economy and citizens. |
| |
| 6 | The members of the Group of Eight, or G8, are Canada, France, Germany, Italy, Japan, Russia, the United Kingdom and the United States. |
EGA Emerging Global Shares Trust 3
Portfolio Summary (Unaudited)
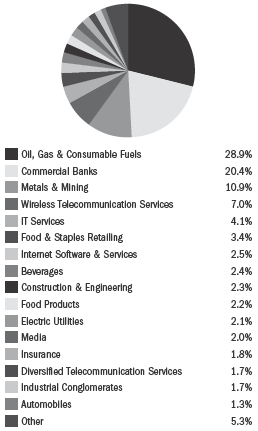
Emerging Global Shares Dow Jones Emerging Markets
Titans Composite Index Fund
Industry Breakdown*
| | |
| Top Ten Holdings* | | |
|
| Gazprom OAO | 6.9 | % |
| Itau Unibanco Holding SA | 5.7 | % |
| Petroleo Brasileiro SA | 4.6 | % |
| Reliance Industries, Ltd. | 4.3 | % |
| Vale SA | 4.0 | % |
| Infosys Technologies, Ltd. | 3.8 | % |
| America Movil SAB de CV | 3.8 | % |
| Industrial and Commercial Bank of China, Ltd. | 3.8 | % |
| China Construction Bank Corp. | 3.4 | % |
| Surgutneftegas | 3.0 | % |
| * | Expressed as a percentage of total investments in securities as of 3/31/2011. |
Emerging Global Shares Dow Jones Emerging Markets Titans Composite Index Fund (ticker: EEG)
The Fund seeks investment results that generally correspond (before fees and expenses) to the price and yield performance of the Dow Jones Emerging Markets Sector Titans Composite 100 Index. The Dow Jones Emerging Markets Sector Titans Composite 100 Index is a stock market index comprised of a representative sample of 100 emerging markets companies that Dow Jones Indexes deems to be the 10 leading companies in each of the 10 industrial sectors, as defined by the Industry Classification Benchmark (ICB), across the developing world. Under normal circumstances, the Fund will invest at least 80% of its net assets in companies included in the Index and generally expects to be substantially invested at such times, with at least 95% of its net assets invested in these securities. The Fund will provide shareholders with at least 60 days’ notice prior to any change in this policy.
The Emerging Global Shares Dow Jones Emerging Markets Titans Composite Index Fund covers the broad emerging markets, in our opinion, better than any other broad exposure fund. The underlying index does not include South Korea, Taiwan and Israel which other emerging market indices often include. For many investors new to gaining exposure to markets in the developing world, they are more familiar with the concept of BRIC economies (Brazil, Russia, India, China) which this Fund has its most exposure to. In fact, the weights are ranked in this Fund as Brazil, then China, Russia ad India with South Africa in fifth place. These top five country exposures make up 83% of the Fund as of March 31. Coincidentally, the recent BRICS meeting in China included South Africa as the last “S” in the moniker. The remainder of the Fund mainly covers Mexico, Chile, Malaysia and Indonesia.
The Emerging Global Shares Dow Jones Emerging Markets Titans Composite Index Fund had a total return of 3.64% at net asset value (“NAV”) for the quarter ended March 31, 2011 and 22.77% annualized return since its inception date of July 22, 2009. The Fund NAV had a 16.04% return for the full year ending March 31, 2011.
Performance Charts
The following performance chart is provided for comparative purposes and represents the period noted. The Fund’s per share NAV is the value of one share of the Fund and is calculated by dividing the value of total assets less total liabilities by the number of shares outstanding. The NAV return is based on the NAV of the Fund and the market return is based on the market price per share of the Fund. The price used to calculate market price returns is the mid-point of the highest bid and lowest offer for Fund shares as of the close of trading on the exchange where Fund shares are listed. NAV and market returns assume that dividends and capital gain distributions have been reinvested in the Fund at NAV and market price, respectively. As with other ETFs, NAV returns and market price returns may differ because of factors such as the supply and demand for Fund shares and investors’ assessments of the underlying value of a Fund’s portfolio securities. An index is a statistical measure of a specified financial market or sector. An index does not actually hold a portfolio of securities, incur expenses or pay any transaction costs. Therefore index returns do not reflect deductions for fees or expenses and are not available for direct investment. In comparison, the Fund’s performance is negatively impacted by these deductions. Fund returns do not reflect brokerage commissions or taxes on transactions in Fund shares or that a shareholder would pay on Fund distributions.
4 EGA Emerging Global Shares Trust
Emerging Global Shares Dow Jones Emerging Markets
Titans Composite Index Fund
| | | |
| Performance as of 3/31/2011 | | | |
|
| |
| | Average Annual Total Return |
| |
|
| | Fund
Net Asset Value | Fund
Market Price | Dow Jones
Emerging Markets
Sector Titans
Composite 100 Index |
|
| 1 Year | 16.04% | 15.09% | 17.35% |
| Since Inception1 | 22.77% | 22.46% | 25.09% |
|
| 1 July 22, 2009. | | | |
Performance data quoted represents past performance. Investment return and principal value of an investment will fluctuate so that an investor’s shares, when sold or redeemed, may be worth more or less than the original cost. Current performance data may be higher or lower than actual data quoted. For the most current month-end performance data please visit www.egshares.com or call (888) 800-4347. As stated in the current prospectus, the Fund’s total annual operating expense ratio is 0.75%. Market price returns are based on the mid-point of the highest bid and lowest offer for Fund shares as of the scheduled close of regular trading on the New York Stock Exchange (“NYSE”) Arca, ordinarily 4:00 p.m. Eastern time, on each day during which the NYSE is open for trading, and do not represent the returns an investor would receive if shares were traded at other times.
Value of a $10,000 Investment Since Inception at Net Asset Value
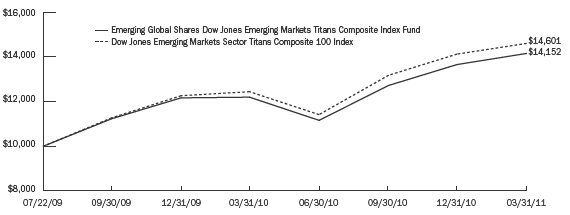
The chart above represents historical performance of a hypothetical investment of $10,000 over the life of the Fund, assuming the reinvestment of distributions. Past performance does not guarantee future results. The hypothetical example does not represent the returns of any particular investment.
EGA Emerging Global Shares Trust 5
Portfolio Summary (Unaudited)
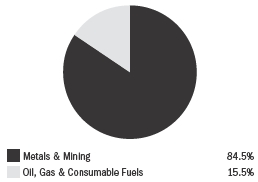
Emerging Global Shares Dow Jones Emerging Markets
Metals & Mining Titans Index Fund
Industry Breakdown*
| | |
| Top Ten Holdings* | | |
|
| Mining and Metallurgical Company Norilsk Nickel JSC | 10.1 | % |
| Vale SA | 9.3 | % |
| Sterlite Industries India, Ltd. | 7.8 | % |
| Impala Platinum Holdings, Ltd. | 6.6 | % |
| AngloGold Ashanti, Ltd. | 5.8 | % |
| Grupo Mexico SAB de CV | 5.4 | % |
| China Shenhua Energy Co., Ltd. | 4.9 | % |
| Companhia Siderurgica Nacional SA | 4.7 | % |
| Gold Fields, Ltd. | 4.4 | % |
| Yanzhou Coal Mining Co., Ltd. | 4.0 | % |
| * | Expressed as a percentage of total investments in securities as of 3/31/2011. |
Emerging Global Shares Dow Jones Emerging Markets Metals & Mining Titans Index Fund (ticker: EMT)
The Fund seeks investment results that generally correspond (before fees and expenses) to the price and yield performance of the Dow Jones Emerging Markets Metals & Mining Titans 30 Index. The Dow Jones Emerging Markets Metals & Mining Titans 30 Index is a stock market index comprised of 30 leading Emerging Markets companies that Dow Jones Indexes deems to be in the Metals & Mining sector of the global economy. The Metals & Mining sector is a sub-sector of the Basic Materials industry, as defined by ICB. Accordingly, some securities in which the Fund invests may also be held by the Emerging Global Shares Dow Jones Emerging Markets Basic Materials Titans Index. Upon normal circumstances, the Fund will invest at least 80% of its net assets in Metals & Mining companies included in the Index and generally expects to be substantially invested at such times, with at least 95% of its net assets invested in these securities. The Fund defines Metals & Mining companies as companies that are included in the Dow Jones Emerging Markets Metals & Mining Titans 30 Index at the time of purchase and generally includes companies involved in the extraction and basic processing of basic resources (other than oil and gas), such as coal, metal ore (including the production of basic aluminum, iron and steel products), precious metals and gemstones. The Fund will provide shareholders with at least 60 days’ notice prior to any change in this policy.
The Emerging Global Shares Dow Jones Emerging Markets Metals & Mining Titans Index Fund, as of March 31, 2011 was our top performing fund in terms of total return since inception. Of course, along with our energy sector ETF, the metals/mining ETF has the longest track record among our product lineup. With global concerns of rising inflation, the metals/mining sector continues to garner added attention as a hedge. For every newsworthy global event, there is usually a commodity angle whether it be related to food, energy or materials. For example, the Japanese earthquake/tsunami, although a large scale human tragedy, has turned out to be a long-term concern related to energy security. Can nuclear plants exist on the “ring of fire” where dense populations are nearby? This leads to discussions on cheaper albeit dirtier forms of energy production such as coal burning. China Shenhua Energy is a coal related name in the metals/mining fund. More obvious connections such as the rising price of gold and the resulting higher revenues for gold producers may relate to this Fund as well.
The Emerging Global Shares Dow Jones Emerging Markets Metals & Mining Titans Index Fund had a total return of -0.78% at net asset value (“NAV”) for the quarter ended March 31, 2011 and 32.56% annualized return since its inception date of May 21, 2009. The Fund NAV had a 12.95% return for the full year ending March 31, 2011.
Performance Charts
The following performance chart is provided for comparative purposes and represents the period noted. The Fund’s per share NAV is the value of one share of the Fund and is calculated by dividing the value of total assets less total liabilities by the number of shares outstanding. The NAV return is based on the NAV of the Fund and the market return is based on the market price per share of the Fund. The price used to calculate market price returns is the mid-point of the highest bid and lowest offer for Fund shares as of the close of trading on the exchange where Fund shares are listed. NAV and market returns assume that dividends and capital gain distributions have been reinvested in the Fund at NAV and market price, respectively. As with other ETFs, NAV returns and market price returns may differ because of factors such as the supply and demand for Fund shares and investors’ assessments of the underlying value of a Fund’s portfolio securities. An index is a statistical measure of a specified financial market or sector. An index does not actually hold a portfolio of securities, incur expenses or pay any transaction costs. Therefore index returns do not reflect deductions for fees or expenses and are not available for direct investment. In comparison, the Fund’s performance is negatively impacted by these deductions. Fund returns do not reflect brokerage commissions or taxes on transactions in Fund shares or that a shareholder would pay on Fund distributions.
6 EGA Emerging Global Shares Trust
Emerging Global Shares Dow Jones Emerging Markets
Metals & Mining Titans Index Fund
Performance as of 3/31/2011
| | | |
| | Average Annual Total Return |
| |
|
| | Fund
Net Asset Value | Fund
Market Price | Dow Jones
Emerging Markets
Metals & Mining
Titans 30 Index |
|
| 1 Year | 12.95% | 12.85% | 11.51% |
| Since Inception1 | 32.56% | 32.74% | 36.38% |
|
| 1 May 21, 2009. | | | |
Performance data quoted represents past performance. Investment return and principal value of an investment will fluctuate so that an investor’s shares, when sold or redeemed, may be worth more or less than the original cost. Current performance data may be higher or lower than actual data quoted. For the most current month-end performance data please visit www.egshares.com or call (888) 800-4347. As stated in the current prospectus, the Fund’s total annual operating expense ratio is 0.85%. Market price returns are based on the mid-point of the highest bid and lowest offer for Fund shares as of the scheduled close of regular trading on the New York Stock Exchange (“NYSE”) Arca, ordinarily 4:00 p.m. Eastern time, on each day during which the NYSE is open for trading, and do not represent the returns an investor would receive if shares were traded at other times.
Value of a $10,000 Investment Since Inception at Net Asset Value
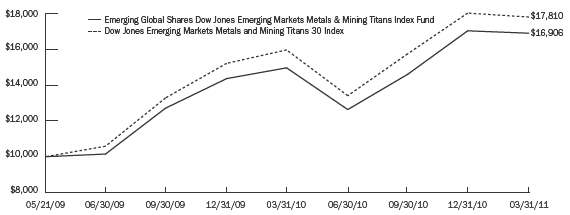
The chart above represents historical performance of a hypothetical investment of $10,000 over the life of the Fund, assuming the reinvestment of distributions. Past performance does not guarantee future results. The hypothetical example does not represent the returns of any particular investment.
EGA Emerging Global Shares Trust 7
Portfolio Summary (Unaudited)
Emerging Global Shares Dow Jones Emerging Markets
Consumer Titans Index Fund
Industry Breakdown*
| | |
| Top Ten Holdings* | | |
|
| Comphania de Bebidas DAS Americas | 9.1 | % |
| Wal-Mart de Mexico SAB de CV | 7.4 | % |
| Naspers, Ltd. | 6.0 | % |
| Grupo Televisa SA | 6.0 | % |
| Astra International Tbk PT | 5.5 | % |
| ITC, Ltd. | 5.5 | % |
| BRF - Brasil Foods SA | 5.4 | % |
| Fomento Economico Mexicano SAB de CV | 5.3 | % |
| S.A.C.I. Falabella | 4.6 | % |
| Cencosud SA | 4.5 | % |
| * | Expressed as a percentage of total investments in securities as of 3/31/2011. |
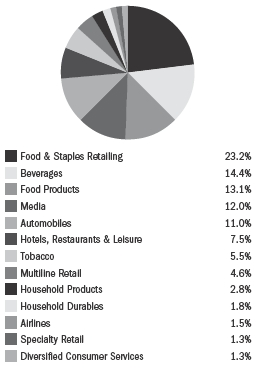
Emerging Global Shares Dow Jones Emerging Markets Consumer Titans Index Fund (ticker: ECON)
The Fund seeks investment results that generally correspond (before fees and expenses) to the price and yield performance of the Dow Jones Emerging Markets Consumer Titans 30 Index. The Dow Jones Emerging Markets Consumer Titans 30 Index is a stock market index comprised of 30 leading Emerging Markets companies that Dow Jones Indexes deems to be part of the Consumer sectors of the global economy. Under normal circumstances, the Fund will invest at least 80% of its net assets in Consumer companies included in the Index and generally expects to be substantially invested at such times, with at least 95% of its net assets invested in these securities. The Fund defines Consumer companies as companies that are included in the Dow Jones Emerging Markets Consumer Goods Titans Index and Dow Jones Emerging Markets Consumer Services Titans Index at the time of purchase and generally includes companies whose business involve: general retailers, beverage providers, food producers, media, auto& parts, travel & leisure and personal goods. The Fund will provide shareholders with at least 60 days’ notice prior to any change in this policy.
The Emerging Global Shares Dow Jones Emerging Markets Consumer Titans Index Fund is our biggest fund by assets. In terms of broad appeal, the concept of billions of new consumers who are relatively new to capitalism within their borders is easy to understand. While some investors may focus on multi-nationals who strive to increase their exposure to consumers in new growth markets, we believe that sophisticated investors will want to go straight to the source. Local providers have greater affinity with the local consumer. Brand recognition and lower costs go a long way in younger markets. The Fund focuses on the basics with large exposures to beverage makers and low cost retailers. We focus less on the increased sales of Italian cars or Swiss watches for the top 0.01% of a few billion new consumers. We seek to focus more on what a relatively poorer demographic requires as they move forward in raising their standard of living.
The Emerging Global Shares Dow Jones Emerging Markets Consumer Titans Index Fund had a total return of -1.94% at net asset value (“NAV”) for the quarter ended March 31, 2011 and 13.88% annualized return since its inception date of September 14, 2010. The Fund did not have enough history as of March 31, 2011 to provide a one-year return.
Performance Charts
The following performance chart is provided for comparative purposes and represents the period noted. The Fund’s per share NAV is the value of one share of the Fund and is calculated by dividing the value of total assets less total liabilities by the number of shares outstanding. The NAV return is based on the NAV of the Fund and the market return is based on the market price per share of the Fund. The price used to calculate market price returns is the mid-point of the highest bid and lowest offer for Fund shares as of the close of trading on the exchange where Fund shares are listed. NAV and market returns assume that dividends and capital gain distributions have been reinvested in the Fund at NAV and market price, respectively. As with other ETFs, NAV returns and market price returns may differ because of factors such as the supply and demand for Fund shares and investors’ assessments of the underlying value of a Fund’s portfolio securities. An index is a statistical measure of a specified financial costs. Therefore index returns do not reflect deductions for fees or expenses and are not available for direct investment. In comparison, the Fund’s performance is negatively impacted by these deductions. Fund returns do not reflect brokerage commissions or taxes on transactions in Fund shares or that a shareholder would pay on Fund distributions.
8 EGA Emerging Global Shares Trust
Emerging Global Shares Dow Jones Emerging Markets
Consumer Titans Index Fund
Performance as of 3/31/2011
| | | |
| | Average Annual Total Return1 |
| |
|
| | Fund
Net Asset Value | Fund
Market Price | Dow Jones
Emerging Markets
Consumer
Titans 30 Index |
|
| Since Inception2 | 13.88% | 14.08% | 14.84% |
|
| 1 | Returns of less than one year are not annualized. |
| 2 | September 14, 2010. |
Performance data quoted represents past performance. Investment return and principal value of an investment will fluctuate so that an investor’s shares, when sold or redeemed, may be worth more or less than the original cost. Current performance data may be higher or lower than actual data quoted. For the most current month-end performance data please visit www.egshares.com or call (888) 800-4347. This fund is new and has limited operating history. As stated in the current prospectus, the Fund’s total annual operating expense ratio is 0.85%. Market price returns are based on the mid-point of the highest bid and lowest offer for Fund shares as of the scheduled close of regular trading on the New York Stock Exchange (“NYSE”) Arca, ordinarily 4:00 p.m. Eastern time, on each day during which the NYSE is open for trading, and do not represent the returns an investor would receive if shares were traded at other times.
Value of a $10,000 Investment Since Inception at Net Asset Value
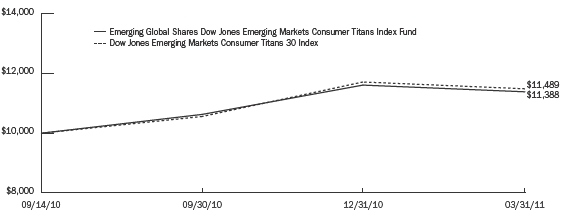
The chart above represents historical performance of a hypothetical investment of $10,000 over the life of the Fund, assuming the reinvestment of distributions. Past performance does not guarantee future results. The hypothetical example does not represent the returns of any particular investment.
EGA Emerging Global Shares Trust 9
Portfolio Summary (Unaudited)
Emerging Global Shares Dow Jones Emerging Markets
Energy Titans Index Fund
Industry Breakdown*

| | |
| Top Ten Holdings* | | |
|
| Gazprom OAO | 8.2 | % |
| CNOOC, Ltd. | 8.0 | % |
| Reliance Industries, Ltd. | 7.5 | % |
| Petroleo Brasileiro SA | 7.5 | % |
| Surgutneftegas | 6.3 | % |
| Sasol, Ltd. | 5.0 | % |
| PetroChina Co., Ltd. | 4.9 | % |
| NovaTek OAO | 4.8 | % |
| China Petroleum & Chemical Corp. | 4.6 | % |
| Tatneft | 4.5 | % |
| * | Expressed as a percentage of total investments in securities as of 3/31/2011. |
Emerging Global Shares Dow Jones Emerging Markets Energy Titans Index Fund (ticker: EEO)
The Fund seeks investment results that generally correspond (before fees and expenses) to the price and yield performance of the Dow Jones Emerging Markets Oil and Gas Titans 30 Index. Dow Jones Emerging Markets Oil and Gas Titans 30 Index is a stock market index comprised of 30 leading emerging markets companies that Dow Jones Indexes deems to be part of the Oil and Gas sector of the global economy, which also includes alternative energy sources other than oil and gas. Under normal circumstances, the Fund will invest at least 80% of its net assets in Energy companies included in the Index and generally expects to be substantially invested at such times, with at least 95% of its net assets invested in these securities. The Fund defines Energy companies as companies that are included in the Dow Jones Emerging Markets Oil and Gas Titans 30 Index at the time of purchase and generally includes companies whose businesses involve: oil and gas production; oil equipment, services and distribution; and alternative energy. The Fund will provide shareholders with at least 60 days’ notice prior to any change in this policy.
The Emerging Global Shares Dow Jones Emerging Markets Energy Titans Index Fund is another fund where we focus on its ability to provide an inflation hedge. Westerners complain of rising fuel prices. As a percentage of basic spending, it cannot compare with the burdens such basic inflation causes in the developing world. But as a result of a lower US dollar, producers have no choice but to elevate prices to compensate on any commodity priced in dollars, especially oil. Traditional energy sources are harder to find and when they are found they are usually in the developing world. Petrobras’ deep water discovery off the coast of Brazil is a good example. As with the supply side, the demand side of energy may grow in significance in the emerging markets especially as the West attempts to diversify supply dependency away from Mideast oil.
The Emerging Global Shares Dow Jones Emerging Markets Energy Titans Index Fund had a total return of 11.18% at net asset value (“NAV”) for the quarter ended March 31, 2011 and 23.44% annualized return since its inception date of May 21, 2009. The Fund NAV had a 25.96% return for the full year ending March 31, 2011.
Performance Charts
The following performance chart is provided for comparative purposes and represents the period noted. The Fund’s per share NAV is the value of one share of the Fund and is calculated by dividing the value of total assets less total liabilities by the number of shares outstanding. The NAV return is based on the NAV of the Fund and the market return is based on the market price per share of the Fund. The price used to calculate market price returns is the mid-point of the highest bid and lowest offer for Fund shares as of the close of trading on the exchange where Fund shares are listed. NAV and market returns assume that dividends and capital gain distributions have been reinvested in the Fund at NAV and market price, respectively. As with other ETFs, NAV returns and market price returns may differ because of factors such as the supply and demand for Fund shares and investors’ assessments of the underlying value of a Fund’s portfolio securities. An index is a statistical measure of a specified financial market or sector. An index does not actually hold a portfolio of securities, incur expenses or pay any transaction costs. Therefore index returns do not reflect deductions for fees or expenses and are not available for direct investment. In comparison, the Fund’s performance is negatively impacted by these deductions. Fund returns do not reflect brokerage commissions or taxes on transactions in Fund shares or that a shareholder would pay on Fund distributions.
10 EGA Emerging Global Shares Trust
Emerging Global Shares Dow Jones Emerging Markets
Energy Titans Index Fund
Performance as of 3/31/2011
| | | |
| | Average Annual Total Return |
| |
|
| | Fund
Net Asset Value | Fund
Market Price | Dow Jones
Emerging Markets
Oil and Gas
Titans 30 Index |
|
| 1 Year | 25.96% | 25.76% | 24.18% |
| Since Inception1 | 23.44% | 23.67% | 24.53% |
|
| 1 May 21, 2009. | | | |
Performance data quoted represents past performance. Investment return and principal value of an investment will fluctuate so that an investor’s shares, when sold or redeemed, may be worth more or less than the original cost. Current performance data may be higher or lower than actual data quoted. For the most current month-end performance data please visit www.egshares.com or call (888) 800-4347. As stated in the current prospectus, the Fund’s total annual operating expense ratio is 0.85%. Market price returns are based on the mid-point of the highest bid and lowest offer for Fund shares as of the scheduled close of regular trading on the New York Stock Exchange (“NYSE”) Arca, ordinarily 4:00 p.m. Eastern time, on each day during which the NYSE is open for trading, and do not represent the returns an investor would receive if shares were traded at other times.
Value of a $10,000 Investment Since Inception at Net Asset Value

The chart above represents historical performance of a hypothetical investment of $10,000 over the life of the Fund, assuming the reinvestment of distributions. Past performance does not guarantee future results. The hypothetical example does not represent the returns of any particular investment.
EGA Emerging Global Shares Trust 11
Portfolio Summary (Unaudited)
Emerging Global Shares Dow Jones Emerging Markets
Financials Titans Index Fund
Industry Breakdown*
| | |
| Top Ten Holdings* | | |
|
| Industrial and Commercial Bank of China, Ltd. | 7.9 | % |
| Itau Unibanco Holding SA | 7.4 | % |
| Banco Bradesco SA | 7.4 | % |
| China Construction Bank Corp. | 7.1 | % |
| Bank of China, Ltd. | 5.8 | % |
| ICICI Bank, Ltd. | 5.6 | % |
| China Life Insurance Co., Ltd. | 4.8 | % |
| Banco do Brasil SA | 4.4 | % |
| Ping An Insurance Group Co. of China, Ltd. | 4.2 | % |
| State Bank of India, Ltd. | 4.0 | % |
| * | Expressed as a percentage of total investments in securities as of 3/31/2011. |
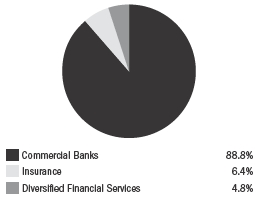
Emerging Global Shares Dow Jones Emerging Markets Financials Titans Index Fund (ticker: EFN)
The Fund seeks investment results that generally correspond (before fees and expenses) to the price and yield performance of the Dow Jones Emerging Markets Financials Titans 30 Index. The Dow Jones Emerging Markets Financials Titans 30 Index is a stock market index comprised of 30 leading emerging markets companies that Dow Jones Indexes deems to be part of the Financials sector of the global economy. Under normal circumstances, the Fund will invest at least 80% of its net assets in Financials companies included in the Index and generally expects to be substantially invested at such times, with at least 95% of its net assets invested in these securities. The Fund defines Financials companies as companies that are included in the Dow Jones Emerging Markets Financials Titans 30 Index at the time of purchase and generally includes companies whose businesses involve: banking; insurance; real estate; and financial services. The Fund will provide shareholders with at least 60 days’ notice prior to any change in this policy.
Not burdened by household or corporate indebtedness, nor with balance sheets littered with real estate related holdings, financial institutions in the emerging markets are tied to individuals and companies that are in their prime growth stage. Concerns exist in high inflation environments such as China and India on the banking system; however authorities have taken measures so as not to repeat the levered speculative behavior seen previous to the global financial crisis. This includes limiting the multiplier effect in China via the reserve ratio requirement.
The Emerging Global Shares Dow Jones Emerging Markets Financials Titans Index Fund had a total return of 0.20% at net asset value (“NAV”) for the quarter ended March 31, 2011 and 16.45% annualized return since its inception date of September 16, 2009. The Fund NAV had a 11.03% return for the full year ending March 31, 2011.
Performance Charts
The following performance chart is provided for comparative purposes and represents the period noted. The Fund’s per share NAV is the value of one share of the Fund and is calculated by dividing the value of total assets less total liabilities by the number of shares outstanding. The NAV return is based on the NAV of the Fund and the market return is based on the market price per share of the Fund. The price used to calculate market price returns is the mid-point of the highest bid and lowest offer for Fund shares as of the close of trading on the exchange where Fund shares are listed. NAV and market returns assume that dividends and capital gain distributions have been reinvested in the Fund at NAV and market price, respectively. As with other ETFs, NAV returns and market price returns may differ because of factors such as the supply and demand for Fund shares and investors’ assessments of the underlying value of a Fund’s portfolio securities. An index is a statistical measure of a specified financial market or sector. An index does not actually hold a portfolio of securities, incur expenses or pay any transaction costs. Therefore index returns do not reflect deductions for fees or expenses and are not available for direct investment. In comparison, the Fund’s performance is negatively impacted by these deductions. Fund returns do not reflect brokerage commissions or taxes on transactions in Fund shares or that a shareholder would pay on Fund distributions.
12 EGA Emerging Global Shares Trust
Emerging Global Shares Dow Jones Emerging Markets
Financials Titans Index Fund
Performance as of 3/31/2011
| | | |
| | Average Annual Total Return |
| |
|
| | Fund
Net Asset Value | Fund
Market Price | Dow Jones
Emerging Markets
Financials
Titans 30 Index |
|
| 1 Year | 11.03% | 10.05% | 13.48% |
| Since Inception1 | 16.45% | 16.29% | 14.76% |
|
| 1 September 16, 2009. | | | |
Performance data quoted represents past performance. Investment return and principal value of an investment will fluctuate so that an investor’s shares, when sold or redeemed, may be worth more or less than the original cost. Current performance data may be higher or lower than actual data quoted. For the most current month-end performance data please visit www.egshares.com or call (888) 800-4347. As stated in the current prospectus, the Fund’s total annual operating expense ratio is 0.85%. Market price returns are based on the mid-point of the highest bid and lowest offer for Fund shares as of the scheduled close of regular trading on the New York Stock Exchange (“NYSE”) Arca, ordinarily 4:00 p.m. Eastern time, on each day during which the NYSE is open for trading, and do not represent the returns an investor would receive if shares were traded at other times.
Value of a $10,000 Investment Since Inception at Net Asset Value
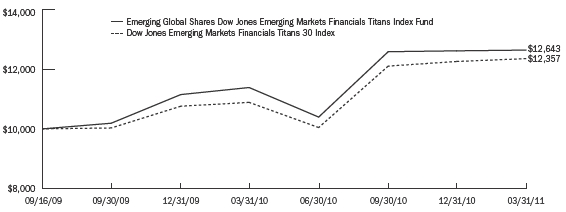
The chart above represents historical performance of a hypothetical investment of $10,000 over the life of the Fund, assuming the reinvestment of distributions. Past performance does not guarantee future results. The hypothetical example does not represent the returns of any particular investment.
EGA Emerging Global Shares Trust 13
Portfolio Summary (Unaudited)
Emerging Global Shares INDXX India Infrastructure Index Fund
Industry Breakdown*
| | |
| Top Ten Holdings* | | |
|
| Tata Motors, Ltd. | 6.3 | % |
| Sterlite Industries India, Ltd. | 5.6 | % |
| Tata Power Co., Ltd. | 5.6 | % |
| Bharti Airtel, Ltd. | 5.6 | % |
| Gail India, Ltd. | 5.4 | % |
| NTPC, Ltd. | 5.3 | % |
| Bharat Heavy Electricals, Ltd. | 4.6 | % |
| Larsen & Toubro, Ltd. | 4.5 | % |
| Siemens India, Ltd. | 4.5 | % |
| DLF, Ltd. | 4.2 | % |
| * | Expressed as a percentage of total investments in securities as of 3/31/2011. |
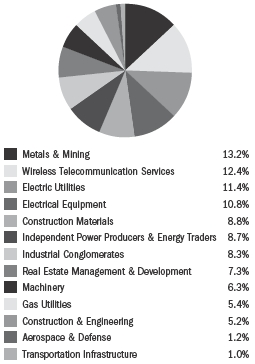
Emerging Global Shares INDXX India Infrastructure Index Fund (ticker: INXX)
The Fund seeks investment results that generally correspond (before fees and expenses) to the price and yield performance of the INDXX India Infrastructure Index (the “Underlying Index”). The Fund seeks to achieve its investment objective by attempting to replicate the portfolio of the Underlying Index through investments in equity securities, including shares traded on local exchanges, American Depositary Receipts (“ADRs”) and Global Depositary Receipts (“GDRs”). The Underlying Index is a free-float capitalization weighted stock market index comprised of 30 leading companies that INDXX, LLC determines to be representative of India’s infrastructure sectors. The Fund invests in Indian mid cap infrastructure companies that are included in the Underlying Index, which are generally defined as companies that are domiciled in India and that have a market capitalization of at least $200 million at the time of purchase. Under normal circumstances, the Fund will invest at least 80% of its net assets in Indian Infrastructure companies included in the Underlying Index and generally expects to be substantially invested at such times, with at least 95% of its nets assets invested in these securities. The Fund defines Indian Infrastructure companies as companies that are included in the Underlying Index at the time of purchase. The Fund will provide shareholders with at least 60 days’ notice prior to any change in this policy.
The Emerging Global Shares INDXX India Infrastructure Index Fund is our most compelling story related to infrastructure. From my visits to various emerging markets over the past 4 decades, I never saw such a dire need for infrastructure as I saw on my trip to Mumbai in the summer of 2010. Even the Philippines of the 1970’s looked very similar, if not better, than what I saw in Mumbai. The need for basic infrastructure (water utilities, large scale hospitals, subway systems, ports) is critical for India to compete globally with other high growth economies. Of course, to get the large and young population to consume, they will need the necessities to get to work, communicate and be educated first. Despite having a tough first quarter in 2011, India has rebounded nicely in the latter part of March. Concerns of inflation linger in India however we believe the need for infrastructure is self-evident.
The Emerging Global Shares INDXX India Infrastructure Index Fund had a total return of -7.18% at net asset value (“NAV”) for the quarter ended March 31, 2011. There was not enough track record to provide one year returns. The Fund had a -3.00% annualized return since its inception date of August 11, 2010.
Performance Charts
The following performance chart is provided for comparative purposes and represents the period noted. The Fund’s per share NAV is the value of one share of the Fund and is calculated by dividing the value of total assets less total liabilities by the number of shares outstanding. The NAV return is based on the NAV of the Fund and the market return is based on the market price per share of the Fund. The price used to calculate market price returns is the mid-point of the highest bid and lowest offer for Fund shares as of the close of trading on the exchange where Fund shares are listed. NAV and market returns assume that dividends and capital gain distributions have been returns may differ because of factors such as the supply and demand for Fund shares and investors’ assessments of the underlying value of a Fund’s portfolio securities. An index is a statistical measure of a specified financial market or sector. An index does not actually hold a portfolio of securities, incur expenses or pay any transaction costs. Therefore index returns do not reflect deductions for fees or expenses and are not available for direct investment. In comparison, the Fund’s performance is negatively impacted by these deductions. Fund returns do not reflect brokerage commissions or taxes on transactions in Fund shares or that a shareholder would pay on Fund distributions.
14 EGA Emerging Global Shares Trust
Emerging Global Shares INDXX India Infrastructure Index Fund
| | | |
| Performance as of 3/31/2011 | | | |
|
| |
| | Average Annual Total Return1 |
| |
|
| | Fund
Net Asset Value | Fund
Market Price | INDXX India
Infrastructure
Index |
|
| Since Inception2 | (3.00)% | (2.55)% | (1.42)% |
|
| 1 | Returns of less than one year are not annualized. |
| |
| 2 | August 11, 2010. |
Performance data quoted represents past performance. Investment return and principal value of an investment will fluctuate so that an investor’s shares, when sold or redeemed, may be worth more or less than the original cost. Current performance data may be higher or lower than actual data quoted. For the most current month-end performance data please visit www.egshares.com or call (888) 800-4347. This fund is new and has limited operating history. As stated in the current prospectus, the Fund’s total annual operating expense ratio is 0.85%. Market price returns are based on the mid-point of the highest bid and lowest offer for Fund shares as of the scheduled close of regular trading on the New York Stock Exchange (“NYSE”) Arca, ordinarily 4:00 p.m. Eastern time, on each day during which the NYSE is open for trading, and do not represent the returns an investor would receive if shares were traded at other times.
Value of a $10,000 Investment Since Inception at Net Asset Value
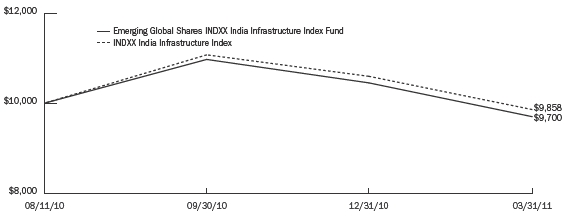
The chart above represents historical performance of a hypothetical investment of $10,000 over the life of the Fund, assuming the reinvestment of distributions. Past performance does not guarantee future results. The hypothetical example does not represent the returns of any particular investment.
EGA Emerging Global Shares Trust 15
Portfolio Summary (Unaudited)
Emerging Global Shares INDXX China Infrastructure Index Fund
Industry Breakdown*
| | |
| Top Ten Holdings* | | |
|
| Jiangxi Copper Co., Ltd. | 6.3 | % |
| China National Building Material Co., Ltd. | 5.8 | % |
| Anhui Conch Cement Co., Ltd. | 5.8 | % |
| China Telecom Corp., Ltd. | 5.2 | % |
| China Oilfield Services, Ltd. | 4.8 | % |
| China Unicom Hong Kong, Ltd. | 4.8 | % |
| Aluminum Corp. of China, Ltd. | 4.8 | % |
| China Communications Construction Co., Ltd. | 4.5 | % |
| Renhe Commercial Holdings | 4.4 | % |
| Evergrande Real Estate Group Ltd. | 3.9 | % |
| * | Expressed as a percentage of total investments in securities as of 3/31/2011. |
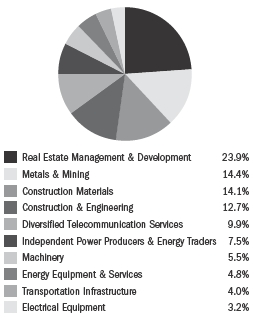
Emerging Global Shares INDXX China Infrastructure Index Fund (ticker: CHXX)
The Fund seeks investment results that generally correspond (before fees and expenses) to the price and yield performance of the INDXX China Infrastructure Index (the “Underlying Index”). The Fund seeks to achieve its investment objective by attempting to replicate the portfolio of the Underlying Index through investments in equity securities, including shares traded on local exchanges, American Depositary Receipts (“ADRs”) and Global Depositary Receipts (“GDRs”). The Underlying Index is a freefloat market capitalization weighted stock market index comprised of 30 leading companies that INDXX, LLC determines to be representative of China’s Infrastructure sectors. The Fund invests in Chinese mid cap infrastructure companies that are included in the Underlying Index, which are generally defined as companies that are domiciled in China and that have a market capitalization of at least $200 million at the time of purchase. Under normal circumstances, the Fund will invest at least 80% of its net assets in Chinese Infrastructure companies included in the Underlying Index and generally expects to be substantially invested at such times with at least 95% of its net assets invested in these securities. The Fund defines Chinese Infrastructure companies as companies that are included in the Underlying Index at the time of purchase. The Fund will provide shareholders with at least 60 days’ notice prior to any change in this policy.
The Emerging Global Shares INDXX China Infrastructure Index Fund aims to provide investors with the means to participate in one of the greatest shifts within China in our lifetime. According to Stephen Roach of Morgan Stanley, China’s 12th Five-Year Plan (2011-2015) will shift the focus from export and investment driven growth to one dependent more on its 1.3 billion consumers within. Roach contends that the 5th Five-Year Plan of the late 70’s was about Deng Xiaoping’s willingness for economic reform and opening to a market driven economy. The 9th Five-Year Plan of the mid 90’s was about ownership transition – essentially state-owned enterprise reforms. The reality now is that the vast majority of Chinese are poor. They don’t have the basic necessities to live the way we do in the West, nor to consume. You don’t just need money to consume. You need infrastructure. The vast majority of Chinese live in the interior that is what we would call a developing world. Consumerism is not about the coastline. It’s done and they have their infrastructure. But for the roughly 750 million people in the interior (twice the population of the US), we believe they need the infrastructure first and then they can consume.
The Emerging Global Shares INDXX China Infrastructure Index Fund had a total return of 4.86% at net asset value (“NAV”) for the quarter ended March 31, 2011 and 10.13% annualized return since its inception date of February 17, 2010. The Fund NAV had a 7.69% return for the full year ending March 31, 2011.
Performance Charts
The following performance chart is provided for comparative purposes and represents the period noted. The Fund’s per share NAV is the value of one share of the Fund and is calculated by dividing the value of total assets less total liabilities by the number of shares outstanding. The NAV return is based on the NAV of the Fund and the market return is based on the market price per share of the Fund. The price used to calculate market price returns is the mid-point of the highest bid and lowest offer for Fund shares as of the close of trading on the exchange where Fund shares are listed. NAV and market returns assume that dividends and capital gain distributions have been reinvested in the Fund at NAV and market price, respectively. As with other ETFs, NAV returns and market price returns may differ because of factors such as the supply and demand for Fund shares and investors’ assessments of the underlying value of a Fund’s portfolio securities. An index is a statistical measure of a specified financial market or sector. An index does not actually hold a portfolio of securities, incur expenses or pay any transaction costs. Therefore index returns do not reflect deductions for fees or expenses and are not available for direct investment. In comparison, the Fund’s performance is negatively impacted by these deductions. Fund returns do not reflect brokerage commissions or taxes on transactions in Fund shares or that a shareholder would pay on Fund distributions.
16 EGA Emerging Global Shares Trust
Emerging Global Shares INDXX China Infrastructure Index Fund
Performance as of 3/31/2011
| | | |
| | Average Annual Total Return |
| |
|
| | Fund
Net Asset Value | Fund
Market Price | INDXX China
Infrastructure
Index |
|
| 1 Year | 7.69% | 7.48% | 10.73% |
| Since Inception1 | 10.13% | 10.88% | 12.53% |
|
| 1 February 17, 2010. | | | |
Performance data quoted represents past performance. Investment return and principal value of an investment will fluctuate so that an investor’s shares, when sold or redeemed, may be worth more or less than the original cost. Current performance data may be higher or lower than actual data quoted. For the most current month-end performance data please visit www.egshares.com or call (888) 800-4347. As stated in the current prospectus, the Fund’s total annual operating expense ratio is 0.85%. Market price returns are based on the mid-point of the highest bid and lowest offer for Fund shares as of the scheduled close of regular trading on the New York Stock Exchange (“NYSE”) Arca, ordinarily 4:00 p.m. Eastern time, on each day during which the NYSE is open for trading, and do not represent the returns an investor would receive if shares were traded at other times.
Value of a $10,000 Investment Since Inception at Net Asset Value
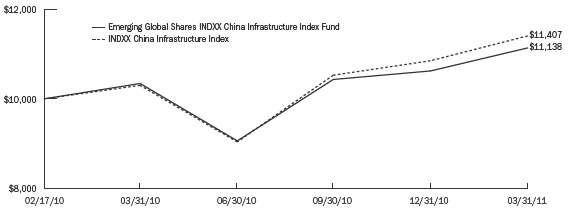
The chart above represents historical performance of a hypothetical investment of $10,000 over the life of the Fund, assuming the reinvestment of distributions. Past performance does not guarantee future results. The hypothetical example does not represent the returns of any particular investment.
EGA Emerging Global Shares Trust 17
Portfolio Summary (Unaudited)
Emerging Global Shares INDXX Brazil Infrastructure Index Fund
Industry Breakdown*
| | |
| Top Ten Holdings* | | |
|
| Telemar Norte Leste SA | 6.8 | % |
| Vivo Participacoes SA | 6.1 | % |
| Centrais Eletricas Brasileiras SA | 5.9 | % |
| CESP - Companhia Energetica de Sao Paulo | 5.4 | % |
| CPFL Energia SA | 5.2 | % |
| Companhia de Concessoes Rodoviarias SA | 5.2 | % |
| Embraer SA | 5.0 | % |
| Ultrapar Participacoes SA | 4.8 | % |
| Weg SA | 4.8 | % |
| Tele Norte Leste Participacoes SA | 4.3 | % |
| * | Expressed as a percentage of total investments in securities as of 3/31/2011. |
Emerging Global Shares INDXX Brazil Infrastructure Index Fund (ticker: BRXX)
The Fund seeks investment results that generally correspond (before fees and expenses) to the price and yield performance of the INDXX Brazil Infrastructure Index (the “Underlying Index”). The Fund seeks to achieve its investment objective by attempting to replicate the portfolio of the Underlying Index through investments in equity securities, including shares traded on local exchanges, American Depositary Receipts (“ADRs”) and Global Depositary Receipts (“GDRs”). The Underlying Index is a freefloat capitalization weighted stock market index comprised of 30 leading companies that INDXX, LLC determines to be representative of Brazil’s Infrastructure sectors. The Fund invests in Brazilian mid cap infrastructure companies that are included in the Underlying Index, which are generally defined as companies that are domiciled in Brazil and that have a market capitalization of at least $200 million at the time of purchase. Under normal circumstances, the Fund will invest at least 80% of its net assets in Brazilian Infrastructure companies included in the Underlying Index and generally expects to be substantially invested at such times, with at least 95% of its net assets invested in these securities. The Fund defines Brazilian Infrastructure companies as companies that are included in the Underlying Index at the time of purchase. The Fund will provide shareholders with at least 60 days’ notice prior to any change in this policy.
The Emerging Global Shares INDXX Brazil Infrastructure Index Fund is in many ways like our other infrastructure funds. It is a play on a country that is truly in need of emerging on a grander scale. For Brazil, it’s just as much the movement of natural resources and voice/data as it is people and this Fund covers such exposures. One of our top performing funds in terms of total returns, this Fund has also been a great outperformer versus the large cap Brazil ETF (roughly 1500 bps for the 1-year period ending March 31, 2011). For Brazil, infrastructure as an equity group has proven to be an excellent defensive performer existing within a sideways channel in Q4 2010 and Q1 2011 while other Brazilian equity index exposures were falling. Brazil remains a strong story broadly because of its BRIC affiliation and its close ties to those that depend on its resources like China. Dilma Rouseff has proven to be a popular figure internationally and has made measured steps to communicate her wish to control inflationary pressures that affect Brazil as well as other emerging markets. As commodity prices increase, Brazil benefits from this tailwind and the infrastructure build-out continues as planned within.
The Emerging Global Shares INDXX Brazil Infrastructure Index Fund had a total return of 6.95% at net asset value (“NAV”) for the quarter ended March 31, 2011 and 25.73% annualized return since its inception date of February 24, 2010. The Fund NAV had a 25.16% return for the full year ending March 31, 2011.
Performance Charts
The following performance chart is provided for comparative purposes and represents the period noted. The Fund’s per share NAV is the value of one share of the Fund and is calculated by dividing the value of total assets less total liabilities by the number of shares outstanding. The NAV return is based on the NAV of the Fund and the market return is based on the market price per share of the Fund. The price used to calculate market price returns is the mid-point of the highest bid and lowest offer for Fund shares as of the close of trading on the exchange where Fund shares are listed. NAV and market returns assume that dividends and capital gain distributions have been reinvested in the Fund at NAV and market price, respectively. As with other ETFs, NAV returns and market price returns may differ because of factors such as the supply and demand for Fund shares and investors’ assessments of the underlying value of a Fund’s portfolio securities. An index is a statistical measure of a specified financial market or sector. An index does not actually hold a portfolio of securities, incur expenses or pay any transaction costs. Therefore index returns do not reflect deductions for fees or expenses and are not available for direct investment. In comparison, the Fund’s performance is negatively impacted by these deductions. Fund returns do not reflect brokerage commissions or taxes on transactions in Fund shares or that a shareholder would pay on Fund distributions.
18 EGA Emerging Global Shares Trust
Emerging Global Shares INDXX Brazil Infrastructure Index Fund
Performance as of 3/31/2011
| | | |
| | Average Annual Total Return |
| |
|
| | Fund
Net Asset Value | Fund
Market Price | INDXX Brazil
Infrastructure
Index |
|
| 1 Year | 25.16% | 23.03% | 27.52% |
| Since Inception1 | 25.73% | 27.50% | 31.99% |
|
| 1 February 24, 2010. | | | |
Performance data quoted represents past performance. Investment return and principal value of an investment will fluctuate so that an investor’s shares, when sold or redeemed, may be worth more or less than the original cost. Current performance data may be higher or lower than actual data quoted. For the most current month-end performance data please visit www.egshares.com or call (888) 800-4347. As stated in the current prospectus, the Fund’s total annual operating expense ratio is 0.85%. Market price returns are based on the mid-point of the highest bid and lowest offer for Fund shares as of the scheduled close of regular trading on the New York Stock Exchange (“NYSE”) Arca, ordinarily 4:00 p.m. Eastern time, on each day during which the NYSE is open for trading, and do not represent the returns an investor would receive if shares were traded at other times.
Value of a $10,000 Investment Since Inception at Net Asset Value

The chart above represents historical performance of a hypothetical investment of $10,000 over the life of the Fund, assuming the reinvestment of distributions. Past performance does not guarantee future results. The hypothetical example does not represent the returns of any particular investment.
EGA Emerging Global Shares Trust 19
Portfolio Summary (Unaudited)
Emerging Global Shares INDXX India Small Cap Index Fund
Industry Breakdown*

| | |
| Top Ten Holdings* | | |
|
| Patni Computer Systems, Ltd. | 3.5 | % |
| UCO Bank | 3.1 | % |
| Dish TV India, Ltd. | 2.9 | % |
| Indian Bank | 2.8 | % |
| Orchid Chemicals & Pharmaceuticals, Ltd. | 2.8 | % |
| Vijaya Bank, Ltd | 2.6 | % |
| Hexaware Technologies, Ltd. | 2.5 | % |
| Amtek Auto, Ltd. | 2.4 | % |
| Godrej Industries, Ltd. | 2.3 | % |
| Havells India, Ltd. | 2.3 | % |
| * | Expressed as a percentage of total investments in securities as of 3/31/2011. |
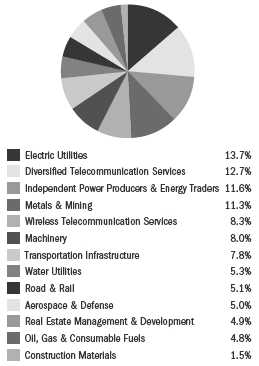
Emerging Global Shares INDXX India Small Cap Index Fund (ticker: SCIN)
The Fund seeks investment results that generally correspond (before fees and expenses) to the price and yield performance of the INDXX India Small Cap Index (the “Underlying Index”). The Fund seeks to achieve its investment objective by attempting to replicate the portfolio of the Underlying Index through investments in equity securities, including shares traded on local exchanges, American Depositary Receipts (“ADRs”) and Global Depositary Receipts (“GDRs”). The Underlying Index is a freefloat capitalization weighted stock market index comprised of 75 leading companies that INDXX, LLC determines to be representative of India’s small capitalization equity market. The Fund invests in Indian Small Cap companies that are included in the Underlying Index, which are generally defined as companies that are domiciled in India and are at the bottom end of the group that have a market capitalization of at least $100 million but below $2 billion at the time of purchase. Under normal circumstances, the Fund will invest at least 80% of its net assets in Indian small cap companies included in the Underlying Index and generally expects to be substantially invested at such times, with at least 95% of its net assets invested in these securities. The Fund defines Indian Small Cap companies as companies that are included in the Underlying Index at the time of purchase. The Fund will provide shareholders with at least 60 days’ notice prior to any change in this policy.
The Emerging Global Shares INDXX India Small Cap Index Fund is our attempt to play on the booming domestic consumption story out of India. As many large cap companies earn significant proportions of their top line revenues from global operations, small cap companies (regardless of where they are domiciled) normally focus more on domestic customers. Although the Indian market had a tough period from November 2010 to March 2011, it was an even harder fall for small cap names. A set of corruption scandals led to further rumor-mongering. What central bankers couldn’t do which was slow down a hot economy was finally accomplished with the crowd psychology of fear. We believe long term prospects for India and its growing consumer class remain positive as the underlying factors of demographics and low debts provide a strong foundation.
The Emerging Global Shares INDXX India Small Cap Index Fund had a total return of -12.56% at net asset value (“NAV”) for the quarter ended March 31, 2011 and -3.45% annualized return since its inception date of July 7, 2010. The Fund did not have enough history as of March 31, 2011 to provide a one-year return.
Performance Charts
The following performance chart is provided for comparative purposes and represents the period noted. The Fund’s per share NAV is the value of one share of the Fund and is calculated by dividing the value of total assets less total liabilities by the number of shares outstanding. The NAV return is based on the NAV of the Fund and the market return is based on the market price per share of the Fund. The price used to calculate market price returns is the mid-point of the highest bid and lowest offer for Fund shares as of the close of trading on the exchange where Fund shares are listed. NAV and market returns assume that dividends and capital gain distributions have been reinvested in the Fund at NAV and market price, respectively. As with other ETFs, NAV returns and market price returns may differ because of factors such as the supply and demand for Fund shares and investors’ assessments of the underlying value of a Fund’s portfolio securities. An index is a statistical measure of a specified financial market or sector. An index does not actually hold a portfolio of securities, incur expenses or pay any transaction costs. Therefore index returns do not reflect deductions for fees or expenses and are not available for direct investment. In comparison, the Fund’s performance is negatively impacted by these deductions. Fund returns do not reflect brokerage commissions or taxes on transactions in Fund shares or that a shareholder would pay on Fund distributions.
20 EGA Emerging Global Shares Trust
Emerging Global Shares INDXX India Small Cap Index Fund
Performance as of 3/31/2011
| | | |
| | Average Annual Total Return1 |
| |
|
| | Fund
Net Asset Value | Fund
Market Price | INDXX India
Small Cap Index |
|
| Since Inception2 | (3.45)% | (2.99)% | (1.35)% |
|
| 1 | Returns of less than one year are not annualized. |
| 2 | July 7, 2010. |
Performance data quoted represents past performance. Investment return and principal value of an investment will fluctuate so that an investor’s shares, when sold or redeemed, may be worth more or less than the original cost. Current performance data may be higher or lower than actual data quoted. For the most current month-end performance data please visit www.egshares.com or call (888) 800-4347. This fund is new and has limited operating history. As stated in the current prospectus, the Fund’s total annual operating expense ratio is 0.85%. Market price returns are based on the mid-point of the highest bid and lowest offer for Fund shares as of the scheduled close of regular trading on the New York Stock Exchange (“NYSE”) Arca, ordinarily 4:00 p.m. Eastern time, on each day during which the NYSE is open for trading, and do not represent the returns an investor would receive if shares were traded at other times.
Value of a $10,000 Investment Since Inception at Net Asset Value
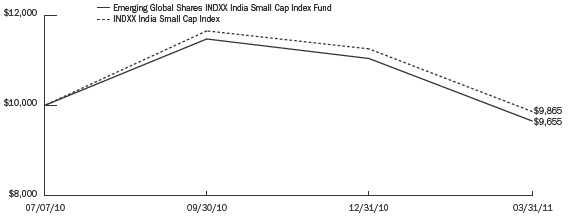
The chart above represents historical performance of a hypothetical investment of $10,000 over the life of the Fund, assuming the reinvestment of distributions. Past performance does not guarantee future results. The hypothetical example does not represent the returns of any particular investment.
EGA Emerging Global Shares Trust 21
Shareholder Expense Examples (Unaudited)
As a shareholder of an EGA Emerging Global Shares Trust ETF, you incur advisory fees and other Fund expenses. The following example is intended to help you understand your ongoing costs (in dollars and cents) of investing in a Fund and to compare these costs with the ongoing costs of investing in other funds. The example is based on an investment of $1,000 invested at the beginning of the period and held throughout the entire period (October 1, 2010 to March 31, 2011).
Actual expenses
The first line under each Fund in the table below provides information about actual account values and actual expenses. You may use the information in this line, together with the amount you invested, to estimate the expenses that you paid over the period. Simply divide your account value by $1,000 (for example, an $8,600 account value divided by $1,000 = 8.6), then multiply the result by the number in the first line for your Fund under the heading entitled “Expenses Paid Through 3/31/2011” to estimate the expenses you paid on your account during this period.
Hypothetical example for comparison purposes
The second line under each Fund in the table provides information about hypothetical account values and hypothetical expenses based on each Fund’s actual expense ratio and an assumed rate of return of 5% per year before expenses, which is not the Fund’s actual return. The hypothetical account values and expenses may not be used to estimate the actual ending account balance or expenses you paid for the period. You may use this information to compare the ongoing costs of investing in your Fund and other funds. To do so, compare this 5% hypothetical example with the 5% hypothetical examples that appear in the shareholder reports of the other funds.
Please note that the expenses shown in the table are meant to highlight your ongoing costs only and do not reflect any transactional costs, such as brokerage commissions paid on purchases and sales of Fund shares. Therefore, the second line under each Fund in the table is useful in comparing ongoing Fund costs only and will not help you determine the relative total costs of owning different funds. In addition, if these transactional costs were included, your costs would have been higher.
22 EGA Emerging Global Shares Trust
Shareholder Expense Examples (Unaudited)
| | | | |
| | Beginning
Account
Value
10/1/2010 | Ending
Account
Value
3/31/2011 | Annualized
Expense Ratios
for the Period | Expenses Paid
Through
3/31/2011* |
|
| Emerging Global Shares Dow Jones Emerging Markets | | | | |
| Titans Composite Index Fund | | | | |
| Actual | $1,000.00 | $1,112.70 | 0.75% | $3.95 |
| Hypothetical (5% return before expenses) | $1,000.00 | $1,021.19 | 0.75% | $3.78 |
|
| Emerging Global Shares Dow Jones Emerging Markets | | | | |
| Metals & Mining Titans Index Fund | | | | |
| Actual | $1,000.00 | $1,157.30 | 0.85% | $4.57 |
| Hypothetical (5% return before expenses) | $1,000.00 | $1,020.69 | 0.85% | $4.28 |
|
| Emerging Global Shares Dow Jones Emerging Markets | | | | |
| Consumer Titans Index Fund (Consolidated)† | | | | |
| Actual | $1,000.00 | $1,071.30 | 0.85% | $4.39 |
| Hypothetical (5% return before expenses) | $1,000.00 | $1,020.69 | 0.85% | $4.28 |
|
| Emerging Global Shares Dow Jones Emerging Markets | | | | |
| Energy Titans Index Fund | | | | |
| Actual | $1,000.00 | $1,230.40 | 0.85% | $4.73 |
| Hypothetical (5% return before expenses) | $1,000.00 | $1,020.69 | 0.85% | $4.28 |
|
| Emerging Global Shares Dow Jones Emerging Markets | | | | |
| Financials Titans Index Fund | | | | |
| Actual | $1,000.00 | $1,004.30 | 0.85% | $4.25 |
| Hypothetical (5% return before expenses) | $1,000.00 | $1,020.69 | 0.85% | $4.28 |
|
| Emerging Global Shares INDXX | | | | |
| India Infrastructure Index Fund (Consolidated)† | | | | |
| Actual | $1,000.00 | $ 884.60 | 0.85% | $3.99 |
| Hypothetical (5% return before expenses) | $1,000.00 | $1,020.69 | 0.85% | $4.28 |
|
| Emerging Global Shares INDXX | | | | |
| China Infrastructure Index Fund | | | | |
| Actual | $1,000.00 | $1,067.60 | 0.85% | $4.38 |
| Hypothetical (5% return before expenses) | $1,000.00 | $1,020.69 | 0.85% | $4.28 |
|
| Emerging Global Shares INDXX | | | | |
| Brazil Infrastructure Index Fund | | | | |
| Actual | $1,000.00 | $1,137.60 | 0.85% | $4.53 |
| Hypothetical (5% return before expenses) | $1,000.00 | $1,020.69 | 0.85% | $4.28 |
|
| Emerging Global Shares INDXX | | | | |
| India Small Cap Index Fund (Consolidated)† | | | | |
| Actual | $1,000.00 | $ 841.80 | 0.87% | $3.99 |
| Hypothetical (5% return before expenses) | $1,000.00 | $1,020.59 | 0.87% | $4.38 |
|
| * | Expenses are calculated using each Fund’s annualized expense ratio, multiplied by the ending account value for the period, multiplied by 182/365 (to reflect the six-month period). |
| |
| † | Expenses for these Funds include the accounts of wholly-owned subsidiaries. All inter-company accounts and transactions have been eliminated in consolidation. See Note 2 in the Notes to Financial Statements. |
EGA Emerging Global Shares Trust 23
Frequency Distribution of Premium and Discount (Unaudited)
The chart below presents information about differences between the per share net asset value (“NAV”) of each Fund and the market trading price of shares of each Fund. For these purposes, the “market price” is the mid-point of the highest bid and lowest offer for Fund shares as of the close of trading on the exchange where Fund shares are listed. The term “premium” is sometimes used to describe a market price in excess of NAV and the term “discount” is sometimes used to describe a market price below NAV. The chart presents information about the size and frequency of premiums or discounts. As with other exchange traded funds, the market price of Fund shares is typically slightly higher or lower than the Fund’s per share NAV. Factors that contribute to the differences between market price and NAV include the supply and demand for Fund shares and investors’ assessments of the underlying value of a Fund’s portfolio securities.
Differences between the closing times of U.S. and non-U.S. markets may contribute to differences between the NAV and market price of Fund shares. Many non-U.S. markets close prior to the close of the U.S. securities exchanges. Developments after the close of such markets as a result of ongoing price discovery may be reflected in a Fund’s market price but not in its NAV (or vice versa).
| | | | | | | | | |
|
| | | Market Price
Above or Equal to NAV | Market Price
Below NAV |
|
| | Basis Point
Differential | Number
of Days | % of
Total Days | Number
of Days | % of
Total Days |
|
| Emerging Global Shares Dow Jones Emerging Markets | | | | | | | | | |
| Titans Composite Index Fund | | | | | | | | | |
| July 22, 2009*–March 31, 2011 | | | | | | | | | |
| | 0-24.99 | 59 | | 13.76 | % | 40 | | 9.33 | % |
| | 25-49.99 | 68 | | 15.85 | % | 27 | | 6.29 | % |
| | 50-74.99 | 58 | | 13.52 | % | 23 | | 5.36 | % |
| | 75-99.99 | 49 | | 11.42 | % | 8 | | 1.86 | % |
| | > 100 | 81 | | 18.88 | % | 16 | | 3.73 | % |
|
| Total | | 315 | | 73.43 | % | 114 | | 26.57 | % |
|
| Emerging Global Shares Dow Jones Emerging Markets | | | | | | | | | |
| Metals & Mining Titans Index Fund | | | | | | | | | |
| May 21, 2009*–March 31, 2011 | | | | | | | | | |
| | 0-24.99 | 74 | | 15.71 | % | 50 | | 10.62 | % |
| | 25-49.99 | 70 | | 14.86 | % | 28 | | 5.95 | % |
| | 50-74.99 | 53 | | 11.25 | % | 23 | | 4.88 | % |
| | 75-99.99 | 59 | | 12.53 | % | 9 | | 1.91 | % |
| | > 100 | 82 | | 17.41 | % | 23 | | 4.88 | % |
|
| Total | | 338 | | 71.76 | % | 133 | | 28.24 | % |
|
| Emerging Global Shares Dow Jones Emerging Market | | | | | | | | | |
| Consumer Titans Index Fund | | | | | | | | | |
| September 14, 2010*–March 31, 2011 | | | | | | | | | |
| | 0-24.99 | 23 | | 16.55 | % | 7 | | 5.03 | % |
| | 25-49.99 | 32 | | 23.02 | % | 4 | | 2.88 | % |
| | 50-74.99 | 34 | | 24.46 | % | 2 | | 1.44 | % |
| | 75-99.99 | 20 | | 14.39 | % | 2 | | 1.44 | % |
| | > 100 | 14 | | 10.07 | % | 1 | | 0.72 | % |
|
| Total | | 123 | | 88.49 | % | 16 | | 11.51 | % |
|
| Emerging Global Shares Dow Jones Emerging Markets | | | | | | | | | |
| Energy Titans Index Fund | | | | | | | | | |
| May 21, 2009*–March 31, 2011 | | | | | | | | | |
| | 0-24.99 | 53 | | 11.25 | % | 31 | | 6.58 | % |
| | 25-49.99 | 78 | | 16.56 | % | 37 | | 7.86 | % |
| | 50-74.99 | 85 | | 18.05 | % | 28 | | 5.94 | % |
| | 75-99.99 | 53 | | 11.25 | % | 11 | | 2.34 | % |
| | > 100 | 69 | | 14.65 | % | 26 | | 5.52 | % |
|
| Total | | 338 | | 71.76 | % | 133 | | 28.24 | % |
|
24 EGA Emerging Global Shares Trust
Frequency Distribution of Premium and Discount (Unaudited) (concluded)
| | | | | | | | | |
|
| | | Market Price
Above or Equal to NAV | Market Price
Below NAV |
|
| | Basis Point
Differential | Number
of Days | % of
Total Days | Number
of Days | % of
Total Days |
|
| Emerging Global Shares Dow Jones Emerging Markets | | | | | | | | | |
| Financials Titans Index Fund | | | | | | | | | |
| September 16, 2009*–March 31, 2011 | | | | | | | | | |
| | 0-24.99 | 57 | | 14.65 | % | 43 | | 11.06 | % |
| | 25-49.99 | 52 | | 13.37 | % | 33 | | 8.48 | % |
| | 50-74.99 | 37 | | 9.51 | % | 30 | | 7.71 | % |
| | 75-99.99 | 35 | | 9.00 | % | 8 | | 2.06 | % |
| | >100 | 70 | | 17.99 | % | 24 | | 6.17 | % |
|
| Total | | 251 | | 64.52 | % | 138 | | 35.48 | % |
|
| Emerging Global Shares INDXX | | | | | | | | | |
| India Infrastructure Index Fund | | | | | | | | | |
| August 11, 2010*–March 31, 2011 | | | | | | | | | |
| | 0-24.99 | 15 | | 9.43 | % | 9 | | 5.66 | % |
| | 25-49.99 | 24 | | 15.09 | % | 5 | | 3.14 | % |
| | 50-74.99 | 22 | | 13.84 | % | 3 | | 1.89 | % |
| | 75-99.99 | 25 | | 15.72 | % | 2 | | 1.26 | % |
| | >100 | 51 | | 32.08 | % | 3 | | 1.89 | % |
|
| Total | | 137 | | 86.16 | % | 22 | | 13.84 | % |
|
| Emerging Global Shares INDXX | | | | | | | | | |
| China Infrastructure Index Fund | | | | | | | | | |
| February 17, 2010*–March 31, 2011 | | | | | | | | | |
| | 0-24.99 | 32 | | 11.27 | % | 18 | | 6.34 | % |
| | 25-49.99 | 35 | | 12.32 | % | 19 | | 6.69 | % |
| | 50-74.99 | 40 | | 14.09 | % | 16 | | 5.63 | % |
| | 75-99.99 | 32 | | 11.27 | % | 11 | | 3.87 | % |
| | > 100 | 53 | | 18.66 | % | 28 | | 9.86 | % |
|
| Total | | 192 | | 67.61 | % | 92 | | 32.39 | % |
|
| Emerging Global Shares INDXX | | | | | | | | | |
| Brazil Infrastructure Index Fund | | | | | | | | | |
| February 24, 2010*–March 31, 2011 | | | | | | | | | |
| | 0-24.99 | — | | 0.00 | % | — | | 0.00 | % |
| | 25-49.99 | 4 | | 1.43 | % | — | | 0.00 | % |
| | 50-74.99 | 2 | | 0.72 | % | 1 | | 0.36 | % |
| | 75-99.99 | 8 | | 2.87 | % | — | | 0.00 | % |
| | > 100 | 262 | | 93.90 | % | 2 | | 0.72 | % |
|
| Total | | 276 | | 98.92 | % | 3 | | 1.08 | % |
|
| Emerging Global Shares INDXX | | | | | | | | | |
| India Small Cap Index Fund | | | | | | | | | |
| July 7, 2010*–March 31, 2011 | | | | | | | | | |
| | 0-24.99 | 22 | | 11.83 | % | 7 | | 3.76 | % |
| | 25-49.99 | 22 | | 11.83 | % | 9 | | 4.84 | % |
| | 50-74.99 | 22 | | 11.83 | % | 3 | | 1.61 | % |
| | 75-99.99 | 32 | | 17.20 | % | 3 | | 1.61 | % |
| | > 100 | 60 | | 32.26 | % | 6 | | 3.23 | % |
|
| Total | | 158 | | 84.95 | % | 28 | | 15.05 | % |
|
| * Commencement of operations. | | | | | | | | | |
Each line in the table shows the number of trading days in which the Fund traded within the premium/ discount range indicated. The number of trading days in each premium/discount range is also shown as a percentage of the total number of trading days in the period covered by each table. All data presented here represents past performance, which cannot be used to predict future results.
The accompanying notes are an integral part of these financial statements.
The accompanying notes are an integral part of these financial statements.
The accompanying notes are an integral part of these financial statements.
The accompanying notes are an integral part of these financial statements.
The accompanying notes are an integral part of these financial statements.
The accompanying notes are an integral part of these financial statements.
The accompanying notes are an integral part of these financial statements.
The accompanying notes are an integral part of these financial statements.
The accompanying notes are an integral part of these financial statements.
The accompanying notes are an integral part of these financial statements.
The accompanying notes are an integral part of these financial statements.
The accompanying notes are an integral part of these financial statements.
The accompanying notes are an integral part of these financial statements.
The accompanying notes are an integral part of these financial statements.
The accompanying notes are an integral part of these financial statements.
Notes to Financial Statements
March 31, 2011
1. ORGANIZATION
EGA Emerging Global Shares Trust (the “Trust”) is a Delaware statutory trust organized on September 12, 2008. The Trust is an open-end management investment company, registered under the Investment Company Act of 1940, as amended (the “1940 Act”). The Trust currently consists of thirty-two separate non-diversified series. As of the date of this report, only the following funds (each a “Fund” and collectively the “Funds”) are being publicly offered:
| |
|
| Funds | Commencement
of Operations |
|
| Emerging Global Shares Dow Jones Emerging Markets Titans Composite Index Fund (“Composite Fund”) | July 22, 2009 |
|
| Emerging Global Shares Dow Jones Emerging Markets Metals & Mining Titans Index Fund (“Metals & Mining Fund”) | May 21, 2009 |
|
| Emerging Global Shares Dow Jones Emerging Markets Consumer Titans Index Fund (“Consumer Fund”) | September 14, 2010 |
|
| Emerging Global Shares Dow Jones Emerging Markets Energy Titans Index Fund (“Energy Fund”) | May 21, 2009 |
|
| Emerging Global Shares Dow Jones Emerging Markets Financials Titans Index Fund (“Financials Fund”) | September 16, 2009 |
|
| Emerging Global Shares INDXX India Infrastructure Index Fund (“India Infrastructure Fund”) | August 11, 2010 |
|
| Emerging Global Shares INDXX China Infrastructure Index Fund (“China Infrastructure Fund”) | February 17, 2010 |
|
| Emerging Global Shares INDXX Brazil Infrastructure Index Fund (“Brazil Infrastructure Fund”) | February 24, 2010 |
|
| Emerging Global Shares INDXX India Small Cap Index Fund (“India Small Cap Fund”) | July 7, 2010 |
|
The Composite Fund’s investment objective is to seek investment results that generally correspond (before fees and expenses) to the price and yield performance of the Dow Jones Emerging Markets Sector Titans Composite 100 Index. The Dow Jones Emerging Markets Sector Titans Composite 100 Index is a stock market index comprised of a representative sample of 100 emerging markets companies that Dow Jones Indices deem to be the 10 leading companies in each of the 10 industrial sectors, as defined by the Industry Classification Benchmark (“ICB”), across the developing world.
The Metals & Mining Fund’s investment objective is to seek investment results that generally correspond (before fees and expenses) to the price and yield performance of the Dow Jones Emerging Markets Metals & Mining Titans 30 Index. The Dow Jones Emerging Markets Metals & Mining Titans 30 Index is a stock market index comprised of 30 leading emerging markets companies that Dow Jones Indices deem to be in the Metals & Mining sector of the global economy. The Metals & Mining sector is a sub-sector of the Basic Materials industry, as defined by ICB.
The Consumer Fund’s investment objective is to seek investment results that generally correspond (before fees and expenses) to the price and yield performance of the Dow Jones Emerging Markets Consumer Titans 30 Index. The Dow Jones Emerging Markets Consumer Titans 30 Index is a stock market index comprised of publicly traded firms in the Consumer Goods industry and Consumer Services industry as defined by ICB.
The Energy Fund’s investment objective is to seek investment results that generally correspond (before fees and expenses) to the price and yield performance of the Dow Jones Emerging Markets Oil and Gas Titans 30 Index. The Dow Jones Emerging Markets Oil and Gas Titans 30 Index is a stock market index comprised of 30 leading emerging markets companies that Dow Jones Indices deem to be part of the Oil and Gas sector of the global economy, which also includes alternative energy sources other than oil and gas.
The Financials Fund’s investment objective is to seek investment results that generally correspond (before fees and expenses) to the price and yield performance of the Dow Jones Emerging Market Financials Titans 30 Index. The Dow Jones Emerging Markets Financials Titans 30 Index is a stock market index comprised of 30 leading emerging markets companies that Dow Jones Indices deem to be part of the Financials sector of the global economy.
The India Infrastructure Fund’s investment objective is to seek investment results that generally correspond (before fees and expenses) to the price and yield performance of the INDXX India Infrastructure Index. The INDXX India Infrastructure Index is a free-float market capitalization weighted stock market index comprised of 30 leading companies that INDXX, LLC determines to be representative of India’s Infrastructure industries. The Fund invests in Indian mid cap infrastructure companies that are included in the INDXX India Infrastructure Index, which are generally defined as companies that are domiciled in India and that have a market capitalization of at least $200 million at the time of purchase.
The China Infrastructure Fund’s investment objective is to seek investment results that generally correspond (before fees and expenses) to the price and yield performance of the INDXX China Infrastructure Index, by investing in Chinese mid cap infrastructure companies that are included in the INDXX China Infrastructure Index, which are generally defined as companies that are domiciled in China and that have a market capitalization of at least $200 million at the time of purchase. The INDXX China Infrastructure Index is a free-float market capitalization weighted stock market index comprised of 30 leading companies that INDXX, LLC determines to be representative of China’s Infrastructure sectors.
46 EGA Emerging Global Shares Trust
Notes to Financial Statements (continued)
March 31, 2011
The Brazil Infrastructure Fund’s investment objective is to seek investment results that generally correspond (before fees and expenses) to the price and yield performance of the INDXX Brazil Infrastructure Index, by investing in Brazilian mid cap infrastructure companies that are included in the INDXX Brazil Infrastructure Index, which are generally defined as companies that are domiciled in Brazil and that have a market capitalization of at least $200 million at the time of purchase. The INDXX Brazil Infrastructure Index is a free-float market capitalization weighted stock market index comprised of 30 leading companies that INDXX, LLC determines to be representative of Brazil’s Infrastructure sectors.
The India Small Cap Fund’s investment objective is to seek investment results that generally correspond (before fees and expenses) to the price and yield performance of the INDXX India Small Cap Index. The INDXX India Small Cap Index is a free-float market capitalization weighted stock market index comprised of a representative sample of 75 Indian companies that INDXX, LLC determines to be representative of small market capitalization companies domiciled in India.
2. CONSOLIDATION OF SUBSIDIARIES
The Consolidated Schedules of Investments, Consolidated Statements of Asset and Liabilities, of Operations and of Changes in Net Assets and the Consolidated Financial Highlights of the Funds listed below include the accounts of wholly-owned subsidiaries. All inter-company accounts and transactions have been eliminated in consolidation.
| |
|
| Fund | Wholly-owned Subsidiary |
|
| Consumer Fund | EG Shares Consumer Mauritius |
|
| India Infrastructure Fund | EG Shares India Infrastructure Mauritius |
|
| India Small Cap Fund | EG Shares India Small Cap Mauritius |
|
The Consumer Fund may invest its assets in a wholly owned subsidiary in Mauritius, which in turn invests virtually all of its assets in Indian securities, based on the number of Indian securities that are included in the Dow Jones Emerging Markets Consumer Titans 30 Index.
The India Infrastructure Fund and India Small Cap Fund invest substantially all of their assets in wholly owned subsidiaries in Mauritius, which in turn, invests at least 90% of their assets in Indian securities, and to some extent ADRs and GDRs, based on the number of Indian securities that are included in the INDXX India Infrastructure Index and INDXX India Small Cap Index, respectively.
By investing in a wholly owned subsidiary, the Consumer Fund, the India Infrastructure Fund and the India Small Cap Fund each obtain benefits under the tax treaty between Mauritius and India. Each subsidiary may be subject to withholding taxes imposed by the Indian government on dividends, interest and realized capital gains should new legislation be passed to modify the current tax treaty with Mauritius. Any change in the provision of this treaty could result in the imposition of withholding and other taxes on these Funds by authorities in India. This would reduce the return on investment and the return received by each Fund’s shareholders.
A summary of each Fund’s investment in its corresponding subsidiary is as follows:
| | | | | | |
|
| | | Subsidiary Net | % of Fund’s Total |
| | Inception Date | Assets at | Net assets at |
| Fund | of Subsidiary | March 31, 2011 | March 31, 2011 |
|
| Consumer Fund | September 14, 2010 | $ | 22,616,738 | | 11.6 | % |
|
| India Infrastructure Fund | August 11, 2010 | | 85,363,241 | | 100.0 | |
|
| India Small Cap Fund | July 7, 2010 | | 34,688,125 | | 99.9 | |
|
3. SIGNIFICANT ACCOUNTING POLICIES
These financial statements are prepared in accordance with accounting principles generally accepted in the United States of America (“GAAP”), which requires management to make estimates and assumptions that affect the reported amounts of assets and liabilities, the disclosure of contingent assets and liabilities at the date of the financial statements, and the reported amounts of increases and decreases in net assets from operations during the reporting period. Actual amounts could differ from these estimates. The following summarizes the significant accounting policies of the Funds.
Indemnifications
In the normal course of business, the Trust enters into contracts that contain a variety of representations that provide general indemnifications. The Trust’s maximum exposure under these arrangements cannot be known as this would involve future claims that may be made against the Trust that have not yet occurred; however, the Trust expects any risk of loss to be remote.
EGA Emerging Global Shares Trust 47
Notes to Financial Statements (continued)
March 31, 2011
Investment Valuation
The Net Asset Value (“NAV”) per share is computed as of the scheduled close of regular trading on the New York Stock Exchange (“NYSE”), ordinarily 4:00 p.m. Eastern time, on each day during which the NYSE is open for trading. The NAV per share of a Fund is computed by dividing the value of the Fund’s portfolio securities, cash and other assets (including accrued interest), less all liabilities (including accrued expenses), by the total number of shares outstanding at the time such computation is made.
Securities Valuation
Equity securities (including American Depositary Receipts and Global Depositary Receipts) are valued at the last reported sale price on the principal exchange on which such securities are traded, as of the close of regular trading on the NYSE on the day the securities are being valued or, if there are no sales, at the mean of the most recent bid and asked prices. Equity securities that are traded in over-the-counter markets are valued at the NASDAQ Official Closing Price as of the close of regular trading on the NYSE on the day the securities are valued or, if there are no sales, at the mean of the most recent bid and asked prices. Securities for which market quotations are not readily available, including restricted securities, are valued by a method that the Board of Trustees (the “Board”) believes accurately reflects fair value. The value of assets denominated in foreign currencies is converted into U.S. dollars using exchange rates deemed appropriate by the Funds. Use of a rate different from the rate used by Dow Jones Indices or INDXX Indices may adversely affect a Fund’s ability to track its Underlying Index.
Foreign Currency Translations
Investments denominated in foreign currencies are subject to additional risk factors as compared to investments denominated in U.S. dollars. The value of an investment denominated in a foreign currency could change significantly as foreign currencies strengthen or weaken relative to the U.S. dollar. Generally, when the U.S. dollar gains in value against a foreign currency, an investment traded in that foreign currency loses value because that currency is worth fewer U.S. dollars. Risks related to foreign currencies also include those related to economic or political developments, market inefficiencies or a higher risk that essential investment information may be incomplete, unavailable or inaccurate. A U.S. dollar investment in Depositary Receipts or Ordinary Shares of foreign issuers traded on U.S. exchanges is indirectly subject to foreign currency risk to the extent that the issuer conducts its principal business in markets where transactions are denominated in foreign currencies.
Portfolio securities and other assets and liabilities denominated in foreign currencies are translated into U.S. dollars based on the exchange rate of such currencies against U.S. dollars on the date of valuation. Purchases and sales of securities and income items denominated in foreign currencies are translated into U.S. dollars at the exchange rate in effect on the transaction date.
The Funds do not separately report the effect of changes in foreign exchange rates from changes in market prices on securities held. Such changes are included in net realized and unrealized gain or loss from investments.
Realized foreign exchange gains or losses arise from sales of foreign currencies, currency gains or losses realized between the trade and settlement dates on securities transactions and the difference between the recorded amounts of dividends, interest, and foreign withholding taxes, and the U.S. dollar equivalent of the amounts actually received or paid. Net unrealized foreign exchange gains and losses arise from changes in foreign exchange rates on foreign denominated assets and liabilities other than investments in securities held at the end of the reporting period.
Security Transactions and Related Income
Investment transactions are recorded on trade date. The Funds determine the gain or loss realized from the investment transactions by comparing the identified cost, which is the same basis used for federal income tax purposes, with the net sales proceeds. Dividend income is recorded on the ex-dividend date. Interest income is recorded on the accrual basis. Discounts are accreted and premiums are amortized on securities purchased over the lives of the respective securities.
Federal Income Taxes
The Composite Fund, Metals & Mining Fund, Energy Fund, Financials Fund, China Fund and Brazil Fund have qualified and continue to qualify, and the Consumer Fund, India Infrastructure Fund, and India Small Cap Fund intend to qualify as a “regulated investment company” under Subchapter M of the Internal Revenue Code. If so qualified, a Fund will not be subject to federal income tax to the extent it distributes substantially all of its net investment income and capital gains to shareholders. Each Fund expects to declare and pay all of its net investment income, if any, to shareholders as dividends annually, and will also declare and pay net realized capital gains, if any, at least annually, except where the costs of such distributions exceed the amount of tax that the distributions are intended to avoid, in which case the Fund will pay the applicable tax. A Fund may distribute such income dividends and capital gains more frequently, if necessary, in order to reduce or eliminate federal excise or income taxes on the Fund. Distributions to shareholders are recorded on the ex-dividend date.
48 EGA Emerging Global Shares Trust
Notes to Financial Statements (continued)
March 31, 2011
The Funds are subject to accounting standards that provide guidance for how uncertain tax positions should be recognized, measured, presented and disclosed in the financial statements. These standards require the evaluation of tax positions taken or expected to be taken by the Funds and whether the tax positions are “more-likely-than-not” of being sustained by the applicable tax authority. Tax positions not deemed to meet the more-likely-than-not threshold would be recorded as a tax benefit or expense in the current year. Accounting for uncertainty in income taxes requires management of the Funds to analyze all open tax years as defined by IRS statute of limitations, for all major jurisdictions, including federal tax authorities and certain state tax authorities. Open tax years are those years that are open for examination by the relevant income taxing authority. As of March 31, 2011, open Federal and state income tax years include the tax years or periods ended March 31, 2010 and March 31, 2011. The Funds have no examinations in progress.
There is no tax liability resulting from uncertain income tax positions taken or expected to be taken. The Funds are also not aware of any tax positions for which it is reasonably possible that the total amounts of unrecognized tax expense will significantly change in the next twelve months.
Expenses
Expenses of the Trust, which are directly identifiable to a specific Fund, are applied to that Fund. Expenses which are not readily identifiable to a specific Fund are allocated in such a manner as deemed equitable, taking into consideration the nature and type of expense and the relative net assets of each Fund in the Trust.
Offering Expenses
Costs incurred in connection with the initial offering of the Funds are being amortized over a 12-month period from inception of the Fund.
4. CONCENTRATION OF MARKET RISK
The India Infrastructure Fund and India Small Cap Fund only invest in Indian securities, therefore, their NAVs will be much more sensitive to changes in economic, political and other factors within India than would a fund that invested in a greater variety of countries.
The China Infrastructure Fund only invests in Chinese securities, therefore, its NAV will be much more sensitive to changes in economic, political and other factors within China than would a fund that invested in a greater variety of countries.
The Brazil Infrastructure Fund only invests in Brazilian securities, therefore, its NAV will be much more sensitive to changes in economic, political and other factors within Brazil than would a fund that invested in a greater variety of countries.
Investments in emerging market securities are subject to even greater risks than for foreign investments generally, including increased risks of: illiquidity of securities; price volatility; inflation or deflation; restrictions on foreign investment; nationalization; higher taxation; economic and political instability; pervasive corruption and crime; less governmental regulation; and less developed legal systems.
5. DISTRIBUTION AGREEMENT
ALPS Distributors, Inc., (the “Distributor”) serves as the distributor of Creation Units for the Funds pursuant to a distribution agreement. The Distributor does not maintain a secondary market in shares. The Funds have adopted a Distribution and Service Plan (the “Plan”) pursuant to Rule 12b-1 under the 1940 Act. In accordance with the Plan, each Fund is authorized to pay an amount up to 0.25% of its average daily net assets each year for certain distribution-related activities. For the periods ended March 31, 2011, no fees were paid by the Funds under the Plan, and there are no current plans to impose these fees.
EGA Emerging Global Shares Trust 49
Notes to Financial Statements (continued)
March 31, 2011
6. FEDERAL INCOME TAX MATTERS
For the period ended March 31, 2011, federal tax cost of investments and net unrealized appreciation (depreciation) were as follows:
| | | | | | | | | | | | |
|
| Funds | Federal
Tax Cost of
Investments | Gross
Unrealized
Appreciation | Gross
Unrealized
Depreciation | Net Unrealized
Appreciation
(Depreciation) |
|
| Composite Fund | $ | 28,555,868 | | $ | 4,049,679 | | $ | (656,726 | ) | $ | 3,392,953 | |
|
| Metals & Mining Fund | | 31,795,151 | | | 6,735,343 | | | (805,460 | ) | | 5,929,883 | |
|
| Consumer Fund | | 188,618,000 | | | 10,819,997 | | | (5,166,465 | ) | | 5,653,532 | |
|
| Energy Fund | | 20,812,319 | | | 4,734,326 | | | (140,644 | ) | | 4,593,682 | |
|
| Financials Fund | | 10,312,570 | | | 1,080,267 | | | (269,412 | ) | | 810,855 | |
|
| India Infrastructure Fund | | 91,474,659 | | | 2,442,226 | | | (8,787,714 | ) | | (6,345,488 | ) |
|
| China Infrastructure Fund | | 19,804,194 | | | 2,450,117 | | | (1,079,405 | ) | | 1,370,712 | |
|
| Brazil Infrastructure Fund | | 73,946,289 | | | 11,335,585 | | | (2,054,088 | ) | | 9,281,497 | |
|
| India Small Cap Fund | | 39,270,606 | | | 1,885,305 | | | (6,559,368 | ) | | (4,674,063 | ) |
|
The differences between book basis and tax basis components of net assets are primarily attributable to tax deferral of losses on wash sales, expensing of organization cost, mark to market on Passive Foreign Investment Companies securities and deferral of post-October losses. For the period ended March 31, 2011, the components of accumulated earnings/loss on a tax-basis were as follows:
| | | | | | | | | | | | |
|
Funds
| Undistributed
Ordinary
Income | Accumulated
Capital and
Other Losses | Net
Unrealized
Appreciation
(Depreciation) | Total
Accumulated
Earnings (Losses) |
|
| Composite Fund | $ | — | | $ | (639,998 | ) | $ | 3,397,203 | | $ | 2,757,205 | |
|
| Metals & Mining Fund | | — | | | (506,638 | ) | | 5,929,986 | | | 5,423,348 | |
|
| Consumer Fund | | — | | | (390,872 | ) | | 5,645,742 | | | 5,254,870 | |
|
| Energy Fund | | — | | | (114,869 | ) | | 4,592,378 | | | 4,477,509 | |
|
| Financials Fund | | — | | | (41,390 | ) | | 809,089 | | | 767,699 | |
|
| India Infrastructure Fund | | 78,483 | | | — | | | (6,343,892 | ) | | (6,265,409 | ) |
|
| China Infrastructure Fund | | 7,374 | | | (2,811 | ) | | 1,370,712 | | | 1,375,275 | |
|
| Brazil Infrastructure Fund | | 826,481 | | | (186,223 | ) | | 9,292,823 | | | 9,933,081 | |
|
| India Small Cap Fund | | — | | | (8,375 | ) | | (4,672,908 | ) | | (4,681,283 | ) |
|
For financial reporting purposes, capital accounts are adjusted to reflect the tax character of permanent book/tax differences. Reclassifications are primarily due to tax treatment of redemptions in kind and tax treatment of currency gains and losses. Results of operations and net assets were not affected by these reclassifications.
For the period ended March 31, 2011, the effect of permanent book/tax reclassifications resulted in increases (decreases) to the components of net assets as follows:
| | | | | | | | | |
|
| Funds | Accumulated
Net Investment
Income (Loss) | Accumulated Net
Realized Gain
(Loss) on
Investments and
Foreign Currency
Transactions | Paid-in Capital |
|
| Composite Fund | $ | 79,709 | | $ | (970,094 | ) | $ | 890,385 | |
|
| Metals & Mining Fund | | 34,814 | | | (750,286 | ) | | 715,472 | |
|
| Consumer Fund | | (150,599 | ) | | (437,356 | ) | | 587,955 | |
|
| Energy Fund | | 9,634 | | | (40,489 | ) | | 30,855 | |
|
| Financials Fund | | 54,285 | | | (484,122 | ) | | 429,837 | |
|
| India Infrastructure Fund | | (22,622 | ) | | 67,079 | | | (44,457 | ) |
|
| China Infrastructure Fund | | 59,467 | | | (271,215 | ) | | 211,748 | |
|
| Brazil Infrastructure Fund | | 64,658 | | | (10,822 | ) | | (53,836 | ) |
|
| India Small Cap Fund | | 32,362 | | | 17,837 | | | (50,199 | ) |
|
50 EGA Emerging Global Shares Trust
Notes to Financial Statements (continued)
March 31, 2011
Certain net losses incurred after October 31 and within the taxable year or period are deemed to arise on the first business day of the Funds’ next taxable year. For the period ended March 31, 2011, the Funds deferred to April 1, 2011 post October losses of:
| | | | | | |
|
| Funds | Post October
Currency Losses | Post October
Capital Losses |
|
| Composite Fund | $ | — | | $ | 21,758 | |
|
| Metals & Mining Fund | | 1,254 | | | — | |
|
| Consumer Fund | | 6,976 | | | 383,897 | |
|
| Energy Fund | | 2,345 | | | 57,433 | |
|
| Financials Fund | | — | | | 25,926 | |
|
| India Infrastructure Fund | | — | | | — | |
|
| China Infrastructure Fund | | — | | | — | |
|
| Brazil Infrastructure Fund | | — | | | 186,223 | |
|
| India Small Cap Fund | | 8,375 | | | — | |
|
For the period ended March 31, 2011, the Funds listed below had net capital loss carryforwards for federal income tax purposes which are available for offset against future taxable net capital gains. The amounts were determined after adjustments for certain differences between financial reporting and tax purposes, such as wash sale losses. Accordingly, no capital gain distributions are expected to be paid to shareholders of these Funds until future net capital gains have been realized in excess of the available capital loss carryforwards. There is no assurance that any Fund will be able to utilize all of its capital loss carryforwards before they expire. These loss carryforwards expire in amounts and fiscal years as follows:
| | | | | | |
|
| Funds | Fiscal Year
2018 | Fiscal Year
2019 |
|
| Composite Fund | $ | — | | $ | 586,695 | |
|
| Metals & Mining Fund | | 26,475 | | | 423,874 | |
|
| Consumer Fund | | — | | | — | |
|
| Energy Fund* | | — | | | — | |
|
| Financials Fund | | — | | | — | |
|
| India Infrastructure Fund | | — | | | — | |
|
| China Infrastructure Fund | | — | | | 2,811 | |
|
| Brazil Infrastructure Fund | | — | | | — | |
|
| India Small Cap Fund | | — | | | — | |
|
| * | During the year ended March 31, 2011, the Energy Fund utilized capital loss carryforward of $35,360 to offset realized gains |
7. FAIR VALUE MEASUREMENT
Fair Value Measurements and Disclosures (Topic 820) defines fair value, establishes a framework for measuring fair value in accordance with GAAP, and expands disclosure about fair value measurements. It also provides guidance on determining when there has been a significant decrease in the volume and level of activity for an asset or liability, when a transaction is not orderly, and how that information must be incorporated into a fair value measurement. Under Fair Value Measurements and Disclosures, various inputs are used in determining the value of the Fund’s investments. These inputs are summarized in the three broad levels as follows:
Level 1 — Unadjusted quoted prices in active markets for identical assets or liabilities.
Level 2 — Observable inputs other than quoted prices included in Level 1 that are observable for the asset or liability, either directly or indirectly. These inputs may include quoted prices for the identical instrument on an inactive market, prices for similar securities, interest rates, prepayment speeds, credit risk, yield curves, default rates and similar data.
Level 3 — Unobservable inputs for the asset or liability, to the extent relevant observable inputs are not available; representing the Funds’ own assumptions about the assumptions a market participant would use in valuing the asset or liability, and would be based on the best information available.
The availability of observable inputs can vary from security to security and is affected by a wide variety of factors, including, for example, the type of security, whether the security is new and not yet established in the marketplace, the liquidity of markets, and other characteristics particular to the security. To the extent that valuation is based on models or inputs that are less observable or unobservable in the market, the determination of fair value requires more judgment. Accordingly, the degree of judgment exercised in determining fair value is greatest for instruments categorized in Level 3.
EGA Emerging Global Shares Trust 51
Notes to Financial Statements (continued)
March 31, 2011
The Funds have adopted the Accounting Standard Update, Fair Value Measurements and Disclosures (Topic 820): Improving Disclosures about Fair Value Measurements which provides guidance on how investment assets and liabilities are to be valued and disclosed. Specifically, the amendment requires reporting entities to disclose i) the input and valuation techniques used to measure fair value for both recurring and nonrecurring fair value measurements, for Level 2 or Level 3 positions ii) transfers between all levels (including Level 1 and Level 2) will be required to be disclosed on a gross basis (i.e. transfers out must be disclosed separately from transfers in) as well as the reason(s) for the transfer and iii) purchases, sales, issuances and settlements must be shown on a gross basis in the Level 3 roll forward rather than as one net number.
The inputs or methodology used for valuing securities are not necessarily an indication of the risk associated with investing in those securities. The following summarizes inputs used as of March 31, 2011 in valuing the Funds’ assets and liabilities carried at fair value:
| | | | | | | | | | | | | | | | | | |
|
| | Quoted Prices in Active Market (Level 1) | Other
Significant
Inputs (Level 2) | Significant
Unobservable
Inputs (Level 3) | | | |
| |
|
| |
| Funds | Common Stocks | Preferred Stocks | Rights | Receipts | Total |
|
| Composite Fund* | $ | 27,811,073 | | $ | 4,137,748 | | $ | — | | $ | — | | $ | — | | $ | 31,948,821 | |
|
| Metals & Mining Fund* | | 35,370,920 | | | 2,354,114 | | | — | | | — | | | — | | | 37,725,034 | |
|
| Consumer Fund* | | 171,912,914 | | | 22,358,618 | | | — | | | — | | | — | | | 194,271,532 | |
|
| Energy Fund* | | 25,406,001 | | | — | | | — | | | — | | | — | | | 25,406,001 | |
|
| Financials Fund* | | 9,474,878 | | | 1,648,547 | | | — | | | — | | | — | | | 11,123,425 | |
|
| India Infrastructure Fund** | | 85,129,171 | | | — | | | — | | | — | | | — | | | 85,129,171 | |
|
| China Infrastructure Fund** | | 21,174,906 | | | — | | | — | | | — | | | — | | | 21,174,906 | |
|
| Brazil Infrastructure Fund** | | 60,031,406 | | | 20,633,857 | | | — | | | — | | | 2,562,523 | | | 83,227,786 | |
|
| India Small Cap Fund** | | 34,502,241 | | | — | | 94,302 | | — | | | — | | | 34,596,543 | |
|
Reconciliation of investments in which significant unobservable inputs (Level 3) were used in determining fair value during the period ended March 31, 2011:
| | | |
|
| Brazil Infrastructure Fund | Receipts |
|
| Balance as of 3/31/2010 | $ | — | |
|
| Securities purchased | | 2,314,044 | |
|
| Return of capital | | 47,235 | |
|
| Realized loss from return of capital | | (10 | ) |
|
| Change in unrealized appreciation | | 201,254 | |
|
| Balance as of 3/31/2011 | $ | 2,562,523 | |
|
To estimate fair value, an industry standard valuation model was used based on market approach. The significant input for the valuation model was to value the receipt at the price of its respective parent company.
| * | Please refer to the schedule of investments to view securities segregated by country. |
| |
| ** | Please refer to the schedule of investments to view securities segregated by industry type. |
There were no transfers between Level 1 and 2 securities.
8. INVESTMENT TRANSACTIONS
During the period ended March 31, 2011, the cost of purchases and proceeds from sales of investments (excluding cost of in-kind transactions, proceeds from in-kind sales, and short-term investments) were:
| | | | | | |
|
| Funds | Purchases | Sales |
|
| Composite Fund | $ | 11,350,279 | | $ | 11,016,337 | |
|
| Metals & Mining Fund | | 9,548,701 | | | 11,703,515 | |
|
| Consumer Fund | | 85,017,524 | | | 9,904,447 | |
|
| Energy Fund | | 3,395,818 | | | 2,386,163 | |
|
| Financials Fund | | 4,977,291 | | | 4,207,309 | |
|
| India Infrastructure Fund | | 95,141,924 | | | 3,740,883 | |
|
| China Infrastructure Fund | | 7,993,051 | | | 4,162,670 | |
|
| Brazil Infrastructure Fund | | 77,456,155 | | | 15,927,647 | |
|
| India Small Cap Fund | | 39,392,484 | | | 125,603 | |
|
52 EGA Emerging Global Shares Trust
Notes to Financial Statements (continued)
March 31, 2011
For the period ended March 31, 2011, the cost of in-kind transactions and proceeds from in-kind sales were as follows:
| | | | | | |
|
| Funds | Purchases | Sales |
|
| Composite Fund | $ | 7,426,287 | | $ | 9,960,624 | |
|
| Metals & Mining Fund | | 12,325,760 | | | 2,881,751 | |
|
| Consumer Fund | | 123,400,940 | | | 10,099,212 | |
|
| Energy Fund | | 12,025,690 | | | 791,856 | |
|
| Financials Fund | | 5,815,097 | | | 3,058,555 | |
|
| India Infrastructure Fund | | — | | | — | |
|
| China Infrastructure Fund | | 14,485,534 | | | 4,793,729 | |
|
| Brazil Infrastructure Fund | | 381,572 | | | — | |
|
| India Small Cap Fund | | — | | | — | |
|
9. INVESTMENT ADVISORY AND OTHER AGREEMENTS
The Trust has entered into an Investment Advisory Agreement (the “Advisory Agreement”) with ALPS Advisors, Inc. (“ALPS” or the “Adviser”). The Adviser acts as the Funds’ investment adviser pursuant to an advisory agreement with the Trust on behalf of the Funds. Pursuant to the Advisory Agreement, the Adviser has overall supervisory responsibility for the general management and investment of each Fund’s securities portfolio, and has ultimate responsibility (subject to oversight by the Trust’s Board of Trustees) for oversight of the Trust’s sub-adviser. For its services, the Trust pays the Adviser an annual management fee consisting of the greater of $400,000 or 0.10% of each Fund’s average daily net assets, but not to exceed $1,000,000 per year. From time to time, the Adviser may waive all or a portion of its fee.
Emerging Global Advisors, LLC (“EGA”) serves as the sub-adviser to the Funds and provides investment advice and management services to the Funds. EGA supervises the day-to-day investment and reinvestment of the assets in each Fund and is responsible for designating the Deposit Securities and for monitoring each Fund’s adherence to its investment mandate. For its investment sub-advisory services, EGA receives from the Funds an annual fee equal to 0.75% of the average daily net assets of Composite Fund and 0.85% of the average daily net assets of each of the other Funds.
The Trust and EGA have entered into a written fee waiver and expense reimbursement agreement pursuant to which EGA has agreed to reduce and/or reimburse expenses to the extent necessary to prevent the annual operating expenses of each Fund (excluding any taxes, interest, brokerage fees and non-routine expenses) from exceeding 0.85% of average daily net assets (0.75% for Composite Fund) at least until July 31, 2011. Under this fee waiver and expense assumption agreement, EGA retains the right to seek reimbursement from each Fund of fees previously waived or expenses previously assumed to the extent such fees were waived or expenses were assumed within three years of such reimbursement, and provided such reimbursement does not cause a Fund to exceed any applicable fee waiver or expense limitation agreement that was in place at the time the fees were waived or expenses assumed.
The amounts EGA reimbursed, the amounts available for potential future recoupment by EGA and the expiration schedule at March 31, 2011 are as follows:
| | | | | | | | | | | | |
| | Expenses
Reimbursed/Waived | Potential Recoupment Amounts Expiring | Total Potential
Recoupment
Amount |
| |
|
| Funds | March 31, 2013 | March 31, 2014 |
|
| Composite Fund | $ | 355,407 | | $ | 302,447 | | $ | 355,407 | | $ | 657,854 | |
|
| Metals & Mining Fund | | 301,755 | | | 344,869 | | | 301,755 | | | 646,624 | |
|
| Consumer Fund | | 403,405 | | | — | | | 403,405 | | | 403,405 | |
|
| Energy Fund | | 202,602 | | | 318,362 | | | 202,602 | | | 520,964 | |
|
| Financials Fund | | 207,810 | | | 125,612 | | | 207,810 | | | 333,422 | |
|
| India Infrastructure Fund | | 381,030 | | | — | | | 381,030 | | | 381,030 | |
|
| China Infrastructure Fund | | 247,399 | | | 34,768 | | | 247,399 | | | 282,167 | |
|
| Brazil Infrastructure Fund | | 478,083 | | | 32,912 | | | 478,083 | | | 510,995 | |
|
| India Small Cap Fund | | 356,162 | | | — | | | 356,162 | | | 356,162 | |
|
EGA Emerging Global Shares Trust 53
Notes to Financial Statements (continued)
March 31, 2011
The Bank of New York Mellon serves as the Funds’ Administrator, Custodian, Fund Accountant and Transfer Agent pursuant to a Fund Administration and Accounting Agreement, a Custody Agreement and a Transfer Agency and Service Agreement, as the case may be.
ALPS Fund Services, Inc. (“AFS”), an affiliate of the Adviser and the Distributor, provides a Chief Compliance Officer and an Anti-Money Laundering Officer as well as certain additional compliance support functions under a Compliance Services Agreement. AFS also provides a Principal Financial Officer to the Trust under a PFO Services Agreement. As compensation for the foregoing services, AFS receives certain out of pocket costs, and fixed and asset-based fees, which are accrued daily and paid monthly by the Funds. Compensation for such services is included under the Advisory Agreement.
10. PAYMENTS BY AFFILIATES AND NET GAINS (LOSSES) REALIZED ON TRADING ERROR
As a result of a trade error by the Energy Fund’s former sub-adviser, the Energy Fund experienced an aggregate loss of $73,832, of which $25,000 was reimbursed by the former sub-adviser and $25,000 was reimbursed by EGA, resulting in a net loss to the Energy Fund of $23,832, for the period ended March 31, 2010.
11. CREATION AND REDEMPTION TRANSACTIONS
The Funds issue and redeem Shares on a continuous basis at NAV in blocks of 50,000 shares called “Creation Units.” Except when aggregated in Creation Units, shares are not redeemable securities of a Fund.
Only “Authorized Participants” may purchase or redeem shares directly from a Fund. An Authorized Participant is either (i) a broker-dealer or other participant in the clearing process through the Continuous Net Settlement System of the National Securities Clearing Corporation or (ii) a DTC participant and, in each case, must have executed a Participant Agreement with Distributors. Most retail investors will not qualify as Authorized Participants or do not have the resources to buy and sell whole Creation Units. Therefore, they will be unable to purchase or redeem the shares directly from the Funds. Rather, most retail investors will purchase shares in the secondary market with the assistance of a broker and will be subject to customary brokerage commissions or fees.
Except as discussed below, the consideration for the purchase of Creation Units of a Fund generally consists of the in-kind deposit of a designated portfolio of equity securities, which constitutes an optimized representation of the corresponding Index and an amount of cash. The consideration for the purchase of Creation Units of the Brazil Infrastructure Fund consists solely or partially for cash in U.S. dollars. The consideration for the purchase of Creation Units of a Fund that invests its assets in a wholly owned subsidiary in Mauritius will consist solely or partially for cash in U.S. dollars based on the number of Indian securities included in a Fund’s corresponding Underlying Index. Investors transacting in Creation Units for cash pay an additional variable charge to compensate the relevant Fund for brokerage and market impact expenses relating to investing in portfolio securities.
12. TRUSTEES’ FEES
The Trust compensates each Trustee who is not an employee of the Adviser, EGA or its affiliates. The interested Trustees do not receive any compensation from the Trust for serving as Trustees.
13. THE REGULATED INVESTMENT COMPANY MODERNIZATION ACT
Under the recently enacted Regulated Investment Company Modernization Act of 2010, the Funds will be permitted to carry forward capital losses incurred in taxable years beginning after December 22, 2010 for an unlimited period. However, any losses incurred during these future taxable years will be required to be utilized prior to the losses incurred in pre-enactment taxable years. As a result of this ordering rule, pre-enactment capital loss carryforwards may have an increased likelihood to expire unused. Additionally, post-enactment capital losses that are carried forward will retain their character as either short-term or long-term capital losses rather than being considered all short-term under previous law.
54 EGA Emerging Global Shares Trust
Notes to Financial Statements (concluded)
March 31, 2011
14. ADDITIONAL INFORMATION
During the period ended March 31, 2011, shares of the Composite Fund, Metals & Mining Fund, Energy Fund and Financials Fund were adjusted to reflect a forward stock split. The effect of the forward stock split was to increase the number of shares outstanding and decrease the net asset value. The stock splits have no impact on the net assets of the Funds or the value of a shareholder’s investment in the Funds. A summary of the stock splits is as follows:
| | | | | | | | | | | |
|
| Fund | Effective Date | Rate | Net Asset
Value
Before Split | Net Asset
Value
After Split | Shares
Outstanding
Before Split | Shares
Outstanding
After Split |
|
| Composite Fund | 9/16/2010 | 2 : 1 | $ | 49.06 | | $ | 24.53 | | 552,500 | 1,105,000 | |
|
| Metals & Mining Fund | 9/16/2010 | 3 : 1 | | 57.09 | | | 19.03 | | 400,000 | 1,200,000 | |
|
| Energy Fund | 9/16/2010 | 2 : 1 | | 47.78 | | | 23.89 | | 200,000 | 400,000 | |
|
| Financials Fund | 9/16/2010 | 2 : 1 | | 48.36 | | | 24.18 | | 200,000 | 400,000 | |
|
15. SUBSEQUENT EVENTS
The Board approved effective June 8, 2011, the following Fund name and NYSE Arca symbol changes:
| | | |
|
| Current Fund Name | New Fund Name | Current
NYSE Arca
Symbol | New
NYSE Arca
Symbol |
|
Emerging Global Shares Dow Jones Emerging Markets
Titans Composite Index Fund | EGShares GEMS Composite ETF | EEG | AGEM |
|
Emerging Global Shares Dow Jones Emerging Markets
Energy Titans Index Fund | EGShares Energy GEMS ETF | EEO | OGEM |
|
Emerging Global Shares Dow Jones Emerging Markets
Financials Titans Index Fund | EGShares Financials GEMS ETF | EFN | FGEM |
|
The Board approved effective June 8, 2011, the following Fund name change:
| |
|
| Current Fund Name | New Fund Name |
|
Emerging Global Shares Dow Jones Emerging Markets
Metals & Mining Titans Index Fund | EGShares Emerging Markets Metals & Mining ETF |
|
The Funds have evaluated subsequent events through the date of issuance of this report and have determined, other than the disclosures stated; there are no other events that impacted the Funds’ financial statements.
EGA Emerging Global Shares Trust 55
Report of Independent Registered Public Accounting Firm
To the Board of Trustees and
Shareholders of EGA Emerging Global Shares Trust
We have audited the accompanying statements of assets and liabilities of Emerging Global Shares Dow Jones Emerging Markets Titans Composite Index Fund, Emerging Global Shares Dow Jones Emerging Markets Metals & Mining Titans Index Fund, Emerging Global Shares Dow Jones Emerging Markets Consumer Titans Index Fund (Consolidated), Emerging Global Shares Dow Jones Emerging Markets Energy Titans Index Fund, Emerging Global Shares Dow Jones Emerging Markets Financials Titans Index Fund, Emerging Global Shares INDXX India Infrastructure Index Fund (Consolidated), Emerging Global Shares INDXX China Infrastructure Index Fund, Emerging Global Shares INDXX Brazil Infrastructure Index Fund and Emerging Global Shares INDXX India Small Cap Index Fund (Consolidated), each a series of shares of beneficial interest of EGA Emerging Global Shares Trust (the “Funds”), including the schedules of investments, as of March 31, 2011, and the related statements of operations for the year or periods then ended, and the statements of changes in net assets and financial highlights for each of the respective year or periods presented. These financial statements and financial highlights are the responsibility of the Funds’ management. Our responsibility is to express an opinion on these financial statements and financial highlights based on our audits.
We conducted our audits in accordance with the standards of the Public Company Accounting Oversight Board (United States). Those standards require that we plan and perform the audits to obtain reasonable assurance about whether the financial statements and financial highlights are free of material misstatement. An audit includes examining, on a test basis, evidence supporting the amounts and disclosures in the financial statements. Our procedures included confirmation of securities owned as of March 31, 2011 by correspondence with the custodian and brokers and by other appropriate auditing procedures where responses from brokers were not received. An audit also includes assessing the accounting principles used and significant estimates made by management, as well as evaluating the overall financial statement presentation. We believe that our audits provide a reasonable basis for our opinion.
In our opinion, the financial statements and financial highlights referred to above present fairly, in all material respects, the financial position of Emerging Global Shares Dow Jones Emerging Markets Titans Composite Index Fund, Emerging Global Shares Dow Jones Emerging Markets Metals & Mining Titans Index Fund, Emerging Global Shares Dow Jones Emerging Markets Consumer Titans Index Fund, Emerging Global Shares Dow Jones Emerging Markets Energy Titans Index Fund, Emerging Global Shares Dow Jones Emerging Markets Financials Titans Index Fund, Emerging Global Shares INDXX India Infrastructure Index Fund, Emerging Global Shares INDXX China Infrastructure Index Fund, Emerging Global Shares INDXX Brazil Infrastructure Index Fund and Emerging Global Shares INDXX India Small Cap Index Fund as of March 31, 2011, and the results of their operations for the year or periods then ended, and the changes in their net assets and their financial highlights for the year or periods presented, in conformity with accounting principles generally accepted in the United States of America.
| |
| | 
BBD, LLP
|
Philadelphia, Pennsylvania
May 26, 2011
56 EGA Emerging Global Shares Trust
Board Review and Approval of Advisory Contracts
A. Emerging Global Shares Funds
At the February 24, 2011 Board of Trustees (the “Board”) meeting (the “February 2011 Meeting”), the Board, including those Trustees who are not “interested persons” (as that term is defined in the Investment Company Act of 1940, as amended (“1940 Act”)) of the Trust (the “Independent Trustees”), approved ALPS Advisors to continue to serve as investment adviser to each Fund and approved the continuation of the investment advisory agreement (the “Advisory Agreement”) between ALPS Advisors and the Trust with respect to each Fund, upon the same terms and conditions set forth therein, for the period April 17, 2011 until April 17, 2012, and approved EGA to continue to serve as investment sub-adviser to each Fund and approved the continuation of the sub-advisory agreement (the “Sub-Advisory Agreement”) between EGA and the Trust with respect to each Fund, upon the same terms and conditions set forth therein, for the period April 17, 2011 until April 17, 2012. In connection with considering approval of the Advisory Agreement and the Sub-Advisory Agreement, the Independent Trustees met in executive session with independent counsel, who provided assistance and advice.
In considering whether to approve the continuation of the Investment Advisory Agreement and the Sub-Advisory Agreement for an additional year, the Independent Trustees reviewed the materials provided for the Meeting by ALPS Advisors and EGA, including: (i) a copy of the Investment Advisory Agreement with ALPS Advisors and all amendments thereto; (ii) a copy of the Sub-Advisory Agreement with EGA and all amendments thereto; (iii) information describing the nature, quality, and extent of the services that ALPS Advisors provides to the Funds; (iv) information describing the nature, quality, and extent of the services that EGA provides to the Funds; (v) information concerning the financial condition, business, operations and the compliance program of ALPS Advisors; (vi) information concerning the financial condition, business and operations, portfolio management team and compliance program of EGA (vii) a copy of the current Form ADV for each of ALPS Advisors and EGA; and (viii) memoranda from Stradley Ronon on the responsibilities of trustees in considering investment advisory arrangements under the 1940 Act. The Independent Trustees also considered the information presented at Board meetings throughout the year. In addition, the Independent Trustees received data compiled by ETF Database comparing the advisory fees, expenses and performance of the Funds that had commenced operations with fees, expenses and performance of other exchange-traded funds (“ETFs”) with similar investment objectives and policies.
During their review of this information, the Independent Trustees focused on and analyzed the factors that the Independent Trustees deemed relevant, including: the nature, quality, and extent of the services provided to each Fund by ALPS Advisors and EGA; the personnel and operations of ALPS Advisors and EGA; the investment performance of the Funds; the profitability to ALPS Advisors and EGA under the Investment Advisory Agreement and Sub-Advisory Agreement, respectively; any “fall-out” benefits to ALPS Advisors and EGA (i.e., the ancillary benefits realized due to a relationship with the Trust); and possible conflicts of interest. In particular, the Independent Trustees considered and reviewed the following with respect to each Fund:
1. Continuation of Investment Advisory Agreement with ALPS Advisors
(a) The nature, extent, and quality of services provided to the Funds by ALPS Advisors. The Independent Trustees reviewed the services that ALPS Advisors provides to the Funds. The Independent Trustees noted the responsibilities that ALPS Advisors has as the Funds’ investment adviser, including: overall supervisory responsibility for the general management and investment of each Fund’s securities portfolio; ultimate responsibility, subject to oversight by the Board, for oversight of EGA as sub-adviser to the Trust; responsibility for daily monitoring of tracking error and quarterly reporting to the Board; and implementation of Board directives as they relate to the Funds.
The Independent Trustees reviewed ALPS Advisors’ experience, resources, and strengths in managing other ETFs, including the Funds. Based on their consideration and review of the foregoing information, the Independent Trustees determined that the Funds were likely to continue to benefit from the nature, quality, and extent of these services, as well as ALPS Advisors’ ability to render such services based on its experience, operations, and resources.
(b) Comparison of services provided and fees charged by ALPS Advisors and other investment advisers to similar clients, and the cost of the services provided and profits realized by ALPS Advisors from the relationship with the Funds. The Independent Trustees next compared both the services rendered and the fees paid pursuant to the Investment Advisory Agreement to contracts of other registered investment advisers providing services to similar ETFs. In particular, the Independent Trustees compared each Fund’s advisory fee and expense ratio to other investment companies considered to be in each Fund’s peer group chosen by ETF Database. It was noted that EGA has an expense limitation agreement whereby EGA reimburses expenses and/or waives fees to keep the expenses of the Funds, except for Emerging Global Shares Dow Jones Emerging Markets Titans Composite Index Fund, from exceeding 0.85% of average daily net assets. EGA reimburses expenses and/or waives fees to keep the expenses of the Emerging Global Shares Dow Jones Emerging Markets Titans Composite Index Fund from exceeding 0.75% of average daily net assets.
EGA Emerging Global Shares Trust 57
Board Review and Approval of Advisory Contracts (continued)
After comparing each Fund’s fees with those of other funds in each Fund’s peer group, and in light of the nature, quality, and extent of services provided by ALPS Advisors and the costs incurred by ALPS Advisors in rendering those services, the Independent Trustees concluded that the level of fees paid to ALPS Advisors with respect to each Fund were fair and reasonable.
(c) ALPS Advisors’ profitability and the extent to which economies of scale were realized as the Funds grow and whether fee levels would reflect such economies of scale. The Independent Trustees next considered economies of scale. The Independent Trustees reviewed the costs and profitability of ALPS Advisors in connection with its serving as investment adviser to each Fund, including operational costs. The Board noted that because ALPS Advisors is subject to a maximum flat rate fee, its fee as a percentage of assets under management will eventually begin to decline as asset levels increase.
(d) Investment performance of ALPS Advisors. The Independent Trustees considered the investment performance of the Funds, including tracking error. In particular, the Independent Trustees considered the investment performance of the Funds relative to their stated objectives and the success of ALPS Advisors in reaching such objectives. The Independent Trustees considered each Fund’s investment performance compared to the benchmark index that each Fund uses for comparison in its prospectus and shareholder reports. The Independent Trustees also considered each Fund’s investment performance compared to the average of the respective Fund’s peer group.
The Independent Trustees also received and considered information about the premium/discount history of the Funds, which illustrated the number of times that the market price of the Funds trading on the secondary market closed above or below the net asset value (“NAV”) of the Funds, and by how much, measured in basis points.
Conclusion. No single factor was determinative to the decision of the Independent Trustees. Based on the foregoing and such other matters as were deemed relevant, the Independent Trustees concluded that the advisory fee rates and total expense ratios were reasonable in relation to the services provided by ALPS Advisors to each Fund, as well as the costs incurred and benefits gained by ALPS Advisors in providing such services. The Independent Trustees also found the investment advisory fees to be reasonable in comparison to the fees charged by advisers to other comparable ETFs of similar size. As a result, the Independent Trustees decided to recommend to the Board the approval of the Investment Advisory Agreement with ALPS Advisors.
2. Continuation of Sub-Advisory Agreement with EGA
(a) The nature, extent, and quality of services provided to each Fund by EGA. The Independent Trustees reviewed the services that EGA provides to each Fund. In connection with the sub-advisory services provided to each Fund, the Independent Trustees noted the significant responsibilities that EGA has as the Funds’ Sub-Adviser, including: implementation of the investment management program of each Fund; management of the day-to-day investment and reinvestment of the assets in each Fund; determining daily baskets of deposit securities and cash components; executing portfolio security trades for purchases and redemptions of Fund shares conducted on a cash-in-lieu basis; making determinations with respect to alternative cash management vehicles and securities lending collateral investments; management of intermediate Mauritius entities for those Funds with significant investments in India; and oversight of general portfolio compliance with relevant law.
The Independent Trustees reviewed EGA’s experience, resources, strengths and its performance as a sub-adviser to the Funds. Based on their consideration and review of the foregoing information, the Independent Trustees determined that each Fund was likely to continue to benefit from the nature, quality, and extent of these services, as well as EGA’s ability to render such services based on its experience, operations and resources.
(b) Comparison of services provided and fees charged by EGA and other investment advisers to similar clients, and the cost of the services provided and profits realized by EGA from the relationship with the Funds. The Independent Trustees next compared both the services rendered and the fees paid pursuant to the Sub-Advisory Agreement to contracts of other registered investment advisers providing services to similar ETFs. In particular, the Independent Trustees compared each Fund’s advisory fee and expense ratio to the advisory fees and expense ratios of other ETFs considered to be in such Fund’s peer group, as chosen by ETF Database for periods that the Funds were in operation through December 31, 2010. The Independent Trustees noted that most Funds’ management fees and expenses (after giving effect to the proposed fee waiver and expense limitation arrangements) were within the median to maximum of the range of such Fund’s peer group. The Independent Trustees also noted that some of the Funds had been in operation for less than one year.
The Independent Trustees noted that the actual sub-advisory fee of the Emerging Global Shares Dow Jones Emerging Markets Titans Composite Index Fund was between the median and the maximum range of fees charged by other funds in the Fund's peer group, as chosen by ETF Database. The Independent Trustees also noted that the total expenses (both including and excluding the proposed fee waiver and expense limitation arrangements) of the Fund were between the median and the maximum range of total expenses of other funds in the Fund's peer group, as chosen by ETF Database.
58 EGA Emerging Global Shares Trust
Board Review and Approval of Advisory Contracts (continued)
The Independent Trustees noted that the actual sub-advisory fee of the Emerging Global Shares Dow Jones Emerging Markets Metals & Mining Titans Index Fund was at the maximum range of fees charged by other funds in the Fund's peer group, as chosen by ETF Database. The Independent Trustees also noted that the total expenses (both including and excluding the proposed fee waiver and expense limitation arrangements) of the Fund were at the maximum range of total expenses of other funds in the Fund's peer group, as chosen by ETF Database.
The Independent Trustees noted that the actual sub-advisory fee of the Emerging Global Shares Dow Jones Emerging Markets Consumer Titans Index Fund was at the maximum range of fees charged by other funds in the Fund's peer group, as chosen by ETF Database. The Independent Trustees also noted that the total expenses (both including and excluding the proposed fee waiver and expense limitation arrangements) of the Fund were at the maximum range of total expenses of other funds in the Fund's peer group, as chosen by ETF Database.
The Independent Trustees noted that the actual sub-advisory fee of the Emerging Global Shares Dow Jones Emerging Markets Energy Titans Index Fund was at the maximum range of fees charged by other funds in the Fund's peer group, as chosen by ETF Database. The Independent Trustees also noted that the total expenses (both including and excluding the proposed fee waiver and expense limitation arrangements) of the Fund were at the maximum range of total expenses of other funds in the Fund's peer group, as chosen by ETF Database.
The Independent Trustees noted that the actual sub-advisory fee of the Emerging Global Shares Dow Jones Emerging Markets Financials Titans Index Fund was at the maximum range of fees charged by other funds in the Fund's peer group, as chosen by ETF Database. The Independent Trustees also noted that the total expenses (both including and excluding the proposed fee waiver and expense limitation arrangements) of the Fund were at the maximum range of total expenses of other funds in the Fund's peer group, as chosen by ETF Database.
The Independent Trustees noted that the actual sub-advisory fee of the Emerging Global Shares INDXX India Infrastructure Index Fund was at the maximum range of fees charged by other funds in the Fund's peer group, as chosen by ETF Database. The Independent Trustees also noted that the total expenses (both including and excluding the proposed fee waiver and expense limitation arrangements) of the Fund were at the maximum range of total expenses of other funds in the Fund's peer group, as chosen by ETF Database.
The Independent Trustees noted that the actual investment advisory fee sub-advisory fee of the Emerging Global Shares INDXX China Infrastructure Index Fund was at the maximum range of fees charged by other funds in the Fund's peer group, as chosen by ETF Database. The Independent Trustees also noted that the total expenses (both including and excluding the proposed fee waiver and expense limitation arrangements) of the Fund were at the maximum range of total expenses of other funds in the Fund's peer group, as chosen by ETF Database.
The Independent Trustees noted that the actual sub-advisory fee of the Emerging Global Shares INDXX Brazil Infrastructure Index Fund was at the maximum range of fees charged by other funds in the Fund's peer group, as chosen by ETF Database. The Independent Trustees also noted that the total expenses (both including and excluding the fee waiver and expense reimbursement arrangements) of the Fund were at the maximum range of total expenses of other funds in the Fund's peer group, as chosen by ETF Database.
The Independent Trustees noted that the actual sub-advisory fee of the Emerging Global Shares INDXX India Small Cap Index Fund was at the maximum range of fees charged by other funds in the Fund's peer group, as chosen by ETF Database. The Independent Trustees also noted that the total expenses (both including and excluding the fee waiver and expense reimbursement arrangements) of the Fund were between the median and the maximum range of total expenses of other funds in the Fund's peer group, as chosen by ETF Database.
The Independent Trustees considered the appropriateness of the sub-advisory fees and expense ratios of the Funds compared to the fees and expenses of similar ETFs. The Independent Trustees also considered the costs, including operational costs, and profitability of EGA in connection with its serving as sub-adviser to each Fund. The Board noted the additional costs of operating the Emerging Global Shares Dow Jones Emerging Markets Consumer Titans Index Fund, the Emerging Global Shares INDXX India Infrastructure Index Fund and the Emerging Global Shares INDXX India Small Cap Index Fund, each of which invests in a related Mauritius company in order to invest directly in Indian companies. The Independent Trustees further considered the costs associated with registering and operating each of the Mauritius companies. The Independent Trustees noted EGA’s commitment to limit each Fund’s expenses through a contractual written fee waiver and expense reimbursement agreement with the Trust, including the circumstances in which the Trust would have to repay fees in excess of the expense cap that were borne by EGA. After comparing each Fund’s fee and expenses with those of other funds in the such Fund’s peer group, including for those Funds whose fees and expenses were in the maximum range compared to their peer groups, and in light of the nature, quality, and extent of services provided by EGA and the costs incurred by EGA in rendering those services and capping the Funds’ expenses, the Independent Trustees concluded that the fees paid to EGA with respect to each Fund were fair and reasonable.
EGA Emerging Global Shares Trust 59
Board Review and Approval of Advisory Contracts (continued)
(c) EGA’s profitability and the extent to which economies of scale were realized as each Fund grew and whether fee levels reflect such economies of scale. The Independent Trustees next reviewed economies of scale and the asset level of each Fund. The Independent Trustees were informed that the Funds were not yet a sufficient size to be experiencing economies of scale, and that EGA would consider addressing economies of scale when assets under management reached appropriate levels.
(d) Investment performance of EGA. The Independent Trustees considered the investment performance of the Funds, including tracking error. In particular, the Independent Trustees considered the investment performance of the Funds relative to their stated objectives and EGA’s success in reaching each Fund’s objectives. The Independent Trustees considered each Fund’s investment performance compared to the benchmark index that each Fund uses for comparison in its prospectus and shareholder reports.
Consideration was also given to data compiled by ETF Database comparing the performance of the Funds to a group of other funds selected by ETF Database for periods that the Funds were in operation through December 31, 2010. The Independent Trustees noted that some of the Funds had been in operation for less than one year.
The Independent Trustees noted that the one-year performance of the Emerging Global Shares Dow Jones Emerging Markets Titans Composite Index Fund was between the minimum and median range of performance of other funds in the Fund's ETF Database peer group. The Independent Trustees also noted that the one-month and three-month performance of the Fund was between the median and maximum range of performance of other funds in the Fund's ETF Database peer group.
The Independent Trustees noted that the sixth-month performance of the Emerging Global Shares Dow Jones Emerging Markets Metals & Mining Titans Index Fund was between the median and maximum range of performance of other funds in the Fund's ETF Database peer group.
The Independent Trustees noted that the three-month performance of the Emerging Global Shares Dow Jones Emerging Markets Consumer Titans Index Fund was between the median and maximum range of performance of other funds in the Fund's ETF Database peer group.
The Independent Trustees noted that the sixth-month performance of the Emerging Global Shares Dow Jones Emerging Markets Energy Titans Index Fund was between the median and maximum range of performance of other funds in the Fund's ETF Database peer group.
The Independent Trustees noted that the sixth-month performance of the Emerging Global Shares Dow Jones Emerging Markets Financials Titans Index Fund was between the median and maximum range of performance of other funds in the Fund's ETF Database peer group.
The Independent Trustees noted that the three-month performance of the Emerging Global Shares INDXX India Infrastructure Index Fund was between the minimum and median range of performance of other funds in the Fund's ETF Database peer group. The Independent Trustees also noted that the one-month performance of the Fund was between the median and maximum range of performance of other funds in the Fund's ETF Database peer group.
The Independent Trustees noted that the sixth-month performance of the Emerging Global Shares INDXX China Infrastructure Index Fund was at the median range of performance of other funds in the Fund's ETF Database peer group.
The Independent Trustees noted that the sixth-month performance of the Emerging Global Shares INDXX Brazil Infrastructure Index Fund was between the median and maximum range of performance of other funds in the Fund's ETF Database peer group.
The Independent Trustees noted that the three-month performance of the Emerging Global Shares INDXX India Small Cap Index Fund was between the minimum and median range of performance of other funds in the Fund's ETF Database peer group.
The Independent Trustees also received and considered information about the premium/discount history of the Funds, which illustrated the number of times that the market price of the Funds trading on the secondary market closed above or below the NAV of the Funds, and by how much, measured in basis points.
Conclusion. No single factor was determinative to the decision of the Independent Trustees. Based on the foregoing and such other matters as were deemed relevant, such as the fee waiver and expense limitation arrangement, the Independent Trustees concluded that the sub-advisory fees and total expense ratios are reasonable in relation to the services provided by EGA to each Fund, as well as the costs incurred and benefits gained by EGA in providing such services. As a result, the Independent Trustees determined that the continuation of the Sub-Advisory Agreement with EGA was in the best interests of each Fund.
60 EGA Emerging Global Shares Trust
Board Review and Approval of Advisory Contracts (continued)
B. New Emerging Global Shares Funds
At the February 2011 Meeting, the Board, including the Independent Trustees, approved amendments to the Trust’s Advisory Agreement on behalf of each new Emerging Global Shares Fund (each, a “New Fund”) with ALPS Advisors and Sub-Advisory Agreement with EGA. In considering the approval of the amendments to the Advisory Agreement and the Sub-Advisory Agreement, the Independent Trustees reviewed the materials provided for the February 2011 Meeting by ALPS Advisors and EGA, including: (i) a copy of the Advisory Agreement with ALPS Advisors and the amendment thereto to add the New Funds; (ii) a copy of the Sub-Advisory Agreement between the Trust and EGA and the amendment thereto to add the New Funds; (iii) information describing the nature, quality, and extent of the services that ALPS Advisors will provide to the New Funds, and the fees that ALPS Advisors will charge to the New Funds; (iv) information describing the nature, quality, and extent of the services that EGA will provide to the New Funds, and the fees that EGA will charge for such services; (v) information concerning business, operations and the compliance program of ALPS Advisors; (vi) information concerning EGA’s business and operations, portfolio management team and compliance program; (vii) a copy of the current Form ADV for each of ALPS Advisors and EGA; (viii) information describing the New Funds’ anticipated operating expenses; and (ix) memoranda from Stradley Ronon on the responsibilities of trustees in considering investment advisory arrangements under the 1940 Act. In addition, the Independent Trustees received data compiled by ETF Database comparing the proposed fee rate for advisory services to be charged to the Trust to fees paid by other ETFs with similar investment objectives and policies at various asset levels.
During their review of this information, the Independent Trustees focused on and analyzed the factors that the Independent Trustees deemed relevant, including: the nature, quality, and extent of the services to be provided to the New Funds by ALPS Advisors and EGA; the personnel and operations of ALPS Advisors and EGA; the New Funds’ proposed expense levels; the anticipated profitability, if any, to ALPS Advisors and EGA under the Investment Advisory Agreement and Sub-Advisory Agreement, respectively; any “fall-out” benefits to ALPS Advisors and EGA (i.e., the ancillary benefits realized due to a relationship with the Trust); the effect of asset growth on the New Funds’ expenses; and possible conflicts of interest. In particular, the Independent Trustees considered and reviewed the following with respect to the New Funds:
1. Investment Advisory Agreement with ALPS Advisors
(a) The nature, extent, and quality of services to be provided to the New Funds by ALPS Advisors. The Independent Trustees reviewed the services that ALPS Advisors would provide to the New Funds. In connection with the investment advisory services to be provided to the New Funds, the Independent Trustees noted the responsibilities that ALPS Advisors would have as the New Funds’ investment adviser, including: overall supervisory responsibility for the general management and investment of each New Fund’s securities portfolio; ultimate responsibility, subject to oversight by the Board, for oversight of the Trust’s sub-adviser; responsibility for daily monitoring of tracking error and quarterly reporting to the Board; and the implementation of Board directives as they relate to the New Funds.
The Independent Trustees reviewed ALPS Advisors’ experience, resources, and strengths in managing other ETFs, including the Funds of the Trust currently operating. Based on their consideration and review of the foregoing information, the Independent Trustees determined that the New Funds were likely to benefit from the nature, quality, and extent of these services, as well as ALPS Advisors’ ability to render such services based on its experience, operations, and resources.
(b) Comparison of services to be provided and fees to be charged by ALPS Advisors and other investment advisers to similar clients, and the cost of the services to be provided and profits to be realized by ALPS Advisors from the relationship with the New Funds. The Independent Trustees next compared both the services to be rendered and the proposed fees to be paid pursuant the Investment Advisory contract with ALPS Advisors, and to contracts of other investment advisers with respect to similar ETFs, including the Funds of the Trust currently operating. In particular, the Independent Trustees compared each New Fund’s proposed advisory fee and projected expense ratios for its first year of operations to other ETFs considered to be in each New Fund’s peer group, as determined by ETF Database. It was noted that EGA is proposing to enter into an expense limitation agreement whereby EGA would agree to reimburse expenses and/or waive fees to keep the expenses of each New Fund from exceeding: (i) 0.89% for New Funds that will invest in a related Mauritius Company; or (ii) 0.85% for New Funds that will not invest in a related Mauritius Company, of the average daily net assets for at least the first year of operations.
After comparing each New Fund’s proposed fee with those of other ETFs in such New Fund’s peer group, and in light of the nature, quality, and extent of services proposed to be provided by ALPS Advisors and the costs expected to be incurred by ALPS Advisors in rendering those services, the Independent Trustees concluded that the fees proposed to be paid to ALPS Advisors with respect to each New Fund was fair and reasonable.
EGA Emerging Global Shares Trust 61
Board Review and Approval of Advisory Contracts (continued)
(c) ALPS Advisors’ profitability and the extent to which economies of scale would be realized as the New Funds grow and whether fee levels would reflect such economies of scale.
The Independent Trustees next considered potential economies of scale and the anticipated costs and projected profitability of ALPS Advisors in connection with its serving as investment adviser to the New Funds, including operational costs. The Independent Trustees recognized the uncertainty in launching a new investment product and estimating future asset levels. The Board noted that because ALPS Advisors is subject to a maximum flat rate fee, its fee as a percentage of assets under management will eventually decline as asset levels increase.
(d) Investment performance of ALPS Advisors. Because the New Funds had not commenced operations, the Independent Trustees could not consider the investment performance of the New Funds, but did take into account the investment performance of the Funds of the Trust currently operating, for which ALPS Advisors serves as investment adviser
Conclusion. No single factor was determinative to the decision of the Independent Trustees. Based on the foregoing and such other matters as were deemed relevant, the Independent Trustees concluded that the proposed advisory fee rates and projected total expense ratios are reasonable in relation to the services to be provided by ALPS Advisors to the New Funds, as well as the costs to be incurred and benefits to be gained by ALPS Advisors in providing such services. As a result, the Independent Trustees decided to recommend to the Board the approval of the amended Investment Advisory Agreement with ALPS Advisors.
2. Sub-Advisory Agreement with EGA
(a) The nature, extent, and quality of services to be provided to the New Funds by EGA. The Independent Trustees reviewed the services that EGA would provide to the New Funds. In connection with the sub-advisory services to be provided to the New Funds, the Independent Trustees noted the significant responsibilities that EGA would have as the New Funds’ Sub-Adviser, including: implementation of the investment management program of each New Fund; management of the day-to-day investment and reinvestment of the assets in each New Fund; determining daily baskets of deposit securities and cash components; executing portfolio security trades for purchases and redemptions of New Fund shares conducted on a cash-in-lieu basis; making determinations with respect to alternative cash management vehicles and securities lending collateral investments; management of intermediate Mauritius entities for those New Funds with significant investments in India; and oversight of general portfolio compliance with relevant law.
The Independent Trustees reviewed EGA’s experience, resources, strengths and its performance as a sub-adviser to the currently operating Funds of the Trust. Based on their consideration and review of the foregoing information, the Independent Trustees determined that the New Funds were likely to benefit from the nature, quality, and extent of these services, as well as EGA’s ability to render such services based on its experience, operations and resources.
(b) Comparison of services to be provided and fees to be charged by EGA and other investment advisers to similar clients, and the cost of the services to be provided and profits to be realized by EGA from the relationship with the New Funds. The Independent Trustees next compared both the services to be rendered and the proposed fees to be paid for sub-advisory services to those of other investment advisers of similar ETFs. In particular, the Independent Trustees compared each New Fund’s proposed advisory fee and projected expense ratio for the first year of operations to other ETFs considered to be in each New Fund’s peer group, as chosen by ETF Database, including the currently operating Funds of the Trust. The Board noted that each New Fund’s proposed management fee and expenses (after giving effect to the proposed fee waiver and expense limitation arrangements) was generally at the top of the range of the New Fund’s peer group.
The Independent Trustees noted that the proposed sub-advisory fee of the Emerging Global Shares INDXX India Financial Index Fund was at the maximum range of fees charged by other funds in the Fund's peer group, as chosen by ETF Database. The Independent Trustees also noted that the projected total expenses (both including and excluding the proposed fee waiver and expense limitation arrangements) of the Fund were at the maximum range of total expenses of other funds in the Fund's peer group, as chosen by ETF Database.
The Independent Trustees noted that the proposed sub-advisory fee of the Emerging Global Shares INDXX India Energy Index Fund was at the maximum range of fees charged by other funds in the Fund's peer group, as chosen by ETF Database. The Independent Trustees also noted that the projected total expenses (both including and excluding the proposed fee waiver and expense limitation arrangements) of the Fund were at the maximum range of total expenses of other funds in the Fund's peer group, as chosen by ETF Database.
The Independent Trustees noted that the proposed sub-advisory fee of the Emerging Global Shares INDXX India Basic Materials Index Fund was at the maximum range of fees charged by other funds in the Fund's peer group, as chosen by ETF Database. The Independent Trustees also noted that the projected total expenses (both including and excluding the proposed fee waiver and expense limitation arrangements) of the Fund were at the maximum range of total expenses of other funds in the Fund's peer group, as chosen by ETF Database.
62 EGA Emerging Global Shares Trust
Board Review and Approval of Advisory Contracts (continued)
The Independent Trustees noted that the proposed sub-advisory fee of the Emerging Global Shares INDXX India Utilities Index Fund was at the maximum range of fees charged by other funds in the Fund's peer group, as chosen by ETF Database. The Independent Trustees also noted that the projected total expenses (both including and excluding the proposed fee waiver and expense limitation arrangements) of the Fund were at the maximum range of total expenses of other funds in the Fund's peer group, as chosen by ETF Database.
The Independent Trustees noted that the proposed sub-advisory fee of the Emerging Global Shares INDXX India Technology Index Fund was at the maximum range of fees charged by other funds in the Fund's peer group, as chosen by ETF Database. The Independent Trustees also noted that the projected total expenses (both including and excluding the proposed fee waiver and expense limitation arrangements) of the Fund were at the maximum range of total expenses of other funds in the Fund's peer group, as chosen by ETF Database.
The Independent Trustees noted that the proposed sub-advisory fee of the Emerging Global Shares INDXX India Industrials Index Fund was at the maximum range of fees charged by other funds in the Fund's peer group, as chosen by ETF Database. The Independent Trustees also noted that the projected total expenses (both including and excluding the proposed fee waiver and expense limitation arrangements) of the Fund were at the maximum range of total expenses of other funds in the Fund's peer group, as chosen by ETF Database.
The Independent Trustees noted that the proposed sub-advisory fee of the Emerging Global Shares INDXX India Telecom Index Fund was at the maximum range of fees charged by other funds in the Fund's peer group, as chosen by ETF Database. The Independent Trustees also noted that the projected total expenses (both including and excluding the proposed fee waiver and expense limitation arrangements) of the Fund were at the maximum range of total expenses of other funds in the Fund's peer group, as chosen by ETF Database.
The Independent Trustees noted that the proposed sub-advisory fee of the Emerging Global Shares INDXX India Consumer Index Fund was at the maximum range of fees charged by other funds in the Fund's peer group, as chosen by ETF Database. The Independent Trustees also noted that the projected total expenses (both including and excluding the proposed fee waiver and expense limitation arrangements) of the Fund were at the maximum range of total expenses of other funds in the Fund's peer group, as chosen by ETF Database.
The Independent Trustees noted that the proposed sub-advisory fee of the Emerging Global Shares INDXX India Healthcare Index Fund was at the maximum range of fees charged by other funds in the Fund's peer group, as chosen by ETF Database. The Independent Trustees also noted that the projected total expenses (both including and excluding the proposed fee waiver and expense limitation arrangements) of the Fund were at the maximum range of total expenses of other funds in the Fund's peer group, as chosen by ETF Database.
The Independent Trustees noted that the proposed sub-advisory fee of the Emerging Global Shares INDXX Turkey Small Cap Index Fund was at the maximum range of fees charged by other funds in the Fund's peer group, as chosen by ETF Database. The Independent Trustees also noted that the projected total expenses (both including and excluding the proposed fee waiver and expense limitation arrangements) of the Fund were at the maximum range of total expenses of other funds in the Fund's peer group, as chosen by ETF Database.
The Independent Trustees noted that the proposed sub-advisory fee of the Emerging Global Shares INDXX Malaysia Small Cap Index Fund was at the maximum range of fees charged by other funds in the Fund's peer group, as chosen by ETF Database. The Independent Trustees also noted that the projected total expenses (both including and excluding the proposed fee waiver and expense limitation arrangements) of the Fund were at the maximum range of total expenses of other funds in the Fund's peer group, as chosen by ETF Database.
The Independent Trustees noted that the proposed sub-advisory fee of the Emerging Global Shares INDXX South Africa Small Cap Index Fund was at the maximum range of fees charged by other funds in the Fund's peer group, as chosen by ETF Database. The Independent Trustees also noted that the projected total expenses (both including and excluding the proposed fee waiver and expense limitation arrangements) of the Fund were at the maximum range of total expenses of other funds in the Fund's peer group, as chosen by ETF Database.
The Independent Trustees noted that the proposed sub-advisory fee of the Emerging Global Shares INDXX Thailand Small Cap Index Fund was at the maximum range of fees charged by other funds in the Fund's peer group, as chosen by ETF Database. The Independent Trustees also noted that the projected total expenses (both including and excluding the proposed fee waiver and expense limitation arrangements) of the Fund were at the maximum range of total expenses of other funds in the Fund's peer group, as chosen by ETF Database.
The Independent Trustees noted that the proposed sub-advisory fee of the Emerging Global Shares INDXX Russia Small Cap Index Fund was at the maximum range of fees charged by other funds in the Fund's peer group, as chosen by ETF Database. The Independent Trustees also noted that the projected total expenses (both including and excluding the proposed fee waiver and expense limitation arrangements) of the Fund were at the maximum range of total expenses of other funds in the Fund's peer group, as chosen by ETF Database.
EGA Emerging Global Shares Trust 63
Board Review and Approval of Advisory Contracts (continued)
The Independent Trustees noted that the proposed sub-advisory fee of the Emerging Global Shares INDXX Mexico Small/Mid Cap Index Fund was at the maximum range of fees charged by other funds in the Fund's peer group, as chosen by ETF Database. The Independent Trustees also noted that the projected total expenses (both including and excluding the proposed fee waiver and expense limitation arrangements) of the Fund were at the maximum range of total expenses of other funds in the Fund's peer group, as chosen by ETF Database.
The Independent Trustees noted that the proposed sub-advisory fee of the Emerging Global Shares INDXX Indonesia Small Cap Index Fund was at the maximum range of fees charged by other funds in the Fund's peer group, as chosen by ETF Database. The Independent Trustees also noted that the projected total expenses (both including and excluding the proposed fee waiver and expense limitation arrangements) of the Fund were at the maximum range of total expenses of other funds in the Fund's peer group, as chosen by ETF Database.
The Independent Trustees noted that the proposed sub-advisory fee of the Emerging Global Shares INDXX Emerging Markets Food and Agriculture Index Fund was at the maximum range of fees charged by other funds in the Fund's peer group, as chosen by ETF Database. The Independent Trustees also noted that the projected total expenses (both including and excluding the proposed fee waiver and expense limitation arrangements) of the Fund were at the maximum range of total expenses of other funds in the Fund's peer group, as chosen by ETF Database.
The Independent Trustees noted that the proposed sub-advisory fee of the Emerging Global Shares INDXX Emerging Markets High Income Low Beta Index Fund was between the median and the maximum range of fees charged by other funds in the Fund's peer group, as chosen by ETF Database. The Independent Trustees also noted that the projected total expenses (both including and excluding the proposed fee waiver and expense limitation arrangements) of the Fund were between the median and the maximum range of total expenses of other funds in the Fund's peer group, as chosen by ETF Database.
The Independent Trustees noted that the proposed sub-advisory fee of the Emerging Global Shares INDXX China High Income Low Beta Index Fund was at the maximum range of fees charged by other funds in the Fund's peer group, as chosen by ETF Database. The Independent Trustees also noted that the projected total expenses (both including and excluding the proposed fee waiver and expense limitation arrangements) of the Fund were at the maximum range of total expenses of other funds in the Fund's peer group, as chosen by ETF Database.
The Independent Trustees noted that the proposed sub-advisory fee of the Emerging Global Shares INDXX India High Income Low Beta Index Fund was at the maximum range of fees charged by other funds in the Fund's peer group, as chosen by ETF Database. The Independent Trustees also noted that the projected total expenses (both including and excluding the proposed fee waiver and expense limitation arrangements) of the Fund were at the maximum range of total expenses of other funds in the Fund's peer group, as chosen by ETF Database.
The Independent Trustees noted that the proposed sub-advisory fee of the Emerging Global Shares INDXX Brazil High Income Low Beta Index Fund was at the maximum range of fees charged by other funds in the Fund's peer group, as chosen by ETF Database. The Independent Trustees also noted that the projected total expenses (both including and excluding the proposed fee waiver and expense limitation arrangements) of the Fund were at the maximum range of total expenses of other funds in the Fund's peer group, as chosen by ETF Database.
The Independent Trustees noted that the proposed sub-advisory fee of the Emerging Global Shares INDXX Emerging Markets REIT Index Fund was at the maximum range of fees charged by other funds in the Fund's peer group, as chosen by ETF Database. The Independent Trustees also noted that the projected total expenses (both including and excluding the proposed fee waiver and expense limitation arrangements) of the Fund were at the maximum range of total expenses of other funds in the Fund's peer group, as chosen by ETF Database.
The Independent Trustees noted that the proposed sub-advisory fee of the Emerging Global Shares Nasdaq/OMX 100 China Index Fund was at the maximum range of fees charged by other funds in the Fund's peer group, as chosen by ETF Database. The Independent Trustees also noted that the projected total expenses (both including and excluding the proposed fee waiver and expense limitation arrangements) of the Fund were at the maximum range of total expenses of other funds in the Fund's peer group, as chosen by ETF Database.
The Independent Trustees considered the appropriateness of the proposed sub-advisory fees and expense ratios of the Funds compared to the fees and expenses of similar ETFs. The Independent Trustees also reviewed the anticipated costs, including operational costs, and projected profitability of EGA in connection with its serving as sub-adviser to each New Fund. The Independent Trustees further considered the additional costs of operating the New Funds that will invest in a related Mauritius Company in order to invest directly in Indian companies. The Independent Trustees received information regarding the additional costs associated with registering and operating each of the Mauritius Companies, which indicated that these additional costs resulted in a higher management fee for New Funds investing in Mauritius Companies, as compared to New Funds that will not invest in Mauritius Companies. The Independent Trustees noted EGA’s commitment initially to limit each New Fund’s expenses through a written fee waiver and expense reimbursement agreement with the Trust, including the circumstances in which the Trust would have to repay fees in excess of the expense cap that were borne by EGA. After comparing each New
64 EGA Emerging Global Shares Trust
Board Review and Approval of Advisory Contracts (concluded)
Fund’s proposed fee and expenses with those of other ETFs in the New Fund’s peer group that included the currently operating Funds of the Trust, including for those New Funds whose fees and expenses were in the maximum range compared to their peer groups, and in light of the nature, quality, and extent of services proposed to be provided by EGA and the costs expected to be incurred by EGA in rendering those services and capping the New Funds’ expenses, the Independent Trustees concluded that the fee proposed to be paid to EGA with respect to each New Fund was fair and reasonable.
(c) EGA’s profitability and the extent to which economies of scale would be realized as each New Fund grows and whether fee levels would reflect such economies of scale. The Independent Trustees considered potential economies of scale. The Independent Trustees were informed that the New Funds were not yet a sufficient size to be experiencing economies of scale, and that EGA would consider addressing economies of scale when assets under management reached appropriate levels.
(d) Investment performance of EGA. Because the New Funds had not commenced operations, the Independent Trustees could not consider the investment performance of the New Funds, but did take into account the investment performance of the currently operating Funds of the Trust, for which EGA serves as sub-adviser.
Conclusion. No single factor was determinative to the decision of the Independent Trustees. Based on the foregoing and such other matters as were deemed relevant, such as the proposed fee waiver and expense limitation arrangement, the Independent Trustees concluded that the proposed sub-advisory fees and projected total expense ratios are reasonable in relation to the services to be provided by EGA to the New Funds, as well as the costs to be incurred and benefits to be gained by EGA in providing such services. As a result, the Independent Trustees decided to recommend to the Board the approval of the amended Sub-Advisory Agreement with EGA.
EGA Emerging Global Shares Trust 65
Board of Trustees and Officers (Unaudited)
The Trustees and officers of the Trust, along with their principal occupations over the past five years and their affiliations, if any, with EGA, are listed below. Unless otherwise noted, the address of each Trustee of the Trust is 171 East Ridgewood Ave., Ridgewood, NJ 07450.
| | | | | |
|
| Name and Year of Birth | Position(s)
Held with
Trust | Term of
Office1 and
Length of
Time Served | Principal Occupation(s)
During Past 5 Years | Number of
Portfolios
in Fund
Complex2
Overseen
by Trustee | Other
Directorships
Held by Trustee |
|
| Independent Trustees | | | | | |
| | | | | | |
| Robert Willens, 1946 | Trustee | Since 2009 | Robert Willens, LLC (tax consulting), President, since January, 2008; Lehman Brothers, Inc., Managing Director, Equity Research Department, January 2004 to January 2008. | 32 | Daxor Corp. (Medical Products and Biotechnology), since 2004. |
| | | | | | |
| Ron Safir, 1951 | Trustee | Since 2009 | Retired, since 2008; UBS Wealth Management, Chief Administrative Officer, February 1971 to December 2008. | 32 | None |
| | | | | | |
| Jeffrey D. Haroldson, 1957 | Trustee | Since 2009 | HDG Mansur Capital Group, LLC, President and Chief Operating Officer, since 2004; HSBC Securities (USA), Inc., Executive Managing Director, Head of Investment and Merchant Banking, 2000 to 2003. | 32 | None |
|
| Interested Trustees | | | | | |
| | | | | | |
| Robert C. Holderith3, 1960 | Trustee and President | Since 2008 | Emerging Global Advisors, LLC, Managing Member and Chief Executive Officer, since September 2008; ProFund Advisors, Managing Director, Institutional Sales & Investment Analytics, June 2006 to August 2008; UBS Financial Services, Inc., Director, January 2000 to May 2006. | 32 | None |
| | | | | | |
| James J. Valenti3, 1947 | Trustee and Secretary | Since 2008 | Emerging Global Advisors, LLC, Member and Chief Administrative Officer, since September 2008; Private Investor and Independent Consultant, June 2007 to September 2008; Senior Loan Consultant, Bridgepoint Mortgage Company, June 2006 to June 2007; Mercedes Benz, North America, Sales Representative, November 2000 to June 2006. | 32 | None |
|
| 1 | Each Trustee holds office for an indefinite term. |
| |
| 2 | The “Fund Complex” consists of the Trust, which consists of thirty-two Funds. |
| |
| 3 | Mr. Holderith and Mr. Valenti are considered to be “interested persons” of the Trust as defined in the 1940 Act, due to their relationship with EGA, the Funds’ sub-adviser. |
66 EGA Emerging Global Shares Trust
Board of Trustees and Officers (Unaudited) (concluded)
| | | |
|
| Name and Year of Birth | Position(s)
Held with
the Trust | Term of Office1
and Length of
Time Served | Principal Occupation(s) During Past 5 Years |
|
| Officers | | | |
| | | | |
Thomas A. Carter
ALPS Fund Services, Inc.
1290 Broadway
Suite 1100
Denver, CO 80203
1966 | Treasurer | Since 2009 | ALPS Fund Services, Inc., Directors, since October 2005; ALPS Advisors, Inc., President and Directors, since September 2008; ALPS Distributors, Inc., President and Director, since September 2008; FTAM Funds Distributor, Inc., President and Director, since September 2008; ALPS Holdings, Inc., Director, since October 2005; and ALPS ETF Trust, President and Trustee, since March 2008. |
| |
Melanie H. Zimdars
ALPS Fund Services, Inc.
1290 Broadway
Suite 1100
Denver, CO 80203
1976 | Chief Compliance Officer | Since 2010 | ALPS Fund Services, Inc., Deputy Chief Compliance Officer, since September 2009; ALPS ETF Trust, Chief Compliance Officer, since December 2009; EGA Emerging Global Shares Trust, Chief Compliance Officer, since March 2010; Financial Investors Variable Insurance Trust, Chief Compliance Officer, since September 2009; Liberty All-Star Growth Fund, Inc., Chief Compliance Officer, since December 2009; Liberty All-Star Equity Fund, Chief Compliance Officer, since December 2009; Wasatch Funds, Principal Financial Officer, Treasurer and Secretary, February 2007 to December 2008; Wasatch Funds, Assistant Treasurer, November 2006 to February 2007; Wasatch Funds, Senior Compliance Officer, 2005 to December 2008. |
|
| 1 | Officers of the Trust are elected by the Trustees and serve at the pleasure of the Board. |
EGA Emerging Global Shares Trust 67
General Information (Unaudited)
Investment Advisor
ALPS Advisors, Inc.
1290 Broadway, Suite 1100
Denver, CO 80203
Sub-Adviser
EGA
171 East Ridgewood Ave.,
Ridgewood, NJ 07450
Distributor
ALPS Distributors, Inc.
1290 Broadway, Suite 1100
Denver, CO 80203
Administrator, Custodian and Transfer Agent
The Bank of New York Mellon
101 Barclay Street
New York, NY 10286
Independent Registered Public Accounting Firm
BBD, LLP
1835 Market Street, 26th Floor
Philadelphia, PA 19103
You may obtain a description of the EGA Funds proxy voting, policies, procedures and information regarding how each Fund voted proxies relating to portfolio securities during the most recent 12-month period ending June 30 (available by August 31) without charge, upon request, by calling 1-888-800-4347 or visiting the funds website www.egshares.com, or by accessing the SEC’s website at www.sec.gov. Such reports may be reviewed and copied at the SEC’s Public Reference Room in Washington, DC. Information on the operation of the Public Reference Room may be obtained by calling 202-942-8090.
Each of the Funds’ premium/discount information that is current to the most recent quarter-end is available by visiting www.egshares.com or by calling 1-201-389-6872.
The Trust files complete schedules of the portfolio holdings with the SEC for the first and third quarters on Form N-Q. The Form N-Q is available without charge, upon request, by calling 1-800-SEC-0330, or by accessing the SEC’s website, at www.sec.gov. It may also be reviewed and copied at the SEC’s Public Reference Room in Washington, DC.
This report has been prepared for shareholders and may be distributed to others only if preceded or accompanied by an effective prospectus, which includes information regarding the Funds’ objectives and polices, experience of its management, marketability of shares and other information.
68 EGA Emerging Global Shares Trust

171 East Ridgewood Avenue
Ridgewood, NJ 07450
(201) 389-6872
470 Park Avenue South, 8th Floor
New York, NY 10016
(888) 800-4EGS (4347)
www.egshares.com
EGA Emerging Global Shares Trust
Emerging Global Shares Dow Jones Emerging Markets Titans Composite Index Fund
Emerging Global Shares Dow Jones Emerging Markets Metals & Mining Titans Index Fund
Emerging Global Shares Dow Jones Emerging Markets Consumer Titans Index Fund
Emerging Global Shares Dow Jones Emerging Markets Energy Titans Index Fund
Emerging Global Shares Dow Jones Emerging Markets Financials Titans Index Fund
Emerging Global Shares INDXX India Infrastructure Index Fund
Emerging Global Shares INDXX China Infrastructure Index Fund
Emerging Global Shares INDXX Brazil Infrastructure Index Fund
Emerging Global Shares INDXX India Small Cap Index Fund
Emerging Global Shares are distributed by ALPS Distributors Inc.
Item 2. Code of Ethics.
a). As of the end of the period covered by this report, the Registrant has adopted a code of ethics that applies to the Registrant’s principal executive officer, principal financial officer or persons performing similar functions (“Code of Ethics”).
b). Not Applicable
c). There has been no amendment to the Registrant’s Code of Ethics during the fiscal year ending March 31, 2010 (“Reporting Period”).
d). Registrant granted no waivers from the provisions of its Code of Ethics during the Reporting Period.
e). Not Applicable
f). Attached
Item 3. Audit Committee Financial Expert.
a). The Registrant’s Board of Trustees has determined that its Audit Committee has one “audit committee financial expert”, as that term is defined under Items 3(b) and 3(c), serving on its Audit Committee. Mr. Robert Willens, the Registrant’s audit committee financial expert, is “independent”, as that term is defined under Item 3(a)(2).
Item 4. Principal Accountant Fees and Services.
The principal accountant fees disclosed in Items 4(a)-(d) are for the nine funds of the Registrant that had a fiscal year ending March 31, 2011 and whose financial statements are reported in Item 1.
a). Audit Fees: the aggregate fees billed in each of the last two fiscal years for professional services rendered by the principal accountant for the audit are as follows:
| |
| | 2011: $105,000 |
| | 2010: $67,000 |
b). Audit-Related Fees: the aggregate fees billed in each of the last two fiscal years for assurance and related services by the principal accountant that are reasonably related to the performance of
the audit of the Registrant’s financial statements and are not reported under paragraph (a) of this item are as follows:
c). Tax Fees: the aggregate fees billed in each of the previous last two fiscal years for professional services rendered by the principal accountant for tax compliance, tax advice, and tax planning are as follows:
The Tax Fees represent services provided in connection with the preparation of tax returns, year-end distribution review, qualifying dividend income analysis and computation of foreign tax credit pass-through.
d). All Other Fees: the aggregate fees billed in each of the last two fiscal years for products and services provided by the principal accountant, other than the services reported in paragraphs (a) and (c) of this Item are as follows:
e) Audit Committee Pre-Approval Policies and Procedures.
| | (i) | Per Rule 2-01(c)(7)(A) and the charter of the Registrant’s Audit Committee, the Audit Committee approves and recommends the principal accountant for the Registrant, pre-approves (i) the principal accountant’s provision of all audit and permissible non-audit services to the Registrant (including the fees and other compensation to be paid to the principal accountant), and (ii) the principal accountant’s provision of any permissible non-audit services to the Registrant’s investment adviser (the “Adviser”), sub-adviser or any entity controlling, controlled by, or under common control with any investment adviser or sub-adviser, if the engagement relates directly to the operations of the financial reporting of the Trust. |
| |
| | (ii) | 100% of services described in each of Items 4(b) through (d) were approved by the Audit Committee pursuant to paragraph (c)(7)(A) of Rule 2-01 of Regulation S-X. |
(f) Less than 50% of the hours expended on the principal accountant’s engagement to audit Registrant’s financial statements were attributed to work performed by persons other than the accountant’s full-time, permanent employees.
(g) The aggregate non-audit fees billed by the accountant for services rendered to the Registrant, the Adviser and any entity controlling, controlled by, or under common control with
the Adviser that provides ongoing services to the Registrant (except for any sub-advisor whose role is primarily portfolio management and is subcontracted with or overseen by another investment advisor) for the last two fiscal years is as following:
(h) Not Applicable
Item 5. Audit Committee of Listed Registrants.
(a) The Registrant is an issuer as defined in Section 10A-3 of the Securities Exchange Act of 1934 and has a separately-designated standing Audit Committee in accordance with Section 3(a)(58)(A) of such Act. All of the Board’s independent Trustees, Robert Willens, Ron Safir and Jeffrey D. Haroldson, are members of Audit Committee.
(b) Not Applicable.
Item 6. Schedule of Investments.
| | (a) | Schedule is included as part of the report to shareholders filed under Item 1 of this Form. |
| |
| | (b) | Not Applicable. |
Item 7. Disclosure of Proxy Voting Policies and Procedures for Closed-End Management Investment Companies.
Not Applicable.
Item 8. Portfolio Managers of Closed-End Management Investment Companies.
Not Applicable.
Item 9. Purchases of Equity Securities by Closed-End Management Investment Company & Affiliated Purchasers.
Not Applicable.
Item 10. Submission of Matters to a Vote of Security Holders.
Not Applicable.
Item 11. Controls and Procedures.
(a) The Chief Executive Officer and Chief Financial Officer have evaluated the Registrant's disclosure controls and procedures within 90 days of the filing date of this report and have concluded that these controls and procedures are effective.
(b) There were no significant changes in the Registrant's internal controls over financial reporting or in other factors that could significantly affect these controls subsequent to the date of their evaluation.
Item 12. Exhibits.
(a)(1) Any code of ethics, or amendment thereto, that is the subject of the disclosure required by Item 2 is attached hereto.
(b) Certifications for each Principal Executive Officer and Principal Financial Officer of the Registrant as required by Rule 30a-2(a) under the 1940 Act (17CFR 270.30a-(a)).
SIGNATURES
Pursuant to the requirements of the Securities Exchange Act of 1934 and the Investment Company Act of 1940, the Registrant has duly caused this report to be signed on its behalf by the undersigned, thereunto duly authorized.
Registrant: EGA Emerging Global Shares Trust
By: /s/ Robert C. Holderith
Robert C. Holderith, Chief Executive Officer
Date: May 24, 2011
Pursuant to the requirements of the Securities Exchange Act of 1934 and the Investment Company Act of 1940, this report has been signed below by the following persons on behalf of the Registrant and in the capacities and on the dates indicated.
Registrant: EGA Emerging Global Shares Trust
By: /s/ Robert C. Holderith
Robert C. Holderith, Chief Executive Officer
Date: May 24, 2011
By: /s/ Thomas A. Carter
Thomas A. Carter, Chief Financial Officer
Date: May 24, 2011