UNITED STATES
SECURITIES AND EXCHANGE COMMISSION
Washington, D.C. 20549
FORM N-CSR
CERTIFIED SHAREHOLDER REPORT OF REGISTERED MANAGEMENT INVESTMENT COMPANIES
Investment Company Act file number 811-22255
EGA Emerging Global Shares Trust
(Exact name of registrant as specified in charter)
171 East Ridgewood Avenue
Ridgewood, NJ 07450
(Address of principal executive offices) (Zip code)
Robert C. Holderith
171 East Ridgewood Avenue
Ridgewood, NJ 07450
(Name and address of agent for service)
Registrant's telephone number, including area code: 1-201-389-6872
Date of fiscal year end: March 31
Date of reporting period: March 31, 2012
Form N-CSR is to be used by management investment companies to file reports with the Commission not later than 10 days after the transmission to stockholders of any report that is required to be transmitted to stockholders under Rule 30e-1 under the Investment Company Act of 1940 (17 CFR 270.30e-1). The Commission may use the information provided on Form N-CSR in its regulatory, disclosure review, inspection, and policymaking roles.
A registrant is required to disclose the information specified by Form N-CSR, and the Commission will make this information public. A registrant is not required to respond to the collection of information contained in Form N-CSR unless the Form displays a currently valid Office of Management and Budget ("OMB") control number. Please direct comments concerning the accuracy of the information collection burden estimate and any suggestions for reducing the burden to Secretary, Securities and Exchange Commission, 450 Fifth Street, NW, Washington, DC 20549-0609. The OMB has reviewed this collection of information under the clearance requirements of 44 U.S.C. § 3507.
Item 1. Reports to Stockholders.

EGA Emerging Global Shares Trust
Annual Report
March 31, 2012
EGShares GEMS Composite ETF
EGShares Basic Materials GEMS ETF
EGShares Consumer Goods GEMS ETF
EGShares Consumer Services GEMS ETF
EGShares Energy GEMS ETF
EGShares Financials GEMS ETF
EGShares Health Care GEMS ETF
EGShares Industrials GEMS ETF
EGShares Technology GEMS ETF
EGShares Telecom GEMS ETF
EGShares Utilities GEMS ETF
EGShares Emerging Markets Metals & Mining ETF
EGShares Emerging Markets Consumer ETF
EGShares India Infrastructure ETF
EGShares China Infrastructure ETF
EGShares Brazil Infrastructure ETF
EGShares India Small Cap ETF
EGShares India Consumer ETF
EGShares Low Volatility Emerging Markets Dividend ETF
Table of Contents
(This page intentionally left blank.)
Letter to Shareholders
Dear Shareholder,
As we enter our fourth year as an ETF provider, much has changed in our industry. Although there are less than fifty US-based ETF firms, some areas of this space are getting crowded. There has been a proliferation of fixed income and equity income products as well as numerous fourth and fifth to market US equity ETFs that are having a difficult time finding a place in investor’s portfolios.
At Emerging Global Advisors (EGA), we continue to remain focused solely on emerging markets. We believe the natural and sensible progression for institutional and other professional investors in emerging markets is trending towards more sector and theme focused exposure tools. We also feel, given our expertise in this area, EGA can offer updated and theme centric broad emerging markets exposure tools. Many of the larger emerging market ETF indexes are less focused on potential future economic drivers. We have focused on, and will continue to provide, what we feel are the most appropriate tools given the economic drivers in these regions. To that end, we believe our funds represent asset categories that could provide great potential for active managers to provide accretive exposures to their EM portfolios.
Ongoing research related to the specific purpose of further product development efforts has been and always will be a focus of our firm. Innovation in our product lineup and a deep appreciation and understanding of the EM opportunity provides us with an edge to make products attractive to investors.
In June of 2011, EGA launched eight additional emerging market sector ETFs, completing the suite of ten. We followed up with an India Consumer ETF (INCO) and Low Volatility Emerging Markets Dividend ETF (HILO) in August. These launches brought our total of funds to 19.
We continue to believe that as developed markets investors learn more about the emerging markets (EMs) investment story, the more interesting the opportunity becomes. We look to continue to introduce products in areas we believe will provide a competitive advantage to emerging market investors and our firm.
Thank you for your support of Emerging Global Advisors ETFs.
Sincerely,

Robert C. Holderith
Chairman of the Board, EGA Emerging Global Shares Trust
President & Founder, Emerging Global Advisors, LLC
This material must be accompanied or preceded by the prospectus
Emerging market investments involve risk of capital loss from unfavorable fluctuation in currency values, from differences in generally accepted accounting principles, from economic or political instability in other nations or increased volatility and lower trading volume. This fund will concentrate its investments in issuers of one or more particular industries to the same extent that its Underlying Index is so concentrated and to the extent permitted by applicable regulatory guidance. Concentration risk results from maintaining exposure to issuers conducting business in a specific industry.
Robert Holderith is a registered representative of ALPS Distributors Inc.
Emerging Global Shares are distributed by ALPS Distributors Inc.
| EGA Emerging Global Shares Trust 1 |
Comments from the Chief Investment Officer & Director of Research
Dear Shareholder:
Twelve months ago, I offered my comments in a similar letter. My remarks included:
| • | | “The “risk on” trade was quickly reversed with investors exiting from positions which had outperformed.” |
| • | | “Emerging market investments of various asset categories (equities, fixed income, currency) underperformed those of developed markets.” |
| • | | “… the US market was relatively strong in the calendar year 2010. This was especially true in the latter half of 2010 … This despite lingering concerns of high unemployment, unsustainable debt levels and partisan government muddling through towards the next presidential election.” |
| • | | “European concerns regarding sovereign risk remain.” |
| • | | “The primary concern seems not to be social unrest and armed conflict (Libya) in the Mideast/North Africa (MENA) region … we observe that during the social unrest … there was little movement in traditional gauges of negative crowd psychology: oil prices did not spike nor did gold or VIX.” |
It is amazing but the clichéd phrase rings true: The more things change, the more they stay the same. Despite some improved economic indicators from the US, we remain in a risk-off psychological environment globally. It may not be enough to blame the Eurozone sovereign crisis. Similar to Europe structurally, the US and Japan remain slow to pull out firmly from the past recession’s grip. Unlike continental Europe which barely dodged a formal recession due to stronger numbers out of Germany, the UK reported a recession for the first quarter of 2012. Thus, one year later we still have a collection of developed economies that are still struggling from the effects of the global financial crisis. In this broad regard, very little has changed.
In fact, with all points listed above, the story remains the same. Short term treasuries remain close to historically low yields as investors accept zero versus the uncertainty of Europe. Emerging market investments continue to relatively underperform as investors gravitate towards the US dollar/treasuries impacting foreign returns both based on capital appreciation and dividend income. Even in the Mideast, concerns remain in Egypt although far greater suffering exists now in Syria. The threat of full scale conventional warfare between Israel and Iran is high.
One distinct difference this year is national politics and in particular, elections. True, the BRICs1 have held national elections with little change. Putin’s return is all about change yet remaining the same. What is more interesting now is recent election results in France and Greece. It may not be a resurgence of the left as it is an ongoing bias towards leftist agendas. Obama’s similar strength is harder to gauge. A simple observation: His entry to the executive office seems to have timed well with the market low of the S&P 500 in March 2009. We make no argument for causality but note how his re-election has greater potential of success as growing hints of sustained economic recovery prevail.
I do not, nor does our firm, make calls on economies or markets. We observe, and provide exposures so investors can make certain calls. However, we do surmise that a strong US economy is in the greater interest of all investors. The emerging markets are growing yet without support rather than drag from the US, Europe and Japan, especially with such globalized and highly correlated markets, investors will continue to be burned by a low return, low yielding environment.
The tug of war among investor psyche remains. Many investors are realizing that they need the growth and income that may come from emerging markets more so than developed markets yet the front page news, regardless of where the focus is, has acted somewhat as a deterrent. Some observers see this as equilibrium of classic greed versus fear.
Market Performance Review
This tug of war may be the only logical explanation for overall sideways or falling markets especially since the summer of 2011. The first quarter of 2012 was a short respite from what has overall been a bearish environment in equity markets with the months of January and February especially stable to the upside. For the quarter ending March 31, 2012, price returns for various capital market benchmarks2 were as follows (source: Bloomberg):
| • | | S&P 500 up 12.00%. MSCI EM index up 13.65%. MSCI World up 10.94%. |
| • | | Gold up 6.38%. Oil (brent crude) up 7.26%. US aggregate bond index up 0.30%. |
| 2 EGA Emerging Global Shares Trust |
Comments from the Chief Investment Officer & Director of Research
(continued)
Due to market weakness in mid 2011, returns were relatively muted over the 12 months ending March 31, 2012:
| • | | S&P 500 up 6.23%. MSCI EM index down 11.05%. MSCI World down 1.72%. |
| • | | Gold up 15.25%. Oil (brent crude) up 14.89%. US aggregate bond index up 7.71%. |
Overall for the 12 months ending March 31, 2012, markets found difficulty establishing a longer term trend. For the months of April to July of 2011, global equities were flat overall. The months of August and September saw a clear uptrend but not necessarily for riskier assets including emerging market equities. The last quarter of 2011 was volatile overall with large swings both ways. Only a broad bull market in the first calendar quarter of 2012 brought some calm to markets.
As of March 31st, total firm assets were US 711.7 million. Our largest funds by assets and their NAV total returns were:
| • | | ECON (EGShares Emerging Markets Consumer ETF): 9.44% for the past 12 months. |
| • | | BRXX (EGShares Brazil Infrastructure ETF): -0.04% for the past 12 months. |
| • | | INXX (EGShares India Infrastructure ETF): -22.19% for the past 12 months. |
For the nine EGShares ETFs whose inception date was prior to March 31, 2011, 12-month returns (based on NAV) ranged from 9.44% for ECON down to -27.66% for EMT (EGShares Emerging Markets Metals & Mining ETF). Along with EMT, three other funds (CHXX, INXX, SCIN) had returns below -20% for the 12-month period.
It is an interesting observation that of the nine EGShares ETFs with at least a 12-month track record, the two top performers were also the largest funds by assets: ECON and BRXX.
Although, for such a short measurement period, it may seem that these returns may seem large but historically may be deemed quite common for emerging markets. Furthermore, although trading volumes may be low in historical terms, price volatility is high and we see this by the wide swings in both quarterly and annual performance along with ranges among various of our funds.
From the data, we see that this inherent volatility is in the nature of the markets overall and not necessarily isolated to the emerging markets.
Global concerns over Europe remain even at the time of this report’s writing if not at heights unseen previously. The VIX index3 was calm (sub 20 in value) prior to Eurozone concerns of the summer of 2011. The VIX spiked to high 40’s and stayed above 30 for most of August to November having not sustained that length of elevated position since the midst of the financial crisis in late 2008. No surprise that oil dropped during that period. Oil did climb from a low below 80 in early October to a high above USD 110 in late February, a rise of over 40%. It has steadily declined since then however at the time of writing, demand for oil has dissipated as crude prices approach USD 90. Gold did provide its classic hedge during the market declines of 2011 especially its climb towards USD 1900 in August 2011. Since then, it has been range-bound (albeit a wide range) between USD 1600-1800. Interestingly, at the time of writing, with rising levels of fear (VIX) related to the Eurozone, gold has fallen to USD 1540.
To repeat again what I stated in last year’s CIO letter to fund shareholders:
“We care less about the raw numbers and more about the trends. Real growth is found there and not here. We are incentivized to save; they spend more. Our aging population is a burden to our system. Their youth is hungry for a better lifestyle and embracing capitalism. We are trying to save blue collar jobs. They compete well for those same jobs (with currency and wages on their side) but are raising the bar on education and thus innovation.”
Without meaning to sound over-dramatic, these comments are more prescient now and the concept of “competing well” needs to be emphasized. The decisions being made in emerging markets are meant to provide a few key results:
| 1. | | Generate a competitive environment within their borders and likely abroad to not only compete with us in the west but against their emerging market brethren. |
| 2. | | As a result of this, they hope to duplicate the economic miracles of recent growth stories such as South Korea, Taiwan and Israel so as to have some form of social harmony and higher standards of living. |
| EGA Emerging Global Shares Trust 3 |
Comments from the Chief Investment Officer & Director of Research
(concluded)
It is not over-dramatic to suggest something is different in the developed world. Europe is a mess and it is amazing that the likelihood of Greece’s exit from the union is a catalyst for unknown potential scenarios for global citizens and investors alike. If Europe is in a mess of unknown proportions, then they are not thinking about competing in this modern, globalized and hyper-competitive world. They are just trying to survive. Some would question if the Japanese are in a similar situation.
It is not for Emerging Global Advisors to determine if the US is also in a similar situation. We are in the business of considering foreign investments, and in particular towards the growth oriented markets. The logic here suggests that of the areas where investors generally have gravitated towards for international diversification, therein lies the greater risks. Europe and Japan are not likely to be growth engines of the future. Certain economies in Europe may in fact be submerging similar to Argentina’s fall of the last 100 years. Of course, there is a fine line here between our observation and the reality of the situation. We only stress the concern that for US investors looking for international diversification, a fair risk assessment may require a more open mind to the so called risky asset class that is emerging markets.
Our firm and the indices our products track remain focused on allowing investors the access to relevant themes, sectors and various niche exposures as well as broader coverage of these important new growth markets.

Richard C. Kang
Chief Investment Officer & Director of Research
May 23, 2012
This material must be accompanied or preceded by the prospectus.
Past performance does not guarantee future results.
Emerging market investments involve risk of capital loss from unfavorable fluctuation in currency values, from differences in generally accepted accounting principles, from economic or political instability in other nations or increased volatility and lower trading volume. This fund will concentrate its investments in issuers of one or more particular industries to the same extent that its Underlying Index is so concentrated and to the extent permitted by applicable regulatory guidance. Concentration risk results from maintaining exposure to issuers conducting business in a specific industry. Small cap and mid cap companies generally will have greater volatility in price than the stocks of large companies due to limited product lines or resources or a dependency upon a particular market niche.
The above commentary is for informational purposes only. Nothing in this commentary should be construed as an offer or recommendation to buy or sell a particular security. The opinions and estimates noted herein are accurate as of May 23, 2012 and are subject to change.
The funds are distributed by ALPS Distributors, Inc.
Richard C. Kang and Robert C. Holderith are registered representative of ALPS Distributors, Inc.
| 1 | | BRICs = Brazil, Russia, India, China |
| 2 | | S&P 500 = Standard and Poor’s 500 Price Return Index, MSCI EM = MSCI Emerging Market Index, MSCI World = MSCI World Index, Gold = Comex Gold 100 oz Futures Contract, Oil (brent crude) = Brent Crude Futures Contract , US Aggregate Bond Index = Barclays US Aggregate Total Return Value Index (unhedged USD) |
| 3 | | VIX Index = The Chicago Board Options Exchange Volatility Index. A reflection of future market volatility based on the weighted average of implied volatilities (time value) found among active S&P 500 index options. Higher values mean greater perceived risk and a higher overall cost as a result to purchase portfolio insurance in the form of index options. Lower values mean less risk aversion. |
| 4 EGA Emerging Global Shares Trust |
(This page intentionally left blank.)
Portfolio Summary (Unaudited)
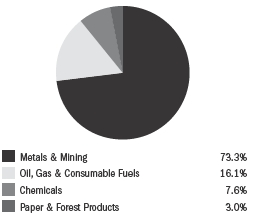
EGShares GEMS Composite ETF
Industry Breakdown*

Top Ten Holdings*
| |
| Gazprom OAO | 5.5% |
| China Mobile, Ltd. | 4.1% |
| Industrial and Commercial Bank of China, Ltd. | 3.5% |
| America Movil SAB de CV | 3.5% |
| Petroleo Brasileiro SA | 3.2% |
| Itau Unibanco Holding SA | 3.2% |
| China Construction Bank Corp. | 3.1% |
| Companhia de Bebidas das Americas | 2.7% |
| Surgutneftegas | 2.6% |
| PetroChina Co., Ltd. | 2.5% |
| * | | Expressed as a percentage of total investments in securities as of 3/31/2012. Holdings are subject to change. |
EGShares GEMS Composite ETF (ticker: AGEM)
The Fund’s investment objective is to seek investment results that correspond (before fees and expenses) to the price and yield performance of the Dow Jones Emerging Markets Sector Titans Composite 100 IndexSM (“Sector Underlying Index”). The Sector Underlying Index is comprised of a representative sample of 100 Emerging Markets companies deemed to be the 10 leading companies in each of the 10 “Industries,” as defined by the Industry Classification Benchmark (“ICB”). Under normal circumstances, the Fund will invest at least 80% of its net assets in companies included in the Index and generally expects to be substantially invested at such times, with at least 95% of its net assets invested in these securities. The Fund will provide shareholders with at least 60 days’ notice prior to any change in this policy. The annual expense ratio of the Fund is 0.75%.
The EGShares GEMS Composite ETF covers the broad emerging markets, in our opinion, better than any other broad exposure global emerging market indexed exchange traded fund. The underlying index does not include South Korea, Taiwan and Israel which many other emerging market indices often include. For investors new to gaining exposure to markets in the developing world, they may be more familiar with the concept of BRIC economies (Brazil, Russia, India, China) which this fund has significant exposure to. In fact, the weights are ranked in this fund as Brazil, then China, Russia and India with South Africa in fifth place. These top five country exposures make up 82% of the fund as of March 31, 2012. The remainder of the Fund predominately gives exposure to Mexico, Chile, Indonesia and Malaysia with several other countries each with less than 1% weight within the fund. Overall, emerging markets underperformed developed markets over the 12 month period ending March 31, 2012 as investors fled for the safety of domestic markets and especially US treasuries.
The EGShares GEMS Composite ETF had a total return of 12.18% at net asset value (“NAV”) for the quarter ended March 31, 2012 and 7.58% annualized return since its inception date of July 22, 2009. The Fund NAV had a -13.97% return for the full year ending March 31, 2012.
Emerging market investments involve risk of capital loss from unfavorable fluctuation in currency values, from differences in generally accepted accounting principles, from economic or political instability in other nations or increased volatility and lower trading volume. This Fund will concentrate its investments in issuers of one or more particular industries to the same extent that its underlying index is so concentrated and to the extent permitted by applicable regulatory guidance. Concentration risk results from investing more than 25% of the Fund’s assets in issuers conducting business in the same industry.
Performance Charts
The following performance chart is provided for comparative purposes and represents the periods noted. The Fund’s per share NAV is the value of one share of the Fund and is calculated by dividing the value of total assets less total liabilities by the number of shares outstanding. The NAV return is based on the NAV of the Fund and the market return is based on the market price per share of the Fund. The price used to calculate market price returns is the mid-point of the highest bid and lowest offer for Fund shares as of the close of trading on the exchange where Fund shares are listed. NAV and market returns assume that dividends and capital gain distributions have been reinvested in the Fund at NAV and market price, respectively. As with other ETFs, NAV returns and market price returns may differ because of factors such as the supply and demand for Fund shares and investors’ assessments of the underlying value of a Fund’s portfolio securities. An index is a statistical measure of a specified financial market or sector. An index does not actually hold a portfolio of securities, incur expenses or pay any transaction costs. Therefore index returns do not reflect deductions for fees or expenses and are not available for direct investment. In comparison, the Fund’s performance is negatively impacted by these fees and expenses. Fund returns do not reflect brokerage commissions, or taxes on transactions in Fund shares or that a shareholder would pay on Fund distributions.
| 6 EGA Emerging Global Shares Trust |
EGShares GEMS Composite ETF
Performance as of 3/31/2012
| | | |
| | Average Annual Total Return |
| | Fund
Net Asset Value | Fund
Market Price | Dow Jones
Emerging Markets
Sector Titans
Composite 10 Index |
| 1 Year | (13.97)% | (13.62)% | (14.16)% |
| Since Inception1 | 7.58% | 7.58% | 7.60% |
Performance data quoted represents past performance. Investment return and principal value of an investment will fluctuate so that an investor’s shares, when sold or redeemed, may be worth more or less than the original cost. Current performance data may be higher or lower than actual data quoted. For the most current month-end performance data please visit www.egshares.com or call (888) 800-4347. As stated in the current prospectus, the Fund’s total annual operating expense ratio after expense waivers and reimbursements is 0.75%. Market price returns are based on the mid-point of the highest bid and lowest offer for Fund shares as of the scheduled close of regular trading on the New York Stock Exchange (“NYSE”) Arca, ordinarily 4:00 p.m. Eastern time, on each day during which the NYSE is open for trading, and do not represent the returns an investor would receive if shares were traded at other times.
Investors should carefully consider the investment objectives, risks, charges and expenses of the Funds before investing. To obtain a prospectus containing this and other important information, please call 1-888-800-4EGS (4347). Read the prospectus carefully before you invest. There are risks involved with investing including the possible loss of principal. Past performance does not guarantee future results.
Emerging Global Shares are distributed by ALPS Distributors Inc.
Value of a $10,000 Investment Since Inception at Net Asset Value
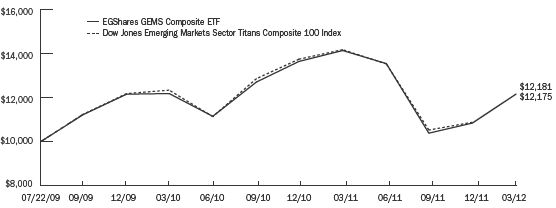
The chart above represents historical performance of a hypothetical investment of $10,000 over the life of the Fund, assuming the reinvestment of distributions. Past performance does not guarantee future results. The hypothetical example does not represent the returns of any particular investment.
| EGA Emerging Global Shares Trust 7 |
Portfolio Summary (Unaudited)
EGShares Basic Materials GEMS ETF
Industry Breakdown*
Top Ten Holdings*
| |
| Vale SA | 10.6% |
| MMC Norilsk Nickel OJSC | 7.2% |
| China Shenhua Energy Co., Ltd. | 5.7% |
| AngloGold Ashanti, Ltd. | 5.7% |
| Grupo Mexico SAB de CV | 5.0% |
| Impala Platinum Holdings, Ltd. | 4.9% |
| Uralkali OJSC | 4.7% |
| Gold Fields, Ltd. | 4.3% |
| Gerdau SA | 4.1% |
| Companhia Siderurgica Nacional SA | 3.9% |
| * | | Expressed as a percentage of total investments in securities as of 3/31/2012. Holdings are subject to change. |
EGShares Basic Materials GEMS ETF (ticker: LGEM)
The Fund’s investment objective is to seek investment results that correspond (before fees and expenses) to the price and yield performance of the Dow Jones Emerging Markets Basic Materials Titans 30 IndexSM (“Basic Materials Underlying Index”). The Basic Materials Underlying Index is comprised of publicly traded firms in the “Basic Materials Industry,” as defined by the Industry Classification Benchmark (“ICB”). Under normal circumstances, the Fund will invest at least 80% of its net assets in securities of Emerging Markets basic materials companies that are included in the Fund’s Basic Materials Underlying Index and generally expects to be substantially invested at such times, with at least 95% of its net assets invested in those securities. The Fund seeks to achieve its investment objective by attempting to replicate the portfolio of the Basic Materials Underlying Index through investments in equity securities, including common shares traded on local exchanges, American Depositary Receipts (“ADRs”) and Global Depositary Receipts (“GDRs”). ADRs and GDRs represent ownership interests in shares of foreign companies that are held in financial institution custodial accounts, and are traded on exchanges in the United States and around the world. The Basic Materials Underlying Index includes companies whose businesses generally involve: chemicals; forestry and paper; industrial metals and mining; and mining. The annual expense ratio of the Fund is 0.85%.
The EGShares Basic Materials GEMS ETF provides a means for investors to have exposure to a particular slice of the commodity complex excluding energy and agriculture. With heightened fears related to Eurozone sovereign risk, investors moved assets away from commodity related investments as concerns lingered of reduced demand. Although January 2012 saw price increases, the months thereafter up to this report’s writing have seen continued price deterioration. Even gold, a classic hedge to market uncertainty, has not been consistent in its ability to retain value during periods of fear. Broader commodity demand, especially from emerging markets, may lead to broader market stability and should provide a stable floor for this Fund going forward. The five largest country exposures (in descending order) were South Africa, Brazil, China, Russia and India.
The EGShares Basic Materials GEMS ETF had a total return of 10.65% at net asset value (“NAV”) for the quarter ended March 31, 2012 and -18.87% return since its inception date of June 23, 2011. Based on this inception date, the Fund did not have enough historical pricing to cover a full year ending March 31, 2012.
Emerging market investments involve risk of capital loss from unfavorable fluctuation in currency values, from differences in generally accepted accounting principles, from economic or political instability in other nations or increased volatility and lower trading volume. This Fund will concentrate its investments in issuers of one or more particular industries to the same extent that its underlying index is so concentrated and to the extent permitted by applicable regulatory guidance. Concentration risk results from investing more than 25% of the Fund’s assets in issuers conducting business in the same industry.
Performance Charts
The following performance chart is provided for comparative purposes and represents the period noted. The Fund’s per share NAV is the value of one share of the Fund and is calculated by dividing the value of total assets less total liabilities by the number of shares outstanding. The NAV return is based on the NAV of the Fund and the market return is based on the market price per share of the Fund. The price used to calculate market price returns is the mid-point of the highest bid and lowest offer for Fund shares as of the close of trading on the exchange where Fund shares are listed. NAV and market returns assume that dividends and capital gain distributions have been reinvested in the Fund at NAV and market price, respectively. As with other ETFs, NAV returns and market price returns may differ because of factors such as the supply and demand for Fund shares and investors’ assessments of the underlying value of a Fund’s portfolio securities. An index is a statistical measure of a specified financial market or sector. An index does not actually hold a portfolio of securities, incur expenses or pay any transaction costs. Therefore index returns do not reflect deductions for fees or expenses and are not available for direct investment. In comparison, the Fund’s performance is negatively impacted by these fees and expenses. Fund returns do not reflect brokerage commissions, or taxes on transactions in Fund shares or that a shareholder would pay on Fund distributions.
| 8 EGA Emerging Global Shares Trust |
EGShares Basic Materials GEMS ETF
Performance as of 3/31/2012
| | | |
| | Average Annual Total Return1 |
| | Fund
Net Asset Value | Fund
Market Price | Dow Jones
Emerging Markets
Basic Materials
Titans 30 Index |
| Since Inception2 | (18.87)% | (18.85)% | (21.23)% |
| 1 | | Returns of less than one year are not annualized. |
Performance data quoted represents past performance. Investment return and principal value of an investment will fluctuate so that an investor’s shares, when sold or redeemed, may be worth more or less than the original cost. Current performance data may be higher or lower than actual data quoted. For the most current month-end performance data please visit www.egshares.com or call (888) 800-4347. This Fund is new and has limited operating history. As stated in the current prospectus, the Fund’s total annual operating expense ratio after expense waivers and reimbursements is 0.85%. Market price returns are based on the mid-point of the highest bid and lowest offer for Fund shares as of the scheduled close of regular trading on the New York Stock Exchange (“NYSE”) Arca, ordinarily 4:00 p.m. Eastern time, on each day during which the NYSE is open for trading, and do not represent the returns an investor would receive if shares were traded at other times.
Investors should carefully consider the investment objectives, risks, charges and expenses of the Funds before investing. To obtain a prospectus containing this and other important information, please call 1-888-800-4EGS (4347). Read the prospectus carefully before you invest. There are risks involved with investing including the possible loss of principal. Past performance does not guarantee future results.
Emerging Global Shares are distributed by ALPS Distributors Inc.
Value of a $10,000 Investment Since Inception at Net Asset Value

The chart above represents historical performance of a hypothetical investment of $10,000 over the life of the Fund, assuming the reinvestment of distributions. Past performance does not guarantee future results. The hypothetical example does not represent the returns of any particular investment.
| EGA Emerging Global Shares Trust 9 |
Portfolio Summary (Unaudited)
EGShares Consumer Goods GEMS ETF
Industry Breakdown*

Top Ten Holdings*
| |
| Companhia de Bebidas das Americas | 10.3% |
| Astra International Tbk PT | 7.2% |
| Fomento Economico Mexicano SAB de CV | 6.4% |
| ITC, Ltd. | 6.2% |
| BRF - Brasil Foods SA | 6.0% |
| Hindustan Unilever, Ltd. | 4.6% |
| Grupo Bimbo SAB de CV | 3.9% |
| Dongfeng Motor Group Co., Ltd. | 3.8% |
| Tiger Brands, Ltd. | 3.8% |
| Bajaj Auto, Ltd. | 3.6% |
| * | | Expressed as a percentage of total investments in securities as of 3/31/2012. Holdings are subject to change. |
EGShares Consumer Goods GEMS ETF (ticker: GGEM)
The Fund’s investment objective is to seek investment results that correspond (before fees and expenses) to the price and yield performance of the Dow Jones Emerging Markets Consumer Goods Titans 30 IndexSM (“Consumer Goods Underlying Index”). The Consumer Goods Underlying Index is comprised of publicly traded firms in the “Consumer Goods Industry,” as defined by the Industry Classification Benchmark (“ICB”). Under normal circumstances, the Fund will invest at least 80% of its net assets in securities of Emerging Markets Consumer Goods companies that are included in the Fund’s Consumer Goods Underlying Index and generally expects to be substantially invested at such times, with at least 95% of its net assets invested in those securities. The Fund seeks to achieve its investment objective by attempting to replicate the portfolio of the Consumer Goods Underlying Index through investments in equity securities, including common shares traded on local exchanges, American Depositary Receipts (“ADRs”) and Global Depositary Receipts (“GDRs”). ADRs and GDRs represent ownership interests in shares of foreign companies that are held in financial institution custodial accounts, and are traded on exchanges in the United States and around the world. The Consumer Goods Underlying Index includes companies whose businesses generally involve: automobiles and parts; beverages; food production; household goods; leisure goods; personal goods; and tobacco. The annual expense ratio of the Fund is 0.85%.
The EGShares Consumer Goods GEMS ETF is one of very few available ETFs to play the emerging market consumer theme. Unlike most other emerging market sectors, since its inception in late June of 2011, GGEM has been a relative outperformer beating both the S&P 500 and MSCI Emerging market indices for the period up to March 31, 2012. Large positions such as Ambev, a major Latin American beverage company not only performed strongly, but also demonstrate the basics of consumer demand. Many of the names in this Fund focus heavily on consumer staples versus consumer discretionary names. As opposed to many consumer funds focused on luxury goods to the emerging markets, this Fund focuses on the goods of greater demand to the billions of new emerging market consumers. As of March 31, 2012, roughly 57% of the Fund’s weight was in the food producers and beverage industries, the two largest components. Geographic diversification was evident with the four largest country exposures all between 18.2% and 13.8% as of March 31, 2012.
The EGShares Consumer Goods GEMS ETF had a total return of 9.80% at net asset value (“NAV”) for the quarter ended March 31, 2012 and 11.62% return since its inception date of June 23, 2011. Based on this inception date, the Fund did not have enough historical pricing to cover a full year ending March 31, 2012.
Emerging market investments involve risk of capital loss from unfavorable fluctuation in currency values, from differences in generally accepted accounting principles, from economic or political instability in other nations or increased volatility and lower trading volume. This Fund will concentrate its investments in issuers of one or more particular industries to the same extent that its underlying index is so concentrated and to the extent permitted by applicable regulatory guidance. Concentration risk results from investing more than 25% of the Fund’s assets in issuers conducting business in the same industry.
Performance Charts
The following performance chart is provided for comparative purposes and represents the period noted. The Fund’s per share NAV is the value of one share of the Fund and is calculated by dividing the value of total assets less total liabilities by the number of shares outstanding. The NAV return is based on the NAV of the Fund and the market return is based on the market price per share of the Fund. The price used to calculate market price returns is the mid-point of the highest bid and lowest offer for Fund shares as of the close of trading on the exchange where Fund shares are listed. NAV and market returns assume that dividends and capital gain distributions have been reinvested in the Fund at NAV and market price, respectively. As with other ETFs, NAV returns and market price returns may differ because of factors such as the supply and demand for Fund shares and investors’ assessments of the underlying value of a Fund’s portfolio securities. An index is a statistical measure of a specified financial market or sector. An index does not actually hold a portfolio of securities, incur expenses or pay any transaction costs. Therefore index returns do not reflect deductions for fees or expenses and are not available for direct investment. In comparison, the Fund’s performance is negatively impacted by these fees and expenses. Fund returns do not reflect brokerage commissions, or taxes on transactions in Fund shares or that a shareholder would pay on Fund distributions.
| 10 EGA Emerging Global Shares Trust |
EGShares Consumer Goods GEMS ETF
Performance as of 3/31/2012
| | | |
| | Average Annual Total Return1 |
| | Fund
Net Asset Value | Fund
Market Price | Dow Jones
Emerging Markets
Consumer Goods
Titans 30 Index |
| Since Inception2 | 11.62% | 11.84% | 9.76% |
| 1 | | Returns of less than one year are not annualized. |
Performance data quoted represents past performance. Investment return and principal value of an investment will fluctuate so that an investor’s shares, when sold or redeemed, may be worth more or less than the original cost. Current performance data may be higher or lower than actual data quoted. For the most current month-end performance data please visit www.egshares.com or call (888) 800-4347. This Fund is new and has limited operating history. As stated in the current prospectus, the Fund’s total annual operating expense ratio after expense waivers and reimbursements is 0.85%. Market price returns are based on the mid-point of the highest bid and lowest offer for Fund shares as of the scheduled close of regular trading on the New York Stock Exchange (“NYSE”) Arca, ordinarily 4:00 p.m. Eastern time, on each day during which the NYSE is open for trading, and do not represent the returns an investor would receive if shares were traded at other times.
Investors should carefully consider the investment objectives, risks, charges and expenses of the Funds before investing. To obtain a prospectus containing this and other important information, please call 1-888-800-4EGS (4347). Read the prospectus carefully before you invest. There are risks involved with investing including the possible loss of principal. Past performance does not guarantee future results.
Emerging Global Shares are distributed by ALPS Distributors Inc.
Value of a $10,000 Investment Since Inception at Net Asset Value
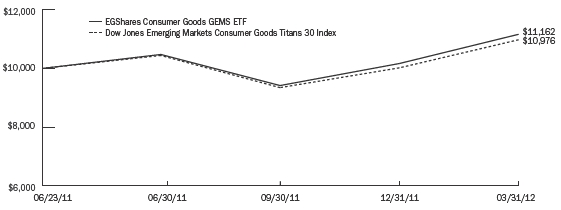
The chart above represents historical performance of a hypothetical investment of $10,000 over the life of the Fund, assuming the reinvestment of distributions. Past performance does not guarantee future results. The hypothetical example does not represent the returns of any particular investment.
| EGA Emerging Global Shares Trust 11 |
Portfolio Summary (Unaudited)
EGShares Consumer Services GEMS ETF
Industry Breakdown*

Top Ten Holdings*
| |
| Naspers, Ltd. | 10.4% |
| Wal-Mart de Mexico SAB de CV | 9.3% |
| Grupo Televisa SAB | 6.9% |
| Cencosud SA | 6.2% |
| S.A.C.I. Falabella | 6.0% |
| Grupo Elektra SA de CV | 4.6% |
| Genting BHD | 4.5% |
| Magnit OJSC | 4.2% |
| Companhia Brasileira de Distribuicao Grupo | |
| Pao de Acucar | 4.0% |
| Shoprite Holdings, Ltd. | 4.0% |
| * | | Expressed as a percentage of total investments in securities as of 3/31/2012. Holdings are subject to change. |
EGShares Consumer Services GEMS ETF (ticker: VGEM)
The Fund’s investment objective is to seek investment results that correspond (before fees and expenses) to the price and yield performance of the Dow Jones Emerging Markets Consumer Services Titans 30 IndexSM (“Consumer Services Underlying Index”). The Consumer Services Underlying Index is comprised of publicly traded firms in the “Consumer Services Industry,” as defined by the Industry Classification Benchmark (“ICB”). Under normal circumstances, the Fund will invest at least 80% of its net assets in securities of Emerging Markets Consumer Services companies that are included in the Fund’s Consumer Services Underlying Index and generally expects to be substantially invested at such times, with at least 95% of its net assets invested in those securities. The Fund seeks to achieve its investment objective by attempting to replicate the portfolio of the Consumer Services Underlying Index through investments in equity securities, including common shares traded on local exchanges, American Depositary Receipts (“ADRs”) and Global Depositary Receipts (“GDRs”). ADRs and GDRs represent ownership interests in shares of foreign companies that are held in financial institution custodial accounts, and are traded on exchanges in the United States and around the world. The Consumer Services Underlying Index includes companies whose businesses generally involve: food and drug retail; general retail; media; and travel and leisure. The annual expense ratio of the Fund is 0.85%.
The EGShares Consumer Services GEMS ETF is a fund heavily biased to basic retailers. The heaviest industry components as of March 31, 2012 were general retailers and food/drug retailers which provided roughly 60% of the Fund’s exposure. Media and travel/leisure were the next largest industry weights with just over one third of the Fund’s exposure. As economies grow and consumers come out of poverty, the services they require will be fairly modest. Basic retailers, media and travel are required of any citizen. Thus, similar to our consumer goods ETF, so the exposures within this Fund focus less on high-end services not of great demand to the larger population of new middle class consumers in these growth markets.
The EGShares Consumer Services GEMS ETF had a total return of 15.88% at net asset value (“NAV”) for the quarter ended March 31, 2012 and 4.49% return since its inception date of June 23, 2011. Based on this inception date, the Fund did not have enough historical pricing to cover a full year ending March 31, 2012.
Emerging market investments involve risk of capital loss from unfavorable fluctuation in currency values, from differences in generally accepted accounting principles, from economic or political instability in other nations or increased volatility and lower trading volume. This Fund will concentrate its investments in issuers of one or more particular industries to the same extent that its underlying index is so concentrated and to the extent permitted by applicable regulatory guidance. Concentration risk results from investing more than 25% of the Fund’s assets in issuers conducting business in the same industry.
Performance Charts
The following performance chart is provided for comparative purposes and represents the period noted. The Fund’s per share NAV is the value of one share of the Fund and is calculated by dividing the value of total assets less total liabilities by the number of shares outstanding. The NAV return is based on the NAV of the Fund and the market return is based on the market price per share of the Fund. The price used to calculate market price returns is the mid-point of the highest bid and lowest offer for Fund shares as of the close of trading on the exchange where Fund shares are listed. NAV and market returns assume that dividends and capital gain distributions have been reinvested in the Fund at NAV and market price, respectively. As with other ETFs, NAV returns and market price returns may differ because of factors such as the supply and demand for Fund shares and investors’ assessments of the underlying value of a Fund’s portfolio securities. An index is a statistical measure of a specified financial market or sector. An index does not actually hold a portfolio of securities, incur expenses or pay any transaction costs. Therefore index returns do not reflect deductions for fees or expenses and are not available for direct investment. In comparison, the Fund’s performance is negatively impacted by these fees and expenses. Fund returns do not reflect brokerage commissions, or taxes on transactions in Fund shares or that a shareholder would pay on Fund distributions.
| 12 EGA Emerging Global Shares Trust |
EGShares Consumer Services GEMS ETF
Performance as of 3/31/2012
| | | |
| | Average Annual Total Return1 |
| | Fund
Net Asset Value | Fund
Market Price | Dow Jones
Emerging Markets
Consumer Services
Titans 30 Index |
| Since Inception2 | 4.49% | 4.54% | 3.36% |
| 1 | | Returns of less than one year are not annualized. |
Performance data quoted represents past performance. Investment return and principal value of an investment will fluctuate so that an investor’s shares, when sold or redeemed, may be worth more or less than the original cost. Current performance data may be higher or lower than actual data quoted. For the most current month-end performance data please visit www.egshares.com or call (888) 800-4347. This Fund is new and has limited operating history. As stated in the current prospectus, the Fund’s total annual operating expense ratio after expense waivers and reimbursements is 0.85%. Market price returns are based on the mid-point of the highest bid and lowest offer for Fund shares as of the scheduled close of regular trading on the New York Stock Exchange (“NYSE”) Arca, ordinarily 4:00 p.m. Eastern time, on each day during which the NYSE is open for trading, and do not represent the returns an investor would receive if shares were traded at other times.
Investors should carefully consider the investment objectives, risks, charges and expenses of the Funds before investing. To obtain a prospectus containing this and other important information, please call 1-888-800-4EGS (4347). Read the prospectus carefully before you invest. There are risks involved with investing including the possible loss of principal. Past performance does not guarantee future results.
Emerging Global Shares are distributed by ALPS Distributors Inc.
Value of a $10,000 Investment Since Inception at Net Asset Value
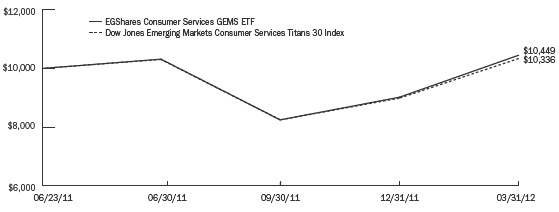
The chart above represents historical performance of a hypothetical investment of $10,000 over the life of the Fund, assuming the reinvestment of distributions. Past performance does not guarantee future results. The hypothetical example does not represent the returns of any particular investment.
| EGA Emerging Global Shares Trust 13 |
Portfolio Summary (Unaudited)
EGShares Energy GEMS ETF
Industry Breakdown*
Top Ten Holdings*
| |
| Gazprom OAO | 10.0% |
| Petroleo Brasileiro SA | 7.1% |
| LUKOIL OAO | 6.6% |
| Surgutneftegas | 6.0% |
| PetroChina Co., Ltd. | 5.9% |
| CNOOC, Ltd. | 5.9% |
| NovaTek OAO | 4.6% |
| China Petroleum & Chemical Corp. | 4.4% |
| Sasol, Ltd. | 4.2% |
| Reliance Industries, Ltd. | 4.2% |
| * | | Expressed as a percentage of total investments in securities as of 3/31/2012. Holdings are subject to change. |
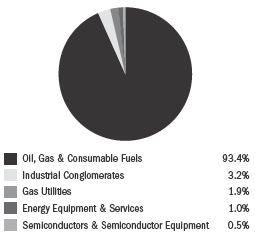
EGShares Energy GEMS ETF (ticker: OGEM)
The Fund’s investment objective is to seek investment results that correspond (before fees and expenses) to the price and yield performance of the Dow Jones Emerging Markets Oil and Gas Titans 30 IndexSM (“Oil and Gas Underlying Index”). The Oil and Gas Underlying Index is comprised of publicly traded firms in the “Oil and Gas Industry,” as defined by the Industry Classification Benchmark (“ICB”). Under normal circumstances, the Fund will invest at least 80% of its net assets in Energy companies included in the Index and generally expects to be substantially invested at such times, with at least 95% of its net assets invested in these securities. The Fund defines Energy companies as companies that are included in the Oil and Gas Underlying Index at the time of purchase and generally includes companies whose businesses involve: oil and gas production; oil equipment, services and distribution; and alternative energy. The Fund will provide shareholders with at least 60 days’ notice prior to any change in this policy. The annual expense ratio of the Fund is 0.85%.
The EGShares Energy GEMS ETF is a fund which can act as an inflation hedge although global investors are likely more concerned with deflation as growth remains lackluster. Aside from certain markets such as India, global markets have not demonstrated anxiety over inflation. For the period from the beginning of 2011 to the end of October 2011, the price of OGEM was fairly close in directional movement with the price of oil. However, a strong 40% increase in oil prices from October 2011 to February 2012 occurred while OGEM underperformed likely due to emerging market currency weakness relative to the US dollar among other macro market factors. Of course, westerners have had little time to complain as energy prices fell back in the first quarter of 2012 as Eurozone worries led to reduced demand assumptions. Longer term optimism exists for the emerging market energy sector given that of the fewer new discoveries, most that are significant are generally found in the developing world such as the Petrobras subsalt deepwater project off the Brazilian Atlantic coast. Other large names in OGEM are also major state owned companies with the BRICs with these four country exposures comprising roughly three-quarters of the Fund’s assets as of March 31, 2012.
The EGShares Energy GEMS ETF had a total return of 14.25% at net asset value (“NAV”) for the quarter ended March 31, 2012 and 8.46% annualized return since its inception date of May 21, 2009. The Fund NAV had a -14.78% return for the full year ending March 31, 2012.
Emerging market investments involve risk of capital loss from unfavorable fluctuation in currency values, from differences in generally accepted accounting principles, from economic or political instability in other nations or increased volatility and lower trading volume. This Fund will concentrate its investments in issuers of one or more particular industries to the same extent that its underlying index is so concentrated and to the extent permitted by applicable regulatory guidance. Concentration risk results from investing more than 25% of the Fund’s assets in issuers conducting business in the same industry.
Performance Charts
The following performance chart is provided for comparative purposes and represents the periods noted. The Fund’s per share NAV is the value of one share of the Fund and is calculated by dividing the value of total assets less total liabilities by the number of shares outstanding. The NAV return is based on the NAV of the Fund and the market return is based on the market price per share of the Fund. The price used to calculate market price returns is the mid-point of the highest bid and lowest offer for Fund shares as of the close of trading on the exchange where Fund shares are listed. NAV and market returns assume that dividends and capital gain distributions have been reinvested in the Fund at NAV and market price, respectively. As with other ETFs, NAV returns and market price returns may differ because of factors such as the supply and demand for Fund shares and investors’ assessments of the underlying value of a Fund’s portfolio securities. An index is a statistical measure of a specified financial market or sector. An index does not actually hold a portfolio of securities, incur expenses or pay any transaction costs. Therefore index returns do not reflect deductions for fees or expenses and are not available for direct investment. In comparison, the Fund’s performance is negatively impacted by these fees and expenses. Fund returns do not reflect brokerage commissions, or taxes on transactions in Fund shares or that a shareholder would pay on Fund distributions.
| 14 EGA Emerging Global Shares Trust |
EGShares Energy GEMS ETF
Performance as of 3/31/2012
| | | |
| | Average Annual Total Return |
| | Fund
Net Asset Value | Fund
Market Price | Dow Jones
Emerging Markets
Oil and Gas
Titans 30 Index |
| 1 Year | (14.78)% | (15.12)% | (16.80)% |
| Since Inception1 | 8.46% | 8.44% | 5.83% |
Performance data quoted represents past performance. Investment return and principal value of an investment will fluctuate so that an investor’s shares, when sold or redeemed, may be worth more or less than the original cost. Current performance data may be higher or lower than actual data quoted. For the most current month-end performance data please visit www.egshares.com or call (888) 800-4347. As stated in the current prospectus, the Fund’s total annual operating expense ratio after expense waivers and reimbursements is 0.85%. Market price returns are based on the mid-point of the highest bid and lowest offer for Fund shares as of the scheduled close of regular trading on the New York Stock Exchange (“NYSE”) Arca, ordinarily 4:00 p.m. Eastern time, on each day during which the NYSE is open for trading, and do not represent the returns an investor would receive if shares were traded at other times.
Investors should carefully consider the investment objectives, risks, charges and expenses of the Funds before investing. To obtain a prospectus containing this and other important information, please call 1-888-800-4EGS (4347). Read the prospectus carefully before you invest. There are risks involved with investing including the possible loss of principal. Past performance does not guarantee future results.
Emerging Global Shares are distributed by ALPS Distributors Inc.
Value of a $10,000 Investment Since Inception at Net Asset Value
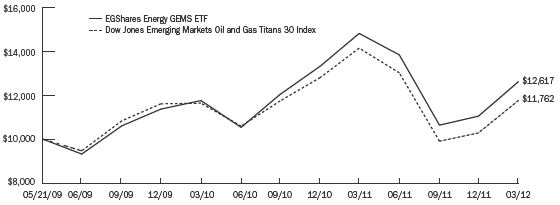
The chart above represents historical performance of a hypothetical investment of $10,000 over the life of the Fund, assuming the reinvestment of distributions. Past performance does not guarantee future results. The hypothetical example does not represent the returns of any particular investment.
| EGA Emerging Global Shares Trust 15 |
Portfolio Summary (Unaudited)
EGShares Financials GEMS ETF
Industry Breakdown*

Top Ten Holdings*
| |
| Industrial and Commercial Bank of China, Ltd. | 9.8% |
| Itau Unibanco Holding SA | 9.1% |
| China Construction Bank Corp. | 8.9% |
| Banco Bradesco SA | 7.3% |
| Sberbank of Russia | 5.9% |
| Bank of China, Ltd. | 4.5% |
| Standard Bank Group, Ltd. | 4.3% |
| Housing Development Finance Corp., Ltd. | 4.3% |
| China Life Insurance Co., Ltd. | 4.3% |
| HDFC Bank, Ltd. | 3.9% |
| * | | Expressed as a percentage of total investments in securities as of 3/31/2012. Holdings are subject to change. |
EGShares Financials GEMS ETF (ticker: FGEM)
The Fund’s investment objective is to seek investment results that correspond (before fees and expenses) to the price and yield performance of the Dow Jones Emerging Markets Financials Titans 30 IndexSM (“Financials Underlying Index”). The Financials Underlying Index is comprised of publicly traded firms in the “Financials Industry,” as defined by the Industry Classification Benchmark (“ICB”). Under normal circumstances, the Fund will invest at least 80% of its net assets in Financials companies included in the Index and generally expects to be substantially invested at such times, with at least 95% of its net assets invested in these securities. The Fund defines Financials companies as companies that are included in the Financials Underlying Index at the time of purchase and generally includes companies whose businesses involve: banking; insurance; real estate; and financial services. The Fund will provide shareholders with at least 60 days’ notice prior to any change in this policy. The annual expense ratio of the Fund is 0.85%.
The EGShares Financials GEMS ETF provides unique exposure to a sector that has traditionally and even today remains focused on American, European and Japanese banks. Given new regulations (Dodd-Frank, Volker rule, etc.) and increased public scrutiny (Occupy Wall Street), it is quite surprising that investors have not generally accepted diversification of financial sector assets into emerging markets. Not burdened by household or corporate indebtedness, nor with balance sheets littered with real estate related holdings, financial institutions in the emerging markets are tied to individuals and companies that are in their prime growth stage. Furthermore, for early stage economies, the financial sector acts in a function similar to a utility or key infrastructure. For the economy to grow and modernize, financial institutions both public and private are required so as to allow for the efficient allocation of high growth capital. As of March 31, 2012, the emerging market financial sector had one of the lowest valuations, by trailing P/E among all sectors.
The EGShares Financials GEMS ETF had a total return of 12.66% at net asset value (“NAV”) for the quarter ended March 31, 2012 and 2.15% annualized return since its inception date of September 16, 2009. The Fund NAV had a -16.52% return for the full year ending March 31, 2012.
Emerging market investments involve risk of capital loss from unfavorable fluctuation in currency values, from differences in generally accepted accounting principles, from economic or political instability in other nations or increased volatility and lower trading volume. This Fund will concentrate its investments in issuers of one or more particular industries to the same extent that its underlying index is so concentrated and to the extent permitted by applicable regulatory guidance. Concentration risk results from investing more than 25% of the Fund’s assets in issuers conducting business in the same industry.
Performance Charts
The following performance chart is provided for comparative purposes and represents the periods noted. The Fund’s per share NAV is the value of one share of the Fund and is calculated by dividing the value of total assets less total liabilities by the number of shares outstanding. The NAV return is based on the NAV of the Fund and the market return is based on the market price per share of the Fund. The price used to calculate market price returns is the mid-point of the highest bid and lowest offer for Fund shares as of the close of trading on the exchange where Fund shares are listed. NAV and market returns assume that dividends and capital gain distributions have been reinvested in the Fund at NAV and market price, respectively. As with other ETFs, NAV returns and market price returns may differ because of factors such as the supply and demand for Fund shares and investors’ assessments of the underlying value of a Fund’s portfolio securities. An index is a statistical measure of a specified financial market or sector. An index does not actually hold a portfolio of securities, incur expenses or pay any transaction costs. Therefore index returns do not reflect deductions for fees or expenses and are not available for direct investment. In comparison, the Fund’s performance is negatively impacted by these fees and expenses. Fund returns do not reflect brokerage commissions, or taxes on transactions in Fund shares or that a shareholder would pay on Fund distributions.
| 16 EGA Emerging Global Shares Trust |
EGShares Financials GEMS ETF
Performance as of 3/31/2012
| | | |
| | Average Annual Total Return |
| | Fund
Net Asset Value | Fund
Market Price | Dow Jones
Emerging Markets
Financials
Titans 30 Index |
| 1 Year | (16.52)% | (16.64)% | (17.75)% |
| Since Inception1 | 2.15% | 2.01% | 0.31% |
Performance data quoted represents past performance. Investment return and principal value of an investment will fluctuate so that an investor’s shares, when sold or redeemed, may be worth more or less than the original cost. Current performance data may be higher or lower than actual data quoted. For the most current month-end performance data please visit www.egshares.com or call (888) 800-4347. As stated in the current prospectus, the Fund’s total annual operating expense ratio after expense waivers and reimbursements is 0.85%. Market price returns are based on the mid-point of the highest bid and lowest offer for Fund shares as of the scheduled close of regular trading on the New York Stock Exchange (“NYSE”) Arca, ordinarily 4:00 p.m. Eastern time, on each day during which the NYSE is open for trading, and do not represent the returns an investor would receive if shares were traded at other times.
Investors should carefully consider the investment objectives, risks, charges and expenses of the Funds before investing. To obtain a prospectus containing this and other important information, please call 1-888-800-4EGS (4347). Read the prospectus carefully before you invest. There are risks involved with investing including the possible loss of principal. Past performance does not guarantee future results.
Emerging Global Shares are distributed by ALPS Distributors Inc.
Value of a $10,000 Investment Since Inception at Net Asset Value

The chart above represents historical performance of a hypothetical investment of $10,000 over the life of the Fund, assuming the reinvestment of distributions. Past performance does not guarantee future results. The hypothetical example does not represent the returns of any particular investment.
| EGA Emerging Global Shares Trust 17 |
Portfolio Summary (Unaudited)
EGShares Health Care GEMS ETF
Industry Breakdown*
Top Ten Holdings*
| |
| Aspen Pharmacare Holdings, Ltd. | 10.7% |
| Dr. Reddy’s Laboratories, Ltd. | 8.5% |
| Sun Pharmaceutical Industries, Ltd. | 8.1% |
| Cipla, Ltd. | 6.5% |
| Mindray Medical International, Ltd. | 6.2% |
| Richter Gedeon Nyrt | 4.7% |
| Sinopharm Group Co. | 4.7% |
| Netcare, Ltd. | 4.4% |
| Mediclinic International, Ltd. | 4.2% |
| Kalbe Farma Tbk PT | 3.6% |
| * | | Expressed as a percentage of total investments in securities as of 3/31/2012. Holdings are subject to change. |
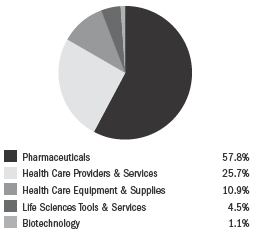
EGShares Health Care GEMS ETF (ticker: HGEM)
The Fund’s investment objective is to seek investment results that correspond (before fees and expenses) to the price and yield performance of the Dow Jones Emerging Markets Health Care Titans 30 IndexSM (“Health Care Underlying Index”). The Health Care Underlying Index is comprised of publicly traded firms in the “Health Care Industry,” as defined by the Industry Classification Benchmark (“ICB”). Under normal circumstances, the Fund will invest at least 80% of its net assets in securities of Emerging Markets Health Care companies that are included in the Fund’s Health Care Underlying Index and generally expects to be substantially invested at such times, with at least 95% of its net assets invested in those securities. The Fund seeks to achieve its investment objective by attempting to replicate the portfolio of the Health Care Underlying Index through investments in equity securities, including common shares traded on local exchanges, American Depositary Receipts (“ADRs”) and Global Depositary Receipts (“GDRs”). ADRs and GDRs represent ownership interests in shares of foreign companies that are held in financial institution custodial accounts, and are traded on exchanges in the United States and around the world. The Health Care Underlying Index includes companies whose businesses generally involve: health care equipment and services; and pharmaceuticals and biotechnology. The annual expense ratio of the Fund is 0.85%.
The EGShares Health Care GEMS ETF is a unique sector fund that plays the consumption story both in the emerging markets and globally. Roughly 70% of the Fund’s exposure is in pharmaceutical and biotech companies. The remainder of the Fund is in health care equipment and services companies. Along with such industry bias, the Fund’s geographical breakdown is heavily biased towards India (37%), South Africa (25%) and China (19%) as of March 31, 2012. The remaining 20% is divided among seven other economies. Although these companies are headquartered in the emerging markets, their revenue reach is globally oriented. For example, one of the largest positions in the Fund, Dr. Reddy’s Laboratories, had only 17.8% of its FY2011 revenues from its domestic market according to Bloomberg. Although involved in proprietary drug research, a significant component of its business is generic drug distribution to western markets. If developed market consumers have become more cost conscious because of the effects of the global financial crisis as well as high health care and drug costs, emerging market companies seem willing to compete in this sector.
The EGShares Health Care GEMS ETF had a total return of 16.33% at net asset value (“NAV”) for the quarter ended March 31, 2012 and -4.33% return since its inception date of June 23, 2011. Based on this inception date, the Fund did not have enough historical pricing to cover a full year ending March 31, 2012.
Emerging market investments involve risk of capital loss from unfavorable fluctuation in currency values, from differences in generally accepted accounting principles, from economic or political instability in other nations or increased volatility and lower trading volume. This Fund will concentrate its investments in issuers of one or more particular industries to the same extent that its underlying index is so concentrated and to the extent permitted by applicable regulatory guidance. Concentration risk results from investing more than 25% of the Fund’s assets in issuers conducting business in the same industry.
Performance Charts
The following performance chart is provided for comparative purposes and represents the period noted. The Fund’s per share NAV is the value of one share of the Fund and is calculated by dividing the value of total assets less total liabilities by the number of shares outstanding. The NAV return is based on the NAV of the Fund and the market return is based on the market price per share of the Fund. The price used to calculate market price returns is the mid-point of the highest bid and lowest offer for Fund shares as of the close of trading on the exchange where Fund shares are listed. NAV and market returns assume that dividends and capital gain distributions have been reinvested in the Fund at NAV and market price, respectively. As with other ETFs, NAV returns and market price returns may differ because of factors such as the supply and demand for Fund shares and investors’ assessments of the underlying value of a Fund’s portfolio securities. An index is a statistical measure of a specified financial market or sector. An index does not actually hold a portfolio of securities, incur expenses or pay any transaction costs. Therefore index returns do not reflect deductions for fees or expenses and are not available for direct investment. In comparison, the Fund’s performance is negatively impacted by these fees and expenses. Fund returns do not reflect brokerage commissions, or taxes on transactions in Fund shares or that a shareholder would pay on Fund distributions.
| 18 EGA Emerging Global Shares Trust |
EGShares Health Care GEMS ETF
Performance as of 3/31/2012
| | | |
| | Average Annual Total Return1 |
| | Fund
Net Asset Value | Fund
Market Price | Dow Jones
Emerging Markets
Health Care
Titans 30 Index |
| Since Inception2 | (4.33)% | (4.43)% | (4.93)% |
| 1 | | Returns of less than one year are not annualized. |
Performance data quoted represents past performance. Investment return and principal value of an investment will fluctuate so that an investor’s shares, when sold or redeemed, may be worth more or less than the original cost. Current performance data may be higher or lower than actual data quoted. For the most current month-end performance data please visit www.egshares.com or call (888) 800-4347. This Fund is new and has limited operating history. As stated in the current prospectus, the Fund’s total annual operating expense ratio after expense waivers and reimbursements is 0.85%. Market price returns are based on the mid-point of the highest bid and lowest offer for Fund shares as of the scheduled close of regular trading on the New York Stock Exchange (“NYSE”) Arca, ordinarily 4:00 p.m. Eastern time, on each day during which the NYSE is open for trading, and do not represent the returns an investor would receive if shares were traded at other times.
Investors should carefully consider the investment objectives, risks, charges and expenses of the Funds before investing. To obtain a prospectus containing this and other important information, please call 1-888-800-4EGS (4347). Read the prospectus carefully before you invest. There are risks involved with investing including the possible loss of principal. Past performance does not guarantee future results.
Emerging Global Shares are distributed by ALPS Distributors Inc.
Value of a $10,000 Investment Since Inception at Net Asset Value

The chart above represents historical performance of a hypothetical investment of $10,000 over the life of the Fund, assuming the reinvestment of distributions. Past performance does not guarantee future results. The hypothetical example does not represent the returns of any particular investment.
| EGA Emerging Global Shares Trust 19 |
Portfolio Summary (Unaudited)
EGShares Industrials GEMS ETF
Industry Breakdown*

Top Ten Holdings*
| |
| Larsen & Toubro, Ltd. | 9.3% |
| Tata Motors, Ltd. | 6.6% |
| Cemex SAB de CV | 6.1% |
| Sime Darby BHD | 5.4% |
| Bidvest Group, Ltd. | 5.0% |
| United Tractors Tbk PT | 4.8% |
| Mahindra & Mahindra, Ltd. | 4.8% |
| Semen Gresik Persero Tbk PT | 3.9% |
| China Communications Construction Co., Ltd. | 3.9% |
| Embraer SA | 3.6% |
| * | | Expressed as a percentage of total investments in securities as of 3/31/2012. Holdings are subject to change. |
EGShares Industrials GEMS ETF (ticker: IGEM)
The Fund’s investment objective is to seek investment results that correspond (before fees and expenses) to the price and yield performance of the Dow Jones Emerging Markets Industrials Titans 30 IndexSM (“Industrials Underlying Index”). The Industrials Underlying Index is comprised of publicly traded firms in the “Industrials Industry,” as defined by the Industry Classification Benchmark (“ICB”). Under normal circumstances, the Fund will invest at least 80% of its net assets in securities of Emerging Markets Industrials companies that are included in the Fund’s Industrials Underlying Index and generally expects to be substantially invested at such times, with at least 95% of its net assets invested in those securities. The Fund seeks to achieve its investment objective by attempting to replicate the portfolio of the Industrials Underlying Index through investments in equity securities, including common shares traded on local exchanges, American Depositary Receipts (“ADRs”) and Global Depositary Receipts (“GDRs”). ADRs and GDRs represent ownership interests in shares of foreign companies that are held in financial institution custodial accounts, and are traded on exchanges in the United States and around the world. The Industrials Underlying Index includes companies whose businesses generally involve: construction and materials; aerospace and defense; general industrials; electronic and electrical equipment; industrial engineering; industrial transportation; and support services. The annual expense ratio of the Fund is 0.85%.
The EGShares Industrials GEMS ETF is a fund with a heavy bias to constructions & materials with a roughly 46% weight as of March 31, 2012. Infrastructure is key part of the thematic play within this sector fund although the manufacturing of cars and airplanes are also components. India and China are the largest country weights covering nearly half the portfolio by assets. Performing very similarly since its inception March 31, 2012 versus the common broad global emerging market indices, emerging market industrials was the top performer among sectors in Q1 2012.
The EGShares Industrials GEMS ETF had a total return of 22.42% at net asset value (“NAV”) for the quarter ended March 31, 2012 and -5.88% return since its inception date of June 23, 2011. Based on this inception date, the Fund did not have enough historical pricing to cover a full year ending March 31, 2012.
Emerging market investments involve risk of capital loss from unfavorable fluctuation in currency values, from differences in generally accepted accounting principles, from economic or political instability in other nations or increased volatility and lower trading volume. This Fund will concentrate its investments in issuers of one or more particular industries to the same extent that its underlying index is so concentrated and to the extent permitted by applicable regulatory guidance. Concentration risk results from investing more than 25% of the Fund’s assets in issuers conducting business in the same industry.
Performance Charts
The following performance chart is provided for comparative purposes and represents the period noted. The Fund’s per share NAV is the value of one share of the Fund and is calculated by dividing the value of total assets less total liabilities by the number of shares outstanding. The NAV return is based on the NAV of the Fund and the market return is based on the market price per share of the Fund. The price used to calculate market price returns is the mid-point of the highest bid and lowest offer for Fund shares as of the close of trading on the exchange where Fund shares are listed. NAV and market returns assume that dividends and capital gain distributions have been reinvested in the Fund at NAV and market price, respectively. As with other ETFs, NAV returns and market price returns may differ because of factors such as the supply and demand for Fund shares and investors’ assessments of the underlying value of a Fund’s portfolio securities. An index is a statistical measure of a specified financial market or sector. An index does not actually hold a portfolio of securities, incur expenses or pay any transaction costs. Therefore index returns do not reflect deductions for fees or expenses and are not available for direct investment. In comparison, the Fund’s performance is negatively impacted by these fees and expenses. Fund returns do not reflect brokerage commissions, or taxes on transactions in Fund shares or that a shareholder would pay on Fund distributions.
| 20 EGA Emerging Global Shares Trust |
EGShares Industrials GEMS ETF
Performance as of 3/31/2012
| | | |
| | Average Annual Total Return1 |
| | Fund
Net Asset Value | Fund
Market Price | Dow Jones
Emerging Markets
Industrials
Titans 30 Index |
| Since Inception2 | (5.88)% | (7.63)% | (6.27)% |
| 1 | | Returns of less than one year are not annualized. |
Performance data quoted represents past performance. Investment return and principal value of an investment will fluctuate so that an investor’s shares, when sold or redeemed, may be worth more or less than the original cost. Current performance data may be higher or lower than actual data quoted. For the most current month-end performance data please visit www.egshares.com or call (888) 800-4347. This Fund is new and has limited operating history. As stated in the current prospectus, the Fund’s total annual operating expense ratio after expense waivers and reimbursements is 0.85%. Market price returns are based on the mid-point of the highest bid and lowest offer for Fund shares as of the scheduled close of regular trading on the New York Stock Exchange (“NYSE”) Arca, ordinarily 4:00 p.m. Eastern time, on each day during which the NYSE is open for trading, and do not represent the returns an investor would receive if shares were traded at other times.
Investors should carefully consider the investment objectives, risks, charges and expenses of the Funds before investing. To obtain a prospectus containing this and other important information, please call 1-888-800-4EGS (4347). Read the prospectus carefully before you invest. There are risks involved with investing including the possible loss of principal. Past performance does not guarantee future results.
Emerging Global Shares are distributed by ALPS Distributors Inc.
Value of a $10,000 Investment Since Inception at Net Asset Value
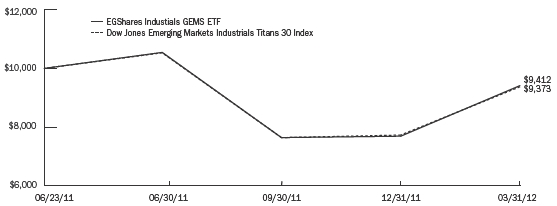
The chart above represents historical performance of a hypothetical investment of $10,000 over the life of the Fund, assuming the reinvestment of distributions. Past performance does not guarantee future results. The hypothetical example does not represent the returns of any particular investment.
| EGA Emerging Global Shares Trust 21 |
Portfolio Summary (Unaudited)
EGShares Technology GEMS ETF
Industry Breakdown*
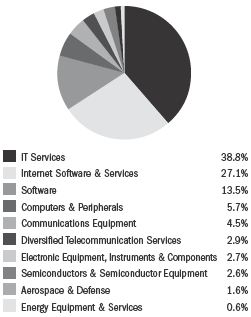
Top Ten Holdings*
| |
| Infosys, Ltd. | 10.0% |
| Baidu, Inc. | 9.1% |
| Tata Consultancy Services, Ltd. | 6.5% |
| Lenovo Group, Ltd. | 5.7% |
| NetEase.com, Inc. | 5.4% |
| SINA Corp. | 5.0% |
| Wipro, Ltd. | 5.0% |
| Sohu.com, Inc. | 3.9% |
| Mail.ru Group, Ltd. | 3.7% |
| ZTE Corp. | 3.3% |
| * | | Expressed as a percentage of total investments in securities as of 3/31/2012. Holdings are subject to change. |
EGShares Technology GEMS ETF (ticker: QGEM)
The Fund’s investment objective is to seek investment results that correspond (before fees and expenses) to the price and yield performance of the Dow Jones Emerging Markets Technology Titans 30 IndexSM (“Technology Underlying Index”). The Technology Underlying Index is comprised of publicly traded firms in the “Technology Industry,” as defined by the Industry Classification Benchmark (“ICB”). Under normal circumstances, the Fund will invest at least 80% of its net assets in securities of Emerging Markets Technology companies that are included in the Fund’s Technology Underlying Index and generally expects to be substantially invested at such times, with at least 95% of its net assets invested in those securities. The Fund seeks to achieve its investment objective by attempting to replicate the portfolio of the Technology Underlying Index through investments in equity securities, including common shares traded on local exchanges, American Depositary Receipts (“ADRs”) and Global Depositary Receipts (“GDRs”). ADRs and GDRs represent ownership interests in shares of foreign companies that are held in financial institution custodial accounts, and are traded on exchanges in the United States and around the world. The Technology Underlying Index includes companies whose businesses generally involve: software and computer services; and technology hardware and equipment. The annual expense ratio of the Fund is 0.85%.
The EGShares Technology GEMS ETF is another fund that performed very similarly to the broad global emerging market benchmarks from its inception in 2011 to March 31, 2012 highlighting the macro nature of global markets over that period. With one of the most extreme country biases, QGEM’s largest weightings are in China at nearly 45% and India at roughly 40% weight based on assets. All other country weights were less than 5% as of March 31, 2012. Industry bias within the Fund was heavy towards software and computer services at roughly 83% of the Fund’s weight. Hardware and equipment providers are not the largest tech companies in emerging markets as they are in developed economies like South Korea and Taiwan. Some of the internet companies in QGEM like Baidu (China) are similar to consumer plays in the way Google or Amazon are in the US.
The EGShares Technology GEMS ETF had a total return of 19.27% at net asset value (“NAV”) for the quarter ended March 31, 2012 and -5.60% return since its inception date of June 23, 2011. Based on this inception date, the Fund did not have enough historical pricing to cover a full year ending March 31, 2012.
Emerging market investments involve risk of capital loss from unfavorable fluctuation in currency values, from differences in generally accepted accounting principles, from economic or political instability in other nations or increased volatility and lower trading volume. This Fund will concentrate its investments in issuers of one or more particular industries to the same extent that its underlying index is so concentrated and to the extent permitted by applicable regulatory guidance. Concentration risk results from investing more than 25% of the Fund’s assets in issuers conducting business in the same industry.
Performance Charts
The following performance chart is provided for comparative purposes and represents the period noted. The Fund’s per share NAV is the value of one share of the Fund and is calculated by dividing the value of total assets less total liabilities by the number of shares outstanding. The NAV return is based on the NAV of the Fund and the market return is based on the market price per share of the Fund. The price used to calculate market price returns is the mid-point of the highest bid and lowest offer for Fund shares as of the close of trading on the exchange where Fund shares are listed. NAV and market returns assume that dividends and capital gain distributions have been reinvested in the Fund at NAV and market price, respectively. As with other ETFs, NAV returns and market price returns may differ because of factors such as the supply and demand for Fund shares and investors’ assessments of the underlying value of a Fund’s portfolio securities. An index is a statistical measure of a specified financial market or sector. An index does not actually hold a portfolio of securities, incur expenses or pay any transaction costs. Therefore index returns do not reflect deductions for fees or expenses and are not available for direct investment. In comparison, the Fund’s performance is negatively impacted by these fees and expenses. Fund returns do not reflect brokerage commissions, or taxes on transactions in Fund shares or that a shareholder would pay on Fund distributions.
| 22 EGA Emerging Global Shares Trust |
EGShares Technology GEMS ETF
Performance as of 3/31/2012
| | | |
| | Average Annual Total Return1 |
| | Fund
Net Asset Value | Fund
Market Price | Dow Jones
Emerging Markets
Technology
Titans 30 Index |
| Since Inception2 | (5.60)% | (5.50)% | (4.73)% |
| 1 | | Returns of less than one year are not annualized. |
Performance data quoted represents past performance. Investment return and principal value of an investment will fluctuate so that an investor’s shares, when sold or redeemed, may be worth more or less than the original cost. Current performance data may be higher or lower than actual data quoted. For the most current month-end performance data please visit www.egshares.com or call (888) 800-4347. This Fund is new and has limited operating history. As stated in the current prospectus, the Fund’s total annual operating expense ratio after expense waivers and reimbursements is 0.85%. Market price returns are based on the mid-point of the highest bid and lowest offer for Fund shares as of the scheduled close of regular trading on the New York Stock Exchange (“NYSE”) Arca, ordinarily 4:00 p.m. Eastern time, on each day during which the NYSE is open for trading, and do not represent the returns an investor would receive if shares were traded at other times.
Investors should carefully consider the investment objectives, risks, charges and expenses of the Funds before investing. To obtain a prospectus containing this and other important information, please call 1-888-800-4EGS (4347). Read the prospectus carefully before you invest. There are risks involved with investing including the possible loss of principal. Past performance does not guarantee future results.
Emerging Global Shares are distributed by ALPS Distributors Inc.
Value of a $10,000 Investment Since Inception at Net Asset Value
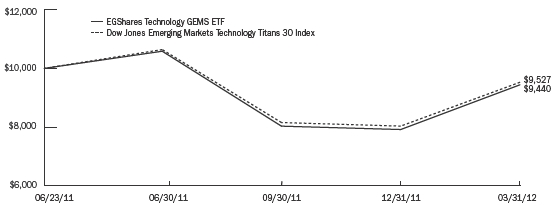
The chart above represents historical performance of a hypothetical investment of $10,000 over the life of the Fund, assuming the reinvestment of distributions. Past performance does not guarantee future results. The hypothetical example does not represent the returns of any particular investment.
| EGA Emerging Global Shares Trust 23 |
Portfolio Summary (Unaudited)
EGShares Telecom GEMS ETF
Industry Breakdown*

Top Ten Holdings*
| |
| China Mobile, Ltd. | 10.1% |
| America Movil SAB de CV | 9.5% |
| MTN Group, Ltd. | 6.8% |
| Mobile TeleSystems | 4.5% |
| Telefonica Brasil SA | 4.5% |
| Bharti Airtel, Ltd. | 4.2% |
| Telekomunikasi Indonesia Tbk PT | 4.0% |
| China Telecom Corp., Ltd. | 3.9% |
| Advanced Info Service PCL | 3.9% |
| China Unicom Hong Kong, Ltd. | 3.8% |
| * | | Expressed as a percentage of total investments in securities as of 3/31/2012. Holdings are subject to change. |
EGShares Telecom GEMS ETF (ticker: TGEM)
The Fund’s investment objective is to seek investment results that correspond (before fees and expenses) to the price and yield performance of the Dow Jones Emerging Markets Telecommunications Titans 30 IndexSM (“Telecom Underlying Index”). The Telecom Underlying Index is comprised of publicly traded firms in the “Telecommunications Industry,” as defined by the Industry Classification Benchmark (“ICB”).
Under normal circumstances, the Fund will invest at least 80% of its net assets in securities of Emerging Markets Telecom companies that are included in the Fund’s Telecom Underlying Index and generally expects to be substantially invested at such times, with at least 95% of its net assets invested in those securities. The Fund seeks to achieve its investment objective by attempting to replicate the portfolio of the Telecom Underlying Index through investments in equity securities, including common shares traded on local exchanges, American Depositary Receipts (“ADRs”) and Global Depositary Receipts (“GDRs”). ADRs and GDRs represent ownership interests in shares of foreign companies that are held in financial institution custodial accounts, and are traded on exchanges in the United States and around the world. The Telecom Underlying Index includes companies whose businesses generally involve: fixed line telecommunications; and mobile telecommunications. The annual expense ratio of the Fund is 0.85%.
The EGShares Telecom GEMS ETF can be seen as a play on what our firm believes are the two biggest themes in emerging market investing: consumption and infrastructure. The ability to gather information and consume via a mobile device can be as common in Africa as it is here in the US. Because of this, ability to easily consume beyond a “bricks and mortar” establishment, the cellphone tower and other components that come from telecom companies can also be considered infrastructure. Similar to the flow of oil through a pipeline or power through a grid, so does the flow of voice or data (as a form of capital) allow for a more modern economy. The Fund consists of roughly 72% mobile telecom versus 28% fixed line telecom. As in any jurisdiction, within individual emerging markets, the telecom industry is dominated by a few names. Thus, as is typical in global utility funds, TGEM has relatively large names diversified well among many countries. No country in TGEM has more than an 18% weight. Since inception, TGEM has outperformed the broad global emerging market benchmark demonstrating properties similar to a lower beta index versus the benchmark.
The EGShares Telecom GEMS ETF had a total return of 10.68% at net asset value (“NAV”) for the quarter ended March 31, 2012 and 2.22% return since its inception date of June 23, 2011. Based on this inception date, the Fund did not have enough historical pricing to cover a full year ending March 31, 2012.
Emerging market investments involve risk of capital loss from unfavorable fluctuation in currency values, from differences in generally accepted accounting principles, from economic or political instability in other nations or increased volatility and lower trading volume. This Fund will concentrate its investments in issuers of one or more particular industries to the same extent that its underlying index is so concentrated and to the extent permitted by applicable regulatory guidance. Concentration risk results from investing more than 25% of the Fund’s assets in issuers conducting business in the same industry.
Performance Charts
The following performance chart is provided for comparative purposes and represents the period noted. The Fund’s per share NAV is the value of one share of the Fund and is calculated by dividing the value of total assets less total liabilities by the number of shares outstanding. The NAV return is based on the NAV of the Fund and the market return is based on the market price per share of the Fund. The price used to calculate market price returns is the mid-point of the highest bid and lowest offer for Fund shares as of the close of trading on the exchange where Fund shares are listed. NAV and market returns assume that dividends and capital gain distributions have been reinvested in the Fund at NAV and market price, respectively. As with other ETFs, NAV returns and market price returns may differ because of factors such as the supply and demand for Fund shares and investors’ assessments of the underlying value of a Fund’s portfolio securities. An index is a statistical measure of a specified financial market or sector. An index does not actually hold a portfolio of securities, incur expenses or pay any transaction costs. Therefore index returns do not reflect deductions for fees or expenses and are not available for direct investment. In comparison, the Fund’s performance is negatively impacted by these fees and expenses. Fund returns do not reflect brokerage commissions, or taxes on transactions in Fund shares or that a shareholder would pay on Fund distributions.
| 24 EGA Emerging Global Shares Trust |
EGShares Telecom GEMS ETF
Performance as of 3/31/2012
| | | |
| | Average Annual Total Return1 |
| | Fund
Net Asset Value | Fund
Market Price | Dow Jones
Emerging Markets
Telecommunications
Titans 30 Index |
| Since Inception2 | 2.22% | 3.64% | 0.44% |
| 1 | | Returns of less than one year are not annualized. |
Performance data quoted represents past performance. Investment return and principal value of an investment will fluctuate so that an investor’s shares, when sold or redeemed, may be worth more or less than the original cost. Current performance data may be higher or lower than actual data quoted. For the most current month-end performance data please visit www.egshares.com or call (888) 800-4347. This Fund is new and has limited operating history. As stated in the current prospectus, the Fund’s total annual operating expense ratio after expense waivers and reimbursements is 0.85%. Market price returns are based on the mid-point of the highest bid and lowest offer for Fund shares as of the scheduled close of regular trading on the New York Stock Exchange (“NYSE”) Arca, ordinarily 4:00 p.m. Eastern time, on each day during which the NYSE is open for trading, and do not represent the returns an investor would receive if shares were traded at other times.
Investors should carefully consider the investment objectives, risks, charges and expenses of the Funds before investing. To obtain a prospectus containing this and other important information, please call 1-888-800-4EGS (4347). Read the prospectus carefully before you invest. There are risks involved with investing including the possible loss of principal. Past performance does not guarantee future results.
Emerging Global Shares are distributed by ALPS Distributors Inc.
Value of a $10,000 Investment Since Inception at Net Asset Value

The chart above represents historical performance of a hypothetical investment of $10,000 over the life of the Fund, assuming the reinvestment of distributions. Past performance does not guarantee future results. The hypothetical example does not represent the returns of any particular investment.
| EGA Emerging Global Shares Trust 25 |
Portfolio Summary (Unaudited)
EGShares Utilities GEMS ETF
Industry Breakdown*
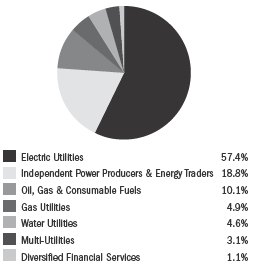
Top Ten Holdings*
| |
| Companhia Energetica de Minas Gerais | 9.1% |
| Ultrapar Participacoes SA | 9.0% |
| CEZ AS | 7.1% |
| Empresa Nacional de Electricidad SA | 6.0% |
| Enersis SA | 5.2% |
| Tenaga Nasional BHD | 4.9% |
| Perusahaan Gas Negara PT | 4.9% |
| Companhia de Saneamento Basico do | |
| Estado de Sao Paulo | 4.6% |
| Federal Hydrogenerating Co. JSC | 4.2% |
| NTPC, Ltd. | 3.8% |
| * | | Expressed as a percentage of total investments in securities as of 3/31/2012. Holdings are subject to change. |
EGShares Utilities GEMS ETF (ticker: UGEM)
The Fund’s investment objective is to seek investment results that correspond (before fees and expenses) to the price and yield performance of the Dow Jones Emerging Markets Utilities Titans 30 IndexSM (“Utilities Underlying Index”). The Utilities Underlying Index is comprised of publicly traded firms in the “Utilities Industry,” as defined by the Industry Classification Benchmark (“ICB”). Under normal circumstances, the Fund will invest at least 80% of its net assets in securities of Emerging Markets Utilities companies that are included in the Fund’s Utilities Underlying Index and generally expects to be substantially invested at such times, with at least 95% of its net assets invested in those securities. The Fund seeks to achieve its investment objective by attempting to replicate the portfolio of the Utilities Underlying Index through investments in equity securities, including common shares traded on local exchanges, American Depositary Receipts (“ADRs”) and Global Depositary Receipts (“GDRs”). ADRs and GDRs represent ownership interests in shares of foreign companies that are held in financial institution custodial accounts, and are traded on exchanges in the United States and around the world. The Utilities Underlying Index includes companies whose businesses generally involve: electricity; and gas, water and multi-utilities. The annual expense ratio of the Fund is 0.85%.
The Emerging Global Shares Utilities GEMS ETF is a direct play on the electricity, gas, water and multi-utility companies within the developing world. In many ways then, this is one play on its local infrastructure. Heavily weighted to Brazil (30%), India (15%) and Chile (15%) as of March 31, 2012, this Fund provides exposure to ten emerging economies. Since the services within the companies of UGEM are provided locally, this is also an effective consumer play. Although in the developed world, the utility sector is considered defensive and statistically a low beta exposure, over the life of UGEM it has demonstrated a price chart very similar to that of the global emerging market benchmark both on the up and downside. Thus, investors may not experience the defensive protection often cited with utilities however, as a consumption play, UGEM may have greater upside compared to other non-emerging market utility funds.
The EGShares Utilities GEMS ETF had a total return of 16.70% at net asset value (“NAV”) for the quarter ended March 31, 2012 and -5.89% return since its inception date of June 23, 2011. Based on this inception date, the Fund did not have enough historical pricing to cover a full year ending March 31, 2012.
Emerging market investments involve risk of capital loss from unfavorable fluctuation in currency values, from differences in generally accepted accounting principles, from economic or political instability in other nations or increased volatility and lower trading volume. This Fund will concentrate its investments in issuers of one or more particular industries to the same extent that its underlying index is so concentrated and to the extent permitted by applicable regulatory guidance. Concentration risk results from investing more than 25% of the Fund’s assets in issuers conducting business in the same industry.
Performance Charts
The following performance chart is provided for comparative purposes and represents the period noted. The Fund’s per share NAV is the value of one share of the Fund and is calculated by dividing the value of total assets less total liabilities by the number of shares outstanding. The NAV return is based on the NAV of the Fund and the market return is based on the market price per share of the Fund. The price used to calculate market price returns is the mid-point of the highest bid and lowest offer for Fund shares as of the close of trading on the exchange where Fund shares are listed. NAV and market returns assume that dividends and capital gain distributions have been reinvested in the Fund at NAV and market price, respectively. As with other ETFs, NAV returns and market price returns may differ because of factors such as the supply and demand for Fund shares and investors’ assessments of the underlying value of a Fund’s portfolio securities. An index is a statistical measure of a specified financial market or sector. An index does not actually hold a portfolio of securities, incur expenses or pay any transaction costs. Therefore index returns do not reflect deductions for fees or expenses and are not available for direct investment. In comparison, the Fund’s performance is negatively impacted by these fees and expenses. Fund returns do not reflect brokerage commissions, or taxes on transactions in Fund shares or that a shareholder would pay on Fund distributions.
| 26 EGA Emerging Global Shares Trust |
EGShares Utilities GEMS ETF
Performance as of 3/31/2012
| | | |
| | Average Annual Total Return1 |
| | Fund
Net Asset Value | Fund
Market Price | Dow Jones
Emerging Markets
Utilities
Titans 30 Index |
| Since Inception2 | (5.89)% | (5.78)% | (6.25)% |
| 1 | | Returns of less than one year are not annualized. |
Performance data quoted represents past performance. Investment return and principal value of an investment will fluctuate so that an investor’s shares, when sold or redeemed, may be worth more or less than the original cost. Current performance data may be higher or lower than actual data quoted. For the most current month-end performance data please visit www.egshares.com or call (888) 800-4347. This Fund is new and has limited operating history. As stated in the current prospectus, the Fund’s total annual operating expense ratio after expense waivers and reimbursements is 0.85%. Market price returns are based on the mid-point of the highest bid and lowest offer for Fund shares as of the scheduled close of regular trading on the New York Stock Exchange (“NYSE”) Arca, ordinarily 4:00 p.m. Eastern time, on each day during which the NYSE is open for trading, and do not represent the returns an investor would receive if shares were traded at other times.
Investors should carefully consider the investment objectives, risks, charges and expenses of the Funds before investing. To obtain a prospectus containing this and other important information, please call 1-888-800-4EGS (4347). Read the prospectus carefully before you invest. There are risks involved with investing including the possible loss of principal. Past performance does not guarantee future results.
Emerging Global Shares are distributed by ALPS Distributors Inc.
Value of a $10,000 Investment Since Inception at Net Asset Value
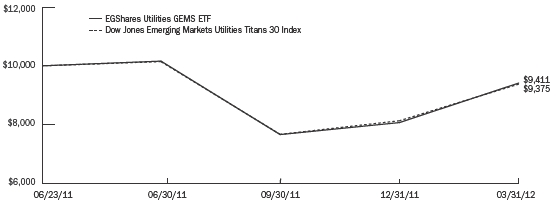
The chart above represents historical performance of a hypothetical investment of $10,000 over the life of the Fund, assuming the reinvestment of distributions. Past performance does not guarantee future results. The hypothetical example does not represent the returns of any particular investment.
| EGA Emerging Global Shares Trust 27 |
Portfolio Summary (Unaudited)
EGShares Emerging Markets Metals & Mining ETF
Industry Breakdown*

Top Ten Holdings*
| |
| Vale SA | 10.5% |
| MMC Norilsk Nickel OJSC | 7.4% |
| China Shenhua Energy Co., Ltd. | 6.2% |
| AngloGold Ashanti, Ltd. | 5.9% |
| Grupo Mexico SAB de CV | 5.2% |
| Impala Platinum Holdings, Ltd. | 5.1% |
| Gold Fields, Ltd. | 4.7% |
| Gerdau SA | 4.5% |
| Companhia Siderurgica Nacional SA | 3.8% |
| Tata Steel, Ltd. | 3.7% |
| * | | Expressed as a percentage of total investments in securities as of 3/31/2012. Holdings are subject to change. |
EGShares Emerging Markets Metals & Mining ETF (ticker: EMT)
The Fund’s investment objective is to seek investment results that correspond (before fees and expenses) to the price and yield performance of the Dow Jones Emerging Markets Metals & Mining Titans 30 IndexSM (“Metals & Mining Underlying Index”). The Metals & Mining Underlying Index is comprised of 30 publicly traded firms in the “Industrial Metals and Mining Sector” and “Mining Sector,” as defined by the Industry Classification Benchmark (“ICB”). The Metals & Mining sector is a sub-sector of the Basic Materials industry, as defined by ICB. Accordingly, some securities in which the Fund invests may also be held by the EGShares Basic Materials GEMS ETF. Under normal circumstances, the Fund will invest at least 80% of its net assets in Metals & Mining companies included in the Index and generally expects to be substantially invested at such times, with at least 95% of its net assets invested in these securities. The Fund defines Metals & Mining companies as companies that are included in the Metals & Mining Underlying Index at the time of purchase and generally includes companies involved in the extraction and basic processing of basic resources (other than oil and gas), such as coal, metal ore (including the production of basic aluminum, iron and steel products), precious metals and gemstones. The Fund will provide shareholders with at least 60 days’ notice prior to any change in this policy. The annual expense ratio of the Fund is 0.85%.
The EGShares Emerging Markets Metals & Mining GEMS ETF, as of March 31, 2012 had the worst 12 month return of any of our ETFs. In our previous annual report, this Fund was our top performing fund in terms of total return since inception. Along with our energy sector ETF, the metals/mining ETF has the longest track record among our product lineup. Any concerns of inflation in emerging markets were negated by reduced global demand assumptions given the ongoing Eurozone crisis highlighting the poor global economic recovery overall. As a result, commodity prices and producer companies performed poorly over the period. Longer term, lower input prices will likely be a net positive for resource hungry economies such as China with their higher levels of demand. Top three country exposures were to South Africa, Brazil and China. Interesting that China is now the largest gold producer in the world and as of 2012 will likely surpass India as the world’s largest gold consumer.
The EGShares Emerging Markets Metals & Mining GEMS ETF had a total return of 10.14% at net asset value (“NAV”) for the quarter ended March 31, 2012 and 7.28% annualized return since its inception date of May 21, 2009. The Fund NAV had a -27.66% return for the full year ending March 31, 2012.
Emerging market investments involve risk of capital loss from unfavorable fluctuation in currency values, from differences in generally accepted accounting principles, from economic or political instability in other nations or increased volatility and lower trading volume. This Fund will concentrate its investments in issuers of one or more particular industries to the same extent that its underlying index is so concentrated and to the extent permitted by applicable regulatory guidance. Concentration risk results from investing more than 25% of the Fund’s assets in issuers conducting business in the same industry.
Performance Charts
The following performance chart is provided for comparative purposes and represents the periods noted. The Fund’s per share NAV is the value of one share of the Fund and is calculated by dividing the value of total assets less total liabilities by the number of shares outstanding. The NAV return is based on the NAV of the Fund and the market return is based on the market price per share of the Fund. The price used to calculate market price returns is the mid-point of the highest bid and lowest offer for Fund shares as of the close of trading on the exchange where Fund shares are listed. NAV and market returns assume that dividends and capital gain distributions have been reinvested in the Fund at NAV and market price, respectively. As with other ETFs, NAV returns and market price returns may differ because of factors such as the supply and demand for Fund shares and investors’ assessments of the underlying value of a Fund’s portfolio securities. An index is a statistical measure of a specified financial market or sector. An index does not actually hold a portfolio of securities, incur expenses or pay any transaction costs. Therefore index returns do not reflect deductions for fees or expenses and are not available for direct investment. In comparison, the Fund’s performance is negatively impacted by these fees and expenses. Fund returns do not reflect brokerage commissions, or taxes on transactions in Fund shares or that a shareholder would pay on Fund distributions.
| 28 EGA Emerging Global Shares Trust |
EGShares Emerging Markets Metals & Mining ETF
Performance as of 3/31/2012
| | | |
| | Average Annual Total Return |
| | Fund
Net Asset Value | Fund
Market Price | Dow Jones
Emerging Markets
Metals & Mining
Titans 30 Index |
| 1 Year | (27.66)% | (27.51)% | (29.68)% |
| Since Inception1 | 7.28% | 7.45% | 5.90% |
Performance data quoted represents past performance. Investment return and principal value of an investment will fluctuate so that an investor’s shares, when sold or redeemed, may be worth more or less than the original cost. Current performance data may be higher or lower than actual data quoted. For the most current month-end performance data please visit www.egshares.com or call (888) 800-4347. As stated in the current prospectus, the Fund’s total annual operating expense ratio after expense waivers and reimbursements is 0.85%. Market price returns are based on the mid-point of the highest bid and lowest offer for Fund shares as of the scheduled close of regular trading on the New York Stock Exchange (“NYSE”) Arca, ordinarily 4:00 p.m. Eastern time, on each day during which the NYSE is open for trading, and do not represent the returns an investor would receive if shares were traded at other times.
Investors should carefully consider the investment objectives, risks, charges and expenses of the Funds before investing. To obtain a prospectus containing this and other important information, please call 1-888-800-4EGS (4347). Read the prospectus carefully before you invest. There are risks involved with investing including the possible loss of principal. Past performance does not guarantee future results.
Emerging Global Shares are distributed by ALPS Distributors Inc.
Value of a $10,000 Investment Since Inception at Net Asset Value

The chart above represents historical performance of a hypothetical investment of $10,000 over the life of the Fund, assuming the reinvestment of distributions. Past performance does not guarantee future results. The hypothetical example does not represent the returns of any particular investment.
| EGA Emerging Global Shares Trust 29 |
Portfolio Summary (Unaudited)
EGShares Emerging Markets Consumer ETF
Industry Breakdown*

Top Ten Holdings*
| |
| Companhia de Bebidas das Americas | 10.0% |
| Naspers, Ltd. | 7.6% |
| Wal-Mart de Mexico SAB de CV | 6.8% |
| Fomento Economico Mexicano SAB de CV | 5.8% |
| Astra International Tbk PT | 5.7% |
| ITC, Ltd. | 5.5% |
| BRF - Brasil Foods SA | 4.9% |
| Grupo Televisa SAB | 4.4% |
| S.A.C.I. Falabella | 4.1% |
| Cencosud SA | 4.0% |
| * | | Expressed as a percentage of total investments in securities as of 3/31/2012. Holdings are subject to change. |
EGShares Emerging Markets Consumer ETF (ticker: ECON)
The Fund’s investment objective is to seek investment results that correspond (before fees and expenses) to the price and yield performance of the Dow Jones Emerging Markets Consumer Titans 30 IndexSM (“Consumer Underlying Index”). The Consumer Underlying Index is comprised of 30 publicly traded firms in the “Consumer Goods Industry,” and “Consumer Services Industry,” as defined by the Industry Classification Benchmark (“ICB”). Under normal circumstances, the Fund will invest at least 80% of its net assets in Consumer companies included in the Index and generally expects to be substantially invested at such times, with at least 95% of its net assets invested in these securities. The Fund defines Consumer companies as companies that are included in the Consumer Underlying Index and the Dow Jones Emerging Markets Consumer Services Titans Index at the time of purchase and generally includes companies whose businesses involve: general retailers, beverage providers, food producers, media, auto & parts, travel & leisure and personal goods. The Fund will provide shareholders with at least 60 days’ notice prior to any change in this policy. The annual expense ratio of the Fund is 0.85%.
The EGShares Emerging Markets Consumer ETF is our biggest fund by assets. In terms of broad appeal, the concept of billions of new consumers who are relatively new to capitalism within their borders is easy to understand. While some investors may focus on multi-nationals who strive to increase their exposure to consumers in new growth markets, we believe that sophisticated investors will want to think locally. Local providers likely provide greater brand recognition and lower costs; both of which go a long way in younger markets. We focus more on what a relatively poorer demographic requires as they move forward in raising their standard of living. Ultimately, as the western world delevers, they are not incentivized to spend but rather save. In the emerging world, where its citizens have traditionally been required to save given limited social safety nets, they have the ability to lever and spend given their increased employment and wages in addition to higher savings rates. US, European and Japanese consumers are in a far more indebted situation limiting the ability of consumer stocks in those regions to be competitive on growth. Beverages, general retailers and food producers were the three largest underlying industry exposures as of March 31, 2012.
The EGShares Emerging Markets Consumer ETF had a total return of 12.95% at net asset value (“NAV”) for the quarter ended March 31, 2012 and 15.31% annualized return since its inception date of September 14, 2010. The Fund had a 9.44% return for the full year ending March 31, 2012.
Emerging market investments involve risk of capital loss from unfavorable fluctuation in currency values, from differences in generally accepted accounting principles, from economic or political instability in other nations or increased volatility and lower trading volume. This Fund will concentrate its investments in issuers of one or more particular industries to the same extent that its underlying index is so concentrated and to the extent permitted by applicable regulatory guidance. Concentration risk results from investing more than 25% of the Fund’s assets in issuers conducting business in the same industry.
Performance Charts
The following performance chart is provided for comparative purposes and represents the periods noted. The Fund’s per share NAV is the value of one share of the Fund and is calculated by dividing the value of total assets less total liabilities by the number of shares outstanding. The NAV return is based on the NAV of the Fund and the market return is based on the market price per share of the Fund. The price used to calculate market price returns is the mid-point of the highest bid and lowest offer for Fund shares as of the close of trading on the exchange where Fund shares are listed. NAV and market returns assume that dividends and capital gain distributions have been reinvested in the Fund at NAV and market price, respectively. As with other ETFs, NAV returns and market price returns may differ because of factors such as the supply and demand for Fund shares and investors’ assessments of the underlying value of a Fund’s portfolio securities. An index is a statistical measure of a specified financial market or sector. An index does not actually hold a portfolio of securities, incur expenses or pay any transaction costs. Therefore index returns do not reflect deductions for fees or expenses and are not available for direct investment. In comparison, the Fund’s performance is negatively impacted by these fees and expenses. Fund returns do not reflect brokerage commissions, or taxes on transactions in Fund shares or that a shareholder would pay on Fund distributions.
| 30 EGA Emerging Global Shares Trust |
EGShares Emerging Markets Consumer ETF
Performance as of 3/31/2012
| | | |
| | Average Annual Total Return |
| | Fund
Net Asset Value | Fund
Market Price | Dow Jones
Emerging Markets
Consumer
Titans 30 Index |
| 1 Year | 9.44% | 9.55% | 8.54% |
| Since Inception1 | 15.31% | 15.52% | 15.25% |
Performance data quoted represents past performance. Investment return and principal value of an investment will fluctuate so that an investor’s shares, when sold or redeemed, may be worth more or less than the original cost. Current performance data may be higher or lower than actual data quoted. For the most current month-end performance data please visit www.egshares.com or call (888) 800-4347. As stated in the current prospectus, the Fund’s total annual operating expense ratio after expense waivers and reimbursements is 0.85%. Market price returns are based on the mid-point of the highest bid and lowest offer for Fund shares as of the scheduled close of regular trading on the New York Stock Exchange (“NYSE”) Arca, ordinarily 4:00 p.m. Eastern time, on each day during which the NYSE is open for trading, and do not represent the returns an investor would receive if shares were traded at other times.
Investors should carefully consider the investment objectives, risks, charges and expenses of the Funds before investing. To obtain a prospectus containing this and other important information, please call 1-888-800-4EGS (4347). Read the prospectus carefully before you invest. There are risks involved with investing including the possible loss of principal. Past performance does not guarantee future results.
Emerging Global Shares are distributed by ALPS Distributors Inc.
Value of a $10,000 Investment Since Inception at Net Asset Value
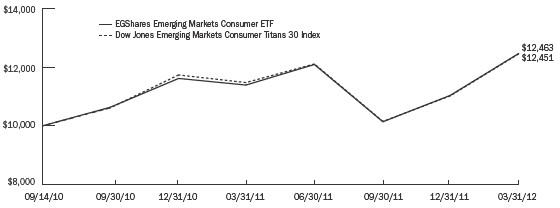
The chart above represents historical performance of a hypothetical investment of $10,000 over the life of the Fund, assuming the reinvestment of distributions. Past performance does not guarantee future results. The hypothetical example does not represent the returns of any particular investment.
| EGA Emerging Global Shares Trust 31 |
Portfolio Summary (Unaudited)
EGShares India Infrastructure ETF
Industry Breakdown*

Top Ten Holdings*
| |
| Tata Motors, Ltd. | 7.9% |
| Idea Cellular, Ltd. | 5.5% |
| Power Grid Corp. of India, Ltd. | 5.4% |
| Ultra Tech Cement, Ltd. | 5.1% |
| Tata Steel, Ltd. | 5.0% |
| ACC, Ltd. | 4.8% |
| Tata Power Co., Ltd. | 4.8% |
| NTPC, Ltd. | 4.4% |
| Ambuja Cements, Ltd. | 4.4% |
| GAIL India, Ltd. | 4.3% |
| * | | Expressed as a percentage of total investments in securities as of 3/31/2012. Holdings are subject to change. |
EGShares India Infrastructure ETF (ticker: INXX)
The Fund’s investment objective is to seek investment results that correspond (before fees and expenses) to the price and yield performance of the INDXX India Infrastructure Index (“Underlying Index”). The Underlying Index is comprised of 30 leading companies that INDXX, LLC determines to be representative of India’s infrastructure sectors. The Fund seeks to achieve its investment objective by attempting to replicate the portfolio of the Underlying Index through investments in equity securities, including shares traded on local exchanges, American Depositary Receipts (“ADRs”) and Global Depositary Receipts (“GDRs”). The Underlying Index is a free-float capitalization weighted stock market index comprised of 30 leading companies that INDXX, LLC determines to be representative of India’s Infrastructure sectors. The Fund invests in Indian large and mid cap infrastructure companies that are included in the Underlying Index, which are generally defined as companies that are domiciled in India and that have a market capitalization of at least $200 million at the time of purchase. Under normal circumstances, the Fund will invest at least 80% of its net assets in Indian Infrastructure companies included in the Underlying Index and generally expects to be substantially invested at such times, with at least 95% of its net assets invested in these securities. The Fund defines Indian Infrastructure companies as companies that are included in the Underlying Index at the time of purchase. The Fund will provide shareholders with at least 60 days’ notice prior to any change in this policy. The annual expense ratio of the Fund is 0.85%.
The EGShares India Infrastructure ETF remains a highly compelling story related to infrastructure. India may be considered an early stage emerging market with further development required to match what is found in the other BRIC economies. The need for basic infrastructure (water utilities, large scale hospitals, subway systems, ports) is critical for India to compete globally with other high growth markets. Concerns of inflation limiting domestic growth linger in India as does a weak currency however the need for infrastructure is self-evident. Indian markets overall have been relative underperformers versus other emerging markets over the past 12-month period and long-term oriented investors as the local policymakers focus on growth stimulus and inflation. Still, the theme of infrastructure is a compelling one over the short and long term. The three largest industry weights as of March 31, 2012 were electricity, construction & materials and mobile telecommunications.
The EGShares India Infrastructure ETF had a total return of 27.90% at net asset value (“NAV”) for the quarter ended March 31, 2012 and -15.78% annualized return since its inception date of August 11, 2010. The Fund had a -22.19% return for the full year ending March 31, 2012.
Emerging market investments involve risk of capital loss from unfavorable fluctuation in currency values, from differences in generally accepted accounting principles, from economic or political instability in other nations or increased volatility and lower trading volume. This Fund will concentrate its investments in issuers of one or more particular industries to the same extent that its underlying index is so concentrated and to the extent permitted by applicable regulatory guidance. Concentration risk results from investing more than 25% of the Fund’s assets in issuers conducting business in the same industry. Because the Fund only invests in Indian securities, its NAV will be much more sensitive to changes in economic, political and other factors within India than would a fund that invested in a greater variety of countries. Special risks include, among others, political and legal uncertainty, persistent religious, ethnic and border disputes, greater government control over the economy, currency fluctuations or blockage and the risk of nationalization or expropriation of assets.
Performance Charts
The following performance chart is provided for comparative purposes and represents the periods noted. The Fund’s per share NAV is the value of one share of the Fund and is calculated by dividing the value of total assets less total liabilities by the number of shares outstanding. The NAV return is based on the NAV of the Fund and the market return is based on the market price per share of the Fund. The price used to calculate market price returns is the mid-point of the highest bid and lowest offer for Fund shares as of the close of trading on the exchange where Fund shares are listed. NAV and market
| 32 EGA Emerging Global Shares Trust |
EGShares India Infrastructure ETF
returns assume that dividends and capital gain distributions have been reinvested in the Fund at NAV and market price, respectively. As with other ETFs, NAV returns and market price returns may differ because of factors such as the supply and demand for Fund shares and investors’ assessments of the underlying value of a Fund’s portfolio securities. An index is a statistical measure of a specified financial market or sector. An index does not actually hold a portfolio of securities, incur expenses or pay any transaction costs. Therefore index returns do not reflect deductions for fees or expenses and are not available for direct investment. In comparison, the Fund’s performance is negatively impacted by these fees and expenses. Fund returns do not reflect brokerage commissions, or taxes on transactions in Fund shares or that a shareholder would pay on Fund distributions.
Performance as of 3/31/2012
| | | |
| | Average Annual Total Return |
| | Fund
Net Asset Value | Fund
Market Price | INDXX India
Infrastructure
Index |
| 1 Year | (22.19)% | (23.02)% | (22.22)% |
| Since Inception1 | (15.78)% | (16.09)% | (15.31)% |
Performance data quoted represents past performance. Investment return and principal value of an investment will fluctuate so that an investor’s shares, when sold or redeemed, may be worth more or less than the original cost. Current performance data may be higher or lower than actual data quoted. For the most current month-end performance data please visit www.egshares.com or call (888) 800-4347. As stated in the current prospectus, the Fund’s total annual operating expense ratio after expense waivers and reimbursements is 0.85%. Market price returns are based on the mid-point of the highest bid and lowest offer for Fund shares as of the scheduled close of regular trading on the New York Stock Exchange (“NYSE”) Arca, ordinarily 4:00 p.m. Eastern time, on each day during which the NYSE is open for trading, and do not represent the returns an investor would receive if shares were traded at other times.
Investors should carefully consider the investment objectives, risks, charges and expenses of the Funds before investing. To obtain a prospectus containing this and other important information, please call 1-888-800-4EGS (4347). Read the prospectus carefully before you invest. There are risks involved with investing including the possible loss of principal. Past performance does not guarantee future results.
Emerging Global Shares are distributed by ALPS Distributors Inc.
Value of a $10,000 Investment Since Inception at Net Asset Value
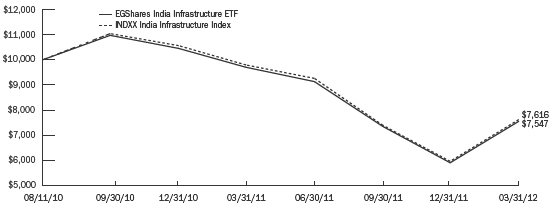
The chart above represents historical performance of a hypothetical investment of $10,000 over the life of the Fund, assuming the reinvestment of distributions. Past performance does not guarantee future results. The hypothetical example does not represent the returns of any particular investment.
| EGA Emerging Global Shares Trust 33 |
Portfolio Summary (Unaudited)
EGShares China Infrastructure ETF
Industry Breakdown*

Top Ten Holdings*
| |
| China Communications Construction Co., Ltd. | 7.1% |
| China National Building Material Co., Ltd. | 4.9% |
| Evergrande Real Estate Group, Ltd. | 4.9% |
| Jiangxi Copper Co., Ltd. | 4.6% |
| China Oilfield Services, Ltd. | 4.6% |
| Changsha Zoomlion Heavy Industry Science | |
| And Technology Development Co., Ltd. | 4.4% |
| Anhui Conch Cement Co., Ltd. | 4.4% |
| China Telecom Corp., Ltd. | 4.3% |
| China Unicom Hong Kong, Ltd. | 3.9% |
| Aluminum Corp. of China, Ltd. | 3.7% |
| * | | Expressed as a percentage of total investments in securities as of 3/31/2012. Holdings are subject to change. |
EGShares China Infrastructure ETF (ticker: CHXX)
The Fund’s investment objective is to seek investment results that correspond (before fees and expenses) to the price and yield performance of the INDXX China Infrastructure Index (“Underlying Index”). The Underlying Index is comprised of 30 leading companies that INDXX, LLC determines to be representative of China’s infrastructure sectors. The Fund seeks to achieve its investment objective by attempting to replicate the portfolio of the Underlying Index through investments in equity securities, including shares traded on local exchanges, American Depositary Receipts (“ADRs”) and Global Depositary Receipts (“GDRs”). The Underlying Index is a free-float market capitalization weighted stock market index comprised of 30 leading companies that INDXX, LLC determines to be representative of China’s Infrastructure sectors. The Fund invests in Chinese large and mid cap infrastructure companies that are included in the Underlying Index, which are generally defined as companies that are domiciled in China and that have a market capitalization of at least $200 million at the time of purchase. Under normal circumstances, the Fund will invest at least 80% of its net assets in Chinese Infrastructure companies included in the Underlying Index and generally expects to be substantially invested at such times, with at least 95% of its net assets invested in these securities. The Fund defines Chinese Infrastructure companies as companies that are included in the Underlying Index at the time of purchase. The Fund will provide shareholders with at least 60 days’ notice prior to any change in this policy. The annual expense ratio of the Fund is 0.85%.
The EGShares China Infrastructure ETF is a multi-sector thematic fund which aims to provide investors with the means to participate in one of the greatest shifts within China in our lifetime. Its largest underlying industry exposure at roughly a quarter of fund assets is construction & materials. According to Stephen Roach of Morgan Stanley, China’s 12th Five-Year Plan (2011-2015) will shift the focus from export and investment driven growth to one dependent more on its 1.3 billion consumers within. This type of transition is not new and is the basis for any economy to truly “emerge” and become a developed nation. Given the roughly 750 million Chinese who are relatively poor and living in the Chinese interior, for them to transition into a modern economy, they will require the needed infrastructure so as to efficiently travel, work, consume … and live. Aside from August and September of 2011 when it underperformed, CHXX has performed quite similarly to other broader market Chinese focused ETFs.
The EGShares China Infrastructure ETF had a total return of 7.33% at net asset value (“NAV”) for the quarter ended March 31, 2012 and -7.77% annualized return since its inception date of February 17, 2010. The Fund NAV had a -24.35% return for the full year ending March 31, 2012.
Emerging market investments involve risk of capital loss from unfavorable fluctuation in currency values, from differences in generally accepted accounting principles, from economic or political instability in other nations or increased volatility and lower trading volume. This Fund will concentrate its investments in issuers of one or more particular industries to the same extent that its underlying index is so concentrated and to the extent permitted by applicable regulatory guidance. Concentration risk results from investing more than 25% of the Fund’s assets in issuers conducting business in the same industry. Because the Fund only invests in Chinese securities, its NAV will be much more sensitive to changes in economic, political and other factors within China than would a fund that invested in a greater variety of countries. Special risks include, among others, political and legal uncertainty, persistent religious, ethnic and border disputes, greater government control over the economy, currency fluctuations or blockage and the risk of nationalization or expropriation of assets.
Performance Charts
The following performance chart is provided for comparative purposes and represents the periods noted. The Fund’s per share NAV is the value of one share of the Fund and is calculated by dividing the value of total assets less total liabilities by the number of shares outstanding. The NAV return is based on the NAV of the Fund and the market return is based on the market price per share of the Fund. The price used to calculate market price returns is the mid-point of the highest bid and lowest offer for Fund shares
| 34 EGA Emerging Global Shares Trust |
EGShares China Infrastructure ETF
as of the close of trading on the exchange where Fund shares are listed. NAV and market returns assume that dividends and capital gain distributions have been reinvested in the Fund at NAV and market price, respectively. As with other ETFs, NAV returns and market price returns may differ because of factors such as the supply and demand for Fund shares and investors’ assessments of the underlying value of a Fund’s portfolio securities. An index is a statistical measure of a specified financial market or sector. An index does not actually hold a portfolio of securities, incur expenses or pay any transaction costs. Therefore index returns do not reflect deductions for fees or expenses and are not available for direct investment. In comparison, the Fund’s performance is negatively impacted by these fees and expenses. Fund returns do not reflect brokerage commissions, or taxes on transactions in Fund shares or that a shareholder would pay on Fund distributions.
Performance as of 3/31/2012
| | | |
| | Average Annual Total Return |
| | Fund
Net Asset Value | Fund
Market Price | INDXX China
Infrastructure
Index |
| 1 Year | (24.35)% | (24.96)% | (24.01)% |
| Since Inception1 | (7.77)% | (7.79)% | (7.36)% |
Performance data quoted represents past performance. Investment return and principal value of an investment will fluctuate so that an investor’s shares, when sold or redeemed, may be worth more or less than the original cost. Current performance data may be higher or lower than actual data quoted. For the most current month-end performance data please visit www.egshares.com or call (888) 800-4347. As stated in the current prospectus, the Fund’s total annual operating expense ratio after expense waivers and reimbursements is 0.85%. Market price returns are based on the mid-point of the highest bid and lowest offer for Fund shares as of the scheduled close of regular trading on the New York Stock Exchange (“NYSE”) Arca, ordinarily 4:00 p.m. Eastern time, on each day during which the NYSE is open for trading, and do not represent the returns an investor would receive if shares were traded at other times.
Investors should carefully consider the investment objectives, risks, charges and expenses of the Funds before investing. To obtain a prospectus containing this and other important information, please call 1-888-800-4EGS (4347). Read the prospectus carefully before you invest. There are risks involved with investing including the possible loss of principal. Past performance does not guarantee future results.
Emerging Global Shares are distributed by ALPS Distributors Inc.
Value of a $10,000 Investment Since Inception at Net Asset Value
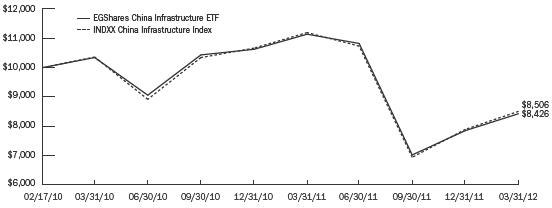
The chart above represents historical performance of a hypothetical investment of $10,000 over the life of the Fund, assuming the reinvestment of distributions. Past performance does not guarantee future results. The hypothetical example does not represent the returns of any particular investment.
| EGA Emerging Global Shares Trust 35 |
Portfolio Summary (Unaudited)
EGShares Brazil Infrastructure ETF
Industry Breakdown*

Top Ten Holdings*
| |
| Ultrapar Participacoes SA | 5.8% |
| Companhia de Saneamento Basico do | |
| Estado de Sao Paulo | 5.5% |
| CPFL Energia SA | 5.4% |
| Embraer SA | 5.4% |
| CCR SA | 5.2% |
| Companhia Energetica de Sao Paulo | 5.2% |
| BR Malls Participacoes SA | 5.0% |
| Gerdau SA | 4.6% |
| Tractebel Energia SA | 4.5% |
| Telefonica Brasil SA | 4.4% |
| * | | Expressed as a percentage of total investments in securities as of 3/31/2012. Holdings are subject to change. |
EGShares Brazil Infrastructure ETF (ticker: BRXX)
The Fund’s investment objective is to seek investment results that correspond (before fees and expenses) to the price and yield performance of the INDXX Brazil Infrastructure Index (“Underlying Index”). The Underlying Index is comprised of 30 leading companies that INDXX, LLC determines to be representative of Brazil’s infrastructure sectors. The Fund seeks to achieve its investment objective by attempting to replicate the portfolio of the Underlying Index through investments in equity securities, including shares traded on local exchanges, American Depositary Receipts (“ADRs”) and Global Depositary Receipts (“GDRs”). The Underlying Index is a free-float capitalization weighted stock market index comprised of 30 leading companies that INDXX, LLC determines to be representative of Brazil’s Infrastructure sectors. The Fund invests in Brazilian large and mid cap infrastructure companies that are included in the Underlying Index, which are generally defined as companies that are domiciled in Brazil and that have a market capitalization of at least $200 million at the time of purchase. Under normal circumstances, the Fund will invest at least 80% of its net assets in Brazilian Infrastructure companies included in the Underlying Index and generally expects to be substantially invested at such times, with at least 95% of its net assets invested in these securities. The Fund defines Brazilian Infrastructure companies as companies that are included in the Underlying Index at the time of purchase. The Fund will provide shareholders with at least 60 days’ notice prior to any change in this policy. The annual expense ratio of the Fund is 0.85%.
The EGShares Brazil Infrastructure ETF is our second largest fund by assets and one of our top performers by return. BRXX outperformed both the broad market large cap and small cap Brazil focused ETFs over the 12 month period ending March 31, 2011. Many investors see Brazil as a commodities play or a proxy for China. Others see the internal growth within Brazil as one of the rare success stories in Latin America. Investor excitement continues to grow as the projects related to the upcoming 2014 World Cup and 2016 Summer Olympics both hosted in Brazil get underway. However, as with past event hosts then considered emerging markets but now considered developed, these events only symbolize a beginning. They act as a catalyst to further infrastructure projects to help the general public become a greater consumption based society leading to greater economic prosperity and higher standards of living.
The EGShares Brazil Infrastructure ETF had a total return of 17.87% at net asset value (“NAV”) for the quarter ended March 31, 2012 and 12.71% annualized return since its inception date of February 24, 2010. The Fund NAV had a -0.04% return for the full year ending March 31, 2012.
Emerging market investments involve risk of capital loss from unfavorable fluctuation in currency values, from differences in generally accepted accounting principles, from economic or political instability in other nations or increased volatility and lower trading volume. This Fund will concentrate its investments in issuers of one or more particular industries to the same extent that its underlying index is so concentrated and to the extent permitted by applicable regulatory guidance. Concentration risk results from investing more than 25% of the Fund’s assets in issuers conducting business in the same industry. Because the Fund only invests in Brazilian securities, its NAV will be much more sensitive to changes in economic, political and other factors within Brazil than would a fund that invested in a greater variety of countries. Special risks include, among others, political and legal uncertainty, persistent religious, ethnic and border disputes, greater government control over the economy, currency fluctuations or blockage and the risk of nationalization or expropriation of assets.
Performance Charts
The following performance chart is provided for comparative purposes and represents the periods noted. The Fund’s per share NAV is the value of one share of the Fund and is calculated by dividing the value of total assets less total liabilities by the number of shares outstanding. The NAV return is based on the NAV of the Fund and the market return is based on the market price per share of the Fund. The price used to calculate market price returns is the mid-point of the highest bid and lowest offer for Fund shares
| 36 EGA Emerging Global Shares Trust |
EGShares Brazil Infrastructure ETF
as of the close of trading on the exchange where Fund shares are listed. NAV and market returns assume that dividends and capital gain distributions have been reinvested in the Fund at NAV and market price, respectively. As with other ETFs, NAV returns and market price returns may differ because of factors such as the supply and demand for Fund shares and investors’ assessments of the underlying value of a Fund’s portfolio securities. An index is a statistical measure of a specified financial market or sector. An index does not actually hold a portfolio of securities, incur expenses or pay any transaction costs. Therefore index returns do not reflect deductions for fees or expenses and are not available for direct investment. In comparison, the Fund’s performance is negatively impacted by these fees and expenses. Fund returns do not reflect brokerage commissions, or taxes on transactions in Fund shares or that a shareholder would pay on Fund distributions.
Performance as of 3/31/2012
| | | |
| | Average Annual Total Return |
| | Fund
Net Asset Value | Fund
Market Price | INDXX Brazil
Infrastructure
Index |
| 1 Year | (0.04)% | (1.98)% | 4.36% |
| Since Inception1 | 12.71% | 12.49% | 10.80% |
Performance data quoted represents past performance. Investment return and principal value of an investment will fluctuate so that an investor’s shares, when sold or redeemed, may be worth more or less than the original cost. Current performance data may be higher or lower than actual data quoted. For the most current month-end performance data please visit www.egshares.com or call (888) 800-4347. As stated in the current prospectus, the Fund’s total annual operating expense ratio after expense waivers and reimbursements is 0.85%. Market price returns are based on the mid-point of the highest bid and lowest offer for Fund shares as of the scheduled close of regular trading on the New York Stock Exchange (“NYSE”) Arca, ordinarily 4:00 p.m. Eastern time, on each day during which the NYSE is open for trading, and do not represent the returns an investor would receive if shares were traded at other times.
Investors should carefully consider the investment objectives, risks, charges and expenses of the Funds before investing. To obtain a prospectus containing this and other important information, please call 1-888-800-4EGS (4347). Read the prospectus carefully before you invest. There are risks involved with investing including the possible loss of principal. Past performance does not guarantee future results.
Emerging Global Shares are distributed by ALPS Distributors Inc.
Value of a $10,000 Investment Since Inception at Net Asset Value

The chart above represents historical performance of a hypothetical investment of $10,000 over the life of the Fund, assuming the reinvestment of distributions. Past performance does not guarantee future results. The hypothetical example does not represent the returns of any particular investment.
| EGA Emerging Global Shares Trust 37 |
Portfolio Summary (Unaudited)
EGShares India Small Cap ETF
Industry Breakdown*

Top Ten Holdings*
| |
| Federal Bank, Ltd. | 4.5% |
| Apollo Hospitals Enterprise, Ltd. | 3.8% |
| Crompton Greaves, Ltd. | 3.3% |
| Tata Global Beverages, Ltd. | 2.9% |
| Bharat Forge, Ltd. | 2.8% |
| United Phosphorus, Ltd. | 2.7% |
| Glenmark Pharmaceuticals, Ltd. | 2.7% |
| Unitech, Ltd. | 2.5% |
| Indiabulls Financial Services, Ltd. | 2.4% |
| Allahabad Bank | 2.4% |
| * | | Expressed as a percentage of total investments in securities as of 3/31/2012. Holdings are subject to change. |
EGShares India Small Cap ETF (ticker: SCIN)
The Fund’s investment objective is to seek investment results that correspond (before fees and expenses) to the price and yield performance of the INDXX India Small Cap Index (“Underlying Index”). The Underlying Index is a free-float market capitalization weighted stock market index comprised of a representative sample of 75 Indian companies that INDXX LLC determines to be the representative of small market cap companies in India. The Fund seeks to achieve its investment objective by attempting to replicate the portfolio of the Underlying Index through investments in equity securities, including shares traded on local exchanges, American Depositary Receipts (“ADRs”) and Global Depositary Receipts (“GDRs”). The Underlying Index is a free-float capitalization weighted stock market index comprised of 75 companies that INDXX, LLC determines to be representative of India’s small capitalization equity market. The Fund invests in Indian Small Cap companies that are included in the Underlying Index, which are generally defined as companies that are domiciled in India and are at the bottom end of the group that have a market capitalization of at least $100 million but below $2 billion at the time of purchase. Under normal circumstances, the Fund will invest at least 80% of its net assets in Indian Small Cap companies included in the Underlying Index and generally expects to be substantially invested at such times, with at least 95% of its net assets invested in these securities. The Fund defines Indian Small Cap companies as companies that are included in the Underlying Index at the time of purchase. The Fund will provide shareholders with at least 60 days’ notice prior to any change in this policy. The annual expense ratio of the Fund is 0.85%.
The EGShares India Small Cap ETF is our play on the booming domestic sector in India. As many large cap companies earn significant proportions of their top line revenues from global operations, small cap companies (regardless of where they are domiciled) normally focus more on the domestic economy. The Indian markets had a difficult 12-month period leading to March 31, 2012. Regardless of large or small cap, broad or sector, India was not favored by investors. Concerns of policymaking decisions leading to both inflation worries and a weakening currency by households and certain corporate sectors has led to a low growth environment. Weak sentiment given potential for a period of stagflation is a worry however for investors looking at India as a long-term play supported by over a billion potential new consumers, they may be seeing a buying opportunity. The three largest sector exposures as of March 31, 2012 were financials, industrials and consumer goods totaling roughly 62% of fund assets.
The EGShares India Small Cap ETF had a total return of 30.94% at net asset value (“NAV”) for the quarter ended March 31, 2012 and -16.56% annualized return since its inception date of July 7, 2010. The Fund had a -24.33% return for the full year ending March 31, 2012.
Emerging market investments involve risk of capital loss from unfavorable fluctuation in currency values, from differences in generally accepted accounting principles, from economic or political instability in other nations or increased volatility and lower trading volume. This Fund will concentrate its investments in issuers of one or more particular industries to the same extent that its underlying index is so concentrated and to the extent permitted by applicable regulatory guidance. Concentration risk results from investing more than 25% of the Fund’s assets in issuers conducting business in the same industry. Because the Fund only invests in Indian securities, its NAV will be much more sensitive to changes in economic, political and other factors within India than would a fund that invested in a greater variety of countries. Special risks include, among others, political and legal uncertainty, persistent religious, ethnic and border disputes, greater government control over the economy, currency fluctuations or blockage and the risk of nationalization or expropriation of assets.
Performance Charts
The following performance chart is provided for comparative purposes and represents the periods noted. The Fund’s per share NAV is the value of one share of the Fund and is calculated by dividing the value of total assets less total liabilities by the number of shares outstanding. The NAV return is based on the NAV of the Fund and the market return is based on the market price per share of the Fund. The price used to calculate
| 38 EGA Emerging Global Shares Trust |
EGShares India Small Cap ETF
market price returns is the mid-point of the highest bid and lowest offer for Fund shares as of the close of trading on the exchange where Fund shares are listed. NAV and market returns assume that dividends and capital gain distributions have been reinvested in the Fund at NAV and market price, respectively. As with other ETFs, NAV returns and market price returns may differ because of factors such as the supply and demand for Fund shares and investors’ assessments of the underlying value of a Fund’s portfolio securities. An index is a statistical measure of a specified financial market or sector. An index does not actually hold a portfolio of securities, incur expenses or pay any transaction costs. Therefore index returns do not reflect deductions for fees or expenses and are not available for direct investment. In comparison, the Fund’s performance is negatively impacted by these fees and expenses. Fund returns do not reflect brokerage commissions, or taxes on transactions in Fund shares or that a shareholder would pay on Fund distributions.
Performance as of 3/31/2012
| | | |
| | Average Annual Total Return |
| | Fund
Net Asset Value | Fund
Market Price | INDXX India
Small Cap Index |
| 1 Year | (24.33)% | (24.23)% | (25.16)% |
| Since Inception1 | (16.56)% | (16.27)% | (16.84)% |
Performance data quoted represents past performance. Investment return and principal value of an investment will fluctuate so that an investor’s shares, when sold or redeemed, may be worth more or less than the original cost. Current performance data may be higher or lower than actual data quoted. For the most current month-end performance data please visit www.egshares.com or call (888) 800-4347. As stated in the current prospectus, the Fund’s total annual operating expense ratio after expense waivers and reimbursements is 0.85%. Market price returns are based on the mid-point of the highest bid and lowest offer for Fund shares as of the scheduled close of regular trading on the New York Stock Exchange (“NYSE”) Arca, ordinarily 4:00 p.m. Eastern time, on each day during which the NYSE is open for trading, and do not represent the returns an investor would receive if shares were traded at other times.
Investors should carefully consider the investment objectives, risks, charges and expenses of the Funds before investing. To obtain a prospectus containing this and other important information, please call 1-888-800-4EGS (4347). Read the prospectus carefully before you invest. There are risks involved with investing including the possible loss of principal. Past performance does not guarantee future results.
Emerging Global Shares are distributed by ALPS Distributors Inc.
Value of a $10,000 Investment Since Inception at Net Asset Value
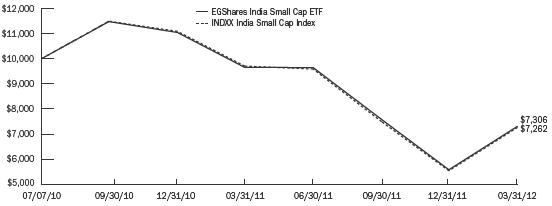
The chart above represents historical performance of a hypothetical investment of $10,000 over the life of the Fund, assuming the reinvestment of distributions. Past performance does not guarantee future results. The hypothetical example does not represent the returns of any particular investment.
| EGA Emerging Global Shares Trust 39 |
Portfolio Summary (Unaudited)
EGShares India Consumer ETF
Industry Breakdown*
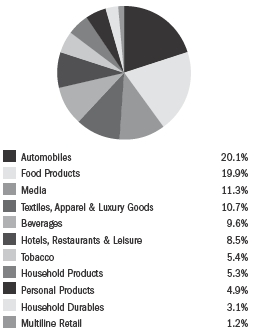
Top Ten Holdings*
| |
| ITC, Ltd. | 5.4% |
| Hindustan Unilever, Ltd. | 5.3% |
| GlaxoSmithKline Consumer Healthcare, Ltd. | 5.3% |
| United Breweries, Ltd. | 5.2% |
| Titan Industries, Ltd. | 5.1% |
| Hero Motorcorp, Ltd. | 5.0% |
| Tata Motors, Ltd. | 5.0% |
| Nestle India, Ltd. | 4.9% |
| Godrej Consumer Products, Ltd. | 4.9% |
| Mahindra & Mahindra, Ltd. | 4.8% |
| * | | Expressed as a percentage of total investments in securities as of 3/31/2012. Holdings are subject to change. |
EGShares India Consumer ETF (ticker: INCO)
The Fund’s investment objective is to seek investment results that correspond (before fees and expenses) to the price and yield performance of the INDXX India Consumer Index (“Consumer Underlying Index”), a 30 stock free float adjusted market capitalization index designed to measure the market performance of companies in the consumer sector of India. The Consumer Underlying Index consists of common stocks that are listed on National Stock Exchange and Bombay Stock Exchange. Under normal circumstances, the Fund will invest at least 80% of its net assets in Indian consumer companies included in the Consumer Underlying Index and generally expects to be substantially invested at such times, with at least 95% of its net assets invested in these securities. The Fund invests in the constituent companies of the Consumer Underlying Index, which may include small and medium capitalized companies (“small cap” and “mid cap” companies, respectively), and are generally consumer goods and services companies domiciled in India having a market capitalization of at least $100 million at the time of purchase. The Fund seeks to achieve its investment objective by attempting to replicate the portfolio of the Consumer Underlying Index through investments in equity securities, including common shares traded on local exchanges, American Depositary Receipts (“ADRs”) and Global Depositary Receipts (“GDRs”). ADRs and GDRs represent ownership interests in shares of foreign companies that are held in financial institution custodial accounts, and are traded on exchanges in the United States and around the world. The Fund defines Indian consumer companies as companies that are included in the Consumer Underlying Index at the time of purchase and generally includes companies whose businesses involve: automobiles and parts; beverages; food production; household goods; leisure goods; personal goods; food and drug retail; general retail; media; travel and leisure; and tobacco. The annual expense ratio of the Fund is 0.85%.
The EGShares India Consumer ETF is a niche fund and is our firm’s only fund that is both country specific and sector specific. India, with its large and relatively young population represents one of the great future consumption markets. Although India has been plagued recently with inflation and an inability for policymakers to generate sustained growth, Indian consumers still need to consume even the most basic of goods and services. Personal goods and food producers were the largest industry weights as of March 31, 2012 at roughly 20% each based on fund assets. The next largest industries at roughly half the size were media and automobile manufacturer/parts. INCO tracked relatively closely to broader Indian equity benchmarks since its inception but like virtually all Indian exposures greatly underperformed broad global emerging market benchmarks.
The EGShares India Consumer ETF had a total return of 20.76% at net asset value (“NAV”) for the quarter ended March 31, 2012 and -4.60% return since its inception date of August 10, 2011. Based on this inception date, the Fund did not have enough historical pricing to cover a full year ending March 31, 2012.
Emerging market investments involve risk of capital loss from unfavorable fluctuation in currency values, from differences in generally accepted accounting principles, from economic or political instability in other nations or increased volatility and lower trading volume. This Fund will concentrate its investments in issuers of one or more particular industries to the same extent that its underlying index is so concentrated and to the extent permitted by applicable regulatory guidance. Concentration risk results from investing more than 25% of the Fund’s assets in issuers conducting business in the same industry. Small cap and mid cap companies generally will have greater volatility in price than the stocks of large companies due to limited product lines or resources or a dependency upon a particular market niche. Because the Fund only invests in Indian securities, its NAV will be much more sensitive to changes in economic, political and other factors within India than would a fund that invested in a greater variety of countries. Special risks include, among others, political and legal uncertainty, persistent religious, ethnic and border disputes, greater government control over the economy, currency fluctuations or blockage and the risk of nationalization or expropriation of assets.
Performance Charts
The following performance chart is provided for comparative purposes and represents the period noted. The Fund’s per share NAV is the value of one share of the Fund and is calculated by dividing the value of total assets less total liabilities by the number of shares outstanding. The NAV return is based on the NAV of the Fund and the market
| 40 EGA Emerging Global Shares Trust |
EGShares India Consumer ETF
return is based on the market price per share of the Fund. The price used to calculate market price returns is the mid-point of the highest bid and lowest offer for Fund shares as of the close of trading on the exchange where Fund shares are listed. NAV and market returns assume that dividends and capital gain distributions have been reinvested in the Fund at NAV and market price, respectively. As with other ETFs, NAV returns and market price returns may differ because of factors such as the supply and demand for Fund shares and investors’ assessments of the underlying value of a Fund’s portfolio securities. An index is a statistical measure of a specified financial market or sector. An index does not actually hold a portfolio of securities, incur expenses or pay any transaction costs. Therefore index returns do not reflect deductions for fees or expenses and are not available for direct investment. In comparison, the Fund’s performance is negatively impacted by these fees and expenses. Fund returns do not reflect brokerage commissions, or taxes on transactions in Fund shares or that a shareholder would pay on Fund distributions.
Performance as of 3/31/2012
| | | |
| | Average Annual Total Return1 |
| | Fund
Net Asset Value | Fund
Market Price | INDXX India
Consumer Index |
| Since Inception2 | (4.60)% | (4.65)% | (6.04)% |
| 1 | | Returns of less than one year are not annualized. |
Performance data quoted represents past performance. Investment return and principal value of an investment will fluctuate so that an investor’s shares, when sold or redeemed, may be worth more or less than the original cost. Current performance data may be higher or lower than actual data quoted. For the most current month-end performance data please visit www.egshares.com or call (888) 800-4347. This Fund is new and has limited operating history. As stated in the current prospectus, the Fund’s total annual operating expense ratio after expense waivers and reimbursements is 0.89%. Market price returns are based on the mid-point of the highest bid and lowest offer for Fund shares as of the scheduled close of regular trading on the New York Stock Exchange (“NYSE”) Arca, ordinarily 4:00 p.m. Eastern time, on each day during which the NYSE is open for trading, and do not represent the returns an investor would receive if shares were traded at other times.
Investors should carefully consider the investment objectives, risks, charges and expenses of the Funds before investing. To obtain a prospectus containing this and other important information, please call 1-888-800-4EGS (4347). Read the prospectus carefully before you invest. There are risks involved with investing including the possible loss of principal. Past performance does not guarantee future results.
Emerging Global Shares are distributed by ALPS Distributors Inc.
Value of a $10,000 Investment Since Inception at Net Asset Value

The chart above represents historical performance of a hypothetical investment of $10,000 over the life of the Fund, assuming the reinvestment of distributions. Past performance does not guarantee future results. The hypothetical example does not represent the returns of any particular investment.
| EGA Emerging Global Shares Trust 41 |
Portfolio Summary (Unaudited)
EGShares Low Volatility Emerging Markets Dividend ETF
(formerly EGShares Emerging Markets High Income Low Beta ETF)
Industry Breakdown*

Top Ten Holdings*
| |
| Major Cineplex Group PCL | 5.4% |
| Magyar Telekom Telecommunications PLC | 5.1% |
| Telekomunikacja Polska SA | 5.0% |
| Telefonica Brasil SA | 4.9% |
| Quality Houses Co., Ltd. PCL | 4.7% |
| Anta Sports Products, Ltd. | 4.2% |
| CEZ AS | 4.1% |
| Zhejiang Expressway Co., Ltd. | 4.0% |
| Kimberly-Clark de Mexico SAB de CV | 3.9% |
| Samart Corp. PCL | 3.7% |
| * | | Expressed as a percentage of total investments in securities as of 3/31/2012. Holdings are subject to change. |
EGShares Low Volatility Emerging Markets Dividend ETF (ticker: HILO)
The Fund’s investment objective is to seek investment results that correspond (before fees and expenses) to the price and yield performance of the INDXX Emerging Market High Income Low Beta Index (“HILB Underlying Index”). The HILB Underlying Index consists of companies whose shares are publicly traded in Emerging Markets countries, such as Chile, Colombia, Czech Republic, Egypt, Hungary, Indonesia, Jordan, Kuwait, Malaysia, Mexico, Morocco, Peru, Philippines, Poland, Russia, Slovenia, South Africa, Brazil, China, India, Thailand and Turkey. Under normal circumstances, the Fund will invest at least 80% of its net assets in emerging markets companies included in the HILB Underlying Index and generally expects to be substantially invested at such times, with at least 95% of its net assets invested in these securities. The Fund invests in the constituent companies of the HILB Underlying Index, which may include small and medium capitalized companies (“small cap” and “mid cap” companies, respectively), domiciled in emerging markets countries having a market capitalization of at least $250 million at the time of purchase. The HILB Underlying Index is a dividend yield weighted stock market index comprised of a representative sample of 30 emerging markets companies that INDXX, LLC determines to have lower relative volatility (i.e., low beta) than the broad market benchmark indices of the local exchanges in which the component securities trade. The components of the HILB Underlying Index will have also paid dividends consistently over the last three years. The HILB Underlying Index was developed to provide a lower beta, and a greater dividend yield (i.e., high income), than the MSCI Emerging Market Index, although there is no guarantee that this result will be obtained. The Fund seeks to achieve its investment objective by attempting to replicate the portfolio of the HILB Underlying Index through investments in equity securities, including common shares traded on local exchanges, American Depositary Receipts (“ADRs”) and Global Depositary Receipts (“GDRs”). ADRs and GDRs represent ownership interests in shares of foreign companies that are held in financial institution custodial accounts, and are traded on exchanges in the United States and around the world. The annual expense ratio of the Fund is 0.85%.
The EGShares Low Volatility Emerging Markets Dividend GEMS ETF (formerly the EGShares Emerging Markets High Income Low Beta ETF) is our firm’s only fund that focuses its weighting methodology more on dividends and volatility management over market capitalization. For investors looking to have greater levels of certainty regarding overall total return via a base of dividend income, this Fund does provide such unique exposure. Furthermore, investors concerned with traditionally high levels of security specific volatility, the methodology of HILO also takes this into account. Country exposures are well diversified with Thailand, China, Brazil and South Africa being the largest weights ranging from 17% to just under 15% as of March 31, 2012. Six other emerging market economies have exposures ranging from roughly 5% to 3.5%. Sectors are also well diversified with telecom and utilities in particular, and not surprisingly, providing dividend income. Since inception, HILO slightly outperformed the global emerging market benchmarks albeit slightly and like emerging markets overall underperformed US equity benchmarks. However, in terms of volatility (as measured by standard deviation), HILO did have lower levels versus EM benchmarks and more similar to US benchmarks.
The EGShares Low Volatility Emerging Markets Dividend GEMS ETF had a total return of 11.17% at net asset value (“NAV”) for the quarter ended March 31, 2012 and 2.45% return since its inception date of August 4, 2011. Based on this inception date, the Fund did not have enough historical pricing to cover a full year ending March 31, 2012.
Emerging market investments involve risk of capital loss from unfavorable fluctuation in currency values, from differences in generally accepted accounting principles, from economic or political instability in other nations or increased volatility and lower trading volume. This Fund will concentrate its investments in issuers of one or more particular industries to the same extent that its underlying index is so concentrated and to the extent permitted by applicable regulatory guidance. Concentration risk results from investing more than 25% of the Fund’s assets in issuers conducting business in the same industry.
Performance Charts
The following performance chart is provided for comparative purposes and represents the period noted. The Fund’s per share NAV is the value of one share of the Fund and is calculated by dividing the value of total assets less total liabilities by the number of shares outstanding. The NAV return is based on the NAV of the Fund and the market
| 42 EGA Emerging Global Shares Trust |
EGShares Low Volatility Emerging Markets Dividend ETF
(formerly EGShares Emerging Markets High Income Low Beta ETF)
return is based on the market price per share of the Fund. The price used to calculate market price returns is the mid-point of the highest bid and lowest offer for Fund shares as of the close of trading on the exchange where Fund shares are listed. NAV and market returns assume that dividends and capital gain distributions have been reinvested in the Fund at NAV and market price, respectively. As with other ETFs, NAV returns and market price returns may differ because of factors such as the supply and demand for Fund shares and investors’ assessments of the underlying value of a Fund’s portfolio securities. An index is a statistical measure of a specified financial market or sector. An index does not actually hold a portfolio of securities, incur expenses or pay any transaction costs. Therefore index returns do not reflect deductions for fees or expenses and are not available for direct investment. In comparison, the Fund’s performance is negatively impacted by these fees and expenses. Fund returns do not reflect brokerage commissions, or taxes on transactions in Fund shares or that a shareholder would pay on Fund distributions.
Performance as of 3/31/2012
| | | |
| | Average Annual Total Return1 |
| | Fund
Net Asset Value | Fund
Market Price | INDXX Emerging
Market High Income
Low Beta Index |
| Since Inception2 | 2.45% | 1.90% | 2.97% |
| 1 | | Returns of less than one year are not annualized. |
Performance data quoted represents past performance. Investment return and principal value of an investment will fluctuate so that an investor’s shares, when sold or redeemed, may be worth more or less than the original cost. Current performance data may be higher or lower than actual data quoted. For the most current month-end performance data please visit www.egshares.com or call (888) 800-4347. This Fund is new and has limited operating history. As stated in the current prospectus, the Fund’s total annual operating expense ratio after expense waivers and reimbursements is 0.85%. Market price returns are based on the mid-point of the highest bid and lowest offer for Fund shares as of the scheduled close of regular trading on the New York Stock Exchange (“NYSE”) Arca, ordinarily 4:00 p.m. Eastern time, on each day during which the NYSE is open for trading, and do not represent the returns an investor would receive if shares were traded at other times.
Investors should carefully consider the investment objectives, risks, charges and expenses of the Funds before investing. To obtain a prospectus containing this and other important information, please call 1-888-800-4EGS (4347). Read the prospectus carefully before you invest. There are risks involved with investing including the possible loss of principal. Past performance does not guarantee future results.
Emerging Global Shares are distributed by ALPS Distributors Inc.
Value of a $10,000 Investment Since Inception at Net Asset Value
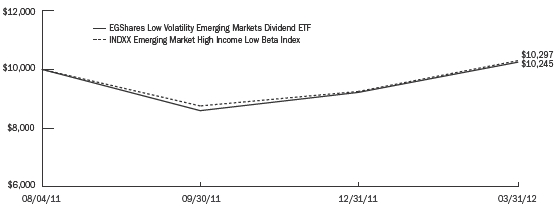
The chart above represents historical performance of a hypothetical investment of $10,000 over the life of the Fund, assuming the reinvestment of distributions. Past performance does not guarantee future results. The hypothetical example does not represent the returns of any particular investment.
| EGA Emerging Global Shares Trust 43 |
Shareholder Expense Examples (Unaudited)
As a shareholder of an EGA Emerging Global Shares Trust ETF, you incur advisory fees and other Fund expenses. The following example is intended to help you understand your ongoing costs (in dollars and cents) of investing in a Fund and to compare these costs with the ongoing costs of investing in other funds. The example is based on an investment of $1,000 invested at the beginning of the period and held throughout the entire period (October 1, 2011 to March 31, 2012).
Actual expenses
The first line under each Fund in the table below provides information about actual account values and actual expenses. You may use the information in this line, together with the amount you invested, to estimate the expenses that you paid over the period. Simply divide your account value by $1,000 (for example, an $8,600 account value divided by $1,000 = 8.6), then multiply the result by the number in the first line for your Fund under the heading entitled “Expenses Paid Through 3/31/2012” to estimate the expenses you paid on your account during this period.
Hypothetical example for comparison purposes
The second line under each Fund in the table provides information about hypothetical account values and hypothetical expenses based on each Fund’s actual expense ratio and an assumed rate of return of 5% per year before expenses, which is not the Fund’s actual return. The hypothetical account values and expenses may not be used to estimate the actual ending account balance or expenses you paid for the period. You may use this information to compare the ongoing costs of investing in your Fund and other funds. To do so, compare this 5% hypothetical example with the 5% hypothetical examples that appear in the shareholder reports of the other funds.
Please note that the expenses shown in the table are meant to highlight your ongoing costs only and do not reflect any transactional costs, such as brokerage commissions paid on purchases and sales of Fund shares. Therefore, the second line under each Fund in the table is useful in comparing ongoing Fund costs only and will not help you determine the relative total costs of owning different funds. In addition, if these transactional costs were included, your costs would have been higher.
| 44 EGA Emerging Global Shares Trust |
Shareholder Expense Examples (Unaudited) (continued)
| | Beginning
Account Value
10/1/2011 | Ending
Account Value
3/31/2012 | Annualized
Expense Ratios
for the Period | Expenses Paid
Through
3/31/20121 |
| EGShares GEMS Composite ETF (Consolidated)2 | | | | | | | | |
| Actual | $ | 1,000.00 | $ | 1,171.37 | 0.75 | % | $ | 4.07 |
| Hypothetical (5% return before expenses) | $ | 1,000.00 | $ | 1,021.25 | 0.75 | % | $ | 3.79 |
| EGShares Basic Materials GEMS ETF (Consolidated)2 | | | | | | | | |
| Actual | $ | 1,000.00 | $ | 1,080.32 | 0.85 | % | $ | 4.42 |
| Hypothetical (5% return before expenses) | $ | 1,000.00 | $ | 1,020.75 | 0.85 | % | $ | 4.29 |
| EGShares Consumer Goods GEMS ETF (Consolidated)2 | | | | | | | | |
| Actual | $ | 1,000.00 | $ | 1,185.59 | 0.86 | %* | $ | 4.70 |
| Hypothetical (5% return before expenses) | $ | 1,000.00 | $ | 1,020.70 | 0.86 | %* | $ | 4.34 |
| EGShares Consumer Services GEMS ETF | | | | | | | | |
| Actual | $ | 1,000.00 | $ | 1,267.28 | 0.85 | % | $ | 4.82 |
| Hypothetical (5% return before expenses) | $ | 1,000.00 | $ | 1,020.75 | 0.85 | % | $ | 4.29 |
| EGShares Energy GEMS ETF (Consolidated)2 | | | | | | | | |
| Actual | $ | 1,000.00 | $ | 1,186.40 | 0.85 | % | $ | 4.65 |
| Hypothetical (5% return before expenses) | $ | 1,000.00 | $ | 1,020.75 | 0.85 | % | $ | 4.29 |
| EGShares Financials GEMS ETF (Consolidated)2 | | | | | | | | |
| Actual | $ | 1,000.00 | $ | 1,197.17 | 0.85 | % | $ | 4.67 |
| Hypothetical (5% return before expenses) | $ | 1,000.00 | $ | 1,020.75 | 0.85 | % | $ | 4.29 |
| EGShares Health Care GEMS ETF (Consolidated)2 | | | | | | | | |
| Actual | $ | 1,000.00 | $ | 1,139.59 | 0.85 | % | $ | 4.55 |
| Hypothetical (5% return before expenses) | $ | 1,000.00 | $ | 1,020.75 | 0.85 | % | $ | 4.29 |
| EGShares Industrials GEMS ETF (Consolidated)2 | | | | | | | | |
| Actual | $ | 1,000.00 | $ | 1,231.97 | 0.85 | % | $ | 4.74 |
| Hypothetical (5% return before expenses) | $ | 1,000.00 | $ | 1,020.75 | 0.85 | % | $ | 4.29 |
| EGShares Technology GEMS ETF (Consolidated)2 | | | | | | | | |
| Actual | $ | 1,000.00 | $ | 1,175.59 | 0.85 | % | $ | 4.62 |
| Hypothetical (5% return before expenses) | $ | 1,000.00 | $ | 1,020.75 | 0.85 | % | $ | 4.29 |
| EGShares Telecom GEMS ETF (Consolidated)2 | | | | | | | | |
| Actual | $ | 1,000.00 | $ | 1,124.53 | 0.85 | % | $ | 4.51 |
| Hypothetical (5% return before expenses) | $ | 1,000.00 | $ | 1,020.75 | 0.85 | % | $ | 4.29 |
| EGShares Utilities GEMS ETF (Consolidated)2 | | | | | | | | |
| Actual | $ | 1,000.00 | $ | 1,229.36 | 0.85 | % | $ | 4.74 |
| Hypothetical (5% return before expenses) | $ | 1,000.00 | $ | 1,020.75 | 0.85 | % | $ | 4.29 |
| EGShares Emerging Markets Metals & Mining ETF (Consolidated)2 | | | | | | |
| Actual | $ | 1,000.00 | $ | 1,066.02 | 0.85 | % | $ | 4.39 |
| Hypothetical (5% return before expenses) | $ | 1,000.00 | $ | 1,020.75 | 0.85 | % | $ | 4.29 |
| EGShares Emerging Markets Consumer ETF (Consolidated)2 | | | | | | |
| Actual | $ | 1,000.00 | $ | 1,229.41 | 0.85 | % | $ | 4.74 |
| Hypothetical (5% return before expenses) | $ | 1,000.00 | $ | 1,020.75 | 0.85 | % | $ | 4.29 |
| EGShares India Infrastructure ETF (Consolidated)2 | | | | | | | | |
| Actual | $ | 1,000.00 | $ | 1,027.56 | 0.85 | % | $ | 4.31 |
| Hypothetical (5% return before expenses) | $ | 1,000.00 | $ | 1,020.75 | 0.85 | % | $ | 4.29 |
| EGShares China Infrastructure ETF | | | | | | | | |
| Actual | $ | 1,000.00 | $ | 1,200.01 | 0.85 | % | $ | 4.68 |
| Hypothetical (5% return before expenses) | $ | 1,000.00 | $ | 1,020.75 | 0.85 | % | $ | 4.29 |
| EGA Emerging Global Shares Trust 45 |
Shareholder Expense Examples (Unaudited) (concluded)
| | Beginning
Account Value
10/1/2011 | Ending
Account Value
3/31/2012 | Annualized
Expense Ratios
for the Period | Expenses Paid
Through
3/31/20121 |
| EGShares Brazil Infrastructure ETF | | | | | | | | |
| Actual | $ | 1,000.00 | $ | 1,269.71 | 0.92 | %** | $ | 5.22 |
| Hypothetical (5% return before expenses) | $ | 1,000.00 | $ | 1,020.40 | 0.92 | %** | $ | 4.65 |
| EGShares India Small Cap ETF (Consolidated)2 | | | | | | | | |
| Actual | $ | 1,000.00 | $ | 963.47 | 0.85 | % | $ | 4.17 |
| Hypothetical (5% return before expenses) | $ | 1,000.00 | $ | 1,020.75 | 0.85 | % | $ | 4.29 |
| EGShares India Consumer ETF (Consolidated)2 | | | | | | | | |
| Actual | $ | 1,000.00 | $ | 1,045.48 | 0.89 | % | $ | 4.55 |
| Hypothetical (5% return before expenses) | $ | 1,000.00 | $ | 1,020.55 | 0.89 | % | $ | 4.50 |
| EGShares Low Volatility Emerging Markets Dividend ETF (Consolidated)2 | | | | |
| Actual | $ | 1,000.00 | $ | 1,192.20 | 0.85 | % | $ | 4.66 |
| Hypothetical (5% return before expenses) | $ | 1,000.00 | $ | 1,020.75 | 0.85 | % | $ | 4.29 |
| 1 | | Expenses are calculated using each Fund's annualized expense ratio, which includes waived fees or reimbursed expenses, multiplied by the ending account value for the period, multiplied by 183/366 (to reflect the six-month period). |
| 2 | | Expenses for these Funds include the accounts of wholly owned subsidiaries. All inter-company accounts and transactions have been eliminated in consolidation. See Note 2 in the Notes to Financial Statements. |
| * | | The expense ratio excluding interest expense, which is outside the cap expense, is 0.85% through the period ended March 31, 2012. |
| ** | | The expense ratio excluding excise tax expense, which is outside the cap expense, is 0.85% through the period ended March 31, 2012. |
| 46 EGA Emerging Global Shares Trust |
Frequency Distribution of Premium and Discount (Unaudited)
The chart below presents information about differences between the per share net asset value (“NAV”) of each Fund and the market trading price of shares of each Fund. For these purposes, the “market price” is the midpoint of the highest bid and lowest offer for Fund shares as of the close of trading on the exchange where Fund shares are listed. The term “premium” is sometimes used to describe a market price in excess of NAV and the term “discount” is sometimes used to describe a market price below NAV. The chart presents information about the size and frequency of premiums or discounts. As with other exchange-traded funds, the market price of Fund shares is typically slightly higher or lower than the Fund’s per share NAV. Factors that contribute to the differences between market price and NAV include the supply and demand for Fund shares and investors’ assessments of the underlying value of a Fund’s portfolio securities.
Differences between the closing times of U.S. and non-U.S. markets may contribute to differences between the NAV and market price of Fund shares. Many non-U.S. markets close prior to the close of the U.S. securities exchanges. Developments after the close of such markets as a result of ongoing price discovery may be reflected in a Fund’s market price but not in its NAV (or vice versa).
| | | | | | | |
| | | Market Price
Above or Equal to NAV | Market Price
Below NAV |
| | Basis Point
Differential | Number
of Days | % of
Total Days | Number
of Days | % of
Total Days |
| EGShares GEMS Composite ETF | | | | | | | |
| July 22, 2009*–March 31, 2012 | | | | | | | |
| | 0-24.99 | 95 | 13.99 | % | 86 | 12.67 | % |
| | 25-49.99 | 103 | 15.17 | % | 79 | 11.64 | % |
| | 50-74.99 | 61 | 8.98 | % | 53 | 7.81 | % |
| | 75-99.99 | 57 | 8.39 | % | 17 | 2.50 | % |
| | > 100 | 74 | 10.90 | % | 54 | 7.95 | % |
| Total | | 390 | 57.43 | % | 289 | 42.57 | % |
| EGShares Basic Materials GEMS ETF | | | | | | | |
| June 23, 2011*–March 31, 2012 | | | | | | | |
| | 0-24.99 | 27 | 13.85 | % | 24 | 12.31 | % |
| | 25-49.99 | 26 | 13.33 | % | 21 | 10.77 | % |
| | 50-74.99 | 16 | 8.20 | % | 15 | 7.69 | % |
| | 75-99.99 | 9 | 4.62 | % | 8 | 4.10 | % |
| | > 100 | 11 | 5.64 | % | 38 | 19.49 | % |
| Total | | 89 | 45.64 | % | 106 | 54.36 | % |
| EGShares Consumer Goods GEMS ETF | | | | | | | |
| June 23, 2011*–March 31, 2012 | | | | | | | |
| | 0-24.99 | 25 | 12.82 | % | 21 | 10.77 | % |
| | 25-49.99 | 28 | 14.36 | % | 15 | 7.69 | % |
| | 50-74.99 | 20 | 10.26 | % | 12 | 6.15 | % |
| | 75-99.99 | 14 | 7.18 | % | 12 | 6.15 | % |
| | > 100 | 14 | 7.18 | % | 34 | 17.44 | % |
| Total | | 101 | 51.80 | % | 94 | 48.20 | % |
| EGShares Consumer Services GEMS ETF | | | | | | | |
| June 23, 2011*–March 31, 2012 | | | | | | | |
| | 0-24.99 | 27 | 13.85 | % | 28 | 14.36 | % |
| | 25-49.99 | 20 | 10.26 | % | 26 | 13.33 | % |
| | 50-74.99 | 11 | 5.64 | % | 22 | 11.28 | % |
| | 75-99.99 | 2 | 1.03 | % | 19 | 9.74 | % |
| | > 100 | 3 | 1.54 | % | 37 | 18.97 | % |
| Total | | 63 | 32.32 | % | 132 | 67.68 | % |
| EGShares Energy GEMS ETF | | | | | | | |
| May 21, 2009*–March 31, 2012 | | | | | | | |
| | 0-24.99 | 85 | 11.80 | % | 67 | 9.30 | % |
| | 25-49.99 | 103 | 14.31 | % | 70 | 9.72 | % |
| | 50-74.99 | 103 | 14.31 | % | 61 | 8.47 | % |
| | 75-99.99 | 56 | 7.78 | % | 28 | 3.89 | % |
| | > 100 | 76 | 10.56 | % | 71 | 9.86 | % |
| Total | | 423 | 58.76 | % | 297 | 41.24 | % |
| EGA Emerging Global Shares Trust 47 |
Frequency Distribution of Premium and Discount (Unaudited) (continued)
| | | | | | | |
| | | Market Price
Above or Equal to NAV | | Market Price
Below NAV | |
| | Basis Point
Differential | Number
of Days | % of
Total Days | | Number
of Days | % of
Total Days | |
| EGShares Financials GEMS ETF | | | | | | | |
| September 16, 2009*–March 31, 2012 | | | | | | | |
| | 0-24.99 | 82 | 12.83 | % | 79 | 12.36 | % |
| | 25-49.99 | 79 | 12.36 | % | 71 | 11.11 | % |
| | 50-74.99 | 49 | 7.67 | % | 66 | 10.33 | % |
| | 75-99.99 | 43 | 6.73 | % | 29 | 4.54 | % |
| | > 100 | 81 | 12.68 | % | 60 | 9.39 | % |
| Total | | 334 | 52.27 | % | 305 | 47.73 | % |
| EGShares Health Care GEMS ETF | | | | | | | |
| June 23, 2011*–March 31, 2012 | | | | | | | |
| | 0-24.99 | 17 | 8.72 | % | 18 | 9.23 | % |
| | 25-49.99 | 20 | 10.26 | % | 23 | 11.79 | % |
| | 50-74.99 | 12 | 6.15 | % | 28 | 14.36 | % |
| | 75-99.99 | 10 | 5.13 | % | 11 | 5.64 | % |
| | > 100 | 21 | 10.77 | % | 35 | 17.95 | % |
| Total | | 80 | 41.03 | % | 115 | 58.97 | % |
| EGShares Industrials GEMS ETF | | | | | | | |
| June 23, 2011*–March 31, 2012 | | | | | | | |
| | 0-24.99 | 20 | 10.26 | % | 18 | 9.23 | % |
| | 25-49.99 | 18 | 9.23 | % | 9 | 4.62 | % |
| | 50-74.99 | 19 | 9.74 | % | 15 | 7.69 | % |
| | 75-99.99 | 12 | 6.15 | % | 12 | 6.15 | % |
| | > 100 | 30 | 15.39 | % | 42 | 21.54 | % |
| Total | | 99 | 50.77 | % | 96 | 49.23 | % |
| EGShares Technology GEMS ETF | | | | | | | |
| June 23, 2011*–March 31, 2012 | | | | | | | |
| | 0-24.99 | 37 | 18.97 | % | 28 | 14.36 | % |
| | 25-49.99 | 30 | 15.38 | % | 13 | 6.67 | % |
| | 50-74.99 | 19 | 9.74 | % | 11 | 5.64 | % |
| | 75-99.99 | 15 | 7.69 | % | 9 | 4.62 | % |
| | > 100 | 16 | 8.21 | % | 17 | 8.72 | % |
| Total | | 117 | 59.99 | % | 78 | 40.01 | % |
| EGShares Telecom GEMS ETF | | | | | | | |
| June 23, 2011*–March 31, 2012 | | | | | | | |
| | 0-24.99 | 31 | 15.90 | % | 21 | 10.77 | % |
| | 25-49.99 | 21 | 10.77 | % | 21 | 10.77 | % |
| | 50-74.99 | 18 | 9.23 | % | 13 | 6.67 | % |
| | 75-99.99 | 12 | 6.15 | % | 9 | 4.61 | % |
| | >100 | 24 | 12.31 | % | 25 | 12.82 | % |
| Total | | 106 | 54.36 | % | 89 | 45.64 | % |
| EGShares Utilities GEMS ETF | | | | | | | |
| June 23, 2011*–March 31, 2012 | | | | | | | |
| | 0-24.99 | 31 | 15.90 | % | 26 | 13.33 | % |
| | 25-49.99 | 24 | 12.31 | % | 18 | 9.23 | % |
| | 50-74.99 | 11 | 5.64 | % | 16 | 8.21 | % |
| | 75-99.99 | 9 | 4.62 | % | 12 | 6.15 | % |
| | > 100 | 5 | 2.56 | % | 43 | 22.05 | % |
| Total | | 80 | 41.03 | % | 115 | 58.97 | % |
| 48 EGA Emerging Global Shares Trust |
Frequency Distribution of Premium and Discount (Unaudited) (continued)
| | | | | | | |
| | | Market Price
Above or Equal to NAV | | Market Price
Below NAV | |
| | Basis Point
Differential | Number
of Days | % of
Total Days | | Number
of Days | % of
Total Days | |
EGShares Emerging Markets
Metals & Mining ETF | | | | | | | |
| May 21, 2009*–March 31, 2012 | | | | | | | |
| | 0-24.99 | 108 | 14.98 | % | 87 | 12.07 | % |
| | 25-49.99 | 93 | 12.90 | % | 55 | 7.63 | % |
| | 50-74.99 | 67 | 9.29 | % | 52 | 7.21 | % |
| | 75-99.99 | 68 | 9.43 | % | 35 | 4.85 | % |
| | > 100 | 85 | 11.79 | % | 71 | 9.85 | % |
| Total | | 421 | 58.39 | % | 300 | 41.61 | % |
| EGShares Emerging Markets Consumer ETF | | | | | | | |
| September 14, 2010*–March 31, 2012 | | | | | | | |
| | 0-24.99 | 58 | 14.80 | % | 41 | 10.46 | % |
| | 25-49.99 | 93 | 23.72 | % | 24 | 6.12 | % |
| | 50-74.99 | 81 | 20.66 | % | 9 | 2.30 | % |
| | 75-99.99 | 41 | 10.46 | % | 8 | 2.04 | % |
| | > 100 | 25 | 6.38 | % | 12 | 3.06 | % |
| Total | | 298 | 76.02 | % | 94 | 23.98 | % |
| EGShares India Infrastructure ETF | | | | | | | |
| August 11, 2010*–March 31, 2012 | | | | | | | |
| | 0-24.99 | 37 | 8.96 | % | 34 | 8.23 | % |
| | 25-49.99 | 45 | 10.90 | % | 29 | 7.02 | % |
| | 50-74.99 | 41 | 9.93 | % | 30 | 7.26 | % |
| | 75-99.99 | 32 | 7.75 | % | 19 | 4.60 | % |
| | > 100 | 79 | 19.13 | % | 67 | 16.22 | % |
| Total | | 234 | 56.67 | % | 179 | 43.33 | % |
| EGShares China Infrastructure ETF | | | | | | | |
| February 17, 2010*–March 31, 2012 | | | | | | | |
| | 0-24.99 | 52 | 9.74 | % | 43 | 8.05 | % |
| | 25-49.99 | 56 | 10.49 | % | 45 | 8.43 | % |
| | 50-74.99 | 66 | 12.36 | % | 34 | 6.37 | % |
| | 75-99.99 | 45 | 8.43 | % | 31 | 5.80 | % |
| | > 100 | 86 | 16.10 | % | 76 | 14.23 | % |
| Total | | 305 | 57.12 | % | 229 | 42.88 | % |
| EGShares Brazil Infrastructure ETF | | | | | | | |
| February 24, 2010*–March 31, 2012 | | | | | | | |
| | 0-24.99 | 31 | 5.87 | % | 21 | 3.98 | % |
| | 25-49.99 | 30 | 5.68 | % | 16 | 3.03 | % |
| | 50-74.99 | 24 | 4.54 | % | 21 | 3.98 | % |
| | 75-99.99 | 24 | 4.54 | % | 5 | 0.95 | % |
| | > 100 | 337 | 63.83 | % | 19 | 3.60 | % |
| Total | | 446 | 84.46 | % | 82 | 15.54 | % |
| EGShares India Small Cap ETF | | | | | | | |
| July 7, 2010*–March 31, 2012 | | | | | | | |
| | 0-24.99 | 45 | 10.27 | % | 27 | 6.17 | % |
| | 25-49.99 | 39 | 8.90 | % | 23 | 5.25 | % |
| | 50-74.99 | 42 | 9.59 | % | 18 | 4.11 | % |
| | 75-99.99 | 48 | 10.96 | % | 12 | 2.74 | % |
| | > 100 | 129 | 29.45 | % | 55 | 12.56 | % |
| Total | | 303 | 69.17 | % | 135 | 30.83 | % |
| EGA Emerging Global Shares Trust 49 |
Frequency Distribution of Premium and Discount (Unaudited) (concluded)
| | | | | | | |
| | | Market Price
Above or Equal to NAV | | Market Price
Below NAV | |
| | Basis Point
Differential | Number
of Days | % of
Total Days | | Number
of Days | % of
Total Days | |
| EGShares India Consumer ETF | | | | | | | |
| August 10, 2011*–March 31, 2012 | | | | | | | |
| | 0-24.99 | 6 | 3.73 | % | 16 | 9.94 | % |
| | 25-49.99 | 15 | 9.32 | % | 15 | 9.32 | % |
| | 50-74.99 | 16 | 9.94 | % | 10 | 6.21 | % |
| | 75-99.99 | 13 | 8.07 | % | 2 | 1.24 | % |
| | > 100 | 55 | 34.16 | % | 13 | 8.07 | % |
| Total | | 105 | 65.22 | % | 56 | 34.78 | % |
| EGShares Low Volatility Emerging Markets Dividend ETF | | | | | | | |
| August 4, 2011*–March 31, 2012 | | | | | | | |
| | 0-24.99 | 14 | 8.49 | % | 15 | 9.09 | % |
| | 25-49.99 | 23 | 13.94 | % | 6 | 3.64 | % |
| | 50-74.99 | 25 | 15.15 | % | 7 | 4.24 | % |
| | 75-99.99 | 22 | 13.33 | % | 10 | 6.06 | % |
| | > 100 | 36 | 21.82 | % | 7 | 4.24 | % |
| Total | | 120 | 72.73 | % | 45 | 27.27 | % |
* Commencement of operations.
Each line in the table shows the number of trading days in which the Fund traded within the premium/discount range indicated. The number of trading days in each premium/discount range is also shown as a percentage of the total number of trading days in the period covered by each table. All data presented here represents past performance, which cannot be used to predict future results.
| 50 EGA Emerging Global Shares Trust |
Schedule of Investments (Consolidated)†
EGShares GEMS Composite ETF
March 31, 2012
| | |
| Investments | Shares | Value |
| COMMON STOCKS—99.7% | | |
| Brazil—18.1% | | |
| Banco Bradesco SA Preference Shares ADR | 19,307 | $ | 337,873 |
| BRF—Brasil Foods SA ADR | 7,278 | 145,633 |
| Companhia Brasileira de Distribuicao Grupo Pao de | | |
| Acucar Preference Shares ADR | 1,450 | 69,049 |
| Companhia de Bebidas das Americas Preference | | |
| Shares ADR | 8,956 | 370,062 |
| Companhia Energetica de Minas Gerais Preference | | |
| Shares ADR | 4,557 | 108,365 |
| Companhia Siderurgica Nacional SA ADR | 8,431 | 79,757 |
| Gerdau SA Preference Shares ADR | 6,968 | 67,102 |
| Itau Unibanco Holding SA Preference Shares ADR | 22,993 | 441,236 |
| Petroleo Brasileiro SA ADR | 16,756 | 445,039 |
| Tele Norte Leste Participacoes SA Preference Shares ADR 4,728 | 53,663 |
| Ultrapar Participacoes SA ADR | 4,813 | 104,394 |
| Vale SA ADR | 13,091 | 305,413 |
| Total Brazil | | 2,527,586 |
| Chile—2.6% | | |
| Cencosud SA | 18,264 | 121,003 |
| Empresa Nacional de Electricidad SA ADR | 1,320 | 71,254 |
| Enersis SA ADR | 2,976 | 60,085 |
| S.A.C.I. Falabella | 12,112 | 117,016 |
| Total Chile | | 369,358 |
| China—25.8% | | |
| Baidu, Inc. ADR* | 1,395 | 203,349 |
| Bank of China, Ltd. Class H | 612,623 | 246,974 |
| China Communications Construction Co., Ltd. Class H | 48,000 | 48,161 |
| China Construction Bank Corp. Class H | 555,350 | 429,173 |
| China Life Insurance Co., Ltd. Class H | 75,500 | 195,946 |
| China Merchants Holdings International Co., Ltd. | 6,000 | 20,093 |
| China Mobile, Ltd. | 52,500 | 577,811 |
| China Petroleum & Chemical Corp. Class H | 162,280 | 176,827 |
| China Shenhua Energy Co., Ltd. Class H | 32,270 | 136,121 |
| China Telecom Corp., Ltd. Class H | 154,000 | 85,291 |
| China Unicom Hong Kong, Ltd. | 22,000 | 37,290 |
| CNOOC, Ltd. | 148,000 | 304,235 |
| Ctrip.com International, Ltd. ADR* | 1,412 | 30,556 |
| Dongfeng Motor Group Co., Ltd. Class H | 26,000 | 46,950 |
| Industrial and Commercial Bank of China, Ltd. Class H | 762,680 | 492,147 |
| Lenovo Group, Ltd. | 49,700 | 44,745 |
| Mindray Medical International, Ltd. ADR | 1,101 | 36,300 |
| NetEase.com, Inc. ADR* | 641 | 37,242 |
| PetroChina Co., Ltd. Class H | 242,000 | 342,241 |
| Shandong Weigao Group Medical Polymer Co., Ltd. | | |
| Class H | 19,600 | 22,392 |
| SINA Corp.* | 948 | 61,620 |
| Sinopharm Group Co. Class H | 2,400 | 6,708 |
| Sohu.com, Inc.* | 418 | 23,061 |
| ZTE Corp. Class H | 2,400 | 6,461 |
| Total China | | 3,611,694 |
| Czech Republic—0.9% | | |
| CEZ AS | 3,007 | 128,647 |
| Egypt—0.3% | | |
| Orascom Construction Industries | 967 | 41,656 |
| Hungary—0.2% | | |
| Richter Gedeon Nyrt. | 149 | 25,477 |
| | |
| India—12.5% | | |
| Bharat Heavy Electricals, Ltd. | 3,485 | | 17,591 |
| Bharti Airtel, Ltd. | 5,386 | 35,723 |
| Cipla, Ltd. | 2,191 | 13,121 |
| Dr. Reddy’s Laboratories, Ltd. ADR | 1,425 | 49,248 |
| HDFC Bank, Ltd. ADR | 4,462 | 152,154 |
| Hindustan Unilever, Ltd. | 4,030 | 32,437 |
| Housing Development Finance Corp., Ltd. | 13,014 | 171,996 |
| ICICI Bank, Ltd. ADR | 4,595 | 160,228 |
| Infosys, Ltd. ADR | 4,986 | 284,352 |
| ITC, Ltd. | 25,969 | 115,661 |
| Larsen & Toubro, Ltd. GDR | 6,113 | 155,881 |
| Mahindra & Mahindra, Ltd. | 1,843 | 25,331 |
| NTPC, Ltd. | 5,480 | 17,507 |
| Ranbaxy Laboratories, Ltd. GDR | 1,862 | 17,112 |
| Reliance Industries, Ltd. GDR 144A | 8,655 | 252,293 |
| Sun Pharmaceutical Industries, Ltd. | 1,603 | 17,934 |
| Tata Consultancy Services, Ltd. | 3,356 | 76,995 |
| Tata Motors, Ltd. ADR | 3,504 | 94,503 |
| Tata Power Co., Ltd. | 7,726 | 15,309 |
| Wipro, Ltd. ADR | 3,283 | 36,113 |
| Total India | | 1,741,489 |
| Indonesia—2.5% | | |
| Astra International Tbk PT | 24,500 | 198,138 |
| Perusahaan Gas Negara PT | 139,500 | 57,972 |
| Telekomunikasi Indonesia Tbk PT | 126,500 | 96,840 |
| Total Indonesia | | 352,950 |
| Malaysia—2.0% | | |
| Genting BHD | 26,400 | 93,415 |
| IOI Corp. BHD | 28,493 | 49,666 |
| Sime Darby BHD | 26,500 | 84,253 |
| Tenaga Nasional BHD | 25,300 | 53,103 |
| Total Malaysia | | 280,437 |
| Mexico—9.0% | | |
| America Movil SAB de CV Series L | 388,322 | 482,580 |
| Cemex SAB de CV Series CPO* | 117,479 | 90,788 |
| Fomento Economico Mexicano SAB de CV Series UB | 17,800 | 146,174 |
| Grupo Bimbo SAB de CV Series A | 28,600 | 66,664 |
| Grupo Mexico SAB de CV Series B | 27,067 | 85,360 |
| Grupo Televisa SAB Series CPO | 32,500 | 137,327 |
| Wal-Mart de Mexico SAB de CV Series V | 73,700 | 246,980 |
| Total Mexico | | 1,255,873 |
| Poland—0.3% | | |
| Asseco Poland SA | 782 | 12,499 |
| KGHM Polska Miedz SA | 610 | 27,989 |
| Total Poland | | 40,488 |
| Russia—14.6% | | |
| Federal Hydrogenerating Co. JSC ADR | 6,554 | 24,027 |
| Gazprom OAO ADR | 62,427 | 761,609 |
| LUKOIL OAO ADR | 5,445 | 327,789 |
| Magnit OJSC GDR | 3,595 | 104,758 |
| MMC Norilsk Nickel OJSC ADR | 11,228 | 205,472 |
| Mobile TeleSystems ADR | 4,929 | 90,398 |
| Rosneft Oil Co. OJSC GDR | 17,581 | 124,474 |
| Surgutneftegas ADR | 36,652 | 358,457 |
| VimpelCom, Ltd. ADR | 3,524 | 39,328 |
| Total Russia | | 2,036,312 |
The accompanying notes are an integral part of these financial statements.
| EGA Emerging Global Shares Trust 51 |
Schedule of Investments (Consolidated)†(concluded)
EGShares GEMS Composite ETF
March 31, 2012
| | |
| Investments | Shares | Value |
| South Africa—10.9% | | |
| AngloGold Ashanti, Ltd. | 3,932 | $ | 144,686 |
| Aspen Pharmacare Holdings, Ltd. | 3,566 | 55,071 |
| Bidvest Group, Ltd. | 4,585 | 107,388 |
| Gold Fields, Ltd. | 7,789 | 106,566 |
| Impala Platinum Holdings, Ltd. | 5,838 | 114,941 |
| MTN Group, Ltd. | 11,794 | 207,494 |
| Naspers, Ltd. N Shares | 3,709 | 208,296 |
| Netcare, Ltd. | 14,050 | 26,051 |
| Sasol, Ltd. | 5,061 | 244,327 |
| Shoprite Holdings, Ltd. | 3,494 | 62,509 |
| Standard Bank Group, Ltd. | 13,548 | 196,585 |
| Tiger Brands, Ltd. | 1,617 | 56,715 |
| Total South Africa | | 1,530,629 |
| TOTAL INVESTMENTS IN SECURITIES—99.7% | |
| (Cost: $14,793,350) | | 13,942,596 |
| Other Assets in Excess of Liabilities—0.3% | | 43,202 |
| Net Assets—100.0% | | $ | 13,985,798 |
| † | | The Consolidated Schedule of Investments includes the accounts of the wholly owned subsidiary. All inter-company accounts and transactions have been eliminated in consolidation. See Note 2 of the Notes to Financial Statements. |
| * | | Non-income producing security |
| ADR | | American Depositary Receipts |
| GDR | | Global Depositary Receipts |
| 144A | | Series 144A securities were purchased pursuant to Rule 144A under the Securities Act of 1933 and may not be resold subject to that rule except to qualified institutional buyers. Unless otherwise noted, Series 144A securities are deemed to be liquid. |
| Summary by Industry | Value | % of
Net Assets |
| Automobiles | $ | 364,922 | | | 2.6 | % |
| Beverages | | 516,236 | | | 3.7 | |
| Commercial Banks | | 2,456,370 | | | 17.6 | |
| Communications Equipment | | 6,461 | | | 0.1 | |
| Computers & Peripherals | | 44,745 | | | 0.3 | |
| Construction & Engineering | | 245,698 | | | 1.8 | |
| Construction Materials | | 90,788 | | | 0.7 | |
| Diversified Telecommunication Services | | 273,084 | | | 2.0 | |
| Electric Utilities | | 389,536 | | | 2.8 | |
| Electrical Equipment | | 17,591 | | | 0.1 | |
| Food & Staples Retailing | | 604,299 | | | 4.3 | |
| Food Products | | 318,678 | | | 2.3 | |
| Gas Utilities | | 57,972 | | | 0.4 | |
| Health Care Equipment & Supplies | | 58,692 | | | 0.4 | |
| Health Care Providers & Services | | 32,759 | | | 0.2 | |
| Hotels, Restaurants & Leisure | | 123,971 | | | 0.9 | |
| Household Products | | 32,437 | | | 0.2 | |
| Independent Power Producers & Energy Traders | | 88,761 | | | 0.6 | |
| Industrial Conglomerates | | 191,641 | | | 1.4 | |
| Insurance | | 195,946 | | | 1.4 | |
| Internet Software & Services | | 325,272 | | | 2.3 | |
| IT Services | | 397,460 | | | 2.8 | |
| Media | | 345,623 | | | 2.5 | |
| Metals & Mining | | 1,137,286 | | | 8.1 | |
| Multiline Retail | | 117,016 | | | 0.8 | |
| Oil, Gas & Consumable Fuels | | 3,577,806 | | | 25.6 | |
| Pharmaceuticals | | 177,963 | | | 1.3 | |
| Software | | 12,499 | | | 0.1 | |
| Thrifts & Mortgage Finance | | 171,996 | | | 1.2 | |
| Tobacco | | 115,661 | | | 0.8 | |
| Transportation Infrastructure | | 20,093 | | | 0.1 | |
| Wireless Telecommunication Services | | 1,433,334 | | | 10.3 | |
| Total Investments | | 13,942,596 | | | 99.7 | |
| Other Assets in Excess of Liabilities | | 43,202 | | | 0.3 | |
| Net Assets | $ | 13,985,798 | | | 100.0 | % |
The accompanying notes are an integral part of these financial statements.
| 52 EGA Emerging Global Shares Trust |
Schedule of Investments (Consolidated)†
EGShares Basic Materials GEMS ETF
March 31, 2012
| | |
| Investments | Shares | Value |
| COMMON STOCKS—101.5% | | |
| Brazil—18.9% | | |
| Companhia Siderurgica Nacional SA ADR | 6,662 | $ | 63,023 |
| Gerdau SA Preference Shares ADR | 6,913 | 66,572 |
| Vale SA Preference A Shares ADR | 7,518 | 170,583 |
| Total Brazil | | 300,178 |
| Chile—3.0% | | |
| Empresas CMPC SA | 11,231 | 48,143 |
| China—15.8% | | |
| Aluminum Corp. of China, Ltd. Class H ADR | 1,713 | 20,333 |
| China Coal Energy Co., Ltd. Class H | 37,000 | 41,508 |
| China Shenhua Energy Co., Ltd. Class H | 22,000 | 92,800 |
| Jiangxi Copper Co., Ltd. Class H | 13,000 | 29,905 |
| Yanzhou Coal Mining Co., Ltd. Class H ADR | 1,776 | 38,379 |
| Zijin Mining Group Co., Ltd. Class H | 72,000 | 28,563 |
| Total China | | 251,488 |
| India—12.5% | | |
| Coal India, Ltd. | 5,675 | 38,309 |
| Hindalco Industries, Ltd. | 12,316 | 31,283 |
| Jindal Steel & Power, Ltd. | 3,376 | 36,126 |
| Steel Authority of India, Ltd. | 7,814 | 14,456 |
| Sterlite Industries India, Ltd. ADR | 3,275 | 27,968 |
| Tata Steel, Ltd. | 5,505 | 50,976 |
| Total India | | 199,118 |
| Indonesia—3.1% | | |
| Bumi Resources Tbk PT | 190,000 | 48,830 |
| Malaysia—3.0% | | |
| Petronas Chemicals Group BHD | 21,500 | 47,302 |
| Mexico—5.0% | | |
| Grupo Mexico SAB de CV Series B | 25,431 | 80,201 |
| Poland—3.4% | | |
| KGHM Polska Miedz SA | 1,183 | 54,279 |
| | |
| Russia—16.5% | | |
| Evraz PLC* | 3,912 | | 23,095 |
| MMC Norilsk Nickel OJSC ADR | 6,352 | 116,242 |
| Novolipetsk Steel GDR | 1,007 | 20,926 |
| Severstal GDR | 2,028 | 27,013 |
| Uralkali OJSC GDR | 1,995 | 75,231 |
| Total Russia | | 262,507 |
| South Africa—20.3% | | |
| Anglo American Platinum, Ltd. | 533 | 37,086 |
| AngloGold Ashanti, Ltd. ADR | 2,482 | 91,635 |
| Gold Fields, Ltd. ADR* | 5,043 | 70,098 |
| Impala Platinum Holdings, Ltd. | 4,000 | 78,754 |
| Kumba Iron Ore, Ltd. | 653 | 44,760 |
| Total South Africa | | 322,333 |
| TOTAL INVESTMENTS IN SECURITIES—101.5% | |
| (Cost: $1,874,897) | | 1,614,379 |
| Liabilities in Excess of Other Assets—(1.5)% | | (24,379) |
| Net Assets—100.0% | | $ | 1,590,000 |
| † | | The Consolidated Schedule of Investments includes the accounts of the wholly owned subsidiary. All inter-company accounts and transactions have been eliminated in consolidation. See Note 2 of the Notes to Financial Statements. |
| * | | Non-income producing security |
| ADR | | American Depositary Receipts |
| GDR | | Global Depositary Receipts |
| Summary by Industry | Value | % of
Net Assets |
| Chemicals | $ | 122,533 | | | 7.7 | % |
| Metals & Mining | | 1,183,877 | | | 74.5 | |
| Oil, Gas & Consumable Fuels | | 259,826 | | | 16.3 | |
| Paper & Forest Products | | 48,143 | | | 3.0 | |
| Total Investments | | 1,614,379 | | | 101.5 | |
| Liabilities in Excess of Other Assets | | (24,379 | ) | | (1.5 | ) |
| Net Assets | $ | 1,590,000 | | | 100.0 | % |
The accompanying notes are an integral part of these financial statements.
| EGA Emerging Global Shares Trust 53 |
Schedule of Investments (Consolidated)†
EGShares Consumer Goods GEMS ETF
March 31, 2012
| | |
| Investments | Shares | Value |
| COMMON STOCKS—102.1% | | |
| Brazil—17.8% | | |
| BRF—Brasil Foods SA ADR | 3,375 | $ | 67,534 |
| Companhia de Bebidas das Americas Preference | | |
| Shares ADR | 2,800 | 115,696 |
| Gafisa SA ADR | 2,800 | 13,216 |
| Total Brazil | | 196,446 |
| China—9.6% | | |
| China Agri-Industries Holdings, Ltd. | 22,000 | 14,508 |
| Dongfeng Motor Group Co., Ltd. Class H | 24,000 | 43,338 |
| Great Wall Motor Co., Ltd. Class H | 12,500 | 24,311 |
| Guangzhou Automobile Group Co., Ltd. Class H | 24,000 | 23,802 |
| Total China | | 105,959 |
| Colombia—2.5% | | |
| Grupo Nutresa SA | 2,302 | 27,759 |
| India—18.6% | | |
| Bajaj Auto, Ltd. | 1,235 | 40,697 |
| Hero MotoCorp, Ltd. | 767 | 30,943 |
| Hindustan Unilever, Ltd. | 6,505 | 52,358 |
| ITC, Ltd. | 15,714 | 69,987 |
| United Spirits, Ltd. | 1,015 | 12,075 |
| Total India | | 206,060 |
| Indonesia—14.2% | | |
| Astra International Tbk PT | 10,000 | 80,873 |
| Gudang Garam Tbk PT | 5,000 | 30,102 |
| Indofood Sukses Makmur Tbk PT | 38,500 | 20,420 |
| Unilever Indonesia Tbk PT | 11,500 | 25,153 |
| Total Indonesia | | 156,548 |
| Malaysia—11.3% | | |
| British American Tobacco Malaysia BHD | 1,600 | 29,572 |
| IOI Corp. BHD | 22,300 | 38,871 |
| Kuala Lumpur Kepong BHD | 3,800 | 30,514 |
| PPB Group BHD | 4,700 | 25,928 |
| Total Malaysia | | 124,885 |
| Mexico—16.8% | | |
| Coca-Cola Femsa SAB de CV ADR | 255 | 27,007 |
| Fomento Economico Mexicano SAB de CV ADR | 883 | 72,645 |
| Grupo Bimbo SAB de CV Series A | 19,000 | 44,287 |
| Grupo Modelo SAB de CV Series C | 2,800 | 19,606 |
| Kimberly-Clark de Mexico SAB de CV Class A | 9,900 | 21,955 |
| Total Mexico | | 185,500 |
| Philippines—1.9% | | |
| San Miguel Corp. | 7,940 | 21,027 |
| South Africa—3.9% | | |
| Tiger Brands, Ltd. | 1,218 | 42,720 |
| Thailand—3.0% | | |
| Charoen Pokphand Foods Public Co., Ltd. | 27,300 | 32,963 |
| Turkey—2.5% | | |
| Anadolu Efes Biracilik ve Malt Sanayii AS | 1,950 | 27,234 |
| TOTAL INVESTMENTS IN SECURITIES—102.1% | |
| (Cost: $1,006,986) | | 1,127,101 |
| Liabilities in Excess of Other Assets—(2.1)% | | (22,922) |
| Net Assets—100.0% | | $ | 1,104,179 |
| † | | The Consolidated Schedule of Investments includes the accounts of the wholly owned subsidiary. All inter-company accounts and transactions have been eliminated in consolidation. See Note 2 of the Notes to Financial Statements. |
| ADR | | American Depositary Receipts |
| Summary by Industry | Value | % of
Net Assets |
| Automobiles | $ | 243,964 | | | 22.1 | % |
| Beverages | | 295,288 | | | 26.8 | |
| Food Products | | 345,506 | | | 31.3 | |
| Household Durables | | 13,216 | | | 1.2 | |
| Household Products | | 99,466 | | | 9.0 | |
| Tobacco | | 129,661 | | | 11.7 | |
| Total Investments | | 1,127,101 | | | 102.1 | |
| Liabilities in Excess of Other Assets | | (22,922 | ) | | (2.1 | ) |
| Net Assets | $ | 1,104,179 | | | 100.0 | % |
The accompanying notes are an integral part of these financial statements.
| 54 EGA Emerging Global Shares Trust |
Schedule of Investments
EGShares Consumer Services GEMS ETF
March 31, 2012
| | |
| Investments | Shares | Value |
| COMMON STOCKS—104.2% | | |
| Brazil—5.7% | | |
| Companhia Brasileira de Distribuicao Grupo Pao | | |
| de Acucar Preference Shares ADR | 914 | $ | 43,524 |
| Tam SA Preference Shares ADR | 629 | 15,807 |
| Total Brazil | | 59,331 |
| Chile—16.0% | | |
| Cencosud SA | 10,223 | 67,730 |
| Lan Airlines SA ADR | 1,179 | 34,297 |
| S.A.C.I. Falabella | 6,759 | 65,300 |
| Total Chile | | 167,327 |
| China—8.6% | | |
| Air China, Ltd. Class H | 18,000 | 12,473 |
| China Resources Enterprise, Ltd. | 8,000 | 27,924 |
| Ctrip.com International, Ltd. ADR* | 1,063 | 23,003 |
| New Oriental Education & Technology Group, Ltd. ADR* | 964 | 26,471 |
| Total China | | 89,871 |
| Colombia—2.4% | | |
| Almacenes Exito SA | 1,694 | 24,483 |
| Malaysia—8.9% | | |
| AirAsia BHD | 14,500 | 16,329 |
| Genting BHD | 13,800 | 48,831 |
| Genting Malaysia BHD | 21,600 | 27,639 |
| Total Malaysia | | 92,799 |
| Mexico—22.6% | | |
| Grupo Elektra SA de CV | 530 | 49,482 |
| Grupo Televisa SAB ADR | 3,541 | 74,644 |
| TV Azteca SAB de CV Series CPO | 17,000 | 10,656 |
| Wal-Mart de Mexico SAB de CV Series V | 30,200 | 101,205 |
| Total Mexico | | 235,987 |
| Philippines—2.4% | | |
| SM Investments Corp. | 1,620 | 24,903 |
| Russia—5.7% | | |
| Magnit OJSC GDR | 1,582 | 46,099 |
| X5 Retail Group NV GDR* | 590 | 13,535 |
| Total Russia | | 59,634 |
| South Africa—25.8% | | |
| Massmart Holdings, Ltd. | 756 | 15,952 |
| Naspers, Ltd. N Shares | 2,022 | 113,555 |
| Pick n Pay Stores, Ltd. | 1,474 | 8,355 |
| Shoprite Holdings, Ltd. | 2,430 | 43,473 |
| Steinhoff International Holdings, Ltd. | 7,787 | 27,903 |
| Truworths International, Ltd. | 2,704 | 28,454 |
| Woolworths Holdings, Ltd. | 4,974 | 31,207 |
| Total South Africa | | 268,899 |
| Thailand—3.3% | | |
| CP ALL PCL | 16,200 | 34,395 |
| Turkey—2.8% | | |
| BIM Birlesik Magazalar AS | 772 | 29,228 |
| TOTAL INVESTMENTS IN SECURITIES—104.2% | |
| (Cost: $1,064,220) | | 1,086,857 |
| Liabilities in Excess of Other Assets—(4.2)% | | (43,318) |
| Net Assets—100.0% | | $ | 1,043,539 |
| * | | Non-income producing security |
| ADR | | American Depositary Receipts |
| GDR | | Global Depositary Receipts |
| Summary by Industry | Value | % of
Net Assets |
| Airlines | $ | 78,906 | | | 7.6 | % |
| Diversified Consumer Services | | 26,471 | | | 2.5 | |
| Food & Staples Retailing | | 455,903 | | | 43.7 | |
| Hotels, Restaurants & Leisure | | 99,473 | | | 9.5 | |
| Household Durables | | 27,903 | | | 2.7 | |
| Industrial Conglomerates | | 24,903 | | | 2.4 | |
| Media | | 198,855 | | | 19.1 | |
| Multiline Retail | | 96,507 | | | 9.2 | |
| Specialty Retail | | 77,936 | | | 7.5 | |
| Total Investments | | 1,086,857 | | | 104.2 | |
| Liabilities in Excess of Other Assets | | (43,318 | ) | | (4.2 | ) |
| Net Assets | $ | 1,043,539 | | | 100.0 | % |
The accompanying notes are an integral part of these financial statements.
| EGA Emerging Global Shares Trust 55 |
Schedule of Investments (Consolidated)†
EGShares Energy GEMS ETF
March 31, 2012
| Investments | Shares | Value |
| COMMON STOCKS—100.0% | | |
| Brazil—7.1% | | |
| Petroleo Brasileiro SA ADR | 30,163 | $ | 801,129 |
| Chile—3.2% | | |
| Empresas Copec SA | 21,548 | 359,798 |
| China—19.9% | | |
| China Oilfield Services, Ltd. Class H | 79,655 | 114,291 |
| China Petroleum & Chemical Corp. Class H | 456,066 | 496,950 |
| CNOOC, Ltd. | 320,800 | 659,450 |
| Kunlun Energy Co., Ltd. | 131,340 | 236,832 |
| PetroChina Co., Ltd. Class H | 471,000 | 666,097 |
| Suntech Power Holdings Co., Ltd. ADR* | 20,154 | 61,671 |
| Total China | | 2,235,291 |
| Colombia—3.9% | | |
| Ecopetrol SA ADR | 7,111 | 434,411 |
| Hungary—1.7% | | |
| MOL Hungarian Oil and Gas PLC* | 2,296 | 190,746 |
| India—14.4% | | |
| Bharat Petroleum Corp., Ltd. | 11,942 | 164,145 |
| Cairn India, Ltd.* | 30,221 | 198,072 |
| GAIL India, Ltd. | 28,210 | 208,343 |
| Indian Oil Corp., Ltd. | 32,951 | 169,913 |
| Oil & Natural Gas Corp., Ltd. | 77,427 | 407,843 |
| Reliance Industries, Ltd. GDR 144A | 16,089 | 468,994 |
| Total India | | 1,617,310 |
| Poland—2.8% | | |
| Polski Koncern Naftowy Orlen SA* | 16,846 | 201,744 |
| Polskie Gornictwo Naftowe i Gazownictwo SA | 84,636 | 109,635 |
| Total Poland | | 311,379 |
| Russia—35.0% | | |
| Gazprom Neft JSC ADR | 4,931 | 131,608 |
| Gazprom OAO ADR | 91,778 | 1,119,692 |
| LUKOIL OAO ADR | 12,227 | 736,065 |
| NovaTek OAO GDR | 3,828 | 518,694 |
| Rosneft Oil Co. OJSC GDR | 55,544 | 393,252 |
| Surgutneftegas ADR | 69,085 | 675,651 |
| Tatneft ADR | 8,503 | 346,923 |
| Total Russia | | 3,921,885 |
| South Africa—4.2% | | |
| Sasol, Ltd. | 9,793 | 472,771 |
| Thailand—6.1% | | |
| PTT Exploration & Production PCL | 39,465 | 223,230 |
| PTT PCL | 27,189 | 311,991 |
| Thai Oil PCL | 62,186 | 146,142 |
| Total Thailand | | 681,363 |
| Turkey—1.7% | | |
| Tupras-Turkiye Petrol Rafinerileri AS | 7,607 | 194,132 |
| TOTAL INVESTMENTS IN SECURITIES—100.0% | |
| (Cost: $12,388,700) | | 11,220,215 |
| Liabilities in Excess of Other Assets—(0.0)%** | | (3,428) |
| Net Assets—100.0% | | $ | 11,216,787 |
| † | | The Consolidated Schedule of Investments includes the accounts of the wholly owned subsidiary. All inter-company accounts and transactions have been eliminated in consolidation. See Note 2 of the Notes to Financial Statements. |
| * | | Non-income producing security |
| ADR | | American Depositary Receipts |
| GDR | | Global Depositary Receipts |
| 144A | | Series 144A securities were purchased pursuant to Rule 144A under the Securities Act of 1933 and may not be resold subject to that rule except to qualified institutional buyers. Unless otherwise noted, Series 144A securities are deemed to be liquid. |
| Summary by Industry | Value | % of
Net Assets |
| Energy Equipment & Services | $ | 114,291 | | | 1.0 | % |
| Gas Utilities | | 208,343 | | | 1.9 | |
| Industrial Conglomerates | | 359,798 | | | 3.2 | |
| Oil, Gas & Consumable Fuels | | 10,476,112 | | | 93.4 | |
| Semiconductors & Semiconductor Equipment | | 61,671 | | | 0.5 | |
| Total Investments | | 11,220,215 | | | 100.0 | |
| Liabilities in Excess of Other Assets | | (3,428 | ) | | (0.0 | )** |
| Net Assets | $ | 11,216,787 | | | 100.0 | % |
The accompanying notes are an integral part of these financial statements.
| 56 EGA Emerging Global Shares Trust |
Schedule of Investments (Consolidated)†
EGShares Financials GEMS ETF
March 31, 2012
| Investments | Shares | Value |
| COMMON STOCKS—100.2% | | |
| Brazil—17.6% | | |
| Banco Bradesco SA Preference Shares ADR | 16,778 | $ | 293,615 |
| Banco Santander Brasil SA ADS | 5,021 | 46,043 |
| Itau Unibanco Holding SA Preference Shares ADR | 19,124 | 366,989 |
| Total Brazil | | 706,647 |
| China—39.5% | | |
| Agricultural Bank of China, Ltd. Class H | 211,000 | 90,498 |
| Bank of China, Ltd. Class H | 453,079 | 182,656 |
| Bank of Communications Co., Ltd. Class H | 59,580 | 45,046 |
| BOC Hong Kong Holdings, Ltd. | 34,700 | 95,867 |
| China Construction Bank Corp. Class H | 466,100 | 360,201 |
| China Life Insurance Co., Ltd. Class H | 66,060 | 171,446 |
| China Merchants Bank Co., Ltd. Class H | 37,275 | 76,240 |
| China Overseas Land & Investment, Ltd. | 32,000 | 60,835 |
| Industrial and Commercial Bank of China, Ltd. Class H | 609,240 | 393,134 |
| Ping An Insurance Group Co. of China, Ltd. Class H | 14,800 | 111,896 |
| Total China | | 1,587,819 |
| India—12.6% | | |
| HDFC Bank, Ltd. ADR | 4,605 | 157,030 |
| Housing Development Finance Corp., Ltd. | 12,991 | 171,692 |
| ICICI Bank, Ltd. ADR | 3,785 | 131,983 |
| State Bank of India GDR | 581 | 47,787 |
| Total India | | 508,492 |
| Indonesia—2.5% | | |
| Bank Central Asia Tbk PT | 116,500 | 101,925 |
| Malaysia—4.5% | | |
| CIMB Group Holdings BHD | 40,100 | 100,659 |
| Malayan Banking BHD | 28,500 | 82,518 |
| Total Malaysia | | 183,177 |
| Poland—2.9% | | |
| Bank Pekao SA | 1,059 | 52,631 |
| Powszechna Kasa Oszczednosci Bank Polski SA | 6,002 | 64,662 |
| Total Poland | | 117,293 |
| Russia—7.3% | | |
| Sberbank of Russia ADR* | 18,636 | 239,286 |
| VTB Bank OJSC GDR | 11,846 | 53,426 |
| Total Russia | | 292,712 |
| South Africa—9.5% | | |
| ABSA Group, Ltd. | 3,156 | 64,152 |
| FirstRand, Ltd. | 23,267 | 71,851 |
| Sanlam, Ltd. | 16,821 | 72,724 |
| Standard Bank Group, Ltd. | 11,869 | 172,223 |
| Total South Africa | | 380,950 |
| Turkey—3.8% | | |
| Akbank TAS* | 16,604 | 65,192 |
| Turkiye Garanti Bankasi AS | 22,008 | 87,148 |
| Total Turkey | | 152,340 |
| TOTAL INVESTMENTS IN SECURITIES—100.2% | |
| (Cost: $4,543,803) | | 4,031,355 |
| Liabilities in Excess of Other Assets—(0.2)% | | (9,715 | ) |
| Net Assets—100.0% | | $ | 4,021,640 |
| † | | The Consolidated Schedule of Investments includes the accounts of the wholly owned subsidiary. All inter-company accounts and transactions have been eliminated in consolidation. See Note 2 of the Notes to Financial Statements. |
| * | | Non-income producing security |
| ADR | | American Depositary Receipts |
| ADS | | American Depositary Shares |
| GDR | | Global Depositary Receipts |
| Summary by Industry | Value | % of
Net Assets |
| Commercial Banks | $ | 3,370,911 | | | 83.8 | % |
| Diversified Financial Services | | 71,851 | | | 1.8 | |
| Insurance | | 356,066 | | | 8.8 | |
| Real Estate Management & Development | | 60,835 | | | 1.5 | |
| Thrifts & Mortgage Finance | | 171,692 | | | 4.3 | |
| Total Investments | | 4,031,355 | | | 100.2 | |
| Liabilities in Excess of Other Assets | | (9,715 | ) | | (0.2 | ) |
| Net Assets | $ | 4,021,640 | | | 100.0 | % |
The accompanying notes are an integral part of these financial statements.
| EGA Emerging Global Shares Trust 57 |
Schedule of Investments (Consolidated)†
EGShares Health Care GEMS ETF
March 31, 2012
| Investments | Shares | Value |
| COMMON STOCKS—101.4% | | |
| Chile—1.4% | | |
| Banmedica SA | 14,396 | $ | 25,805 |
| China—19.6% | | |
| China Pharmaceutical Group, Ltd. | 28,000 | 6,419 |
| Mindray Medical International, Ltd. ADR | 3,623 | 119,450 |
| Shandong Weigao Group Medical Polymer Co., Ltd. | | |
| Class H | 60,000 | 68,547 |
| Shanghai Pharmaceuticals Holding Co., Ltd. Class H* | 26,500 | 42,460 |
| Sinopharm Group Co. Class H | 32,400 | 90,557 |
| WuXi PharmaTech Cayman, Inc. ADR* | 3,243 | 46,699 |
| Total China | | 374,132 |
| Hungary—5.3% | | |
| EGIS Pharmaceuticals PLC | 159 | 10,517 |
| Richter Gedeon Nyrt | 532 | 90,965 |
| Total Hungary | | 101,482 |
| India—37.1% | | |
| Apollo Hospitals Enterprise, Ltd. | 4,559 | 57,165 |
| Aurobindo Pharma, Ltd. | 5,292 | 12,361 |
| Biocon, Ltd. | 4,572 | 21,449 |
| Cipla, Ltd. | 20,859 | 124,921 |
| Divi’s Laboratories, Ltd. | 2,628 | 39,517 |
| Dr. Reddy’s Laboratories, Ltd. ADR | 4,765 | 164,678 |
| Glenmark Pharmaceuticals, Ltd. | 6,748 | 40,982 |
| Piramal Healthcare, Ltd. | 3,333 | 30,841 |
| Ranbaxy Laboratories, Ltd. | 6,465 | 59,568 |
| Sun Pharmaceutical Industries, Ltd. | 14,073 | 157,442 |
| Total India | | 708,924 |
| Indonesia—3.6% | | |
| Kalbe Farma Tbk PT | 177,000 | 68,717 |
| Malaysia—1.2% | | |
| Top Glove Corp. BHD | 15,700 | 23,062 |
| Mexico—1.9% | | |
| Genomma Lab Internacional SAB de CV Class B* | 20,400 | 37,263 |
| Russia—3.0% | | |
| Pharmstandard OJSC GDR* | 3,192 | 56,626 |
| South Africa—25.2% | | |
| Adcock Ingram Holdings, Ltd.* | 6,556 | 50,144 |
| Aspen Pharmacare Holdings, Ltd.* | 13,450 | 207,712 |
| Life Healthcare Group Holdings, Ltd. | 17,512 | 57,046 |
| Mediclinic International, Ltd. | 16,592 | 81,073 |
| Netcare, Ltd. | 45,735 | 84,801 |
| Total South Africa | | 480,776 |
| Thailand—3.1% | | |
| Bangkok Dusit Medical Services PCL | 12,000 | 33,744 |
| Bumrungrad Hospital PCL | 14,500 | 25,146 |
| Total Thailand | | 58,890 |
| TOTAL INVESTMENTS IN SECURITIES—101.4% | |
| (Cost: $1,933,186) | | 1,935,677 |
| Liabilities in Excess of Other Assets—(1.4)% | | (26,975 | ) |
| Net Assets—100.0% | | $ | 1,908,702 |
| † | | The Consolidated Schedule of Investments includes the accounts of the wholly owned subsidiary. All inter-company accounts and transactions have been eliminated in consolidation. See Note 2 of the Notes to Financial Statements. |
| * | | Non-income producing security |
| ADR | | American Depositary Receipts |
| GDR | | Global Depositary Receipts |
| Summary by Industry | Value | % of
Net Assets |
| Biotechnology | $ | 21,449 | | | 1.1 | % |
| Health Care Equipment & Supplies | | 211,059 | | | 11.1 | |
| Health Care Providers & Services | | 497,796 | | | 26.1 | |
| Life Sciences Tools & Services | | 86,216 | | | 4.5 | |
| Pharmaceuticals | | 1,119,157 | | | 58.6 | |
| Total Investments | | 1,935,677 | | | 101.4 | |
| Liabilities in Excess of Other Assets | | (26,975 | ) | | (1.4 | ) |
| Net Assets | $ | 1,908,702 | | | 100.0 | % |
The accompanying notes are an integral part of these financial statements.
| 58 EGA Emerging Global Shares Trust |
Schedule of Investments (Consolidated)†
EGShares Industrials GEMS ETF
March 31, 2012
| Investments | Shares | Value |
| COMMON STOCKS—101.3% | | |
| Brazil—3.7% | | |
| Embraer SA ADR | 2,165 | $ | 69,237 |
| China—25.5% | | |
| Anhui Conch Cement Co., Ltd. Class H | 16,500 | 52,280 |
| Beijing Enterprises Holdings, Ltd. | 7,500 | 45,740 |
| BYD Co., Ltd. Class H* | 13,000 | 36,334 |
| China Communications Construction Co., Ltd. Class H | 73,000 | 73,244 |
| China COSCO Holdings Co., Ltd. Class H | 42,500 | 26,877 |
| China Merchants Holdings International Co., Ltd. | 16,000 | 53,581 |
| China National Building Material Co., Ltd. Class H | 46,000 | 58,004 |
| China Railway Construction Corp., Ltd. Class H | 51,000 | 31,727 |
| China Railway Group, Ltd. Class H | 101,000 | 32,392 |
| Citic Pacific, Ltd. | 19,000 | 32,009 |
| Weichai Power Co., Ltd. Class H | 8,000 | 37,352 |
| Total China | | 479,540 |
| Colombia—2.8% | | |
| Inversiones Argos SA | 5,629 | 53,401 |
| Egypt—3.0% | | |
| Orascom Construction Industries | 1,314 | 56,604 |
| India—30.6% | | |
| Adani Enterprises, Ltd. | 4,969 | 29,734 |
| Ambuja Cements, Ltd. | 15,799 | 53,403 |
| Bharat Heavy Electricals, Ltd. | 11,131 | 56,185 |
| Jaiprakash Associates, Ltd. | 24,711 | 39,629 |
| Larsen & Toubro, Ltd. | 6,917 | 177,728 |
| Mahindra & Mahindra, Ltd. | 6,622 | 91,014 |
| Tata Motors, Ltd. ADR | 4,668 | 125,896 |
| Total India | | 573,589 |
| Indonesia—8.9% | | |
| Semen Gresik Persero Tbk PT | 56,000 | 75,022 |
| United Tractors Tbk PT | 25,500 | 92,028 |
| Total Indonesia | | 167,050 |
| Malaysia—7.1% | | |
| MISC BHD | 17,900 | 31,435 |
| Sime Darby BHD | 32,100 | 102,058 |
| Total Malaysia | | 133,493 |
| Mexico—8.2% | | |
| Cemex SAB de CV ADR* | 14,878 | 115,453 |
| Grupo Carso SAB de CV Series A1 | 12,500 | 39,128 |
| Total Mexico | | 154,581 |
| South Africa—8.6% | | |
| Bidvest Group, Ltd. | 4,072 | 95,372 |
| Imperial Holdings, Ltd. | 3,238 | 65,397 |
| Total South Africa | | 160,769 |
| Thailand—2.9% | | |
| Siam Cement PCL | 4,700 | 54,084 |
| TOTAL INVESTMENTS IN SECURITIES—101.3% | |
| (Cost: $1,957,706) | | 1,902,348 |
| Liabilities in Excess of Other Assets—(1.3)% | | (24,597 | ) |
| Net Assets—100.0% | | $ | 1,877,751 |
| † | | The Consolidated Schedule of Investments includes the accounts of the wholly owned subsidiary. All inter-company accounts and transactions have been eliminated in consolidation. See Note 2 of the Notes to Financial Statements. |
| * | | Non-income producing security |
| ADR | | American Depositary Receipts |
| Summary by Industry | Value | % of
Net Assets |
| Aerospace & Defense | $ | 69,237 | | | 3.7 | % |
| Automobiles | | 253,245 | | | 13.5 | |
| Construction & Engineering | | 371,696 | | | 19.8 | |
| Construction Materials | | 461,646 | | | 24.6 | |
| Distributors | | 65,397 | | | 3.5 | |
| Electrical Equipment | | 56,185 | | | 3.0 | |
| Industrial Conglomerates | | 353,936 | | | 18.8 | |
| Machinery | | 129,379 | | | 6.9 | |
| Marine | | 58,312 | | | 3.1 | |
| Trading Companies & Distributors | | 29,734 | | | 1.6 | |
| Transportation Infrastructure | | 53,581 | | | 2.8 | |
| Total Investments | | 1,902,348 | | | 101.3 | |
| Liabilities in Excess of Other Assets | | (24,597 | ) | | (1.3 | ) |
| Net Assets | $ | 1,877,751 | | | 100.0 | % |
The accompanying notes are an integral part of these financial statements.
| EGA Emerging Global Shares Trust 59 |
Schedule of Investments (Consolidated)†
EGShares Technology GEMS ETF
March 31, 2012
| Investments | Shares | Value |
| COMMON STOCKS—101.6% | | |
| Chile—3.1% | | |
| Sonda SA | 19,782 | $ | 58,963 |
| China—46.7% | | |
| AsiaInfo-Linkage, Inc.* | 4,010 | 50,526 |
| Baidu, Inc. ADR* | 1,204 | 175,507 |
| China Communications Services Corp., Ltd. Class H | 116,000 | 56,028 |
| Lenovo Group, Ltd. | 122,000 | 109,838 |
| NetEase.com, Inc. ADR* | 1,785 | 103,708 |
| SINA Corp.* | 1,468 | 95,420 |
| Sohu.com, Inc.* | 1,371 | 75,638 |
| Spreadtrum Communications, Inc. ADR | 3,055 | 50,408 |
| TCL Communication Technology Holdings, Ltd. | 49,000 | 21,900 |
| Travelsky Technology, Ltd. Class H | 68,000 | 35,647 |
| VanceInfo Technologies, Inc. ADR* | 3,607 | 43,428 |
| ZTE Corp. Class H | 23,800 | 64,067 |
| Total China | | 882,115 |
| India—40.6% | | |
| 3i Infotech, Ltd. | 64,965 | 19,702 |
| Financial Technologies India, Ltd. | 2,387 | 32,060 |
| GTL, Ltd.* | 25,767 | 21,041 |
| Infosys, Ltd. ADR | 3,360 | 191,621 |
| Mphasis, Ltd. | 6,184 | 49,174 |
| Oracle Financial Sevices Software, Ltd.* | 1,020 | 52,463 |
| Patni Computer Systems, Ltd. ADR* | 2,158 | 40,743 |
| Rolta India, Ltd. | 16,212 | 29,881 |
| Satyam Computer Services, Ltd.* | 37,587 | 59,466 |
| Sterling International Enterprises, Ltd.* | 66,112 | 12,263 |
| Tata Consultancy Services, Ltd. | 5,432 | 124,623 |
| Tech Mahindra, Ltd. | 2,684 | 37,972 |
| Wipro, Ltd. ADR | 8,649 | 95,139 |
| Total India | | 766,148 |
| Poland—3.2% | | |
| Asseco Poland SA | 3,781 | 60,434 |
| Russia—3.7% | | |
| Mail.ru Group, Ltd. GDR* | 1,783 | 70,339 |
| South Africa—2.7% | | |
| DataTec, Ltd. | 8,853 | 50,756 |
| Turkey—1.6% | | |
| Aselsan Elektronik Sanayi Ve Ticaret AS | 5,152 | 30,631 |
| TOTAL INVESTMENTS IN SECURITIES—101.6% | |
| (Cost: $1,916,685) | | 1,919,386 |
| Liabilities in Excess of Other Assets—(1.6)% | | (30,986) |
| Net Assets—100.0% | | $ | 1,888,400 |
| † | | The Consolidated Schedule of Investments includes the accounts of the wholly owned subsidiary. All inter-company accounts and transactions have been eliminated in consolidation. See Note 2 of the Notes to Financial Statements. |
| * | | Non-income producing security |
| ADR | | American Depositary Receipts |
| GDR | | Global Depositary Receipts |
| Summary by Industry | Value | % of
Net Assets |
| Aerospace & Defense | $ | 30,631 | | | 1.6 | % |
| Communications Equipment | | 85,967 | | | 4.5 | |
| Computers & Peripherals | | 109,838 | | | 5.8 | |
| Diversified Telecommunication Services | | 56,028 | | | 3.0 | |
| Electronic Equipment, Instruments & Components | | 50,756 | | | 2.7 | |
| Energy Equipment & Services | | 12,263 | | | 0.6 | |
| Internet Software & Services | | 520,613 | | | 27.6 | |
| IT Services | | 744,269 | | | 39.4 | |
| Semiconductors & Semiconductor Equipment | | 50,408 | | | 2.7 | |
| Software | | 258,613 | | | 13.7 | |
| Total Investments | | 1,919,386 | | | 101.6 | |
| Liabilities in Excess of Other Assets | | (30,986 | ) | | (1.6 | ) |
| Net Assets | $ | 1,888,400 | | | 100.0 | % |
The accompanying notes are an integral part of these financial statements.
| 60 EGA Emerging Global Shares Trust |
Schedule of Investments (Consolidated)†
EGShares Telecom GEMS ETF
March 31, 2012
| Investments | Shares | Value |
| COMMON STOCKS—100.2% | | |
| Brazil—12.1% | | |
| Oi SA ADR | 2,749 | $ | 43,709 |
| Tele Norte Leste Participacoes SA Preference Shares ADR 6,434 | 73,026 |
| Telefonica Brasil SA Preference Shares ADR | 4,425 | 135,538 |
| Tim Participacoes SA ADR | 3,518 | 113,491 |
| Total Brazil | | 365,764 |
| China—17.9% | | |
| China Mobile, Ltd. | 28,000 | 308,166 |
| China Telecom Corp., Ltd. Class H | 216,000 | 119,629 |
| China Unicom Hong Kong, Ltd. ADR | 6,887 | 115,702 |
| Total China | | 543,497 |
| Egypt—1.7% | | |
| Orascom Telecom Holding SAE* | 75,228 | 50,941 |
| Hungary—1.3% | | |
| Magyar Telekom Telecommunications PLC | 14,650 | 38,232 |
| India—5.5% | | |
| Bharti Airtel, Ltd. | 19,425 | 128,839 |
| Reliance Communications, Ltd. | 22,579 | 37,251 |
| Total India | | 166,090 |
| Indonesia—3.9% | | |
| Telekomunikasi Indonesia Tbk PT ADR | 3,955 | 120,074 |
| Malaysia—11.5% | | |
| Axiata Group BHD | 59,600 | 101,165 |
| DiGi.Com BHD | 62,300 | 82,565 |
| Maxis BHD | 44,400 | 88,264 |
| Telekom Malaysia BHD | 44,400 | 77,104 |
| Total Malaysia | | 349,098 |
| Mexico—10.7% | | |
| America Movil SAB de CV Series L ADR | 11,662 | 289,567 |
| Telefonos de Mexico SAB de CV Class L | 44,400 | 35,214 |
| Total Mexico | | 324,781 |
| Morocco—2.2% | | |
| Maroc Telecom | 4,212 | 68,334 |
| Philippines—3.5% | | |
| Philippine Long Distance Telephone Co. ADR | 1,697 | 105,536 |
| Poland—2.7% | | |
| Telekomunikacja Polska SA | 14,852 | 81,384 |
| Russia—7.2% | | |
| Mobile TeleSystems ADR | 7,524 | 137,990 |
| VimpelCom, Ltd. ADR | 7,307 | 81,546 |
| Total Russia | | 219,536 |
| South Africa—11.2% | | |
| MTN Group, Ltd. | 11,752 | 206,756 |
| Telkom South Africa, Ltd. | 13,176 | 41,204 |
| Vodacom Group, Ltd. | 6,477 | 91,274 |
| Total South Africa | | 339,234 |
| Thailand—3.9% | | |
| Advanced Info Service PCL | 19,700 | 117,498 |
| Turkey—4.9% | | |
| Turk Telekomunikasyon AS | 16,020 | 69,547 |
| Turkcell Iletisim Hizmetleri AS ADR* | 6,227 | 78,460 |
| Total Turkey | | 148,007 |
| TOTAL INVESTMENTS IN SECURITIES—100.2% | |
| (Cost: $3,014,689) | | 3,038,006 |
| Liabilities in Excess of Other Assets—(0.2)% | | (6,333) |
| Net Assets—100.0% | | $ | 3,031,673 |
| † | | The Consolidated Schedule of Investments includes the accounts of the wholly owned subsidiary. All inter-company accounts and transactions have been eliminated in consolidation. See Note 2 of the Notes to Financial Statements. |
| * | | Non-income producing security |
| ADR | | American Depositary Receipts |
| Summary by Industry | Value | % of
Net Assets |
| Diversified Telecommunication Services | $ | 1,018,697 | | | 33.6 | % |
| Wireless Telecommunication Services | | 2,019,309 | | | 66.6 | |
| Total Investments | | 3,038,006 | | | 100.2 | |
| Liabilities in Excess of Other Assets | | (6,333 | ) | | (0.2 | ) |
| Net Assets | $ | 3,031,673 | | | 100.0 | % |
The accompanying notes are an integral part of these financial statements.
| EGA Emerging Global Shares Trust 61 |
Schedule of Investments (Consolidated)†
EGShares Utilities GEMS ETF
March 31, 2012
| | |
| Investments | Shares | Value |
| COMMON STOCKS—100.8% | | |
| Brazil—30.8% | | |
| Centrais Eletricas Brasileiras SA ADR | 10,270 | $ | 96,127 |
| Companhia de Saneamento Basico do Estado de | | |
| Sao Paulo ADR | 1,695 | 129,871 |
| Companhia Energetica de Minas Gerais Preference | | |
| Shares ADR | 10,731 | 255,183 |
| Companhia Paranaense de Energia-Copel Preference | | |
| Shares ADR | 3,010 | 70,765 |
| CPFL Energia SA ADR | 1,741 | 52,665 |
| Ultrapar Participacoes SA ADR | 11,643 | 252,537 |
| Total Brazil | | 857,148 |
| Chile—14.8% | | |
| Colbun SA | 193,692 | 55,348 |
| Companhia General de Electricidad SA | 7,781 | 40,776 |
| Empresa Nacional de Electricidad SA ADR | 3,146 | 169,821 |
| Enersis SA ADR | 7,277 | 146,923 |
| Total Chile | | 412,868 |
| China—5.6% | | |
| China Resources Power Holdings Co., Ltd. | 44,000 | 81,494 |
| Datang International Power Generation Co., Ltd. Class H | 84,000 | 29,644 |
| Huaneng Power International, Inc. ADR | 2,063 | 45,221 |
| Total China | | 156,359 |
| Colombia—2.4% | | |
| Interconexion Electrica SA ESP | 10,492 | 66,006 |
| Czech Republic—7.1% | | |
| CEZ AS | 4,653 | 199,022 |
| India—14.8% | | |
| NTPC, Ltd. | 33,461 | 106,895 |
| Petronet LNG, Ltd. | 9,855 | 32,508 |
| Power Grid Corp. of India, Ltd. | 44,055 | 93,523 |
| Reliance Infrastructure, Ltd. | 4,065 | 46,858 |
| Rural Electrification Corp., Ltd. | 7,525 | 30,339 |
| Tata Power Co., Ltd. | 52,189 | 103,415 |
| Total India | | 413,538 |
| Indonesia—4.9% | | |
| Perusahaan Gas Negara PT | 328,500 | 136,516 |
| Malaysia—8.1% | | |
| Tenaga Nasional BHD | 65,400 | 137,268 |
| YTL Corp. BHD | 87,600 | 51,185 |
| YTL Power International BHD | 59,400 | 35,871 |
| Total Malaysia | | 224,324 |
| Philippines—3.2% | | |
| Aboitiz Power Corp. | 49,300 | 38,926 |
| Manila Electric Co. | 8,380 | 51,137 |
| Total Philippines | | 90,063 |
| Poland—4.9% | | |
| PGE SA | 15,158 | 93,753 |
| Tauron Polska Energia SA | 26,824 | 43,692 |
| Total Poland | | 137,445 |
| Russia—4.2% | | |
| Federal Hydrogenerating Co. JSC ADR | 31,957 | 117,154 |
| TOTAL INVESTMENTS IN SECURITIES—100.8% | |
| (Cost: $2,682,718) | | 2,810,443 |
| Liabilities in Excess of Other Assets—(0.8)% | | (22,308) |
| Net Assets—100.0% | | $ | 2,788,135 |
| † | | The Consolidated Schedule of Investments includes the accounts of the wholly owned subsidiary. All inter-company accounts and transactions have been eliminated in consolidation. See Note 2 of the Notes to Financial Statements. |
| ADR | | American Depositary Receipts |
| Summary by Industry | Value | % of
Net Assets |
| Diversified Financial Services | $ | 30,339 | | | 1.1 | % |
| Electric Utilities | | 1,614,268 | | | 57.9 | |
| Gas Utilities | | 136,516 | | | 4.9 | |
| Independent Power Producers & Energy Traders | | 527,349 | | | 18.9 | |
| Multi-Utilities | | 87,055 | | | 3.1 | |
| Oil, Gas & Consumable Fuels | | 285,045 | | | 10.2 | |
| Water Utilities | | 129,871 | | | 4.7 | |
| Total Investments | | 2,810,443 | | | 100.8 | |
| Liabilities in Excess of Other Assets | | (22,308 | ) | | (0.8 | ) |
| Net Assets | $ | 2,788,135 | | | 100.0 | % |
The accompanying notes are an integral part of these financial statements.
| 62 EGA Emerging Global Shares Trust |
Schedule of Investments (Condolidated)†
EGShares Emerging Markets Metals & Mining ETF
March 31, 2012
| | |
| Investments | Shares | Value |
| COMMON STOCKS—99.9% | | |
| Brazil—18.8% | | |
| Companhia Siderurgica Nacional SA ADR | 58,217 | $ | 550,733 |
| Gerdau SA Preference Shares ADR | 66,899 | 644,237 |
| Vale SA ADR | 64,862 | 1,513,230 |
| Total Brazil | | 2,708,200 |
| China—16.2% | | |
| Aluminum Corp. of China, Ltd. Class H | 385,564 | 185,730 |
| China Coal Energy Co., Ltd. Class H | 335,267 | 376,117 |
| China Shenhua Energy Co., Ltd. Class H | 212,019 | 894,336 |
| Jiangxi Copper Co., Ltd. Class H | 138,641 | 318,924 |
| Yanzhou Coal Mining Co., Ltd. Class H | 160,720 | 348,599 |
| Zijin Mining Group Co., Ltd. Class H | 514,900 | 204,262 |
| Total China | | 2,327,968 |
| India—15.5% | | |
| Coal India, Ltd. | 56,731 | 382,958 |
| Hindalco Industries, Ltd. | 126,752 | 321,949 |
| Jindal Steel & Power, Ltd. | 35,850 | 383,622 |
| JSW Steel Ltd. | 11,755 | 166,467 |
| Steel Authority of India, Ltd. | 59,438 | 109,962 |
| Sterlite Industries India, Ltd. ADR | 38,858 | 331,847 |
| Tata Steel, Ltd. | 56,892 | 526,819 |
| Total India | | 2,223,624 |
| Indonesia—3.1% | | |
| Bumi Resources Tbk PT | 1,716,090 | 441,034 |
| Mexico—8.1% | | |
| Grupo Mexico SAB de CV Series B | 237,661 | 749,503 |
| Industrias Penoles SAB de CV | 8,590 | 416,012 |
| Total Mexico | | 1,165,515 |
| Poland—3.6% | | |
| KGHM Polska Miedz SA | 11,306 | 518,754 |
| Russia—12.0% | | |
| Evraz PLC | 40,143 | 236,992 |
| MMC Norilsk Nickel OJSC ADR | 58,015 | 1,061,675 |
| Novolipetsk Steel GDR | 9,057 | 188,205 |
| Severstal GDR | 17,317 | 230,662 |
| Total Russia | | 1,717,534 |
| South Africa—21.2% | | |
| Anglo American Platinum, Ltd. | 5,249 | 365,229 |
| AngloGold Ashanti, Ltd. | 23,115 | 850,561 |
| Gold Fields, Ltd. | 49,721 | 680,262 |
| Impala Platinum Holdings, Ltd. | 37,427 | 736,880 |
| Kumba Iron Ore, Ltd. | 6,089 | 417,369 |
| Total South Africa | | 3,050,301 |
| Turkey—1.4% | | |
| Eregli Demir ve Celik Fabrikalari TAS | 105,772 | 208,234 |
| TOTAL INVESTMENTS IN SECURITIES—99.9% | |
| (Cost: $17,713,951) | | 14,361,164 |
| Other Assets in Excess of Liabilities—0.1% | | 14,850 |
| Net Assets—100.0% | | $ | 14,376,014 |
| † | | The Consolidated Schedule of Investments includes the accounts of the wholly owned subsidiary. All inter-company accounts and transactions have been eliminated in consolidation. See Note 2 of the Notes to Financial Statements. |
| * | | Non-income producing security |
| ADR | | American Depositary Receipts |
| GDR | | Global Depositary Receipts |
| Summary by Industry | Value | % of
Net Assets |
| Metals & Mining | $ | 11,918,120 | | | 82.9 | % |
| Oil, Gas & Consumable Fuels | | 2,443,044 | | | 17.0 | |
| Total Investments | | 14,361,164 | | | 99.9 | |
| Other Assets in Excess of Liabilities | | 14,850 | | | 0.1 | |
| Net Assets | $ | 14,376,014 | | | 100.0 | % |
The accompanying notes are an integral part of these financial statements.
| EGA Emerging Global Shares Trust 63 |
Schedule of Investments (Consolidated)†
EGShares Emerging Markets Consumer ETF
March 31, 2012
| Investments | Shares | Value |
| COMMON STOCKS—99.9% | | |
| Brazil—17.4% | | |
| BRF—Brasil Foods SA ADR | 989,432 | $ | 19,798,534 |
| Companhia Brasileira de Distribuicao Grupo | | |
| Pao de Acucar Preference Shares ADR | 211,369 | 10,065,392 |
| Companhia de Bebidas das Americas | | |
| Preference Shares ADR | 973,260 | 40,215,103 |
| Total Brazil | | 70,079,029 |
| Chile—10.3% | | |
| Cencosud SA | 2,417,487 | 16,016,377 |
| Lan Airlines SA ADR | 300,772 | 8,749,458 |
| S.A.C.I. Falabella | 1,706,368 | 16,485,511 |
| Total Chile | | 41,251,346 |
| China—5.1% | | |
| Ctrip.com International, Ltd. ADR* | 246,295 | 5,329,824 |
| Dongfeng Motor Group Co., Ltd. Class H | 4,724,496 | 8,531,354 |
| New Oriental Education & Technology Group, Ltd. ADR* 245,327 | 6,736,679 |
| Total China | | 20,597,857 |
| Colombia—1.3% | | |
| Grupo Nutresa SA | 428,721 | 5,169,857 |
| India—12.6% | | |
| Bajaj Auto, Ltd. | 260,334 | 8,578,834 |
| Hero Motorcorp, Ltd. | 162,786 | 6,567,199 |
| Hindustan Unilever, Ltd. | 1,686,243 | 13,572,361 |
| ITC, Ltd. | 4,938,998 | 21,997,422 |
| Total India | | 50,715,816 |
| Indonesia—5.7% | | |
| Astra International Tbk PT | 2,829,256 | 22,880,958 |
| Malaysia—6.8% | | |
| Genting BHD | 3,535,420 | 12,509,859 |
| Genting Malaysia BHD | 4,906,280 | 6,277,988 |
| IOI Corp. BHD | 4,868,720 | 8,486,687 |
| Total Malaysia | | 27,274,534 |
| Mexico—19.4% | | |
| Fomento Economico Mexicano SAB de CV Series UB | 2,837,200 | 23,299,125 |
| Grupo Bimbo SAB de CV Series A | 4,195,300 | 9,778,826 |
| Grupo Televisa SAB Series CPO | 4,195,700 | 17,728,679 |
| Wal-Mart de Mexico SAB de CV Series V | 8,150,000 | 27,311,932 |
| Total Mexico | | 78,118,562 |
| Russia—3.9% | | |
| Magnit OJSC GDR | 409,750 | 11,940,115 |
| X5 Retail Group NV GDR* | 169,195 | 3,881,333 |
| Total Russia | | 15,821,448 |
| South Africa—17.4% | | |
| Massmart Holdings, Ltd. | 236,441 | 4,989,121 |
| Naspers, Ltd. N Shares | 542,665 | 30,475,874 |
| Shoprite Holdings, Ltd. | 590,750 | 10,568,694 |
| Steinhoff International Holdings, Ltd.* | 1,814,215 | 6,500,826 |
| Tiger Brands, Ltd. | 276,569 | 9,700,483 |
| Truworths International, Ltd. | 743,023 | 7,818,900 |
| Total South Africa | | 70,053,898 |
| TOTAL INVESTMENTS IN SECURITIES—99.9% | |
| (Cost: $368,246,628) | | 401,963,305 |
| Other Assets in Excess of Liabilities—0.1% | | 502,742 |
| Net Assets—100.0% | | $ | 402,466,047 |
| † | | The Consolidated Schedule of Investments includes the accounts of the wholly owned subsidiary. All inter-company accounts and transactions have been eliminated in consolidation. See Note 2 of the Notes to Financial Statements. |
| * | | Non-income producing security |
| ADR | | American Depositary Receipts |
| GDR | | Global Depositary Receipts |
| Summary by Industry | Value | % of
Net Assets |
| Airlines | $ | 8,749,458 | | | 2.2 | % |
| Automobiles | | 46,558,345 | | | 11.6 | |
| Beverages | | 63,514,228 | | | 15.8 | |
| Diversified Consumer Services | | 6,736,679 | | | 1.7 | |
| Food & Staples Retailing | | 84,772,964 | | | 21.0 | |
| Food Products | | 52,934,388 | | | 13.1 | |
| Hotels, Restaurants & Leisure | | 24,117,671 | | | 6.0 | |
| Household Durables | | 6,500,826 | | | 1.6 | |
| Household Products | | 13,572,361 | | | 3.4 | |
| Media | | 48,204,552 | | | 12.0 | |
| Multiline Retail | | 16,485,511 | | | 4.1 | |
| Specialty Retail | | 7,818,900 | | | 1.9 | |
| Tobacco | | 21,997,422 | | | 5.5 | |
| Total Investments | | 401,963,305 | | | 99.9 | |
| Other Assets in Excess of Liabilities | | 502,742 | | | 0.1 | |
| Net Assets | $ | 402,466,047 | | | 100.0 | % |
The accompanying notes are an integral part of these financial statements.
| 64 EGA Emerging Global Shares Trust |
Schedule of Investments (Consolidated)†
EGShares India Infrastructure ETF
March 31, 2012
| | |
| Investments | Shares | Value |
| COMMON STOCKS—100.0% | | |
| Automobiles—7.9% | | |
| Tata Motors, Ltd. | 886,798 | $ | 4,791,268 |
| Construction & Engineering—4.5% | | |
| IRB Infrastructure Developers, Ltd. | 115,134 | 422,275 |
| Larsen & Toubro, Ltd. | 90,212 | 2,317,941 |
| Total Construction & Engineering | | 2,740,216 |
| Construction Materials—14.3% | | |
| ACC, Ltd. | 109,920 | 2,933,178 |
| Ambuja Cements, Ltd. | 788,601 | 2,665,563 |
| Ultra Tech Cement, Ltd. | 104,784 | 3,115,136 |
| Total Construction Materials | | 8,713,877 |
| Electric Utilities—13.7% | | |
| Power Grid Corp. of India, Ltd. | 1,534,335 | 3,257,205 |
| Reliance Infrastructure, Ltd. | 185,539 | 2,138,734 |
| Tata Power Co., Ltd. | 1,466,090 | 2,905,129 |
| Total Electric Utilities | | 8,301,068 |
| Electrical Equipment—4.5% | | |
| Bharat Heavy Electricals, Ltd. | 449,649 | 2,269,649 |
| Suzlon Energy, Ltd.* | 956,415 | 474,030 |
| Total Electrical Equipment | | 2,743,679 |
| Gas Utilities—5.0% | | |
| GAIL India, Ltd. | 352,606 | 2,604,142 |
| Gujarat State Petronet, Ltd. | 303,347 | 455,512 |
| Total Gas Utilities | | 3,059,654 |
| Independent Power Producers & Energy Traders—9.0% | |
| GMR Infrastructure, Ltd.* | 1,047,768 | 638,594 |
| NTPC, Ltd. | 842,786 | 2,692,382 |
| Reliance Power, Ltd.* | 915,867 | 2,106,072 |
| Total Independent Power Producers & Energy Traders | 5,437,048 |
| Industrial Conglomerates—5.8% | | |
| Jaiprakash Associates, Ltd. | 1,204,815 | 1,932,150 |
| Siemens, Ltd. | 107,563 | 1,603,574 |
| Total Industrial Conglomerates | | 3,535,724 |
| Machinery—2.1% | | |
| Cummins India, Ltd. | 129,042 | 1,254,832 |
| Metals & Mining—11.4% | | |
| Steel Authority of India, Ltd. | 744,628 | 1,377,588 |
| Sterlite Industries India, Ltd. | 1,133,750 | 2,471,350 |
| Tata Steel, Ltd. | 329,130 | 3,047,739 |
| Total Metals & Mining | | 6,896,677 |
| Oil, Gas & Consumable Fuels—2.4% | | |
| Petronet LNG, Ltd. | 445,254 | 1,468,739 |
| Real Estate Management & Development—5.2% | |
| DLF, Ltd. | 456,926 | 1,809,497 |
| Housing Development & Infrastructure, Ltd.* | 253,967 | 426,976 |
| Unitech, Ltd.* | 1,614,608 | 911,178 |
| Total Real Estate Management & Development | 3,147,651 |
| Transportation Infrastructure—2.2% | | |
| Adani Ports and Special Economic Zone, Ltd. | 516,829 | 1,313,757 |
| Wireless Telecommunication Services—12.0% | | |
| Bharti Airtel, Ltd. | 376,038 | 2,494,126 |
| Idea Cellular, Ltd.* | 1,723,493 | 3,342,450 |
| Reliance Communications, Ltd. | 874,329 | 1,442,484 |
| Total Wireless Telecommunication Services | | 7,279,060 |
| TOTAL INVESTMENTS IN SECURITIES—100.0% | |
| (Cost: $76,147,717) | | 60,683,250 |
| Other Assets in Excess of Liabilities—0.0%** | | 19,388 |
| Net Assets—100.0% | | $ | 60,702,638 |
| † | | The Consolidated Schedule of Investments includes the accounts of the wholly owned subsidiary. All inter-company accounts and transactions have been eliminated in consolidation. See Note 2 of the Notes to Financial Statements. |
| * | | Non-income producing security |
The accompanying notes are an integral part of these financial statements.
| EGA Emerging Global Shares Trust 65 |
Schedule of Investments
EGShares China Infrastructure ETF
March 31, 2012
| | |
| Investments | Shares | Value |
| COMMON STOCKS—99.8% | | |
| Construction & Engineering—12.7% | | |
| China Communications Construction Co., Ltd. Class H | 873,216 | $ | 876,140 |
| China Railway Construction Corp., Ltd. Class H | 467,003 | 290,523 |
| China Railway Group, Ltd. Class H | 1,250,377 | 401,010 |
| Total Construction & Engineering | | 1,567,673 |
| Construction Materials—12.4% | | |
| Anhui Conch Cement Co., Ltd. Class H | 169,615 | 537,420 |
| BBMG Corp. Class H | 453,354 | 381,298 |
| China National Building Material Co., Ltd. Class H | 480,508 | 605,896 |
| Total Construction Materials | | 1,524,614 |
| Diversified Telecommunication Services—8.2% | |
| China Telecom Corp., Ltd. Class H | 942,458 | 521,969 |
| China Unicom Hong Kong, Ltd. | 284,885 | 482,881 |
| Total Diversified Telecommunication Services | | 1,004,850 |
| Electrical Equipment—4.4% | | |
| Dongfang Electric Corp., Ltd. Class H | 70,984 | 172,066 |
| Shanghai Electric Group Co., Ltd. Class H | 720,559 | 366,590 |
| Total Electrical Equipment | | 538,656 |
| Energy Equipment & Services—4.6% | | |
| China Oilfield Services, Ltd. Class H | 392,121 | 562,626 |
| Independent Power Producers & Energy Traders—6.3% | |
| China Longyuan Power Group Corp. Class H | 516,699 | 431,913 |
| Huaneng Power International, Inc. Class H | 631,012 | 342,977 |
| Total Independent Power Producers & Energy Traders | 774,890 |
| Machinery—13.0% | | |
| Changsha Zoomlion Heavy Industry Science and | | |
| Technology Development Co., Ltd. Class H | 409,800 | 545,766 |
| China Rongsheng Heavy Industries Group Holdings, Ltd. | 935,500 | 247,009 |
| CSR Corp., Ltd. Class H | 605,155 | 413,102 |
| Weichai Power Co., Ltd. Class H | 84,418 | 394,146 |
| Total Machinery | | 1,600,023 |
| Metals & Mining—11.5% | | |
| Aluminum Corp. of China, Ltd. Class H | 940,100 | 452,856 |
| Angang Steel Co., Ltd. Class H | 332,852 | 213,927 |
| Jiangxi Copper Co., Ltd. Class H | 245,424 | 564,564 |
| Maanshan Iron & Steel Co., Ltd. Class H | 619,019 | 180,189 |
| Total Metals & Mining | | 1,411,536 |
| Real Estate Management & Development—24.4% | |
| Agile Property Holdings, Ltd. | 359,798 | 415,223 |
| Country Garden Holdings Co., Ltd. | 887,000 | 340,451 |
| Evergrande Real Estate Group, Ltd. | 1,113,771 | 596,765 |
| Guangzhou R&F Properties Co., Ltd. Class H | 251,845 | 300,047 |
| Longfor Properties Co., Ltd. | 275,796 | 386,484 |
| Renhe Commercial Holdings Co., Ltd. | 2,332,604 | 162,237 |
| Shimao Property Holdings, Ltd. | 410,165 | 437,953 |
| Soho China, Ltd. | 507,000 | 367,647 |
| Total Real Estate Management & Development | 3,006,807 |
| Transportation Infrastructure—2.3% | | |
| Jiangsu Expressway Co., Ltd. Class H | 296,225 | 286,534 |
| TOTAL INVESTMENTS IN SECURITIES—99.8% | |
| (Cost: $15,698,070) | | 12,278,209 |
| Other Assets in Excess of Liabilities—0.2% | | 24,894 |
| Net Assets—100.0% | | $ | 12,303,103 |
The accompanying notes are an integral part of these financial statements.
| 66 EGA Emerging Global Shares Trust |
Schedule of Investments
EGShares Brazil Infrastructure ETF
March 31, 2012
| | |
| Investments | Shares | Value |
| COMMON STOCKS—98.8% | | |
| Aerospace & Defense—5.3% | | |
| Embraer SA | 604,346 | $ | 4,790,245 |
| Construction Materials—0.6% | | |
| Magnesita Refratarios SA* | 134,948 | 505,232 |
| Diversified Telecommunication Services—9.7% | | |
| Oi SA Preference Shares | 483,300 | 2,564,460 |
| Telecomunicacoes Brasileiras SA Preference Shares* | 277,200 | 2,241,243 |
| Telefonica Brasil SA | 127,924 | 3,914,925 |
| Total Diversified Telecommunication Services | | 8,720,628 |
| Electric Utilities—12.3% | | |
| Centrais Eletricas Brasileiras SA | 355,720 | 3,307,028 |
| Companhia Energetica de Minas Gerais | 140,130 | 2,869,734 |
| CPFL Energia SA | 320,780 | 4,821,459 |
| Total Electric Utilities | | 10,998,221 |
| Energy Equipment & Services—0.6% | | |
| OSX Brasil SA* | 54,600 | 490,840 |
| Independent Power Producers & Energy Traders—11.6% | |
| AES Tiete SA | 129,061 | 1,758,733 |
| Companhia Energetica de Sao Paulo Preference | | |
| Shares Class B | 229,990 | 4,625,518 |
| Tractebel Energia SA | 223,583 | 3,983,143 |
| Total Independent Power Producers & Energy Traders | 10,367,394 |
| Machinery—7.4% | | |
| Marcopolo SA Preference Shares | 406,261 | 2,066,602 |
| Randon SA Implementos e Participacoes | | |
| Preference Shares | 192,363 | 1,241,086 |
| Weg SA | 301,247 | 3,315,814 |
| Total Machinery | | 6,623,502 |
| Metals & Mining—12.4% | | |
| Companhia Siderurgica Nacional SA | 398,400 | 3,747,489 |
| Gerdau SA | 527,750 | 4,122,369 |
| Vale SA | 139,854 | 3,267,323 |
| Total Metals & Mining | | 11,137,181 |
| Oil, Gas & Consumable Fuels—5.8% | | |
| Ultrapar Participacoes SA | 238,616 | 5,199,247 |
| Real Estate Management & Development—9.1% | |
| BR Malls Participacoes SA | 343,886 | 4,448,671 |
| BR Properties SA | 166,900 | 2,133,480 |
| Multiplan Empreendimentos Imobiliarios SA | 68,452 | 1,572,561 |
| Total Real Estate Management & Development | | 8,154,712 |
| Road & Rail—6.0% | | |
| All America Latina Logistica | 685,120 | 3,421,281 |
| Localiza Rent a Car SA | 107,506 | 1,980,048 |
| Total Road & Rail | | 5,401,329 |
| Transportation Infrastructure—8.0% | | |
| CCR SA | 577,928 | 4,679,053 |
| Ecorodovias Infraestrutura e Logistica SA | 153,600 | 1,349,673 |
| Obrascon Huarte Lain Brasil SA | 26,063 | 1,100,066 |
| Total Transportation Infrastructure | | 7,128,792 |
| Water Utilities—7.2% | | |
| Companhia de Saneamento Basico do Estado de | | |
| Sao Paulo | 128,221 | 4,885,513 |
| Companhia de Saneamento de Minas Gerais | 65,832 | 1,550,984 |
| Total Water Utilities | | 6,436,497 |
| Wireless Telecommunication Services—2.8% | | |
| Tim Participacoes SA | 396,437 | 2,520,786 |
| TOTAL INVESTMENTS IN SECURITIES—98.8% | |
| (Cost: $78,332,331) | | 88,474,606 |
| Other Assets in Excess of Liabilities—1.2% | | 1,116,145 |
| Net Assets—100.0% | | $ | 89,590,751 |
| * | | Non-income producing security |
The accompanying notes are an integral part of these financial statements.
| EGA Emerging Global Shares Trust 67 |
Schedule of Investments (Consolidated)†
EGShares India Small Cap ETF
March 31, 2012
| Investments | Shares | Value |
| COMMON STOCKS–99.8% | | |
| Auto Components–5.5% | | |
| Amtek Auto, Ltd. | 133,078 | $ | 347,290 |
| Apollo Tyres, Ltd. | 235,996 | 368,968 |
| Bharat Forge, Ltd. | 117,516 | 738,267 |
| Total Auto Components | | 1,454,525 |
| Automobiles–0.5% | | |
| TVS Motor Co., Ltd. | 164,986 | 132,779 |
| Biotechnology–1.2% | | |
| Biocon, Ltd. | 67,207 | 315,291 |
| Building Products–1.0% | | |
| Sintex Industries, Ltd. | 153,272 | 259,490 |
| Chemicals–6.2% | | |
| Chambal Fertilizers & Chemicals, Ltd. | 198,461 | 301,129 |
| Godrej Industries, Ltd. | 63,785 | 324,027 |
| Nagarjuna Fertilizers & Chemicals, Ltd.** | 582,385 | 191,480 |
| Tata Chemicals, Ltd. | 17,000 | 115,675 |
| United Phosphorus, Ltd. | 285,157 | 728,215 |
| Total Chemicals | | 1,660,526 |
| Commercial Banks–12.3% | | |
| Allahabad Bank | 172,037 | 628,275 |
| Dena Bank, Ltd. | 119,102 | 210,524 |
| Development Credit Bank, Ltd.* | 172,766 | 152,605 |
| Federal Bank, Ltd. | 143,570 | 1,201,936 |
| Oriental Bank of Commerce | 107,986 | 535,532 |
| UCO Bank | 211,403 | 328,443 |
| Vijaya Bank, Ltd. | 196,866 | 225,867 |
| Total Commercial Banks | | 3,283,182 |
| Construction & Engineering–6.2% | | |
| IRB Infrastructure Developers, Ltd. | 102,851 | 377,224 |
| IVRCL, Ltd. | 190,206 | 246,975 |
| Lanco Infratech, Ltd.* | 583,085 | 208,306 |
| Praj Industries, Ltd. | 106,576 | 167,777 |
| Punj Lloyd, Ltd. | 185,332 | 200,811 |
| Voltas, Ltd. | 198,178 | 436,657 |
| Total Construction & Engineering | | 1,637,750 |
| Construction Materials–1.2% | | |
| Century Textiles & Industries, Ltd. | 44,521 | 322,339 |
| Diversified Consumer Services–0.6% | | |
| Educomp Solutions, Ltd. | 40,242 | 152,492 |
| Diversified Financial Services–5.3% | | |
| IFCI, Ltd. | 638,124 | 524,829 |
| Indiabulls Financial Services, Ltd. | 158,474 | 644,223 |
| L&T Finance Holdings, Ltd.* | 253,901 | 238,476 |
| Total Diversified Financial Services | | 1,407,528 |
| Electrical Equipment–5.3% | | |
| Alstom T&D India, Ltd. | 52,620 | 194,181 |
| Crompton Greaves, Ltd. | 323,470 | 876,852 |
| Suzlon Energy, Ltd.* | 714,627 | 354,192 |
| Total Electrical Equipment | | 1,425,225 |
| Energy Equipment & Services–0.6% | | |
| Aban Offshore, Ltd. | 17,669 | 150,158 |
| Food Products–5.4% | | |
| Bajaj Hindusthan, Ltd. | 344,410 | 210,249 |
| Ruchi Soya Industries, Ltd. | 140,955 | 252,471 |
| Shree Renuka Sugars, Ltd. | 360,764 | 223,420 |
| Tata Global Beverages, Ltd. | 346,638 | 764,448 |
| Total Food Products | | 1,450,588 |
| Gas Utilities–1.7% | | |
| Gujarat State Petronet, Ltd. | 300,381 | 451,058 |
| Health Care Providers & Services–3.8% | | |
| Apollo Hospitals Enterprise, Ltd. | 80,235 | 1,006,068 |
| Hotels, Restaurants & Leisure–2.4% | | |
| Cox & Kings, Ltd. | 46,586 | 149,099 |
| Jubilant Foodworks, Ltd.* | 21,762 | 502,412 |
| Total Hotels, Restaurants & Leisure | | 651,511 |
| Household Durables–0.5% | | |
| TTK Prestige, Ltd. | 2,222 | 128,433 |
| Independent Power Producers & Energy Traders–0.8% | |
| GVK Power & Infrastructure, Ltd.* | 627,726 | 214,397 |
| Industrial Conglomerates–1.7% | | |
| Max India, Ltd.* | 139,264 | 462,254 |
| IT Services–6.4% | | |
| Core Education & Technologies, Ltd. | 54,676 | 302,384 |
| Hexaware Technologies, Ltd. | 179,652 | 412,764 |
| Mphasis, Ltd. | 72,829 | 579,116 |
| Tech Mahindra, Ltd. | 28,170 | 398,538 |
| Total IT Services | | 1,692,802 |
| Machinery–5.3% | | |
| ABG Shipyard, Ltd. | 16,586 | 124,025 |
| Ashok Leyland, Ltd. | 1,045,619 | 622,918 |
| Escorts, Ltd. | 111,670 | 150,369 |
| Pipavav Defence & Offshore Engineering Co., Ltd.* | 326,438 | 512,612 |
| Total Machinery | | 1,409,924 |
| Media–1.1% | | |
| Dish TV India, Ltd.* | 239,956 | 300,975 |
| Metals & Mining–3.3% | | |
| Bhushan Steel, Ltd. | 53,689 | 439,039 |
| Orissa Minerals Development Co., Ltd. | 251 | 167,966 |
| Welspun Corp., Ltd. | 102,143 | 269,868 |
| Total Metals & Mining | | 876,873 |
| Oil, Gas & Consumable Fuels–1.4% | | |
| Essar Oil, Ltd.* | 145,967 | 153,717 |
| Hindustan Oil Exploration Co., Ltd.* | 60,576 | 133,233 |
| Nagarjuna Oil Refinery, Ltd.* | 582,385 | 73,163 |
| Total Oil, Gas & Consumable Fuels | | 360,113 |
| Pharmaceuticals–6.9% | | |
| Aurobindo Pharma, Ltd. | 112,325 | 262,374 |
| Glenmark Pharmaceuticals, Ltd. | 119,644 | 726,624 |
| Orchid Chemicals & Pharmaceuticals, Ltd. | 43,145 | 156,506 |
| Strides Arcolab, Ltd. | 35,527 | 409,246 |
| Wockhardt, Ltd.* | 24,199 | 284,360 |
| Total Pharmaceuticals | | 1,839,110 |
The accompanying notes are an integral part of these financial statements.
| 68 EGA Emerging Global Shares Trust |
Schedule of Investments (Consolidated)† (concluded)
EGShares India Small Cap ETF
March 31, 2012
| | |
| Investments | Shares | Value |
| |
| Real Estate Management & Development–6.0% | |
| Delta Corp., Ltd. | 111,414 | $ | 150,790 |
| Housing Development & Infrastructure, Ltd.* | 216,375 | 363,775 |
| Indiabulls Real Estate, Ltd. | 245,529 | 307,725 |
| Parsvnath Developers, Ltd.* | 113,773 | 125,509 |
| Unitech, Ltd.* | 1,166,283 | 658,173 |
| Total Real Estate Management & Development | 1,605,972 |
| Software–1.2% | | |
| Financial Technologies India, Ltd. | 24,597 | 330,366 |
| Textiles, Apparel & Luxury Goods–6.0% | | |
| Alok Industries, Ltd. | 516,076 | 199,056 |
| Arvind, Ltd.* | 136,780 | 221,232 |
| Bata India, Ltd. | 25,122 | 379,012 |
| Bombay Dyeing & Manufacturing Co., Ltd. | 16,482 | 187,709 |
| Gitanjali Gems, Ltd. | 35,286 | 224,447 |
| Raymond, Ltd. | 31,011 | 258,521 |
| VIP Industries, Ltd. | 59,933 | 117,466 |
| Total Textiles, Apparel & Luxury Goods | | 1,587,443 |
| TOTAL INVESTMENTS IN SECURITIES–99.8% | |
| (Cost: $26,828,197) | | $ | 26,569,172 |
| Other Assets in Excess of Liabilities–0.2% | | 47,020 |
| Net Assets—100.0% | | $ | 26,616,192 |
| † | | The Consolidated Schedule of Investments includes the accounts of the wholly owned subsidiary. All inter-company accounts and transactions have been eliminated in consolidation. See Note 2 of the Notes to Financial Statements. |
| * | | Non-income producing security |
| ** | | Fair valued security. When trading resumes, security is expected to be known as Kakinada Fertilizers Ltd. and increase to 640,623 shares. |
The accompanying notes are an integral part of these financial statements.
| EGA Emerging Global Shares Trust 69 |
Schedule of Investments (Consolidated)†
EGShares India Consumer ETF
March 31, 2012
| | |
| Investments | Shares | Value |
| COMMON STOCKS—100.3% | | |
| Automobiles—20.2% | | |
| Bajaj Auto, Ltd. | 2,646 | $ | 87,194 |
| Hero Motorcorp, Ltd. | 2,388 | 96,338 |
| Mahindra & Mahindra, Ltd. | 6,666 | 91,619 |
| Tata Motors, Ltd. | 17,788 | 96,107 |
| TVS Motor Co., Ltd. | 17,032 | 13,707 |
| Total Automobiles | | 384,965 |
| Beverages—9.6% | | |
| United Breweries, Ltd. | 9,467 | 100,199 |
| United Spirits, Ltd. | 7,028 | 83,606 |
| Total Beverages | | 183,805 |
| Food Products—20.0% | | |
| GlaxoSmithKline Consumer Healthcare, Ltd. | 1,855 | 100,908 |
| McLeod Russel India, Ltd. | 6,772 | 36,070 |
| Nestle India, Ltd. | 1,026 | 93,257 |
| Ruchi Soya Industries, Ltd. | 18,566 | 33,255 |
| Shree Renuka Sugars, Ltd. | 55,119 | 34,135 |
| Tata Global Beverages, Ltd. | 37,693 | 83,125 |
| Total Food Products | | 380,750 |
| Hotels, Restaurants & Leisure—8.5% | | |
| Cox & Kings, Ltd. | 7,028 | 22,493 |
| Indian Hotels Co., Ltd. | 55,741 | 69,697 |
| Jubilant Foodworks, Ltd.* | 3,031 | 69,976 |
| Total Hotels, Restaurants & Leisure | | 162,166 |
| Household Durables—3.1% | | |
| TTK Prestige, Ltd. | 207 | 11,964 |
| Videocon Industries, Ltd. | 13,874 | 46,678 |
| Total Household Durables | | 58,642 |
| Household Products—5.3% | | |
| Hindustan Unilever, Ltd. | 12,545 | 100,973 |
| Media—11.4% | | |
| Dish TV India, Ltd.* | 36,750 | 46,095 |
| Hathway Cable & Datacom, Ltd.* | 5,618 | 18,190 |
| Sun TV Network, Ltd. | 13,813 | 82,466 |
| Zee Entertainment Enterprises, Ltd. | 28,262 | 70,315 |
| Total Media | | 217,066 |
| Multiline Retail—1.2% | | |
| Shoppers Stop, Ltd. | 3,065 | 23,385 |
| Personal Products—4.9% | | |
| Godrej Consumer Products, Ltd. | 9,888 | 93,193 |
| Textiles, Apparel & Luxury Goods—10.7% | | |
| Arvind, Ltd.* | 17,397 | 28,138 |
| Bata India, Ltd. | 3,152 | 47,554 |
| Raymond, Ltd. | 3,761 | 31,353 |
| Titan Industries, Ltd. | 21,819 | 97,885 |
| Total Textiles, Apparel & Luxury Goods | | 204,930 |
| Tobacco��5.4% | | |
| ITC, Ltd. | 23,233 | 103,476 |
| TOTAL INVESTMENTS IN SECURITIES—100.3% | |
| (Cost: $1,810,894) | | 1,913,351 |
| Liabilities in Excess of Other Assets—(0.3)% | | (4,990) |
| Net Assets—100.0% | | $ | 1,908,361 |
| † | | The Consolidated Schedule of Investments includes the accounts of the wholly owned subsidiary. All inter-company accounts and transactions have been eliminated in consolidation. See Note 2 of the Notes to Financial Statements. |
| * | | Non-income producing security |
The accompanying notes are an integral part of these financial statements.
| 70 EGA Emerging Global Shares Trust |
Schedule of Investments (Consolidated)†
EGShares Low Volatility Emerging Markets Dividend ETF
(formerly EGShares Emerging Markets High Income Low Beta ETF)
March 31, 2012
| | |
| Investments | Shares | Value |
| COMMON STOCKS—100.1% | | |
| Brazil—16.2% | | |
| Centrais Eletricas Brasileiras SA Preference B | | |
| Shares ADR | 154,614 | $ | 1,988,336 |
| Companhia de Bebidas das Americas Preference | | |
| Shares ADR | 36,815 | 1,521,196 |
| Companhia Energetica de Minas Gerais Preference | | |
| Shares ADR | 79,288 | 1,885,469 |
| Companhia Paranaense de Energia-Copel Preference | | |
| Shares ADR | 55,051 | 1,294,249 |
| Telefonica Brasil SA Preference Shares ADR | 94,545 | 2,895,913 |
| Total Brazil | | 9,585,163 |
| China—16.8% | | |
| Anta Sports Products, Ltd. | 2,373,000 | 2,475,696 |
| Huaneng Power International, Inc. Class H | 2,838,000 | 1,542,550 |
| Jiangsu Expressway Co., Ltd. Class H | 1,878,000 | 1,816,561 |
| Renhe Commercial Holdings Co., Ltd. | 24,934,000 | 1,734,204 |
| Zhejiang Expressway Co., Ltd. Class H | 3,176,000 | 2,372,591 |
| Total China | | 9,941,602 |
| Czech Republic—4.1% | | |
| CEZ AS | 56,798 | 2,429,970 |
| Hungary—5.1% | | |
| Magyar Telekom Telecommunications PLC | 1,154,509 | 3,012,941 |
| India—3.5% | | |
| Indian Oil Corp., Ltd. | 217,025 | 1,119,098 |
| Oil & Natural Gas Corp., Ltd. | 185,120 | 975,110 |
| Total India | | 2,094,208 |
| Indonesia—2.6% | | |
| Telekomunikasi Indonesia Tbk PT ADR | 49,998 | 1,517,939 |
| Malaysia—5.0% | | |
| DiGi.com BHD | 1,272,400 | 1,686,288 |
| Public Bank BHD | 294,400 | 1,310,794 |
| Total Malaysia | | 2,997,082 |
| Mexico—3.8% | | |
| Kimberly-Clark de Mexico SAB de CV Class A | 1,029,600 | 2,283,356 |
| Philippines—2.9% | | |
| Philippine Long Distance Telephone Co. ADR | 27,276 | 1,696,294 |
| Poland—5.0% | | |
| Telekomunikacja Polska SA | 536,454 | 2,939,592 |
| Russia—3.4% | | |
| Mobile TeleSystems ADR | 109,042 | 1,999,830 |
| South Africa—14.8% | | |
| Aveng, Ltd. | 335,402 | | 1,708,356 |
| JD Group, Ltd. | 278,840 | 1,798,487 |
| Pretoria Portland Cement Co., Ltd. | 419,181 | 1,791,523 |
| Reunert, Ltd. | 200,044 | 1,824,613 |
| Sanlam, Ltd. | 382,112 | 1,652,016 |
| Total South Africa | | 8,774,995 |
| Thailand—16.9% | | |
| Major Cineplex Group PCL | 5,524,666 | 3,223,468 |
| Quality Houses Co., Ltd. PCL | 48,204,059 | 2,812,554 |
| Samart Corp. PCL | 7,270,489 | 2,168,185 |
| Total Access Communication PCL | 691,872 | 1,839,012 |
| Total Thailand | | 10,043,219 |
| TOTAL INVESTMENTS IN SECURITIES—100.1% | |
| (Cost: $58,086,070) | | 59,316,191 |
| Liabilities in Excess of Other Assets—(0.1)% | | (61,286) |
| Net Assets—100.0% | | $ | 59,254,905 |
| † | | The Consolidated Schedule of Investments includes the accounts of the wholly owned subsidiary. All inter-company accounts and transactions have been eliminated in consolidation. See Note 2 of the Notes to Financial Statements. |
| ADR | | American Depositary Receipts |
| Summary by Industry | Value | % of
Net Assets |
| Beverages | $ | 1,521,196 | | | 2.6 | % |
| Commercial Banks | | 1,310,794 | | | 2.2 | |
| Construction & Engineering | | 1,708,356 | | | 2.9 | |
| Construction Materials | | 1,791,524 | | | 3.0 | |
| Diversified Telecommunication Services | | 10,366,385 | | | 17.5 | |
| Electric Utilities | | 7,598,024 | | | 12.8 | |
| Electronic Equipment, Instruments & Components | | 2,168,185 | | | 3.7 | |
| Household Products | | 2,283,356 | | | 3.8 | |
| Independent Power Producers & Energy Traders | | 1,542,550 | | | 2.6 | |
| Industrial Conglomerates | | 1,824,613 | | | 3.1 | |
| Insurance | | 1,652,016 | | | 2.8 | |
| Media | | 3,223,468 | | | 5.4 | |
| Oil, Gas & Consumable Fuels | | 2,094,208 | | | 3.5 | |
| Real Estate Management & Development | | 4,546,758 | | | 7.7 | |
| Specialty Retail | | 1,798,487 | | | 3.0 | |
| Textiles, Apparel & Luxury Goods | | 2,475,695 | | | 4.2 | |
| Transportation Infrastructure | | 4,189,152 | | | 7.1 | |
| Wireless Telecommunication Services | | 7,221,424 | | | 12.2 | |
| Total Investments | | 59,316,191 | | | 100.1 | |
| Liabilities in Excess of Other Assets | | (61,286 | ) | | (0.1 | ) |
| Net Assets | $ | 59,254,905 | | | 100.0 | % |
The accompanying notes are an integral part of these financial statements.
| EGA Emerging Global Shares Trust 71 |
Statements of Assets and Liabilities
EGA Emerging Global Shares Trust
March 31, 2012
| | | EGShares
GEMS
Composite ETF
(Consolidated) | | EGShares
Basic Materials
GEMS ETF
(Consolidated) | | EGShares
Consumer Goods
GEMS ETF
(Consolidated) | | EGShares
Consumer
Services
GEMS ETF |
| ASSETS: | | | | | | | | | | | | | |
| Cost of Investments: | | $ | 14,793,350 | | $ | 1,874,897 | | $ | 1,006,986 | | $ | 1,064,220 | |
| Investments at value | | | 13,942,596 | | | 1,614,379 | | | 1,127,101 | | | 1,086,857 | |
| Cash | | | 35,932 | | | 4,247 | | | 2,888 | | | 3,246 | |
| Foreign cash* | | | 7,600 | | | 2,869 | | | 1,138 | | | 7 | |
| Restricted cash† | | | — | | | — | | | — | | | — | |
| Receivables: | | | | | | | | | | | | | |
| Capital shares sold | | | — | | | — | | | — | | | — | |
| Dividends and interest | | | 39,413 | | | — | | | 1,687 | | | 83 | |
| Due from broker | | | — | | | — | | | — | | | — | |
| Due from sub-adviser | | | 2,260 | | | — | | | — | | | — | |
| Investment securities sold | | | — | | | — | | | — | | | — | |
| Prepaid offering expenses | | | — | | | — | | | — | | | 1,697 | |
| Prepaid expense and other assets | | | 4,089 | | | 3,779 | | | 3,773 | | | 4,061 | |
| Total Assets | | | 14,031,890 | | | 1,625,274 | | | 1,136,587 | | | 1,095,951 | |
| |
| LIABILITIES: | | | | | | | | | | | | | |
| Payables: | | | | | | | | | | | | | |
| Accrued investment advisory fees | | | 405 | | | 131 | | | 133 | | | 161 | |
| Accrued sub-advisory fees | | | — | | | 8,982 | | | 5,419 | | | 31,573 | |
| Accrued trustee fees | | | 231 | | | 11 | | | 12 | | | 7 | |
| Capital shares payable | | | — | | | — | | | — | | | — | |
| Due to broker | | | — | | | — | | | — | | | — | |
| Investment securities purchased | | | — | | | — | | | — | | | — | |
| Accrued expenses and other liabilities | | | 45,456 | | | 26,150 | | | 26,844 | | | 20,671 | |
| Total Liabilities | | | 46,092 | | | 35,274 | | | 32,408 | | | 52,412 | |
| NET ASSETS | | $ | 13,985,798 | | $ | 1,590,000 | | $ | 1,104,179 | | $ | 1,043,539 | |
| |
| NET ASSETS: | | | | | | | | | | | | | |
| Paid-in capital | | $ | 16,096,371 | | $ | 1,881,650 | | $ | 999,847 | | $ | 1,042,903 | |
| Undistributed (accumulated) net investment income (loss) | | | (19,886 | ) | | 4,500 | | | 3,470 | | | (1,061 | ) |
| Accumulated net realized loss on investments and foreign currency transactions | | | (1,240,197 | ) | | (35,662 | ) | | (19,273 | ) | | (20,940 | ) |
| Net unrealized appreciation (depreciation) on investments and on foreign currency translations | | | (850,490 | ) | | (260,488 | ) | | 120,135 | | | 22,637 | |
| NET ASSETS | | $ | 13,985,798 | | $ | 1,590,000 | | $ | 1,104,179 | | $ | 1,043,539 | |
| Outstanding beneficial interest shares (unlimited shares of beneficial interest authorized, no par value) | | | 600,000 | | | 100,000 | | | 50,000 | | | 50,000 | |
| Net asset value per share | | $ | 23.31 | | $ | 15.90 | | $ | 22.08 | | $ | 20.87 | |
| |
| * Cost of foreign cash: | | $ | 7,413 | | $ | 2,839 | | $ | 1,118 | | $ | 7 | |
| † | | Restricted cash represents deposits being held by custodian as collateral for outstanding creation or redemption transactions. |
| | | EGShares
Energy
GEMS ETF
(Consolidated) | | EGShares
Financials
GEMS ETF
(Consolidated) | | EGShares
Health Care
GEMS ETF
(Consolidated) | | EGShares
Industrials
GEMS ETF
(Consolidated) | | EGShares
Technology
GEMS ETF
(Consolidated) | | EGShares
Telecom
GEMS ETF
(Consolidated) |
| ASSETS: | | | | | | | | | | | | | | | | | | | |
| Cost of Investments: | | $ | 12,388,700 | | $ | 4,543,803 | | $ | 1,933,186 | | $ | 1,957,706 | | $ | 1,916,685 | | $ | 3,014,689 | |
| Investments at value | | | 11,220,215 | | | 4,031,355 | | | 1,935,677 | | | 1,902,348 | | | 1,919,386 | | | 3,038,006 | |
| Cash | | | 8,831 | | | 8,462 | | | 446 | | | 323,870 | | | 515 | | | 6,090 | |
| Foreign cash* | | | 1,335 | | | 3,553 | | | 500 | | | 29,897 | | | — | | | 19,674 | |
| Restricted cash† | | | — | | | 384,228 | | | — | | | 981,372 | | | — | | | 116,098 | |
| Receivables: | | | | | | | | | | | | | | | | | | | |
| Capital shares sold | | | — | | | — | | | — | | | 436 | | | — | | | — | |
| Dividends and interest | | | 20,858 | | | 4,807 | | | 1,964 | | | 906 | | | — | | | 19,080 | |
| Due from broker | | | — | | | 263,029 | | | — | | | — | | | — | | | 112,236 | |
| Due from sub-adviser | | | 7,003 | | | 12,605 | | | — | | | — | | | — | | | — | |
| Investment securities sold | | | — | | | — | | | — | | | 79,417 | | | — | | | — | |
| Prepaid offering expenses | | | — | | | — | | | — | | | — | | | — | | | — | |
| Prepaid expense and other assets | | | 4,334 | | | 3,875 | | | 3,773 | | | 3,773 | | | 3,773 | | | 3,773 | |
| Total Assets | | | 11,262,576 | | | 4,711,914 | | | 1,942,360 | | | 3,322,019 | | | 1,923,674 | | | 3,314,957 | |
| |
| LIABILITIES: | | | | | | | | | | | | | | | | | | | |
| Payables: | | | | | | | | | | | | | | | | | | | |
| Accrued investment advisory fees | | | 402 | | | 274 | | | 144 | | | 218 | | | 225 | | | 230 | |
| Accrued sub-advisory fees | | | — | | | — | | | 6,447 | | | 7,049 | | | 8,437 | | | 9,621 | |
| Accrued trustee fees | | | 213 | | | 37 | | | 18 | | | 20 | | | 18 | | | 16 | |
| Capital shares payable | | | — | | | — | | | — | | | 428,944 | | | — | | | — | |
| Due to broker | | | — | | | 384,228 | | | — | | | 981,372 | | | — | | | 116,098 | |
| Investment securities purchased | | | — | | | 263,029 | | | — | | | — | | | — | | | 130,982 | |
| Accrued expenses and other liabilities | | | 45,174 | | | 42,706 | | | 27,049 | | | 26,665 | | | 26,594 | | | 26,337 | |
| Total Liabilities | | | 45,789 | | | 690,274 | | | 33,658 | | | 1,444,268 | | | 35,274 | | | 283,284 | |
| NET ASSETS | | $ | 11,216,787 | | $ | 4,021,640 | | $ | 1,908,702 | | $ | 1,877,751 | | $ | 1,888,400 | | $ | 3,031,673 | |
| |
| NET ASSETS: | | | | | | | | | | | | | | | | | | | |
| Paid-in capital | | $ | 13,462,297 | | $ | 4,598,791 | | $ | 1,935,127 | | $ | 2,050,208 | | $ | 1,945,935 | | $ | 3,003,988 | |
| Undistributed (accumulated) net investment income (loss) | | | (41,545 | ) | | (15,553 | ) | | 2,153 | | | (637 | ) | | — | | | 15,242 | |
| Accumulated net realized loss on investments and foreign currency transactions | | | (1,035,378 | ) | | (49,060 | ) | | (31,085 | ) | | (116,451 | ) | | (60,236 | ) | | (10,817 | ) |
| Net unrealized appreciation (depreciation) on investments and on foreign currency translations | | | (1,168,587 | ) | | (512,538 | ) | | 2,507 | | | (55,369 | ) | | 2,701 | | | 23,260 | |
| NET ASSETS | | $ | 11,216,787 | | $ | 4,021,640 | | $ | 1,908,702 | | $ | 1,877,751 | | $ | 1,888,400 | | $ | 3,031,673 | |
| Outstanding beneficial interest shares (unlimited shares of beneficial interest authorized, no par value) | | | 450,000 | | | 200,000 | | | 100,000 | | | 100,000 | | | 100,000 | | | 150,000 | |
| Net asset value per share | | $ | 24.93 | | $ | 20.11 | | $ | 19.09 | | $ | 18.78 | | $ | 18.88 | | $ | 20.21 | |
| |
| * Cost of foreign cash: | | $ | 1,337 | | $ | 3,583 | | $ | 482 | | $ | 29,889 | | $ | — | | $ | 19,668 | |
| † | | Restricted cash represents deposits being held by custodian as collateral for outstanding creation or redemption transactions. |
The accompanying notes are an integral part of these financial statements.
| 72 & 73 EGA Emerging Global Shares Trust |
Statements of Assets and Liabilities (concluded)
EGA Emerging Global Shares Trust
March 31, 2012
| | | EGShares
Utilities
GEMS ETF
(Consolidated) | | EGShares
Emerging Markets
Metals & Mining ETF
(Consolidated) | | EGShares
Emerging Markets
Consumer ETF
(Consolidated) |
| ASSETS: | | | | | | | | | | |
| Cost of Investments: | | $ | 2,682,718 | | $ | 17,713,951 | | $ | 368,246,628 | |
| Investments at value | | | 2,810,443 | | | 14,361,164 | | | 401,963,305 | |
| Cash | | | 2,810 | | | 37,699 | | | 262,847 | |
| Foreign cash* | | | 182 | | | 18,038 | | | 136,445 | |
| Restricted cash† | | | — | | | — | | | 1,990,122 | |
| Receivables: | | | | | | | | | | |
| Capital shares sold | | | — | | | — | | | — | |
| Dividends and interest | | | 6,769 | | | — | | | 453,427 | |
| Due from broker | | | — | | | — | | | 1,002,914 | |
| Due from sub-adviser | | | — | | | 2,003 | | | — | |
| Foreign currency sold | | | — | | | — | | | — | |
| Due from custodian | | | — | | | — | | | — | |
| Prepaid offering expenses | | | — | | | — | | | — | |
| Prepaid expense and other assets | | | 3,772 | | | 4,863 | | | 55,171 | |
| Total Assets | | | 2,823,976 | | | 14,423,767 | | | 405,864,231 | |
| |
| LIABILITIES: | | | | | | | | | | |
| Payables: | | | | | | | | | | |
| Accrued investment advisory fees | | | 339 | | | 292 | | | 26,508 | |
| Accrued sub-advisory fees | | | 6,749 | | | — | | | 82,919 | |
| Accrued trustee fees | | | 32 | | | 196 | | | 4,953 | |
| Capital shares payable | | | — | | | — | | | 1,084 | |
| Due to custodian | | | — | | | — | | | — | |
| Due to broker | | | — | | | — | | | 1,990,122 | |
| Income payable | | | — | | | — | | | — | |
| Investment securities purchased | | | — | | | — | | | 1,113,545 | |
| Accrued expenses and other liabilities | | | 28,721 | | | 47,265 | | | 179,053 | |
| Total Liabilities | | | 35,841 | | | 47,753 | | | 3,398,184 | |
| NET ASSETS | | $ | 2,788,135 | | $ | 14,376,014 | | $ | 402,466,047 | |
| |
| NET ASSETS: | | | | | | | | | | |
| Paid-in capital | | $ | 2,700,957 | | $ | 19,028,078 | | $ | 370,787,170 | |
| Undistributed (accumulated) net investment income (loss) | | | 8,394 | | | (36,159 | ) | | 124,633 | ) |
| Accumulated net realized loss on investments and foreign currency transactions | | | (48,936 | ) | | (1,263,251 | ) | | (2,162,573 | ) |
| Net unrealized appreciation (depreciation) on investments and on foreign currency translations | | | 127,720 | | | (3,352,654 | ) | | 33,716,817 | |
| NET ASSETS | | $ | 2,788,135 | | $ | 14,376,014 | | $ | 402,466,047 | |
| Outstanding beneficial interest shares (unlimited shares of beneficial interest authorized, no par value) | | | 150,000 | | | 900,000 | | | 16,250,000 | |
| Net asset value per share | | $ | 18.59 | | $ | 15.97 | | $ | 24.77 | |
| |
| * Cost of foreign cash: | | $ | 182 | | $ | 17,906 | | $ | 136,188 | |
| † | | Restricted cash represents deposits being held by custodian as collateral for outstanding creation or redemption transactions. |
| | | EGShares
India
Infrastructure
ETF
(Consolidated) | | EGShares
China
Infrastructure
ETF | | EGShares
Brazil
Infrastructure
ETF | | EGShares
India
Small Cap ETF
(Consolidated) | | EGShares
India
Consumer ETF
(Consolidated) | | EGShares
Low Volatility
Emerging Markets
Dividend ETF
(Consolidated) |
| ASSETS: | | | | | | | | | | | | | | | | | | | |
| Cost of Investments: | | $ | 76,147,717 | | $ | 15,698,070 | | $ | 78,332,331 | | $ | 26,828,197 | | $ | 1,810,894 | | $ | 58,086,070 | |
| Investments at value | | | 60,683,250 | | | 12,278,209 | | | 88,474,606 | | | 26,569,172 | | | 1,913,351 | | | 59,316,191 | |
| Cash | | | 7,374 | | | 49,055 | | | 214,659 | | | — | | | 14,647 | | | 199,596 | |
| Foreign cash* | | | 15,294 | | | — | | | 378 | | | 1,253,324 | | | 1,901 | | | 20,953 | |
| Restricted cash† | | | — | | | — | | | — | | | — | | | — | | | 310,940 | |
| Receivables: | | | | | | | | | | | | | | | | | | | |
| Capital shares sold | | | — | | | — | | | — | | | — | | | — | | | 1,009,651 | |
| Dividends and interest | | | 62,171 | | | — | | | 979,612 | | | 7,829 | | | 1,091 | | | 229,884 | |
| Due from broker | | | — | | | — | | | — | | | — | | | — | | | — | |
| Due from sub-adviser | | | 21,272 | | | 16,140 | | | 6,462 | | | 18,230 | | | — | | | — | |
| Foreign currency sold | | | — | | | — | | | — | | | 12,424 | | | — | | | — | |
| Due from custodian | | | — | | | — | | | — | | | — | | | — | | | 300,984 | |
| Prepaid offering expenses | | | — | | | — | | | — | | | — | | | — | | | 3,618 | |
| Prepaid expense and other assets | | | 6,467 | | | 3,781 | | | 4,832 | | | 3,989 | | | 8,033 | | | 7,857 | |
| Total Assets | | | 60,795,828 | | | 12,347,185 | | | 89,680,549 | | | 27,864,968 | | | 1,939,023 | | | 61,399,674 | |
| |
| LIABILITIES: | | | | | | | | | | | | | | | | | | | |
| Payables: | | | | | | | | | | | | | | | | | | | |
| Accrued investment advisory fees | | | 2,922 | | | 558 | | | 5,278 | | | 1,833 | | | 152 | | | 4,863 | |
| Accrued sub-advisory fees | | | — | | | — | | | — | | | — | | | 6,320 | | | 16,050 | |
| Accrued trustee fees | | | 890 | | | 203 | | | 1,165 | | | 362 | | | 104 | | | 924 | |
| Capital shares payable | | | — | | | — | | | — | | | — | | | — | | | — | |
| Due to custodian | | | — | | | — | | | — | | | 1,071,189 | | | — | | | — | |
| Due to broker | | | — | | | — | | | — | | | — | | | — | | | 310,940 | |
| Income payable | | | — | | | — | | | — | | | — | | | — | | | 499,996 | |
| Investment securities purchased | | | — | | | — | | | — | | | 115,614 | | | — | | | 1,271,414 | |
| Accrued expenses and other liabilities | | | 89,378 | | | 43,321 | | | 83,355 | | | 59,778 | | | 24,086 | | | 40,582 | |
| Total Liabilities | | | 93,190 | | | 44,082 | | | 89,798 | | | 1,248,776 | | | 30,662 | | | 2,144,769 | |
| NET ASSETS | | $ | 60,702,638 | | $ | 12,303,103 | | $ | 89,590,751 | | $ | 26,616,192 | | $ | 1,908,361 | | $ | 59,254,905 | |
| |
| NET ASSETS: | | | | | | | | | | | | | | | | | | | |
| Paid-in capital | | $ | 87,153,679 | | $ | 17,262,386 | | $ | 85,314,944 | | $ | 39,930,753 | | $ | 1,838,041 | | $ | 58,854,590 | |
| Undistributed (accumulated) net investment income (loss) | | | 102,219 | | | (28,354 | ) | | 826,959 | | | (48,453 | ) | | (743 | ) | | (360,697 | ) |
| Accumulated net realized loss on investments and foreign currency transactions | | | (11,087,305 | ) | | (1,511,068 | ) | | (6,684,818 | ) | | (13,009,482 | ) | | (31,407 | ) | | (468,307 | ) |
| Net unrealized appreciation (depreciation) on investments and on foreign currency translations | | | (15,465,955 | ) | | (3,419,861 | ) | | 10,133,666 | | | (256,626 | ) | | 102,470 | | | 1,229,319 | |
| NET ASSETS | | $ | 60,702,638 | | $ | 12,303,103 | | $ | 89,590,751 | | $ | 26,616,192 | | $ | 1,908,361 | | $ | 59,254,905 | |
| Outstanding beneficial interest shares (unlimited shares of beneficial interest authorized, no par value) | | | 4,050,000 | | | 750,000 | | | 3,700,000 | | | 1,850,000 | | | 100,000 | | | 2,950,000 | |
| Net asset value per share | | $ | 14.99 | | $ | 16.40 | | $ | 24.21 | | $ | 14.39 | | $ | 19.08 | | $ | 20.09 | |
| |
| * Cost of foreign cash: | | $ | 15,141 | | $ | — | | $ | 379 | | $ | 1,250,984 | | $ | 1,889 | | $ | 20,940 | |
| † | | Restricted cash represents deposits being held by custodian as collateral for outstanding creation or redemption transactions. |
The accompanying notes are an integral part of these financial statements.
| 74 and 75 EGA Emerging Global Shares Trust |
Statements of Operations
EGA Emerging Global Shares Trust
Year Ended March 31, 2012
| | | EGShares
GEMS
Composite ETF
(Consolidated) | | EGShares
Basic Materials
GEMS ETF
(Consolidated)1 | | EGShares
Consumer Goods
GEMS ETF
(Consolidated)1 | | EGShares
Consumer
Services
GEMS ETF1 |
| INVESTMENT INCOME: | | | | | | | | | | | | | |
| Dividend income* | | $ | 623,530 | | $ | 28,673 | | $ | 22,241 | | $ | 5,401 | |
| Interest income | | | 5 | | | 1 | | | 83 | | | 7 | |
| Total investment income | | | 623,535 | | | 28,674 | | | 22,324 | | | 5,408 | |
| |
| EXPENSES: | | | | | | | | | | | | | |
| Sub-advisory fees | | | 173,687 | | | 7,729 | | | 8,251 | | | 6,873 | |
| Administration and accounting fees | | | 91,410 | | | — | | | — | | | — | |
| Custody fees | | | 44,614 | | | 11,355 | | | 17,521 | | | 5,990 | |
| Investment advisory fees | | | 23,169 | | | 909 | | | 4,438 | | | 3,456 | |
| Licensing fees | | | 18,094 | | | 2,625 | | | 3,184 | | | 580 | |
| Offering fees | | | — | | | 16,431 | | | 17,931 | | | 5,865 | |
| Legal fees | | | 16,856 | | | 877 | | | 969 | | | 801 | |
| Audit and tax fees | | | 14,961 | | | 14,967 | | | 14,967 | | | 13,489 | |
| Pricing fees | | | 13,573 | | | 2,778 | | | 2,778 | | | 2,795 | |
| Transfer agent fees | | | 11,967 | | | 8,953 | | | 8,953 | | | 8,954 | |
| Shareholder reporting fees | | | 8,930 | | | 1,792 | | | 1,840 | | | 1,753 | |
| Exchange listing fees | | | 4,986 | | | 3,857 | | | 3,857 | | | 3,857 | |
| Insurance fees | | | 2,128 | | | 67 | | | 76 | | | 57 | |
| Trustees’ fees and expenses | | | 1,527 | | | 71 | | | 78 | | | 65 | |
| Interest expense | | | — | | | — | | | 37 | | | — | |
| Registration fees | | | — | | | 122 | | | 110 | | | 113 | |
| Miscellaneous fees | | | 485 | | | 100 | | | 100 | | | 100 | |
| Total expenses before reimbursements/waivers | | | 426,387 | | | 72,633 | | | 85,090 | | | 54,748 | |
| Less: Reimbursements/waivers of expenses from sub-adviser | | | (252,669 | ) | | (64,900 | ) | | (76,800 | ) | | (47,875 | ) |
| Net expenses | | | 173,718 | | | 7,733 | | | 8,290 | | | 6,873 | |
| Net investment income (loss) | | | 449,817 | | | 20,941 | | | 14,034 | | | (1,465 | ) |
| |
| REALIZED AND UNREALIZED GAIN (LOSS) ON INVESTMENTS AND FOREIGN CURRENCY TRANSLATIONS: | | | | | | | | | | | | | |
| Net realized gain (loss) on: | | | | | | | | | | | | | |
| Investments | | | (634,114 | ) | | (35,662 | ) | | (19,273 | ) | | (20,940 | ) |
| In-Kind Redemptions | | | (946,665 | ) | | (59,063 | ) | | 33,550 | | | 53,290 | |
| Foreign currency transactions | | | (11,342 | ) | | (3,173 | ) | | (1,061 | ) | | 574 | |
| Net realized gain (loss) | | | (1,592,121 | ) | | (97,898 | ) | | 13,216 | | | 32,924 | |
| Change in unrealized appreciation (depreciation) on: | | | | | | | | | | | | | |
| Investments | | | (4,510,288 | ) | | (260,518 | ) | | 120,115 | | | 22,637 | |
| Foriegn currency translations | | | (3,985 | ) | | 30 | | | 20 | | | — | |
| Change in unrealized appreciation (depreciation) | | | (4,514,273 | ) | | (260,488 | ) | | 120,135 | | | 22,637 | |
| Net realized and unrealized gain (loss) on investments and foreign currency translations | | | (6,106,394 | ) | | (358,386 | ) | | 133,351 | | | 55,561 | |
| NET INCREASE (DECREASE) IN NET ASSETS RESULTING FROM OPERATIONS | | $ | (5,656,577 | ) | $ | (337,445 | ) | $ | 147,385 | | $ | 54,096 | |
| |
| * Net of foreign taxes withheld of: | | $ | 50,062 | | $ | 1,685 | | $ | 860 | | $ | 378 | |
| 1 | | Represents the period June 23, 2011 (commencement of operations) to March 31, 2012. |
| | | EGShares
Energy
GEMS ETF
(Consolidated) | | EGShares
Financials
GEMS ETF
(Consolidated) | | EGShares
Health Care
GEMS ETF
(Consolidated)1 | | EGShares
Industrials
GEMS ETF
(Consolidated)1 | | EGShares
Technology
GEMS ETF
(Consolidated)1 | | EGShares
Telecom
GEMS ETF
(Consolidated)1 |
| INVESTMENT INCOME: | | | | | | | | | | | | | | | | | | | |
| Dividend income* | | $ | 483,836 | | $ | 202,418 | | $ | 10,975 | | $ | 15,602 | | $ | 7,391 | | $ | 36,604 | |
| Interest income | | | 1 | | | 3 | | | 2 | | | — | | | — | | | 1 | |
| Total investment income | | | 483,837 | | | 202,421 | | | 10,977 | | | 15,602 | | | 7,391 | | | 36,605 | |
| |
| EXPENSES: | | | | | | | | | | | | | | | | | | | |
| Sub-advisory fees | | | 153,102 | | | 49,646 | | | 8,670 | | | 9,045 | | | 8,768 | | | 8,696 | |
| Administration and accounting fees | | | 95,564 | | | 87,244 | | | — | | | — | | | — | | | — | |
| Custody fees | | | 44,976 | | | 35,880 | | | 15,698 | | | 14,024 | | | 13,512 | | | 12,211 | |
| Investment advisory fees | | | 18,021 | | | 6,150 | | | 1,020 | | | 1,064 | | | 4,159 | | | 4,142 | |
| Licensing fees | | | 15,990 | | | 6,410 | | | 3,125 | | | 3,169 | | | 3,184 | | | 3,170 | |
| Offering fees | | | — | | | — | | | 17,169 | | | 17,169 | | | 17,169 | | | 17,168 | |
| Legal fees | | | 17,759 | | | 7,142 | | | 980 | | | 988 | | | 992 | | | 966 | |
| Audit and tax fees | | | 14,961 | | | 14,962 | | | 14,967 | | | 14,967 | | | 14,967 | | | 14,967 | |
| Pricing fees | | | 13,573 | | | 13,573 | | | 2,795 | | | 2,795 | | | 2,795 | | | 2,778 | |
| Transfer agent fees | | | 11,967 | | | 11,967 | | | 8,953 | | | 8,954 | | | 8,954 | | | 8,953 | |
| Shareholder reporting fees | | | 8,055 | | | 1,593 | | | 1,846 | | | 1,850 | | | 1,852 | | | 1,839 | |
| Exchange listing fees | | | 4,986 | | | 4,986 | | | 3,857 | | | 3,857 | | | 3,858 | | | 3,857 | |
| Insurance fees | | | 1,694 | | | 602 | | | 70 | | | 68 | | | 70 | | | 72 | |
| Trustees’ fees and expenses | | | 1,082 | | | 402 | | | 79 | | | 80 | | | 80 | | | 78 | |
| Interest expense | | | — | | | — | | | — | | | 13 | | | — | | | — | |
| Registration fees | | | 27 | | | — | | | 126 | | | 228 | | | 127 | | | 228 | |
| Miscellaneous fees | | | 580 | | | 581 | | | 100 | | | 100 | | | 100 | | | 100 | |
| Total expenses before reimbursements/waivers | | | 402,337 | | | 241,138 | | | 79,455 | | | 78,371 | | | 80,587 | | | 79,225 | |
| Less: Reimbursements/waivers of expenses from sub-adviser | | | (249,227 | ) | | (191,473 | ) | | (70,782 | ) | | (69,310 | ) | | (71,813 | ) | | (70,518 | ) |
| Net expenses | | | 153,110 | | | 49,665 | | | 8,673 | | | 9,061 | | | 8,774 | | | 8,707 | |
| Net investment income (loss) | | | 330,727 | | | 152,756 | | | 2,304 | | | 6,541 | | | (1,383 | ) | | 27,898 | |
| |
| REALIZED AND UNREALIZED GAIN (LOSS) ON INVESTMENTS AND FOREIGN CURRENCY TRANSLATIONS: | | | | | | | | | | | | | | | | | | | |
| Net realized gain (loss) on: | | | | | | | | | | | | | | | | | | | |
| Investments | | | (965,498 | ) | | (30,095 | ) | | (31,085 | ) | | (116,451 | ) | | (60,236 | ) | | (10,817 | ) |
| In-Kind Redemptions | | | 2,280,846 | | | (382,258 | ) | | (77,254 | ) | | (19,235 | ) | | (58,170 | ) | | (16,617 | ) |
| Foreign currency transactions | | | (5,806 | ) | | (3,536 | ) | | (134 | ) | | (8,223 | ) | | (595 | ) | | (3,958 | ) |
| Net realized gain (loss) | | | 1,309,542 | | | (415,889 | ) | | (108,473 | ) | | (143,909 | ) | | (119,001 | ) | | (31,392 | ) |
| Change in unrealized appreciation (depreciation) on: | | | | | | | | | | | | | | | | | | | |
| Investments | | | (5,835,311 | ) | | (1,469,004 | ) | | 2,491 | | | (55,358 | ) | | 2,701 | | | 23,317 | |
| Foriegn currency translations | | | 1,202 | | | (294 | ) | | 16 | | | (11 | ) | | — | | | (57 | ) |
| Change in unrealized appreciation (depreciation) | | | (5,834,109 | ) | | (1,469,298 | ) | | 2,507 | | | (55,369 | ) | | 2,701 | | | 23,260 | |
| Net realized and unrealized gain (loss) on investments and foreign currency translations | | | (4,524,567 | ) | | (1,885,187 | ) | | (105,966 | ) | | (199,278 | ) | | (116,300 | ) | | (8,132 | ) |
| NET INCREASE (DECREASE) IN NET ASSETS RESULTING FROM OPERATIONS | | $ | (4,193,840 | ) | $ | (1,732,431 | ) | $ | (103,662 | ) | $ | (192,737 | ) | $ | (117,683 | ) | $ | 19,766 | |
| |
| * Net of foreign taxes withheld of: | | $ | 58,063 | | $ | 15,047 | | $ | 548 | | $ | 135 | | $ | 211 | | $ | 1,765 | |
| 1 | | Represents the period June 23, 2011 (commencement of operations) to March 31, 2012. |
The accompanying notes are an integral part of these financial statements.
| 76 and 77 EGA Emerging Global Shares Trust |
Statements of Operations (concluded)
EGA Emerging Global Shares Trust
Year Ended March 31, 2012
| | | EGShares
Utilities
GEMS ETF
(Consolidated)1 | | EGShares
Emerging Markets
Metals & Mining ETF
(Consolidated) | | EGShares
Emerging Markets
Consumer ETF
(Consolidated) |
| INVESTMENT INCOME: | | | | | | | | | | |
| Dividend income* | | $ | 32,248 | | $ | 732,428 | | $ | 4,172,495 | |
| Interest income | | | — | | | 75 | | | 5,127 | |
| Total investment income | | | 32,248 | | | 732,503 | | | 4,177,622 | |
| |
| EXPENSES: | | | | | | | | | | |
| Sub-advisory fees | | | 10,186 | | | 186,954 | | | 2,206,835 | |
| Investment advisory fees | | | 4,235 | | | 22,008 | | | 259,696 | |
| Custody fees | | | 14,349 | | | 38,557 | | | 232,786 | |
| Legal fees | | | 1,120 | | | 20,537 | | | 187,942 | |
| Shareholder reporting fees | | | 1,918 | | | 8,990 | | | 156,649 | |
| Licensing fees | | | 4,730 | | | 16,060 | | | 122,324 | |
| Administration and accounting fees | | | — | | | 95,564 | | | 115,729 | |
| Offering fees | | | 17,169 | | | — | | | 32,729 | |
| Excise tax | | | — | | | — | | | — | |
| Insurance fees | | | 67 | | | 2,186 | | | 21,317 | |
| Trustees’ fees and expenses | | | 91 | | | 1,429 | | | 15,732 | |
| Audit and tax fees | | | 14,967 | | | 14,962 | | | 15,000 | |
| Pricing fees | | | 2,795 | | | 13,573 | | | 13,573 | |
| Transfer agent fees | | | 8,954 | | | 11,967 | | | 11,967 | |
| Registration fees | | | 127 | | | 68 | | | 5,707 | |
| Exchange listing fees | | | 3,857 | | | 4,986 | | | 4,986 | |
| Interest expense | | | 228 | | | — | | | — | |
| Miscellaneous fees | | | 99 | | | 580 | | | 523 | |
| Total expenses before reimbursements/waivers | | | 84,892 | | | 438,421 | | | 3,403,495 | |
| Less: Reimbursements/waivers of expenses from sub-adviser | | | (74,475 | ) | | (251,382 | ) | | (1,195,954 | ) |
| Net expenses | | | 10,417 | | | 187,039 | | | 2,207,541 | |
| Net investment income (loss) | | | 21,831 | | | 545,464 | | | 1,970,081 | |
| |
| REALIZED AND UNREALIZED GAIN (LOSS) ON INVESTMENTS AND FOREIGN CURRENCY TRANSLATIONS: | | | | | | | | | | |
| Net realized gain (loss) on: | | | | | | | | | | |
| Investments | | | (48,702 | ) | | (802,333 | ) | | (1,277,541 | ) |
| In-Kind Redemptions | | | (83,145 | ) | | 1,111,849 | | | 2,883,920 | |
| Foreign currency transactions | | | (5,748 | ) | | 6,879 | | | (173,525 | ) |
| Net realized gain (loss) | | | (137,595 | ) | | 316,395 | | | 1,432,854 | |
| Change in unrealized appreciation (depreciation) on: | | | | | | | | | | |
| Investments | | | 127,725 | | | (9,372,737 | ) | | 27,550,122 | |
| Foriegn currency translations | | | (5 | ) | | 32 | | | 1,237 | |
| Change in unrealized appreciation (depreciation) | | | 127,720 | | | (9,372,705 | ) | | 27,551,359 | |
| Net realized and unrealized gain (loss) on investments and foreign currency translations | | | (9,875 | ) | | (9,056,310 | ) | | 28,984,213 | |
| NET INCREASE (DECREASE) IN NET ASSETS RESULTING FROM OPERATIONS | | $ | 11,956 | | $ | (8,510,846 | ) | $ | 30,954,294 | |
| |
| * Net of foreign taxes withheld of: | | $ | 2,122 | | $ | 60,620 | | $ | 204,838 | |
| 1 | | Represents the period June 23, 2011 (commencement of operations) to March 31, 2012. |
| 2 | | Represents the period August 10, 2011 (commencement of operations) to March 31, 2012. |
| 3 | | Represents the period August 4, 2011 (commencement of operations) to March 31, 2012. |
| | | EGShares
India
Infrastructure
ETF
(Consolidated) | | EGShares
China
Infrastructure
ETF | | EGShares
Brazil
Infrastructure
ETF | | EGShares
India
Small Cap ETF
(Consolidated) | | EGShares
India
Consumer ETF
(Consolidated)2 | | EGShares
Low Volatility Emerging
Markets Dividend ETF
(Consolidated)3 |
| INVESTMENT INCOME: | | | | | | | | | | | | | | | | | | | |
| Dividend income* | | $ | 850,275 | | $ | 430,025 | | $ | 3,968,905 | | $ | 474,283 | | $ | 16,047 | | $ | 538,719 | |
| Interest income | | | 159 | | | — | | | — | | | 5,538 | | | — | | | 96 | |
| Total investment income | | | 850,434 | | | 430,025 | | | 3,968,905 | | | 479,821 | | | 16,047 | | | 538,815 | |
| |
| EXPENSES: | | | | | | | | | | | | | | | | | | | |
| Sub-advisory fees | | | 582,058 | | | 140,370 | | | 677,796 | | | 240,846 | | | 16,683 | | | 131,919 | |
| Investment advisory fees | | | 68,507 | | | 16,522 | | | 79,771 | | | 28,824 | | | 9,754 | | | 52,706 | |
| Custody fees | | | 132,905 | | | 8,765 | | | 98,148 | | | 121,048 | | | 17,658 | | | 20,391 | |
| Legal fees | | | 55,699 | | | 15,890 | | | 61,146 | | | 25,901 | | | 14,222 | | | 31,764 | |
| Shareholder reporting fees | | | 49,306 | | | 6,706 | | | 31,665 | | | 10,643 | | | 2,406 | | | 9,514 | |
| Licensing fees | | | 103,968 | | | 20,436 | | | 98,481 | | | 55,064 | | | 16,754 | | | 29,414 | |
| Administration and accounting fees | | | 64,911 | | | 78,946 | | | 78,946 | | | 66,483 | | | — | | | — | |
| Offering fees | | | 45,866 | | | — | | | — | | | 41,564 | | | 8,509 | | | 10,622 | |
| Excise tax | | | — | | | — | | | 24,625 | | | — | | | — | | | — | |
| Insurance fees | | | 5,515 | | | 1,740 | | | 6,262 | | | 2,411 | | | 119 | | | 495 | |
| Trustees’ fees and expenses | | | 4,297 | | | 1,058 | | | 4,992 | | | 1,811 | | | 185 | | | 1,296 | |
| Audit and tax fees | | | 15,000 | | | 13,462 | | | 13,463 | | | 15,000 | | | 14,941 | | | 14,943 | |
| Pricing fees | | | 13,573 | | | 13,573 | | | 13,573 | | | 13,572 | | | 2,493 | | | 2,607 | |
| Transfer agent fees | | | 11,967 | | | 11,967 | | | 11,967 | | | 11,967 | | | 7,965 | | | 7,967 | |
| Registration fees | | | 150 | | | — | | | 411 | | | — | | | 436 | | | 2,015 | |
| Exchange listing fees | | | 4,986 | | | 4,986 | | | 4,986 | | | 4,986 | | | 3,200 | | | 3,282 | |
| Interest expense | | | — | | | — | | | 62 | | | — | | | — | | | — | |
| Miscellaneous fees | | | 503 | | | 288 | | | 444 | | | 360 | | | 97 | | | 2,599 | |
| Total expenses before reimbursements/waivers | | | 1,159,211 | | | 334,709 | | | 1,206,738 | | | 640,480 | | | 115,422 | | | 321,534 | |
| Less: Reimbursements/waivers of expenses from sub-adviser | | | (577,187 | ) | | (194,340 | ) | | (504,255 | ) | | (399,568 | ) | | (98,710 | ) | | (189,604 | ) |
| Net expenses | | | 582,024 | | | 140,369 | | | 702,483 | | | 240,912 | | | 16,712 | | | 131,930 | |
| Net investment income (loss) | | | 268,410 | | | 289,656 | | | 3,266,422 | | | 238,909 | | | (665 | ) | | 406,885 | |
| |
| REALIZED AND UNREALIZED GAIN (LOSS) ON INVESTMENTS AND FOREIGN CURRENCY TRANSLATIONS: | | | | | | | | | | | | | | | | | | | |
| Net realized gain (loss) on: | | | | | | | | | | | | | | | | | | | |
| Investments | | | (10,919,711 | ) | | (1,488,836 | ) | | (6,060,839 | ) | | (12,974,447 | ) | | (31,407 | ) | | (539,967 | ) |
| In-Kind Redemptions | | | — | | | 926,796 | | | — | | | — | | | — | | | 1,612,244 | |
| Foreign currency transactions | | | 72,739 | | | (968 | ) | | (83,531 | ) | | (64,682 | ) | | (16,522 | ) | | (111,782 | ) |
| Net realized gain (loss) | | | (10,846,972 | ) | | (563,008 | ) | | (6,144,370 | ) | | (13,039,129 | ) | | (47,929 | ) | | 960,495 | |
| Change in unrealized appreciation (depreciation) on: | | | | | | | | | | | | | | | | | | | |
| Investments | | | (9,305,028 | ) | | (4,834,847 | ) | | 351,705 | | | 4,377,091 | | | 102,457 | | | 1,230,121 | |
| Foriegn currency translations | | | (3,084 | ) | | — | | | (19,935 | ) | | 1,243 | | | 13 | | | (802 | ) |
| Change in unrealized appreciation (depreciation) | | | (9,308,112 | ) | | (4,834,847 | ) | | 331,770 | | | 4,378,334 | | | 102,470 | | | 1,229,319 | |
| Net realized and unrealized gain (loss) on investments and foreign currency translations | | | (20,155,084 | ) | | (5,397,855 | ) | | (5,812,600 | ) | | (8,660,795 | ) | | 54,541 | | | 2,189,814 | |
| NET INCREASE (DECREASE) IN NET ASSETS RESULTING FROM OPERATIONS | | $ | (19,886,674 | ) | $ | (5,108,199 | ) | $ | (2,546,178 | ) | $ | (8,421,886 | ) | $ | 53,876 | | $ | 2,596,699 | |
| |
| * Net of foreign taxes withheld of: | | $ | — | | $ | 29,096 | | $ | 132,640 | | $ | — | | $ | — | | $ | 42,545 | |
| 1 | | Represents the period June 23, 2011 (commencement of operations) to March 31, 2012. |
| 2 | | Represents the period August 10, 2011 (commencement of operations) to March 31, 2012. |
| 3 | | Represents the period August 4, 2011 (commencement of operations) to March 31, 2012. |
The accompanying notes are an integral part of these financial statements.
| 78 and 79 EGA Emerging Global Shares Trust |
Statements of Changes in Net Assets
EGA Emerging Global Shares Trust
| | | | | | | | | | | | | | | | |
| | | EGShares GEMS Composite ETF
(Consolidated)1 | | EGShares Basic
Materials GEMS ETF
(Consolidated) | | EGShares
Consumer Goods
GEMS ETF
(Consolidated) | | EGShares
Consumer Services
GEMS ETF |
| | | For the
Year Ended
March 31, 2012 | | For the
Year Ended
March 31, 2011 | | For the Period
June 23, 20112
Through
March 31, 2012 | | For the Period
June 23, 20112
Through
March 31, 2012 | | For the Period
June 23, 20112
Through
March 31, 2012 |
| INCREASE (DECREASE) IN NET ASSETS RESULTING FROM OPERATIONS: | | | | | | | | | | | | | | | | |
| Net investment income (loss) | | $ | 449,817 | | $ | 441,879 | | $ | 20,941 | | $ | 14,034 | | $ | (1,465 | ) |
| Net realized gain (loss) on investments and foreign currency transactions | | | (1,592,121 | ) | | 323,391 | | | (97,898 | ) | | 13,216 | | | 32,924 | |
| Net unrealized appreciation (depreciation) on investments and foreign currency translations | | | (4,514,273 | ) | | 2,208,345 | | | (260,488 | ) | | 120,135 | | | 22,637 | |
| Net increase (decrease) in net assets resulting from operations | | | (5,656,577 | ) | | 2,973,615 | | | (337,445 | ) | | 147,385 | | | 54,096 | |
| |
| DISTRIBUTIONS TO SHAREHOLDERS: | | | | | | | | | | | | | | | | |
| Net investment income | | | (312,176 | ) | | (644,426 | ) | | (15,017 | ) | | (11,203 | ) | | (1,186 | ) |
| |
| CAPITAL SHARE TRANSACTIONS: | | | | | | | | | | | | | | | | |
| Proceeds from sale of shares | | | 5,814,766 | | | 11,669,431 | | | 2,870,607 | | | 4,092,709 | | | 4,942,777 | |
| Cost of shares redeemed | | | (17,734,608 | ) | | (13,879,381 | ) | | (927,874 | ) | | (3,124,066 | ) | | (3,952,148 | ) |
| Transaction fees | | | (88 | ) | | — | | | (271 | ) | | (646 | ) | | — | |
| Net increase (decrease) in net assets resulting from capital share transactions | | | (11,919,930 | ) | | (2,209,950 | ) | | 1,942,462 | | | 967,997 | | | 990,629 | |
| Net Increase (Decrease) in Net Assets | | | (17,888,683 | ) | | 119,239 | | | 1,590,000 | | | 1,104,179 | | | 1,043,539 | |
| |
| NET ASSETS: | | | | | | | | | | | | | | | | |
| Beginning of period | | | 31,874,481 | | | 31,755,242 | | | — | | | — | | | — | |
| End of period | | $ | 13,985,798 | | $ | 31,874,481 | | $ | 1,590,000 | | $ | 1,104,179 | | $ | 1,043,539 | |
| Accumulated net investment income (loss) included in net assets at end of period | | $ | (19,886 | ) | $ | (160,618 | ) | $ | 4,500 | | $ | 3,470 | | $ | (1,061 | ) |
| |
| SHARES CREATED AND REDEEMED: | | | | | | | | | | | | | | | | |
| Shares outstanding, beginning of period | | | 1,155,000 | | | 1,305,000 | | | — | | | — | | | — | |
| Shares sold | | | 250,000 | | | 450,000 | | | 150,000 | | | 200,000 | | | 250,000 | |
| Shares redeemed | | | (805,000 | ) | | (600,000 | ) | | (50,000 | ) | | (150,000 | ) | | (200,000 | ) |
| Shares outstanding, end of period | | | 600,000 | | | 1,155,000 | | | 100,000 | | | 50,000 | | | 50,000 | |
| 1 | | On September 16, 2010 there was a 2 for 1 forward stock split. Historical share amounts have been adjusted to reflect the 2 for 1 forward stock split on a retroactive basis |
| 2 | | Commencement of operations. |
| | | | | | | | | | | | | | | | | | | | | | | | | | |
| | | EGShares Energy
GEMS ETF
(Consolidated)1 | | EGShares Financials
GEMS ETF
(Consolidated)1 | | EGShares Health
Care GEMS ETF
(Consolidated) | | EGShares
Industrials
GEMS ETF
(Consolidated) | | EGShares
Technology
GEMS ETF
(Consolidated) | | EGShares
Telecom
GEMS ETF
(Consolidated) |
| | | For the
Year Ended
March 31,
2012 | | For the
Year Ended
March 31,
2011 | | For the
Year Ended
March 31,
2012 | | For the
Year Ended
March 31,
2011 | | For the Period
June 23, 20112
Through
March 31, 2012 | | For the Period
June 23, 20112
Through
March 31, 2012 | | For the Period
June 23, 20112
Through
March 31, 2012 | | For the Period
June 23, 20112
Through
March 31, 2012 |
| INCREASE (DECREASE) IN NET ASSETS RESULTING FROM OPERATIONS: | | | | | | | | | | | | | | | | | | | | | | | | | |
| Net investment income (loss) | | $ | 330,727 | | $ | 123,085 | | $ | 152,756 | | $ | 187,531 | | $ | 2,304 | | $ | 6,541 | | $ | (1,383 | ) | $ | 27,898 | |
| Net realized gain (loss) on investments and foreign currency transactions | | | 1,309,542 | | | (25,280 | ) | | (415,889 | ) | | 412,798 | | | (108,473 | ) | | (143,909 | ) | | (119,001 | ) | | (31,392 | ) |
| Net unrealized appreciation (depreciation) on investments and foreign currency translations | | | (5,834,109 | ) | | 3,554,511 | | | (1,469,298 | ) | | 303,701 | | | 2,507 | | | (55,369 | ) | | 2,701 | | | 23,260 | |
| Net increase (decrease) in net assets resulting from operations | | | (4,193,840 | ) | | 3,652,316 | | | (1,732,431 | ) | | 904,030 | | | (103,662 | ) | | (192,737 | ) | | (117,683 | ) | | 19,766 | |
| |
| DISTRIBUTIONS TO SHAREHOLDERS: | | | | | | | | | | | | | | | | | | | | | | | | | |
| Net investment income | | | (309,030 | ) | | (144,970 | ) | | (52,077 | ) | | (398,935 | ) | | (1,891 | ) | | (1,831 | ) | | — | | | (10,536 | ) |
| |
| CAPITAL SHARE TRANSACTIONS: | | | | | | | | | | | | | | | | | | | | | | | | | |
| Proceeds from sale of shares | | | 10,787,713 | | | 15,043,490 | | | 5,241,705 | | | 9,604,582 | | | 3,852,559 | | | 5,614,977 | | | 4,651,039 | | | 5,902,467 | |
| Cost of shares redeemed | | | (20,507,227 | ) | | (2,718,340 | ) | | (10,481,218 | ) | | (5,916,109 | ) | | (1,837,994 | ) | | (3,541,987 | ) | | (2,644,489 | ) | | (2,879,951 | ) |
| Transaction fees | | | (546 | ) | | — | | | 3 | | | — | | | (310 | ) | | (671 | ) | | (467 | ) | | (73 | ) |
| Net increase (decrease) in net assets resulting from capital share transactions | | | (9,720,060 | ) | | 12,325,150 | | | (5,239,510 | ) | | 3,688,473 | | | 2,014,255 | | | 2,072,319 | | | 2,006,083 | | | 3,022,443 | |
| Net Increase (Decrease) in Net Assets | | | (14,222,930 | ) | | 15,832,496 | | | (7,024,018 | ) | | 4,193,568 | | | 1,908,702 | | | 1,877,751 | | | 1,888,400 | | | 3,031,673 | |
| |
| NET ASSETS: | | | | | | | | | | | | | | | | | | | | | | | | | |
| Beginning of period | | | 25,439,717 | | | 9,607,221 | | | 11,045,658 | | | 6,852,090 | | | — | | | — | | | — | | | — | |
| End of period | | $ | 11,216,787 | | $ | 25,439,717 | | $ | 4,021,640 | | $ | 11,045,658 | | $ | 1,908,702 | | $ | 1,877,751 | | $ | 1,888,400 | | $ | 3,031,673 | |
| Accumulated net investment income (loss) included in net assets at end of period | | $ | (41,545 | ) | $ | (57,436 | ) | $ | (15,553 | ) | $ | (160,314 | ) | $ | 2,153 | | $ | (637 | ) | $ | — | | $ | 15,242 | |
| |
| SHARES CREATED AND REDEEMED: | | | | | | | | | | | | | | | | | | | | | | | | | |
| Shares outstanding, beginning of period | | | 850,000 | | | 400,000 | | | 450,000 | | | 300,000 | | | — | | | — | | | — | | | — | |
| Shares sold | | | 400,000 | | | 550,000 | | | 250,000 | | | 400,000 | | | 200,000 | | | 300,000 | | | 250,000 | | | 300,000 | |
| Shares redeemed | | | (800,000 | ) | | (100,000 | ) | | (500,000 | ) | | (250,000 | ) | | (100,000 | ) | | (200,000 | ) | | (150,000 | ) | | (150,000 | ) |
| Shares outstanding, end of period | | | 450,000 | | | 850,000 | | | 200,000 | | | 450,000 | | | 100,000 | | | 100,000 | | | 100,000 | | | 150,000 | |
| 1 | | On September 16, 2010 there was a 2 for 1 forward stock split. Historical share amounts have been adjusted to reflect the 2 for 1 forward stock split on a retroactive basis |
| 2 | | Commencement of operations. |
The accompanying notes are an integral part of these financial statements.
| 80 and 81 EGA Emerging Global Shares Trust |
Statements of Changes in Net Assets (concluded)
EGA Emerging Global Shares Trust
| | | EGShares Utilities
GEMS ETF
(Consolidated) | | EGShares Emerging Markets
Metals & Mining ETF
(Consolidated)1 | | EGShares Emerging Markets
Consumer ETF
(Consolidated) | | EGShares India Infrastructure ETF
(Consolidated) |
| | | For the Period
June 23, 20112
Through
March 31, 2012 | | For the
Year Ended
March 31, 2012 | | For the
Year Ended
March 31, 2011 | | For the
Year Ended
March 31, 2012 | | For the Period
September 14, 20102
Through
March 31, 2011 | | For the
Year Ended
March 31, 2012 | | For the Period
August 11, 20102
Through
March 31, 2011 |
| INCREASE (DECREASE) IN NET ASSETS RESULTING FROM OPERATIONS: | | | | | | | | | | | | | | | | | | | | | | |
| Net investment income (loss) | | $ | 21,831 | | $ | 545,464 | | $ | 172,404 | | $ | 1,970,081 | | $ | 252,091 | | $ | 268,410 | | $ | 29,073 | |
Net realized gain (loss
on investments and foreign currency transactions | | | (137,595 | ) | | 316,395 | | | 275,522 | | | 1,432,854 | | | (459,563 | ) | | (10,846,972 | ) | | (181,096 | ) |
| Net unrealized appreciation (depreciation) on investments and foreign currency translations | | | 127,720 | | | (9,372,705 | ) | | 2,521,470 | | | 27,551,359 | | | 6,165,458 | | | (9,308,112 | ) | | (6,157,843 | ) |
| Net increase (decrease) in net assets resulting from operations | | | 11,956 | | | (8,510,846 | ) | | 2,969,396 | | | 30,954,294 | | | 5,957,986 | | | (19,886,674 | ) | | (6,309,866 | ) |
| |
| DISTRIBUTIONS TO SHAREHOLDERS: | | | | | | | | | | | | | | | | | | | | | |
| Net investment income | | | (9,988 | ) | | (532,215 | ) | | (203,413 | ) | | (1,634,800 | ) | | (115,161 | ) | | (344,824 | ) | | — | |
| |
| CAPITAL SHARE TRANSACTIONS: | | | | | | | | | | | | | | | | | | | | | |
| Proceeds from sale of shares | | | 3,672,180 | | | 5,244,146 | | | 14,511,574 | | | 195,117,317 | | | 199,856,513 | | | 3,189,751 | | | 93,889,722 | |
| Cost of shares redeemed | | | (885,693 | ) | | (19,702,991 | ) | | (7,039,234 | ) | | (16,583,599 | ) | | (11,096,209 | ) | | (7,631,044 | ) | | (2,203,911 | ) |
| Transaction fees | | | (320 | ) | | (546 | ) | | — | | | 1,525 | | | 8,181 | | | (2,023 | ) | | 1,507 | |
| Net increase (decrease) in net assets resulting from capital share transactions | | | 2,786,167 | | | (14,459,391 | ) | | 7,472,340 | | | 178,535,243 | | | 188,768,485 | | | (4,443,316 | ) | | 91,687,318 | |
| Net Increase (Decrease) in Net Assets | | | 2,788,135 | | | (23,502,452 | ) | | 10,238,323 | | | 207,854,737 | | | 194,611,310 | | | (24,674,814 | ) | | 85,377,452 | |
| |
| NET ASSETS: | | | | | | | | | | | | | | | | | | | | | | |
| Beginning of period | | | — | | | 37,878,466 | | | 27,640,143 | | | 194,611,310 | | | — | | | 85,377,452 | | | — | |
| End of period | | $ | 2,788,135 | | $ | 14,376,014 | | $ | 37,878,466 | | $ | 402,466,047 | | $ | 194,611,310 | | $ | 60,702,638 | | $ | 85,377,452 | |
| Accumulated net investment income (loss) included in net assets at end of period | | $ | 8,394 | | $ | (36,159 | ) | $ | (56,287 | ) | $ | 124,633 | | $ | (13,669 | ) | $ | 102,219 | | $ | 6,451 | |
| |
| SHARES CREATED AND REDEEMED: | | | | | | | | | | | | | | | | | | | | | |
| Shares outstanding, beginning of period | | | — | | | 1,650,000 | | | 1,350,000 | | | 8,550,000 | | | — | | | 4,400,000 | | | — | |
| Shares sold | | | 200,000 | | | 300,000 | | | 650,000 | | | 8,450,000 | | | 9,050,000 | | | 200,000 | | | 4,500,000 | |
| Shares redeemed | | | (50,000 | ) | | (1,050,000 | ) | | (350,000 | ) | | (750,000 | ) | | (500,000 | ) | | (550,000 | ) | | (100,000 | ) |
| Shares outstanding, end of period | | | 150,000 | | | 900,000 | | | 1,650,000 | | | 16,250,000 | | | 8,550,000 | | | 4,050,000 | | | 4,400,000 | |
| 1 | | On September 16, 2010 there was a 3 for 1 forward stock split. Historical share amounts have been adjusted to reflect the 3 for 1 forward stock split on a retroactive basis |
| | | | | | | | | | | | | | | | | | | | | | | | | |
| | | EGShares China
Infrastructure ETF | | EGShares Brazil
Infrastructure ETF | | EGShares India Small Cap ETF
(Consolidated) | | EGShares India
Consumer ETF
(Consolidated) | | EGShares
Low Volatility
Emerging Markets
Dividend ETF
(Consolidated) |
| | | For the
Year Ended
March 31, 2012 | | For the
Year Ended
March 31, 2011 | | For the
Year Ended
March 31, 2012 | | For the
Year Ended
March 31, 2011 | | For the
Year Ended
March 31, 2012 | | For the Period
July 7, 20102
Through
March 31, 2011 | | For the Period
August 10, 20112
Through
March 31, 2012 | | For the Period
August 4, 20112
Through
March 31, 2012 |
| INCREASE (DECREASE) IN NET ASSETS RESULTING FROM OPERATIONS: | | | | | | | | | | | | | | | | | | | | | | | | | |
| Net investment income (loss) | | $ | 289,656 | | $ | 57,693 | | $ | 3,266,422 | | $ | 944,389 | | $ | 238,909 | | $ | (9,977 | ) | $ | (665 | ) | $ | 406,885 | |
| Net realized gain (loss) on investments and foreign currency transactions | | | (563,008 | ) | | 224,130 | | | (6,144,370 | ) | | 43,568 | | | (13,039,129 | ) | | (52,060 | ) | | (47,929 | ) | | 960,495 | |
| Net unrealized appreciation (depreciation) on investments and foreign currency translations | | | (4,834,847 | ) | | 1,261,211 | | | 331,770 | | | 10,009,758 | | | 4,378,334 | | | (4,634,960 | ) | | 102,470 | | | 1,229,319 | |
| Net increase (decrease) in net assets resulting from operations | | | (5,108,199 | ) | | 1,543,034 | | | (2,546,178 | ) | | 10,997,715 | | | (8,421,886 | ) | | (4,696,997 | ) | | 53,876 | | | 2,596,699 | |
| |
| DISTRIBUTIONS TO SHAREHOLDERS: | | | | | | | | | | | | | | | | | | | | | | | | |
| Net investment income | | | (324,416 | ) | | (109,650 | ) | | (3,135,584 | ) | | (862,977 | ) | | (254,107 | ) | | (34,485 | ) | | — | | | (659,822 | ) |
| |
| CAPITAL SHARE TRANSACTIONS: | | | | | | | | | | | | | | | | | | | | | | | | |
| Proceeds from sale of shares | | | 5,989,764 | | | 18,255,814 | | | 22,319,521 | | | 62,322,748 | | | 8,163,191 | | | 39,458,782 | | | 3,835,493 | | | 72,180,393 | |
| Cost of shares redeemed | | | (9,385,596 | ) | | (4,792,601 | ) | | (10,807,230 | ) | | — | | | (7,596,936 | ) | | — | | | (1,980,060 | ) | | (14,863,146 | ) |
| Transaction fees | | | — | | | — | | | — | | | — | | | (2,593 | ) | | 1,223 | | | (948 | ) | | 781 | |
| Net increase (decrease) in net assets resulting from capital share transactions | | | (3,395,832 | ) | | 13,463,213 | | | 11,512,291 | | | 62,322,748 | | | 563,662 | | | 39,460,005 | | | 1,854,485 | | | 57,318,028 | |
| Net Increase (Decrease) in Net Assets | | | (8,828,447 | ) | | 14,896,597 | | | 5,830,529 | | | 72,457,486 | | | (8,112,331 | ) | | 34,728,523 | | | 1,908,361 | | | 59,254,905 | |
| |
| NET ASSETS: | | | | | | | | | | | | | | | | | | | | | | | | | |
| Beginning of period | | | 21,131,550 | | | 6,234,953 | | | 83,760,222 | | | 11,302,736 | | | 34,728,523 | | | — | | | — | | | — | |
| End of period | | $ | 12,303,103 | | $ | 21,131,550 | | $ | 89,590,751 | | $ | 83,760,222 | | $ | 26,616,192 | | $ | 34,728,523 | | $ | 1,908,361 | | $ | 59,254,905 | |
| Accumulated net investment income (loss) included in net assets at end of period | | $ | (28,354 | ) | $ | 7,374 | | $ | 826,959 | | $ | 101,230 | | $ | (48,453 | ) | $ | (12,100 | ) | $ | (743 | ) | $ | (360,697 | ) |
| |
| SHARES CREATED AND REDEEMED: | | | | | | | | | | | | | | | | | | | | | | | | |
| Shares outstanding, beginning of period | | | 950,000 | | | 300,000 | | | 3,300,000 | | | 550,000 | | | 1,800,000 | | | — | | | — | | | — | |
| Shares sold | | | 300,000 | | | 900,000 | | | 900,000 | | | 2,750,000 | | | 500,000 | | | 1,800,000 | | | 200,000 | | | 3,700,000 | |
| Shares redeemed | | | (500,000 | ) | | (250,000 | ) | | (500,000 | ) | | — | | | (450,000 | ) | | — | | | (100,000 | ) | | (750,000 | ) |
| Shares outstanding, end of period | | | 750,000 | | | 950,000 | | | 3,700,000 | | | 3,300,000 | | | 1,850,000 | | | 1,800,000 | | | 100,000 | | | 2,950,000 | |
| 2 | | Commencement of operations. |
| 1 | | On September 16, 2010 there was a 3 for 1 forward stock split. Historical share amounts have been adjusted to reflect the 3 for 1 forward stock split on a retroactive basis |
| 2 | | Commencement of operations. |
The accompanying notes are an integral part of these financial statements.
| 82 and 83 EGA Emerging Global Shares Trust |
Financial Highlights
EGA Emerging Global Shares Trust
For a share outstanding throughout each period
| EGShares GEMS Composite ETF (Consolidated)1 | | | | | | | | | |
| | For the
Year Ended
March 31, 2012 | | For the
Year Ended
March 31, 2011 | | For the Period
July 22, 20092
Through
March 31, 2010 |
| Net asset value, beginning of period | $ | 27.60 | | $ | 24.34 | | $ | 20.00 | |
| Investment operations: | | | | | | | | | |
| Net investment income3 | | 0.47 | | | 0.39 | | | 0.09 | |
| Net realized and unrealized gain (loss) on investments and foreign currency translations | | (4.37 | ) | | 3.48 | | | 4.31 | |
| Total from investment operations | | (3.90 | ) | | 3.87 | | | 4.40 | |
| Distributions to shareholders: | | | | | | | | | |
| Net investment income | | (0.39 | ) | | (0.61 | ) | | (0.06 | ) |
| Net asset value, end of period | $ | 23.31 | | $ | 27.60 | | $ | 24.34 | |
| NET ASSET VALUE TOTAL RETURN4 | | (13.97 | )% | | 16.04 | % | | 21.96 | % |
| |
| RATIOS/SUPPLEMENTAL DATA: | | | | | | | | | |
| Net assets, end of period (000’s omitted) | $ | 13,986 | | $ | 31,874 | | $ | 31,755 | |
| Ratios to average net assets: | | | | | | | | | |
| Expenses, net of expense reimbursements/waivers | | 0.75 | % | | 0.75 | % | | 0.75 | %5 |
| Expenses, prior to expense reimbursements/waivers | | 1.84 | % | | 2.00 | % | | 3.43 | %5 |
| Net investment income | | 1.94 | % | | 1.55 | % | | 0.52 | %5 |
| Portfolio turnover rate | | 10 | % | | 39 | % | | 6 | %6 |
| |
| EGShares Basic Materials GEMS ETF (Consolidated) | | | | | | | | | |
| | | | | | | | For the Period
June 23, 20112
Through
March 31, 2012 |
| Net asset value, beginning of period | | | | | | | $ | 20.00 | |
| Investment operations: | | | | | | | | | |
| Net investment income3 | | | | | | | | 0.31 | |
| Net realized and unrealized loss on investments and foreign currency translations | | | | | | | | (4.11 | ) |
| Total from investment operations | | | | | | | | (3.80 | ) |
| Distributions to shareholders: | | | | | | | | | |
| Net investment income | | | | | | | | (0.30 | ) |
| Net asset value, end of period | | | | | | | $ | 15.90 | |
| NET ASSET VALUE TOTAL RETURN4 | | | | | | | | (18.87 | )% |
| |
| RATIOS/SUPPLEMENTAL DATA: | | | | | | | | | |
| Net assets, end of period (000’s omitted) | | | | | | | $ | 1,590 | |
| Ratios to average net assets: | | | | | | | | | |
| Expenses, net of expense reimbursements/waivers | | | | | | | | 0.85 | %5 |
| Expenses, prior to expense reimbursements/waivers | | | | | | | | 7.99 | %5 |
| Net investment income | | | | | | | | 2.30 | %5 |
| Portfolio turnover rate | | | | | | | | 21 | %6 |
| 1 | | On September 16, 2010, there was a 2 for 1 forward stock split. Historical share amounts have been adjusted to reflect the 2 for 1 forward stock split on a retroactive basis. |
| 2 | | Commencement of operations. |
| 3 | | Based on average shares outstanding. |
| 4 | | Total return is calculated assuming an initial investment made at the net asset value at the beginning of the period, reinvestment of all dividends and distributions at net asset value during the period, and redemption at net asset value on the last day of the period. Total return calculated for a period of less than one year is not annualized. The total return would have been lower if certain expenses had not been reimbursed/waived by the sub-adviser. |
The accompanying notes are an integral part of these financial statements.
| 84 EGA Emerging Global Shares Trust |
Financial Highlights (continued)
EGA Emerging Global Shares Trust
For a share outstanding throughout each period
| EGShares Consumer Goods GEMS ETF (Consolidated) | | | |
| | For the Period
June 23, 20111
Through
March 31, 2012 |
| Net asset value, beginning of period | $ | 20.00 | |
| Investment operations: | | | |
| Net investment income2 | | 0.23 | |
| Net realized and unrealized gain on investments and foreign currency translations | | 2.07 | |
| Total from investment operations | | 2.30 | |
| Distributions to shareholders: | | | |
| Net investment income | | (0.22 | ) |
| Net asset value, end of period | $ | 22.08 | |
| NET ASSET VALUE TOTAL RETURN3 | | 11.62 | % |
| |
| RATIOS/SUPPLEMENTAL DATA: | | | |
| Net assets, end of period (000’s omitted) | $ | 1,104 | |
| Ratios to average net assets: | | | |
| Expenses, net of expense reimbursements/waivers | | 0.85 | %4 |
| Expenses, prior to expense reimbursements/waivers | | 8.77 | %4 |
| Net investment income | | 1.45 | %4 |
| Portfolio turnover rate | | 50 | %5 |
| |
| EGShares Consumer Services GEMS ETF | | | |
| | For the Period
June 23, 20111
Through
March 31, 2012 |
| Net asset value, beginning of period | $ | 20.00 | |
| Investment operations: | | | |
| Net investment loss2 | | (0.03 | ) |
| Net realized and unrealized gain on investments and foreign currency translations | | 0.92 | |
| Total from investment operations | | 0.89 | |
| Distributions to shareholders: | | | |
| Net investment income | | (0.02 | ) |
| Net asset value, end of period | $ | 20.87 | |
| NET ASSET VALUE TOTAL RETURN3 | | 4.49 | % |
| |
| RATIOS/SUPPLEMENTAL DATA: | | | |
| Net assets, end of period (000’s omitted) | $ | 1,044 | |
| Ratios to average net assets: | | | |
| Expenses, net of expense reimbursements/waivers | | 0.85 | %4 |
| Expenses, prior to expense reimbursements/waivers | | 6.77 | %4 |
| Net investment loss | | (0.18 | )%4 |
| Portfolio turnover rate | | 51 | %5 |
| 1 | | Commencement of operations. |
| 2 | | Based on average shares outstanding. |
| 3 | | Total return is calculated assuming an initial investment made at the net asset value at the beginning of the period, reinvestment of all dividends and distributions at net asset value during the period, and redemption at net asset value on the last day of the period. Total return calculated for a period of less than one year is not annualized. The total return would have been lower if certain expenses had not been reimbursed/waived by the sub-adviser. |
The accompanying notes are an integral part of these financial statements.
| EGA Emerging Global Shares Trust 85 |
Financial Highlights (continued)
EGA Emerging Global Shares Trust
For a share outstanding throughout each period
| EGShares Energy GEMS ETF (Consolidated)1 | | | | | | | | | |
| | For the
Year Ended
March 31, 2012 | | For the
Year Ended
March 31, 2011 | | For the Period
May 21, 20092
Through
March 31, 2010 |
| Net asset value, beginning of period | $ | 29.93 | | $ | 24.02 | | $ | 20.49 | |
| Investment operations: | | | | | | | | | |
| Net investment income3 | | 0.47 | | | 0.26 | | | 0.09 | |
| Net realized and unrealized gain (loss) on investments and foreign currency translations | | (4.95 | ) | | 5.94 | | | 3.50 | |
| Total from investment operations | | (4.48 | ) | | 6.20 | | | 3.59 | |
| Distributions to shareholders: | | | | | | | | | |
| Net investment income | | (0.52 | ) | | (0.29 | ) | | (0.06 | ) |
| Net asset value, end of period | $ | 24.93 | | $ | 29.93 | | $ | 24.02 | |
| NET ASSET VALUE TOTAL RETURN4 | | (14.78 | )% | | 25.96 | % | | 17.53 | %5 |
| |
| RATIOS/SUPPLEMENTAL DATA: | | | | | | | | | |
| Net assets, end of period (000’s omitted) | $ | 11,217 | | $ | 25,440 | | $ | 9,607 | |
| Ratios to average net assets: | | | | | | | | | |
| Expenses, net of expense reimbursements/waivers | | 0.85 | % | | 0.85 | % | | 0.85 | %6 |
| Expenses, prior to expense reimbursements/waivers | | 2.23 | % | | 2.56 | % | | 5.90 | %6 |
| Net investment income | | 1.84 | % | | 1.04 | % | | 0.49 | %6 |
| Portfolio turnover rate | | 19 | % | | 19 | % | | 49 | %7 |
| |
| EGShares Financials GEMS ETF (Consolidated)1 | | | | | | | | | |
| |
| | | For the
Year Ended
March 31, 2012 | | | For the
Year Ended
March 31, 2011 | | | For the Period
September 16, 20092
Through
March 31, 2010 |
| Net asset value, beginning of period | $ | 24.55 | | $ | 22.84 | | $ | 20.12 | |
| Investment operations: | | | | | | | | | |
| Net investment income3 | | 0.57 | | | 0.42 | | | 0.08 | |
| Net realized and unrealized gain (loss) on investments and foreign currency translations | | (4.66 | ) | | 2.09 | | | 2.71 | |
| Total from investment operations | | (4.09 | ) | | 2.51 | | | 2.79 | |
| Distributions to shareholders: | | | | | | | | | |
| Net investment income | | (0.35 | ) | | (0.80 | ) | | (0.07 | ) |
| Net asset value, end of period | $ | 20.11 | | $ | 24.55 | | $ | 22.84 | |
| NET ASSET VALUE TOTAL RETURN4 | | (16.52 | )% | | 11.03 | % | | 13.87 | % |
| |
| RATIOS/SUPPLEMENTAL DATA: | | | | | | | | | |
| Net assets, end of period (000’s omitted) | $ | 4,022 | | $ | 11,046 | | $ | 6,852 | |
| Ratios to average net assets: | | | | | | | | | |
| Expenses, net of expense reimbursements/waivers | | 0.85 | % | | 0.85 | % | | 0.85 | %6 |
| Expenses, prior to expense reimbursements/waivers | | 4.13 | % | | 2.81 | % | | 5.47 | %6 |
| Net investment income | | 2.62 | % | | 1.77 | % | | 0.67 | %6 |
| Portfolio turnover rate | | 25 | % | | 39 | % | | 12 | %7 |
| 1 | | On September 16, 2010, there was a 2 for 1 forward stock split. Historical share amounts have been adjusted to reflect the 2 for 1 forward stock split on a retroactive basis. |
| 2 | | Commencement of operations. |
| 3 | | Based on average shares outstanding. |
| 4 | | Total return is calculated assuming an initial investment made at the net asset value at the beginning of the period, reinvestment of all dividends and distributions at net asset value during the period, and redemption at net asset value on the last day of the period. Total return calculated for a period of less than one year is not annualized. The total return would have been lower if certain expenses had not been reimbursed/waived by the sub-adviser. |
| 5 | | For the period ended March 31, 2010, 0.73% of the Fund’s total return consists of a voluntary reimbursement by the current and former sub-advisers for a realized investment loss, and another (1.08)% consists of a loss on an investment not meeting the Fund’s investment restrictions. Excluding these items, total return would have been 17.88%. |
The accompanying notes are an integral part of these financial statements.
| 86 EGA Emerging Global Shares Trust |
Financial Highlights (continued)
EGA Emerging Global Shares Trust
For a share outstanding throughout each period
| | | |
| EGShares Health Care GEMS ETF (Consolidated) | | | |
| | For the Period
June 23, 20111
Through
March 31, 2012 |
| Net asset value, beginning of period | $ | 20.00 | |
| Investment operations: | | | |
| Net investment income2 | | 0.03 | |
| Net realized and unrealized loss on investments and foreign currency translations | | (0.90 | ) |
| Total from investment operations | | (0.87 | ) |
| Distributions to shareholders: | | | |
| Net investment income | | (0.04 | ) |
| Net asset value, end of period | $ | 19.09 | |
| NET ASSET VALUE TOTAL RETURN3 | | (4.33 | )% |
| |
| RATIOS/SUPPLEMENTAL DATA: | | | |
| Net assets, end of period (000’s omitted) | $ | 1,909 | |
| Ratios to average net assets: | | | |
| Expenses, net of expense reimbursements/waivers | | 0.85 | %4 |
| Expenses, prior to expense reimbursements/waivers | | 7.79 | %4 |
| Net investment income | | 0.23 | %4 |
| Portfolio turnover rate | | 26 | %5 |
| |
| EGShares Industrials GEMS ETF (Consolidated) | | | |
| | For the Period
June 23, 20111
Through
March 31, 2012 |
| Net asset value, beginning of period | $ | 20.00 | |
| Investment operations: | | | |
| Net investment income2 | | 0.09 | |
| Net realized and unrealized loss on investments and foreign currency translations | | (1.27 | ) |
| Total from investment operations | | (1.18 | ) |
| Distributions to shareholders: | | | |
| Net investment income | | (0.04 | ) |
| Net asset value, end of period | $ | 18.78 | |
| NET ASSET VALUE TOTAL RETURN3 | | (5.88 | )% |
| |
| RATIOS/SUPPLEMENTAL DATA: | | | |
| Net assets, end of period (000’s omitted) | $ | 1,878 | |
| Ratios to average net assets: | | | |
| Expenses, net of expense reimbursements/waivers | | 0.85 | %4 |
| Expenses, prior to expense reimbursements/waivers | | 7.37 | %4 |
| Net investment income | | 0.61 | %4 |
| Portfolio turnover rate | | 70 | %5 |
| 1 | | Commencement of operations. |
| 2 | | Based on average shares outstanding. |
| 3 | | Total return is calculated assuming an initial investment made at the net asset value at the beginning of the period, reinvestment of all dividends and distributions at net asset value during the period, and redemption at net asset value on the last day of the period. Total return calculated for a period of less than one year is not annualized. The total return would have been lower if certain expenses had not been reimbursed/waived by the sub-adviser. |
The accompanying notes are an integral part of these financial statements.
| EGA Emerging Global Shares Trust 87 |
Financial Highlights (continued)
EGA Emerging Global Shares Trust
For a share outstanding throughout each period
| | | |
| EGShares Technology GEMS ETF (Consolidated) | | | |
| | For the Period
June 23, 20111
Through
March 31, 2012 |
| Net asset value, beginning of period | $ | 20.00 | |
| Investment operations: | | | |
| Net investment loss2 | | (0.02 | ) |
| Net realized and unrealized loss on investments and foreign currency translations | | (1.10 | ) |
| Total from investment operations | | (1.12 | ) |
| Net asset value, end of period | $ | 18.88 | |
| NET ASSET VALUE TOTAL RETURN3 | | (5.60 | )% |
| |
| RATIOS/SUPPLEMENTAL DATA: | | | |
| Net assets, end of period (000’s omitted) | $ | 1,888 | |
| Ratios to average net assets: | | | |
| Expenses, net of expense reimbursements/waivers | | 0.85 | %4 |
| Expenses, prior to expense reimbursements/waivers | | 7.81 | %4 |
| Net investment loss | | (0.13 | )%4 |
| Portfolio turnover rate | | 21 | %5 |
| |
| EGShares Telecom GEMS ETF (Consolidated) | | | |
| | For the Period
June 23, 20111
Through
March 31, 2012 |
| Net asset value, beginning of period | $ | 20.00 | |
| Investment operations: | | | |
| Net investment income2 | | 0.41 | |
| Net realized and unrealized gain on investments and foreign currency translations | | 0.01 | 6 |
| Total from investment operations | | 0.42 | |
| Distributions to shareholders: | | | |
| Net investment income | | (0.21 | ) |
| Net asset value, end of period | $ | 20.21 | |
| NET ASSET VALUE TOTAL RETURN3 | | 2.22 | % |
| |
| RATIOS/SUPPLEMENTAL DATA: | | | |
| Net assets, end of period (000’s omitted) | $ | 3,032 | |
| Ratios to average net assets: | | | |
| Expenses, net of expense reimbursements/waivers | | 0.85 | %4 |
| Expenses, prior to expense reimbursements/waivers | | 7.74 | %4 |
| Net investment income | | 2.73 | %4 |
| Portfolio turnover rate | | 18 | %5 |
| 1 | | Commencement of operations. |
| 2 | | Based on average shares outstanding. |
| 3 | | Total return is calculated assuming an initial investment made at the net asset value at the beginning of the period, reinvestment of all dividends and distributions at net asset value during the period, and redemption at net asset value on the last day of the period. Total return calculated for a period of less than one year is not annualized. The total return would have been lower if certain expenses had not been reimbursed/waived by the sub-adviser. |
| 6 | | The realized and unrealized gain on investments and foreign currency transactions does not accord with the amounts reported in the Statement of Operations due to the timing of subscriptions of fund shares in relation to the investment performance during the period and contributions made by Authorized Participants to compensate the Fund for additional costs incurred in purchasing securities that were not transferred in kind (See Note 10). |
The accompanying notes are an integral part of these financial statements.
| 88 EGA Emerging Global Shares Trust |
Financial Highlights (continued)
EGA Emerging Global Shares Trust
For a share outstanding throughout each period
| | | | | | | | | |
| EGShares Utilities GEMS ETF (Consolidated) | | | | | | | | | |
| | | | | | | | For the Period
June 23, 20111
Through
March 31, 2012 |
| Net asset value, beginning of period | | | | | | | $ | 20.00 | |
| Investment operations: | | | | | | | | | |
| Net investment income2 | | | | | | | | 0.25 | |
| Net realized and unrealized loss on investments and foreign currency translations | | | | | | | | (1.46 | ) |
| Total from investment operations | | | | | | | | (1.21 | ) |
| Distributions to shareholders: | | | | | | | | | |
| Net investment income | | | | | | | | (0.20 | ) |
| Net asset value, end of period | | | | | | | $ | 18.59 | |
| NET ASSET VALUE TOTAL RETURN3 | | | | | | | | (5.89 | )% |
| |
| RATIOS/SUPPLEMENTAL DATA: | | | | | | | | | |
| Net assets, end of period (000’s omitted) | | | | | | | $ | 2,788 | |
| Ratios to average net assets: | | | | | | | | | |
| Expenses, net of expense reimbursements/waivers | | | | | | | | 0.87 | %4,5 |
| Expenses, prior to expense reimbursements/waivers | | | | | | | | 7.08 | %4 |
| Net investment income | | | | | | | | 1.82 | %4 |
| Portfolio turnover rate | | | | | | | | 27 | %6 |
| |
| EGShares Emerging Markets Metals & Mining ETF (Consolidated)7 | | | | | | | | | |
| | For the
Year Ended
March 31, 2012 | | For the
Year Ended
March 31, 2011 | | For the Period
May 21, 20091
Through
March 31, 2010 |
| Net asset value, beginning of period | $ | 22.96 | | $ | 20.47 | | $ | 13.73 | |
| Investment operations: | | | | | | | | | |
| Net investment income (loss)2 | | 0.48 | | | 0.13 | | | (0.01 | ) |
| Net realized and unrealized gain (loss) on investments and foreign currency translations | | (6.88 | ) | | 2.52 | | | 6.82 | |
| Total from investment operations | | (6.40 | ) | | 2.65 | | | 6.81 | |
| Distributions to shareholders: | | | | | | | | | |
| Net investment income | | (0.59 | ) | | (0.16 | ) | | (0.07 | ) |
| Net asset value, end of period | $ | 15.97 | | $ | 22.96 | | $ | 20.47 | |
| NET ASSET VALUE TOTAL RETURN3 | | (27.66 | )% | | 12.95 | % | | 49.69 | % |
| |
| RATIOS/SUPPLEMENTAL DATA: | | | | | | | | | |
| Net assets, end of period (000’s omitted) | $ | 14,376 | | $ | 37,878 | | $ | 27,640 | |
| Ratios to average net assets: | | | | | | | | | |
| Expenses, net of expense reimbursements/waivers | | 0.85 | % | | 0.85 | % | | 0.85 | %4 |
| Expenses, prior to expense reimbursements/waivers | | 1.99 | % | | 1.96 | % | | 4.37 | %4 |
| Net investment income (loss) | | 2.48 | % | | 0.63 | % | | (0.06 | )%4 |
| Portfolio turnover rate | | 10 | % | | 35 | % | | 17 | %6 |
| 1 | | Commencement of operations. |
| 2 | | Based on average shares outstanding. |
| 3 | | Total return is calculated assuming an initial investment made at the net asset value at the beginning of the period, reinvestment of all dividends and distributions at net asset value during the period, and redemption at net asset value on the last day of the period. Total return calculated for a period of less than one year is not annualized. The total return would have been lower if certain expenses had not been reimbursed/waived by the sub-adviser. |
| 5 | | The ratio includes 0.02% for the period ended March 31, 2012 attributed to interest expense, which is outside the cap expense. |
| 7 | | On September 16, 2010, there was a 3 for 1 forward stock split. Historical shares amounts have been adjusted to reflect the 3 for 1 forward stock split on a retroactive basis. |
The accompanying notes are an integral part of these financial statements.
| EGA Emerging Global Shares Trust 89 |
Financial Highlights (continued)
EGA Emerging Global Shares Trust
For a share outstanding throughout each period
| | | | | | |
| EGShares Emerging Markets Consumer ETF (Consolidated) | | | | | | |
| | For the
Year Ended
March 31, 2012 | | For the Period
September 14, 20101
Through
March 31, 2011 |
| Net asset value, beginning of period | $ | 22.76 | | $ | 20.00 | |
| Investment operations: | | | | | | |
| Net investment income2 | | 0.17 | | | 0.04 | |
| Net realized and unrealized gain on investments and foreign currency translations | | 1.96 | | | 2.74 | |
| Total from investment operations | | 2.13 | | | 2.78 | |
| Distributions to shareholders: | | | | | | |
| Net investment income | | (0.12 | ) | | (0.02 | ) |
| Net asset value, end of period | $ | 24.77 | | $ | 22.76 | |
| NET ASSET VALUE TOTAL RETURN3 | | 9.44 | % | | 13.88 | % |
| |
| RATIOS/SUPPLEMENTAL DATA: | | | | | | |
| Net assets, end of period (000’s omitted) | $ | 402,466 | | $ | 194,611 | |
| Ratios to average net assets: | | | | | | |
| Expenses, net of expense reimbursements/waivers | | 0.85 | % | | 0.85 | %4 |
| Expenses, prior to expense reimbursements/waivers | | 1.31 | % | | 1.44 | %4 |
| Net investment income | | 0.76 | % | | 0.37 | %4 |
| Portfolio turnover rate | | 3 | % | | 9 | %5 |
| |
| EGShares India Infrastructure ETF (Consolidated) | | | | | | |
| | For the
Year Ended
March 31, 2012 | | For the Period
August 11, 20101
Through
March 31, 2011 |
| Net asset value, beginning of period | $ | 19.40 | | $ | 20.00 | |
| Investment operations: | | | | | | |
| Net investment income2 | | 0.06 | | | 0.01 | |
| Net realized and unrealized loss on investments and foreign currency translations | | (4.39 | ) | | (0.61 | ) |
| Total from investment operations | | (4.33 | ) | | (0.60 | ) |
| Distributions to shareholders: | | | | | | |
| Net investment income | | (0.08 | ) | | — | |
| Net asset value, end of period | $ | 14.99 | | $ | 19.40 | |
| NET ASSET VALUE TOTAL RETURN3 | | (22.19 | )% | | (3.00 | )% |
| |
| RATIOS/SUPPLEMENTAL DATA: | | | | | | |
| Net assets, end of period (000’s omitted) | $ | 60,703 | | $ | 85,377 | |
| Ratios to average net assets: | | | | | | |
| Expenses, net of expense reimbursements/waivers | | 0.85 | % | | 0.85 | %4 |
| Expenses, prior to expense reimbursements/waivers | | 1.69 | % | | 2.24 | %4 |
| Net investment income | | 0.39 | % | | 0.11 | %4 |
| Portfolio turnover rate | | 23 | % | | 9 | %5 |
| 1 | | Commencement of operations. |
| 2 | | Based on average shares outstanding. |
| 3 | | Total return is calculated assuming an initial investment made at the net asset value at the beginning of the period, reinvestment of all dividends and distributions at net asset value during the period, and redemption at net asset value on the last day of the period. Total return calculated for a period of less than one year is not annualized. The total return would have been lower if certain expenses had not been reimbursed/waived by the sub-adviser. |
The accompanying notes are an integral part of these financial statements.
| 90 EGA Emerging Global Shares Trust |
Financial Highlights (continued)
EGA Emerging Global Shares Trust
For a share outstanding throughout each period
| | | | | | | | | |
| EGShares China Infrastructure ETF | | | | | | | | | |
| | For the
Year Ended
March 31, 2012 | | For the
Year Ended
March 31, 2011 | | For the Period
February 17, 20101
Through
March 31, 2010 |
| Net asset value, beginning of period | $ | 22.24 | | $ | 20.78 | | $ | 20.09 | |
| Investment operations: | | | | | | | | | |
| Net investment income (loss)2 | | 0.33 | | | 0.10 | | | (0.02 | ) |
| Net realized and unrealized gain (loss) on investments and foreign currency translations | | (5.76 | ) | | 1.49 | | | 0.71 | |
| Total from investment operations | | (5.43 | ) | | 1.59 | | | 0.69 | |
| Distributions to shareholders: | | | | | | | | | |
| Net investment income | | (0.41 | ) | | (0.13 | ) | | — | |
| Net asset value, end of period | $ | 16.40 | | $ | 22.24 | | $ | 20.78 | |
| NET ASSET VALUE TOTAL RETURN3 | | (24.35 | )% | | 7.69 | % | | 3.43 | % |
| |
| RATIOS/SUPPLEMENTAL DATA: | | | | | | | | | |
| Net assets, end of period (000’s omitted) | $ | 12,303 | | $ | 21,132 | | $ | 6,235 | |
| Ratios to average net assets: | | | | | | | | | |
| Expenses, net of expense reimbursements/waivers | | 0.85 | % | | 0.85 | % | | 0.85 | %4 |
| Expenses, prior to expense reimbursements/waivers | | 2.03 | % | | 2.89 | % | | 7.82 | %4 |
| Net investment income (loss) | | 1.75 | % | | 0.47 | % | | (0.85 | )%4 |
| Portfolio turnover rate | | 12 | % | | 34 | % | | 1 | %5 |
| |
| EGShares Brazil Infrastructure ETF | | | | | | | | | |
| | For the
Year Ended
March 31, 2012 | | For the
Year Ended
March 31, 2011 | | For the Period
February 24, 20101
Through
March 31, 2010 |
| Net asset value, beginning of period | $ | 25.38 | | $ | 20.55 | | $ | 20.00 | |
| Investment operations: | | | | | | | | | |
| Net investment income2 | | 0.96 | | | 0.47 | | | 0.03 | |
| Net realized and unrealized gain (loss) on investments and foreign currency translations | | (1.15 | ) | | 4.67 | | | 0.526 | |
| Total from investment operations | | (0.19 | ) | | 5.14 | | | 0.55 | |
| Distributions to shareholders: | | | | | | | | | |
| Net investment income | | (0.98 | ) | | (0.31 | ) | | — | |
| Net asset value, end of period | $ | 24.21 | | $ | 25.38 | | $ | 20.55 | |
| NET ASSET VALUE TOTAL RETURN3 | | (0.04 | )% | | 25.16 | % | | 2.75 | % |
| |
| RATIOS/SUPPLEMENTAL DATA: | | | | | | | | | |
| Net assets, end of period (000’s omitted) | $ | 89,591 | | $ | 83,760 | | $ | 11,303 | |
| Ratios to average net assets: | | | | | | | | | |
| Expenses, net of expense reimbursements/waivers | | 0.88 | %7 | | 0.85 | % | | 0.85 | %4 |
| Expenses, prior to expense reimbursements/waivers | | 1.51 | % | | 1.91 | % | | 5.67 | %4 |
| Net investment income | | 4.10 | % | | 2.09 | % | | 1.58 | %4 |
| Portfolio turnover rate | | 30 | % | | 35 | % | | 1 | %5 |
| 1 | | Commencement of operations. |
| 2 | | Based on average shares outstanding. |
| 3 | | Total return is calculated assuming an initial investment made at the net asset value at the beginning of the period, reinvestment of all dividends and distributions at net asset value during the period, and redemption at net asset value on the last day of the period. Total return calculated for a period of less than one year is not annualized. The total return would have been lower if certain expenses had not been reimbursed/waived by the sub-adviser. |
| 6 | | The realized and unrealized gain on investements and foreign currency transactions does not accord with the amounts reported in the Statement of Operations due to the timing of subscriptions and/or redemptions of fund shares in relation to the investment performance during the period and contributions made by Authorized Participants to compensate the Fund for additional costs incurred in purchasing securities that were not transferred in kind (See Note 10). |
| 7 | | The ratio includes 0.03% for the period ended March 31, 2012 attributed to excise tax expense, which is outside the cap expense. |
The accompanying notes are an integral part of these financial statements.
| EGA Emerging Global Shares Trust 91 |
Financial Highlights (continued)
EGA Emerging Global Shares Trust
For a share outstanding throughout each period
| EGShares India Small Cap ETF (Consolidated) | | | | | | |
| | For the
Year Ended
March 31, 2012 | | For the Period
July 7, 20101
Through
March 31, 2011 |
| Net asset value, beginning of period | $ | 19.29 | | $ | 20.00 | |
| Investment operations: | | | | | | |
| Net investment income (loss)2 | | 0.14 | | | (0.01 | ) |
| Net realized and unrealized loss on investments and foreign currency translations | | (4.88 | ) | | (0.68 | ) |
| Total from investment operations | | (4.74 | ) | | (0.69 | ) |
| Distributions to shareholders: | | | | | | |
| Net investment income | | (0.16 | ) | | (0.02 | ) |
| Net asset value, end of period | $ | 14.39 | | $ | 19.29 | |
| NET ASSET VALUE TOTAL RETURN3 | | (24.33 | )% | | (3.45 | )% |
| |
| RATIOS/SUPPLEMENTAL DATA: | | | | | | |
| Net assets, end of period (000’s omitted) | $ | 26,616 | | $ | 34,729 | |
| Ratios to average net assets: | | | | | | |
| Expenses, net of expense reimbursements/waivers | | 0.85 | % | | 0.90 | %4,5 |
| Expenses, prior to expense reimbursements/waivers | | 2.26 | % | | 3.12 | %4 |
| Net investment income (loss) | | 0.84 | % | | (0.06 | )%4 |
| Portfolio turnover rate | | 125 | % | | 1 | %6 |
| |
| EGShares India Consumer ETF (Consolidated) | | | | | | |
| | | | | For the Period
August 10, 20111
Through
March 31, 2012 |
| Net asset value, beginning of period | | | | $ | 20.00 | |
| Investment operations: | | | | | | |
| Net investment loss2 | | | | | —7 | |
| Net realized and unrealized loss on investments and foreign currency translations | | | | | (0.92 | )8 |
| Total from investment operations | | | | | (0.92 | ) |
| Net asset value, end of period | | | | $ | 19.08 | |
| NET ASSET VALUE TOTAL RETURN3 | | | | | (4.60 | )% |
| |
| RATIOS/SUPPLEMENTAL DATA: | | | | | | |
| Net assets, end of period (000’s omitted) | | | | $ | 1,908 | |
| Ratios to average net assets: | | | | | | |
| Expenses, net of expense reimbursements/waivers | | | | | 0.89 | %4 |
| Expenses, prior to expense reimbursements/waivers | | | | | 6.16 | %4 |
| Net investment loss | | | | | (0.04 | )%4 |
| Portfolio turnover rate | | | | | 104 | %6 |
| 1 | | Commencement of operations. |
| 2 | | Based on average shares outstanding. |
| 3 | | Total return is calculated assuming an initial investment made at the net asset value at the beginning of the period, reinvestment of all dividends and distributions at net asset value during the period, and redemption at net asset value on the last day of the period. Total return calculated for a period of less than one year is not annualized. The total return would have been lower if certain expenses had not been reimbursed/waived by the sub-adviser. |
| 5 | | The ratio includes 0.05% for the period ended March 31, 2011 attributed to interest expense. |
| 8 | | The realized and unrealized loss on investments and foreign currency transactions does not accord with the amounts reported in the Statement of Operations due to the timing of subscriptions and/or redemptions of fund shares in relation to the investment performance during the period and contributions made by Authorized Participants to compensate the Fund for additional costs incurred in purchasing securities that were not transferred in kind (See Note 10). |
The accompanying notes are an integral part of these financial statements.
| 92 EGA Emerging Global Shares Trust |
Financial Highlights (concluded)
EGA Emerging Global Shares Trust
For a share outstanding throughout each period
| | | |
| EGShares Low Volatility Emerging Markets Dividend ETF (Consolidated) | | | |
| | For the Period
August 4, 20111
Through
March 31, 2012 |
| Net asset value, beginning of period | $ | 20.00 | |
| Investment operations: | | | |
| Net investment income2 | | 0.33 | |
| Net realized and unrealized gain on investments and foreign currency translations | | 0.13 | |
| Total from investment operations | | 0.46 | |
| Distributions to shareholders: | | | |
| Net investment income | | (0.37 | ) |
| Net asset value, end of period | $ | 20.09 | |
| NET ASSET VALUE TOTAL RETURN3 | | 2.45 | % |
| |
| RATIOS/SUPPLEMENTAL DATA: | | | |
| Net assets, end of period (000’s omitted) | $ | 59,255 | |
| Ratios to average net assets: | | | |
| Expenses, net of expense reimbursements/waivers | | 0.85 | %4 |
| Expenses, prior to expense reimbursements/waivers | | 2.07 | %4 |
| Net investment income | | 2.62 | %4 |
| Portfolio turnover rate | | 45 | %5 |
| 1 | | Commencement of operations. |
| 2 | | Based on average shares outstanding. |
| 3 | | Total return is calculated assuming an initial investment made at the net asset value at the beginning of the period, reinvestment of all dividends and distributions at net asset value during the period, and redemption at net asset value on the last day of the period. Total return calculated for a period of less than one year is not annualized. The total return would have been lower if certain expenses had not been reimbursed/waived by the sub-adviser. |
The accompanying notes are an integral part of these financial statements.
| EGA Emerging Global Shares Trust 93 |
Notes to Financial Statements
March 31, 2012
1. ORGANIZATION
EGA Emerging Global Shares Trust (the “Trust”) is a Delaware statutory trust organized on September 12, 2008. The Trust is an open-end management investment company, registered under the Investment Company Act of 1940, as amended (the “1940 Act”). The Trust currently consists of forty-five separate non-diversified series, each of which tracks an underlying index (each, an “Underlying Index”). As of the date of this report, only the following ETFs (each an “ETF” or “Fund” and collectively the “ETFs” or “Funds”) are being publicly offered:
| |
| Funds | Commencement
of Operations |
| EGShares GEMS Composite ETF (“Composite ETF”) | July 22, 2009 |
| EGShares Basic Materials GEMS ETF (“Basic Materials ETF”) | June 23, 2011 |
| EGShares Consumer Goods GEMS ETF (“Consumer Goods ETF”) | June 23, 2011 |
| EGShares Consumer Services GEMS ETF (“Consumer Services ETF”) | June 23, 2011 |
| EGShares Energy GEMS ETF (“Energy ETF”) | May 21, 2009 |
| EGShares Financials GEMS ETF (“Financials ETF”) | September 16, 2009 |
| EGShares Health Care GEMS ETF (“Health Care ETF”) | June 23, 2011 |
| EGShares Industrials GEMS ETF (“Industrials ETF”) | June 23, 2011 |
| EGShares Technology GEMS ETF (“Technology ETF”) | June 23, 2011 |
| EGShares Telecom GEMS ETF (“Telecom ETF”) | June 23, 2011 |
| EGShares Utilities GEMS ETF (“Utilities ETF”) | June 23, 2011 |
| EGShares Emerging Markets Metals & Mining ETF (“Metals & Mining ETF”) | May 21, 2009 |
| EGShares Emerging Markets Consumer ETF (“Consumer ETF”) | September 14, 2010 |
| EGShares India Infrastructure ETF (“India Infrastructure ETF”) | August 11, 2010 |
| EGShares China Infrastructure ETF (“China Infrastructure ETF”) | February 17, 2010 |
| EGShares Brazil Infrastructure ETF (“Brazil Infrastructure ETF”) | February 24, 2010 |
| EGShares India Small Cap ETF (“India Small Cap ETF”) | July 7, 2010 |
| EGShares India Consumer ETF (“India Consumer ETF”) | August 10, 2011 |
| EGShares Low Volatility Emerging Markets Dividend ETF (“Low Volatility Dividend ETF”) | |
| (formerly EGShares Emerging Markets High Income Low Beta ETF) | August 4, 2011 |
The Composite ETF’s investment objective is to seek investment results that correspond (before fees and expenses) to the price and yield performance of the Dow Jones Emerging Markets Sector Titans Composite 100 IndexSM. The Dow Jones Emerging Markets Sector Titans Composite 100 IndexSM is comprised of a representative sample of 100 Emerging Markets companies deemed to be the 10 leading companies in each of the 10 “Industries,” as defined by the Industry Classification Benchmark (“ICB”).
The Basic Materials ETF’s investment objective is to seek investment results that correspond (before fees and expenses) to the price and yield performance of the Dow Jones Emerging Markets Basic Materials Titans 30 IndexSM. The Dow Jones Emerging Markets Basic Materials Titans 30 IndexSM is comprised of publicly traded firms in the “Basic Materials Industry,” as defined by ICB.
The Consumer Goods ETF’s investment objective is to seek investment results that correspond (before fees and expenses) to the price and yield performance of the Dow Jones Emerging Markets Consumer Goods Titans 30 IndexSM. The Dow Jones Emerging Markets Consumer Goods Titans 30 IndexSM is comprised of publicly traded firms in the “Consumer Goods Industry,” as defined by ICB.
The Consumer Services ETF’s investment objective is to seek investment results that correspond (before fees and expenses) to the price and yield performance of the Dow Jones Emerging Markets Consumer Services Titans 30 IndexSM. The Dow Jones Emerging Markets Consumer Services Titans 30 IndexSM is comprised of publicly traded firms in the “Consumer Services Industry,” as defined by ICB.
The Energy ETF’s investment objective is to seek investment results that correspond (before fees and expenses) to the price and yield performance of the Dow Jones Emerging Markets Oil and Gas Titans 30 IndexSM. The Dow Jones Emerging Markets Oil and Gas Titans 30 IndexSM is comprised of publicly traded firms in the “Oil and Gas Industry,” as defined by ICB.
The Financials ETF’s investment objective is to seek investment results that correspond (before fees and expenses) to the price and yield performance of the Dow Jones Emerging Markets Financials Titans 30 IndexSM. The Dow Jones Emerging Markets Financials Titans 30 IndexSM is comprised of publicly traded firms in the “Financials Industry,” as defined by ICB.
The Health Care ETF’s investment objective is to seek investment results that correspond (before fees and expenses) to the price and yield performance of the Dow Jones Emerging Markets Health Care Titans 30 IndexSM. The Dow Jones Emerging Markets Health Care Titans 30 IndexSM is comprised of publicly traded firms in the “Health Care Industry,” as defined by ICB.
| 94 EGA Emerging Global Shares Trust |
Notes to Financial Statements (continued)
March 31, 2012
The Industrials ETF’s investment objective is to seek investment results that correspond (before fees and expenses) to the price and yield performance of the Dow Jones Emerging Markets Industrials Titans 30 IndexSM. The Dow Jones Emerging Markets Industrials Titans 30 IndexSM is comprised of publicly traded firms in the “Industrials Industry,” as defined by ICB.
The Technology ETF’s investment objective is to seek investment results that correspond (before fees and expenses) to the price and yield performance of the Dow Jones Emerging Markets Technology Titans 30 IndexSM. The Dow Jones Emerging Markets Technology Titans 30 IndexSM is comprised of publicly traded firms in the “Technology Industry,” as defined by ICB.
The Telecom ETF’s investment objective is to seek investment results that correspond (before fees and expenses) to the price and yield performance of the Dow Jones Emerging Markets Telecommunications Titans 30 IndexSM. The Dow Jones Emerging Markets Telecommunications Titans 30 IndexSM is comprised of publicly traded firms in the “Telecommunications Industry,” as defined by ICB.
The Utilities ETF’s investment objective is to seek investment results that correspond (before fees and expenses) to the price and yield performance of the Dow Jones Emerging Markets Utilities Titans 30 IndexSM. The Dow Jones Emerging Markets Utilities Titans 30 IndexSM is comprised of publicly traded firms in the “Utilities Industry,” as defined by ICB.
The Metals & Mining ETF’s investment objective is to seek investment results that correspond (before fees and expenses) to the price and yield performance of the Dow Jones Emerging Markets Metals & Mining Titans 30 IndexSM. The Dow Jones Emerging Markets Metals & Mining Titans 30 IndexSM comprised of publicly traded firms in the “Industrial Metals and Mining Sector” and “Mining Sector,” as defined by ICB.
The Consumer ETF’s investment objective is to seek investment results that correspond (before fees and expenses) to the price and yield performance of the Dow Jones Emerging Markets Consumer Titans 30 IndexSM. The Dow Jones Emerging Markets Consumer Titans 30 IndexSM is comprised of publicly traded firms in the “Consumer Goods Industry” and “Consumer Services Industry,” as defined by ICB.
The India Infrastructure ETF’s investment objective is to seek investment results that correspond (before fees and expenses) to the price and yield performance of the INDXX India Infrastructure Index. The INDXX India Infrastructure Index is comprised of 30 leading companies that INDXX, LLC determines to be representative of India’s infrastructure sectors.
The China Infrastructure ETF’s investment objective is to seek investment results that correspond (before fees and expenses) to the price and yield performance of the INDXX China Infrastructure Index. The INDXX China Infrastructure Index is comprised of 30 leading companies that INDXX, LLC determines to be representative of China’s infrastructure sectors.
The Brazil Infrastructure ETF’s investment objective is to seek investment results that correspond (before fees and expenses) to the price and yield performance of the INDXX Brazil Infrastructure Index. The INDXX Brazil Infrastructure Index is comprised of 30 leading companies that INDXX, LLC determines to be representative of Brazil’s infrastructure sectors.
The India Small Cap ETF’s investment objective is to seek investment results that correspond (before fees and expenses) to the price and yield performance of the INDXX India Small Cap Index. The INDXX India Small Cap Index is comprised of a representative sample of 75 emerging markets companies that INDXX, LLC determines to be representative of small capitalization companies domiciled in India.
The India Consumer ETF’s investment objective is to seek investment results that correspond (before fees and expenses) to the price and yield performance of the INDXX India Consumer Index. The INDXX India Consumer Index is comprised of 30 leading companies that INDXX, LLC determines to be representative of India’s consumer sectors.
The Low Volatility Dividend ETF’s investment objective is to seek investment results that correspond (before fees and expenses) to the price and yield performance of the INDXX Emerging Market High Income Low Beta Index. The INDXX Emerging Market High Income Low Beta Index is comprised of a representative sample of 30 emerging markets companies that INDXX, LLC determines to have lower relative volatility (i.e., low beta) than the broad market benchmark indices of the local exchanges in which the component securities trade, which have also paid dividends consistently over the last three years.
2. CONSOLIDATION OF SUBSIDIARIES
The Consolidated Schedules of Investments, Consolidated Statements of Asset and Liabilities, of Operations and of Changes in Net Assets and the Consolidated Financial Highlights of the ETFs listed below include the accounts of wholly owned subsidiaries. All inter-company accounts and transactions have been eliminated in consolidation.
| EGA Emerging Global Shares Trust 95 |
Notes to Financial Statements (continued)
March 31, 2012
| |
| Funds | Wholly Owned Subsidiary |
| Composite ETF | EGShares Composite Mauritius |
| Basic Materials ETF | EGShares Basic Materials Mauritius |
| Consumer Goods ETF | EGShares Consumer Goods Mauritius |
| Energy ETF | EGShares Energy Fund Mauritius |
| Financials ETF | EGShares Financials Fund Mauritius |
| Health Care ETF | EGShares Health Care Mauritius |
| Industrials ETF | EGShares Industrials Mauritius |
| Technology ETF | EGShares Technology Mauritius |
| Telecom ETF | EGShares Telecom Mauritius |
| Utilities ETF | EGShares Utilities Mauritius |
| Metals & Mining ETF | EGShares Metals & Mining Mauritius |
| Consumer ETF | EGShares Consumer Mauritius |
| India Infrastructure ETF | EGShares India Infrastructure Mauritius |
| India Small Cap ETF | EGShares India Small Cap Mauritius |
| India Consumer ETF | EGShares India Consumer Mauritius |
| Low Volatility Dividend ETF | EGShares Low Volatility Emerging Markets Dividend Mauritius |
The Composite ETF, Basic Materials ETF, Consumer Goods ETF, Energy ETF, Financials ETF, Health Care ETF, Industrials ETF, Technology ETF, Telecom ETF, Utilities ETF, Metals & Mining ETF, Consumer ETF and Low Volatility Dividend ETF may each invest its assets in a wholly owned subsidiary in Mauritius, which in turn invests virtually all of its assets in Indian securities, based on the number of Indian securities that are included in each ETF’s respective Index.
The India Infrastructure ETF, India Small Cap ETF and India Consumer ETF invest substantially all of their assets in wholly owned subsidiaries in Mauritius, which in turn invest at least 90% of their assets in Indian securities, and to some extent ADRs and GDRs, based on the number of Indian securities that are included in each ETF’s respective Index.
By investing in a wholly owned subsidiary, the Composite ETF, the Basic Materials ETF, the Consumer Goods ETF, the Energy ETF, the Financials ETF, the Health Care ETF, the Industrials ETF, the Technology ETF, the Telecom ETF, the Utilities ETF, the Metals & Mining ETF, the Consumer ETF, the India Infrastructure ETF, the India Small Cap ETF, the India Consumer ETF and the Low Volatility Dividend ETF each obtain benefits under the tax treaty between Mauritius and India. Each subsidiary may be subject to withholding taxes imposed by the Indian government on dividends, interest and realized capital gains should new legislation be passed to modify the current tax treaty with Mauritius. Any change in the provision of this treaty could result in the imposition of withholding and other taxes on these ETFs by authorities in India. This would reduce the return on investment and the return received by each ETF’s shareholders.
A summary of each ETF’s investment in its corresponding subsidiary is as follows:
| Funds | Inception Date
of Subsidiary | Subsidiary Net
Assets at
March 31, 2012 | | % of ETF’s Total
Net assets at
March 31, 2012 |
| Composite ETF | September 19, 2011 | $ | 546,211 | | 3.9 | % |
| Basic Materials ETF | June 23, 2011 | | 174,224 | | 11.0 | |
| Consumer Goods ETF | June 23, 2011 | | 206,967 | | 18.7 | |
| Energy ETF | June 27, 2011 | | 1,149,983 | | 10.3 | |
| Financials ETF | June 27, 2011 | | 175,859 | | 4.4 | |
| Health Care ETF | June 23, 2011 | | 544,933 | | 28.5 | |
| Industrials ETF | June 23, 2011 | | 448,843 | | 23.9 | |
| Technology ETF | June 23, 2011 | | 438,765 | | 23.2 | |
| Telecom ETF | June 23, 2011 | | 167,141 | | 5.5 | |
| Utilities ETF | June 23, 2011 | | 413,674 | | 14.8 | |
| Metals & Mining ETF | September 19, 2011 | | 1,908,625 | | 13.3 | |
| Consumer ETF | September 14, 2010 | | 50,913,857 | | 12.7 | |
| India Infrastructure ETF | August 11, 2010 | | 60,761,852 | | 100.1 | |
| India Small Cap ETF | July 7, 2010 | | 26,739,075 | | 100.5 | |
| India Consumer ETF | August 10, 2011 | | 1,917,273 | | 100.5 | |
| Low Volatility Dividend ETF | August 4, 2011 | | 2,118,996 | | 3.6 | |
| 96 EGA Emerging Global Shares Trust |
Notes to Financial Statements (continued)
March 31, 2012
3. SIGNIFICANT ACCOUNTING POLICIES
These financial statements are prepared in accordance with accounting principles generally accepted in the United States of America (“GAAP”), which requires management to make estimates and assumptions that affect the reported amounts of assets and liabilities, the disclosure of contingent assets and liabilities at the date of the financial statements, and the reported amounts of increases and decreases in net assets from operations during the reporting period. Actual amounts could differ from these estimates. The following summarizes the significant accounting policies of the ETFs.
Indemnifications
In the normal course of business, the Trust enters into contracts that contain a variety of representations that provide general indemnifications. The Trust’s maximum exposure under these arrangements cannot be known as this would involve future claims that may be made against the Trust that have not yet occurred; however, the Trust expects any risk of loss to be remote.
Investment Valuation
The Net Asset Value (“NAV”) per share is computed as of the scheduled close of regular trading on the New York Stock Exchange (“NYSE”), ordinarily 4:00 p.m. Eastern time, on each day during which the NYSE is open for trading. The NAV per share of an ETF is computed by dividing the value of the ETF’s portfolio securities, cash and other assets (including accrued interest), less all liabilities (including accrued expenses), by the total number of shares outstanding at the time such computation is made.
Securities Valuation
Equity securities (including American Depositary Receipts and Global Depositary Receipts) are valued at the last reported sale price on the principal exchange on which such securities are traded, as of the close of regular trading on the NYSE on the day the securities are being valued or, if there are no sales, at the mean of the most recent bid and asked prices. Equity securities that are traded in over-the-counter markets are valued at the NASDAQ Official Closing Price as of the close of regular trading on the NYSE on the day the securities are valued or, if there are no sales, at the mean of the most recent bid and asked prices. Securities for which market quotations are not readily available, including restricted securities, are valued by a method that the Board of Trustees (the “Board”) believes accurately reflects fair value. The value of assets denominated in foreign currencies is converted into U.S. dollars using exchange rates deemed appropriate by the ETFs. Use of a rate different from the rate used by CME Group Index Services LLC or INDXX, LLC may adversely affect an ETF’s ability to track its Underlying Index.
Foreign Currency Translations
Investments denominated in foreign currencies are subject to additional risk factors as compared to investments denominated in U.S. dollars. The value of an investment denominated in a foreign currency could change significantly as foreign currencies strengthen or weaken relative to the U.S. dollar. Generally, when the U.S. dollar gains in value against a foreign currency, an investment traded in that foreign currency loses value because that currency is worth fewer U.S. dollars. Risks related to foreign currencies also include those related to economic or political developments, market inefficiencies or a higher risk that essential investment information may be incomplete, unavailable or inaccurate. A U.S. dollar investment in depositary receipts or ordinary shares of foreign issuers traded on U.S. exchanges is indirectly subject to foreign currency risk to the extent that the issuer conducts its principal business in markets where transactions are denominated in foreign currencies.
Portfolio securities and other assets and liabilities denominated in foreign currencies are translated into U.S. dollars based on the exchange rate of such currencies against U.S. dollars on the date of valuation. Purchases and sales of securities and income items denominated in foreign currencies are translated into U.S. dollars at the exchange rate in effect on the transaction date.
The ETFs do not separately report the effect of changes in foreign exchange rates from changes in market prices on securities held. Such changes are included in net realized and unrealized gain or loss from investments.
Realized foreign exchange gains or losses arise from sales of foreign currencies, currency gains or losses realized between the trade and settlement dates on securities transactions and the difference between the recorded amounts of dividends, interest, and foreign withholding taxes, and the U.S. dollar equivalent of the amounts actually received or paid. Net unrealized foreign exchange gains and losses arise from changes in foreign exchange rates on foreign denominated assets and liabilities other than investments in securities held at the end of the reporting period.
Security Transactions and Related Income
Investment transactions are recorded on trade date. The ETFs determine the gain or loss realized from the investment transactions by comparing the identified cost, which is the same basis used for federal income tax purposes, with the net sales proceeds. Dividend income is recorded on the ex-dividend date. Interest income is recorded on the accrual basis. Discounts are accreted and premiums are amortized on securities purchased over the lives of the respective securities.
| EGA Emerging Global Shares Trust 97 |
Notes to Financial Statements (continued)
March 31, 2012
Federal Income Taxes
The Composite ETF, Energy ETF, Financials ETF, Metals & Mining ETF, Consumer ETF, India Infrastructure ETF, China Infrastructure ETF, Brazil Infrastructure ETF and India Small Cap ETF have qualified and continue to qualify, and the Basic Materials ETF, Consumer Goods ETF, Consumer Services ETF, Health Care ETF, Industrials ETF, Technology ETF, Telecom ETF, Utilities ETF, India Consumer ETF and Low Volatility Dividend ETF intend to qualify as a “regulated investment company” under Subchapter M of the Internal Revenue Code. If so qualified, an ETF will not be subject to federal income tax to the extent it distributes substantially all of its net investment income and capital gains to shareholders. Each ETF expects to declare and pay all of its net investment income, if any, to shareholders as dividends annually (quarterly for the Low Volatility Dividend ETF), and will also declare and pay net realized capital gains, if any, at least annually, except where the costs of such distributions exceed the amount of tax that the distributions are intended to avoid, in which case the ETF will pay the applicable tax. An ETF may distribute such income dividends and capital gains more frequently, if necessary, in order to reduce or eliminate federal excise or income taxes on the ETF. Distributions to shareholders are recorded on the ex-dividend date.
The ETFs are subject to accounting standards that provide guidance for how uncertain tax positions should be recognized, measured, presented and disclosed in the financial statements. These standards require the evaluation of tax positions taken or expected to be taken by the ETFs and whether the tax positions are “more-likely-than-not” of being sustained by the applicable tax authority. Tax positions not deemed to meet the more-likely-than-not threshold would be recorded as a tax benefit or expense in the current year. Accounting for uncertainty in income taxes requires management of the ETFs to analyze all open tax years as defined by IRS statute of limitations, for all major jurisdictions, including federal tax authorities and certain state tax authorities. Open tax years are those years that are open for examination by the relevant income taxing authority. As of March 31, 2012, open Federal and state income tax years include the tax years or periods ended March 31, 2010, March 31, 2011 and March 31, 2012. The ETFs have no examinations in progress.
There is no tax liability resulting from uncertain income tax positions taken or expected to be taken. The ETFs are also not aware of any tax positions for which it is reasonably possible that the total amounts of unrecognized tax expense will significantly change in the next twelve months.
Expenses
Expenses of the Trust, which are directly identifiable to a specific ETF, are applied to that ETF. Expenses which are not readily identifiable to a specific ETF are allocated in such a manner as deemed equitable, taking into consideration the nature and type of expense and the relative net assets of each ETF in the Trust.
Offering Expenses
Costs incurred in connection with the initial offering of the ETFs are being amortized over a 12-month period from inception of the ETF.
4. CONCENTRATION OF MARKET RISK
The India Infrastructure ETF, India Small Cap ETF and India Consumer ETF, only invest in Indian securities, therefore, their NAVs will be much more sensitive to changes in economic, political and other factors within India than would a fund that invested in a greater variety of countries.
The China Infrastructure ETF only invests in Chinese securities, therefore, its NAV will be much more sensitive to changes in economic, political and other factors within China than would a fund that invested in a greater variety of countries.
The Brazil Infrastructure ETF only invests in Brazilian securities, therefore, its NAV will be much more sensitive to changes in economic, political and other factors within Brazil than would a fund that invested in a greater variety of countries.
The India Small Cap ETF concentrates its investments in small capitalization companies, and as such, may be adversely affected by increased price volatility of securities in that capitalization.
The Basic Materials ETF concentrates its investments in the basic materials industry, and as such, may be adversely affected by increased price volatility of securities in that industry, and may be more susceptible to adverse economic, market, political or regulatory occurrences affecting that industry. Issuers in the basic materials industry are at risk for environmental damage and product liability claims and may be adversely affected by depletion of resources, technical progress, labor relations and governmental regulations.
The Consumer ETF, Consumer Goods ETF, Consumer Services ETF and India Consumer ETF concentrate their investments in the consumer industry, and as such, may be adversely affected by increased price volatility of securities in that industry, and may be more susceptible to adverse economic, market, political or regulatory occurrences affecting that industry. The success of consumer goods and consumer services suppliers and retailers is tied closely to the performance of the domestic and international economy, interest rates, currency exchange rates, competition, preferences, and consumer confidence.
| 98 EGA Emerging Global Shares Trust |
Notes to Financial Statements (continued)
March 31, 2012
The Energy ETF concentrates its investments in the oil and gas industry, and as such, may be adversely affected by increased price volatility of securities in that industry, and may be more susceptible to adverse economic, market, political or regulatory occurrences affecting that industry. The profitability of companies in the oil and gas industry (including alternative energy suppliers) is related to worldwide energy prices, exploration, and production spending.
The Financials ETF concentrates its investments in the financial industry, and as such may be adversely affected by increased price volatility of securities in that industry, and may be more susceptible to adverse economic, market, political or regulatory occurrences affecting that industry. Companies in the financial industry are subject to extensive governmental regulation, which may adversely affect the scope of their activities, the prices they can charge and the amount of capital they must maintain.
The Health Care ETF concentrates its investments in the health care industry, and as such, may be adversely affected by increased price volatility of securities in that industry, and may be more susceptible to adverse economic, market, political or regulatory occurrences affecting that industry. The profitability of companies in the health care industry may be affected by extensive government regulation, restriction on government reimbursement for medical expenses, rising costs of medical products and services, pricing pressure, an increased emphasis on outpatient services, limited number of products, industry innovation, changes in technologies and other market developments.
The Industrials ETF concentrates its investments in the industrials industry, and as such, may be adversely affected by increased price volatility of securities in that industry, and may be more susceptible to adverse economic, market, political or regulatory occurrences affecting that industry. Government regulation, world events and economic conditions affect the performance of companies in the industrials industry.
The Technology ETF concentrates its investments in the technology industry, and as such, may be adversely affected by increased price volatility of securities in that industry, and may be more susceptible to adverse economic, market, political or regulatory occurrences affecting that industry. Technology companies may be affected by intense competition, obsolescence of existing technology, general economic conditions, government regulation and may have limited product lines, markets, financial resources or personnel.
The Telecom ETF concentrates its investments in the telecommunications industry, and as such, may be adversely affected by increased price volatility of securities in that industry, and may be more susceptible to adverse economic, market, political or regulatory occurrences affecting that industry. The global telecommunications market is characterized by increasing competition and government regulation.
The Utilities ETF concentrates its investments in the utilities industry, and as such, may be adversely affected by increased price volatility of securities in that industry, and may be more susceptible to adverse economic, market, political or regulatory occurrences affecting that industry. Companies in the utilities industry may be adversely affected by changes in exchange rates, domestic and international competition, and governmental limitation on rates charged to customers.
The Metals & Mining ETF concentrates its investments in the metals and mining industry, and as such, may be adversely affected by increased price volatility of securities in that industry, and may be more susceptible to adverse economic, market, political or regulatory occurrences affecting that industry. Securities of companies involved in metals and mining may be subject to broad price fluctuations, reflecting volatility of energy and basic materials prices and possible instability of supply of various basic resources.
The India Infrastructure ETF, China Infrastructure ETF, and Brazil Infrastructure ETF concentrate their investments in the infrastructure sector, and as such, may be adversely affected by increased price volatility of securities in that sector, and may be more susceptible to adverse economic, market, political or regulatory occurrences affecting that sector.
The ETFs are subject to emerging markets risk. Investments in emerging market securities are subject to even greater risks than for foreign investments generally, including increased risks of: illiquidity of securities; price volatility; inflation or deflation; restrictions on foreign investment; nationalization; higher taxation; economic and political instability; pervasive corruption and crime; less governmental regulation; and less developed legal systems.
5. DISTRIBUTION AGREEMENT
ALPS Distributors, Inc., (the “Distributor”) serves as the distributor of Creation Units for the ETFs pursuant to a distribution agreement. The Distributor does not maintain a secondary market in shares. The ETFs have adopted a Distribution and Service Plan (the “Plan”) pursuant to Rule 12b-1 under the 1940 Act. In accordance with the Plan, each ETF is authorized to pay an amount up to 0.25% of its average daily net assets each year for certain distribution-related activities. For the periods ended March 31, 2012, no fees were paid by the ETFs under the Plan, and there are no current plans to impose these fees.
| EGA Emerging Global Shares Trust 99 |
Notes to Financial Statements (continued)
March 31, 2012
6. FEDERAL INCOME TAX MATTERS
For the period ended March 31, 2012, federal tax cost of investments and net unrealized appreciation (depreciation) were as follows:
| Funds | Federal
Tax Cost of
Investments | Gross
Unrealized
Appreciation | Gross
Unrealized
Depreciation | | Net Unrealized
Appreciation
(Depreciation) |
| Composite ETF | $ | 14,819,913 | $ | 1,016,769 | $ | (1,894,086 | ) | $ | (877,317 | ) |
| Basic Materials ETF | | 1,879,058 | | 11,963 | | (276,642 | ) | | (264,679 | ) |
| Consumer Goods ETF | | 1,007,613 | | 140,185 | | (20,697 | ) | | 119,488 | |
| Consumer Services ETF | | 1,068,497 | | 84,935 | | (66,575 | ) | | 18,360 | |
| Energy ETF | | 12,424,150 | | 426,349 | | (1,630,284 | ) | | (1,203,935 | ) |
| Financials ETF | | 4,547,207 | | 100,085 | | (615,937 | ) | | (515,852 | ) |
| Health Care ETF | | 1,934,141 | | 132,579 | | (131,043 | ) | | 1,536 | |
| Industrials ETF | | 2,113,839 | | 43,289 | | (254,780 | ) | | (211,491 | ) |
| Technology ETF | | 1,920,433 | | 152,013 | | (153,060 | ) | | (1,047 | ) |
| Telecom ETF | | 3,016,865 | | 134,685 | | (113,544 | ) | | 21,141 | |
| Utilities ETF | | 2,688,316 | | 243,423 | | (121,296 | ) | | 122,127 | |
| Metals & Mining ETF | | 17,799,229 | | 331,683 | | (3,769,748 | ) | | (3,438,065 | ) |
| Consumer ETF | | 370,048,464 | | 44,621,924 | | (12,707,083 | ) | | 31,914,841 | |
| India Infrastructure ETF | | 77,278,027 | | 2,795,919 | | (19,390,696 | ) | | (16,594,777 | ) |
| China Infrastructure ETF | | 15,722,553 | | 435,411 | | (3,879,755 | ) | | (3,444,344 | ) |
| Brazil Infrastructure ETF | | 80,313,233 | | 15,447,536 | | (7,286,163 | ) | | 8,161,373 | |
| India Small Cap ETF | | 27,302,634 | | 1,036,402 | | (1,769,864 | ) | | (733,462 | ) |
| India Consumer ETF | | 1,811,616 | | 157,037 | | (55,302 | ) | | 101,735 | |
| Low Volatility Dividend ETF | | 58,183,212 | | 3,304,000 | | (2,171,021 | ) | | 1,132,979 | |
The differences between book basis and tax basis components of net assets are primarily attributable to tax deferral of losses on wash sales, unamortized organization costs, mark to market on Passive Foreign Investment Companies securities and deferral of post-October and December losses.
For the period ended March 31, 2012, the components of accumulated earnings (losses) on a tax-basis were as follows:
| Funds | Undistributed
Ordinary Income | Accumulated
Capital and
Other Losses | | Net
Unrealized
Appreciation
(Depreciation) | | Total
Accumulated
Earnings (Losses) | |
| Composite ETF | $ | 23,269 | $ | (1,256,789 | ) | $ | (877,053 | ) | $ | (2,110,573 | ) |
| Basic Materials ETF | | 4,500 | | (31,501 | ) | | (264,649 | ) | | (291,650 | ) |
| Consumer Goods ETF | | 3,470 | | (18,646 | ) | | 119,508 | | | 104,332 | |
| Consumer Services ETF | | — | | (17,724 | ) | | 18,360 | | | 636 | |
| Energy ETF | | 9,335 | | (1,050,808 | ) | | (1,204,037 | ) | | (2,245,510 | ) |
| Financials ETF | | — | | (61,209 | ) | | (515,942 | ) | | (577,151 | ) |
| Health Care ETF | | 2,153 | | (30,130 | ) | | 1,552 | | | (26,425 | ) |
| Industrials ETF | | 39,045 | | — | | | (211,502 | ) | | (172,457 | ) |
| Technology ETF | | — | | (56,488 | ) | | (1,047 | ) | | (57,535 | ) |
| Telecom ETF | | 15,242 | | (8,641 | ) | | 21,084 | | | 27,685 | |
| Utilities ETF | | 11,158 | | (46,102 | ) | | 122,122 | | | 87,178 | |
| Metals & Mining ETF | | 14,668 | | (1,228,800 | ) | | (3,437,932 | ) | | (4,652,064 | ) |
| Consumer ETF | | 124,633 | | (360,737 | ) | | 31,914,981 | | | 31,678,877 | |
| India Infrastructure ETF | | 464,495 | | (10,319,271 | ) | | (16,596,265 | ) | | (26,451,041 | ) |
| China Infrastructure ETF | | 119 | | (1,515,058 | ) | | (3,444,344 | ) | | (4,959,283 | ) |
| Brazil Infrastructure ETF | | 826,959 | | (4,703,916 | ) | | 8,152,764 | | | 4,275,807 | |
| India Small Cap ETF | | — | | (12,583,498 | ) | | (731,063 | ) | | (13,314,561 | ) |
| India Consumer ETF | | — | | (31,428 | ) | | 101,748 | | | 70,320 | |
| Low Volatility Dividend ETF | | 139,299 | | (871,161 | ) | | 1,132,177 | | | 400,315 | |
| 100 EGA Emerging Global Shares Trust |
Notes to Financial Statements (continued)
March 31, 2012
For financial reporting purposes, capital accounts are adjusted to reflect the tax character of permanent book/tax differences. Reclassifications are primarily due to tax treatment of redemptions in kind, PFIC sold adjustments, non-deductible offering costs, return of capital distributions and tax treatment of currency gains and losses. Results of operations and net assets were not affected by these reclassifications.
For the period ended March 31, 2012, the effect of permanent book/tax reclassifications resulted in increases (decreases) to the components of net assets as follows:
| Funds | Accumulated
Undistributed
Net Investment
Income (loss) | | Accumulated
Net Realized
Gain (Loss)
on Investments | | Paid-in Capital | |
| Composite ETF | $ | 3,091 | | $ | 1,097,884 | | $ | (1,100,975 | ) |
| Basic Materials ETF | | (1,424 | ) | | 62,236 | | | (60,812 | ) |
| Consumer Goods ETF | | 639 | | | (32,489 | ) | | 31,850 | |
| Consumer Services ETF | | 1,590 | | | (53,864 | ) | | 52,274 | |
| Energy ETF | | (5,806 | ) | | (2,214,343 | ) | | 2,220,149 | |
| Financials ETF | | 44,082 | | | 395,576 | | | (439,658 | ) |
| Health Care ETF | | 1,740 | | | 77,388 | | | (79,128 | ) |
| Industrials ETF | | (5,347 | ) | | 27,458 | | | (22,111 | ) |
| Technology ETF | | 1,383 | | | 58,765 | | | (60,148 | ) |
| Telecom ETF | | (2,120 | ) | | 20,575 | | | (18,455 | ) |
| Utilities ETF | | (3,449 | ) | | 88,659 | | | (85,210 | ) |
| Metals & Mining ETF | | 6,879 | | | (1,039,230 | ) | | 1,032,351 | |
| Consumer ETF | | (196,979 | ) | | (2,698,508 | ) | | 2,895,487 | |
| India Infrastructure ETF | | 172,182 | | | (126,316 | ) | | (45,866 | ) |
| China Infrastructure ETF | | (968 | ) | | (900,975 | ) | | 901,943 | |
| Brazil Infrastructure ETF | | 594,891 | | | (570,402 | ) | | (24,489 | ) |
| India Small Cap ETF | | (21,155 | ) | | 63,870 | | | (42,715 | ) |
| India Consumer ETF | | (78 | ) | | 16,522 | | | (16,444 | ) |
| Low Volatility Dividend ETF | | (107,760 | ) | | (1,428,802 | ) | | 1,536,562 | |
Certain net losses incurred after October 31 and December 31, and within the taxable year or period are deemed to arise on the first business day of the ETFs’ next taxable year. For the period ended March 31, 2012, the ETFs deferred to April 1, 2012 these losses of:
| Funds | Late Year
Ordinary Losses | | Post October
Capital Losses |
| Composite ETF | $ | — | | $ | — |
| Basic Materials ETF | | — | | | — |
| Consumer Goods ETF | | — | | | 1,855 |
| Consumer Services ETF | | 1,061 | | | 9,108 |
| Energy ETF | | — | | | 778,524 |
| Financials ETF | | — | | | — |
| Health Care ETF | | — | | | — |
| Industrials ETF | | 637 | | | — |
| Technology ETF | | — | | | 6,580 |
| Telecom ETF | | — | | | 6,259 |
| Utilities ETF | | — | | | 710 |
| Metals & Mining ETF | | — | | | — |
| Consumer ETF | | — | | | — |
| India Infrastructure ETF | | — | | | 4,788,346 |
| China Infrastructure ETF | | 28,473 | | | 157,799 |
| Brazil Infrastructure ETF | | — | | | 90,834 |
| India Small Cap ETF | | 38,927 | | | 8,430,012 |
| India Consumer ETF | | 743 | | | 30,685 |
| Low Volatility Dividend ETF | | — | | | — |
| EGA Emerging Global Shares Trust 101 |
Notes to Financial Statements (continued)
March 31, 2012
On December 22, 2010, the Regulated Investment Company Modernization Act of 2010 (the “Act”) was enacted, which changed various technical rules governing the tax treatment of regulated investment companies. The changes are generally effective for taxable years beginning after the date of enactment. One of the more prominent changes addresses capital loss carryforwards. Under the Act, each ETF will be permitted to carryforward capital losses incurred in taxable years beginning after the date of enactment for an unlimited period. However, any losses incurred during those future taxable years will be required to be utilized prior to the losses incurred in pre-enactment taxable years, which carry an expiration date. As a result of this ordering rule pre-enactment capital loss carryforwards may be more likely to expire unused. Additionally, post-enactment capital loss carryforwards will retain their character as either short-term or long-term capital losses rather than being considered all short-term losses as permitted under previous regulation. At March 31, 2012, for Federal income tax purposes, the following ETFs had capital loss carryforwards available to offset future capital gains as per the guidelines set forth in the Act:
| | | | | | | | |
| | | Carryforwards with No Expiration* | | Carryfowards Expiring In |
| Funds | | Short-Term
Capital Loss
Carryforward | | Long-Term
Capital Loss
Carryforward | | Fiscal Year
2018 | | Fiscal Year
2019 |
| Composite ETF | $ | 358,407 | $ | 282,524 | $ | — | $ | 586,695 |
| Basic Material ETF | | 31,501 | | — | | — | | — |
| Consumer Goods ETF | | 16,791 | | — | | — | | — |
| Consumer Services ETF | | 7,555 | | — | | — | | — |
| Energy ETF | | 126,803 | | 94,601 | | — | | — |
| Financials ETF | | 46,897 | | — | | — | | — |
| Health Care ETF | | 30,130 | | — | | — | | — |
| Industrials ETF | | — | | — | | — | | — |
| Technology ETF | | 49,908 | | — | | — | | — |
| Telecom ETF | | 2,382 | | — | | — | | — |
| Utilities ETF | | 45,392 | | — | | — | | — |
| Metals & Mining ETF | | 385,008 | | 342,616 | | 26,475 | | 423,874 |
| Consumer ETF | | 360,737 | | — | | — | | — |
| India Infrastructure ETF | | 5,077,656 | | 453,269 | | — | | — |
| China Infrastructure ETF | | 1,151,170 | | 174,805 | | — | | 2,811 |
| Brazil Infrastructure ETF | | 3,632,725 | | 980,357 | | — | | — |
| India Small Cap ETF | | 3,493,209 | | 621,350 | | — | | — |
| India Consumer ETF | | — | | — | | — | | — |
| Low Volatility Dividend ETF | | 371,165 | | — | | — | | — |
| * | | Capital loss carryforwards for tax years beginning after December 22, 2010 do not expire and are carried forward in character. |
| 102 EGA Emerging Global Shares Trust |
Notes to Financial Statements (continued)
March 31, 2012
The tax character of distributions paid during the periods ended March 31, 2012 and March 31, 2011 were as follows:
| | | | | | | | | | | | | | | | | |
| | Period Ended March 31, 2012 | | Period Ended March 31, 2011 |
| Funds | Distributions
Paid from
Ordinary
Income | | Distributions
Paid From
Long Term
Capital Gains | | Distributions
Paid From
Return of
Capital | | Distributions
Paid from
Ordinary
Income | | Distributions
Paid From
Long Term
Capital Gains | | Distributions
Paid From
Return of
Capital |
| Composite ETF | $ | 312,176 | | $ | — | | $ | — | | $ | 644,426 | | $ | — | | $ | — |
| Basic Materials ETF | | 15,017 | | | — | | | — | | | — | | | — | | | — |
| Consumer Goods ETF | | 11,203 | | | — | | | — | | | — | | | — | | | — |
| Consumer Services ETF | | 1,186 | | | — | | | — | | | — | | | — | | | — |
| Energy ETF | | 309,030 | | | — | | | — | | | 144,970 | | | — | | | — |
| Financials ETF | | 52,077 | | | — | | | — | | | 398,935 | | | — | | | — |
| Health Care ETF | | 1,891 | | | — | | | — | | | — | | | — | | | — |
| Industrials ETF | | 1,831 | | | — | | | — | | | — | | | — | | | — |
| Technology ETF | | — | | | — | | | — | | | — | | | — | | | — |
| Telecom ETF | | 10,536 | | | — | | | — | | | — | | | — | | | — |
| Utilities ETF | | 9,988 | | | — | | | — | | | — | | | — | | | — |
| Metals & Mining ETF | | 532,215 | | | — | | | — | | | 203,413 | | | — | | | — |
| Consumer ETF | | 1,634,800 | | | — | | | — | | | 115,161 | | | — | | | — |
| India Infrastructure ETF | | 344,824 | | | — | | | — | | | — | | | — | | | — |
| China Infrastructure ETF | | 324,416 | | | — | | | — | | | 109,650 | | | — | | | — |
| Brazil Infrastructure ETF | | 3,135,584 | | | — | | | — | | | 862,977 | | | — | | | — |
| India Small Cap ETF | | 254,107 | | | — | | | — | | | 34,485 | | | — | | | — |
| India Consumer ETF | | — | | | — | | | — | | | — | | | — | | | — |
| Low Volatility Dividend ETF | | 659,822 | | | — | | | — | | | — | | | — | | | — |
7. FAIR VALUE MEASUREMENT
Financial Accounting Standards Board’s Accounting Standards Codification, Section 820-10, Fair Value Measurements and Disclosures defines fair value, establishes a framework for measuring fair value in accordance with GAAP, and expands disclosure about fair value measurements. It also provides guidance on determining when there has been a significant decrease in the volume and level of activity for an asset or liability, when a transaction is not orderly, and how that information must be incorporated into a fair value measurement. Under Fair Value Measurements and Disclosures, various inputs are used in determining the value of the ETF’s investments. These inputs are summarized in the three broad levels as follows:
Level 1 — Unadjusted quoted prices in active markets for identical assets or liabilities.
Level 2 — Observable inputs other than quoted prices included in Level 1 that are observable for the asset or liability, either directly or indirectly. These inputs may include quoted prices for the identical instrument in an inactive market, prices for similar securities, interest rates, prepayment speeds, credit risk, yield curves, default rates and similar data.
Level 3 — Unobservable inputs for the asset or liability, to the extent relevant observable inputs are not available; representing the ETFs’ own assumptions about the assumptions a market participant would use in valuing the asset or liability, and would be based on the best information available.
The availability of observable inputs can vary from security to security and is affected by a wide variety of factors, including, for example, the type of security, whether the security is new and not yet established in the marketplace, the liquidity of markets, and other characteristics particular to the security. To the extent that valuation is based on models or inputs that are less observable or unobservable in the market, the determination of fair value requires more judgment. Accordingly, the degree of judgment exercised in determining fair value is greatest for instruments categorized in Level 3.
The ETFs have adopted the Accounting Standard Update, Fair Value Measurements and Disclosures (Topic 820): Improving Disclosures about Fair Value Measurements which provides guidance on how investment assets and liabilities are to be valued and disclosed. Specifically, the amendment requires reporting entities to disclose i) the input and valuation techniques used to measure fair value for both recurring and nonrecurring fair value measurements, for Level 2 or Level 3 positions ii) transfers between all levels (including Level 1 and Level 2) are required to be disclosed on a gross basis (i.e. transfers out must be disclosed separately from transfers in) as well as the reason(s) for the transfer and iii) purchases, sales, issuances and settlements must be shown on a gross basis in the Level 3 roll forward rather than as one net number.
| EGA Emerging Global Shares Trust 103 |
Notes to Financial Statements (continued)
March 31, 2012
The inputs or methodology used for valuing securities are not necessarily an indication of the risk associated with investing in those securities. The following summarizes inputs used as of March 31, 2012 in valuing the ETFs’ assets and liabilities carried at fair value:
| | | | | | | | | | | | |
| | Quoted Prices in
Active Market
(Level 1) | | Other Significant
Inputs (Level 2) | | Significant
Unobservable
Inputs (Level 3) | | | | |
| Funds | Common Stocks | | Common Stocks | | | | Total |
| Composite ETF* | $ | 13,942,596 | | $ | — | | $ | — | | | $ | 13,942,596 |
| Basic Materials ETF* | | 1,614,379 | | | — | | | — | | | | 1,614,379 |
| Consumer Goods ETF* | | 1,127,101 | | | — | | | — | | | | 1,127,101 |
| Consumer Services ETF* | | 1,086,857 | | | — | | | — | | | | 1,086,857 |
| Energy ETF* | | 11,220,215 | | | — | | | — | | | | 11,220,215 |
| Financials ETF* | | 4,031,355 | | | — | | | — | | | | 4,031,355 |
| Health Care ETF* | | 1,935,677 | | | — | | | — | | | | 1,935,677 |
| Industrials ETF* | | 1,902,348 | | | — | | | — | | | | 1,902,348 |
| Technology ETF* | | 1,919,386 | | | — | | | — | | | | 1,919,386 |
| Telecom ETF* | | 3,038,006 | | | — | | | — | | | | 3,038,006 |
| Utilities ETF* | | 2,810,443 | | | — | | | — | | | | 2,810,443 |
| Metals & Mining ETF* | | 14,361,164 | | | — | | | — | | | | 14,361,164 |
| Consumer ETF* | | 401,963,305 | | | — | | | — | | | | 401,963,305 |
| India Infrastructure ETF** | | 60,683,250 | | | — | | | — | | | | 60,683,250 |
| China Infrastructure ETF** | | 12,278,209 | | | — | | | — | | | | 12,278,209 |
| Brazil Infrastructure ETF** | | 88,474,606 | | | — | | | — | | | | 88,474,606 |
| India Small Cap ETF** | | 26,377,692 | | | — | | | 191,480 | † | | | 26,569,172 |
| India Consumer ETF** | | 1,913,351 | | | — | | | — | | | | 1,913,351 |
| Low Volatility Dividend ETF* | | 59,316,191 | | | — | | | — | | | | 59,316,191 |
| * | | Please refer to the schedule/consolidated schedule of investments to view securities segregated by country. |
| ** | | Please refer to the schedule/consolidated schedule of investments to view securities segregated by industry type. |
| † | | $400,088 was transferred into Level 3 from Level 1 as a result of unadjusted quoted prices not being readily available. It is the ETF’s policy to recognize transfers in and transfers out at the fair value as of the beginning of the period. |
Reconciliation of investments in which significant unobservable inputs (Level 3) were used in determining fair value during the year ended March 31, 2012:
| | | | | | |
| | Brazil
Infrastructure ETF | | India Small Cap ETF | |
| | Receipts | | Common Stocks | |
| Balance as of 3/31/2011 | $ | 2,562,523 | | $ | 400,088 | |
| Purchases | | — | | | 53,329 | |
| Sales and spin-off | | — | | | (195,025 | ) |
| Receipt exercised and exchanged for preferred stock | | (2,361,269 | ) | | — | |
| Realized gain (loss) | | — | | | (26,637 | ) |
| Change in unrealized depreciation | | (201,254 | ) | | (40,275 | ) |
| Balance as of 3/31/2012 | $ | — | | $ | 191,480 | |
| Net change in unrealized appreciation (depreciation) for investment securities still held at 3/31/12 | $ | — | | $ | (90,753 | ) |
To estimate fair value, an industry standard valuation model was used based on market approach. The significant input for the valuation model for the Brazil Infrastructure ETF was to value the receipt at the price of its respective parent company. The significant input for the valuation model for the India Small Cap ETF was based on last available trading price, adjusted for a spun-off security.
| 104 EGA Emerging Global Shares Trust |
Notes to Financial Statements (continued)
March 31, 2012
8. INVESTMENT TRANSACTIONS
The table below displays each ETF’s investment transactions during the periods ended March 31, 2012. The Purchase column represents the aggregate purchases of investments excluding cost of in-kind purchases and short-term investments. The Sales column represents the aggregate sales of investments excluding proceeds from in-kind sales and short-term investments. Purchases In-Kind are the aggregate of all in-kind purchases and Sales In-Kind are the aggregate of all proceeds from in-kind sales. The transactions for each of these categories are as follows:
| | | | | | | | | | | |
| Funds | Purchases | | Sales | | Purchases In-Kind | | Sales In-Kind |
| Composite ETF | $ | 2,961,463 | | $ | 2,323,962 | | $ | 1,296,101 | | $ | 13,847,963 |
| Basic Materials ETF | | 577,125 | | | 236,317 | | | 2,420,790 | | | 791,976 |
| Consumer Goods ETF | | 1,116,005 | | | 578,504 | | | 1,352,709 | | | 897,501 |
| Consumer Services ETF | | 881,964 | | | 511,967 | | | 2,254,479 | | | 1,592,532 |
| Energy ETF | | 6,389,114 | | | 3,472,654 | | | 3,099,104 | | | 15,681,387 |
| Financials ETF | | 1,899,270 | | | 1,502,319 | | | 1,955,579 | | | 7,563,243 |
| Health Care ETF | | 1,048,482 | | | 335,128 | | | 1,956,525 | | | 626,541 |
| Industrials ETF | | 1,707,521 | | | 893,441 | | | 2,408,185 | | | 1,128,873 |
| Technology ETF | | 943,133 | | | 276,282 | | | 2,056,757 | | | 688,517 |
| Telecom ETF | | 940,032 | | | 243,458 | | | 3,190,444 | | | 844,895 |
| Utilities ETF | | 1,295,713 | | | 433,413 | | | 2,551,521 | | | 599,256 |
| Metals & Mining ETF | | 4,393,362 | | | 2,196,023 | | | 813,234 | | | 17,311,222 |
| Consumer ETF | | 82,036,799 | | | 6,981,650 | | | 117,699,073 | | | 14,218,950 |
| India Infrastructure ETF | | 16,034,402 | | | 20,255,584 | | | — | | | — |
| China Infrastructure ETF | | 2,852,840 | | | 1,988,630 | | | 4,486,983 | | | 8,581,003 |
| Brazil Infrastructure ETF | | 35,095,767 | | | 24,410,094 | | | — | | | — |
| India Small Cap ETF | | 36,250,123 | | | 35,680,137 | | | — | | | — |
| India Consumer ETF | | 4,441,863 | | | 2,599,562 | | | — | | | — |
| Low Volatility Dividend ETF | | 35,331,235 | | | 11,132,834 | | | 46,595,448 | | | 13,780,056 |
9. INVESTMENT ADVISORY AND OTHER AGREEMENTS
The Trust has entered into an Investment Advisory Agreement (the “Advisory Agreement”) with ALPS Advisors, Inc. (“ALPS” or the “Adviser”). The Adviser acts as the ETFs’ investment adviser pursuant to an advisory agreement with the Trust on behalf of the ETFs. Pursuant to the Advisory Agreement, the Adviser has overall supervisory responsibility for the general management and investment of each ETF’s securities portfolio, and has ultimate responsibility (subject to oversight by the Trust’s Board of Trustees) for oversight of the Trust’s sub-adviser. For its services, the Trust pays the Adviser an annual management fee, accrued daily at the rate of 1/366th of the applicable advisory fee rate and payable monthly as soon as practicable after the last day of each month. The annual management fee for the following ETFs consists of the greater of $400,000 or 0.10% of each ETF’s average daily net assets during the month, but not to exceed $1,000,000 per year:
| |
| Composite ETF | Basic Materials ETF |
| Energy ETF | Financials ETF |
| Health Care ETF | Industrials ETF |
| Metals & Mining ETF | Consumer ETF |
| India Infrastructure ETF | China Infrastructure ETF |
| Brazil Infrastructure ETF | India Small Cap ETF |
In addition, the annual management fee for the ETFs listed below consist of the greater of $400,000 plus $33,333.33 per ETF minus any management fees paid to the Adviser by the ETFs detailed above, or 0.10% of the average daily net assets of each ETF listed below, but not to exceed annually $1,000,000 plus $83,333.33 for each ETF minus any management fees paid to the Adviser by the ETFs detailed above:
| |
| Consumer Goods ETF | Consumer Services ETF |
| Technology ETF | Telecom ETF |
| Utilities ETF | India Consumer ETF |
| Low Volatility Dividend ETF | |
From time to time, the Adviser may waive all or a portion of its fee.
| EGA Emerging Global Shares Trust 105 |
Notes to Financial Statements (continued)
March 31, 2012
Emerging Global Advisors, LLC (“EGA”) serves as the sub-adviser to the ETFs and provides investment advice and management services to the ETFs. EGA supervises the day-to-day investment and reinvestment of the assets in each ETF and is responsible for designating the Deposit Securities and for monitoring each ETF’s adherence to its investment mandate. For its investment sub-advisory services, EGA receives from the ETFs an annual fee equal to 0.75% of the average daily net assets of Composite ETF, 0.89% of average daily net assets of India Consumer ETF and 0.85% of the average daily net assets of each of the other ETFs.
The Trust and EGA have entered into a written fee waiver and expense reimbursement agreement pursuant to which EGA has agreed to reduce and/or reimburse expenses to the extent necessary to prevent the annual operating expenses of each ETF (excluding any taxes, interest, brokerage fees and non-routine expenses) from exceeding 0.85% of average daily net assets (0.75% for Composite ETF and 0.89% for India Consumer ETF) at least until July 31, 2012. Under this fee waiver and expense assumption agreement, EGA retains the right to seek reimbursement from each ETF of fees previously waived or expenses previously assumed to the extent such fees were waived or expenses were assumed within three years of such reimbursement, and provided such reimbursement does not cause an ETF to exceed any applicable fee waiver or expense limitation agreement that was in place at the time the fees were waived or expenses assumed.
On July 19, 2011, ALPS Holdings, Inc. (“ALPS Holdings”), parent company to ALPS Advisors, announced that it signed a definitive agreement to be acquired by DST Systems, Inc. (“DST”) through a merger with a wholly owned DST subsidiary (the “Transaction”). On October 31, 2011, the Transaction was completed. Under the Investment Company Act of 1940, as amended (the “1940 Act”), completion of the Transaction caused the automatic termination of each Fund’s prior investment advisory agreement with the Adviser. In order for the management of each Fund to continue uninterrupted, the Board of Trustees of each Fund (the “Board”) approved a new investment advisory agreement with the Adviser (the “New Advisory Agreement”) on July 28, 2011, subject to shareholder approval.
On September 27, 2011, a special meeting of shareholders of the Funds (the “Special Meeting”) was called to consider the approval of the New Advisory Agreement. The Special Meeting was adjourned until November 22, 2011 for those Funds for which shareholder approval of the New Advisory Agreement had not yet been obtained (the “Remaining Funds”). At a meeting on October 27, 2011, the Board approved an interim investment advisory agreement with ALPS Advisors (the “Interim Advisory Agreement”) pursuant to Rule 15a-4 under the 1940 Act for the Remaining Funds. The Interim Advisory Agreement for each Remaining Fund took effect upon the consummation of the Transaction on October 31, 2011.
At the reconvened Special Meeting on November 22, 2011, the New Investment Advisory Agreement was approved by shareholders for each Remaining Fund except EGShares China Infrastructure ETF, EGShares India Small Cap ETF and EGShares Brazil Infrastructure ETF, for which the requisite shareholder vote had not yet been obtained. These Funds continued to operate under the Interim Advisory Agreement. A subsequent meeting of shareholders was held on February 29, 2012, at which time the New Investment Advisory Agreement was approved for EGShares China Infrastructure ETF, EGShares India Small Cap ETF and EGShares Brazil Infrastructure ETF.
The amounts EGA reimbursed, the amounts available for potential future recoupment by EGA and the expiration schedule at March 31, 2012 are as follows:
| | | | | | | | | | | | | | |
| | Expenses
Reimbursed/Waived | | Potential Recoupment Amounts Expiring | | Total Potential
Recoupment
Amount |
| Funds | | March 31, 2013 | | March 30, 2014 | | March 31, 2015 | |
| Composite ETF | $ | 252,669 | | $ | 302,447 | | $ | 355,407 | | $ | 252,669 | | $ | 910,523 |
| Basic Materials ETF | | 64,900 | | | — | | | — | | | 64,900 | | | 64,900 |
| Consumer Goods ETF | | 76,800 | | | — | | | — | | | 76,800 | | | 76,800 |
| Consumer Services ETF | | 47,875 | | | — | | | — | | | 47,875 | | | 47,875 |
| Energy ETF | | 249,227 | | | 318,362 | | | 202,602 | | | 249,227 | | | 770,191 |
| Financials ETF | | 191,473 | | | 125,612 | | | 207,810 | | | 191,473 | | | 524,895 |
| Health Care ETF | | 70,782 | | | — | | | — | | | 70,782 | | | 70,782 |
| Industrials ETF | | 69,310 | | | — | | | — | | | 69,310 | | | 69,310 |
| Technology ETF | | 71,813 | | | — | | | — | | | 71,813 | | | 71,813 |
| Telecom ETF | | 70,518 | | | — | | | — | | | 70,518 | | | 70,518 |
| Utilities ETF | | 74,475 | | | — | | | — | | | 74,475 | | | 74,475 |
| Metals & Mining ETF | | 251,382 | | | 344,869 | | | 301,755 | | | 251,382 | | | 898,006 |
| Consumer ETF | | 1,195,954 | | | — | | | 403,405 | | | 1,195,954 | | | 1,599,359 |
| India Infrastructure ETF | | 577,187 | | | — | | | 381,030 | | | 577,187 | | | 958,217 |
| China Infrastructure ETF | | 194,340 | | | 34,768 | | | 247,399 | | | 194,340 | | | 476,507 |
| Brazil Infrastructure ETF | | 504,255 | | | 32,912 | | | 478,083 | | | 504,255 | | | 1,015,250 |
| India Small Cap ETF | | 399,568 | | | — | | | 356,162 | | | 399,568 | | | 755,730 |
| India Consumer ETF | | 98,710 | | | — | | | — | | | 98,710 | | | 98,710 |
| Low Volatility Dividend ETF | | 189,604 | | | — | | | — | | | 189,604 | | | 189,604 |
| 106 EGA Emerging Global Shares Trust |
Notes to Financial Statements (continued)
March 31, 2012
The Bank of New York Mellon serves as the ETFs’ Administrator, Custodian, Fund Accountant and Transfer Agent pursuant to a Fund Administration and Accounting Agreement, a Custody Agreement and a Transfer Agency and Service Agreement, as the case may be.
ALPS Fund Services, Inc. (“AFS”), an affiliate of the Adviser and the Distributor, provides a Chief Compliance Officer and an Anti-Money Laundering Officer as well as certain additional compliance support functions under a Compliance Services Agreement. AFS also provides a Principal Financial Officer to the Trust under a PFO Services Agreement. As compensation for the foregoing services, AFS receives certain out of pocket costs, and fixed and asset-based fees, which are accrued daily and paid monthly by the ETFs. Compensation for such services is included under the Advisory Agreement.
10. CREATION AND REDEMPTION TRANSACTIONS
The ETFs issue and redeem Shares on a continuous basis at NAV in blocks of 50,000 shares called “Creation Units.” Except when aggregated in Creation Units, shares are not redeemable securities of an ETF.
Only “Authorized Participants” may purchase or redeem shares directly from an ETF. An Authorized Participant is either (i) a broker-dealer or other participant in the clearing process through the Continuous Net Settlement System of the National Securities Clearing Corporation or (ii) a DTC participant and, in each case, must have executed a Participant Agreement with Distributors. Most retail investors will not qualify as Authorized Participants or do not have the resources to buy and sell whole Creation Units. Therefore, they will be unable to purchase or redeem the shares directly from the ETFs. Rather, most retail investors will purchase shares in the secondary market with the assistance of a broker and will be subject to customary brokerage commissions or fees.
Except as discussed below, the consideration for the purchase of Creation Units of an ETF generally consists of the in-kind deposit of a designated portfolio of equity securities, which constitutes an optimized representation of the corresponding Index and an amount of cash. The consideration for the purchase of Creation Units of the Brazil Infrastructure ETF consists solely or partially for cash in U.S. dollars. The consideration for the purchase of Creation Units of an ETF that invests its assets in a wholly owned subsidiary in Mauritius will consist solely or partially for cash in U.S. dollars based on the number of Indian securities included in an ETF’s corresponding Underlying Index. Investors transacting in Creation Units for cash pay an additional variable charge to compensate the relevant ETF for brokerage and market impact expenses relating to investing in portfolio securities.
11. TRUSTEES’ FEES
The Trust compensates each Trustee who is not an employee of the Adviser, EGA or its affiliates. The interested Trustees do not receive any compensation from the Trust for serving as Trustees.
12. NEW ACCOUNTING PRONOUNCEMENTS
In April 2011, the Financial Accounting Standards Board (“FASB”) issued Accounting Standards Update (“ASU”) No. 2011-03 “Reconsideration of Effective control for Repurchase Agreements”. The objective of ASU 2011-03 is to improve the accounting for repurchase agreements and other agreements that both entitle and obligate a transferor to repurchase or redeem financial assets before their maturity. Under previous guidance, whether or not to account for a transaction as a sale was based on, in part, if the entity maintained effective control over the transferred financial assets. ASU 2011-03 removes the transferor’s ability criterion from the effective control assessment. This guidance is effective prospectively for interim and annual reporting periods beginning on or after December 15, 2011. At this time, management is evaluating the implications of ASU No. 2011-03 and its impact on the financial statements has not been determined.
In May 2011, the FASB issued ASU No. 2011-04 “Amendments to Achieve Common Fair Value Measurement and Disclosure Requirements in U.S. GAAP and IFRSs”. ASU 2011-04 includes common requirements for measurement of and disclosure about fair value between U.S. GAAP and IFRS. ASU 2011-04 will require reporting entities to disclose the following information for fair value measurements categorized within Level 3 of the fair value hierarchy: quantitative information about the unobservable inputs used in the fair value measurement, the valuation processes used by the reporting entity and a narrative description of the sensitivity of the fair value measurement to changes in unobservable inputs and the interrelationships between those unobservable inputs. In addition, ASU 2011-04 will require reporting entities to make disclosures about amounts and reasons for all transfers in and out of Level 1 and Level 2 fair value measurements. The new and revised disclosures are effective for interim and annual reporting periods beginning after December 15, 2011. Management is currently evaluating the implications of ASU No. 2011-04 and its impact on the financial statements.
In December 2011, the Financial Accounting Standards Board issued Accounting Standards Update No. 2011-11, Disclosures about Offsetting Assets and Liabilities (“ASU 2011-11”). ASU 2011-11 requires disclosures to make financial statements that are prepared under U.S. GAAP more comparable to those prepared under International Financial Reporting Standards. The new disclosure requirements mandate that entities disclose both gross and net information about instruments and transactions eligible for offset in the statement of assets and liabilities as well as instruments and transactions subject to an agreement similar to a master netting arrangement. In addition, ASU 2011-11 requires disclosure of collateral received and posted in connection with master netting agreements or similar arrangements. New disclosures
| EGA Emerging Global Shares Trust 107 |
Notes to Financial Statements (continued)
March 31, 2012
are required for annual reporting periods beginning on or after January 1, 2013, and interim periods within those annual periods. Management is evaluating the impact of ASU 2011-11 on the financial statements and disclosures.
13. ETF NAME CHANGES
The Board approved effective May 3, 2011, the following Fund name changes:
| |
| Prior Fund Name | New Fund Name |
| Emerging Global Shares Dow Jones Emerging Markets Basic Materials Titans Index Fund | EGShares Basic Materials GEMS ETF |
| Emerging Global Shares Dow Jones Emerging Markets Consumer Goods Titans Index Fund | EGShares Consumer Goods GEMS ETF |
| Emerging Global Shares Dow Jones Emerging Markets Consumer Services Titans Index Fund | EGShares Consumer Services GEMS ETF |
| Emerging Global Shares Dow Jones Emerging Markets Health Care Titans Index Fund | EGShares Health Care GEMS ETF |
| Emerging Global Shares Dow Jones Emerging Markets Industrials Titans Index Fund | EGShares Industrials GEMS ETF |
| Emerging Global Shares Dow Jones Emerging Markets Technology Titans Index Fund | EGShares Technology GEMS ETF |
| Emerging Global Shares Dow Jones Emerging Markets Telecom Titans Index Fund | EGShares Telecom GEMS ETF |
| Emerging Global Shares Dow Jones Emerging Markets Utilities Titans Index Fund | EGShares Utilities GEMS ETF |
The Board approved effective June 23, 2011, the following Fund name and NYSE Arca symbol changes:
| Prior Fund Name | New Fund Name | Prior NYSE
Arca Symbol | New NYSE
Arca Symbol |
| Emerging Global Shares Dow Jones Emerging Markets Titans Composite Index Fund | EGShares GEMS Composite ETF | EEG | AGEM |
| Emerging Global Shares Dow Jones Emerging Markets Energy Titans Index Fund | EGShares Energy GEMS ETF | EEO | OGEM |
| Emerging Global Shares Dow Jones Emerging Markets Financials Titans Index Fund | EGShares Financials GEMS ETF | EFN | FGEM |
The Board approved effective June 23, 2011, the following Fund name change:
| |
| Prior Fund Name | New Fund Name |
| Emerging Global Shares Dow Jones Emerging Markets Metals & Mining Titans Index Fund | EGShares Emerging Markets Metals & Mining ETF |
The Board approved effective July 29, 2011, the following Fund name changes:
| |
| Prior Fund Name | New Fund Name |
| Emerging Global Shares Dow Jones Emerging Markets Consumer Titans Index Fund | EGShares Emerging Markets Consumer ETF |
| Emerging Global Shares INDXX India Infrastructure Index Fund | EGShares India Infrastructure ETF |
| Emerging Global Shares INDXX China Infrastructure Index Fund | EGShares China Infrastructure ETF |
| Emerging Global Shares INDXX Brazil Infrastructure Index Fund | EGShares Brazil Infrastructure ETF |
| Emerging Global Shares INDXX India Small Cap Index Fund | EGShares India Small Cap ETF |
The Board approved effective October 28, 2011, the following Fund name change:
| |
| Current ETF Name | New ETF Name |
| EGShares Emerging Markets Low Volatility Dividend ETF | EGShares Low Volatility Emerging Markets Dividend ETF |
14. SUBSEQUENT EVENTS
The ETFs have evaluated subsequent events through the date of issuance of this report and have determined; there are no material events that impacted the ETFs’ financial statements.
| 108 EGA Emerging Global Shares Trust |
Report of Independent Registered Public Accounting Firm
To the Board of Trustees and
Shareholders of EGA Emerging Global Shares Trust
We have audited the accompanying statements of assets and liabilities of EGShares GEMS Composite ETF, EGShares Basic Materials GEMS ETF, EGShares Consumer Goods GEMS ETF, EGShares Consumer Services GEMS ETF, EGShares Energy GEMS ETF, EGShares Financials GEMS ETF, EGShares Health Care GEMS ETF, EGShares Industrials GEMS ETF, EGShares Technology GEMS ETF, EGShares Telecom GEMS ETF, EGShares Utilities GEMS ETF, EGShares Emerging Markets Metals & Mining ETF, EGShares Emerging Markets Consumer ETF, EGShares India Infrastructure ETF, EGShares China Infrastructure ETF, EGShares Brazil Infrastructure ETF, EGShares India Small Cap ETF, EGShares India Consumer ETF, and EGShares Low Volatility Emerging Markets Dividend ETF, each a series of shares of beneficial interest of EGA Emerging Global Shares Trust (the “Funds”), including the schedules of investments, as of March 31, 2012, and the related statements of operations for the year or periods then ended, and the statements of changes in net assets and financial highlights for each of the respective years or periods presented. These financial statements and financial highlights are the responsibility of the Funds’ management. Our responsibility is to express an opinion on these financial statements and financial highlights based on our audits.
We conducted our audits in accordance with the standards of the Public Company Accounting Oversight Board (United States). Those standards require that we plan and perform the audits to obtain reasonable assurance about whether the financial statements and financial highlights are free of material misstatement. An audit includes examining, on a test basis, evidence supporting the amounts and disclosures in the financial statements. Our procedures included confirmation of securities owned as of March 31, 2012 by correspondence with the custodian and brokers and by other appropriate auditing procedures where responses from brokers were not received. An audit also includes assessing the accounting principles used and significant estimates made by management, as well as evaluating the overall financial statement presentation. We believe that our audits provide a reasonable basis for our opinion.
In our opinion, the financial statements and financial highlights referred to above present fairly, in all material respects, the financial position of EGShares GEMS Composite ETF, EGShares Basic Materials GEMS ETF, EGShares Consumer Goods GEMS ETF, EGShares Consumer Services GEMS ETF, EGShares Energy GEMS ETF, EGShares Financials GEMS ETF, EGShares Health Care GEMS ETF, EGShares Industrials GEMS ETF, EGShares Technology GEMS ETF, EGShares Telecom GEMS ETF, EGShares Utilities GEMS ETF, EGShares Emerging Markets Metals & Mining ETF, EGShares Emerging Markets Consumer ETF, EGShares India Infrastructure ETF, EGShares China Infrastructure ETF, EGShares Brazil Infrastructure ETF, EGShares India Small Cap ETF, EGShares India Consumer ETF, and EGShares Low Volatility Emerging Markets Dividend ETF as of March 31, 2012, and the results of their operations for the year or periods then ended, and the changes in their net assets and their financial highlights for the years or periods presented, in conformity with accounting principles generally accepted in the United States of America.
| |  |
| | |
| | BBD, LLP |
Philadelphia, Pennsylvania
May 30, 2012
| EGA Emerging Global Shares Trust 109 |
Federal Income Tax Information (Unaudited)
Federal Tax Status of Dividends Declared during the Tax Year
For Federal income tax purposes, dividends from short-term capital gains are classified as ordinary income. The percentage of ordinary income distribution designated as qualifying for the corporate dividend received deduction (“DRD”), and the individual qualified dividend rate (“QDI”) is presented below.
| | | | | |
| Funds | DRD | | QDI |
| EGShares GEMS Composite ETF | 0.00 | % | | 100.00 | % |
| EGShares Basic Materials GEMS ETF | 0.00 | % | | 77.62 | % |
| EGShares Consumer Goods GEMS ETF | 0.00 | % | | 100.00 | % |
| EGShares Consumer Services GEMS ETF | 0.00 | % | | 9.61 | % |
| EGShares Energy GEMS ETF | 0.00 | % | | 100.00 | % |
| EGShares Financials GEMS ETF | 0.00 | % | | 100.00 | % |
| EGShares Health Care GEMS ETF | 0.00 | % | | 100.00 | % |
| EGShares Industrials GEMS ETF | 0.00 | % | | 100.00 | % |
| EGShares Technology GEMS ETF | 0.00 | % | | 0.00 | % |
| EGShares Telecom GEMS ETF | 0.00 | % | | 60.47 | % |
| EGShares Utilities GEMS ETF | 0.00 | % | | 100.00 | % |
| EGShares Emerging Markets Metals & Mining ETF | 0.00 | % | | 100.00 | % |
| EGShares Emerging Markets Consumer ETF | 0.00 | % | | 100.00 | % |
| EGShares India Infrastructure ETF | 0.00 | % | | 77.24 | % |
| EGShares China Infrastructure ETF | 0.00 | % | | 65.59 | % |
| EGShares Brazil Infrastructure ETF | 0.00 | % | | 32.81 | % |
| EGShares India Small Cap ETF | 0.00 | % | | 100.00 | % |
| EGShares India Consumer ETF | 0.00 | % | | 0.00 | % |
| EGShares Low Volatility Emerging Markets Dividend ETF | 0.00 | % | | 100.00 | % |
| 110 EGA Emerging Global Shares Trust |
Shareholder Meeting Results (Unaudited)
A special meeting of shareholders of the Funds (the “Special Meeting”) was called to consider the approval of the New Investment Advisory Agreement.
| Funds | Total
Outstanding
Shares | | Total Voted | | Present
(% of Total) |
| EGShares GEMS Composite ETF | 1,155,000 | | 584,927 | | 50.64 | % |
| EGShares Basic Materials GEMS ETF | 100,000 | | 85,737 | | 85.74 | |
| EGShares Consumer Goods GEMS ETF | 100,000 | | 98,200 | | 98.20 | |
| EGShares Consumer Services GEMS ETF | 50,000 | | 25,747 | | 51.49 | |
| EGShares Energy GEMS ETF | 750,000 | | 382,039 | | 50.94 | |
| EGShares Financials GEMS ETF | 300,000 | | 198,179 | | 66.06 | |
| EGShares Health Care GEMS ETF | 100,000 | | 85,294 | | 85.29 | |
| EGShares Industrials GEMS ETF | 100,000 | | 99,649 | | 99.65 | |
| EGShares Technology GEMS ETF | 100,000 | | 97,223 | | 97.22 | |
| EGShares Telecom GEMS ETF | 100,000 | | 78,014 | | 78.01 | |
| EGShares Utilities GEMS ETF | 100,000 | | 90,825 | | 90.83 | |
| EGShares Emerging Markets Metals & Mining ETF | 1,250,000 | | 647,023 | | 51.76 | |
| EGShares Emerging Markets Consumer ETF | 10,350,000 | | 5,346,503 | | 51.66 | |
| EGShares India Infrastructure ETF | 4,400,000 | | 2,913,257 | | 66.21 | |
| EGShares China Infrastructure ETF | 800,000 | | 348,685 | | 43.59 | |
| EGShares Brazil Infrastructure ETF | 3,200,000 | | 1,193,051 | | 37.28 | |
| EGShares India Small Cap ETF | 1,550,000 | | 580,203 | | 37.43 | |
Proposal (1) was approved. Shares voted in favor, shares voted against, and shares abstaining with respect to proposal (1) at the Special Meeting were as follows:
| Funds | Voted “For” | | Voted “Against” | | Abstained |
| EGShares GEMS Composite ETF | 579,546 | | 1,883 | | | 3,498 | |
| EGShares Basic Materials GEMS ETF | 85,737 | | — | | | — | |
| EGShares Consumer Goods GEMS ETF | 98,200 | | — | | | — | |
| EGShares Consumer Services GEMS ETF | 25,747 | | — | | | — | |
| EGShares Energy GEMS ETF | 376,814 | | 1,661 | | | 3,564 | |
| EGShares Financials GEMS ETF | 190,785 | | 4,894 | | | 2,500 | |
| EGShares Health Care GEMS ETF | 85,294 | | — | | | — | |
| EGShares Industrials GEMS ETF | 99,649 | | — | | | — | |
| EGShares Technology GEMS ETF | 97,223 | | — | | | — | |
| EGShares Telecom GEMS ETF | 78,014 | | — | | | — | |
| EGShares Utilities GEMS ETF | 90,825 | | — | | | — | |
| EGShares Emerging Markets Metals & Mining ETF | 627,547 | | 6,124 | | | 13,352 | |
| EGShares Emerging Markets Consumer ETF | 5,240,673 | | 33,933 | | | 71,897 | |
| EGShares India Infrastructure ETF | 2,894,985 | | 11,931 | | | 6,341 | |
| EGShares China Infrastructure ETF | 343,438 | | 1,201 | | | 4,046 | |
| EGShares Brazil Infrastructure ETF | 1,152,895 | | 25,901 | | | 14,255 | |
| EGShares India Small Cap ETF | 543,636 | | 35,427 | | | 1,140 | |
The New Advisory Agreement for each Fund listed below was approved by the sole shareholder of each Fund.
|
| Funds |
| EGShares India Consumer ETF |
| EGShares Low Volatility Emerging Markets Dividend ETF |
| EGA Emerging Global Shares Trust 111 |
Board Review and Approval of Advisory Contracts (Unaudited)
A. EGShares Funds
At the February 23, 2012 Board of Trustees (the “Board”) meeting (the “Meeting”), the Board, including those Trustees who are not “interested persons” (as that term is defined in the Investment Company Act of 1940, as amended (“1940 Act”)) of the Trust (the “Independent Trustees”), approved EGA to continue to serve as investment sub-adviser to each Fund and approved the continuation of the sub-advisory agreement (the “Sub-Advisory Agreement”) between EGA and the Trust with respect to each Fund, upon the same terms and conditions set forth therein, for the period April 17, 2012 until April 17, 2013. In connection with considering approval of the Sub-Advisory Agreement, the Independent Trustees met in executive session with independent counsel, who provided assistance and advice.
In considering the approval of the Sub-Advisory Agreement, the Independent Trustees reviewed the materials provided for the Meeting by EGA, including: (i) a copy of the Sub-Advisory Agreement with EGA and any amendments thereto; (ii) information describing the nature, quality, and extent of the services that EGA provides to the Funds, and the fees that EGA charges for such services; (iii) information concerning the business, operations and compliance program of EGA; (iv) a copy of the current Form ADV for EGA; and (v) a memorandum from Stradley Ronon on the responsibilities of trustees in considering investment advisory arrangements under the 1940 Act. In addition, the Independent Trustees received data compiled by ETF Database comparing the advisory fees, expenses and performance of the Funds that had commenced operations with fees, expenses and performance of other ETFs with similar investment objectives and policies.
During their review of this information, the Independent Trustees focused on and analyzed the factors that the Independent Trustees deemed relevant, including: the nature, quality, and extent of the services provided to each Fund by EGA; the personnel and operations of EGA; the investment performance of the Funds; the profitability to EGA under the Sub-Advisory Agreements; any “fall-out” benefits to EGA (i.e., the ancillary benefits realized due to a relationship with the Trust); and possible conflicts of interest.
In particular, the Board considered and reviewed the following with respect to each Fund:
Approval of Continuation of Sub-Advisory Agreement with EGA
(a) The nature, extent, and quality of services provided to each Fund by EGA. The Board reviewed the services that EGA provides to each Fund. In connection with the sub-advisory services provided to each Fund, the Board noted the significant responsibilities that EGA has as the Funds’ sub-adviser, including: implementation of the investment management program of each Fund; management of the day-to-day investment and reinvestment of the assets in each Fund; determining daily baskets of deposit securities and cash components; executing portfolio security trades for purchases and redemptions of Fund shares conducted on a cash-in-lieu basis; making determinations with respect to alternative cash management vehicles and securities lending collateral investments; management of intermediate Mauritius entities for those Funds with significant investments in India; and oversight of general portfolio compliance with relevant law.
The Board reviewed EGA’s experience, resources, strengths and its performance as a sub-adviser to the Funds. Based on their consideration and review of the foregoing information, the Board concluded that each Fund was likely to continue to benefit from the nature, quality, and extent of these services, as well as EGA’s ability to render such services based on its experience, operations and resources.
(b) Comparison of services provided and fees charged by EGA and other investment advisers to similar clients, and the cost of the services provided and profits realized by EGA from the relationship with the Funds.
Operational Funds
The Board next compared both the services rendered and the fees paid pursuant to the Sub-Advisory Agreement for each currently operating ETF (the “Operational Funds”) to contracts of other registered investment advisers providing services to similar ETFs. In particular, the Board compared each Fund’s advisory fee and expense ratio to the advisory fees and expense ratios of other ETFs considered to be in such Fund’s peer group, as chosen by ETF Database for periods that the Funds were in operation through December 31, 2011. The Board noted that most Funds’ management fees and expenses (after giving effect to the proposed Expense Cap Agreement) were within the median to maximum of the range of such Fund’s peer group. The Board also noted that some of the Funds had been in operation for less than one year.
The Board noted that the actual sub-advisory fee of the EGShares GEMS Composite ETF was between the median and the maximum range of fees charged by other funds in the Fund’s peer group, as chosen by ETF Database. The Board also noted that the total expenses (including the proposed Expense Cap Agreement) of the Fund were between the median and the maximum range of total expenses of other funds in the Fund’s peer group, as chosen by ETF Database.
The Board noted that the actual sub-advisory fee of the EGShares Low Volatility Emerging Markets Dividend ETF was at the maximum range of fees charged by other funds in the Fund’s peer group, as chosen by ETF Database. The Board also noted that the total expenses (including the proposed Expense Cap Agreement) of the Fund were between the median and the maximum range of total expenses of other funds in the Fund’s peer group, as chosen by ETF Database.
| 112 EGA Emerging Global Shares Trust |
Board Review and Approval of Advisory Contracts (Unaudited) (continued)
The Board noted that the actual sub-advisory fee for each of the EGShares Basic Materials GEMS ETF, the EGShares Consumer Goods GEMS ETF, the EGShares Consumer Services GEMS ETF, the EGShares Energy GEMS ETF, the EGShares Financials GEMS ETF, the EGShares Health Care GEMS, the EGShares Industrials GEMS ETF, the EGShares Technology GEMS, the EGShares Telecom GEMS ETF, the EGShares Utilities GEMS ETF, the EGShares Emerging Markets Metals & Mining ETF and the EGShares Emerging Markets Consumer ETF was at the maximum range of fees charged by other funds in each Fund’s respective peer group, as chosen by ETF Database. The Board also noted that the total expenses (including the proposed Expense Cap Agreement) of the Funds were at the maximum range of total expenses of other funds in the each Fund’s respective peer group, as chosen by ETF Database.
The Board noted that the actual sub-advisory fee of the EGShares India Consumer ETF, EGShares China Infrastructure ETF and EGShares Brazil Infrastructure ETF was at the maximum range of fees charged by other funds in each Fund’s peer group, as chosen by ETF Database. The Board also noted that the total expenses (including the proposed Expense Cap Agreement) of each Fund were at the maximum range of total expenses of other funds in each Fund’s peer group, as chosen by ETF Database.
The Board noted that the actual sub-advisory fee of the EGShares India Small Cap ETF and EGShares India Infrastructure ETF was at the maximum range of fees charged by other funds in each Fund’s peer group, as chosen by ETF Database. The Board also noted that the total expenses (including the proposed Expense Cap Agreement) of each Fund were between the median and the maximum range of total expenses of other funds in each Fund’s peer group, as chosen by ETF Database.
The Board considered the appropriateness of the investment advisory fees and expense ratios of the Funds compared to the fees and expenses of similar ETFs. The Board received information in regard to the costs, including operational costs, and profitability of EGA in connection with its serving as sub-adviser to each Fund. The Board also received information regarding the additional costs of operating the EGShares Energy GEMS ETF, the EGShares Financials GEMS ETF, the EGShares Basic Materials GEMS ETF, the EGShares Consumer Goods GEMS ETF, the EGShares Telecom GEMS ETF, the EGShares Health Care GEMS ETF, the EGShares Technology GEMS ETF, the EGShares Industrials GEMS ETF, the EGShares Utilities GEMS ETF, the EGShares India Consumer ETF and EGShares Low Volatility Emerging Markets Dividend ETF, each of which invests in a related Mauritius company in order to invest directly in Indian companies, which resulted in higher expense ratios for those Funds. The Board received information regarding the costs associated with registering and operating each of the Mauritius companies. The Board noted EGA’s commitment to limit each Fund’s expenses through an Expense Cap Agreement with the Trust, including the circumstances in which the Trust would have to repay fees in excess of the Expense Cap Agreement that were borne by EGA. After comparing each Fund’s fee and expenses with those of other funds in the such Fund’s peer group, including for those Funds whose fees and expenses were in the maximum range compared to their peer groups, and in light of the nature, quality, and extent of services provided by EGA and the costs incurred by EGA in rendering those services and capping the Funds’ expenses, the Board concluded that the fees paid to EGA with respect to each Fund were fair and reasonable.
Non-Operational Funds
The Board noted that the actual sub-advisory fee for each of the EGShares India Financials ETF, EGShares India Health Care ETF, EGShares India Industrials ETF, EGShares India Technology ETF, EGShares India Basic Materials ETF, EGShares India Energy ETF and EGShares Low Volatility India Dividend ETF was at the maximum range of fees charged by other funds in each Fund’s respective peer group, as chosen by ETF Database. The Board also noted that the total expenses including the proposed Expense Cap Agreement of the Funds were at the maximum range of total expenses of other funds in the each Fund’s respective peer group, as chosen by ETF Database.
The Board noted that the actual sub-advisory fee for each of the EGShares Emerging Markets Food and Agriculture ETF, EGShares China Mid Cap ETF and EGShares Brazil Mid Cap ETF was above the maximum range of fees charged by other funds in each Fund’s respective peer group, as chosen by ETF Database. The Board also noted that the total expenses including the proposed Expense Cap Agreement of the Funds were above the maximum range of total expenses of other funds in the each Fund’s respective peer group, as chosen by ETF Database.
(c) EGA’s profitability and the extent to which economies of scale were realized as each Fund grew and whether fee levels reflect such economies of scale. The Board reviewed EGA’s profitability with respect to each Operational Fund. The Board then considered economies of scale and the asset level of each Fund. The Board was informed that the Funds were not yet a sufficient size to be experiencing economies of scale, and that EGA would consider addressing economies of scale when assets under management reached appropriate levels.
(d) Investment performance of EGA. The Board considered the investment performance of the Funds, including tracking error. In particular, the Board considered the investment performance of the Funds relative to their stated objective to seek investment results that correspond (before fees and expenses) to the price and yield performance of their applicable underlying index, and EGA’s success in reaching each Fund’s objectives. The Board considered each Fund’s investment performance compared to the underlying index that is referenced in each Fund’s investment objective. Consideration was given to tracking data provided to the Board throughout the year by ALPS Advisors and EGA. The Board noted that some of the Funds had been in operation for less than one year.
| EGA Emerging Global Shares Trust 113 |
Board Review and Approval of Advisory Contracts (Unaudited) (continued)
The Board noted that the tracking error for EGShares GEMS Composite ETF ranged from -0.84% to 0.96% for each of the four quarters of 2011.
The Board noted that the tracking error for EGShares Energy GEMS ETF ranged from 0.07% to 0.82% for each of the four quarters of 2011.
The Board noted that the tracking error for EGShares Financials ETF ranged from -0.76% to 0.04% for each of the four quarters of 2011.
The Board noted that the tracking error for EGShares Basic Materials GEMS ETF was 0.56% for the third quarter of 2011 (the first full quarter of operation) and 0.38% for the fourth quarter of 2011.
The Board noted that the tracking error for EGShares Consumer Goods GEMS ETF was 2.17% for the third quarter of 2011 (the first full quarter of operation) and 0.39% for the fourth quarter of 2011.
The Board noted that the tracking error for
EGShares Health Care GEMS ETF was 0.02% for the third quarter of 2011 (the first full quarter of operation) and 0.24% for the fourth quarter of 2011.
The Board noted that the tracking error for EGShares Industrials GEMS ETF was -0.25% for the third quarter of 2011 (the first full quarter of operation) and -0.45% for the fourth quarter of 2011.
The Board noted that the tracking error for EGShares Technology GEMS ETF was -0.52% for the third quarter of 2011 (the first full quarter of operation) and 0.43% for the fourth quarter of 2011.
The Board noted that the tracking error for EGShares Telecom GEMS ETF was 0.18% for the third quarter of 2011 (the first full quarter of operation) and 0.41% for the fourth quarter of 2011.
The Board noted that the tracking error for EGShares Utilities GEMS ETF was -0.55% for the third quarter of 2011 (the first full quarter of operation) and -0.67% for the fourth quarter of 2011.
The Board noted that the tracking error for EGShares Consumer Services GEMS ETF was -0.44% for the third quarter of 2011 (the first full quarter of operation) and 0.51% for the fourth quarter of 2011.
The Board noted that the tracking error for EGShares Emerging Markets Consumer ETF ranged from -0.04% to 0.37% for each of the four quarters of 2011.
The Board noted that the tracking error for EGShares Emerging Markets Metals and Mining ETF ranged from 0.23% to 0.67% for each of the four quarters of 2011.
The Board noted that the tracking error for EGShares Low Volatility Emerging Markets Dividend ETF was -0.14% for the fourth quarter of 2011 (the first full quarter of operation).
The Board noted that the tracking error for EGShares Emerging Markets Brazil Infrastructure ETF ranged from -0.46% to 0.54% for each of the four quarters of 2011.
The Board noted that the tracking error for EGShares Emerging Markets China Infrastructure ETF ranged from -1.71% to 0.38% for each of the four quarters of 2011.
The Board noted that the tracking error for EGShares Emerging Markets India Small Cap ETF ranged from -0.30% to 3.33% for each of the four quarters of 2011.
The Board noted that the tracking error for EGShares Emerging Markets India Infrastructure ETF ranged from -0.32% to 0.54% for each of the four quarters of 2011.
The Board noted that the tracking error for EGShares India Consumer ETF was 0.38% for the fourth quarter of 2011 (the first full quarter of operation).
The Board was informed that comparative data on tracking error of other ETFs was not readily available. The Board noted, however, that the tracking error of the Funds was generally within 1%, with only a small number of temporary exceptions. The Board also received and considered information about the premium/discount history of the Funds, which illustrated the number of times that the market price of the Funds trading on the secondary market closed above or below the NAV of the Funds, and by how much, measured in basis points.
Conclusion. No single factor was determinative to the decision of the Board. Based on the foregoing and such other matters as were deemed relevant, such as the Expense Cap Agreement, the Board concluded that the sub-advisory fees and total expense ratios were reasonable in relation to the services provided by EGA to each Fund, as well as the costs incurred and benefits gained by EGA in providing such services. As a result, the Board determined that the continuation of the Sub-Advisory Agreement with EGA was in the best interests of each Fund and their shareholders.
| 114 EGA Emerging Global Shares Trust |
Board Review and Approval of Advisory Contracts (Unaudited) (continued)
B. New EGShares Funds
At the Meeting, the Board, including the Independent Trustees, approved a new investment advisory agreement (“Investment Advisory Agreement”) between EGA and EGShares Beyond BRICS ETF, EGShares Beyond BRICs Emerging Asia Consumer ETF, EGShares Beyond BRICs Emerging Asia Infrastructure ETF, EGShares Beyond BRICs Emerging Asia Small Cap ETF, EGShares Emerging Markets Balanced Income ETF, EGShares Emerging Markets Consumer Small Cap ETF, EGShares Emerging Markets Domestic Demand ETF, EGShares Emerging Markets Real Estate ETF, EGShares India Consumer Goods ETF, EGShares Low Volatility China Dividend ETF, EGShares Low Volatility Brazil Dividend ETF, EGShares South Africa Small Cap ETF, and EGShares Turkey Small Cap ETF (each, a “New Fund”).
In considering the approval of the Investment Advisory Agreement, the Independent Trustees reviewed the materials provided for the Meeting by EGA, including: (i) a copy of the Investment Advisory Agreement between the Trust and EGA for the New Funds; (ii) information describing the nature, quality, and extent of the services that EGA will provide to the New Funds, and the fees that EGA will charge for such services; (iii) information concerning the business, operations and compliance program of EGA; (iv) a copy of the current Form ADV for EGA; (v) information describing the New Funds’ anticipated operating expenses; and (vi) a memorandum from Stradley Ronon on the responsibilities of trustees in considering investment advisory arrangements under the 1940 Act. The Independent Trustees also received data compiled by ETF Database comparing the proposed fee rate for advisory services to be charged to the New Funds to fees paid by other ETFs with similar investment objectives and policies at various asset levels.
During their review of this information, the Independent Trustees focused on and analyzed the factors that the Independent Trustees deemed relevant, including: the nature, quality, and extent of the services provided to each Fund by EGA; the nature, quality, and extent of the services to be provided to the New Funds by EGA; the personnel and operations of EGA; the investment performance of the Funds; the profitability to EGA under the Advisory Agreements; any “fall-out” benefits to EGA (i.e., the ancillary benefits realized due to a relationship with the Trust); and possible conflicts of interest.
In particular, the Board considered and reviewed the following with respect to each New Fund:
(a) The nature, extent, and quality of services to be provided to the New Funds by EGA. The Board reviewed the services that EGA would provide to the New Funds. In connection with the investment advisory services to be provided to the New Funds, the Board noted the significant responsibilities that EGA would have as the New Funds’ investment adviser, including: implementation of the investment management program of each New Fund; management of the day-to-day investment and reinvestment of the assets in each New Fund; determining daily baskets of deposit securities and cash components; executing portfolio security trades for purchases and redemptions of New Fund shares conducted on a cash-in-lieu basis; making determinations with respect to alternative cash management vehicles and securities lending collateral investments; management of intermediate Mauritius entities for those New Funds with significant investments in India; and oversight of general portfolio compliance with relevant law.
The Board reviewed EGA’s experience, resources, strengths and its performance as a sub-adviser to the Operational Funds of the Trust. Based on their consideration and review of the foregoing information, the Board determined that the New Funds were likely to benefit from the nature, quality, and extent of these services, as well as EGA’s ability to render such services based on its experience, operations and resources.
(b) Comparison of services to be provided and fees to be charged by EGA and other investment advisers to similar clients, and the cost of the services to be provided and profits to be realized by EGA from the relationship with the New Funds. The Board then compared both the services to be rendered and the proposed fees to be paid for investment advisory services to those of other investment advisers of similar ETFs. In particular, the Board compared each New Fund’s proposed advisory fee and projected expense ratio for the first year of operations to other ETFs considered to be in each New Fund’s peer group, as chosen by ETF Database, including the Operational Funds of the Trust. The Board noted that each New Fund’s proposed management fee and expenses (after giving effect to the proposed Expense Cap Agreement) was generally at the top of the range of each New Fund’s peer group.
The Board noted that the proposed investment advisory fee for each of the EGShares Emerging Markets Balanced Income ETF, the EGShares Beyond BRICS ETF and the EGShares Beyond BRICs Emerging Asia Small Cap ETF was between the median and the maximum range of fees charged by other funds in each New Fund’s peer group, as chosen by ETF Database. The Board also noted that the projected total expenses, (including the proposed Expense Cap Agreement) of the New Funds were between the median and the maximum range (or in some cases, at the maximum range) of total expenses of other funds in each New Fund’s peer group, as chosen by ETF Database.
The Board noted that the proposed investment advisory fee of each of the EGShares Beyond BRICs Emerging Asia Consumer ETF, the EGShares Beyond BRICs Emerging Asia Infrastructure ETF, the EGShares Emerging Markets Consumer Small Cap ETF, the EGShares Emerging Markets Domestic Demand ETF, the EGShares Emerging Markets Real Estate ETF, the EGShares India Consumer Goods ETF, the EGShares Low Volatility China Dividend ETF, the EGShares Low Volatility Brazil Dividend ETF, the EGShares South Africa Small Cap ETF and the EGShares Turkey Small Cap ETF was at the maximum range of fees charged by other funds in each New Fund’s peer group, as chosen by ETF Database. The Board also noted that the projected total expenses, (including the proposed Expense Cap Agreement) of the New Funds were at the maximum range of total expenses of other funds in each New Fund’s peer group, as chosen by ETF Database.
| EGA Emerging Global Shares Trust 115 |
Board Review and Approval of Advisory Contracts (Unaudited) (concluded)
The Board then received information regarding the appropriateness of the proposed investment advisory fees and expense ratios of the New Funds compared to the fees and expenses of similar ETFs. The Board also received information regarding the anticipated costs, including operational costs, and projected profitability of EGA in connection with its serving as investment adviser to each New Fund. The Board was reminded about the additional costs of operating the New Funds that will invest in a related Mauritius Company in order to invest directly in Indian companies. The Board was informed that these additional costs resulted in a higher management fee for each of EGShares Emerging Markets Balanced Income ETF, EGShares Emerging Markets Consumer Small Cap ETF, EGShares Emerging Markets Domestic Demand ETF, EGShares Emerging Markets Real Estate ETF and EGShares India Consumer Goods ETF, the New Funds investing in Mauritius Companies, which resulted in higher expense ratios for those New Funds, as compared to New Funds that will not invest in Mauritius Companies. The Board noted EGA’s commitment initially to limit each New Fund’s expenses through a written Expense Cap Agreement with the Trust, including the circumstances in which the Trust would have to repay fees in excess of the expense cap that were borne by EGA. After comparing each New Fund’s proposed fee and expenses with those of other ETFs in the New Fund’s peer group that included the currently operating Funds of the Trust, including for those New Funds whose fees and expenses were in the maximum range compared to their peer groups, and in light of the nature, quality, and extent of services proposed to be provided by EGA and the costs expected to be incurred by EGA in rendering those services and capping the New Funds’ expenses, the Board concluded that the fee proposed to be paid to EGA with respect to each New Fund was fair and reasonable.
(c) EGA’s profitability and the extent to which economies of scale would be realized as each New Fund grows and whether fee levels would reflect such economies of scale. The Board discussed potential economies of scale. The Board was informed that EGA would consider addressing economies of scale when assets under management reached appropriate levels.
(d) Investment performance of EGA. Because the New Funds had not commenced operations, the Board could not consider the investment performance of the New Funds, but did take into account the investment performance of the Operational Funds of the Trust, for which EGA serves as sub-adviser.
Conclusion. No single factor was determinative to the decision of the Board. Based on the foregoing and such other matters as were deemed relevant, such as the proposed Expense Cap Agreement, the Board concluded that the proposed investment advisory fees and projected total expense ratios are reasonable in relation to the services to be provided by EGA to the New Funds, as well as the costs to be incurred and benefits to be gained by EGA in providing such services. As a result, the Board decided to approve the Investment Advisory Agreement with EGA.
| 116 EGA Emerging Global Shares Trust |
Board of Trustees and Officers (Unaudited)
The Trustees and officers of the Trust, along with their principal occupations over the past five years and their affiliations, if any, with EGA, are listed below. Unless otherwise noted, the address of each Trustee of the Trust is 171 East Ridgewood Ave., Ridgewood, NJ 07450.
| Name and Year of Birth | Position(s)
Held with
Trust | Term of
Office1 and
Length of
Time Served | Principal Occupation(s)
During Past 5 Years | Number of
Portfolios
in Fund
Complex2
Overseen
by Trustee | Other
Directorships
Held by Trustee |
| Independent Trustees | | | | | |
| | | | | | |
| Robert Willens, 1946 | Trustee | Since 2009 | Robert Willens, LLC (tax consulting),
President, since January, 2008; Lehman
Brothers, Inc., Managing Director, Equity
Research Department, January 2004 to
January 2008. | 32 | Daxor Corp.
(Medical Products
and
Biotechnology),
since 2004. |
| |
| Ron Safir, 1951 | Trustee | Since 2009 | Retired, since 2008; UBS Wealth
Management, Chief Administrative Officer,
February 1971 to December 2008. | 32 | None |
| |
| Jeffrey D. Haroldson, 1957 | Trustee | Since 2009 | HDG Mansur Capital Group, LLC, President
and Chief Operating Officer, since 2004;
HSBC Securities (USA), Inc., Executive
Managing Director, Head of Investment and
Merchant Banking, 2000 to 2003. | 32 | None |
| |
| Interested Trustees | | | | | |
| |
| Robert C. Holderith3, 1960 | Trustee and
President | Since 2008 | Emerging Global Advisors, LLC, Managing
Member and Chief Executive Officer, since
September 2008; ProFund Advisors,
Managing Director, Institutional Sales &
Investment Analytics, June 2006 to August
2008; UBS Financial Services, Inc., Director,
January 2000 to May 2006. | 32 | None |
| |
| |
| James J. Valenti3, 1947 | Trustee and
Secretary | Since 2008 | Emerging Global Advisors, LLC, Member
and Chief Administrative Officer, since
September 2008; Private Investor and
Independent Consultant, June 2007 to
September 2008; Senior Loan Consultant,
Bridgepoint Mortgage Company, June 2006
to June 2007; Mercedes Benz, North
America, Sales Representative, November 2000 to June 2006. | 32 | None |
|
| 1 | | Each Trustee holds office for an indefinite term. |
| 2 | | The “Fund Complex” consists of the Trust, which consists of thirty-two Funds. |
| 3 | | Mr. Holderith and Mr. Valenti are considered to be “interested persons” of the Trust as defined in the 1940 Act, due to their relationship with EGA, the Funds’ sub-adviser. |
| EGA Emerging Global Shares Trust 117 |
Board of Trustees and Officers (Unaudited) (concluded)
| Name and Year of Birth | Position(s)
Held with
the Trust | Term of Office1
and Length of
Time Served | Principal Occupation(s) During Past 5 Years |
| Officers | | | |
| | | | |
Thomas A. Carter
ALPS Fund Services, Inc.
1290 Broadway
Suite 1100
Denver, CO 80203
1966 | Treasurer | Since 2009 | ALPS Fund Services, Inc., Directors, since October 2005; ALPS Advisors, Inc.,
President and Directors, since September 2008; ALPS Distributors, Inc., President
and Director, since September 2008; FTAM Funds Distributor, Inc., President and
Director, since September 2008; ALPS Holdings, Inc., Director, since October
2005; and ALPS ETF Trust, President and Trustee, since March 2008. |
| |
Melanie H. Zimdars
ALPS Fund Services, Inc.
1290 Broadway
Suite 1100
Denver, CO 80203
1976 | Chief
Compliance
Officer | Since 2010 | ALPS Fund Services, Inc., Deputy Chief Compliance Officer, since September
2009; ALPS ETF Trust, Chief Compliance Officer, since December 2009; EGA
Emerging Global Shares Trust, Chief Compliance Officer, since March 2010;
Financial Investors Variable Insurance Trust, Chief Compliance Officer, since
September 2009; Liberty All-Star Growth Fund, Inc., Chief Compliance Officer,
since December 2009; Liberty All-Star Equity Fund, Chief Compliance Officer,
since December 2009; Wasatch Funds, Principal Financial Officer, Treasurer and
Secretary, February 2007 to December 2008; Wasatch Funds, Assistant Treasurer,
November 2006 to February 2007; Wasatch Funds, Senior Compliance Officer,
2005 to December 2008. |
| 1 | | Officers of the Trust are elected by the Trustees and serve at the pleasure of the Board. |
| 118 EGA Emerging Global Shares Trust |
General Information (Unaudited)
Investment Advisor
ALPS Advisors, Inc.
1290 Broadway, Suite 1100
Denver, CO 80203
Sub-Adviser
Emerging Global Advisors, LLC
171 East Ridgewood Ave.
Ridgewood, NJ 07450
Distributor
ALPS Distributors, Inc.
1290 Broadway, Suite 1100
Denver, CO 80203
Administrator, Custodian and Transfer Agent
The Bank of New York Mellon
101 Barclay Street
New York, NY 10286
Independent Registered Public Accounting Firm
BBD, LLP
1835 Market Street, 26th Floor
Philadelphia, PA 19103
You may obtain a description of the EGA Funds proxy voting, policies, procedures and information regarding how each Fund voted proxies relating to portfolio securities during the most recent 12-month period ending June 30 (available by August 31) without charge, upon request, by calling 1-888-800-4347 or visiting the funds website www.egshares.com, or by accessing the SEC’s website at www.sec.gov. Such reports may be reviewed and copied at the SEC’s Public Reference Room in Washington, DC. Information on the operation of the Public Reference Room may be obtained by calling 202-942-8090.
Each of the Funds’ premium/discount information that is current on the most recent quarter-end is available by visiting www.egshares.com or by calling 1-201-389-6872.
The Trust files complete schedules of the portfolio holdings with the SEC for the first and third quarters on Form N-Q. The Form N-Q is available without charge, upon request, by calling 1-800-SEC-0330, or by accessing the SEC’s website, at www.sec.gov. It may also be reviewed and copied at the SEC’s Public Reference Room in Washington, DC.
This report has been prepared for shareholders and may be distributed to others only if preceded or accompanied by an effective prospectus, which includes information regarding the Funds’ objectives and polices, experience of its management, marketability of shares and other information.
| EGA Emerging Global Shares Trust 119 |

171 East Ridgewood Avenue
Ridgewood, NJ 07450
(201) 389-6872
155 W 19th Street, 3rd Floor
New York, NY 10011
(888) 800-4EGS (4347)
www.egshares.com
EGA Emerging Global Shares Trust
EGShares GEMS Composite ETF
EGShares Basic Materials GEMS ETF
EGShares Consumer Goods GEMS ETF
EGShares Consumer Services GEMS ETF
EGShares Energy GEMS ETF
EGShares Financials GEMS ETF
EGShares Health Care GEMS ETF
EGShares Industrials GEMS ETF
EGShares Technology GEMS ETF
EGShares Telecom GEMS ETF
EGShares Utilities GEMS ETF
EGShares Emerging Markets Metals & Mining ETF
EGShares Emerging Markets Consumer ETF
EGShares India Infrastructure ETF
EGShares China Infrastructure ETF
EGShares Brazil Infrastructure ETF
EGShares India Small Cap ETF
EGShares India Consumer ETF
EGShares Low Volatility Emerging Markets Dividend ETF
(formerly Emerging Markets High Income Low Beta ETF)
Emerging Global Shares are distributed by ALPS Distributors Inc.
Item 2. Code of Ethics.
a). As of the end of the period covered by this report, the Registrant has adopted a code of ethics that applies to the Registrant’s principal executive officer, principal financial officer or persons performing similar functions (“Code of Ethics”).
b). Not Applicable
c). There has been no amendment to the Registrant’s Code of Ethics during the fiscal year ending March 31, 2012 (“Reporting Period”).
d). Registrant granted no waivers from the provisions of its Code of Ethics during the Reporting Period.
e). Not Applicable
f). Attached
Item 3. Audit Committee Financial Expert.
a). The Registrant’s Board of Trustees has determined that its Audit Committee has one “audit committee financial expert”, as that term is defined under Items 3(b) and 3(c), serving on its Audit Committee. Mr. Robert Willens, the Registrant’s audit committee financial expert, is “independent”, as that term is defined under Item 3(a)(2).
b). Not Applicable
c). Not Applicable
d). Not Applicable
Item 4. Principal Accountant Fees and Services.
The principal accountant fees disclosed in Items 4(a)-(d) are for the nineteen funds of the Registrant that had a fiscal year ending March 31, 2012 and whose financial statements are reported in Item 1.
a). Audit Fees: the aggregate fees billed in each of the last two fiscal years for professional services rendered by the principal accountant for the audit of the Registrant’s financial
statements or services that are normally provided by the accountant in connection with statutory and regulatory filings or engagements for those fiscal years are as follows:
2012: $241,000
2011: $105,000
b). Audit-Related Fees: the aggregate fees billed in each of the last two fiscal years for assurance and related services by the principal accountant that are reasonably related to the performance of the audit of the Registrant’s financial statements and are not reported under paragraph (a) of this item are as follows:
2012: $0
2011: $0
c). Tax Fees: the aggregate fees billed in each of the previous last two fiscal years for professional services rendered by the principal accountant for tax compliance, tax advice, and tax planning are as follows:
2012: $38,000
2011: $18,000
The Tax Fees represent services provided in connection with the preparation of tax returns, year-end distribution review, qualifying dividend income analysis and computation of foreign tax credit pass-through.
d). All Other Fees: the aggregate fees billed in each of the last two fiscal years for products and services provided by the principal accountant, other than the services reported in paragraphs (a) and (c) of this Item are as follows:
2012: $0
2011: $0
e) Audit Committee Pre-Approval Policies and Procedures.
| (i) | Per Rule 2-01(c)(7)(A) and the charter of the Registrant’s Audit Committee, the Audit Committee approves and recommends the principal accountant for the Registrant, pre-approves (i) the principal accountant’s provision of all audit and permissible non-audit services to the Registrant (including the fees and other compensation to be paid to the principal accountant), and (ii) the principal accountant’s provision of any permissible non-audit services to the Registrant’s investment adviser (the “Adviser”), sub-adviser or any entity controlling, controlled by, or under common control with any investment adviser or sub-adviser, if the engagement relates directly to the operations of the financial reporting of the Trust. |
| (ii) | 100% of services described in each of Items 4(b) through (d) were approved by the Audit Committee pursuant to paragraph (c)(7)(A) of Rule 2-01 of Regulation S-X. |
(f) Less than 50% of the hours expended on the principal accountant’s engagement to audit Registrant’s financial statements were attributed to work performed by persons other than the accountant’s full-time, permanent employees.
(g) The aggregate non-audit fees billed by the accountant for services rendered to the Registrant, the Adviser and any entity controlling, controlled by, or under common control with the Adviser that provides ongoing services to the Registrant (except for any sub-advisor whose role is primarily portfolio management and is subcontracted with or overseen by another investment advisor) for the last two fiscal years is as following:
2012: $0
2011: $0
(h) Not Applicable
Item 5. Audit Committee of Listed Registrants.
(a) The Registrant is an issuer as defined in Section 10A-3 of the Securities Exchange Act of 1934 and has a separately-designated standing Audit Committee in accordance with Section 3(a)(58)(A) of such Act. All of the Board’s independent Trustees, Robert Willens, Ron Safir and Jeffrey D. Haroldson, are members of Audit Committee.
(b) Not Applicable.
Item 6. Schedule of Investments.
| (a) | Schedule is included as part of the report to shareholders filed under Item 1 of this Form. |
Item 7. Disclosure of Proxy Voting Policies and Procedures for Closed-End Management Investment Companies.
Not Applicable.
Item 8. Portfolio Managers of Closed-End Management Investment Companies.
Not Applicable.
Item 9. Purchases of Equity Securities by Closed-End Management Investment Company & Affiliated Purchasers.
Not Applicable.
Item 10. Submission of Matters to a Vote of Security Holders.
Not Applicable.
Item 11. Controls and Procedures.
(a) The Chief Executive Officer and Chief Financial Officer have evaluated the Registrant's disclosure controls and procedures as of a date within 90 days of the filing date of this report and have concluded that these controls and procedures are effective.
(b) There were no significant changes in the Registrant's internal controls over financial reporting or in other factors that could significantly affect these controls subsequent to the date of their evaluation.
Item 12. Exhibits.
(a)(1) Any code of ethics, or amendment thereto, that is the subject of the disclosure required by Item 2 is attached hereto.
(b) Certifications for each Principal Executive Officer and Principal Financial Officer of the Registrant as required by Rule 30a-2(a) under the 1940 Act (17CFR 270.30a-(a)).
SIGNATURES
Pursuant to the requirements of the Securities Exchange Act of 1934 and the Investment Company Act of 1940, the Registrant has duly caused this report to be signed on its behalf by the undersigned, thereunto duly authorized.
Registrant: EGA Emerging Global Shares Trust
By: /s/ Robert C. Holderith
Robert C. Holderith, Chief Executive Officer
Date: May 24, 2012
Pursuant to the requirements of the Securities Exchange Act of 1934 and the Investment Company Act of 1940, this report has been signed below by the following persons on behalf of the Registrant and in the capacities and on the dates indicated.
Registrant: EGA Emerging Global Shares Trust
By: /s/ Robert C. Holderith
Robert C. Holderith, Chief Executive Officer
Date: May 24, 2012
By: /s/ Thomas A. Carter
Thomas A. Carter, Chief Financial Officer
Date: May 24, 2012