UNITED STATES
SECURITIES AND EXCHANGE COMMISSION
Washington, D.C. 20549
FORM N-CSR
CERTIFIED SHAREHOLDER REPORT OF REGISTERED MANAGEMENT
INVESTMENT COMPANIES
Investment Company Act file number 811-22255
| EGA Emerging Global Shares Trust |
(Exact name of registrant as specified in charter)
171 East Ridgewood Avenue
Ridgewood, NJ 07450 |
(Address of principal executive offices) (Zip code)
Robert C. Holderith
171 East Ridgewood Avenue
(Name and address of agent for service)
Registrant's telephone number, including area code: 1-201-389-6872
Date of fiscal year end: March 31
Date of reporting period: March 31, 2013
Form N-CSR is to be used by management investment companies to file reports with the Commission not later than 10 days after the transmission to stockholders of any report that is required to be transmitted to stockholders under Rule 30e-1 under the Investment Company Act of 1940 (17 CFR 270.30e-1). The Commission may use the information provided on Form N-CSR in its regulatory, disclosure review, inspection, and policymaking roles.
A registrant is required to disclose the information specified by Form N-CSR, and the Commission will make this information public. A registrant is not required to respond to the collection of information contained in Form N-CSR unless the Form displays a currently valid Office of Management and Budget ("OMB") control number. Please direct comments concerning the accuracy of the information collection burden estimate and any suggestions for reducing the burden to Secretary, Securities and Exchange Commission, 100 F Street, NE, Washington, DC 20549. The OMB has reviewed this collection of information under the clearance requirements of 44 U.S.C. § 3507.
Item 1. Reports to Stockholders.
The Report to Shareholders is attached herewith.

EGA Emerging Global Shares Trust
Annual Report
March 31, 2013
EGShares Basic Materials GEMS ETF
EGShares Beyond BRICs ETF
EGShares Brazil Infrastructure ETF
EGShares China Infrastructure ETF
EGShares Consumer Goods GEMS ETF
EGShares Consumer Services GEMS ETF
EGShares Emerging Markets Consumer ETF
EGShares Emerging Markets Core ETF
EGShares Emerging Markets Domestic Demand ETF
EGShares Emerging Markets Metals & Mining ETF
EGShares Energy GEMS ETF
EGShares Financials GEMS ETF
EGShares GEMS Composite ETF
EGShares Health Care GEMS ETF
EGShares India Consumer ETF
EGShares India Infrastructure ETF
EGShares India Small Cap ETF
EGShares Industrials GEMS ETF
EGShares Low Volatility Emerging Markets Dividend ETF
EGShares Technology GEMS ETF
EGShares Telecom GEMS ETF
EGShares Utilities GEMS ETF
(This page intentionally left blank.)
Letter to Shareholders
Dear Shareholder,
Emerging Global Advisors continued to grow our assets under management (AUM) in the first quarter, bringing our total to $1.23 billion as of March 31, 2013. The fact that our emerging market equity exchange-traded funds (ETFs) attracted steady inflows is significant given the dynamics in the marketplace. Although the ETF industry experienced record-setting inflows of more than $70 billion during the quarter, EM equity ETFs in general did not share this momentum. While flows were still positive, they were slower. During the month of March, the two largest broad EM equity ETFs had combined outflows of more than $5 billion.1
We believe this recent gain in our market share is further evidence of the normalization of EM investor behavior. It has been our longstanding belief that using broad EM benchmarks as de facto investment portfolios produces a less-then-optimal balance of risk and reward. Investors are beginning to realize that tools are available to help them make more deliberate choices in emerging markets. We think that the increasing interest in EM fixed-income funds in recent months is an encouraging sign.
It is interesting to note that during first quarter 2013, 8 out of 10 economic sectors outperformed the broad MSCI EM Index which was down –1.62%.2 Four of these had positive returns. These results continue to make the case for the differentiated tools we provide.
In recent months, we have worked to build on the success of our existing funds, and to generate interest in some that have gotten less attention. Our recent campaign on emerging market volatility appears to be resonating with clients, and is especially supportive of HILO, BBRC, EMDD and ECON. We were excited to see the related piece in our Expert Series, “Emerging Market Volatility: Remedies for the Chronically Underweight,” highlighted by Barron’s in a March 21st Emerging Markets blog. The article by Ben Levisohn (“Emerging Markets: The Low Volatility Solution”) also mentioned HILO as an example of a low volatility EM ETF, and included links to our website.
As always, I appreciate your continued support of our products and our firm.
Sincerely,

Robert C. Holderith
President
Emerging Global Advisors, LLC
| 1 | | Index Universe, March 31, 2013. |
| 2 | | Bloomberg, March 31, 2013. |
MSCI Emerging Markets Index is an index created by Morgan Stanley Capital International (MSCI) that is designed to measure equity market performance in global emerging markets. MSCI makes no express or implied warranties or representations and shall have no liability whatsoever with respect to any claims contained herein. It is not possible to invest directly in an index.
ALPS is not affiliated with Barron’s.
This material must be accompanied or preceded by the prospectus
Emerging market investments involve risk of capital loss from unfavorable fluctuation in currency values, from differences in generally accepted accounting principles, from economic or political instability in other nations or increased volatility and lower trading volume. These Funds will concentrate their investments in issuers of one or more particular industries to the same extent that their underlying indices are so concentrated and to the extent permitted by applicable regulatory guidance. Concentration risk results from maintaining exposure to issuers conducting business in a specific industry.
Robert Holderith is a registered representative of ALPS Distributors, Inc.
EGShares Funds are distributed by ALPS Distributors, Inc.
| | EGA Emerging Global Shares Trust 1 |
Comments from the Chief Investment Officer
Dear Shareholder,
The past 12 months were generally positive for global stocks, especially developed markets, which delivered double-digit returns overall. The strong U.S. market rally in the first quarter of 2013 dominated performance for the period. As the threat of the fiscal cliff dissipated and positive news bolstered the economy, investors poured money into U.S. equities, pushing domestic indices to record highs. Yet investors’ renewed appetite for risk did not carry over to emerging markets (EM). The Cypriot banking crisis, escalating threats of war by North Korea and a strengthening U.S. dollar were among the factors weighing on the investment climate in EM. After gaining ground in the second half of 2012, broad emerging market stocks fell in the first quarter of 2013. The MSCI Emerging Markets Index returned a modest gain of 1.96%1 for the year ended March 31, 2013.
Given this backdrop, I would like to note the performance of our newest fund, Emerging Markets Core ETF (EMCR), which is designed to provide broader industry and EM economic diversification than conventional benchmark indices. During a volatile period for emerging markets, the Fund benefitted from its lower concentration in the hardest-hit sectors, returning 4.55% (based on net asset value) since its October 2012 inception. In other words, we believe it is doing what it was designed to do. (For standardized performance on Emerging Markets Core ETF, please see page 19).
Recent events once again demonstrate that crowd psychology is underpinning the performance of global capital markets. Within EM, this is likely to prolong the investment climate we have seen for some time, in which negative economic or geopolitical events inhibit a broad market rally beyond three or four quarters. In such an indiscriminate environment, we believe that allocating assets across countries, sectors and other market segments remains a more viable strategy than individual security selection. The performance of the funds in the Trust this past year highlights the impact of such differentiation: returns ranged from –16.30% to 6.44% (based on net asset value), representing a difference of 22.74%. One would consider the potential for alpha generation given such wide disparity of sector returns demonstrated over the past year.
Looking ahead, many market observers are questioning if the run-up in U.S. stocks is reasonable. If this is a “flight to quality,” then there is some logic. However, diversification remains one of the principal ways to potentially improve a portfolio’s balance of risk and return potential. And with ongoing risks on the horizon for foreign exposures to the developed world — mainly new banking shocks in Europe and Japan’s increasingly futile attempts to jump start a dying economy — where else can investors turn? We continue to believe that within the more diverse set of risks in emerging markets, many are the kind that can provide commensurate return to keenly attuned investors.

Richard C. Kang
Chief Investment Officer
Emerging Global Advisors, LLC
May 30, 2013
| 1 | | Bloomberg, March 31, 2013 |
MSCI Emerging Markets Index is an index created by Morgan Stanley Capital International (MSCI) that is designed to measure equity market performance in global emerging markets. MSCI makes no express or implied warranties or representations and shall have no liability whatsoever with respect to any claims contained herein. It is not possible to invest directly in an index.
This manager commentary represents an assessment of the market environment at a specific point in time and is not intended to be a forecast of future events, or a guarantee of future results. This information should not be relied upon by the reader as research or investment advice.
Diversification does not guarantee a profit or protect against loss.
This material must be accompanied or preceded by the prospectus
Emerging market investments involve risk of capital loss from unfavorable fluctuation in currency values, from differences in generally accepted accounting principles, from economic or political instability in other nations or increased volatility and lower trading volume. These Funds will concentrate their investments in issuers of one or more particular industries to the same extent that their underlying indices are so concentrated and to the extent permitted by applicable regulatory guidance. Concentration risk results from maintaining exposure to issuers conducting business in a specific industry.
Past performance does not guarantee future results.
Richard Kang is a registered representative of ALPS Distributors, Inc. EGShares Funds are distributed by ALPS Distributors, Inc.
| 2 EGA Emerging Global Shares Trust |
(This page intentionally left blank.)
Portfolio Summary (Unaudited)
EGShares Basic Materials GEMS ETF
| | | |
| Top Ten Holdings* | | |
| Vale SA Preference A Shares | | | 9.3 | % |
| MMC Norilsk Nickel OJSC | | | 6.6 | |
| China Shenhua Energy Co., Ltd. | | | 6.4 | |
| Grupo Mexico SAB de CV | | | 6.0 | |
| Uralkali OJSC | | | 5.6 | |
| AngloGold Ashanti, Ltd. | | | 5.1 | |
| Impala Platinum Holdings, Ltd. | | | 4.8 | |
| KGHM Polska Miedz SA | | | 4.4 | |
| Gerdau SA Preference Shares | | | 4.4 | |
| Industrias Penoles SAB de CV | | | 4.2 | |
| * | Expressed as a percentage of total investments in securities as of 3/31/2013. Holdings are subject to change. |
EGShares Basic Materials GEMS ETF (ticker: LGEM)
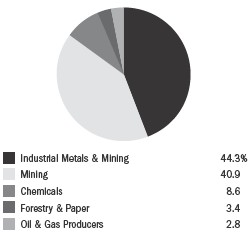
The Fund’s investment objective is to seek investment results that correspond (before fees and expenses) to the price and yield performance of the Dow Jones Emerging Markets Basic Materials Titans 30 IndexSM (“Basic Materials Underlying Index”). The Basic Materials Underlying Index is comprised of publicly traded firms in the “Basic Materials Industry,” as defined by the S&P Dow Jones Indices’ proprietary system. The Basic Materials Underlying Index includes companies whose businesses generally involve: chemicals; forestry and paper; industrial metals and mining; and mining.
The EGShares Basic Materials GEMS ETF provides a means for investors to access a particular slice of the commodities universe that excludes energy and agriculture. This Fund may be used as an inflation hedge, commodity supercycle play or compliment/supplement to traditional gold/gold miner funds. With gold having recently been seen as overvalued, many investors may turn to silver, platinum and other industrial/precious metals to compensate. Also, the infrastructure theme ties well into commodities and in particular, basic materials. In line with this theme, iron/steel companies made up over a quarter of Fund assets at the end of the reporting period — the second highest industry allocation. Mining companies represented the highest industry allocation at just over 40% of Fund assets. Within sub-categories based on industry, losses were generally broad, with no single industry group significantly outperforming or underperforming others. The five largest country exposures (in descending order) were South Africa, China, Brazil, Russia and Mexico. Within these country exposures, investors should note that large negative contributors to fund performance were primarily from South Africa. Holdings from Brazil, India and China detracted from returns to a lesser extent. Mexican and Polish positions provided strong upside performance, although they were relatively smaller exposures in the fund. Investors may be keen to know that as a cyclical sector play, basic materials was easily the worst performing of the emerging market sectors over the 12-month period ended March 31, 2013. (source, Bloomberg 3/31/2013) At the time of this writing, gold prices had experienced incredible volatility, especially to the downside, providing an interesting entry point not only for gold but for the broader materials companies as well.
The EGShares Basic Materials GEMS ETF had a total return of –15.29% at net asset value (“NAV”) for the quarter ended March 31, 2013 and –21.44% annualized return since its inception date of June 23, 2011. The Fund’s NAV had a –19.70% return for the full year ended March 31, 2013.
Emerging market investments involve risk of capital loss from unfavorable fluctuation in currency values, from differences in generally accepted accounting principles, from economic or political instability in other nations or increased volatility and lower trading volume. This Fund will concentrate its investments in issuers of one or more particular industries to the same extent that its underlying index is so concentrated and to the extent permitted by applicable regulatory guidance. Concentration risk results from investing more than 25% of the Fund’s assets in issuers conducting business in the same industry.
Performance Charts
The following performance chart is provided for comparative purposes and represents the periods noted. The Fund’s per share NAV is the value of one share of the Fund and is calculated by dividing the value of total assets less total liabilities by the number of shares outstanding. The NAV return is based on the NAV of the Fund and the market return is based on the market price per share of the Fund. The price used to calculate market price returns is the mid-point of the highest bid and lowest offer for Fund shares as of the close of trading on the exchange where Fund shares are listed. NAV and market returns assume that dividends and capital gain distributions have been reinvested in the Fund at NAV and market price, respectively. As with other ETFs, NAV returns and market price returns may differ because of factors such as the supply and demand for Fund shares and investors’ assessments of the underlying value of a Fund’s portfolio securities. An index is a statistical measure of a specified financial market or sector. An index does not actually hold a portfolio of securities, incur expenses or pay any transaction costs. Therefore index returns do not reflect deductions for fees or expenses and are not available for direct investment. In comparison, the Fund’s performance is negatively impacted by these fees and expenses. Fund returns do not reflect brokerage commissions, or taxes on transactions in Fund shares or that a shareholder would pay on Fund distributions.
| 4 EGA Emerging Global Shares Trust |
|
| EGShares Basic Materials GEMS ETF |
|
| Performance as of 3/31/2013 |
| | | |
| | Average Annual Total Return |
| | Fund
Net Asset Value | Fund
Market Price | Dow Jones
Emerging Markets
Basic Materials
Titans 30 IndexSM |
| 1 Year | (19.70)% | (19.54)% | (18.96)% |
| Since Inception1 | (21.44)% | (21.34)% | (21.47)% |
1 June 23, 2011.
Performance data quoted represents past performance. Investment return and principal value of an investment will fluctuate so that an investor’s shares, when sold or redeemed, may be worth more or less than the original cost. Current performance data may be higher or lower than actual data quoted. For the most current month-end performance data please call (888) 800-4347. Fund’s net annual operating expense ratio is 0.85%. Market price returns are based on the mid-point of the highest bid and lowest offer for Fund shares as of the scheduled close of regular trading on the New York Stock Exchange (“NYSE”) Arca, ordinarily 4:00 p.m. Eastern time, on each day during which the NYSE is open for trading, and do not represent the returns an investor would receive if shares were traded at other times. Past performance does not guarantee future results.
|
| Value of a $10,000 Investment Since Inception at Net Asset Value |
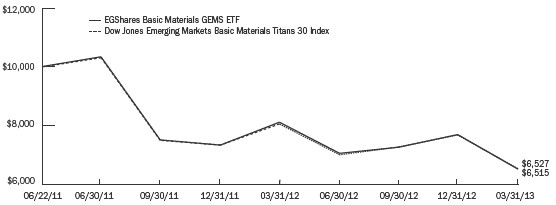
The chart above represents historical performance of a hypothetical investment of $10,000 over the life of the Fund, assuming the reinvestment of distributions. Past performance does not guarantee future results.
| | EGA Emerging Global Shares Trust 5 |
Portfolio Summary (Unaudited)
EGShares Beyond BRICs ETF
| | |
| Top Ten Holdings* | |
| Fomento Economico Mexicano SAB de CV | | 5.5 | % |
| Grupo Mexico SAB de CV | | 5.1 | |
| Grupo Modelo SAB de CV | | 4.4 | |
| MTN Group, Ltd. | | 4.2 | |
| Sasol, Ltd. | | 3.9 | |
| Naspers, Ltd. | | 3.7 | |
| America Movil SAB de CV | | 3.2 | |
| Bank Central Asia Tbk PT | | 3.1 | |
| FirstRand, Ltd. | | 2.9 | |
| Astra International Tbk PT | | 2.9 | |
| * | Expressed as a percentage of total investments in securities as of 3/31/2013. Holdings are subject to change. |
EGShares Beyond BRICs ETF (ticker: BBRC)
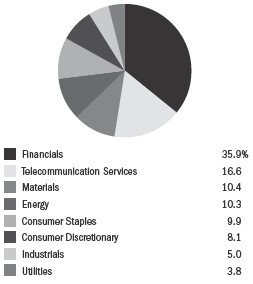
The Fund’s investment objective is to seek investment results that correspond (before fees and expenses) to the price and yield performance of the INDXX Beyond BRICs Index (“Beyond BRICs Underlying Index”). The Beyond BRICs Underlying Index is comprised of 50 leading companies that INDXX, LLC determines to be representative of all industries in emerging market countries, excluding Brazil, Russia, India and China. The Fund invests in the constituent companies of the Beyond BRICs Underlying Index, which may include small and medium capitalized companies (“small cap” and “mid cap” companies, respectively), having a market capitalization of at least $100 million at the time of purchase.
The concept of aggregating the four largest emerging markets into BRICs is over ten years old. A common reason for going beyond these BRIC economies is prudent diversification, yet investors may be cautious about entering frontier markets due to concerns over access, liquidity, cost and greater information asymmetry. The EGShares Beyond BRICs ETF provides indexed equity exposure to countries that are classified as emerging markets, excluding the BRIC economies. Since its launch on August 15, 2012, the Fund has had steady positive performance. It has had only one period where it deviated slightly from broad emerging market indices, which was from the market highs of January 2013 to the date of this report. During that time, the broad emerging market indices declined steadily while BBRC performed in a sideways channel and the US equity market climbed markedly higher. 2013 has shown some degree of noncorrelation among major market groups. While this may be providing greater opportunities for active managers, it is also a positive sign for passive/index funds, which require the liquidity provided by such market participants. At the end of the reporting period, slightly more than half the Fund’s sector allocation was in banks and telecom companies. All other sectors represented less than 10% of Fund assets. Broadly speaking, all sectors made a positive contribution to fund performance, but financials was easily the largest contributor. Geographically, the largest allocations by country were to Mexico, South Africa, Thailand, Malaysia and Indonesia, each with a weighting greater than 10% as of March 31, 2013. Within these country exposures, investors should note that large positive contributors to fund performance were from Thailand, Indonesia and Mexico. Peru, a very small exposure, contributed negatively to returns.
The EGShares Beyond BRICs ETF had a total return of 2.90% at net asset value (“NAV”) for the quarter ended March 31, 2013 and 10.41% return since its inception date of August 15, 2012. Based on this inception date, the Fund did not have enough historical pricing to cover a full year ended March 31, 2013.
Emerging market investments involve risk of capital loss from unfavorable fluctuation in currency values, from differences in generally accepted accounting principles, from economic or political instability in other nations or increased volatility and lower trading volume. This Fund will concentrate its investments in issuers of one or more particular industries to the same extent that its underlying index is so concentrated and to the extent permitted by applicable regulatory guidance. Concentration risk results from investing more than 25% of the Fund’s assets in issuers conducting business in the same industry.
Performance Charts
The following performance chart is provided for comparative purposes and represents the period noted. The Fund’s per share NAV is the value of one share of the Fund and is calculated by dividing the value of total assets less total liabilities by the number of shares outstanding. The NAV return is based on the NAV of the Fund and the market return is based on the market price per share of the Fund. The price used to calculate market price returns is the mid-point of the highest bid and lowest offer for Fund shares as of the close of trading on the exchange where Fund shares are listed. NAV and market returns assume that dividends and capital gain distributions have been reinvested in the Fund at NAV and market price, respectively. As with other ETFs, NAV returns and market price returns may differ because of factors such as the supply and demand for Fund shares and investors’ assessments of the underlying value of a Fund’s portfolio securities. An index is a statistical measure of a specified financial market or sector. An index does not actually hold a portfolio of securities, incur expenses or pay any transaction costs. Therefore index returns do not reflect deductions for fees or expenses and are not available for direct investment. In comparison, the Fund’s performance is negatively impacted by these fees and expenses. Fund returns do not reflect brokerage commissions, or taxes on transactions in Fund shares or that a shareholder would pay on Fund distributions.
| 6 EGA Emerging Global Shares Trust |
EGShares Beyond BRICs ETF
|
| Performance as of 3/31/2013 |
| | | |
| | Average Annual Total Return1 |
| | Fund
Net Asset Value | Fund
Market Price | INDXX
Beyond BRICs
Index |
| Since Inception2 | 10.41% | 11.46% | 11.62% |
| 1 | Returns of less than one year are not annualized. |
Performance data quoted represents past performance. Investment return and principal value of an investment will fluctuate so that an investor’s shares, when sold or redeemed, may be worth more or less than the original cost. Current performance data may be higher or lower than actual data quoted. For the most current month-end performance data please call (888) 800-4347. This Fund is new and has limited operating history. Fund’s net annual operating expense ratio is 0.85%. Market price returns are based on the mid-point of the highest bid and lowest offer for Fund shares as of the scheduled close of regular trading on the New York Stock Exchange (“NYSE”) Arca, ordinarily 4:00 p.m. Eastern time, on each day during which the NYSE is open for trading, and do not represent the returns an investor would receive if shares were traded at other times. Past performance does not guarantee future results.
|
| Value of a $10,000 Investment Since Inception at Net Asset Value |
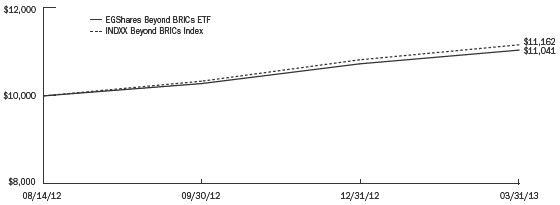
The chart above represents historical performance of a hypothetical investment of $10,000 over the life of the Fund, assuming the reinvestment of distributions. Past performance does not guarantee future results.
| | EGA Emerging Global Shares Trust 7 |
Portfolio Summary (Unaudited)
EGShares Brazil Infrastructure ETF
| | |
| Top Ten Holdings* | |
| Embraer SA | | 6.6 | % |
| CCR SA | | 5.9 | |
| Ultrapar Participacoes SA | | 5.8 | |
| Companhia de Saneamento Basico do Estado | | | |
| de Sao Paulo | | 5.8 | |
| Telefonica Brasil SA | | 5.6 | |
| BR Malls Participacoes SA | | 5.0 | |
| Vale SA | | 4.9 | |
| Tim Participacoes SA | | 4.8 | |
| Tractebel Energia SA | | 4.7 | |
| Companhia Siderurgica Nacional SA | | 4.2 | |
| * | Expressed as a percentage of total investments in securities as of 3/31/2013. Holdings are subject to change. |
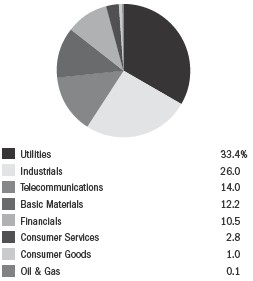
EGShares Brazil Infrastructure ETF (ticker: BRXX)
The Fund’s investment objective is to seek investment results that correspond (before fees and expenses) to the price and yield performance of the INDXX Brazil Infrastructure Index (“Brazil Infrastructure Underlying Index”). The Brazil Infrastructure Underlying Index is comprised of 30 leading companies that INDXX, LLC determines to be representative of Brazil’s infrastructure sectors. The Fund invests in Brazilian large and mid cap infrastructure companies that are included in the Brazil Infrastructure Underlying Index, which are generally defined as companies that are domiciled in Brazil and that have a market capitalization of at least $200 million at the time of purchase.
The EGShares Brazil Infrastructure ETF is currently our third largest fund by assets. BRXX outperformed both the broad market large cap and small cap Brazil focused ETFs during the five month period from March 31, 2012 to August 31, 2012. For the remaining seven months ended March 31, 2013, BRXX was roughly in-line with large-cap and small-cap Brazil ETFs. Over the entire 12-month period, BRXX’s return was between that of the large-cap and small-cap funds. As of the date of this report, BRXX was well distributed by sub-industry with no group holding more than a 20% allocation. The largest allocations include electric, telecom, iron/steel and water. Of the fund’s largest sector exposures, investors should note that utilities was a large negative contributor to fund performance, largely due to the weight allocated to this sector. Although materials and telecom services performed even worse than utilities, their contribution to negative returns was less due to their smaller allocations. Industrials made a positive contribution to fund performance due to its large weight and positive performance. Many investors continue to see Brazil as a commodities play or as a proxy for exposure to China given its need for resources. Others see the internal growth within Brazil as one of a growing number of success stories in Latin America. Investor excitement continues to grow as the projects related to the upcoming 2014 World Cup and 2016 Summer Olympics, both hosted in Brazil, come closer to arriving. Such events act as a catalyst to further infrastructure development, which helps the general public evolve into a consumption class and prompts industrial improvements that increase capacity for exports. All of this ideally leads to greater economic prosperity and higher standards of living.
The EGShares Brazil Infrastructure ETF had a total return of 2.11% at net asset value (“NAV”) for the quarter ended March 31, 2013 and 5.33% annualized return since its inception date of February 24, 2010. The Fund’s NAV had a –8.63% return for the full year ended March 31, 2013.
Emerging market investments involve risk of capital loss from unfavorable fluctuation in currency values, from differences in generally accepted accounting principles, from economic or political instability in other nations or increased volatility and lower trading volume. This Fund will concentrate its investments in issuers of one or more particular industries to the same extent that its underlying index is so concentrated and to the extent permitted by applicable regulatory guidance. Concentration risk results from investing more than 25% of the Fund’s assets in issuers conducting business in the same industry. Because the Fund only invests in Brazilian securities, its NAV will be much more sensitive to changes in economic, political and other factors within Brazil than would a fund that invested in a greater variety of countries. Special risks include, among others, political and legal uncertainty, persistent religious, ethnic and border disputes, greater government control over the economy, currency fluctuations or blockage and the risk of nationalization or expropriation of assets.
Performance Charts
The following performance chart is provided for comparative purposes and represents the periods noted. The Fund’s per share NAV is the value of one share of the Fund and is calculated by dividing the value of total assets less total liabilities by the number of shares outstanding. The NAV return is based on the NAV of the Fund and the market return is based on the market price per share of the Fund. The price used to calculate market price returns is the mid-point of the highest bid and lowest offer for Fund shares as of the close of trading on the exchange where Fund shares are listed. NAV and market returns assume that dividends and capital gain distributions have been reinvested in the Fund at NAV and market price, respectively. As with other ETFs, NAV returns and market price returns may differ because of factors such as the supply and demand for Fund shares and investors’ assessments of the underlying value of a Fund’s portfolio securities. An index is a statistical measure of a specified financial market or sector. An index does not actually hold a portfolio of securities, incur expenses or pay any transaction costs. Therefore index returns do not reflect deductions for fees or expenses and are not available for direct investment. In comparison, the Fund’s performance is negatively impacted by these fees and expenses. Fund returns do not reflect brokerage commissions, or taxes on transactions in Fund shares or that a shareholder would pay on Fund distributions.
| 8 EGA Emerging Global Shares Trust |
EGShares Brazil Infrastructure ETF
|
| Performance as of 3/31/2013 |
| | | |
| | Average Annual Total Return |
| | Fund
Net Asset Value | Fund
Market Price | INDXX Brazil
Infrastructure
Index |
| 1 Year | (8.63)% | (8.45)% | (8.43)% |
| 3 Year | 4.56% | 3.35% | 5.46% |
| Since Inception1 | 5.33% | 5.25% | 7.19% |
Performance data quoted represents past performance. Investment return and principal value of an investment will fluctuate so that an investor’s shares, when sold or redeemed, may be worth more or less than the original cost. Current performance data may be higher or lower than actual data quoted. For the most current month-end performance data please call (888) 800-4347. Fund’s net annual operating expense ratio is 0.85%. Market price returns are based on the mid-point of the highest bid and lowest offer for Fund shares as of the scheduled close of regular trading on the New York Stock Exchange (“NYSE”) Arca, ordinarily 4:00 p.m. Eastern time, on each day during which the NYSE is open for trading, and do not represent the returns an investor would receive if shares were traded at other times. Past performance does not guarantee future results.
|
| Value of a $10,000 Investment Since Inception at Net Asset Value |
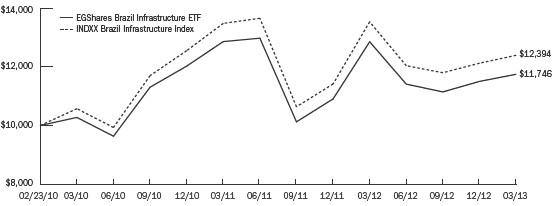
The chart above represents historical performance of a hypothetical investment of $10,000 over the life of the Fund, assuming the reinvestment of distributions. Past performance does not guarantee future results.
| | EGA Emerging Global Shares Trust 9 |
Portfolio Summary (Unaudited)
EGShares China Infrastructure ETF
| | |
| Top Ten Holdings* | |
| Huaneng Power International, Inc. | | 6.6 | % |
| China Oilfield Services, Ltd. | | 5.7 | |
| Anhui Conch Cement Co., Ltd. | | 5.6 | |
| Datang International Power Generation Co., Ltd. | | 5.4 | |
| China Railway Group, Ltd. | | 5.3 | |
| China Railway Construction Corp., Ltd. | | 4.9 | |
| China Communications Construction Co., Ltd. | | 4.6 | |
| Changsha Zoomlion Heavy Industry Science and Technology Development Co., Ltd. | | 4.5 | |
| China Telecom Corp., Ltd. | | 4.3 | |
| Jiangxi Copper Co., Ltd. | | 4.1 | |
| * | Expressed as a percentage of total investments in securities as of 3/31/2013. Holdings are subject to change. |
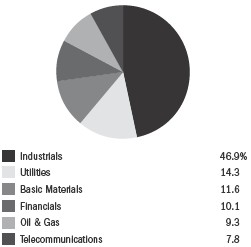
EGShares China Infrastructure ETF (ticker: CHXX)
The Fund’s investment objective is to seek investment results that correspond (before fees and expenses) to the price and yield performance of the INDXX China Infrastructure Index (“China Infrastructure Underlying Index”). The China Infrastructure Underlying Index is comprised of 30 leading companies that INDXX, LLC determines to be representative of China’s infrastructure sectors. The Fund invests in Chinese large and mid cap infrastructure companies that are included in the China Infrastructure Underlying Index, which are generally defined as companies that are domiciled in China and that have a market capitalization of at least $200 million at the time of purchase.
The EGShares China Infrastructure ETF is a multi-sector thematic Fund that aims to provide investors with a means to participate in the great migration of the Chinese rural population to its modern urban centers. Various online sources cite the number of Chinese cities with populations over 1 million at somewhere between 160-180. Yet the more important concept is the trend towards an increasing number of these cities. Current projections show that in 20 years there will be well over 200 cities with more than 1 million inhabitants. If China’s 12th Five-Year Plan (2011-2015) is to shift the nation’s economic focus from export and investment-driven growth to domestic consumption, then the infrastructure needs of its large population of consumers simply must be built. In order for the roughly 750 million Chinese who are relatively poor and living in the Chinese interior to transition into a modern economy, they will require the infrastructure to efficiently travel, work and consume. If this basic infrastructure is not built, it could easily lead to a greater divide between the rich and poor. Minimizing internal social unrest is easily the top priority of the Chinese government, therefore we are confident that the infrastructure story is sound both for the short and longer term. Over the 12-month period ended March 31, 2013, Chinese ETFs behaved like high beta (higher volatility) versions of the broader emerging market indices. (source: Bloomberg 3/31/2013) CHXX was even more volatile than the broad China ETFs, which are more diversified by industry. The Fund’s higher volatility nature is likely the result of its more cyclical industry allocations to engineering/construction, electric, building materials and real estate. Investors should note that large positive contributors to fund performance during the period were from the utilities and energy sectors, more due to the strong performance of these sectors than their index weightings, which were relatively small. Returns from the financial sector, which were positive but not as strong as those from utilities and energy, also contributed positively to performance due to the sector’s larger weighting. Materials and telecom services both detracted from fund performance, due mainly to a large weighting in the case of the former and poorer relative performance for the latter.
The EGShares China Infrastructure ETF had a total return of –8.84% at net asset value (“NAV”) for the quarter ended March 31, 2013 and –2.93% annualized return since its inception date of February 17, 2010. The Fund’s NAV had a 8.16% return for the full year ended March 31, 2013.
Emerging market investments involve risk of capital loss from unfavorable fluctuation in currency values, from differences in generally accepted accounting principles, from economic or political instability in other nations or increased volatility and lower trading volume. This Fund will concentrate its investments in issuers of one or more particular industries to the same extent that its underlying index is so concentrated and to the extent permitted by applicable regulatory guidance. Concentration risk results from investing more than 25% of the Fund’s assets in issuers conducting business in the same industry. Because the Fund only invests in Chinese securities, its NAV will be much more sensitive to changes in economic, political and other factors within China than would a fund that invested in a greater variety of countries. Special risks include, among others, political and legal uncertainty, persistent religious, ethnic and border disputes, greater government control over the economy, currency fluctuations or blockage and the risk of nationalization or expropriation of assets.
Performance Charts
The following performance chart is provided for comparative purposes and represents the periods noted. The Fund’s per share NAV is the value of one share of the Fund and is calculated by dividing the value of total assets less total liabilities by the number of shares outstanding. The NAV return is based on the NAV of the Fund and the market return is based on the market price per share of the Fund. The price used to calculate market price returns is the mid-point of the highest bid and lowest offer for Fund shares as of the close of trading on the exchange where Fund shares are listed. NAV and market returns assume that dividends and capital gain distributions have been reinvested in the Fund at NAV and market price, respectively. As with other ETFs, NAV returns and market price returns may differ because of factors such as the supply and demand for Fund shares and investors’ assessments of the underlying value of a Fund’s portfolio securities. An index is a statistical measure of a specified financial market or sector. An index does not actually hold a portfolio of securities, incur expenses or pay any transaction costs. Therefore index returns do not reflect deductions for fees or expenses and are not available for direct investment. In comparison, the Fund’s performance is negatively impacted by these fees and expenses. Fund returns do not reflect brokerage commissions, or taxes on transactions in Fund shares or that a shareholder would pay on Fund distributions.
| 10 EGA Emerging Global Shares Trust |
EGShares China Infrastructure ETF
|
| Performance as of 3/31/2013 |
| | | |
| | Average Annual Total Return |
| | Fund
Net Asset Value | Fund
Market Price | INDXX China
Infrastructure
Index |
| 1 Year | 8.16% | 8.10% | 8.84% |
| 3 Year | (4.13)% | (4.47)% | (2.17)% |
| Since Inception1 | (2.93)% | (2.96)% | (0.96)% |
Performance data quoted represents past performance. Investment return and principal value of an investment will fluctuate so that an investor’s shares, when sold or redeemed, may be worth more or less than the original cost. Current performance data may be higher or lower than actual data quoted. For the most current month-end performance data please call (888) 800-4347. Fund’s net annual operating expense ratio is 0.85%. Market price returns are based on the mid-point of the highest bid and lowest offer for Fund shares as of the scheduled close of regular trading on the New York Stock Exchange (“NYSE”) Arca, ordinarily 4:00 p.m. Eastern time, on each day during which the NYSE is open for trading, and do not represent the returns an investor would receive if shares were traded at other times. Past performance does not guarantee future results.
|
| Value of a $10,000 Investment Since Inception at Net Asset Value |
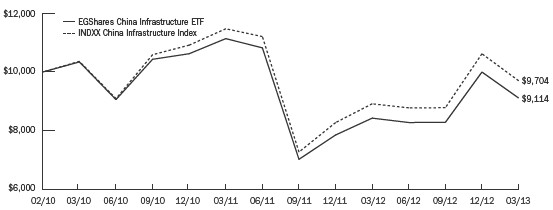
The chart above represents historical performance of a hypothetical investment of $10,000 over the life of the Fund, assuming the reinvestment of distributions. Past performance does not guarantee future results.
| | EGA Emerging Global Shares Trust 11 |
Portfolio Summary (Unaudited)
EGShares Consumer Goods GEMS ETF
| | |
| Top Ten Holdings* | |
| Companhia de Bebidas das Americas Preference Shares | | 9.7 | % |
| Fomento Economico Mexicano SAB de CV | | 7.9 | |
| Astra International Tbk PT | | 6.4 | |
| BRF–Brasil Foods SA | | 6.0 | |
| ITC, Ltd. | | 5.2 | |
| Hindustan Unilever, Ltd. | | 4.7 | |
| Grupo Bimbo SAB de CV | | 4.5 | |
| Grupo Modelo SAB de CV | | 3.7 | |
| Kimberly-Clark de Mexico SAB de CV | | 3.5 | |
| Arca Continental SAB de CV | | 3.5 | |
| * | Expressed as a percentage of total investments in securities as of 3/31/2013. Holdings are subject to change. |
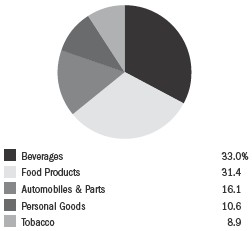
EGShares Consumer Goods GEMS ETF (ticker: GGEM)
The Fund’s investment objective is to seek investment results that correspond (before fees and expenses) to the price and yield performance of the Dow Jones Emerging Markets Consumer Goods Titans 30 IndexSM (“Consumer Goods Underlying Index”). The Consumer Goods Underlying Index is comprised of publicly traded firms in the “Consumer Goods Industry,” as defined by the S&P Dow Jones Indices’ proprietary classification system. The Consumer Goods Underlying Index includes companies whose businesses generally involve: automobiles and parts; beverages; food production; household goods; leisure goods; personal goods; and tobacco.
The EGShares Consumer Goods GEMS ETF is one of very few available ETFs that focus on the emerging market consumer theme. The consumer goods sector was one of the best performers over the 12-month period ended March 31, 2013, and as of that date, GGEM had the best annualized return since inception of all the funds we manage. Large positions such as Ambev, a major Latin American beverage company, not only performed strongly, but also demonstrated the basics of consumer demand. However, despite the strong long-term potential and past performance of a large consumer conglomerate like Ambev, it still is susceptible to significant short-term declines. Ambev dropped roughly 20% in April/May 2013 and again over 10% in February/March 2013. In between these declines, Ambev had a 32% price increase. These results demonstrate that although it is a defensive sector, emerging market consumer goods can be volatile on both the upside and downside. Still, as opposed to many consumer funds that focus on luxury goods to the emerging markets, this Fund focuses on goods that are increasingly in demand by the billions of new emerging market consumers. As of March 31, 2013, industries that had the largest allocations included beverages, food and household products. The largest country allocations were to Mexico, Brazil, India and Indonesia — each with more than 10% of Fund assets. Within these country exposures, large positive contributors to fund performance were from Mexico, India, Brazil and Indonesia given their large weights and positive returns. However, Mexico’s combination as the country with the largest weight and by far the largest return made it the source for nearly 80% of the Fund’s total return. Colombia and Turkey also had strong returns although their contribution to fund performance was smaller due to their small weights. Although relatively small in weight, Malaysia and South Africa provided some negative contribution to fund performance.
The EGShares Consumer Goods GEMS ETF had a total return of 2.67% at net asset value (“NAV”) for the quarter ended March 31, 2013 and 12.82% annualized return since its inception date of June 23, 2011. The Fund’s NAV had a 10.98% return for the full year ended March 31, 2013.
Emerging market investments involve risk of capital loss from unfavorable fluctuation in currency values, from differences in generally accepted accounting principles, from economic or political instability in other nations or increased volatility and lower trading volume. This Fund will concentrate its investments in issuers of one or more particular industries to the same extent that its underlying index is so concentrated and to the extent permitted by applicable regulatory guidance. Concentration risk results from investing more than 25% of the Fund’s assets in issuers conducting business in the same industry.
Performance Charts
The following performance chart is provided for comparative purposes and represents the periods noted. The Fund’s per share NAV is the value of one share of the Fund and is calculated by dividing the value of total assets less total liabilities by the number of shares outstanding. The NAV return is based on the NAV of the Fund and the market return is based on the market price per share of the Fund. The price used to calculate market price returns is the mid-point of the highest bid and lowest offer for Fund shares as of the close of trading on the exchange where Fund shares are listed. NAV and market returns assume that dividends and capital gain distributions have been reinvested in the Fund at NAV and market price, respectively. As with other ETFs, NAV returns and market price returns may differ because of factors such as the supply and demand for Fund shares and investors’ assessments of the underlying value of a Fund’s portfolio securities. An index is a statistical measure of a specified financial market or sector. An index does not actually hold a portfolio of securities, incur expenses or pay any transaction costs. Therefore index returns do not reflect deductions for fees or expenses and are not available for direct investment. In comparison, the Fund’s performance is negatively impacted by these fees and expenses. Fund returns do not reflect brokerage commissions, or taxes on transactions in Fund shares or that a shareholder would pay on Fund distributions.
| 12 EGA Emerging Global Shares Trust |
EGShares Consumer Goods GEMS ETF
|
| Performance as of 3/31/2013 |
| | | |
| | Average Annual Total Return |
| | Fund
Net Asset Value | Fund
Market Price | Dow Jones
Emerging Markets
Consumer Goods
Titans 30 IndexSM |
| 1 Year | 10.98% | 10.69% | 12.09% |
| Since Inception1 | 12.82% | 12.78% | 13.40% |
Performance data quoted represents past performance. Investment return and principal value of an investment will fluctuate so that an investor’s shares, when sold or redeemed, may be worth more or less than the original cost. Current performance data may be higher or lower than actual data quoted. For the most current month-end performance data please call (888) 800-4347. Fund’s net annual operating expense ratio after expense waivers and reimbursements is 0.85%. Market price returns are based on the mid-point of the highest bid and lowest offer for Fund shares as of the scheduled close of regular trading on the New York Stock Exchange (“NYSE”) Arca, ordinarily 4:00 p.m. Eastern time, on each day during which the NYSE is open for trading, and do not represent the returns an investor would receive if shares were traded at other times. Past performance does not guarantee future results.
|
| Value of a $10,000 Investment Since Inception at Net Asset Value |
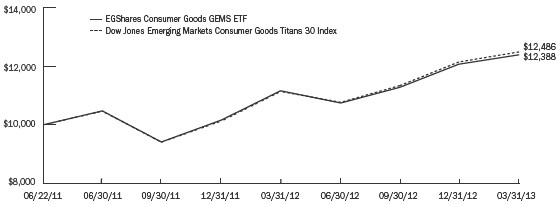
The chart above represents historical performance of a hypothetical investment of $10,000 over the life of the Fund, assuming the reinvestment of distributions. Past performance does not guarantee future results.
| | EGA Emerging Global Shares Trust 13 |
Portfolio Summary (Unaudited)
EGShares Consumer Services GEMS ETF
| | |
| Top Ten Holdings* | |
| Naspers, Ltd. | | 9.3 | % |
| Wal-Mart de Mexico SAB de CV | | 7.8 | |
| Magnit OJSC | | 6.2 | |
| S.A.C.I. Falabella | | 5.7 | |
| Grupo Televisa SAB | | 5.1 | |
| Companhia Brasileira de Distribuicao Grupo Pao de Acucar Preference Shares | | 4.4 | |
| SM Investments Corp. | | 4.3 | |
| Shoprite Holdings, Ltd. | | 4.2 | |
| CP ALL PCL | | 4.2 | |
| Genting BHD | | 4.1 | |
| * | Expressed as a percentage of total investments in securities as of 3/31/2013. Holdings are subject to change. |
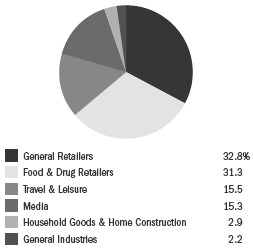
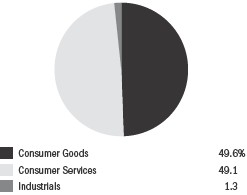
EGShares Consumer Services GEMS ETF (ticker: VGEM)
The Fund’s investment objective is to seek investment results that correspond (before fees and expenses) to the price and yield performance of the Dow Jones Emerging Markets Consumer Services Titans 30 IndexSM (“Consumer Services Underlying Index”). The Consumer Services Underlying Index is comprised of publicly traded firms in the “Consumer Services Industry,” as defined by the S&P Dow Jones Indices’ proprietary classification system. The Consumer Services Underlying Index includes companies whose businesses generally involve: food and drug retail; general retail; media; and travel and leisure.
The EGShares Consumer Services GEMS ETF is a Fund that is heavily biased to basic retailers. As of March 31, 2013, the heaviest industry components were general retailers and food/drug retailers, representing over 60% of the Fund’s exposure. Media, lodging and airlines were other large industry weights in the Fund. As economies grow and consumers come out of poverty, the services they require will be fairly modest. Basic retailers, media and travel are required by any citizen. Thus, similar to our Consumer Goods ETF, the holdings within this Fund focus less on high-end services, since these are not of great demand to the larger population of new middle class emerging market consumers. The Fund’s largest country exposures were to South Africa, Mexico and Chile, each with a portfolio weight of more than 10%. Other significant exposures included Russia, Malaysia, China and Brazil among others. Within these country exposures, large positive contributors to fund performance were from the Philippines, Russia and Thailand, not because of their weights in the fund, which were small, but because of the very strong performance from positions in these countries. Even though returns from South African holdings were not as strong, they were significant contributors to positive return because of the allocation to that country. Significant negative contributors to fund performance were from Mexico, which had a large weight, as well as Malaysia and China, which produced larger negative returns. To highlight a specific holding, Naspers is a South African multi-media conglomerate involved in various forms of media publishing in addition to TV/internet subscription services. It was the largest position in VGEM as of March 31, 2013. From March 31, 2012 to its 52-week high in mid March 2013, Naspers’ stock price was up roughly 48%. It subsequently declined in the latter half of March, resulting in a return of 33% for the reporting period.
The EGShares Consumer Services GEMS ETF had a total return of –1.28% at net asset value (“NAV”) for the quarter ended March 31, 2013 and 4.89% annualized return since its inception date of June 23, 2011. The Fund’s NAV had a 4.17% return for the full year ended March 31, 2013.
Emerging market investments involve risk of capital loss from unfavorable fluctuation in currency values, from differences in generally accepted accounting principles, from economic or political instability in other nations or increased volatility and lower trading volume. This Fund will concentrate its investments in issuers of one or more particular industries to the same extent that its underlying index is so concentrated and to the extent permitted by applicable regulatory guidance. Concentration risk results from investing more than 25% of the Fund’s assets in issuers conducting business in the same industry.
Performance Charts
The following performance chart is provided for comparative purposes and represents the periods noted. The Fund’s per share NAV is the value of one share of the Fund and is calculated by dividing the value of total assets less total liabilities by the number of shares outstanding. The NAV return is based on the NAV of the Fund and the market return is based on the market price per share of the Fund. The price used to calculate market price returns is the mid-point of the highest bid and lowest offer for Fund shares as of the close of trading on the exchange where Fund shares are listed. NAV and market returns assume that dividends and capital gain distributions have been reinvested in the Fund at NAV and market price, respectively. As with other ETFs, NAV returns and market price returns may differ because of factors such as the supply and demand for Fund shares and investors’ assessments of the underlying value of a Fund’s portfolio securities. An index is a statistical measure of a specified financial market or sector. An index does not actually hold a portfolio of securities, incur expenses or pay any transaction costs. Therefore index returns do not reflect deductions for fees or expenses and are not available for direct investment. In comparison, the Fund’s performance is negatively impacted by these fees and expenses. Fund returns do not reflect brokerage commissions, or taxes on transactions in Fund shares or that a shareholder would pay on Fund distributions.
| 14 EGA Emerging Global Shares Trust |
EGShares Consumer Services GEMS ETF
|
| Performance as of 3/31/2013 |
| | | |
| | Average Annual Total Return |
| | Fund
Net Asset Value | Fund
Market Price | Dow Jones
Emerging Markets
Consumer Services
Titans 30 IndexSM |
| 1 Year | 4.17% | 3.88% | 5.51% |
| Since Inception1 | 4.89% | 4.75% | 5.32% |
Performance data quoted represents past performance. Investment return and principal value of an investment will fluctuate so that an investor’s shares, when sold or redeemed, may be worth more or less than the original cost. Current performance data may be higher or lower than actual data quoted. For the most current month-end performance data please call (888) 800-4347. Fund’s net annual operating expense ratio after expense waivers and reimbursements is 0.85%. Market price returns are based on the mid-point of the highest bid and lowest offer for Fund shares as of the scheduled close of regular trading on the New York Stock Exchange (“NYSE”) Arca, ordinarily 4:00 p.m. Eastern time, on each day during which the NYSE is open for trading, and do not represent the returns an investor would receive if shares were traded at other times. Past performance does not guarantee future results.
|
| Value of a $10,000 Investment Since Inception at Net Asset Value |
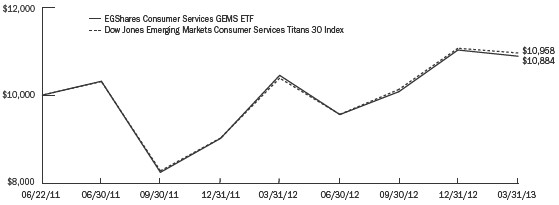
The chart above represents historical performance of a hypothetical investment of $10,000 over the life of the Fund, assuming the reinvestment of distributions. Past performance does not guarantee future results.
| | EGA Emerging Global Shares Trust 15 |
Portfolio Summary (Unaudited)
EGShares Emerging Markets Consumer ETF
| | |
| Top Ten Holdings* | |
| Companhia de Bebidas das Americas Preference Shares | | 9.5 | % |
| Naspers, Ltd. | | 8.0 | |
| Fomento Economico Mexicano SAB de CV | | 6.9 | |
| Wal-Mart de Mexico SAB de CV | | 5.9 | |
| Astra International TBK PT | | 5.7 | |
| BRF–Brasil Foods SA | | 5.1 | |
| Magnit OJSC | | 4.5 | |
| ITC, Ltd. | | 4.2 | |
| S.A.C.I. Falabella | | 4.1 | |
| Grupo Televisa SAB | | 3.8 | |
| * | Expressed as a percentage of total investments in securities as of 3/31/2013. Holdings are subject to change. |
EGShares Emerging Markets Consumer ETF (ticker: ECON)
The Fund’s investment objective is to seek investment results that correspond (before fees and expenses) to the price and yield performance of the Dow Jones Emerging Markets Consumer Titans 30 IndexSM (“Consumer Underlying Index”). The Consumer Underlying Index is comprised of 30 publicly traded firms in the “Consumer Goods Industry” and “Consumer Services Industry,” as defined by the S&P Dow Jones Indices’ proprietary classification system. The Consumer Underlying Index includes companies whose businesses involve: general retailers, beverage providers, food producers, media, auto & parts, travel & leisure and personal goods.
The EGShares Emerging Markets Consumer ETF is our biggest fund with $885.5 million in assets as of March 31, 2013. The idea of young consumers with little debt entering the global economy is exciting, and it is a common focus of sell side research reports as well as a broadly followed theme by fund managers and the mainstream media. This trend follows similar patterns of the “boomer” population in the western world, which helped propel the capital markets in the 1980s and 90s. ECON was one of our top performing funds over the reporting period. Strong performers such as ITC from India, Naspers in South Africa and Mexico’s FEMSA all had returns well over 30% for the 12-month period ended March 31, 2013. Industries more representative of the needs of a broader, emerging economy such as food, basic retail, beverages and media were the largest allocations in ECON. By sub-industry, strong performance was observed in food, beverage and retail stocks while negative performance was evident in auto and consumer services. By country, the largest exposures were to Mexico, Brazil, South Africa and India. Within these country exposures, investors should note that large positive contributors to fund performance were from Mexico, Brazil and India, due to their large weights in the fund as well as strong performance from individual positions. Russia was also a strong contributor of positive return not so much because of its allocation, which was small, but due to its very strong performance over the period. Significant detractors from fund performance were from China and Malaysia, not due to allocations but their larger negative returns. As companies all over the world diversify away from dependence on Western consumers, the ongoing focus will be on consumers from the emerging markets. It is the companies within these markets that have better local brand recognition, lower input costs and better understanding of customer needs. We believe ECON best represents this group of companies.
The EGShares Emerging Markets Consumer ETF had a total return of 0.68% at net asset value (“NAV”) for the quarter ended March 31, 2013 and 12.16% annualized return since its inception date of September 14, 2010. The Fund’s NAV had a 7.46% return for the full year ended March 31, 2013.
Emerging market investments involve risk of capital loss from unfavorable fluctuation in currency values, from differences in generally accepted accounting principles, from economic or political instability in other nations or increased volatility and lower trading volume. This Fund will concentrate its investments in issuers of one or more particular industries to the same extent that its underlying index is so concentrated and to the extent permitted by applicable regulatory guidance. Concentration risk results from investing more than 25% of the Fund’s assets in issuers conducting business in the same industry.
Performance Charts
The following performance chart is provided for comparative purposes and represents the periods noted. The Fund’s per share NAV is the value of one share of the Fund and is calculated by dividing the value of total assets less total liabilities by the number of shares outstanding. The NAV return is based on the NAV of the Fund and the market return is based on the market price per share of the Fund. The price used to calculate market price returns is the mid-point of the highest bid and lowest offer for Fund shares as of the close of trading on the exchange where Fund shares are listed. NAV and market returns assume that dividends and capital gain distributions have been reinvested in the Fund at NAV and market price, respectively. As with other ETFs, NAV returns and market price returns may differ because of factors such as the supply and demand for Fund shares and investors’ assessments of the underlying value of a Fund’s portfolio securities. An index is a statistical measure of a specified financial market or sector. An index does not actually hold a portfolio of securities, incur expenses or pay any transaction costs. Therefore index returns do not reflect deductions for fees or expenses and are not available for direct investment. In comparison, the Fund’s performance is negatively impacted by these fees and expenses. Fund returns do not reflect brokerage commissions, or taxes on transactions in Fund shares or that a shareholder would pay on Fund distributions.
| 16 EGA Emerging Global Shares Trust |
EGShares Emerging Markets Consumer ETF
|
| Performance as of 3/31/2013 |
| | | |
| | Average Annual Total Return |
| | Fund
Net Asset Value | Fund
Market Price | Dow Jones
Emerging Markets
Consumer
Titans 30 IndexSM |
| 1 Year | 7.46% | 7.52% | 8.38% |
| Since Inception1 | 12.16% | 12.31% | 13.63% |
Performance data quoted represents past performance. Investment return and principal value of an investment will fluctuate so that an investor’s shares, when sold or redeemed, may be worth more or less than the original cost. Current performance data may be higher or lower than actual data quoted. For the most current month-end performance data please call (888) 800-4347. Fund’s net annual operating expense ratio is 0.85%. Market price returns are based on the mid-point of the highest bid and lowest offer for Fund shares as of the scheduled close of regular trading on the New York Stock Exchange (“NYSE”) Arca, ordinarily 4:00 p.m. Eastern time, on each day during which the NYSE is open for trading, and do not represent the returns an investor would receive if shares were traded at other times. Past performance does not guarantee future results.
|
| Value of a $10,000 Investment Since Inception at Net Asset Value |
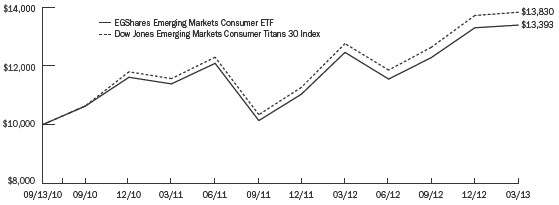
The chart above represents historical performance of a hypothetical investment of $10,000 over the life of the Fund, assuming the reinvestment of distributions. Past performance does not guarantee future results.
| | EGA Emerging Global Shares Trust 17 |
Portfolio Summary (Unaudited)
EGShares Emerging Markets Core ETF
| | |
| Top Ten Holdings* | |
| Grupo Bimbo SAB de CV | | 1.6 | % |
| Kimberly-Clark de Mexico SAB de CV | | 1.6 | |
| Ayala Land, Inc. | | 1.5 | |
| Embraer SA | | 1.4 | |
| Arcelik AS | | 1.4 | |
| Fomento Economico Mexicano SAB de CV | | 1.4 | |
| Grupo de Inversiones Suramericana SA | | 1.4 | |
| Haci OMER Sabanci Holding AS | | 1.4 | |
| S.A.C.I. Falabella | | 1.4 | |
| Companhia Brasileira de Distribuicao Grupo Pao de Acucar Preference Shares | | 1.4 | |
| * | Expressed as a percentage of total investments in securities as of 3/31/2013. Holdings are subject to change. |
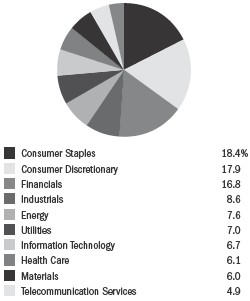
EGShares Emerging Market Core ETF (ticker: EMCR)
The Fund’s investment objective is to seek investment results that correspond (before fees and expenses) to the price and yield performance of the S&P Emerging Markets Core Index (“Core Underlying Index”). The Core Underlying Index is comprised of 116 leading companies that S&P Dow Jones Indices determines to be representative of all industries in emerging market countries. The Fund invests in the constituent companies of the Core Underlying Index, which may include small and medium capitalized companies (“small cap” and “mid cap” companies, respectively) domiciled in emerging market countries having a market capitalization of at least $1 billion at the time of purchase.
The EGShares Emerging Markets Core ETF provides a differentiated approach to broad-based emerging market exposure. Unlike traditional market cap-weighted index methods that naturally provide the greatest exposure to financials, energy and materials (the large names that pull economies out of frontier and into emerging status), EMCR attempts to provide a more balanced approach to sector coverage. This serves to help ensure that other sectors beyond these three have adequate exposure. Not only are these three specific sectors more heavily weighted in traditional indices, but they also provide most of the inherent volatility in price performance. EMCR also attempts to provide a better balance between the BRIC (“Brazil, Russia India and China”) countries and other emerging markets. Thus, by various measures, we believe that EMCR is more intelligently balanced and represents the evolution of the ETF industry away from being solely focused on market cap-weighted exposures and towards “better beta.” Of the Fund’s largest country exposures, investors should note that India, China and Mexico were among those with positive contribution to Fund performance, while South Africa and Malaysia were the main negative contributors. Strong country-specific returns that contributed positively to the Fund were from the Philippines, Turkey and Colombia, although in all cases country weights were below 5% on average over the period. South Africa was also a strong contributor of positive return not so much because of very strong performance but because of the allocation to that country. Significant detractors from Fund performance were from Mexico, which had a large weight, but also Malaysia and China more so due to larger negative returns. By sector, strong performance was observed in financials and consumer stocks while negative performance was evident in energy and materials.
The EGShares Emerging Markets Core ETF had a total return of 0.14% at net asset value (“NAV”) for the quarter ended March 31, 2013 and 4.55% return since its inception date of October 16, 2012. Based on this inception date, the Fund did not have enough historical pricing to cover a full year ended March 31, 2013.
Emerging market investments involve risk of capital loss from unfavorable fluctuation in currency values, from differences in generally accepted accounting principles, from economic or political instability in other nations or increased volatility and lower trading volume. This Fund will concentrate its investments in issuers of one or more particular industries to the same extent that its underlying index is so concentrated and to the extent permitted by applicable regulatory guidance. Concentration risk results from investing more than 25% of the Fund’s assets in issuers conducting business in the same industry.
Performance Charts
The following performance chart is provided for comparative purposes and represents the period noted. The Fund’s per share NAV is the value of one share of the Fund and is calculated by dividing the value of total assets less total liabilities by the number of shares outstanding. The NAV return is based on the NAV of the Fund and the market return is based on the market price per share of the Fund. The price used to calculate market price returns is the mid-point of the highest bid and lowest offer for Fund shares as of the close of trading on the exchange where Fund shares are listed. NAV and market returns assume that dividends and capital gain distributions have been reinvested in the Fund at NAV and market price, respectively. As with other ETFs, NAV returns and market price returns may differ because of factors such as the supply and demand for Fund shares and investors’ assessments of the underlying value of a Fund’s portfolio securities. An index is a statistical measure of a specified financial market or sector. An index does not actually hold a portfolio of securities, incur expenses or pay any transaction costs. Therefore index returns do not reflect deductions for fees or expenses and are not available for direct investment. In comparison, the Fund’s performance is negatively impacted by these fees and expenses. Fund returns do not reflect brokerage commissions, or taxes on transactions in Fund shares or that a shareholder would pay on Fund distributions.
| 18 EGA Emerging Global Shares Trust |
EGShares Emerging Markets Core ETF
|
| Performance as of 3/31/2013 |
| | | |
| | Average Annual Total Return1 |
| | Fund
Net Asset Value | Fund
Market Price | S&P
Emerging Markets
Core Index |
| Since Inception2 | 4.55% | 5.25% | 5.14% |
| 1 | Returns of less than one year are not annualized. |
Performance data quoted represents past performance. Investment return and principal value of an investment will fluctuate so that an investor’s shares, when sold or redeemed, may be worth more or less than the original cost. Current performance data may be higher or lower than actual data quoted. For the most current month-end performance data please call (888) 800-4347. This Fund is new and has a limited operating history. Fund’s net annual operating expense ratio is 0.70%. Market price returns are based on the mid-point of the highest bid and lowest offer for Fund shares as of the scheduled close of regular trading on the New York Stock Exchange (“NYSE”) Arca, ordinarily 4:00 p.m. Eastern time, on each day during which the NYSE is open for trading, and do not represent the returns an investor would receive if shares were traded at other times. Past performance does not guarantee future results.
|
| Value of a $10,000 Investment Since Inception at Net Asset Value |
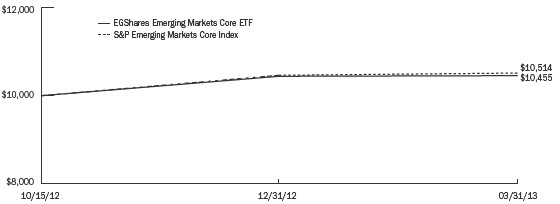
The chart above represents historical performance of a hypothetical investment of $10,000 over the life of the Fund, assuming the reinvestment of distributions. Past performance does not guarantee future results.
| | EGA Emerging Global Shares Trust 19 |
Portfolio Summary (Unaudited)
EGShares Emerging Markets Domestic Demand ETF
| | |
| Top Ten Holdings* | |
| Fomento Economico Mexicano SAB de CV | | 6.1 | % |
| ITC, Ltd. | | 5.3 | |
| Companhia de Bebidas das Americas Preference Shares | | 4.8 | |
| Naspers, Ltd. | | 4.4 | |
| China Telecom Corp., Ltd. | | 4.3 | |
| Grupo Modelo SAB de CV | | 4.3 | |
| MTN Group, Ltd. | | 4.1 | |
| Coca-Cola Femsa SAB de CV | | 3.8 | |
| BRF–Brasil Foods SA | | 3.6 | |
| Huaneng Power International, Inc. | | 3.6 | |
| * | Expressed as a percentage of total investments in securities as of 3/31/2013. Holdings are subject to change. |
EGShares Emerging Markets Domestic Demand ETF (ticker: EMDD)
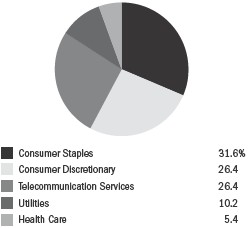
The Fund’s investment objective is to seek investment results that correspond (before fees and expenses) to the price and yield performance of the INDXX Emerging Markets Domestic Demand Index (“Domestic Demand Underlying Index”). The Domestic Demand Underlying Index is comprised of 50 emerging markets companies in sectors INDXX, LLC determines may have greater exposure to local markets than the MSCI Emerging Markets IndexSM. The Fund invests in the constituent companies of the Domestic Demand Underlying Index, which may include small and medium capitalized companies (“small cap” and “mid cap” companies, respectively) domiciled in emerging market countries having a market capitalization of at least $100 million at the time of purchase. The Domestic Demand Underlying Index includes emerging market companies in the consumer goods, consumer services, health care, telecommunications and utilities industries.
The EGShares Emerging Markets Domestic Demand ETF expands beyond the consumer sector represented by the EGShares Emerging Markets Consumer ETF to also include Telecom, utilities and health care, since these are generally all in demand by emerging market citizens regardless of wealth or stature. The Fund is broadly diversified by geography, with allocations to Mexico, China, India, South Africa and Brazil each representing more than 10% of portfolio assets. While our Beyond BRICs ETF provides the means to diversify away from the heavy country exposures found in broad cap-weighted emerging market indices, EMDD attempts to solve the same problems related to undesired sector overweights. Considering country allocations during the reporting period, Mexico, China, India and Brazil contributed positively to fund returns due to their larger weights as well as strong performance from individual positions. Holdings that detracted from fund performance were from Poland and Russia, although their weights in the fund were small. Of the Fund’s largest industry exposures, investors should note all categories were positive to Fund performance but consumer stocks were the greatest contributors due to a combination of large exposures and strong market performance. Although smaller in allocation, utilities and health care performed strongly, making a positive contribution to the fund.
The EGShares Emerging Markets Domestic Demand ETF had a total return of 1.93% at net asset value (“NAV”) for the quarter ended March 31, 2013 and 11.23% return since its inception date of August 15, 2012. Based on this inception date, the Fund did not have enough historical pricing to cover a full year ended March 31, 2013.
Emerging market investments involve risk of capital loss from unfavorable fluctuation in currency values, from differences in generally accepted accounting principles, from economic or political instability in other nations or increased volatility and lower trading volume. This Fund will concentrate its investments in issuers of one or more particular industries to the same extent that its underlying index is so concentrated and to the extent permitted by applicable regulatory guidance. Concentration risk results from investing more than 25% of the Fund’s assets in issuers conducting business in the same industry.
Performance Charts
The following performance chart is provided for comparative purposes and represents the period noted. The Fund’s per share NAV is the value of one share of the Fund and is calculated by dividing the value of total assets less total liabilities by the number of shares outstanding. The NAV return is based on the NAV of the Fund and the market return is based on the market price per share of the Fund. The price used to calculate market price returns is the mid-point of the highest bid and lowest offer for Fund shares as of the close of trading on the exchange where Fund shares are listed. NAV and market returns assume that dividends and capital gain distributions have been reinvested in the Fund at NAV and market price, respectively. As with other ETFs, NAV returns and market price returns may differ because of factors such as the supply and demand for Fund shares and investors’ assessments of the underlying value of a Fund’s portfolio securities. An index is a statistical measure of a specified financial market or sector. An index does not actually hold a portfolio of securities, incur expenses or pay any transaction costs. Therefore index returns do not reflect deductions for fees or expenses and are not available for direct investment. In comparison, the Fund’s performance is negatively impacted by these fees and expenses. Fund returns do not reflect brokerage commissions, or taxes on transactions in Fund shares or that a shareholder would pay on Fund distributions.
| 20 EGA Emerging Global Shares Trust |
EGShares Emerging Markets Domestic Demand ETF
|
| Performance as of 3/31/2013 |
| | | |
| | Average Annual Total Return1 |
| | Fund
Net Asset Value | Fund
Market Price | INDXX
Emerging Market
Domestic
Demand Index |
| Since Inception2 | 11.23% | 12.13% | 12.65% |
| 1 | Returns of less than one year are not annualized. |
Performance data quoted represents past performance. Investment return and principal value of an investment will fluctuate so that an investor’s shares, when sold or redeemed, may be worth more or less than the original cost. Current performance data may be higher or lower than actual data quoted. For the most current month-end performance data please call (888) 800-4347. This Fund is new and has limited operating history. Fund’s net annual operating expense ratio is 0.85%. Market price returns are based on the mid-point of the highest bid and lowest offer for Fund shares as of the scheduled close of regular trading on the New York Stock Exchange (“NYSE”) Arca, ordinarily 4:00 p.m. Eastern time, on each day during which the NYSE is open for trading, and do not represent the returns an investor would receive if shares were traded at other times. Past performance does not guarantee future results.
|
| Value of a $10,000 Investment Since Inception at Net Asset Value |
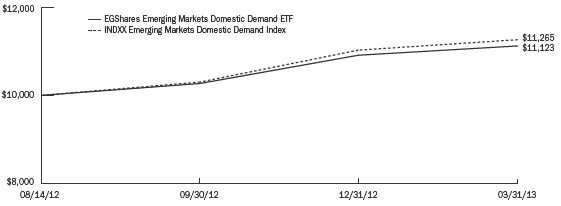
The chart above represents historical performance of a hypothetical investment of $10,000 over the life of the Fund, assuming the reinvestment of distributions. Past performance does not guarantee future results.
| | EGA Emerging Global Shares Trust 21 |
Portfolio Summary (Unaudited)
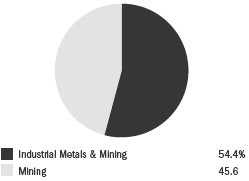
EGShares Emerging Markets Metals & Mining ETF
| | |
| Top Ten Holdings* | |
| Vale SA | | 9.4 | % |
| China Shenhua Energy Co., Ltd. | | 7.0 | |
| MMC Norilsk Nickel OJSC | | 7.0 | |
| Grupo Mexico SAB de CV | | 6.4 | |
| AngloGold Ashanti, Ltd. | | 5.8 | |
| Impala Platinum Holdings, Ltd. | | 5.1 | |
| KGHM Polska Miedz SA | | 4.9 | |
| Gerdau SA Preference Shares | | 4.7 | |
| Industrias Penoles SAB de CV | | 4.4 | |
| Gold Fields, Ltd. | | 4.1 | |
| * | Expressed as a percentage of total investments in securities as of 3/31/2013. Holdings are subject to change. |
EGShares Emerging Markets Metals & Mining ETF (ticker: EMT)
The Fund’s investment objective is to seek investment results that correspond (before fees and expenses) to the price and yield performance of the Dow Jones Emerging Markets Metals & Mining Titans 30 IndexSM (“Metals & Mining Underlying Index”). The Metals & Mining Underlying Index is comprised of 30 publicly traded firms in the “Industrial Metals and Mining Sector” and “Mining Sector,” as defined by the S&P Dow Jones Indices’ proprietary classification system. The Metals & Mining Underlying Index includes companies involved in the extraction and basic processing of basic resources (other than oil and gas), such as coal, metal ore (including the production of basic aluminum, iron and steel products), precious metals and gemstones.
For the second year in a row, the EGShares Emerging Markets Metals & Mining GEMS ETF, had the worst 12 month return of any of our ETFs. The Fund has a lifetime maximum drawdown of roughly 55%. The Fund’s results greatly underperformed global and international material sector ETFs, but outperformed niche ETFs that focus on gold mining companies. Of the fund’s largest country exposures, the main negative contributors to performance were from South Africa and to a lesser extent from Brazil, India and China. Mexican and Polish positions provided strong upside performance, although they were relatively smaller exposures in the fund. Within sub-categories based on industry, losses were generally broad, with no single industry group significantly outperforming or underperforming others. Despite poor performance over the past two years, annualized returns since inception are just below 1% as of March 31, 2013, since performance was relatively strong in its first two years. This is a hybrid sector fund in that it takes the basic materials sector and strips out paper/forestry and chemical companies. The themes of infrastructure, commodity demand, inflation hedging and cyclical growth within emerging markets all connect well with EMT. Given recent bearish sentiment towards gold and the poor performance in emerging market materials/miners, positive cyclical sentiment toward these companies could potentially be strong: a rebound in the US, Europe and Japan may strengthen emerging market demand for materials as industrial production ramps up alongside export demand.
The EGShares Emerging Markets Metals & Mining GEMS ETF had a total return of –16.30% at net asset value (“NAV”) for the quarter ended March 31, 2013 and –1.05% annualized return since its inception date of May 21, 2009. The Fund’s NAV had a –21.51% return for the full year ended March 31, 2013.
Emerging market investments involve risk of capital loss from unfavorable fluctuation in currency values, from differences in generally accepted accounting principles, from economic or political instability in other nations or increased volatility and lower trading volume. This Fund will concentrate its investments in issuers of one or more particular industries to the same extent that its underlying index is so concentrated and to the extent permitted by applicable regulatory guidance. Concentration risk results from investing more than 25% of the Fund’s assets in issuers conducting business in the same industry.
Performance Charts
The following performance chart is provided for comparative purposes and represents the periods noted. The Fund’s per share NAV is the value of one share of the Fund and is calculated by dividing the value of total assets less total liabilities by the number of shares outstanding. The NAV return is based on the NAV of the Fund and the market return is based on the market price per share of the Fund. The price used to calculate market price returns is the mid-point of the highest bid and lowest offer for Fund shares as of the close of trading on the exchange where Fund shares are listed. NAV and market returns assume that dividends and capital gain distributions have been reinvested in the Fund at NAV and market price, respectively. As with other ETFs, NAV returns and market price returns may differ because of factors such as the supply and demand for Fund shares and investors’ assessments of the underlying value of a Fund’s portfolio securities. An index is a statistical measure of a specified financial market or sector. An index does not actually hold a portfolio of securities, incur expenses or pay any transaction costs. Therefore index returns do not reflect deductions for fees or expenses and are not available for direct investment. In comparison, the Fund’s performance is negatively impacted by these fees and expenses. Fund returns do not reflect brokerage commissions, or taxes on transactions in Fund shares or that a shareholder would pay on Fund distributions.
| 22 EGA Emerging Global Shares Trust |
EGShares Emerging Markets Metals & Mining ETF
|
| Performance as of 3/31/2013 |
| | | |
| | Average Annual Total Return |
| | Fund
Net Asset Value | Fund
Market Price | Dow Jones
Emerging Markets
Metals & Mining
Titans 30 IndexSM |
| 1 Year | (21.51)% | (21.77)% | (21.09)% |
| 3 Years | (13.76)% | (13.83)% | (13.98)% |
| Since Inception1 | (1.05)% | (1.02)% | (0.41)% |
Performance data quoted represents past performance. Investment return and principal value of an investment will fluctuate so that an investor’s shares, when sold or redeemed, may be worth more or less than the original cost. Current performance data may be higher or lower than actual data quoted. For the most current month-end performance data please call (888) 800-4347. Fund’s net annual operating expense ratio is 0.85%. Market price returns are based on the mid-point of the highest bid and lowest offer for Fund shares as of the scheduled close of regular trading on the New York Stock Exchange (“NYSE”) Arca, ordinarily 4:00 p.m. Eastern time, on each day during which the NYSE is open for trading, and do not represent the returns an investor would receive if shares were traded at other times. Past performance does not guarantee future results.
|
| Value of a $10,000 Investment Since Inception at Net Asset Value |
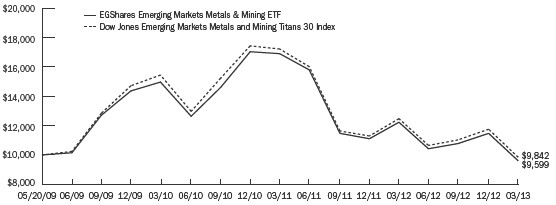
The chart above represents historical performance of a hypothetical investment of $10,000 over the life of the Fund, assuming the reinvestment of distributions. Past performance does not guarantee future results.
| | EGA Emerging Global Shares Trust 23 |
Portfolio Summary (Unaudited)
EGShares Energy GEMS ETF
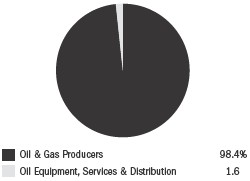
| | |
| Top Ten Holdings* | |
| Gazprom OAO | | 10.1 | % |
| LUKOIL OAO | | 7.4 | |
| CNOOC, Ltd. | | 6.9 | |
| PetroChina Co., Ltd. | | 6.6 | |
| Petroleo Brasileiro SA | | 6.5 | |
| Reliance Industries, Ltd. | | 5.7 | |
| Sasol, Ltd. | | 4.7 | |
| NovaTek OAO | | 4.5 | |
| China Petroleum & Chemical Corp. | | 4.5 | |
| Ecopetrol SA | | 4.2 | |
| * | Expressed as a percentage of total investments in securities as of 3/31/2013. Holdings are subject to change. |
EGShares Energy GEMS ETF (ticker: OGEM)
The Fund’s investment objective is to seek investment results that correspond (before fees and expenses) to the price and yield performance of the Dow Jones Emerging Markets Oil and Gas Titans 30 IndexSM (“The Oil and Gas Underlying Index”). The Oil and Gas Underlying Index is comprised of publicly traded firms in the “Oil and Gas Industry,” as defined by the S&P Dow Jones Indices’ proprietary classification system. Oil and Gas Underlying Index includes companies whose businesses involve: oil and gas production; oil equipment, services and distribution; and alternative energy.
The EGShares Energy GEMS ETF provides exposure to a sector that has traditionally been a large component of broad emerging market indices. Within energy, the oil and gas sector has historically been a source of price volatility, and this was demonstrated in the Fund’s performance over the 12 months ended March 31, 2013. OGEM began the reporting period roughly at a net asset value of $25, fell to just above $20 two months later and then climbed back to $25 by mid-September. These results amounted to a 20% decline in the first half of the fiscal year, followed by a 25% climb in the second half. The latter period was less volatile than the former, with the Fund’s price staying within a band between roughly $23 and $25. Large portfolio holdings like Petrobras were relative underperformers over the period, while South Africa’s Sasol was an outperformer. On a country basis, the main negative contributors to Fund performance were from Brazil, Hungary and Chile, due more to poor performance than their weights. Conversely, Russia and India also contributed negatively not so much because of performance but due to large allocations. Significant positive performance was visible from positions in Poland, Turkey and China although contribution to Fund performance was minimal due to small allocations. Interestingly, with the global economy unable to find the strength it demonstrated before the financial crisis, oil prices have been challenged to remain above USD100. With oil prices less of a macro driver to the stock price of producers, company specific factors were more significant. This accounts for the relatively high variability among holdings in OGEM. The Fund continues to act as an effective inflation hedge for globally oriented investors. With more emerging markets considering the reduction or removal of government subsidies or mandated price limits, there is greater positive potential for local oil producers. Longer term optimism exists for the emerging market energy sector given that as the global economy truly recovers in a meaningful manner, energy prices will climb, providing a structural tailwind for OGEM holdings. The U.S. economy has shown positive signs of longer term recovery, but as the Eurozone and Japan follow a similar path, this tailwind should only strengthen.
The EGShares Energy GEMS ETF had a total return of –4.80% at net asset value (“NAV”) for the quarter ended March 31, 2013 and 4.45% annualized return since its inception date of May 21, 2009. The Fund’s NAV had a –6.21% return for the full year ended March 31, 2013.
Emerging market investments involve risk of capital loss from unfavorable fluctuation in currency values, from differences in generally accepted accounting principles, from economic or political instability in other nations or increased volatility and lower trading volume. This Fund will concentrate its investments in issuers of one or more particular industries to the same extent that its underlying index is so concentrated and to the extent permitted by applicable regulatory guidance. Concentration risk results from investing more than 25% of the Fund’s assets in issuers conducting business in the same industry.
Performance Charts
The following performance chart is provided for comparative purposes and represents the periods noted. The Fund’s per share NAV is the value of one share of the Fund and is calculated by dividing the value of total assets less total liabilities by the number of shares outstanding. The NAV return is based on the NAV of the Fund and the market return is based on the market price per share of the Fund. The price used to calculate market price returns is the mid-point of the highest bid and lowest offer for Fund shares as of the close of trading on the exchange where Fund shares are listed. NAV and market returns assume that dividends and capital gain distributions have been reinvested in the Fund at NAV and market price, respectively. As with other ETFs, NAV returns and market price returns may differ because of factors such as the supply and demand for Fund shares and investors’ assessments of the underlying value of a Fund’s portfolio securities. An index is a statistical measure of a specified financial market or sector. An index does not actually hold a portfolio of securities, incur expenses or pay any transaction costs. Therefore index returns do not reflect deductions for fees or expenses and are not available for direct investment. In comparison, the Fund’s performance is negatively impacted by these fees and expenses. Fund returns do not reflect brokerage commissions, or taxes on transactions in Fund shares or that a shareholder would pay on Fund distributions.
| 24 EGA Emerging Global Shares Trust |
EGShares Energy GEMS ETF
|
| Performance as of 3/31/2013 |
| | | |
| | Average Annual Total Return |
| | Fund
Net Asset Value | Fund
Market Price | Dow Jones
Emerging Markets
Oil and Gas
Titans 30 IndexSM |
| 1 Year | (6.21)% | (6.09)% | (4.78)% |
| 3 Year | 0.23% | 0.08% | 0.26% |
| Since Inception1 | 4.45% | 4.47% | 4.56% |
Performance data quoted represents past performance. Investment return and principal value of an investment will fluctuate so that an investor’s shares, when sold or redeemed, may be worth more or less than the original cost. Current performance data may be higher or lower than actual data quoted. For the most current month-end performance data please call (888) 800-4347. Fund’s net annual operating expense ratio is 0.85%. Market price returns are based on the mid-point of the highest bid and lowest offer for Fund shares as of the scheduled close of regular trading on the New York Stock Exchange (“NYSE”) Arca, ordinarily 4:00 p.m. Eastern time, on each day during which the NYSE is open for trading, and do not represent the returns an investor would receive if shares were traded at other times. Past performance does not guarantee future results.
|
| Value of a $10,000 Investment Since Inception at Net Asset Value |
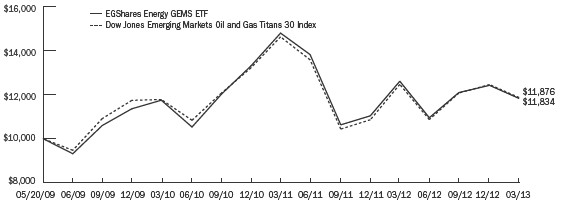
The chart above represents historical performance of a hypothetical investment of $10,000 over the life of the Fund, assuming the reinvestment of distributions. Past performance does not guarantee future results.
| | EGA Emerging Global Shares Trust 25 |
Portfolio Summary (Unaudited)
EGShares Financials GEMS ETF
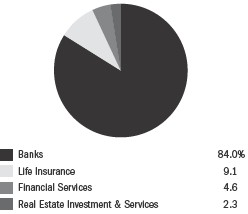
| | |
| Top Ten Holdings* | |
| China Construction Bank Corp. | | 10.2 | % |
| Industrial and Commercial Bank of China, Ltd. | | 9.0 | |
| Itau Unibanco Holding SA Preference Shares | | 6.7 | |
| Banco Bradesco SA Preference Shares | | 6.4 | |
| Sberbank of Russia | | 5.7 | |
| Bank of China, Ltd. | | 5.6 | |
| Housing Development Finance Corp., Ltd. | | 4.6 | |
| China Life Insurance Co., Ltd. | | 3.8 | |
| Bank Central Asia Tbk PT | | 3.6 | |
| Grupo Financiero Banorte SAB de CV | | 3.3 | |
| * | Expressed as a percentage of total investments in securities as of 3/31/2013. Holdings are subject to change. |
EGShares Financials GEMS ETF (ticker: FGEM)
The Fund’s investment objective is to seek investment results that correspond (before fees and expenses) to the price and yield performance of the Dow Jones Emerging Markets Financials Titans 30 IndexSM (“Financials Underlying Index”). The Financials Underlying Index is comprised of publicly traded firms in the “Financials Industry,” as defined by the S&P Dow Jones Indices’ proprietary classification system. The Financials Underlying Index includes companies whose businesses involve: banking; insurance; real estate; and financial services.
The EGShares Financials GEMS ETF provides exposure to a sector that has traditionally focused on American, European and Japanese banks, and continues to do so today. The negative stigma attached to financial institutions has continued in Europe albeit within periphery economies such as Cyprus. Still, with tighter industry regulations and increased dissatisfaction from the broader public regarding financial institutions and banks in particular, we continue to be surprised at how investors have not generally accepted the migration of financial sector assets into emerging markets. Unlike the previous 12-month period which was generally downward, the 12-month period ended March 31, 2013 was generally upward trending. From the end of March 2012 to May, 23 2012, FGEM declined by 17%. However, from that point to January 23, 2013, its price climbed by 35%. In the early part of 2013, FGEM saw some weakness primarily due to significant declines from Chinese holdings which remain the largest allocation by country. Positions in China and India were large positive contributors during the overall reporting period, however, due to their significant weights as well as good performance. Even stronger performance was visible in Turkey, Mexico and Indonesia, although small allocations minimized their contribution to Fund returns. Negative performance came primarily from Russian exposure. Within the emerging market sectors, Financials were one of the strongest performers during the reporting period with a return of roughly 10%. Not burdened by household or corporate indebtedness, nor with balance sheets littered with real estate-related holdings, financial institutions in the emerging markets are tied to individuals and companies that continue to be in a secular growth stage. By contrast, those in developed markets are striving to find growth. Although the financial sector has been and continues to be the largest sector weight in most broad emerging market indices, investors have been reluctant to actively bias their portfolios in this sector. This is likely due to recent recollection of financial sector trauma in the US/Eurozone as well as concerns specifically within China. We continue to see the financial sector as both a key infrastructure piece for ongoing growth as well as somewhat of a consumption play as more wealth is generated in these growing markets.
The EGShares Financials GEMS ETF had a total return of 0.28% at net asset value (“NAV”) for the quarter ended March 31, 2013 and 4.31% annualized return since its inception date of September 16, 2009. The Fund’s NAV had a 10.00% return for the full year ended March 31, 2013.
Emerging market investments involve risk of capital loss from unfavorable fluctuation in currency values, from differences in generally accepted accounting principles, from economic or political instability in other nations or increased volatility and lower trading volume. This Fund will concentrate its investments in issuers of one or more particular industries to the same extent that its underlying index is so concentrated and to the extent permitted by applicable regulatory guidance. Concentration risk results from investing more than 25% of the Fund’s assets in issuers conducting business in the same industry.
Performance Charts
The following performance chart is provided for comparative purposes and represents the periods noted. The Fund’s per share NAV is the value of one share of the Fund and is calculated by dividing the value of total assets less total liabilities by the number of shares outstanding. The NAV return is based on the NAV of the Fund and the market return is based on the market price per share of the Fund. The price used to calculate market price returns is the mid-point of the highest bid and lowest offer for Fund shares as of the close of trading on the exchange where Fund shares are listed. NAV and market returns assume that dividends and capital gain distributions have been reinvested in the Fund at NAV and market price, respectively. As with other ETFs, NAV returns and market price returns may differ because of factors such as the supply and demand for Fund shares and investors’ assessments of the underlying value of a Fund’s portfolio securities. An index is a statistical measure of a specified financial market or sector. An index does not actually hold a portfolio of securities, incur expenses or pay any transaction costs. Therefore index returns do not reflect deductions for fees or expenses and are not available for direct investment. In comparison, the Fund’s performance is negatively impacted by these fees and expenses. Fund returns do not reflect brokerage commissions, or taxes on transactions in Fund shares or that a shareholder would pay on Fund distributions.
| 26 EGA Emerging Global Shares Trust |
EGShares Financials GEMS ETF
|
| Performance as of 3/31/2013 |
| | | |
| | Average Annual Total Return |
| | Fund
Net Asset Value | Fund
Market Price | Dow Jones
Emerging Markets
Financials
Titans 30 IndexSM |
| 1 Year | 10.00% | 10.34% | 10.57% |
| 3 Year | 0.65% | 0.41% | 1.97% |
| Since Inception1 | 4.31% | 4.29% | 4.91% |
Performance data quoted represents past performance. Investment return and principal value of an investment will fluctuate so that an investor’s shares, when sold or redeemed, may be worth more or less than the original cost. Current performance data may be higher or lower than actual data quoted. For the most current month-end performance data please call (888) 800-4347. Fund’s net annual operating expense ratio is 0.85%. Market price returns are based on the mid-point of the highest bid and lowest offer for Fund shares as of the scheduled close of regular trading on the New York Stock Exchange (“NYSE”) Arca, ordinarily 4:00 p.m. Eastern time, on each day during which the NYSE is open for trading, and do not represent the returns an investor would receive if shares were traded at other times. Past performance does not guarantee future results.
|
| Value of a $10,000 Investment Since Inception at Net Asset Value |
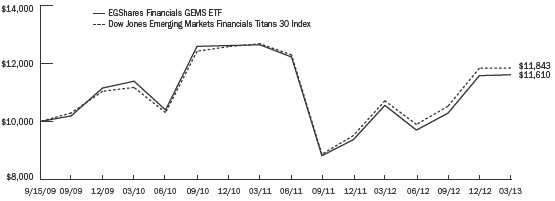
The chart above represents historical performance of a hypothetical investment of $10,000 over the life of the Fund, assuming the reinvestment of distributions. Past performance does not guarantee future results.
| | EGA Emerging Global Shares Trust 27 |
Portfolio Summary (Unaudited)
EGShares GEMS Composite ETF
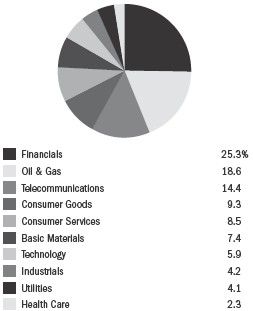
| | |
| Top Ten Holdings* | |
| China Construction Bank Corp. | | 5.0 | % |
| Industrial and Commercial Bank of China, Ltd. | | 4.3 | |
| America Movil SAB de CV | | 4.1 | |
| China Mobile, Ltd. | | 4.1 | |
| Gazprom OAO | | 3.7 | |
| Itau Unibanco Holding SA Preference Shares | | 3.1 | |
| Banco Bradesco SA Preference Shares | | 2.7 | |
| LUKOIL OAO | | 2.5 | |
| Sberbank of Russia | | 2.5 | |
| Companhia de Bebidas das Americas Preference Shares | | 2.4 | |
| * | Expressed as a percentage of total investments in securities as of 3/31/2013. Holdings are subject to change. |
EGShares GEMS Composite ETF (ticker: AGEM)
The Fund’s investment objective is to seek investment results that correspond (before fees and expenses) to the price and yield performance of the Dow Jones Emerging Markets Sector Titans Composite 100 IndexSM (“Sector Underlying Index”). The Sector Underlying Index is comprised of a representative sample of 100 Emerging Markets companies deemed to be the 10 leading companies in each of the 10 “Industries,” as defined by the S&P Dow Jones Indices’ proprietary classification system.
The EGShares GEMS Composite ETF covers the broad emerging markets without exposure to South Korea, Taiwan and Israel, which many other emerging market indices often include. A year ago, we reported that the Fund’s top country exposure was to Brazil, followed by China, Russia, India and South Africa, with their combined allocation comprising roughly 82% of the Fund as of March 31, 2012. As of March 31, 2013, the order shifted to China, Brazil, Russia, South Africa and India, and their combined weight in the portfolio decreased to about 76% of total assets. Interestingly, Mexico gained significant exposure within the Fund over the year, with a 10% allocation as of March 31, 2013 — very close to the allocation to India. The remainder of the Fund’s exposure was dominated by Chile, Indonesia and Malaysia, with other countries each comprising less than 5% of Fund assets. Of the Fund’s largest country exposures, investors should note that Mexico, India and China provided most of the positive contribution to Fund performance while Brazil, Russia and South Africa were the main negative contributors. Strong country specific returns that contributed positively to the Fund were from Thailand and Indonesia, although both countries were small fund allocations. Similarly, the Czech Republic and Egypt were poor performers but also had small allocations in the Fund. By sector, strong performance was observed in financials and consumer stocks while negative performance was evident in energy and materials. Overall, emerging markets underperformed developed markets over the 12-month period ended March 31, 2013, as investors biased portfolios to the perceived safety of domestic markets and especially U.S. Treasuries. Broad U.S. and developed international equity indices had low double-digit returns over the year, while AGEM returned less than 1%. Global markets (U.S., developed international and emerging markets) were quite synchronized in price movement for the first three quarters of the reporting period. However, after the tension of the “fiscal cliff” had abated, U.S. and international developed markets climbed strongly in the first quarter of 2013 while emerging market shares declined.
The EGShares GEMS Composite ETF had a total return of –1.91% at net asset value (“NAV”) for the quarter ended March 31, 2013 and 5.02% annualized return since its inception date of July 22, 2009. The Fund’s NAV had a –1.57% return for the full year ended March 31, 2013.
Emerging market investments involve risk of capital loss from unfavorable fluctuation in currency values, from differences in generally accepted accounting principles, from economic or political instability in other nations or increased volatility and lower trading volume. This Fund will concentrate its investments in issuers of one or more particular industries to the same extent that its underlying index is so concentrated and to the extent permitted by applicable regulatory guidance. Concentration risk results from investing more than 25% of the Fund’s assets in issuers conducting business in the same industry.
Performance Charts
The following performance chart is provided for comparative purposes and represents the periods noted. The Fund’s per share NAV is the value of one share of the Fund and is calculated by dividing the value of total assets less total liabilities by the number of shares outstanding. The NAV return is based on the NAV of the Fund and the market return is based on the market price per share of the Fund. The price used to calculate market price returns is the mid-point of the highest bid and lowest offer for Fund shares as of the close of trading on the exchange where Fund shares are listed. NAV and market returns assume that dividends and capital gain distributions have been reinvested in the Fund at NAV and market price, respectively. As with other ETFs, NAV returns and market price returns may differ because of factors such as the supply and demand for Fund shares and investors’ assessments of the underlying value of a Fund’s portfolio securities. An index is a statistical measure of a specified financial market or sector. An index does not actually hold a portfolio of securities, incur expenses or pay any transaction costs. Therefore index returns do not reflect deductions for fees or expenses and are not available for direct investment. In comparison, the Fund’s performance is negatively impacted by these fees and expenses. Fund returns do not reflect brokerage commissions, or taxes on transactions in Fund shares or that a shareholder would pay on Fund distributions.
| 28 EGA Emerging Global Shares Trust |
EGShares GEMS Composite ETF
|
| Performance as of 3/31/2013 |
| | | |
| | Average Annual Total Return |
| | Fund
Net Asset Value | Fund
Market Price | Dow Jones
Emerging Markets
Sector Titans
Composite 100 IndexSM |
| 1 Year | (1.57)% | (1.36)% | (0.69)% |
| 3 Year | (0.58)% | (0.65)% | 0.88% |
| Since Inception1 | 5.02% | 5.08% | 6.65% |
Performance data quoted represents past performance. Investment return and principal value of an investment will fluctuate so that an investor’s shares, when sold or redeemed, may be worth more or less than the original cost. Current performance data may be higher or lower than actual data quoted. For the most current month-end performance data please call (888) 800-4347. Fund’s net annual operating expense ratio is 0.75%. Market price returns are based on the mid-point of the highest bid and lowest offer for Fund shares as of the scheduled close of regular trading on the New York Stock Exchange (“NYSE”) Arca, ordinarily 4:00 p.m. Eastern time, on each day during which the NYSE is open for trading, and do not represent the returns an investor would receive if shares were traded at other times. Past performance does not guarantee future results.
|
| Value of a $10,000 Investment Since Inception at Net Asset Value |
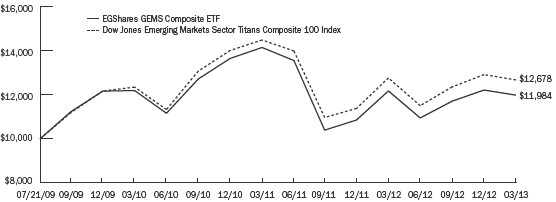
The chart above represents historical performance of a hypothetical investment of $10,000 over the life of the Fund, assuming the reinvestment of distributions. Past performance does not guarantee future results.
| | EGA Emerging Global Shares Trust 29 |
Portfolio Summary (Unaudited)
EGShares Health Care GEMS ETF
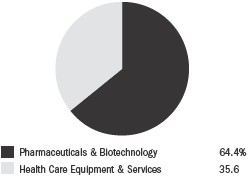
| | |
| Top Ten Holdings* | |
| Aspen Pharmacare Holdings, Ltd. | | 10.2 | % |
| Sun Pharmaceutical Industries, Ltd. | | 9.2 | |
| Life Healthcare Group Holdings, Ltd. | | 6.6 | |
| Mindray Medical International, Ltd. | | 6.0 | |
| Sinopharm Group Co. | | 4.7 | |
| Kalbe Farma TBK PT | | 4.5 | |
| Dr. Reddy’s Laboratories, Ltd. | | 4.4 | |
| Netcare, Ltd. | | 4.4 | |
| Mediclinic International, Ltd. | | 4.3 | |
| Cipla, Ltd. | | 4.2 | |
| * | Expressed as a percentage of total investments in securities as of 3/31/2013. Holdings are subject to change. |
EGShares Health Care GEMS ETF (ticker: HGEM)
The Fund’s investment objective is to seek investment results that correspond (before fees and expenses) to the price and yield performance of the Dow Jones Emerging Markets Health Care Titans 30 IndexSM (“Health Care Underlying Index”). The Health Care Underlying Index is comprised of publicly traded firms in the “Health Care Industry,” as defined by the S&P Dow Jones Indices’ proprietary classification system. The Health Care Underlying Index includes companies whose businesses generally involve: health care equipment and services; and pharmaceuticals and biotechnology.
The EGShares Health Care GEMS ETF is a sector fund that plays the consumption story both in the emerging markets and globally. The Fund’s primary exposures are in pharmaceuticals, biotechs and health care equipment and services companies. Along with such industry bias, the Fund’s geographical breakdown is roughly three-quarters weighted towards India, South Africa and China. Among all EGShares Funds ETFs, HGEM had the highest return for the year ending March 31, 2013. Although falling roughly 10% for the second quarter of 2012, HGEM’s price experienced a nearly perfect upward trend for the subsequent nine months. Strong returns were found not only consistently within the Fund, but also among other health care sector ETFs regardless of geographic focus. Of the Fund’s largest country exposures, investors should note that large positive contributors to Fund performance were primarily from South Africa, India and China due to their significant weights as well as good performance. Even stronger performance was visible in Thailand, Indonesia and Chile, although small allocations minimized their contribution to fund returns. Negative performance came from exposure to Hungary. Given the cautious nature of investors even years after the global financial crisis, it is not surprising that defensive sectors such as consumer staples, utilities and health care were the strongest performers.
The EGShares Health Care GEMS ETF had a total return of 4.97% at net asset value (“NAV”) for the quarter ended March 31, 2013 and 8.52% annualized return since its inception date of June 23, 2011. The Fund’s NAV had a 20.85% return for the full year ended March 31, 2013.
Emerging market investments involve risk of capital loss from unfavorable fluctuation in currency values, from differences in generally accepted accounting principles, from economic or political instability in other nations or increased volatility and lower trading volume. This Fund will concentrate its investments in issuers of one or more particular industries to the same extent that its underlying index is so concentrated and to the extent permitted by applicable regulatory guidance. Concentration risk results from investing more than 25% of the Fund’s assets in issuers conducting business in the same industry.
Performance Charts
The following performance chart is provided for comparative purposes and represents the periods noted. The Fund’s per share NAV is the value of one share of the Fund and is calculated by dividing the value of total assets less total liabilities by the number of shares outstanding. The NAV return is based on the NAV of the Fund and the market return is based on the market price per share of the Fund. The price used to calculate market price returns is the mid-point of the highest bid and lowest offer for Fund shares as of the close of trading on the exchange where Fund shares are listed. NAV and market returns assume that dividends and capital gain distributions have been reinvested in the Fund at NAV and market price, respectively. As with other ETFs, NAV returns and market price returns may differ because of factors such as the supply and demand for Fund shares and investors’ assessments of the underlying value of a Fund’s portfolio securities. An index is a statistical measure of a specified financial market or sector. An index does not actually hold a portfolio of securities, incur expenses or pay any transaction costs. Therefore index returns do not reflect deductions for fees or expenses and are not available for direct investment. In comparison, the Fund’s performance is negatively impacted by these fees and expenses. Fund returns do not reflect brokerage commissions, or taxes on transactions in Fund shares or that a shareholder would pay on Fund distributions.
| 30 EGA Emerging Global Shares Trust |
EGShares Health Care GEMS ETF
|
| Performance as of 3/31/2013 |
| | | |
| | Average Annual Total Return |
| | Fund
Net Asset Value | Fund
Market Price | Dow Jones
Emerging Markets
Health Care
Titans 30 IndexSM |
| 1 Year | 20.85% | 21.66% | 22.63% |
| Since Inception1 | 8.52% | 8.86% | 9.49% |
Performance data quoted represents past performance. Investment return and principal value of an investment will fluctuate so that an investor’s shares, when sold or redeemed, may be worth more or less than the original cost. Current performance data may be higher or lower than actual data quoted. For the most current month-end performance data please call (888) 800-4347. Fund’s net annual operating expense ratio is 0.85%. Market price returns are based on the mid-point of the highest bid and lowest offer for Fund shares as of the scheduled close of regular trading on the New York Stock Exchange (“NYSE”) Arca, ordinarily 4:00 p.m. Eastern time, on each day during which the NYSE is open for trading, and do not represent the returns an investor would receive if shares were traded at other times. Past performance does not guarantee future results.
|
| Value of a $10,000 Investment Since Inception at Net Asset Value |
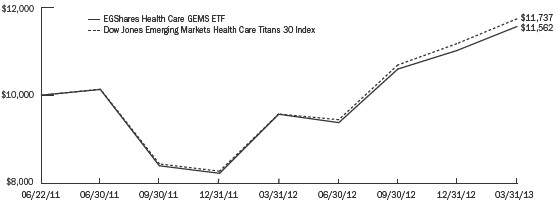
The chart above represents historical performance of a hypothetical investment of $10,000 over the life of the Fund, assuming the reinvestment of distributions. Past performance does not guarantee future results.
| | EGA Emerging Global Shares Trust 31 |
Portfolio Summary (Unaudited)
EGShares India Consumer ETF
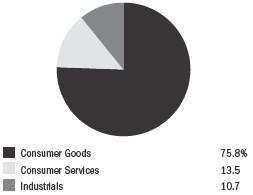
| | |
| Top Ten Holdings* | |
| United Spirits, Ltd. | | 7.3 | % |
| GlaxoSmithKline Consumer Healthcare, Ltd. | | 6.2 | |
| Godrej Consumer Products, Ltd. | | 5.9 | |
| ITC, Ltd. | | 5.8 | |
| Hindustan Unilever, Ltd. | | 5.0 | |
| Nestle India, Ltd. | | 4.9 | |
| Zee Entertainment Enterprises, Ltd. | | 4.8 | |
| Mahindra & Mahindra, Ltd. | | 4.7 | |
| Bajaj Auto, Ltd. | | 4.5 | |
| Hero MotoCorp, Ltd. | | 4.4 | |
| * | Expressed as a percentage of total investments in securities as of 3/31/2013. Holdings are subject to change. |
EGShares India Consumer ETF (ticker: INCO)
The Fund’s investment objective is to seek investment results that correspond (before fees and expenses) to the price and yield performance of the INDXX India Consumer Index (“India Consumer Underlying Index”). The India Consumer Underlying Index is comprised of 30 leading companies that INDXX, LLC determines to be representative of India’s consumer sector. The Fund invests in the constituent companies of the India Consumer Underlying Index, which may include small and medium capitalized companies (“small cap” and “mid cap” companies, respectively), and are generally consumer goods and services companies domiciled in India having a market capitalization of at least $100 million at the time of purchase. India Consumer Underlying Index includes companies whose businesses involve: automobiles and parts; beverages; food production; household goods; leisure goods; personal goods; food and drug retail; general retail; media; travel and leisure; and tobacco.
The EGShares India Consumer ETF focuses on the growth stories of India and its burgeoning consumer base. India, with its large and relatively young population, represents one of the great present and future consumption markets. Although India has been plagued recently with inflation and an inability for policymakers to generate sustained growth, its population still needs to consume the most basic goods and services. As of March 31, 2013, beverages, household products and food producers were the Fund’s largest industry weights at roughly a combined 40% of assets. Of the Fund’s largest industry exposures, investors should note that the largest positive contributors to Fund performance were food and beverage stocks due to large allocations and strong market performance. Other positive contributors were household products and media, although their index weightings were smaller. Auto and consumer services both detracted from Fund performance due more so to large weight in the case of the former and poorer relative performance for the latter. Given that the period from late 2010 to May 2012 provided no sustained bull rally, there was a strong uptrend in broad Indian markets from May 2012 to January 2013. INCO saw a maximum increase (trough to peak) of roughly 53% over this period. This was followed by a slow and steady decline of roughly 13% to March 31, 2013. Overall, of our trio of Indian-focused ETFs, INCO was the clear outperformer for the year with a return of more than 15%. By contrast, our India Small Cap ETF and India Infrastructure ETF were both down double digits over the same period.
The EGShares India Consumer ETF had a total return of –7.84% at net asset value (“NAV”) for the quarter ended March 31, 2013 and 6.26% annualized return since its inception date of August 10, 2011. The Fund’s NAV had a 15.83% return for the full year ended March 31, 2013.
Emerging market investments involve risk of capital loss from unfavorable fluctuation in currency values, from differences in generally accepted accounting principles, from economic or political instability in other nations or increased volatility and lower trading volume. This Fund will concentrate its investments in issuers of one or more particular industries to the same extent that its underlying index is so concentrated and to the extent permitted by applicable regulatory guidance. Concentration risk results from investing more than 25% of the Fund’s assets in issuers conducting business in the same industry. Small cap and mid cap companies generally will have greater volatility in price than the stocks of large companies due to limited product lines or resources or a dependency upon a particular market niche. Because the Fund only invests in Indian securities, its NAV will be much more sensitive to changes in economic, political and other factors within India than would a fund that invested in a greater variety of countries. Special risks include, among others, political and legal uncertainty, persistent religious, ethnic and border disputes, greater government control over the economy, currency fluctuations or blockage and the risk of nationalization or expropriation of assets.
Performance Charts
The following performance chart is provided for comparative purposes and represents the periods noted. The Fund’s per share NAV is the value of one share of the Fund and is calculated by dividing the value of total assets less total liabilities by the number of shares outstanding. The NAV return is based on the NAV of the Fund and the market return is based on the market price per share of the Fund. The price used to calculate market price returns is the mid-point of the highest bid and lowest offer for Fund shares as of the close of trading on the exchange where Fund shares are listed. NAV and market returns assume that dividends and capital gain distributions have been reinvested in the Fund at NAV and market price, respectively. As with other ETFs, NAV returns and market price returns may differ because of factors such as the supply and demand for Fund shares and investors’ assessments of the underlying value of a Fund’s portfolio securities. An index is a statistical measure of a specified financial market or sector. An index does not actually hold a portfolio of securities, incur expenses or pay any transaction costs. Therefore index returns do not reflect deductions for fees or expenses and are not available for direct investment. In comparison, the Fund’s performance is negatively impacted by these fees and expenses. Fund returns do not reflect brokerage commissions, or taxes on transactions in Fund shares or that a shareholder would pay on Fund distributions.
| 32 EGA Emerging Global Shares Trust |
EGShares India Consumer ETF
|
| Performance as of 3/31/2013 |
| | | |
| | Average Annual Total Return |
| | Fund
Net Asset Value | Fund
Market Price | INDXX India
Consumer Index |
| 1 Year | 15.83% | 15.89% | 17.84% |
| Since Inception1 | 6.26% | 6.26% | 7.92% |
Performance data quoted represents past performance. Investment return and principal value of an investment will fluctuate so that an investor’s shares, when sold or redeemed, may be worth more or less than the original cost. Current performance data may be higher or lower than actual data quoted. For the most current month-end performance data please call (888) 800-4347. Fund’s net annual operating expense ratio is 0.89%. Market price returns are based on the mid-point of the highest bid and lowest offer for Fund shares as of the scheduled close of regular trading on the New York Stock Exchange (“NYSE”) Arca, ordinarily 4:00 p.m. Eastern time, on each day during which the NYSE is open for trading, and do not represent the returns an investor would receive if shares were traded at other times. Past performance does not guarantee future results.
|
| Value of a $10,000 Investment Since Inception at Net Asset Value |
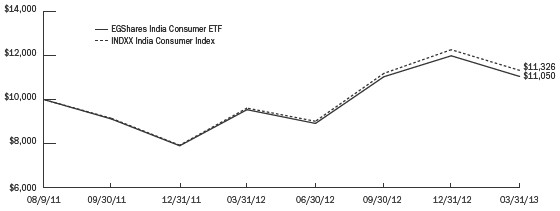
The chart above represents historical performance of a hypothetical investment of $10,000 over the life of the Fund, assuming the reinvestment of distributions. Past performance does not guarantee future results.
| | EGA Emerging Global Shares Trust 33 |
Portfolio Summary (Unaudited)
EGShares India Infrastructure ETF
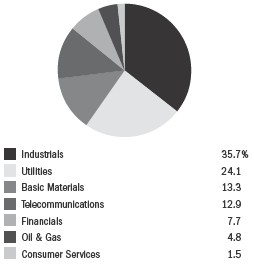
| | |
| Top Ten Holdings* | |
| Bharti Airtel, Ltd. | | 5.9 | % |
| Tata Motors, Ltd. | | 5.5 | |
| Tata Power Co., Ltd. | | 5.3 | |
| DLF, Ltd. | | 5.1 | |
| Larsen & Toubro, Ltd. | | 4.9 | |
| GAIL India, Ltd. | | 4.8 | |
| Ambuja Cements, Ltd. | | 4.8 | |
| Idea Cellular, Ltd. | | 4.8 | |
| Power Grid Corp. of India, Ltd. | | 4.7 | |
| Sterlite Industries India, Ltd. | | 4.6 | |
| * | Expressed as a percentage of total investments in securities as of 3/31/2013. Holdings are subject to change. |
EGShares India Infrastructure ETF (ticker: INXX)
The Fund’s investment objective is to seek investment results that correspond (before fees and expenses) to the price and yield performance of the INDXX India Infrastructure Index (“India Infrastructure Underlying Index”). The India Infrastructure Underlying Index is comprised of 30 leading companies that INDXX, LLC determines to be representative of India’s infrastructure sectors. The Fund invests in Indian large and mid cap infrastructure companies that are included in the India Infrastructure Underlying Index, which are generally defined as companies that are domiciled in India and that have a market capitalization of at least $200 million at the time of purchase.
The EGShares India Infrastructure ETF remains a highly compelling story related to infrastructure. India may be considered an early stage emerging market with further development required to match what is found in the other BRIC (“Brazil, Russia, India, China”) economies especially in regard to basic infrastructure. Such needs include water utilities, large scale hospitals, subway systems, ports and electricity generators and distribution networks. The three largest industry weights as of March 31, 2013 were electricity, mobile telecom and construction & materials. Of the Fund’s industry exposures, all categories contributed to the overall negative performance of the Fund. Utilities, industrials and materials stocks were the largest contributors to negative performance due to a combination of both large weights and poor market performance in all three cases. Energy also had strong negative performance but contribution to the Fund was small due to a lesser allocation. Although the theme of Indian infrastructure is long-term in nature, many investors in such niche emerging market exposures are driven by a shorter time horizon. INXX spent most of the 12-month period ended March 31, 2013 within a price band of $12 to $15. In relative terms, this is a wide channel but given that this is a thematic fund focused on India, one might expect a wide band. Unlike our Indian Consumer Fund that had a more upward sloping curve for the period, both our Indian Infrastructure and Indian Small Cap Funds were more flat if not downward sloping for the period. The market awaits stronger commitments from various branches of the Indian government to bolster fund flows into the infrastructure sector. We believe this Fund remains a favorable long-term investment given the underlying structural factors in India based on demographics and demand.
The EGShares India Infrastructure ETF had a total return of –15.50% at net asset value (“NAV”) for the quarter ended March 31, 2013 and –16.28% annualized return since its inception date of August 11, 2010. The Fund had a –17.08% return for the full year ended March 31, 2013.
Emerging market investments involve risk of capital loss from unfavorable fluctuation in currency values, from differences in generally accepted accounting principles, from economic or political instability in other nations or increased volatility and lower trading volume. This Fund will concentrate its investments in issuers of one or more particular industries to the same extent that its underlying index is so concentrated and to the extent permitted by applicable regulatory guidance. Concentration risk results from investing more than 25% of the Fund’s assets in issuers conducting business in the same industry. Because the Fund only invests in Indian securities, its NAV will be much more sensitive to changes in economic, political and other factors within India than would a fund that invested in a greater variety of countries. Special risks include, among others, political and legal uncertainty, persistent religious, ethnic and border disputes, greater government control over the economy, currency fluctuations or blockage and the risk of nationalization or expropriation of assets.
Performance Charts
The following performance chart is provided for comparative purposes and represents the periods noted. The Fund’s per share NAV is the value of one share of the Fund and is calculated by dividing the value of total assets less total liabilities by the number of shares outstanding. The NAV return is based on the NAV of the Fund and the market return is based on the market price per share of the Fund. The price used to calculate market price returns is the mid-point of the highest bid and lowest offer for Fund shares as of the close of trading on the exchange where Fund shares are listed. NAV and market returns assume that dividends and capital gain distributions have been reinvested in the Fund at NAV and market price, respectively. As with other ETFs, NAV returns and market price returns may differ because of factors such as the supply and demand for Fund shares and investors’ assessments of the underlying value of a Fund’s portfolio securities. An index is a statistical measure of a specified financial market or sector. An index does not actually hold a portfolio of securities, incur expenses or pay any transaction costs. Therefore index returns do not reflect deductions for fees or expenses and are not available for direct investment. In comparison, the Fund’s performance is negatively impacted by these fees and expenses. Fund returns do not reflect brokerage commissions, or taxes on transactions in Fund shares or that a shareholder would pay on Fund distributions.
| 34 EGA Emerging Global Shares Trust |
EGShares India Infrastructure ETF
|
| Performance as of 3/31/2013 |
| | | |
| | Average Annual Total Return |
| | Fund
Net Asset Value | Fund
Market Price | INDXX India
Infrastructure
Index |
| 1 Year | (17.08)% | (16.45)% | (16.94)% |
| Since Inception1 | (16.28)% | (16.23)% | (15.63)% |
Performance data quoted represents past performance. Investment return and principal value of an investment will fluctuate so that an investor’s shares, when sold or redeemed, may be worth more or less than the original cost. Current performance data may be higher or lower than actual data quoted. For the most current month-end performance data please call (888) 800-4347. Fund’s net annual operating expense ratio is 0.85%. Market price returns are based on the mid-point of the highest bid and lowest offer for Fund shares as of the scheduled close of regular trading on the New York Stock Exchange (“NYSE”) Arca, ordinarily 4:00 p.m. Eastern time, on each day during which the NYSE is open for trading, and do not represent the returns an investor would receive if shares were traded at other times. Past performance does not guarantee future results.
|
| Value of a $10,000 Investment Since Inception at Net Asset Value |
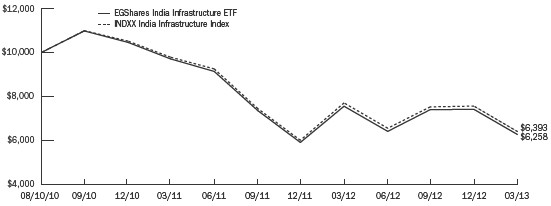
The chart above represents historical performance of a hypothetical investment of $10,000 over the life of the Fund, assuming the reinvestment of distributions. Past performance does not guarantee future results.
| | EGA Emerging Global Shares Trust 35 |
Portfolio Summary (Unaudited)
EGShares India Small Cap ETF
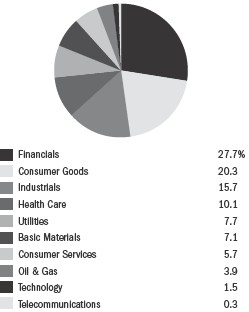
| | |
| Top Ten Holdings* | |
| Federal Bank, Ltd. | | 4.2 | % |
| Apollo Hospitals Enterprise, Ltd. | | 3.8 | |
| Tata Chemicals, Ltd. | | 3.6 | |
| Aditya Birla Nuvo, Ltd. | | 3.5 | |
| Mahindra & Mahindra Financial Services, Ltd. | | 3.4 | |
| Tata Global Beverages, Ltd. | | 3.2 | |
| Exide Industries, Ltd. | | 2.9 | |
| Hindustan Petroleum Corp., Ltd. | | 2.8 | |
| United Phosphorus, Ltd. | | 2.3 | |
| Ashok Leyland, Ltd. | | 2.2 | |
| * | Expressed as a percentage of total investments in securities as of 3/31/2013. Holdings are subject to change. |
EGShares India Small Cap ETF (ticker: SCIN)
The Fund’s investment objective is to seek investment results that correspond (before fees and expenses) to the price and yield performance of the INDXX India Small Cap Index (“India Small Cap Underlying Index”). The India Small Cap Underlying Index is comprised of 75 leading companies that INDXX, LLC determines to be representative of small market cap companies in India. The Fund invests in Indian Small Cap companies that are included in the India Small Cap Underlying Index, which are generally defined as companies that are domiciled in India and are at the bottom end of the group that have a market capitalization of at least $100 million but below $2 billion at the time of purchase.
The EGShares India Small Cap ETF is our play on the booming domestic sector in India. As many large-cap companies earn significant portions of their top line revenues from global operations, small cap companies (regardless of where they are domiciled) normally focus more on the domestic economy. The Indian markets had a relatively strong period leading to March 31, 2013 with an 8-month bull run after a downward trending period that began in late 2010. Given the strong Indian bull market of 2009/10 and the lengthy bearish period thereafter, investors have generally shied away from exposure to India, whether large or small cap, broad or sector-focused. Banks were easily the Fund’s largest sector allocation with more than double the weight of the next largest sectors (chemical, diversified financial services, electrical equipment). Of the Fund’s industry exposures, nearly all categories contributed to the overall negative performance of the Fund. Industrials, financials and consumer stocks were the largest contributors to negative performance due to a combination of both large weights and poor market performance in all three cases. Utilities and energy also had strong negative performance but contribution to the Fund was small due to a lesser allocation. Health care was the only sector with meaningful positive impact to the Fund. SCIN tracked our India Infrastructure ETF to a close degree and both were significant underperformers to our India Consumer ETF, which had the tailwind of being a defensive sector. Most investors heavily biased defensive sectors given their caution over the macro environment. We remain confident that SCIN is a strong position for the long-term oriented investor focused on the Indian growth story.
The EGShares India Small Cap ETF had a total return of –16.11% at net asset value (“NAV”) for the quarter ended March 31, 2013 and –15.23% annualized return since its inception date of July 7, 2010. The Fund had a –12.87% return for the full year ended March 31, 2013.
Emerging market investments involve risk of capital loss from unfavorable fluctuation in currency values, from differences in generally accepted accounting principles, from economic or political instability in other nations or increased volatility and lower trading volume. This Fund will concentrate its investments in issuers of one or more particular industries to the same extent that its underlying index is so concentrated and to the extent permitted by applicable regulatory guidance. Concentration risk results from investing more than 25% of the Fund’s assets in issuers conducting business in the same industry. Because the Fund only invests in Indian securities, its NAV will be much more sensitive to changes in economic, political and other factors within India than would a fund that invested in a greater variety of countries. Special risks include, among others, political and legal uncertainty, persistent religious, ethnic and border disputes, greater government control over the economy, currency fluctuations or blockage and the risk of nationalization or expropriation of assets. Small and medium capitalization companies may have greater volatility in price than the stocks of large capitalization companies due to limited product lines or resources or a dependency upon a particular market niche.
Performance Charts
The following performance chart is provided for comparative purposes and represents the periods noted. The Fund’s per share NAV is the value of one share of the Fund and is calculated by dividing the value of total assets less total liabilities by the number of shares outstanding. The NAV return is based on the NAV of the Fund and the market return is based on the market price per share of the Fund. The price used to calculate market price returns is the mid-point of the highest bid and lowest offer for Fund shares as of the close of trading on the exchange where Fund shares are listed. NAV and market returns assume that dividends and capital gain distributions have been reinvested in the Fund at NAV and market price, respectively. As with other ETFs, NAV returns and market price returns may differ because of factors such as the supply and demand for Fund shares and investors’ assessments of the underlying value of a Fund’s portfolio securities. An index is a statistical measure of a specified financial market or sector. An index does not actually hold a portfolio of securities, incur expenses or pay any transaction costs. Therefore index returns do not reflect deductions for fees or expenses and are not available for direct investment. In comparison, the Fund’s performance is negatively impacted by these fees and expenses. Fund returns do not reflect brokerage commissions, or taxes on transactions in Fund shares or that a shareholder would pay on Fund distributions.
| 36 EGA Emerging Global Shares Trust |
EGShares India Small Cap ETF
|
| Performance as of 3/31/2013 |
| | | |
| | Average Annual Total Return |
| | Fund
Net Asset Value | Fund
Market Price | INDXX India
Small Cap Index |
| 1 Year | (12.87)% | (13.69)% | (12.19)% |
| Since Inception1 | (15.23)% | (15.33)% | (14.38)% |
Performance data quoted represents past performance. Investment return and principal value of an investment will fluctuate so that an investor’s shares, when sold or redeemed, may be worth more or less than the original cost. Current performance data may be higher or lower than actual data quoted. For the most current month-end performance data please call (888) 800-4347. Fund’s net annual operating expense ratio is 0.85%. Market price returns are based on the mid-point of the highest bid and lowest offer for Fund shares as of the scheduled close of regular trading on the New York Stock Exchange (“NYSE”) Arca, ordinarily 4:00 p.m. Eastern time, on each day during which the NYSE is open for trading, and do not represent the returns an investor would receive if shares were traded at other times. Past performance does not guarantee future results.
|
| Value of a $10,000 Investment Since Inception at Net Asset Value |
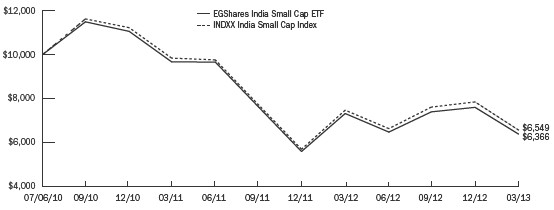
The chart above represents historical performance of a hypothetical investment of $10,000 over the life of the Fund, assuming the reinvestment of distributions. Past performance does not guarantee future results.
| | EGA Emerging Global Shares Trust 37 |
Portfolio Summary (Unaudited)
EGShares Industrials GEMS ETF
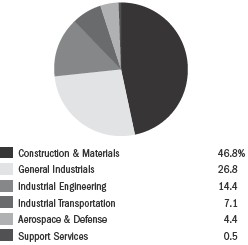
| | |
| Top Ten Holdings* | |
| Cemex SAB de CV | | 10.9 | % |
| Sime Darby Bhd | | 6.1 | |
| Bidvest Group, Ltd. | | 6.0 | |
| Alfa, SAB | | 5.9 | |
| Semen Indonesia Persero Tbk PT | | 4.5 | |
| Embraer SA | | 4.4 | |
| Mahindra & Mahindra, Ltd. | | 4.2 | |
| Imperial Holdings, Ltd. | | 4.1 | |
| Siam Cement PCL | | 4.1 | |
| Tata Motors, Ltd. | | 3.9 | |
| * | Expressed as a percentage of total investments in securities as of 3/31/2013. Holdings are subject to change. |
EGShares Industrials GEMS ETF (ticker: IGEM)
The Fund’s investment objective is to seek investment results that correspond (before fees and expenses) to the price and yield performance of the Dow Jones Emerging Markets Industrials Titans 30 IndexSM (“Industrials Underlying Index”). The Industrials Underlying Index is comprised of publicly traded firms in the “Industrials Industry,” as defined by the S&P Dow Jones Indices’ proprietary classification system. The Industrials Underlying Index includes companies whose businesses generally involve: construction and materials; aerospace and defense; general industrials; electronic and electrical equipment; industrial engineering; industrial transportation; and support services.
The EGShares Industrials GEMS ETF is a fund with a heavy bias to engineering/construction & building material companies. Infrastructure is a key part of the thematic play within this sector Fund, although the manufacturing of cars and airplanes are also components. In last year’s report, we stated that India and China were the Fund’s largest country weights, covering nearly half the portfolio by assets. As of March 31, 2013, China was the largest allocation (roughly 23%), with Mexico and India close behind at roughly 19% and 15% respectively. Indonesia and South Africa were the next largest country exposures. Within these country exposures, investors should note that large positive contributors to Fund performance were primarily from Mexico and South Africa due to their significant weights as well as good performance. Stronger performance was visible in Thailand, Colombia and the Philippines, however allocations were small so contribution to Fund performance was small. Negative performance came from India primarily due to its large allocation but also from Egypt more due to poor performance in its case. To highlight a specific holding, Cemex has been a consistently large position in the Fund. This Mexican company is the world’s largest building materials supplier and producer of cement. Cemex had a roughly 140% return from its low in June 2012 to its high in March 2013. With returns that have been similar to those of the broad global emerging market indices since inception, IGEM was one of our stronger performing funds over the 12-month period ended March 31, 2013.
The EGShares Industrials GEMS ETF had a total return of 0.69% at net asset value (“NAV”) for the quarter ended March 31, 2013 and 1.97% annualized return since its inception date of June 23, 2011. The Fund’s NAV had a 10.00% return for the full year ended March 31, 2013.
Emerging market investments involve risk of capital loss from unfavorable fluctuation in currency values, from differences in generally accepted accounting principles, from economic or political instability in other nations or increased volatility and lower trading volume. This Fund will concentrate its investments in issuers of one or more particular industries to the same extent that its underlying index is so concentrated and to the extent permitted by applicable regulatory guidance. Concentration risk results from investing more than 25% of the Fund’s assets in issuers conducting business in the same industry.
Performance Charts
The following performance chart is provided for comparative purposes and represents the periods noted. The Fund’s per share NAV is the value of one share of the Fund and is calculated by dividing the value of total assets less total liabilities by the number of shares outstanding. The NAV return is based on the NAV of the Fund and the market return is based on the market price per share of the Fund. The price used to calculate market price returns is the mid-point of the highest bid and lowest offer for Fund shares as of the close of trading on the exchange where Fund shares are listed. NAV and market returns assume that dividends and capital gain distributions have been reinvested in the Fund at NAV and market price, respectively. As with other ETFs, NAV returns and market price returns may differ because of factors such as the supply and demand for Fund shares and investors’ assessments of the underlying value of a Fund’s portfolio securities. An index is a statistical measure of a specified financial market or sector. An index does not actually hold a portfolio of securities, incur expenses or pay any transaction costs. Therefore index returns do not reflect deductions for fees or expenses and are not available for direct investment. In comparison, the Fund’s performance is negatively impacted by these fees and expenses. Fund returns do not reflect brokerage commissions, or taxes on transactions in Fund shares or that a shareholder would pay on Fund distributions.
| 38 EGA Emerging Global Shares Trust |
EGShares Industrials GEMS ETF
|
| Performance as of 3/31/2013 |
| | | |
| | Average Annual Total Return |
| | Fund
Net Asset Value | Fund
Market Price | Dow Jones
Emerging Markets
Industrials
Titans 30 IndexSM |
| 1 Year | 10.00% | 12.85% | 10.61% |
| Since Inception1 | 1.97% | 2.37% | 2.73% |
Performance data quoted represents past performance. Investment return and principal value of an investment will fluctuate so that an investor’s shares, when sold or redeemed, may be worth more or less than the original cost. Current performance data may be higher or lower than actual data quoted. For the most current month-end performance data please call (888) 800-4347. Fund’s net annual operating expense ratio is 0.85%. Market price returns are based on the mid-point of the highest bid and lowest offer for Fund shares as of the scheduled close of regular trading on the New York Stock Exchange (“NYSE”) Arca, ordinarily 4:00 p.m. Eastern time, on each day during which the NYSE is open for trading, and do not represent the returns an investor would receive if shares were traded at other times. Past performance does not guarantee future results.
|
| Value of a $10,000 Investment Since Inception at Net Asset Value |
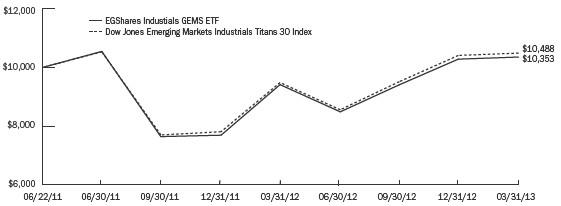
The chart above represents historical performance of a hypothetical investment of $10,000 over the life of the Fund, assuming the reinvestment of distributions. Past performance does not guarantee future results.
| | EGA Emerging Global Shares Trust 39 |
Portfolio Summary (Unaudited)
EGShares Low Volatility Emerging Markets Dividend ETF
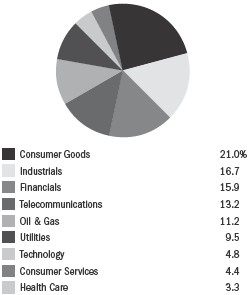
| | |
| Top Ten Holdings* | |
| Turk Traktor ve Ziraat Makineleri AS | | 5.7 | % |
| Maxis BHD | | 5.0 | |
| Grupo Modelo SAB de CV | | 4.8 | |
| Shin Corp. PCL | | 4.8 | |
| Redefine Properties Ltd. | | 4.8 | |
| Vodacom Group, Ltd. | | 4.6 | |
| Lewis Group Ltd. | | 4.4 | |
| Growthpoint Properties Ltd. | | 4.4 | |
| DiGi.Com BHD | | 3.6 | |
| LUKOIL OAO | | 3.6 | |
| * | Expressed as a percentage of total investments in securities as of 3/31/2013. Holdings are subject to change. |
EGShares Low Volatility Emerging Markets Dividend ETF (ticker: HILO)
The Fund’s investment objective is to seek investment results that correspond (before fees and expenses) to the price and yield performance of the INDXX Emerging Market High Income Low Beta Index (“HILB Underlying Index”). The HILB Underlying Index is a dividend yield weighted stock market index comprised of a representative sample of 30 emerging markets companies that INDXX, LLC determines to have lower relative volatility (i.e., low beta) than the broad market benchmark indices of the local exchanges in which the component securities trade and have also paid dividends consistently over the last three years. The Fund invests in the constituent companies of the HILB Underlying Index, which may include small and medium capitalized companies (“small cap” and “mid cap” companies, respectively), domiciled in emerging markets countries having a market capitalization of at least $250 million.
The EGShares Low Volatility Emerging Markets Dividend GEMS ETF is our firm’s only fund that focuses its weighting methodology on dividends and volatility management rather than market capitalization. For investors looking to have greater levels of certainty regarding overall total return via a base of dividend income, this Fund does provide such exposure. Furthermore, for investors concerned with traditionally high levels of security specific volatility, the methodology of HILO also takes this into account. Country exposures are well diversified with South Africa, Turkey, Mexico and Malaysia being the largest weights, each representing more than 10% of Fund assets as of March 31, 2013. Five other emerging market economies had exposures ranging from roughly 10% to 3%. Of the Fund’s largest country exposures, investors should note that Turkey, Mexico and China provided most of the positive contribution to Fund performance while Brazil and South Africa were the main negative contributors. Strong country-specific returns which contributed positively to the Fund were also from Indonesia and the Philippines, although both countries were small fund allocations. Similarly, Poland and Hungary were poor performers but also had small allocations in the fund. By sector, strong performance was observed in financials, industrials and consumer stocks and to some degree from health care which, was the top performing sector but also the smallest sector allocation. Negative performance was evident mainly in telecom and materials. As with country exposures, sectors are well diversified with telecom and energy in particular having large allocations. Since inception, HILO has outperformed the global emerging market benchmarks and in the 12-month period ending March 31, 2013, the differential versus the MSCI Emerging Market Index has increased. However, in terms of volatility (as measured by standard deviation), HILO did have lower levels versus EM benchmarks and has been more similar to U.S. benchmarks. HILO is our firm’s second largest fund and at time of writing is nearly $100MM in asset size.
The EGShares Low Volatility Emerging Markets Dividend GEMS ETF had a total return of –0.50% at net asset value (“NAV”) for the quarter ended March 31, 2013 and 3.97% annualized return since its inception date of August 4, 2011. The Fund’s NAV had a 4.12% return for the full year ended March 31, 2013.
Emerging market investments involve risk of capital loss from unfavorable fluctuation in currency values, from differences in generally accepted accounting principles, from economic or political instability in other nations or increased volatility and lower trading volume. This Fund will concentrate its investments in issuers of one or more particular industries to the same extent that its underlying index is so concentrated and to the extent permitted by applicable regulatory guidance. Concentration risk results from investing more than 25% of the Fund’s assets in issuers conducting business in the same industry.
Performance Charts
The following performance chart is provided for comparative purposes and represents the periods noted. The Fund’s per share NAV is the value of one share of the Fund and is calculated by dividing the value of total assets less total liabilities by the number of shares outstanding. The NAV return is based on the NAV of the Fund and the market return is based on the market price per share of the Fund. The price used to calculate market price returns is the mid-point of the highest bid and lowest offer for Fund shares as of the close of trading on the exchange where Fund shares are listed. NAV and market returns assume that dividends and capital gain distributions have been reinvested in the Fund at NAV and market price, respectively. As with other ETFs, NAV returns and market price returns may differ because of factors such as the supply and demand for Fund shares and investors’ assessments of the underlying value of a Fund’s portfolio securities. An index is a statistical measure of a specified financial market or sector. An index does not actually hold a portfolio of securities, incur expenses or pay any transaction costs. Therefore index returns do not reflect deductions for fees or expenses and are not available for direct investment. In comparison, the Fund’s performance is negatively impacted by these fees and expenses. Fund returns do not reflect brokerage commissions, or taxes on transactions in Fund shares or that a shareholder would pay on Fund distributions.
| 40 EGA Emerging Global Shares Trust |
EGShares Low Volatility Emerging Markets Dividend ETF
|
| Performance as of 3/31/2013 |
| | | |
| | Average Annual Total Return |
| | Fund
Net Asset Value | Fund
Market Price | INDXX
Emerging Market
High Income
Low Beta Index |
| 1 Year | 4.12% | 4.33% | 5.26% |
| Since Inception1 | 3.97% | 4.30% | 5.52% |
Performance data quoted represents past performance. Investment return and principal value of an investment will fluctuate so that an investor’s shares, when sold or redeemed, may be worth more or less than the original cost. Current performance data may be higher or lower than actual data quoted. For the most current month-end performance data please call (888) 800-4347. Fund’s net annual operating expense ratio is 0.85%. Market price returns are based on the mid-point of the highest bid and lowest offer for Fund shares as of the scheduled close of regular trading on the New York Stock Exchange (“NYSE”) Arca, ordinarily 4:00 p.m. Eastern time, on each day during which the NYSE is open for trading, and do not represent the returns an investor would receive if shares were traded at other times. Past performance does not guarantee future results.
|
| Value of a $10,000 Investment Since Inception at Net Asset Value |
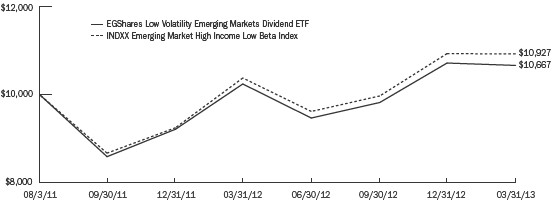
The chart above represents historical performance of a hypothetical investment of $10,000 over the life of the Fund, assuming the reinvestment of distributions. Past performance does not guarantee future results.
| | EGA Emerging Global Shares Trust 41 |
Portfolio Summary (Unaudited)
EGShares Technology GEMS ETF
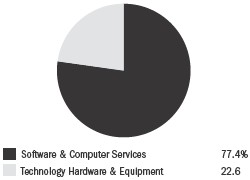
| | |
| Top Ten Holdings* | |
| Tencent Holdings Ltd. | | 9.3 | % |
| Infosys, Ltd. | | 9.0 | |
| Baidu, Inc. | | 8.4 | |
| Tata Consultancy Services, Ltd. | | 7.3 | |
| Lenovo Group, Ltd. | | 4.9 | |
| Wipro, Ltd. | | 4.7 | |
| NetEase.com, Inc. | | 4.5 | |
| SINA Corp. | | 3.6 | |
| Shin Corp. PCL | | 3.3 | |
| Satyam Computer Services, Ltd. | | 3.3 | |
| * | Expressed as a percentage of total investments in securities as of 3/31/2013. Holdings are subject to change. |
EGShares Technology GEMS ETF (ticker: QGEM)
The Fund’s investment objective is to seek investment results that correspond (before fees and expenses) to the price and yield performance of the Dow Jones Emerging Markets Technology Titans 30 IndexSM (“Technology Underlying Index”). The Technology Underlying Index is comprised of publicly traded firms in the “Technology Industry,” as defined by the S&P Dow Jones Indices’ proprietary classification system. The Technology Underlying Index includes companies whose businesses generally involve: software and computer services; and technology hardware and equipment.
The EGShares Technology GEMS ETF is a cyclical sector play within the broader emerging markets. With one of the most extreme country biases, QGEM’s largest weightings are in China and India with a combined weight of just over 80% of Fund assets as of March 31, 2013. All other country weights were less than 5% as of that date. Of the Fund’s country exposures, investors should note that the largest negative contributor to Fund performance was China primarily due to its large weight in the Fund. Although smaller in allocation, due to poor market performance, Poland and Russia also contributed negatively to the fund. Significant positive performance was visible from positions in Turkey, Indonesia and Thailand although contribution to Fund performance was minimal due to small allocations. India had positive performance albeit very small so despite its large allocation, its contribution to Fund performance was minimal. Industry bias within the Fund was heavy towards internet and computer hardware at roughly two-thirds of the Fund. QGEM does not hold the Korean or Taiwanese tech names that tend to represent large weights within most emerging market funds. To highlight a company holding, Tencent Holdings Ltd provides media, entertainment, internet and phone services as well as online advertising. As China’s largest internet portal, it is the world’s third largest internet company after Google and Amazon. Like SINA and Baidu, both also holdings in QGEM, the focus is almost entirely on the Chinese consumer. Although an average performer for the 12-month period ended March 31, 2013, QGEM was the best performer in the final 3-months of this period.
The EGShares Technology GEMS ETF had a total return of 6.44% at net asset value (“NAV”) for the quarter ended March 31, 2013 and –5.09% annualized return since its inception date of June 23, 2011. The Fund’s NAV had a –3.45% return for the full year ended March 31, 2013.
Emerging market investments involve risk of capital loss from unfavorable fluctuation in currency values, from differences in generally accepted accounting principles, from economic or political instability in other nations or increased volatility and lower trading volume. This Fund will concentrate its investments in issuers of one or more particular industries to the same extent that its underlying index is so concentrated and to the extent permitted by applicable regulatory guidance. Concentration risk results from investing more than 25% of the Fund’s assets in issuers conducting business in the same industry.
Performance Charts
The following performance chart is provided for comparative purposes and represents the periods noted. The Fund’s per share NAV is the value of one share of the Fund and is calculated by dividing the value of total assets less total liabilities by the number of shares outstanding. The NAV return is based on the NAV of the Fund and the market return is based on the market price per share of the Fund. The price used to calculate market price returns is the mid-point of the highest bid and lowest offer for Fund shares as of the close of trading on the exchange where Fund shares are listed. NAV and market returns assume that dividends and capital gain distributions have been reinvested in the Fund at NAV and market price, respectively. As with other ETFs, NAV returns and market price returns may differ because of factors such as the supply and demand for Fund shares and investors’ assessments of the underlying value of a Fund’s portfolio securities. An index is a statistical measure of a specified financial market or sector. An index does not actually hold a portfolio of securities, incur expenses or pay any transaction costs. Therefore index returns do not reflect deductions for fees or expenses and are not available for direct investment. In comparison, the Fund’s performance is negatively impacted by these fees and expenses. Fund returns do not reflect brokerage commissions, or taxes on transactions in Fund shares or that a shareholder would pay on Fund distributions.
| 42 EGA Emerging Global Shares Trust |
EGShares Technology GEMS ETF
|
| Performance as of 3/31/2013 |
| | | |
| | Average Annual Total Return |
| | Fund
Net Asset Value | Fund
Market Price | Dow Jones
Emerging Markets
Technology
Titans 30 IndexSM |
| 1 Year | (3.45)% | (3.56)% | (2.25)% |
| Since Inception1 | (5.09)% | (5.09)% | (3.61)% |
Performance data quoted represents past performance. Investment return and principal value of an investment will fluctuate so that an investor’s shares, when sold or redeemed, may be worth more or less than the original cost. Current performance data may be higher or lower than actual data quoted. For the most current month-end performance data please call (888) 800-4347. Fund’s net annual operating expense ratio is 0.85%. Market price returns are based on the mid-point of the highest bid and lowest offer for Fund shares as of the scheduled close of regular trading on the New York Stock Exchange (“NYSE”) Arca, ordinarily 4:00 p.m. Eastern time, on each day during which the NYSE is open for trading, and do not represent the returns an investor would receive if shares were traded at other times. Past performance does not guarantee future results.
|
| Value of a $10,000 Investment Since Inception at Net Asset Value |
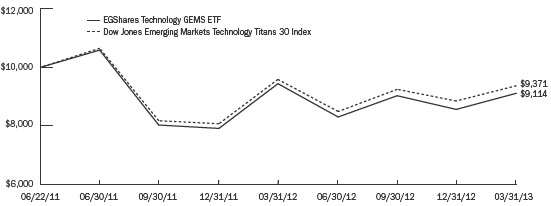
The chart above represents historical performance of a hypothetical investment of $10,000 over the life of the Fund, assuming the reinvestment of distributions. Past performance does not guarantee future results.
| | EGA Emerging Global Shares Trust 43 |
Portfolio Summary (Unaudited)
EGShares Telecom GEMS ETF
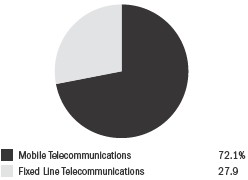
| | |
| Top Ten Holdings* | |
| China Mobile, Ltd. | | 10.1 | % |
| America Movil SAB de CV | | 9.5 | |
| MTN Group, Ltd. | | 6.6 | |
| Telekomunikasi Indonesia Tbk PT | | 5.2 | |
| Mobile TeleSystems | | 4.5 | |
| Advanced Info Service PCL | | 4.5 | |
| Telefonica Brasil SA Preference Shares | | 3.7 | |
| Axiata Group BHD | | 3.7 | |
| China Telecom Corp., Ltd. | | 3.5 | |
| Rostelecom OJSC | | 3.5 | |
| * | Expressed as a percentage of total investments in securities as of 3/31/2013. Holdings are subject to change. |
EGShares Telecom GEMS ETF (ticker: TGEM)
The Fund’s investment objective is to seek investment results that correspond (before fees and expenses) to the price and yield performance of the Dow Jones Emerging Markets Telecommunications Titans 30 IndexSM (“Telecom Underlying Index”). The Telecom Underlying Index is comprised of publicly traded firms in the “Telecommunications Industry,” as defined by the S&P Dow Jones Indices’ proprietary classification system. The Telecom Underlying Index includes companies whose businesses generally involve: fixed line telecommunications and mobile telecommunications.
The EGShares Telecom GEMS ETF can be seen as a play on what our firm believes are the two biggest themes in emerging market investing: consumption and infrastructure. The ability to gather information and consume via a mobile device can be as common in an emerging market as it is here in the U.S. Due to this ability to easily consume beyond a “bricks and mortar” establishment, the cellphone tower and other components that come from telecom companies can also be considered essential infrastructure. Similar to the flow of oil through a pipeline or power through a grid, the flow of voice or data (as a form of capital) allows for a more modern economy. Within individual emerging markets, the telecom industry tends to be dominated by a few names. Thus, as is typical in global utility funds, TGEM has relatively large names yet is well diversified across many countries. No country in TGEM has more than a 20% weight. China, Malaysia, Russia and South Africa are the largest country exposures, all with more than 10% weight. However Mexico, Brazil, Thailand, Turkey and Indonesia each represent more than 5% of Fund assets. Within the Fund’s largest country exposures, investors should note that large negative contributors to fund performance were primarily from Mexico, China and South Africa. Brazil, Poland, India and several other countries also contributed negatively to the Fund but more due to their poor performance than their weights. Significant positive performance was visible from various countries but especially in Malaysia due to its large weight and good performance. However, even stronger positive performance was visible in Thailand, Indonesia, Turkey and other countries although contribution to fund performance was less due to small allocations. Since inception, TGEM has generally outperformed or been in line with the broad global emerging market indices, demonstrating properties similar to those of a lower beta index versus the benchmark.
The EGShares Telecom GEMS ETF had a total return of –3.07% at net asset value (“NAV”) for the quarter ended March 31, 2013 and 1.13% annualized return since its inception date of June 23, 2011. The Fund’s NAV had a –0.21% return for the full year ended March 31, 2013.
Emerging market investments involve risk of capital loss from unfavorable fluctuation in currency values, from differences in generally accepted accounting principles, from economic or political instability in other nations or increased volatility and lower trading volume. This Fund will concentrate its investments in issuers of one or more particular industries to the same extent that its underlying index is so concentrated and to the extent permitted by applicable regulatory guidance. Concentration risk results from investing more than 25% of the Fund’s assets in issuers conducting business in the same industry.
Performance Charts
The following performance chart is provided for comparative purposes and represents the periods noted. The Fund’s per share NAV is the value of one share of the Fund and is calculated by dividing the value of total assets less total liabilities by the number of shares outstanding. The NAV return is based on the NAV of the Fund and the market return is based on the market price per share of the Fund. The price used to calculate market price returns is the mid-point of the highest bid and lowest offer for Fund shares as of the close of trading on the exchange where Fund shares are listed. NAV and market returns assume that dividends and capital gain distributions have been reinvested in the Fund at NAV and market price, respectively. As with other ETFs, NAV returns and market price returns may differ because of factors such as the supply and demand for Fund shares and investors’ assessments of the underlying value of a Fund’s portfolio securities. An index is a statistical measure of a specified financial market or sector. An index does not actually hold a portfolio of securities, incur expenses or pay any transaction costs. Therefore index returns do not reflect deductions for fees or expenses and are not available for direct investment. In comparison, the Fund’s performance is negatively impacted by these fees and expenses. Fund returns do not reflect brokerage commissions, or taxes on transactions in Fund shares or that a shareholder would pay on Fund distributions.
| 44 EGA Emerging Global Shares Trust |
EGShares Telecom GEMS ETF
|
| Performance as of 3/31/2013 |
| | | |
| | Average Annual Total Return |
| | Fund
Net Asset Value | Fund
Market Price | Dow Jones
Emerging Markets
Telecommunications
Titans 30 IndexSM |
| 1 Year | (0.21)% | (1.71)% | 0.29% |
| Since Inception1 | 1.13% | 1.05% | 1.48% |
Performance data quoted represents past performance. Investment return and principal value of an investment will fluctuate so that an investor’s shares, when sold or redeemed, may be worth more or less than the original cost. Current performance data may be higher or lower than actual data quoted. For the most current month-end performance data please call (888) 800-4347. Fund’s net annual operating expense ratio is 0.85%. Market price returns are based on the mid-point of the highest bid and lowest offer for Fund shares as of the scheduled close of regular trading on the New York Stock Exchange (“NYSE”) Arca, ordinarily 4:00 p.m. Eastern time, on each day during which the NYSE is open for trading, and do not represent the returns an investor would receive if shares were traded at other times. Past performance does not guarantee future results.
|
| Value of a $10,000 Investment Since Inception at Net Asset Value |
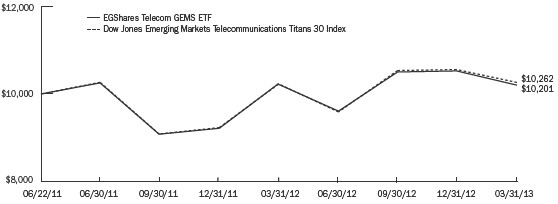
The chart above represents historical performance of a hypothetical investment of $10,000 over the life of the Fund, assuming the reinvestment of distributions. Past performance does not guarantee future results.
| | EGA Emerging Global Shares Trust 45 |
Portfolio Summary (Unaudited)
EGShares Utilities GEMS ETF
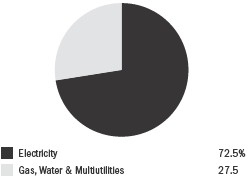
| | |
| Top Ten Holdings* | |
| Ultrapar Participacoes SA | | 9.0 | % |
| Perusahaan Gas Negara PT | | 6.4 | |
| Enersis SA | | 6.1 | |
| Companhia Energetica de Minas Gerais Preference Shares | | 5.5 | |
| Companhia de Saneamento Basico do Estado de Sao Paulo | | 5.3 | |
| China Resources Power Holdings Co., Ltd. | | 4.9 | |
| Tenaga Nasional BHD | | 4.9 | |
| CEZ AS | | 4.9 | |
| Empresa Nacional de Electricidad SA | | 4.8 | |
| PGE SA | | 4.0 | |
| * | Expressed as a percentage of total investments in securities as of 3/31/2013. Holdings are subject to change. |
EGShares Utilities GEMS ETF (ticker: UGEM)
The Fund’s investment objective is to seek investment results that correspond (before fees and expenses) to the price and yield performance of the Dow Jones Emerging Markets Utilities Titans 30 IndexSM (“Utilities Underlying Index”). The Utilities Underlying Index is comprised of publicly traded firms in the “Utilities Industry,” as defined by the S&P Dow Jones Indices’ proprietary classification system. The Utilities Underlying Index includes companies whose businesses generally involve: electricity; and gas, water and multi-utilities.
The EGShares Utilities GEMS ETF is a direct play on the electricity, gas, water and multi-utility companies within the developing world. In many ways, it is also a play on local infrastructure within emerging markets. Heavily weighted to Brazil, Chile and India as of March 31, 2013, this Fund provides exposure to several other emerging economies. Since the services within the companies of UGEM are provided locally, this is also an effective consumer play. Although in the developed world the utility sector is considered defensive and statistically a low volatility exposure as measured by beta, UGEM has performed very similarly to global emerging market benchmarks since its inception — both on the upside and downside. During the reporting period, large negative contributors to Fund performance were primarily from Brazil and India. Russia, Czech Republic and Colombia also contributed negatively to the Fund but less due to their weights than due to poor performance. Significant positive contribution to Fund performance was visible from China, Indonesia and the Philippines due to their large allocations and strong returns. However, in all cases they were relatively small allocations to the Fund. One of the Fund’s largest holdings has consistently been Ultrapar Participacoes, a Brazilian holding company that includes a gas distribution company, petrochemical company, oil/gas storage company and energy transportation company. Other holdings in UGEM likewise cover the utility complex for an entire country or countries within the region.
The EGShares Utilities GEMS ETF had a total return of 2.74% at net asset value (“NAV”) for the quarter ended March 31, 2013 and –5.40% annualized return since its inception date of June 23, 2011. The Fund’s NAV had a –3.72% return for the full year ended March 31, 2013.
Emerging market investments involve risk of capital loss from unfavorable fluctuation in currency values, from differences in generally accepted accounting principles, from economic or political instability in other nations or increased volatility and lower trading volume. This Fund will concentrate its investments in issuers of one or more particular industries to the same extent that its underlying index is so concentrated and to the extent permitted by applicable regulatory guidance. Concentration risk results from investing more than 25% of the Fund’s assets in issuers conducting business in the same industry.
Performance Charts
The following performance chart is provided for comparative purposes and represents the periods noted. The Fund’s per share NAV is the value of one share of the Fund and is calculated by dividing the value of total assets less total liabilities by the number of shares outstanding. The NAV return is based on the NAV of the Fund and the market return is based on the market price per share of the Fund. The price used to calculate market price returns is the mid-point of the highest bid and lowest offer for Fund shares as of the close of trading on the exchange where Fund shares are listed. NAV and market returns assume that dividends and capital gain distributions have been reinvested in the Fund at NAV and market price, respectively. As with other ETFs, NAV returns and market price returns may differ because of factors such as the supply and demand for Fund shares and investors’ assessments of the underlying value of a Fund’s portfolio securities. An index is a statistical measure of a specified financial market or sector. An index does not actually hold a portfolio of securities, incur expenses or pay any transaction costs. Therefore index returns do not reflect deductions for fees or expenses and are not available for direct investment. In comparison, the Fund’s performance is negatively impacted by these fees and expenses. Fund returns do not reflect brokerage commissions, or taxes on transactions in Fund shares or that a shareholder would pay on Fund distributions.
| 46 EGA Emerging Global Shares Trust |
EGShares Utilities GEMS ETF
|
| Performance as of 3/31/2013 |
| | | |
| | Average Annual Total Return |
| | Fund
Net Asset Value | Fund
Market Price | Dow Jones
Emerging Markets
Utilities
Titans 30 IndexSM |
| 1 Year | (3.72)% | (3.92)% | (2.10)% |
| Since Inception1 | (5.40)% | (5.45)% | (3.88)% |
Performance data quoted represents past performance. Investment return and principal value of an investment will fluctuate so that an investor’s shares, when sold or redeemed, may be worth more or less than the original cost. Current performance data may be higher or lower than actual data quoted. For the most current month-end performance data please call (888) 800-4347. Fund’s net annual operating expense ratio 0.85%. Market price returns are based on the mid-point of the highest bid and lowest offer for Fund shares as of the scheduled close of regular trading on the New York Stock Exchange (“NYSE”) Arca, ordinarily 4:00 p.m. Eastern time, on each day during which the NYSE is open for trading, and do not represent the returns an investor would receive if shares were traded at other times. Past performance does not guarantee future results.
|
| Value of a $10,000 Investment Since Inception at Net Asset Value |
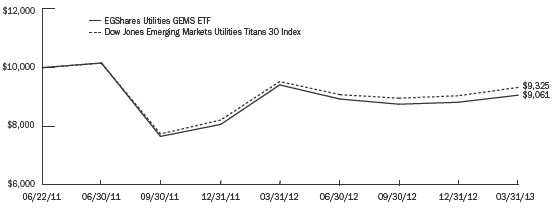
The chart above represents historical performance of a hypothetical investment of $10,000 over the life of the Fund, assuming the reinvestment of distributions. Past performance does not guarantee future results.
| | EGA Emerging Global Shares Trust 47 |
Shareholder Expense Examples (Unaudited)
As a shareholder of an EGA EGShares Funds Trust ETF, you incur advisory fees and other Fund expenses. The following example is intended to help you understand your ongoing costs (in dollars and cents) of investing in a Fund and to compare these costs with the ongoing costs of investing in other funds. The example is based on an investment of $1,000 invested at the beginning of the period and held throughout the entire period (October 1, 2012 to March 31, 2013).
Actual expenses
The first line under each Fund in the table below provides information about actual account values and actual expenses. You may use the information in this line, together with the amount you invested, to estimate the expenses that you paid over the period. Simply divide your account value by $1,000 (for example, an $8,600 account value divided by $1,000 = 8.6), then multiply the result by the number in the first line for your Fund under the heading entitled “Expenses Paid Through 3/31/2013” to estimate the expenses you paid on your account during this period.
Hypothetical example for comparison purposes
The second line under each Fund in the table provides information about hypothetical account values and hypothetical expenses based on each Fund’s actual expense ratio and an assumed rate of return of 5% per year before expenses, which is not the Fund’s actual return. The hypothetical account values and expenses may not be used to estimate the actual ending account balance or expenses you paid for the period. You may use this information to compare the ongoing costs of investing in your Fund and other funds. To do so, compare this 5% hypothetical example with the 5% hypothetical examples that appear in the shareholder reports of the other funds.
Please note that the expenses shown in the table are meant to highlight your ongoing costs only and do not reflect any transactional costs, such as brokerage commissions paid on purchases and sales of Fund shares. Therefore, the second line under each Fund in the table is useful in comparing ongoing Fund costs only and will not help you determine the relative total costs of owning different funds. In addition, if these transactional costs were included, your costs would have been higher.
| 48 EGA Emerging Global Shares Trust |
Shareholder Expense Examples (Unaudited) (continued)
| | | | |
| | Beginning
Account Value
10/1/2012 | Ending
Account Value
3/31/2013 | Annualized
Expense Ratios
for the Period | Expenses Paid
Through
3/31/20131 |
| EGShares Basic Materials GEMS ETF (Consolidated)2 | | | | |
| Actual | $1,000.00 | $ 897.23 | 0.85% | $4.02 |
| Hypothetical (5% return before expenses) | $1,000.00 | $1,020.69 | 0.85% | $4.28 |
| EGShares Beyond BRICs ETF | | | | |
| Actual | $1,000.00 | $1,074.01 | 0.85% | $4.40 |
| Hypothetical (5% return before expenses) | $1,000.00 | $1,020.69 | 0.85% | $4.28 |
| EGShares Brazil Infrastructure ETF | | | | |
| Actual | $1,000.00 | $1,053.92 | 0.85% | $4.35 |
| Hypothetical (5% return before expenses) | $1,000.00 | $1,020.69 | 0.85% | $4.28 |
| EGShares China Infrastructure ETF | | | | |
| Actual | $1,000.00 | $1,100.41 | 0.85% | $4.45 |
| Hypothetical (5% return before expenses) | $1,000.00 | $1,020.69 | 0.85% | $4.28 |
| EGShares Consumer Goods GEMS ETF (Consolidated)2 | | | | |
| Actual | $1,000.00 | $1,098.38 | 0.85% | $4.45 |
| Hypothetical (5% return before expenses) | $1,000.00 | $1,020.69 | 0.85% | $4.28 |
| EGShares Consumer Services GEMS ETF | | | | |
| Actual | $1,000.00 | $1,079.96 | 0.85% | $4.41 |
| Hypothetical (5% return before expenses) | $1,000.00 | $1,020.69 | 0.85% | $4.28 |
| EGShares Emerging Markets Consumer ETF (Consolidated)2 | | | | |
| Actual | $1,000.00 | $1,090.48 | 0.85% | $4.43 |
| Hypothetical (5% return before expenses) | $1,000.00 | $1,020.69 | 0.85% | $4.28 |
| EGShares Emerging Markets Core ETF (Consolidated)2 | | | | |
| Actual | $1,000.00 | $1,045.54 | 0.70% | $3.28 |
| Hypothetical (5% return before expenses) | $1,000.00 | $1,021.44 | 0.70% | $3.53 |
| EGShares Emerging Markets Domestic Demand ETF (Consolidated)2 | | | |
| Actual | $1,000.00 | $1,083.05 | 0.85% | $4.41 |
| Hypothetical (5% return before expenses) | $1,000.00 | $1,020.69 | 0.85% | $4.28 |
| EGShares Emerging Markets Metals & Mining ETF (Consolidated)2 | | | |
| Actual | $1,000.00 | $ 890.92 | 0.85% | $4.01 |
| Hypothetical (5% return before expenses) | $1,000.00 | $1,020.69 | 0.85% | $4.28 |
| EGShares Energy GEMS ETF (Consolidated)2 | | | | |
| Actual | $1,000.00 | $ 977.90 | 0.85% | $4.19 |
| Hypothetical (5% return before expenses) | $1,000.00 | $1,020.69 | 0.85% | $4.28 |
| EGShares Financials GEMS ETF (Consolidated)2 | | | | |
| Actual | $1,000.00 | $1,129.15 | 0.85% | $4.51 |
| Hypothetical (5% return before expenses) | $1,000.00 | $1,020.69 | 0.85% | $4.28 |
| EGShares GEMS Composite ETF (Consolidated)2 | | | | |
| Actual | $1,000.00 | $1,023.34 | 0.75% | $3.78 |
| Hypothetical (5% return before expenses) | $1,000.00 | $1,021.19 | 0.75% | $3.78 |
| EGShares Health Care GEMS ETF (Consolidated)2 | | | | |
| Actual | $1,000.00 | $1,091.33 | 0.85% | $4.43 |
| Hypothetical (5% return before expenses) | $1,000.00 | $1,020.69 | 0.85% | $4.28 |
| EGShares India Consumer ETF (Consolidated)2 | | | | |
| Actual | $1,000.00 | $1,000.91 | 0.89% | $4.44 |
| Hypothetical (5% return before expenses) | $1,000.00 | $1,020.49 | 0.89% | $4.48 |
| EGShares India Infrastructure ETF (Consolidated)2 | | | | |
| Actual | $1,000.00 | $ 846.68 | 0.85% | $3.91 |
| Hypothetical (5% return before expenses) | $1,000.00 | $1,020.69 | 0.85% | $4.28 |
| EGShares India Small Cap ETF (Consolidated)2 | | | | |
| Actual | $1,000.00 | $ 862.27 | 0.85% | $3.95 |
| Hypothetical (5% return before expenses) | $1,000.00 | $1,020.69 | 0.85% | $4.28 |
| | EGA Emerging Global Shares Trust 49 |
Shareholder Expense Examples (Unaudited) (concluded)
| | | | |
| | Beginning
Account Value
10/1/2012 | Ending
Account Value
3/31/2013 | Annualized
Expense Ratios
for the Period | Expenses Paid
Through
3/31/20131 |
| EGShares Industrials GEMS ETF (Consolidated)2 | | | | |
| Actual | $1,000.00 | $1,100.57 | 0.85% | $4.45 |
| Hypothetical (5% return before expenses) | $1,000.00 | $1,020.69 | 0.85% | $4.28 |
| EGShares Low Volatility Emerging Markets Dividend ETF (Consolidated)2 | | | |
| Actual | $1,000.00 | $1,085.81 | 0.85% | $4.42 |
| Hypothetical (5% return before expenses) | $1,000.00 | $1,020.69 | 0.85% | $4.28 |
| EGShares Technology GEMS ETF (Consolidated)2 | | | | |
| Actual | $1,000.00 | $1,009.33 | 0.85% | $4.26 |
| Hypothetical (5% return before expenses) | $1,000.00 | $1,020.69 | 0.85% | $4.28 |
| EGShares Telecom GEMS ETF (Consolidated)2 | | | | |
| Actual | $1,000.00 | $ 971.47 | 0.85% | $4.18 |
| Hypothetical (5% return before expenses) | $1,000.00 | $1,020.69 | 0.85% | $4.28 |
| EGShares Utilities GEMS ETF (Consolidated)2 | | | | |
| Actual | $1,000.00 | $1,035.23 | 0.85% | $4.31 |
| Hypothetical (5% return before expenses) | $1,000.00 | $1,020.69 | 0.85% | $4.28 |
| 1 | Expenses are calculated using each Fund’s annualized expense ratio, which includes waived fees or reimbursed expenses, multiplied by the average account value for the period, multiplied by 182/365 (to reflect the six-month period). |
| 2 | Expenses for these Funds include the accounts of wholly owned subsidiaries. All inter-company accounts and transactions have been eliminated in consolidation. See Note 2 in the Notes to Financial Statements. |
| 50 EGA Emerging Global Shares Trust |
Frequency Distribution of Premium and Discount (Unaudited)
The chart below presents information about differences between the per share net asset value (“NAV”) of each Fund and the market trading price of shares of each Fund. For these purposes, the “market price” is the mid-point of the highest bid and lowest offer for Fund shares as of the close of trading on the exchange where Fund shares are listed. The term “premium” is sometimes used to describe a market price in excess of NAV and the term “discount” is sometimes used to describe a market price below NAV. The chart presents information about the size and frequency of premiums or discounts. As with other exchange-traded funds, the market price of Fund shares is typically slightly higher or lower than the Fund’s per share NAV. Factors that contribute to the differences between market price and NAV include the supply and demand for Fund shares and investors’ assessments of the underlying value of a Fund’s portfolio securities. Shareholders may pay more than NAV when they buy Fund shares and receive less than NAV when they sell those shares, as they are bought and sold at current market prices.
Differences between the closing times of U.S. and non-U.S. markets may contribute to differences between the NAV and market price of Fund shares. Many non-U.S. markets close prior to the close of the U.S. securities exchanges. Developments after the close of such markets as a result of ongoing price discovery may be reflected in a Fund’s market price but not in its NAV (or vice versa).
| | | | | |
| | | Market Price
Above or Equal to NAV | Market Price
Below NAV |
| | Basis Point
Differential | Number
of Days | % of
Total Days | Number
of Days | % of
Total Days |
| EGShares Basic Materials GEMS ETF | | | | | |
| June 23, 2011*– March 31, 2013 | | | | | |
| | 0-24.99 | 43 | 9.71% | 34 | 7.67% |
| | 25-49.99 | 58 | 13.09% | 35 | 7.90% |
| | 50-74.99 | 52 | 11.74% | 21 | 4.74% |
| | 75-99.99 | 48 | 10.84% | 10 | 2.26% |
| | > 100 | 100 | 22.57% | 42 | 9.48% |
| Total | | 301 | 67.95% | 142 | 32.05% |
| EGShares Beyond BRICs ETF | | | | | |
| August 15, 2012* – March 31, 2013 | | | | | |
| | 0-24.99 | 4 | 2.60% | 4 | 2.60% |
| | 25-49.99 | 24 | 15.58% | 1 | 0.65% |
| | 50-74.99 | 42 | 27.27% | — | 0.00% |
| | 75-99.99 | 48 | 31.17% | — | 0.00% |
| | > 100 | 31 | 20.13% | — | 0.00% |
| Total | | 149 | 96.75% | 5 | 3.25% |
| EGShares Brazil Infrastructure ETF | | | | | |
| February 24, 2010* – March 31, 2013 | | | | | |
| | 0-24.99 | 81 | 10.44% | 69 | 8.89% |
| | 25-49.99 | 65 | 8.38% | 66 | 8.50% |
| | 50-74.99 | 34 | 4.38% | 46 | 5.93% |
| | 75-99.99 | 28 | 3.61% | 19 | 2.45% |
| | > 100 | 340 | 43.81% | 28 | 3.61% |
| Total | | 548 | 70.62% | 228 | 29.38% |
| EGShares China Infrastructure ETF | | | | | |
| February 17, 2010* – March 31, 2013 | | | | | |
| | 0-24.99 | 89 | 11.38% | 77 | 9.85% |
| | 25-49.99 | 71 | 9.08% | 76 | 9.72% |
| | 50-74.99 | 77 | 9.85% | 51 | 6.52% |
| | 75-99.99 | 64 | 8.18% | 46 | 5.88% |
| | > 100 | 114 | 14.58% | 117 | 14.96% |
| Total | | 415 | 53.07% | 367 | 46.93% |
| EGShares Consumer Goods GEMS ETF | | | | | |
| June 23, 2011* – March 31, 2013 | | | | | |
| | 0-24.99 | 58 | 13.09% | 84 | 18.96% |
| | 25-49.99 | 40 | 9.03% | 82 | 18.51% |
| | 50-74.99 | 30 | 6.77% | 46 | 10.39% |
| | 75-99.99 | 19 | 4.29% | 25 | 5.64% |
| | > 100 | 18 | 4.06% | 41 | 9.26% |
| Total | | 165 | 37.24% | 278 | 62.76% |
| | EGA Emerging Global Shares Trust 51 |
Frequency Distribution of Premium and Discount (Unaudited) (continued)
| | | | | |
| | | Market Price
Above or Equal to NAV | Market Price
Below NAV |
| | Basis Point
Differential | Number
of Days | % of
Total Days | Number
of Days | % of
Total Days |
| EGShares Consumer Services GEMS ETF | | | | | |
| June 23, 2011* – March 31, 2013 | | | | | |
| | 0-24.99 | 74 | 16.70% | 103 | 23.25% |
| | 25-49.99 | 40 | 9.03% | 68 | 15.35% |
| | 50-74.99 | 17 | 3.84% | 48 | 10.84% |
| | 75-99.99 | 4 | 0.90% | 40 | 9.03% |
| | > 100 | 4 | 0.90% | 45 | 10.16% |
| Total | | 139 | 31.37% | 304 | 68.63% |
| EGShares Emerging Markets Consumer ETF | | | | | |
| September 14, 2010* – March 31, 2013 | | | | | |
| | 0-24.99 | 112 | 17.50% | 93 | 14.53% |
| | 25-49.99 | 168 | 26.25% | 33 | 5.16% |
| | 50-74.99 | 115 | 17.97% | 15 | 2.34% |
| | 75-99.99 | 51 | 7.97% | 12 | 1.87% |
| | > 100 | 27 | 4.22% | 14 | 2.19% |
| Total | | 473 | 73.91% | 167 | 26.09% |
| EGShares Emerging Markets Core ETF | | | | | |
| October 16, 2012* – March 31, 2013 | | | | | |
| | 0-24.99 | 5 | 4.51% | 1 | 0.90% |
| | 25-49.99 | 16 | 14.41% | 1 | 0.90% |
| | 50-74.99 | 41 | 36.94% | 1 | 0.90% |
| | 75-99.99 | 34 | 30.63% | — | 0.00% |
| | > 100 | 12 | 10.81% | — | 0.00% |
| Total | | 108 | 97.30% | 3 | 2.70% |
| EGShares Emerging Markets Domestic Demand ETF | | | | | |
| August 15, 2012* – March 31, 2013 | | | | | |
| | 0-24.99 | 8 | 5.19% | 5 | 3.25% |
| | 25-49.99 | 25 | 16.23% | — | 0.00% |
| | 50-74.99 | 44 | 28.57% | — | 0.00% |
| | 75-99.99 | 51 | 33.12% | — | 0.00% |
| | > 100 | 21 | 13.64% | — | 0.00% |
| Total | | 149 | 96.75% | 5 | 3.25% |
| EGShares Emerging Markets Metals & Mining ETF | | | | | |
| May 21, 2009* – March 31, 2013 | | | | | |
| | 0-24.99 | 164 | 16.93% | 136 | 14.04% |
| | 25-49.99 | 120 | 12.38% | 106 | 10.94% |
| | 50-74.99 | 81 | 8.36% | 76 | 7.84% |
| | 75-99.99 | 76 | 7.84% | 44 | 4.54% |
| | > 100 | 88 | 9.08% | 78 | 8.05% |
| Total | | 529 | 54.59% | 440 | 45.41% |
| EGShares Energy GEMS ETF | | | | | |
| May 21, 2009* – March 31, 2013 | | | | | |
| | 0-24.99 | 141 | 14.57% | 122 | 12.60% |
| | 25-49.99 | 131 | 13.53% | 108 | 11.16% |
| | 50-74.99 | 124 | 12.81% | 82 | 8.47% |
| | 75-99.99 | 59 | 6.10% | 34 | 3.51% |
| | > 100 | 80 | 8.26% | 87 | 8.99% |
| Total | | 535 | 55.27% | 433 | 44.73% |
| EGShares Financials GEMS ETF | | | | | |
| September 16, 2009* – March 31, 2013 | | | | | |
| | 0-24.99 | 126 | 14.21% | 142 | 16.01% |
| | 25-49.99 | 104 | 11.72% | 111 | 12.51% |
| | 50-74.99 | 61 | 6.88% | 91 | 10.26% |
| | 75-99.99 | 44 | 4.96% | 44 | 4.96% |
| | > 100 | 85 | 9.58% | 79 | 8.91% |
| Total | | 420 | 47.35% | 467 | 52.65% |
| 52 EGA Emerging Global Shares Trust |
Frequency Distribution of Premium and Discount (Unaudited) (continued)
| | | | | |
| | | Market Price
Above or Equal to NAV | Market Price
Below NAV |
| | Basis Point
Differential | Number
of Days | % of
Total Days | Number
of Days | % of
Total Days |
| EGShares GEMS Composite ETF | | | | | |
| July 22, 2009* – March 31, 2013 | | | | | |
| | 0-24.99 | 151 | 16.29% | 131 | 14.13% |
| | 25-49.99 | 151 | 16.29% | 104 | 11.22% |
| | 50-74.99 | 77 | 8.31% | 77 | 8.31% |
| | 75-99.99 | 62 | 6.69% | 30 | 3.23% |
| | > 100 | 79 | 8.52% | 65 | 7.01% |
| Total | | 520 | 56.10% | 407 | 43.90% |
| EGShares Health Care GEMS ETF | | | | | |
| June 23, 2011* – March 31, 2013 | | | | | |
| | 0-24.99 | 53 | 11.96% | 51 | 11.51% |
| | 25-49.99 | 70 | 15.80% | 43 | 9.71% |
| | 50-74.99 | 40 | 9.03% | 48 | 10.84% |
| | 75-99.99 | 30 | 6.77% | 21 | 4.74% |
| | > 100 | 38 | 8.58% | 49 | 11.06% |
| Total | | 231 | 52.14% | 212 | 47.86% |
| EGShares India Consumer ETF | | | | | |
| August 10, 2011* – March 31, 2013 | | | | | |
| | 0-24.99 | 29 | 7.09% | 46 | 11.25% |
| | 25-49.99 | 41 | 10.02% | 39 | 9.54% |
| | 50-74.99 | 46 | 11.25% | 26 | 6.36% |
| | 75-99.99 | 31 | 7.58% | 5 | 1.22% |
| | > 100 | 123 | 30.07% | 23 | 5.62% |
| Total | | 270 | 66.01% | 139 | 33.99% |
| EGShares India Infrastructure ETF | | | | | |
| August 11, 2010* – March 31, 2013 | | | | | |
| | 0-24.99 | 66 | 9.98% | 73 | 11.04% |
| | 25-49.99 | 76 | 11.50% | 58 | 8.78% |
| | 50-74.99 | 64 | 9.68% | 59 | 8.93% |
| | 75-99.99 | 42 | 6.35% | 39 | 5.90% |
| | > 100 | 91 | 13.77% | 93 | 14.07% |
| Total | | 339 | 51.28% | 322 | 48.72% |
| EGShares India Small Cap ETF | | | | | |
| July 7, 2010* – March 31, 2013 | | | | | |
| | 0-24.99 | 85 | 12.39% | 61 | 8.89% |
| | 25-49.99 | 64 | 9.33% | 65 | 9.48% |
| | 50-74.99 | 58 | 8.45% | 51 | 7.43% |
| | 75-99.99 | 55 | 8.02% | 28 | 4.08% |
| | > 100 | 138 | 20.12% | 81 | 11.81% |
| Total | | 400 | 58.31% | 286 | 41.69% |
| EGShares Industrials GEMS ETF | | | | | |
| June 23, 2011* – March 31, 2013 | | | | | |
| | 0-24.99 | 61 | 13.77% | 57 | 12.87% |
| | 25-49.99 | 50 | 11.29% | 44 | 9.93% |
| | 50-74.99 | 35 | 7.90% | 34 | 7.67% |
| | 75-99.99 | 24 | 5.42% | 31 | 7.00% |
| | > 100 | 45 | 10.16% | 62 | 13.99% |
| Total | | 215 | 48.54% | 228 | 51.46% |
| EGShares Low Volatility Emerging Markets Dividend ETF | | | | | |
| August 4, 2011* – March 31, 2013 | | | | | |
| | 0-24.99 | 69 | 16.71% | 57 | 13.80% |
| | 25-49.99 | 82 | 19.85% | 22 | 5.33% |
| | 50-74.99 | 61 | 14.77% | 21 | 5.08% |
| | 75-99.99 | 37 | 8.96% | 14 | 3.39% |
| | > 100 | 38 | 9.20% | 12 | 2.91% |
| Total | | 287 | 69.49% | 126 | 30.51% |
| | EGA Emerging Global Shares Trust 53 |
Frequency Distribution of Premium and Discount (Unaudited) (concluded)
| | | | | |
| | | Market Price
Above or Equal to NAV | Market Price
Below NAV |
| | Basis Point
Differential | Number
of Days | % of
Total Days | Number
of Days | % of
Total Days |
| EGShares Technology GEMS ETF | | | | | |
| June 23, 2011* – March 31, 2013 | | | | | |
| | 0-24.99 | 91 | 20.54% | 93 | 20.99% |
| | 25-49.99 | 52 | 11.74% | 44 | 9.93% |
| | 50-74.99 | 34 | 7.68% | 31 | 7.00% |
| | 75-99.99 | 24 | 5.42% | 18 | 4.06% |
| | > 100 | 29 | 6.55% | 27 | 6.09% |
| Total | | 230 | 51.93% | 213 | 48.07% |
| EGShares Telecom GEMS ETF | | | | | |
| June 23, 2011* – March 31, 2013 | | | | | |
| | 0-24.99 | 57 | 12.87% | 74 | 16.70% |
| | 25-49.99 | 34 | 7.67% | 82 | 18.51% |
| | 50-74.99 | 24 | 5.42% | 51 | 11.51% |
| | 75-99.99 | 26 | 5.87% | 18 | 4.06% |
| | > 100 | 48 | 10.84% | 29 | 6.55% |
| Total | | 189 | 42.67% | 254 | 57.33% |
| EGShares Utilities GEMS ETF | | | | | |
| June 23, 2011* – March 31, 2013 | | | | | |
| | 0-24.99 | 72 | 16.25% | 93 | 20.99% |
| | 25-49.99 | 45 | 10.16% | 81 | 18.28% |
| | 50-74.99 | 15 | 3.39% | 49 | 11.06% |
| | 75-99.99 | 12 | 2.71% | 23 | 5.19% |
| | > 100 | 5 | 1.13% | 48 | 10.84% |
| Total | | 149 | 33.64% | 294 | 66.36% |
| * | Commencement of Operations. |
Each line in the table shows the number of trading days in which the Fund traded within the premium/discount range indicated. The number of trading days in each premium/discount range is also shown as a percentage of the total number of trading days in the period covered by each table. All data presented here represents past performance, which cannot be used to predict future results.
| 54 EGA Emerging Global Shares Trust |
Schedule of Investments (Consolidated)†
EGShares Basic Materials GEMS ETF
| | |
| Investments | Shares | Value |
| |
| COMMON STOCKS—99.7% | | |
| Brazil—16.2% | | |
| Companhia Siderurgica Nacional SA ADR | 21,217 | $ | 95,052 |
| Gerdau SA Preference Shares ADR | 20,874 | 160,939 |
| Vale SA Preference A Shares ADR | 20,568 | 339,989 |
| Total Brazil | | 595,980 |
| Chile—3.4% | | |
| Empresas CMPC SA | 34,050 | 124,009 |
| China—16.9% | | |
| Aluminum Corp. of China, Ltd. Class H ADR* | 4,837 | 47,064 |
| China Coal Energy Co., Ltd. Class H | 114,166 | 101,773 |
| China Shenhua Energy Co., Ltd. Class H | 64,917 | 235,829 |
| Jiangxi Copper Co., Ltd. Class H | 41,826 | 92,352 |
| Yanzhou Coal Mining Co., Ltd. Class H ADR | 5,779 | 79,115 |
| Zijin Mining Group Co., Ltd. Class H | 199,924 | 65,932 |
| Total China | | 622,065 |
| India—8.7% | | |
| Coal India, Ltd. | 18,145 | 103,194 |
| Hindalco Industries, Ltd. | 26,079 | 43,953 |
| Jindal Steel & Power, Ltd. | 11,910 | 76,204 |
| Sterlite Industries India, Ltd. ADR | 7,608 | 53,104 |
| Tata Steel, Ltd. | 7,781 | 44,789 |
| Total India | | 321,244 |
| Malaysia—3.1% | | |
| Petronas Chemicals Group BHD | 53,800 | 112,065 |
| Mexico—10.1% | | |
| Grupo Mexico SAB de CV Series B | 54,304 | 219,563 |
| Industrias Penoles SAB de CV | 3,204 | 152,271 |
| Total Mexico | | 371,834 |
| Poland—4.4% | | |
| KGHM Polska Miedz SA | 3,359 | 162,970 |
| | |
| Investments | Shares | Value |
| |
| Russia—15.6% | | |
| Evraz PLC | 10,824 | $ | 36,487 |
| MMC Norilsk Nickel OJSC ADR | 14,419 | 243,537 |
| Novolipetsk Steel GDR | 2,324 | 36,650 |
| Severstal GDR | 5,832 | 51,817 |
| Uralkali OJSC GDR | 5,514 | 203,356 |
| Total Russia | | 571,847 |
| South Africa—18.5% | | |
| Anglo American Platinum, Ltd.* | 1,742 | 72,563 |
| AngloGold Ashanti, Ltd. ADR | 7,910 | 186,280 |
| Gold Fields, Ltd. ADR | 17,832 | 138,198 |
| Impala Platinum Holdings, Ltd. | 11,791 | 174,273 |
| Kumba Iron Ore, Ltd. | 2,003 | 107,409 |
| Total South Africa | | 678,723 |
| Thailand—2.8% | | |
| PTT Global Chemical PCL | 43,000 | 102,049 |
| TOTAL INVESTMENTS IN SECURITIES—99.7% | | |
| (Cost: $4,465,624) | | 3,662,786 |
| Other Assets in Excess of Liabilities—0.3% | | 9,408 |
| Net Assets—100.0% | | $ | 3,672,194 |
| † | The Consolidated Schedule of Investments includes the accounts of the wholly owned subsidiary. All inter-company accounts and transactions have been eliminated in consolidation. See Note 2 of the Notes to Financial Statements. |
| * | Non-income producing security |
| ADR | American Depositary Receipts |
| GDR | Global Depositary Receipts |
| | |
| Summary by Sector | Value | % of
Net Assets |
| Chemicals | $ | 315,422 | 8.6% |
| Forestry & Paper | 124,009 | 3.4 |
| Industrial Metals & Mining | 1,624,160 | 44.2 |
| Mining | 1,497,146 | 40.7 |
| Oil & Gas Producers | 102,049 | 2.8 |
| Total Investments | 3,662,786 | 99.7 |
| Other Assets in Excess of Liabilities | 9,408 | 0.3 |
| Net Assets | $ | 3,672,194 | 100.0% |
The accompanying notes are an integral part of these financial statements.
| | EGA Emerging Global Shares Trust 55 |
Schedule of Investments
EGShares Beyond BRICs ETF
| | |
| Investments | Shares | Value |
| |
| COMMON STOCKS—99.6% | | |
| Chile—4.4% | | |
| Banco Santander Chile ADR | 1,649 | $ | 46,947 |
| Enersis SA ADR | 3,804 | 73,189 |
| Latam Airlines Group SA ADR | 5,092 | 110,700 |
| Sociedad Quimica y Minera de Chile SA ADR | 1,881 | 104,301 |
| Total Chile | | 335,137 |
| Colombia—3.5% | | |
| Bancolombia SA ADR | 1,253 | 79,252 |
| Ecopetrol SA ADR | 3,545 | 193,274 |
| Total Colombia | | 272,526 |
| Indonesia—13.5% | | |
| Astra International Tbk PT | 272,835 | 221,805 |
| Bank Central Asia Tbk PT | 203,740 | 239,016 |
| Bank Mandiri Persero Tbk PT | 148,950 | 153,280 |
| Bank Rakyat Indonesia Persero Tbk PT | 168,093 | 151,357 |
| Perusahaan Gas Negara PT | 162,047 | 99,221 |
| Telekomunikasi Indonesia Tbk PT ADR | 3,883 | 175,046 |
| Total Indonesia | | 1,039,725 |
| Malaysia—14.5% | | |
| Axiata Group BHD | 54,400 | 116,301 |
| CIMB Group Holdings BHD | 65,100 | 160,832 |
| DiGi.Com BHD | 39,900 | 59,789 |
| Genting BHD | 36,200 | 117,374 |
| Malayan Banking BHD | 46,200 | 140,249 |
| Maxis BHD | 27,300 | 57,571 |
| Petronas Chemicals Group BHD | 28,000 | 58,324 |
| Public Bank BHD | 42,000 | 220,274 |
| Sime Darby BHD | 38,300 | 114,535 |
| Tenaga Nasional BHD | 29,400 | 68,361 |
| Total Malaysia | | 1,113,610 |
| Mexico—18.1% | | |
| America Movil SAB de CV Series L ADR | 11,733 | 245,924 |
| Fomento Economico Mexicano SAB de CV ADR | 3,724 | 422,674 |
| Grupo Mexico SAB de CV Series B | 96,746 | 391,166 |
| Grupo Modelo SAB de CV Series C | 36,767 | 333,578 |
| Total Mexico | | 1,393,342 |
| Peru—1.2% | | |
| Cia de Minas Buenaventura SA ADR | 3,454 | 89,666 |
| Philippines—1.4% | | |
| SM Investments Corp. | 3,970 | 108,467 |
| Poland—3.1% | | |
| Bank Pekao SA | 1,498 | 72,310 |
| PGE SA | 10,441 | 53,739 |
| Powszechna Kasa Oszczednosci Bank Polski SA | 10,469 | 111,210 |
| Total Poland | | 237,259 |
| South Africa—16.8% | | |
| FirstRand, Ltd. | 63,537 | 222,999 |
| MTN Group, Ltd. | 18,126 | 319,037 |
| Naspers, Ltd. N Shares | 4,490 | 280,354 |
| Sasol, Ltd. | 6,686 | 296,854 |
| Standard Bank Group, Ltd. | 13,260 | 171,111 |
| Total South Africa | | 1,290,355 |
| | |
| Investments | Shares | Value |
| |
| Thailand—15.5% | | |
| Advanced Info Service PCL | 23,800 | $ | 191,798 |
| Bangkok Bank PCL | 19,141 | 145,102 |
| Kasikornbank PCL | 25,900 | 183,958 |
| PTT Exploration & Production PCL | 16,100 | 81,641 |
| PTT PCL | 19,600 | 216,848 |
| Siam Cement PCL | 9,100 | 149,155 |
| Siam Commercial Bank PCL | 36,400 | 220,625 |
| Total Thailand | | 1,189,127 |
| Turkey—7.6% | | |
| Akbank TAS | 25,080 | 131,672 |
| KOC Holding AS | 8,630 | 50,078 |
| Turk Telekomunikasyon AS | 6,980 | 30,936 |
| Turkcell Iletisim Hizmetleri AS* | 11,524 | 77,378 |
| Turkiye Garanti Bankasi AS | 31,472 | 166,969 |
| Turkiye Halk Bankasi AS | 4,567 | 48,837 |
| Turkiye Is Bankasi Class C | 21,225 | 80,701 |
| Total Turkey | | 586,571 |
| TOTAL INVESTMENTS IN SECURITIES—99.6% | | |
| (Cost: $7,027,893) | | 7,655,785 |
| Other Assets in Excess of Liabilities—0.4% | | 32,130 |
| Net Assets—100.0% | | $ | 7,687,915 |
| * | Non-income producing security |
| ADR | American Depositary Receipts |
| | |
| Summary by Sector | Value | % of
Net Assets |
| Consumer Discretionary | $ | 619,533 | 8.1% |
| Consumer Staples | 756,252 | 9.8 |
| Energy | 788,617 | 10.3 |
| Financials | 2,746,701 | 35.7 |
| Industrials | 383,780 | 5.0 |
| Materials | 792,612 | 10.3 |
| Telecommunication Services | 1,273,780 | 16.6 |
| Utilities | 294,510 | 3.8 |
| Total Investments | 7,655,785 | 99.6 |
| Other Assets in Excess of Liabilities | 32,130 | 0.4 |
| Net Assets | $ | 7,687,915 | 100.0% |
The accompanying notes are an integral part of these financial statements.
| 56 EGA Emerging Global Shares Trust |
Schedule of Investments
EGShares Brazil Infrastructure ETF
| | |
| Investments | Shares | Value |
| |
| COMMON STOCKS—99.3% | | |
| Basic Materials—12.1% | | |
| Companhia Siderurgica Nacional SA | 741,938 | $ | 3,359,483 |
| Gerdau SA | 350,789 | 2,432,132 |
| Vale SA | 222,544 | 3,854,111 |
| Total Basic Materials | | 9,645,726 |
| Consumer Goods—1.0% | | |
| Iochpe-Maxion SA | 60,465 | 795,864 |
| Consumer Services—2.8% | | |
| Localiza Rent a Car SA | 122,121 | 2,198,523 |
| Financials—10.4% | | |
| BR Malls Participacoes SA | 316,416 | 3,968,637 |
| BR Properties SA | 189,129 | 2,108,572 |
| Multiplan Empreendimentos Imobiliarios SA | 78,537 | 2,261,052 |
| Total Financials | | 8,338,261 |
| Industrials—25.9% | | |
| All America Latina Logistica | 438,402 | 2,187,281 |
| Arteris SA | 129,571 | 1,450,994 |
| CCR SA | 453,244 | 4,639,550 |
| Ecorodovias Infraestrutura e Logistica SA | 155,941 | 1,341,819 |
| Embraer SA | 582,902 | 5,194,906 |
| JSL SA | 48,785 | 395,584 |
| Marcopolo SA Preference Shares | 345,566 | 2,455,904 |
| Weg SA | 227,382 | 2,953,423 |
| Total Industrials | | 20,619,461 |
| | |
| Investments | Shares | Value |
| |
| Oil & Gas—0.1% | | |
| OSX Brasil SA* | 55,447 | $ | 110,545 |
| Telecommunications—13.9% | | |
| Oi SA Preference Shares | 938,042 | 2,870,394 |
| Telefonica Brasil SA | 166,087 | 4,444,692 |
| Tim Participacoes SA | 856,127 | 3,761,889 |
| Total Telecommunications | | 11,076,975 |
| Utilities—33.1% | | |
| AES Tiete SA | 118,344 | 1,027,113 |
| Centrais Eletricas Brasileiras SA | 347,595 | 1,203,270 |
| Companhia de Gas de Sao Paulo Class A | 104,397 | 2,890,094 |
| Companhia de Saneamento Basico | | |
| do Estado de Sao Paulo | 95,355 | 4,553,168 |
| Companhia de Saneamento de Minas Gerais | 61,017 | 1,482,189 |
| Companhia Energetica de Minas Gerais | 153,787 | 1,813,701 |
| Companhia Energetica de Sao Paulo | | |
| Preference Shares Class B | 196,076 | 1,971,117 |
| CPFL Energia SA | 300,462 | 3,153,111 |
| Tractebel Energia SA | 217,830 | 3,738,982 |
| Ultrapar Participacoes SA | 180,420 | 4,583,984 |
| Total Utilities | | 26,416,729 |
| TOTAL INVESTMENTS IN SECURITIES—99.3% | |
| (Cost: $74,017,369) | | 79,202,084 |
| Other Assets in Excess of Liabilities—0.7% | | 537,250 |
| Net Assets—100.0% | | $ | 79,739,334 |
| * | Non-income producing security |
The accompanying notes are an integral part of these financial statements.
| | EGA Emerging Global Shares Trust 57 |
Schedule of Investments
EGShares China Infrastructure ETF
| | |
| Investments | Shares | Value |
| |
| COMMON STOCKS—99.7% | | |
| Basic Materials—11.6% | | |
| Aluminum Corp. of China, Ltd. Class H* | 1,351,128 | $ | 520,424 |
| Angang Steel Co., Ltd. Class H* | 533,345 | 292,003 |
| Jiangxi Copper Co., Ltd. Class H | 245,665 | 542,431 |
| Maanshan Iron & Steel Co., Ltd. Class H* | 640,968 | 166,793 |
| Total Basic Materials | | 1,521,651 |
| Financials—10.1% | | |
| Agile Property Holdings, Ltd. | 101,042 | 120,402 |
| Country Garden Holdings Co., Ltd.* | 350,381 | 175,131 |
| Evergrande Real Estate Group, Ltd. | 398,106 | 160,521 |
| Guangzhou R&F Properties Co., Ltd. Class H | 238,941 | 400,767 |
| Longfor Properties Co., Ltd. | 92,047 | 152,253 |
| Shimao Property Holdings, Ltd. | 101,768 | 195,338 |
| Soho China, Ltd. | 145,479 | 121,441 |
| Total Financials | | 1,325,853 |
| Industrials—46.8% | | |
| Anhui Conch Cement Co., Ltd. Class H | 220,684 | 732,046 |
| BBMG Corp. Class H | 411,460 | 335,522 |
| Changsha Zoomlion Heavy Industry Science | | |
| and Technology Development Co., Ltd. Class H | 493,369 | 595,527 |
| China Communications Construction Co., Ltd. Class H | 647,668 | 602,393 |
| China National Building Material Co., Ltd. Class H | 353,073 | 444,374 |
| China Railway Construction Corp., Ltd. Class H | 673,071 | 638,159 |
| China Railway Group, Ltd. Class H | 1,376,851 | 700,606 |
| CSR Corp., Ltd. Class H | 751,187 | 533,199 |
| Dongfang Electric Corp., Ltd. Class H | 213,174 | 353,155 |
| Shanghai Electric Group Co., Ltd. Class H | 1,319,665 | 513,405 |
| Weichai Power Co., Ltd. Class H | 141,161 | 470,073 |
| Zhuzhou CSR Times Electric Co. Ltd. Class H | 81,373 | 230,618 |
| Total Industrials | | 6,149,077 |
| | |
| Investments | Shares | Value |
| |
| Oil & Gas—9.2% | | |
| China Longyuan Power Group Corp. Class H | 518,334 | $ | 470,080 |
| China Oilfield Services, Ltd. Class H | 356,123 | 745,952 |
| Total Oil & Gas | | 1,216,032 |
| Telecommunications—7.8% | | |
| China Telecom Corp., Ltd. Class H | 1,106,787 | 557,482 |
| China Unicom Hong Kong, Ltd. | 350,095 | 469,039 |
| Total Telecommunications | | 1,026,521 |
| Utilities—14.2% | | |
| Datang International Power Generation Co., | | |
| Ltd. Class H | 1,587,631 | 701,510 |
| ENN Energy Holdings Ltd. | 53,272 | 295,092 |
| Huaneng Power International, Inc. Class H | 814,824 | 869,129 |
| Total Utilities | | 1,865,731 |
| TOTAL INVESTMENTS IN SECURITIES—99.7% | |
| (Cost: $15,064,015) | | 13,104,865 |
| Other Assets in Excess of Liabilities—0.3% | | 34,085 |
| Net Assets—100.0% | | $ | 13,138,950 |
| * | Non-income producing security |
The accompanying notes are an integral part of these financial statements.
| 58 EGA Emerging Global Shares Trust |
Schedule of Investments (Consolidated)†
EGShares Consumer Goods GEMS ETF
| | |
| Investments | Shares | Value |
| |
| COMMON STOCKS—100.2% | | |
| Brazil—15.8% | | |
| BRF—Brasil Foods SA ADR | 6,646 | $ | 146,943 |
| Companhia de Bebidas das Americas | | |
| Preference Shares ADR | 5,570 | 235,778 |
| Total Brazil | | 382,721 |
| Cayman Islands—2.8% | | |
| China Mengniu Dairy Co. Ltd. | 23,302 | 66,940 |
| China—6.9% | | |
| China Agri-Industries Holdings, Ltd. | 35,706 | 18,445 |
| Dongfeng Motor Group Co., Ltd. Class H | 38,541 | 54,118 |
| Great Wall Motor Co., Ltd. Class H | 19,329 | 65,487 |
| Guangzhou Automobile Group Co., Ltd. Class H | 34,257 | 28,994 |
| Total China | | 167,044 |
| Colombia—2.7% | | |
| Grupo Nutresa SA | 4,691 | 66,721 |
| India—13.4% | | |
| Bajaj Auto, Ltd. | 1,363 | 45,129 |
| Hero MotoCorp, Ltd. | 1,429 | 40,543 |
| Hindustan Unilever, Ltd. | 13,245 | 113,795 |
| ITC, Ltd. | 22,151 | 126,120 |
| Total India | | 325,587 |
| Indonesia—12.9% | | |
| Astra International Tbk PT | 192,584 | 156,564 |
| Gudang Garam Tbk PT | 6,848 | 34,496 |
| Indofood Sukses Makmur Tbk PT | 81,177 | 62,235 |
| Unilever Indonesia Tbk PT | 25,159 | 59,030 |
| Total Indonesia | | 312,325 |
| Malaysia—8.8% | | |
| British American Tobacco Malaysia BHD | 2,800 | 56,497 |
| IOI Corp. BHD | 44,500 | 66,969 |
| Kuala Lumpur Kepong BHD | 9,100 | 60,951 |
| PPB Group BHD | 7,300 | 29,752 |
| Total Malaysia | | 214,169 |
| | |
| Investments | Shares | Value |
| |
| Mexico—26.5% | | |
| Arca Continental SAB de CV | 11,235 | $ | 84,268 |
| Coca-Cola Femsa SAB de CV ADR | 510 | 83,523 |
| Fomento Economico Mexicano SAB de CV ADR | 1,694 | 192,269 |
| Grupo Bimbo SAB de CV Series A | 33,858 | 108,359 |
| Grupo Modelo SAB de CV Series C | 9,894 | 89,766 |
| Kimberly-Clark de Mexico SAB de CV Class A | 24,500 | 85,597 |
| Total Mexico | | 643,782 |
| Philippines—2.1% | | |
| San Miguel Corp. | 18,217 | 51,557 |
| South Africa—3.5% | | |
| Tiger Brands, Ltd. | 2,616 | 83,831 |
| Thailand—2.1% | | |
| Charoen Pokphand Foods Public Co., Ltd. | 46,400 | 52,286 |
| Turkey—2.7% | | |
| Anadolu Efes Biracilik ve Malt Sanayii AS | 4,056 | 65,004 |
| TOTAL INVESTMENTS IN SECURITIES—100.2% | |
| (Cost: $2,239,071) | | 2,431,967 |
| Liabilities in Excess of Other Assets—(0.2)% | | (5,854) |
| Net Assets—100.0% | | $ | 2,426,113 |
| † | The Consolidated Schedule of Investments includes the accounts of the wholly owned subsidiary. All inter-company accounts and transactions have been eliminated in consolidation. See Note 2 of the Notes to Financial Statements. |
| ADR | American Depositary Receipts |
| | |
| Summary by Sector | Value | % of
Net Assets |
| Automobiles & Parts | $ | 390,835 | 16.1% |
| Beverages | 802,165 | 33.1 |
| Food Producers | 763,432 | 31.5 |
| Personal Goods | 258,422 | 10.6 |
| Tobacco | 217,113 | 8.9 |
| Total Investments | 2,431,967 | 100.2 |
| Liabilities in Excess of Other Assets | (5,854) | (0.2) |
| Net Assets | $ | 2,426,113 | 100.0% |
The accompanying notes are an integral part of these financial statements.
| | EGA Emerging Global Shares Trust 59 |
Schedule of Investments
EGShares Consumer Services GEMS ETF
| | |
| Investments | Shares | Value |
| |
| COMMON STOCKS—99.9% | | |
| Brazil—4.4% | | |
| Companhia Brasileira de Distribuicao Grupo Pao | | |
| de Acucar Preference Shares ADR | 1,805 | $ | 96,170 |
| Chile—13.5% | | |
| Cencosud SA | 13,661 | 84,925 |
| Latam Airlines Group SA ADR | 3,850 | 83,699 |
| S.A.C.I. Falabella | 10,259 | 123,269 |
| Total Chile | | 291,893 |
| China—8.0% | | |
| Air China, Ltd. Class H | 39,839 | 35,412 |
| China Resources Enterprise, Ltd. | 15,810 | 46,844 |
| Ctrip.com International, Ltd. ADR* | 2,396 | 51,226 |
| New Oriental Education & Technology Group, Ltd. ADR | 2,166 | 38,988 |
| Total China | | 172,470 |
| Colombia—2.7% | | |
| Almacenes Exito SA | 3,234 | 58,382 |
| Malaysia—7.7% | | |
| AirAsia BHD | 28,500 | 26,323 |
| Genting BHD | 27,200 | 88,193 |
| Genting Malaysia BHD | 43,400 | 51,438 |
| Total Malaysia | | 165,954 |
| Mexico—15.1% | | |
| Grupo Elektra SAB de CV* | 750 | 29,580 |
| Grupo Televisa SAB ADR | 4,143 | 110,245 |
| TV Azteca SAB de CV Series CPO | 27,161 | 19,282 |
| Wal-Mart de Mexico SAB de CV Series V | 51,544 | 168,762 |
| Total Mexico | | 327,869 |
| Philippines—4.3% | | |
| SM Investments Corp. | 3,440 | 93,987 |
| Russia—7.7% | | |
| Magnit OJSC-SPON GDR REGS | 2,967 | 133,960 |
| X5 Retail Group NV GDR* | 1,977 | 33,214 |
| Total Russia | | 167,174 |
| | |
| Investments | Shares | Value |
| |
| South Africa—29.2% | | |
| Foschini Group Ltd. (The) | 3,239 | $ | 39,824 |
| Massmart Holdings, Ltd. | 1,735 | 35,979 |
| Mr. Price Group Ltd. | 3,785 | 48,265 |
| Naspers, Ltd. N Shares | 3,227 | 201,493 |
| Pick n Pay Stores, Ltd. | 4,356 | 20,212 |
| Shoprite Holdings, Ltd. | 4,597 | 91,595 |
| Steinhoff International Holdings, Ltd.* | 23,080 | 62,917 |
| Truworths International, Ltd. | 6,443 | 63,324 |
| Woolworths Holdings, Ltd. | 8,938 | 68,780 |
| Total South Africa | | 632,389 |
| Thailand—4.2% | | |
| CP ALL PCL | 57,600 | 89,985 |
| Turkey—3.1% | | |
| BIM Birlesik Magazalar AS | 1,394 | 67,986 |
| TOTAL INVESTMENTS IN SECURITIES—99.9% | |
| (Cost: $2,100,961) | | 2,164,259 |
| Other Assets in Excess of Liabilities—0.1% | | 2,758 |
| Net Assets—100.0% | | $ | 2,167,017 |
| * | Non-income producing security |
| ADR | American Depositary Receipts |
| GDR | Global Depositary Receipts |
| | |
| Summary by Sector | Value | % of
Net Assets |
| Food & Drug Retailers | $ | 676,429 | 31.2% |
| General Industrials | 46,844 | 2.2 |
| General Retailers | 710,757 | 32.8 |
| Household Goods & Home Construction | 62,917 | 2.9 |
| Media | 331,021 | 15.3 |
| Travel & Leisure | 336,291 | 15.5 |
| Total Investments | 2,164,259 | 99.9 |
| Other Assets in Excess of Liabilities | 2,758 | 0.1 |
| Net Assets | $ | 2,167,017 | 100.0% |
The accompanying notes are an integral part of these financial statements.
| 60 EGA Emerging Global Shares Trust |
Schedule of Investments (Consolidated)†
EGShares Emerging Markets Consumer ETF
| | |
| Investments | Shares | Value |
| |
| COMMON STOCKS—99.8% | | |
| Brazil—17.5% | | |
| BRF—Brasil Foods SA ADR | 2,037,986 | $ | 45,059,871 |
| Companhia Brasileira de Distribuicao Grupo | | |
| Pao de Acucar Preference Shares ADR | 492,034 | 26,215,572 |
| Companhia de Bebidas das Americas | | |
| Preference Shares ADR | 1,975,679 | 83,630,492 |
| Total Brazil | | 154,905,935 |
| Chile—9.2% | | |
| Cencosud SA | 3,669,346 | 22,811,004 |
| Latam Airlines Group SA ADR | 1,047,371 | 22,769,846 |
| S.A.C.I. Falabella | 3,029,557 | 36,402,207 |
| Total Chile | | 81,983,057 |
| China—5.6% | | |
| China Resources Enterprise, Ltd. | 4,048,612 | 11,995,656 |
| Ctrip.com International, Ltd. ADR* | 562,946 | 12,035,786 |
| Dongfeng Motor Group Co., Ltd. Class H | 10,538,472 | 14,797,697 |
| New Oriental Education & Technology | | |
| Group, Ltd. ADR | 582,298 | 10,481,364 |
| Total China | | 49,310,503 |
| Colombia—1.7% | | |
| Grupo Nutresa SA | 1,041,249 | 14,809,887 |
| India—9.9% | | |
| Bajaj Auto, Ltd. | 289,729 | 9,593,042 |
| Hero Motocorp, Ltd. | 326,575 | 9,265,476 |
| Hindustan Unilever, Ltd. | 3,702,774 | 31,812,517 |
| ITC, Ltd. | 6,449,948 | 36,723,761 |
| Total India | | 87,394,796 |
| Indonesia—5.7% | | |
| Astra International TBK PT | 61,648,522 | 50,118,171 |
| Malaysia—6.0% | | |
| Genting BHD | 7,556,620 | 24,501,361 |
| Genting Malaysia BHD | 11,453,980 | 13,575,361 |
| IOI Corp. BHD | 10,246,320 | 15,419,942 |
| Total Malaysia | | 53,496,664 |
| | |
| Investments | Shares | Value |
| |
| Mexico—19.7% | | |
| Fomento Economico Mexicano SAB | | |
| de CV Series UBD | 5,426,852 | $ | 61,120,063 |
| Grupo Bimbo SAB de CV Series A | 8,511,079 | 27,238,708 |
| Grupo Televisa SAB Series CPO | 6,382,587 | 33,906,596 |
| Wal-Mart de Mexico SAB de CV Series V | 16,014,913 | 52,434,931 |
| Total Mexico | | 174,700,298 |
| Russia—4.5% | | |
| Magnit OJSC GDR | 878,932 | 39,683,780 |
| South Africa—17.2% | | |
| Naspers, Ltd. N Shares | 1,127,986 | 70,431,119 |
| Shoprite Holdings, Ltd. | 1,346,817 | 26,835,194 |
| Steinhoff International Holdings, Ltd.* | 6,413,431 | 17,483,327 |
| Tiger Brands, Ltd. | 658,583 | 21,104,633 |
| Truworths International, Ltd. | 1,714,750 | 16,853,218 |
| Total South Africa | | 152,707,491 |
| Thailand—2.8% | | |
| CP ALL PCL | 15,901,400 | 24,841,695 |
| TOTAL INVESTMENTS IN SECURITIES—99.8% | | |
| (Cost: $810,979,666) | | 883,952,277 |
| Other Assets in Excess of Liabilities—0.2% | | 1,524,086 |
| Net Assets—100.0% | | $ | 885,476,363 |
| † | The Consolidated Schedule of Investments includes the accounts of the wholly owned subsidiary. All inter-company accounts and transactions have been eliminated in consolidation. See Note 2 of the Notes to Financial Statements. |
| * | Non-income producing security |
| ADR | American Depositary Receipts |
| GDR | Global Depositary Receipts |
| | |
| Summary by Industry | Value | % of
Net Assets |
| Consumer Goods | $ | 438,177,588 | 49.4% |
| Consumer Services | 433,779,033 | 49.0 |
| Industrials | 11,995,656 | 1.4 |
| Total Investments | 883,952,277 | 99.8 |
| Other Assets in Excess of Liabilities | 1,524,086 | 0.2 |
| Net Assets | $ | 885,476,363 | 100.0% |
The accompanying notes are an integral part of these financial statements.
| | EGA Emerging Global Shares Trust 61 |
Schedule of Investments (Consolidated)†
EGShares Emerging Markets Core ETF
| | |
| Investments | Shares | Value |
| |
| COMMON STOCKS—99.7% | | |
| Brazil—10.1% | | |
| Banco Bradesco SA Preference Shares ADR | 3,107 | $ | 52,881 |
| Companhia Brasileira de Distribuicao Grupo Pao | | |
| de Acucar Preference Shares ADR | 1,074 | 57,223 |
| Companhia de Bebidas das Americas | | |
| Preference Shares ADR | 1,236 | 52,320 |
| Companhia Energetica de Minas Gerais | | |
| Preference Shares ADR | 3,972 | 47,068 |
| Embraer SA ADR | 1,688 | 60,211 |
| Itau Unibanco Holding SA Preference Shares ADR | 2,914 | 51,869 |
| Petroleo Brasileiro SA ADR | 3,122 | 51,732 |
| Vale SA ADR | 2,798 | 48,377 |
| Total Brazil | | 421,681 |
| Chile—7.7% | | |
| Cencosud SA | 8,702 | 54,097 |
| Empresa Nacional de Electricidad SA ADR | 1,046 | 55,522 |
| Empresas Copec SA | 3,466 | 50,459 |
| Enersis SA ADR | 2,944 | 56,643 |
| Latam Airlines Group SA ADR | 2,108 | 45,828 |
| S.A.C.I. Falabella | 4,782 | 57,459 |
| Total Chile | | 320,008 |
| China—14.6% | | |
| AAC Technologies Holdings, Inc. | 5,304 | 25,486 |
| Baidu, Inc. ADR* | 162 | 14,208 |
| Bank of China, Ltd. Class H | 47,812 | 22,173 |
| China Construction Bank Corp. Class H | 26,980 | 22,036 |
| China Life Insurance Co. Ltd. Class H ADR | 460 | 18,133 |
| China Merchants Holdings International Co., Ltd. | 6,208 | 20,353 |
| China Mobile Ltd. ADR | 378 | 20,083 |
| China Overseas Land & Investment, Ltd. | 7,706 | 21,244 |
| China Pacific Insurance Group Co. Ltd. Class H | 6,290 | 20,703 |
| China Resources Enterprise, Ltd. | 6,252 | 18,524 |
| China Resources Land Ltd. | 8,604 | 24,052 |
| China Unicom Hong Kong, Ltd. ADR | 1,148 | 15,475 |
| Cosco Pacific Ltd. | 14,068 | 20,297 |
| Ctrip.com International, Ltd. ADR* | 1,076 | 23,005 |
| Digital China Holdings Ltd. | 10,934 | 14,790 |
| Dongfeng Motor Group Co., Ltd. Class H | 15,862 | 22,273 |
| Evergrande Real Estate Group, Ltd. | 47,216 | 19,038 |
| Focus Media Holding Ltd. ADR | 830 | 22,252 |
| GCL-Poly Energy Holdings Ltd. | 98,174 | 19,982 |
| Industrial and Commercial Bank of China, Ltd. Class H | 31,078 | 21,779 |
| Lenovo Group, Ltd. | 22,030 | 21,881 |
| Mindray Medical International, Ltd. ADR | 566 | 22,606 |
| NetEase.com, Inc. ADR | 348 | 19,060 |
| New Oriental Education & Technology Group, Ltd. ADR | 1,332 | 23,976 |
| Picc Property & Casualty Co. Ltd. Class H | 15,610 | 20,049 |
| Ping An Insurance Group Co. of China, Ltd. Class H | 2,620 | 20,318 |
| Shandong Weigao Group Medical | | |
| Polymer Co., Ltd. Class H | 18,660 | 16,899 |
| Sinopharm Group Co. Class H | 6,192 | 19,981 |
| Tencent Holdings Ltd. | 594 | 18,885 |
| ZTE Corp. Class H | 12,210 | 21,077 |
| Total China | | 610,618 |
| Colombia—1.4% | | |
| Grupo de Inversiones Suramericana SA | 2,720 | 58,031 |
| | |
| Investments | Shares | Value |
| |
| Czech Republic—1.0% | | |
| CEZ AS | 1,482 | $ | 43,472 |
| Egypt—1.1% | | |
| Orascom Construction Industries* | 1,292 | 45,811 |
| Hungary—1.1% | | |
| Richter Gedeon Nyrt. | 316 | 44,274 |
| India—14.8% | | |
| Bharti Airtel, Ltd. | 6,900 | 37,039 |
| Cipla, Ltd. | 5,580 | 38,988 |
| Dabur India, Ltd. | 15,998 | 40,311 |
| Hindustan Unilever, Ltd. | 4,292 | 36,875 |
| Infosys, Ltd. ADR | 746 | 40,217 |
| ITC, Ltd. | 7,432 | 42,315 |
| Larsen & Toubro, Ltd. | 1,328 | 33,382 |
| Mahindra & Mahindra, Ltd. | 2,434 | 38,572 |
| NTPC, Ltd. | 13,156 | 34,360 |
| Reliance Industries Ltd. | 2,424 | 34,471 |
| Sun Pharmaceutical Industries, Ltd. | 2,836 | 42,733 |
| Tata Consultancy Services, Ltd. | 1,444 | 41,865 |
| Tata Motors, Ltd. ADR | 1,434 | 35,004 |
| Titan Industries, Ltd. | 8,468 | 39,948 |
| Wipro, Ltd. | 4,940 | 39,734 |
| Zee Entertainment Enterprises, Ltd. | 10,342 | 40,046 |
| Total India | | 615,860 |
| Indonesia—3.8% | | |
| Astra International Tbk PT | 64,786 | 52,669 |
| Telekomunikasi Indonesia Tbk PT ADR | 1,252 | 56,440 |
| Unilever Indonesia Tbk PT | 20,702 | 48,572 |
| Total Indonesia | | 157,681 |
| Malaysia—7.5% | | |
| AirAsia BHD | 55,400 | 51,169 |
| Genting BHD | 17,000 | 55,120 |
| Genting Malaysia BHD | 45,600 | 54,046 |
| IOI Corp. BHD | 32,600 | 49,061 |
| Sime Darby BHD | 16,800 | 50,240 |
| Tenaga Nasional BHD | 23,400 | 54,410 |
| Total Malaysia | | 314,046 |
| Mexico—8.2% | | |
| America Movil SAB de CV Series L ADR | 2,116 | 44,352 |
| Fomento Economico Mexicano SAB de CV ADR | 518 | 58,793 |
| Grupo Bimbo SAB de CV Series A | 20,228 | 64,737 |
| Grupo Televisa SAB ADR | 2,068 | 55,029 |
| Kimberly-Clark de Mexico SAB de CV Class A | 18,462 | 64,502 |
| Wal-Mart de Mexico SAB de CV Series V | 16,194 | 53,021 |
| Total Mexico | | 340,434 |
| Philippines—1.5% | | |
| Ayala Land, Inc. | 78,400 | 62,820 |
| Poland—1.1% | | |
| Powszechny Zaklad Ubezpieczen SA | 388 | 48,195 |
| Russia—8.6% | | |
| Gazprom OAO ADR | 5,342 | 45,674 |
| LUKOIL OAO ADR | 802 | 51,649 |
| Magnit OJSC GDR | 1,260 | 56,889 |
| MMC Norilsk Nickel OJSC ADR | 3,032 | 51,210 |
| Sberbank of Russia ADR | 3,918 | 50,229 |
| Surgutneftegas ADR | 5,536 | 49,492 |
| Uralkali OJSC GDR | 1,432 | 52,812 |
| Total Russia | | 357,955 |
The accompanying notes are an integral part of these financial statements.
| 62 EGA Emerging Global Shares Trust |
Schedule of Investments (Consolidated)† (concluded)
EGShares Emerging Markets Core ETF
| | |
| Investments | Shares | Value |
| |
| South Africa—14.4% | | |
| AngloGold Ashanti, Ltd. ADR | 1,186 | $ | 27,930 |
| Aspen Pharmacare Holdings, Ltd.* | 1,798 | 37,430 |
| Bidvest Group, Ltd. | 1,306 | 34,500 |
| FirstRand, Ltd. | 10,056 | 35,294 |
| Gold Fields, Ltd. ADR | 4,482 | 34,736 |
| Impala Platinum Holdings, Ltd. | 2,158 | 31,896 |
| Imperial Holdings, Ltd. | 1,482 | 33,960 |
| MTN Group, Ltd. | 1,744 | 30,696 |
| Naspers, Ltd. N Shares | 532 | 33,218 |
| Netcare, Ltd. | 15,250 | 32,962 |
| Remgro, Ltd. | 1,832 | 36,572 |
| Sanlam, Ltd. | 6,978 | 35,885 |
| Sasol Ltd. ADR | 772 | 34,230 |
| Shoprite Holdings, Ltd. | 1,706 | 33,992 |
| Steinhoff International Holdings, Ltd.* | 11,642 | 31,737 |
| Tiger Brands, Ltd. | 1,022 | 32,750 |
| Truworths International, Ltd. | 3,102 | 30,488 |
| Woolworths Holdings, Ltd. | 4,468 | 34,383 |
| Total South Africa | | 602,659 |
| Turkey—2.8% | | |
| Arcelik AS | 8,462 | 59,858 |
| Haci OMER Sabanci Holding AS | 9,760 | 57,713 |
| Total Turkey | | 117,571 |
| TOTAL INVESTMENTS IN SECURITIES—99.7% | |
| (Cost: $4,067,302) | | 4,161,116 |
| Other Assets in Excess of Liabilities—0.3% | | 12,098 |
| Net Assets—100.0% | | $ | 4,173,214 |
| † | The Consolidated Schedule of Investments includes the accounts of the wholly owned subsidiary. All inter-company accounts and transactions have been eliminated in consolidation. See Note 2 of the Notes to Financial Statements. |
| * | Non-income producing security. |
| ADR | American Depositary Receipts |
| GDR | Global Depositary Receipts |
| | |
| Summary by Sector | Value | % of
Net Assets |
| Consumer Discretionary | $ | 743,043 | 17.8% |
| Consumer Staples | 763,982 | 18.3 |
| Energy | 317,707 | 7.6 |
| Financials | 699,014 | 16.8 |
| Health Care | 255,873 | 6.1 |
| Industrials | 361,791 | 8.7 |
| Information Technology | 277,185 | 6.6 |
| Materials | 246,961 | 5.9 |
| Telecommunication Services | 204,085 | 4.9 |
| Utilities | 291,475 | 7.0 |
| Total Investments | 4,161,116 | 99.7 |
| Other Assets in Excess of Liabilities | 12,098 | 0.3 |
| Net Assets | $ | 4,173,214 | 100.0% |
The accompanying notes are an integral part of these financial statements.
| | EGA Emerging Global Shares Trust 63 |
Schedule of Investments (Consolidated)†
EGShares Emerging Markets Domestic Demand ETF
| | |
| Investments | Shares | Value |
| |
| COMMON STOCKS—100.4% | | |
| Brazil—13.5% | | |
| BRF—Brasil Foods SA ADR | 3,652 | $ | 80,746 |
| Centrais Eletricas Brasileiras SA ADR | 1,380 | 4,720 |
| Cia Energetica de Minas Gerais ADR | 589 | 6,980 |
| Companhia de Bebidas das Americas | | |
| Preference Shares ADR | 2,535 | 107,306 |
| Companhia de Saneamento Basico do Estado | | |
| de Sao Paulo ADR* | 538 | 25,679 |
| Companhia Paranaense de Energia-Copel | | |
| Preference Shares ADR | 174 | 2,692 |
| CPFL Energia SA ADR | 93 | 1,947 |
| Telefonica Brasil SA Preference Shares ADR | 2,551 | 68,061 |
| Total Brazil | | 298,131 |
| Chile—1.0% | | |
| Enersis SA ADR | 1,184 | 22,780 |
| China—16.2% | | |
| BYD Co., Ltd. Class H* | 12,924 | 41,206 |
| China Telecom Corp., Ltd. Class H | 191,606 | 96,511 |
| Dongfeng Motor Group Co., Ltd. Class H | 39,168 | 54,998 |
| Great Wall Motor Co., Ltd. Class H | 15,718 | 53,253 |
| Huaneng Power International, Inc. Class H | 75,575 | 80,612 |
| Sinopharm Group Co. Class H | 9,875 | 31,866 |
| Total China | | 358,446 |
| India—14.1% | | |
| Bajaj Auto, Ltd. | 569 | 18,840 |
| Bharti Airtel, Ltd. | 4,992 | 26,797 |
| Cipla, Ltd. | 1,954 | 13,653 |
| Dr Reddy’s Laboratories Ltd. | 531 | 17,259 |
| GAIL India, Ltd. | 1,600 | 9,369 |
| Hero MotoCorp, Ltd. | 146 | 4,142 |
| ITC, Ltd. | 20,853 | 118,730 |
| Mahindra & Mahindra, Ltd. | 1,952 | 30,934 |
| Sun Pharmaceutical Industries, Ltd. | 2,505 | 37,745 |
| Tata Motors, Ltd. ADR | 1,458 | 35,590 |
| Total India | | 313,059 |
| Indonesia—7.1% | | |
| Astra International Tbk PT | 88,854 | 72,235 |
| Perusahaan Gas Negara PT | 50,671 | 31,026 |
| Telekomunikasi Indonesia Tbk PT ADR | 1,208 | 54,456 |
| Total Indonesia | | 157,717 |
| Malaysia—4.2% | | |
| Axiata Group BHD | 16,800 | 35,917 |
| Genting BHD | 11,200 | 36,315 |
| Tenaga Nasional BHD | 9,000 | 20,927 |
| Total Malaysia | | 93,159 |
| | |
| Investments | Shares | Value |
| |
| Mexico—24.3% | | |
| America Movil SAB de CV Series L ADR | 2,967 | $ | 62,188 |
| Coca-Cola Femsa SAB de CV ADR | 517 | 84,669 |
| Fomento Economico Mexicano SAB de CV ADR | 1,204 | 136,654 |
| Grupo Elektra SAB de CV | 315 | 12,423 |
| Grupo Modelo SAB de CV Series C | 10,592 | 96,099 |
| Grupo Televisa SAB ADR | 2,581 | 68,681 |
| Wal-Mart de Mexico SAB de CV Series V | 23,888 | 78,212 |
| Total Mexico | | 538,926 |
| Philippines—1.5% | | |
| Philippine Long Distance Telephone Co. ADR | 472 | 33,484 |
| Poland—0.8% | | |
| PGE SA | 3,378 | 17,386 |
| Russia—2.8% | | |
| Federal Hydrogenerating Co. JSC ADR | 1,146 | 2,229 |
| Mobile TeleSystems ADR | 2,837 | 58,839 |
| Total Russia | | 61,068 |
| South Africa—12.2% | | |
| Aspen Pharmacare Holdings, Ltd. | 937 | 19,506 |
| Imperial Holdings, Ltd. | 639 | 14,642 |
| MTN Group, Ltd. | 5,204 | 91,596 |
| Naspers, Ltd. N Shares | 1,563 | 97,593 |
| Steinhoff International Holdings, Ltd.* | 4,821 | 13,142 |
| Truworths International, Ltd. | 1,598 | 15,706 |
| Woolworths Holdings, Ltd. | 2,463 | 18,953 |
| Total South Africa | | 271,138 |
| Thailand—2.7% | | |
| Advanced Info Service PCL | 7,400 | 59,635 |
| TOTAL INVESTMENTS IN SECURITIES—100.4% | | |
| (Cost: $1,963,153) | | 2,224,929 |
| Liabilities in Excess of Other Assets—(0.4)% | | (9,038) |
| Net Assets—100.0% | | $ | 2,215,891 |
| † | The Consolidated Schedule of Investments includes the accounts of the wholly owned subsidiary. All inter-company accounts and transactions have been eliminated in consolidation. See Note 2 of the Notes to Financial Statements. |
| * | Non-income producing security |
| ADR | American Depositary Receipts |
| | |
| Summary by Sector | Value | % of
Net Assets |
| Consumer Discretionary | $ | 588,653 | 26.6% |
| Consumer Staples | 702,416 | 31.7 |
| Health Care | 120,029 | 5.4 |
| Telecommunication Services | 587,484 | 26.5 |
| Utilities | 226,347 | 10.2 |
| Total Investments | 2,224,929 | 100.4 |
| Liabilities in Excess of Other Assets | (9,038) | (0.4) |
| Net Assets | $ | 2,215,891 | 100.0% |
The accompanying notes are an integral part of these financial statements.
| 64 EGA Emerging Global Shares Trust |
Schedule of Investments (Consolidated)†
EGShares Emerging Markets Metals & Mining ETF
| | |
| Investments | Shares | Value |
| |
| COMMON STOCKS—99.8% | | |
| Brazil—16.8% | | |
| Companhia Siderurgica Nacional SA ADR | 53,125 | $ | 238,000 |
| Gerdau SA Preference Shares ADR | 51,825 | 399,571 |
| Vale SA ADR | 46,073 | 796,602 |
| Total Brazil | | 1,434,173 |
| Chile—2.3% | | |
| Capital SA | 6,112 | 198,046 |
| China—19.0% | | |
| Aluminum Corp. of China, Ltd. Class H* | 368,071 | 141,773 |
| China Coal Energy Co., Ltd. Class H | 301,451 | 268,728 |
| China Shenhua Energy Co., Ltd. Class H | 164,123 | 596,223 |
| Jiangxi Copper Co., Ltd. Class H | 107,173 | 236,639 |
| Yanzhou Coal Mining Co., Ltd. Class H | 151,516 | 204,164 |
| Zijin Mining Group Co., Ltd. Class H | 511,151 | 168,569 |
| Total China | | 1,616,096 |
| India—10.7% | | |
| Coal India, Ltd. | 43,683 | 248,435 |
| Hindalco Industries, Ltd. | 78,030 | 131,510 |
| Jindal Steel & Power, Ltd. | 29,399 | 188,105 |
| Steel Authority of India, Ltd. | 63,508 | 73,090 |
| Sterlite Industries India, Ltd. ADR | 19,994 | 139,558 |
| Tata Steel, Ltd. | 23,196 | 133,521 |
| Total India | | 914,219 |
| Indonesia—1.7% | | |
| Bumi Resources Tbk PT | 1,997,486 | 141,833 |
| Mexico—10.7% | | |
| Grupo Mexico SAB de CV Series B | 133,695 | 540,559 |
| Industrias Penoles SAB de CV | 7,875 | 374,260 |
| Total Mexico | | 914,819 |
| Poland—4.9% | | |
| KGHM Polska Miedz SA | 8,510 | 412,882 |
| | |
| Investments | Shares | Value |
| |
| Russia—11.3% | | |
| Evraz PLC | 38,152 | $ | 128,609 |
| MMC Norilsk Nickel OJSC ADR | 35,046 | 591,927 |
| Novolipetsk Steel GDR | 6,983 | 110,122 |
| Severstal GDR | 15,094 | 134,110 |
| Total Russia | | 964,768 |
| South Africa—20.4% | | |
| Anglo American Platinum, Ltd.* | 4,513 | 187,988 |
| AngloGold Ashanti, Ltd. | 20,955 | 491,278 |
| Gold Fields, Ltd. | 44,990 | 344,740 |
| Impala Platinum Holdings, Ltd. | 29,233 | 432,069 |
| Kumba Iron Ore, Ltd. | 5,158 | 276,592 |
| Total South Africa | | 1,732,667 |
| Turkey—2.0% | | |
| Eregli Demir ve Celik Fabrikalari TAS | 132,911 | 172,612 |
| TOTAL INVESTMENTS IN SECURITIES—99.8% | |
| (Cost: $13,675,313) | | 8,502,115 |
| Other Assets in Excess of Liabilities—0.2% | | 15,480 |
| Net Assets—100.0% | | $ | 8,517,595 |
| † | The Consolidated Schedule of Investments includes the accounts of the wholly owned subsidiary. All inter-company accounts and transactions have been eliminated in consolidation. See Note 2 of the Notes to Financial Statements. |
| * | Non-income producing security |
| ADR | American Depositary Receipts |
| GDR | Global Depositary Receipts |
| | |
| Summary by Sector | Value | % of
Net Assets |
| Industrial Metals & Mining | $ | 4,621,486 | 54.2% |
| Mining | 3,880,629 | 45.6 |
| Total Investments | 8,502,115 | 99.8 |
| Other Assets in Excess of Liabilities | 15,480 | 0.2 |
| Net Assets | $ | 8,517,595 | 100.0% |
The accompanying notes are an integral part of these financial statements.
| | EGA Emerging Global Shares Trust 65 |
Schedule of Investments (Consolidated)†
EGShares Energy GEMS ETF
| | |
| Investments | Shares | Value |
| |
| COMMON STOCKS—99.7% | | |
| Brazil—6.5% | | |
| Petroleo Brasileiro SA ADR | 35,550 | $ | 589,064 |
| Chile—2.8% | | |
| Empresas Copec SA | 17,714 | 257,883 |
| China—22.4% | | |
| China Oilfield Services, Ltd. Class H | 67,867 | 142,157 |
| China Petroleum & Chemical Corp. Class H | 345,362 | 406,641 |
| CNOOC, Ltd. | 328,937 | 632,225 |
| Kunlun Energy Co., Ltd. | 122,688 | 260,781 |
| PetroChina Co., Ltd. Class H | 460,682 | 604,142 |
| Total China | | 2,045,946 |
| Colombia—4.1% | | |
| Ecopetrol SA ADR | 6,926 | 377,606 |
| Hungary—1.6% | | |
| MOL Hungarian Oil and Gas PLC | 2,094 | 147,465 |
| India—14.1% | | |
| Bharat Petroleum Corp., Ltd. | 12,481 | 86,735 |
| Cairn India, Ltd. | 23,818 | 119,397 |
| GAIL India, Ltd. | 16,008 | 93,736 |
| Indian Oil Corp., Ltd. | 24,540 | 127,147 |
| Oil & Natural Gas Corp., Ltd. | 59,112 | 338,684 |
| Reliance Industries, Ltd. GDR 144A | 18,150 | 516,912 |
| Total India | | 1,282,611 |
| Malaysia—1.0% | | |
| Petronas Dagangan BHD | 12,300 | 93,109 |
| Poland—3.8% | | |
| Polski Koncern Naftowy Orlen SA* | 12,861 | 203,248 |
| Polskie Gornictwo Naftowe i Gazownictwo SA* | 83,255 | 141,555 |
| Total Poland | | 344,803 |
| Russia—31.5% | | |
| Gazprom Neft JSC ADR | 808 | 17,049 |
| Gazprom OAO ADR | 107,732 | 921,109 |
| LUKOIL OAO ADR | 10,441 | 672,400 |
| NovaTek OAO GDR | 3,798 | 409,424 |
| Rosneft Oil Co. OJSC GDR | 36,334 | 277,228 |
| Surgutneftegas ADR | 32,389 | 289,558 |
| Tatneft ADR | 7,408 | 293,209 |
| Total Russia | | 2,879,977 |
| | |
| Investments | Shares | Value |
| |
| South Africa—4.6% | | |
| Sasol, Ltd. | 9,542 | $ | 423,659 |
| Thailand—5.4% | | |
| PTT Exploration & Production PCL | 30,965 | 157,019 |
| PTT PCL | 21,989 | 243,279 |
| Thai Oil PCL | 43,686 | 95,472 |
| Total Thailand | | 495,770 |
| Turkey—1.9% | | |
| Tupras-Turkiye Petrol Rafinerileri AS | 5,683 | 171,165 |
| TOTAL INVESTMENTS IN SECURITIES—99.7% | | |
| (Cost: $10,911,710) | | 9,109,058 |
| Other Assets in Excess of Liabilities—0.3% | | 23,287 |
| Net Assets—100.0% | | $ | 9,132,345 |
| † | The Consolidated Schedule of Investments includes the accounts of the wholly owned subsidiary. All inter-company accounts and transactions have been eliminated in consolidation. See Note 2 of the Notes to Financial Statements. |
| * | Non-income producing security |
| ADR | American Depositary Receipts |
| GDR | Global Depositary Receipts |
| 144A | Series 144A securities were purchased pursuant to Rule 144A under the Securities Act of 1933 and may not be resold subject to that rule except to qualified institutional buyers. Unless otherwise noted, Series 144A securities are deemed to be liquid. |
| | |
| Summary by Sector | Value | % of
Net Assets |
| Oil & Gas Producers | $ | 8,966,901 | 98.2% |
| Oil Equipment, Services & Distribution | 142,157 | 1.5 |
| Total Investments | 9,109,058 | 99.7 |
| Other Assets in Excess of Liabilities | 23,287 | 0.3 |
| Net Assets | $ | 9,132,345 | 100.0% |
The accompanying notes are an integral part of these financial statements.
| 66 EGA Emerging Global Shares Trust |
Schedule of Investments (Consolidated)†
EGShares Financials GEMS ETF
| | |
| Investments | Shares | Value |
| |
| COMMON STOCKS—99.9% | | |
| Brazil—14.2% | | |
| Banco Bradesco SA Preference Shares ADR | 16,240 | $ | 276,405 |
| Banco Santander Brasil SA ADS | 6,455 | 46,863 |
| Itau Unibanco Holding SA Preference Shares ADR | 16,391 | 291,760 |
| Total Brazil | | 615,028 |
| China—41.1% | | |
| Agricultural Bank of China, Ltd. Class H | 237,644 | 113,883 |
| Bank of China, Ltd. Class H | 524,227 | 243,115 |
| Bank of Communications Co., Ltd. Class H | 75,580 | 56,568 |
| China Citic Bank Corp., Ltd. Class H | 89,968 | 54,009 |
| China Construction Bank Corp. Class H | 543,640 | 444,008 |
| China Life Insurance Co., Ltd. Class H | 63,792 | 165,178 |
| China Merchants Bank Co., Ltd. Class H | 37,399 | 79,205 |
| China Overseas Land & Investment, Ltd. | 37,068 | 102,189 |
| Industrial and Commercial Bank of | | |
| China, Ltd. Class H | 558,445 | 391,354 |
| Ping An Insurance Group Co. of China, Ltd. Class H | 17,260 | 133,853 |
| Total China | | 1,783,362 |
| India—11.7% | | |
| HDFC Bank, Ltd. ADR | 3,480 | 130,222 |
| Housing Development Finance Corp., Ltd. | 13,038 | 198,209 |
| ICICI Bank, Ltd. ADR | 2,748 | 117,889 |
| State Bank of India GDR | 748 | 62,346 |
| Total India | | 508,666 |
| Indonesia—3.6% | | |
| Bank Central Asia Tbk PT | 133,117 | 156,165 |
| Malaysia—3.3% | | |
| CIMB Group Holdings BHD | 26,200 | 64,728 |
| Malayan Banking BHD | 25,600 | 77,713 |
| Total Malaysia | | 142,441 |
| Mexico—3.3% | | |
| Grupo Financiero Banorte SAB de CV Class O | 17,834 | 142,624 |
| Poland—1.8% | | |
| Powszechna Kasa Oszczednosci Bank Polski SA | 7,421 | 78,831 |
| | |
| Investments | Shares | Value |
| |
| Russia—6.8% | | |
| Sberbank of Russia ADR | 19,402 | $ | 248,734 |
| VTB Bank OJSC GDR | 14,637 | 46,048 |
| Total Russia | | 294,782 |
| South Africa—8.8% | | |
| ABSA Group, Ltd. | 3,167 | 53,506 |
| FirstRand, Ltd. | 26,844 | 94,216 |
| Sanlam, Ltd. | 18,575 | 95,522 |
| Standard Bank Group, Ltd. | 10,889 | 140,515 |
| Total South Africa | | 383,759 |
| Turkey—5.3% | | |
| Akbank TAS | 21,177 | 111,182 |
| Turkiye Garanti Bankasi AS | 22,081 | 117,147 |
| Total Turkey | | 228,329 |
| TOTAL INVESTMENTS IN SECURITIES—99.9% | |
| (Cost: $4,371,371) | | 4,333,987 |
| Other Assets in Excess of Liabilities—0.1% | | 5,661 |
| Net Assets—100.0% | | $ | 4,339,648 |
| † | The Consolidated Schedule of Investments includes the accounts of the wholly owned subsidiary. All inter-company accounts and transactions have been eliminated in consolidation. See Note 2 of the Notes to Financial Statements. |
| ADR | American Depositary Receipts |
| ADS | American Depositary Shares |
| GDR | Global Depositary Receipts |
| | |
| Summary by Sector | Value | % of
Net Assets |
| Banks | $ | 3,639,036 | 83.8% |
| Financial Services | 198,209 | 4.6 |
| Life Insurance | 394,553 | 9.1 |
| Real Estate Investment & Services | 102,189 | 2.4 |
| Total Investments | 4,333,987 | 99.9 |
| Other Assets in Excess of Liabilities | 5,661 | 0.1 |
| Net Assets | $ | 4,339,648 | 100.0% |
The accompanying notes are an integral part of these financial statements.
| | EGA Emerging Global Shares Trust 67 |
Schedule of Investments (Consolidated)†
EGShares GEMS Composite ETF
| | |
| Investments | Shares | Value |
| |
| COMMON STOCKS—99.8% | | |
| Brazil—16.9% | | |
| Banco Bradesco SA Preference Shares ADR | 26,881 | $ | 457,515 |
| BRF—Brasil Foods SA ADR | 8,949 | 197,863 |
| Companhia Brasileira de Distribuicao Grupo Pao | | |
| de Acucar Preference Shares ADR | 1,790 | 95,371 |
| Companhia de Bebidas das Americas | | |
| Preference Shares ADR | 9,608 | 406,706 |
| Companhia de Saneamento Basico do Estado | | |
| de Sao Paulo ADR* | 1,326 | 63,290 |
| Companhia Energetica de Minas Gerais | | |
| Preference Shares ADR | 4,558 | 54,012 |
| Companhia Siderurgica Nacional SA ADR | 10,577 | 47,385 |
| Embraer SA ADR | 1,974 | 70,413 |
| Gerdau SA Preference Shares ADR | 9,350 | 72,088 |
| Itau Unibanco Holding SA Preference Shares ADR | 29,192 | 519,617 |
| Petroleo Brasileiro SA ADR | 20,943 | 347,026 |
| Telefonica Brasil SA Preference Shares ADR | 3,542 | 94,501 |
| Ultrapar Participacoes SA ADR | 5,864 | 148,828 |
| Vale SA ADR | 16,697 | 288,691 |
| Total Brazil | | 2,863,306 |
| Chile—2.2% | | |
| Cencosud SA | 13,603 | 84,565 |
| Empresa Nacional de Electricidad SA ADR | 1,597 | 84,769 |
| Enersis SA ADR | 3,624 | 69,726 |
| S.A.C.I. Falabella | 11,632 | 139,766 |
| Total Chile | | 378,826 |
| China—28.6% | | |
| Baidu, Inc. ADR* | 3,482 | 305,371 |
| Bank of China, Ltd. Class H | 836,178 | 387,785 |
| China Communications Construction Co., Ltd. | | |
| Class H | 59,322 | 55,175 |
| China Construction Bank Corp. Class H | 1,036,883 | 846,855 |
| China Life Insurance Co., Ltd. Class H | 94,529 | 244,766 |
| China Mobile, Ltd. | 65,532 | 693,929 |
| China Petroleum & Chemical Corp. Class H | 204,292 | 240,540 |
| China Shenhua Energy Co., Ltd. Class H | 40,961 | 148,802 |
| China Telecom Corp., Ltd. Class H | 189,339 | 95,369 |
| China Unicom Hong Kong, Ltd. | 45,288 | 60,674 |
| CNOOC, Ltd. | 205,795 | 395,543 |
| Dongfeng Motor Group Co., Ltd. Class H | 33,633 | 47,226 |
| Industrial and Commercial Bank of China, Ltd. | | |
| Class H | 1,035,654 | 725,778 |
| Lenovo Group, Ltd. | 64,626 | 64,188 |
| Mindray Medical International, Ltd. ADR | 1,316 | 52,561 |
| NetEase.com, Inc. ADR | 819 | 44,857 |
| PetroChina Co., Ltd. Class H | 266,180 | 349,071 |
| Shandong Weigao Group Medical Polymer Co., Ltd. | | |
| Class H | 24,146 | 21,867 |
| SINA Corp.* | 522 | 25,364 |
| Sinopharm Group Co. Class H | 4,367 | 14,092 |
| Sohu.com, Inc.* | 497 | 24,656 |
| ZTE Corp. Class H | 3,851 | 6,648 |
| Total China | | 4,851,117 |
| Czech Republic—0.4% | | |
| CEZ AS | 2,133 | 62,569 |
| Egypt—0.2% | | |
| Orascom Construction Industries* | 1,197 | 42,443 |
| | |
| Investments | Shares | Value |
| |
| Hungary—0.2% | | |
| Richter Gedeon Nyrt. | 184 | $ | 25,780 |
| India—10.4% | | |
| Bharti Airtel, Ltd. | 11,250 | 60,390 |
| Cipla, Ltd. | 2,971 | 20,759 |
| Dr. Reddy’s Laboratories, Ltd. ADR | 824 | 26,656 |
| HDFC Bank, Ltd. ADR | 4,514 | 168,914 |
| Hindustan Unilever, Ltd. | 12,948 | 111,243 |
| Housing Development Finance Corp., Ltd. | 19,082 | 290,092 |
| Infosys, Ltd. ADR | 6,173 | 332,786 |
| ITC, Ltd. | 23,037 | 131,165 |
| Mahindra & Mahindra, Ltd. | 2,547 | 40,363 |
| NTPC, Ltd. | 8,458 | 22,090 |
| Reliance Industries, Ltd. GDR 144A | 9,612 | 273,750 |
| Sun Pharmaceutical Industries, Ltd. | 4,894 | 73,743 |
| Tata Consultancy Services, Ltd. | 4,488 | 130,119 |
| Tata Motors, Ltd. ADR | 1,464 | 35,736 |
| Tata Motors, Ltd. | 1,508 | 7,468 |
| Wipro, Ltd. ADR | 4,319 | 43,622 |
| Total India | | 1,768,896 |
| Indonesia—2.8% | | |
| Astra International Tbk PT | 245,268 | 199,395 |
| Perusahaan Gas Negara PT | 165,860 | 101,556 |
| Telekomunikasi Indonesia Persero Tbk PT | 116,166 | 131,497 |
| United Tractors Tbk PT | 21,491 | 40,251 |
| Total Indonesia | | 472,699 |
| Malaysia—1.9% | | |
| Genting BHD | 32,100 | 104,080 |
| IOI Corp. BHD | 35,893 | 54,016 |
| Sime Darby BHD | 32,500 | 97,190 |
| Tenaga Nasional BHD | 30,700 | 71,384 |
| Total Malaysia | | 326,670 |
| Mexico—10.3% | | |
| America Movil SAB de CV Series L | 655,398 | 695,280 |
| Cemex SAB de CV Series CPO* | 143,643 | 174,968 |
| Fomento Economico Mexicano SAB de CV Series UBD | 22,545 | 253,914 |
| Grupo Bimbo SAB de CV Series A | 34,615 | 110,781 |
| Grupo Mexico SAB de CV Series B | 32,307 | 130,625 |
| Grupo Televisa SAB Series CPO | 27,726 | 147,290 |
| Wal-Mart de Mexico SAB de CV Series V | 72,948 | 238,842 |
| Total Mexico | | 1,751,700 |
| Poland—0.1% | | |
| Asseco Poland SA | 961 | 12,410 |
| Russia—13.2% | | |
| Federal Hydrogenerating Co. JSC ADR | 9,541 | 18,557 |
| Gazprom OAO ADR | 74,141 | 633,906 |
| LUKOIL OAO ADR | 6,600 | 425,040 |
| Magnit OJSC GDR | 3,275 | 147,866 |
| MMC Norilsk Nickel OJSC ADR | 8,422 | 142,248 |
| Mobile TeleSystems ADR | 6,227 | 129,148 |
| Rosneft Oil Co. OJSC GDR | 11,703 | 89,294 |
| Sberbank of Russia ADR | 32,960 | 422,547 |
| Surgutneftegas ADR | 11,960 | 106,922 |
| Uralkali OJSC GDR | 3,145 | 115,988 |
| Total Russia | | 2,231,516 |
The accompanying notes are an integral part of these financial statements.
| 68 EGA Emerging Global Shares Trust |
Schedule of Investments (Consolidated)† (concluded)
EGShares GEMS Composite ETF
| | |
| Investments | Shares | Value |
| |
| South Africa—11.5% | | |
| AngloGold Ashanti, Ltd. | 4,956 | $ | 116,191 |
| Aspen Pharmacare Holdings, Ltd. | 4,369 | 90,952 |
| Bidvest Group, Ltd. | 3,324 | 87,810 |
| Gold Fields, Ltd. | 9,735 | 74,595 |
| Impala Platinum Holdings, Ltd. | 7,295 | 107,821 |
| Imperial Holdings, Ltd. | 2,717 | 62,259 |
| Mediclinic International, Ltd. | 4,813 | 33,680 |
| MTN Group, Ltd. | 20,090 | 353,605 |
| Naspers, Ltd. N Shares | 5,319 | 332,117 |
| Netcare, Ltd. | 16,998 | 36,740 |
| Sasol, Ltd. | 6,398 | 284,067 |
| Shoprite Holdings, Ltd. | 4,401 | 87,690 |
| Standard Bank Group, Ltd. | 16,804 | 216,844 |
| Tiger Brands, Ltd. | 2,094 | 67,103 |
| Total South Africa | | 1,951,474 |
| Thailand—1.1% | | |
| Advanced Info Service PCL | 14,600 | 117,657 |
| CP ALL PCL | 43,100 | 67,332 |
| Total Thailand | | 184,989 |
| TOTAL INVESTMENTS IN SECURITIES—99.8% | | |
| (Cost: $17,869,420) | | 16,924,395 |
| Other Assets in Excess of Liabilities—0.2% | | 28,405 |
| Net Assets—100.0% | | $ | 16,952,800 |
| † | The Consolidated Schedule of Investments includes the accounts of the wholly owned subsidiary. All inter-company accounts and transactions have been eliminated in consolidation. See Note 2 of the Notes to Financial Statements. |
| * | Non-income producing security |
| ADR | American Depositary Receipts |
| GDR | Global Depositary Receipts |
| 144A | Series 144A securities were purchased pursuant to Rule 144A under the Securities Act of 1933 and may not be resold subject to that rule except to qualified institutional buyers. Unless otherwise noted, Series 144A securities are deemed to be liquid. |
| Summary by Industry | Value | % of
Net Assets |
| Basic Materials | $ | 1,244,434 | 7.3% |
| Consumer Goods | 1,579,412 | 9.3 |
| Consumer Services | 1,444,919 | 8.5 |
| Financials | 4,280,713 | 25.3 |
| Health Care | 396,830 | 2.3 |
| Industrials | 714,076 | 4.2 |
| Oil & Gas | 3,145,159 | 18.6 |
| Technology | 990,021 | 5.8 |
| Telecommunications | 2,432,050 | 14.4 |
| Utilities | 696,781 | 4.1 |
| Total Investments | 16,924,395 | 99.8 |
| Other Assets in Excess of Liabilities | 28,405 | 0.2 |
| Net Assets | $ | 16,952,800 | 100.0% |
The accompanying notes are an integral part of these financial statements.
| | EGA Emerging Global Shares Trust 69 |
Schedule of Investments (Consolidated)†
EGShares Health Care GEMS ETF
| | |
| Investments | Shares | Value |
| |
| COMMON STOCKS—99.8% | | |
| Chile—1.7% | | |
| Banmedica SA | 35,959 | $ | 95,273 |
| China—19.8% | | |
| CSPC Pharmaceutical Group, Ltd. | 87,453 | 37,290 |
| Mindray Medical International, Ltd. ADR | 8,588 | 343,004 |
| Shandong Weigao Group Medical | | |
| Polymer Co., Ltd. Class H | 203,930 | 184,683 |
| Shanghai Pharmaceuticals Holding Co., Ltd. Class H | 73,905 | 162,612 |
| Sinopharm Group Co. Class H | 83,138 | 268,285 |
| WuXi PharmaTech Cayman, Inc. ADR* | 8,342 | 143,316 |
| Total China | | 1,139,190 |
| Hungary—4.3% | | |
| EGIS Pharmaceuticals PLC | 504 | 38,267 |
| Richter Gedeon Nyrt. | 1,474 | 206,518 |
| Total Hungary | | 244,785 |
| India—29.3% | | |
| Apollo Hospitals Enterprise, Ltd. | 10,507 | 162,177 |
| Aurobindo Pharma, Ltd. | 16,323 | 43,833 |
| Biocon, Ltd. | 7,168 | 36,091 |
| Cipla, Ltd. | 34,494 | 241,014 |
| Divi’s Laboratories, Ltd. | 4,687 | 85,159 |
| Dr. Reddy’s Laboratories, Ltd. ADR | 7,778 | 251,618 |
| Glenmark Pharmaceuticals, Ltd. | 12,608 | 107,383 |
| Piramal Enterprises, Ltd. | 10,101 | 113,611 |
| Ranbaxy Laboratories, Ltd.* | 14,243 | 114,979 |
| Sun Pharmaceutical Industries, Ltd. | 35,109 | 529,025 |
| Total India | | 1,684,890 |
| Indonesia—4.5% | | |
| Kalbe Farma TBK PT | 2,044,607 | 260,902 |
| Malaysia—1.3% | | |
| Top Glove Corp. BHD | 43,000 | 74,988 |
| Mexico—3.5% | | |
| Genomma Lab Internacional SAB de CV Class B* | 82,831 | 202,796 |
| | |
| Investments | Shares | Value |
| |
| Russia—2.7% | | |
| Pharmstandard OJSC GDR* | 7,649 | $ | 157,952 |
| South Africa—27.3% | | |
| Adcock Ingram Holdings, Ltd. | 16,955 | 111,974 |
| Aspen Pharmacare Holdings, Ltd. | 28,101 | 584,995 |
| Life Healthcare Group Holdings, Ltd. | 99,919 | 376,829 |
| Mediclinic International, Ltd. | 35,006 | 244,961 |
| Netcare, Ltd. | 116,410 | 251,613 |
| Total South Africa | | 1,570,372 |
| Thailand—5.4% | | |
| Bangkok Dusit Medical Services PCL | 34,800 | 194,291 |
| Bumrungrad Hospital PCL | 40,500 | 118,935 |
| Total Thailand | | 313,226 |
| TOTAL INVESTMENTS IN SECURITIES—99.8% | | |
| (Cost: $5,399,322) | | 5,744,374 |
| Other Assets in Excess of Liabilities—0.2% | | 13,649 |
| Net Assets—100.0% | | $ | 5,758,023 |
| † | The Consolidated Schedule of Investments includes the accounts of the wholly owned subsidiary. All inter-company accounts and transactions have been eliminated in consolidation. See Note 2 of the Notes to Financial Statements. |
| * | Non-income producing security |
| ADR | American Depositary Receipts |
| GDR | Global Depositary Receipts |
| | |
| Summary by Sector | Value | % of
Net Assets |
| Health Care Equipment & Services | $ | 2,046,754 | 35.6% |
| Pharmaceuticals & Biotechnology | 3,697,620 | 64.2 |
| Total Investments | 5,744,374 | 99.8 |
| Other Assets in Excess of Liabilities | 13,649 | 0.2 |
| Net Assets | $ | 5,758,023 | 100.0% |
The accompanying notes are an integral part of these financial statements.
| 70 EGA Emerging Global Shares Trust |
Schedule of Investments (Consolidated)†
EGShares India Consumer ETF
| | |
| Investments | Shares | Value |
| |
| COMMON STOCKS—100.0% | | |
| Consumer Goods—75.8% | | |
| Apollo Tyres, Ltd. | 67,000 | $ | 102,873 |
| Bajaj Auto, Ltd. | 9,032 | 299,053 |
| Emami, Ltd. | 9,600 | 106,324 |
| Exide Industries, Ltd. | 96,000 | 228,652 |
| Gitanjali Gems, Ltd. | 8,100 | 88,288 |
| GlaxoSmithKline Consumer Healthcare, Ltd. | 5,281 | 408,070 |
| Godrej Consumer Products, Ltd. | 27,487 | 393,466 |
| Hero Motocorp, Ltd. | 10,392 | 294,838 |
| Hindustan Unilever, Ltd. | 38,298 | 329,039 |
| ITC, Ltd. | 67,118 | 382,147 |
| Marico, Ltd. | 64,000 | 250,701 |
| McLeod Russel India, Ltd. | 19,871 | 127,983 |
| Motherson Sumi Systems Ltd. | 79,500 | 283,991 |
| MRF, Ltd. | 500 | 110,136 |
| Nestle India, Ltd. | 3,843 | 324,424 |
| Tata Global Beverages, Ltd. | 92,304 | 217,131 |
| Titan Industries, Ltd. | 62,089 | 292,909 |
| TTK Prestige, Ltd. | 534 | 31,870 |
| United Breweries, Ltd. | 15,929 | 205,040 |
| United Spirits, Ltd. | 13,830 | 483,261 |
| Videocon Industries, Ltd. | 18,095 | 67,752 |
| Total Consumer Goods | | 5,027,948 |
| | |
| Investments | Shares | Value |
| |
| Consumer Services—13.5% | | |
| Dish TV India, Ltd.* | 89,579 | $ | 110,593 |
| Indian Hotels Co., Ltd. | 93,960 | 92,577 |
| Jubilant Foodworks, Ltd.* | 6,093 | 139,791 |
| Sun TV Network, Ltd. | 19,705 | 141,579 |
| TV18 Broadcast Ltd.* | 170,000 | 87,893 |
| Zee Entertainment Enterprises, Ltd. | 82,718 | 320,295 |
| Total Consumer Services | | 892,728 |
| Industrials—10.7% | | |
| Bharat Forge, Ltd. | 31,000 | 118,125 |
| Mahindra & Mahindra, Ltd. | 19,800 | 313,776 |
| Tata Motors, Ltd. | 56,617 | 280,377 |
| Total Industrials | | 712,278 |
| TOTAL INVESTMENTS IN SECURITIES—100.0% | | |
| (Cost: $6,402,559) | | 6,632,954 |
| Liabilities in Excess of Other Assets—0.0%** | | (1,886) |
| Net Assets—100.0% | | $ | 6,631,068 |
| † | The Consolidated Schedule of Investments includes the accounts of the wholly owned subsidiary. All inter-company accounts and transactions have been eliminated in consolidation. See Note 2 of the Notes to Financial Statements. |
| * | Non-income producing security |
The accompanying notes are an integral part of these financial statements.
| | EGA Emerging Global Shares Trust 71 |
Schedule of Investments (Consolidated)†
EGShares India Infrastructure ETF
| | |
| Investments | Shares | Value |
| |
| COMMON STOCKS—99.7% | | |
| Basic Materials—13.2% | | |
| Jindal Steel & Power, Ltd. | 365,356 | $ | 2,337,674 |
| Sterlite Industries India, Ltd. | 1,361,890 | 2,347,913 |
| Tata Steel, Ltd. | 369,747 | 2,128,341 |
| Total Basic Materials | | 6,813,928 |
| Consumer Services—1.5% | | |
| Dish TV India, Ltd.* | 607,951 | 750,571 |
| Financials—7.7% | | |
| DLF, Ltd. | 607,042 | 2,621,394 |
| Housing Development & Infrastructure, Ltd.* | 423,711 | 360,174 |
| Unitech, Ltd.* | 2,227,379 | 965,129 |
| Total Financials | | 3,946,697 |
| Industrials—35.7% | | |
| ACC, Ltd. | 108,596 | 2,316,182 |
| Adani Ports and Special Economic Zone, Ltd. | 707,610 | 1,805,805 |
| Ambuja Cements, Ltd. | 766,265 | 2,455,996 |
| Ashok Leyland, Ltd. | 2,710,072 | 1,089,514 |
| Bharat Heavy Electricals, Ltd. | 661,840 | 2,155,394 |
| IRB Infrastructure Developers, Ltd. | 121,452 | 253,518 |
| Jaiprakash Associates, Ltd. | 1,894,739 | 2,281,705 |
| Larsen & Toubro, Ltd. | 100,259 | 2,520,218 |
| Pipavav Defence & Offshore Engineering Co., Ltd.* | 482,327 | 651,829 |
| Tata Motors, Ltd. | 572,831 | 2,836,752 |
| Total Industrials | | 18,366,913 |
| | |
| Investments | Shares | Value |
| |
| Oil & Gas—4.8% | | |
| GAIL India, Ltd. | 421,702 | $ | 2,469,304 |
| Telecommunications—12.8% | | |
| Bharti Airtel, Ltd. | 561,656 | 3,014,961 |
| Idea Cellular, Ltd.* | 1,167,371 | 2,446,432 |
| Reliance Communications, Ltd. | 1,137,062 | 1,156,937 |
| Total Telecommunications | | 6,618,330 |
| Utilities—24.0% | | |
| Adani Power, Ltd.* | 567,883 | 424,737 |
| GMR Infrastructure, Ltd.* | 1,791,019 | 711,794 |
| Indraprastha Gas, Ltd. | 112,328 | 572,800 |
| NTPC, Ltd. | 844,321 | 2,205,177 |
| Petronet LNG, Ltd. | 399,967 | 997,158 |
| Power Grid Corp. of India, Ltd. | 1,228,837 | 2,392,106 |
| Reliance Infrastructure, Ltd. | 231,982 | 1,384,849 |
| Reliance Power, Ltd.* | 883,353 | 999,562 |
| Tata Power Co., Ltd. | 1,519,894 | 2,698,616 |
| Total Utilities | | 12,386,799 |
| TOTAL INVESTMENTS IN SECURITIES—99.7% | | |
| (Cost: $74,687,064) | | 51,352,542 |
| Other Assets in Excess of Liabilities—0.3% | | 160,632 |
| Net Assets—100.0% | | $ | 51,513,174 |
| † | The Consolidated Schedule of Investments includes the accounts of the wholly owned subsidiary. All inter-company accounts and transactions have been eliminated in consolidation. See Note 2 of the Notes to Financial Statements. |
| * | Non-income producing security |
The accompanying notes are an integral part of these financial statements.
| 72 EGA Emerging Global Shares Trust |
Schedule of Investments (Consolidated)†
EGShares India Small Cap ETF
| | |
| Investments | Shares | Value |
| |
| COMMON STOCKS—99.8% | | |
| Basic Materials—7.1% | | |
| Bhushan Steel, Ltd.*(a) | 3,276 | $ | 14,798 |
| Nagarjuna Fertilizers & Chemicals, Ltd.*+ | 582,385 | 131,907 |
| Orissa Minerals Development Co., Ltd. | 2,300 | 100,849 |
| Tata Chemicals, Ltd. | 127,510 | 754,503 |
| United Phosphorus, Ltd. | 228,170 | 492,864 |
| Total Basic Materials | | 1,494,921 |
| Consumer Goods—20.3% | | |
| Aditya Birla Nuvo, Ltd. | 40,728 | 731,043 |
| Apollo Tyres, Ltd. | 216,028 | 331,693 |
| Arvind, Ltd. | 126,265 | 179,699 |
| Bombay Dyeing & Manufacturing Co., Ltd. | 75,990 | 122,968 |
| Delta Corp., Ltd. | 58,427 | 44,183 |
| Exide Industries, Ltd. | 257,176 | 612,538 |
| Gitanjali Gems, Ltd. | 22,456 | 244,764 |
| Godrej Industries, Ltd. | 59,192 | 320,301 |
| McLeod Russel India, Ltd. | 39,627 | 255,224 |
| MRF, Ltd. | 1,658 | 365,211 |
| Raymond, Ltd. | 28,386 | 149,294 |
| Shree Renuka Sugars, Ltd.* | 330,242 | 134,892 |
| Tata Global Beverages, Ltd. | 286,391 | 673,691 |
| TTK Prestige, Ltd. | 2,033 | 121,333 |
| Total Consumer Goods | | 4,286,834 |
| Consumer Services—5.7% | | |
| Dish TV India, Ltd.* | 342,937 | 423,387 |
| Jet Airways India, Ltd.* | 9,868 | 94,032 |
| Jubilant Foodworks, Ltd.* | 19,372 | 444,451 |
| TV18 Broadcast, Ltd.* | 458,502 | 237,054 |
| Total Consumer Services | | 1,198,924 |
| Financials—27.6% | | |
| Allahabad Bank | 157,484 | 366,255 |
| Anant Raj, Ltd. | 69,312 | 80,088 |
| Andhra Bank | 153,362 | 267,079 |
| Federal Bank, Ltd. | 100,625 | 889,888 |
| Housing Development & Infrastructure, Ltd.* | 198,069 | 168,368 |
| IFCI, Ltd. | 425,930 | 204,540 |
| Indiabulls Real Estate, Ltd.* | 138,235 | 138,744 |
| Indian Overseas Bank | 157,763 | 188,822 |
| Jammu & Kashmir Bank, Ltd.(The) | 15,002 | 328,940 |
| Karnataka Bank, Ltd. | 105,619 | 254,088 |
| Mahindra & Mahindra Financial Services, Ltd. | 198,934 | 713,747 |
| Manappuram Finance, Ltd. | 218,619 | 86,884 |
| Multi Commodity Exchange of India, Ltd. | 13,160 | 201,117 |
| Oriental Bank of Commerce | 83,273 | 385,798 |
| Reliance Capital, Ltd. | 75,284 | 433,143 |
| SKS Microfinance, Ltd.* | 40,635 | 91,214 |
| Syndicate Bank | 131,178 | 265,373 |
| UCO Bank | 196,925 | 201,998 |
| Unitech, Ltd.* | 974,644 | 422,316 |
| Vijaya Bank, Ltd. | 182,448 | 157,439 |
| Total Financials | | 5,845,841 |
| | |
| Investments | Shares | Value |
| |
| Health Care—10.0% | | |
| Apollo Hospitals Enterprise, Ltd. | 52,182 | $ | 805,437 |
| Aurobindo Pharma, Ltd. | 102,821 | 276,113 |
| Biocon, Ltd. | 45,040 | 226,775 |
| Ipca Laboratories, Ltd. | 44,521 | 433,660 |
| Strides Arcolab, Ltd. | 23,980 | 384,739 |
| Total Health Care | | 2,126,724 |
| Industrials—15.7% | | |
| Amara Raja Batteries, Ltd. | 51,199 | 258,633 |
| Ashok Leyland, Ltd. | 1,166,612 | 469,006 |
| Bharat Forge, Ltd. | 85,537 | 325,938 |
| Century Textiles & Industries, Ltd. | 40,726 | 215,095 |
| Crompton Greaves, Ltd. | 249,803 | 431,123 |
| Educomp Solutions, Ltd. | 36,837 | 42,564 |
| India Cements, Ltd. | 135,748 | 208,929 |
| IRB Infrastructure Developers, Ltd. | 94,886 | 198,065 |
| IVRCL, Ltd.* | 174,114 | 61,669 |
| Jain Irrigation Systems, Ltd. | 193,954 | 218,934 |
| NCC, Ltd. | 101,972 | 62,290 |
| Pipavav Defence & Offshore Engineering Co., Ltd.* | 205,187 | 277,295 |
| Punj Lloyd, Ltd. | 169,906 | 174,283 |
| Sintex Industries, Ltd. | 140,306 | 118,879 |
| Voltas, Ltd. | 181,411 | 251,505 |
| Total Industrials | | 3,314,208 |
| Oil & Gas—3.9% | | |
| Aban Offshore, Ltd. | 16,175 | 78,509 |
| Hindustan Petroleum Corp., Ltd. | 112,530 | 590,498 |
| Suzlon Energy, Ltd.* | 654,168 | 163,692 |
| Total Oil & Gas | | 832,699 |
| Technology—1.5% | | |
| Financial Technologies India, Ltd. | 11,348 | 148,787 |
| Hexaware Technologies, Ltd. | 113,018 | 175,817 |
| Total Technology | | 324,604 |
| Telecommunications—0.3% | | |
| Mahanagar Telephone Nigam* | 200,829 | 67,990 |
| Utilities—7.7% | | |
| CESC, Ltd. | 37,697 | 183,699 |
| GMR Infrastructure, Ltd.* | 675,313 | 268,386 |
| GVK Power & Infrastructure, Ltd.* | 574,620 | 96,739 |
| Indraprastha Gas, Ltd. | 46,779 | 238,543 |
| Jaiprakash Power Ventures, Ltd.* | 214,868 | 103,184 |
| JSW Energy, Ltd. | 194,344 | 195,595 |
| Lanco Infratech, Ltd.* | 533,756 | 101,153 |
| Petronet LNG, Ltd. | 174,907 | 436,060 |
| Total Utilities | | 1,623,359 |
| TOTAL INVESTMENTS IN SECURITIES—99.8% | | |
| (Cost: $23,821,638) | | 21,116,104 |
| Other Assets in Excess of Liabilities—0.2% | | 47,389 |
| Net Assets—100.0% | | $ | 21,163,493 |
| † | The Consolidated Schedule of Investments includes the accounts of the wholly owned subsidiary. All inter-company accounts and transactions have been eliminated in consolidation. See Note 2 of the Notes to Financial Statements. |
| * | Non-income producing security |
| + | Fair valued security. When trading resumes, security is expected to be known as Kakinada Fertilizers Ltd. and increase to 640,623 shares. |
| (a) | Partly paid equity shares — successful applicants paid a percentage of the issue price on application, with the balance payable on call. |
The accompanying notes are an integral part of these financial statements.
| | EGA Emerging Global Shares Trust 73 |
Schedule of Investments (Consolidated)†
EGShares Industrials GEMS ETF
| | |
| Investments | Shares | Value |
| |
| COMMON STOCKS—99.8% | | |
| Brazil—4.4% | | |
| Embraer SA ADR | 3,802 | $ | 135,617 |
| China—22.6% | | |
| Anhui Conch Cement Co., Ltd. Class H | 33,459 | 110,989 |
| Beijing Enterprises Holdings, Ltd. | 11,711 | 90,216 |
| China Communications Construction Co., Ltd. Class H | 108,615 | 101,022 |
| China Merchants Holdings International Co., Ltd. | 28,271 | 92,687 |
| China National Building Material Co., Ltd. Class H | 71,368 | 89,823 |
| China Railway Construction Corp., Ltd. Class H | 44,500 | 42,192 |
| China Railway Group, Ltd. Class H | 98,971 | 50,361 |
| Citic Pacific, Ltd. | 26,242 | 34,076 |
| Weichai Power Co., Ltd. Class H | 12,278 | 40,886 |
| Zoomlion Heavy Industry Science And | | |
| Technology Co., Ltd. Class H | 34,575 | 41,734 |
| Total China | | 693,986 |
| Colombia—3.4% | | |
| Grupo Argos SA/Colombia | 8,820 | 104,991 |
| Egypt—2.6% | | |
| Orascom Construction Industries* | 2,236 | 79,283 |
| India—14.9% | | |
| Adani Enterprises, Ltd. | 3,746 | 13,936 |
| Ambuja Cements, Ltd. | 15,547 | 49,830 |
| Bharat Heavy Electricals, Ltd. | 14,347 | 46,724 |
| Larsen & Toubro, Ltd. | 3,855 | 96,904 |
| Mahindra & Mahindra, Ltd. | 8,139 | 128,981 |
| Tata Motors, Ltd. ADR | 4,901 | 119,634 |
| Total India | | 456,009 |
| Indonesia—10.2% | | |
| Indocement Tunggal Prakarsa Tbk PT | 46,148 | 110,651 |
| Semen Indonesia Persero Tbk PT | 76,345 | 139,059 |
| United Tractors Tbk PT | 33,855 | 63,408 |
| Total Indonesia | | 313,118 |
| Malaysia—6.1% | | |
| Sime Darby Bhd | 62,400 | 186,606 |
| | |
| Investments | Shares | Value |
| |
| Mexico—18.7% | | |
| Alfa, SAB Class A | 74,034 | $ | 180,958 |
| Cemex SAB de CV ADR* | 27,252 | 332,747 |
| Grupo Carso SAB de CV Series A1 | 11,065 | 61,740 |
| Total Mexico | | 575,445 |
| Philippines—2.7% | | |
| Aboitiz Equity Ventures, Inc. | 61,200 | 82,705 |
| South Africa—10.1% | | |
| Bidvest Group, Ltd. | 6,939 | 183,306 |
| Imperial Holdings, Ltd. | 5,511 | 126,283 |
| Total South Africa | | 309,589 |
| Thailand—4.1% | | |
| Siam Cement PCL | 7,600 | 124,569 |
| TOTAL INVESTMENTS IN SECURITIES—99.8% | | |
| (Cost: $2,954,545) | | 3,061,918 |
| Other Assets in Excess of Liabilities—0.2% | | 6,754 |
| Net Assets—100.0% | | $ | 3,068,672 |
| † | The Consolidated Schedule of Investments includes the accounts of the wholly owned subsidiary. All inter-company accounts and transactions have been eliminated in consolidation. See Note 2 of the Notes to Financial Statements. |
| * | Non-income producing security |
| ADR | American Depositary Receipts |
| | |
| Summary by Sector | Value | % of
Net Assets |
| Aerospace & Defense | $ | 135,617 | 4.4% |
| Construction & Materials | 1,432,421 | 46.7 |
| General Industrials | 819,607 | 26.7 |
| Industrial Engineering | 441,367 | 14.4 |
| Industrial Transportation | 218,970 | 7.1 |
| Support Services | 13,936 | 0.5 |
| Total Investments | 3,061,918 | 99.8 |
| Other Assets in Excess of Liabilities | 6,754 | 0.2 |
| Net Assets | $ | 3,068,672 | 100.0% |
The accompanying notes are an integral part of these financial statements.
| 74 EGA Emerging Global Shares Trust |
Schedule of Investments (Consolidated)†
EGShares Low Volatility Emerging Markets Dividend ETF
| | |
| Investments | Shares | Value |
| |
| COMMON STOCKS—99.7% | | |
| Brazil—2.7% | | |
| Companhia Paranaense de Energia-Copel | | |
| Preference Shares ADR | 153,216 | $ | 2,370,252 |
| China—9.9% | | |
| China Petroleum & Chemical Corp. Class H | 2,131,550 | 2,509,757 |
| Datang International Power Generation Co., Ltd. | | |
| Class H | 4,798,705 | 2,120,353 |
| Jiangsu Expressway Co., Ltd. Class H | 2,747,713 | 2,750,315 |
| Shenzhou International Group, Ltd. | 513,478 | 1,445,318 |
| Total China | | 8,825,743 |
| Colombia—3.5% | | |
| Ecopetrol SA ADR | 57,581 | 3,139,316 |
| India—4.7% | | |
| Ashok Leyland, Ltd. | 7,688,138 | 3,090,815 |
| Bharat Petroleum Corp., Ltd. | 161,936 | 1,125,358 |
| Total India | | 4,216,173 |
| Malaysia—11.7% | | |
| DiGi.Com BHD | 2,163,800 | 3,242,381 |
| Kuala Lumpur Kepong BHD | 409,700 | 2,744,124 |
| Maxis BHD | 2,097,900 | 4,424,120 |
| Total Malaysia | | 10,410,625 |
| Mexico—13.5% | | |
| Bolsa Mexicana de Valores SAB de CV | 1,122,420 | 3,217,401 |
| Grupo Aeroportuario del Sureste SAB de CV Class B | 139,902 | 1,902,753 |
| Grupo Modelo SAB de CV Series C | 471,636 | 4,279,035 |
| Kimberly-Clark de Mexico SAB de CV Class A | 741,555 | 2,590,814 |
| Total Mexico | | 11,990,003 |
| Philippines—2.6% | | |
| Aboitiz Power Corp. | 2,598,000 | 2,355,452 |
| Russia—3.6% | | |
| LUKOIL OAO ADR | 49,989 | 3,219,292 |
| South Africa—21.2% | | |
| ABSA Group, Ltd. | 164,664 | 2,781,956 |
| Growthpoint Properties, Ltd. | 1,328,409 | 3,902,209 |
| Lewis Group, Ltd. | 560,147 | 3,945,991 |
| Redefine Properties, Ltd. | 3,919,585 | 4,229,561 |
| Vodacom Group, Ltd. | 340,386 | 4,077,456 |
| Total South Africa | | 18,937,173 |
| | |
| Investments | Shares | Value |
| |
| Thailand—9.2% | | |
| Charoen Pokphand Foods PCL | 2,128,600 | $ | 2,398,627 |
| Glow Energy PCL—NVDR | 602,973 | 1,528,795 |
| Shin Corp. PCL | 76,590 | 207,919 |
| Shin Corp. PCL—Foreign | 1,484,224 | 4,029,223 |
| Total Thailand | | 8,164,564 |
| Turkey—17.1% | | |
| Arcelik AS | 419,701 | 2,968,871 |
| Brisa Bridgestone Sabanci Sanayi ve Ticaret AS | 759,198 | 2,215,289 |
| Eczacibasi Ilac Sinai ve Finansal Yatirimlar Sanayi | | |
| ve Ticaret AS | 2,086,213 | 2,963,010 |
| Konya Cimento Sanayii AS | 11,039 | 2,086,398 |
| Turk Traktor ve Ziraat Makineleri AS | 153,111 | 5,034,598 |
| Total Turkey | | 15,268,166 |
| TOTAL INVESTMENTS IN SECURITIES—99.7% | | |
| (Cost: $84,085,132) | | 88,896,759 |
| Other Assets in Excess of Liabilities—0.3% | | 224,999 |
| Net Assets—100.0% | | $ | 89,121,758 |
| † | The Consolidated Schedule of Investments includes the accounts of the wholly owned subsidiary. All inter-company accounts and transactions have been eliminated in consolidation. See Note 2 of the Notes to Financial Statements. |
| ADR | American Depositary Receipts |
| NVDR | Non-Voting Depositary Receipts |
| | |
| Summary by Industry | Value | % of
Net Assets |
| Consumer Goods | $ | 18,642,078 | 20.9% |
| Consumer Services | 3,945,991 | 4.4 |
| Financials | 14,131,127 | 15.9 |
| Health Care | 2,963,010 | 3.3 |
| Industrials | 14,864,879 | 16.7 |
| Oil & Gas | 9,993,723 | 11.2 |
| Technology | 4,237,142 | 4.7 |
| Telecommunications | 11,743,957 | 13.2 |
| Utilities | 8,374,852 | 9.4 |
| Total Investments | 88,896,759 | 99.7 |
| Other Assets in Excess of Liabilities | 224,999 | 0.3 |
| Net Assets | $ | 89,121,758 | 100.0% |
The accompanying notes are an integral part of these financial statements.
| | EGA Emerging Global Shares Trust 75 |
Schedule of Investments (Consolidated)†
EGShares Technology GEMS ETF
| | |
| Investments | Shares | Value |
| |
| COMMON STOCKS—100.2% | | |
| Chile—2.9% | | |
| Sonda SA | 22,052 | $ | 76,877 |
| China—49.5% | | |
| AsiaInfo-Linkage, Inc.* | 4,670 | 55,433 |
| Baidu, Inc. ADR* | 2,582 | 226,442 |
| China Communications Services Corp., Ltd. Class H | 124,481 | 80,340 |
| Comba Telecom Systems Holdings, Ltd. | 95,555 | 32,374 |
| Lenovo Group, Ltd. | 132,879 | 131,978 |
| NetEase.com, Inc. ADR | 2,181 | 119,453 |
| Pactera Technology International Ltd. ADR* | 6,635 | 42,597 |
| SINA Corp.* | 2,013 | 97,812 |
| Sohu.com, Inc.* | 1,536 | 76,201 |
| Spreadtrum Communications, Inc. ADR | 3,171 | 65,037 |
| TCL Communication Technology Holdings, Ltd. | 84,024 | 24,787 |
| Tencent Holdings Ltd. | 7,825 | 248,782 |
| Travelsky Technology, Ltd. Class H | 87,744 | 57,760 |
| ZTE Corp. Class H | 39,315 | 67,866 |
| Total China | | 1,326,862 |
| India—32.7% | | |
| Financial Technologies India, Ltd. | 2,493 | 32,687 |
| Hexaware Technologies, Ltd. | 23,866 | 37,127 |
| Infosys, Ltd. ADR | 4,465 | 240,708 |
| Mphasis, Ltd. | 7,106 | 51,200 |
| Oracle Financial Services Software, Ltd.* | 1,093 | 51,489 |
| Satyam Computer Services, Ltd.* | 37,077 | 87,593 |
| Tata Consultancy Services, Ltd. | 6,712 | 194,599 |
| Tech Mahindra, Ltd. | 2,866 | 55,870 |
| Wipro, Ltd. ADR | 12,445 | 125,694 |
| Total India | | 876,967 |
| Indonesia—2.4% | | |
| Tower Bersama Infrastructure Tbk PT* | 101,310 | 63,074 |
| | |
| Investments | Shares | Value |
| |
| Poland—2.2% | | |
| Asseco Poland SA | 4,597 | $ | 59,363 |
| Russia—3.0% | | |
| Mail.ru Group, Ltd. GDR | 2,862 | 79,277 |
| South Africa—2.2% | | |
| DataTec, Ltd. | 10,861 | 59,783 |
| Thailand—3.3% | | |
| Shin Corp. PCL | 21,566 | 58,545 |
| Shin Corp. PCL—Foreign | 11,259 | 30,565 |
| Total Thailand | | 89,110 |
| Turkey—2.0% | | |
| Aselsan Elektronik Sanayi Ve Ticaret AS | 9,045 | 52,486 |
| TOTAL INVESTMENTS IN SECURITIES—100.2% | | |
| (Cost: $2,754,523) | | 2,683,799 |
| Liabilities in Excess of Other Assets—(0.2)% | | (5,819) |
| Net Assets—100.0% | | $ | 2,677,980 |
| † | The Consolidated Schedule of Investments includes the accounts of the wholly owned subsidiary. All inter-company accounts and transactions have been eliminated in consolidation. See Note 2 of the Notes to Financial Statements. |
| * | Non-income producing security |
| ADR | American Depositary Receipts |
| GDR | Global Depositary Receipts |
| | |
| Summary by Sector | Value | % of
Net Assets |
| Software & Computer Services | $ | 2,076,746 | 77.5% |
| Technology Hardware & Equipment | 607,053 | 22.7 |
| Total Investments | 2,683,799 | 100.2 |
| Liabilities in Excess of Other Assets | (5,819) | (0.2) |
| Net Assets | $ | 2,677,980 | 100.0% |
The accompanying notes are an integral part of these financial statements.
| 76 EGA Emerging Global Shares Trust |
Schedule of Investments (Consolidated)†
EGShares Telecom GEMS ETF
| | |
| Investments | Shares | Value |
| |
| COMMON STOCKS—99.4% | | |
| Brazil—8.1% | | |
| Oi SA ADR | 23,720 | $ | 72,109 |
| Telefonica Brasil SA Preference Shares ADR | 5,403 | 144,152 |
| Tim Participacoes SA ADR | 4,572 | 100,035 |
| Total Brazil | | 316,296 |
| Chile—2.1% | | |
| Empresa Nacional De Telecom | 3,994 | 84,465 |
| China—16.7% | | |
| China Mobile, Ltd. | 37,033 | 392,149 |
| China Telecom Corp., Ltd. Class H | 270,673 | 136,336 |
| China Unicom Hong Kong, Ltd. ADR | 9,237 | 124,515 |
| Total China | | 653,000 |
| Czech Republic—1.4% | | |
| Telefonica Czech Republic SA | 3,641 | 54,990 |
| Egypt—1.8% | | |
| Orascom Telecom Holding SAE* | 108,176 | 70,124 |
| India—4.2% | | |
| Bharti Airtel, Ltd. | 24,365 | 130,791 |
| Reliance Communications, Ltd. | 33,508 | 34,094 |
| Total India | | 164,885 |
| Indonesia—5.2% | | |
| Telekomunikasi Indonesia Tbk PT ADR | 4,513 | 203,446 |
| Malaysia—11.6% | | |
| Axiata Group BHD | 66,700 | 142,598 |
| DiGi.Com BHD | 69,800 | 104,593 |
| Maxis BHD | 56,900 | 119,992 |
| Telekom Malaysia BHD | 50,800 | 88,426 |
| Total Malaysia | | 455,609 |
| Mexico—9.4% | | |
| America Movil SAB de CV Series L ADR | 17,633 | 369,588 |
| Morocco—1.8% | | |
| Maroc Telecom | 5,618 | 68,889 |
| Philippines—3.4% | | |
| Philippine Long Distance Telephone Co. ADR | 1,854 | 131,523 |
| | |
| Investments | Shares | Value |
| |
| Poland—1.4% | | |
| Telekomunikacja Polska SA | 27,041 | $ | 55,455 |
| Russia—10.2% | | |
| Mobile TeleSystems ADR | 8,463 | 175,523 |
| Rostelecom OJSC ADR | 5,620 | 134,205 |
| VimpelCom, Ltd. ADR | 7,615 | 90,542 |
| Total Russia | | 400,270 |
| South Africa—10.0% | | |
| MTN Group, Ltd. | 14,654 | 257,926 |
| Telkom South Africa, Ltd.* | 18,312 | 29,940 |
| Vodacom Group, Ltd. | 8,524 | 102,108 |
| Total South Africa | | 389,974 |
| Thailand—6.7% | | |
| Advanced Info Service PCL | 21,500 | 173,263 |
| Total Access Communication NVDR | 27,100 | 87,680 |
| Total Thailand | | 260,943 |
| Turkey—5.4% | | |
| Turk Telekomunikasyon AS | 18,269 | 80,971 |
| Turkcell Iletisim Hizmetleri AS ADR* | 7,784 | 129,526 |
| Total Turkey | | 210,497 |
| TOTAL INVESTMENTS IN SECURITIES—99.4% | | |
| (Cost: $3,954,733) | | 3,889,954 |
| Other Assets in Excess of Liabilities—0.6% | | 22,452 |
| Net Assets—100.0% | | $ | 3,912,406 |
| † | The Consolidated Schedule of Investments includes the accounts of the wholly owned subsidiary. All inter-company accounts and transactions have been eliminated in consolidation. See Note 2 of the Notes to Financial Statements. |
| * | Non-income producing security |
| ADR | American Depositary Receipts |
| NVDR | Non-Voting Depositary Receipt |
| | |
| Summary by Sector | Value | % of
Net Assets |
| Fixed Line Telecommunications | $ | 1,084,496 | 27.7% |
| Mobile Telecommunications | 2,805,458 | 71.7 |
| Total Investments | 3,889,954 | 99.4 |
| Other Assets in Excess of Liabilities | 22,452 | 0.6 |
| Net Assets | $ | 3,912,406 | 100.0% |
The accompanying notes are an integral part of these financial statements.
| | EGA Emerging Global Shares Trust 77 |
Schedule of Investments (Consolidated)†
EGShares Utilities GEMS ETF
| | |
| Investments | Shares | Value |
| |
| COMMON STOCKS—99.6% | | |
| Brazil—26.1% | | |
| Centrais Eletricas Brasileiras SA ADR | 19,099 | $ | 65,318 |
| Companhia de Saneamento Basico do Estado | | |
| de Sao Paulo ADR | 3,878 | 185,097 |
| Companhia Energetica de Minas Gerais | | |
| Preference Shares ADR | 16,402 | 194,364 |
| Companhia Paranaense de Energia-Copel | | |
| Preference Shares ADR | 4,275 | 66,134 |
| CPFL Energia SA ADR | 4,393 | 91,989 |
| Ultrapar Participacoes SA ADR | 12,492 | 317,047 |
| Total Brazil | | 919,949 |
| Chile—13.5% | | |
| Colbun SA* | 301,118 | 92,068 |
| Empresa Nacional de Electricidad SA ADR | 3,163 | 167,892 |
| Enersis SA ADR | 11,190 | 215,296 |
| Total Chile | | 475,256 |
| China—10.9% | | |
| China Resources Power Holdings Co., Ltd. | 57,934 | 173,519 |
| Datang International Power Generation Co., Ltd. | | |
| Class H | 168,719 | 74,550 |
| Huaneng Power International, Inc. ADR | 3,203 | 135,295 |
| Total China | | 383,364 |
| Colombia—2.4% | | |
| Interconexion Electrica SA ESP | 16,845 | 82,935 |
| Czech Republic—4.8% | | |
| CEZ AS | 5,818 | 170,663 |
| Hong Kong—2.9% | | |
| Guangdong Investment, Ltd. | 116,801 | 102,617 |
| India—11.5% | | |
| NTPC, Ltd. | 47,613 | 124,355 |
| Petronet LNG, Ltd. | 8,627 | 21,508 |
| Power Grid Corp. of India, Ltd. | 49,458 | 96,277 |
| Reliance Infrastructure, Ltd. | 5,710 | 34,087 |
| Rural Electrification Corp., Ltd. | 15,162 | 58,151 |
| Tata Power Co., Ltd. | 39,962 | 70,954 |
| Total India | | 405,332 |
| | |
| Investments | Shares | Value |
| |
| Indonesia—6.4% | | |
| Perusahaan Gas Negara PT | 367,152 | $ | 224,806 |
| Malaysia—8.1% | | |
| Tenaga Nasional BHD | 73,600 | 171,135 |
| YTL Corp. BHD | 149,140 | 78,989 |
| YTL Power International BHD | 72,300 | 34,090 |
| Total Malaysia | | 284,214 |
| Philippines—4.3% | | |
| Aboitiz Power Corp. | 76,800 | 69,630 |
| Manila Electric Co. | 10,130 | 81,070 |
| Total Philippines | | 150,700 |
| Poland—5.8% | | |
| PGE SA | 27,219 | 140,093 |
| Tauron Polska Energia SA | 49,702 | 65,404 |
| Total Poland | | 205,497 |
| Russia—2.9% | | |
| Federal Hydrogenerating Co. JSC ADR | 52,041 | 101,220 |
| TOTAL INVESTMENTS IN SECURITIES—99.6% | | |
| (Cost: $3,512,917) | | 3,506,553 |
| Other Assets in Excess of Liabilities—0.4% | | 13,176 |
| Net Assets—100.0% | | $ | 3,519,729 |
| † | The Consolidated Schedule of Investments includes the accounts of the wholly owned subsidiary. All inter-company accounts and transactions have been eliminated in consolidation. See Note 2 of the Notes to Financial Statements. |
| * | Non-income producing security |
| ADR | American Depositary Receipts |
| | |
| Summary by Sector | Value | % of
Net Assets |
| Electricity | $ | 2,542,399 | 72.2% |
| Gas, Water & Multiutilities | 964,154 | 27.4 |
| Total Investments | 3,506,553 | 99.6 |
| Other Assets in Excess of Liabilities | 13,176 | 0.4 |
| Net Assets | $ | 3,519,729 | 100.0% |
The accompanying notes are an integral part of these financial statements.
| 78 EGA Emerging Global Shares Trust |
(This page intentionally left blank.)
| | EGA Emerging Global Shares Trust 79 |
Statements of Assets and Liabilities
EGA Emerging Global Shares Trust
| | | EGShares
Basic Materials
GEMS ETF
(Consolidated) | | EGShares
Beyond
BRICs ETF | | EGShares
Brazil
Infrastructure ETF | | EGShares
China
Infrastructure ETF | | EGShares
Consumer Goods
GEMS ETF
(Consolidated) |
| ASSETS: | | | | | | | | | | |
| Cost of Investments: | | $ | 4,465,624 | | | $ | 7,027,893 | | | $ | 74,017,369 | | | $ | 15,064,015 | | | $ | 2,239,071 | |
| Investments at value | | | 3,662,786 | | | | 7,655,785 | | | | 79,202,084 | | | | 13,104,865 | | | | 2,431,967 | |
| Cash | | | 16,308 | | | | 24,281 | | | | — | | | | 40,648 | | | | 7,024 | |
| Foreign cash* | | | 3,624 | | | | 707 | | | | 94,438 | | | | — | | | | 3,445 | |
| Restricted cash† | | | — | | | | — | | | | — | | | | — | | | | — | |
| Due from custodian | | | — | | | | — | | | | — | | | | — | | | | — | |
| Receivables: | | | | | | | | | | | | | | | | | | | | |
| Capital shares sold | | | — | | | | — | | | | — | | | | — | | | | — | |
| Dividends and interest | | | 380 | | | | 21,986 | | | | 507,252 | | | | — | | | | 1,961 | |
| Due from sub-adviser | | | 14,301 | | | | 2,185 | | | | — | | | | 13,372 | | | | 6,903 | |
| Investment securities sold | | | — | | | | — | | | | 46,083 | | | | — | | | | — | |
| Prepaid offering expenses | | | — | | | | 233 | | | | — | | | | — | | | | — | |
| Prepaid expense and other assets | | | 6,375 | | | | 8,271 | | | | 19,192 | | | | 9,296 | | | | 6,375 | |
| Total Assets | | | 3,703,774 | | | | 7,713,448 | | | | 79,869,049 | | | | 13,168,181 | | | | 2,457,675 | |
|
| LIABILITIES: | | | | | | | | | | | | | | | | | | | | |
| Payables: | | | | | | | | | | | | | | | | | | | | |
| Accrued compliance administration fees | | | 1,500 | | | | 1,500 | | | | 1,500 | | | | 1,500 | | | | 1,500 | |
| Accrued sub-advisory fees | | | — | | | | — | | | | 26,733 | | | | — | | | | — | |
| Accrued trustee fees | | | 52 | | | | 139 | | | | 1,618 | | | | 192 | | | | 45 | |
| Due to custodian | | | — | | | | — | | | | 44,145 | | | | — | | | | — | |
| Investment securities purchased | | | — | | | | — | | | | — | | | | — | | | | — | |
| Accrued expenses and other liabilities | | | 30,028 | | | | 23,894 | | | | 55,719 | | | | 27,539 | | | | 30,017 | |
| Total Liabilities | | | 31,580 | | | | 25,533 | | | | 129,715 | | | | 29,231 | | | | 31,562 | |
| NET ASSETS | | $ | 3,672,194 | | | $ | 7,687,915 | | | $ | 79,739,334 | | | $ | 13,138,950 | | | $ | 2,426,113 | |
|
| NET ASSETS: | | | | | | | | | | | | | | | | | | | | |
| Paid-in capital | | $ | 4,756,314 | | | $ | 7,044,690 | | | $ | 86,150,902 | | | $ | 17,540,143 | | | $ | 2,250,697 | |
| Undistributed (accumulated) net investment income (loss) | | | 6,828 | | | | 24,479 | | | | (71,310 | ) | | | (25,822 | ) | | | 7,043 | |
| Accumulated net realized loss on investments and foreign currency transactions | | | (288,119 | ) | | | (9,437 | ) | | | (11,524,415 | ) | | | (2,416,221 | ) | | | (24,574 | ) |
| Net unrealized appreciation (depreciation) on investments and on foreign currency translations | | | (802,829 | ) | | | 628,183 | | | | 5,184,157 | | | | (1,959,150 | ) | | | 192,947 | |
| NET ASSETS | | $ | 3,672,194 | | | $ | 7,687,915 | | | $ | 79,739,334 | | | $ | 13,138,950 | | | $ | 2,426,113 | |
| Outstanding beneficial interest shares (unlimited shares of beneficial interest authorized, no par value) | | | 300,000 | | | | 350,000 | | | | 3,750,000 | | | | 750,000 | | | | 100,000 | |
| Net asset value per share | | $ | 12.24 | | | $ | 21.97 | | | $ | 21.26 | | | $ | 17.52 | | | $ | 24.26 | |
|
| * Cost of foreign cash: | | $ | 3,615 | | | $ | 707 | | | $ | 94,468 | | | $ | — | | | $ | 3,394 | |
| † | Restricted cash represents deposits being held by custodian as collateral for outstanding creation or redemption transactions. |
| | | EGShares
Consumer
Services
GEMS ETF | | EGShares
Emerging Markets
Consumer ETF
(Consolidated) | | EGShares
Emerging Markets
Core ETF
(Consolidated) | | EGShares
Emerging Markets
Domestic Demand ETF
(Consolidated) | | EGShares
Emerging Markets
Metals & Mining ETF
(Consolidated) | | EGShares
Energy
GEMS ETF
(Consolidated) |
| ASSETS: | | | | | | | | | | | | |
| Cost of Investments: | | $ | 2,100,961 | | | $ | 810,979,666 | | | $ | 4,067,302 | | | $ | 1,963,153 | | | $ | 13,675,313 | | | $ | 10,911,710 | |
| Investments at value | | | 2,164,259 | | | | 883,952,277 | | | | 4,161,116 | | | | 2,224,929 | | | | 8,502,115 | | | | 9,109,058 | |
| Cash | | | 9,919 | | | | 1,039,660 | | | | — | | | | 5,643 | | | | 34,476 | | | | 34,475 | |
| Foreign cash* | | | 10 | | | | 538,895 | | | | 27,449 | | | | 765 | | | | 14,682 | | | | 1,828 | |
| Restricted cash† | | | 12,545 | | | | — | | | | — | | | | — | | | | — | | | | — | |
| Due from custodian | | | 12,272 | | | | — | | | | — | | | | — | | | | — | | | | — | |
| Receivables: | | | | | | | | | | | | | | | | | | | | | | | | |
| Capital shares sold | | | — | | | | — | | | | 2,076,676 | | | | — | | | | — | | | | — | |
| Dividends and interest | | | 1,657 | | | | 720,947 | | | | 3,995 | | | | 4,795 | | | | — | | | | 20,448 | |
| Due from sub-adviser | | | 14,780 | | | | — | | | | 17,718 | | | | 503 | | | | 5,543 | | | | 4,327 | |
| Investment securities sold | | | — | | | | — | | | | — | | | | — | | | | — | | | | — | |
| Prepaid offering expenses | | | — | | | | — | | | | 3,176 | | | | 233 | | | | — | | | | — | |
| Prepaid expense and other assets | | | 6,375 | | | | 9,538 | | | | 6,375 | | | | 7,125 | | | | 6,375 | | | | 6,375 | |
| Total Assets | | | 2,221,817 | | | | 886,261,317 | | | | 6,296,505 | | | | 2,243,993 | | | | 8,563,191 | | | | 9,176,511 | |
|
| LIABILITIES: | | | | | | | | | | | | | | | | | | | | | | | | |
| Payables: | | | | | | | | | | | | | | | | | | | | | | | | |
| Accrued compliance administration fees | | | 1,500 | | | | 1,500 | | | | 1,500 | | | | 1,500 | | | | 1,500 | | | | 1,500 | |
| Accrued sub-advisory fees | | | — | | | | 386,009 | | | | — | | | | — | | | | — | | | | — | |
| Accrued trustee fees | | | 27 | | | | 3,751 | | | | 40 | | | | 63 | | | | 217 | | | | 127 | |
| Due to custodian | | | 12,545 | | | | — | | | | 24,066 | | | | — | | | | — | | | | — | |
| Investment securities purchased | | | 12,272 | | | | — | | | | 2,075,775 | | | | — | | | | — | | | | — | |
| Accrued expenses and other liabilities | | | 28,456 | | | | 393,694 | | | | 21,910 | | | | 26,539 | | | | 43,879 | | | | 42,539 | |
| Total Liabilities | | | 54,800 | | | | 784,954 | | | | 2,123,291 | | | | 28,102 | | | | 45,596 | | | | 44,166 | |
| NET ASSETS | | $ | 2,167,017 | | | $ | 885,476,363 | | | $ | 4,173,214 | | | $ | 2,215,891 | | | $ | 8,517,595 | | | $ | 9,132,345 | |
|
| NET ASSETS: | | | | | | | | | | | | | | | | | | | | | | | | |
| Paid-in capital | | $ | 2,176,929 | | | $ | 819,845,652 | | | $ | 4,074,305 | | | $ | 1,948,057 | | | $ | 15,932,859 | | | $ | 12,348,273 | |
| Undistributed (accumulated) net investment income (loss) | | | 659 | | | | 405,168 | | | | 7,173 | | | | 7,977 | | | | (31,800 | ) | | | (44,882 | ) |
| Accumulated net realized loss on investments and foreign currency transactions | | | (73,877 | ) | | | (7,753,503 | ) | | | (1,325 | ) | | | (1,966 | ) | | | (2,210,094 | ) | | | (1,368,622 | ) |
| Net unrealized appreciation (depreciation) on investments and on foreign currency translations | | | 63,306 | | | | 72,979,046 | | | | 93,061 | | | | 261,823 | | | | (5,173,370 | ) | | | (1,802,424 | ) |
| NET ASSETS | | $ | 2,167,017 | | | $ | 885,476,363 | | | $ | 4,173,214 | | | $ | 2,215,891 | | | $ | 8,517,595 | | | $ | 9,132,345 | |
| Outstanding beneficial interest shares (unlimited shares of beneficial interest authorized, no par value) | | | 100,000 | | | | 33,400,000 | | | | 200,000 | | | | 100,000 | | | | 700,000 | | | | 400,000 | |
| Net asset value per share | | $ | 21.67 | | | $ | 26.51 | | | $ | 20.87 | | | $ | 22.16 | | | $ | 12.17 | | | $ | 22.83 | |
|
| * Cost of foreign cash: | | $ | 9 | | | $ | 532,460 | | | $ | 27,718 | | | $ | 759 | | | $ | 14,854 | | | $ | 1,801 | |
| † | Restricted cash represents deposits being held by custodian as collateral for outstanding creation or redemption transactions. |
The accompanying notes are an integral part of these financial statements.
| 80 and 81 EGA Emerging Global Shares Trust |
Statements of Assets and Liabilities (concluded)
EGA Emerging Global Shares Trust
| | | EGShares
Financials
GEMS ETF
(Consolidated) | | EGShares
GEMS
Composite ETF
(Consolidated) | | EGShares
Health Care
GEMS ETF
(Consolidated) | | EGShares
India
Consumer ETF
(Consolidated) | | EGShares
India
Infrastructure ETF
(Consolidated) |
| ASSETS: | | | | | | | | | | | | | | | | | | | | |
| Cost of Investments: | | $ | 4,371,371 | | | $ | 17,869,420 | | | $ | 5,399,322 | | | $ | 6,402,559 | | | $ | 74,687,064 | |
| Investments at value | | | 4,333,987 | | | | 16,924,395 | | | | 5,744,374 | | | | 6,632,954 | | | | 51,352,542 | |
| Cash | | | 12,699 | | | | 38,719 | | | | 17,534 | | | | — | | | | — | |
| Foreign cash* | | | 4,824 | | | | 4,159 | | | | 704 | | | | 20,436 | | | | 180,709 | |
| Restricted cash† | | | — | | | | — | | | | — | | | | — | | | | — | |
| Due from custodian | | | — | | | | — | | | | — | | | | — | | | | — | |
| Receivables: | | | | | | | | | | | | | | | | | | | | |
| Dividends and interest | | | 2,642 | | | | 27,313 | | | | 5,997 | | | | 4,373 | | | | 68,981 | |
| Due from sub-adviser | | | 15,605 | | | | — | | | | 16,711 | | | | 3,889 | | | | 15,238 | |
| Prepaid expense and other assets | | | 6,375 | | | | 6,375 | | | | 6,375 | | | | 8,167 | | | | 15,929 | |
| Total Assets | | | 4,376,132 | | | | 17,000,961 | | | | 5,791,695 | | | | 6,669,819 | | | | 51,633,399 | |
|
| LIABILITIES: | | | | | | | | | | | | | | | | | | | | |
| Payables: | | | | | | | | | | | | | | | | | | | | |
| Accrued compliance administration fees | | | 1,500 | | | | 1,500 | | | | 1,500 | | | | 1,500 | | | | 1,500 | |
| Accrued sub-advisory fees | | | — | | | | 2,003 | | | | — | | | | — | | | | — | |
| Accrued trustee fees | | | 37 | | | | 177 | | | | 11 | | | | 17 | | | | 728 | |
| Due to custodian | | | — | | | | — | | | | — | | | | 4,797 | | | | 53,523 | |
| Income payable | | | — | | | | — | | | | — | | | | — | | | | — | |
| Due to broker | | | — | | | | — | | | | — | | | | — | | | | — | |
| Investment securities purchased | | | — | | | | — | | | | — | | | | — | | | | — | |
| Accrued expenses and other liabilities | | | 34,947 | | | | 44,481 | | | | 32,161 | | | | 32,437 | | | | 64,474 | |
| Total Liabilities | | | 36,484 | | | | 48,161 | | | | 33,672 | | | | 38,751 | | | | 120,225 | |
| NET ASSETS | | $ | 4,339,648 | | | $ | 16,952,800 | | | $ | 5,758,023 | | | $ | 6,631,068 | | | $ | 51,513,174 | |
|
| NET ASSETS: | | | | | | | | | | | | | | | | | | | | |
| Paid-in capital | | $ | 4,540,181 | | | $ | 19,601,109 | | | $ | 5,479,714 | | | $ | 6,723,944 | | | $ | 89,358,996 | |
| Undistributed (accumulated) net investment income (loss) | | | (31,879 | ) | | | (10,688 | ) | | | 1,551 | | | | (44,096 | ) | | | (7,314 | ) |
| Accumulated net realized loss on investments and foreign currency transactions | | | (131,137 | ) | | | (1,692,161 | ) | | | (68,328 | ) | | | (279,290 | ) | | | (14,504,382 | ) |
| Net unrealized appreciation (depreciation) on investments and on foreign currency translations | | | (37,517 | ) | | | (945,460 | ) | | | 345,086 | | | | 230,510 | | | | (23,334,126 | ) |
| NET ASSETS | | $ | 4,339,648 | | | $ | 16,952,800 | | | $ | 5,758,023 | | | $ | 6,631,068 | | | $ | 51,513,174 | |
| Outstanding beneficial interest shares (unlimited shares of beneficial interest authorized, no par value) | | | 200,000 | | | | 750,000 | | | | 250,000 | | | | 300,000 | | | | 4,200,000 | |
| Net asset value per share | | $ | 21.70 | | | $ | 22.60 | | | $ | 23.03 | | | $ | 22.10 | | | $ | 12.27 | |
|
| * Cost of foreign cash: | | $ | 4,978 | | | $ | 4,101 | | | $ | 692 | | | $ | 20,327 | | | $ | 180,232 | |
| † | Restricted cash represents deposits being held by custodian as collateral for outstanding creation or redemption transactions. |
| | | EGShares
India
Small Cap ETF
(Consolidated) | | EGShares
Industrials
GEMS ETF
(Consolidated) | | EGShares
Low Volatility Emerging
Markets Dividend ETF
(Consolidated) | | EGShares
Technology
GEMS ETF
(Consolidated) | | EGShares
Telecom
GEMS ETF
(Consolidated) | | EGShares
Utilities
GEMS ETF
(Consolidated) |
| ASSETS: | | | | | | | | | | | | | | | | | | | | | | | | |
| Cost of Investments: | | $ | 23,821,638 | | | $ | 2,954,545 | | | $ | 84,085,132 | | | $ | 2,754,523 | | | $ | 3,954,733 | | | $ | 3,512,917 | |
| Investments at value | | | 21,116,104 | | | | 3,061,918 | | | | 88,896,759 | | | | 2,683,799 | | | | 3,889,954 | | | | 3,506,553 | |
| Cash | | | — | | | | 8,515 | | | | 602,845 | | | | 9,911 | | | | 10,253 | | | | 5,544 | |
| Foreign cash* | | | 95,092 | | | | 1,941 | | | | 246,043 | | | | 2,594 | | | | 3,795 | | | | 8,238 | |
| Restricted cash† | | | — | | | | — | | | | 2,242,601 | | | | — | | | | — | | | | — | |
| Due from custodian | | | — | | | | — | | | | 2,189,298 | | | | — | | | | — | | | | — | |
| Receivables: | | | | | | | | | | | | | | | | | | | | | | | | |
| Dividends and interest | | | 10,143 | | | | 7,148 | | | | 219,182 | | | | 527 | | | | 19,055 | | | | 11,859 | |
| Due from sub-adviser | | | 11,434 | | | | 15,422 | | | | — | | | | 6,995 | | | | 14,930 | | | | 14,582 | |
| Prepaid expense and other assets | | | 10,775 | | | | 6,375 | | | | 19,575 | | | | 6,375 | | | | 6,375 | | | | 6,375 | |
| Total Assets | | | 21,243,548 | | | | 3,101,319 | | | | 94,416,303 | | | | 2,710,201 | | | | 3,944,362 | | | | 3,553,151 | |
|
| LIABILITIES: | | | | | | | | | | | | | | | | | | | | | | | | |
| Payables: | | | | | | | | | | | | | | | | | | | | | | | | |
| Accrued compliance administration fees | | | 1,500 | | | | 1,500 | | | | 1,500 | | | | 1,500 | | | | 1,500 | | | | 1,500 | |
| Accrued sub-advisory fees | | | — | | | | — | | | | 14,484 | | | | — | | | | — | | | | — | |
| Accrued trustee fees | | | 338 | | | | 56 | | | | 1,928 | | | | 48 | | | | 94 | | | | 43 | |
| Due to custodian | | | 29,076 | | | | — | | | | — | | | | — | | | | — | | | | — | |
| Income payable | | | — | | | | — | | | | 800,010 | | | | — | | | | — | | | | — | |
| Due to broker | | | — | | | | — | | | | 2,242,601 | | | | — | | | | — | | | | — | |
| Investment securities purchased | | | 11,991 | | | | — | | | | 2,189,298 | | | | — | | | | — | | | | — | |
| Accrued expenses and other liabilities | | | 37,150 | | | | 31,091 | | | | 44,724 | | | | 30,673 | | | | 30,362 | | | | 31,879 | |
| Total Liabilities | | | 80,055 | | | | 32,647 | | | | 5,294,545 | | | | 32,221 | | | | 31,956 | | | | 33,422 | |
| NET ASSETS | | $ | 21,163,493 | | | $ | 3,068,672 | | | $ | 89,121,758 | | | $ | 2,677,980 | | | $ | 3,912,406 | | | $ | 3,519,729 | |
|
| NET ASSETS: | | | | | | | | | | | | | | | | | | | | | | | | |
| Paid-in capital | | $ | 38,096,570 | | | $ | 3,230,021 | | | $ | 92,034,532 | | | $ | 2,908,626 | | | $ | 4,027,822 | | | $ | 3,673,804 | |
| Undistributed (accumulated) net investment income (loss) | | | (9,911 | ) | | | 21,189 | | | | (257,626 | ) | | | 10,524 | | | | 21,657 | | | | 33,611 | |
| Accumulated net realized loss on investments and foreign currency transactions | | | (14,218,350 | ) | | | (289,975 | ) | | | (7,467,207 | ) | | | (170,452 | ) | | | (72,491 | ) | | | (181,330 | ) |
| Net unrealized appreciation (depreciation) on investments and on foreign currency translations | | | (2,704,816 | ) | | | 107,437 | | | | 4,812,059 | | | | (70,718 | ) | | | (64,582 | ) | | | (6,356 | ) |
| NET ASSETS | | $ | 21,163,493 | | | $ | 3,068,672 | | | $ | 89,121,758 | | | $ | 2,677,980 | | | $ | 3,912,406 | | | $ | 3,519,729 | |
| Outstanding beneficial interest shares (unlimited shares of beneficial interest authorized, no par value) | | | 1,700,000 | | | | 150,000 | | | | 4,500,000 | | | | 150,000 | | | | 200,000 | | | | 200,000 | |
| Net asset value per share | | $ | 12.45 | | | $ | 20.46 | | | $ | 19.80 | | | $ | 17.85 | | | $ | 19.56 | | | $ | 17.60 | |
|
| * Cost of foreign cash: | | $ | 94,379 | | | $ | 1,928 | | | $ | 245,257 | | | $ | 2,588 | | | $ | 3,731 | | | $ | 8,217 | |
| † | Restricted cash represents deposits being held by custodian as collateral for outstanding creation or redemption transactions. |
The accompanying notes are an integral part of these financial statements.
| 82 and 83 EGA Emerging Global Shares Trust |
Statements of Operations
EGA Emerging Global Shares Trust
|
| Year Ended March 31, 2013 |
| | | EGShares
Basic Materials
GEMS ETF
(Consolidated) | | EGShares
Beyond
BRICs ETF1 | | EGShares
Brazil
Infrastructure ETF | | EGShares
China
Infrastructure ETF | | EGShares
Consumer Goods
GEMS ETF
(Consolidated) |
| INVESTMENT INCOME: | | | | | | | | | | | | | | | | | | | | |
| Dividend income* | | $ | 82,617 | | | $ | 92,328 | | | $ | 3,171,869 | | | $ | 257,758 | | | $ | 42,058 | |
| Interest income | | | 10 | | | | 1 | | | | — | | | | 59 | | | | — | |
| Total investment income | | | 82,627 | | | | 92,329 | | | | 3,171,869 | | | | 257,817 | | | | 42,058 | |
|
| EXPENSES: | | | | | | | | | | | | | | | | | | | | |
| Administration and accounting fees | | | 37,503 | | | | — | | | | 98,133 | | | | 98,133 | | | | 37,503 | |
| Sub-advisory fees | | | 22,698 | | | | 37,209 | | | | 648,173 | | | | 101,028 | | | | 16,541 | |
| Custody fees | | | 20,427 | | | | 9,412 | | | | 80,427 | | | | 8,265 | | | | 31,584 | |
| Licensing fees | | | 17,186 | | | | 6,480 | | | | 111,730 | | | | 16,079 | | | | 15,830 | |
| Audit and tax fees | | | 15,031 | | | | 15,066 | | | | 12,537 | | | | 12,537 | | | | 15,031 | |
| Transfer agent fees | | | 12,047 | | | | 7,530 | | | | 12,034 | | | | 12,033 | | | | 12,047 | |
| Exchange listing fees | | | 5,023 | | | | 10,654 | | | | 5,031 | | | | 5,031 | | | | 5,023 | |
| Offering fees | | | 4,894 | | | | 5,871 | | | | — | | | | — | | | | 5,394 | |
| Pricing fees | | | 3,715 | | | | 1,125 | | | | 10,598 | | | | 10,526 | | | | 3,715 | |
| Investment advisory fees | | | 2,361 | | | | 3,897 | | | | 71,543 | | | | 11,239 | | | | 159 | |
| Legal fees | | | 1,999 | | | | 2,717 | | | | 76,567 | | | | 8,906 | | | | 1,399 | |
| Compliance administration fees | | | 1,500 | | | | 1,500 | | | | 1,500 | | | | 1,500 | | | | 1,500 | |
| Shareholder reporting fees | | | 853 | | | | 3,438 | | | | 17,290 | | | | 3,360 | | | | 713 | |
| Registration fees | | | 518 | | | | 962 | | | | — | | | | 51 | | | | 146 | |
| Trustees’ fees and expenses | | | 176 | | | | 390 | | | | 5,166 | | | | 732 | | | | 151 | |
| Insurance fees | | | 149 | | | | 181 | | | | 5,346 | | | | 601 | | | | 82 | |
| Interest expense | | | — | | | | — | | | | — | | | | — | | | | 3 | |
| Miscellaneous fees | | | 1,401 | | | | 145 | | | | 1,420 | | | | 1,420 | | | | 602 | |
| Total expenses before reimbursements/waivers | | | 147,481 | | | | 106,577 | | | | 1,157,495 | | | | 291,441 | | | | 147,423 | |
| Less: Reimbursements/waivers of expenses from sub-adviser | | | (124,773 | ) | | | (69,367 | ) | | | (509,458 | ) | | | (190,413 | ) | | | (130,872 | ) |
| Net expenses | | | 22,708 | | | | 37,210 | | | | 648,037 | | | | 101,028 | | | | 16,551 | |
| Net investment income | | | 59,919 | | | | 55,119 | | | | 2,523,832 | | | | 156,789 | | | | 25,507 | |
|
| REALIZED AND UNREALIZED GAIN (LOSS) ON INVESTMENTS AND FOREIGN CURRENCY TRANSLATIONS: | | | | | | | | | | | | | | | | | | | | |
| Net realized gain (loss) on: | | | | | | | | | | | | | | | | | | | | |
| Investments | | | (270,235 | ) | | | (9,411 | ) | | | (4,839,597 | ) | | | (909,229 | ) | | | (5,598 | ) |
| In-Kind Redemptions | | | 18,688 | | | | — | | | | — | | | | (94,051 | ) | | | 185,810 | |
| Foreign currency transactions | | | (1,537 | ) | | | 969 | | | | (139,248 | ) | | | 261 | | | | (1,567 | ) |
| Net realized gain (loss) | | | (253,084 | ) | | | (8,442 | ) | | | (4,978,845 | ) | | | (1,003,019 | ) | | | 178,645 | |
| Change in unrealized appreciation (depreciation) on: | | | | | | | | | | | | | | | | | | | | |
| Investments | | | (542,320 | ) | | | 627,892 | | | | (4,957,560 | ) | | | 1,460,711 | | | | 72,781 | |
| Foreign currency translations | | | (21 | ) | | | 291 | | | | 8,051 | | | | — | | | | 31 | |
| Change in unrealized appreciation (depreciation) | | | (542,341 | ) | | | 628,183 | | | | (4,949,509 | ) | | | 1,460,711 | | | | 72,812 | |
| Net realized and unrealized gain (loss) on investments and foreign currency translations | | | (795,425 | ) | | | 619,741 | | | | (9,928,354 | ) | | | 457,692 | | | | 251,457 | |
| NET INCREASE (DECREASE) IN NET ASSETS RESULTING FROM OPERATIONS | | $ | (735,506 | ) | | $ | 674,860 | | | $ | (7,404,522 | ) | | $ | 614,481 | | | $ | 276,964 | |
|
| * Net of foreign taxes withheld of: | | $ | 8,129 | | | $ | 8,569 | | | $ | 110,833 | | | $ | 19,714 | | | $ | 1,943 | |
| 1 | Represents the period August 15, 2012 (commencement of operations) to March 31, 2013. |
| 2 | Represents the period October 16, 2012 (commencement of operations) to March 31, 2013. |
| | | EGShares
Consumer
Services
GEMS ETF | | EGShares
Emerging
Markets
Consumer ETF
(Consolidated) | | EGShares
Emerging Markets
Core ETF
(Consolidated)2 | | EGShares
Emerging
Markets
Domestic
Demand ETF
(Consolidated)1 | | EGShares
Emerging
Markets
Metals &
Mining ETF
(Consolidated) | | EGShares
Energy
GEMS ETF
(Consolidated) |
| INVESTMENT INCOME: | | | | | | | | | | | | | | | | | | | | | | | | |
| Dividend income* | | $ | 22,513 | | | $ | 8,280,600 | | | $ | 15,685 | | | $ | 35,023 | | | $ | 407,245 | | | $ | 305,762 | |
| Interest income | | | 4 | | | | 570 | | | | — | | | | — | | | | — | | | | 1 | |
| Total investment income | | | 22,517 | | | | 8,281,170 | | | | 15,685 | | | | 35,023 | | | | 407,245 | | | | 305,763 | |
|
| EXPENSES: | | | | | | | | | | | | | | | | | | | | | | | | |
| Administration and accounting fees | | | 37,503 | | | | 219,783 | | | | — | | | | — | | | | 100,262 | | | | 100,262 | |
| Sub-advisory fees | | | 15,029 | | | | 4,608,489 | | | | 6,617 | | | | 15,958 | | | | 98,485 | | | | 86,361 | |
| Custody fees | | | 6,031 | | | | 360,232 | | | | 10,157 | | | | 15,377 | | | | 28,608 | | | | 30,952 | |
| Licensing fees | | | 6,670 | | | | 472,682 | | | | 671 | | | | 4,121 | | | | 19,399 | | | | 16,851 | |
| Audit and tax fees | | | 14,513 | | | | 14,998 | | | | 15,090 | | | | 15,066 | | | | 15,036 | | | | 15,036 | |
| Transfer agent fees | | | 12,047 | | | | 12,033 | | | | 5,491 | | | | 7,530 | | | | 12,034 | | | | 12,034 | |
| Exchange listing fees | | | 5,023 | | | | 5,656 | | | | 9,805 | | | | 10,654 | | | | 5,031 | | | | 5,031 | |
| Offering fees | | | 1,760 | | | | — | | | | 47,482 | | | | 5,871 | | | | — | | | | — | |
| Pricing fees | | | 3,697 | | | | 9,572 | | | | 875 | | | | 1,125 | | | | 8,676 | | | | 8,673 | |
| Investment advisory fees | | | 145 | | | | 472,968 | | | | — | | | | 1,845 | | | | 11,772 | | | | 9,915 | |
| Legal fees | | | 1,268 | | | | 321,579 | | | | 590 | | | | 2,154 | | | | 9,396 | | | | 6,616 | |
| Compliance administration fees | | | 1,500 | | | | 1,500 | | | | 1,500 | | | | 1,500 | | | | 1,500 | | | | 1,500 | |
| Shareholder reporting fees | | | 427 | | | | 68,367 | | | | 13,909 | | | | 3,037 | | | | 1,741 | | | | 2,057 | |
| Registration fees | | | 134 | | | | 66,337 | | | | 273 | | | | 251 | | | | — | | | | — | |
| Trustees’ fees and expenses | | | 129 | | | | 26,828 | | | | 110 | | | | 167 | | | | 821 | | | | 619 | |
| Insurance fees | | | 71 | | | | 22,619 | | | | 63 | | | | 181 | | | | 835 | | | | 677 | |
| Interest expense | | | — | | | | — | | | | 6 | | | | — | | | | 57 | | | | — | |
| Miscellaneous fees | | | 769 | | | | 1,400 | | | | 199 | | | | 145 | | | | 1,400 | | | | 1,400 | |
| Total expenses before reimbursements/waivers | | | 106,716 | | | | 6,685,043 | | | | 112,838 | | | | 84,982 | | | | 315,053 | | | | 297,984 | |
| Less: Reimbursements/waivers of expenses from sub-adviser | | | (91,687 | ) | | | (2,076,610 | ) | | | (106,195 | ) | | | (69,022 | ) | | | (216,583 | ) | | | (211,609 | ) |
| Net expenses | | | 15,029 | | | | 4,608,433 | | | | 6,643 | | | | 15,960 | | | | 98,470 | | | | 86,375 | |
| Net investment income | | | 7,488 | | | | 3,672,737 | | | | 9,042 | | | | 19,063 | | | | 308,775 | | | | 219,388 | |
|
| REALIZED AND UNREALIZED GAIN (LOSS) ON INVESTMENTS AND FOREIGN CURRENCY TRANSLATIONS: | | | | | | | | | | | | | | | | | | | | | | | | |
| Net realized gain (loss) on: | | | | | | | | | | | | | | | | | | | | | | | | |
| Investments | | | (57,494 | ) | | | (5,836,638 | ) | | | (1,325 | ) | | | (61 | ) | | | (948,549 | ) | | | (337,758 | ) |
| In-Kind Redemptions | | | 156,509 | | | | 7,204,313 | | | | 269 | | | | 105,308 | | | | (384,407 | ) | | | 93,403 | |
| Foreign currency transactions | | | (595 | ) | | | (444,657 | ) | | | (491 | ) | | | (9,572 | ) | | | (4,620 | ) | | | (6,735 | ) |
| Net realized gain (loss) | | | 98,420 | | | | 923,018 | | | | (1,547 | ) | | | 95,675 | | | | (1,337,576 | ) | | | (251,090 | ) |
| Change in unrealized appreciation (depreciation) on: | | | | | | | | | | | | | | | | | | | | | | | | |
| Investments | | | 40,661 | | | | 39,255,934 | | | | 93,814 | | | | 261,776 | | | | (1,820,411 | ) | | | (634,167 | ) |
| Foreign currency translations | | | 8 | | | | 6,295 | | | | (753 | ) | | | 47 | | | | (305 | ) | | | 330 | |
| Change in unrealized appreciation (depreciation) | | | 40,669 | | | | 39,262,229 | | | | 93,061 | | | | 261,823 | | | | (1,820,716 | ) | | | (633,837 | ) |
| Net realized and unrealized gain (loss) on investments and foreign currency translations | | | 139,089 | | | | 40,185,247 | | | | 91,514 | | | | 357,498 | | | | (3,158,292 | ) | | | (884,927 | ) |
| NET INCREASE (DECREASE) IN NET ASSETS RESULTING FROM OPERATIONS | | $ | 146,577 | | | $ | 43,857,984 | | | $ | 100,556 | | | $ | 376,561 | | | $ | (2,849,517 | ) | | $ | (665,539 | ) |
|
| * Net of foreign taxes withheld of: | | $ | 2,975 | | | $ | 544,002 | | | $ | 941 | | | $ | 4,002 | | | $ | 39,136 | | | $ | 36,174 | |
| 1 | Represents the period August 15, 2012 (commencement of operations) to March 31, 2013. |
| 2 | Represents the period October 16, 2012 (commencement of operations) to March 31, 2013. |
The accompanying notes are an integral part of these financial statements.
| 84 and 85 EGA Emerging Global Shares Trust |
Statements of Operations (concluded)
EGA Emerging Global Shares Trust
|
| Year Ended March 31, 2013 |
| | | EGShares
Financials
GEMS ETF
(Consolidated) | | EGShares
GEMS
Composite ETF
(Consolidated) | | EGShares
Health Care
GEMS ETF
(Consolidated) | | EGShares
India
Consumer ETF
(Consolidated) | | EGShares
India
Infrastructure ETF
(Consolidated) |
| INVESTMENT INCOME: | | | | | | | | | | | | | | | | | | | | |
| Dividend income* | | $ | 98,506 | | | $ | 367,651 | | | $ | 28,908 | | | $ | 30,972 | | | $ | 756,221 | |
| Interest income | | | 29 | | | | 60 | | | | 16 | | | | — | | | | — | |
| Total investment income | | | 98,535 | | | | 367,711 | | | | 28,924 | | | | 30,972 | | | | 756,221 | |
|
| EXPENSES: | | | | | | | | | | | | | | | | | | | | |
| Administration and accounting fees | | | 100,250 | | | | 100,251 | | | | 37,503 | | | | 29,169 | | | | 78,791 | |
| Sub-advisory fees | | | 33,826 | | | | 106,907 | | | | 23,255 | | | | 30,881 | | | | 467,311 | |
| Custody fees | | | 33,710 | | | | 38,500 | | | | 26,664 | | | | 27,050 | | | | 65,499 | |
| Licensing fees | | | 15,685 | | | | 20,661 | | | | 18,323 | | | | 17,667 | | | | 95,027 | |
| Audit and tax fees | | | 15,036 | | | | 15,036 | | | | 15,031 | | | | 15,057 | | | | 14,998 | |
| Transfer agent fees | | | 12,034 | | | | 12,033 | | | | 12,047 | | | | 12,035 | | | | 12,033 | |
| Exchange listing fees | | | 5,031 | | | | 5,031 | | | | 5,023 | | | | 5,023 | | | | 5,031 | |
| Offering fees | | | — | | | | — | | | | 5,156 | | | | — | | | | — | |
| Pricing fees | | | 8,659 | | | | 8,680 | | | | 3,697 | | | | 5,323 | | | | 10,585 | |
| Investment advisory fees | | | 3,903 | | | | 13,639 | | | | 2,336 | | | | 452 | | | | 52,341 | |
| Legal fees | | | 1,127 | | | | 10,483 | | | | 1,845 | | | | 271 | | | | 54,398 | |
| Compliance administration fees | | | 1,500 | | | | 1,500 | | | | 1,500 | | | | 1,500 | | | | 1,500 | |
| Shareholder reporting fees | | | 1,672 | | | | 6,927 | | | | 716 | | | | 2,724 | | | | 17,576 | |
| Registration fees | | | — | | | | 469 | | | | 409 | | | | 660 | | | | 290 | |
| Trustees’ fees and expenses | | | 244 | | | | 840 | | | | 134 | | | | 88 | | | | 3,418 | |
| Insurance fees | | | 223 | | | | 919 | | | | 115 | | | | 101 | | | | 3,951 | |
| Interest expense | | | — | | | | — | | | | — | | | | 142 | | | | — | |
| Miscellaneous fees | | | 1,400 | | | | 1,400 | | | | 1,400 | | | | 1,403 | | | | 1,400 | |
| Total expenses before reimbursements/waivers | | | 234,300 | | | | 343,276 | | | | 155,154 | | | | 149,546 | | | | 884,149 | |
| Less: Reimbursements/waivers of expenses from sub-adviser | | | (200,475 | ) | | | (236,341 | ) | | | (131,889 | ) | | | (118,527 | ) | | | (416,566 | ) |
| Net expenses | | | 33,825 | | | | 106,935 | | | | 23,265 | | | | 31,019 | | | | 467,583 | |
| Net investment income (loss) | | | 64,710 | | | | 260,776 | | | | 5,659 | | | | (47 | ) | | | 288,638 | |
|
| REALIZED AND UNREALIZED GAIN (LOSS) ON INVESTMENTS AND FOREIGN CURRENCY TRANSLATIONS: | | | | | | | | | | | | | | | | | | | | |
| Net realized gain (loss) on: | | | | | | | | | | | | | | | | | | | | |
| Investments | | | (143,781 | ) | | | (448,976 | ) | | | (38,198 | ) | | | (247,883 | ) | | | (3,417,077 | ) |
| In-Kind Redemptions | | | 148,896 | | | | 54,571 | | | | 290,426 | | | | — | | | | — | |
| Foreign currency transactions | | | (1,895 | ) | | | (1,142 | ) | | | (3,691 | ) | | | (43,306 | ) | | | 342,909 | |
| Net realized gain (loss) | | | 3,220 | | | | (395,547 | ) | | | 248,537 | | | | (291,189 | ) | | | (3,074,168 | ) |
| Change in unrealized appreciation (depreciation) on: | | | | | | | | | | | | | | | | | | | | |
| Investments | | | 475,064 | | | | (94,271 | ) | | | 342,561 | | | | 127,938 | | | | (7,870,055 | ) |
| Foreign currency translations | | | (43 | ) | | | (699 | ) | | | 18 | | | | 102 | | | | 1,884 | |
| Change in unrealized appreciation (depreciation) | | | 475,021 | | | | (94,970 | ) | | | 342,579 | | | | 128,040 | | | | (7,868,171 | ) |
| Net realized and unrealized gain (loss) on investments and foreign currency translations | | | 478,241 | | | | (490,517 | ) | | | 591,116 | | | | (163,149 | ) | | | (10,942,339 | ) |
| NET INCREASE (DECREASE) IN NET ASSETS RESULTING FROM OPERATIONS | | $ | 542,951 | | | $ | (229,741 | ) | | $ | 596,775 | | | $ | (163,196 | ) | | $ | (10,653,701 | ) |
|
| * Net of foreign taxes withheld of: | | $ | 8,566 | | | $ | 37,200 | | | $ | 3,212 | | | $ | — | | | $ | — | |
| | | EGShares
India
Small Cap ETF
(Consolidated) | | EGShares
Industrials
GEMS ETF
(Consolidated) | | EGShares
Low Volatility Emerging
Markets Dividend ETF
(Consolidated) | | EGShares
Technology
GEMS ETF
(Consolidated) | | EGShares
Telecom
GEMS ETF
(Consolidated) | | EGShares
Utilities
GEMS ETF
(Consolidated) |
| INVESTMENT INCOME: | | | | | | | | | | | | | | | | | | | | | | | | |
| Dividend income* | | $ | 377,446 | | | $ | 45,195 | | | $ | 3,912,711 | | | $ | 38,139 | | | $ | 163,637 | | | $ | 112,983 | |
| Interest income | | | — | | | | 13 | | | | 588 | | | | — | | | | 98 | | | | — | |
| Total investment income | | | 377,446 | | | | 45,208 | | | | 3,913,299 | | | | 38,139 | | | | 163,735 | | | | 112,983 | |
|
| EXPENSES: | | | | | | | | | | | | | | | | | | | | | | | | |
| Administration and accounting fees | | | 91,849 | | | | 37,503 | | | | 29,169 | | | | 37,503 | | | | 37,503 | | | | 37,503 | |
| Sub-advisory fees | | | 199,571 | | | | 22,554 | | | | 626,449 | | | | 14,049 | | | | 33,267 | | | | 24,129 | |
| Custody fees | | | 62,257 | | | | 26,895 | | | | 83,091 | | | | 24,637 | | | | 30,887 | | | | 28,946 | |
| Licensing fees | | | 41,118 | | | | 17,454 | | | | 130,496 | | | | 16,152 | | | | 15,874 | | | | 15,285 | |
| Audit and tax fees | | | 14,998 | | | | 15,031 | | | | 15,055 | | | | 15,031 | | | | 15,031 | | | | 15,031 | |
| Transfer agent fees | | | 12,034 | | | | 12,047 | | | | 12,034 | | | | 12,047 | | | | 12,047 | | | | 12,047 | |
| Exchange listing fees | | | 5,004 | | | | 5,023 | | | | 5,023 | | | | 5,023 | | | | 5,023 | | | | 5,023 | |
| Offering fees | | | — | | | | 5,156 | | | | 8,953 | | | | 5,156 | | | | 5,157 | | | | 5,156 | |
| Pricing fees | | | 10,537 | | | | 3,697 | | | | 5,209 | | | | 3,697 | | | | 3,715 | | | | 3,697 | |
| Investment advisory fees | | | 20,391 | | | | 2,389 | | | | 40,383 | | | | 176 | | | | 1,473 | | | | 780 | |
| Legal fees | | | 21,404 | | | | 1,909 | | | | 56,082 | | | | 1,386 | | | | 2,982 | | | | 2,095 | |
| Compliance administration fees | | | 1,500 | | | | 1,500 | | | | 1,500 | | | | 1,500 | | | | 1,500 | | | | 1,500 | |
| Shareholder reporting fees | | | 4,060 | | | | 899 | | | | 22,105 | | | | 926 | | | | 1,371 | | | | 1,220 | |
| Registration fees | | | 992 | | | | 145 | | | | 6,352 | | | | 252 | | | | 154 | | | | 246 | |
| Trustees’ fees and expenses | | | 1,491 | | | | 202 | | | | 5,296 | | | | 121 | | | | 289 | | | | 172 | |
| Insurance fees | | | 1,679 | | | | 119 | | | | 3,769 | | | | 102 | | | | 246 | | | | 163 | |
| Interest expense | | | — | | | | 40 | | | | 111 | | | | — | | | | — | | | | — | |
| Miscellaneous fees | | | 1,400 | | | | 1,401 | | | | 1,400 | | | | 553 | | | | 1,400 | | | | 1,401 | |
| Total expenses before reimbursements/waivers | | | 490,285 | | | | 153,964 | | | | 1,052,477 | | | | 138,311 | | | | 167,919 | | | | 154,394 | |
| Less: Reimbursements/waivers of expenses from sub-adviser | | | (290,870 | ) | | | (131,361 | ) | | | (425,833 | ) | | | (124,253 | ) | | | (134,659 | ) | | | (130,258 | ) |
| Net expenses | | | 199,415 | | | | 22,603 | | | | 626,644 | | | | 14,058 | | | | 33,260 | | | | 24,136 | |
| Net investment income (loss) | | | 178,031 | | | | 22,605 | | | | 3,286,655 | | | | 24,081 | | | | 130,475 | | | | 88,847 | |
|
| REALIZED AND UNREALIZED GAIN (LOSS) ON INVESTMENTS AND FOREIGN CURRENCY TRANSLATIONS: | | | | | | | | | | | | | | | | | | | | | | | | |
| Net realized gain (loss) on: | | | | | | | | | | | | | | | | | | | | | | | | |
| Investments | | | (1,111,051 | ) | | | (152,402 | ) | | | (6,035,445 | ) | | | (110,216 | ) | | | (61,674 | ) | | | (134,999 | ) |
| In-Kind Redemptions | | | — | | | | 276,132 | | | | 4,196,450 | | | | 12,265 | | | | 39,274 | | | | 52,645 | |
| Foreign currency transactions | | | (71,703 | ) | | | (5,934 | ) | | | (15,710 | ) | | | (1,265 | ) | | | (2,077 | ) | | | (6,080 | ) |
| Net realized gain (loss) | | | (1,182,754 | ) | | | 117,796 | | | | (1,854,705 | ) | | | (99,216 | ) | | | (24,477 | ) | | | (88,434 | ) |
| Change in unrealized appreciation (depreciation) on: | | | | | | | | | | | | | | | | | | | | | | | | |
| Investments | | | (2,446,509 | ) | | | 162,731 | | | | 3,581,506 | | | | (73,425 | ) | | | (88,096 | ) | | | (134,089 | ) |
| Foreign currency translations | | | (1,681 | ) | | | 75 | | | | 1,234 | | | | 6 | | | | 254 | | | | 13 | |
| Change in unrealized appreciation (depreciation) | | | (2,448,190 | ) | | | 162,806 | | | | 3,582,740 | | | | (73,419 | ) | | | (87,842 | ) | | | (134,076 | ) |
| Net realized and unrealized gain (loss) on investments and foreign currency translations | | | (3,630,944 | ) | | | 280,602 | | | | 1,728,035 | | | | (172,635 | ) | | | (112,319 | ) | | | (222,510 | ) |
| NET INCREASE (DECREASE) IN NET ASSETS RESULTING FROM OPERATIONS | | $ | (3,452,913 | ) | | $ | 303,207 | | | $ | 5,014,690 | | | $ | (148,554 | ) | | $ | 18,156 | | | $ | (133,663 | ) |
|
| * Net of foreign taxes withheld of: | | $ | — | | | $ | 4,262 | | | $ | 361,837 | | | $ | 1,563 | | | $ | 16,697 | | | $ | 8,859 | |
The accompanying notes are an integral part of these financial statements.
| 86 and 87 EGA Emerging Global Shares Trust |
Statements of Changes in Net Assets
EGA Emerging Global Shares Trust
| | | EGShares Basic Materials GEMS ETF
(Consolidated) | | EGShares Beyond
BRICs ETF | | EGShares Brazil Infrastructure ETF |
| | | For the
Year Ended
March 31, 2013 | | For the Period
June 23, 20111
Through
March 31, 2012 | | For the Period
August 15, 20121
Through
March 31, 2013 | | For the
Year Ended
March 31, 2013 | | For the
Year Ended
March 31, 2012 |
| INCREASE (DECREASE) IN NET ASSETS RESULTING | | | | | | | | | | | | | | | | | | | | |
| FROM OPERATIONS: | | | | | | | | | | | | | | | | | | | | |
| Net investment income (loss) | | $ | 59,919 | | | $ | 20,941 | | | $ | 55,119 | | | $ | 2,523,832 | | | $ | 3,266,422 | |
| Net realized gain (loss) on investments and foreign currency transactions | | | (253,084 | ) | | | (97,898 | ) | | | (8,442 | ) | | | (4,978,845 | ) | | | (6,144,370 | ) |
| Net unrealized appreciation (depreciation) on investments and foreign currency translations | | | (542,341 | ) | | | (260,488 | ) | | | 628,183 | | | | (4,949,509 | ) | | | 331,770 | |
| Net increase (decrease) in net assets resulting from operations | | | (735,506 | ) | | | (337,445 | ) | | | 674,860 | | | | (7,404,522 | ) | | | (2,546,178 | ) |
|
| DISTRIBUTIONS TO SHAREHOLDERS: | | | | | | | | | | | | | | | | | | | | |
| Net investment income | | | (60,948 | ) | | | (15,017 | ) | | | (37,506 | ) | | | (3,009,024 | ) | | | (3,135,584 | ) |
|
| CAPITAL SHARE TRANSACTIONS: | | | | | | | | | | | | | | | | | | | | |
| Proceeds from sale of shares | | | 7,684,851 | | | | 2,870,607 | | | | 7,050,561 | | | | 8,274,032 | | | | 22,319,521 | |
| Cost of shares redeemed | | | (4,806,473 | ) | | | (927,874 | ) | | | — | | | | (7,711,903 | ) | | | (10,807,230 | ) |
| Transaction fees | | | 270 | | | | (271 | ) | | | — | | | | — | | | | — | |
| Net increase (decrease) in net assets resulting from capital share transactions | | | 2,878,648 | | | | 1,942,462 | | | | 7,050,561 | | | | 562,129 | | | | 11,512,291 | |
| Net Increase (Decrease) in Net Assets | | | 2,082,194 | | | | 1,590,000 | | | | 7,687,915 | | | | (9,851,417 | ) | | | 5,830,529 | |
|
| NET ASSETS: | | | | | | | | | | | | | | | | | | | | |
| Beginning of period | | | 1,590,000 | | | | — | | | | — | | | | 89,590,751 | | | | 83,760,222 | |
| End of period | | $ | 3,672,194 | | | $ | 1,590,000 | | | $ | 7,687,915 | | | $ | 79,739,334 | | | $ | 89,590,751 | |
| Accumulated net investment income (loss) included in net assets at end of period | | $ | 6,828 | | | $ | 4,500 | | | $ | 24,479 | | | $ | (71,310 | ) | | $ | 826,959 | |
|
| SHARES CREATED AND REDEEMED: | | | | | | | | | | | | | | | | | | | | |
| Shares outstanding, beginning of period | | | 100,000 | | | | — | | | | — | | | | 3,700,000 | | | | 3,300,000 | |
| Shares sold | | | 550,000 | | | | 150,000 | | | | 350,000 | | | | 400,000 | | | | 900,000 | |
| Shares redeemed | | | (350,000 | ) | | | (50,000 | ) | | | — | | | | (350,000 | ) | | | (500,000 | ) |
| Shares outstanding, end of period | | | 300,000 | | | | 100,000 | | | | 350,000 | | | | 3,750,000 | | | | 3,700,000 | |
| 1 | Commencement of operations. |
| | | EGShares China Infrastructure ETF | | EGShares Consumer Goods GEMS ETF
(Consolidated) | | EGShares Consumer Services GEMS ETF | | EGShares Emerging Markets Consumer ETF
(Consolidated) |
| | | For the
Year Ended
March 31, 2013 | | For the
Year Ended
March 31, 2012 | | For the
Year Ended
March 31, 2013 | | For the Period
June 23, 20111
Through
March 31, 2012 | | For the
Year Ended
March 31, 2013 | | For the Period
June 23, 20111
Through
March 31, 2012 | | For the
Year Ended
March 31, 2013 | | For the
Year Ended
March 31, 2012 |
| INCREASE (DECREASE) IN NET ASSETS RESULTING | | | | | | | | | | | | | | | | | | | | | | | | | | | | | | | | |
| FROM OPERATIONS: | | | | | | | | | | | | | | | | | | | | | | | | | | | | | | | | |
| Net investment income (loss) | | $ | 156,789 | | | $ | 289,656 | | | $ | 25,507 | | | $ | 14,034 | | | $ | 7,488 | | | $ | (1,465 | ) | | $ | 3,672,737 | | | $ | 1,970,081 | |
| Net realized gain (loss) on investments and foreign currency transactions | | | (1,003,019 | ) | | | (563,008 | ) | | | 178,645 | | | | 13,216 | | | | 98,420 | | | | 32,924 | | | | 923,018 | | | | 1,432,854 | |
| Net unrealized appreciation (depreciation) on investments and foreign currency translations | | | 1,460,711 | | | | (4,834,847 | ) | | | 72,812 | | | | 120,135 | | | | 40,669 | | | | 22,637 | | | | 39,262,229 | | | | 27,551,359 | |
| Net increase (decrease) in net assets resulting from operations | | | 614,481 | | | | (5,108,199 | ) | | | 276,964 | | | | 147,385 | | | | 146,577 | | | | 54,096 | | | | 43,857,984 | | | | 30,954,294 | |
|
| DISTRIBUTIONS TO SHAREHOLDERS: | | | | | | | | | | | | | | | | | | | | | | | | | | | | | | | | |
| Net investment income | | | (154,518 | ) | | | (324,416 | ) | | | (23,469 | ) | | | (11,203 | ) | | | (6,933 | ) | | | (1,186 | ) | | | (2,930,218 | ) | | | (1,634,800 | ) |
|
| CAPITAL SHARE TRANSACTIONS: | | | | | | | | | | | | | | | | | | | | | | | | | | | | | | | | |
| Proceeds from sale of shares | | | 2,804,555 | | | | 5,989,764 | | | | 5,587,055 | | | | 4,092,709 | | | | 4,064,823 | | | | 4,942,777 | | | | 477,224,008 | | | | 195,117,317 | |
| Cost of shares redeemed | | | (2,428,671 | ) | | | (9,385,596 | ) | | | (4,518,604 | ) | | | (3,124,066 | ) | | | (3,080,989 | ) | | | (3,952,148 | ) | | | (35,143,331 | ) | | | (16,583,599 | ) |
| Transaction fees | | | — | | | | — | | | | (12 | ) | | | (646 | ) | | | — | | | | — | | | | 1,873 | | | | 1,525 | |
| Net increase (decrease) in net assets resulting from capital share transactions | | | 375,884 | | | | (3,395,832 | ) | | | 1,068,439 | | | | 967,997 | | | | 983,834 | | | | 990,629 | | | | 442,082,550 | | | | 178,535,243 | |
| Net Increase (Decrease) in Net Assets | | | 835,847 | | | | (8,828,447 | ) | | | 1,321,934 | | | | 1,104,179 | | | | 1,123,478 | | | | 1,043,539 | | | | 483,010,316 | | | | 207,854,737 | |
|
| NET ASSETS: | | | | | | | | | | | | | | | | | | | | | | | | | | | | | | | | |
| Beginning of period | | | 12,303,103 | | | | 21,131,550 | | | | 1,104,179 | | | | — | | | | 1,043,539 | | | | — | | | | 402,466,047 | | | | 194,611,310 | |
| End of period | | $ | 13,138,950 | | | $ | 12,303,103 | | | $ | 2,426,113 | | | $ | 1,104,179 | | | $ | 2,167,017 | | | $ | 1,043,539 | | | $ | 885,476,363 | | | $ | 402,466,047 | |
| Accumulated net investment income (loss) included in net assets at end of period | | $ | (25,822 | ) | | $ | (28,354 | ) | | $ | 7,043 | | | $ | 3,470 | | | $ | 659 | | | $ | (1,061 | ) | | $ | 405,168 | | | $ | 124,633 | |
|
| SHARES CREATED AND REDEEMED: | | | | | | | | | | | | | | | | | | | | | | | | | | | | | | | | |
| Shares outstanding, beginning of period | | | 750,000 | | | | 950,000 | | | | 50,000 | | | | — | | | | 50,000 | | | | — | | | | 16,250,000 | | | | 8,550,000 | |
| Shares sold | | | 150,000 | | | | 300,000 | | | | 250,000 | | | | 200,000 | | | | 200,000 | | | | 250,000 | | | | 18,600,000 | | | | 8,450,000 | |
| Shares redeemed | | | (150,000 | ) | | | (500,000 | ) | | | (200,000 | ) | | | (150,000 | ) | | | (150,000 | ) | | | (200,000 | ) | | | (1,450,000 | ) | | | (750,000 | ) |
| Shares outstanding, end of period | | | 750,000 | | | | 750,000 | | | | 100,000 | | | | 50,000 | | | | 100,000 | | | | 50,000 | | | | 33,400,000 | | | | 16,250,000 | |
| 1 | Commencement of operations. |
The accompanying notes are an integral part of these financial statements.
| 88 and 89 EGA Emerging Global Shares Trust |
Statements of Changes in Net Assets (continued)
EGA Emerging Global Shares Trust
| | | EGShares Emerging
Markets Core ETF
(Consolidated) | | EGShares Emerging
Markets Domestic
Demand ETF
(Consolidated) | | EGShares Emerging Markets
Metals & Mining ETF
(Consolidated) | | EGShares Energy GEMS ETF
(Consolidated) |
| | | For the Period
October 16, 20121
Through
March 31, 2013 | | For the Period
August 15, 20121
Through
March 31, 2013 | | For the
Year Ended
March 31, 2013 | | For the
Year Ended
March 31, 2012 | | For the
Year Ended
March 31, 2013 | | For the
Year Ended
March 31, 2012 |
| INCREASE (DECREASE) IN NET ASSETS RESULTING | | | | | | | | | | | | | | | | | | | | | | | | |
| FROM OPERATIONS: | | | | | | | | | | | | | | | | | | | | | | | | |
| Net investment income (loss) | | $ | 9,042 | | | $ | 19,063 | | | $ | 308,775 | | | $ | 545,464 | | | $ | 219,388 | | | $ | 330,727 | |
| Net realized gain (loss) on investments and foreign currency transactions | | | (1,547 | ) | | | 95,675 | | | | (1,337,576 | ) | | | 316,395 | | | | (251,090 | ) | | | 1,309,542 | |
| Net unrealized appreciation (depreciation) on investments and foreign currency translations | | | 93,061 | | | | 261,823 | | | | (1,820,716 | ) | | | (9,372,705 | ) | | | (633,837 | ) | | | (5,834,109 | ) |
| Net increase (decrease) in net assets resulting | | | | | | | | | | | | | | | | | | | | | | | | |
| from operations | | | 100,556 | | | | 376,561 | | | | (2,849,517 | ) | | | (8,510,846 | ) | | | (665,539 | ) | | | (4,193,840 | ) |
|
| DISTRIBUTIONS TO SHAREHOLDERS: | | | | | | | | | | | | | | | | | | | | | | | | |
| Net investment income | | | (4,026 | ) | | | (8,302 | ) | | | (299,796 | ) | | | (532,215 | ) | | | (200,778 | ) | | | (309,030 | ) |
|
| CAPITAL SHARE TRANSACTIONS: | | | | | | | | | | | | | | | | | | | | | | | | |
| Proceeds from sale of shares | | | 5,118,595 | | | | 5,008,034 | | | | 631,668 | | | | 5,244,146 | | | | 5,804,410 | | | | 10,787,713 | |
| Cost of shares redeemed | | | (1,041,854 | ) | | | (3,160,206 | ) | | | (3,340,104 | ) | | | (19,702,991 | ) | | | (7,022,141 | ) | | | (20,507,227 | ) |
| Transaction fees | | | (57 | ) | | | (196 | ) | | | (670 | ) | | | (546 | ) | | | (394 | ) | | | (546 | ) |
| Net increase (decrease) in net assets resulting | | | | | | | | | | | | | | | | | | | | | | | | |
| from capital share transactions | | | 4,076,684 | | | | 1,847,632 | | | | (2,709,106 | ) | | | (14,459,391 | ) | | | (1,218,125 | ) | | | (9,720,060 | ) |
| Net Increase (Decrease) in Net Assets | | | 4,173,214 | | | | 2,215,891 | | | | (5,858,419 | ) | | | (23,502,452 | ) | | | (2,084,442 | ) | | | (14,222,930 | ) |
|
| NET ASSETS: | | | | | | | | | | | | | | | | | | | | | | | | |
| Beginning of period | | | — | | | | — | | | | 14,376,014 | | | | 37,878,466 | | | | 11,216,787 | | | | 25,439,717 | |
| End of period | | $ | 4,173,214 | | | $ | 2,215,891 | | | $ | 8,517,595 | | | $ | 14,376,014 | | | $ | 9,132,345 | | | $ | 11,216,787 | |
| Accumulated net investment income (loss) included in net assets at end of period | | $ | 7,173 | | | $ | 7,977 | | | $ | (31,800 | ) | | $ | (36,159 | ) | | $ | (44,882 | ) | | $ | (41,545 | ) |
| SHARES CREATED AND REDEEMED: | | | | | | | | | | | | | | | | | | | | | | | | |
| Shares outstanding, beginning of period | | | — | | | | — | | | | 900,000 | | | | 1,650,000 | | | | 450,000 | | | | 850,000 | |
| Shares sold | | | 250,000 | | | | 250,000 | | | | 50,000 | | | | 300,000 | | | | 250,000 | | | | 400,000 | |
| Shares redeemed | | | (50,000 | ) | | | (150,000 | ) | | | (250,000 | ) | | | (1,050,000 | ) | | | (300,000 | ) | | | (800,000 | ) |
| Shares outstanding, end of period | | | 200,000 | | | | 100,000 | | | | 700,000 | | | | 900,000 | | | | 400,000 | | | | 450,000 | |
| 1 | Commencement of operations. |
| | | EGShares Financials GEMS ETF
(Consolidated) | | EGShares GEMS Composite ETF
(Consolidated) | | EGShares Health Care GEMS ETF
(Consolidated) | | EGShares India Consumer ETF
(Consolidated) |
| | | For the
Year Ended
March 31, 2013 | | For the
Year Ended
March 31, 2012 | | For the
Year Ended
March 31, 2013 | | For the
Year Ended
March 31, 2012 | | For the
Year Ended
March 31, 2013 | | For the Period
June 23, 20111
Through
March 31, 2012 | | For the
Year Ended
March 31, 2013 | | For the Period
August 10, 20111
Through
March 31, 2012 |
| INCREASE (DECREASE) IN NET ASSETS RESULTING | | | | | | | | | | | | | | | | | | | | | | | | | | | | | | | | |
| FROM OPERATIONS: | | | | | | | | | | | | | | | | | | | | | | | | | | | | | | | | |
| Net investment income (loss) | | $ | 64,710 | | | $ | 152,756 | | | $ | 260,776 | | | $ | 449,817 | | | $ | 5,659 | | | $ | 2,304 | | | $ | (47 | ) | | $ | (665 | ) |
| Net realized gain (loss) on investments and foreign currency transactions | | | 3,220 | | | | (415,889 | ) | | | (395,547 | ) | | | (1,592,121 | ) | | | 248,537 | | | | (108,473 | ) | | | (291,189 | ) | | | (47,929 | ) |
| Net unrealized appreciation (depreciation) on investments and foreign currency translations | | | 475,021 | | | | (1,469,298 | ) | | | (94,970 | ) | | | (4,514,273 | ) | | | 342,579 | | | | 2,507 | | | | 128,040 | | | | 102,470 | |
| Net increase (decrease) in net assets resulting from operations | | | 542,951 | | | | (1,732,431 | ) | | | (229,741 | ) | | | (5,656,577 | ) | | | 596,775 | | | | (103,662 | ) | | | (163,196 | ) | | | 53,876 | |
|
| DISTRIBUTIONS TO SHAREHOLDERS: | | | | | | | | | | | | | | | | | | | | | | | | | | | | | | | | |
| Net investment income | | | (82,898 | ) | | | (52,077 | ) | | | (242,214 | ) | | | (312,176 | ) | | | (7,726 | ) | | | (1,891 | ) | | | — | | | | — | |
|
| CAPITAL SHARE TRANSACTIONS: | | | | | | | | | | | | | | | | | | | | | | | | | | | | | | | | |
| Proceeds from sale of shares | | | 2,852,785 | | | | 5,241,705 | | | | 4,476,741 | | | | 5,814,766 | | | | 8,547,260 | | | | 3,852,559 | | | | 4,886,779 | | | | 3,835,493 | |
| Cost of shares redeemed | | | (2,995,302 | ) | | | (10,481,218 | ) | | | (1,037,160 | ) | | | (17,734,608 | ) | | | (5,286,845 | ) | | | (1,837,994 | ) | | | — | | | | (1,980,060 | ) |
| Transaction fees | | | 472 | | | | 3 | | | | (624 | ) | | | (88 | ) | | | (143 | ) | | | (310 | ) | | | (876 | ) | | | (948 | ) |
| Net increase (decrease) in net assets resulting from capital share transactions | | | (142,045 | ) | | | (5,239,510 | ) | | | 3,438,957 | | | | (11,919,930 | ) | | | 3,260,272 | | | | 2,014,255 | | | | 4,885,903 | | | | 1,854,485 | |
| Net Increase (Decrease) in Net Assets | | | 318,008 | | | | (7,024,018 | ) | | | 2,967,002 | | | | (17,888,683 | ) | | | 3,849,321 | | | | 1,908,702 | | | | 4,722,707 | | | | 1,908,361 | |
|
| NET ASSETS: | | | | | | | | | | | | | | | | | | | | | | | | | | | | | | | | |
| Beginning of period | | | 4,021,640 | | | | 11,045,658 | | | | 13,985,798 | | | | 31,874,481 | | | | 1,908,702 | | | | — | | | | 1,908,361 | | | | — | |
| End of period | | $ | 4,339,648 | | | $ | 4,021,640 | | | $ | 16,952,800 | | | $ | 13,985,798 | | | $ | 5,758,023 | | | $ | 1,908,702 | | | $ | 6,631,068 | | | $ | 1,908,361 | |
| Accumulated net investment income (loss) included in net assets at end of period | | $ | (31,879 | ) | | $ | (15,553 | ) | | $ | (10,688 | ) | | $ | (19,886 | ) | | $ | 1,551 | | | $ | 2,153 | | | $ | (44,096 | ) | | $ | (743 | ) |
| SHARES CREATED AND REDEEMED: | | | | | | | | | | | | | | | | | | | | | | | | | | | | | | | | |
| Shares outstanding, beginning of period | | | 200,000 | | | | 450,000 | | | | 600,000 | | | | 1,155,000 | | | | 100,000 | | | | — | | | | 100,000 | | | | — | |
| Shares sold | | | 150,000 | | | | 250,000 | | | | 200,000 | | | | 250,000 | | | | 400,000 | | | | 200,000 | | | | 200,000 | | | | 200,000 | |
| Shares redeemed | | | (150,000 | ) | | | (500,000 | ) | | | (50,000 | ) | | | (805,000 | ) | | | (250,000 | ) | | | (100,000 | ) | | | — | | | | (100,000 | ) |
| Shares outstanding, end of period | | | 200,000 | | | | 200,000 | | | | 750,000 | | | | 600,000 | | | | 250,000 | | | | 100,000 | | | | 300,000 | | | | 100,000 | |
| 1 | Commencement of operations. |
The accompanying notes are an integral part of these financial statements.
| 90 and 91 EGA Emerging Global Shares Trust |
Statements of Changes in Net Assets (concluded)
EGA Emerging Global Shares Trust
| | | EGShares India Infrastructure ETF
(Consolidated) | | EGShares India Small Cap ETF
(Consolidated) | | EGShares Industrials GEMS ETF
(Consolidated) |
| | | For the
Year Ended
March 31, 2013 | | For the
Year Ended
March 31, 2012 | | For the
Year Ended
March 31, 2013 | | For the
Year Ended
March 31, 2012 | | For the
Year Ended
March 31, 2013 | | For the Period
June 23, 20111
Through
March 31, 2012 |
| INCREASE (DECREASE) IN NET ASSETS RESULTING FROM OPERATIONS: | | | | | | | | | | | | | | | | | | | | | | | | |
| Net investment income (loss) | | $ | 288,638 | | | $ | 268,410 | | | $ | 178,031 | | | $ | 238,909 | | | $ | 22,605 | | | $ | 6,541 | |
| Net realized gain (loss) on investments and foreign currency transactions | | | (3,074,168 | ) | | | (10,846,972 | ) | | | (1,182,754 | ) | | | (13,039,129 | ) | | | 117,796 | | | | (143,909 | ) |
| Net unrealized appreciation (depreciation) on investments and foreign currency translations | | | (7,868,171 | ) | | | (9,308,112 | ) | | | (2,448,190 | ) | | | 4,378,334 | | | | 162,806 | | | | (55,369 | ) |
| Net increase (decrease) in net assets resulting from operations | | | (10,653,701 | ) | | | (19,886,674 | ) | | | (3,452,913 | ) | | | (8,421,886 | ) | | | 303,207 | | | | (192,737 | ) |
|
| DISTRIBUTIONS TO SHAREHOLDERS: | | | | | | | | | | | | | | | | | | | | | | | | |
| Net investment income | | | (741,080 | ) | | | (344,824 | ) | | | (165,603 | ) | | | (254,107 | ) | | | (38,792 | ) | | | (1,831 | ) |
| Return of Capital | | | — | | | | — | | | | (8,562 | ) | | | — | | | | — | | | | — | |
| Total Distribution | | | (741,080 | ) | | | (344,824 | ) | | | (174,165 | ) | | | (254,107 | ) | | | (38,792 | ) | | | (1,831 | ) |
|
| CAPITAL SHARE TRANSACTIONS: | | | | | | | | | | | | | | | | | | | | | | | | |
| Proceeds from sale of shares | | | 3,590,929 | | | | 3,189,751 | | | | — | | | | 8,163,191 | | | | 6,744,871 | | | | 5,614,977 | |
| Cost of shares redeemed | | | (1,384,494 | ) | | | (7,631,044 | ) | | | (1,823,856 | ) | | | (7,596,936 | ) | | | (5,818,053 | ) | | | (3,541,987 | ) |
| Transaction fees | | | (1,118 | ) | | | (2,023 | ) | | | (1,765 | ) | | | (2,593 | ) | | | (312 | ) | | | (671 | ) |
| Net increase (decrease) in net assets resulting from capital share transactions | | | 2,205,317 | | | | (4,443,316 | ) | | | (1,825,621 | ) | | | 563,662 | | | | 926,506 | | | | 2,072,319 | |
| Net Increase (Decrease) in Net Assets | | | (9,189,464 | ) | | | (24,674,814 | ) | | | (5,452,699 | ) | | | (8,112,331 | ) | | | 1,190,921 | | | | 1,877,751 | |
|
| NET ASSETS: | | | | | | | | | | | | | | | | | | | | | | | | |
| Beginning of period | | | 60,702,638 | | | | 85,377,452 | | | | 26,616,192 | | | | 34,728,523 | | | | 1,877,751 | | | | — | |
| End of period | | $ | 51,513,174 | | | $ | 60,702,638 | | | $ | 21,163,493 | | | $ | 26,616,192 | | | $ | 3,068,672 | | | $ | 1,877,751 | |
| Accumulated net investment income (loss) included in net assets at end of period | | $ | (7,314 | ) | | $ | 102,219 | | | $ | (9,911 | ) | | $ | (48,453 | ) | | $ | 21,189 | | | $ | (637 | ) |
|
| SHARES CREATED AND REDEEMED: | | | | | | | | | | | | | | | | | | | | | | | | |
| Shares outstanding, beginning of period | | | 4,050,000 | | | | 4,400,000 | | | | 1,850,000 | | | | 1,800,000 | | | | 100,000 | | | | — | |
| Shares sold | | | 250,000 | | | | 200,000 | | | | — | | | | 500,000 | | | | 350,000 | | | | 300,000 | |
| Shares redeemed | | | (100,000 | ) | | | (550,000 | ) | | | (150,000 | ) | | | (450,000 | ) | | | (300,000 | ) | | | (200,000 | ) |
| Shares outstanding, end of period | | | 4,200,000 | | | | 4,050,000 | | | | 1,700,000 | | | | 1,850,000 | | | | 150,000 | | | | 100,000 | |
| 1 | Commencement of operations. |
| | | EGShares Low Volatility
Emerging Markets Dividend ETF
(Consolidated) | | EGShares Technology GEMS ETF
(Consolidated) | | EGShares Telecom GEMS ETF
(Consolidated) | | EGShares Utilities GEMS ETF
(Consolidated) |
| | | For the
Year Ended
March 31, 2013 | | For the Period
August 4, 20111
Through
March 31, 2012 | | For the
Year Ended
March 31, 2013 | | For the Period
June 23, 20111
Through
March 31, 2012 | | For the
Year Ended
March 31, 2013 | | For the Period
June 23, 20111
Through
March 31, 2012 | | For the
Year Ended
March 31, 2013 | | For the Period
June 23, 20111
Through
March 31, 2012 |
| INCREASE (DECREASE) IN NET ASSETS RESULTING FROM OPERATIONS: | | | | | | | | | | | | | | | | | | | | | | | | | | | | | | | | |
| Net investment income (loss) | | $ | 3,286,655 | | | $ | 406,885 | | | $ | 24,081 | | | $ | (1,383 | ) | | $ | 130,475 | | | $ | 27,898 | | | $ | 88,847 | | | $ | 21,831 | |
| Net realized gain (loss) on investments and foreign currency transactions | | | (1,854,705 | ) | | | 960,495 | | | | (99,216 | ) | | | (119,001 | ) | | | (24,477 | ) | | | (31,392 | ) | | | (88,434 | ) | | | (137,595 | ) |
| Net unrealized appreciation (depreciation) on investments and foreign currency translations | | | 3,582,740 | | | | 1,229,319 | | | | (73,419 | ) | | | 2,701 | | | | (87,842 | ) | | | 23,260 | | | | (134,076 | ) | | | 127,720 | |
| Net increase (decrease) in net assets resulting from operations | | | 5,014,690 | | | | 2,596,699 | | | | (148,554 | ) | | | (117,683 | ) | | | 18,156 | | | | 19,766 | | | | (133,663 | ) | | | 11,956 | |
|
| DISTRIBUTIONS TO SHAREHOLDERS: | | | | | | | | | | | | | | | | | | | | | | | | | | | | | | | | |
| Net investment income | | | (4,409,451 | ) | | | (659,822 | ) | | | (17,448 | ) | | | — | | | | (123,602 | ) | | | (10,536 | ) | | | (57,510 | ) | | | (9,988 | ) |
| Return of Capital | | | — | | | | — | | | | — | | | | — | | | | — | | | | — | | | | — | | | | — | |
| Total Distribution | | | (4,409,451 | ) | | | (659,822 | ) | | | (17,448 | ) | | | — | | | | (123,602 | ) | | | (10,536 | ) | | | (57,510 | ) | | | (9,988 | ) |
|
| CAPITAL SHARE TRANSACTIONS: | | | | | | | | | | | | | | | | | | | | | | | | | | | | | | | | |
| Proceeds from sale of shares | | | 69,939,964 | | | | 72,180,393 | | | | 4,390,403 | | | | 4,651,039 | | | | 3,907,663 | | | | 5,902,467 | | | | 4,296,547 | | | | 3,672,180 | |
| Cost of shares redeemed | | | (40,678,667 | ) | | | (14,863,146 | ) | | | (3,434,199 | ) | | | (2,644,489 | ) | | | (2,921,229 | ) | | | (2,879,951 | ) | | | (3,373,423 | ) | | | (885,693 | ) |
| Transaction fees | | | 317 | | | | 781 | | | | (622 | ) | | | (467 | ) | | | (255 | ) | | | (73 | ) | | | (357 | ) | | | (320 | ) |
| Net increase (decrease) in net assets resulting from capital share transactions | | | 29,261,614 | | | | 57,318,028 | | | | 955,582 | | | | 2,006,083 | | | | 986,179 | | | | 3,022,443 | | | | 922,767 | | | | 2,786,167 | |
| Net Increase (Decrease) in Net Assets | | | 29,866,853 | | | | 59,254,905 | | | | 789,580 | | | | 1,888,400 | | | | 880,733 | | | | 3,031,673 | | | | 731,594 | | | | 2,788,135 | |
|
| NET ASSETS: | | | | | | | | | | | | | | | | | | | | | | | | | | | | | | | | |
| Beginning of period | | | 59,254,905 | | | | — | | | | 1,888,400 | | | | — | | | | 3,031,673 | | | | — | | | | 2,788,135 | | | | — | |
| End of period | | $ | 89,121,758 | | | $ | 59,254,905 | | | $ | 2,677,980 | | | $ | 1,888,400 | | | $ | 3,912,406 | | | $ | 3,031,673 | | | $ | 3,519,729 | | | $ | 2,788,135 | |
| Accumulated net investment income (loss) included in net assets at end of period | | $ | (257,626 | ) | | $ | (360,697 | ) | | $ | 10,524 | | | $ | — | | | $ | 21,657 | | | $ | 15,242 | | | $ | 33,611 | | | $ | 8,394 | |
|
| SHARES CREATED AND REDEEMED: | | | | | | | | | | | | | | | | | | | | | | | | | | | | | | | | |
| Shares outstanding, beginning of period | | | 2,950,000 | | | | — | | | | 100,000 | | | | — | | | | 150,000 | | | | — | | | | 150,000 | | | | — | |
| Shares sold | | | 3,650,000 | | | | 3,700,000 | | | | 250,000 | | | | 250,000 | | | | 200,000 | | | | 300,000 | | | | 250,000 | | | | 200,000 | |
| Shares redeemed | | | (2,100,000 | ) | | | (750,000 | ) | | | (200,000 | ) | | | (150,000 | ) | | | (150,000 | ) | | | (150,000 | ) | | | (200,000 | ) | | | (50,000 | ) |
| Shares outstanding, end of period | | | 4,500,000 | | | | 2,950,000 | | | | 150,000 | | | | 100,000 | | | | 200,000 | | | | 150,000 | | | | 200,000 | | | | 150,000 | |
| 1 | Commencement of operations. |
The accompanying notes are an integral part of these financial statements.
| 92 and 93 EGA Emerging Global Shares Trust |
Financial Highlights
EGA Emerging Global Shares Trust
For a share outstanding throughout each period
|
| EGShares Basic Materials GEMS ETF (Consolidated) |
| | | For the
Year Ended
March 31, 2013 | | For the Period
June 23, 20111
Through
March 31, 2012 |
| Net asset value, beginning of period | | $ | 15.90 | | | $ | 20.00 | |
| Investment operations: | | | | | | | | |
| Net investment income2 | | | 0.31 | | | | 0.31 | |
| Net realized and unrealized loss on investments and foreign currency translations | | | (3.36 | ) | | | (4.11 | ) |
| Total from investment operations | | | (3.05 | ) | | | (3.80 | ) |
| Distributions to shareholders: | | | | | | | | |
| Net investment income | | | (0.61 | ) | | | (0.30 | ) |
| Net asset value, end of period | | $ | 12.24 | | | $ | 15.90 | |
| NET ASSET VALUE TOTAL RETURN3 | | | (19.70 | )% | | | (18.87 | )% |
|
| RATIOS/SUPPLEMENTAL DATA: | | | | | | | | |
| Net assets, end of period (000’s omitted) | | $ | 3,672 | | | $ | 1,590 | |
| Ratios to average net assets: | | | | | | | | |
| Expenses, net of expense reimbursements/waivers | | | 0.85 | % | | | 0.85 | %4 |
| Expenses, prior to expense reimbursements/waivers | | | 5.52 | % | | | 7.99 | %4 |
| Net investment income | | | 2.24 | % | | | 2.30 | %4 |
| Portfolio turnover rate | | | 33 | % | | | 21 | %5 |
|
| EGShares Beyond BRICs ETF |
| | | For the Period
August 15, 20121
Through
March 31, 2013 |
| Net asset value, beginning of period | | $ | 20.00 | |
| Investment operations: | | | | |
| Net investment income2 | | | 0.17 | |
| Net realized and unrealized gain on investments and foreign currency translations | | | 1.91 | |
| Total from investment operations | | | 2.08 | |
| Distributions to shareholders: | | | | |
| Net investment income | | | (0.11 | ) |
| Net asset value, end of period | | $ | 21.97 | |
| NET ASSET VALUE TOTAL RETURN3 | | | 10.41 | % |
|
| RATIOS/SUPPLEMENTAL DATA: | | | | |
| Net assets, end of period (000’s omitted) | | $ | 7,688 | |
| Ratios to average net assets: | | | | |
| Expenses, net of expense reimbursements/waivers | | | 0.85 | %4 |
| Expenses, prior to expense reimbursements/waivers | | | 2.43 | %4 |
| Net investment income | | | 1.26 | %4 |
| Portfolio turnover rate | | | 1 | %5 |
| 1 | Commencement of operations. |
| 2 | Based on average shares outstanding. |
| 3 | Total return is calculated assuming an initial investment made at the net asset value at the beginning of the period, reinvestment of all dividends and distributions at net asset value during the period, and redemption at net asset value on the last day of the period. Total return calculated for a period of less than one year is not annualized. The total return would have been lower if certain expenses had not been reimbursed/waived by the sub-adviser. |
The accompanying notes are an integral part of these financial statements.
| 94 EGA Emerging Global Shares Trust | |
Financial Highlights (continued)
EGA Emerging Global Shares Trust
For a share outstanding throughout each period
|
| EGShares Brazil Infrastructure ETF |
| | | For the
Year Ended
March 31, 2013 | | For the
Year Ended
March 31, 2012 | | For the
Year Ended
March 31, 2011 | | For the Period
February 24, 20101
Through
March 31, 2010 |
| Net asset value, beginning of period | | $ | 24.21 | | | $ | 25.38 | | | $ | 20.55 | | | $ | 20.00 | |
| Investment operations: | | | | | | | | | | | | | | | | |
| Net investment income2 | | | 0.71 | | | | 0.96 | | | | 0.47 | | | | 0.03 | |
| Net realized and unrealized gain (loss) on investments and foreign currency translations | | | (2.84 | ) | | | (1.15 | ) | | | 4.67 | | | | 0.527 | |
| Total from investment operations | | | (2.13 | ) | | | (0.19 | ) | | | 5.14 | | | | 0.55 | |
| Distributions to shareholders: | | | | | | | | | | | | | | | | |
| Net investment income | | | (0.82 | ) | | | (0.98 | ) | | | (0.31 | ) | | | — | |
| Net asset value, end of period | | $ | 21.26 | | | $ | 24.21 | | | $ | 25.38 | | | $ | 20.55 | |
| NET ASSET VALUE TOTAL RETURN3 | | | (8.63 | )% | | | (0.04 | )% | | | 25.16 | % | | | 2.75 | % |
|
| RATIOS/SUPPLEMENTAL DATA: | | | | | | | | | | | | | | | | |
| Net assets, end of period (000’s omitted) | | $ | 79,739 | | | $ | 89,591 | | | $ | 83,760 | | | $ | 11,303 | |
| Ratios to average net assets: | | | | | | | | | | | | | | | | |
| Expenses, net of expense reimbursements/waivers | | | 0.85 | % | | | 0.88 | %5 | | | 0.85 | % | | | 0.85 | %4 |
| Expenses, prior to expense reimbursements/waivers | | | 1.52 | % | | | 1.51 | % | | | 1.91 | % | | | 5.67 | %4 |
| Net investment income | | | 3.31 | % | | | 4.10 | % | | | 2.09 | % | | | 1.58 | %4 |
| Portfolio turnover rate | | | 30 | % | | | 30 | % | | | 35 | % | | | 1 | %6 |
|
| EGShares China Infrastructure ETF |
| | | | | | | | | |
| | | For the
Year Ended
March 31, 2013 | | For the
Year Ended
March 31, 2012 | | For the
Year Ended
March 31, 2011 | | For the Period
February 17, 20101
Through
March 31, 2010 |
| Net asset value, beginning of period | | $ | 16.40 | | | $ | 22.24 | | | $ | 20.78 | | | $ | 20.09 | |
| Investment operations: | | | | | | | | | | | | | | | | |
| Net investment income (loss)2 | | | 0.23 | | | | 0.33 | | | | 0.10 | | | | (0.02 | ) |
| Net realized and unrealized gain (loss) on investments and foreign currency translations | | | 1.13 | | | | (5.76 | ) | | | 1.49 | | | | 0.71 | |
| Total from investment operations | | | 1.36 | | | | (5.43 | ) | | | 1.59 | | | | 0.69 | |
| Distributions to shareholders: | | | | | | | | | | | | | | | | |
| Net investment income | | | (0.24 | ) | | | (0.41 | ) | | | (0.13 | ) | | | — | |
| Net asset value, end of period | | $ | 17.52 | | | $ | 16.40 | | | $ | 22.24 | | | $ | 20.78 | |
| NET ASSET VALUE TOTAL RETURN3 | | | 8.16 | % | | | (24.35 | )% | | | 7.69 | % | | | 3.43 | % |
|
| RATIOS/SUPPLEMENTAL DATA: | | | | | | | | | | | | | | | | |
| Net assets, end of period (000’s omitted) | | $ | 13,139 | | | $ | 12,303 | | | $ | 21,132 | | | $ | 6,235 | |
| Ratios to average net assets: | | | | | | | | | | | | | | | | |
| Expenses, net of expense reimbursements/waivers | | | 0.85 | % | | | 0.85 | % | | | 0.85 | % | | | 0.85 | %4 |
| Expenses, prior to expense reimbursements/waivers | | | 2.45 | % | | | 2.03 | % | | | 2.89 | % | | | 7.82 | %4 |
| Net investment income (loss) | | | 1.32 | % | | | 1.75 | % | | | 0.47 | % | | | (0.85 | )%4 |
| Portfolio turnover rate | | | 19 | % | | | 12 | % | | | 34 | % | | | 1 | %6 |
| 1 | Commencement of operations. |
| 2 | Based on average shares outstanding. |
| 3 | Total return is calculated assuming an initial investment made at the net asset value at the beginning of the period, reinvestment of all dividends and distributions at net asset value during the period, and redemption at net asset value on the last day of the period. Total return calculated for a period of less than one year is not annualized. The total return would have been lower if certain expenses had not been reimbursed/waived by the sub-adviser. |
| 5 | The ratio includes 0.03% for the period ended March 31, 2012 attributed to excise tax expense, which is outside the cap expense. |
| 7 | The realized and unrealized gain or loss on investments and foreign currency transactions does not accord with the amounts reported in the Statement of Operations due to the timing of subscriptions and/or redemptions of Fund shares in relation to the investment performance during the period and contributions made by Authorized Participants to compensate the Fund for additional costs incurred in purchasing securities that were not transferred in kind (See Note 10). |
The accompanying notes are an integral part of these financial statements.
| | EGA Emerging Global Shares Trust 95 |
Financial Highlights (continued)
EGA Emerging Global Shares Trust
For a share outstanding throughout each period
|
| EGShares Consumer Goods GEMS ETF (Consolidated) |
| | | For the
Year Ended
March 31, 2013 | | For the Period
June 23, 20111
Through
March 31, 2012 |
| Net asset value, beginning of period | | $ | 22.08 | | | $ | 20.00 | |
| Investment operations: | | | | | | | | |
| Net investment income2 | | | 0.30 | | | | 0.23 | |
| Net realized and unrealized gain on investments and foreign currency translations | | | 2.11 | | | | 2.07 | |
| Total from investment operations | | | 2.41 | | | | 2.30 | |
| Distributions to shareholders: | | | | | | | | |
| Net investment income | | | (0.23 | ) | | | (0.22 | ) |
| Net asset value, end of period | | $ | 24.26 | | | $ | 22.08 | |
| NET ASSET VALUE TOTAL RETURN3 | | | 10.98 | % | | | 11.62 | % |
|
| RATIOS/SUPPLEMENTAL DATA: | | | | | | | | |
| Net assets, end of period (000’s omitted) | | $ | 2,426 | | | $ | 1,104 | |
| Ratios to average net assets: | | | | | | | | |
| Expenses, net of expense reimbursements/waivers | | | 0.85 | % | | | 0.85 | %4 |
| Expenses, prior to expense reimbursements/waivers | | | 7.58 | % | | | 8.77 | %4 |
| Net investment income | | | 1.31 | % | | | 1.45 | %4 |
| Portfolio turnover rate | | | 24 | % | | | 50 | %5 |
|
| EGShares Consumer Services GEMS ETF |
| | | For the
Year Ended
March 31, 2013 | | For the Period
June 23, 20111
Through
March 31, 2012 |
| Net asset value, beginning of period | | $ | 20.87 | | | $ | 20.00 | |
| Investment operations: | | | | | | | | |
| Net investment income (loss)2 | | | 0.09 | | | | (0.03 | ) |
| Net realized and unrealized gain on investments and foreign currency translations | | | 0.78 | | | | 0.92 | |
| Total from investment operations | | | 0.87 | | | | 0.89 | |
| Distributions to shareholders: | | | | | | | | |
| Net investment income | | | (0.07 | ) | | | (0.02 | ) |
| Net asset value, end of period | | $ | 21.67 | | | $ | 20.87 | |
| NET ASSET VALUE TOTAL RETURN3 | | | 4.17 | % | | | 4.49 | % |
|
| RATIOS/SUPPLEMENTAL DATA: | | | | | | | | |
| Net assets, end of period (000’s omitted) | | $ | 2,167 | | | $ | 1,044 | |
| Ratios to average net assets: | | | | | | | | |
| Expenses, net of expense reimbursements/waivers | | | 0.85 | % | | | 0.85 | %4 |
| Expenses, prior to expense reimbursements/waivers | | | 6.04 | % | | | 6.77 | %4 |
| Net investment income (loss) | | | 0.42 | % | | | (0.18 | )%4 |
| Portfolio turnover rate | | | 32 | % | | | 51 | %5 |
| 1 | Commencement of operations. |
| 2 | Based on average shares outstanding. |
| 3 | Total return is calculated assuming an initial investment made at the net asset value at the beginning of the period, reinvestment of all dividends and distributions at net asset value during the period, and redemption at net asset value on the last day of the period. Total return calculated for a period of less than one year is not annualized. The total return would have been lower if certain expenses had not been reimbursed/waived by the sub-adviser. |
The accompanying notes are an integral part of these financial statements.
| 96 EGA Emerging Global Shares Trust | |
Financial Highlights (continued)
EGA Emerging Global Shares Trust
For a share outstanding throughout each period
|
| EGShares Emerging Markets Consumer ETF (Consolidated) |
| | | For the
Year Ended
March 31, 2013 | | For the
Year Ended
March 31, 2012 | | For the Period
September 14, 20101
Through
March 31, 2011 |
| Net asset value, beginning of period | | $ | 24.77 | | | $ | 22.76 | | | $ | 20.00 | |
| Investment operations: | | | | | | | | | | | | |
| Net investment income2 | | | 0.17 | | | | 0.17 | | | | 0.04 | |
| Net realized and unrealized gain on investments and foreign currency translations | | | 1.68 | | | | 1.96 | | | | 2.74 | |
| Total from investment operations | | | 1.85 | | | | 2.13 | | | | 2.78 | |
| Distributions to shareholders: | | | | | | | | | | | | |
| Net investment income | | | (0.11 | ) | | | (0.12 | ) | | | (0.02 | ) |
| Net asset value, end of period | | $ | 26.51 | | | $ | 24.77 | | | $ | 22.76 | |
| NET ASSET VALUE TOTAL RETURN3 | | | 7.46 | % | | | 9.44 | % | | | 13.88 | % |
|
| RATIOS/SUPPLEMENTAL DATA: | | | | | | | | | | | | |
| Net assets, end of period (000’s omitted) | | $ | 885,476 | | | $ | 402,466 | | | $ | 194,611 | |
| Ratios to average net assets: | | | | | | | | | | | | |
| Expenses, net of expense reimbursements/waivers | | | 0.85 | % | | | 0.85 | % | | | 0.85 | %4 |
| Expenses, prior to expense reimbursements/waivers | | | 1.23 | % | | | 1.31 | % | | | 1.44 | %4 |
| Net investment income | | | 0.68 | % | | | 0.76 | % | | | 0.37 | %4 |
| Portfolio turnover rate | | | 7 | % | | | 3 | % | | | 9 | %5 |
|
| EGShares Emerging Markets Core ETF (Consolidated) |
| | | For the Period
October 16, 20121
Through
March 31, 2013 |
| Net asset value, beginning of period | | $ | 20.00 | |
| Investment operations: | | | | |
| Net investment income2 | | | 0.09 | |
| Net realized and unrealized gain on investments and foreign currency translations | | | 0.82 | |
| Total from investment operations | | | 0.91 | |
| Distributions to shareholders: | | | | |
| Net investment income | | | (0.04 | ) |
| Net asset value, end of period | | $ | 20.87 | |
| NET ASSET VALUE TOTAL RETURN3 | | | 4.55 | % |
|
| RATIOS/SUPPLEMENTAL DATA: | | | | |
| Net assets, end of period (000’s omitted) | | $ | 4,173 | |
| Ratios to average net assets: | | | | |
| Expenses, net of expense reimbursements/waivers | | | 0.70 | %4 |
| Expenses, prior to expense reimbursements/waivers | | | 11.94 | %4 |
| Net investment income | | | 0.96 | %4 |
| Portfolio turnover rate | | | 3 | %5 |
| 1 | Commencement of operations. |
| 2 | Based on average shares outstanding. |
| 3 | Total return is calculated assuming an initial investment made at the net asset value at the beginning of the period, reinvestment of all dividends and distributions at net asset value during the period, and redemption at net asset value on the last day of the period. Total return calculated for a period of less than one year is not annualized. The total return would have been lower if certain expenses had not been reimbursed/waived by the sub-adviser. |
The accompanying notes are an integral part of these financial statements.
| | EGA Emerging Global Shares Trust 97 |
Financial Highlights (continued)
EGA Emerging Global Shares Trust
For a share outstanding throughout each period
|
| EGShares Emerging Markets Domestic Demand ETF (Consolidated) |
| | | For the Period
August 15, 20121
Through
March 31, 2013 |
| Net asset value, beginning of period | | $ | 20.00 | |
| Investment operations: | | | | |
| Net investment income2 | | | 0.13 | |
| Net realized and unrealized gain on investments and foreign currency translations | | | 2.11 | |
| Total from investment operations | | | 2.24 | |
| Distributions to shareholders: | | | | |
| Net investment income | | | (0.08 | ) |
| Net asset value, end of period | | $ | 22.16 | |
| NET ASSET VALUE TOTAL RETURN3 | | | 11.23 | % |
|
| RATIOS/SUPPLEMENTAL DATA: | | | | |
| Net assets, end of period (000’s omitted) | | $ | 2,216 | |
| Ratios to average net assets: | | | | |
| Expenses, net of expense reimbursements/waivers | | | 0.85 | %4 |
| Expenses, prior to expense reimbursements/waivers | | | 4.53 | %4 |
| Net investment income | | | 1.02 | %4 |
| Portfolio turnover rate | | | 57 | %5 |
|
| EGShares Emerging Markets Metals & Mining ETF (Consolidated)6 |
| | | For the
Year Ended
March 31, 2013 | | For the
Year Ended
March 31, 2012 | | For the
Year Ended
March 31, 2011 | | For the Period
May 21, 20091
Through
March 31, 2010 |
| Net asset value, beginning of period | | $ | 15.97 | | | $ | 22.96 | | | $ | 20.47 | | | $ | 13.73 | |
| Investment operations: | | | | | | | | | | | | | | | | |
| Net investment income (loss)2 | | | 0.37 | | | | 0.48 | | | | 0.13 | | | | (0.01 | ) |
| Net realized and unrealized gain (loss) on investments and foreign currency translations | | | (3.74 | ) | | | (6.88 | ) | | | 2.52 | | | | 6.82 | |
| Total from investment operations | | | (3.37 | ) | | | (6.40 | ) | | | 2.65 | | | | 6.81 | |
| Distributions to shareholders: | | | | | | | | | | | | | | | | |
| Net investment income | | | (0.43 | ) | | | (0.59 | ) | | | (0.16 | ) | | | (0.07 | ) |
| Net asset value, end of period | | $ | 12.17 | | | $ | 15.97 | | | $ | 22.96 | | | $ | 20.47 | |
| NET ASSET VALUE TOTAL RETURN3 | | | (21.51 | )% | | | (27.66 | )% | | | 12.95 | % | | | 49.69 | % |
|
| RATIOS/SUPPLEMENTAL DATA: | | | | | | | | | | | | | | | | |
| Net assets, end of period (000’s omitted) | | $ | 8,518 | | | $ | 14,376 | | | $ | 37,878 | | | $ | 27,640 | |
| Ratios to average net assets: | | | | | | | | | | | | | | | | |
| Expenses, net of expense reimbursements/waivers | | | 0.85 | % | | | 0.85 | % | | | 0.85 | % | | | 0.85 | %4 |
| Expenses, prior to expense reimbursements/waivers | | | 2.72 | % | | | 1.99 | % | | | 1.96 | % | | | 4.37 | %4 |
| Net investment income (loss) | | | 2.66 | % | | | 2.48 | % | | | 0.63 | % | | | (0.06 | )%4 |
| Portfolio turnover rate | | | 15 | % | | | 10 | % | | | 35 | % | | | 17 | %5 |
| 1 | Commencement of operations. |
| 2 | Based on average shares outstanding. |
| 3 | Total return is calculated assuming an initial investment made at the net asset value at the beginning of the period, reinvestment of all dividends and distributions at net asset value during the period, and redemption at net asset value on the last day of the period. Total return calculated for a period of less than one year is not annualized. The total return would have been lower if certain expenses had not been reimbursed/waived by the sub-adviser. |
| 6 | On September 16, 2010, there was a 3 for 1 forward stock split. Historical shares amounts have been adjusted to reflect the 3 for 1 forward stock split on a retroactive basis. |
The accompanying notes are an integral part of these financial statements.
| 98 EGA Emerging Global Shares Trust | |
Financial Highlights (continued)
EGA Emerging Global Shares Trust
For a share outstanding throughout each period
|
| EGShares Energy GEMS ETF (Consolidated)1 |
| | | For the
Year Ended
March 31, 2013 | | For the
Year Ended
March 31, 2012 | | For the
Year Ended
March 31, 2011 | | For the Period
May 21, 20092
Through
March 31, 2010 |
| Net asset value, beginning of period | | $ | 24.93 | | | $ | 29.93 | | | $ | 24.02 | | | $ | 20.49 | |
| Investment operations: | | | | | | | | | | | | | | | | |
| Net investment income3 | | | 0.50 | | | | 0.47 | | | | 0.26 | | | | 0.09 | |
| Net realized and unrealized gain (loss) on investments and foreign currency translations | | | (2.03 | ) | | | (4.95 | ) | | | 5.94 | | | | 3.50 | |
| Total from investment operations | | | (1.53 | ) | | | (4.48 | ) | | | 6.20 | | | | 3.59 | |
| Distributions to shareholders: | | | | | | | | | | | | | | | | |
| Net investment income | | | (0.57 | ) | | | (0.52 | ) | | | (0.29 | ) | | | (0.06 | ) |
| Net asset value, end of period | | $ | 22.83 | | | $ | 24.93 | | | $ | 29.93 | | | $ | 24.02 | |
| NET ASSET VALUE TOTAL RETURN4 | | | (6.21 | )% | | | (14.78 | )% | | | 25.96 | % | | | 17.53 | %5 |
|
| RATIOS/SUPPLEMENTAL DATA: | | | | | | | | | | | | | | | | |
| Net assets, end of period (000’s omitted) | | $ | 9,132 | | | $ | 11,217 | | | $ | 25,440 | | | $ | 9,607 | |
| Ratios to average net assets: | | | | | | | | | | | | | | | | |
| Expenses, net of expense reimbursements/waivers | | | 0.85 | % | | | 0.85 | % | | | 0.85 | % | | | 0.85 | %6 |
| Expenses, prior to expense reimbursements/waivers | | | 2.93 | % | | | 2.23 | % | | | 2.56 | % | | | 5.90 | %6 |
| Net investment income | | | 2.16 | % | | | 1.84 | % | | | 1.04 | % | | | 0.49 | %6 |
| Portfolio turnover rate | | | 16 | % | | | 19 | % | | | 19 | % | | | 49 | %7 |
|
| EGShares Financials GEMS ETF (Consolidated)1 |
| | | For the
Year Ended
March 31, 2013 | | For the
Year Ended
March 31, 2012 | | For the
Year Ended
March 31, 2011 | | For the Period
September 16, 20092
Through
March 31, 2010 |
| Net asset value, beginning of period | | $ | 20.11 | | | $ | 24.55 | | | $ | 22.84 | | | $ | 20.12 | |
| Investment operations: | | | | | | | | | | | | | | | | |
| Net investment income3 | | | 0.33 | | | | 0.57 | | | | 0.42 | | | | 0.08 | |
| Net realized and unrealized gain (loss) on investments and foreign currency translations | | | 1.67 | | | | (4.66 | ) | | | 2.09 | | | | 2.71 | |
| Total from investment operations | | | 2.00 | | | | (4.09 | ) | | | 2.51 | | | | 2.79 | |
| Distributions to shareholders: | | | | | | | | | | | | | | | | |
| Net investment income | | | (0.41 | ) | | | (0.35 | ) | | | (0.80 | ) | | | (0.07 | ) |
| Net asset value, end of period | | $ | 21.70 | | | $ | 20.11 | | | $ | 24.55 | | | $ | 22.84 | |
| NET ASSET VALUE TOTAL RETURN4 | | | 10.00 | % | | | (16.52 | )% | | | 11.03 | % | | | 13.87 | % |
|
| RATIOS/SUPPLEMENTAL DATA: | | | | | | | | | | | | | | | | |
| Net assets, end of period (000’s omitted) | | $ | 4,340 | | | $ | 4,022 | | | $ | 11,046 | | | $ | 6,852 | |
| Ratios to average net assets: | | | | | | | | | | | | | | | | |
| Expenses, net of expense reimbursements/waivers | | | 0.85 | % | | | 0.85 | % | | | 0.85 | % | | | 0.85 | %6 |
| Expenses, prior to expense reimbursements/waivers | | | 5.89 | % | | | 4.13 | % | | | 2.81 | % | | | 5.47 | %6 |
| Net investment income | | | 1.63 | % | | | 2.62 | % | | | 1.77 | % | | | 0.67 | %6 |
| Portfolio turnover rate | | | 19 | % | | | 25 | % | | | 39 | % | | | 12 | %7 |
| 1 | On September 16, 2010, there was a 2 for 1 forward stock split. Historical share amounts have been adjusted to reflect the 2 for 1 forward stock split on a retroactive basis. |
| 2 | Commencement of operations. |
| 3 | Based on average shares outstanding. |
| 4 | Total return is calculated assuming an initial investment made at the net asset value at the beginning of the period, reinvestment of all dividends and distributions at net asset value during the period, and redemption at net asset value on the last day of the period. Total return calculated for a period of less than one year is not annualized. The total return would have been lower if certain expenses had not been reimbursed/waived by the sub-adviser. |
| 5 | For the period ended March 31, 2010, 0.73% of the Fund’s total return consists of a voluntary reimbursement by the current and former sub-advisers for a realized investment loss, and another (1.08)% consists of a loss on an investment not meeting the Fund’s investment restrictions. Excluding these items, total return would have been 17.88%. |
The accompanying notes are an integral part of these financial statements.
| | EGA Emerging Global Shares Trust 99 |
Financial Highlights (continued)
EGA Emerging Global Shares Trust
For a share outstanding throughout each period
|
| EGShares GEMS Composite ETF (Consolidated)1 |
| | | For the
Year Ended
March 31, 2013 | | For the
Year Ended
March 31, 2012 | | For the
Year Ended
March 31, 2011 | | For the Period
July 22, 20092
Through
March 31, 2010 |
| Net asset value, beginning of period | | $ | 23.31 | | | $ | 27.60 | | | $ | 24.34 | | | $ | 20.00 | |
| Investment operations: | | | | | | | | | | | | | | | | |
| Net investment income3 | | | 0.41 | | | | 0.47 | | | | 0.39 | | | | 0.09 | |
| Net realized and unrealized gain (loss) on investments and foreign currency translations | | | (0.77 | ) | | | (4.37 | ) | | | 3.48 | | | | 4.31 | |
| Total from investment operations | | | (0.36 | ) | | | (3.90 | ) | | | 3.87 | | | | 4.40 | |
| Distributions to shareholders: | | | | | | | | | | | | | | | | |
| Net investment income | | | (0.35 | ) | | | (0.39 | ) | | | (0.61 | ) | | | (0.06 | ) |
| Net asset value, end of period | | $ | 22.60 | | | $ | 23.31 | | | $ | 27.60 | | | $ | 24.34 | |
| NET ASSET VALUE TOTAL RETURN4 | �� | | (1.57 | )% | | | (13.97 | )% | | | 16.04 | % | | | 21.96 | % |
|
| RATIOS/SUPPLEMENTAL DATA: | | | | | | | | | | | | | | | | |
| Net assets, end of period (000’s omitted) | | $ | 16,953 | | | $ | 13,986 | | | $ | 31,874 | | | $ | 31,755 | |
| Ratios to average net assets: | | | | | | | | | | | | | | | | |
| Expenses, net of expense reimbursements/waivers | | | 0.75 | % | | | 0.75 | % | | | 0.75 | % | | | 0.75 | %5 |
| Expenses, prior to expense reimbursements/waivers | | | 2.41 | % | | | 1.84 | % | | | 2.00 | % | | | 3.43 | %5 |
| Net investment income | | | 1.83 | % | | | 1.94 | % | | | 1.55 | % | | | 0.52 | %5 |
| Portfolio turnover rate | | | 10 | % | | | 10 | % | | | 39 | % | | | 6 | %6 |
|
| EGShares Health Care GEMS ETF (Consolidated) |
| | | For the
Year Ended
March 31, 2013 | | For the Period
June 23, 20112
Through
March 31, 2012 |
| Net asset value, beginning of period | | $ | 19.09 | | | $ | 20.00 | |
| Investment operations: | | | | | | | | |
| Net investment income3 | | | 0.04 | | | | 0.03 | |
| Net realized and unrealized gain (loss) on investments and foreign currency translations | | | 3.94 | | | | (0.90 | ) |
| Total from investment operations | | | 3.98 | | | | (0.87 | ) |
| Distributions to shareholders: | | | | | | | | |
| Net investment income | | | (0.04 | ) | | | (0.04 | ) |
| Net asset value, end of period | | $ | 23.03 | | | $ | 19.09 | |
| NET ASSET VALUE TOTAL RETURN4 | | | 20.85 | % | | | (4.33 | )% |
|
| RATIOS/SUPPLEMENTAL DATA: | | | | | | | | |
| Net assets, end of period (000’s omitted) | | $ | 5,758 | | | $ | 1,909 | |
| Ratios to average net assets: | | | | | | | | |
| Expenses, net of expense reimbursements/waivers | | | 0.85 | % | | | 0.85 | %5 |
| Expenses, prior to expense reimbursements/waivers | | | 5.67 | % | | | 7.79 | %5 |
| Net investment income | | | 0.21 | % | | | 0.23 | %5 |
| Portfolio turnover rate | | | 29 | % | | | 26 | %6 |
| 1 | On September 16, 2010, there was a 2 for 1 forward stock split. Historical share amounts have been adjusted to reflect the 2 for 1 forward stock split on a retroactive basis. |
| 2 | Commencement of operations. |
| 3 | Based on average shares outstanding. |
| 4 | Total return is calculated assuming an initial investment made at the net asset value at the beginning of the period, reinvestment of all dividends and distributions at net asset value during the period, and redemption at net asset value on the last day of the period. Total return calculated for a period of less than one year is not annualized. The total return would have been lower if certain expenses had not been reimbursed/waived by the sub-adviser. |
The accompanying notes are an integral part of these financial statements.
| 100 EGA Emerging Global Shares Trust | |
Financial Highlights (continued)
EGA Emerging Global Shares Trust
For a share outstanding throughout each period
|
| EGShares India Consumer ETF (Consolidated) |
| | | For the
Year Ended
March 31, 2013 | | For the Period
August 10, 20111
Through
March 31, 2012 |
| Net asset value, beginning of period | | $ | 19.08 | | | $ | 20.00 | |
| Investment operations: | | | | | | | | |
| Net investment loss2 | | | (— | )3 | | | (— | )3 |
| Net realized and unrealized gain (loss) on investments and foreign currency translations | | | 3.024 | | | | (0.92 | )4 |
| Total from investment operations | | | 3.02 | | | | (0.92 | ) |
| Distributions to shareholders: | | | | | | | | |
| Net investment income | | | — | | | | — | |
| Net asset value, end of period | | $ | 22.10 | | | $ | 19.08 | |
| NET ASSET VALUE TOTAL RETURN5 | | | 15.83 | % | | | (4.60 | )% |
|
| RATIOS/SUPPLEMENTAL DATA: | | | | | | | | |
| Net assets, end of period (000’s omitted) | | $ | 6,631 | | | $ | 1,908 | |
| Ratios to average net assets: | | | | | | | | |
| Expenses, net of expense reimbursements/waivers | | | 0.89 | % | | | 0.89 | %6 |
| Expenses, prior to expense reimbursements/waivers | | | 4.31 | % | | | 6.16 | %6 |
| Net investment loss | | | (0.00 | )%7 | | | (0.04 | )%6 |
| Portfolio turnover rate | | | 50 | % | | | 104 | %8 |
|
| EGShares India Infrastructure ETF (Consolidated) |
| | | For the
Year Ended
March 31, 2013 | | For the
Year Ended
March 31, 2012 | | For the Period
August 11, 20101
Through
March 31, 2011 |
| Net asset value, beginning of period | | $ | 14.99 | | | $ | 19.40 | | | $ | 20.00 | |
| Investment operations: | | | | | | | | | | | | |
| Net investment income2 | | | 0.07 | | | | 0.06 | | | | 0.01 | |
| Net realized and unrealized loss on investments and foreign currency translations | | | (2.60 | ) | | | (4.39 | ) | | | (0.61 | ) |
| Total from investment operations | | | (2.53 | ) | | | (4.33 | ) | | | (0.60 | ) |
| Distributions to shareholders: | | | | | | | | | | | | |
| Net investment income | | | (0.19 | ) | | | (0.08 | ) | | | — | |
| Net asset value, end of period | | $ | 12.27 | | | $ | 14.99 | | | $ | 19.40 | |
| NET ASSET VALUE TOTAL RETURN5 | | | (17.08 | )% | | | (22.19 | )% | | | (3.00 | )% |
|
| RATIOS/SUPPLEMENTAL DATA: | | | | | | | | | | | | |
| Net assets, end of period (000’s omitted) | | $ | 51,513 | | | $ | 60,703 | | | $ | 85,377 | |
| Ratios to average net assets: | | | | | | | | | | | | |
| Expenses, net of expense reimbursements/waivers | | | 0.85 | % | | | 0.85 | % | | | 0.85 | %6 |
| Expenses, prior to expense reimbursements/waivers | | | 1.61 | % | | | 1.69 | % | | | 2.24 | %6 |
| Net investment income | | | 0.53 | % | | | 0.39 | % | | | 0.11 | %6 |
| Portfolio turnover rate | | | 24 | % | | | 23 | % | | | 9 | %8 |
| 1 | Commencement of operations. |
| 2 | Based on average shares outstanding. |
| 4 | The realized and unrealized gain or loss on investments and foreign currency transactions does not accord with the amounts reported in the Statement of Operations due to the timing of subscriptions and/or redemptions of Fund shares in relation to the investment performance during the period and contributions made by Authorized Participants to compensate the Fund for additional costs incurred in purchasing securities that were not transferred in kind (See Note 10). |
| 5 | Total return is calculated assuming an initial investment made at the net asset value at the beginning of the period, reinvestment of all dividends and distributions at net asset value during the period, and redemption at net asset value on the last day of the period. Total return calculated for a period of less than one year is not annualized. The total return would have been lower if certain expenses had not been reimbursed/waived by the sub-adviser. |
The accompanying notes are an integral part of these financial statements.
| | EGA Emerging Global Shares Trust 101 |
Financial Highlights (continued)
EGA Emerging Global Shares Trust
For a share outstanding throughout each period
|
| EGShares India Small Cap ETF (Consolidated) |
| | | For the
Year Ended
March 31, 2013 | | For the
Year Ended
March 31, 2012 | | For the Period
July 7, 20101
Through
March 31, 2011 |
| Net asset value, beginning of period | | $ | 14.39 | | | $ | 19.29 | | | $ | 20.00 | |
| Investment operations: | | | | | | | | | | | | |
| Net investment income (loss)2 | | | 0.10 | | | | 0.14 | | | | (0.01 | ) |
| Net realized and unrealized loss on investments and foreign currency translations | | | (1.94 | ) | | | (4.88 | ) | | | (0.68 | ) |
| Total from investment operations | | | (1.84 | ) | | | (4.74 | ) | | | (0.69 | ) |
| Distributions to shareholders: | | | | | | | | | | | | |
| Net investment income | | | (0.10 | ) | | | (0.16 | ) | | | (0.02 | ) |
| Return of Capital | | | (— | )7 | | | — | | | | — | |
| Total Distribution | | | (0.10 | ) | | | (0.16 | ) | | | (0.02 | ) |
| Net asset value, end of period | | $ | 12.45 | | | $ | 14.39 | | | $ | 19.29 | |
| NET ASSET VALUE TOTAL RETURN3 | | | (12.87 | )% | | | (24.33 | )% | | | (3.45 | )% |
|
| RATIOS/SUPPLEMENTAL DATA: | | | | | | | | | | | | |
| Net assets, end of period (000’s omitted) | | $ | 21,163 | | | $ | 26,616 | | | $ | 34,729 | |
| Ratios to average net assets: | | | | | | | | | | | | |
| Expenses, net of expense reimbursements/waivers | | | 0.85 | % | | | 0.85 | % | | | 0.90 | %4,5 |
| Expenses, prior to expense reimbursements/waivers | | | 2.09 | % | | | 2.26 | % | | | 3.12 | %4 |
| Net investment income (loss) | | | 0.76 | % | | | 0.84 | % | | | (0.06 | )%4 |
| Portfolio turnover rate | | | 43 | % | | | 125 | % | | | 1 | %6 |
|
| EGShares Industrials GEMS ETF (Consolidated) |
| | | For the
Year Ended
March 31, 2013 | | For the Period
June 23, 20111
Through
March 31, 2012 |
| Net asset value, beginning of period | | $ | 18.78 | | | $ | 20.00 | |
| Investment operations: | | | | | | | | |
| Net investment income2 | | | 0.16 | | | | 0.09 | |
| Net realized and unrealized gain (loss) on investments and foreign currency translations | | | 1.71 | | | | (1.27 | ) |
| Total from investment operations | | | 1.87 | | | | (1.18 | ) |
| Distributions to shareholders: | | | | | | | | |
| Net investment income | | | (0.19 | ) | | | (0.04 | ) |
| Net asset value, end of period | | $ | 20.46 | | | $ | 18.78 | |
| NET ASSET VALUE TOTAL RETURN3 | | | 10.00 | % | | | (5.88 | )% |
|
| RATIOS/SUPPLEMENTAL DATA: | | | | | | | | |
| Net assets, end of period (000’s omitted) | | $ | 3,069 | | | $ | 1,878 | |
| Ratios to average net assets: | | | | | | | | |
| Expenses, net of expense reimbursements/waivers | | | 0.85 | % | | | 0.85 | %4 |
| Expenses, prior to expense reimbursements/waivers | | | 5.80 | % | | | 7.37 | %4 |
| Net investment income | | | 0.85 | % | | | 0.61 | %4 |
| Portfolio turnover rate | | | 61 | % | | | 70 | %6 |
| 1 | Commencement of operations. |
| 2 | Based on average shares outstanding. |
| 3 | Total return is calculated assuming an initial investment made at the net asset value at the beginning of the period, reinvestment of all dividends and distributions at net asset value during the period, and redemption at net asset value on the last day of the period. Total return calculated for a period of less than one year is not annualized. The total return would have been lower if certain expenses had not been reimbursed/waived by the sub-adviser. |
| 5 | The ratio includes 0.05% for the period ended March 31, 2011 attributed to interest expense. |
The accompanying notes are an integral part of these financial statements.
| 102 EGA Emerging Global Shares Trust | |
Financial Highlights (continued)
EGA Emerging Global Shares Trust
For a share outstanding throughout each period
|
| EGShares Low Volatility Emerging Markets Dividend ETF (Consolidated) |
| | | For the
Year Ended
March 31, 2013 | | For the Period
August 4, 20111
Through
March 31, 2012 |
| Net asset value, beginning of period | | $ | 20.09 | | | $ | 20.00 | |
| Investment operations: | | | | | | | | |
| Net investment income2 | | | 0.86 | | | | 0.33 | |
| Net realized and unrealized gain (loss) on investments and foreign currency translations | | | (0.09 | )3 | | | 0.13 | |
| Total from investment operations | | | 0.77 | | | | 0.46 | |
| Distributions to shareholders: | | | | | | | | |
| Net investment income | | | (1.06 | ) | | | (0.37 | ) |
| Net asset value, end of period | | $ | 19.80 | | | $ | 20.09 | |
| NET ASSET VALUE TOTAL RETURN4 | | | 4.12 | % | | | 2.45 | % |
|
| RATIOS/SUPPLEMENTAL DATA: | | | | | | | | |
| Net assets, end of period (000’s omitted) | | $ | 89,122 | | | $ | 59,255 | |
| Ratios to average net assets: | | | | | | | | |
| Expenses, net of expense reimbursements/waivers | | | 0.85 | % | | | 0.85 | %5 |
| Expenses, prior to expense reimbursements/waivers | | | 1.43 | % | | | 2.07 | %5 |
| Net investment income | | | 4.45 | % | | | 2.62 | %5 |
| Portfolio turnover rate | | | 86 | % | | | 45 | %6 |
|
| EGShares Technology GEMS ETF (Consolidated) |
| | | For the
Year Ended
March 31, 2013 | | For the Period
June 23, 20111
Through
March 31, 2012 |
| Net asset value, beginning of period | | $ | 18.88 | | | $ | 20.00 | |
| Investment operations: | | | | | | | | |
| Net investment income (loss)2 | | | 0.25 | | | | (0.02 | ) |
| Net realized and unrealized loss on investments and foreign currency translations | | | (0.93 | ) | | | (1.10 | ) |
| Total from investment operations | | | (0.68 | ) | | | (1.12 | ) |
| Distributions to shareholders: | | | | | | | | |
| Net investment income | | | (0.35 | ) | | | — | |
| Net asset value, end of period | | $ | 17.85 | | | $ | 18.88 | |
| NET ASSET VALUE TOTAL RETURN4 | | | (3.45 | )% | | | (5.60 | )% |
|
| RATIOS/SUPPLEMENTAL DATA: | | | | | | | | |
| Net assets, end of period (000’s omitted) | | $ | 2,678 | | | $ | 1,888 | |
| Ratios to average net assets: | | | | | | | | |
| Expenses, net of expense reimbursements/waivers | | �� | 0.85 | % | | | 0.85 | %5 |
| Expenses, prior to expense reimbursements/waivers | | | 8.37 | % | | | 7.81 | %5 |
| Net investment income (loss) | | | 1.46 | % | | | (0.13 | )%5 |
| Portfolio turnover rate | | | 30 | % | | | 21 | %6 |
| 1 | Commencement of operations. |
| 2 | Based on average shares outstanding. |
| 3 | The realized and unrealized loss on investments and foreign currency transactions does not accord with the amounts reported in the Statement of Operations due to the timing of subscriptions and/or redemptions of Fund shares in relation to the investment performance during the period and contributions made by Authorized Participants to compensate the Fund for additional costs incurred in purchasing securities that were not transferred in kind (See Note 10). |
| 4 | Total return is calculated assuming an initial investment made at the net asset value at the beginning of the period, reinvestment of all dividends and distributions at net asset value during the period, and redemption at net asset value on the last day of the period. Total return calculated for a period of less than one year is not annualized. The total return would have been lower if certain expenses had not been reimbursed/waived by the sub-adviser. |
The accompanying notes are an integral part of these financial statements.
| | EGA Emerging Global Shares Trust 103 |
Financial Highlights (concluded)
EGA Emerging Global Shares Trust
For a share outstanding throughout each period
|
| EGShares Telecom GEMS ETF (Consolidated) |
| | | For the
Year Ended
March 31, 2013 | | For the Period
June 23, 20111
Through
March 31, 2012 |
| Net asset value, beginning of period | | $ | 20.21 | | | $ | 20.00 | |
| Investment operations: | | | | | | | | |
| Net investment income2 | | | 0.66 | | | | 0.41 | |
| Net realized and unrealized gain (loss) on investments and foreign currency translations | | | (0.69 | ) | | | 0.013 | |
| Total from investment operations | | | (0.03 | ) | | | 0.42 | |
| Distributions to shareholders: | | | | | | | | |
| Net investment income | | | (0.62 | ) | | | (0.21 | ) |
| Net asset value, end of period | | $ | 19.56 | | | $ | 20.21 | |
| NET ASSET VALUE TOTAL RETURN3 | | | (0.21 | )% | | | 2.22 | % |
|
| RATIOS/SUPPLEMENTAL DATA: | | | | | | | | |
| Net assets, end of period (000’s omitted) | | $ | 3,912 | | | $ | 3,032 | |
| Ratios to average net assets: | | | | | | | | |
| Expenses, net of expense reimbursements/waivers | | | 0.85 | % | | | 0.85 | %4 |
| Expenses, prior to expense reimbursements/waivers | | | 4.29 | % | | | 7.74 | %4 |
| Net investment income | | | 3.33 | % | | | 2.73 | %4 |
| Portfolio turnover rate | | | 12 | % | | | 18 | %5 |
|
| EGShares Utilities GEMS ETF (Consolidated) |
| | | For the
Year Ended
March 31, 2013 | | For the Period
June 23, 20111
Through
March 31, 2012 |
| Net asset value, beginning of period | | $ | 18.59 | | | $ | 20.00 | |
| Investment operations: | | | | | | | | |
| Net investment income2 | | | 0.55 | | | | 0.25 | |
| Net realized and unrealized loss on investments and foreign currency translations | | | (1.25 | ) | | | (1.46 | ) |
| Total from investment operations | | | (0.70 | ) | | | (1.21 | ) |
| Distributions to shareholders: | | | | | | | | |
| Net investment income | | | (0.29 | ) | | | (0.20 | ) |
| Net asset value, end of period | | $ | 17.60 | | | $ | 18.59 | |
| NET ASSET VALUE TOTAL RETURN3 | | | (3.72 | )% | | | (5.89 | )% |
|
| RATIOS/SUPPLEMENTAL DATA: | | | | | | | | |
| Net assets, end of period (000’s omitted) | | $ | 3,520 | | | $ | 2,788 | |
| Ratios to average net assets: | | | | | | | | |
| Expenses, net of expense reimbursements/waivers | | | 0.85 | % | | | 0.87 | %4,6 |
| Expenses, prior to expense reimbursements/waivers | | | 5.44 | % | | | 7.08 | %4 |
| Net investment income | | | 3.13 | % | | | 1.82 | %4 |
| Portfolio turnover rate | | | 36 | % | | | 27 | %5 |
| 1 | Commencement of operations. |
| 2 | Based on average shares outstanding. |
| 3 | Total return is calculated assuming an initial investment made at the net asset value at the beginning of the period, reinvestment of all dividends and distributions at net asset value during the period, and redemption at net asset value on the last day of the period. Total return calculated for a period of less than one year is not annualized. The total return would have been lower if certain expenses had not been reimbursed/waived by the sub-adviser. |
| 6 | The ratio includes 0.02% for the period ended March 31, 2012 attributed to interest expense, which is outside the cap expense. |
The accompanying notes are an integral part of these financial statements.
| 104 EGA Emerging Global Shares Trust | |
Notes to Financial Statements
March 31, 2013
1. ORGANIZATION
EGA Emerging Global Shares Trust (the “Trust”) is a Delaware statutory trust organized on September 12, 2008. The Trust is an open-end management investment company, registered under the Investment Company Act of 1940, as amended (the “1940 Act”). The Trust currently consists of forty-five separate non-diversified series, each of which tracks an underlying index (each, an “Underlying Index”). As of the date of this report, only the following ETFs (each an “ETF” or “Fund” and collectively the “ETFs” or “Funds”) are being publicly offered:
| |
| Funds | Commencement
of Operations |
| EGShares Basic Materials GEMS ETF (“Basic Materials ETF”) | June 23, 2011 |
| EGShares Beyond BRICs ETF (“Beyond BRICs ETF”) | August 15, 2012 |
| EGShares Brazil Infrastructure ETF (“Brazil Infrastructure ETF”) | February 24, 2010 |
| EGShares China Infrastructure ETF (“China Infrastructure ETF”) | February 17, 2010 |
| EGShares Consumer Goods GEMS ETF (“Consumer Goods ETF”) | June 23, 2011 |
| EGShares Consumer Services GEMS ETF (“Consumer Services ETF”) | June 23, 2011 |
| EGShares Emerging Markets Consumer ETF (“Consumer ETF”) | September 14, 2010 |
| EGShares Emerging Markets Core ETF (“Core ETF”) | October 16, 2012 |
| EGShares Emerging Markets Domestic Demand ETF (“Domestic Demand ETF”) | August 15, 2012 |
| EGShares Emerging Markets Metals & Mining ETF (“Metals & Mining ETF”) | May 21, 2009 |
| EGShares Energy GEMS ETF (“Energy ETF”) | May 21, 2009 |
| EGShares Financials GEMS ETF (“Financials ETF”) | September 16, 2009 |
| EGShares GEMS Composite ETF (“Composite ETF”) | July 22, 2009 |
| EGShares Health Care GEMS ETF (“Health Care ETF”) | June 23, 2011 |
| EGShares India Consumer ETF (“India Consumer ETF”) | August 10, 2011 |
| EGShares India Infrastructure ETF (“India Infrastructure ETF”) | August 11, 2010 |
| EGShares India Small Cap ETF (“India Small Cap ETF”) | July 7, 2010 |
| EGShares Industrials GEMS ETF (“Industrials ETF”) | June 23, 2011 |
| EGShares Low Volatility Emerging Markets Dividend ETF (“Low Volatility Dividend ETF”) | August 4, 2011 |
| EGShares Technology GEMS ETF (“Technology ETF”) | June 23, 2011 |
| EGShares Telecom GEMS ETF (“Telecom ETF”) | June 23, 2011 |
| EGShares Utilities GEMS ETF (“Utilities ETF”) | June 23, 2011 |
The Basic Materials ETF’s investment objective is to seek investment results that correspond (before fees and expenses) to the price and yield performance of the Dow Jones Emerging Markets Basic Materials Titans 30 IndexSM. The Dow Jones Emerging Markets Basic Materials Titans 30 IndexSM is comprised of publicly traded firms in the “Basic Materials Industry,” as defined by the S&P Dow Jones Indices’ proprietary classification system.
The Beyond BRICs ETF’s investment objective is to seek investment results that correspond (before fees and expenses) to the price and yield performance of the INDXX Beyond BRICs Index. The INDXX Beyond BRICs Index is comprised of 50 leading companies that INDXX, LLC determines to be representative of all industries in emerging market countries, excluding Brazil, Russia, India and China.
The Brazil Infrastructure ETF’s investment objective is to seek investment results that correspond (before fees and expenses) to the price and yield performance of the INDXX Brazil Infrastructure Index. The INDXX Brazil Infrastructure Index is comprised of 30 leading companies that INDXX, LLC determines to be representative of Brazil’s infrastructure sectors.
The China Infrastructure ETF’s investment objective is to seek investment results that correspond (before fees and expenses) to the price and yield performance of the INDXX China Infrastructure Index. The INDXX China Infrastructure Index is comprised of 30 leading companies that INDXX, LLC determines to be representative of China’s infrastructure sectors.
The Consumer Goods ETF’s investment objective is to seek investment results that correspond (before fees and expenses) to the price and yield performance of the Dow Jones Emerging Markets Consumer Goods Titans 30 IndexSM. The Dow Jones Emerging Markets Consumer Goods Titans 30 IndexSM is comprised of publicly traded firms in the “Consumer Goods Industry,” as defined by S&P Dow Jones Indices’ proprietary classification system.
The Consumer Services ETF’s investment objective is to seek investment results that correspond (before fees and expenses) to the price and yield performance of the Dow Jones Emerging Markets Consumer Services Titans 30 IndexSM. The Dow Jones Emerging Markets Consumer Services Titans 30 IndexSM is comprised of publicly traded firms in the “Consumer Services Industry,” as defined by S&P Dow Jones Indices’ proprietary classification system.
| | EGA Emerging Global Shares Trust 105 |
Notes to Financial Statements (continued)
March 31, 2013
The Consumer ETF’s investment objective is to seek investment results that correspond (before fees and expenses) to the price and yield performance of the Dow Jones Emerging Markets Consumer Titans 30 IndexSM. The Dow Jones Emerging Markets Consumer Titans 30 IndexSM is comprised of publicly traded firms in the “Consumer Goods Industry” and “Consumer Services Industry,” as defined by S&P Dow Jones Indices’ proprietary classification system.
The Core ETF’s investment objective is to seek investment results that correspond (before fees and expenses) to the price and yield performance of the S&P Emerging Markets Core Index. The S&P Emerging Markets Core Index is comprised of 116 leading companies that S&P Dow Jones Indices determines to be representative of all industries in emerging market countries.
The Domestic Demand ETF’s investment objective is to seek investment results that correspond (before fees and expenses) to the price and yield performance of the INDXX Emerging Markets Domestic Demand Index. The INDXX Emerging Markets Domestic Demand Index is comprised of a representative sample of 50 emerging markets companies in sectors that INDXX, LLC determines may have greater exposure to local markets than the MSCI Emerging Markets IndexSM.
The Metals & Mining ETF’s investment objective is to seek investment results that correspond (before fees and expenses) to the price and yield performance of the Dow Jones Emerging Markets Metals & Mining Titans 30 IndexSM. The Dow Jones Emerging Markets Metals & Mining Titans 30 IndexSM is comprised of publicly traded firms in the “Industrial Metals and Mining Sector” and “Mining Sector,” as defined by S&P Dow Jones Indices’ proprietary classification system.
The Energy ETF’s investment objective is to seek investment results that correspond (before fees and expenses) to the price and yield performance of the Dow Jones Emerging Markets Oil and Gas Titans 30 IndexSM. The Dow Jones Emerging Markets Oil and Gas Titans 30 IndexSM is comprised of publicly traded firms in the “Oil and Gas Industry,” as defined by S&P Dow Jones Indices’ proprietary classification system.
The Financials ETF’s investment objective is to seek investment results that correspond (before fees and expenses) to the price and yield performance of the Dow Jones Emerging Markets Financials Titans 30 IndexSM. The Dow Jones Emerging Markets Financials Titans 30 IndexSM is comprised of publicly traded firms in the “Financials Industry,” as defined by S&P Dow Jones Indices’ proprietary classification system.
The Composite ETF’s investment objective is to seek investment results that correspond (before fees and expenses) to the price and yield performance of the Dow Jones Emerging Markets Sector Titans Composite 100 IndexSM. The Dow Jones Emerging Markets Sector Titans Composite 100 IndexSM is comprised of a representative sample of 100 Emerging Markets companies deemed to be the 10 leading companies in each of the 10 “Industries,” as defined by S&P Dow Jones Indices’ proprietary classification system.
The Health Care ETF’s investment objective is to seek investment results that correspond (before fees and expenses) to the price and yield performance of the Dow Jones Emerging Markets Health Care Titans 30 IndexSM. The Dow Jones Emerging Markets Health Care Titans 30 IndexSM is comprised of publicly traded firms in the “Health Care Industry,” as defined by S&P Dow Jones Indices’ proprietary classification system.
The India Consumer ETF’s investment objective is to seek investment results that correspond (before fees and expenses) to the price and yield performance of the INDXX India Consumer Index. The INDXX India Consumer Index is comprised of 30 leading companies that INDXX, LLC determines to be representative of India’s consumer sectors.
The India Infrastructure ETF’s investment objective is to seek investment results that correspond (before fees and expenses) to the price and yield performance of the INDXX India Infrastructure Index. The INDXX India Infrastructure Index is comprised of 30 leading companies that INDXX, LLC determines to be representative of India’s infrastructure sectors.
The India Small Cap ETF’s investment objective is to seek investment results that correspond (before fees and expenses) to the price and yield performance of the INDXX India Small Cap Index. The INDXX India Small Cap Index is comprised of a representative sample of 75 emerging markets companies that INDXX, LLC determines to be representative of small capitalization companies domiciled in India.
The Industrials ETF’s investment objective is to seek investment results that correspond (before fees and expenses) to the price and yield performance of the Dow Jones Emerging Markets Industrials Titans 30 IndexSM. The Dow Jones Emerging Markets Industrials Titans 30 IndexSM is comprised of publicly traded firms in the “Industrials Industry,” as defined by S&P Dow Jones Indices’ proprietary classification system.
The Low Volatility Dividend ETF’s investment objective is to seek investment results that correspond (before fees and expenses) to the price and yield performance of the INDXX Emerging Market High Income Low Beta Index. The INDXX Emerging Market High Income Low Beta Index is comprised of a representative sample of 30 emerging markets companies that INDXX, LLC determines to have lower relative volatility (i.e., low beta) than the broad market benchmark indices of the local exchanges in which the component securities trade, which have also paid dividends consistently over the last three years.
| 106 EGA Emerging Global Shares Trust | |
Notes to Financial Statements (continued)
March 31, 2013
The Technology ETF’s investment objective is to seek investment results that correspond (before fees and expenses) to the price and yield performance of the Dow Jones Emerging Markets Technology Titans 30 IndexSM. The Dow Jones Emerging Markets Technology Titans 30 IndexSM is comprised of publicly traded firms in the “Technology Industry,” as defined by S&P Dow Jones Indices’ proprietary classification system.
The Telecom ETF’s investment objective is to seek investment results that correspond (before fees and expenses) to the price and yield performance of the Dow Jones Emerging Markets Telecommunications Titans 30 IndexSM. The Dow Jones Emerging Markets Telecommunications Titans 30 IndexSM is comprised of publicly traded firms in the “Telecommunications Industry,” as defined by S&P Dow Jones Indices’ proprietary classification system.
The Utilities ETF’s investment objective is to seek investment results that correspond (before fees and expenses) to the price and yield performance of the Dow Jones Emerging Markets Utilities Titans 30 IndexSM. The Dow Jones Emerging Markets Utilities Titans 30 IndexSM is comprised of publicly traded firms in the “Utilities Industry,” as defined by S&P Dow Jones Indices’ proprietary classification system.
2. CONSOLIDATION OF SUBSIDIARIES
The Consolidated Schedules of Investments; Consolidated Statements of Assets and Liabilities, of Operations and of Changes in Net Assets; and the Consolidated Financial Highlights of the ETFs listed below include the accounts of wholly owned subsidiaries. All inter-company accounts and transactions have been eliminated in consolidation.
| |
| Funds | Wholly Owned Subsidiary |
| Basic Materials ETF | EGShares Basic Materials Mauritius |
| Consumer Goods ETF | EGShares Consumer Goods Mauritius |
| Consumer ETF | EGShares Consumer Mauritius |
| Core ETF | EGShares Core Mauritius |
| Domestic Demand ETF | EGShares Domestic Demand Mauritius |
| Metals & Mining ETF | EGShares Metals & Mining Mauritius |
| Energy ETF | EGShares Energy Fund Mauritius |
| Financials ETF | EGShares Financials Fund Mauritius |
| Composite ETF | EGShares Composite Mauritius |
| Health Care ETF | EGShares Health Care Mauritius |
| India Consumer ETF | EGShares India Consumer Mauritius |
| India Infrastructure ETF | EGShares India Infrastructure Mauritius |
| India Small Cap ETF | EGShares India Small Cap Mauritius |
| Industrials ETF | EGShares Industrials Mauritius |
| Low Volatility Dividend ETF | EGShares Low Volatility Emerging Markets Dividend Mauritius |
| Technology ETF | EGShares Technology Mauritius |
| Telecom ETF | EGShares Telecom Mauritius |
| Utilities ETF | EGShares Utilities Mauritius |
The Basic Materials ETF, Consumer Goods ETF, Consumer ETF, Core ETF, Domestic Demand ETF, Metals & Mining ETF, Energy ETF, Financials ETF, Composite ETF, Health Care ETF, Industrials ETF, Low Volatility Dividend ETF, Technology ETF, Telecom ETF and Utilities ETF may each invest its assets in a wholly owned subsidiary in Mauritius, which in turn invests virtually all of its assets in Indian securities, based on the number of Indian securities that are included in each ETF’s respective Underlying Index.
The India Consumer ETF, India Infrastructure ETF and India Small Cap ETF invest substantially all of their assets in wholly owned subsidiaries in Mauritius, which in turn invest at least 90% of their assets in Indian securities, and to some extent American Depositary Receipts (“ADRs”) and Global Depositary Receipts (“GDRs”), based on the number of Indian securities that are included in each ETF’s respective Underlying Index.
By investing in a wholly owned subsidiary, the Basic Materials ETF, the Consumer Goods ETF, the Consumer ETF, the Core ETF, the Domestic Demand ETF, the Metals & Mining ETF, the Energy ETF, the Financials ETF, the Composite ETF, the Health Care ETF, the India Consumer ETF, the India Infrastructure ETF, the India Small Cap ETF, the Industrials ETF, the Low Volatility Dividend ETF, the Technology ETF, the Telecom ETF and the Utilities ETF each obtain benefits under the tax treaty between Mauritius and India. Each subsidiary may be subject to withholding taxes imposed by the Indian government on dividends, interest and realized capital gains should new legislation be passed to modify the current tax treaty with Mauritius. Any change in the provisions of this treaty could result in the imposition of withholding and other taxes on these ETFs by authorities in India. This would reduce the return on investment and the return received by each ETF’s shareholders.
| | EGA Emerging Global Shares Trust 107 |
Notes to Financial Statements (continued)
March 31, 2013
A summary of each ETF’s investment in its corresponding subsidiary is as follows:
| Funds | | Inception Date
of Subsidiary | | Subsidiary
Net Assets at
March 31, 2013 | | % of ETF’s Total
Net Assets at
March 31, 2013 |
| Basic Materials ETF | | June 23, 2011 | | $ | 271,934 | | | | 7.4 | % |
| Consumer Goods ETF | | June 23, 2011 | | | 329,148 | | | | 13.6 | |
| Consumer ETF | | September 14, 2010 | | | 87,929,767 | | | | 9.9 | |
| Core ETF | | October 16, 2012 | | | 540,680 | | | | 13.0 | |
| Domestic Demand ETF | | August 15, 2012 | | | 278,302 | | | | 12.6 | |
| Metals & Mining ETF | | September 19, 2011 | | | 788,072 | | | | 9.3 | |
| Energy ETF | | June 27, 2011 | | | 771,982 | | | | 8.5 | |
| Financials ETF | | June 27, 2011 | | | 201,779 | | | | 4.6 | |
| Composite ETF | | September 19, 2011 | | | 891,209 | | | | 5.3 | |
| Health Care ETF | | June 23, 2011 | | | 1,437,089 | | | | 25.0 | |
| India Consumer ETF | | August 10, 2011 | | | 6,639,909 | | | | 100.1 | |
| India Infrastructure ETF | | August 11, 2010 | | | 51,474,139 | | | | 99.9 | |
| India Small Cap ETF | | July 7, 2010 | | | 21,173,016 | | | | 100.0 | |
| Industrials ETF | | June 23, 2011 | | | 340,183 | | | | 11.1 | |
| Low Volatility Dividend ETF | | August 4, 2011 | | | 4,618,445 | | | | 5.2 | |
| Technology ETF | | June 23, 2011 | | | 511,769 | | | | 19.1 | |
| Telecom ETF | | June 23, 2011 | | | 167,264 | | | | 4.3 | |
| Utilities ETF | | June 23, 2011 | | | 413,011 | | | | 11.7 | |
3. SIGNIFICANT ACCOUNTING POLICIES
These financial statements are prepared in accordance with accounting principles generally accepted in the United States of America (“GAAP”), which requires management to make estimates and assumptions that affect the reported amounts of assets and liabilities, the disclosure of contingent assets and liabilities at the date of the financial statements, and the reported amounts of increases and decreases in net assets from operations during the reporting period. Actual amounts could differ from these estimates. The following summarizes the significant accounting policies of the ETFs.
Indemnifications
In the normal course of business, the Trust enters into contracts that contain a variety of representations that provide general indemnifications. The Trust’s maximum exposure under these arrangements cannot be known as this would involve future claims that may be made against the Trust that have not yet occurred; however, the Trust expects any risk of loss to be remote.
Investment Valuation
The Net Asset Value (“NAV”) per share is computed as of the scheduled close of regular trading on the New York Stock Exchange (“NYSE”), ordinarily 4:00 p.m. Eastern time, on each day during which the NYSE is open for trading. The NAV per share of an ETF is computed by dividing the value of the ETF’s portfolio securities, cash and other assets (including accrued interest), less all liabilities (including accrued expenses), by the total number of shares outstanding at the time such computation is made.
Securities Valuation
Foreign equity securities are valued at the last reported sale price on the principal exchange on which such securities are traded. U.S. listed equity securities and listed ADRs and GDRs are valued at the last reported sale price on the principal exchange on which such securities are traded, as of the close of regular trading on the NYSE on the day the securities are being valued or, if there are no sales, at the mean of the most recent bid and asked prices. U.S. equity securities that are traded in over-the-counter markets are valued at the NASDAQ Official Closing Price as of the close of regular trading on the NYSE on the day the securities are valued or, if there are no sales, at the mean of the most recent bid and asked prices. Securities for which market quotations are not readily available, including restricted securities, are valued by a method that the Board of Trustees (the “Board”) believes accurately reflects fair value. The value of assets denominated in foreign currencies is converted into U.S. dollars using exchange rates deemed appropriate by management of the ETFs. Use of a rate different from the rate used by CME Group Index Services LLC or INDXX, LLC may adversely affect an ETF’s ability to track its Underlying Index.
| 108 EGA Emerging Global Shares Trust | |
Notes to Financial Statements (continued)
March 31, 2013
Foreign Currency Translations
Investments denominated in foreign currencies are subject to additional risk factors as compared to investments denominated in U.S. dollars. The value of an investment denominated in a foreign currency could change significantly as foreign currencies strengthen or weaken relative to the U.S. dollar. Generally, when the U.S. dollar gains in value against a foreign currency, an investment traded in that foreign currency loses value because that currency is worth fewer U.S. dollars. Risks related to foreign currencies also include those related to economic or political developments, market inefficiencies or a higher risk that essential investment information may be incomplete, unavailable or inaccurate. A U.S. dollar investment in depositary receipts or ordinary shares of foreign issuers traded on U.S. exchanges is indirectly subject to foreign currency risk to the extent that the issuer conducts its principal business in markets where transactions are denominated in foreign currencies.
Portfolio securities and other assets and liabilities denominated in foreign currencies are translated into U.S. dollars based on the exchange rate of such currencies against U.S. dollars on the date of valuation. Purchases and sales of securities and income items denominated in foreign currencies are translated into U.S. dollars at the exchange rate in effect on the transaction date.
The ETFs do not separately report the effect of changes in foreign exchange rates from changes in market prices on securities held. Such changes are included in net realized and unrealized gains or losses from investments.
Realized foreign exchange gains or losses arise from sales of foreign currencies, currency gains or losses realized between the trade and settlement dates on securities transactions and the difference between the recorded amounts of dividends, interest, and foreign withholding taxes, and the U.S. dollar equivalent of the amounts actually received or paid. Net unrealized foreign exchange gains and losses arise from changes in foreign exchange rates on foreign denominated assets and liabilities other than investments in securities held at the end of the reporting period.
Security Transactions and Related Income
Investment transactions are recorded on trade date. The ETFs determine the gain or loss realized from the investment transactions by comparing the identified cost, which is the same basis used for federal income tax purposes, with the net sales proceeds. Dividend income is recorded on the ex-dividend date. Interest income is recorded on the accrual basis.
Federal Income Taxes
The Basic Materials ETF, Brazil Infrastructure ETF, China Infrastructure ETF, Consumer Goods ETF, Consumer Services ETF, Consumer ETF, Metals & Mining ETF, Energy ETF, Financials ETF, Composite ETF, Health Care ETF, India Consumer ETF, India Infrastructure ETF, India Small Cap ETF, Industrials ETF, Low Volatility Dividend ETF, Technology ETF, Telecom ETF and Utilities ETF have qualified and continue to qualify, and the Beyond BRICs ETF, Core ETF and Domestic Demand ETF intend to qualify, as a “regulated investment company” under Subchapter M of the Internal Revenue Code. If so qualified, an ETF will not be subject to federal income tax to the extent it distributes substantially all of its net investment income and capital gains to shareholders. Each ETF expects to declare and pay all of its net investment income, if any, to shareholders as dividends annually (quarterly for the Low Volatility Dividend ETF), and will also declare and pay net realized capital gains, if any, at least annually, except where the costs of such distributions exceed the amount of tax that the distributions are intended to avoid, in which case the ETF will pay the applicable tax. An ETF may distribute such investment income and capital gains more frequently, if necessary, in order to reduce or eliminate federal excise or income taxes on the ETF. Distributions to shareholders are recorded on the ex-dividend date.
The ETFs are subject to accounting standards that provide guidance for how uncertain tax positions should be recognized, measured, presented and disclosed in the financial statements. These standards require the evaluation of tax positions taken or expected to be taken by the ETFs and whether the tax positions are “more-likely-than-not” of being sustained by the applicable tax authority. Tax positions not deemed to meet the more-likely-than-not threshold would be recorded as a tax benefit or expense in the current year. Accounting for uncertainty in income taxes requires management of the ETFs to analyze all open tax years as defined by IRS statute of limitations, for all major jurisdictions, including federal tax authorities and certain state tax authorities. Open tax years are those years that are open for examination by the relevant income taxing authority. As of March 31, 2013, open federal and state income tax years include the tax years or periods ended March 31, 2010, March 31, 2011, March 31, 2012 and March 31, 2013. The ETFs have no examinations in progress.
There is no tax liability resulting from uncertain income tax positions taken or expected to be taken. The ETFs are also not aware of any tax positions for which it is reasonably possible that the total amounts of unrecognized tax expense will significantly change in the next twelve months.
| | EGA Emerging Global Shares Trust 109 |
Notes to Financial Statements (continued)
March 31, 2013
Expenses
Expenses of the Trust, which are directly identifiable to a specific ETF, are applied to that ETF. Expenses which are not readily identifiable to a specific ETF are allocated in such a manner as deemed equitable, taking into consideration the nature and type of expense and the relative net assets of each ETF in the Trust.
Offering Expenses
Costs incurred in connection with the initial offering of the ETFs are being amortized over a 12-month period from inception of the ETF.
4. INVESTMENT RISKS
The ETFs are subject to emerging markets risk. Investments in emerging market securities are subject to even greater risks than for foreign investments generally, including increased risks of: illiquidity of securities; price volatility; inflation or deflation; restrictions on foreign investment; nationalization; higher taxation; economic and political instability; pervasive corruption and crime; less governmental regulation; and less developed legal systems.
The Basic Materials ETF concentrates its investments in industries to the same extent as the Basic Materials Underlying Index, and as such, may be adversely affected by increased price volatility of securities in the basic materials industry, and may be more susceptible to adverse economic, market, political or regulatory occurrences affecting that industry. Issuers in the basic materials industry are at risk for environmental damage and product liability claims and may be adversely affected by depletion of resources, technical progress, labor relations and governmental regulations.
The Beyond BRICs ETF concentrates its investments in industries to the same extent as the Beyond BRICs Underlying Index, and as such, may be adversely affected by increased price volatility of securities in those industries, and may be more susceptible to adverse economic, market, political or regulatory occurrences affecting those industries.
The Brazil Infrastructure ETF only invests in Brazilian securities. Its NAV will therefore be much more sensitive to changes in economic, political and other factors within Brazil than would a fund that invested in a greater variety of countries.
The China Infrastructure ETF only invests in Chinese securities. Its NAV will therefore be much more sensitive to changes in economic, political and other factors within China than would a fund that invested in a greater variety of countries.
The Brazil Infrastructure ETF, China Infrastructure ETF, and India Infrastructure ETF concentrate their investments in industries to the same extent as their respective Underlying Indices, and as such, may be adversely affected by increased price volatility of securities in the infrastructure sector, and may be more susceptible to adverse economic, market, political or regulatory occurrences affecting that sector.
The Consumer Goods ETF, Consumer Services ETF, Consumer ETF and India Consumer ETF concentrate their investments in industries to the same extent as their respective Underlying Indices, and as such, may be adversely affected by increased price volatility of securities in the consumer industry, and may be more susceptible to adverse economic, market, political or regulatory occurrences affecting that industry. The success of consumer goods and consumer services suppliers and retailers is tied closely to the performance of the domestic and international economy, interest rates, currency exchange rates, competition, preferences, and consumer confidence.
The Core ETF concentrates its investments in industries to the same extent as the Core Underlying Index, and as such, may be adversely affected by increased price volatility of securities in those industries, and may be more susceptible to adverse economic, market, political or regulatory occurrences affecting those industries.
The Domestic Demand ETF concentrates its investments in industries to the same extent as the Domestic Demand Underlying Index, and as such, may be adversely affected by increased price volatility of securities in the consumer goods, consumer services, health care, telecommunications and utilities industries, and may be more susceptible to adverse economic, market, political or regulatory occurrences affecting those industries.
The Metals & Mining ETF concentrates its investments in industries to the same extent as the Metals & Mining Underlying Index, and as such, may be adversely affected by increased price volatility of securities in the metals and mining industry, and may be more susceptible to adverse economic, market, political or regulatory occurrences affecting that industry. Securities of companies involved in metals and mining may be subject to broad price fluctuations, reflecting volatility of energy and basic materials prices and possible instability of supply of various basic resources.
The Energy ETF concentrates its investments in industries to the same extent as the Energy Underlying Index, and as such, may be adversely affected by increased price volatility of securities in the oil and gas industry, and may be more susceptible to adverse economic, market, political or regulatory occurrences affecting that industry. The profitability of companies in the oil and gas industry (including alternative energy suppliers) is related to worldwide energy prices, exploration, and production spending.
| 110 EGA Emerging Global Shares Trust | |
Notes to Financial Statements (continued)
March 31, 2013
The Financials ETF concentrates its investments in industries to the same extent as the Financials Underlying Index, and as such, may be adversely affected by increased price volatility of securities in the financial industry, and may be more susceptible to adverse economic, market, political or regulatory occurrences affecting that industry. Companies in the financial industry are subject to extensive governmental regulation, which may adversely affect the scope of their activities, the prices they can charge and the amount of capital they must maintain.
The GEM Composite ETF concentrates its investments in a particular industry or group of industries to approximately the same extent that the Composite Underlying Index is concentrated. The Composite Underlying Index is comprised of a representative sample of 100 Emerging Markets companies deemed to be the 10 leading companies in each of the 10 “Industries” as defined by the Industry Classification Benchmark (“ICB”) system.
The Health Care ETF concentrates its investments in industries to the same extent as the Health Care Underlying Index, and as such, may be adversely affected by increased price volatility of securities in the health care industry, and may be more susceptible to adverse economic, market, political or regulatory occurrences affecting that industry. The profitability of companies in the health care industry may be affected by extensive government regulation, restriction on government reimbursement for medical expenses, rising costs of medical products and services, pricing pressure, an increased emphasis on outpatient services, limited number of products, industry innovation, changes in technologies and other market developments.
The India Consumer ETF, India Infrastructure ETF and India Small Cap ETF only invest in Indian securities. Their NAVs will therefore be much more sensitive to changes in economic, political and other factors within India than would a fund that invested in a greater variety of countries.
The India Small Cap ETF primarily invests in small capitalization companies, and as such, may be adversely affected by increased price volatility of securities in that capitalization.
The Industrials ETF concentrates its investments in industries to the same extent as the Industrials Underlying Index, and as such, may be adversely affected by increased price volatility of securities in the industrials industry, and may be more susceptible to adverse economic, market, political or regulatory occurrences affecting that industry. Government regulation, world events and economic conditions affect the performance of companies in the industrials industry.
The Low Volatility Emerging Market Dividend ETF concentrates its investments in industries to the same extent as the HILB Underlying Index, and as such, may be adversely affected by increased price volatility of securities in those industries, and may be more susceptible to adverse economic, market, political or regulatory occurrences affecting those industries.
The Technology ETF concentrates its investments in industries to the same extent as the Technology Underlying Index, and as such, may be adversely affected by increased price volatility of securities in the technology industry, and may be more susceptible to adverse economic, market, political or regulatory occurrences affecting that industry. Technology companies may be affected by intense competition, obsolescence of existing technology, general economic conditions, government regulation and may have limited product lines, markets, financial resources or personnel.
The Telecom ETF concentrates its investments in industries to the same extent as the Telecom Underlying Index, and as such, may be adversely affected by increased price volatility of securities in the telecommunications industry, and may be more susceptible to adverse economic, market, political or regulatory occurrences affecting that industry. The global telecommunications market is characterized by increasing competition and government regulation.
The Utilities ETF concentrates its investments in industries to the same extent as the Utilities Underlying Index, and as such, may be adversely affected by increased price volatility of securities in the utilities industry, and may be more susceptible to adverse economic, market, political or regulatory occurrences affecting that industry. Companies in the utilities industry may be adversely affected by changes in exchange rates, domestic and international competition, and governmental limitation on rates charged to customers.
5. DISTRIBUTION AGREEMENT
ALPS Distributors, Inc., (the “Distributor”) serves as the distributor of creation units (see Note 10) for the ETFs pursuant to a distribution agreement. The Distributor does not maintain a secondary market in shares. The ETFs have adopted a Distribution and Service Plan (the “Plan”) pursuant to Rule 12b-1 under the 1940 Act. In accordance with the Plan, each ETF is authorized to pay an amount up to 0.25% of its average daily net assets each year for certain distribution-related activities. For the period ended March 31, 2013, no fees were paid by the ETFs under the Plan, and there are no current plans to impose these fees.
| | EGA Emerging Global Shares Trust 111 |
Notes to Financial Statements (continued)
March 31, 2013
6. FEDERAL INCOME TAX MATTERS
For the period ended March 31, 2013, federal tax cost of investments and net unrealized appreciation (depreciation) were as follows:
| Funds | | Federal
Tax Cost of
Investments | | Gross
Unrealized
Appreciation | | Gross
Unrealized
Depreciation | | Net Unrealized
Appreciation
(Depreciation) |
| Basic Materials ETF | | $ | 4,584,431 | | | $ | 42,122 | | | $ | (963,767 | ) | | $ | (921,645 | ) |
| Beyond BRICs ETF | | | 7,028,633 | | | | 823,650 | | | | (196,498 | ) | | | 627,152 | |
| Brazil Infrastructure ETF | | | 76,346,860 | | | | 13,627,724 | | | | (10,772,500 | ) | | | 2,855,224 | |
| China Infrastructure ETF | | | 15,118,191 | | | | 918,697 | | | | (2,932,023 | ) | | | (2,013,326 | ) |
| Consumer Goods ETF | | | 2,253,550 | | | | 243,158 | | | | (64,741 | ) | | | 178,417 | |
| Consumer Services ETF | | | 2,151,439 | | | | 146,152 | | | | (133,332 | ) | | | 12,820 | |
| Consumer ETF | | | 813,654,377 | | | | 113,040,076 | | | | (42,742,176 | ) | | | 70,297,900 | |
| Core ETF | | | 4,074,397 | | | | 185,616 | | | | (98,897 | ) | | | 86,719 | |
| Domestic Demand ETF | | | 1,963,153 | | | | 300,100 | | | | (38,324 | ) | | | 261,776 | |
| Metals & Mining ETF | | | 13,797,798 | | | | 518,598 | | | | (5,814,281 | ) | | | (5,295,683 | ) |
| Energy ETF | | | 10,982,055 | | | | 395,927 | | | | (2,268,924 | ) | | | (1,872,997 | ) |
| Financials ETF | | | 4,429,736 | | | | 307,878 | | | | (403,627 | ) | | | (95,749 | ) |
| Composite ETF | | | 17,952,739 | | | | 1,457,477 | | | | (2,485,821 | ) | | | (1,028,344 | ) |
| Health Care ETF | | | 5,417,421 | | | | 481,237 | | | | (154,284 | ) | | | 326,953 | |
| India Consumer ETF | | | 6,403,258 | | | | 1,018,059 | | | | (788,363 | ) | | | 229,696 | |
| India Infrastructure ETF | | | 75,797,594 | | | | 31,799,889 | | | | (56,244,941 | ) | | | (24,445,052 | ) |
| India Small Cap ETF | | | 24,005,383 | | | | 12,314,575 | | | | (15,203,854 | ) | | | (2,889,279 | ) |
| Industrials ETF | | | 3,061,197 | | | | 212,100 | | | | (211,379 | ) | | | 721 | |
| Low Volatility Dividend ETF | | | 84,275,711 | | | | 8,071,600 | | | | (3,450,552 | ) | | | 4,621,048 | |
| Technology ETF | | | 2,762,071 | | | | 235,681 | | | | (313,953 | ) | | | (78,272 | ) |
| Telecom ETF | | | 3,970,214 | | | | 404,019 | | | | (484,279 | ) | | | (80,260 | ) |
| Utilities ETF | | | 3,577,297 | | | | 304,792 | | | | (375,536 | ) | | | (70,744 | ) |
| 112 EGA Emerging Global Shares Trust | |
Notes to Financial Statements (continued)
March 31, 2013
For the period ended March 31, 2013, the components of accumulated earnings (losses) on a tax-basis were as follows:
| Funds | | Undistributed
Ordinary Income | | Accumulated
Capital and
Other Losses | | Net
Unrealized
Appreciation
(Depreciation) | | Total
Accumulated
Earnings (Losses) |
| Basic Materials ETF | | $ | 6,828 | | | $ | (169,312 | ) | | $ | (921,636 | ) | | $ | (1,084,120 | ) |
| Beyond BRICs ETF | | | 24,479 | | | | (8,697 | ) | | | 627,443 | | | | 643,225 | |
| Brazil Infrastructure ETF | | | 147,999 | | | | (9,414,233 | ) | | | 2,854,666 | | | | (6,411,568 | ) |
| China Infrastructure ETF | | | — | | | | (2,387,867 | ) | | | (2,013,326 | ) | | | (4,401,193 | ) |
| Consumer Goods ETF | | | 7,043 | | | | (10,095 | ) | | | 178,468 | | | | 175,416 | |
| Consumer Services ETF | | | 659 | | | | (23,399 | ) | | | 12,828 | | | | (9,912 | ) |
| Consumer ETF | | | 434,225 | | | | (5,107,849 | ) | | | 70,304,335 | | | | 65,630,711 | |
| Core ETF | | | 12,943 | | | | — | | | | 85,966 | | | | 98,909 | |
| Domestic Demand ETF | | | 7,977 | | | | (1,966 | ) | | | 261,823 | | | | 267,834 | |
| Metals & Mining ETF | | | 14,821 | | | | (2,134,230 | ) | | | (5,295,855 | ) | | | (7,415,264 | ) |
| Energy ETF | | | 1,787 | | | | (1,344,946 | ) | | | (1,872,769 | ) | | | (3,215,928 | ) |
| Financials ETF | | | 12,037 | | | | (116,688 | ) | | | (95,882 | ) | | | (200,533 | ) |
| Composite ETF | | | 51,762 | | | | (1,671,292 | ) | | | (1,028,779 | ) | | | (2,648,309 | ) |
| Health Care ETF | | | 1,551 | | | | (50,229 | ) | | | 326,987 | | | | 278,309 | |
| India Consumer ETF | | | — | | | | (322,687 | ) | | | 229,811 | | | | (92,876 | ) |
| India Infrastructure ETF | | | — | | | | (13,401,166 | ) | | | (24,444,656 | ) | | | (37,845,822 | ) |
| India Small Cap ETF | | | — | | | | (14,044,516 | ) | | | (2,888,561 | ) | | | (16,933,077 | ) |
| Industrials ETF | | | 21,189 | | | | (183,323 | ) | | | 785 | | | | (161,349 | ) |
| Low Volatility Dividend ETF | | | 560,079 | | | | (8,094,333 | ) | | | 4,621,480 | | | | (2,912,774 | ) |
| Technology ETF | | | 10,524 | | | | (162,904 | ) | | | (78,266 | ) | | | (230,646 | ) |
| Telecom ETF | | | 21,657 | | | | (57,010 | ) | | | (80,063 | ) | | | (115,416 | ) |
| Utilities ETF | | | 37,221 | | | | (120,560 | ) | | | (70,736 | ) | | | (154,075 | ) |
The differences between book basis and tax basis components of net assets are primarily attributable to tax deferral of losses on wash sales, unamortized organization costs, mark to market on Passive Foreign Investment Companies (“PFIC”) securities and deferral of post-October and December losses.
| | EGA Emerging Global Shares Trust 113 |
Notes to Financial Statements (continued)
March 31, 2013
For the period ended March 31, 2013, the effect of permanent book/tax reclassifications resulted in increases (decreases) to the components of net assets as follows:
| Funds | | Accumulated
Undistributed
Net Investment
Income (Loss) | | Accumulated
Net Realized
Gain (Loss)
on Investments | | Paid-in Capital |
| Basic Materials ETF | | $ | 3,357 | | | $ | 627 | | | $ | (3,984 | ) |
| Beyond BRICs ETF | | | 6,866 | | | | (995 | ) | | | (5,871 | ) |
| Brazil Infrastructure ETF | | | (413,077 | ) | | | 139,248 | | | | 273,829 | |
| China Infrastructure ETF | | | 261 | | | | 97,866 | | | | (98,127 | ) |
| Consumer Goods ETF | | | 1,535 | | | | (183,946 | ) | | | 182,411 | |
| Consumer Services ETF | | | 1,165 | | | | (151,357 | ) | | | 150,192 | |
| Consumer ETF | | | (461,984 | ) | | | (6,513,948 | ) | | | 6,975,932 | |
| Core ETF | | | 2,157 | | | | 222 | | | | (2,379 | ) |
| Domestic Demand ETF | | | (2,784 | ) | | | (97,641 | ) | | | 100,425 | |
| Metals & Mining ETF | | | (4,620 | ) | | | 390,733 | | | | (386,113 | ) |
| Energy ETF | | | (21,947 | ) | | | (82,154 | ) | | | 104,101 | |
| Financials ETF | | | 1,862 | | | | (85,297 | ) | | | 83,435 | |
| Composite ETF | | | (9,364 | ) | | | (56,417 | ) | | | 65,781 | |
| Health Care ETF | | | 1,465 | | | | (285,780 | ) | | | 284,315 | |
| India Consumer ETF | | | (43,306 | ) | | | 43,306 | | | | — | |
| India Infrastructure ETF | | | 342,909 | | | | (342,909 | ) | | | — | |
| India Small Cap ETF | | | 26,114 | | | | (26,114 | ) | | | — | |
| Industrials ETF | | | 38,013 | | | | (291,320 | ) | | | 253,307 | |
| Low Volatility Dividend ETF | | | 1,225,867 | | | | (5,144,195 | ) | | | 3,918,328 | |
| Technology ETF | | | 3,891 | | | | (11,000 | ) | | | 7,109 | |
| Telecom ETF | | | (458 | ) | | | (37,197 | ) | | | 37,655 | |
| Utilities ETF | | | (6,120 | ) | | | (43,960 | ) | | | 50,080 | |
For financial reporting purposes, capital accounts are adjusted to reflect the tax character of permanent book/tax differences. Reclassifications are primarily due to tax treatment of redemptions in kind, PFIC sales adjustments, non-deductible offering costs, return of capital distributions and tax treatment of currency gains and losses. Results of operations and net assets were not affected by these reclassifications.
| 114 EGA Emerging Global Shares Trust | |
Notes to Financial Statements (continued)
March 31, 2013
Certain net losses incurred after October 31 and December 31, and within the taxable year or period are deemed to arise on the first business day of the ETFs’ next taxable year. For the period ended March 31, 2013, the ETFs deferred to April 1, 2013 these losses of:
| Funds | | Late Year
Ordinary Losses | | Post October
Capital Losses |
| Basic Materials ETF | | $ | — | | | $ | 85,174 | |
| Beyond BRICs ETF | | | — | | | | 8,697 | |
| Brazil Infrastructure ETF | | | 219,309 | | | | 513,854 | |
| China Infrastructure ETF | | | 25,822 | | | | 45,445 | |
| Consumer Goods ETF | | | — | | | | 5,732 | |
| Consumer Services ETF | | | — | | | | — | |
| Consumer ETF | | | 29,057 | | | | — | |
| Core ETF | | | — | | | | — | |
| Domestic Demand ETF | | | — | | | | 1,966 | |
| Metals & Mining ETF | | | — | | | | 335,077 | |
| Energy ETF | | | — | | | | 93,133 | |
| Financials ETF | | | — | | | | 20,912 | |
| Composite ETF | | | — | | | | 10,679 | |
| Health Care ETF | | | — | | | | — | |
| India Consumer ETF | | | 44,096 | | | | 244,068 | |
| India Infrastructure ETF | | | 7,314 | | | | 77,922 | |
| India Small Cap ETF | | | 9,911 | | | | 1,668,917 | |
| Industrials ETF | | | — | | | | 17,260 | |
| Low Volatility Dividend ETF | | | — | | | | 2,661,683 | |
| Technology ETF | | | — | | | | 16,186 | |
| Telecom ETF | | | — | | | | 4,792 | |
| Utilities ETF | | | — | | | | 6,446 | |
At March 31, 2013, for federal income tax purposes, the following ETFs had capital loss carryforwards available to offset future capital gains:
| | | Carryforwards with No Expiration* | | Carryforwards Expiring In |
| Funds | | Short-Term
Capital Loss
Carryforward | | Long-Term
Capital Loss
Carryforward | | Fiscal Year
2018 | | Fiscal Year
2019 |
| Basic Materials ETF | | $ | 46,730 | | | $ | 37,408 | | | $ | — | | | $ | — | |
| Beyond BRICs ETF | | | — | | | | — | | | | — | | | | — | |
| Brazil Infrastructure ETF | | | 4,895,069 | | | | 3,786,001 | | | | — | | | | — | |
| China Infrastructure ETF | | | 1,416,804 | | | | 896,985 | | | | — | | | | 2,811 | |
| Consumer Goods ETF | | | 4,363 | | | | — | | | | — | | | | — | |
| Consumer Services ETF | | | 12,224 | | | | 11,174 | | | | — | | | | — | |
| Consumer ETF | | | 1,372,030 | | | | 3,706,762 | | | | — | | | | — | |
| Core ETF | | | — | | | | — | | | | — | | | | — | |
| Domestic Demand ETF | | | — | | | | — | | | | — | | | | — | |
| Metals & Mining ETF | | | 526,070 | | | | 776,113 | | | | 26,475 | | | | 423,874 | |
| Energy ETF | | | 790,756 | | | | 414,388 | | | | — | | | | — | |
| Financials ETF | | | 44,695 | | | | 37,921 | | | | — | | | | — | |
| Composite ETF | | | 397,575 | | | | 649,561 | | | | — | | | | 586,695 | |
| Health Care ETF | | | 36,397 | | | | 13,832 | | | | — | | | | — | |
| India Consumer ETF | | | 34,523 | | | | — | | | | — | | | | — | |
| India Infrastructure ETF | | | 5,720,686 | | | | 7,595,244 | | | | — | | | | — | |
| India Small Cap ETF | | | 4,473,655 | | | | 7,892,033 | | | | — | | | | — | |
| Industrials ETF | | | 157,255 | | | | 8,808 | | | | — | | | | — | |
| Low Volatility Dividend ETF | | | 4,230,678 | | | | 401,963 | | | | — | | | | — | |
| Technology ETF | | | 113,818 | | | | 32,900 | | | | — | | | | — | |
| Telecom ETF | | | 37,373 | | | | 14,845 | | | | — | | | | — | |
| Utilities ETF | | | 101,713 | | | | 12,401 | | | | — | | | | — | |
| * | Capital loss carryforwards for tax years beginning after December 22, 2010 do not expire and are carried forward in character. |
| | EGA Emerging Global Shares Trust 115 |
Notes to Financial Statements (continued)
March 31, 2013
The tax character of distributions paid during the periods ended March 31, 2013 and March 31, 2012 were as follows:
| | | Period Ended March 31, 2013 | | Period Ended March 31, 2012 |
| Funds | | Distributions
Paid from
Ordinary
Income | | Distributions
Paid from
Long Term
Capital Gains | | Distributions
Paid from
Return of
Capital | | Distributions
Paid from
Ordinary
Income | | Distributions
Paid from
Long Term
Capital Gains | | Distributions
Paid from
Return of
Capital |
| Basic Materials ETF | | $ | 60,948 | | | $ | — | | | $ | — | | | $ | 15,017 | | | $ | — | | | $ | — | |
| Beyond BRICs ETF | | | 37,506 | | | | — | | | | — | | | | — | | | | — | | | | — | |
| Brazil Infrastructure ETF | | | 3,009,024 | | | | — | | | | — | | | | 3,135,584 | | | | — | | | | — | |
| China Infrastructure ETF | | | 154,518 | | | | — | | | | — | | | | 324,416 | | | | — | | | | — | |
| Consumer Goods ETF | | | 23,469 | | | | — | | | | — | | | | 11,203 | | | | — | | | | — | |
| Consumer Services ETF | | | 6,933 | | | | — | | | | — | | | | 1,186 | | | | — | | | | — | |
| Consumer ETF | | | 2,930,218 | | | | — | | | | — | | | | 1,634,800 | | | | — | | | | — | |
| Core ETF | | | 4,026 | | | | — | | | | — | | | | — | | | | — | | | | — | |
| Domestic Demand ETF | | | 8,302 | | | | — | | | | — | | | | — | | | | — | | | | — | |
| Metals & Mining ETF | | | 299,796 | | | | — | | | | — | | | | 532,215 | | | | — | | | | — | |
| Energy ETF | | | 200,778 | | | | — | | | | — | | | | 309,030 | | | | — | | | | — | |
| Financials ETF | | | 82,898 | | | | — | | | | — | | | | 52,077 | | | | — | | | | — | |
| Composite ETF | | | 242,214 | | | | — | | | | — | | | | 312,176 | | | | — | | | | — | |
| Health Care ETF | | | 7,726 | | | | — | | | | — | | | | 1,891 | | | | — | | | | — | |
| India Consumer ETF | | | — | | | | — | | | | — | | | | — | | | | — | | | | — | |
| India Infrastructure ETF | | | 741,080 | | | | — | | | | — | | | | 344,824 | | | | — | | | | — | |
| India Small Cap ETF | | | 165,603 | | | | — | | | | 8,562 | | | | 254,107 | | | | — | | | | — | |
| Industrials ETF | | | 38,792 | | | | — | | | | — | | | | 1,831 | | | | — | | | | — | |
| Low Volatility Dividend ETF | | | 4,409,451 | | | | — | | | | — | | | | 659,822 | | | | — | | | | — | |
| Technology ETF | | | 17,448 | | | | — | | | | — | | | | — | | | | — | | | | — | |
| Telecom ETF | | | 123,602 | | | | — | | | | — | | | | 10,536 | | | | — | | | | — | |
| Utilities ETF | | | 57,510 | | | | — | | | | — | | | | 9,988 | | | | — | | | | — | |
7. FAIR VALUE MEASUREMENT
Financial Accounting Standards Board’s Accounting Standards Codification, Section 820-10, Fair Value Measurements and Disclosures defines fair value, establishes a framework for measuring fair value in accordance with GAAP, and expands disclosure about fair value measurements. It also provides guidance on determining when there has been a significant decrease in the volume and level of activity for an asset or liability, when a transaction is not orderly, and how that information must be incorporated into a fair value measurement. Under Fair Value Measurements and Disclosures, various inputs are used in determining the value of the ETFs’ investments. These inputs are summarized in three broad levels as follows:
Level 1 — Unadjusted quoted prices in active markets for identical assets or liabilities.
Level 2 — Observable inputs other than quoted prices included in Level 1 that are observable for the asset or liability, either directly or indirectly. These inputs may include quoted prices for the identical instrument in an inactive market, prices for similar securities, interest rates, prepayment speeds, credit risk, yield curves, default rates and similar data.
Level 3 — Unobservable inputs for the asset or liability, to the extent relevant observable inputs are not available, representing the ETFs’ own assumptions about the assumptions a market participant would use in valuing the asset or liability, and would be based on the best information available.
The availability of observable inputs can vary from security to security and is affected by a wide variety of factors, including, for example, the type of security, whether the security is new and not yet established in the marketplace, the liquidity of markets, and other characteristics particular to the security. To the extent that valuation is based on models or inputs that are less observable or unobservable in the market, the determination of fair value requires more judgment. Accordingly, the degree of judgment exercised in determining fair value is greatest for instruments categorized in Level 3.
The ETFs have adopted the Accounting Standard Update, Fair Value Measurements and Disclosures (Topic 820): Improving Disclosures about Fair Value Measurements which provides guidance on how investment assets and liabilities are to be valued and disclosed. Specifically, the amendment requires reporting entities to disclose: i) the input and valuation techniques used to measure fair value for both recurring and nonrecurring fair value measurements for Level 2 or Level 3 positions; ii) transfers between all levels (including Level 1 and Level 2) are required to be disclosed on a gross basis (i.e. transfers out must be disclosed separately from transfers in) as well as the reason(s) for the transfer; and iii) purchases, sales, issuances and settlements must be shown on a gross basis in the Level 3 roll forward rather than as one net number.
| 116 EGA Emerging Global Shares Trust | |
Notes to Financial Statements (continued)
March 31, 2013
The inputs or methodology used for valuing securities are not necessarily an indication of the risk associated with investing in those securities. The following summarizes inputs used as of March 31, 2013 in valuing the ETFs’ assets and liabilities carried at fair value:
| | | Quoted Prices
in Active Markets
(Level 1) | | Other
Significant
Inputs (Level 2) | | Significant
Unobservable
Inputs (Level 3) | | Total |
| Funds | | Common Stocks | | Common Stocks | | |
| Basic Materials ETF* | | $ | 3,662,786 | | | $ | — | | | $ | — | | | $ | 3,662,786 | |
| Beyond BRICs ETF* | | | 7,655,785 | | | | — | | | | — | | | | 7,655,785 | |
| Brazil Infrastructure ETF** | | | 79,202,084 | | | | — | | | | — | | | | 79,202,084 | |
| China Infrastructure ETF** | | | 13,104,865 | | | | — | | | | — | | | | 13,104,865 | |
| Consumer Goods ETF* | | | 2,431,967 | | | | — | | | | — | | | | 2,431,967 | |
| Consumer Services ETF* | | | 2,164,259 | | | | — | | | | — | | | | 2,164,259 | |
| Consumer ETF* | | | 883,952,277 | | | | — | | | | — | | | | 883,952,277 | |
| Core ETF* | | | 4,161,116 | | | | — | | | | — | | | | 4,161,116 | |
| Domestic Demand ETF* | | | 2,224,929 | | | | — | | | | — | | | | 2,224,929 | |
| Metals & Mining ETF* | | | 8,502,115 | | | | — | | | | — | | | | 8,502,115 | |
| Energy ETF* | | | 9,109,058 | | | | — | | | | — | | | | 9,109,058 | |
| Financials ETF* | | | 4,333,987 | | | | — | | | | — | | | | 4,333,987 | |
| Composite ETF* | | | 16,924,395 | | | | — | | | | — | | | | 16,924,395 | |
| Health Care ETF* | | | 5,744,374 | | | | — | | | | — | | | | 5,744,374 | |
| India Consumer ETF** | | | 6,632,954 | | | | — | | | | — | | | | 6,632,954 | |
| India Infrastructure ETF** | | | 51,352,542 | | | | — | | | | — | | | | 51,352,542 | |
| India Small Cap ETF** | | | 20,984,197 | | | | — | | | | 131,907 | | | | 21,116,104 | |
| Industrials ETF* | | | 3,061,918 | | | | — | | | | — | | | | 3,061,918 | |
| Low Volatility Dividend ETF* | | | 88,896,759 | | | | — | | | | — | | | | 88,896,759 | |
| Technology ETF* | | | 2,683,799 | | | | — | | | | — | | | | 2,683,799 | |
| Telecom ETF* | | | 3,889,954 | | | | — | | | | — | | | | 3,889,954 | |
| Utilities ETF* | | | 3,506,553 | | | | — | | | | — | | | | 3,506,553 | |
| * | Please refer to the schedule/consolidated schedule of investments to view securities segregated by country. |
| ** | Please refer to the schedule/consolidated schedule of investments to view securities segregated by industry type. |
Reconciliation of the investment in which significant unobservable inputs (Level 3) were used in determining the fair value during the year ended March 31, 2013:
| | Common Stocks |
| India Small Cap ETF | Chemicals |
| Balance as of March 31, 2012 | $ | 191,480 | |
| Realized gain (loss)1 | | — | |
| Change in unrealized depreciation2 | | (59,573 | ) |
| Purchases | | — | |
| Sales | | — | |
| Transfers into Level 33 | | — | |
| Transfers out of Level 34 | | — | |
| Balance as of March 31, 2013 | $ | 131,907 | |
Net change in unrealized appreciation (depreciation) from investments still held as of
March 31, 2013 is: | $ | (59,573 | ) |
| 1 | This amount is included in net realized gain (loss) from investment transactions in the Statement of Operations. |
| 2 | This amount is included in the net change in unrealized appreciation (depreciation) from investment transactions in the Statement of Operations. Change in unrealized appreciation (depreciation) includes net unrealized appreciation (depreciation) resulting from changes in investment values during the period and the reversal of previously recorded unrealized appreciation (depreciation) when gains or losses are realized. |
| 3 | Transfers into Level 3 are as a result of the unavailability of a quoted price in an active market for an identical investment or the unavailability of other significant observable inputs. |
| 4 | Transfers out of Level 3 are as a result of the availability of a quoted price in an active market for an identical investment or the availability of other significant observable inputs. |
To estimate fair value, the Trust’s Valuation Committee (the “Committee”) followed procedures established by the Board. The significant inputs for the valuation methodology for the India Small Cap ETF, after consideration of quantitative and fundamental factors, were comparable benchmark performance and an illiquidity discount.
| | EGA Emerging Global Shares Trust 117 |
Notes to Financial Statements (continued)
March 31, 2013
Each Fund values its investments at fair value pursuant to procedures adopted by the Board if (1) market quotations are insufficient or not readily available or (2) Emerging Global Advisors, LLC (“EGA”) believes that the values available are unreliable. The Committee performs certain functions as they relate to the administration and oversight of the Funds’ valuation procedures. Under these procedures, the Committee convenes on a regular and ad-hoc basis to review such securities and considers a number of factors, including valuation methodologies and significant unobservable inputs, when arriving at fair value.
In determining fair valuations, inputs may include market-based analytics, which may consider related or comparable assets or liabilities, recent transactions, market multiples, book values and other relevant investment information. Discounts may be applied based on the nature or duration of any restrictions on the disposition of the investments. The Committee performs regular reviews of valuation methodologies, key inputs and assumptions, disposition analysis and market activity.
Due to the inherent uncertainty of valuations, fair values may differ significantly from the values that would have been used had an active market existed. Fair valuation could result in a different NAV than a NAV determined by using market quotes.
The following is a summary of the significant unobservable inputs used as of March 31, 2013 in valuing Level 3 securities:
| | | | |
| India Small Cap ETF | Fair Value | Valuation Technique | Unobservable Input | Value of
Unobservable
Inputs |
| Investments in Securities | | | | |
| Common Stocks | | | | |
| Chemicals | $131,907 | Adjustment to market | Illiquidity | 33.3% |
| | | based on comparable | Discount | |
| | | benchmark performance | | |
| | | and illiquidity discount | | |
Significant changes in any of the unobservable inputs may significantly impact the fair value measurement. A significant increase (decrease) in the comparable benchmark may result in a corresponding increase (decrease) in fair value. A significant increase (decrease) in the illiquidity discount may result in a corresponding decrease (increase) in fair value.
8. INVESTMENT TRANSACTIONS
The table below displays each ETF’s investment transactions during the periods ended March 31, 2013. The Purchases column represents the aggregate purchases of investments excluding cost of in-kind purchases and short-term investments. The Sales column represents the aggregate sales of investments excluding proceeds from in-kind sales and short-term investments. Purchases In-Kind are the aggregate of all in-kind purchases and Sales In-Kind are the aggregate of all proceeds from in-kind sales. The transactions for each of these categories are as follows:
| Funds | | Purchases | | Sales | | Purchases
In-Kind | | Sales In-Kind |
| Basic Materials ETF | | $ | 1,255,224 | | | $ | 972,410 | | | $ | 6,171,414 | | | $ | 3,611,953 | |
| Beyond BRICs ETF | | | 5,355,136 | | | | 64,263 | | | | 1,746,430 | | | | — | |
| Brazil Infrastructure ETF | | | 23,219,392 | | | | 22,747,436 | | | | — | | | | — | |
| China Infrastructure ETF | | | 2,301,976 | | | | 2,314,614 | | | | 2,451,053 | | | | 2,069,190 | |
| Consumer Goods ETF | | | 756,220 | | | | 468,025 | | | | 1,720,494 | | | | 956,816 | |
| Consumer Services ETF | | | 787,827 | | | | 571,382 | | | | 1,671,314 | | | | 950,033 | |
| Consumer ETF | | | 159,434,474 | | | | 39,105,977 | | | | 349,991,832 | | | | 28,954,966 | |
| Core ETF | | | 1,141,920 | | | | 81,199 | | | | 3,008,844 | | | | 1,204 | |
| Domestic Demand ETF | | | 6,120,315 | | | | 1,653,635 | | | | — | | | | 2,608,361 | |
| Metals & Mining ETF | | | 1,654,765 | | | | 1,961,176 | | | | 22,052 | | | | 2,421,322 | |
| Energy ETF | | | 1,574,181 | | | | 1,668,728 | | | | 2,146,764 | | | | 3,284,852 | |
| Financials ETF | | | 751,283 | | | | 789,681 | | | | 2,605,880 | | | | 2,745,029 | |
| Composite ETF | | | 1,771,674 | | | | 1,430,569 | | | | 3,375,247 | | | | 245,243 | |
| Health Care ETF | | | 1,793,493 | | | | 822,780 | | | | 3,935,631 | | | | 1,690,056 | |
| India Consumer ETF | | | 6,595,360 | | | | 1,755,812 | | | | — | | | | — | |
| India Infrastructure ETF | | | 15,011,746 | | | | 13,055,322 | | | | — | | | | — | |
| India Small Cap ETF | | | 9,959,905 | | | | 11,855,413 | | | | — | | | | — | |
| Industrials ETF | | | 1,803,337 | | | | 1,528,516 | | | | 3,404,015 | | | | 2,805,723 | |
| Low Volatility Dividend ETF | | | 79,500,631 | | | | 63,549,040 | | | | 47,283,752 | | | | 35,515,754 | |
| Technology ETF | | | 762,630 | | | | 540,087 | | | | 1,465,082 | | | | 750,656 | |
| Telecom ETF | | | 703,893 | | | | 469,844 | | | | 955,568 | | | | 219,982 | |
| Utilities ETF | | | 1,318,186 | | | | 1,008,610 | | | | 1,920,010 | | | | 1,317,033 | |
| 118 EGA Emerging Global Shares Trust | |
Notes to Financial Statements (continued)
March 31, 2013
9. INVESTMENT ADVISORY AND OTHER AGREEMENTS
For the period from April 1, 2012 through February 28, 2013, the Trust (except for Core ETF) operated under an Investment Advisory Agreement (the “Advisory Agreement”) with ALPS Advisors, Inc. (“ALPS”). ALPS acted as the ETFs’ investment adviser pursuant to an advisory agreement with the Trust on behalf of the ETFs. Pursuant to the Advisory Agreement, ALPS had overall supervisory responsibility for the general management and investment of each ETF’s securities portfolio, and had ultimate responsibility (subject to oversight by the Trust’s Board of Trustees) for oversight of the Trust’s sub-adviser. For its services, the Trust paid ALPS an annual management fee, accrued daily at the rate of 1/365th of the applicable advisory fee rate and payable monthly as soon as practicable after the last day of each month. The annual management fee for the following ETFs consisted of the greater of $400,000 or 0.10% of each ETF’s average daily net assets during the month, but not to exceed $1,000,000 per year:
| |
| Basic Materials ETF | Brazil Infrastructure ETF |
| China Infrastructure ETF | Consumer ETF |
| Metals & Mining ETF | Energy ETF |
| Financials ETF | Composite ETF |
| Health Care ETF | India Infrastructure ETF |
| India Small Cap ETF | Industrials ETF |
In addition, the annual management fee for the ETFs listed below consisted of the greater of $400,000 plus $33,333 per ETF minus any management fees paid to ALPS by the ETFs detailed above, or 0.10% of the average daily net assets of each ETF listed below, but not to exceed annually $1,000,000 plus $83,333 for each ETF minus any management fees paid to the Adviser by the ETFs detailed above:
| |
| Beyond BRICs ETF | Consumer Goods ETF |
| Consumer Services ETF | Domestic Demand ETF |
| India Consumer ETF | Low Volatility Dividend ETF |
| Technology ETF | Telecom ETF |
| Utilities ETF | |
For the period from April 1, 2012 through February 28, 2013, EGA served as the sub-adviser to the ETFs (except for Core ETF) and provided investment advice and management services to the ETFs. EGA supervised the day-to-day investment and reinvestment of the assets in each ETF and was responsible for designating the Deposit Securities and for monitoring each ETF’s adherence to its investment mandate. For its investment sub-advisory services, EGA received from the ETFs an annual fee equal to 0.75% of the average daily net assets of Composite ETF, 0.89% of average daily net assets of India Consumer ETF and 0.85% of the average daily net assets of each of the other ETFs, except for Core ETF. For Core ETF, EGA served as the sole investment advisor from inception through March 31, 2013 and provided investment advice and management services to the ETF. EGA received from Core ETF an annual fee equal to 0.70% of the average daily net assets of Core ETF.
The Trust and EGA had entered into a written fee waiver and expense reimbursement agreement pursuant to which EGA agreed to reduce and/or reimburse expenses to the extent necessary to prevent the annual operating expenses of each ETF (excluding any taxes, interest, brokerage fees and non-routine expenses) from exceeding 0.85% of average daily net assets (0.70% for Core ETF, 0.75% for Composite ETF and 0.89% for India Consumer ETF) at least until July 31, 2013. Under this fee waiver and expense assumption agreement, EGA retained the right to seek reimbursement from each ETF of fees previously waived or expenses previously assumed to the extent such fees were waived or expenses were assumed within three years of such reimbursement, and provided such reimbursement does not cause an ETF to exceed any applicable fee waiver or expense limitation agreement that was in place at the time the fees were waived or expenses assumed.
Effective April 1, 2013, EGA replaced the current fee and expense structure with a unified fee (“Unified Fee”) for all of the series of the Trust, (see Note 13).
| | EGA Emerging Global Shares Trust 119 |
Notes to Financial Statements (continued)
March 31, 2013
The amounts EGA reimbursed, the amounts available for potential future recoupment by EGA and the expiration schedule at March 31, 2013 are as follows:
| | | Expenses
Reimbursed/Waived | | Potential Recoupment Amounts Expiring | | Total Potential
Recoupment
Amount |
| Funds | | | March 31, 2014 | | March 31, 2015 | | March 31, 2016 | |
| Basic Materials ETF | | $ | 124,773 | | | $ | — | | | $ | 64,900 | | | $ | 124,773 | | | $ | 189,673 | |
| Beyond BRICs ETF | | | 69,367 | | | | — | | | | — | | | | 69,367 | | | | 69,367 | |
| Brazil Infrastructure ETF | | | 509,458 | | | | 478,083 | | | | 504,255 | | | | 509,458 | | | | 1,491,796 | |
| China Infrastructure ETF | | | 190,413 | | | | 247,399 | | | | 194,340 | | | | 190,413 | | | | 632,152 | |
| Consumer Goods ETF | | | 130,872 | | | | — | | | | 76,800 | | | | 130,872 | | | | 207,672 | |
| Consumer Services ETF | | | 91,687 | | | | — | | | | 47,875 | | | | 91,687 | | | | 139,562 | |
| Consumer ETF | | | 2,076,610 | | | | 403,405 | | | | 1,195,954 | | | | 2,076,610 | | | | 3,675,969 | |
| Core ETF | | | 106,195 | | | | — | | | | — | | | | 106,195 | | | | 106,195 | |
| Domestic Demand ETF | | | 69,022 | | | | — | | | | — | | | | 69,022 | | | | 69,022 | |
| Metals & Mining ETF | | | 216,583 | | | | 301,755 | | | | 251,382 | | | | 216,583 | | | | 769,720 | |
| Energy ETF | | | 211,609 | | | | 202,602 | | | | 249,227 | | | | 211,609 | | | | 663,438 | |
| Financials ETF | | | 200,475 | | | | 207,810 | | | | 191,473 | | | | 200,475 | | | | 599,758 | |
| Composite ETF | | | 236,341 | | | | 355,407 | | | | 252,669 | | | | 236,341 | | | | 844,417 | |
| Health Care ETF | | | 131,889 | | | | — | | | | 70,782 | | | | 131,889 | | | | 202,671 | |
| India Consumer ETF | | | 118,527 | | | | — | | | | 98,710 | | | | 118,527 | | | | 217,237 | |
| India Infrastructure ETF | | | 416,566 | | | | 381,030 | | | | 577,187 | | | | 416,566 | | | | 1,374,783 | |
| India Small Cap ETF | | | 290,870 | | | | 356,162 | | | | 399,568 | | | | 290,870 | | | | 1,046,600 | |
| Industrials ETF | | | 131,361 | | | | — | | | | 69,310 | | | | 131,361 | | | | 200,671 | |
| Low Volatility Dividend ETF | | | 425,833 | | | | — | | | | 189,604 | | | | 425,833 | | | | 615,437 | |
| Technology ETF | | | 124,253 | | | | — | | | | 71,813 | | | | 124,253 | | | | 196,066 | |
| Telecom ETF | | | 134,659 | | | | — | | | | 70,518 | | | | 134,659 | | | | 205,177 | |
| Utilities ETF | | | 130,258 | | | | — | | | | 74,475 | | | | 130,258 | | | | 204,733 | |
Effective March 1, 2013, EGA became the sole investment adviser to all of the series in the Trust (except for Core ETF, where EGA had been sole investment adviser since inception on October 16, 2012). On February 28, 2013, the Board of Trustees for the Trust accepted the resignation of ALPS as investment adviser to certain series of the Trust. In its capacity as sole investment adviser to the Funds, EGA will continue to provide the services and receive the compensation set forth under its existing sub-advisory agreement with the Trust.
The Bank of New York Mellon serves as the ETFs’ Administrator, Custodian, Fund Accountant and Transfer Agent pursuant to a Fund Administration and Accounting Agreement, a Custody Agreement and a Transfer Agency and Service Agreement, as the case may be.
For the period from April 1, 2012 through February 28, 2013, ALPS Fund Services, Inc. (“AFS”), an affiliate of ALPS and the Distributor, provided a Chief Compliance Officer and an Anti-Money Laundering Officer as well as certain additional compliance support functions under a Compliance Services Agreement. AFS also provided a Principal Financial Officer to the Trust under a PFO Services Agreement. As compensation for the foregoing services, AFS received certain out of pocket costs, which were accrued daily and paid monthly by the ETFs. Effective March 1, 2013, the Board appointed an officer of EGA to serve as Principal Financial Officer to the Trust.
Effective as of March 1, 2013, EGA and AFS amended the Compliance Services Agreement. AFS will continue to provide a Chief Compliance Officer and an Anti-Money Laundering Officer as well as certain additional compliance support functions. As compensation for the foregoing services, AFS will receive certain out of pocket costs and fixed fees, which will be accrued for by the Trust and paid for by EGA under the written fee waiver and expense reimbursement agreement. Commencing April 1, 2013, such fees will be paid by EGA out of the Unified Fee (defined below).
| 120 EGA Emerging Global Shares Trust | |
Notes to Financial Statements (concluded)
March 31, 2013
10. CREATION AND REDEMPTION TRANSACTIONS
The ETFs issue and redeem shares on a continuous basis at NAV in blocks of 50,000 shares called “Creation Units.” Except when aggregated in Creation Units, shares are not redeemable securities of an ETF.
Only “Authorized Participants” may purchase or redeem shares directly from an ETF. An Authorized Participant is either (i) a broker-dealer or other participant in the clearing process through the Continuous Net Settlement System of the National Securities Clearing Corporation or (ii) a DTC participant and, in each case, must have executed a Participant Agreement with the Distributor. Most retail investors will not qualify as Authorized Participants or do not have the resources to buy and sell whole Creation Units. Therefore, they will be unable to purchase or redeem the shares directly from the ETFs. Rather, most retail investors will purchase shares in the secondary market with the assistance of a broker and will be subject to customary brokerage commissions or fees.
Except as discussed below, the consideration for the purchase of Creation Units of an ETF generally consists of the in-kind deposit of a designated portfolio of equity securities, which constitutes a representation of the corresponding Underlying Index and an amount of cash. The consideration for the purchase of Creation Units of the Brazil Infrastructure ETF, India Consumer ETF, India Infrastructure ETF and India Small Cap ETF consists solely of cash in U.S. dollars. Investors transacting in Creation Units for cash pay an additional variable charge to compensate the relevant ETF for brokerage and market impact expenses relating to investing in portfolio securities. This charge is either debited or credited to Paid-in Capital.
11. TRUSTEES’ AND OFFICERS’ FEES
The Trust compensates each Trustee who is not an employee of ALPS, EGA or its affiliates. The interested Trustees do not receive any compensation from the Trust for serving as Trustees. No officer of the Trust who is also an officer or employee of EGA receives any compensation from the Trust for services to the Trust. Compensation by the Trust for services provided by the Chief Compliance Officer, Anti-Money Laundering Officer and Principal Financial Officer was paid by EGA pursuant to the written fee waiver and expense reimbursement agreement. Therefore, net remuneration paid by the Funds to officers of the Trust for the fiscal year ended March 31, 2013 is $0.
12. NEW ACCOUNTING PRONOUNCEMENTS
In December 2011, the Financial Accounting Standards Board (“FASB”) issued Accounting Standards Update No. 2011-11, Disclosures about Offsetting Assets and Liabilities (“ASU 2011-11”). ASU 2011-11 requires disclosures to make financial statements that are prepared under U.S. GAAP more comparable to those prepared under International Financial Reporting Standards. The new disclosure requirements mandate that entities disclose both gross and net information about instruments and transactions eligible for offset in the statement of assets and liabilities as well as instruments and transactions subject to an agreement similar to a master netting arrangement. In addition, ASU 2011-11 rerequires disclosure of collateral received and posted in connection with master netting agreements or similar arrangements. New disclosures are required for annual reporting periods beginning on or after January 1, 2013, and interim periods within those annual periods. Management is evaluating the impact of ASU 2011-11 on the financial statements and disclosures.
On January 31, 2013, FASB issued Accounting Standards Update No. 2013-01 Clarifying the Scope of Disclosures about Offsetting Assets and Liabilities (“ASU 2013-01”). ASU 2013-01 limits the scope of the new balance sheet offsetting disclosures to the following financial instruments, to the extent they are offset in the financial statements or subject to an enforceable master netting arrangement or similar agreement: (i) recognized derivative instruments accounted for under ASC 815 (Derivatives and Hedging)’ (ii) repurchase agreements and reverse repurchase agreements; and (iii) securities borrowing and securities lending transactions. The disclosures are required irrespective of whether the transactions are offset in the statement of assets and liabilities. The effective date and transition of the disclosure requirements in ASU 2011-11 remain unchanged. At this time, management is evaluating the implications of ASU 2013-01 and its impact on the Trust’s financial statements.
13. SUBSEQUENT EVENTS
The ETFs have evaluated subsequent events through the date of issuance of this report, and have determined that there are no material events (except as described below) that impacted the ETFs’ financial statements.
Effective April 1, 2013, EGA replaced the current fee and expense structure with a Unified Fee for all of the series of the Trust. Under the Unified Fee, EGA took on the contractual obligation to pay all ordinary operating expenses of the ETFs without any increase in EGA’s advisory fee. The ETFs were currently obligated to pay these expenses through March 31, 2013, although EGA, as noted above, had entered into annual voluntary expense waiver and reimbursement agreements that capped an ETF’s ordinary operating expenses at the same rate as EGA’s advisory fee. Under the Unified Fee, EGA pays all of the expenses of each series of the Trust, except for the fee payment under the investment advisory agreements between EGA and the Trust, payments under each series’ 12b-1 plan (if ever implemented), brokerage expenses, taxes, interest, litigation expenses and other non-routine or extraordinary expenses.
Effective July 1, 2013, the advisory fee for Consumer ETF will change from 0.85% of the average daily net assets to the following tiered structure: 0.85% of average daily net assets up to $1 billion; 0.75% of average daily net assets between $1 billion and $2 billion; 0.70% of average daily next assets over and above $2 billion.
| | EGA Emerging Global Shares Trust 121 |
Report of Independent Registered Public Accounting Firm
To the Board of Trustees and
Shareholders of EGA Emerging Global Shares Trust
We have audited the accompanying statements of assets and liabilities of EGShares Beyond BRICs ETF, EGShares Brazil Infrastructure ETF, EGShares China Infrastructure ETF and EGShares Consumer Services GEMS ETF, each a series of shares of beneficial interest of EGA Emerging Global Shares Trust, including the schedules of investments, as of March 31, 2013, and the related statements of operations for the year or periods then ended, and the statements of changes in net assets and financial highlights for each of the respective years or periods presented. We have also audited the accompanying consolidated statements of assets and liabilities of EGShares Basic Materials GEMS ETF, EGShares Consumer Goods GEMS ETF, EGShares Emerging Markets Consumer ETF, EGShares Emerging Markets Core ETF, EGShares Emerging Markets Domestic Demand ETF, EGShares Emerging Markets Metals & Mining ETF, EGShares Energy GEMS ETF, EGShares Financials GEMS ETF, EGShares GEMS Composite ETF, EGShares Health Care GEMS ETF, EGShares India Consumer ETF, EGShares India Infrastructure ETF, EGShares India Small Cap ETF, EGShares Industrials GEMS ETF, EGShares Low Volatility Emerging Markets Dividend ETF, EGShares Technology GEMS ETF, EGShares Telecom GEMS ETF and EGShares Utilities GEMS ETF, each a series of shares of beneficial interest of EGA Emerging Global Shares Trust, including the consolidated schedules of investments, as of March 31, 2013, and the related consolidated statements of operations for the year or periods then ended, and the consolidated statements of changes in net assets and consolidated financial highlights for each of the respective years or periods presented. These financial statements and financial highlights are the responsibility of the Funds’ management. Our responsibility is to express an opinion on these financial statements and financial highlights based on our audits.
We conducted our audits in accordance with the standards of the Public Company Accounting Oversight Board (United States). Those standards require that we plan and perform the audits to obtain reasonable assurance about whether the financial statements and financial highlights are free of material misstatement. An audit includes examining, on a test basis, evidence supporting the amounts and disclosures in the financial statements. Our procedures included confirmation of securities owned as of March 31, 2013 by correspondence with the custodian and brokers and by other appropriate auditing procedures where responses from brokers were not received. An audit also includes assessing the accounting principles used and significant estimates made by management, as well as evaluating the overall financial statement presentation. We believe that our audits provide a reasonable basis for our opinion.
In our opinion, the financial statements and financial highlights referred to above present fairly, in all material respects, the financial position of EGShares Basic Materials GEMS ETF, EGShares Beyond BRICs ETF, EGShares Brazil Infrastructure ETF, EGShares China Infrastructure ETF, EGShares Consumer Goods GEMS ETF, EGShares Consumer Services GEMS ETF, EGShares Emerging Markets Consumer ETF, EGShares Emerging Markets Core ETF, EGShares Emerging Markets Domestic Demand ETF, EGShares Emerging Markets Metals & Mining ETF, EGShares Energy GEMS ETF, EGShares Financials GEMS ETF, EGShares GEMS Composite ETF, EGShares Health Care GEMS ETF, EGShares India Consumer ETF, EGShares India Infrastructure ETF, EGShares India Small Cap ETF, EGShares Industrials GEMS ETF, EGShares Low Volatility Emerging Markets Dividend ETF, EGShares Technology GEMS ETF, EGShares Telecom GEMS ETF and EGShares Utilities GEMS ETF as of March 31, 2013, and the results of their operations for the year or periods then ended, and the changes in their net assets and their financial highlights for each of the years or periods presented, in conformity with accounting principles generally accepted in the United States of America.

BBD, LLP
Philadelphia, Pennsylvania
May 30, 2013
| 122 EGA Emerging Global Shares Trust | |
Federal Income Tax Information (Unaudited)
Federal Tax Status of Dividends Declared during the Tax Year
For Federal income tax purposes, dividends from short-term capital gains are classified as ordinary income. The percentage of ordinary income distribution designated as qualifying for the corporate dividend received deduction (“DRD”), and the individual qualified dividend rate (“QDI”) is presented below.
| Funds | | DRD | | QDI |
| EGShares Basic Materials GEMS ETF | | | 0.00 | % | | | 100.00 | % |
| EGShares Beyond BRICs ETF | | | 0.00 | % | | | 100.00 | % |
| EGShares Brazil Infrastructure ETF | | | 0.00 | % | | | 8.53 | % |
| EGShares China Infrastructure ETF | | | 0.00 | % | | | 64.89 | % |
| EGShares Consumer Goods GEMS ETF | | | 0.00 | % | | | 100.00 | % |
| EGShares Consumer Services GEMS ETF | | | 0.00 | % | | | 100.00 | % |
| EGShares Emerging Markets Consumer ETF | | | 0.00 | % | | | 100.00 | % |
| EGShares Emerging Markets Core ETF | | | 0.00 | % | | | 100.00 | % |
| EGShares Emerging Markets Domestic Demand ETF | | | 0.00 | % | | | 100.00 | % |
| EGShares Emerging Markets Metals & Mining ETF | | | 0.00 | % | | | 100.00 | % |
| EGShares Energy GEMS ETF | | | 0.00 | % | | | 98.89 | % |
| EGShares Financials GEMS ETF | | | 0.00 | % | | | 100.00 | % |
| EGShares GEMS Composite ETF | | | 0.00 | % | | | 100.00 | % |
| EGShares Health Care GEMS ETF | | | 0.00 | % | | | 100.00 | % |
| EGShares India Consumer ETF | | | 0.00 | % | | | 0.00 | % |
| EGShares India Infrastructure ETF | | | 0.00 | % | | | 100.00 | % |
| EGShares India Small Cap ETF | | | 0.00 | % | | | 100.00 | % |
| EGShares Industrials GEMS ETF | | | 0.00 | % | | | 100.00 | % |
| EGShares Low Volatility Emerging Markets Dividend ETF | | | 0.00 | % | | | 100.00 | % |
| EGShares Technology GEMS ETF | | | 0.00 | % | | | 50.60 | % |
| EGShares Telecom GEMS ETF | | | 0.00 | % | | | 76.61 | % |
| EGShares Utilities GEMS ETF | | | 0.00 | % | | | 100.00 | % |
| | EGA Emerging Global Shares Trust 123 |
Board Review and Approval of Advisory Contracts (Unaudited)
At the February 28, 2013 meeting (the “Meeting”) of the Board of Trustees (the “Board”) of EGA Emerging Global Shares Trust (the “Trust”), the Board accepted the resignation of ALPS Advisors, Inc. (“ALPS Advisors”), as investment adviser to certain series of the Trust, effective March 1, 2013, and appointed Emerging Global Advisors, LLC (“EGA”), the sub-adviser to each of these series, to serve as investment adviser effective March 1, 2013. As a result, as of March 1, 2013, EGA serves as investment adviser to all of the series of the Trust (each, a “Fund” and, collectively, the “Funds”).
At the Meeting, the Board, including those Trustees who are not “interested persons” (as that term is defined in the Investment Company Act of 1940, as amended (“1940 Act”)) of the Trust (the “Independent Trustees”), approved the investment advisory agreements (collectively, the “Advisory Agreement”) between EGA and the Trust with respect to each Fund, for the period March 1, 2013 until February 28, 2014. The Advisory Agreement added a fee structure whereby EGA is obligated to pay all of the ordinary operating expenses of each Fund (the “Unified Fee”).
In connection with considering approval of the Advisory Agreement, the Independent Trustees met in executive session with independent counsel, who provided assistance and advice. In considering the approval of the Advisory Agreement, the Board, including the Independent Trustees, reviewed the materials provided for the Meeting by EGA, including: (i) a copy of the Advisory Agreement with EGA and any amendments thereto; (ii) information describing the nature, quality, and extent of the services that EGA currently provides, and will provide, to the Funds, and the fees that EGA charges for such services; (iii) information concerning the business, operations and compliance program of EGA; (iv) a copy of the current Form ADV for EGA; (v) a memorandum from Stradley Ronon Stevens & Young, LLP (“Stradley Ronon”), counsel to the Trust and EGA, on the responsibilities of trustees in considering investment advisory arrangements under the 1940 Act; (vi) a no-action letter from the Division of Investment Management (the “Division”) of the U.S. Securities and Exchange Commission (the “Commission”) that the Division would not recommend enforcement action to the Commission if the Trust and EGA made certain non-material changes to the Advisory Agreement to reflect the resignation of ALPS Advisors, and also adopted the Unified Fee, without obtaining approval from the shareholders of the Trust; and (vii) an opinion of counsel from Stradley Ronon on the approval requirements for the Advisory Agreement. In addition, the Board considered data compiled by ETF Database, an independent data provider, comparing the advisory fees and expenses of the Funds with fees and expenses of other ETFs with similar investment objectives and policies. The Board, including the Independent Trustees, concluded that the ETF Database report was useful and reliable for the purpose of reviewing the Advisory Agreement.
During their review of this information, the Board, including the Independent Trustees, focused on and analyzed the factors that the Board deemed relevant, including: the nature, quality, and extent of the services provided, and to be provided, to each Fund by EGA; the personnel and operations of EGA; the profitability to EGA under the Advisory Agreement; any “fall-out” benefits to EGA (i.e., the ancillary benefits realized due to a relationship with the Trust); and possible conflicts of interest.
In particular, the Board considered and reviewed the following with respect to each Fund:
(a) The nature, extent, and quality of services provided to each Fund by EGA. The Board reviewed the services that EGA has provided, and is expected to provide, for each Fund. In connection with the advisory services provided to each Fund, the Board noted the significant responsibilities that EGA currently has, and will have as the Funds’ investment adviser, including: implementation of the investment management program of each Fund; management of the day-to-day investment and reinvestment of the assets in each Fund; determining daily baskets of deposit securities and cash components; executing portfolio security trades for purchases and redemptions of Fund shares conducted on a cash-in-lieu basis; management of intermediate Mauritius Companies for those Funds with significant investments in India; and oversight of general portfolio compliance with relevant law. The Board noted that it had reviewed and considered most, if not all, of these items at its meetings throughout the course of the year.
The Board reviewed EGA’s experience, resources, strengths and its prior performance as an adviser and sub-adviser to the Funds. Based on their consideration and review of the foregoing information, the Board concluded that each Fund was likely to continue to benefit from the nature, quality, and extent of these services, as well as EGA’s ability to render such services based on its experience, operations and resources.
(b) Comparison of services provided and fees charged by EGA and other investment advisers to similar clients, and the cost of the services provided.
The Board compared both the services rendered and the fees paid pursuant to the Advisory Agreements for each Fund that is currently listed for trading on an exchange (the “Operational Funds”) to contracts of other registered investment advisers providing services to similar ETFs. In particular, the Board compared each Fund’s advisory fee and expense ratio to the advisory fees and expense ratios of other ETFs considered to be in such Fund’s peer group, as chosen by ETF Database for periods that the Funds were in operation through December 31, 2012. The Board noted that most Funds’ management fees and expenses (after giving effect to the resignation of ALPS Advisors and the proposed Unified Fee) were within the median to maximum of the range of each Fund’s respective peer group. The Board also noted that some of the Funds had been in operation for less than one year.
| 124 EGA Emerging Global Shares Trust | |
Board Review and Approval of Advisory Contracts (Unaudited) (continued)
The Board noted that the actual advisory fees of the EGShares GEMS Composite ETF, EGShares Emerging Markets Core ETF, EGShares China Infrastructure ETF, EGShares Beyond BRICS ETF, EGShares India Small Cap ETF and EGShares India Infrastructure ETF were between the median and the maximum range of fees charged by other funds in each Fund’s peer group. The Board also noted that the total expenses (including under the proposed Unified Fee) of these Funds were between the median and the maximum range of total expenses of other funds in each Fund’s respective peer group.
The Board noted that the actual advisory fee of the EGShares Low Volatility Emerging Markets Dividend ETF and EGShares India Consumer ETF were above the maximum range of fees charged by other funds in each Fund’s peer group. The Board also noted that the total expenses (including under the proposed Unified Fee) of the Funds were between the median and the maximum range of total expenses of other funds in each Fund’s respective peer group.
The Board noted that the actual advisory fee for each of the EGShares Basic Materials GEMS ETF, EGShares Consumer Goods GEMS ETF, EGShares Consumer Services GEMS ETF, EGShares Energy GEMS ETF, EGShares Financials GEMS ETF, EGShares Health Care GEMS ETF, EGShares Industrials GEMS ETF, EGShares Technology GEMS ETF, EGShares Telecom GEMS ETF, EGShares Utilities GEMS ETF, EGShares Emerging Markets Metals & Mining ETF, EGShares Emerging Markets Consumer ETF, EGShares Brazil Infrastructure ETF and Emerging Markets Domestic Demand ETF was above the maximum range of fees charged by other funds in each Fund’s peer group. The Board also noted that the total expenses (including under the proposed Unified Fee) of the Funds were above the maximum range of total expenses of other funds in each Fund’s respective peer group.
The Board considered the appropriateness of the investment advisory fees and expense ratios of the Funds compared to the fees and expenses of the ETFs in the peer groups selected by ETF Database. The Board received information regarding the costs, including operational costs, and profitability of EGA in connection with its serving as adviser to each Fund. The Board also received information regarding the additional costs of operating the EGShares Energy GEMS ETF, EGShares Financials GEMS ETF, EGShares Basic Materials GEMS ETF, EGShares Consumer Goods GEMS ETF, EGShares Telecom GEMS ETF, EGShares Health Care GEMS ETF, EGShares Technology GEMS ETF, EGShares Industrials GEMS ETF, EGShares Utilities GEMS ETF, EGShares India Consumer ETF and EGShares Low Volatility Emerging Markets Dividend ETF, each of which invests in a related Mauritius Company in order to invest directly in Indian companies, which resulted in higher expenses for those Funds. The Board noted EGA’s assumption of the contractual obligation to limit each Fund’s expenses through the Unified Fee, which cannot be changed without shareholder approval. The Board noted that, prior to EGA’s adoption of the Unified Fee, each Fund’s expense ratio had been capped by EGA through voluntary expense waivers and reimbursements, which EGA had voluntarily renewed each year.
After comparing each Fund’s fees and expenses with those of other funds in each Fund’s peer group, including for those Funds whose fees and expenses were at or above the maximum range compared to their peer groups, and in light of the nature, quality, and extent of services provided by EGA and the costs incurred by EGA in rendering those services and absorbing the Funds’ ordinary operating expenses, the Board concluded that the fees paid to EGA with respect to each Fund were fair and reasonable.
(c) EGA’s profitability and the extent to which economies of scale were realized as each Fund grew and whether fee levels reflect such economies of scale. With respect to each Operational Fund, the Board received information and reviewed EGA’s profitability and/or the extent to which EGA supported each Operational Fund’s net expense ratio. The Board then considered economies of scale and the asset level of each Fund. EGA informed the Board that the Funds were not yet at a sufficient size to be experiencing economies of scale, and that EGA would consider addressing economies of scale when assets under management reached appropriate levels. The Board received information regarding EGA’s financial condition and reviewed EGA’s financial statements. The Board concluded that EGA’s overall profitability with respect to the Operational Funds was reasonable and consistent with the level of services that EGA provides to the Funds.
(d) Investment performance of EGA. The Board considered the investment performance of the Operational Funds, including tracking error. In particular, the Board considered the investment performance of the Operational Funds relative to their stated objective to seek investment results that correspond (before fees and expenses) to the price and yield performance of their applicable underlying index, and EGA’s success in reaching each Fund’s objectives. The Board considered each Fund’s investment performance compared to the underlying index that is referenced in each Fund’s investment objective. Consideration was given to tracking error data provided to the Board throughout the year by ALPS Advisors and EGA. The Board noted that some of the Funds had been in operation for less than one year.
The Board noted that the tracking error for EGShares GEMS Composite ETF ranged from –0.60% to 0.40% for each of the four quarters of 2012.
The Board noted that the tracking error for EGShares Beyond BRICs ETF ranged from 0.51% to 0.80% for each of the third and fourth quarters of 2012.
The Board noted that the tracking error for EGShares Emerging Markets Brazil Infrastructure ETF ranged from –0.48% to 0.49% for each of the four quarters of 2012.
| | EGA Emerging Global Shares Trust 125 |
Board Review and Approval of Advisory Contracts (Unaudited) (concluded)
The Board noted that the tracking error for EGShares Emerging Markets China Infrastructure ETF ranged from –0.74% to 0.36% for each of the four quarters of 2012.
The Board noted that the tracking error for EGShares Emerging Markets Consumer ETF ranged from –0.09% to 0.54% for each of the four quarters of 2012.
The Board noted that the tracking error for EGShares Emerging Markets Core ETF ranged from 0.53% to 0.73% for the fourth quarter of 2012.
The Board noted that the tracking error for EGShares Domestic Demand ETF ranged from 0.50% to 0.90% for each of the third and fourth quarters of 2012.
The Board noted that the tracking error for EGShares Emerging Markets Metals & Mining ETF ranged from –0.30% to 0.30% for each of the four quarters of 2012.
The Board noted that the tracking error for EGShares Financials GEMS ETF ranged from –0.74% to 0.19% for each of the four quarters of 2012.
The Board noted that the tracking error for EGShares Consumer Goods GEMS ETF ranged from –0.38% to 0.26% for each of the four quarters of 2012.
The Board noted that the tracking error for EGShares Health Care GEMS ETF ranged from –0.55% to 0.62% for each of the four quarters of 2012.
The Board noted that the tracking error for EGShares Low Volatility Emerging Markets Dividend ETF ranged from –0.28% to 0.82% for each of the four quarters of 2012.
The Board noted that the tracking error for EGShares Industrials GEMS ETF ranged from –0.65% to 0.30% for each of the four quarters of 2012.
The Board noted that the tracking error for EGShares India Consumer ETF ranged from –0.05% to 1.49% for each of the four quarters of 2012.
The Board noted that the tracking error for EGShares Emerging Markets India Infrastructure ETF ranged from –0.69% to 0.12% for each of the four quarters of 2012.
The Board noted that the tracking error for EGShares Basic Materials GEMS ETF ranged from –0.18% to 1.17% for each of the four quarters of 2012.
The Board noted that the tracking error for EGShares Energy GEMS ETF ranged from –0.33% to 0.12% for each of the four quarters of 2012.
The Board noted that the tracking error for EGShares Technology GEMS ETF ranged from –0.40% to 0.75% for each of the four quarters of 2012.
The Board noted that the tracking error for EGShares Emerging Markets India Small Cap ETF ranged from –0.69% to 1.31% for each of the four quarters of 2012.
The Board noted that the tracking error for EGShares Telecom GEMS ETF ranged from –0.40% to 1.47% for each of the four quarters of 2012.
The Board noted that the tracking error for EGShares Utilities GEMS ETF ranged from –0.42% to 0.09% for each of the four quarters of 2012.
The Board noted that the tracking error for EGShares Consumer Services GEMS ETF ranged from –0.62% to 0.08% for each of the four quarters of 2012.
The Board was informed that comparative data on tracking errors of other ETFs was not readily available. The Board noted, however, that the tracking error of the Funds was generally within 1%, with only a small number of temporary exceptions, which EGA believed was consistent with industry standards. The Board also received and considered information about the premium/discount history of the Funds, which illustrated the number of times that the market price of the Funds trading on the secondary market closed above or below the NAV of the Funds, and by how much, measured in basis points.
Conclusion. No single factor was determinative to the decision of the Board. Based on the foregoing and such other matters as were deemed relevant, such as the Unified Fee and other reports that the Board had received and reviewed throughout the year, the Board concluded that the advisory fees and total expense ratios were reasonable in relation to the services provided, and to be provided, by EGA to each Fund, as well as the costs incurred and benefits gained by EGA in providing such services. As a result, the Board determined that the approval of the Advisory Agreement with EGA was in the best interest of each Fund and their shareholders.
| 126 EGA Emerging Global Shares Trust | |
Board of Trustees and Officers (Unaudited)
The Trustees and officers of the Trust, along with their principal occupations over the past five years and their affiliations, if any, with EGA, are listed below. Unless otherwise noted, the address of each Trustee of the Trust is 171 East Ridgewood Ave., Ridgewood, NJ 07450. The Statement of Additional Information includes additional information about Fund Trustee and is available, without charge, upon request at 171 East Ridgewood Ave., Ridgewood, NJ 07450.
| | | | | |
| Name and Year of Birth | Position(s)
Held with
Trust | Term of
Office1 and
Length of
Time Served | Principal Occupation(s)
During Past 5 Years | Number of
Portfolios
in Fund
Complex2
Overseen
by Trustee | Other
Directorships
Held by Trustee |
| Independent Trustees | | | | | |
| Robert Willens, 1946 | Trustee | Since 2009 | Robert Willens, LLC (tax consulting), President, since January, 2008; Lehman Brothers, Inc., Managing Director, Equity Research Department, January 2004 to January 2008. | 45 | Daxor Corp. (Medical Products and Biotechnology), since 2004. |
| |
| Ron Safir, 1951 | Trustee | Since 2009 | Retired, since 2008; UBS Wealth Management, Chief Administrative Officer, February 1971 to December 2008. | 45 | None |
| |
| Jeffrey D. Haroldson, 1957 | Trustee | Since 2009 | HDG Mansur Capital Group, LLC, (international real estate company) President and Chief Operating Officer, since 2004; HSBC Securities (USA), Inc., Executive Managing Director, Head of Investment and Merchant Banking, 2000 to 2003. | 45 | None |
| Interested Trustees | | | | | |
| Robert C. Holderith3, 1960 | Trustee and
President | Since 2008 | Emerging Global Advisors, LLC, Managing
Member and Chief Executive Officer, since
September 2008; ProFund Advisors,
Managing Director, Institutional Sales &
Investment Analytics, June 2006 to August
2008; UBS Financial Services, Inc., Director,
January 2000 to May 2006. | 45 | None |
| 1 | Each Trustee holds office for an indefinite term. |
| 2 | The “Fund Complex” consists of the Trust, which consists of forty-five Funds. |
| 3 | Mr. Holderith is considered to be “interested persons” of the Trust as defined in the 1940 Act, due to their relationship with EGA, the Funds’ Advisor. |
| | EGA Emerging Global Shares Trust 127 |
Board of Trustees and Officers (Unaudited) (concluded)
| | | |
| Name and Year of Birth | Position(s)
Held with
the Trust | Term of Office1
and Length of
Time Served | Principal Occupation(s) During Past 5 Years |
| Officers | | | |
| |
Marten S. Hoekstra
Emerging Global
Advisors, LLC
155 West 19th Street,
3rd Floor
New York, NY 10011
1960 | Executive Vice President | Since 2011 | Chief Executive Officer, Emerging Global Advisors, LLC, since January 2011; Board of Directors, Securities Industry and Financial Markets Association, 2006–2011; UBS (and its predecessor, PaineWebber), 1983–2009 (including various executive positions starting in 2001). |
| |
Susan M. Ciccarone
Emerging Global
Advisors, LLC
155 West 19th Street,
3rd Floor
New York, NY 10011
1973 | Principal Financial Officer | Since 2013 | Emerging Global Advisors LLC, Member and Chief Financial Officer since August 2012. Goldman, Sachs & Co., Managing Director, Financial Institutions Group, since October 2009. UBS Investment Bank, Executive Director, Director, Associate Director, 2002–2009. |
| |
Melanie H. Zimdars
ALPS Fund Services, Inc.
1290 Broadway
Suite 1100
Denver, CO 80203
1976 | Chief Compliance Officer | Since 2010 | ALPS Fund Services, Inc., Deputy Chief Compliance Officer, since September 2009; ALPS ETF Trust, Chief Compliance Officer, since December 2009; EGA EGShares Funds Trust, Chief Compliance Officer, since March 2010; Financial Investors Variable Insurance Trust, Chief Compliance Officer, since September 2009; BPV Family of Funds, Chief Compliance Officer since September 2011; Liberty All-Star Growth Fund, Inc., Chief Compliance Officer, since December 2009; Liberty All-Star Equity Fund, Chief Compliance Officer, since December 2009; Wasatch Funds, Principal Financial Officer, Treasurer and Secretary, February 2007 to December 2008; Wasatch Funds, Assistant Treasurer, November 2006 to February 2007; Wasatch Funds, Senior Compliance Officer, 2005 to December 2008. |
| 1 | Officers of the Trust are elected by the Trustees and serve at the pleasure of the Board. |
| 128 EGA Emerging Global Shares Trust | |
General Information (Unaudited)
Investment Adviser
Emerging Global Advisors, LLC
155 West 19th Street, 3rd Floor
New York, NY 10011
Distributor
ALPS Distributors, Inc.
1290 Broadway, Suite 1100
Denver, CO 80203
Administrator, Custodian and Transfer Agent
The Bank of New York Mellon
101 Barclay Street
New York, NY 10286
Independent Registered Public Accounting Firm
BBD, LLP
1835 Market Street, 26th Floor
Philadelphia, PA 19103
You may obtain a description of the EGShares Funds’ proxy voting, policies, procedures and information regarding how each Fund voted proxies relating to portfolio securities during the most recent 12-month period ending June 30 (available by August 31) without charge, upon request, by calling 1-888-800-4347 or visiting the funds website www.egshares.com, or by accessing the SEC’s website at www.sec.gov. Such reports may be reviewed and copied at the SEC’s Public Reference Room in Washington, DC. Information on the operation of the Public Reference Room may be obtained by calling 202-942-8090.
Each of the Funds’ premium/discount information that is current as of the most recent quarter-end is available by visiting www.egshares.com or by calling 1-201-389-6872.
The Trust files complete schedules of the portfolio holdings with the SEC for the first and third quarters on Form N-Q. The Form N-Q is available without charge, upon request, by calling 1-800-SEC-0330, or by accessing the SEC’s website, at www.sec.gov. It may also be reviewed and copied at the SEC’s Public Reference Room in Washington, DC.
This report has been prepared for shareholders and may be distributed to others only if preceded or accompanied by an effective prospectus, which includes information regarding the Funds’ objectives and polices, experience of its management, marketability of shares and other information.
| | EGA Emerging Global Shares Trust 129 |
(This page intentionally left blank.)

171 East Ridgewood Avenue
Ridgewood, NJ 07450
(201) 389-6872
(888) 800-4EGS (4347)
www.egshares.com
EGA Emerging Global Shares Trust
EGShares Basic Materials GEMS ETF
EGShares Beyond BRICs ETF
EGShares Brazil Infrastructure ETF
EGShares China Infrastructure ETF
EGShares Consumer Goods GEMS ETF
EGShares Consumer Services GEMS ETF
EGShares Emerging Markets Consumer ETF
EGShares Emerging Markets Core ETF
EGShares Emerging Markets Domestic Demand ETF
EGShares Emerging Markets Metals & Mining ETF
EGShares Energy GEMS ETF
EGShares Financials GEMS ETF
EGShares GEMS Composite ETF
EGShares Health Care GEMS ETF
EGShares India Consumer ETF
EGShares India Infrastructure ETF
EGShares India Small Cap ETF
EGShares Industrials GEMS ETF
EGShares Low Volatility Emerging Markets Dividend ETF
EGShares Technology GEMS ETF
EGShares Telecom GEMS ETF
EGShares Utilities GEMS ETF
EGShares are distributed by ALPS Distributors, Inc.
Item 2. Code of Ethics.
| (a) | The registrant, as of the end of the period covered by this report, has adopted a code of ethics that applies to the registrant’s principal executive officer, principal financial officer, principal accounting officer or controller, or persons performing similar functions, regardless of whether these individuals are employed by the registrant or a third party. |
| (c) | There have been no amendments, during the period covered by this report, to a provision of the code of ethics that applies to the registrant’s principal executive officer, principal financial officer, principal accounting officer or controller, or persons performing similar functions, regardless of whether these individuals are employed by the registrant or a third party, and that relates to any element of the code of ethics description. |
| (d) | The registrant has not granted any waivers, including an implicit waiver, from a provision of the code of ethics that applies to the registrant’s principal executive officer, principal financial officer, principal accounting officer or controller, or persons performing similar functions, regardless of whether these individuals are employed by the registrant or a third party, that relates to one or more of the items set forth in paragraph (b) of this item’s instructions. |
| (f) | Pursuant to Item 12(a)(1), the registrant is attaching as an exhibit a copy of its code of ethics that applies to registrant’s principal executive officer, principal financial officer, principal accounting officer or controller, or persons performing similar functions. |
Item 3. Audit Committee Financial Expert.
The Registrant’s Board of Trustees has determined that its Audit Committee has one “audit committee financial expert”, as that term is defined under Items 3(b) and 3(c), serving on its Audit Committee. Mr. Robert Willens, the Registrant’s audit committee financial expert, is “independent”, as that term is defined under Item 3(a)(2).
Item 4. Principal Accountant Fees and Services.
Audit Fees
| (a) | The aggregate fees billed for each of the last two fiscal years for professional services rendered by the principal accountant for the audit of the registrant's annual financial statements or services that are normally provided by the accountant in connection with statutory and regulatory filings or engagements for those fiscal years are $278,000 for 2013 and $241,000 for 2012. |
Audit-Related Fees
| (b) | The aggregate fees billed in each of the last two fiscal years for assurance and related services by the principal accountant that are reasonably related to the performance of the audit of the registrant's financial statements and are not reported under paragraph (a) of this Item are $0 for 2013 and $0 for 2012. |
Tax Fees
| (c) | The aggregate fees billed in each of the last two fiscal years for professional services rendered by the principal accountant for tax compliance, tax advice, and tax planning are $44,000 for 2013 and $38,000 for 2012. The Tax Fees represent services provided in connection with the preparation of tax returns and year-end distribution review. |
All Other Fees
| (d) | The aggregate fees billed in each of the last two fiscal years for products and services provided by the principal accountant, other than the services reported in paragraphs (a) through (c) of this Item are $0 for 2013 and $0 for 2012. |
| (e)(1) | Disclose the audit committee's pre-approval policies and procedures described in paragraph (c)(7) of Rule 2-01 of Regulation S-X. |
Per Rule 2-01(c)(7)(A) and the charter of the Registrant’s Audit Committee, the Audit Committee approves and recommends the principal accountant for the Registrant, pre-approves (i) the principal accountant’s provision of all audit and permissible non-audit services to the Registrant (including the fees and other compensation to be paid to the principal accountant), and (ii) the principal accountant’s provision of any permissible non-audit services to the Registrant’s investment adviser (the “Adviser”), sub-adviser or any entity controlling, controlled by, or under common control with any investment adviser or sub-adviser, if the engagement relates directly to the operations of the financial reporting of the Trust.
| (e)(2) | The percentage of services described in each of paragraphs (b) through (d) of this Item that were approved by the audit committee pursuant to paragraph (c)(7)(i)(C) of Rule 2-01 of Regulation S-X are as follows: |
| (f) | The percentage of hours expended on the principal accountant's engagement to audit the registrant's financial statements for the most recent fiscal year that were attributed to work performed by persons other than the principal accountant's full-time, permanent employees was less than fifty percent. |
| (g) | The aggregate non-audit fees billed by the registrant's accountant for services rendered to the registrant, and rendered to the registrant's investment adviser (not including any sub-adviser whose role is primarily portfolio management and is subcontracted with or overseen by another investment adviser), and any entity controlling, controlled by, or under common control with the adviser that provides ongoing services to the registrant for each of the last two fiscal years of the registrant was $0 for 2013 and $0 for 2012. |
Item 5. Audit Committee of Listed registrants.
The Registrant is an issuer as defined in Section 10A-3 of the Securities Exchange Act of 1934 and has a separately designated standing Audit Committee in accordance with Section 3(a)(58)(A) of such Act. All of the Board’s independent Trustees, Robert Willens, Ron Safir and Jeffrey D. Haroldson, are members of Audit Committee.
Item 6. Investments.
| (a) | Schedule of Investments in securities of unaffiliated issuers as of the close of the reporting period is included as part of the report to shareholders filed under Item 1 of this form. |
Item 7. Disclosure of Proxy Voting Policies and Procedures for Closed-End Management Investment Companies.
Not applicable.
Item 8. Portfolio Managers of Closed-End Management Investment Companies.
Not applicable.
Item 9. Purchases of Equity Securities by Closed-End Management Investment Company and Affiliated Purchasers.
Not applicable.
Item 10. Submission of Matters to a Vote of Security Holders.
There have been no material changes to the procedures by which the shareholders may recommend nominees to the registrant’s board of trustees, where those changes were implemented after the registrant last provided disclosure in response to the requirements of Item 407(c)(2)(iv) of Regulation S-K (17 CFR 229.407) (as required by Item 22(b)(15) of Schedule 14A (17 CFR 240.14a-101)), or this Item.
Item 11. Controls and Procedures.
| (a) | The registrant’s principal executive and principal financial officers, or persons performing similar functions, have concluded that the registrant’s disclosure controls and procedures (as defined in Rule 30a-3(c) under the Investment Company Act of 1940, as amended (the “1940 Act”) (17 CFR 270.30a-3(c))) are effective, as of a date within 90 days of the filing date of the report that includes the disclosure required by this paragraph, based on their evaluation of these controls and procedures required by Rule 30a-3(b) under the 1940 Act (17 CFR 270.30a-3(b)) and Rules 13a-15(b) or 15d-15(b) under the Securities Exchange Act of 1934, as amended (17 CFR 240.13a-15(b) or 240.15d-15(b)). |
| (b) | There were no changes in the registrant’s internal control over financial reporting (as defined in Rule 30a-3(d) under the 1940 Act (17 CFR 270.30a-3(d)) that occurred during the registrant’s second fiscal quarter of the period covered by this report that has materially affected, or is reasonably likely to materially affect, the registrant’s internal control over financial reporting. |
Item 12. Exhibits.
| (a)(1) | Code of ethics, or any amendment thereto, that is the subject of disclosure required by Item 2 is attached hereto. |
| (a)(2) | Certifications pursuant to Rule 30a-2(a) under the 1940 Act and Section 302 of the Sarbanes-Oxley Act of 2002 are attached hereto. |
| (b) | Certifications pursuant to Rule 30a-2(b) under the 1940 Act and Section 906 of the Sarbanes-Oxley Act of 2002 are attached hereto. |
SIGNATURES
Pursuant to the requirements of the Securities Exchange Act of 1934 and the Investment Company Act of 1940, the registrant has duly caused this report to be signed on its behalf by the undersigned, thereunto duly authorized.
| (Registrant) | EGA Emerging Global Shares Trust |
| By (Signature and Title)* | | /s/ Robert C. Holderith |
| | | Robert C. Holderith, President |
| | | (principal executive officer) |
Pursuant to the requirements of the Securities Exchange Act of 1934 and the Investment Company Act of 1940, this report has been signed below by the following persons on behalf of the registrant and in the capacities and on the dates indicated.
| By (Signature and Title)* | | /s/ Robert C. Holderith |
| | | Robert C. Holderith, President |
| | | (principal executive officer) |
| By (Signature and Title)* | | /s/ Susan M. Ciccarone |
| | | Susan M. Ciccarone, Chief Financial Officer |
| | | (principal financial officer) |
* Print the name and title of each signing officer under his or her signature.