UNITED STATES
SECURITIES AND EXCHANGE COMMISSION
Washington, D.C. 20549
FORM N-CSR
CERTIFIED SHAREHOLDER REPORT OF REGISTERED MANAGEMENT
INVESTMENT COMPANIES
Investment Company Act file number 811-22255
EGA Emerging Global Shares Trust
(Exact name of registrant as specified in charter)
171 East Ridgewood Avenue
Ridgewood, NJ 07450
(Address of principal executive offices) (Zip code)
Robert C. Holderith
171 East Ridgewood Avenue
Ridgewood, NJ 07450
(Name and address of agent for service)
Registrant's telephone number, including area code: 201-389-6872
Date of fiscal year end: March 31
Date of reporting period: March 31, 2010
Form N-CSR is to be used by management investment companies to file reports with the Commission not later than 10 days after the transmission to stockholders of any report that is required to be transmitted to stockholders under Rule 30e-1 under the Investment Company Act of 1940 (17 CFR 270.30e-1). The Commission may use the information provided on Form N-CSR in its regulatory, disclosure review, inspection, and policymaking roles.
A registrant is required to disclose the information specified by Form N-CSR, and the Commission will make this information public. A registrant is not required to respond to the collection of information contained in Form N-CSR unless the Form displays a currently valid Office of Management and Budget ("OMB") control number. Please direct comments concerning the accuracy of the information collection burden estimate and any suggestions for reducing the burden to Secretary, Securities and Exchange Commission, 450 Fifth Street, NW, Washington, DC 20549-0609. The OMB has reviewed this collection of information under the clearance requirements of 44 U.S.C. § 3507.
Item 1. Reports to Stockholders.
EGA EMERGING GLOBAL SHARES TRUST
Annual Report
March 31, 2010
EMERGING GLOBAL SHARES DOW JONES EMERGING MARKETS
TITANS COMPOSITE INDEX FUND
EMERGING GLOBAL SHARES DOW JONES EMERGING MARKETS
ENERGY TITANS INDEX FUND
EMERGING GLOBAL SHARES DOW JONES EMERGING MARKETS
METALS & MINING TITANS INDEX FUND
EMERGING GLOBAL SHARES DOW JONES EMERGING MARKETS
FINANCIALS TITANS INDEX FUND
EMERGING GLOBAL SHARES INDXX
CHINA INFRASTRUCTURE INDEX FUND
EMERGING GLOBAL SHARES INDXX
BRAZIL INFRASTRUCTURE INDEX FUND
Table of Contents
Letter to Shareholders
Dear Shareholder,
In today’s low yield, low return environment, we believe it is increasingly necessary for investors to expand their geographic scope to effectively manage risk factors and achieve improved risk-adjusted equity returns. We argue that certain risk factors such as political risk actually exist to a large degree in developed markets and not just in emerging markets. Furthermore, we believe that investors underestimate the scale of such risks in their highly home biased portfolios.
According to Morgan Stanley, fund flows in 2010 have increased not only to equities, but also to global emerging markets and exchange-traded funds (ETFs):
“[Emerging Market] equity funds recorded net inflows of $1.5bn for the week ended 04/28/10, with inflows mostly to [Global Emerging Market] funds (43%) and [Europe, Middle East, and Africa] funds (37%), while [Latin America] funds reported outflow for the third consecutive week. [Year-to-date Emerging Market] funds recorded net inflow of $19.2bn. This is the 11th consecutive week of net inflows, for a total of $14.4bn. ETF type funds accounted for 65% of inflows this week. Total assets under management tracked by [EPFR Global] reached $554bn this week, now 4.6% below the all-time high.”1
In this document we provide tables showing various return metrics. We believe our funds represent asset categories that provide great potential for active managers to derive “alpha”2. It is very common to see returns (both positive and negative) from any of our funds greater than 10% in a particular month. Aside from January, where we saw returns in the area of –7% to –8%, we believe the general performance of our funds and that of global markets overall in 2010 have been strong to the positive. Keeping in mind that we are a full year past the equity market troughs of March 2009, we believe that we are in a period of increased risk taking. Allocating to countries and sectors (with some individual security selection) is warranted as the outlook no longer assumes an upward trend for all, or even most, asset categories.
We are in a period where many investors are still sore from the pain of the recent financial crisis which may have lasting psychological impact and we feel that most remain underexposed to risky assets. At the current level of 17.59, the “VIX” (fear gauge based on implied volatility used to price equity index options) suggests that forward looking risk aversion is minimal.3 Thus we would expect more investors will gain further exposure to risky assets over the remainder of this year. If 2009 was relatively “easy money” but 2010 is not, then we expect that investors will either: a) more actively manage market exposures through timing and/or b) supplement existing exposures with more niche, alternative investments.
Despite investors trending to accept greater risk in today’s environment, we are observant of high risk situations globally. Unfortunately, these problems seem to be occurring in areas where investor exposure is the highest. Examples include possible tax increases in the U.S., economic instability in the European Union, and overall slow GDP growth in most developed markets. Thus, it would make sense that investors continue to gain exposure where they likely are underweighted and where they see the greatest potential for forward looking returns: emerging markets. Fund flows to emerging markets funds (ETFs and otherwise) would seemingly confirm this.
As always, we appreciate the trust you have placed with our organization and look forward to working on your behalf.
Sincerely,

Robert C. Holderith
President & Chief Executive Officer
Emerging Global Advisors, LLC
| 1 | Morgan Stanley Research. “Asia/GEMs Equity Strategy” J. Garner. April 30, 2010 |
| 2 | The term “alpha” refers to the abnormal rate of return on a security or portfolio in excess of what would be predicted by an equilibrium model. Source: www.investopedia.com |
| 3 | The Chicago Board Options Exchange SPX Volatility Index reflects a market estimate of future volatility, based on the weighted average of the implied volatilities for a wide range of strikes. The term “volatility” refers to statistical measure of the dispersion of returns for a given security or market index. Sources: Bloomberg, www.investopedia.com |
EGA Emerging Global Shares Trust 1
Portfolio Summary (Unaudited)
EMERGING GLOBAL SHARES DOW JONES EMERGING MARKETS
TITANS COMPOSITE INDEX FUND
|
| Industry Breakdown* |
|
 |
| | |
| Top Ten Holdings* | | |
|
|
| Industrial & Commercial Bank of China, Ltd. Class H | 5.9 | % |
| Gazprom OAO ADR | 5.4 | % |
| Itau Unibanco Holding SA | 5.0 | % |
| Reliance Industries, Ltd. GDR 144A | 5.0 | % |
| Petroleo Brasileiro SA | 4.8 | % |
| Vale SA Class A | 4.3 | % |
| Infosys Technologies, Ltd. ADR | 3.6 | % |
| China Construction Bank Corp. Class H | 3.4 | % |
| America Movil SAB de CV Series L | 3.1 | % |
| China Life Insurance Co., Ltd. Class H | 2.8 | % |
| * | Expressed as a percentage of total investments in securities as of 3/31/10. |
Emerging Global Shares Dow Jones Emerging Markets Titans Composite Index Fund (ticker: EEG)
The Fund seeks to achieve its investment objective of total return by investing in the constituent securities of the Dow Jones Emerging Markets Composite Titans 100 Index (the “Underlying Index”). The Underlying Index is a stock market index comprised of a representative sample of 100 Emerging Markets companies that Dow Jones Indices deem to be the 10 leading companies in each of the 10 industrial sectors, as defined by the Industry Classification Benchmark (“ICB”), across the developing world. Under normal circumstances, the Fund will invest at least 80% of its net assets in companies included in the Index and generally expects to be substantially invested at such times, with at least 95% of its net assets invested in these securities. The Fund will provide shareholders with at least 60 days’ notice prior to any change in this policy. The annual expense ratio of the Fund is 0.75%.
The Emerging Global Shares Dow Jones Emerging Markets Titans Composite Index Fund had a total return of 0.25% at net asset value (“NAV”) for the quarter ended March 31, 2010 and 21.96% since its inception date of July 22, 2009. The Fund does not have a long enough history to calculate performance for the full year ended March 31, 2010. Aside from January 2010, we believe, broad emerging markets have experienced strong upward performance. As a more diversified fund by both country and sector, this mandate should experience less overall volatility in the long run versus our other country and sector specific products. However, we believe the outlook of the Fund appears to remain favorable given the economic factors of longer term nature such as demographics and urbanization and thus the continued interest from global investors because of this.
Performance Charts
The following performance chart is provided for comparative purposes and represents the period noted. The Fund’s per share NAV is the value of one share of the Fund and is calculated by dividing the value of total assets less total liabilities by the number of shares outstanding. The NAV return is based on the NAV of the Fund and the market return is based on the market price per share of the Fund. The price used to calculate market price returns is the mid-point of the highest bid and lowest offer for Fund shares as of the close of trading on the exchange where Fund shares are listed. NAV and market returns assume that dividends and capital gain distributions have been reinvested in the Fund at NAV and market price, respectively. As with other ETFs, NAV returns and market price returns may differ because of factors such as the supply and demand for Fund shares and investors’ assessments of the underlying value of a Fund’s portfolio securities. An index is a statistical measure of a specified financial market or sector. An index does not actually hold a portfolio of securities, incur expenses or pay any transaction costs. Therefore index returns do not reflect deductions for fees or expenses and are not available for direct investment. In comparison, the Fund’s performance is negatively impacted by these deductions. Fund returns do not reflect brokerage commissions or taxes on transactions in Fund shares or that a shareholder would pay on Fund distributions.
Emerging market investments involve risk of capital loss from unfavorable fluctuation in currency values, from differences in generally accepted accounting principles, from economic or political instability in other nations or increased volatility and lower trading volume. This fund will concentrate its investments in issuers of one or more particular industries to the same extent that its Underlying Index is so concentrated and to the extent permitted by applicable regulatory guidance. Concentration risk results from maintaining exposure to issuers conducting business in a specific industry.
2 EGA Emerging Global Shares Trust
EMERGING GLOBAL SHARES DOW JONES EMERGING MARKETS
TITANS COMPOSITE INDEX FUND
|
| Performance as of 3/31/2010 |
|
| | | | | |
| | Cumulative Return1
| | |
| | Fund
Net Asset Value | Fund
Market Price | Dow Jones
Emerging Markets
Composite
Titans 100 Index | Gross
Expense Ratio | Net
Expense Ratio3 |
|
|
| Since Inception2 | 21.96% | 22.45% | 24.42% | 3.43% | 0.75% |
|
| 1 | Returns of less than one year are not annualized. |
| 2 | July 22, 2009. |
| 3 | This agreement will remain in effect and will be contractually binding for at least one year from the date of the Prospectus. |
Performance data quoted represents past performance. Investment return and principal value of an investment will fluctuate so that an investor’s shares, when sold or redeemed, may be worth more or less than the original cost. Current performance data may be higher or lower than actual data quoted. For the most current month-end performance data please visit www.egshares.com or call (888) 800-4347. This fund is new and has limited operating history. Market price returns are based on the midpoint of the bid/ask spread as of the scheduled close of regular trading on the New York Stock Exchange (“NYSE”) Arca, ordinarily 4:00 p.m. Eastern time, on each day during which the NYSE is open for trading, and do not represent the returns an investor would receive if shares were traded at other times.
|
| Growth of $10,000 Investment |
|
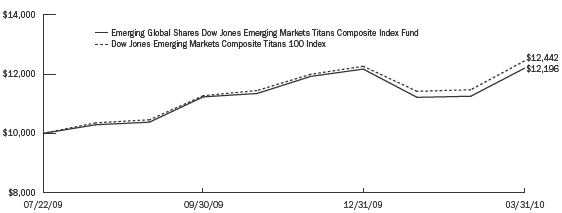
The chart above represents historical performance of a hypothetical investment of $10,000 over the life of the Fund. Past performance does not guarantee future results. The hypothetical example does not represent the returns of any particular investment.
EGA Emerging Global Shares Trust 3
Portfolio Summary (Unaudited)
EMERGING GLOBAL SHARES DOW JONES EMERGING MARKETS
ENERGY TITANS INDEX FUND
|
| Industry Breakdown* |
|
 |
| | |
| Top Ten Holdings* | | |
|
|
| Reliance Industries, Ltd. GDR 144A | 9.5 | % |
| Surgutneftegaz ADR | 8.4 | % |
| Gazprom OAO ADR | 7.3 | % |
| Petroleo Brasileiro SA | 6.9 | % |
| PetroChina Co., Ltd. Class H | 5.5 | % |
| Lukoil OAO ADR | 5.3 | % |
| China Petroleum & Chemical Corp. Class H | 4.6 | % |
| NovaTek OAO GDR | 4.6 | % |
| Sasol, Ltd. | 4.5 | % |
| MOL Hungarian Oil and Gas Nyrt. | 4.4 | % |
| * | Expressed as a percentage of total investments in securities as of 3/31/10. |
Emerging Global Shares Dow Jones Emerging Markets Energy Titans Index Fund (ticker: EEO)
The Fund seeks to achieve its investment objective of total return by investing in the constituent securities of the Dow Jones Emerging Markets Oil and Gas Titans Index (the “Underlying Index”). The Underlying Index is a stock market index comprised of 30 leading Emerging Markets companies that Dow Jones Indices deem to be part of the Oil and Gas sector of the global economy, which also includes alternative energy sources other than oil and gas as defined by their ICB (Industry Classification Benchmark) methodology. Under normal circumstances, the Fund will invest at least 80% of its net assets in Energy companies included in the Index and generally expects to be substantially invested at such times, with at least 95% of its net assets invested in these securities. The Fund defines Energy companies as companies that are included in the Underlying Index at the time of purchase and generally includes companies whose businesses involve: oil and gas production; oil equipment, services and distribution; and alternative energy. The Fund will provide shareholders with at least 60 days’ notice prior to any change in this policy. The annual expense ratio of the Fund is 0.85%.
The Emerging Global Shares Dow Jones Emerging Markets Energy Titans Index Fund had a total return of 3.42% at net asset value (“NAV”) for the quarter ended March 31, 2010 and 17.53% since the inception date of May 21, 2009. The Fund does not have a long enough history to calculate performance for the full year ended March 31, 2010. Aside from January 2010, we believe, this fund has experienced strong upward performance. A roughly 25% drawdown† in the summer of 2009 and a roughly 16% drawdown in January/February 2010 were the main examples of extreme volatility in this sector. The Fund is favorably positioned to benefit from increases in oil prices arising from a global economic recovery, a potentially troubling upcoming hurricane season, and a potential windfall profits tax on U.S. oil companies likely to occur as a result of higher oil prices or some exogenous catalyst such as the recent Gulf of Mexico oil spill.
Performance Charts
The following performance chart is provided for comparative purposes and represents the period noted. The Fund’s per share NAV is the value of one share of the Fund and is calculated by dividing the value of total assets less total liabilities by the number of shares outstanding. The NAV return is based on the NAV of the Fund and the market return is based on the market price per share of the Fund. The price used to calculate market price returns is the mid-point of the highest bid and lowest offer for Fund shares as of the close of trading on the exchange where Fund shares are listed. NAV and market returns assume that dividends and capital gain distributions have been reinvested in the Fund at NAV and market price, respectively. As with other ETFs, NAV returns and market price returns may differ because of factors such as the supply and demand for Fund shares and investors’ assessments of the underlying value of a Fund’s portfolio securities. An index is a statistical measure of a specified financial market or sector. An index does not actually hold a portfolio of securities, incur expenses or pay any transaction costs. Therefore index returns do not reflect deductions for fees or expenses and are not available for direct investment. In comparison, the Fund’s performance is negatively impacted by these deductions. Fund returns do not reflect brokerage commissions or taxes on transactions in Fund shares or that a shareholder would pay on Fund distributions.
| |
| † | The term “drawdown” refers to a peak-to-trough decline during a specific record period of an investment, fund or commodity. Source: www.investopedia.com |
| |
4 EGA Emerging Global Shares Trust
EMERGING GLOBAL SHARES DOW JONES EMERGING MARKETS
ENERGY TITANS INDEX FUND
|
| Performance as of 3/31/2010 |
|
| | | | | |
| | Cumulative Return1
| | |
| | Fund
Net Asset Value | Fund
Market Price | Dow Jones
Emerging Markets
Oil and Gas
Titans Index | Gross
Expense Ratio | Net
Expense Ratio3 |
|
|
| Since Inception2 | 17.53% | 18.13% | 21.11% | 5.90% | 0.85% |
|
| 1 | Returns of less than one year are not annualized. |
| 2 | May 21, 2009. |
| 3 �� | This agreement will remain in effect and will be contractually binding for at least one year from the date of the Prospectus. |
Performance data quoted represents past performance. Investment return and principal value of an investment will fluctuate so that an investor’s shares, when sold or redeemed, may be worth more or less than the original cost. Current performance data may be higher or lower than actual data quoted. For the most current month-end performance data please visit www.egshares.com or call (888) 800-4347. This fund is new and has limited operating history. Market price returns are based on the midpoint of the bid/ask spread as of the scheduled close of regular trading on the New York Stock Exchange (“NYSE”) Arca, ordinarily 4:00 p.m. Eastern time, on each day during which the NYSE is open for trading, and do not represent the returns an investor would receive if shares were traded at other times.
|
| Growth of $10,000 Investment |
|
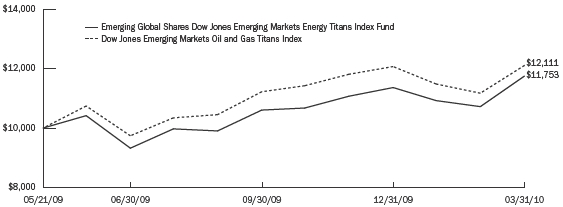
The chart above represents historical performance of a hypothetical investment of $10,000 over the life of the Fund. Past performance does not guarantee future results. The hypothetical example does not represent the returns of any particular investment.
EGA Emerging Global Shares Trust 5
Portfolio Summary (Unaudited)
EMERGING GLOBAL SHARES DOW JONES EMERGING MARKETS
METALS & MINING TITANS INDEX FUND
|
| Industry Breakdown* |
|
 |
| | |
| Top Ten Holdings* | | |
|
|
| Vale SA Class A | 8.8 | % |
| Mining and Metallurgical Company Norilsk | | |
| Nickel JSC ADR | 8.0 | % |
| Impala Platinum Holdings, Ltd. | 7.4 | % |
| Grupo Mexico SAB de CV Series B | 5.8 | % |
| Companhia Siderurgica Nacional SA | 5.8 | % |
| China Shenhua Energy Co., Ltd. Class H | 5.7 | % |
| Anglo Platinum, Ltd. | 5.2 | % |
| Usinas Siderurgicas de Minas Gerais SA Class A | 5.0 | % |
| AngloGold Ashanti, Ltd. | 4.6 | % |
| Sterlite Industries, Ltd. ADR | 4.2 | % |
| * | Expressed as a percentage of total investments in securities as of 3/31/10. |
Emerging Global Shares Dow Jones Emerging Markets Metals & Mining Titans Index Fund (ticker: EMT)
The Fund seeks to achieve its investment objective of total return by investing in the constituent securities of the Dow Jones Emerging Markets Metals & Mining Titans Index (the “Underlying Index”). The Underlying Index is a stock market index comprised of 30 leading emerging markets companies that Dow Jones Indices deem to be in the Metals & Mining sector of the global economy. The Metals & Mining sector is a sub-sector of the Basic Materials industry, as defined by their ICB (Industry Classification Benchmark) methodology. Under normal circumstances, the Fund will invest at least 80% of its net assets in Metals & Mining companies included in the Index and generally expects to be substantially invested at such times, with at least 95% of its net assets invested in these securities. The Fund defines Metals & Mining companies as companies that are included in the Underlying Index at the time of purchase and generally includes companies involved in the extraction and basic processing of basic resources (other than oil and gas), such as coal, metal ore (including the production of basic aluminum, iron and steel products), precious metals and gemstones. The Fund will provide shareholders with at least 60 days’ notice prior to any change in this policy. The annual expense ratio of the Fund is 0.85%.
The Emerging Global Shares Dow Jones Emerging Markets Metals & Mining Titans Index Fund had a total return of 4.19% at net asset value (“NAV”) for the quarter ended March 31, 2010 and 49.69% since its inception date of May 21, 2009. The Fund does not have a long enough history to calculate performance for the full year ended March 31, 2010. Aside from January 2010, we believe, this fund has experienced strong upward performance. There have been some periods of roughly 10% drawdown (peak to trough total return) but January’s fall of roughly 20% was significant. However, this was true for metals/mining overall and not just for emerging markets. We believe continued interest lies in increased demand both in developed markets and especially in emerging markets overall for commodities of all types as their recovery strengthens and infrastructure expansion continues.
Performance Charts
The following performance chart is provided for comparative purposes and represents the period noted. The Fund’s per share NAV is the value of one share of the Fund and is calculated by dividing the value of total assets less total liabilities by the number of shares outstanding. The NAV return is based on the NAV of the Fund and the market return is based on the market price per share of the Fund. The price used to calculate market price returns is the mid-point of the highest bid and lowest offer for Fund shares as of the close of trading on the exchange where Fund shares are listed. NAV and market returns assume that dividends and capital gain distributions have been reinvested in the Fund at NAV and market price, respectively. As with other ETFs, NAV returns and market price returns may differ because of factors such as the supply and demand for Fund shares and investors’ assessments of the underlying value of a Fund’s portfolio securities. An index is a statistical measure of a specified financial market or sector. An index does not actually hold a portfolio of securities, incur expenses or pay any transaction costs. Therefore index returns do not reflect deductions for fees or expenses and are not available for direct investment. In comparison, the Fund’s performance is negatively impacted by these deductions. Fund returns do not reflect brokerage commissions or taxes on transactions in Fund shares or that a shareholder would pay on Fund distributions.
6 EGA Emerging Global Shares Trust
EMERGING GLOBAL SHARES DOW JONES EMERGING MARKETS
METALS & MINING TITANS INDEX FUND
|
| Performance as of 3/31/2010 |
|
| | | | | |
| | Cumulative Return1
| | |
| | Fund
Net Asset Value | Fund
Market Price | Dow Jones
Emerging Markets
Metals and Mining
Titans Index | Gross
Expense Ratio | Net
Expense Ratio3 |
|
|
| Since Inception2 | 49.69% | 50.19% | 59.72% | 4.37% | 0.85% |
|
| 1 | Returns of less than one year are not annualized. |
| 2 | May 21, 2009. |
| 3 | This agreement will remain in effect and will be contractually binding for at least one year from the date of the Prospectus. |
Performance data quoted represents past performance. Investment return and principal value of an investment will fluctuate so that an investor’s shares, when sold or redeemed, may be worth more or less than the original cost. Current performance data may be higher or lower than actual data quoted. For the most current month-end performance data please visit www.egshares.com or call (888) 800-4347. This fund is new and has limited operating history. Market price returns are based on the midpoint of the bid/ask spread as of the scheduled close of regular trading on the New York Stock Exchange (“NYSE”) Arca, ordinarily 4:00 p.m. Eastern time, on each day during which the NYSE is open for trading, and do not represent the returns an investor would receive if shares were traded at other times.
|
| Growth of $10,000 Investment |
|

The chart above represents historical performance of a hypothetical investment of $10,000 over the life of the Fund. Past performance does not guarantee future results. The hypothetical example does not represent the returns of any particular investment.
EGA Emerging Global Shares Trust 7
Portfolio Summary (Unaudited)
EMERGING GLOBAL SHARES DOW JONES EMERGING MARKETS
FINANCIALS TITANS INDEX FUND
|
| Industry Breakdown* |
|
 |
| | |
| Top Ten Holdings* | | |
|
|
| ICICI Bank, Ltd. ADR | 9.4 | % |
| Industrial & Commercial Bank of China, Ltd. Class H | 9.3 | % |
| China Life Insurance Co., Ltd. Class H | 7.0 | % |
| China Construction Bank Corp. Class H | 6.6 | % |
| Banco Bradesco SA | 6.5 | % |
| Bank of China, Ltd. Class H | 5.5 | % |
| Itau Unibanco Holding SA | 4.3 | % |
| State Bank of India GDR | 4.3 | % |
| Standard Bank Group, Ltd. | 4.2 | % |
| Sanlam, Ltd. | 3.6 | % |
| * | Expressed as a percentage of total investments in securities as of 3/31/10. |
Emerging Global Shares Dow Jones Emerging Markets Financials Titans Index Fund (ticker: EFN)
The Fund seeks to achieve its investment objective of total return by investing in the constituent securities of the Dow Jones Emerging Markets Financials Titans Index (the “Underlying Index”). The Underlying Index is a stock market index comprised of 30 leading Emerging Markets companies that Dow Jones Indices deem to be part of the Financials sector of the global economy as defined by their ICB (Industry Classification Benchmark) methodology. Under normal circumstances, the Fund will invest at least 80% of its net assets in Financials companies included in the Index and generally expects to be substantially invested at such times, with at least 95% of its net assets invested in these securities. The Fund defines Financials companies as companies that are included in the Underlying Index at the time of purchase and generally includes companies whose businesses involve: banking; insurance; real estate; and financial services. The Fund will provide shareholders with at least 60 days’ notice prior to any change in this policy. The annual expense ratio of the Fund is 0.85%.
The Emerging Global Shares Dow Jones Emerging Markets Financials Titans Index Fund had a total return of 2.12% at net asset value (“NAV”) for the quarter ended March 31, 2010 and 13.87% since its inception date of September 16, 2009. The Fund does not have a long enough history to calculate performance for the full year ended March 31, 2010. Aside from January 2010, we believe, this fund has experienced strong upward performance. A drop of roughly 15% in January-February 2010 is the worst this sector has experienced since fund launch. Interestingly, immediately after this maximum drawdown point, the fund rebounded by roughly 25%, easily surpassing previous highs. Given likely troubles with European financials as contagion spreads in that region, one only can wonder how the Goldman Sachs versus SEC lawsuit scenario will play out for US financial conglomerates as a whole. Clearly political risk exists for the domestic financial sector if not for other domestic sectors as well.
Performance Charts
The following performance chart is provided for comparative purposes and represents the period noted. The Fund’s per share NAV is the value of one share of the Fund and is calculated by dividing the value of total assets less total liabilities by the number of shares outstanding. The NAV return is based on the NAV of the Fund and the market return is based on the market price per share of the Fund. The price used to calculate market price returns is the mid-point of the highest bid and lowest offer for Fund shares as of the close of trading on the exchange where Fund shares are listed. NAV and market returns assume that dividends and capital gain distributions have been reinvested in the Fund at NAV and market price, respectively. As with other ETFs, NAV returns and market price returns may differ because of factors such as the supply and demand for Fund shares and investors’ assessments of the underlying value of a Fund’s portfolio securities. An index is a statistical measure of a specified financial market or sector. An index does not actually hold a portfolio of securities, incur expenses or pay any transaction costs. Therefore index returns do not reflect deductions for fees or expenses and are not available for direct investment. In comparison, the Fund’s performance is negatively impacted by these deductions. Fund returns do not reflect brokerage commissions or taxes on transactions in Fund shares or that a shareholder would pay on Fund distributions.
8 EGA Emerging Global Shares Trust
EMERGING GLOBAL SHARES DOW JONES EMERGING MARKETS
FINANCIALS TITANS INDEX FUND
|
| Performance as of 3/31/2010 |
|
| | | | | |
| | Cumulative Return1
| | |
| | Fund
Net Asset Value | Fund
Market Price | Dow Jones
Emerging Markets
Financials
Titans Index | Gross
Expense Ratio | Net
Expense Ratio3 |
|
|
| Since Inception2 | 13.87% | 14.63% | 8.89% | 5.47% | 0.85% |
|
| 1 | Returns of less than one year are not annualized. |
| 2 | September 16, 2009. |
| 3 | This agreement will remain in effect and will be contractually binding for at least one year from the date of the Prospectus. |
Performance data quoted represents past performance. Investment return and principal value of an investment will fluctuate so that an investor’s shares, when sold or redeemed, may be worth more or less than the original cost. Current performance data may be higher or lower than actual data quoted. For the most current month-end performance data please visit www.egshares.com or call (888) 800-4347. This fund is new and has limited operating history. Market price returns are based on the midpoint of the bid/ask spread as of the scheduled close of regular trading on the New York Stock Exchange (“NYSE”) Arca, ordinarily 4:00 p.m. Eastern time, on each day during which the NYSE is open for trading, and do not represent the returns an investor would receive if shares were traded at other times.
|
| Growth of $10,000 Investment |
|

The chart above represents historical performance of a hypothetical investment of $10,000 over the life of the Fund. Past performance does not guarantee future results. The hypothetical example does not represent the returns of any particular investment.
EGA Emerging Global Shares Trust 9
Portfolio Summary (Unaudited)
EMERGING GLOBAL SHARES INDXX
CHINA INFRASTRUCTURE INDEX FUND
|
| Industry Breakdown* |
|
 |
| | |
| Top Ten Holdings* | | |
|
|
| Jiangxi Copper Co., Ltd. Class H | 5.1 | % |
| China Telecom Corp., Ltd. Class H | 5.0 | % |
| Agile Property Holdings, Ltd. | 5.0 | % |
| Aluminum Corp. of China, Ltd. Class H | 4.8 | % |
| China Railway Construction Corp., Ltd. Class H | 4.8 | % |
| Suntech Power Holdings Co., Ltd. ADR | 4.7 | % |
| China Communication Construction Co., Ltd. Class H | 4.5 | % |
| China Railway Group, Ltd. Class H | 4.4 | % |
| Huaneng Power International, Inc. Class H | 4.3 | % |
| Guangzhou R&F Properties Co., Ltd. Class H | 4.2 | % |
| * | Expressed as a percentage of total investments in securities as of 3/31/10. |
Emerging Global Shares INDXX China Infrastructure Index Fund (ticker: CHXX)
The Fund’s investment objective is to seek investment results that generally correspond (before fees and expenses) to the price and yield performance of the INDXX China Infrastructure Index (the “Underlying Index”). The Fund seeks to achieve its investment objective by attempting to replicate the portfolio of the Underlying Index through investments in equity securities, including shares traded on local exchanges, American Depositary Receipts (“ADRs”) and Global Depositary Receipts (“GDRs”). The Underlying Index is a free-float market capitalization weighted stock market index comprised of 30 leading companies that INDXX, LLC determines to be representative of China’s Infrastructure sectors. The Fund invests in Chinese large and mid cap infrastructure related companies that are included in the Underlying Index, which are generally defined as companies that are domiciled in China and that have a market capitalization of at least $200 million at the time of purchase. Under normal circumstances, the Fund will invest at least 80% of its net assets in Chinese Infrastructure related companies included in the Underlying Index and generally expects to be substantially invested at such times, with at least 95% of its net assets invested in these securities. The Fund defines Chinese Infrastructure companies as companies that are included in the Underlying Index at the time of purchase. The Fund will provide shareholders with at least 60 days’ notice prior to any change in this policy. The annual expense ratio of the Fund is 0.85%.
The Emerging Global Shares INDXX China Infrastructure Index Fund had a net asset value (“NAV”) total return of 3.43% since its inception date of February 17, 2010. The Fund does not have a long enough history to calculate performance for the quarter or full year ended March 31, 2010. However, it is important to note that despite speculation of China as a bubble, we would expect that any decline will likely be limited to specific real estate markets and certain areas of the financial sector.
Performance Charts
The following performance chart is provided for comparative purposes and represents the period noted. The Fund’s per share NAV is the value of one share of the Fund and is calculated by dividing the value of total assets less total liabilities by the number of shares outstanding. The NAV return is based on the NAV of the Fund and the market return is based on the market price per share of the Fund. The price used to calculate market price returns is the mid-point of the highest bid and lowest offer for Fund shares as of the close of trading on the exchange where Fund shares are listed. NAV and market returns assume that dividends and capital gain distributions have been reinvested in the Fund at NAV and market price, respectively. As with other ETFs, NAV returns and market price returns may differ because of factors such as the supply and demand for Fund shares and investors’ assessments of the underlying value of a Fund’s portfolio securities. An index is a statistical measure of a specified financial market or sector. An index does not actually hold a portfolio of securities, incur expenses or pay any transaction costs. Therefore index returns do not reflect deductions for fees or expenses and are not available for direct investment. In comparison, the Fund’s performance is negatively impacted by these deductions. Fund returns do not reflect brokerage commissions or taxes on transactions in Fund shares or that a shareholder would pay on Fund distributions.
10 EGA Emerging Global Shares Trust
EMERGING GLOBAL SHARES INDXX
CHINA INFRASTRUCTURE INDEX FUND
|
| Performance as of 3/31/2010 |
|
| | | | | |
| | Cumulative Return1
| | |
| | Fund
Net Asset Value | Fund
Market Price | INDXX China
Infrastructure
Index | Gross
Expense Ratio | Net
Expense Ratio3 |
|
|
| Since Inception2 | 3.43% | 4.90% | 3.01% | 7.82% | 0.85% |
|
| 1 | Returns of less than one year are not annualized. |
| 2 | February 17, 2010. |
| 3 | This agreement will remain in effect and will be contractually binding for at least one year from the date of the Prospectus. |
Performance data quoted represents past performance. Investment return and principal value of an investment will fluctuate so that an investor’s shares, when sold or redeemed, may be worth more or less than the original cost. Current performance data may be higher or lower than actual data quoted. For the most current month-end performance data please visit www.egshares.com or call (888) 800-4347. This fund is new and has limited operating history. Market price returns are based on the midpoint of the bid/ask spread as of the scheduled close of regular trading on the New York Stock Exchange (“NYSE”) Arca, ordinarily 4:00 p.m. Eastern time, on each day during which the NYSE is open for trading, and do not represent the returns an investor would receive if shares were traded at other times.
|
| Growth of $10,000 Investment |
|

The chart above represents historical performance of a hypothetical investment of $10,000 over the life of the Fund. Past performance does not guarantee future results. The hypothetical example does not represent the returns of any particular investment.
EGA Emerging Global Shares Trust 11
Portfolio Summary (Unaudited)
EMERGING GLOBAL SHARES INDXX
BRAZIL INFRASTRUCTURE INDEX FUND
|
| Industry Breakdown* |
|
 |
| | |
| Top Ten Holdings* | | |
|
|
| Vale SA | 6.0 | % |
| Companhia Siderurgica Nacional SA | 5.7 | % |
| Companhia de Concessoes Rodoviarias | 5.6 | % |
| Gerdau SA | 5.2 | % |
| Ultrapar Participacoes SA | 5.1 | % |
| Weg SA | 5.0 | % |
| Net Servicos de Comunicacao SA | 4.9 | % |
| Vivo Participacoes SA ADR | 4.8 | % |
| Empresa Brasileira de Aeronautica SA | 4.6 | % |
| AES Tiete SA | 4.2 | % |
| * | Expressed as a percentage of total investments in securities as of 3/31/10. |
Emerging Global Shares INDXX Brazil Infrastructure Index Fund (ticker: BRXX)
The Fund’s investment objective is to seek investment results that generally correspond (before fees and expenses) to the price and yield performance of the INDXX Brazil Infrastructure Index (the “Underlying Index”). The Fund seeks to achieve its investment objective by attempting to replicate the portfolio of the Underlying Index through investments in equity securities, including shares traded on local exchanges, American Depositary Receipts (“ADRs”) and Global Depositary Receipts (“GDRs”). The Underlying Index is a free-float capitalization weighted stock market index comprised of 30 leading companies that INDXX, LLC determines to be representative of Brazil’s Infrastructure sectors. The Fund invests in Brazilian large and mid cap infrastructure companies that are included in the Underlying Index, which are generally defined as companies that are domiciled in Brazil and that have a market capitalization of at least $200 million at the time of purchase. Under normal circumstances, the Fund will invest at least 80% of its net assets in Brazilian Infrastructure companies included in the Underlying Index and generally expects to be substantially invested at such times, with at least 95% of its net assets invested in these securities. The Fund defines Brazilian Infrastructure companies as companies that are included in the Underlying Index at the time of purchase. The Fund will provide shareholders with at least 60 days’ notice prior to any change in this policy. The annual expense ratio of the Fund is 0.85%.
The Emerging Global Shares INDXX Brazil Infrastructure Index Fund had a net asset value (“NAV”) total return of 2.75% since its inception date of February 24, 2010. The Fund does not have a long enough history to calculate performance for the quarter or full year ended March 31, 2010. Overall, the Brazilian economy has rebounded well from the global collapse. In fact, its equity markets have rebounded from the market bottoms of late 2008/early 2009 better than most other indices throughout the globe. Unlike most other countries, Brazil has come very close to reaching its previous highs (May 2008) having seen recent peaks in January 2010 and the end of Q1 2010. As this is an election year in Brazil and given drastic underspending in infrastructure, investors are finding this country theme to be very enticing.
Performance Charts
The following performance chart is provided for comparative purposes and represents the period noted. The Fund’s per share NAV is the value of one share of the Fund and is calculated by dividing the value of total assets less total liabilities by the number of shares outstanding. The NAV return is based on the NAV of the Fund and the market return is based on the market price per share of the Fund. The price used to calculate market price returns is the mid-point of the highest bid and lowest offer for Fund shares as of the close of trading on the exchange where Fund shares are listed. NAV and market returns assume that dividends and capital gain distributions have been reinvested in the Fund at NAV and market price, respectively. As with other ETFs, NAV returns and market price returns may differ because of factors such as the supply and demand for Fund shares and investors’ assessments of the underlying value of a Fund’s portfolio securities. An index is a statistical measure of a specified financial market or sector. An index does not actually hold a portfolio of securities, incur expenses or pay any transaction costs. Therefore index returns do not reflect deductions for fees or expenses and are not available for direct investment. In comparison, the Fund’s performance is negatively impacted by these deductions. Fund returns do not reflect brokerage commissions or taxes on transactions in Fund shares or that a shareholder would pay on Fund distributions.
12 EGA Emerging Global Shares Trust
EMERGING GLOBAL SHARES INDXX
BRAZIL INFRASTRUCTURE INDEX FUND
|
| Performance as of 3/31/2010 |
|
| | | | | |
| | Cumulative Return1
| | |
| | Fund
Net Asset Value | Fund
Market Price | INDXX Brazil
Infrastructure
Index | Gross
Expense Ratio | Net
Expense Ratio3 |
|
|
| Since Inception2 | 2.75% | 6.15% | 6.30% | 5.67% | 0.85% |
|
| 1 | Returns of less than one year are not annualized. |
| 2 | February 24, 2010. |
| 3 | This agreement will remain in effect and will be contractually binding for at least one year from the date of the Prospectus. |
Performance data quoted represents past performance. Investment return and principal value of an investment will fluctuate so that an investor’s shares, when sold or redeemed, may be worth more or less than the original cost. Current performance data may be higher or lower than actual data quoted. For the most current month-end performance data please visit www.egshares.com or call (888) 800-4347. This fund is new and has limited operating history. Market price returns are based on the midpoint of the bid/ask spread as of the scheduled close of regular trading on the New York Stock Exchange (“NYSE”) Arca, ordinarily 4:00 p.m. Eastern time, on each day during which the NYSE is open for trading, and do not represent the returns an investor would receive if shares were traded at other times.
|
| Growth of $10,000 Investment |
|
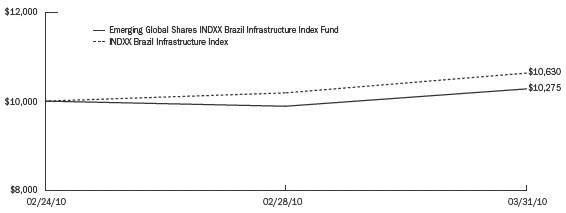
The chart above represents historical performance of a hypothetical investment of $10,000 over the life of the Fund. Past performance does not guarantee future results. The hypothetical example does not represent the returns of any particular investment.
EGA Emerging Global Shares Trust 13
Shareholder Expense Examples (Unaudited)
As a shareholder of EGA Emerging Global Shares Trust ETF, you incur advisory fees and other Fund expenses. The following example is intended to help you understand your ongoing costs (in dollars and cents) of investing in a Fund and to compare these costs with the ongoing costs of investing in other funds. The example is based on an investment of $1,000 invested at the beginning of the period and held throughout the entire period ended March 31, 2010.
Actual expenses
The first line under each Fund in the table below provides information about actual account values and actual expenses. You may use the information in this line, together with the amount you invested, to estimate the expenses that you paid over the period. Simply divide your account value by $1,000 (for example, an $8,600 account value divided by $1,000 = 8.6), then multiply the result by the number in the first line for your Fund under the heading entitled “Expenses Paid Through 3/31/2010” to estimate the expenses you paid on your account during this period.
Hypothetical example for comparison purposes
The second line under each Fund in the table provides information about hypothetical account values and hypothetical expenses based on each Fund’s actual expense ratio and an assumed rate of return of 5% per year before expenses, which is not the Fund’s actual return. The hypothetical account values and expenses may not be used to estimate the actual ending account balance or expenses you paid for the period. You may use this information to compare the ongoing costs of investing in your Fund and other funds. To do so, compare this 5% hypothetical example with the 5% hypothetical examples that appear in the shareholder reports of the other funds.
Please note that the expenses shown in the table are meant to highlight your ongoing costs only and do not reflect any transactional costs, such as brokerage commissions paid on purchases and sales of Fund shares. Therefore, the second line under each Fund in the table is useful in comparing ongoing Fund costs only and will not help you determine the relative total costs of owning different funds. In addition, if these transactional costs were included, your costs would have been higher.
14 EGA Emerging Global Shares Trust
Shareholder Expense Examples (Unaudited) (concluded)
| | | | | | | | | | | |
|
| | Beginning
Account
Value | Ending
Account
Value
3/31/2010 | Annualized
Expense Ratios
for the Period* | Expenses Paid
Through
3/31/2010 |
|
|
| Emerging Global Shares Dow Jones Emerging Markets | | | | | | | | | | | |
| Titans Composite Index Fund | | | | | | | | | | | |
| Actual | $ | 1,000.00 | | $ | 1,086.00 | | 0.75 | % | $ | 3.90 | ** |
| Hypothetical (5% return before expenses) | $ | 1,000.00 | | $ | 1,021.19 | | 0.75 | % | $ | 3.78 | ** |
|
| Emerging Global Shares Dow Jones Emerging Markets | | | | | | | | | | | |
| Energy Titans Index Fund | | | | | | | | | | | |
| Actual | $ | 1,000.00 | | $ | 1,108.26 | | 0.85 | % | $ | 4.47 | ** |
| Hypothetical (5% return before expenses) | $ | 1,000.00 | | $ | 1,020.69 | | 0.85 | % | $ | 4.28 | ** |
|
| Emerging Global Shares Dow Jones Emerging Markets | | | | | | | | | | | |
| Metals & Mining Titans Index Fund | | | | | | | | | | | |
| Actual | $ | 1,000.00 | | $ | 1,177.53 | | 0.85 | % | $ | 4.61 | ** |
| Hypothetical (5% return before expenses) | $ | 1,000.00 | | $ | 1,020.69 | | 0.85 | % | $ | 4.28 | ** |
|
| Emerging Global Shares Dow Jones Emerging Markets | | | | | | | | | | | |
| Financials Titans Index Fund | | | | | | | | | | | |
| Actual | $ | 1,000.00 | | $ | 1,117.60 | | 0.85 | % | $ | 4.49 | ** |
| Hypothetical (5% return before expenses) | $ | 1,000.00 | | $ | 1,020.69 | | 0.85 | % | $ | 4.28 | ** |
|
| Emerging Global Shares INDXX | | | | | | | | | | | |
| China Infrastructure Index Fund1 | | | | | | | | | | | |
| Actual | $ | 1,000.00 | | $ | 1,034.30 | | 0.85 | % | $ | 1.02 | † |
| Hypothetical (5% return before expenses) | $ | 1,000.00 | | $ | 1,020.69 | | 0.85 | % | $ | 4.28 | ** |
|
| Emerging Global Shares INDXX | | | | | | | | | | | |
| Brazil Infrastructure Index Fund2 | | | | | | | | | | | |
| Actual | $ | 1,000.00 | | $ | 1,027.50 | | 0.85 | % | $ | 0.85 | †† |
| Hypothetical (5% return before expenses) | $ | 1,000.00 | | $ | 1,020.69 | | 0.85 | % | $ | 4.28 | ** |
|
| * | Expense ratios reflect expense caps through the period ended March 31, 2010. |
| ** | Expenses are calculated using each Fund's annualized expense ratio, multiplied by the ending account value for the period, multiplied by 182/365 (to reflect the six-month period). |
| † | Expenses are calculated using the Fund's annualized expense ratio, multiplied by the ending account value for the period, multiplied by 43/365 (to reflect commencement of operations). |
| †† | Expenses are calculated using the Fund's annualized expense ratio, multiplied by the ending account value for the period, multiplied by 36/365 (to reflect commencement of operations). |
| 1 | Emerging Global Shares INDXX China Infrastructure Index Fund commenced operations on February 17, 2010. |
| 2 | Emerging Global Shares INDXX Brazil Infrastructure Index Fund commenced operations on February 24, 2010. |
EGA Emerging Global Shares Trust 15
Frequency Distribution of Premium and Discount (Unaudited)
The chart below presents information about differences between the per share net asset value (“NAV”) of each Fund and the market trading price of shares of each Fund. For these purposes, the “market price” is the midpoint of the highest bid and lowest offer for Fund shares as of the close of trading on the exchange where Fund shares are listed. The term “premium” is sometimes used to describe a market price in excess of NAV and the term “discount” is sometimes used to describe a market price below NAV. The chart presents information about the size and frequency of premiums or discounts. As with other exchange traded funds, the market price of Fund shares is typically slightly higher or lower than the Fund’s per share NAV. Factors that contribute to the differences between market price and NAV include the supply and demand for Fund shares and investors’ assessments of the underlying value of a Fund’s portfolio securities.
Differences between the closing times of U.S. and non-U.S. markets may contribute to differences between the NAV and market price of Fund shares. Many non-U.S. markets close prior to the close of the U.S. securities exchanges. Developments after the close of such markets as a result of ongoing price discovery may be reflected in a Fund’s market price but not in its NAV (or vice versa).
| | | | | | | | | | |
|
| | | | Market Price
Above or Equal to NAV | Market Price
Below NAV |
|
|
| | Basis Point
Differential | Number
of Days | % of
Total Days | Number
of Days | % of
Total Days |
|
|
Emerging Global Shares Dow Jones Emerging
Markets Titans Composite Index Fund | | | | | | | | | | |
| July 22, 2009–March 31, 2010 | | | | | | | | | | |
| | 0–24.9 | | 64 | | 36.4 | % | 23 | | 13.1 | % |
| | 25–49.9 | | 43 | | 24.4 | % | 4 | | 2.3 | % |
| | 50–74.9 | | 31 | | 17.6 | % | 2 | | 1.1 | % |
| | 75–100 | | 5 | | 2.8 | % | 0 | | 0.0 | % |
| | >100 | | 4 | | 2.3 | % | 0 | | 0.0 | % |
|
|
| Total | | | 147 | | 83.5 | % | 29 | | 16.5 | % |
|
|
|
Emerging Global Shares Dow Jones Emerging
Markets Energy Titans Index Fund | | | | | | | | | | |
| May 21, 2009–March 31, 2010 | | | | | | | | | | |
| | 0–24.9 | | 70 | | 32.1 | % | 36 | | 16.5 | % |
| | 25–49.9 | | 63 | | 28.9 | % | 12 | | 5.5 | % |
| | 50–74.9 | | 20 | | 9.2 | % | 5 | | 2.3 | % |
| | 75–100 | | 8 | | 3.6 | % | 2 | | 0.9 | % |
| | >100 | | 1 | | 0.5 | % | 1 | | 0.5 | % |
|
|
| Total | | | 162 | | 74.3 | % | 56 | | 25.7 | % |
|
|
|
Emerging Global Shares Dow Jones Emerging
Markets Metals & Mining Titans Index Fund | | | | | | | | | | |
| May 21, 2009–March 31, 2010 | | | | | | | | | | |
| | 0–24.9 | | 57 | | 26.1 | % | 28 | | 12.9 | % |
| | 25–49.9 | | 53 | | 24.3 | % | 16 | | 7.3 | % |
| | 50–74.9 | | 34 | | 15.6 | % | 4 | | 1.8 | % |
| | 75–100 | | 15 | | 6.9 | % | 0 | | 0.0 | % |
| | >100 | | 10 | | 4.6 | % | 1 | | 0.5 | % |
|
|
| Total | | | 169 | | 77.5 | % | 49 | | 22.5 | % |
|
|
|
Emerging Global Shares Dow Jones Emerging
Markets Financials Titans Index Fund | | | | | | | | | | |
| September 16, 2009–March 31, 2010 | | | | | | | | | | |
| | 0–24.9 | | 38 | | 28.0 | % | 23 | | 16.9 | % |
| | 25–49.9 | | 39 | | 28.7 | % | 8 | | 5.9 | % |
| | 50–74.9 | | 19 | | 14.0 | % | 2 | | 1.5 | % |
| | 75–100 | | 4 | | 2.9 | % | 1 | | 0.7 | % |
| | >100 | | 1 | | 0.7 | % | 1 | | 0.7 | % |
|
|
| Total | | | 101 | | 74.3 | % | 35 | | 25.7 | % |
|
|
|
16 EGA Emerging Global Shares Trust
Frequency Distribution of Premium and Discount (Unaudited) (concluded)
| | | | | | | | | | | |
|
| | | | | Market Price
Above or Equal to NAV | Market Price
Below NAV |
|
|
| | Basis Point
Differential | Number
of Days | % of
Total Days | Number
of Days | % of
Total Days |
| |
|
|
| Emerging Global Shares INDXX | | | | | | | | | | | |
| China Infrastructure Index Fund | | | | | | | | | | | |
| February 17, 2010–March 31, 2010 | | | | | | | | | | | |
| | | 0–24.9 | | 24 | | 77.4 | % | 3 | | 9.7 | % |
| | | 25–49.9 | | 4 | | 12.9 | % | 0 | | 0.0 | % |
| | | 50–74.9 | | 0 | | 0.0 | % | 0 | | 0.0 | % |
| | | 75–100 | | 0 | | 0.0 | % | 0 | | 0.0 | % |
| | | >100 | | 0 | | 0.0 | % | 0 | | 0.0 | % |
|
|
| Total | | | | 28 | | 90.3 | % | 3 | | 9.7 | % |
|
|
|
| Emerging Global Shares INDXX | | | | | | | | | | | |
| Brazil Infrastructure Index Fund | | | | | | | | | | | |
| February 24, 2010–March 31, 2010 | | | | | | | | | | | |
| | | 0–24.9 | | 0 | | 0.0 | % | 0 | | 0.0 | % |
| | | 25–49.9 | | 5 | | 19.2 | % | 0 | | 0.0 | % |
| | | 50–74.9 | | 18 | | 69.2 | % | 0 | | 0.0 | % |
| | | 75–100 | | 3 | | 11.6 | % | 0 | | 0.0 | % |
| | | >100 | | 0 | | 0.0 | % | 0 | | 0.0 | % |
|
|
| Total | | | | 26 | | 100.0 | % | 0 | | 0.0 | % |
|
|
|
Each line in the table shows the number of trading days in which the Fund traded within the premium/ discount range indicated. The number of trading days in each premium/discount range is also shown as a percentage of the total number of trading days in the period covered by each table. All data presented here represents past performance, which cannot be used to predict future results.
EGA Emerging Global Shares Trust 17
Schedule of InvestmentsEMERGING GLOBAL SHARES DOW JONES EMERGING MARKETSTITANS COMPOSITE INDEX FUNDMarch 31, 2010
| Investments | Shares | | | Value |
|
|
|
|
| COMMON STOCKS—76.5% | | | | |
| Brazil—2.3% | | | | |
| BRF - Brasil Foods SA* | 8,000 | | $ | 215,476 |
| Centrais Eletricas Brasileiras SA* | 6,500 | | | 95,786 |
| Companhia Siderurgica Nacional SA* | 18,200 | | | 361,410 |
| Diagnosticos da America SA* | 6,100 | | | 52,944 |
| | |
|
|
| Total Brazil | | | | 725,616 |
|
|
|
| Chile—0.8% | | | | |
| Empresa Nacional de Electricidad SA ADR | 2,829 | | | 132,934 |
| Empresas Copec SA | 232 | | | 3,471 |
| Enersis SA ADR | 6,383 | | | 127,596 |
| | |
|
|
| Total Chile | | | | 264,001 |
|
|
|
| China—22.9% | | | | |
| Baidu, Inc. ADR* | 381 | | | 227,457 |
| Bank of China, Ltd. Class H | 1,416,930 | | | 755,482 |
| China Communications | | | | |
| Construction Co., Ltd. Class H | 104,000 | | | 98,178 |
| China Construction Bank Corp. Class H | 1,324,350 | | | 1,084,764 |
| China Cosco Holdings Co., Ltd. Class H | 136,500 | | | 180,718 |
| China Life Insurance Co., Ltd. Class H | 182,000 | | | 871,946 |
| China Petroleum & Chemical Corp. Class H | 666,080 | | | 545,580 |
| China Railway Group, Ltd. Class H* | 104,000 | | | 75,006 |
| China Shenhua Energy Co., Ltd. Class H | 84,500 | | | 365,111 |
| China Telecom Corp., Ltd. Class H | 338,000 | | | 166,721 |
| Ctrip.com International, Ltd. ADR* | 3,094 | | | 121,285 |
| Dongfeng Motor Group Co., Ltd. Class H | 58,000 | | | 94,268 |
| Industrial and Commercial Bank of | | | | |
| China, Ltd. Class H | 2,430,980 | | | 1,853,438 |
| Mindray Medical International, Ltd. ADR | 2,039 | | | 74,260 |
| NetEase.com, Inc. ADR* | 1,411 | | | 50,048 |
| PetroChina Co., Ltd. Class H | 520,000 | | | 608,085 |
| Sina Corp. ADR* | 1,295 | | | 48,809 |
| Sohu.com, Inc.* | 779 | | | 42,533 |
| | |
|
|
| Total China | | | | 7,263,689 |
|
|
|
| Czech Republic—0.5% | | | | |
| CEZ AS | 3,449 | | | 163,092 |
|
|
|
|
| Egypt—0.3% | | | | |
| Orascom Construction Industries | 2,086 | | | 99,981 |
|
|
|
|
| Hungary—0.2% | | | | |
| Richter Gedeon Nyrt. | 327 | | | 70,764 |
|
|
|
|
| India—12.5% | | | | |
| Dr. Reddy’s Laboratories, Ltd. ADR | 2,354 | | | 66,453 |
| ICICI Bank, Ltd. ADR | 8,781 | | | 374,949 |
| Infosys Technologies, Ltd. ADR | 19,448 | | | 1,144,515 |
| Larsen & Toubro, Ltd. GDR | 17,893 | | | 648,442 |
| Ranbaxy Laboratories, Ltd. GDR* | 3,990 | | | 42,334 |
| Reliance Industries, Ltd. GDR 144A | 32,966 | | | 1,588,961 |
| Wipro, Ltd. ADR | 4,309 | | | 100,443 |
| | |
|
|
| Total India | | | | 3,966,097 |
|
|
|
| Indonesia—2.0% | | | | |
| Astra International Tbk PT | 52,000 | | | 239,442 |
| Perusahaan Gas Negara PT | 299,000 | | | 139,651 |
| Telekomunikasi Indonesia Tbk PT | 273,000 | | | 241,513 |
| | |
|
|
| Total Indonesia | | | | 620,606 |
|
|
|
| Malaysia—2.2% | | | | |
| Genting Berhad | 57,300 | | | 115,935 |
| Genting Malaysia Berhad | 75,300 | | | 66,251 |
| IOI Corp. Berhad | 151,193 | | | 249,825 |
| Sime Darby Berhad | 57,200 | | | 152,732 |
| Tenaga Nasional Berhad | 44,300 | | | 108,917 |
| | |
|
|
| Total Malaysia | | | | 693,660 |
|
|
|
| Mexico—8.6% | | | | |
| America Movil SAB de CV Series L | 388,000 | | | 980,605 |
| Carso Global Telecom SAB de CV* | 81,800 | | | 418,981 |
| Cemex SAB de CV Series CPO* | 196,100 | | | 201,903 |
| Fomento Economico Mexicano SAB de CV Series UB | 55,900 | | | 266,727 |
| Grupo Bimbo SAB de CV Series A | 15,600 | | | 139,733 |
| Grupo Televisa SA Series CPO | 62,400 | | | 264,480 |
| Telefonos de Mexico SAB de CV Series L | 136,900 | | | 107,518 |
| Wal-Mart de Mexico SAB de CV Series V | 68,800 | | | 353,622 |
| | |
|
|
| Total Mexico | | | | 2,733,569 |
|
|
|
| Poland—0.1% | | | | |
| Asseco Poland SA | 1,492 | | | 29,703 |
|
|
|
|
| Russia—13.8% | | | | |
| Gazprom OAO ADR | 72,778 | | | 1,697,911 |
| Lukoil OAO ADR | 9,839 | | | 557,871 |
| Mining and Metallurgical Company | | | | |
| Norilsk Nickel JSC ADR* | 22,596 | | | 415,992 |
| Mobile TeleSystems ADR | 4,301 | | | 238,706 |
| Polyus Gold ADR | 5,172 | | | 133,179 |
| Rosneft Oil Co. GDR | 62,583 | | | 496,283 |
| Surgutneftegaz ADR | 83,612 | | | 828,595 |
| | |
|
|
| Total Russia | | | | 4,368,537 |
|
|
|
| South Africa—10.3% | | | | |
| AngloGold Ashanti, Ltd. | 8,549 | | | 323,558 |
| Aspen Pharmacare Holdings, Ltd.* | 7,742 | | | 83,862 |
| Bidvest Group, Ltd.* | 7,610 | | | 141,186 |
| Gold Fields, Ltd. | 16,834 | | | 211,343 |
| Impala Platinum Holdings, Ltd. | 22,569 | | | 657,653 |
| MTN Group, Ltd. | 25,959 | | | 395,892 |
| Naspers, Ltd. N Shares | 6,715 | | | 289,394 |
| Netcare, Ltd.* | 29,980 | | | 53,886 |
| Remgro, Ltd. | 10,615 | | | 141,650 |
| Sasol, Ltd. | 10,997 | | | 453,315 |
| Standard Bank Group, Ltd. | 28,549 | | | 445,498 |
| Tiger Brands, Ltd.* | 3,501 | | | 87,430 |
| | |
|
|
| Total South Africa | | | | 3,284,667 |
|
|
|
| |
| TOTAL COMMON STOCKS (Cost $23,221,088) | | | | 24,283,982 |
|
|
|
| PREFERRED STOCKS—23.0% | | | | |
| Brazil—23.0% | | | | |
| Banco Bradesco SA | 43,380 | | | 791,423 |
| Companhia de Bebidas das Americas | 3,900 | | | 357,090 |
| Companhia Energetica de Minas Gerais | 9,100 | | | 149,959 |
| Gerdau SA* | 15,600 | | | 253,138 |
| Itausa - Investimentos Itau SA | 110,700 | | | 755,492 |
| Itau Unibanco Holding SA | 73,090 | | | 1,594,735 |
| Net Servicos de Comunicacao SA* | 5,400 | | | 69,592 |
| Petroleo Brasileiro SA | 76,500 | | | 1,510,539 |
| Tele Norte Leste Participacoes SA | 6,500 | | | 114,579 |
| Ultrapar Participacoes SA | 2,800 | | | 133,309 |
| Usinas Siderurgicas de Minas Gerais SA Class A | 6,500 | | | 223,004 |
| Vale SA Class A | 49,330 | | | 1,364,059 |
| | |
|
|
| |
| TOTAL PREFERRED STOCKS (Cost $6,925,634) | | | | 7,316,919 |
|
|
|
| TOTAL INVESTMENTS IN SECURITIES—99.5% | | | | |
| (Cost $30,146,722) | | | | 31,600,901 |
| Other Assets in Excess of Liabilities—0.5% | | | | 154,341 |
| | | |
|
|
| Net Assets—100.0% | | | $ | 31,755,242 |
|
|
|
| |
| * | Non–income producing security. |
| ADR | American Depositary Receipts. |
| GDR | Global Depositary Receipts. |
144A | Series 144A securities were purchased pursuant to Rule 144A under the Securities Act of 1933 and may not be resold subject to that rule except to qualified institutional buyers. Unless otherwise noted, Series 144A securities are deemed to be liquid. |
The accompanying notes are an integral part of these financial statements.
18 EGA Emerging Global Shares Trust
Schedule of InvestmentsEMERGING GLOBAL SHARES DOW JONES EMERGING MARKETSENERGY TITANS INDEX FUNDMarch 31, 2010
| | | | | |
| Investments | Shares | | Value |
|
|
|
|
|
| COMMON STOCKS—93.3% | | | | | |
| Argentina—0.6% | | | | | |
| Petrobras Energia SA Class B | 34,697 | | $ | 57,280 | |
|
| Chile—2.4% | | | | | |
| Empresas Copec SA | 15,260 | | | 228,282 | |
|
|
|
|
|
| China—14.4% | | | | | |
| China Oilfield Services, Ltd. Class H | 100,555 | | | 147,633 | |
| China Petroleum & Chemical Corp. Class H | 544,066 | | | 445,640 | |
| PetroChina Co., Ltd. Class H | 453,460 | | | 530,274 | |
| Suntech Power Holdings Co., Ltd. ADR* | 18,523 | | | 259,693 | |
| | |
|
|
|
| Total China | | | | 1,383,240 | |
|
|
|
|
| Colombia—4.2% | | | | | |
| Ecopetrol SA ADR | 14,310 | | | 405,402 | |
|
|
|
|
|
| Hungary—4.4% | | | | | |
| MOL Hungarian Oil And Gas Nyrt.* | 4,115 | | | 421,152 | |
|
|
|
|
|
| India—9.5% | | | | | |
| Reliance Industries, Ltd. GDR 144A | 19,014 | | | 916,475 | |
|
|
|
|
|
| Poland—6.5% | | | | | |
| Polski Koncern Naftowy Orlen SA* | 29,056 | | | 395,140 | |
| Polskie Gornictwo Naftowe I Gazownictwo SA | 177,777 | | | 228,055 | |
| | |
|
|
|
| Total Poland | | | | 623,195 | |
|
|
|
|
| Russia—34.1% | | | | | |
| Gazprom OAO ADR | 30,272 | | | 706,246 | |
| Lukoil OAO ADR | 8,973 | | | 508,769 | |
| NovaTek OAO GDR | 6,086 | | | 443,061 | |
| Rosneft Oil Co. GDR | 51,206 | | | 406,064 | |
| Surgutneftegaz ADR | 81,628 | | | 808,932 | |
| Tatneft ADR | 13,070 | | | 409,091 | |
| | |
|
|
|
| Total Russia | | | | 3,282,163 | |
|
|
|
|
| South Africa—4.5% | | | | | |
| Sasol, Ltd. | 10,413 | | | 429,241 | |
|
| Thailand—10.6% | | | | | |
| PTT Aromatics & Refining PCL | 143,828 | | | 127,882 | |
| PTT Exploration and Production PCL | 69,465 | | | 319,021 | |
| PTT PCL | 49,889 | | | 404,234 | |
| Thai Oil PCL | 107,946 | | | 166,918 | |
| | |
|
|
| Total Thailand | | | | 1,018,055 | |
|
|
|
| Turkey—2.1% | | | | | |
| Tupras-Turkiye Petrol Rafinerileri AS | 8,930 | | | 202,395 | |
|
|
|
|
| TOTAL COMMON STOCKS (Cost $7,918,309) | | | | 8,966,880 | |
|
|
|
| PREFERRED STOCK—6.9% | | | | | |
| Brazil—6.9% | | | | | |
| Petroleo Brasileiro SA | | | | | |
| (Cost $601,385) | 33,630 | | | 664,045 | |
|
|
|
|
| TOTAL INVESTMENTS IN SECURITIES—100.2% | | | | | |
| (Cost $8,519,694) | | | | 9,630,925 | |
| Liabilities in Excess of Other Assets—(0.2)% | | | | (23,704 | ) |
| | | |
|
|
| Net Assets—100.0% | | | $ | 9,607,221 | |
|
|
|
| |
| * | Non–income producing security. |
| ADR | American Depositary Receipts |
| GDR | Global Depositary Receipts. |
144A | Series 144A securities were purchased pursuant to Rule 144A under the Securities Act of 1933 and may not be resold subject to that rule except to qualified institutional buyers. Unless otherwise noted, Series 144A securities are deemed to be liquid. |
The accompanying notes are an integral part of these financial statements.
EGA Emerging Global Shares Trust 19
Schedule of InvestmentsEMERGING GLOBAL SHARES DOW JONES EMERGING MARKETSMETALS & MINING TITANS INDEX FUNDMarch 31, 2010
| | | | | |
| Investments | Shares | | Value |
|
| COMMON STOCKS—79.3% | | | | | |
| Brazil—5.8% | | | | | |
| Companhia Siderurgica Nacional SA* | 80,780 | | $ | 1,604,103 | |
|
| China—19.4% | | | | | |
| Aluminum Corp of China, Ltd. Class H* | 717,264 | | | 740,847 | |
| Angang Steel Co., Ltd. Class H | 233,242 | | | 427,752 | |
| China Coal Energy Co. Class H | 632,267 | | | 986,912 | |
| China Shenhua Energy Co., Ltd. Class H | 367,519 | | | 1,587,990 | |
| Jiangxi Copper Co., Ltd. Class H | 268,641 | | | 606,844 | |
| Yanzhou Coal Mining Co., Ltd. Class H | 417,920 | | | 1,005,415 | |
| | | |
|
|
| Total China | | | | 5,355,760 | |
|
|
|
| India—4.2% | | | | | |
| Sterlite Industries, Ltd. ADR | 62,984 | | | 1,172,132 | |
|
| Indonesia—3.6% | | | | | |
| Bumi Resources Tbk PT | 3,969,590 | | | 981,546 | |
|
| Mexico—5.8% | | | | | |
| Grupo Mexico SAB de CV Series B | 596,725 | | | 1,609,309 | |
|
| Russia—16.1% | | | | | |
| Mining and Metallurgical Company Norilsk | | | | | |
| Nickel JSC ADR* | 120,780 | | | 2,223,560 | |
| Novolipetsk Steel GDR* | 19,951 | | | 691,302 | |
| Polyus Gold ADR | 35,993 | | | 926,820 | |
| Severstal GDR* | 41,889 | | | 609,904 | |
| | | |
|
|
| Total Russia | | | | 4,451,586 | |
|
|
|
| South Africa—23.2% | | | | | |
| Anglo Platinum, Ltd.* | 14,307 | | | 1,441,619 | |
| AngloGold Ashanti, Ltd. | 33,389 | | | 1,263,690 | |
| ArcelorMittal South Africa, Ltd.* | 61,538 | | | 775,599 | |
| Gold Fields, Ltd. | 69,959 | | | 878,304 | |
| Impala Platinum Holdings, Ltd. | 70,223 | | | 2,046,272 | |
| | | |
|
|
| Total South Africa | | | | 6,405,484 | |
|
|
|
| Turkey—1.2% | | | | | |
| Eregli Demir ve Celik Fabrikalari TAS* | 113,774 | | | 340,829 | |
|
| TOTAL COMMON STOCKS (Cost $19,490,578) | | | | 21,920,749 | |
|
|
|
| PREFERRED STOCKS—20.7% | | | | | |
| Brazil—20.7% | | | | | |
| Gerdau SA* | 71,140 | | | 1,154,376 | |
| Metalurgica Gerdau SA* | 36,519 | | | 737,665 | |
| Usinas Siderurgicas de Minas Gerais SA Class A* | 40,604 | | | 1,393,054 | |
| Vale SA Class A | 88,299 | | | 2,441,617 | |
| | | |
|
|
| TOTAL PREFERRED STOCKS (Cost $4,658,229) | | | | 5,726,712 | |
|
|
|
| TOTAL INVESTMENTS IN SECURITIES—100.0% | | | | | |
| (Cost $24,148,807) | | | | 27,647,461 | |
| Liabilities in Excess of Other Assets—(0.0)%† | | | | (7,318 | ) |
| | | |
|
|
| Net Assets—100.0% | | | $ | 27,640,143 | |
|
|
|
| |
| * | Non–income producing security. |
| † | Less than (0.05)% |
| ADR | American Depositary Receipts. |
GDR | Global Depositary Receipts. |
The accompanying notes are an integral part of these financial statements.
20 EGA Emerging Global Shares Trust
Schedule of InvestmentsEMERGING GLOBAL SHARES DOW JONES EMERGING MARKETSFINANCIALS TITANS INDEX FUNDMarch 31, 2010
| | | | | |
| Investments | Shares | | Value |
|
|
|
|
|
| COMMON STOCKS—86.8% | | | | | |
| Brazil—3.0% | | | | | |
| Banco do Brasil SA | 12,300 | | $ | 204,966 | |
|
| China—36.5% | | | | | |
| Bank of China, Ltd. Class H | 707,890 | | | 377,434 | |
| Bank of Communications Co., Ltd. Class H | 102,000 | | | 121,511 | |
| China Construction Bank Corp. Class H | 555,100 | | | 454,678 | |
| China Life Insurance Co., Ltd. Class H | 99,960 | | | 478,899 | |
| China Merchants Bank Co., Ltd. Class H | 76,275 | | | 206,289 | |
| Industrial & Commercial Bank of China, Ltd. Class H | 838,240 | | | 639,096 | |
| Ping An Insurance Group Co. of China, Ltd. Class H | 25,500 | | | 219,706 | |
| | |
|
|
|
| Total China | | | | 2,497,613 | |
|
|
|
|
| Hungary—3.0% | | | | | |
| OTP Bank Nyrt.* | 5,917 | | | 207,011 | |
|
|
|
|
|
| India—13.7% | | | | | |
| ICICI Bank, Ltd. ADR | 15,025 | | | 641,568 | |
| State Bank of India GDR | 3,128 | | | 294,032 | |
| | |
|
|
|
| Total India | | | | 935,600 | |
|
|
|
|
| Malaysia—6.5% | | | | | |
| CIMB Group Holdings Berhad | 44,200 | | | 190,513 | |
| Malayan Banking Berhad | 54,700 | | | 125,263 | |
| Public Bank Berhad | 35,920 | | | 128,177 | |
| | |
|
|
|
| Total Malaysia | | | | 443,953 | |
|
|
|
|
| Poland—4.8% | | | | | |
| Bank Pekao SA | 2,181 | | | 126,896 | |
| Powszechna Kasa Oszczednosci Bank Polski SA | 14,549 | | | 203,719 | |
| | |
|
|
|
| Total Poland | | | | 330,615 | |
|
|
|
|
| South Africa—12.7% | | | | | |
| ABSA Group, Ltd. | 10,828 | | | 209,809 | |
| FirstRand, Ltd. | 47,749 | | | 131,337 | |
| Sanlam, Ltd. | 72,685 | | | 246,145 | |
| Standard Bank Group, Ltd. | 18,269 | | | 285,082 | |
| | |
|
|
|
| Total South Africa | | | | 872,373 | |
|
|
|
| Turkey—6.6% | | | | | |
| Akbank TAS | 15,409 | | | 99,204 | |
| Turkiye Garanti Bankasi AS | 47,394 | | | 221,060 | |
| Turkiye Is Bankasi Class C | 28,746 | | | 93,289 | |
| Turkiye Is Bankasi * | 13,257 | | | 41,456 | |
| | |
|
|
|
| Total Turkey | | | | 455,009 | |
|
|
|
| TOTAL COMMON STOCKS (Cost $5,398,550) | | | | 5,947,140 | |
|
|
|
| PREFERRED STOCKS—13.3% | | | | | |
| Brazil—13.3% | | | | | |
| Banco Bradesco SA | 24,480 | | | 446,612 | |
| Itausa - Investimentos Itau SA | 24,490 | | | 167,136 | |
| Itau Unibanco Holding SA | 13,610 | | | 296,954 | |
| | |
|
|
|
| TOTAL PREFERRED STOCKS (Cost $806,317) | | | | 910,702 | |
|
|
|
| TOTAL INVESTMENTS IN SECURITIES—100.1% | | | | | |
| (Cost $6,204,867) | | | | 6,857,842 | |
| Liabilities in Excess of Other Assets—(0.1)% | | | | (5,752 | ) |
| | |
|
|
|
| Net Assets—100.0% | | | $ | 6,852,090 | |
|
|
|
| |
| * | Non–income producing security. |
| ADR | American Depositary Receipts. |
GDR | Global Depositary Receipts. |
The accompanying notes are an integral part of these financial statements.
EGA Emerging Global Shares Trust 21
Schedule of InvestmentsEMERGING GLOBAL SHARES INDXXCHINA INFRASTRUCTURE INDEX FUNDMarch 31, 2010
| | | | |
| Investments | Shares | | Value |
|
|
|
|
| COMMON STOCKS—98.9% | | | | |
| Construction & Engineering—13.6% | | | | |
| China Communications Construction Co., Ltd. | | | | |
| Class H | 296,000 | | $ | 279,429 |
| China Railway Construction Corp., Ltd. Class H | 241,000 | | | 297,033 |
| China Railway Group, Ltd. Class H* | 374,000 | | | 269,734 |
| | |
|
|
| Total Construction & Engineering | | | | 846,196 |
|
|
|
| Construction Materials—5.7% | | | | |
| China National Building Material Co., Ltd. Class H | 127,600 | | | 247,158 |
| China Shanshui Cement Group | 198,000 | | | 110,670 |
| | |
|
|
| Total Construction Materials | | | | 357,828 |
|
|
|
| Diversified Telecommunication Services—7.4% | | | | |
| China Communication Services Corp., Ltd. Class H | 300,000 | | | 150,682 |
| China Telecom Corp., Ltd. Class H | 627,600 | | | 309,569 |
| | |
|
|
| Total Diversified Telecommunication Services | | | | 460,251 |
|
|
|
| Electrical Equipment—13.8% | | | | |
| China High Speed Transmission Equipment | | | | |
| Group Co., Ltd. | 102,000 | | | 225,420 |
| Shanghai Electric Group Co. Ltd. Class H | 360,000 | | | 175,255 |
| Suntech Power Holdings Co., Ltd. ADR* | 20,578 | | | 288,504 |
| Yingli Green Energy Holding Co., Ltd. ADR* | 13,732 | | | 174,946 |
| | |
|
|
| Total Electrical Equipment | | | | 864,125 |
|
|
|
| Independent Power Producers & Energy Traders—8.1% | | | | |
| Datang International Power | | | | |
| Generation Co., Ltd. Class H | 520,000 | | | 235,734 |
| Huaneng Power International, Inc. Class H | 460,000 | | | 267,184 |
| | |
|
|
| Total Independent Power Producers & Energy Traders | | | | 502,918 |
|
|
|
| Machinery—1.7% | | | | |
| China National Materials Co., Ltd. Class H | 162,000 | | | 107,865 |
|
|
|
|
| Metals & Mining—21.2% | | | | |
| Aluminum Corp. of China, Ltd. Class H* | 288,000 | | $ | 297,469 |
| Angang Steel Co., Ltd. Class H | 132,000 | | | 242,080 |
| China Molybdenum Co., Ltd. Class H | 150,000 | | | 125,568 |
| Fosun International | 175,000 | | | 139,960 |
| Hidili Industry International Development, Ltd.* | 114,000 | | | 124,061 |
| Hunan Non-Ferrous Metal Corp., Ltd. Class H* | 204,000 | | | 82,496 |
| Jiangxi Copper Co., Ltd. Class H | 138,000 | | | 311,734 |
| | |
|
|
| Total Metals & Mining | | | | 1,323,368 |
|
|
|
| Real Estate Management & Development—22.7% | | | | |
| Agile Property Holdings, Ltd. | 226,400 | | | 309,071 |
| Country Garden Holdings Co. | 607,500 | | | 218,286 |
| E-House China Holdings, Ltd. ADS* | 4,822 | | | 91,763 |
| Guangzhou R&F Properties Co., Ltd. Class H | 157,200 | | | 257,522 |
| Renhe Commercial Holdings | 664,000 | | | 153,927 |
| Shui On Land, Ltd. | 428,000 | | | 218,831 |
| Soho China, Ltd. | 290,000 | | | 164,333 |
| | |
|
|
| Total Real Estate Management & Development | | | | 1,413,733 |
|
|
|
| Transportation Infrastructure—4.7% | | | | |
| Beijing Capital International Airport Co., Ltd. Class H* | 240,000 | | | 143,418 |
| Jiangsu Expressway Co., Ltd. Class H | 156,000 | | | 147,266 |
| | |
|
|
| Total Transportation Infrastructure | | | | 290,684 |
|
|
|
| TOTAL INVESTMENTS IN SECURITIES—98.9% | | | | |
| (Cost $6,013,193) | | | | 6,166,968 |
| Other Assets in Excess of Liabilities—1.1% | | | | 67,985 |
| | | |
|
|
| Net Assets—100.0% | | | $ | 6,234,953 |
|
|
|
| |
| * | Non–income producing security. |
| ADR | American Depositary Receipts. |
ADS | American Depositary Shares. |
The accompanying notes are an integral part of these financial statements.
22 EGA Emerging Global Shares Trust
Schedule of InvestmentsEMERGING GLOBAL SHARES INDXXBRAZIL INFRASTRUCTURE INDEX FUNDMarch 31, 2010
| | | | |
| Investments | Shares | | Value |
|
|
|
|
| COMMON STOCKS—68.5% | | | | |
| Aerospace & Defense—4.5% | | | | |
| Empresa Brasileira de Aeronautica SA* | 86,700 | | $ | 512,515 |
|
| Air Freight & Logistics—0.4% | | | | |
| Log-in Logistica Intermodal SA | 10,900 | | | 50,142 |
|
|
|
|
| Construction Materials—1.4% | | | | |
| Magnesita Refratarios SA* | 19,800 | | | 157,539 |
|
|
|
|
| Electric Utilities—10.2% | | | | |
| Centrais Eletricas Brasileiras SA* | 31,900 | | | 470,090 |
| Companhia Energetica de Minas Gerais | 25,200 | | | 324,760 |
| CPFL Energia SA | 17,600 | | | 351,961 |
| | |
|
|
| Total Electric Utilities | | | | 1,146,811 |
|
|
|
| Independent Power Producers & Energy Traders—3.9% | | | | |
| Tractebel Energia SA | 39,500 | | | 439,332 |
|
|
|
|
| Machinery—5.6% | | | | |
| Lupatech SA* | 5,400 | | | 72,557 |
| Weg SA | 52,700 | | | 563,999 |
| | |
|
|
| Total Machinery | | | | 636,556 |
|
|
|
| Metals & Mining—16.9% | | | | |
| Companhia Siderurgica Nacional SA* | 32,500 | | | 645,375 |
| Gerdau SA | 48,100 | | | 588,617 |
| Vale SA | 21,100 | | | 671,767 |
| | |
|
|
| Total Metals & Mining | | | | 1,905,759 |
|
|
|
| Real Estate Management & Development—1.6% | | | | |
| BR Malls Participacoes SA* | 15,400 | | | 181,207 |
|
|
|
|
| Road & Rail—1.4% | | | | |
| Localiza Rent a Car SA | 15,400 | | | 161,360 |
|
|
|
|
| Transportation Infrastructure—10.3% | | | | |
| Companhia de Concessoes Rodoviarias | 28,700 | | | 625,395 |
| LLX Logistica SA* | 93,000 | | | 438,242 |
| Obrascon Huarte Lain Brasil SA | 4,400 | | | 100,983 |
| | |
|
|
| Total Transportation Infrastructure | | | | 1,164,620 |
|
|
|
| Water Utilities—4.8% | | | | |
| Companhia de Saneamento Basico | | | | |
| do Estado de Sao Paulo* | 22,000 | | | 397,545 |
| Companhia de Saneamento de Minas Gerais* | 9,900 | | | 140,898 |
| | |
|
|
| Total Water Utilities | | | | 538,443 |
|
|
|
| Wireless Telecommunication Services—7.5% | | | | |
| Tim Participacoes SA* | 78,800 | | | 308,630 |
| Vivo Participacoes SA ADR | 19,990 | | | 541,929 |
| | | |
|
|
| Total Wireless Telecommunication Services | | | | 850,559 |
|
|
|
| TOTAL COMMON STOCKS (Cost $7,816,509) | | | | 7,744,843 |
|
|
|
| PREFERRED STOCKS—31.1% | | | | |
| Diversified Telecommunication Services—9.4% | | | | |
| Brasil Telecom SA* | 56,800 | | | 363,772 |
| Telesp - Telecomunicacoes de Sao Paulo SA | 12,100 | | | 261,906 |
| Telemar Norte Leste SA Class A | 15,400 | | | 435,328 |
| | | |
|
|
| Total Diversified Telecommunication Services | | | | 1,061,006 |
|
|
|
| Gas Utilities—2.7% | | | | |
| Companhia de Gas de Sao Paulo Class A | 15,400 | | | 310,554 |
|
| Independent Power Producers & Energy Traders—7.7% | | | | |
| AES Tiete SA | 43,400 | | | 472,252 |
| CESP - Companhia Energetica de Sao Paulo Class B* | 29,100 | | | 395,403 |
| | | |
|
|
| Total Independent Power Producers & Energy Traders | | | | 867,655 |
|
|
|
| Machinery—1.3% | | | | |
| Randon SA Implementos e Participacoes | 18,700 | | | 144,281 |
|
| Media—4.9% | | | | |
| Net Servicos de Comunicacao SA* | 42,800 | | | 551,577 |
|
| Oil, Gas & Consumable Fuels—5.1% | | | | |
| Ultrapar Participacoes SA | 12,100 | | | 576,084 |
|
| TOTAL PREFERRED STOCKS (Cost $3,647,953) | | | | 3,511,157 |
|
|
|
| RIGHTS—0.0%† | | | | |
| Gas Utilities—0.0%† | | | | |
| Companhia de Gas de Sao Paulo | | | | |
| (Cost $0) | 89 | | | 57 |
|
| TOTAL INVESTMENTS IN SECURITIES—99.6% | | | | |
| (Cost $11,464,462) | | | | 11,256,057 |
| Other Assets in Excess of Liabilities—0.4% | | | | 46,679 |
| | | |
|
|
| Net Assets—100.0% | | | $ | 11,302,736 |
|
|
|
| |
| * | Non–income producing security. |
| † | Less than 0.05% |
ADR | American Depositary Receipts. |
The accompanying notes are an integral part of these financial statements.
EGA Emerging Global Shares Trust 23
Statements of Assets and Liabilities
EGA EMERGING GLOBAL SHARES TRUST
March 31, 2010
| | | | | | | | | | | | | | | | | | |
|
|
| | Emerging Global
Shares Dow Jones
Emerging Markets
Titans Composite
Index Fund | Emerging Global
Shares Dow Jones
Emerging Markets
Energy Titans
Index Fund | Emerging Global
Shares Dow Jones
Emerging Markets
Metals & Mining
Titans Index Fund | Emerging Global
Shares Dow Jones
Emerging Markets
Financials Titans
Index Fund | Emerging Global
Shares INDXX
China
Infrastructure
Index Fund | Emerging Global
Shares INDXX
Brazil
Infrastructure
Index Fund |
|
|
| ASSETS: | | | | | | | | | | | | | | | | | | |
| Cost of Investments: | $ | 30,146,722 | | $ | 8,519,694 | | $ | 24,148,807 | | $ | 6,204,867 | | $ | 6,013,193 | | $ | 11,464,462 | |
|
| Investments at value | | 31,600,901 | | | 9,630,925 | | | 27,647,461 | | | 6,857,842 | | | 6,166,968 | | | 11,256,057 | |
| Cash | | 89,422 | | | — | | | — | | | 32,727 | | | 44,928 | | | — | |
| Foreign cash* | | 117 | | | — | | | 1,577 | | | 1,621 | | | — | | | — | |
| Restricted foreign cash†* | | — | | | 24,483 | | | — | | | — | | | — | | | — | |
| Receivables: | | | | | | | | | | | | | | | | | | |
| Due from sub-adviser | | 72,975 | | | 8,887 | | | 26,631 | | | — | | | 23,058 | | | 23,681 | |
| Due from custodian (Note 9) | | 70,996 | | | — | | | — | | | — | | | — | | | — | |
| Dividend and interest | | 41,613 | | | 21,388 | | | 11,053 | | | 9,728 | | | — | | | 13,362 | |
| Prepaid organization expenses | | 20,497 | | | 10,905 | | | 10,905 | | | 23,528 | | | 19,018 | | | 19,430 | |
| Investment securities sold | | — | | | — | | | 109,634 | | | — | | | — | | | 45,649 | |
| Other assets | | 5,962 | | | 4,933 | | | 5,576 | | | 4,824 | | | 3,767 | | | 3,767 | |
|
| Total Assets | | 31,902,483 | | | 9,701,521 | | | 27,812,837 | | | 6,930,270 | | | 6,257,739 | | | 11,361,946 | |
|
| |
| LIABILITIES: | | | | | | | | | | | | | | | | | | |
| Payables: | | | | | | | | | | | | | | | | | | |
Investment securities purchased
(Note 9) | | 70,996 | | | — | | | — | | | — | | | — | | | — | |
| Accrued investment advisory fees | | 13,530 | | | 4,413 | | | 12,774 | | | 3,113 | | | 1,421 | | | 991 | |
| Accrued sub-advisory fees | | — | | | — | | | — | | | 38,958 | | | — | | | — | |
| Due to custodian | | — | | | 42,831 | | | 105,829 | | | — | | | — | | | 37,343 | |
Accrued expenses and other
liabilities | | 62,715 | | | 47,056 | | | 54,091 | | | 36,109 | | | 21,365 | | | 20,876 | |
|
| Total Liabilities | | 147,241 | | | 94,300 | | | 172,694 | | | 78,180 | | | 22,786 | | | 59,210 | |
|
| NET ASSETS | $ | 31,755,242 | | $ | 9,607,221 | | $ | 27,640,143 | | $ | 6,852,090 | | $ | 6,234,953 | | $ | 11,302,736 | |
|
| |
| NET ASSETS: | | | | | | | | | | | | | | | | | | |
| Paid-in capital | $ | 30,436,841 | | $ | 8,606,203 | | $ | 24,267,306 | | $ | 6,159,649 | | $ | 6,081,314 | | $ | 11,558,230 | |
| Accumulated net investment loss | | (37,780 | ) | | (45,185 | ) | | (60,092 | ) | | (3,195 | ) | | (136 | ) | | (44,840 | ) |
Undistributed (accumulated) net
realized gain (loss) on
investments and foreign | | | | | | | | | | | | | | | | | | |
| currency transactions | | (99,257 | ) | | (64,808 | ) | | (65,652 | ) | | 42,577 | | | — | | | (2,792 | ) |
| Net unrealized appreciation | | | | | | | | | | | | | | | | | | |
| (depreciation) on investments | | | | | | | | | | | | | | | | | | |
and on foreign currency
translations | | 1,455,438 | | | 1,111,011 | | | 3,498,581 | | | 653,059 | | | 153,775 | | | (207,862 | ) |
|
| NET ASSETS | $ | 31,755,242 | | $ | 9,607,221 | | $ | 27,640,143 | | $ | 6,852,090 | | $ | 6,234,953 | | $ | 11,302,736 | |
|
| Outstanding beneficial interest | | | | | | | | | | | | | | | | | | |
| shares (unlimited shares of | | | | | | | | | | | | | | | | | | |
| beneficial interest authorized, | | | | | | | | | | | | | | | | | | |
| no par value) | | 652,500 | | | 200,000 | | | 450,000 | | | 150,000 | | | 300,000 | | | 550,000 | |
|
| Net asset value per share | $ | 48.67 | | $ | 48.04 | | $ | 61.42 | | $ | 45.68 | | $ | 20.78 | | $ | 20.55 | |
|
| |
| * Cost of foreign cash: | | $122 | | | $21,963 | | | $1,574 | | | $1,618 | | | $ — | | | $ — | |
| |
| †* Restricted foreign cash represents deposits being held by custodian as collateral for Argentine currency contracts. |
The accompanying notes are an integral part of these financial statements.
24 EGA Emerging Global Shares Trust
Statements of Operations
EGA EMERGING GLOBAL SHARES TRUST
|
|
| Emerging Global
Shares Dow Jones
Emerging Markets
Titans Composite
Index Fund | Emerging Global
Shares Dow Jones
Emerging Markets
Energy Titans
Index Fund | Emerging Global
Shares Dow Jones
Emerging Markets
Metals & Mining
Titans Index Fund | Emerging Global
Shares Dow Jones
Emerging Markets
Financials Titans
Index Fund | Emerging Global
Shares INDXX
China
Infrastructure
Index Fund | Emerging Global
Shares INDXX
Brazil
Infrastructure
Index Fund |
|
|
| For the Period | For the Period | For the Period | For the Period | For the Period | For the Period |
| July 22, 20091 | May 21, 20091 | May 21, 20091 | September 16, 20091 | February 17, 20101 | February 24, 20101 |
| Through | Through | Through | Through | Through | Through |
| March 31, 2010 | March 31, 2010 | March 31, 2010 | March 31, 2010 | March 31, 2010 | March 31, 2010 |
|
|
| INVESTMENT INCOME: | | | | | | | | | | | | | | | | | | |
| Dividend income* | $ | 143,719 | | $ | 84,357 | | $ | 77,248 | | $ | 41,176 | | $ | — | | $ | 16,582 | |
|
|
| EXPENSES: | | | | | | | | | | | | | | | | | | |
| Investment advisory fees | | 107,823 | | | 94,176 | | | 114,749 | | | 26,727 | | | 2,840 | | | 1,982 | |
| Sub-Advisory fees | | 84,640 | | | 53,592 | | | 83,382 | | | 23,100 | | | 4,237 | | | 5,805 | |
| Organization and offering fees | | 45,711 | | | 67,138 | | | 67,138 | | | 27,287 | | | 2,473 | | | 2,061 | |
| Legal fees | | 24,500 | | | 22,900 | | | 26,494 | | | 6,820 | | | 512 | | | 357 | |
| Custody fees | | 24,300 | | | 10,190 | | | 5,391 | | | 3,664 | | | 1,690 | | | 1,087 | |
| Licensing fees | | 23,665 | | | 35,701 | | | 37,318 | | | 10,905 | | | 510 | | | 692 | |
Administration and
accounting fees | | 18,750 | | | 27,084 | | | 27,084 | | | 10,416 | | | — | | | — | |
| Shareholder reporting fees | | 15,100 | | | 10,500 | | | 15,500 | | | 5,505 | | | 553 | | | 387 | |
| Audit and tax fees | | 13,000 | | | 13,000 | | | 13,000 | | | 13,000 | | | 13,000 | | | 13,000 | |
| Transfer agent fees | | 9,000 | | | 11,000 | | | 11,000 | | | 7,000 | | | 2,000 | | | 2,000 | |
| Pricing fees | | 7,879 | | | 11,074 | | | 10,902 | | | 8,101 | | | 2,140 | | | 2,140 | |
| Exchange listing fees | | 4,643 | | | 4,583 | | | 4,866 | | | 3,503 | | | 8,089 | | | 7,993 | |
| Insurance fees | | 4,376 | | | 8,656 | | | 8,159 | | | 1,256 | | | 833 | | | 833 | |
| Trustees’ fees and expenses | | 3,700 | | | 2,360 | | | 3,013 | | | 1,428 | | | 128 | | | 380 | |
| Miscellaneous fees | | — | | | — | | | 255 | | | — | | | — | | | — | |
|
|
|
Total expenses before
reimbursements/waivers | | 387,087 | | | 371,954 | | | 428,251 | | | 148,712 | | | 39,005 | | | 38,717 | |
|
|
|
| Less: Reimbursements/waivers | | | | | | | | | | | | | | | | | | |
| of expenses from sub-adviser | | (302,447 | ) | | (318,362 | ) | | (344,869 | ) | | (125,612 | ) | | (34,768 | ) | | (32,912 | ) |
|
|
|
| Net expenses | | 84,640 | | | 53,592 | | | 83,382 | | | 23,100 | | | 4,237 | | | 5,805 | |
|
|
|
| Net investment income (loss) | | 59,079 | | | 30,765 | | | (6,134 | ) | | 18,076 | | | (4,237 | ) | | 10,777 | |
|
|
|
|
REALIZED AND
UNREALIZED GAIN (LOSS)
ON INVESTMENTS AND
FOREIGN CURRENCY
TRANSACTIONS: | | | | | | | | | | | | | | | | | | |
| Net realized gain (loss) on: | | | | | | | | | | | | | | | | | | |
| Investments | | (99,257 | ) | | (40,976 | ) | | (65,652 | ) | | 43,831 | | | 3,967 | | | (2,792 | ) |
| Foreign currency transactions | | (56,630 | ) | | (57,930 | ) | | (2,067 | ) | | (13,775 | ) | | (136 | ) | | (55,617 | ) |
| Net increase from payments by | | | | | | | | | | | | | | | | | | |
| affiliates and net losses | | | | | | | | | | | | | | | | | | |
| realized on trading error | | | | | | | | | | | | | | | | | | |
| (Note 8) | | — | | | (23,832 | ) | | — | | | — | | | — | | | — | |
|
|
|
| Net realized gain (loss) | | (155,887 | ) | | (122,738 | ) | | (67,719 | ) | | 30,056 | | | 3,831 | | | (58,409 | ) |
|
|
|
Net unrealized appreciation
(depreciation) on: | | | | | | | | | | | | | | | | | | |
| Investments | | 1,454,179 | | | 1,111,231 | | | 3,498,654 | | | 652,975 | | | 153,775 | | | (208,405 | ) |
| Foreign currency translations | | 1,259 | | | (220 | ) | | (73 | ) | | 84 | | | — | | | 543 | |
|
|
|
Net unrealized appreciation
(depreciation) | | 1,455,438 | | | 1,111,011 | | | 3,498,581 | | | 653,059 | | | 153,775 | | | (207,862 | ) |
|
|
|
| Net realized and unrealized | | | | | | | | | | | | | | | | | | |
| gain (loss) on investments | | | | | | | | | | | | | | | | | | |
and foreign currency
transactions | | 1,299,551 | | | 988,273 | | | 3,430,862 | | | 683,115 | | | 157,606 | | | (266,271 | ) |
|
|
|
| NET INCREASE (DECREASE) | | | | | | | | | | | | | | | | | | |
| IN NET ASSETS RESULTING | | | | | | | | | | | | | | | | | | |
| FROM OPERATIONS | $ | 1,358,630 | | $ | 1,019,038 | | $ | 3,424,728 | | $ | 701,191 | | $ | 153,369 | | $ | (255,494 | ) |
|
|
| * Net of foreign taxes withheld of: | | $2,372 | | | $6,348 | | | $2,174 | | | $796 | | | $ — | | | $ — | |
| 1 Commencement of operations. | | | | | | | | | | | | | | | | | | |
The accompanying notes are an integral part of these financial statements.
EGA Emerging Global Shares Trust 25
Statements of Changes in Net Assets
EGA EMERGING GLOBAL SHARES TRUST
| | | | | | | | | | | | | | | | | | |
|
|
| | Emerging Global
Shares Dow Jones
Emerging Markets
Titans Composite
Index Fund | Emerging Global
Shares Dow Jones
Emerging Markets
Energy Titans
Index Fund | Emerging Global
Shares Dow Jones
Emerging Markets
Metals & Mining
Titans Index Fund | Emerging Global
Shares Dow Jones
Emerging Markets
Financials Titans
Index Fund | Emerging Global
Shares INDXX
China
Infrastructure
Index Fund | Emerging Global
Shares INDXX
Brazil
Infrastructure
Index Fund |
|
|
| | For the Period | For the Period | For the Period | For the Period | For the Period | For the Period |
| | July 22, 20091 | May 21, 20091 | May 21, 20091 | September 16, 20091 | February 17, 20101 | February 24, 20101 |
| | Through | Through | Through | Through | | Through | Through |
| | March 31, 2010 | March 31, 2010 | March 31, 2010 | March 31, 2010 | March 31, 2010 | March 31, 2010 |
|
|
| INCREASE (DECREASE) IN NET ASSETS | | | | | | | | | | | | | | | | | | |
| RESULTING FROM OPERATIONS: | | | | | | | | | | | | | | | | | | |
| Net investment income (loss) | $ | 59,079 | | $ | 30,765 | | $ | (6,134 | ) | $ | 18,076 | | $ | (4,237 | ) | $ | 10,777 | |
| Net realized gain (loss) on investments | | | | | | | | | | | | | | | | | | |
| and foreign currency transactions | | (155,887 | ) | | (122,738 | ) | | (67,719 | ) | | 30,056 | | | 3,831 | | | (58,409 | ) |
| Net unrealized appreciation (depreciation) | | | | | | | | | | | | | | | | | | |
| on investments and forward currency | | | | | | | | | | | | | | | | | | |
| translations | | 1,455,438 | | | 1,111,011 | | | 3,498,581 | | | 653,059 | | | 153,775 | | | (207,862 | ) |
|
|
|
| Net increase (decrease) in net assets | | | | | | | | | | | | | | | | | | |
| resulting from operations | | 1,358,630 | | | 1,019,038 | | | 3,424,728 | | | 701,191 | | | 153,369 | | | (255,494 | ) |
|
|
|
| |
| DISTRIBUTIONS TO SHAREHOLDERS: | | | | | | | | | | | | | | | | | | |
| Net investment income | | (45,229 | ) | | (21,996 | ) | | (56,190 | ) | | (13,750 | ) | | — | | | — | |
|
|
|
| |
| CAPITAL SHARE TRANSACTIONS: | | | | | | | | | | | | | | | | | | |
| Proceeds from sale of shares | | 30,341,841 | | | 8,610,179 | | | 24,271,605 | | | 6,164,649 | | | 6,081,584 | | | 11,558,230 | |
|
|
|
| Net Increase in Net Assets | | 31,655,242 | | | 9,607,221 | | | 27,640,143 | | | 6,852,090 | | | 6,234,953 | | | 11,302,736 | |
|
|
|
| |
| NET ASSETS: | | | | | | | | | | | | | | | | | | |
| Beginning of period | | 100,000 | | | — | | | — | | | — | | | — | | | — | |
|
|
|
| End of period | $ | 31,755,242 | | $ | 9,607,221 | | $ | 27,640,143 | | $ | 6,852,090 | | $ | 6,234,953 | | $ | 11,302,736 | |
|
| Accumulated net investment loss included | | | | | | | | | | | | | | | | | | |
| in net assets at end of period | $ | (37,780 | ) | $ | (45,185 | ) | $ | (60,092 | ) | $ | (3,195 | ) | $ | (136 | ) | $ | (44,840 | ) |
|
| |
| SHARES CREATED AND REDEEMED: | | | | | | | | | | | | | | | | | | |
| Shares outstanding, beginning of period | | 2,500 | | | — | | | — | | | — | | | — | | | — | |
| Shares sold | | 650,000 | | | 200,000 | | | 450,000 | | | 150,000 | | | 300,000 | | | 550,000 | |
|
|
|
| Shares outstanding, end of period | | 652,500 | | | 200,000 | | | 450,000 | | | 150,000 | | | 300,000 | | | 550,000 | |
|
|
|
| 1 Commencement of operations. | | |
The accompanying notes are an integral part of these financial statements.
26 EGA Emerging Global Shares Trust
Financial Highlights
EGA EMERGING GLOBAL SHARES TRUST
For a share outstanding throughout each period
| | | | | | | | | | | | | | | | | | |
|
|
| | Emerging Global
Shares Dow Jones
Emerging Markets
Titans Composite
Index Fund | Emerging Global
Shares Dow Jones
Emerging Markets
Energy Titans
Index Fund | Emerging Global
Shares Dow Jones
Emerging Markets
Metals & Mining
Titans Index Fund | Emerging Global
Shares Dow Jones
Emerging Markets
Financials Titans
Index Fund | Emerging Global
Shares INDXX
China
Infrastructure
Index Fund | Emerging Global
Shares INDXX
Brazil
Infrastructure
Index Fund |
|
|
| | For the Period | For the Period | For the Period | For the Period | For the Period | For the Period |
| | July 22, 20091 | May 21, 20091 | May 21, 20091 | September 16, 20091 | February 17, 20101 | February 24, 20101 |
| | Through | Through | Through | Through | Through | Through |
| | March 31, 2010 | March 31, 2010 | March 31, 2010 | March 31, 2010 | March 31, 2010 | March 31, 2010 |
|
|
| Net asset value, beginning of period | $ | 40.00 | | $ | 40.97 | | $ | 41.19 | | $ | 40.24 | | $ | 20.09 | | $ | 20.00 | |
|
| Investment operations: | | | | | | | | | | | | | | | | | | |
| Net investment income(loss)2 | | 0.17 | | | 0.18 | | | (0.03 | ) | | 0.16 | | | (0.02 | ) | | 0.03 | |
| Net realized and unrealized gain on | | | | | | | | | | | | | | | | | | |
| investments and foreign currency | | | | | | | | | | | | | | | | | | |
| transactions | | 8.61 | | | 7.00 | | | 20.48 | | | 5.42 | | | 0.71 | | | 0.52 | 7 |
|
|
|
| Total from investment operations | | 8.78 | | | 7.18 | | | 20.45 | | | 5.58 | | | 0.69 | | | 0.55 | |
|
|
|
Less: Distributions from net
nvestment income | | (0.11 | ) | | (0.11 | ) | | (0.22 | ) | | (0.14 | ) | | — | | | — | |
|
|
|
| Net asset value, end of period | $ | 48.67 | | $ | 48.04 | | $ | 61.42 | | $ | 45.68 | | $ | 20.78 | | $ | 20.55 | |
|
| NET ASSET VALUE TOTAL RETURN3 | | 21.96 | % | | 17.53 | %4 | | 49.69 | % | | 13.87 | % | | 3.43 | % | | 2.75 | % |
|
|
|
| |
| RATIOS/SUPPLEMENTAL DATA: | | | | | | | | | | | | | | | | | | |
Net assets, end of period
(000’s ommited) | $ | 31,755 | | $ | 9,607 | | $ | 27,640 | | $ | 6,852 | | $ | 6,235 | | $ | 11,303 | |
| Ratios to average net assets: | | | | | | | | | | | | | | | | | | |
| Expenses, net of expense | | | | | | | | | | | | | | | | | | |
| reimbursements/waivers5 | | 0.75 | % | | 0.85 | % | | 0.85 | % | | 0.85 | % | | 0.85 | % | | 0.85 | % |
| Expenses, prior to expense | | | | | | | | | | | | | | | | | | |
| reimbursements/waivers5 | | 3.43 | % | | 5.90 | % | | 4.37 | % | | 5.47 | % | | 7.82 | % | | 5.67 | % |
| Net investment income (loss)5 | | 0.52 | % | | 0.49 | % | | (0.06 | )% | | 0.67 | % | | (0.85 | )% | | 1.58 | % |
|
|
|
| Portfolio turnover rate6 | | 6 | % | | 49 | % | | 17 | % | | 12 | % | | 1 | % | | 1 | % |
|
|
|
| 1 | Commencement of operations. |
| 2 | Based on average shares outstanding. |
| 3 | Total return is calculated assuming an initial investment made at the net asset value at the beginning of the period, reinvestment of all dividends and distributions at net asset value during the period and redemption on the last day of the period. Total return calculated for a period of less than one year is not annualized. The total return would have been lower if certain expenses had not been reimbursed/waived by the sub-adviser. |
| 4 | For the period ended March 31, 2010, 0.73% of the Fund’s total return consists of a voluntary reimbursement by the current and former sub-advisers for a realized investment loss, and another (1.08)% consists of a realized investment loss on a trading error. Excluding these items, total return would have been 17.88%. |
| 5 | Annualized. |
| 6 | Not annualized. |
| 7 | The realized and unrealized gain on investments and foreign currency transactions does not accord with the amounts reported in the Statement of Operations due to the timing of subscriptions of fund shares in relation to the investment performance during the period and contributions made by Authorized Participants to compensate the Fund for additional costs incurred in purchasing securities that were not transferred in kind (See Note 9). |
The accompanying notes are an integral part of these financial statements.
EGA Emerging Global Shares Trust 27
Notes to Financial Statements
March 31, 2010
1. ORGANIZATION
EGA Emerging Global Shares Trust (the “Trust”) is a Delaware statutory trust organized on September 12, 2008. The Trust is an open-end management investment company, registered under the Investment Company Act of 1940, as amended (the “1940 Act”). The Trust currently consists of eighteen separate non-diversified series. As of the date of this report, only the following funds (each a “Fund” and collectively the “Funds”) are being publicly offered:
| |
|
| Funds | Commencement
of Operations |
|
| Emerging Global Shares Dow Jones Emerging Markets Titans Composite Index Fund (“Composite Fund”) | July 22, 2009 |
|
| Emerging Global Shares Dow Jones Emerging Markets Energy Titans Index Fund (“Energy Fund”) | May 21, 2009 |
|
Emerging Global Shares Dow Jones Emerging Markets Metals & Mining Titans Index Fund
(“Metals & Mining Fund”) | May 21, 2009 |
|
| Emerging Global Shares Dow Jones Emerging Markets Financials Titans Index Fund (“Financials Fund”) | September 16, 2009 |
|
| Emerging Global Shares INDXX China Infrastructure Index Fund (“China Infrastructure Fund”) | February 17, 2010 |
|
| Emerging Global Shares INDXX Brazil Infrastructure Index Fund (“Brazil Infrastructure Fund”) | February 24, 2010 |
|
The Composite Fund’s investment objective is to seek investment results that generally correspond (before fees and expenses) to the price and yield performance of the Dow Jones Emerging Markets Composite Titans 100 Index. The Dow Jones Emerging Markets Composite Titans 100 Index is a stock market index comprised of a representative sample of 100 emerging markets companies that Dow Jones Indices deem to be the 10 leading companies in each of the 10 industrial sectors, as defined by the Industry Classification Benchmark system (“ICB”), across the developing world.
The Energy Fund’s investment objective is to seek investment results that generally correspond (before fees and expenses) to the price and yield performance of the Dow Jones Emerging Markets Oil and Gas Titans Index. The Dow Jones Emerging Markets Oil and Gas Titans Index is a stock market index comprised of 30 leading emerging markets companies that Dow Jones Indices deem to be part of the Oil and Gas sector of the global economy, which also includes alternative energy sources other than oil and gas.
The Metals & Mining Fund’s investment objective is to seek investment results that generally correspond (before fees and expenses) to the price and yield performance of the Dow Jones Emerging Markets Metals & Mining Titans Index. The Dow Jones Emerging Markets Metals & Mining Titans Index is a stock market index comprised of 30 leading emerging markets companies that Dow Jones Indices deem to be in the Metals & Mining sector of the global economy. The Metals & Mining sector is a sub-sector of the Basic Materials industry, as defined by ICB.
The Financials Fund’s investment objective is to seek investment results that generally correspond (before fees and expenses) to the price and yield performance of the Dow Jones Emerging Markets Financials Titans Index. The Dow Jones Emerging Markets Financials Titans Index is a stock market index comprised of 30 leading emerging markets companies that Dow Jones Indices deem to be part of the Financials sector of the global economy.
The China Infrastructure Fund’s investment objective is to seek investment results that generally correspond (before fees and expenses) to the price and yield performance of the INDXX China Infrastructure Index, by investing in Chinese mid cap infrastructure companies that are included in the INDXX China Infrastructure Index, which are generally defined as companies that are domiciled in China and that have a market capitalization of at least $200 million at the time of purchase. The INDXX China Infrastructure Index is a free-float market capitalization weighted stock market index comprised of 30 leading companies that INDXX, LLC determines to be representative of China’s Infrastructure sectors.
The Brazil Infrastructure Fund’s investment objective is to seek investment results that generally correspond (before fees and expenses) to the price and yield performance of the INDXX Brazil Infrastructure Index, by investing in Brazilian mid cap infrastructure companies that are included in the INDXX Brazil Infrastructure Index, which are generally defined as companies that are domiciled in Brazil and that have a market capitalization of at least $200 million at the time of purchase. The INDXX Brazil Infrastructure Index is a free-float market capitalization weighted stock market index comprised of 30 leading companies that INDXX, LLC determines to be representative of Brazil’s Infrastructure sectors.
2. SIGNIFICANT ACCOUNTING POLICIES
These financial statements are prepared in accordance with accounting principles generally accepted in the United States of America (“GAAP”), which requires management to make estimates and assumptions that affect the reported amounts of assets and liabilities, the disclosure of contingent assets and liabilities at the date of the financial statements, and the reported amounts of increases and decreases in net assets from operations during the reporting period. Actual amounts could differ from these estimates. The following summarizes the significant accounting policies of the Funds.
28 EGA Emerging Global Shares Trust
Notes to Financial Statements (continued)
March 31, 2010
Indemnifications
In the normal course of business, the Trust enters into contracts that contain a variety of representations that provide general indemnifications. The Trust’s maximum exposure under these arrangements cannot be known as this would involve future claims that may be made against the Trust that have not yet occurred; however, the Trust expects any risk of loss to be remote.
Investment Valuation
The Net Asset Value (“NAV”) per share is computed as of the scheduled close of regular trading on the New York Stock Exchange (“NYSE”), ordinarily 4:00 p.m. Eastern time, on each day during which the NYSE is open for trading. The NAV per share of a Fund is computed by dividing the value of the Fund’s portfolio securities, cash and other assets (including accrued interest), less all liabilities (including accrued expenses), by the total number of shares outstanding at the time such computation is made.
Securities Valuation
Equity securities (including American Depositary Receipts and Global Depositary Receipts) are valued at the last reported sale price on the principal exchange on which such securities are traded, as of the close of regular trading on the NYSE on the day the securities are being valued or, if there are no sales, at the mean of the most recent bid and asked prices. Equity securities that are traded in over-the-counter markets are valued at the NASDAQ Official Closing Price as of the close of regular trading on the NYSE on the day the securities are valued or, if there are no sales, at the mean of the most recent bid and asked prices. Securities for which market quotations are not readily available, including restricted securities, are valued by a method that the Board of Trustees (the “Board”) believe accurately reflects fair value. The value of assets denominated in foreign currencies is converted into U.S. dollars using exchange rates deemed appropriate by the Funds. Use of a rate different from the rate used by Dow Jones Indices or INDXX Indices may adversely affect a Fund’s ability to track its Underlying Index.
Foreign Currency Translations
Investments denominated in foreign currencies are subject to additional risk factors as compared to investments denominated in U.S. dollars. The value of an investment denominated in a foreign currency could change significantly as foreign currencies strengthen or weaken relative to the U.S. dollar. Generally, when the U.S. dollar gains in value against a foreign currency, an investment traded in that foreign currency loses value because that currency is worth fewer U.S. dollars. Risks related to foreign currencies also include those related to economic or political developments, market inefficiencies or a higher risk that essential investment information may be incomplete, unavailable or inaccurate. A U.S. dollar investment in Depositary Receipts or Ordinary Shares of foreign issuers traded on U.S. exchanges is indirectly subject to foreign currency risk to the extent that the issuer conducts its principal business in markets where transactions are denominated in foreign currencies.
Portfolio securities and other assets and liabilities denominated in foreign currencies are translated into U.S. dollars based on the exchange rate of such currencies against U.S. dollars on the date of valuation. Purchases and sales of securities and income items denominated in foreign currencies are translated into U.S. dollars at the exchange rate in effect on the transaction date.
The Funds do not separately report the effect of changes in foreign exchange rates from changes in market prices on securities held. Such changes are included in net realized and unrealized gain or loss from investments.
Realized foreign exchange gains or losses arise from sales of foreign currencies, currency gains or losses realized between the trade and settlement dates on securities transactions and the difference between the recorded amounts of dividends, interest, and foreign withholding taxes, and the U.S. dollar equivalent of the amounts actually received or paid. Net unrealized foreign exchange gains and losses arise from changes in foreign exchange rates on foreign denominated assets and liabilities other than investments in securities held at the end of the reporting period.
Security Transactions and Related Income
Investment transactions are recorded on trade date. The Funds determine the gain or loss realized from the investment transactions by comparing the identified cost, which is the same basis used for federal income tax purposes, with the net sales proceeds. Dividend income is recorded on the ex-dividend date. Interest income is recorded on the accrual basis. Discounts are accreted and premiums are amortized on securities purchased over the lives of the respective securities.
Federal Income Taxes
Each Fund intends to qualify as a “regulated investment company” under Subchapter M of the Internal Revenue Code. If so qualified, a Fund will not be subject to federal income tax to the extent it distributes substantially all of its net investment income and capital gains to shareholders. Each Fund expects to declare and pay all of its net investment income, if any, to shareholders as dividends annually, and will
EGA Emerging Global Shares Trust 29
Notes to Financial Statements (continued)
March 31, 2010
also declare and pay net realized capital gains, if any, at least annually, except where the costs of such distributions exceed the amount of tax that the distributions are intended to avoid, in which case the Fund will pay the applicable tax. A Fund may distribute such income dividends and capital gains more frequently, if necessary, in order to reduce or eliminate federal excise or income taxes on the Fund. Distributions to shareholders are recorded on the ex-dividend date.
The Funds are subject to accounting standards that provide guidance for how uncertain tax positions should be recognized, measured, presented and disclosed in the financial statements. These standards require the evaluation of tax positions taken or expected to be taken by the Funds and whether the tax positions are “more-likely-than-not” of being sustained by the applicable tax authority. Tax positions not deemed to meet the more-likely-than-not threshold would be recorded as a tax benefit or expense in the current year. Accounting for uncertainty in income taxes requires management of the Funds to analyze all open tax years as defined by IRS statute of limitations, for all major jurisdictions, including federal tax authorities and certain state tax authorities. Open tax years are those years that are open for examination by the relevant income taxing authority. As of March 31, 2010, the Funds have no examinations in progress.
There is no tax liability resulting from uncertain income tax positions taken or expected to be taken. The Funds are also not aware of any tax positions for which it is reasonably possible that the total amounts of unrecognized tax expense will significantly change in the next twelve months.
Expenses
Expenses of the Trust, which are directly identifiable to a specific Fund, are applied to that Fund. Expenses which are not readily identifiable to a specific Fund are allocated in such a manner as deemed equitable, taking into consideration the nature and type of expense and the relative net assets of each Fund in the Trust.
Organizational and Offering Expenses
Costs incurred in connection with the initial offering of the Funds are being amortized over a 12-month period.
3. DISTRIBUTION AGREEMENT
ALPS Distributors, Inc. (“the Distributor”) serves as the distributor of Creation Units for the Funds pursuant to a distribution agreement. The Distributor does not maintain a secondary market in shares. The Funds have adopted a Distribution and Service Plan (the “Plan”) pursuant to Rule 12b-1 under the 1940 Act. In accordance with the Plan, each Fund is authorized to pay an amount up to 0.25% of its average daily net assets each year for certain distribution-related activities. For the periods ended March 31, 2010, no fees were paid by the Funds under the Plan, and there are no current plans to impose these fees.
4. FEDERAL INCOME TAX MATTERS
At March 31, 2010, the federal tax cost of investments and net unrealized appreciation/(depreciation) were as follows:
| | | | | | | | | | | | |
|
| Funds | Federal Tax
Cost of
Investments | Gross
Unrealized
Appreciation | Gross
Unrealized
Depreciation | Net Unrealized
Appreciation
(Depreciation) |
|
| Composite Fund | $ | 30,313,690 | | $ | 1,743,702 | | $ | (456,491 | ) | $ | 1,287,211 | |
|
| Energy Fund | | 8,549,143 | | | 1,153,004 | | | (71,222 | ) | | 1,081,782 | |
|
| Metals & Mining Fund | | 24,178,517 | | | 3,784,089 | | | (315,145 | ) | | 3,468,944 | |
|
| Financials Fund | | 6,284,385 | | | 574,986 | | | (1,529 | ) | | 573,457 | |
|
| China Infrastructure Fund | | 6,013,193 | | | 218,272 | | | (64,497 | ) | | 153,775 | |
|
| Brazil Infrastructure Fund | | 11,464,462 | | | 144,979 | | | (353,384 | ) | | (208,405 | ) |
|
30 EGA Emerging Global Shares Trust
Notes to Financial Statements (continued)
March 31, 2010
The differences between book basis and tax basis components of net assets are primarily attributable to tax deferral of losses on wash sales, expensing of organization costs and deferral of post-October losses. At March 31, 2010, the components of accumulated earnings/loss on a tax-basis were as follows:
|
| Funds | Undistributed
Ordinary
Income | Accumulated
Capital and
Other Losses | Net
Unrealized
Appreciation
(Depreciation) | Total
Accumulated
Earnings (Losses) |
|
| Composite Fund | $ 63,856 | | $ (33,925 | ) | $ 1,288,470 | | $ 1,318,401 | |
|
| Energy Fund | 14,117 | | (94,662 | ) | 1,081,563 | | 1,001,018 | |
|
| Metals & Mining Fund | — | | (96,034 | ) | 3,468,871 | | 3,372,837 | |
|
| Financials Fund | 135,515 | | (16,615 | ) | 573,541 | | 692,441 | |
|
| China Infrastructure Fund | — | | (136 | ) | 153,775 | | 153,639 | |
|
| Brazil Infrastructure Fund | — | | (46,809 | ) | (208,685 | ) | (255,494 | ) |
|
For financial reporting purposes, capital accounts are adjusted to reflect the tax character of permanent book/tax differences. Reclassifications are primarily due to tax treatment of redemptions in kind, non-deductible organization costs and tax treatment of currency gains and losses. Results of operations and net assets were not affected by these reclassifications.
At March 31, 2010, the effect of permanent book/tax reclassifications resulted in increases (decreases) to the components of net assets as follows:
|
| Funds | Undistributed
Net Investment
Income | Accumulated
Net Realized
Gain (Loss) on
Investments | Paid-in Capital |
|
| Composite Fund | $ (51,630 | ) | $ 56,630 | | $ (5,000 | ) |
|
| Energy Fund | (53,954 | ) | 57,930 | | (3,976 | ) |
|
| Metals & Mining Fund | 2,232 | | 2,067 | | (4,299 | ) |
|
| Financials Fund | (7,521 | ) | 12,521 | | (5,000 | ) |
|
| China Infrastructure Fund | 4,101 | | (3,831 | ) | (270 | ) |
|
| Brazil Infrastructure Fund | (55,617 | ) | 55,617 | | — | |
|
For the periods ended March 31, 2010, all of the distributions to shareholders were from ordinary income.
Certain net losses incurred after October 31 and within the taxable year are deemed to arise on the first business day of the Funds’ next taxable year. For the periods ended March 31, 2010, the Funds deferred to April 1, 2010 post October losses of:
| | | |
|
|
|
|
| Funds | Post October
Currency Losses | Post October
Capital Losses |
|
| Composite Fund | $ — | | $ — |
|
| Energy Fund | — | | 29,448 |
|
|
|
|
| Metals & Mining Fund | 853 | | 9,466 |
|
|
|
|
| Financials Fund | — | | — |
|
|
|
|
| China Infrastructure Fund | 136 | | — |
|
|
|
|
| Brazil Infrastructure Fund | 44,840 | | 1,969 |
|
|
|
|
At March 31, 2010, the Funds listed below had net capital loss carryforwards for federal income tax purposes which are available for offset against future taxable net capital gains. The amounts were determined after adjustments for certain differences between financial reporting and tax purposes, such as wash sale losses. Accordingly, no capital gain distributions are expected to be paid to shareholders of these Funds until future net capital gains have been realized in excess of the available capital loss carryforwards. There is no assurance that any Fund will be able to utilize all of its capital loss carryforwards before they expire. These loss carryforwards expire in amounts and fiscal years as follows:
| | |
|
| Funds | Fiscal Year
2018 |
|
| Composite Fund | $ | — |
|
| Energy Fund | | 35,360 |
|
| Metals & Mining Fund | | 26,475 |
|
| Financials Fund | | — |
|
| China Infrastructure Fund | | — |
|
| Brazil Infrastructure Fund | | — |
|
EGA Emerging Global Shares Trust 31
Notes to Financial Statements (continued)
March 31, 2010
5. FAIR VALUE MEASUREMENT
The Funds utilize various inputs in determining the value of each Fund’s investments. GAAP establishes a hierarchy for inputs used in measuring fair value that maximizes the use of observable inputs and minimizes the use of unobservable inputs by requiring the most observable inputs be used when available. These inputs are summarized in the three broad levels as follows:
Level 1 — quoted prices in active markets for identical securities
Level 2 — other significant observable inputs (including quoted prices for similar securities, interest rates, prepayment speeds, credit risk, etc.)
Level 3 — significant unobservable inputs (including the Fund’s own assumptions in determining the fair value of investments)
The inputs or methodology used for valuing securities are not necessarily an indication of the risk associated with investing in those securities.
The following summarizes inputs used as of March 31, 2010 in valuing the Funds’ assets and liabilities carried at fair value:
|
| | Quoted Prices in Active Market (Level 1) | Other Significant
Observable Inputs
(Level 2) | Significant
Unobservable
Inputs (Level 3) | Total |
| |
|
|
| Funds | Common Stock | Preferred Stock | Rights |
|
| Assets: | | | | | | | | | | | |
|
|
| Composite Fund* | $ 24,283,982 | | $ 7,316,919 | | $ — | | $ — | | $ — | | $ 31,600,901 |
|
| Energy Fund* | 8,966,880 | | 664,045 | | — | | — | | — | | 9,630,925 |
|
|
|
|
| Metals & Mining Fund* | 21,920,749 | | 5,726,712 | | — | | — | | — | | 27,647,461 |
|
|
|
|
| Financials Fund* | 5,947,140 | | 910,702 | | — | | — | | — | | 6,857,842 |
|
|
|
|
| China Infrastructure Fund** | 6,166,968 | | — | | — | | — | | — | | 6,166,968 |
|
|
|
|
| Brazil Infrastructure Fund** | 7,744,843 | | 3,511,157 | | 57 | | — | | — | | 11,256,057 |
|
|
|
|
| * | Please refer to the schedule of investments to view securities segregated by country. |
| ** | Please refer to the schedule of investments to view securities segregated by industry type. |
The Funds did not hold any Level 3 securities during the periods reported.
6. INVESTMENT TRANSACTIONS
During the periods ended March 31, 2010, the cost of purchases and proceeds from sales of investments (excluding short-term investments) were:
| | | | |
|
| Funds | Purchases | Sales |
|
| Composite Fund | $ | 21,779,889 | $ | 1,043,215 |
|
| Energy Fund | | 5,741,274 | | 3,543,742 |
|
| Metals & Mining Fund | | 10,662,364 | | 2,012,943 |
|
| Financials Fund | | 3,019,112 | | 642,670 |
|
| China Infrastructure Fund | | 2,033,842 | | 72,322 |
|
| Brazil Infrastructure Fund | | 10,943,510 | | 54,644 |
|
For the periods ended March 31, 2010, the cost of in-kind transactions and proceeds from in-kind sales were as follows:
| | | | |
|
| Funds | Purchases | Sales |
|
| Composite Fund | $ | 9,398,616 | $ | — |
|
| Energy Fund | | 6,432,838 | | — |
|
| Metals & Mining Fund | | 15,471,325 | | — |
|
| Financials Fund | | 3,774,963 | | — |
|
| China Infrastructure Fund | | 4,047,705 | | — |
|
| Brazil Infrastructure Fund | | 358,660 | | — |
|
32 EGA Emerging Global Shares Trust
Notes to Financial Statements (continued)
March 31, 2010
7. INVESTMENT ADVISORY AND OTHER AGREEMENTS
The Trust has entered into an Investment Advisory Agreement (the “Advisory Agreement”) with ALPS Advisors, Inc. (“ALPS” or the “Adviser”). The Adviser acts as the Funds’ investment adviser pursuant to an advisory agreement with the Trust on behalf of the Funds. Pursuant to the Advisory Agreement, the Adviser has overall supervisory responsibility for the general management and investment of each Fund’s securities portfolio, and has ultimate responsibility (subject to oversight by the Trust’s Board of Trustees) for oversight of the Trust’s sub-adviser. For its services, the Trust pays the Adviser an annual management fee consisting of the greater of $400,000 or 0.10% of each Fund’s average daily net assets, but not to exceed $1,000,000 per year. From time to time, the Adviser may waive all or a portion of its fee.
Emerging Global Advisors, LLC (“EGA”) serves as the sub-adviser to the Funds and provides investment advice and management services to the Funds. EGA supervises the day-to-day investment and reinvestment of the assets in each Fund and is responsible for designating the Deposit Securities and for monitoring each Fund’s adherence to its investment mandate. For its investment sub-advisory services, EGA receives from the Funds an annual fee equal to 0.75% of the average daily net assets of Composite Fund and 0.85% of the average daily net assets of each of the other Funds.
The Trust and EGA have entered into a written fee waiver and expense reimbursement agreement pursuant to which EGA has agreed to reduce and/or reimburse expenses to the extent necessary to prevent the annual operating expenses of each Fund (excluding any taxes, interest, brokerage fees and non-routine expenses) from exceeding 0.85% of average daily net assets (0.75% for Composite Fund) at least until May 21, 2011 (January 26, 2011, for China Infrastructure Fund and Brazil Infrastructure Fund). Under this fee waiver and expense assumption agreement, EGA retains the right to seek reimbursement from each Fund of fees previously waived or expenses previously assumed to the extent such fees were waived or expenses were assumed within three years of such reimbursement, and provided such reimbursement does not cause a Fund to exceed any applicable fee waiver or expense limitation agreement that was in place at the time the fees were waived or expenses assumed.
For the periods ended March 31, 2010, EGA reimbursed and/or waived the following fees, which are all available for recoupment until fiscal year ending March 31, 2013:
| | |
|
| Funds | Fees
Reimbursed/
Waived |
|
| Composite Fund | $ | 302,447 |
|
| Energy Fund | | 318,362 |
|
| Metals & Mining Fund | | 344,869 |
|
| Financials Fund | | 125,612 |
|
| China Infrastructure Fund | | 34,768 |
|
| Brazil Infrastructure Fund | | 32,912 |
|
The Bank of New York Mellon serves as the Funds’ Administrator, Custodian, Fund Accountant and Transfer Agent pursuant to a Fund Administration and Accounting Agreement, a Custody Agreement and a Transfer Agency and Service Agreement, as the case may be.
ALPS Fund Services, Inc. (“AFS”), an affiliate of the Adviser and the Distributor, provides a Chief Compliance Officer and an Anti-Money Laundering Officer as well as certain additional compliance support functions under a Compliance Services Agreement. AFS also provides a Principal Financial Officer to the Trust under a PFO Services Agreement. As compensation for the foregoing services, AFS receives certain out of pocket costs, and fixed and asset-based fees, which are accrued daily and paid monthly by the Funds. Compensation for such services is included under the Advisory Agreement.
8. PAYMENTS BY AFFILIATES AND NET GAINS (LOSSES) REALIZED ON TRADING ERROR
As a result of a trade error by the Energy Fund’s former sub-adviser, the Energy Fund experienced an aggregate loss of $73,832, of which $25,000 was reimbursed by the former sub-adviser and $25,000 was reimbursed by EGA, resulting in a net loss to the Energy Fund of $23,832.
9. CREATION AND REDEMPTION TRANSACTIONS
The Funds issue and redeem Shares on a continuous basis at NAV in blocks of 50,000 shares called “Creation Units.” Except when aggregated in Creation Units, shares are not redeemable securities of a Fund.
Only “Authorized Participants” may purchase or redeem shares directly from a Fund. An Authorized Participant is either (i) a broker-dealer or other participant in the clearing process through the Continuous Net Settlement System of the National Securities Clearing Corporation or (ii) a DTC participant and, in each case, must have executed a Participant Agreement with the Distributor. Most retail investors will not qualify as
EGA Emerging Global Shares Trust 33
Notes to Financial Statements (concluded)
March 31, 2010
Authorized Participants or do not have the resources to buy and sell whole Creation Units. Therefore, they will be unable to purchase or redeem the shares directly from the Funds. Rather, most retail investors will purchase shares in the secondary market with the assistance of a broker and will be subject to customary brokerage commissions or fees.
The consideration for the purchase of Creation Units of a Fund generally consists of the in-kind deposit of a designated portfolio of equity securities, which constitutes an optimized representation of the corresponding Index and an amount of cash (except for the Brazil Infrastructure Fund, which are offered in Creation Units solely or partially for cash in U.S. dollars). Investors transacting in Creation Units for cash pay an additional variable charge to compensate the relevant Fund for brokerage and market impact expenses relating to investing in portfolio securities.
From time to time, settlement of securities related to in-kind contributions may be delayed. In such cases, securities related to in-kind contributions are reflected as “Due from custodian” in the Statements of Assets and Liabilities.
10. TRUSTEES’ FEES
The Trust compensates each Trustee who is not an employee of the Adviser, EGA or their affiliates. The interested Trustees do not receive any compensation from the Trust for serving as Trustees.
11. NEW ACCOUNTING PRONOUNCEMENT
In January 2010, the Financial Accounting Standards Board (“FASB”) issued Accounting Standards Update (“ASU”) No. 2010-06 “Improving Disclosures about Fair Value Measurements.” ASU 2010-06 amends FASB Accounting Standards Codification Topic 820, Fair Value Measurements and Disclosures, to require additional disclosures regarding fair value measurements. Certain disclosures required by ASU No. 2010-06 are effective for interim and annual reporting periods beginning after December 15, 2009, and other required disclosures are effective for fiscal years beginning after December 31, 2010, and for interim periods within those fiscal years. Management is currently evaluating the impact ASU No. 2010-06 will have on its financial statement disclosures.
12. SUBSEQUENT EVENTS
The Funds have adopted authoritative standards of accounting for and disclosure of events that occur after the balance sheet date but before financial statements are issued or are available to be issued. These standards require the Funds to recognize in the financial statements the effects of all recognized subsequent events that provide additional evidence about conditions that existed at the date of the balance sheet. For nonrecognized subsequent events that must be disclosed to keep the financial statements from being misleading, the Funds are required to disclose the nature of the event as well as an estimate of its financial effect, or a statement that such an estimate cannot be made. The Funds have evaluated subsequent events through the date of issuance of this report and have determined that there are no material events that would require disclosure.
34 EGA Emerging Global Shares Trust
Report of Independent Registered Public Accounting Firm
To the Board of Trustees and
Shareholders of EGA Emerging Global Shares Trust
We have audited the accompanying statements of assets and liabilities of Emerging Global Shares Dow Jones Emerging Markets Titans Composite Index Fund, Emerging Global Shares Dow Jones Emerging Markets Energy Titans Index Fund, Emerging Global Shares Dow Jones Emerging Markets Metals & Mining Titans Index Fund, Emerging Global Shares Dow Jones Emerging Markets Financials Titans Index Fund, Emerging Global Shares INDXX China Infrastructure Index Fund and Emerging Global Shares INDXX Brazil Infrastructure Index Fund, each a series of shares of beneficial interest of EGA Emerging Global Shares Trust, including the schedules of investments, as of March 31, 2010, and the related statements of operations, changes in net assets and financial highlights for each of the respective periods presented. These financial statements and financial highlights are the responsibility of the Funds’ management. Our responsibility is to express an opinion on these financial statements and financial highlights based on our audits.
We conducted our audits in accordance with the standards of the Public Company Accounting Oversight Board (United States). Those standards require that we plan and perform the audits to obtain reasonable assurance about whether the financial statements and financial highlights are free of material misstatement. An audit includes examining, on a test basis, evidence supporting the amounts and disclosures in the financial statements. Our procedures included confirmation of securities owned as of March 31, 2010 by correspondence with the custodian. An audit also includes assessing the accounting principles used and significant estimates made by management, as well as evaluating the overall financial statement presentation. We believe that our audits provide a reasonable basis for our opinion.
In our opinion, the financial statements and financial highlights referred to above present fairly, in all material respects, the financial position of Emerging Global Shares Dow Jones Emerging Markets Titans Composite Index Fund, Emerging Global Shares Dow Jones Emerging Markets Energy Titans Index Fund, Emerging Global Shares Dow Jones Emerging Markets Metals & Mining Titans Index Fund, Emerging Global Shares Dow Jones Emerging Markets Financials Titans Index Fund, Emerging Global Shares INDXX China Infrastructure Index Fund and Emerging Global Shares INDXX Brazil Infrastructure Index Fund as of March 31, 2010, and the results of their operations, changes in their net assets, and their financial highlights for each of the respective periods presented, in conformity with accounting principles generally accepted in the United States of America.

Philadelphia, Pennsylvania
May 21, 2010
EGA Emerging Global Shares Trust 35
Board Approval of Investment Advisory and Sub-Advisory Agreements
A. Emerging Global Shares INDXX Index Funds
At a meeting held on November 12, 2009, the Board unanimously approved amendments to the Trust’s investment advisory agreement on behalf of each Emerging Global Shares INDXX Index Fund (each, an “INDXX Fund”) with ALPS and sub-advisory agreement with EGA. In considering the approval of the amendments to investment advisory agreement and the sub-advisory agreement, the Independent Trustees reviewed the materials provided for the meeting by ALPS and EGA, including: (i) a copy of the investment advisory agreement with ALPS and the amendment thereto to add the INDXX Funds; (ii) a copy of the sub-advisory agreement between the Trust and EGA and the amendment thereto to add the INDXX Funds; (iii) information describing the nature, quality, and extent of the services that ALPS will provide to the INDXX Funds, and the fees that ALPS will charge to the INDXX Funds; (iv) information describing the nature, quality, and extent of the services that EGA will provide to the INDXX Funds, and the fees that EGA will charge for such services; (v) information concerning business, operations and compliance program of ALPS; (vi) information concerning EGA’s business and operations, portfolio management team and compliance program (vii) a copy of the current Form ADV for each of ALPS and EGA; (viii) information describing each INDXX Fund’s anticipated operating expenses; and (x) memoranda from Stradley Ronon on the responsibilities of trustees in considering investment advisory arrangements under the 1940 Act. The Independent Trustees also considered presentations made by, and discussions held with, representatives of ALPS and EGA. In addition, the Independent Trustees received data compiled by Thomson Reuters comparing the proposed fee rate for advisory services to be charged to the Trust to fees paid by other exchange-traded funds with similar investment objectives and policies at various asset levels.
During their review of this information, the Independent Trustees focused on and analyzed the factors that the Independent Trustees deemed relevant, including: the nature, quality, and extent of the services to be provided to each INDXX Funds by ALPS and EGA; the personnel and operations of ALPS and EGA; each INDXX Fund’s proposed expense levels; the anticipated profitability, if any, to ALPS and EGA under the investment advisory agreement and sub-advisory agreement; any “fall-out” benefits to ALPS and EGA (i.e., the ancillary benefits realized due to a relationship with the Trust); the effect of asset growth on each INDXX Fund’s expenses; and possible conflicts of interest. The Independent Trustees also considered the nature, quality, and extent of the non-advisory services to be provided to each INDXX Funds by EGA. In particular, the Independent Trustees considered and discussed the following with respect to each INDXX Funds:
1. Investment Advisory Agreement with ALPS
(a) The nature, extent, and quality of services to be provided to each INDXX Fund by ALPS. The Independent Trustees reviewed the services that ALPS would provide to each INDXX Fund. In connection with the investment advisory services to be provided to each INDXX Fund, the Independent Trustees noted the responsibilities that ALPS would have as the INDXX Funds’ investment adviser, including overall supervisory responsibility for the general management and investment of each INDXX Fund’s securities portfolio, ultimate responsibility, subject to oversight by the Board, for oversight of the Trust’s sub-advisers, responsibility for daily monitoring of tracking error and quarterly reporting to the Board, and the implementation of Board directives as they relate to the INDXX Funds.
The Independent Trustees reviewed ALPS’ experience, resources, and strengths in managing other ETFs, including the EMTI Funds. Based on their consideration and review of the foregoing information, the Independent Trustees determined that each INDXX Fund was likely to benefit from the nature, quality, and extent of these services, as well as ALPS’ ability to render such services based on its experience, operations, and resources.
(b) Comparison of services provided and fees charged by ALPS and other investment advisers to similar clients, and the cost of the services to be provided and profits to be realized by ALPS from the relationship with the INDXX Funds. The Independent Trustees then compared both the services to be rendered and the proposed fees to be paid pursuant to other investment advisory contracts of ALPS, and to contracts of other investment advisers with respect to similar open-end registered investment companies, including the EMTI Funds. In particular, the Independent Trustees compared each INDXX Fund’s proposed advisory fees and projected expense ratios for its first year of operations to other investment companies considered to be in that Fund’s peer group. The Board acknowledged the difference in ALPS’ advisory fee for the INDXX Funds compared to other ETFs advised by ALPS arising from the different adviser and sub-adviser structure to be employed by the INDXX Funds and different services that ALPS would be providing to the INDXX Funds. It was noted that EGA is proposing to enter into an expense limitation agreement whereby EGA would agree to reimburse expenses and/or waive fees to keep the expenses of each INDXX Fund from exceeding 0.85% of average daily net assets for at least the first year of operations.
After comparing each INDXX Fund’s proposed fees with those of other funds in the INDXX Funds’ peer group, and in light of the nature, quality, and extent of services proposed to be provided by ALPS and the costs expected to be incurred by ALPS in rendering those services, the Independent Trustees concluded that the level of fees proposed to be paid to ALPS with respect to each INDXX Fund were fair and reasonable.
(c) ALPS’ profitability and the extent to which economies of scale would be realized as each INDXX Fund grows and whether fee levels would reflect such economies of scale. The Independent Trustees next discussed potential economies of scale. The Independent Trustees considered the anticipated costs and projected profitability of ALPS in connection with its serving as investment adviser to each INDXX Fund, including operational costs.
36 EGA Emerging Global Shares Trust
Board Approval of Investment Advisory and Sub-Advisory Agreements (continued)
(d) Investment performance of ALPS. Because each INDXX Fund had not commenced operations, the Independent Trustees could not consider the investment performance of the INDXX Funds, but did take into account the investment performance of the EMTI Funds, for which ALPS serves as investment adviser.
Conclusion. No single factor was determinative to the decision of the Independent Trustees. Based on the foregoing and such other matters as were deemed relevant, the Independent Trustees concluded that the proposed advisory fee rate and projected total expense ratio are reasonable in relation to the services to be provided by ALPS to each INDXX Fund, as well as the costs to be incurred and benefits to be gained by ALPS in providing such services. As a result, the Independent Trustees decided to recommend to the Board the approval of the amended investment advisory agreement with ALPS.
2. Sub-Advisory Agreement with EGA
(a) The nature, extent, and quality of services to be provided to each INDXX Fund by EGA. The Independent Trustees reviewed the services that EGA would provide to each INDXX Fund. In connection with the sub-advisory services to be provided to each INDXX Fund, the Independent Trustees noted the significant responsibilities that EGA would have as the INDXX Funds’ sub-adviser, including: the investment management program of each INDXX Fund; management of the day-to-day investment and reinvestment of the assets in each INDXX Fund; determining daily baskets of deposit securities and cash components; making determinations with respect to alternative cash management vehicles and securities lending collateral investments; and oversight of general portfolio compliance with relevant law.
The Independent Trustees reviewed EGA’s experience, resources, strengths and its performance as a sub-adviser to the EMTI Funds. Based on their consideration and review of the foregoing information, the Independent Trustees determined that each INDXX Fund was likely to benefit from the nature, quality, and extent of these services, as well as EGA’s ability to render such services based on its experience, operations and resources.
(b) Comparison of services provided and fees charged by EGA and other investment advisers to similar clients, and the cost of the services to be provided and profits to be realized by EGA from the relationship with the INDXX Funds. The Independent Trustees then compared both the services to be rendered and the proposed fees to be paid for sub-advisory services to those of other investment advisers of similar ETFs. In particular, the Independent Trustees compared each INDXX Fund’s proposed advisory fees and projected expense ratios for the first year of operations to other ETFs considered to be in such INDXX Fund’s peer group, including the EMTI Funds. It was noted that the comparative fee data compiled by Thomson Reuters erroneously reflected the contractual sub-advisory fee for four of the INDXX Funds as 0.60% rather than 0.85%. The Board further noted that the INDXX Funds’ proposed management fees and expenses (after giving the proposed fee waiver and expense limitation arrangements) were at the top of the range of the INDXX Funds’ Peer Group. The Independent Trustees considered that each INDXX Fund’s investments were concentrated in emerging markets and the factors contributing to increased costs associated with managing those types of investments.
The Independent Trustees considered the anticipated costs, including operational costs, and projected profitability of EGA in connection with its serving as sub-adviser to each INDXX Funds. The Independent Trustees noted EGA’s commitment initially to limit each INDXX Fund’s expenses through a contractual written fee waiver and expense reimbursement agreement with the Trust, including the circumstances in which the Trust would have to repay fees in excess of the expense cap that were borne by EGA. After comparing each INDXX Fund’s proposed fees with those of other funds in each INDXX Fund’s peer group, including the EMTI Funds, and in light of the nature, quality, and extent of services proposed to be provided by EGA and the costs expected to be incurred by EGA in rendering those services and capping the Funds’ expenses, the Independent Trustees concluded that the level of fees proposed to be paid to EGA with respect to each INDXX Funds were fair and reasonable.
(c) EGA’s profitability and the extent to which economies of scale would be realized as each INDXX Fund grows and whether fee levels would reflect such economies of scale. The Independent Trustees considered the financial viability of EGA, including EGA’s capitalization and ability to maintain operations. The Independent Trustees then discussed potential economies of scale if the costs of managing the INDXX Funds decreased. The Independent Trustees noted that, because the INDXX Funds had not yet commenced operations, the eventual aggregate amount of assets was uncertain, and recognized the uncertainty in launching new investment products and estimating future asset levels.
(d) Investment performance of EGA. Because the EMTI Funds had only recently commenced operations, the Independent Trustees considered EGA’s limited investment performance history. The Independent Trustees considered the factors that impact tracking error and EGA’s goal to keep index tracking error in the INDXX Funds to a minimum.
Conclusion. No single factor was determinative to the decision of the Independent Trustees. Based on the foregoing and such other matters as were deemed relevant, such as the proposed fee waiver and expense limitation arrangements, the Independent Trustees concluded that the proposed sub-advisory fee rate and projected total expense ratio are reasonable in relation to the services to be provided by EGA to each INDXX Fund, as well as the costs to be incurred and benefits to be gained by EGA in providing such services. As a result, the Independent Trustees decided to recommend to the Board the approval of the amended sub-advisory agreement with EGA. In light of the foregoing, the Board, including a majority of the Independent Trustees, approved the appointment of ALPS as the investment adviser to the INDXX Funds, the approval of the amendment to the investment advisory agreement with ALPS, the appointment of EGA as sub-adviser to the INDXX Funds and approval of the amendment to the sub-advisory agreement with EGA.
EGA Emerging Global Shares Trust 37
Board Approval of Investment Advisory and Sub-Advisory Agreements (continued)
B. Emerging Global Shares Dow Jones Emerging Markets Consumer Titans Index Fund
At a meeting held on March 2, 2009, the Board unanimously approved amendments to the Trust’s investment advisory agreement on behalf of the Emerging Global Shares Dow Jones Emerging Markets Consumer Titans Index Fund (the “New Fund”) with ALPS and sub-advisory agreement with EGA. In considering the approval of the amendments to investment advisory agreement and the sub-advisory agreement, the Independent Trustees reviewed the materials provided for the meeting by ALPS and EGA, including: (i) a copy of the investment advisory agreement with ALPS and the amendment thereto to add the New Fund; (ii) a copy of the sub-advisory agreement between the Trust and EGA and the amendment thereto to add the New Fund; (iii) information describing the nature, quality, and extent of the services that ALPS will provide to the New Fund, and the fees that ALPS will charge to the New Fund; (iv) information describing the nature, quality, and extent of the services that EGA will provide to the New Fund, and the fees that EGA will charge for such services; (v) information concerning business, operations and compliance program of ALPS; (vi) information concerning EGA’s business and operations, portfolio management team and compliance program (vii) a copy of the current Form ADV for each of ALPS and EGA; (viii) information describing the New Fund’s anticipated operating expenses; and (x) memoranda from Stradley Ronon on the responsibilities of trustees in considering investment advisory arrangements under the 1940 Act. In addition, the Independent Trustees received data compiled by Thomson Reuters comparing the proposed fee rate for advisory services to be charged to the Trust to fees paid by other ETFs with similar investment objectives and policies at various asset levels.
During their review of this information, the Independent Trustees focused on and analyzed the factors that the Independent Trustees deemed relevant, including: the nature, quality, and extent of the services to be provided to the New Fund by ALPS and EGA; the personnel and operations of ALPS and EGA; the New Fund’s proposed expense level; the anticipated profitability, if any, to ALPS and EGA under the investment advisory agreement and sub-advisory agreement; any “fall-out” benefits to ALPS and EGA (i.e., the ancillary benefits realized due to a relationship with the Trust); the effect of asset growth on the New Fund’s expenses; and possible conflicts of interest. In particular, the Independent Trustees considered and discussed the following with respect to the New Fund:
1. Investment Advisory Agreement with ALPS
(a) The nature, extent, and quality of services to be provided to the New Fund by ALPS. The Independent Trustees reviewed the services that ALPS would provide to the New Fund. In connection with the investment advisory services to be provided to the New Fund, the Independent Trustees noted the responsibilities that ALPS would have as the New Fund’s investment adviser, including overall supervisory responsibility for the general management and investment of the New Fund’s securities portfolio, ultimate responsibility, subject to oversight by the Board, for oversight of the Trust’s sub-adviser, responsibility for daily monitoring of tracking error and quarterly reporting to the Board, and the implementation of Board directives as they relate to the New Fund.
The Independent Trustees reviewed ALPS’ experience, resources, and strengths in managing other ETFs, including the Titans Funds. Based on their consideration and review of the foregoing information, the Independent Trustees determined that the New Fund was likely to benefit from the nature, quality, and extent of these services, as well as ALPS’ ability to render such services based on its experience, operations, and resources.
(b) Comparison of services provided and fees charged by ALPS and other investment advisers to similar clients, and the cost of the services to be provided and profits to be realized by ALPS from the relationship with the New Fund. The Independent Trustees then compared both the services to be rendered and the proposed fees to be paid pursuant to other investment advisory contracts of ALPS, and to contracts of other investment advisers with respect to similar open-end registered investment companies, including the Titans Funds. In particular, the Independent Trustees compared the New Fund’s proposed advisory fee and projected expense ratios for its first year of operations to other investment companies considered to be in the New Fund’s peer group by Thomson Reuters. EGA shared its view with respect to the data compiled by Thomson Reuters, including limitations of such information. It was noted that EGA is proposing to enter into an expense limitation agreement whereby EGA would agree to reimburse expenses and/or waive fees to keep the expenses of the New Fund from exceeding 0.85% of average daily net assets for at least the first year of operations.
After comparing the New Fund’s proposed fee with those of other funds in the New Fund’s peer group, and in light of the nature, quality, and extent of services proposed to be provided by ALPS and the costs expected to be incurred by ALPS in rendering those services, the Independent Trustees concluded that the fee proposed to be paid to ALPS with respect to the New Fund was fair and reasonable.
(c) ALPS’ profitability and the extent to which economies of scale would be realized as the New Fund grows and whether fee levels would reflect such economies of scale. The Independent Trustees next considered potential economies of scale and the anticipated costs and projected profitability of ALPS in connection with its serving as investment adviser to the New Fund, including operational costs.
(d) Investment performance of ALPS. Because the New Fund had not commenced operations, the Independent Trustees could not consider the investment performance of the New Fund, but did take into account the investment performance of the EMTI Funds, for which ALPS serves as investment adviser.
38 EGA Emerging Global Shares Trust
Board Approval of Investment Advisory and Sub-Advisory Agreements (concluded)
Conclusion. No single factor was determinative to the decision of the Independent Trustees. Based on the foregoing and such other matters as were deemed relevant, the Independent Trustees concluded that the proposed advisory fee rate and projected total expense ratio are reasonable in relation to the services to be provided by ALPS to the New Fund, as well as the costs to be incurred and benefits to be gained by ALPS in providing such services. As a result, the Independent Trustees decided to recommend to the Board the approval of the amended investment advisory agreement with ALPS.
2. Sub-Advisory Agreement with EGA
(a) The nature, extent, and quality of services to be provided to the New Fund by EGA. The Independent Trustees reviewed the services that EGA would provide to the New Fund. In connection with the sub-advisory services to be provided to the New Fund, the Independent Trustees noted the significant responsibilities that EGA would have as the New Fund’s sub-adviser, including: supervision of the investment management program of the New Fund; management of the day-to-day investment and reinvestment of the assets in the New Fund; determining daily baskets of deposit securities and cash components; making determinations with respect to alternative cash management vehicles and securities lending collateral investments; and oversight of general portfolio compliance with relevant law.
The Independent Trustees reviewed EGA’s experience, resources, strengths and its performance as a sub-adviser to the EMTI Funds. Based on their consideration and review of the foregoing information, the Independent Trustees determined that the New Fund was likely to benefit from the nature, quality, and extent of these services, as well as EGA’s ability to render such services based on its experience, operations and resources.
(b) Comparison of services provided and fees charged by EGA and other investment advisers to similar clients, and the cost of the services to be provided and profits to be realized by EGA from the relationship with the New Fund. The Independent Trustees compared both the services to be rendered and the proposed fees to be paid for sub-advisory services to those of other investment advisers of similar ETFs. In particular, the Independent Trustees compared the New Fund’s proposed advisory fee and projected expense ratios for the first year of operations to other ETFs considered to be in the New Fund’s peer group, including the EMTI Funds. The Board noted that the New Fund’s proposed management fee and expenses (after giving the proposed fee waiver and expense limitation arrangements) was below the median of the range of the New Fund’s peer group.
The Independent Trustees noted EGA’s commitment initially to limit the New Fund’s expenses through a contractual written fee waiver and expense reimbursement agreement with the Trust, including the circumstances in which the Trust would have to repay fees in excess of the expense cap that were borne by EGA. After comparing the New Fund’s proposed fee with those of other funds in the New Fund’s peer group, including the EMTI Funds, and in light of the nature, quality, and extent of services proposed to be provided by EGA and the costs expected to be incurred by EGA in rendering those services and capping the Funds’ expenses, the Independent Trustees concluded that the fee proposed to be paid to EGA with respect to the New Fund was fair and reasonable.
(c) EGA’s profitability and the extent to which economies of scale would be realized as the New Fund grows and whether fee levels would reflect such economies of scale. The Independent Trustees considered the financial viability of EGA, including EGA’s capitalization and ability to maintain operations. The Independent Trustees then discussed potential economies of scale if the costs of managing the New Fund decreased. The Independent Trustees noted that, because the New Fund had not yet commenced operations, the eventual aggregate amount of assets was uncertain, and recognized the uncertainty in launching new investment products and estimating future asset levels.
(d) Investment performance of EGA. Because the New Fund had not commenced operations, the Independent Trustees could not consider the investment performance of the New Fund, but did take into account the investment performance of the EMTI Funds, for which EGA serves as sub-adviser.
Conclusion. No single factor was determinative to the decision of the Independent Trustees. Based on the foregoing and such other matters as were deemed relevant, such as the proposed fee waiver and expense limitation arrangement, the Independent Trustees concluded that the proposed sub-advisory fee and projected total expense ratio are reasonable in relation to the services to be provided by EGA to the New Fund, as well as the costs to be incurred and benefits to be gained by EGA in providing such services. As a result, the Independent Trustees decided to recommend to the Board the approval of the amended sub-advisory agreement with EGA. In light of the foregoing, the Board, including a majority of the Independent Trustees, approved the appointment of ALPS as the investment adviser to the New Fund, the approval of the amendment to the investment advisory agreement with ALPS, the appointment of EGA as sub-adviser to the New Fund and approval of the amendment to the sub-advisory agreement with EGA.
EGA Emerging Global Shares Trust 39
Board of Trustees and Officers (Unaudited)
The Trustees and officers of the Trust, along with their principal occupations over the past five years and their affiliations, if any, with EGA, are listed below. Unless otherwise noted, the address of each Trustee of the Trust is 171 East Ridgewood Ave., Ridgewood, NJ 07450.
| | | | | | | | | | |
|
| Name and Year of Birth | | Position(s)
Held with
Trust | | Office and
Length of
Time Served | | Principal Occupation(s)
During Past 5 Years | | Portfolios in
Fund Complex
Overseen by
Trustee | | Other
Directorships
Held by Trustee |
|
| Independent Trustees | | | | | | | | |
Robert Willens,
1946 | | Trustee | | Since 2009 | | Robert Willens, LLC (tax consulting), President, since January, 2008; Lehman Brothers, Inc., Managing Director, Equity Research Department, January 2004 to January 2008. | | 6 | | Daxor Corp. (Medical Products and Biotechnology), since 2004. |
| | | | | | | | | | | |
| Ron Safir, 1951 | | Trustee | | Since 2009 | | Retired, since 2008; UBS Wealth Management, Chief Administrative Officer, February 1971 to December 2008. | | 6 | | None |
| | | | | | | | | | | |
Jeffrey D. Haroldson,
1957 | | Trustee | | Since 2009 | | HDG Mansur Capital Group, LLC, President and Chief Operating Officer, since 2004. | | 6 | | None |
|
|
|
|
| Interested Trustees | | | | | | | | |
| | | | | | | | | | | |
Robert C. Holderith,
1960 | | Trustee and
President | | Since 2008 | | Emerging Global Advisors, LLC, Managing Member and Chief Executive Officer, since September 2008; ProFund Advisors, Managing Director, Institutional Sales & Investment Analytics, June 2006 to August 2008; UBS Financial Services, Inc., Director, January 2000 to May 2006. | | 6 | | None |
| | | | | | | | | | | |
James J. Valenti,
1947 | | Trustee and
Secretary | | Since 2008 | | Emerging Global Advisors, LLC, Member and Chief Administrative Officer, since September 2008; Private Investor and Independent Consultant, June 2007 to September 2008; Senior Loan Consultant, Bridgepoint Mortgage Company, June 2006 to June 2007; Mercedes Benz, North America, Sales Representative, November 2000 to June 2006. | | 6 | | None |
| | | | | | |
|
Name, Address
and Year of Birth | | Position(s)
Held with
the Trust | | Office and
Length of
Time Served | | Principal Occupation(s) During Past 5 Years |
|
| Officers | | | | | | |
| | | | | | | |
Thomas A. Carter
ALPS Fund Services, Inc.
1290 Broadway
Suite 1100
Denver, CO 80203
1966 | | Treasurer | | Since 2009 | | ALPS Fund Services, Inc., Director, since October 2005; ALPS Advisors, Inc., President and Director, since September 2008; ALPS Distributors, Inc., President and Director, since September 2008; FTAM Funds Distributor, Inc., President and Director, since September 2008; ALPS Holdings, Inc., Director, since October 2005; and ALPS ETF Trust, President and Trustee, since March 2008. |
| | | | | | | |
Melanie H. Zimdars
ALPS Fund Services, Inc.
1290 Broadway
Suite 1100
Denver, CO 80203
1976 | | Chief
Compliance
Officer | | Since 2010 | | ALPS Fund Services, Inc., Deputy Chief Compliance Officer, since September 2009; ALPS ETF Trust, Chief Compliance Officer, since December 2009; EGA Emerging Global Shares Trust, Chief Compliance Officer, since March 2010; Financial Investors Variable Insurance Trust, Chief Compliance Officer, since September 2009; Liberty All-Star Growth Fund, Inc., Chief Compliance Officer, since December 2009; Liberty All-Star Equity Fund, Chief Compliance Officer, since December 2009; Wasatch Funds, Principal Financial Officer, Treasurer and Secretary, February 2007 to December 2008; Wasatch Funds, Assistant Treasurer, November 2006 to February 2007; Wasatch Funds, Senior Compliance Officer, 2005 to December 2008. |
40 EGA Emerging Global Shares Trust
General Information (Unaudited)
Investment Adviser
ALPS Advisors, Inc.
1290 Broadway, Suite 1100
Denver, CO 80203
Sub-Adviser
Emerging Global Advisors, LLC
171 East Ridgewood Ave.
Ridgewood, NJ 07450
Distributor
ALPS Distributors, Inc.
1290 Broadway, Suite 1100
Denver, CO 80203
Administrator, Custodian and Transfer Agent
The Bank of New York Mellon
101 Barclay Street
New York, NY 10286
Independent Registered Public Accounting Firm
BBD, LLP
1835 Market Street, 26th Floor
Philadelphia, PA 19103
You may obtain a description of the EGA Funds’ proxy voting, policies, procedures and information regarding how each Fund voted proxies relating to portfolio securities during the most recent 12-month period ending June 30 (available by August 31) without charge, upon request, by calling 1-888-800-4347 or visiting the Funds’ website www.egshares.com, or by accessing the SEC’s website at www.sec.gov. Such reports may be reviewed and copied at the SEC’s Public Reference Room in Washington, DC. Information on the operation of the Public Reference Room may be obtained by calling 202-942-8090.
The Trust files complete schedules of the portfolio holdings with the SEC for the first and third quarters on Form N-Q. The Form N-Q is available without charge, upon request, by calling 1-800-SEC-0330, or by accessing the SEC’s website, at www.SEC.Gov. It may also be reviewed and copied at the SEC’s Public Reference Room in Washington, DC.
This report has been prepared for shareholders and may be distributed to others only if preceded or accompanied by an effective prospectus, which includes information regarding the Funds’ objectives and polices, experienced of its management, marketability of shares and other information.
EGA Emerging Global Shares Trust 41

171 East Ridgewood Avenue
Ridgewood, NJ 07450
(201) 389-6872
470 Park Avenue South, 8th Floor
New York, NY 10016
(888) 800-4EGS (4347)
www.egshares.com
EGA EMERGING GLOBAL SHARES TRUST
EMERGING GLOBAL SHARES DOW JONES EMERGING MARKETS
TITANS COMPOSITE INDEX FUND
EMERGING GLOBAL SHARES DOW JONES EMERGING MARKETS
ENERGY TITANS INDEX FUND
EMERGING GLOBAL SHARES DOW JONES EMERGING MARKETS
METALS & MINING TITANS INDEX FUND
EMERGING GLOBAL SHARES DOW JONES EMERGING MARKETS
FINANCIALS TITANS INDEX FUND
EMERGING GLOBAL SHARES INDXX
CHINA INFRASTRUCTURE INDEX FUND
EMERGING GLOBAL SHARES INDXX
BRAZIL INFRASTRUCTURE INDEX FUND
Emerging Global Shares are distributed by ALPS Distributors Inc.
Item 2. Code of Ethics.
(a). As of the end of the period covered by this report, the Registrant has adopted a code of ethics that applies to the Registrant’s principal executive officer, principal financial officer or persons performing similar functions (“Code of Ethics”).
(b). Not Applicable
(c). There has been no amendment to the Registrant’s Code of Ethics during the fiscal year ending March 31, 2010 (“Reporting Period”).
(d). Registrant granted no waivers from the provisions of its Code of Ethics during the Reporting Period.
(e). Not Applicable
(f). Attached
Item 3. Audit Committee Financial Expert.
(a). The Registrant’s Board of Trustees has determined that its Audit Committee has one “audit committee financial expert”, as that term is defined under Items 3(b) and 3(c), serving on its Audit Committee. Mr. Robert Willens, the Registrant’s audit committee financial expert, is “independent”, as that term is defined under Item 3(a)(2).
Item 4. Principal Accountant Fees and Services.
The principal accountant fees disclosed in Items 4(a)-(d) are for the six funds of the Registrant that had a fiscal year ending March 31, 2010 and whose financial statements are reported in Item 1.
(a). Audit Fees: the aggregate fees billed in each of the last two fiscal years for professional services rendered by the principal accountant for the audit are as follows:
2010: $67,000
2009: N/A
(b). Audit-Related Fees: the aggregate fees billed in each of the last two fiscal years for assurance and related services by the principal accountant that are reasonably related to the performance of
the audit of the Registrant’s financial statements and are not reported under paragraph (a) of this item are as follows:
2010: $0
2009: N/A
(c). Tax Fees: the aggregate fees billed in each of the previous last two fiscal years for professional services rendered by the principal accountant for tax compliance, tax advice, and tax planning are as follows:
2010: $0
2009: N/A
The Tax Fees represent services provided in connection with the preparation of tax returns, year-end distribution review, qualifying dividend income analysis and computation of foreign tax credit pass-through.
(d). All Other Fees: the aggregate fees billed in each of the last two fiscal years for products and services provided by the principal accountant, other than the services reported in paragraphs (a) and (c) of this Item are as follows:
2010: $0
2009: N/A
(e) Audit Committee Pre-Approval Policies and Procedures.
| | (i) | Per Rule 2-01(c)(7)(A) and the charter of the Registrant’s Audit Committee, the Audit Committee approves and recommends the principal accountant for the Registrant, pre-approves (i) the principal accountant’s provision of all audit and permissible non-audit services to the Registrant (including the fees and other compensation to be paid to the principal accountant), and (ii) the principal accountant’s provision of any permissible non-audit services to the Registrant’s investment adviser (the “Adviser”), sub-adviser or any entity controlling, controlled by, or under common control with any investment adviser or sub-adviser, if the engagement relates directly to the operations of the financial reporting of the Trust. |
| | | |
| | (ii) | 100% of services described in each of Items 4(b) through (d) were approved by the Audit Committee pursuant to paragraph (c)(7)(A) of Rule 2-01 of Regulation S-X. |
(f) Less than 50% of the hours expended on the principal accountant’s engagement to audit Registrant’s financial statements were attributed to work performed by persons other than the accountant’s full-time, permanent employees.
(g) The aggregate non-audit fees billed by the accountant for services rendered to the Registrant, the Adviser and any entity controlling, controlled by, or under common control with
the Adviser that provides ongoing services to the Registrant (except for any sub-advisor whose role is primarily portfolio management and is subcontracted with or overseen by another investment advisor) for the last two fiscal years is as following:
2010: $0
2009: N/A
(h) Not Applicable
Item 5. Audit Committee of Listed Registrants.
(a) The Registrant is an issuer as defined in Section 10A-3 of the Securities Exchange Act of 1934 and has a separately-designated standing Audit Committee in accordance with Section 3(a)(58)(A) of such Act. All of the Board’s independent Trustees, Robert Willens, Ron Safir and Jeffrey D. Haroldson, are members of Audit Committee.
(b) Not Applicable.
Item 6. Schedule of Investments.
(a) Schedule is included as part of the report to shareholders filed under Item 1 of this Form.
(b) Not Applicable.
Item 7. Disclosure of Proxy Voting Policies and Procedures for Closed-End Management Investment Companies.
Not Applicable.
Item 8. Portfolio Managers of Closed-End Management Investment Companies.
Not Applicable.
Item 9. Purchases of Equity Securities by Closed-End Management Investment Company & Affiliated Purchasers.
Not Applicable.
Item 10. Submission of Matters to a Vote of Security Holders.
Not Applicable.
Item 11. Controls and Procedures.
(a) The Chief Executive Officer and Chief Financial Officer have evaluated the Registrant's disclosure controls and procedures within 90 days of the filing date of this report and have concluded that these controls and procedures are effective.
(b) There were no significant changes in the Registrant's internal controls over financial reporting or in other factors that could significantly affect these controls subsequent to the date of their evaluation.
Item 12. Exhibits.
(a)(1) Any code of ethics, or amendment thereto, that is the subject of the disclosure required by Item 2 is attached hereto.
(b) Certifications for each Principal Executive Officer and Principal Financial Officer of the Registrant as required by Rule 30a-2(a) under the 1940 Act (17CFR 270.30a-(a)).
SIGNATURES
Pursuant to the requirements of the Securities Exchange Act of 1934 and the Investment Company Act of 1940, the Registrant has duly caused this report to be signed on its behalf by the undersigned, thereunto duly authorized.
Registrant: EGA Emerging Global Shares Trust
By: /s/ Robert C. Holderith
Robert C. Holderith, Chief Executive Officer
Date: May 28, 2010
Pursuant to the requirements of the Securities Exchange Act of 1934 and the Investment Company Act of 1940, this report has been signed below by the following persons on behalf of the Registrant and in the capacities and on the dates indicated.
Registrant: EGA Emerging Global Shares Trust
By: /s/ Robert C. Holderith
Robert C. Holderith, Chief Executive Officer
Date: May 28, 2010
By: /s/ Thomas A. Carter
Thomas A. Carter, Chief Financial Officer
Date: May 28, 2010