Table of Contents
UNITED STATES
SECURITIES AND EXCHANGE COMMISSION
Washington, D.C. 20549
FORMN-CSR
CERTIFIED SHAREHOLDER REPORT OF REGISTERED
MANAGEMENT INVESTMENT COMPANIES
Investment Company Act file number:811-22311
Schwab Strategic Trust – U.S. Equity ETFs and International Equity ETFs
(Exact name of registrant as specified in charter)
211 Main Street, San Francisco, California 94105
(Address of principal executive offices) (Zip code)
Jonathan de St. Paer
Schwab Strategic Trust – U.S. Equity ETFs and International Equity ETFs
211 Main Street, San Francisco, California 94105
(Name and address of agent for service)
Registrant’s telephone number, including area code: (415)636-7000
Date of fiscal year end: August 31
Date of reporting period: August 31, 2019
Item 1: Report(s) to Shareholders.
Table of Contents

| Schwab International Equity ETF | SCHF |
| Schwab International Small-Cap Equity ETF | SCHC |
| Schwab Emerging Markets Equity ETF | SCHE |
| New Notice Regarding Shareholder Report Delivery Options |
| Beginning on January 1, 2021, paper copies of a fund’s shareholder reports will no longer be sent by mail, unless you specifically request paper copies of the reports from your financial intermediary (such as a bank or broker-dealer). Instead, the reports will be made available on a fund’s websitewww.schwabfunds.com/schwabetfs_prospectus, and you will be notified by mail each time a report is posted and the mailing will provide a website link to access the report. You will continue to receive other fund regulatory documents (such as prospectuses or supplements) in paper unless you have elected to receive all fund documents electronically. |
| If you would like to receive a fund’s future shareholder reports in paper free of charge after January 1, 2021, you can make that request: |
| • If you invest through Charles Schwab & Co, Inc. (broker-dealer), by calling 1-866-345-5954 and using the unique identifier attached to this mailing; or |
| • If you invest through another financial intermediary (such as a bank or broker-dealer) by contacting them directly. |
| If you already receive shareholder reports and other fund documents electronically, you will not be affected by this change and you need not take any action. |
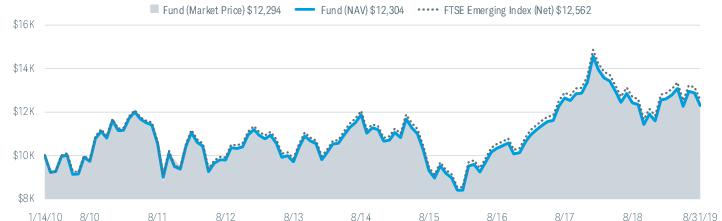
| Total Returns for the 12 Months Ended August 31, 2019 | |
| Schwab International Equity ETF (Ticker Symbol: SCHF) | |
| Market Price Return1 | -3.61% |
| NAV Return1 | -3.79% |
| FTSE Developed ex US Index (Net)* | -3.95% |
| ETF Category: Morningstar Foreign Large Blend2 | -4.13% |
| Performance Details | pages 8-10 |
| Schwab International Small-Cap Equity ETF (Ticker Symbol: SCHC) | |
| Market Price Return1 | -10.42% |
| NAV Return1 | -10.57% |
| FTSE Developed Small Cap ex US Liquid Index (Net)* | -10.71% |
| ETF Category: Morningstar Foreign Small/Mid Blend2 | -9.97% |
| Performance Details | pages 11-13 |
| Schwab Emerging Markets Equity ETF (Ticker Symbol: SCHE) | |
| Market Price Return1 | -0.95% |
| NAV Return1 | -0.97% |
| FTSE Emerging Index (Net)* | -0.99% |
| ETF Category: Morningstar Diversified Emerging Markets2 | -2.54% |
| Performance Details | pages 14-16 |
| * | The total return cited for the index is calculated net of foreign withholding taxes; the underlying tax rate information is available from FTSE. |
| 1 | ETF performance must be shown based on both a market price and NAV basis. The fund’s per share NAV is the value of one share of the fund. NAV is calculated by taking the fund’s total assets (including the market value of securities owned), subtracting liabilities, and dividing by the number of shares outstanding. The NAV Return is based on the NAV of the fund, and the Market Price Return is based on the market price per share of the fund. The price used to calculate market return (Market Price) is determined using the Official Closing Price on the primary stock exchange (generally, 4:00 p.m. Eastern time) and may not represent the returns you would receive if shares were traded at other times. Market Price and NAV returns assume that dividends and capital gain distributions have been reinvested in the fund at Market Price and NAV, respectively. |
| 2 | Source for category information: Morningstar, Inc. The Morningstar Category return represents all passively- and actively-managed ETFs within the category as of the report date. |

President and CEO of
Charles Schwab Investment
Management, Inc. and the
funds covered in this report.
| * | The net version of the index reflects reinvested dividends net of withholding taxes, but reflects no deductions for expenses or other taxes. |
| 1 | Schwab Center for Financial Research. (2019, May 24). Why Waiting for a Market Rebound Could Cost You. |


| * | The net version of the index reflects reinvested dividends net of withholding taxes, but reflects no deductions for expenses or other taxes. |
 | Christopher Bliss, CFA, Vice President and Head of Passive Equity Strategies, leads the portfolio management team for Schwab’s passive equity mutual funds and ETFs. He also has overall responsibility for all aspects of the management of the funds. Prior to joining CSIM in 2016, Mr. Bliss spent 12 years at BlackRock (formerly Barclays Global Investors) managing and leading institutional index teams, most recently as a managing director and head of the Americas institutional index team. Prior to BlackRock, he worked as an equity analyst and portfolio manager for Harris Bretall and before that, as a research analyst for JP Morgan. |
 | Chuck Craig, CFA, Senior Portfolio Manager, is responsible for the day-to-day co-management of the funds. Prior to joining CSIM in 2012, Mr. Craig worked at Guggenheim Funds (formerly Claymore Group), where he spent more than five years as a managing director of portfolio management and supervision, and three years as vice president of product research and development. Prior to that, he worked as an equity research analyst at First Trust Portfolios (formerly Niké Securities), and a trader and analyst at PMA Securities, Inc. |
 | Jane Qin, Portfolio Manager, is responsible for the day-to-day co-management of the funds. Prior to joining CSIM in 2012, Ms. Qin spent more than four years at The Bank of New York Mellon Corporation. During that time, Ms. Qin spent more than two years as an associate equity portfolio manager and nearly two years as a performance analyst. She also worked at Wells Fargo Funds Management as a mutual fund analyst and at CIGNA Reinsurance in the risk management group as a risk analyst. |
 | David Rios, Portfolio Manager, is responsible for the day-to-day co-management of the funds. He joined CSIM in 2008 and became a Portfolio Manager in 2014. Prior to this role, Mr. Rios served as an Associate Portfolio Manager on the Schwab Equity Index Strategies team for four years. His first role with CSIM was as a trade operations specialist. He also previously worked as a senior fund accountant at Investors Bank & Trust (subsequently acquired by State Street Corporation). |
| 1 | The total return cited for the index is calculated net of foreign withholding taxes; the underlying tax rate information is available from FTSE. |
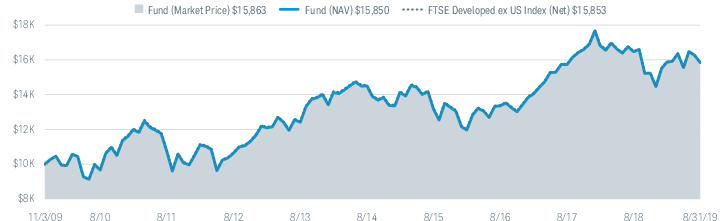
| Fund and Inception Date | 1 Year | 5 Years | Since Inception* |
| Fund: Schwab International Equity ETF (11/3/09) | |||
| Market Price Return2 | -3.61% | 1.78% | 4.81% |
| NAV Return2 | -3.79% | 1.78% | 4.80% |
| FTSE Developed ex US Index (Net)3 | -3.95% | 1.70% | 4.80% |
| ETF Category: Morningstar Foreign Large Blend4 | -4.13% | 1.56% | N/A |
| Fund Expense Ratio5: 0.06% | |||
| * | Inception (11/3/09) represents the date that the shares began trading in the secondary market. |
| 1 | Performance does not reflect the deduction of taxes that a shareholder would pay on fund distributions or on the redemption or sale of fund shares. |
| 2 | ETF performance must be shown based on both a market price and NAV basis. The fund’s per share NAV is the value of one share of the fund. NAV is calculated by taking the fund’s total assets (including the market value of securities owned), subtracting liabilities, and dividing by the number of shares outstanding. The NAV Return is based on the NAV of the fund, and the Market Price Return is based on the market price per share of the fund. The price used to calculate market return (Market Price) is determined using the Official Closing Price on the primary stock exchange (generally, 4:00 p.m. Eastern time) and may not represent the returns you would receive if shares were traded at other times. NAV is used as a proxy for purposes of calculating Market Price Return on inception date. Market Price and NAV returns assume that dividends and capital gain distributions have been reinvested in the fund at Market Price and NAV, respectively. |
| 3 | The total return cited for the index is calculated net of foreign withholding taxes; the underlying tax rate information is available from FTSE. |
| 4 | Source for category information: Morningstar, Inc. The Morningstar Category return represents all passively- and actively-managed ETFs within the category as of the report date. |
| 5 | As stated in the prospectus. |
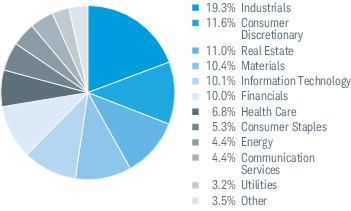
| Number of Holdings | 1,481 |
| Weighted Average Market Cap (millions) | $59,781 |
| Price/Earnings Ratio (P/E) | 14.5 |
| Price/Book Ratio (P/B) | 1.5 |
| Portfolio Turnover Rate | 8%2 |

| 1 | Excludes derivatives. |
| 2 | Portfolio turnover rate excludes securities received or delivered from processing of in-kind creations or redemptions. |
| 3 | This list is not a recommendation of any security by the investment adviser. |
| 4 | The percentage may differ from the Portfolio Holdings because the above calculation is based on a percentage of total investments, excluding derivatives, whereas the calculation in the Portfolio Holdings is based on a percentage of net assets. |
| 1 | The total return cited for the index is calculated net of foreign withholding taxes; the underlying tax rate information is available from FTSE. |
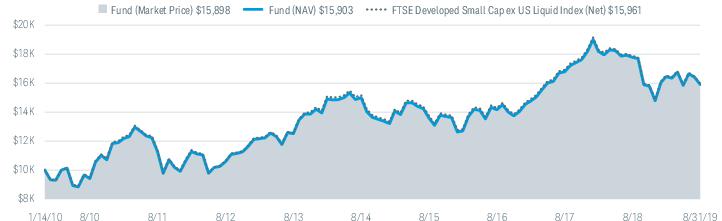
| Fund and Inception Date | 1 Year | 5 Years | Since Inception* |
| Fund: Schwab International Small-Cap Equity ETF (1/14/10) | |||
| Market Price Return2 | -10.42% | 1.12% | 4.93% |
| NAV Return2 | -10.57% | 1.18% | 4.94% |
| FTSE Developed Small Cap ex US Liquid Index (Net)3 | -10.71% | 1.02% | 4.98% |
| ETF Category: Morningstar Foreign Small/Mid Blend4 | -9.97% | 2.20% | N/A |
| Fund Expense Ratio5: 0.12% | |||
| * | Inception (1/14/10) represents the date that the shares began trading in the secondary market. |
| 1 | Performance does not reflect the deduction of taxes that a shareholder would pay on fund distributions or on the redemption or sale of fund shares. |
| 2 | ETF performance must be shown based on both a market price and NAV basis. The fund’s per share NAV is the value of one share of the fund. NAV is calculated by taking the fund’s total assets (including the market value of securities owned), subtracting liabilities, and dividing by the number of shares outstanding. The NAV Return is based on the NAV of the fund, and the Market Price Return is based on the market price per share of the fund. The price used to calculate market return (Market Price) is determined using the Official Closing Price on the primary stock exchange (generally, 4:00 p.m. Eastern time) and may not represent the returns you would receive if shares were traded at other times. NAV is used as a proxy for purposes of calculating Market Price Return on inception date. Market Price and NAV returns assume that dividends and capital gain distributions have been reinvested in the fund at Market Price and NAV, respectively. |
| 3 | The total return cited for the index is calculated net of foreign withholding taxes; the underlying tax rate information is available from FTSE. |
| 4 | Source for category information: Morningstar, Inc. The Morningstar Category return represents all passively- and actively-managed ETFs within the category as of the report date. |
| 5 | As stated in the prospectus. |
| Number of Holdings | 2,119 |
| Weighted Average Market Cap (millions) | $2,343 |
| Price/Earnings Ratio (P/E) | 14.0 |
| Price/Book Ratio (P/B) | 1.3 |
| Portfolio Turnover Rate | 20%2 |
| 1 | Excludes derivatives. |
| 2 | Portfolio turnover rate excludes securities received or delivered from processing of in-kind creations or redemptions. |
| 3 | This list is not a recommendation of any security by the investment adviser. |
| 4 | The percentage may differ from the Portfolio Holdings because the above calculation is based on a percentage of total investments, excluding derivatives, whereas the calculation in the Portfolio Holdings is based on a percentage of net assets. |
| 1 | The total return cited for the index is calculated net of foreign withholding taxes; the underlying tax rate information is available from FTSE. |
| Fund and Inception Date | 1 Year | 5 Years | Since Inception* |
| Fund: Schwab Emerging Markets Equity ETF (1/14/10) | |||
| Market Price Return2 | -0.95% | 0.62% | 2.17% |
| NAV Return2 | -0.97% | 0.71% | 2.18% |
| FTSE Emerging Index (Net)3 | -0.99% | 0.83% | 2.40% |
| ETF Category: Morningstar Diversified Emerging Markets4 | -2.54% | 0.02% | N/A |
| Fund Expense Ratio5: 0.13% | |||
| * | Inception (1/14/10) represents the date that the shares began trading in the secondary market. |
| 1 | Performance does not reflect the deduction of taxes that a shareholder would pay on fund distributions or on the redemption or sale of fund shares. |
| 2 | ETF performance must be shown based on both a market price and NAV basis. The fund’s per share NAV is the value of one share of the fund. NAV is calculated by taking the fund’s total assets (including the market value of securities owned), subtracting liabilities, and dividing by the number of shares outstanding. The NAV Return is based on the NAV of the fund, and the Market Price Return is based on the market price per share of the fund. The price used to calculate market return (Market Price) is determined using the Official Closing Price on the primary stock exchange (generally, 4:00 p.m. Eastern time) and may not represent the returns you would receive if shares were traded at other times. NAV is used as a proxy for purposes of calculating Market Price Return on inception date. Market Price and NAV returns assume that dividends and capital gain distributions have been reinvested in the fund at Market Price and NAV, respectively. |
| 3 | The total return cited for the index is calculated net of foreign withholding taxes; the underlying tax rate information is available from FTSE. |
| 4 | Source for category information: Morningstar, Inc. The Morningstar Category return represents all passively- and actively-managed ETFs within the category as of the report date. |
| 5 | As stated in the prospectus. |
| Number of Holdings | 1,203 |
| Weighted Average Market Cap (millions) | $83,743 |
| Price/Earnings Ratio (P/E) | 13.3 |
| Price/Book Ratio (P/B) | 1.7 |
| Portfolio Turnover Rate | 13%2 |
| 1 | Excludes derivatives. |
| 2 | Portfolio turnover rate excludes securities received or delivered from processing of in-kind creations or redemptions. |
| 3 | This list is not a recommendation of any security by the investment adviser. |
| 4 | The percentage may differ from the Portfolio Holdings because the above calculation is based on a percentage of total investments, excluding derivatives, whereas the calculation in the Portfolio Holdings is based on a percentage of net assets. |
| Expense Ratio (Annualized)1 | Beginning Account Value at 3/1/19 | Ending Account Value (Net of Expenses) at 8/31/19 | Expenses Paid During Period 3/1/19-8/31/192 | |
| Schwab International Equity ETF | ||||
| Actual Return | 0.06% | $1,000.00 | $999.00 | $0.30 |
| Hypothetical 5% Return | 0.06% | $1,000.00 | $1,024.90 | $0.31 |
| Schwab International Small-Cap Equity ETF | ||||
| Actual Return | 0.12% | $1,000.00 | $966.70 | $0.59 |
| Hypothetical 5% Return | 0.12% | $1,000.00 | $1,024.60 | $0.61 |
| Schwab Emerging Markets Equity ETF | ||||
| Actual Return | 0.13% | $1,000.00 | $975.50 | $0.65 |
| Hypothetical 5% Return | 0.13% | $1,000.00 | $1,024.54 | $0.66 |
| 1 | Based on the most recent six-month expense ratio. |
| 2 | Expenses for each fund are equal to its annualized expense ratio, multiplied by the average account value over the period, multiplied by 184 days of the period, and divided by 365 days of the fiscal year. |
| 9/1/18– 8/31/19 | 9/1/17– 8/31/18 | 9/1/16– 8/31/17 | 9/1/15– 8/31/16 | 9/1/14– 8/31/15 | ||
| Per-Share Data | ||||||
| Net asset value at beginning of period | $33.25 | $32.51 | $28.32 | $28.55 | $32.37 | |
| Income (loss) from investment operations: | ||||||
| Net investment income (loss)1 | 1.00 | 0.98 | 0.88 | 0.84 | 0.87 | |
| Net realized and unrealized gains (losses) | (2.30) | 0.56 | 4.02 | (0.45) | (3.85) | |
| Total from investment operations | (1.30) | 1.54 | 4.90 | 0.39 | (2.98) | |
| Less distributions: | ||||||
| Distributions from net investment income | (1.13) | (0.80) | (0.71) | (0.62) | (0.84) | |
| Net asset value at end of period | $30.82 | $33.25 | $32.51 | $28.32 | $28.55 | |
| Total return | (3.79%) | 4.70% | 17.76% | 1.47% | (9.27%) | |
| Ratios/Supplemental Data | ||||||
| Ratios to average net assets: | ||||||
| Total expenses | 0.06% | 0.06% | 0.06%2 | 0.08% | 0.08% | |
| Net investment income (loss) | 3.22% | 2.91% | 2.95% | 3.06% | 2.86% | |
| Portfolio turnover rate3 | 8% | 5% | 5% | 5% | 4% | |
| Net assets, end of period (x 1,000) | $18,138,537 | $16,294,052 | $11,413,011 | $6,168,595 | $4,042,603 | |
| Security | Number of Shares | % of Net Assets | Value ($) | |
| Common Stock98.8% of net assets | ||||
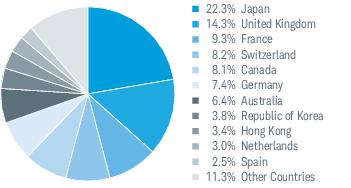
| Australia 6.4% | ||||
| BHP Group Ltd. | 3,316,925 | 0.5 | 81,100,105 | |
| Commonwealth Bank of Australia | 1,993,408 | 0.6 | 106,168,789 | |
| CSL Ltd. | 515,171 | 0.5 | 83,605,128 | |
| Westpac Banking Corp. | 3,881,836 | 0.4 | 73,806,224 | |
| Other Securities | 4.4 | 813,897,710 | ||
| 6.4 | 1,158,577,956 | |||
| Austria 0.2% | ||||
| Other Securities | 0.2 | 34,970,237 | ||
| Belgium 0.9% | ||||
| Anheuser-Busch InBev S.A. | 866,107 | 0.5 | 82,217,591 | |
| Other Securities | 0.4 | 79,602,501 | ||
| 0.9 | 161,820,092 | |||
| Canada 8.0% | ||||
| Canadian National Railway Co. | 813,602 | 0.4 | 75,065,928 | |
| Enbridge, Inc. | 2,222,316 | 0.4 | 74,473,007 | |
| Royal Bank of Canada | 1,638,833 | 0.7 | 122,813,810 | |
| The Bank of Nova Scotia | 1,383,170 | 0.4 | 73,696,896 | |
| The Toronto-Dominion Bank | 2,072,619 | 0.6 | 112,615,211 | |
| Other Securities | 5.5 | 996,160,060 | ||
| 8.0 | 1,454,824,912 | |||
| Denmark 1.5% | ||||
| Novo Nordisk A/S, B Shares | 1,861,306 | 0.5 | 96,850,811 | |
| Other Securities | 1.0 | 180,635,550 | ||
| 1.5 | 277,486,361 | |||
| Finland 1.0% | ||||
| Other Securities | 1.0 | 186,818,270 | ||
| France 9.3% | ||||
| Air Liquide S.A. | 474,536 | 0.4 | 66,185,110 | |
| Airbus SE | 618,214 | 0.5 | 85,332,498 | |
| Danone S.A. | 669,190 | 0.3 | 60,031,581 | |
| L'Oreal S.A. | 270,229 | 0.4 | 73,980,798 | |
| LVMH Moet Hennessy Louis Vuitton SE | 280,766 | 0.6 | 112,051,748 | |
| Sanofi | 1,219,089 | 0.6 | 104,877,803 | |
| Total S.A. | 2,710,428 | 0.8 | 135,482,746 | |
| Other Securities | 5.7 | 1,047,982,523 | ||
| 9.3 | 1,685,924,807 | |||
| Security | Number of Shares | % of Net Assets | Value ($) | |
| Germany 7.0% | ||||
| adidas AG | 219,479 | 0.4 | 65,186,828 | |
| Allianz SE | 472,934 | 0.6 | 104,424,126 | |
| BASF SE | 1,028,232 | 0.4 | 68,144,252 | |
| Bayer AG | 1,050,852 | 0.4 | 77,929,269 | |
| Deutsche Telekom AG | 3,617,574 | 0.3 | 60,458,960 | |
| SAP SE | 1,096,823 | 0.7 | 131,175,373 | |
| Siemens AG | 849,294 | 0.5 | 85,064,175 | |
| Other Securities | 3.7 | 671,420,057 | ||
| 7.0 | 1,263,803,040 | |||
| Hong Kong 3.3% | ||||
| AIA Group Ltd. | 13,628,774 | 0.7 | 132,628,921 | |
| Other Securities | 2.6 | 474,520,989 | ||
| 3.3 | 607,149,910 | |||
| Ireland 0.2% | ||||
| Other Securities | 0.2 | 35,514,241 | ||
| Israel 0.4% | ||||
| Other Securities | 0.4 | 79,226,093 | ||
| Italy 2.1% | ||||
| Enel S.p.A. | 8,815,409 | 0.4 | 64,014,350 | |
| Other Securities | 1.7 | 326,435,355 | ||
| 2.1 | 390,449,705 | |||
| Japan 22.3% | ||||
| Keyence Corp. | 101,041 | 0.3 | 59,875,443 | |
| Mitsubishi UFJ Financial Group, Inc. | 13,975,047 | 0.4 | 67,199,246 | |
| SoftBank Group Corp. | 1,926,923 | 0.5 | 87,573,381 | |
| Sony Corp. | 1,406,635 | 0.5 | 80,068,667 | |
| Toyota Motor Corp. | 2,823,090 | 1.0 | 185,111,936 | |
| Other Securities | 19.6 | 3,560,092,454 | ||
| 22.3 | 4,039,921,127 | |||
| Netherlands 3.0% | ||||
| ASML Holding N.V. | 442,518 | 0.5 | 98,561,069 | |
| Unilever N.V. | 1,633,012 | 0.6 | 101,499,129 | |
| Other Securities | 1.9 | 348,871,376 | ||
| 3.0 | 548,931,574 | |||
| New Zealand 0.3% | ||||
| Other Securities | 0.3 | 48,582,730 | ||
| Security | Number of Shares | % of Net Assets | Value ($) | |
| Norway 0.6% | ||||
| Other Securities | 0.6 | 110,247,442 | ||
| Poland 0.3% | ||||
| Other Securities | 0.3 | 51,766,256 | ||
| Portugal 0.1% | ||||
| Other Securities | 0.1 | 24,290,643 | ||
| Republic of Korea 3.6% | ||||
| Samsung Electronics Co., Ltd. | 5,289,728 | 1.1 | 192,155,238 | |
| Other Securities | 2.5 | 455,377,464 | ||
| 3.6 | 647,532,702 | |||
| Singapore 1.2% | ||||
| Other Securities | 1.2 | 210,625,854 | ||
| Spain 2.5% | ||||
| Banco Santander S.A. | 18,015,863 | 0.3 | 68,249,496 | |
| Iberdrola S.A. | 7,019,929 | 0.4 | 72,297,479 | |
| Other Securities | 1.8 | 306,332,801 | ||
| 2.5 | 446,879,776 | |||
| Sweden 2.2% | ||||
| Other Securities | 2.2 | 400,254,614 | ||
| Switzerland 8.1% | ||||
| Nestle S.A. | 3,355,283 | 2.1 | 376,407,512 | |
| Novartis AG | 2,464,978 | 1.2 | 221,747,124 | |
| Roche Holding AG | 783,410 | 1.2 | 214,251,095 | |
| Other Securities | 3.6 | 660,337,220 | ||
| 8.1 | 1,472,742,951 | |||
| United Kingdom 14.3% | ||||
| AstraZeneca plc | 1,477,317 | 0.7 | 131,661,864 | |
| BP plc | 22,377,584 | 0.8 | 136,317,239 | |
| British American Tobacco plc | 2,568,986 | 0.5 | 90,104,841 | |
| Diageo plc | 2,624,340 | 0.6 | 111,973,724 | |
| GlaxoSmithKline plc | 5,514,703 | 0.6 | 114,952,469 | |
| HSBC Holdings plc | 22,775,731 | 0.9 | 164,039,163 | |
| Rio Tinto plc | 1,240,480 | 0.4 | 62,687,281 | |
| Royal Dutch Shell plc, A Shares | 4,948,725 | 0.8 | 137,139,973 | |
| Royal Dutch Shell plc, B Shares | 4,251,034 | 0.7 | 117,261,834 | |
| Unilever plc | 1,225,395 | 0.4 | 77,542,383 | |
| Other Securities | 7.9 | 1,445,261,966 | ||
| 14.3 | 2,588,942,737 | |||
| Total Common Stock | ||||
| (Cost $17,366,469,751) | 17,927,284,030 | |||
| Security | Number of Shares | % of Net Assets | Value ($) | |
| Preferred Stock0.7% of net assets | ||||
| Germany 0.5% | ||||
| Other Securities | 0.5 | 79,514,178 | ||
| Italy 0.0% | ||||
| Other Securities | 0.0 | 3,593,556 | ||
| Republic of Korea 0.2% | ||||
| Other Securities | 0.2 | 36,376,892 | ||
| Spain 0.0% | ||||
| Other Securities | 0.0 | 5,617,842 | ||
| Total Preferred Stock | ||||
| (Cost $126,758,465) | 125,102,468 | |||
| Other Investment Companies0.2% of net assets | ||||
| United States 0.2% | ||||
| Money Market Fund 0.1% | ||||
| Other Securities | 0.1 | 16,096,739 | ||
| Securities Lending Collateral 0.1% | ||||
| Other Securities | 0.1 | 19,458,984 | ||
| Total Other Investment Companies | ||||
| (Cost $35,555,723) | 35,555,723 | |||
| Number of Contracts | Notional Amount ($) | Current Value/ Unrealized Depreciation ($) | ||
| Futures Contracts | ||||
| Long | ||||
| MSCI EAFE Index, expires 09/20/19 | 894 | 82,422,330 | (63,284) | |
| * | Non-income producing security. |
| (a) | All or a portion of this security is on loan. Securities on loan were valued at $18,723,737. |
| (b) | Fair-valued by management using significant unobservable inputs in accordance with procedures approved by the fund’s Board of Trustees. |
| (c) | The rate shown is the 7-day yield. |
| REIT — | Real Estate Investment Trust |
| RSP — | Risparmio (Convertible Savings Shares) |
| Description | Quoted Prices in Active Markets for Identical Assets (Level 1) | Other Significant Observable Inputs (Level 2) | Significant Unobservable Inputs (Level 3) | Total | |
| Assets | |||||
| Common Stock1 | $17,295,843,477 | $— | $— | $17,295,843,477 | |
| Hong Kong | 607,149,910 | — | —* | 607,149,910 | |
| Portugal | 24,290,643 | — | —* | 24,290,643 | |
| Preferred Stock1 | 125,102,468 | — | — | 125,102,468 | |
| Other Investment Companies1 | 35,555,723 | — | — | 35,555,723 | |
| Liabilities | |||||
| Futures Contracts2 | (63,284) | — | — | (63,284) | |
| Total | $18,087,878,937 | $— | $— | $18,087,878,937 |
| * | Level 3 amount shown includes securities determined to have no value at August 31, 2019. |
| 1 | As categorized in the complete schedule of Portfolio Holdings. |
| 2 | Futures contracts are valued at unrealized appreciation or depreciation. |
| Assets | ||
| Investments in unaffiliated issuers, at value (cost $17,509,324,955) including securities on loan of $18,723,737 | $18,068,483,237 | |
| Collateral invested for securities on loan, at value (cost $19,458,984) | 19,458,984 | |
| Deposit with broker for futures contracts | 4,108,500 | |
| Foreign currency, at value (cost $3,383,949) | 3,381,214 | |
| Receivables: | ||
| Dividends | 49,655,286 | |
| Foreign tax reclaims | 16,037,856 | |
| Variation margin on futures contracts | 375,480 | |
| Income from securities on loan | + | 95,888 |
| Total assets | 18,161,596,445 | |
| Liabilities | ||
| Collateral held for securities on loan | 19,458,984 | |
| Payables: | ||
| Investments bought | 2,628,207 | |
| Management fees | + | 972,271 |
| Total liabilities | 23,059,462 | |
| Net Assets | ||
| Total assets | 18,161,596,445 | |
| Total liabilities | – | 23,059,462 |
| Net assets | $18,138,536,983 | |
| Net Assets by Source | ||
| Capital received from investors | 17,957,193,724 | |
| Total distributable earnings1 | 181,343,259 | |
| Net Asset Value (NAV) | ||||
| Net Assets | ÷ | Shares Outstanding | = | NAV |
| $18,138,536,983 | 588,500,000 | $30.82 | ||
| 1 | The SEC eliminated the requirement to disclose total distributable earnings (loss) by each of its components as previously disclosed as the previous presentation did not provide insight into the tax implications of distributions (see financial note 11 for additional information). |
| Investment Income | ||
| Dividends (net of foreign withholding tax of $53,699,652) | $546,461,757 | |
| Securities on loan, net | + | 2,769,439 |
| Total investment income | 549,231,196 | |
| Expenses | ||
| Management fees | 10,029,402 | |
| Professional fees | + | 93,919* |
| Total expenses | 10,123,321 | |
| Expense reduction by CSIM | – | 93,919* |
| Net expenses | – | 10,029,402 |
| Net investment income | 539,201,794 | |
| Realized and Unrealized Gains (Losses) | ||
| Net realized losses on investments | (303,859,334) | |
| Net realized gains on futures contracts | 63,224 | |
| Net realized losses on foreign currency transactions | + | (1,105,920) |
| Net realized losses | (304,902,030) | |
| Net change in unrealized appreciation (depreciation) on investments | (816,947,205) | |
| Net change in unrealized appreciation (depreciation) on futures contracts | (321,244) | |
| Net change in unrealized appreciation (depreciation) on foreign currency translations | + | (359,001) |
| Net change in unrealized appreciation (depreciation) | + | (817,627,450) |
| Net realized and unrealized losses | (1,122,529,480) | |
| Decrease in net assets resulting from operations | ($583,327,686) | |
| * | Includes professional fees associated with the filing of tax claims in the European Union deemed to be non-routine expenses of the fund. See financial notes 2 (d) and 4 for additional information. |
| Operations | ||||
| 9/1/18-8/31/19 | 9/1/17-8/31/18 | |||
| Net investment income | $539,201,794 | $414,988,466 | ||
| Net realized losses | (304,902,030) | (59,555,035) | ||
| Net change in unrealized appreciation (depreciation) | + | (817,627,450) | 141,092,417 | |
| Increase (decrease) in net assets resulting from operations | (583,327,686) | 496,525,848 | ||
| Distributions to Shareholders1 | ||||
| Total distributions | ($592,259,760) | ($308,067,760) | ||
| Transactions in Fund Shares | ||||||||
| 9/1/18-8/31/19 | 9/1/17-8/31/18 | |||||||
| SHARES | VALUE | SHARES | VALUE | |||||
| Shares sold | 98,500,000 | $3,020,072,181 | 138,900,000 | $4,692,583,434 | ||||
| Shares redeemed | + | — | — | — | — | |||
| Net transactions in fund shares | 98,500,000 | $3,020,072,181 | 138,900,000 | $4,692,583,434 | ||||
| Shares Outstanding and Net Assets | ||||||||
| 9/1/18-8/31/19 | 9/1/17-8/31/18 | |||||||
| SHARES | NET ASSETS | SHARES | NET ASSETS | |||||
| Beginning of period | 490,000,000 | $16,294,052,248 | 351,100,000 | $11,413,010,726 | ||||
| Total increase | + | 98,500,000 | 1,844,484,735 | 138,900,000 | 4,881,041,522 | |||
| End of period2 | 588,500,000 | $18,138,536,983 | 490,000,000 | $16,294,052,248 | ||||
| 1 | For the period ended August 31, 2018, the fund distributed to shareholders $308,067,760 from net investment income. The SEC eliminated the requirement to disclose distributions to shareholders from net investment income and from net realized gains in 2018 (see financial note 11 for additional information). |
| 2 | End of period - Net assets include net investment income not yet distributed of $292,309,858 at August 31, 2018. The SEC eliminated the requirement to disclose undistributed net investment income in 2018. |
| 9/1/18– 8/31/19 | 9/1/17– 8/31/18 | 9/1/16– 8/31/17 | 9/1/15– 8/31/16 | 9/1/14– 8/31/15 | ||
| Per-Share Data | ||||||
| Net asset value at beginning of period | $35.86 | $34.80 | $29.96 | $29.46 | $33.32 | |
| Income (loss) from investment operations: | ||||||
| Net investment income (loss)1 | 0.82 | 0.84 | 0.73 | 0.67 | 0.73 | |
| Net realized and unrealized gains (losses) | (4.63) | 1.22 | 4.70 | 0.50 | (3.84) | |
| Total from investment operations | (3.81) | 2.06 | 5.43 | 1.17 | (3.11) | |
| Less distributions: | ||||||
| Distributions from net investment income | (0.90) | (1.00) | (0.59) | (0.67) | (0.75) | |
| Net asset value at end of period | $31.15 | $35.86 | $34.80 | $29.96 | $29.46 | |
| Total return | (10.57%) | 5.93% | 18.52% | 4.12% | (9.29%) | |
| Ratios/Supplemental Data | ||||||
| Ratios to average net assets: | ||||||
| Total expenses | 0.12% | 0.12% | 0.14%2 | 0.17%3 | 0.18%4 | |
| Net investment income (loss) | 2.54% | 2.31% | 2.31% | 2.34% | 2.40% | |
| Portfolio turnover rate5 | 20% | 16% | 12% | 23% | 23% | |
| Net assets, end of period (x 1,000) | $2,186,842 | $2,280,998 | $1,538,038 | $787,951 | $609,773 | |
| Security | Number of Shares | % of Net Assets | Value ($) | |
| Common Stock99.0% of net assets | ||||
| Australia 6.4% | ||||
| Afterpay Touch Group Ltd. * | 218,358 | 0.2 | 4,557,738 | |
| Charter Hall Group | 587,909 | 0.2 | 5,010,712 | |
| Other Securities | 6.0 | 130,451,291 | ||
| 6.4 | 140,019,741 | |||
| Austria 1.0% | ||||
| Other Securities | 1.0 | 22,164,676 | ||
| Belgium 2.2% | ||||
| Argenx SE * | 47,559 | 0.3 | 6,190,648 | |
| Other Securities | 1.9 | 42,166,227 | ||
| 2.2 | 48,356,875 | |||
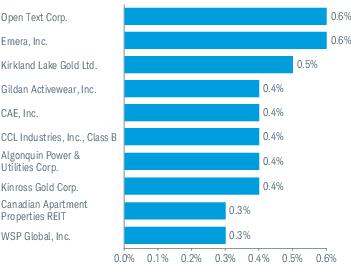
| Canada 19.5% | ||||
| Air Canada * | 167,895 | 0.3 | 5,654,200 | |
| Algonquin Power & Utilities Corp. | 614,505 | 0.4 | 8,046,649 | |
| Allied Properties Real Estate Investment Trust | 137,790 | 0.3 | 5,443,991 | |
| AltaGas Ltd. | 340,711 | 0.2 | 4,635,803 | |
| Aurora Cannabis, Inc. *(a) | 993,603 | 0.3 | 5,488,445 | |
| B2Gold Corp. * | 1,238,347 | 0.2 | 4,454,620 | |
| CAE, Inc. | 341,355 | 0.4 | 8,952,605 | |
| Cameco Corp. | 494,970 | 0.2 | 4,350,730 | |
| Canadian Apartment Properties REIT | 183,236 | 0.3 | 7,384,323 | |
| Canopy Growth Corp. *(a) | 223,364 | 0.2 | 5,288,254 | |
| CCL Industries, Inc., Class B | 183,363 | 0.4 | 8,325,022 | |
| Cronos Group, Inc. *(a) | 419,976 | 0.2 | 4,642,871 | |
| Emera, Inc. | 293,524 | 0.6 | 12,741,168 | |
| Empire Co., Ltd., A Shares | 215,316 | 0.3 | 5,951,653 | |
| First Quantum Minerals Ltd. | 852,256 | 0.2 | 5,233,601 | |
| Gildan Activewear, Inc. | 258,545 | 0.4 | 9,496,976 | |
| H&R Real Estate Investment Trust | 361,284 | 0.3 | 6,152,812 | |
| IA Financial Corp., Inc. * | 137,430 | 0.3 | 5,726,595 | |
| Keyera Corp. | 264,168 | 0.3 | 6,387,506 | |
| Kinross Gold Corp. * | 1,556,869 | 0.4 | 7,756,226 | |
| Kirkland Lake Gold Ltd. | 233,459 | 0.5 | 11,374,274 | |
| Onex Corp. | 103,173 | 0.3 | 6,073,293 | |
| Open Text Corp. | 325,324 | 0.6 | 12,752,955 | |
| Pan American Silver Corp. | 258,086 | 0.2 | 4,766,278 | |
| Parkland Fuel Corp. | 183,809 | 0.3 | 5,743,340 | |
| Ritchie Bros. Auctioneers, Inc. | 136,740 | 0.2 | 5,420,000 | |
| TMX Group Ltd. | 69,379 | 0.3 | 6,020,539 | |
| Toromont Industries Ltd. | 98,020 | 0.2 | 4,704,045 | |
| Security | Number of Shares | % of Net Assets | Value ($) | |
| WSP Global, Inc. | 129,424 | 0.3 | 7,020,531 | |
| Other Securities | 10.4 | 229,574,497 | ||
| 19.5 | 425,563,802 | |||
| Denmark 1.4% | ||||
| Royal Unibrew A/S | 62,729 | 0.3 | 5,442,208 | |
| SimCorp A/S | 49,540 | 0.2 | 4,620,641 | |
| Other Securities | 0.9 | 19,987,995 | ||
| 1.4 | 30,050,844 | |||
| Finland 1.1% | ||||
| Other Securities | 1.1 | 23,919,817 | ||
| France 3.0% | ||||
| Altran Technologies S.A. | 290,817 | 0.2 | 4,634,195 | |
| Euronext N.V. | 87,261 | 0.3 | 6,856,462 | |
| Other Securities | 2.5 | 53,200,259 | ||
| 3.0 | 64,690,916 | |||
| Germany 4.7% | ||||
| Dialog Semiconductor plc * | 95,902 | 0.2 | 4,537,095 | |
| MorphoSys AG * | 39,823 | 0.2 | 4,714,421 | |
| Other Securities | 4.3 | 92,753,627 | ||
| 4.7 | 102,005,143 | |||
| Hong Kong 1.5% | ||||
| Other Securities | 1.5 | 32,127,970 | ||
| Ireland 0.4% | ||||
| Other Securities | 0.4 | 8,080,396 | ||
| Israel 0.7% | ||||
| Other Securities | 0.7 | 14,467,744 | ||
| Italy 2.7% | ||||
| Other Securities | 2.7 | 58,817,278 | ||
| Japan 18.8% | ||||
| Other Securities | 18.8 | 411,624,440 | ||
| Security | Number of Shares | % of Net Assets | Value ($) | |
| Netherlands 2.2% | ||||
| IMCD N.V. | 65,928 | 0.2 | 4,632,085 | |
| Takeaway.com N.V. * | 45,605 | 0.2 | 4,361,825 | |
| Other Securities | 1.8 | 39,427,850 | ||
| 2.2 | 48,421,760 | |||
| New Zealand 1.0% | ||||
| Other Securities | 1.0 | 23,005,996 | ||
| Norway 1.8% | ||||
| Other Securities | 1.8 | 40,210,171 | ||
| Poland 0.7% | ||||
| Other Securities | 0.7 | 14,839,992 | ||
| Portugal 0.4% | ||||
| Other Securities | 0.4 | 9,292,784 | ||
| Republic of Korea 4.2% | ||||
| Other Securities | 4.2 | 92,936,622 | ||
| Singapore 1.4% | ||||
| Other Securities | 1.4 | 30,184,815 | ||
| Spain 1.6% | ||||
| Other Securities | 1.6 | 36,202,163 | ||
| Sweden 4.8% | ||||
| Fabege AB | 335,395 | 0.3 | 5,613,971 | |
| Other Securities | 4.5 | 99,086,516 | ||
| 4.8 | 104,700,487 | |||
| Switzerland 4.1% | ||||
| Other Securities | 4.1 | 89,460,496 | ||
| United Kingdom 13.4% | ||||
| BBA Aviation plc | 1,322,232 | 0.2 | 5,169,001 | |
| Beazley plc | 662,400 | 0.2 | 4,594,179 | |
| Dechra Pharmaceuticals plc | 125,105 | 0.2 | 4,570,775 | |
| HomeServe plc | 342,091 | 0.2 | 4,782,747 | |
| Intermediate Capital Group plc | 348,711 | 0.3 | 5,673,695 | |
| SSP Group plc | 549,818 | 0.2 | 4,734,044 | |
| The Unite Group plc | 357,673 | 0.2 | 4,560,650 | |
| Other Securities | 11.9 | 260,100,528 | ||
| 13.4 | 294,185,619 | |||
| Total Common Stock | ||||
| (Cost $2,259,590,662) | 2,165,330,547 | |||
| Preferred Stock0.3% of net assets | ||||
| Germany 0.2% | ||||
| Other Securities | 0.2 | 3,784,268 | ||
| Security | Number of Shares | % of Net Assets | Value ($) | |
| Italy 0.0% | ||||
| Other Securities | 0.0 | 457,102 | ||
| Republic of Korea 0.0% | ||||
| Other Securities | 0.0 | 208,497 | ||
| Sweden 0.1% | ||||
| Other Securities | 0.1 | 1,012,759 | ||
| Total Preferred Stock | ||||
| (Cost $6,791,000) | 5,462,626 | |||
| Rights0.0% of net assets | ||||
| Singapore 0.0% | ||||
| Other Securities | 0.0 | 2,560 | ||
| Total Rights | ||||
| (Cost $—) | 2,560 | |||
| Warrants0.0% of net assets | ||||
| Singapore 0.0% | ||||
| Other Securities | 0.0 | — | ||
| Total Warrants | ||||
| (Cost $—) | — | |||
| Other Investment Companies3.6% of net assets | ||||
| Switzerland 0.3% | ||||
| BB Biotech AG | 69,486 | 0.2 | 4,438,340 | |
| Other Securities | 0.1 | 1,438,860 | ||
| 0.3 | 5,877,200 | |||
| United Kingdom 0.1% | ||||
| Other Securities | 0.1 | 2,322,963 | ||
| United States 3.2% | ||||
| Money Market Fund 0.1% | ||||
| Other Securities | 0.1 | 2,035,557 | ||
| Securities Lending Collateral 3.1% | ||||
| Wells Fargo Government Money Market Fund, Select Class 2.03%(c) | 3.1 | 68,896,383 | ||
| 3.2 | 70,931,940 | |||
| Total Other Investment Companies | ||||
| (Cost $78,846,277) | 79,132,103 | |||
| Number of Contracts | Notional Amount ($) | Current Value/ Unrealized Appreciation ($) | ||
| Futures Contracts | ||||
| Long | ||||
| MSCI EAFE Index, expires 09/20/19 | 77 | 7,099,015 | 139,722 | |
| * | Non-income producing security. |
| (a) | All or a portion of this security is on loan. Securities on loan were valued at $65,060,287. |
| (b) | Fair-valued by management using significant unobservable inputs in accordance with procedures approved by the fund’s Board of Trustees. |
| (c) | The rate shown is the 7-day yield. |
| CVA — | Dutch Certificate |
| REIT — | Real Estate Investment Trust |
| RSP — | Risparmio (Convertible Savings Shares) |
| Description | Quoted Prices in Active Markets for Identical Assets (Level 1) | Other Significant Observable Inputs (Level 2) | Significant Unobservable Inputs (Level 3) | Total | |
| Assets | |||||
| Common Stock1 | $1,422,234,796 | $— | $— | $1,422,234,796 | |
| Australia | 139,545,363 | — | 474,378* | 140,019,741 | |
| Hong Kong | 32,106,862 | — | 21,108* | 32,127,970 | |
| Japan | 411,333,381 | — | 291,059 | 411,624,440 | |
| Republic of Korea | 92,717,117 | — | 219,505 | 92,936,622 | |
| Singapore | 29,950,236 | — | 234,579* | 30,184,815 | |
| Spain | 36,202,163 | — | —* | 36,202,163 | |
| Preferred Stock1 | 5,462,626 | — | — | 5,462,626 | |
| Rights1 | |||||
| Singapore | — | — | 2,560 | 2,560 | |
| Warrants1 | |||||
| Singapore | — | — | —* | — | |
| Other Investment Companies1 | 79,132,103 | — | — | 79,132,103 | |
| Futures Contracts2 | 139,722 | — | — | 139,722 | |
| Total | $2,248,824,369 | $— | $1,243,189 | $2,250,067,558 |
| * | Level 3 amount shown includes securities determined to have no value at August 31, 2019. |
| 1 | As categorized in the complete schedule of Portfolio Holdings. |
| 2 | Futures contracts are valued at unrealized appreciation or depreciation. |
| Assets | ||
| Investments in unaffiliated issuers, at value (cost $2,276,331,556) including securities on loan of $65,060,287 | $2,181,031,453 | |
| Collateral invested for securities on loan, at value (cost $68,896,383) | 68,896,383 | |
| Deposit with broker for futures contracts | 949,500 | |
| Receivables: | ||
| Investments sold | 4,972,574 | |
| Dividends | 3,009,977 | |
| Foreign tax reclaims | 1,131,746 | |
| Income from securities on loan | 355,123 | |
| Variation margin on futures contracts | + | 31,238 |
| Total assets | 2,260,377,994 | |
| Liabilities | ||
| Collateral held for securities on loan | 68,896,383 | |
| Foreign currency | 4,227,201 | |
| Payables: | ||
| Investments bought | 44,813 | |
| Management fees | 235,757 | |
| Foreign capital gains tax | + | 131,350 |
| Total liabilities | 73,535,504 | |
| Net Assets | ||
| Total assets | 2,260,377,994 | |
| Total liabilities | – | 73,535,504 |
| Net assets | $2,186,842,490 | |
| Net Assets by Source | ||
| Capital received from investors | 2,394,321,502 | |
| Total distributable loss1 | (207,479,012) | |
| Net Asset Value (NAV) | ||||
| Net Assets | ÷ | Shares Outstanding | = | NAV |
| $2,186,842,490 | 70,200,000 | $31.15 | ||
| 1 | The SEC eliminated the requirement to disclose total distributable earnings (loss) by each of its components as previously disclosed as the previous presentation did not provide insight into the tax implications of distributions (see financial note 11 for additional information). |
| Investment Income | ||
| Dividends (net of foreign withholding tax of $5,739,160) | $53,604,172 | |
| Securities on loan, net | + | 3,308,332 |
| Total investment income | 56,912,504 | |
| Expenses | ||
| Management fees | 2,560,827 | |
| Professional fees | + | 4,324* |
| Total expenses | 2,565,151 | |
| Expense reduction by CSIM | – | 4,324* |
| Net expenses | – | 2,560,827 |
| Net investment income | 54,351,677 | |
| Realized and Unrealized Gains (Losses) | ||
| Net realized losses on investments (net of foreign capital gains tax of $9,163) | (56,853,213) | |
| Net realized gains on in-kind redemptions | 79,664,619 | |
| Net realized losses on futures contracts | (520,182) | |
| Net realized losses on foreign currency transactions | + | (240,107) |
| Net realized gains | 22,051,117 | |
| Net change in unrealized appreciation (depreciation) on investments (net of change in foreign capital gains tax of $106,693) | (312,727,154) | |
| Net change in unrealized appreciation (depreciation) on futures contracts | 181,111 | |
| Net change in unrealized appreciation (depreciation) on foreign currency translations | + | (24,532) |
| Net change in unrealized appreciation (depreciation) | + | (312,570,575) |
| Net realized and unrealized losses | (290,519,458) | |
| Decrease in net assets resulting from operations | ($236,167,781) | |
| * | Includes professional fees associated with the filing of tax claims in the European Union deemed to be non-routine expenses of the fund. See financial notes 2 (d) and 4 for additional information. |
| Operations | ||||
| 9/1/18-8/31/19 | 9/1/17-8/31/18 | |||
| Net investment income | $54,351,677 | $43,918,155 | ||
| Net realized gains | 22,051,117 | 47,132,418 | ||
| Net change in unrealized appreciation (depreciation) | + | (312,570,575) | 636,039 | |
| Increase (decrease) in net assets resulting from operations | (236,167,781) | 91,686,612 | ||
| Distributions to Shareholders1 | ||||
| Total distributions | ($59,504,600) | ($47,913,600) | ||
| Transactions in Fund Shares | ||||||||
| 9/1/18-8/31/19 | 9/1/17-8/31/18 | |||||||
| SHARES | VALUE | SHARES | VALUE | |||||
| Shares sold | 14,200,000 | $453,570,587 | 22,700,000 | $818,810,444 | ||||
| Shares redeemed | + | (7,600,000) | (252,053,793) | (3,300,000) | (119,623,285) | |||
| Net transactions in fund shares | 6,600,000 | $201,516,794 | 19,400,000 | $699,187,159 | ||||
| Shares Outstanding and Net Assets | ||||||||
| 9/1/18-8/31/19 | 9/1/17-8/31/18 | |||||||
| SHARES | NET ASSETS | SHARES | NET ASSETS | |||||
| Beginning of period | 63,600,000 | $2,280,998,077 | 44,200,000 | $1,538,037,906 | ||||
| Total increase or decrease | + | 6,600,000 | (94,155,587) | 19,400,000 | 742,960,171 | |||
| End of period2 | 70,200,000 | $2,186,842,490 | 63,600,000 | $2,280,998,077 | ||||
| 1 | For the period ended August 31, 2018, the fund distributed to shareholders $47,913,600 from net investment income. The SEC eliminated the requirement to disclose distributions to shareholders from net investment income and from net realized gains in 2018 (see financial note 11 for additional information). |
| 2 | End of period - Net assets include net investment income not yet distributed of $13,971,989 at August 31, 2018. The SEC eliminated the requirement to disclose undistributed net investment income in 2018. |
| 9/1/18– 8/31/19 | 9/1/17– 8/31/18 | 9/1/16– 8/31/17 | 9/1/15– 8/31/16 | 9/1/14– 8/31/15 | ||
| Per-Share Data | ||||||
| Net asset value at beginning of period | $25.89 | $26.99 | $22.56 | $20.83 | $27.34 | |
| Income (loss) from investment operations: | ||||||
| Net investment income (loss)1 | 0.72 | 0.68 | 0.71 | 0.58 | 0.66 | |
| Net realized and unrealized gains (losses) | (1.00) | (1.13) | 4.21 | 1.64 | (6.49) | |
| Total from investment operations | (0.28) | (0.45) | 4.92 | 2.22 | (5.83) | |
| Less distributions: | ||||||
| Distributions from net investment income | (0.79) | (0.65) | (0.49) | (0.49) | (0.68) | |
| Net asset value at end of period | $24.82 | $25.89 | $26.99 | $22.56 | $20.83 | |
| Total return | (0.97%) | (1.79%) | 22.40% | 11.02% | (21.62%) | |
| Ratios/Supplemental Data | ||||||
| Ratios to average net assets: | ||||||
| Total expenses | 0.13% | 0.13% | 0.13%2 | 0.14% | 0.14% | |
| Net investment income (loss) | 2.85% | 2.48% | 2.96% | 2.85% | 2.66% | |
| Portfolio turnover rate3 | 13% | 18% | 7% | 10% | 8% | |
| Net assets, end of period (x 1,000) | $5,804,446 | $4,900,591 | $4,248,821 | $2,009,874 | $1,276,740 | |
| Security | Number of Shares | % of Net Assets | Value ($) | |
| Common Stock97.3% of net assets | ||||
| Brazil 6.8% | ||||
| Ambev S.A. | 5,419,070 | 0.4 | 24,549,874 | |
| B3 S.A. - Brasil Bolsa Balcao | 2,483,100 | 0.5 | 26,920,981 | |
| Itau Unibanco Holding S.A. ADR | 5,975,747 | 0.9 | 49,240,155 | |
| Petroleo Brasileiro S.A. | 3,657,369 | 0.4 | 25,021,495 | |
| Vale S.A. * | 4,282,656 | 0.8 | 47,229,232 | |
| Other Securities | 3.8 | 220,462,200 | ||
| 6.8 | 393,423,937 | |||
| Chile 1.0% | ||||
| Other Securities | 1.0 | 57,448,798 | ||
| China 33.7% | ||||
| Alibaba Group Holding Ltd. ADR * | 1,508,451 | 4.6 | 264,024,179 | |
| Baidu, Inc. ADR * | 343,445 | 0.6 | 35,879,699 | |
| Bank of China Ltd., H Shares | 96,815,929 | 0.7 | 36,945,335 | |
| China Construction Bank Corp., H Shares | 117,095,771 | 1.5 | 86,977,274 | |
| China Life Insurance Co., Ltd., H Shares | 9,671,287 | 0.4 | 22,637,330 | |
| China Merchants Bank Co., Ltd., H Shares | 4,669,612 | 0.4 | 21,276,031 | |
| China Mobile Ltd. | 6,627,465 | 1.0 | 54,937,412 | |
| China Petroleum & Chemical Corp., H Shares | 31,841,518 | 0.3 | 18,652,972 | |
| CNOOC Ltd. | 19,878,079 | 0.5 | 29,682,595 | |
| Industrial & Commercial Bank of China Ltd., H Shares | 98,780,485 | 1.1 | 62,404,794 | |
| JD.com, Inc. ADR * | 996,731 | 0.5 | 30,400,295 | |
| Meituan Dianping., B Shares * | 4,269,772 | 0.7 | 40,516,065 | |
| NetEase, Inc. ADR | 89,259 | 0.4 | 22,761,045 | |
| New Oriental Education & Technology Group, Inc. ADR * | 171,549 | 0.3 | 19,453,657 | |
| Ping An Insurance Group Co. of China Ltd., H Shares | 6,866,982 | 1.4 | 78,789,292 | |
| Tencent Holdings Ltd. | 7,148,307 | 5.1 | 296,319,898 | |
| Other Securities | 14.2 | 833,986,589 | ||
| 33.7 | 1,955,644,462 | |||
| Colombia 0.4% | ||||
| Other Securities | 0.4 | 23,600,346 | ||
| Czech Republic 0.2% | ||||
| Other Securities | 0.2 | 11,405,439 | ||
| Security | Number of Shares | % of Net Assets | Value ($) | |
| Egypt 0.1% | ||||
| Other Securities | 0.1 | 8,705,395 | ||
| Greece 0.4% | ||||
| Other Securities | 0.4 | 21,472,988 | ||
| Hungary 0.4% | ||||
| Other Securities | 0.4 | 20,810,056 | ||
| India 11.0% | ||||
| Axis Bank Ltd. | 2,241,253 | 0.4 | 20,837,697 | |
| Hindustan Unilever Ltd. | 883,783 | 0.4 | 23,291,548 | |
| Housing Development Finance Corp., Ltd. | 2,155,234 | 1.1 | 65,388,183 | |
| Infosys Ltd. | 4,723,356 | 0.9 | 53,902,781 | |
| Reliance Industries Ltd. | 3,884,119 | 1.2 | 67,913,269 | |
| Tata Consultancy Services Ltd. | 1,127,144 | 0.6 | 35,667,046 | |
| Other Securities | 6.4 | 372,516,110 | ||
| 11.0 | 639,516,634 | |||
| Indonesia 2.4% | ||||
| PT Bank Central Asia Tbk | 12,006,640 | 0.5 | 25,816,180 | |
| PT Bank Rakyat Indonesia (Persero) Tbk | 65,143,668 | 0.3 | 19,609,691 | |
| PT Telekomunikasi Indonesia (Persero) Tbk | 58,147,565 | 0.3 | 18,241,570 | |
| Other Securities | 1.3 | 74,120,420 | ||
| 2.4 | 137,787,861 | |||
| Kuwait 1.0% | ||||
| National Bank of Kuwait SAKP | 7,603,140 | 0.4 | 24,810,246 | |
| Other Securities | 0.6 | 31,240,996 | ||
| 1.0 | 56,051,242 | |||
| Malaysia 2.9% | ||||
| Public Bank Berhad | 3,851,354 | 0.3 | 18,608,849 | |
| Other Securities | 2.6 | 151,215,908 | ||
| 2.9 | 169,824,757 | |||
| Mexico 3.1% | ||||
| America Movil S.A.B. de C.V., Series L | 34,721,407 | 0.4 | 25,365,626 | |
| Fomento Economico Mexicano S.A.B. de C.V. | 2,616,253 | 0.4 | 23,862,521 | |
| Security | Number of Shares | % of Net Assets | Value ($) | |
| Grupo Financiero Banorte S.A.B. de C.V., O Shares | 3,509,617 | 0.3 | 18,857,033 | |
| Other Securities | 2.0 | 112,123,738 | ||
| 3.1 | 180,208,918 | |||
| Peru 0.1% | ||||
| Other Securities | 0.1 | 4,129,187 | ||
| Philippines 1.4% | ||||
| Other Securities | 1.4 | 82,707,065 | ||
| Qatar 1.3% | ||||
| Qatar National Bank QPSC | 5,544,004 | 0.5 | 29,152,928 | |
| Other Securities | 0.8 | 48,431,992 | ||
| 1.3 | 77,584,920 | |||
| Russia 4.4% | ||||
| Gazprom PJSC * | 13,147,549 | 0.8 | 45,821,141 | |
| LUKOIL PJSC | 595,619 | 0.8 | 48,101,971 | |
| NovaTek PJSC | 1,341,631 | 0.4 | 25,941,875 | |
| Sberbank of Russia PJSC | 12,820,940 | 0.7 | 43,152,694 | |
| Tatneft PJSC | 1,908,820 | 0.4 | 21,294,363 | |
| Other Securities | 1.3 | 72,305,560 | ||
| 4.4 | 256,617,604 | |||
| Saudi Arabia 1.7% | ||||
| Other Securities | 1.7 | 97,059,871 | ||
| South Africa 6.8% | ||||
| Naspers Ltd., N Shares | 534,181 | 2.1 | 121,508,477 | |
| Standard Bank Group Ltd. | 1,623,752 | 0.3 | 18,956,205 | |
| Other Securities | 4.4 | 252,098,776 | ||
| 6.8 | 392,563,458 | |||
| Taiwan 12.6% | ||||
| Hon Hai Precision Industry Co., Ltd. | 14,975,092 | 0.6 | 35,375,735 | |
| MediaTek, Inc. | 1,861,713 | 0.4 | 21,782,220 | |
| Taiwan Semiconductor Manufacturing Co., Ltd. | 30,101,500 | 4.3 | 248,210,395 | |
| Other Securities | 7.3 | 428,235,047 | ||
| 12.6 | 733,603,397 | |||
| Thailand 3.8% | ||||
| PTT PCL NVDR | 18,024,800 | 0.5 | 26,088,720 | |
| Other Securities | 3.3 | 192,357,265 | ||
| 3.8 | 218,445,985 | |||
| Turkey 0.7% | ||||
| Other Securities | 0.7 | 43,123,533 | ||
| Security | Number of Shares | % of Net Assets | Value ($) | |
| United Arab Emirates 1.1% | ||||
| First Abu Dhabi Bank PJSC | 5,463,365 | 0.4 | 22,697,399 | |
| Other Securities | 0.7 | 42,530,221 | ||
| 1.1 | 65,227,620 | |||
| Total Common Stock | ||||
| (Cost $5,315,158,228) | 5,646,963,473 | |||
| Preferred Stock2.5% of net assets | ||||
| Brazil 2.1% | ||||
| Banco Bradesco S.A. | 5,034,842 | 0.7 | 40,147,632 | |
| Petroleo Brasileiro S.A. | 4,949,214 | 0.5 | 30,541,832 | |
| Other Securities | 0.9 | 55,805,870 | ||
| 2.1 | 126,495,334 | |||
| Chile 0.1% | ||||
| Other Securities | 0.1 | 3,601,836 | ||
| Colombia 0.1% | ||||
| Other Securities | 0.1 | 3,412,732 | ||
| Russia 0.2% | ||||
| Other Securities | 0.2 | 10,481,006 | ||
| Total Preferred Stock | ||||
| (Cost $128,252,311) | 143,990,908 | |||
| Rights0.0% of net assets | ||||
| Brazil 0.0% | ||||
| Other Securities | 0.0 | 62,621 | ||
| China 0.0% | ||||
| Other Securities | 0.0 | — | ||
| Total Rights | ||||
| (Cost $—) | 62,621 | |||
| Warrants0.0% of net assets | ||||
| Thailand 0.0% | ||||
| Other Securities | 0.0 | — | ||
| Total Warrants | ||||
| (Cost $—) | — | |||
| Corporate Bond0.0% of net assets | ||||
| India 0.0% | ||||
| Other Securities | 0.0 | 30,438 | ||
| Total Corporate Bond | ||||
| (Cost $29,483) | 30,438 | |||
| Security | Number of Shares | % of Net Assets | Value ($) | |
| Other Investment Companies0.2% of net assets | ||||
| United States 0.2% | ||||
| Money Market Fund 0.1% | ||||
| Other Securities | 0.1 | 5,028,748 | ||
| Securities Lending Collateral 0.1% | ||||
| Other Securities | 0.1 | 5,664,659 | ||
| Total Other Investment Companies | ||||
| (Cost $10,693,407) | 10,693,407 | |||
| Number of Contracts | Notional Amount ($) | Current Value/ Unrealized Appreciation ($) | ||||
| Futures Contracts | ||||||
| Long | ||||||
| MSCI Emerging Markets Index, expires 09/20/19 | 253 | 12,447,600 | 192,550 | |||
| * | Non-income producing security. |
| (a) | All or a portion of this security is on loan. Securities on loan were valued at $5,258,438. |
| (b) | Fair-valued by management using significant unobservable inputs in accordance with procedures approved by the fund’s Board of Trustees. |
| (c) | The rate shown is the 7-day yield. |
| ADR — | American Depositary Receipt |
| DVR — | Differential Voting Rights |
| GDR — | Global Depositary Receipt |
| NVDR — | Non-Voting Depositary Receipt |
| REIT — | Real Estate Investment Trust |
| Description | Quoted Prices in Active Markets for Identical Assets (Level 1) | Other Significant Observable Inputs (Level 2) | Significant Unobservable Inputs (Level 3) | Total | |
| Assets | |||||
| Common Stock1 | $3,669,846,023 | $— | $— | $3,669,846,023 | |
| China | 1,953,830,304 | — | 1,814,158* | 1,955,644,462 | |
| Greece | 21,472,988 | — | —* | 21,472,988 | |
| Preferred Stock1 | 143,990,908 | — | — | 143,990,908 | |
| Rights1 | 62,621 | — | — | 62,621 | |
| China | — | — | —* | — | |
| Warrants1 | |||||
| Thailand | — | — | — | — | |
| Corporate Bonds1 | — | 30,438 | — | 30,438 | |
| Other Investment Companies1 | 10,693,407 | — | — | 10,693,407 | |
| Futures Contracts2 | 192,550 | — | — | 192,550 | |
| Total | $5,800,088,801 | $30,438 | $1,814,158 | $5,801,933,397 |
| * | Level 3 amount shown includes securities determined to have no value at August 31, 2019. |
| 1 | As categorized in the complete schedule of Portfolio Holdings. |
| 2 | Futures contracts are valued at unrealized appreciation or depreciation. |
| Assets | ||
| Investments in unaffiliated issuers, at value (cost $5,448,468,770) including securities on loan of $5,258,438 | $5,796,076,188 | |
| Collateral invested for securities on loan, at value (cost $5,664,659) | 5,664,659 | |
| Deposit with broker for futures contracts | 2,410,200 | |
| Foreign currency, at value (cost $7,234,716) | 7,235,288 | |
| Receivables: | ||
| Dividends | 10,807,817 | |
| Variation margin on futures contracts | 93,819 | |
| Income from securities on loan | 34,282 | |
| Foreign tax reclaims | + | 12,416 |
| Total assets | 5,822,334,669 | |
| Liabilities | ||
| Collateral held for securities on loan | 5,664,659 | |
| Payables: | ||
| Investments bought | 5,996,437 | |
| Management fees | 678,055 | |
| Foreign capital gains tax | + | 5,549,139 |
| Total liabilities | 17,888,290 | |
| Net Assets | ||
| Total assets | 5,822,334,669 | |
| Total liabilities | – | 17,888,290 |
| Net assets | $5,804,446,379 | |
| Net Assets by Source | ||
| Capital received from investors | 5,842,080,963 | |
| Total distributable loss1 | (37,634,584) | |
| Net Asset Value (NAV) | ||||
| Net Assets | ÷ | Shares Outstanding | = | NAV |
| $5,804,446,379 | 233,900,000 | $24.82 | ||
| 1 | The SEC eliminated the requirement to disclose total distributable earnings (loss) by each of its components as previously disclosed as the previous presentation did not provide insight into the tax implications of distributions (see financial note 11 for additional information). |
| Investment Income | ||
| Dividends (net of foreign withholding tax of $17,397,029) | $159,201,753 | |
| Securities on loan, net | + | 953,639 |
| Total investment income | 160,155,392 | |
| Expenses | ||
| Management fees | 6,957,390 | |
| Professional fees | + | 17,966* |
| Total expenses | 6,975,356 | |
| Expense reduction by CSIM | – | 17,966* |
| Net expenses | – | 6,957,390 |
| Net investment income | 153,198,002 | |
| Realized and Unrealized Gains (Losses) | ||
| Net realized losses on investments (net of foreign capital gains tax of $439) | (122,528,426) | |
| Net realized gains on in-kind redemptions | 23,547,896 | |
| Net realized gains on futures contracts | 287,138 | |
| Net realized losses on foreign currency transactions | + | (1,131,110) |
| Net realized losses | (99,824,502) | |
| Net change in unrealized appreciation (depreciation) on investments (net of change in foreign capital gains tax of ($5,127,813)) | (98,720,972) | |
| Net change in unrealized appreciation (depreciation) on futures contracts | 336,719 | |
| Net change in unrealized appreciation (depreciation) on foreign currency translations | + | 165,988 |
| Net change in unrealized appreciation (depreciation) | + | (98,218,265) |
| Net realized and unrealized losses | (198,042,767) | |
| Decrease in net assets resulting from operations | ($44,844,765) | |
| * | Includes professional fees associated with the filing of tax claims in the European Union deemed to be non-routine expenses of the fund. See financial notes 2 (d) and 4 for additional information. |
| Operations | ||||
| 9/1/18-8/31/19 | 9/1/17-8/31/18 | |||
| Net investment income | $153,198,002 | $120,916,490 | ||
| Net realized losses | (99,824,502) | (81,491,649) | ||
| Net change in unrealized appreciation (depreciation) | + | (98,218,265) | (193,893,853) | |
| Decrease in net assets resulting from operations | (44,844,765) | (154,469,012) | ||
| Distributions to Shareholders1 | ||||
| Total distributions | ($160,604,080) | ($107,285,800) | ||
| Transactions in Fund Shares | ||||||||
| 9/1/18-8/31/19 | 9/1/17-8/31/18 | |||||||
| SHARES | VALUE | SHARES | VALUE | |||||
| Shares sold | 46,300,000 | $1,153,254,120 | 32,900,000 | $940,429,372 | ||||
| Shares redeemed | + | (1,700,000) | (43,949,430) | (1,000,000) | (26,904,868) | |||
| Net transactions in fund shares | 44,600,000 | $1,109,304,690 | 31,900,000 | $913,524,504 | ||||
| Shares Outstanding and Net Assets | ||||||||
| 9/1/18-8/31/19 | 9/1/17-8/31/18 | |||||||
| SHARES | NET ASSETS | SHARES | NET ASSETS | |||||
| Beginning of period | 189,300,000 | $4,900,590,534 | 157,400,000 | $4,248,820,842 | ||||
| Total increase | + | 44,600,000 | 903,855,845 | 31,900,000 | 651,769,692 | |||
| End of period2 | 233,900,000 | $5,804,446,379 | 189,300,000 | $4,900,590,534 | ||||
| 1 | For the period ended August 31, 2018, the fund distributed to shareholders $107,285,800 from net investment income. The SEC eliminated the requirement to disclose distributions to shareholders from net investment income and from net realized gains in 2018 (see financial note 11 for additional information). |
| 2 | End of period - Net assets include net investment income not yet distributed of $77,987,465 at August 31, 2018. The SEC eliminated the requirement to disclose undistributed net investment income in 2018. |
| SCHWAB STRATEGIC TRUST (ORGANIZED JANUARY 27, 2009) | |
| Schwab International Equity ETF | Schwab U.S. REIT ETF |
| Schwab International Small-Cap Equity ETF | Schwab U.S. TIPS ETF |
| Schwab Emerging Markets Equity ETF | Schwab Short-Term U.S. Treasury ETF |
| Schwab U.S. Broad Market ETF | Schwab Intermediate-Term U.S. Treasury ETF |
| Schwab 1000 Index® ETF | Schwab U.S. Aggregate Bond ETF |
| Schwab U.S. Large-Cap ETF | Schwab Fundamental U.S. Broad Market Index ETF |
| Schwab U.S. Large-Cap Growth ETF | Schwab Fundamental U.S. Large Company Index ETF |
| Schwab U.S. Large-Cap Value ETF | Schwab Fundamental U.S. Small Company Index ETF |
| Schwab U.S. Mid-Cap ETF | Schwab Fundamental International Large Company Index ETF |
| Schwab U.S. Small-Cap ETF | Schwab Fundamental International Small Company Index ETF |
| Schwab U.S. Dividend Equity ETF | Schwab Fundamental Emerging Markets Large Company Index ETF |
2. Significant Accounting Policies:
3. Risk Factors:
4. Affiliates and Affiliated Transactions:
| Schwab International Equity ETF | Schwab International Small-Cap Equity ETF | Schwab Emerging Markets Equity ETF |
| 0.06% | 0.12% | 0.13% |
| Underlying Funds | |||||
| Schwab International Equity ETF | Schwab International Small-Cap Equity ETF | Schwab Emerging Markets Equity ETF | |||
| Schwab VIT Balanced Portfolio | 0.0%* | 0.1% | 0.1% | ||
| Schwab VIT Balanced with Growth Portfolio | 0.1% | 0.2% | 0.2% | ||
| Schwab VIT Growth Portfolio | 0.2% | 0.3% | 0.2% | ||
| Schwab Target 2010 Index Fund | 0.0%* | -% | -% | ||
| Schwab Target 2015 Index Fund | 0.0%* | -% | -% | ||
| Schwab Target 2020 Index Fund | 0.1% | -% | 0.0%* | ||
| Schwab Target 2025 Index Fund | 0.2% | -% | 0.1% | ||
| Schwab Target 2030 Index Fund | 0.3% | -% | 0.1% | ||
| Schwab Target 2035 Index Fund | 0.2% | -% | 0.1% | ||
| Schwab Target 2040 Index Fund | 0.2% | -% | 0.2% | ||
| Schwab Target 2045 Index Fund | 0.1% | -% | 0.1% | ||
| Schwab Target 2050 Index Fund | 0.2% | -% | 0.1% | ||
| Schwab Target 2055 Index Fund | 0.1% | -% | 0.1% | ||
| Schwab Target 2060 Index Fund | 0.1% | -% | 0.1% | ||
| * | Less than 0.05% |
| Total Aggregate Transactions | Realized Gains (Losses) | |
| Schwab International Equity ETF | $336,431,996 | ($65,669,909) |
| Schwab International Small-Cap Equity ETF | 195,960,706 | 1,869,645 |
| Schwab Emerging Markets Equity ETF | 173,550,460 | (37,307,307) |
5. Other Service Providers:
6. Board of Trustees:
7. Borrowing from Banks:
8. Derivatives:
| Notional Amounts | Number of Contracts | |
| Schwab International Equity ETF | $72,152,937 | 775 |
| Schwab International Small-Cap Equity ETF | 9,310,506 | 100 |
| Schwab Emerging Markets Equity ETF | 11,470,100 | 223 |
9. Purchases and Sales of Investment Securities:
| Purchases of Securities | Sales of Securities | |
| Schwab International Equity ETF | $1,462,596,017 | $1,257,086,549 |
| Schwab International Small-Cap Equity ETF | 440,369,027 | 420,483,430 |
| Schwab Emerging Markets Equity ETF | 1,476,719,660 | 694,562,028 |
10. In-Kind Transactions:
| In-Kind Purchases of Securities | In-Kind Sales of Securities | |
| Schwab International Equity ETF | $2,775,494,290 | $— |
| Schwab International Small-Cap Equity ETF | 417,326,837 | 229,400,205 |
| Schwab Emerging Markets Equity ETF | 352,126,147 | 41,874,328 |
11. Federal Income Taxes
| Schwab International Equity ETF | Schwab International Small-Cap Equity ETF | Schwab Emerging Markets Equity ETF | |||
| Tax cost | $17,664,096,402 | $2,381,153,213 | $5,593,265,607 | ||
| Gross unrealized appreciation | $2,148,951,520 | $228,028,504 | $753,553,661 | ||
| Gross unrealized depreciation | (1,725,168,985) | (359,114,159) | (544,885,871) | ||
| Net unrealized appreciation (depreciation) | $423,782,535 | ($131,085,655) | $208,667,790 |
| Schwab International Equity ETF | Schwab International Small-Cap Equity ETF | Schwab Emerging Markets Equity ETF | |||
| Undistributed ordinary income | $301,381,946 | $44,929,402 | $99,907,918 | ||
| Net unrealized appreciation (depreciation) on investments | 423,782,535 | (131,085,655) | 208,667,790 | ||
| Net other unrealized appreciation (depreciation) | (185,453) | (155,238) | (5,641,310) | ||
| Total | $724,979,028 | ($86,311,491) | $302,934,398 |
| Expiration Date | Schwab International Equity ETF | Schwab International Small-Cap Equity ETF | Schwab Emerging Markets Equity ETF | ||
| No expiration | $543,635,769 | $121,167,521 | $340,568,982 | ||
| Total | $543,635,769 | $121,167,521 | $340,568,982 |
| Schwab International Equity ETF | Schwab International Small-Cap Equity ETF | Schwab Emerging Markets Equity ETF | |
| Capital losses expired | $2,345,874 | $215,545 | $1,091,404 |
| Schwab International Equity ETF | Schwab International Small-Cap Equity ETF | Schwab Emerging Markets Equity ETF | |
| Current period distributions | |||
| Ordinary income | $592,259,760 | $59,504,600 | $160,604,080 |
| Long-term capital gains | — | — | — |
| Prior period distributions | |||
| Ordinary income | $308,067,760 | $47,913,600 | $107,285,800 |
| Long-term capital gains | — | — | — |
12. Subsequent Events:
San Francisco, California
October 17, 2019
| Foreign Tax Credit | Foreign Source Income | |
| Schwab International Equity ETF | $50,338,689 | $587,973,575 |
| Schwab International Small-Cap Equity ETF | 5,174,412 | 57,616,914 |
| Schwab Emerging Markets Equity ETF | 17,260,044 | 176,356,159 |
| Schwab International Equity ETF | $532,817,515 |
| Schwab International Small-Cap Equity ETF | 37,229,951 |
| Schwab Emerging Markets Equity ETF | 96,513,664 |
Market Price vs. NAV as of August 31, 2019
| Number of Days Market Price Above NAV | Number of Days Market Price Below NAV | |||||||
| 1-49 Basis Points | 50-99 Basis Points | 100-199 Basis Points | >200 Basis Points | 1-49 Basis Points | 50-99 Basis Points | 100-199 Basis Points | >200 Basis Points | |
| Schwab International Equity ETF | ||||||||
| Commencement of trading | ||||||||
| 11/3/09 through 8/31/19 | 1,129 | 653 | 163 | 12 | 332 | 107 | 36 | 4 |
| Schwab International Small-Cap Equity ETF | ||||||||
| Commencement of trading | ||||||||
| 1/14/10 through 8/31/19 | 979 | 765 | 212 | 3 | 294 | 92 | 38 | 6 |
| Schwab Emerging Markets Equity ETF | ||||||||
| Commencement of trading | ||||||||
| 1/14/10 through 8/31/19 | 761 | 677 | 314 | 21 | 394 | 145 | 66 | 10 |
| 1. | the nature, extent and quality of the services provided to the Funds under the Agreement, including the resources of CSIM and its affiliates dedicated to the Funds; |
| 2. | each Fund’s investment performance and how it compared to that of certain other comparable exchange-traded funds and benchmark data; |
| 3. | each Fund’s expenses and how those expenses compared to those of certain other similar exchange-traded funds; |
| 4. | the profitability of CSIM and its affiliates, including Charles Schwab & Co., Inc. (Schwab), with respect to the Funds, including both direct and indirect benefits accruing to CSIM and its affiliates; and |
| 5. | the extent to which economies of scale would be realized as the Funds grow and whether fee levels in the Agreement reflect those economies of scale for the benefit of Fund investors. |
| Independent Trustees | |||
| Name, Year of Birth, and Position(s) with the trust (Terms of office, and length of Time Served1) | Principal Occupations During the Past Five Years | Number of Portfolios in Fund Complex Overseen by the Trustee | Other Directorships |
| Robert W. Burns 1959 Trustee (Trustee of Schwab Strategic Trust since 2009; The Charles Schwab Family of Funds, Schwab Investments, Schwab Capital Trust, Schwab Annuity Portfolios and Laudus Trust since 2016) | Retired/Private Investor (Jan. 2009 – present). Formerly, Managing Director, Pacific Investment Management Company, LLC (PIMCO) (investment management firm) and President, PIMCO Funds. | 101 | None |
| John F. Cogan 1947 Trustee (Trustee of The Charles Schwab Family of Funds, Schwab Investments, Schwab Capital Trust and Schwab Annuity Portfolios since 2008; Laudus Trust since 2010; Schwab Strategic Trust since 2016) | Senior Fellow (Oct. 1979 – present), The Hoover Institution at Stanford University (public policy think tank); Senior Fellow (2000 – present), Stanford Institute for Economic Policy Research; Professor of Public Policy (1994 – 2015), Stanford University. | 101 | Director (2005 – present), Gilead Sciences, Inc. |
| Nancy F. Heller 1956 Trustee (Trustee of The Charles Schwab Family of Funds, Schwab Investments, Schwab Capital Trust, Schwab Annuity Portfolios, Schwab Strategic Trust and Laudus Trust since 2018) | President and Chairman (2014 – 2016), TIAA Charitable (financial services); Senior Managing Director (2003 – 2016), TIAA (financial services). | 101 | None |
| Stephen Timothy Kochis 1946 Trustee (Trustee of Schwab Strategic Trust since 2012; The Charles Schwab Family of Funds, Schwab Investments, Schwab Capital Trust, Schwab Annuity Portfolios and Laudus Trust since 2016) | CEO and Owner (May 2012 – present), Kochis Global (wealth management consulting). | 101 | None |
| Independent Trustees (continued) | |||
| Name, Year of Birth, and Position(s) with the trust (Terms of office, and length of Time Served1) | Principal Occupations During the Past Five Years | Number of Portfolios in Fund Complex Overseen by the Trustee | Other Directorships |
| David L. Mahoney 1954 Trustee (Trustee of The Charles Schwab Family of Funds, Schwab Investments, Schwab Capital Trust, Schwab Annuity Portfolios and Laudus Trust since 2011; Schwab Strategic Trust since 2016) | Private Investor. | 101 | Director (2003 – present), Symantec Corporation Director (2004 – present), Corcept Therapeutics Incorporated Director (2009 – present), Adamas Pharmaceuticals, Inc. |
| Jane P. Moncreiff 1961 Trustee (Trustee of The Charles Schwab Family of Funds, Schwab Investments, Schwab Capital Trust, Schwab Annuity Portfolios, Schwab Strategic Trust and Laudus Trust since 2019) | Chief Investment Officer (2009-2017), CareGroup Healthcare System, Inc. (healthcare). | 101 | None |
| Kiran M. Patel 1948 Trustee (Trustee of The Charles Schwab Family of Funds, Schwab Investments, Schwab Capital Trust, Schwab Annuity Portfolios and Laudus Trust since 2011; Schwab Strategic Trust since 2016) | Retired. Executive Vice President and General Manager of Small Business Group (Dec. 2008 – Sept. 2013), Intuit, Inc. (financial software and services firm for consumers and small businesses). | 101 | Director (2008 – present), KLA-Tencor Corporation |
| Kimberly S. Patmore 1956 Trustee (Trustee of The Charles Schwab Family of Funds, Schwab Investments, Schwab Capital Trust, Schwab Annuity Portfolios, Schwab Strategic Trust and Laudus Trust since 2016) | Consultant (2008 – present), Patmore Management Consulting (management consulting). | 101 | None |
| Gerald B. Smith 1950 Trustee (Trustee of The Charles Schwab Family of Funds, Schwab Investments, Schwab Capital Trust and Schwab Annuity Portfolios since 2000; Laudus Trust since 2010; Schwab Strategic Trust since 2016) | Chairman, Chief Executive Officer and Founder (Mar. 1990 – present), Smith Graham & Co. (investment advisors). | 101 | Director (2012 – present), Eaton Corporation plc |
| Interested Trustees | |||
| Name, Year of Birth, and Position(s) with the trust (Terms of office, and length of Time Served1) | Principal Occupations During the Past Five Years | Number of Portfolios in Fund Complex Overseen by the Trustee | Other Directorships |
| Walter W. Bettinger II2 1960 Chairman and Trustee (Trustee of The Charles Schwab Family of Funds, Schwab Investments, Schwab Capital Trust and Schwab Annuity Portfolios since 2008; Schwab Strategic Trust since 2009; Laudus Trust since 2010) | Director, President and Chief Executive Officer (Oct. 2008 – present), The Charles Schwab Corporation; President and Chief Executive Officer (Oct. 2008 – present) and Director (May 2008 – present), Charles Schwab & Co., Inc.; Director (Apr. 2006 – present), Charles Schwab Bank; Director (Nov. 2017 – present), Charles Schwab Premier Bank; Director (May 2008 – present) and President and Chief Executive Officer (Aug. 2017 – present), Schwab Holdings, Inc.; Director (July 2016 – present), Charles Schwab Investment Management, Inc. | 101 | Director (2008 – present), The Charles Schwab Corporation |
| Jonathan de St. Paer2 1973 Trustee (Trustee of The Charles Schwab Family of Funds, Schwab Investments, Schwab Capital Trust, Schwab Annuity Portfolios, Schwab Strategic Trust and Laudus Trust since 2019) | Director and Chief Executive Officer (Apr. 2019 – present) and President (Oct. 2018 – present), Charles Schwab Investment Management, Inc.; Trustee and Chief Executive Officer (Apr. 2019 – present) and President (Nov. 2018 – present), Schwab Funds, Laudus Funds and Schwab ETFs; Director (Apr. 2019 – present), Charles Schwab Worldwide Funds plc and Charles Schwab Asset Management (Ireland) Limited; Senior Vice President (Apr. 2019 – present), Senior Vice President – Strategy and Product Development (CSIM) (Jan. 2014 – Mar. 2019), and Vice President (Jan. 2009 – Dec. 2013), Charles Schwab & Co., Inc. | 101 | None |
| Joseph R. Martinetto2 1962 Trustee (Trustee of The Charles Schwab Family of Funds, Schwab Investments, Schwab Capital Trust, Schwab Annuity Portfolios, Schwab Strategic Trust and Laudus Trust since 2016) | Chief Operating Officer (Feb. 2018 – present) and Senior Executive Vice President (July 2015 – Feb. 2018), The Charles Schwab Corporation; Senior Executive Vice President (July 2015 – present), Charles Schwab & Co., Inc.; Chief Financial Officer (July 2015 – Aug. 2017) and Executive Vice President and Chief Financial Officer (May 2007 – July 2015), The Charles Schwab Corporation and Charles Schwab & Co., Inc.; Director (May 2007 – present), Charles Schwab & Co., Inc.; Director (Apr. 2010 – present) and Chief Executive Officer (July 2013 – Apr. 2015), Charles Schwab Bank; Director (Nov. 2017 – present), Charles Schwab Premier Bank; Director (May 2007 – present), Chief Financial Officer (May 2007 – Aug. 2017), Senior Executive Vice President (Feb. 2016 – present), and Executive Vice President (May 2007 – Feb. 2016), Schwab Holdings, Inc. | 101 | None |
| Officers of the Trust | |
| Name, Year of Birth, and Position(s) with the trust (Terms of office, and length of Time Served3) | Principal Occupations During the Past Five Years |
| Jonathan de St. Paer 1973 President and Chief Executive Officer (Officer of The Charles Schwab Family of Funds, Schwab Investments, Schwab Capital Trust, Schwab Annuity Portfolios, Schwab Strategic Trust and Laudus Trust since 2018) | Director and Chief Executive Officer (Apr. 2019 – present) and President (Oct. 2018 – present), Charles Schwab Investment Management, Inc.; Trustee and Chief Executive Officer (Apr. 2019 – present) and President (Nov. 2018 – present), Schwab Funds, Laudus Funds and Schwab ETFs; Director (Apr. 2019 – present), Charles Schwab Worldwide Funds plc and Charles Schwab Asset Management (Ireland) Limited; Senior Vice President (Apr. 2019 – present), Senior Vice President – Strategy and Product Development (CSIM) (Jan. 2014 – Mar. 2019), and Vice President (Jan. 2009 – Dec. 2013), Charles Schwab & Co., Inc. |
| Officers of the Trust (continued) | |
| Name, Year of Birth, and Position(s) with the trust (Terms of office, and length of Time Served3) | Principal Occupations During the Past Five Years |
| Mark Fischer 1970 Treasurer and Chief Financial Officer (Officer of The Charles Schwab Family of Funds, Schwab Investments, Schwab Capital Trust, Schwab Annuity Portfolios, Schwab Strategic Trust and Laudus Trust since 2013) | Treasurer and Chief Financial Officer (Jan. 2016 – present), Schwab Funds, Laudus Funds and Schwab ETFs; Assistant Treasurer (Dec. 2013 – Dec. 2015), Schwab Funds and Laudus Funds; Assistant Treasurer (Nov. 2013 – Dec. 2015), Schwab ETFs; Vice President (Oct. 2013 – present), Charles Schwab Investment Management, Inc.; Executive Director (Apr. 2011 – Sept. 2013), J.P. Morgan Investor Services; Assistant Treasurer (May 2005 – Mar. 2011), Massachusetts Financial Service Investment Management. |
| George Pereira 1964 Senior Vice President and Chief Operating Officer (Officer of The Charles Schwab Family of Funds, Schwab Investments, Schwab Capital Trust and Schwab Annuity Portfolios since 2004; Laudus Trust since 2006; Schwab Strategic Trust since 2009) | Senior Vice President and Chief Financial Officer (Nov. 2004 – present) and Chief Operating Officer (Jan. 2011 – present), Charles Schwab Investment Management, Inc.; Senior Vice President and Chief Operating Officer (Jan. 2016 – present), Schwab Funds, Laudus Funds and Schwab ETFs; Treasurer and Chief Financial Officer (June 2006 – Dec. 2015), Laudus Funds; Treasurer and Principal Financial Officer (Nov. 2004 – Dec. 2015), Schwab Funds; Treasurer and Principal Financial Officer (Oct. 2009 – Dec. 2015), Schwab ETFs; Director (Apr. 2005 – present), Charles Schwab Worldwide Funds plc and Charles Schwab Asset Management (Ireland) Limited. |
| Omar Aguilar 1970 Senior Vice President and Chief Investment Officer – Equities and Multi-Asset Strategies (Officer of The Charles Schwab Family of Funds, Schwab Investments, Schwab Capital Trust, Schwab Annuity Portfolios, Schwab Strategic Trust and Laudus Trust since 2011) | Senior Vice President and Chief Investment Officer – Equities and Multi-Asset Strategies (Apr. 2011 – present), Charles Schwab Investment Management, Inc.; Senior Vice President and Chief Investment Officer – Equities and Multi-Asset Strategies (June 2011 – present), Schwab Funds, Laudus Funds and Schwab ETFs; Head of the Portfolio Management Group and Vice President of Portfolio Management (May 2009 – Apr. 2011), Financial Engines, Inc. (investment management firm); Head of Quantitative Equity (July 2004 – Jan. 2009), ING Investment Management. |
| Brett Wander 1961 Senior Vice President and Chief Investment Officer – Fixed Income (Officer of The Charles Schwab Family of Funds, Schwab Investments, Schwab Capital Trust, Schwab Annuity Portfolios, Schwab Strategic Trust and Laudus Trust since 2011) | Senior Vice President and Chief Investment Officer – Fixed Income (Apr. 2011 – present), Charles Schwab Investment Management, Inc.; Senior Vice President and Chief Investment Officer – Fixed Income (June 2011 – present), Schwab Funds, Laudus Funds and Schwab ETFs; Senior Managing Director and Global Head of Active Fixed-Income Strategies (Jan. 2008 – Oct. 2010), State Street Global Advisors; Director of Alpha Strategies (Apr. 2006 – Jan. 2008), Loomis, Sayles & Company (investment management firm). |
| David Lekich 1964 Chief Legal Officer and Secretary, Schwab Funds and Schwab ETFs Vice President and Assistant Clerk, Laudus Funds (Officer of The Charles Schwab Family of Funds, Schwab Investments, Schwab Capital Trust, Schwab Annuity Portfolios, Schwab Strategic Trust and Laudus Trust since 2011) | Senior Vice President (Sept. 2011 – present) and Vice President (Mar. 2004 – Sept. 2011), Charles Schwab & Co., Inc.; Senior Vice President and Chief Counsel (Sept. 2011 – present) and Vice President (Jan. 2011 – Sept. 2011), Charles Schwab Investment Management, Inc.; Secretary (Apr. 2011 – present) and Chief Legal Officer (Dec. 2011 – present), Schwab Funds; Vice President and Assistant Clerk (Apr. 2011 – present), Laudus Funds; Secretary (May 2011 – present) and Chief Legal Officer (Nov. 2011 – present), Schwab ETFs. |
| Catherine MacGregor 1964 Vice President and Assistant Secretary, Schwab Funds and Schwab ETFs Chief Legal Officer, Vice President and Clerk, Laudus Funds (Officer of The Charles Schwab Family of Funds, Schwab Investments, Schwab Capital Trust, Schwab Annuity Portfolios and Laudus Trust since 2005; Schwab Strategic Trust since 2009) | Vice President (July 2005 – present), Charles Schwab & Co., Inc.; Vice President (Sept. 2005 – present), Charles Schwab Investment Management, Inc.; Vice President (Dec. 2005 – present) and Chief Legal Officer and Clerk (Mar. 2007 – present), Laudus Funds; Vice President (Nov. 2005 – present) and Assistant Secretary (June 2007 – present), Schwab Funds; Vice President and Assistant Secretary (Oct. 2009 – present), Schwab ETFs. |
| 1 | Each Trustee shall hold office until the election and qualification of his or her successor, or until he or she dies, resigns or is removed. The retirement policy requires that each independent trustee retire by December 31 of the year in which the Trustee turns 74 or the Trustee’s twentieth year of service as an independent trustee on any trust in the Fund Complex, whichever occurs first. |
| 2 | Mr. Bettinger, Mr. de St. Paer and Mr. Martinetto are Interested Trustees. Mr. Bettinger is an Interested Trustee because he owns stock of The Charles Schwab Corporation (CSC), the parent company of Charles Schwab Investment Management, Inc. (CSIM), the investment adviser for the trusts in the Fund Complex, is an employee and director of Charles Schwab & Co., Inc. (CS&Co), the principal underwriter for The Charles Schwab Family of Funds, Schwab Investments, Schwab Capital Trust, Schwab Annuity Portfolios and Laudus Trust, and is a director of CSIM. Mr. de St. Paer is an Interested Trustee because he owns stock of CSC and is an employee and director of CSIM. Mr. Martinetto is an Interested Trustee because he owns stock of CSC and is an employee and director of CS&Co. |
| 3 | The President, Treasurer and Secretary/Clerk hold office until their respective successors are chosen and qualified or until he or she sooner dies, resigns, is removed or becomes disqualified. Each of the other officers serves at the pleasure of the Board. |
Schwab ETFs
Index ETF
Printed on recycled paper.
| * | FUNDAMENTAL INDEX is a registered trademark of Research Affiliates LLC. |
00234524
Table of Contents

| Schwab U.S. Broad Market ETF | SCHB |
| Schwab 1000 Index® ETF | SCHK |
| Schwab U.S. Large-Cap ETF | SCHX |
| Schwab U.S. Large-Cap Growth ETF | SCHG |
| Schwab U.S. Large-Cap Value ETF | SCHV |
| Schwab U.S. Mid-Cap ETF | SCHM |
| Schwab U.S. Small-Cap ETF | SCHA |
| Schwab U.S. Dividend Equity ETF | SCHD |
| New Notice Regarding Shareholder Report Delivery Options |
| Beginning on January 1, 2021, paper copies of a fund’s shareholder reports will no longer be sent by mail, unless you specifically request paper copies of the reports from your financial intermediary (such as a bank or broker-dealer). Instead, the reports will be made available on a fund’s websitewww.schwabfunds.com/schwabetfs_prospectus, and you will be notified by mail each time a report is posted and the mailing will provide a website link to access the report. You will continue to receive other fund regulatory documents (such as prospectuses or supplements) in paper unless you have elected to receive all fund documents electronically. |
| If you would like to receive a fund’s future shareholder reports in paper free of charge after January 1, 2021, you can make that request: |
| • If you invest through Charles Schwab & Co, Inc. (broker-dealer), by calling 1-866-345-5954 and using the unique identifier attached to this mailing; or |
| • If you invest through another financial intermediary (such as a bank or broker-dealer) by contacting them directly. |
| If you already receive shareholder reports and other fund documents electronically, you will not be affected by this change and you need not take any action. |
| Total Returns for the 12 Months Ended August 31, 2019 | |
| Schwab U.S. Broad Market ETF (Ticker Symbol: SCHB) | |
| Market Price Return1 | 1.26% |
| NAV Return1 | 1.35% |
| Dow Jones U.S. Broad Stock Market Index | 1.35% |
| ETF Category: Morningstar Large Blend2 | 1.45% |
| Performance Details | pages 8-10 |
| Schwab 1000 Index ETF (Ticker Symbol: SCHK) | |
| Market Price Return1 | 2.35% |
| NAV Return1 | 2.42% |
| Schwab 1000 Index® | 2.49% |
| Russell 1000® Index | 2.49% |
| ETF Category: Morningstar Large Blend2 | 1.45% |
| Performance Details | pages 11-13 |
| Schwab U.S. Large-Cap ETF (Ticker Symbol: SCHX) | |
| Market Price Return1 | 2.66% |
| NAV Return1 | 2.70% |
| Dow Jones U.S. Large-Cap Total Stock Market Index | 2.71% |
| ETF Category: Morningstar Large Blend2 | 1.45% |
| Performance Details | pages 14-16 |
| Schwab U.S. Large-Cap Growth ETF (Ticker Symbol: SCHG) | |
| Market Price Return1 | 4.02% |
| NAV Return1 | 4.09% |
| Dow Jones U.S. Large-Cap Growth Total Stock Market Index | 4.10% |
| ETF Category: Morningstar Large Growth2 | 2.69% |
| Performance Details | pages 17-19 |
| Total Returns for the 12 Months Ended August 31, 2019 | |
| Schwab U.S. Large-Cap Value ETF (Ticker Symbol: SCHV) | |
| Market Price Return1 | 0.65% |
| NAV Return1 | 0.70% |
| Dow Jones U.S. Large-Cap Value Total Stock Market Index | 0.75% |
| ETF Category: Morningstar Large Value2 | -1.41% |
| Performance Details | pages 20-22 |
| Schwab U.S. Mid-Cap ETF (Ticker Symbol: SCHM) | |
| Market Price Return1 | -3.34% |
| NAV Return1 | -3.24% |
| Dow Jones U.S. Mid-Cap Total Stock Market Index | -3.20% |
| ETF Category: Morningstar Mid-Cap Blend2 | -4.57% |
| Performance Details | pages 23-25 |
| Schwab U.S. Small-Cap ETF (Ticker Symbol: SCHA) | |
| Market Price Return1 | -10.21% |
| NAV Return1 | -10.26% |
| Dow Jones U.S. Small-Cap Total Stock Market Index | -10.28% |
| ETF Category: Morningstar Small Blend2 | -12.34% |
| Performance Details | pages 26-28 |
| Schwab U.S. Dividend Equity ETF (Ticker Symbol: SCHD) | |
| Market Price Return1 | 4.09% |
| NAV Return1 | 4.18% |
| Dow Jones U.S. Dividend 100TM Index | 4.27% |
| ETF Category: Morningstar Large Value2 | -1.41% |
| Performance Details | pages 29-31 |
| 1 | ETF performance must be shown based on both a market price and NAV basis. The fund’s per share NAV is the value of one share of the fund. NAV is calculated by taking the fund’s total assets (including the market value of securities owned), subtracting liabilities, and dividing by the number of shares outstanding. The NAV Return is based on the NAV of the fund, and the Market Price Return is based on the market price per share of the fund. The price used to calculate market return (Market Price) is determined using the Official Closing Price on the primary stock exchange (generally, 4:00 p.m. Eastern time) and may not represent the returns you would receive if shares were traded at other times. Market Price and NAV returns assume that dividends and capital gain distributions have been reinvested in the fund at Market Price and NAV, respectively. |
| 2 | Source for category information: Morningstar, Inc. The Morningstar Category return represents all passively- and actively-managed ETFs within the category as of the report date. |

President and CEO of
Charles Schwab Investment
Management, Inc. and the
funds covered in this report.
| 1 | Schwab Center for Financial Research. (2019, May 24).Why Waiting for a Market Rebound Could Cost You. |

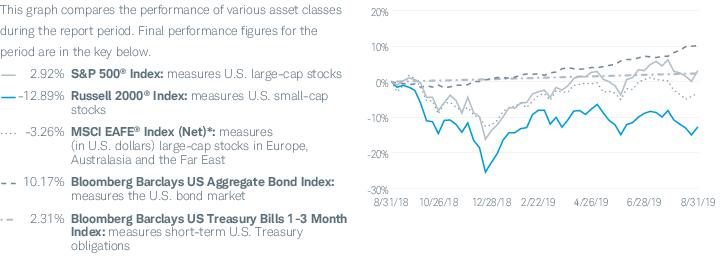
| * | The net version of the index reflects reinvested dividends net of withholding taxes, but reflects no deductions for expenses or other taxes. |
 | Christopher Bliss, CFA, Vice President and Head of Passive Equity Strategies, leads the portfolio management team for Schwab’s passive equity mutual funds and ETFs. He also has overall responsibility for all aspects of the management of the funds. Prior to joining CSIM in 2016, Mr. Bliss spent 12 years at BlackRock (formerly Barclays Global Investors) managing and leading institutional index teams, most recently as a managing director and head of the Americas institutional index team. Prior to BlackRock, he worked as an equity analyst and portfolio manager for Harris Bretall and before that, as a research analyst for JP Morgan. |
 | Jeremy Brown, Portfolio Manager, is responsible for the day-to-day co-management of the funds. Prior to joining CSIM in 2017, Mr. Brown spent six years with ALPS Advisors, Inc. in Denver, most recently as a senior analyst on the ETF portfolio management and research team where he performed portfolio management, trading and analytics/research functions for ALPS ETFs and passive funds. Additionally, Mr. Brown led a number of investment research, commentary, industry trend analysis and sales and marketing support initiatives. |
 | Ferian Juwono, CFA, Senior Portfolio Manager, is responsible for the day-to-day co-management of the funds. Prior to joining CSIM in 2010, Mr. Juwono worked at BlackRock (formerly Barclays Global Investors), where he spent more than three years as a portfolio manager, managing equity index funds for institutional clients, and two years as a senior business analyst. Prior to that, Mr. Juwono worked for more than four years as a senior financial analyst with Union Bank of California. |
 | Sabya Sinha, Portfolio Manager, is responsible for the day-to-day co-management of the funds. Prior to joining CSIM in 2015, Mr. Sinha spent a year at F-Squared Investments on the product development and analytics team. Prior to F-Squared, he worked at IndexIQ Advisors as a senior index portfolio manager for three years and for Bank of America’s Columbia Management subsidiary as a portfolio manager for three years. |

| Fund and Inception Date | 1 Year | 5 Years | Since Inception* |
| Fund: Schwab U.S. Broad Market ETF (11/3/09) | |||
| Market Price Return2 | 1.26% | 9.54% | 13.36% |
| NAV Return2 | 1.35% | 9.57% | 13.37% |
| Dow Jones U.S. Broad Stock Market Index | 1.35% | 9.58% | 13.39% |
| ETF Category: Morningstar Large Blend3 | 1.45% | 8.18% | N/A |
| Fund Expense Ratio4: 0.03% | |||
| * | Inception (11/3/09) represents the date that the shares began trading in the secondary market. |
| 1 | Performance does not reflect the deduction of taxes that a shareholder would pay on fund distributions or on the redemption or sale of fund shares. |
| 2 | ETF performance must be shown based on both a market price and NAV basis. The fund’s per share NAV is the value of one share of the fund. NAV is calculated by taking the fund’s total assets (including the market value of securities owned), subtracting liabilities, and dividing by the number of shares outstanding. The NAV Return is based on the NAV of the fund, and the Market Price Return is based on the market price per share of the fund. The price used to calculate market return (Market Price) is determined using the Official Closing Price on the primary stock exchange (generally, 4:00 p.m. Eastern time) and may not represent the returns you would receive if shares were traded at other times. NAV is used as a proxy for purposes of calculating Market Price Return on inception date. Market Price and NAV returns assume that dividends and capital gain distributions have been reinvested in the fund at Market Price and NAV, respectively. |
| 3 | Source for category information: Morningstar, Inc. The Morningstar Category return represents all passively- and actively-managed ETFs within the category as of the report date. |
| 4 | As stated in the prospectus. |
| Number of Holdings | 2,445 |
| Weighted Average Market Cap (millions) | $208,157 |
| Price/Earnings Ratio (P/E) | 19.9 |
| Price/Book Ratio (P/B) | 2.9 |
| Portfolio Turnover Rate | 4%2 |
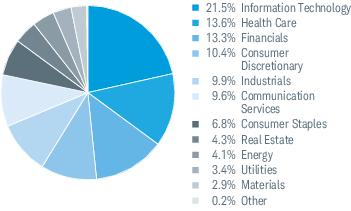
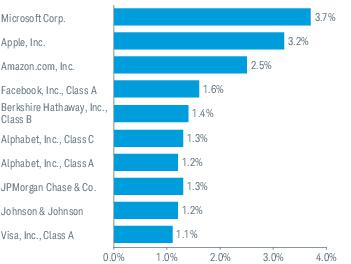
| 1 | Excludes derivatives. |
| 2 | Portfolio turnover rate excludes securities received or delivered from processing of in-kind creations or redemptions. |
| 3 | The percentage may differ from the Portfolio Holdings because the above calculation is based on a percentage of total investments, excluding derivatives, whereas the calculation in the Portfolio Holdings is based on a percentage of net assets. |
| 4 | This list is not a recommendation of any security by the investment adviser. |
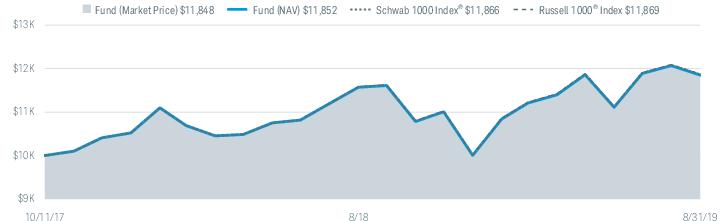
| Fund and Inception Date | 1 Year | Since Inception* |
| Fund: Schwab 1000 Index ETF (10/11/17) | ||
| Market Price Return2 | 2.35% | 9.38% |
| NAV Return2 | 2.42% | 9.41% |
| Schwab 1000 Index® | 2.49% | 9.48% |
| Russell 1000® Index | 2.49% | 9.50% |
| ETF Category: Morningstar Large Blend3 | 1.45% | N/A |
| Fund Expense Ratio4: 0.05% | ||
| * | Inception (10/11/17) represents the date that the shares began trading in the secondary market. |
| 1 | Performance does not reflect the deduction of taxes that a shareholder would pay on fund distributions or on the redemption or sale of fund shares. |
| 2 | ETF performance must be shown based on both a market price and NAV basis. The fund’s per share NAV is the value of one share of the fund. NAV is calculated by taking the fund’s total assets (including the market value of securities owned), subtracting liabilities, and dividing by the number of shares outstanding. The NAV Return is based on the NAV of the fund, and the Market Price Return is based on the market price per share of the fund. The price used to calculate market return (Market Price) is determined using the Official Closing Price on the primary stock exchange (generally, 4:00 p.m. Eastern time) and may not represent the returns you would receive if shares were traded at other times. NAV is used as a proxy for purposes of calculating Market Price Return on inception date. Market Price and NAV returns assume that dividends and capital gain distributions have been reinvested in the fund at Market Price and NAV, respectively. |
| 3 | Source for category information: Morningstar, Inc. The Morningstar Category return represents all passively- and actively-managed ETFs within the category as of the report date. |
| 4 | As stated in the prospectus. |
| Number of Holdings | 990 |
| Weighted Average Market Cap (millions) | $221,081 |
| Price/Earnings Ratio (P/E) | 20.2 |
| Price/Book Ratio (P/B) | 3.0 |
| Portfolio Turnover Rate | 5%2 |
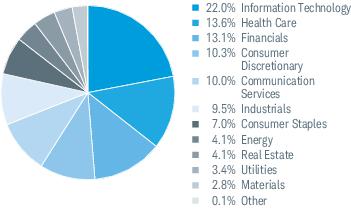
| 1 | Excludes derivatives. |
| 2 | Portfolio turnover rate excludes securities received or delivered from processing of in-kind creations or redemptions. |
| 3 | The percentage may differ from the Portfolio Holdings because the above calculation is based on a percentage of total investments, excluding derivatives, whereas the calculation in the Portfolio Holdings is based on a percentage of net assets. |
| 4 | This list is not a recommendation of any security by the investment adviser. |
| Fund and Inception Date | 1 Year | 5 Years | Since Inception* |
| Fund: Schwab U.S. Large-Cap ETF (11/3/09) | |||
| Market Price Return2 | 2.66% | 9.93% | 13.37% |
| NAV Return2 | 2.70% | 9.93% | 13.38% |
| Dow Jones U.S. Large-Cap Total Stock Market Index | 2.71% | 9.96% | 13.45% |
| ETF Category: Morningstar Large Blend3 | 1.45% | 8.18% | N/A |
| Fund Expense Ratio4: 0.03% | |||
| * | Inception (11/3/09) represents the date that the shares began trading in the secondary market. |
| 1 | Performance does not reflect the deduction of taxes that a shareholder would pay on fund distributions or on the redemption or sale of fund shares. |
| 2 | ETF performance must be shown based on both a market price and NAV basis. The fund’s per share NAV is the value of one share of the fund. NAV is calculated by taking the fund’s total assets (including the market value of securities owned), subtracting liabilities, and dividing by the number of shares outstanding. The NAV Return is based on the NAV of the fund, and the Market Price Return is based on the market price per share of the fund. The price used to calculate market return (Market Price) is determined using the Official Closing Price on the primary stock exchange (generally, 4:00 p.m. Eastern time) and may not represent the returns you would receive if shares were traded at other times. NAV is used as a proxy for purposes of calculating Market Price Return on inception date. Market Price and NAV returns assume that dividends and capital gain distributions have been reinvested in the fund at Market Price and NAV, respectively. |
| 3 | Source for category information: Morningstar, Inc. The Morningstar Category return represents all passively- and actively-managed ETFs within the category as of the report date. |
| 4 | As stated in the prospectus. |
| Number of Holdings | 754 |
| Weighted Average Market Cap (millions) | $229,690 |
| Price/Earnings Ratio (P/E) | 20.2 |
| Price/Book Ratio (P/B) | 3.1 |
| Portfolio Turnover Rate | 4%2 |

| 1 | Excludes derivatives. |
| 2 | Portfolio turnover rate excludes securities received or delivered from processing of in-kind creations or redemptions. |
| 3 | The percentage may differ from the Portfolio Holdings because the above calculation is based on a percentage of total investments, excluding derivatives, whereas the calculation in the Portfolio Holdings is based on a percentage of net assets. |
| 4 | This list is not a recommendation of any security by the investment adviser. |
| Fund and Inception Date | 1 Year | 5 Years | Since Inception* |
| Fund: Schwab U.S. Large-Cap Growth ETF (12/11/09) | |||
| Market Price Return2 | 4.02% | 12.11% | 14.36% |
| NAV Return2 | 4.09% | 12.12% | 14.37% |
| Dow Jones U.S. Large-Cap Growth Total Stock Market Index | 4.10% | 12.17% | 14.46% |
| ETF Category: Morningstar Large Growth3 | 2.69% | 10.73% | N/A |
| Fund Expense Ratio4: 0.04% | |||
| * | Inception (12/11/09) represents the date that the shares began trading in the secondary market. |
| 1 | Performance does not reflect the deduction of taxes that a shareholder would pay on fund distributions or on the redemption or sale of fund shares. |
| 2 | ETF performance must be shown based on both a market price and NAV basis. The fund’s per share NAV is the value of one share of the fund. NAV is calculated by taking the fund’s total assets (including the market value of securities owned), subtracting liabilities, and dividing by the number of shares outstanding. The NAV Return is based on the NAV of the fund, and the Market Price Return is based on the market price per share of the fund. The price used to calculate market return (Market Price) is determined using the Official Closing Price on the primary stock exchange (generally, 4:00 p.m. Eastern time) and may not represent the returns you would receive if shares were traded at other times. NAV is used as a proxy for purposes of calculating Market Price Return on inception date. Market Price and NAV returns assume that dividends and capital gain distributions have been reinvested in the fund at Market Price and NAV, respectively. |
| 3 | Source for category information: Morningstar, Inc. The Morningstar Category return represents all passively- and actively-managed ETFs within the category as of the report date. |
| 4 | As stated in the prospectus. |
| Number of Holdings | 408 |
| Weighted Average Market Cap (millions) | $309,766 |
| Price/Earnings Ratio (P/E) | 25.2 |
| Price/Book Ratio (P/B) | 4.4 |
| Portfolio Turnover Rate | 14%2 |
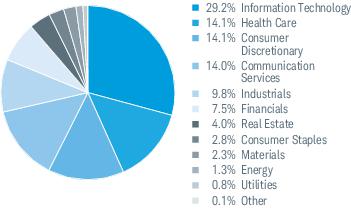
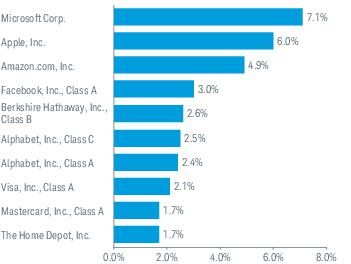
| 1 | Excludes derivatives. |
| 2 | Portfolio turnover rate excludes securities received or delivered from processing of in-kind creations or redemptions. |
| 3 | The percentage may differ from the Portfolio Holdings because the above calculation is based on a percentage of total investments, excluding derivatives, whereas the calculation in the Portfolio Holdings is based on a percentage of net assets. |
| 4 | This list is not a recommendation of any security by the investment adviser. |
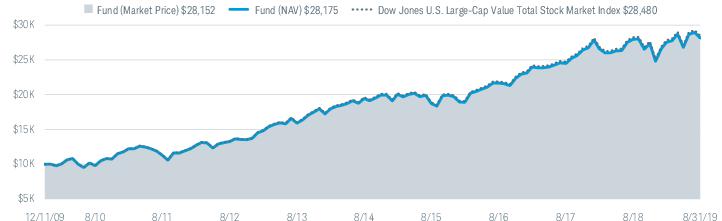
| Fund and Inception Date | 1 Year | 5 Years | Since Inception* |
| Fund: Schwab U.S. Large-Cap Value ETF (12/11/09) | |||
| Market Price Return2 | 0.65% | 7.67% | 11.23% |
| NAV Return2 | 0.70% | 7.68% | 11.24% |
| Dow Jones U.S. Large-Cap Value Total Stock Market Index | 0.75% | 7.74% | 11.37% |
| ETF Category: Morningstar Large Value3 | -1.41% | 6.12% | N/A |
| Fund Expense Ratio4: 0.04% | |||
| * | Inception (12/11/09) represents the date that the shares began trading in the secondary market. |
| 1 | Performance does not reflect the deduction of taxes that a shareholder would pay on fund distributions or on the redemption or sale of fund shares. |
| 2 | ETF performance must be shown based on both a market price and NAV basis. The fund’s per share NAV is the value of one share of the fund. NAV is calculated by taking the fund’s total assets (including the market value of securities owned), subtracting liabilities, and dividing by the number of shares outstanding. The NAV Return is based on the NAV of the fund, and the Market Price Return is based on the market price per share of the fund. The price used to calculate market return (Market Price) is determined using the Official Closing Price on the primary stock exchange (generally, 4:00 p.m. Eastern time) and may not represent the returns you would receive if shares were traded at other times. NAV is used as a proxy for purposes of calculating Market Price Return on inception date. Market Price and NAV returns assume that dividends and capital gain distributions have been reinvested in the fund at Market Price and NAV, respectively. |
| 3 | Source for category information: Morningstar, Inc. The Morningstar Category return represents all passively- and actively-managed ETFs within the category as of the report date. |
| 4 | As stated in the prospectus. |
| Number of Holdings | 348 |
| Weighted Average Market Cap (millions) | $124,852 |
| Price/Earnings Ratio (P/E) | 16.0 |
| Price/Book Ratio (P/B) | 2.2 |
| Portfolio Turnover Rate | 7%2 |
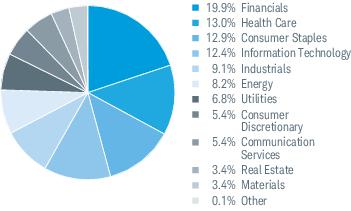
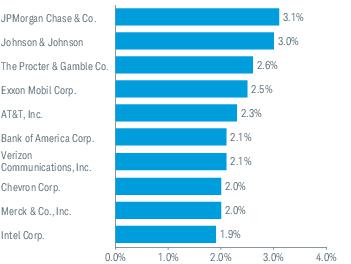
| 1 | Excludes derivatives. |
| 2 | Portfolio turnover rate excludes securities received or delivered from processing of in-kind creations or redemptions. |
| 3 | The percentage may differ from the Portfolio Holdings because the above calculation is based on a percentage of total investments, excluding derivatives, whereas the calculation in the Portfolio Holdings is based on a percentage of net assets. |
| 4 | This list is not a recommendation of any security by the investment adviser. |
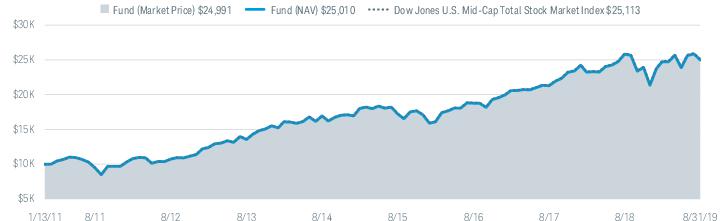
| Fund and Inception Date | 1 Year | 5 Years | Since Inception* |
| Fund: Schwab U.S. Mid-Cap ETF (1/13/11) | |||
| Market Price Return2 | -3.34% | 8.07% | 11.19% |
| NAV Return2 | -3.24% | 8.09% | 11.20% |
| Dow Jones U.S. Mid-Cap Total Stock Market Index | -3.20% | 8.12% | 11.26% |
| ETF Category: Morningstar Mid-Cap Blend3 | -4.57% | 5.23% | N/A |
| Fund Expense Ratio4: 0.04% | |||
| * | Inception (1/13/11) represents the date that the shares began trading in the secondary market. |
| 1 | Performance does not reflect the deduction of taxes that a shareholder would pay on fund distributions or on the redemption or sale of fund shares. |
| 2 | ETF performance must be shown based on both a market price and NAV basis. The fund’s per share NAV is the value of one share of the fund. NAV is calculated by taking the fund’s total assets (including the market value of securities owned), subtracting liabilities, and dividing by the number of shares outstanding. The NAV Return is based on the NAV of the fund, and the Market Price Return is based on the market price per share of the fund. The price used to calculate market return (Market Price) is determined using the Official Closing Price on the primary stock exchange (generally, 4:00 p.m. Eastern time) and may not represent the returns you would receive if shares were traded at other times. NAV is used as a proxy for purposes of calculating Market Price Return on inception date. Market Price and NAV returns assume that dividends and capital gain distributions have been reinvested in the fund at Market Price and NAV, respectively. |
| 3 | Source for category information: Morningstar, Inc. The Morningstar Category return represents all passively- and actively-managed ETFs within the category as of the report date. |
| 4 | As stated in the prospectus. Effective March 11, 2019, the management fee was reduced to 0.04%. For more information, see financial note 4 or refer to the prospectus supplement dated March 11, 2019. |
| Number of Holdings | 504 |
| Weighted Average Market Cap (millions) | $8,851 |
| Price/Earnings Ratio (P/E) | 19.8 |
| Price/Book Ratio (P/B) | 2.3 |
| Portfolio Turnover Rate | 19%2 |
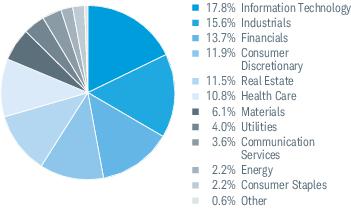
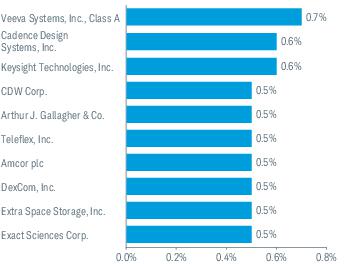
| 1 | Excludes derivatives. |
| 2 | Portfolio turnover rate excludes securities received or delivered from processing of in-kind creations or redemptions. |
| 3 | The percentage may differ from the Portfolio Holdings because the above calculation is based on a percentage of total investments, excluding derivatives, whereas the calculation in the Portfolio Holdings is based on a percentage of net assets. |
| 4 | This list is not a recommendation of any security by the investment adviser. |
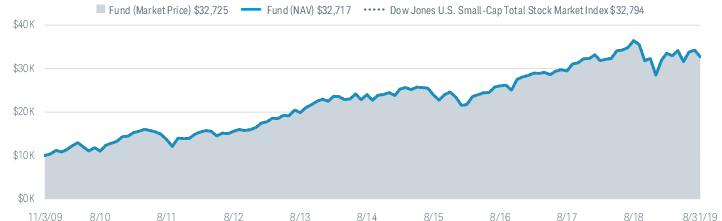
| Fund and Inception Date | 1 Year | 5 Years | Since Inception* |
| Fund: Schwab U.S. Small-Cap ETF (11/3/09) | |||
| Market Price Return2 | -10.21% | 6.39% | 12.82% |
| NAV Return2 | -10.26% | 6.36% | 12.82% |
| Dow Jones U.S. Small-Cap Total Stock Market Index | -10.28% | 6.33% | 12.85% |
| ETF Category: Morningstar Small Blend3 | -12.34% | 5.07% | N/A |
| Fund Expense Ratio4: 0.04% | |||
| * | Inception (11/3/09) represents the date that the shares began trading in the secondary market. |
| 1 | Performance does not reflect the deduction of taxes that a shareholder would pay on fund distributions or on the redemption or sale of fund shares. |
| 2 | ETF performance must be shown based on both a market price and NAV basis. The fund’s per share NAV is the value of one share of the fund. NAV is calculated by taking the fund’s total assets (including the market value of securities owned), subtracting liabilities, and dividing by the number of shares outstanding. The NAV Return is based on the NAV of the fund, and the Market Price Return is based on the market price per share of the fund. The price used to calculate market return (Market Price) is determined using the Official Closing Price on the primary stock exchange (generally, 4:00 p.m. Eastern time) and may not represent the returns you would receive if shares were traded at other times. NAV is used as a proxy for purposes of calculating Market Price Return on inception date. Market Price and NAV returns assume that dividends and capital gain distributions have been reinvested in the fund at Market Price and NAV, respectively. |
| 3 | Source for category information: Morningstar, Inc. The Morningstar Category return represents all passively- and actively-managed ETFs within the category as of the report date. |
| 4 | As stated in the prospectus. Effective March 11, 2019, the management fee was reduced to 0.04%. For more information, see financial note 4 or refer to the prospectus supplement dated March 11, 2019. |
| Number of Holdings | 1,731 |
| Weighted Average Market Cap (millions) | $3,796 |
| Price/Earnings Ratio (P/E) | 17.6 |
| Price/Book Ratio (P/B) | 2.0 |
| Portfolio Turnover Rate | 11%2 |
| 1 | Excludes derivatives. |
| 2 | Portfolio turnover rate excludes securities received or delivered from processing of in-kind creations or redemptions. |
| 3 | The percentage may differ from the Portfolio Holdings because the above calculation is based on a percentage of total investments, excluding derivatives, whereas the calculation in the Portfolio Holdings is based on a percentage of net assets. |
| 4 | This list is not a recommendation of any security by the investment adviser. |
| Fund and Inception Date | 1 Year | 5 Years | Since Inception* |
| Fund: Schwab U.S. Dividend Equity ETF (10/20/11) | |||
| Market Price Return2 | 4.09% | 9.61% | 13.26% |
| NAV Return2 | 4.18% | 9.63% | 13.27% |
| Dow Jones U.S. Dividend 100TM Index | 4.27% | 9.74% | 13.41% |
| ETF Category: Morningstar Large Value3 | -1.41% | 6.12% | N/A |
| Fund Expense Ratio4: 0.06% | |||
| * | Inception (10/20/11) represents the date that the shares began trading in the secondary market. |
| 1 | Performance does not reflect the deduction of taxes that a shareholder would pay on fund distributions or on the redemption or sale of fund shares. |
| 2 | ETF performance must be shown based on both a market price and NAV basis. The fund’s per share NAV is the value of one share of the fund. NAV is calculated by taking the fund’s total assets (including the market value of securities owned), subtracting liabilities, and dividing by the number of shares outstanding. The NAV Return is based on the NAV of the fund, and the Market Price Return is based on the market price per share of the fund. The price used to calculate market return (Market Price) is determined using the Official Closing Price on the primary stock exchange (generally, 4:00 p.m. Eastern time) and may not represent the returns you would receive if shares were traded at other times. NAV is used as a proxy for purposes of calculating Market Price Return on inception date. Market Price and NAV returns assume that dividends and capital gain distributions have been reinvested in the fund at Market Price and NAV, respectively. |
| 3 | Source for category information: Morningstar, Inc. The Morningstar Category return represents all passively- and actively-managed ETFs within the category as of the report date. |
| 4 | As stated in the prospectus. Effective March 11, 2019, the management fee was reduced to 0.06%. For more information, see financial note 4 or refer to the prospectus supplement dated March 11, 2019. |
| Number of Holdings | 101 |
| Weighted Average Market Cap (millions) | $124,784 |
| Price/Earnings Ratio (P/E) | 16.7 |
| Price/Book Ratio (P/B) | 3.5 |
| Portfolio Turnover Rate | 24%2 |
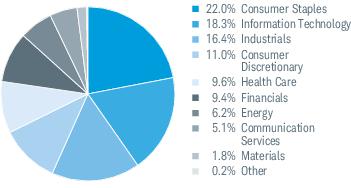
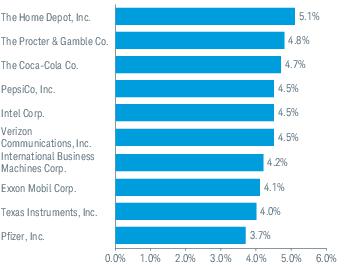
| 1 | Excludes derivatives. |
| 2 | Portfolio turnover rate excludes securities received or delivered from processing of in-kind creations or redemptions. |
| 3 | The percentage may differ from the Portfolio Holdings because the above calculation is based on a percentage of total investments, excluding derivatives, whereas the calculation in the Portfolio Holdings is based on a percentage of net assets. |
| 4 | This list is not a recommendation of any security by the investment adviser. |
| Expense Ratio (Annualized)1 | Beginning Account Value at 3/1/19 | Ending Account Value (Net of Expenses) at 8/31/19 | Expenses Paid During Period 3/1/19-8/31/192 | |
| Schwab U.S. Broad Market ETF | ||||
| Actual Return | 0.03% | $1,000.00 | $1,050.40 | $0.16 |
| Hypothetical 5% Return | 0.03% | $1,000.00 | $1,025.05 | $0.15 |
| Schwab 1000 Index ETF | ||||
| Actual Return | 0.05% | $1,000.00 | $1,057.40 | $0.26 |
| Hypothetical 5% Return | 0.05% | $1,000.00 | $1,024.95 | $0.26 |
| Schwab U.S. Large-Cap ETF | ||||
| Actual Return | 0.03% | $1,000.00 | $1,058.70 | $0.16 |
| Hypothetical 5% Return | 0.03% | $1,000.00 | $1,025.05 | $0.15 |
| Schwab U.S. Large-Cap Growth ETF | ||||
| Actual Return | 0.04% | $1,000.00 | $1,087.80 | $0.21 |
| Hypothetical 5% Return | 0.04% | $1,000.00 | $1,025.00 | $0.20 |
| Schwab U.S. Large-Cap Value ETF | ||||
| Actual Return | 0.04% | $1,000.00 | $1,023.00 | $0.20 |
| Hypothetical 5% Return | 0.04% | $1,000.00 | $1,025.00 | $0.20 |
| Schwab U.S. Mid-Cap ETF | ||||
| Actual Return | 0.04% | $1,000.00 | $1,010.20 | $0.20 |
| Hypothetical 5% Return | 0.04% | $1,000.00 | $1,025.00 | $0.20 |
| Schwab U.S. Small-Cap ETF | ||||
| Actual Return | 0.04% | $1,000.00 | $975.30 | $0.20 |
| Hypothetical 5% Return | 0.04% | $1,000.00 | $1,025.00 | $0.20 |
| Schwab U.S. Dividend Equity ETF | ||||
| Actual Return | 0.06% | $1,000.00 | $1,043.80 | $0.31 |
| Hypothetical 5% Return | 0.06% | $1,000.00 | $1,024.90 | $0.31 |
| 1 | Based on the most recent six-month expense ratio; may differ from the expense ratio provided in the Financial Highlights which covers a 12-month period. |
| 2 | Expenses for each fund are equal to its annualized expense ratio, multiplied by the average account value over the period, multiplied by 184 days of the period, and divided by 365 days of the fiscal year. |
| 9/1/18– 8/31/19 | 9/1/17– 8/31/18 | 9/1/16– 8/31/17 | 9/1/15– 8/31/16 | 9/1/14– 8/31/15 | ||
| Per-Share Data | ||||||
| Net asset value at beginning of period | $70.55 | $59.72 | $52.42 | $48.02 | $48.75 | |
| Income (loss) from investment operations: | ||||||
| Net investment income (loss)1 | 1.43 | 1.18 | 1.12 | 1.03 | 0.99 | |
| Net realized and unrealized gains (losses) | (0.55) | 10.77 | 7.20 | 4.34 | (0.79) | |
| Total from investment operations | 0.88 | 11.95 | 8.32 | 5.37 | 0.20 | |
| Less distributions: | ||||||
| Distributions from net investment income | (1.30) | (1.12) | (1.02) | (0.97) | (0.93) | |
| Net asset value at end of period | $70.13 | $70.55 | $59.72 | $52.42 | $48.02 | |
| Total return | 1.35% | 20.20% | 16.03% | 11.35% | 0.33% | |
| Ratios/Supplemental Data | ||||||
| Ratios to average net assets: | ||||||
| Total expenses | 0.03% | 0.03% | 0.03% | 0.03%2 | 0.04% | |
| Net investment income (loss) | 2.12% | 1.81% | 1.99% | 2.09% | 1.98% | |
| Portfolio turnover rate3 | 4% | 4% | 4% | 5% | 3% | |
| Net assets, end of period (x 1,000) | $14,877,368 | $13,326,391 | $10,215,289 | $6,858,980 | $4,919,185 | |
| Security | Number of Shares | % of Net Assets | Value ($) | |
| Common Stock99.8% of net assets | ||||
| Automobiles & Components 0.7% | ||||
| Other Securities | 0.7 | 101,620,337 | ||
| Banks 5.5% | ||||
| Bank of America Corp. | 4,529,217 | 0.9 | 124,598,760 | |
| Citigroup, Inc. | 1,184,866 | 0.5 | 76,246,127 | |
| JPMorgan Chase & Co. | 1,660,825 | 1.3 | 182,458,234 | |
| Wells Fargo & Co. | 2,071,190 | 0.7 | 96,455,318 | |
| Other Securities | 2.1 | 338,305,194 | ||
| 5.5 | 818,063,633 | |||
| Capital Goods 6.9% | ||||
| Honeywell International, Inc. | 372,212 | 0.4 | 61,273,539 | |
| The Boeing Co. | 267,831 | 0.7 | 97,514,589 | |
| Other Securities | 5.8 | 862,871,671 | ||
| 6.9 | 1,021,659,799 | |||
| Commercial & Professional Services 1.2% | ||||
| Other Securities | 1.2 | 170,201,002 | ||
| Consumer Durables & Apparel 1.3% | ||||
| Other Securities | 1.3 | 197,894,577 | ||
| Consumer Services 2.4% | ||||
| McDonald's Corp. | 390,840 | 0.6 | 85,191,395 | |
| Starbucks Corp. | 620,401 | 0.4 | 59,905,921 | |
| Other Securities | 1.4 | 214,436,235 | ||
| 2.4 | 359,533,551 | |||
| Diversified Financials 5.0% | ||||
| Berkshire Hathaway, Inc., Class B * | 992,608 | 1.4 | 201,906,393 | |
| The Charles Schwab Corp.(b) | 604,078 | 0.2 | 23,118,065 | |
| Other Securities | 3.4 | 524,675,686 | ||
| 5.0 | 749,700,144 | |||
| Energy 4.1% | ||||
| Chevron Corp. | 974,561 | 0.8 | 114,725,321 | |
| Exxon Mobil Corp. | 2,167,184 | 1.0 | 148,408,760 | |
| Other Securities | 2.3 | 344,877,444 | ||
| 4.1 | 608,011,525 | |||
| Security | Number of Shares | % of Net Assets | Value ($) | |
| Food & Staples Retailing 1.4% | ||||
| Costco Wholesale Corp. | 225,187 | 0.5 | 66,376,120 | |
| Walmart, Inc. | 716,158 | 0.6 | 81,828,213 | |
| Other Securities | 0.3 | 63,768,111 | ||
| 1.4 | 211,972,444 | |||
| Food, Beverage & Tobacco 3.6% | ||||
| PepsiCo, Inc. | 717,459 | 0.7 | 98,098,169 | |
| Philip Morris International, Inc. | 797,091 | 0.4 | 57,462,290 | |
| The Coca-Cola Co. | 1,967,619 | 0.7 | 108,297,750 | |
| Other Securities | 1.8 | 267,938,849 | ||
| 3.6 | 531,797,058 | |||
| Health Care Equipment & Services 6.2% | ||||
| Abbott Laboratories | 904,161 | 0.5 | 77,143,017 | |
| Medtronic plc | 687,352 | 0.5 | 74,158,407 | |
| UnitedHealth Group, Inc. | 486,986 | 0.8 | 113,954,724 | |
| Other Securities | 4.4 | 661,527,723 | ||
| 6.2 | 926,783,871 | |||
| Household & Personal Products 1.8% | ||||
| The Procter & Gamble Co. | 1,285,009 | 1.0 | 154,496,632 | |
| Other Securities | 0.8 | 112,445,778 | ||
| 1.8 | 266,942,410 | |||
| Insurance 2.7% | ||||
| Other Securities | 2.7 | 406,821,007 | ||
| Materials 2.9% | ||||
| Other Securities | 2.9 | 432,939,526 | ||
| Media & Entertainment 7.6% | ||||
| Alphabet, Inc., Class A * | 153,380 | 1.2 | 182,603,491 | |
| Alphabet, Inc., Class C * | 157,079 | 1.3 | 186,625,560 | |
| Comcast Corp., Class A | 2,318,908 | 0.7 | 102,634,868 | |
| Facebook, Inc., Class A * | 1,230,609 | 1.6 | 228,487,173 | |
| Netflix, Inc. * | 224,079 | 0.5 | 65,823,206 | |
| The Walt Disney Co. | 894,518 | 0.8 | 122,781,541 | |
| Other Securities | 1.5 | 244,071,712 | ||
| 7.6 | 1,133,027,551 | |||
| Pharmaceuticals, Biotechnology & Life Sciences 7.4% | ||||
| Amgen, Inc. | 312,747 | 0.5 | 65,245,279 | |
| Johnson & Johnson | 1,360,285 | 1.2 | 174,606,183 | |
| Merck & Co., Inc. | 1,319,021 | 0.8 | 114,055,746 | |
| Pfizer, Inc. | 2,844,196 | 0.7 | 101,111,168 | |
| Security | Number of Shares | % of Net Assets | Value ($) | |
| Thermo Fisher Scientific, Inc. | 204,602 | 0.4 | 58,733,050 | |
| Other Securities | 3.8 | 587,429,619 | ||
| 7.4 | 1,101,181,045 | |||
| Real Estate 4.3% | ||||
| Other Securities | 4.3 | 634,545,922 | ||
| Retailing 6.0% | ||||
| Amazon.com, Inc. * | 211,869 | 2.5 | 376,340,786 | |
| The Home Depot, Inc. | 563,464 | 0.9 | 128,419,080 | |
| Other Securities | 2.6 | 387,817,622 | ||
| 6.0 | 892,577,488 | |||
| Semiconductors & Semiconductor Equipment 3.7% | ||||
| Broadcom, Inc. | 202,811 | 0.4 | 57,322,501 | |
| Intel Corp. | 2,292,366 | 0.7 | 108,681,072 | |
| Texas Instruments, Inc. | 480,571 | 0.4 | 59,470,661 | |
| Other Securities | 2.2 | 321,239,146 | ||
| 3.7 | 546,713,380 | |||
| Software & Services 12.5% | ||||
| Accenture plc, Class A | 326,196 | 0.4 | 64,642,261 | |
| Adobe, Inc. * | 250,178 | 0.5 | 71,178,143 | |
| International Business Machines Corp. | 454,045 | 0.4 | 61,536,719 | |
| Mastercard, Inc., Class A | 460,094 | 0.9 | 129,456,649 | |
| Microsoft Corp. | 3,924,136 | 3.7 | 540,981,389 | |
| Oracle Corp. | 1,241,462 | 0.4 | 64,630,512 | |
| PayPal Holdings, Inc. * | 601,648 | 0.5 | 65,609,714 | |
| salesforce.com, Inc. * | 437,754 | 0.5 | 68,320,267 | |
| Visa, Inc., Class A | 890,471 | 1.1 | 161,014,966 | |
| Other Securities | 4.1 | 630,915,488 | ||
| 12.5 | 1,858,286,108 | |||
| Technology Hardware & Equipment 5.3% | ||||
| Apple, Inc. | 2,238,232 | 3.2 | 467,208,548 | |
| Cisco Systems, Inc. | 2,192,351 | 0.7 | 102,623,950 | |
| Other Securities | 1.4 | 223,264,158 | ||
| 5.3 | 793,096,656 | |||
| Telecommunication Services 2.0% | ||||
| AT&T, Inc. | 3,737,505 | 0.9 | 131,784,426 | |
| Verizon Communications, Inc. | 2,117,734 | 0.9 | 123,167,409 | |
| Other Securities | 0.2 | 34,904,175 | ||
| 2.0 | 289,856,010 | |||
| Transportation 1.9% | ||||
| Union Pacific Corp. | 362,665 | 0.4 | 58,737,223 | |
| Other Securities | 1.5 | 227,638,802 | ||
| 1.9 | 286,376,025 | |||
| Security | Number of Shares | % of Net Assets | Value ($) | |
| Utilities 3.4% | ||||
| Other Securities | 3.4 | 503,332,082 | ||
| Total Common Stock | ||||
| (Cost $11,556,565,092) | 14,842,933,151 | |||
| Rights0.0% of net assets | ||||
| Materials 0.0% | ||||
| Other Securities | 0.0 | 6,692 | ||
| Media 0.0% | ||||
| Other Securities | 0.0 | 3,585 | ||
| Total Rights | ||||
| (Cost $6,692) | 10,277 | |||
| Other Investment Companies0.2% of net assets | ||||
| Money Market Fund 0.0% | ||||
| Other Securities | 0.0 | 4,400,132 | ||
| Securities Lending Collateral 0.2% | ||||
| Other Securities | 0.2 | 25,769,726 | ||
| Total Other Investment Companies | ||||
| (Cost $30,169,858) | 30,169,858 | |||
| Number of Contracts | Notional Amount ($) | Current Value/ Unrealized Appreciation ($) | ||
| Futures Contracts | ||||
| Long | ||||
| S&P 500 Index, e-mini, expires 09/20/19 | 218 | 31,880,320 | 97,136 | |
| * | Non-income producing security. |
| (a) | All or a portion of this security is on loan. Securities on loan were valued at $24,663,894. |
| (b) | Issuer is affiliated with the fund’s investment adviser. |
| (c) | Fair-valued by management using significant unobservable inputs in accordance with procedures approved by the fund’s Board of Trustees. |
| (d) | The rate shown is the 7-day yield. |
| CVR — | Contingent Value Rights |
| REIT — | Real Estate Investment Trust |
| Market Value at 8/31/18 | Gross Purchases | Gross Sales | Realized Gains(Losses) | Net change in unrealized appreciation (depreciation) | Market Value at 8/31/19 | Balance of Shares Held at 8/31/19 | Dividends Received | |
| The Charles Schwab Corp. | $27,122,520 | $5,892,537 | ($2,604,396) | $890,891 | ($8,183,487) | $23,118,065 | 604,078 | $378,329 |
| Description | Quoted Prices in Active Markets for Identical Assets (Level 1) | Other Significant Observable Inputs (Level 2) | Significant Unobservable Inputs (Level 3) | Total | |
| Assets | |||||
| Common Stock1 | $14,842,933,151 | $— | $— | $14,842,933,151 | |
| Rights1 | |||||
| Materials | — | — | 6,692 | 6,692 | |
| Media | — | — | 3,585 | 3,585 | |
| Other Investment Companies1 | 30,169,858 | — | — | 30,169,858 | |
| Futures Contracts2 | 97,136 | — | — | 97,136 | |
| Total | $14,873,200,145 | $— | $10,277 | $14,873,210,422 |
| 1 | As categorized in the complete schedule of Portfolio Holdings. |
| 2 | Futures contracts are valued at unrealized appreciation or depreciation. |
| Assets | ||
| Investments in affiliated issuer, at value (cost $21,752,560) | $23,118,065 | |
| Investments in unaffiliated issuers, at value (cost $11,539,219,356) including securities on loan of $24,663,894 | 14,824,225,495 | |
| Collateral invested for securities on loan, at value (cost $25,769,726) | 25,769,726 | |
| Cash | 895,905 | |
| Deposit with broker for futures contracts | 2,066,400 | |
| Receivables: | ||
| Investments sold | 843,394 | |
| Dividends | 26,686,086 | |
| Income from securities on loan | + | 131,150 |
| Total assets | 14,903,736,221 | |
| Liabilities | ||
| Collateral held for securities on loan | 25,769,726 | |
| Payables: | ||
| Investments bought | 171,604 | |
| Management fees | 410,355 | |
| Variation margin on futures contracts | + | 16,890 |
| Total liabilities | 26,368,575 | |
| Net Assets | ||
| Total assets | 14,903,736,221 | |
| Total liabilities | – | 26,368,575 |
| Net assets | $14,877,367,646 | |
| Net Assets by Source | ||
| Capital received from investors | 11,602,365,487 | |
| Total distributable earnings1 | 3,275,002,159 | |
| Net Asset Value (NAV) | ||||
| Net Assets | ÷ | Shares Outstanding | = | NAV |
| $14,877,367,646 | 212,150,000 | $70.13 | ||
| 1 | The SEC eliminated the requirement to disclose total distributable earnings (loss) by each of its components as previously disclosed as the previous presentation did not provide insight into the tax implications of distributions (see financial note 11 for additional information). |
| Investment Income | ||
| Dividends received from affiliated issuer | $378,329 | |
| Dividends received from unaffiliated issuers (net of foreign withholding tax of $16,325) | 296,054,880 | |
| Securities on loan, net | + | 2,517,942 |
| Total investment income | 298,951,151 | |
| Expenses | ||
| Management fees | 4,162,548 | |
| Total expenses | – | 4,162,548 |
| Net investment income | 294,788,603 | |
| Realized and Unrealized Gains (Losses) | ||
| Net realized losses on affiliated issuer | (189,416) | |
| Net realized losses on unaffiliated investments | (35,285,253) | |
| Net realized gains on in-kind redemptions on affiliated issuer | 1,080,307 | |
| Net realized gains on in-kind redemptions on unaffiliated investments | 589,139,071 | |
| Net realized losses on futures contracts | + | (89,124) |
| Net realized gains | 554,655,585 | |
| Net change in unrealized appreciation (depreciation) on affiliated issuer | (8,183,487) | |
| Net change in unrealized appreciation (depreciation) on unaffiliated investments | (547,161,974) | |
| Net change in unrealized appreciation (depreciation) on futures contracts | + | (102,023) |
| Net change in unrealized appreciation (depreciation) | + | (555,447,484) |
| Net realized and unrealized losses | (791,899) | |
| Increase in net assets resulting from operations | $293,996,704 | |
| Operations | ||||
| 9/1/18-8/31/19 | 9/1/17-8/31/18 | |||
| Net investment income | $294,788,603 | $211,077,403 | ||
| Net realized gains | 554,655,585 | 192,178,495 | ||
| Net change in unrealized appreciation (depreciation) | + | (555,447,484) | 1,744,691,993 | |
| Increase in net assets resulting from operations | 293,996,704 | 2,147,947,891 | ||
| Distributions to Shareholders1 | ||||
| Total distributions | ($265,289,790) | ($199,698,380) | ||
| Transactions in Fund Shares | ||||||||
| 9/1/18-8/31/19 | 9/1/17-8/31/18 | |||||||
| SHARES | VALUE | SHARES | VALUE | |||||
| Shares sold | 42,400,000 | $2,804,352,289 | 23,600,000 | $1,536,444,895 | ||||
| Shares redeemed | + | (19,150,000) | (1,282,082,268) | (5,750,000) | (373,592,989) | |||
| Net transactions in fund shares | 23,250,000 | $1,522,270,021 | 17,850,000 | $1,162,851,906 | ||||
| Shares Outstanding and Net Assets | ||||||||
| 9/1/18-8/31/19 | 9/1/17-8/31/18 | |||||||
| SHARES | NET ASSETS | SHARES | NET ASSETS | |||||
| Beginning of period | 188,900,000 | $13,326,390,711 | 171,050,000 | $10,215,289,294 | ||||
| Total increase | + | 23,250,000 | 1,550,976,935 | 17,850,000 | 3,111,101,417 | |||
| End of period2 | 212,150,000 | $14,877,367,646 | 188,900,000 | $13,326,390,711 | ||||
| 1 | For the period ended August 31, 2018, the fund distributed to shareholders $199,698,380 from net investment income. The SEC eliminated the requirement to disclose distributions to shareholders from net investment income and from net realized gains in 2018 (see financial note 11 for additional information). |
| 2 | End of period - Net assets include net investment income not yet distributed of $44,482,540 at August 31, 2018. The SEC eliminated the requirement to disclose undistributed net investment income in 2018. |
| 9/1/18– 8/31/19 | 10/11/171– 8/31/18 | |||||
| Per-Share Data | ||||||
| Net asset value at beginning of period | $28.62 | $25.00 | ||||
| Income (loss) from investment operations: | ||||||
| Net investment income (loss)2 | 0.57 | 0.44 | ||||
| Net realized and unrealized gains (losses) | 0.10 | 3.47 | ||||
| Total from investment operations | 0.67 | 3.91 | ||||
| Less distributions: | ||||||
| Distributions from net investment income | (0.49) | (0.29) | ||||
| Net asset value at end of period | $28.80 | $28.62 | ||||
| Total return | 2.42% | 15.72%3 | ||||
| Ratios/Supplemental Data | ||||||
| Ratios to average net assets: | ||||||
| Total expenses | 0.05% | 0.05%4 | ||||
| Net investment income (loss) | 2.06% | 1.87%4 | ||||
| Portfolio turnover rate5 | 5% | 3%3 | ||||
| Net assets, end of period (x 1,000) | $838,213 | $486,487 | ||||
| Security | Number of Shares | % of Net Assets | Value ($) | |
| Common Stock99.8% of net assets | ||||
| Automobiles & Components 0.6% | ||||
| Other Securities | 0.6 | 5,343,607 | ||
| Banks 5.2% | ||||
| Bank of America Corp. | 271,382 | 0.9 | 7,465,719 | |
| Citigroup, Inc. | 71,011 | 0.6 | 4,569,558 | |
| JPMorgan Chase & Co. | 99,599 | 1.3 | 10,941,946 | |
| Wells Fargo & Co. | 124,135 | 0.7 | 5,780,967 | |
| Other Securities | 1.7 | 15,144,385 | ||
| 5.2 | 43,902,575 | |||
| Capital Goods 6.7% | ||||
| Honeywell International, Inc. | 22,346 | 0.5 | 3,678,598 | |
| The Boeing Co. | 16,059 | 0.7 | 5,846,921 | |
| Other Securities | 5.5 | 46,311,697 | ||
| 6.7 | 55,837,216 | |||
| Commercial & Professional Services 1.0% | ||||
| Other Securities | 1.0 | 7,937,574 | ||
| Consumer Durables & Apparel 1.2% | ||||
| Other Securities | 1.2 | 9,839,355 | ||
| Consumer Services 2.3% | ||||
| McDonald's Corp. | 23,432 | 0.6 | 5,107,473 | |
| Starbucks Corp. | 37,152 | 0.4 | 3,587,397 | |
| Other Securities | 1.3 | 10,828,050 | ||
| 2.3 | 19,522,920 | |||
| Diversified Financials 5.1% | ||||
| Berkshire Hathaway, Inc., Class B * | 59,476 | 1.5 | 12,098,013 | |
| The Charles Schwab Corp.(b) | 36,255 | 0.2 | 1,387,479 | |
| Other Securities | 3.4 | 28,991,060 | ||
| 5.1 | 42,476,552 | |||
| Energy 4.1% | ||||
| Chevron Corp. | 58,471 | 0.8 | 6,883,206 | |
| Exxon Mobil Corp. | 129,884 | 1.1 | 8,894,456 | |
| Other Securities | 2.2 | 18,787,451 | ||
| 4.1 | 34,565,113 | |||
| Security | Number of Shares | % of Net Assets | Value ($) | |
| Food & Staples Retailing 1.5% | ||||
| Costco Wholesale Corp. | 13,497 | 0.5 | 3,978,376 | |
| Walmart, Inc. | 42,919 | 0.6 | 4,903,925 | |
| Other Securities | 0.4 | 3,589,619 | ||
| 1.5 | 12,471,920 | |||
| Food, Beverage & Tobacco 3.7% | ||||
| PepsiCo, Inc. | 43,015 | 0.7 | 5,881,441 | |
| Philip Morris International, Inc. | 47,740 | 0.4 | 3,441,577 | |
| The Coca-Cola Co. | 117,816 | 0.8 | 6,484,593 | |
| Other Securities | 1.8 | 15,014,674 | ||
| 3.7 | 30,822,285 | |||
| Health Care Equipment & Services 6.3% | ||||
| Abbott Laboratories | 54,149 | 0.6 | 4,619,993 | |
| Medtronic plc | 41,141 | 0.5 | 4,438,703 | |
| UnitedHealth Group, Inc. | 29,168 | 0.8 | 6,825,312 | |
| Other Securities | 4.4 | 36,689,903 | ||
| 6.3 | 52,573,911 | |||
| Household & Personal Products 1.9% | ||||
| The Procter & Gamble Co. | 76,978 | 1.1 | 9,255,065 | |
| Other Securities | 0.8 | 6,263,200 | ||
| 1.9 | 15,518,265 | |||
| Insurance 2.7% | ||||
| Other Securities | 2.7 | 22,987,060 | ||
| Materials 2.8% | ||||
| Other Securities | 2.8 | 23,720,631 | ||
| Media & Entertainment 7.9% | ||||
| Alphabet, Inc., Class A * | 9,190 | 1.3 | 10,940,971 | |
| Alphabet, Inc., Class C * | 9,406 | 1.3 | 11,175,269 | |
| Comcast Corp., Class A | 138,917 | 0.7 | 6,148,466 | |
| Facebook, Inc., Class A * | 73,734 | 1.6 | 13,690,192 | |
| Netflix, Inc. * | 13,418 | 0.5 | 3,941,537 | |
| The Walt Disney Co. | 53,564 | 0.9 | 7,352,195 | |
| Other Securities | 1.6 | 13,127,738 | ||
| 7.9 | 66,376,368 | |||
| Pharmaceuticals, Biotechnology & Life Sciences 7.3% | ||||
| Amgen, Inc. | 18,705 | 0.5 | 3,902,237 | |
| Johnson & Johnson | 81,483 | 1.3 | 10,459,158 | |
| Merck & Co., Inc. | 79,021 | 0.8 | 6,832,946 | |
| Pfizer, Inc. | 170,383 | 0.7 | 6,057,116 | |
| Security | Number of Shares | % of Net Assets | Value ($) | |
| Thermo Fisher Scientific, Inc. | 12,269 | 0.4 | 3,521,939 | |
| Other Securities | 3.6 | 30,368,449 | ||
| 7.3 | 61,141,845 | |||
| Real Estate 4.1% | ||||
| Other Securities | 4.1 | 33,918,987 | ||
| Retailing 6.2% | ||||
| Amazon.com, Inc. * | 12,692 | 2.7 | 22,544,673 | |
| The Home Depot, Inc. | 33,767 | 0.9 | 7,695,837 | |
| Other Securities | 2.6 | 21,346,620 | ||
| 6.2 | 51,587,130 | |||
| Semiconductors & Semiconductor Equipment 3.7% | ||||
| Broadcom, Inc. | 12,148 | 0.4 | 3,433,511 | |
| Intel Corp. | 137,397 | 0.8 | 6,513,992 | |
| Texas Instruments, Inc. | 28,820 | 0.4 | 3,566,475 | |
| Other Securities | 2.1 | 17,788,303 | ||
| 3.7 | 31,302,281 | |||
| Software & Services 12.8% | ||||
| Accenture plc, Class A | 19,576 | 0.5 | 3,879,376 | |
| Adobe, Inc. * | 14,981 | 0.5 | 4,262,244 | |
| International Business Machines Corp. | 27,213 | 0.4 | 3,688,178 | |
| Mastercard, Inc., Class A | 27,582 | 0.9 | 7,760,747 | |
| Microsoft Corp. | 235,193 | 3.9 | 32,423,707 | |
| Oracle Corp. | 74,492 | 0.5 | 3,878,053 | |
| PayPal Holdings, Inc. * | 36,059 | 0.5 | 3,932,234 | |
| salesforce.com, Inc. * | 26,224 | 0.5 | 4,092,780 | |
| Visa, Inc., Class A | 53,375 | 1.2 | 9,651,267 | |
| Other Securities | 3.9 | 33,909,445 | ||
| 12.8 | 107,478,031 | |||
| Technology Hardware & Equipment 5.4% | ||||
| Apple, Inc. | 134,150 | 3.4 | 28,002,471 | |
| Cisco Systems, Inc. | 131,376 | 0.7 | 6,149,710 | |
| Other Securities | 1.3 | 11,262,677 | ||
| 5.4 | 45,414,858 | |||
| Telecommunication Services 2.0% | ||||
| AT&T, Inc. | 223,940 | 1.0 | 7,896,124 | |
| Verizon Communications, Inc. | 126,906 | 0.9 | 7,380,853 | |
| Other Securities | 0.1 | 1,723,724 | ||
| 2.0 | 17,000,701 | |||
| Security | Number of Shares | % of Net Assets | Value ($) | |
| Transportation 1.9% | ||||
| Union Pacific Corp. | 21,728 | 0.4 | 3,519,067 | |
| Other Securities | 1.5 | 12,591,920 | ||
| 1.9 | 16,110,987 | |||
| Utilities 3.4% | ||||
| Other Securities | 3.4 | 28,884,492 | ||
| Total Common Stock | ||||
| (Cost $774,069,496) | 836,734,664 | |||
| Other Investment Companies0.1% of net assets | ||||
| Money Market Fund 0.1% | ||||
| Other Securities | 0.1 | 639,417 | ||
| Securities Lending Collateral 0.0% | ||||
| Other Securities | 0.0 | 143,525 | ||
| Total Other Investment Companies | ||||
| (Cost $782,942) | 782,942 | |||
| Number of Contracts | Notional Amount ($) | Current Value/ Unrealized Appreciation ($) | ||
| Futures Contracts | ||||
| Long | ||||
| S&P 500 Index, e-mini, expires 09/20/19 | 9 | 1,316,160 | 14,050 | |
| * | Non-income producing security. |
| (a) | All or a portion of this security is on loan. Securities on loan were valued at $139,835. |
| (b) | Issuer is affiliated with the fund's investment adviser. |
| (c) | The rate shown is the 7-day yield. |
| REIT — | Real Estate Investment Trust |
| Market Value at 8/31/18 | Gross Purchases | Gross Sales | Realized Gains(Losses) | Net change in unrealized appreciation (depreciation) | Market Value at 8/31/19 | Balance of Shares Held at 8/31/19 | Dividends Received | |
| The Charles Schwab Corp. | $1,058,870 | $894,556 | ($222,333) | ($8,017) | ($335,597) | $1,387,479 | 36,255 | $20,750 |
| Description | Quoted Prices in Active Markets for Identical Assets (Level 1) | Other Significant Observable Inputs (Level 2) | Significant Unobservable Inputs (Level 3) | Total | |
| Assets | |||||
| Common Stock1 | $836,734,664 | $— | $— | $836,734,664 | |
| Other Investment Companies1 | 782,942 | — | — | 782,942 | |
| Futures Contracts2 | 14,050 | — | — | 14,050 | |
| Total | $837,531,656 | $— | $— | $837,531,656 |
| 1 | As categorized in the complete schedule of Portfolio Holdings. |
| 2 | Futures contracts are valued at unrealized appreciation or depreciation. |
| Assets | ||
| Investments in affiliated issuer, at value (cost $1,707,659) | $1,387,479 | |
| Investments in unaffiliated issuers, at value (cost $773,001,254) including securities on loan of $139,835 | 835,986,602 | |
| Collateral invested for securities on loan, at value (cost $143,525) | 143,525 | |
| Deposit with broker for futures contracts | 96,000 | |
| Receivables: | ||
| Investments sold | 39,458 | |
| Dividends | 1,516,589 | |
| Income from securities on loan | + | 89 |
| Total assets | 839,169,742 | |
| Liabilities | ||
| Collateral held for securities on loan | 143,525 | |
| Payables: | ||
| Investments bought | 774,545 | |
| Management fees | 37,551 | |
| Variation margin on futures contracts | + | 681 |
| Total liabilities | 956,302 | |
| Net Assets | ||
| Total assets | 839,169,742 | |
| Total liabilities | – | 956,302 |
| Net assets | $838,213,440 | |
| Net Assets by Source | ||
| Capital received from investors | 775,647,170 | |
| Total distributable earnings1 | 62,566,270 | |
| Net Asset Value (NAV) | ||||
| Net Assets | ÷ | Shares Outstanding | = | NAV |
| $838,213,440 | 29,100,000 | $28.80 | ||
| 1 | The SEC eliminated the requirement to disclose total distributable earnings (loss) by each of its components as previously disclosed as the previous presentation did not provide insight into the tax implications of distributions (see financial note 11 for additional information). |
| Investment Income | ||
| Dividends received from affiliated issuer | $20,750 | |
| Dividends received from unaffiliated issuers (net of foreign withholding tax of $474) | 14,706,298 | |
| Securities on loan, net | + | 326 |
| Total investment income | 14,727,374 | |
| Expenses | ||
| Management fees | 348,091 | |
| Total expenses | – | 348,091 |
| Net investment income | 14,379,283 | |
| Realized and Unrealized Gains (Losses) | ||
| Net realized losses on affiliated issuer | (18,756) | |
| Net realized losses on unaffiliated investments | (3,729,444) | |
| Net realized gains on in-kind redemptions on affiliated issuer | 10,739 | |
| Net realized gains on in-kind redemptions on unaffiliated investments | 12,438,634 | |
| Net realized gains on futures contracts | + | 13,928 |
| Net realized gains | 8,715,101 | |
| Net change in unrealized appreciation (depreciation) on affiliated issuer | (335,597) | |
| Net change in unrealized appreciation (depreciation) on unaffiliated investments | 24,648,261 | |
| Net change in unrealized appreciation (depreciation) on futures contracts | + | (718) |
| Net change in unrealized appreciation (depreciation) | + | 24,311,946 |
| Net realized and unrealized gains | 33,027,047 | |
| Increase in net assets resulting from operations | $47,406,330 | |
| Operations | ||||
| 9/1/18-8/31/19 | 10/11/17*-8/31/18 | |||
| Net investment income | $14,379,283 | $5,143,368 | ||
| Net realized gains (losses) | 8,715,101 | (365,496) | ||
| Net change in unrealized appreciation (depreciation) | + | 24,311,946 | 38,367,272 | |
| Increase in net assets resulting from operations | 47,406,330 | 43,145,144 | ||
| Distributions to Shareholders1 | ||||
| Total distributions | ($11,758,680) | ($3,615,715) | ||
| Transactions in Fund Shares | ||||||||
| 9/1/18-8/31/19 | 10/11/17*-8/31/18 | |||||||
| SHARES | VALUE | SHARES | VALUE | |||||
| Shares sold | 16,200,000 | $422,614,476 | 17,100,001 | $449,565,045 | ||||
| Shares redeemed | + | (4,100,000) | (106,536,181) | (100,001) | (2,606,979) | |||
| Net transactions in fund shares | 12,100,000 | $316,078,295 | 17,000,000 | $446,958,066 | ||||
| Shares Outstanding and Net Assets | ||||||||
| 9/1/18-8/31/19 | 10/11/17*-8/31/18 | |||||||
| SHARES | NET ASSETS | SHARES | NET ASSETS | |||||
| Beginning of period | 17,000,000 | $486,487,495 | — | $— | ||||
| Total increase | + | 12,100,000 | 351,725,945 | 17,000,000 | 486,487,495 | |||
| End of period2 | 29,100,000 | $838,213,440 | 17,000,000 | $486,487,495 | ||||
| * | Commencement of operations. |
| 1 | For the period ended August 31, 2018, the fund distributed to shareholders $3,615,715 from net investment income. The SEC eliminated the requirement to disclose distributions to shareholders from net investment income and from net realized gains in 2018 (see financial note 11 for additional information). |
| 2 | End of period — Net assets include net investment income not yet distributed of $1,521,163 at August 31, 2018. The SEC eliminated the requirement to disclose undistributed net investment income in 2018. |
| 9/1/18– 8/31/19 | 9/1/17– 8/31/18 | 9/1/16– 8/31/17 | 9/1/15– 8/31/16 | 9/1/14– 8/31/15 | ||
| Per-Share Data | ||||||
| Net asset value at beginning of period | $69.53 | $59.10 | $51.75 | $47.30 | $47.99 | |
| Income (loss) from investment operations: | ||||||
| Net investment income (loss)1 | 1.47 | 1.19 | 1.15 | 1.03 | 1.01 | |
| Net realized and unrealized gains (losses) | 0.33 | 10.39 | 7.24 | 4.41 | (0.77) | |
| Total from investment operations | 1.80 | 11.58 | 8.39 | 5.44 | 0.24 | |
| Less distributions: | ||||||
| Distributions from net investment income | (1.33) | (1.15) | (1.04) | (0.99) | (0.93) | |
| Net asset value at end of period | $70.00 | $69.53 | $59.10 | $51.75 | $47.30 | |
| Total return | 2.70% | 19.79% | 16.39% | 11.66% | 0.43% | |
| Ratios/Supplemental Data | ||||||
| Ratios to average net assets: | ||||||
| Total expenses | 0.03% | 0.03% | 0.03% | 0.03%2 | 0.04% | |
| Net investment income (loss) | 2.19% | 1.86% | 2.07% | 2.13% | 2.04% | |
| Portfolio turnover rate3 | 4% | 3% | 4% | 4% | 4% | |
| Net assets, end of period (x 1,000) | $17,785,958 | $14,989,877 | $9,824,643 | $6,218,346 | $4,329,918 | |
| Security | Number of Shares | % of Net Assets | Value ($) | |
| Common Stock99.8% of net assets | ||||
| Automobiles & Components 0.6% | ||||
| Other Securities | 0.6 | 112,735,683 | ||
| Banks 5.0% | ||||
| Bank of America Corp. | 5,990,064 | 0.9 | 164,786,661 | |
| Citigroup, Inc. | 1,566,851 | 0.6 | 100,826,862 | |
| JPMorgan Chase & Co. | 2,197,204 | 1.4 | 241,384,831 | |
| Wells Fargo & Co. | 2,740,159 | 0.7 | 127,609,205 | |
| Other Securities | 1.4 | 259,748,095 | ||
| 5.0 | 894,355,654 | |||
| Capital Goods 6.6% | ||||
| Honeywell International, Inc. | 492,845 | 0.5 | 81,132,144 | |
| The Boeing Co. | 354,375 | 0.7 | 129,024,394 | |
| Other Securities | 5.4 | 959,942,950 | ||
| 6.6 | 1,170,099,488 | |||
| Commercial & Professional Services 0.9% | ||||
| Other Securities | 0.9 | 167,632,718 | ||
| Consumer Durables & Apparel 1.2% | ||||
| Other Securities | 1.2 | 206,127,720 | ||
| Consumer Services 2.2% | ||||
| McDonald's Corp. | 517,024 | 0.6 | 112,695,721 | |
| Starbucks Corp. | 820,259 | 0.5 | 79,204,209 | |
| Other Securities | 1.1 | 207,666,698 | ||
| 2.2 | 399,566,628 | |||
| Diversified Financials 5.1% | ||||
| Berkshire Hathaway, Inc., Class B * | 1,312,085 | 1.5 | 266,891,210 | |
| The Charles Schwab Corp.(b) | 798,679 | 0.2 | 30,565,445 | |
| Other Securities | 3.4 | 616,052,885 | ||
| 5.1 | 913,509,540 | |||
| Energy 4.3% | ||||
| Chevron Corp. | 1,290,016 | 0.9 | 151,860,684 | |
| Exxon Mobil Corp. | 2,864,851 | 1.1 | 196,184,997 | |
| Other Securities | 2.3 | 411,286,048 | ||
| 4.3 | 759,331,729 | |||
| Security | Number of Shares | % of Net Assets | Value ($) | |
| Food & Staples Retailing 1.5% | ||||
| Costco Wholesale Corp. | 297,905 | 0.5 | 87,810,478 | |
| Walmart, Inc. | 946,871 | 0.6 | 108,189,480 | |
| Other Securities | 0.4 | 69,624,344 | ||
| 1.5 | 265,624,302 | |||
| Food, Beverage & Tobacco 3.8% | ||||
| PepsiCo, Inc. | 948,967 | 0.7 | 129,752,258 | |
| Philip Morris International, Inc. | 1,054,111 | 0.4 | 75,990,862 | |
| The Coca-Cola Co. | 2,599,480 | 0.8 | 143,075,379 | |
| Other Securities | 1.9 | 324,160,061 | ||
| 3.8 | 672,978,560 | |||
| Health Care Equipment & Services 6.2% | ||||
| Abbott Laboratories | 1,194,710 | 0.6 | 101,932,657 | |
| Medtronic plc | 908,049 | 0.5 | 97,969,407 | |
| UnitedHealth Group, Inc. | 643,616 | 0.8 | 150,606,144 | |
| Other Securities | 4.3 | 751,358,870 | ||
| 6.2 | 1,101,867,078 | |||
| Household & Personal Products 1.9% | ||||
| The Procter & Gamble Co. | 1,698,221 | 1.1 | 204,177,111 | |
| Other Securities | 0.8 | 136,574,008 | ||
| 1.9 | 340,751,119 | |||
| Insurance 2.7% | ||||
| Other Securities | 2.7 | 485,792,804 | ||
| Materials 2.8% | ||||
| Other Securities | 2.8 | 489,231,742 | ||
| Media & Entertainment 8.1% | ||||
| Alphabet, Inc., Class A * | 202,763 | 1.4 | 241,395,434 | |
| Alphabet, Inc., Class C * | 207,532 | 1.4 | 246,568,769 | |
| Comcast Corp., Class A | 3,066,835 | 0.8 | 135,738,117 | |
| Facebook, Inc., Class A * | 1,626,970 | 1.7 | 302,079,520 | |
| Netflix, Inc. * | 296,277 | 0.5 | 87,031,369 | |
| The Walt Disney Co. | 1,182,057 | 0.9 | 162,249,144 | |
| Other Securities | 1.4 | 270,935,104 | ||
| 8.1 | 1,445,997,457 | |||
| Pharmaceuticals, Biotechnology & Life Sciences 7.4% | ||||
| Amgen, Inc. | 412,962 | 0.5 | 86,152,132 | |
| Johnson & Johnson | 1,798,143 | 1.3 | 230,809,635 | |
| Merck & Co., Inc. | 1,743,879 | 0.9 | 150,793,217 | |
| Pfizer, Inc. | 3,760,808 | 0.8 | 133,696,724 | |
| Security | Number of Shares | % of Net Assets | Value ($) | |
| Thermo Fisher Scientific, Inc. | 270,635 | 0.4 | 77,688,483 | |
| Other Securities | 3.5 | 644,987,808 | ||
| 7.4 | 1,324,127,999 | |||
| Real Estate 3.8% | ||||
| Other Securities | 3.8 | 667,332,497 | ||
| Retailing 6.3% | ||||
| Amazon.com, Inc. * | 280,048 | 2.8 | 497,446,462 | |
| The Home Depot, Inc. | 745,073 | 1.0 | 169,809,587 | |
| Other Securities | 2.5 | 448,643,791 | ||
| 6.3 | 1,115,899,840 | |||
| Semiconductors & Semiconductor Equipment 3.7% | ||||
| Broadcom, Inc. | 268,249 | 0.4 | 75,817,897 | |
| Intel Corp. | 3,032,090 | 0.8 | 143,751,387 | |
| Texas Instruments, Inc. | 635,722 | 0.4 | 78,670,598 | |
| Other Securities | 2.1 | 361,736,818 | ||
| 3.7 | 659,976,700 | |||
| Software & Services 12.7% | ||||
| Accenture plc, Class A | 432,040 | 0.5 | 85,617,367 | |
| Adobe, Inc. * | 330,255 | 0.5 | 93,960,850 | |
| International Business Machines Corp. | 600,931 | 0.5 | 81,444,178 | |
| Mastercard, Inc., Class A | 608,458 | 1.0 | 171,201,827 | |
| Microsoft Corp. | 5,188,912 | 4.0 | 715,343,408 | |
| Oracle Corp. | 1,644,051 | 0.5 | 85,589,295 | |
| PayPal Holdings, Inc. * | 796,165 | 0.5 | 86,821,793 | |
| salesforce.com, Inc. * | 578,571 | 0.5 | 90,297,576 | |
| Visa, Inc., Class A | 1,177,380 | 1.2 | 212,893,852 | |
| Other Securities | 3.5 | 635,599,551 | ||
| 12.7 | 2,258,769,697 | |||
| Technology Hardware & Equipment 5.5% | ||||
| Apple, Inc. | 2,960,015 | 3.5 | 617,873,531 | |
| Cisco Systems, Inc. | 2,899,350 | 0.8 | 135,718,574 | |
| Other Securities | 1.2 | 224,914,108 | ||
| 5.5 | 978,506,213 | |||
| Telecommunication Services 2.1% | ||||
| AT&T, Inc. | 4,940,765 | 1.0 | 174,211,374 | |
| Verizon Communications, Inc. | 2,799,796 | 0.9 | 162,836,135 | |
| Other Securities | 0.2 | 35,542,426 | ||
| 2.1 | 372,589,935 | |||
| Security | Number of Shares | % of Net Assets | Value ($) | |
| Transportation 2.0% | ||||
| Union Pacific Corp. | 479,495 | 0.4 | 77,659,010 | |
| Other Securities | 1.6 | 271,093,579 | ||
| 2.0 | 348,752,589 | |||
| Utilities 3.4% | ||||
| Other Securities | 3.4 | 602,280,251 | ||
| Total Common Stock | ||||
| (Cost $14,346,497,413) | 17,753,837,943 | |||
| Other Investment Companies0.2% of net assets | ||||
| Money Market Fund 0.1% | ||||
| Other Securities | 0.1 | 16,952,458 | ||
| Securities Lending Collateral 0.1% | ||||
| Other Securities | 0.1 | 7,638,190 | ||
| Total Other Investment Companies | ||||
| (Cost $24,590,648) | 24,590,648 | |||
| Number of Contracts | Notional Amount ($) | Current Value/ Unrealized Appreciation ($) | ||
| Futures Contracts | ||||
| Long | ||||
| S&P 500 Index, e-mini, expires 09/20/19 | 199 | 29,101,760 | 252,258 | |
| * | Non-income producing security. |
| (a) | All or a portion of this security is on loan. Securities on loan were valued at $7,403,893. |
| (b) | Issuer is affiliated with the fund’s investment adviser. |
| (c) | The rate shown is the 7-day yield. |
| Market Value at 8/31/18 | Gross Purchases | Gross Sales | Realized Gains(Losses) | Net change in unrealized appreciation (depreciation) | Market Value at 8/31/19 | Balance of Shares Held at 8/31/19 | Dividends Received | |
| The Charles Schwab Corp. | $33,997,099 | $8,013,357 | ($2,408,288) | $939,438 | ($9,976,161) | $30,565,445 | 798,679 | $470,344 |
| Description | Quoted Prices in Active Markets for Identical Assets (Level 1) | Other Significant Observable Inputs (Level 2) | Significant Unobservable Inputs (Level 3) | Total | |
| Assets | |||||
| Common Stock1 | $17,753,837,943 | $— | $— | $17,753,837,943 | |
| Other Investment Companies1 | 24,590,648 | — | — | 24,590,648 | |
| Futures Contracts2 | 252,258 | — | — | 252,258 | |
| Total | $17,778,680,849 | $— | $— | $17,778,680,849 |
| 1 | As categorized in the complete schedule of Portfolio Holdings. |
| 2 | Futures contracts are valued at unrealized appreciation or depreciation. |
| Assets | ||
| Investments in affiliated issuer, at value (cost $30,693,796) | $30,565,445 | |
| Investments in unaffiliated issuers, at value (cost $14,332,756,075) including securities on loan of $7,403,893 | 17,740,224,956 | |
| Collateral invested for securities on loan, at value (cost $7,638,190) | 7,638,190 | |
| Deposit with broker for futures contracts | 2,444,400 | |
| Receivables: | ||
| Investments sold | 834,710 | |
| Dividends | 32,583,966 | |
| Income from securities on loan | + | 14,046 |
| Total assets | 17,814,305,713 | |
| Liabilities | ||
| Collateral held for securities on loan | 7,638,190 | |
| Payables: | ||
| Investments bought | 20,220,964 | |
| Management fees | 474,184 | |
| Variation margin on futures contracts | + | 14,737 |
| Total liabilities | 28,348,075 | |
| Net Assets | ||
| Total assets | 17,814,305,713 | |
| Total liabilities | – | 28,348,075 |
| Net assets | $17,785,957,638 | |
| Net Assets by Source | ||
| Capital received from investors | 14,412,155,331 | |
| Total distributable earnings1 | 3,373,802,307 | |
| Net Asset Value (NAV) | ||||
| Net Assets | ÷ | Shares Outstanding | = | NAV |
| $17,785,957,638 | 254,100,000 | $70.00 | ||
| 1 | The SEC eliminated the requirement to disclose total distributable earnings (loss) by each of its components as previously disclosed as the previous presentation did not provide insight into the tax implications of distributions (see financial note 11 for additional information). |
| Investment Income | ||
| Dividends received from affiliated issuer | $470,344 | |
| Dividends received from unaffiliated issuers (net of foreign withholding tax of $10,002) | 342,417,162 | |
| Securities on loan, net | + | 2,171,121 |
| Total investment income | 345,058,627 | |
| Expenses | ||
| Management fees | 4,641,081 | |
| Total expenses | – | 4,641,081 |
| Net investment income | 340,417,546 | |
| Realized and Unrealized Gains (Losses) | ||
| Net realized losses on affiliated issuer | (155,456) | |
| Net realized losses on unaffiliated investments | (52,749,272) | |
| Net realized gains on in-kind redemptions on affiliated issuer | 1,094,894 | |
| Net realized gains on in-kind redemptions on unaffiliated investments | 451,919,557 | |
| Net realized gains on futures contracts | + | 486,889 |
| Net realized gains | 400,596,612 | |
| Net change in unrealized appreciation (depreciation) on affiliated issuer | (9,976,161) | |
| Net change in unrealized appreciation (depreciation) on unaffiliated investments | (271,697,221) | |
| Net change in unrealized appreciation (depreciation) on futures contracts | + | (327,433) |
| Net change in unrealized appreciation (depreciation) | + | (282,000,815) |
| Net realized and unrealized gains | 118,595,797 | |
| Increase in net assets resulting from operations | $459,013,343 | |
| Operations | ||||
| 9/1/18-8/31/19 | 9/1/17-8/31/18 | |||
| Net investment income | $340,417,546 | $223,037,825 | ||
| Net realized gains | 400,596,612 | 158,977,935 | ||
| Net change in unrealized appreciation (depreciation) | + | (282,000,815) | 1,787,408,701 | |
| Increase in net assets resulting from operations | 459,013,343 | 2,169,424,461 | ||
| Distributions to Shareholders1 | ||||
| Total distributions | ($302,865,295) | ($208,413,000) | ||
| Transactions in Fund Shares | ||||||||
| 9/1/18-8/31/19 | 9/1/17-8/31/18 | |||||||
| SHARES | VALUE | SHARES | VALUE | |||||
| Shares sold | 56,050,000 | $3,767,929,713 | 56,450,000 | $3,665,022,620 | ||||
| Shares redeemed | + | (17,550,000) | (1,127,997,534) | (7,100,000) | (460,799,703) | |||
| Net transactions in fund shares | 38,500,000 | $2,639,932,179 | 49,350,000 | $3,204,222,917 | ||||
| Shares Outstanding and Net Assets | ||||||||
| 9/1/18-8/31/19 | 9/1/17-8/31/18 | |||||||
| SHARES | NET ASSETS | SHARES | NET ASSETS | |||||
| Beginning of period | 215,600,000 | $14,989,877,411 | 166,250,000 | $9,824,643,033 | ||||
| Total increase | + | 38,500,000 | 2,796,080,227 | 49,350,000 | 5,165,234,378 | |||
| End of period2 | 254,100,000 | $17,785,957,638 | 215,600,000 | $14,989,877,411 | ||||
| 1 | For the period ended August 31, 2018, the fund distributed to shareholders $208,413,000 from net investment income. The SEC eliminated the requirement to disclose distributions to shareholders from net investment income and from net realized gains in 2018 (see financial note 11 for additional information). |
| 2 | End of period - Net assets include net investment income not yet distributed of $50,766,094 at August 31, 2018. The SEC eliminated the requirement to disclose undistributed net investment income in 2018. |
| 9/1/18– 8/31/19 | 9/1/17– 8/31/18 | 9/1/16– 8/31/17 | 9/1/15– 8/31/16 | 9/1/14– 8/31/15 | ||
| Per-Share Data | ||||||
| Net asset value at beginning of period | $81.69 | $65.55 | $55.25 | $51.93 | $50.11 | |
| Income (loss) from investment operations: | ||||||
| Net investment income (loss)1 | 0.95 | 0.68 | 0.75 | 0.59 | 0.66 | |
| Net realized and unrealized gains (losses) | 2.30 | 16.17 | 10.17 | 3.30 | 1.79 | |
| Total from investment operations | 3.25 | 16.85 | 10.92 | 3.89 | 2.45 | |
| Less distributions: | ||||||
| Distributions from net investment income | (0.92) | (0.71) | (0.62) | (0.57) | (0.63) | |
| Net asset value at end of period | $84.02 | $81.69 | $65.55 | $55.25 | $51.93 | |
| Total return | 4.09% | 25.88% | 19.89% | 7.56% | 4.87% | |
| Ratios/Supplemental Data | ||||||
| Ratios to average net assets: | ||||||
| Total expenses | 0.04% | 0.04% | 0.05%2 | 0.07%3 | 0.07% | |
| Net investment income (loss) | 1.21% | 0.93% | 1.25% | 1.14% | 1.25% | |
| Portfolio turnover rate4 | 14% | 5% | 5% | 7% | 10% | |
| Net assets, end of period (x 1,000) | $8,107,853 | $6,886,721 | $4,470,809 | $2,980,475 | $2,246,101 | |
| Security | Number of Shares | % of Net Assets | Value ($) | |
| Common Stock99.8% of net assets | ||||
| Automobiles & Components 0.3% | ||||
| Other Securities | 0.3 | 21,620,535 | ||
| Banks 0.3% | ||||
| Other Securities | 0.3 | 22,578,842 | ||
| Capital Goods 6.6% | ||||
| 3M Co. | 314,292 | 0.6 | 50,827,302 | |
| Lockheed Martin Corp. | 134,004 | 0.6 | 51,472,276 | |
| Northrop Grumman Corp. | 92,598 | 0.4 | 34,064,026 | |
| The Boeing Co. | 285,135 | 1.3 | 103,814,802 | |
| Other Securities | 3.7 | 293,597,448 | ||
| 6.6 | 533,775,854 | |||
| Commercial & Professional Services 1.1% | ||||
| Other Securities | 1.1 | 91,934,213 | ||
| Consumer Durables & Apparel 1.5% | ||||
| NIKE, Inc., Class B | 685,253 | 0.7 | 57,903,879 | |
| Other Securities | 0.8 | 63,270,895 | ||
| 1.5 | 121,174,774 | |||
| Consumer Services 2.0% | ||||
| Starbucks Corp. | 660,150 | 0.8 | 63,744,084 | |
| Other Securities | 1.2 | 100,259,881 | ||
| 2.0 | 164,003,965 | |||
| Diversified Financials 6.2% | ||||
| Berkshire Hathaway, Inc., Class B * | 1,055,850 | 2.6 | 214,770,449 | |
| CME Group, Inc. | 195,202 | 0.5 | 42,415,443 | |
| S&P Global, Inc. | 133,944 | 0.4 | 34,850,889 | |
| The Charles Schwab Corp.(b) | 645,793 | 0.3 | 24,714,498 | |
| Other Securities | 2.4 | 190,381,007 | ||
| 6.2 | 507,132,286 | |||
| Energy 1.3% | ||||
| Other Securities | 1.3 | 104,687,006 | ||
| Food & Staples Retailing 1.2% | ||||
| Costco Wholesale Corp. | 239,748 | 0.9 | 70,668,121 | |
| Other Securities | 0.3 | 26,441,361 | ||
| 1.2 | 97,109,482 | |||
| Security | Number of Shares | % of Net Assets | Value ($) | |
| Food, Beverage & Tobacco 1.0% | ||||
| Other Securities | 1.0 | 83,462,801 | ||
| Health Care Equipment & Services 8.7% | ||||
| Anthem, Inc. | 140,303 | 0.4 | 36,692,041 | |
| Becton Dickinson & Co. | 146,790 | 0.4 | 37,272,917 | |
| Danaher Corp. | 343,654 | 0.6 | 48,829,797 | |
| Medtronic plc | 730,641 | 1.0 | 78,828,857 | |
| Stryker Corp. | 169,047 | 0.5 | 37,301,911 | |
| UnitedHealth Group, Inc. | 517,957 | 1.5 | 121,201,938 | |
| Other Securities | 4.3 | 344,885,521 | ||
| 8.7 | 705,012,982 | |||
| Household & Personal Products 0.6% | ||||
| Other Securities | 0.6 | 48,760,860 | ||
| Insurance 1.0% | ||||
| Other Securities | 1.0 | 80,256,636 | ||
| Materials 2.3% | ||||
| Linde plc | 295,847 | 0.7 | 55,888,457 | |
| Other Securities | 1.6 | 129,519,108 | ||
| 2.3 | 185,407,565 | |||
| Media & Entertainment 13.7% | ||||
| Alphabet, Inc., Class A * | 163,120 | 2.4 | 194,199,254 | |
| Alphabet, Inc., Class C * | 166,954 | 2.5 | 198,358,047 | |
| Charter Communications, Inc., Class A * | 93,823 | 0.5 | 38,428,963 | |
| Comcast Corp., Class A | 2,468,358 | 1.4 | 109,249,525 | |
| Facebook, Inc., Class A * | 1,308,518 | 3.0 | 242,952,537 | |
| Netflix, Inc. * | 238,183 | 0.9 | 69,966,256 | |
| The Walt Disney Co. | 951,293 | 1.6 | 130,574,477 | |
| Other Securities | 1.4 | 124,195,790 | ||
| 13.7 | 1,107,924,849 | |||
| Pharmaceuticals, Biotechnology & Life Sciences 5.4% | ||||
| Amgen, Inc. | 332,450 | 0.9 | 69,355,719 | |
| Celgene Corp. * | 384,600 | 0.5 | 37,229,280 | |
| Thermo Fisher Scientific, Inc. | 218,197 | 0.8 | 62,635,631 | |
| Zoetis, Inc. | 261,091 | 0.4 | 33,007,124 | |
| Other Securities | 2.8 | 238,290,591 | ||
| 5.4 | 440,518,345 | |||
| Security | Number of Shares | % of Net Assets | Value ($) | |
| Real Estate 4.0% | ||||
| American Tower Corp. | 240,958 | 0.7 | 55,466,122 | |
| Other Securities | 3.3 | 270,632,333 | ||
| 4.0 | 326,098,455 | |||
| Retailing 10.3% | ||||
| Amazon.com, Inc. * | 225,270 | 4.9 | 400,144,848 | |
| Booking Holdings, Inc. * | 23,621 | 0.6 | 46,448,571 | |
| Lowe's Cos., Inc. | 426,874 | 0.6 | 47,895,263 | |
| The Home Depot, Inc. | 599,568 | 1.7 | 136,647,543 | |
| The TJX Cos., Inc. | 661,812 | 0.4 | 36,379,806 | |
| Other Securities | 2.1 | 167,949,190 | ||
| 10.3 | 835,465,221 | |||
| Semiconductors & Semiconductor Equipment 2.2% | ||||
| Broadcom, Inc. | 215,792 | 0.8 | 60,991,451 | |
| NVIDIA Corp. | 332,052 | 0.7 | 55,622,030 | |
| Other Securities | 0.7 | 62,754,573 | ||
| 2.2 | 179,368,054 | |||
| Software & Services 20.1% | ||||
| Accenture plc, Class A | 347,558 | 0.8 | 68,875,569 | |
| Adobe, Inc. * | 266,113 | 0.9 | 75,711,810 | |
| Automatic Data Processing, Inc. | 236,867 | 0.5 | 40,229,491 | |
| Fidelity National Information Services, Inc. | 333,508 | 0.6 | 45,430,460 | |
| Fiserv, Inc. * | 310,449 | 0.4 | 33,199,416 | |
| Intuit, Inc. | 141,474 | 0.5 | 40,795,443 | |
| Mastercard, Inc., Class A | 489,700 | 1.7 | 137,786,889 | |
| Microsoft Corp. | 4,174,149 | 7.1 | 575,448,181 | |
| PayPal Holdings, Inc. * | 640,389 | 0.9 | 69,834,420 | |
| salesforce.com, Inc. * | 465,824 | 0.9 | 72,701,152 | |
| Visa, Inc., Class A | 947,356 | 2.1 | 171,300,912 | |
| Other Securities | 3.7 | 301,227,071 | ||
| 20.1 | 1,632,540,814 | |||
| Technology Hardware & Equipment 6.8% | ||||
| Apple, Inc. | 2,381,016 | 6.0 | 497,013,280 | |
| Other Securities | 0.8 | 57,176,634 | ||
| 6.8 | 554,189,914 | |||
| Telecommunication Services 0.3% | ||||
| Other Securities | 0.3 | 22,516,641 | ||
| Security | Number of Shares | % of Net Assets | Value ($) | |
| Transportation 2.1% | ||||
| Union Pacific Corp. | 385,732 | 0.8 | 62,473,155 | |
| Other Securities | 1.3 | 107,549,498 | ||
| 2.1 | 170,022,653 | |||
| Utilities 0.8% | ||||
| NextEra Energy, Inc. | 260,717 | 0.7 | 57,117,880 | |
| Other Securities | 0.1 | 5,016,976 | ||
| 0.8 | 62,134,856 | |||
| Total Common Stock | ||||
| (Cost $5,989,007,279) | 8,097,697,603 | |||
| Other Investment Companies0.1% of net assets | ||||
| Money Market Fund 0.0% | ||||
| Other Securities | 0.0 | 1,439,573 | ||
| Securities Lending Collateral 0.1% | ||||
| Other Securities | 0.1 | 3,400,683 | ||
| Total Other Investment Companies | ||||
| (Cost $4,840,256) | 4,840,256 | |||
| Number of Contracts | Notional Amount ($) | Current Value/ Unrealized Appreciation ($) | ||
| Futures Contracts | ||||
| Long | ||||
| Russell 1000 Growth Index, e-mini, expires 09/20/19 | 110 | 8,838,500 | 79,012 | |
| * | Non-income producing security. |
| (a) | All or a portion of this security is on loan. Securities on loan were valued at $3,303,190. |
| (b) | Issuer is affiliated with the fund’s investment adviser. |
| (c) | The rate shown is the 7-day yield. |
| Market Value at 8/31/18 | Gross Purchases | Gross Sales | Realized Gains(Losses) | Net change in unrealized appreciation (depreciation) | Market Value at 8/31/19 | Balance of Shares Held at 8/31/19 | Dividends Received | |
| The Charles Schwab Corp. | $31,120,557 | $6,635,908 | ($5,612,804) | $437,877 | ($7,867,040) | $24,714,498 | 645,793 | $387,572 |
| Description | Quoted Prices in Active Markets for Identical Assets (Level 1) | Other Significant Observable Inputs (Level 2) | Significant Unobservable Inputs (Level 3) | Total | |
| Assets | |||||
| Common Stock1 | $8,097,697,603 | $— | $— | $8,097,697,603 | |
| Other Investment Companies1 | 4,840,256 | — | — | 4,840,256 | |
| Futures Contracts2 | 79,012 | — | — | 79,012 | |
| Total | $8,102,616,871 | $— | $— | $8,102,616,871 |
| 1 | As categorized in the complete schedule of Portfolio Holdings. |
| 2 | Futures contracts are valued at unrealized appreciation or depreciation. |
| Assets | ||
| Investments in affiliated issuer, at value (cost $23,770,538) | $24,714,498 | |
| Investments in unaffiliated issuers, at value (cost $5,966,676,314) including securities on loan of $3,303,190 | 8,074,422,678 | |
| Collateral invested for securities on loan, at value (cost $3,400,683) | 3,400,683 | |
| Deposit with broker for futures contracts | 673,200 | |
| Receivables: | ||
| Investments sold | 653,540 | |
| Dividends | 7,676,511 | |
| Income from securities on loan | + | 9,584 |
| Total assets | 8,111,550,694 | |
| Liabilities | ||
| Collateral held for securities on loan | 3,400,683 | |
| Payables: | ||
| Management fees | 287,331 | |
| Variation margin on futures contracts | + | 9,216 |
| Total liabilities | 3,697,230 | |
| Net Assets | ||
| Total assets | 8,111,550,694 | |
| Total liabilities | – | 3,697,230 |
| Net assets | $8,107,853,464 | |
| Net Assets by Source | ||
| Capital received from investors | 6,083,005,169 | |
| Total distributable earnings1 | 2,024,848,295 | |
| Net Asset Value (NAV) | ||||
| Net Assets | ÷ | Shares Outstanding | = | NAV |
| $8,107,853,464 | 96,500,000 | $84.02 | ||
| 1 | The SEC eliminated the requirement to disclose total distributable earnings (loss) by each of its components as previously disclosed as the previous presentation did not provide insight into the tax implications of distributions (see financial note 11 for additional information). |
| Investment Income | ||
| Dividends received from affiliated issuer | $387,572 | |
| Dividends received from unaffiliated issuers (net of foreign withholding tax of $8,305) | 85,876,670 | |
| Securities on loan, net | + | 1,623,275 |
| Total investment income | 87,887,517 | |
| Expenses | ||
| Management fees | 2,809,589 | |
| Total expenses | – | 2,809,589 |
| Net investment income | 85,077,928 | |
| Realized and Unrealized Gains (Losses) | ||
| Net realized losses on affiliated issuer | (350,860) | |
| Net realized losses on unaffiliated investments | (21,864,431) | |
| Net realized gains on in-kind redemptions on affiliated issuer | 788,737 | |
| Net realized gains on in-kind redemptions on unaffiliated investments | 264,300,245 | |
| Net realized gains on futures contracts | + | 761,545 |
| Net realized gains | 243,635,236 | |
| Net change in unrealized appreciation (depreciation) on affiliated issuer | (7,867,040) | |
| Net change in unrealized appreciation (depreciation) on unaffiliated investments | 4,200,647 | |
| Net change in unrealized appreciation (depreciation) on futures contracts | + | (83,534) |
| Net change in unrealized appreciation (depreciation) | + | (3,749,927) |
| Net realized and unrealized gains | 239,885,309 | |
| Increase in net assets resulting from operations | $324,963,237 | |
| Operations | ||||
| 9/1/18-8/31/19 | 9/1/17-8/31/18 | |||
| Net investment income | $85,077,928 | $51,511,997 | ||
| Net realized gains | 243,635,236 | 70,580,945 | ||
| Net change in unrealized appreciation (depreciation) | + | (3,749,927) | 1,161,185,205 | |
| Increase in net assets resulting from operations | 324,963,237 | 1,283,278,147 | ||
| Distributions to Shareholders1 | ||||
| Total distributions | ($80,450,420) | ($52,664,675) | ||
| Transactions in Fund Shares | ||||||||
| 9/1/18-8/31/19 | 9/1/17-8/31/18 | |||||||
| SHARES | VALUE | SHARES | VALUE | |||||
| Shares sold | 19,500,000 | $1,542,423,996 | 21,550,000 | $1,561,031,674 | ||||
| Shares redeemed | + | (7,300,000) | (565,804,444) | (5,450,000) | (375,733,139) | |||
| Net transactions in fund shares | 12,200,000 | $976,619,552 | 16,100,000 | $1,185,298,535 | ||||
| Shares Outstanding and Net Assets | ||||||||
| 9/1/18-8/31/19 | 9/1/17-8/31/18 | |||||||
| SHARES | NET ASSETS | SHARES | NET ASSETS | |||||
| Beginning of period | 84,300,000 | $6,886,721,095 | 68,200,000 | $4,470,809,088 | ||||
| Total increase | + | 12,200,000 | 1,221,132,369 | 16,100,000 | 2,415,912,007 | |||
| End of period2 | 96,500,000 | $8,107,853,464 | 84,300,000 | $6,886,721,095 | ||||
| 1 | For the period ended August 31, 2018, the fund distributed to shareholders $52,664,675 from net investment income. The SEC eliminated the requirement to disclose distributions to shareholders from net investment income and from net realized gains in 2018 (see financial note 11 for additional information). |
| 2 | End of period - Net assets include net investment income not yet distributed of $10,314,360 at August 31, 2018. The SEC eliminated the requirement to disclose undistributed net investment income in 2018. |
| 9/1/18– 8/31/19 | 9/1/17– 8/31/18 | 9/1/16– 8/31/17 | 9/1/15– 8/31/16 | 9/1/14– 8/31/15 | ||
| Per-Share Data | ||||||
| Net asset value at beginning of period | $56.37 | $50.65 | $46.01 | $40.89 | $43.54 | |
| Income (loss) from investment operations: | ||||||
| Net investment income (loss)1 | 1.84 | 1.47 | 1.36 | 1.29 | 1.20 | |
| Net realized and unrealized gains (losses) | (1.48) | 5.63 | 4.56 | 5.01 | (2.75) | |
| Total from investment operations | 0.36 | 7.10 | 5.92 | 6.30 | (1.55) | |
| Less distributions: | ||||||
| Distributions from net investment income | (1.59) | (1.38) | (1.28) | (1.18) | (1.10) | |
| Net asset value at end of period | $55.14 | $56.37 | $50.65 | $46.01 | $40.89 | |
| Total return | 0.70% | 14.20% | 13.01% | 15.70% | (3.71%) | |
| Ratios/Supplemental Data | ||||||
| Ratios to average net assets: | ||||||
| Total expenses | 0.04% | 0.04% | 0.05%2 | 0.07%3 | 0.07% | |
| Net investment income (loss) | 3.38% | 2.72% | 2.79% | 3.00% | 2.75% | |
| Portfolio turnover rate4 | 7% | 8% | 7% | 6% | 15% | |
| Net assets, end of period (x 1,000) | $5,976,674 | $4,692,419 | $3,532,689 | $2,491,664 | $1,435,194 | |
| Security | Number of Shares | % of Net Assets | Value ($) | |
| Common Stock99.8% of net assets | ||||
| Automobiles & Components 1.1% | ||||
| Other Securities | 1.1 | 66,548,905 | ||
| Banks 11.2% | ||||
| Bank of America Corp. | 4,643,781 | 2.1 | 127,750,415 | |
| Citigroup, Inc. | 1,214,451 | 1.3 | 78,149,922 | |
| JPMorgan Chase & Co. | 1,703,602 | 3.1 | 187,157,716 | |
| The PNC Financial Services Group, Inc. | 237,085 | 0.5 | 30,567,369 | |
| U.S. Bancorp | 785,940 | 0.7 | 41,411,179 | |
| Wells Fargo & Co. | 2,124,197 | 1.7 | 98,923,854 | |
| Other Securities | 1.8 | 107,703,532 | ||
| 11.2 | 671,663,987 | |||
| Capital Goods 6.6% | ||||
| Caterpillar, Inc. | 300,341 | 0.6 | 35,740,579 | |
| General Dynamics Corp. | 142,593 | 0.5 | 27,273,763 | |
| General Electric Co. | 4,579,612 | 0.6 | 37,781,799 | |
| Honeywell International, Inc. | 382,156 | 1.1 | 62,910,521 | |
| United Technologies Corp. | 425,934 | 0.9 | 55,473,644 | |
| Other Securities | 2.9 | 173,665,634 | ||
| 6.6 | 392,845,940 | |||
| Commercial & Professional Services 0.7% | ||||
| Other Securities | 0.7 | 41,295,540 | ||
| Consumer Durables & Apparel 0.7% | ||||
| Other Securities | 0.7 | 43,068,704 | ||
| Consumer Services 2.5% | ||||
| McDonald's Corp. | 400,949 | 1.5 | 87,394,854 | |
| Other Securities | 1.0 | 64,448,308 | ||
| 2.5 | 151,843,162 | |||
| Diversified Financials 3.7% | ||||
| American Express Co. | 359,589 | 0.7 | 43,283,728 | |
| The Goldman Sachs Group, Inc. | 178,656 | 0.6 | 36,429,745 | |
| Other Securities | 2.4 | 139,892,072 | ||
| 3.7 | 219,605,545 | |||
| Energy 8.2% | ||||
| Chevron Corp. | 1,000,270 | 2.0 | 117,751,784 | |
| ConocoPhillips | 593,507 | 0.5 | 30,969,195 | |
| Security | Number of Shares | % of Net Assets | Value ($) | |
| Exxon Mobil Corp. | 2,221,775 | 2.5 | 152,147,152 | |
| Other Securities | 3.2 | 186,893,068 | ||
| 8.2 | 487,761,199 | |||
| Food & Staples Retailing 1.9% | ||||
| Walmart, Inc. | 734,552 | 1.4 | 83,929,911 | |
| Other Securities | 0.5 | 28,486,542 | ||
| 1.9 | 112,416,453 | |||
| Food, Beverage & Tobacco 7.4% | ||||
| Altria Group, Inc. | 982,538 | 0.7 | 42,976,212 | |
| Mondelez International, Inc., Class A | 756,527 | 0.7 | 41,775,421 | |
| PepsiCo, Inc. | 736,107 | 1.7 | 100,647,910 | |
| Philip Morris International, Inc. | 817,010 | 1.0 | 58,898,251 | |
| The Coca-Cola Co. | 2,016,223 | 1.9 | 110,972,914 | |
| Other Securities | 1.4 | 85,903,690 | ||
| 7.4 | 441,174,398 | |||
| Health Care Equipment & Services 2.9% | ||||
| Abbott Laboratories | 926,262 | 1.3 | 79,028,674 | |
| CVS Health Corp. | 682,103 | 0.7 | 41,553,715 | |
| Other Securities | 0.9 | 54,047,595 | ||
| 2.9 | 174,629,984 | |||
| Household & Personal Products 3.6% | ||||
| Colgate-Palmolive Co. | 450,842 | 0.6 | 33,429,934 | |
| The Procter & Gamble Co. | 1,317,232 | 2.6 | 158,370,804 | |
| Other Securities | 0.4 | 25,475,576 | ||
| 3.6 | 217,276,314 | |||
| Insurance 5.0% | ||||
| Chubb Ltd. | 240,460 | 0.6 | 37,579,089 | |
| Other Securities | 4.4 | 261,743,597 | ||
| 5.0 | 299,322,686 | |||
| Materials 3.4% | ||||
| Other Securities | 3.4 | 200,703,472 | ||
| Media & Entertainment 0.9% | ||||
| Other Securities | 0.9 | 53,428,900 | ||
| Pharmaceuticals, Biotechnology & Life Sciences 10.1% | ||||
| AbbVie, Inc. | 776,294 | 0.8 | 51,033,568 | |
| Bristol-Myers Squibb Co. | 858,924 | 0.7 | 41,288,477 | |
| Eli Lilly & Co. | 453,675 | 0.9 | 51,251,665 | |
| Security | Number of Shares | % of Net Assets | Value ($) | |
| Gilead Sciences, Inc. | 667,695 | 0.7 | 42,425,340 | |
| Johnson & Johnson | 1,394,246 | 3.0 | 178,965,417 | |
| Merck & Co., Inc. | 1,351,966 | 2.0 | 116,904,500 | |
| Pfizer, Inc. | 2,915,390 | 1.7 | 103,642,114 | |
| Other Securities | 0.3 | 16,906,751 | ||
| 10.1 | 602,417,832 | |||
| Real Estate 3.4% | ||||
| Prologis, Inc. | 330,700 | 0.4 | 27,653,134 | |
| Other Securities | 3.0 | 175,561,482 | ||
| 3.4 | 203,214,616 | |||
| Retailing 1.0% | ||||
| Target Corp. | 269,057 | 0.5 | 28,799,861 | |
| Other Securities | 0.5 | 31,319,588 | ||
| 1.0 | 60,119,449 | |||
| Semiconductors & Semiconductor Equipment 5.7% | ||||
| Intel Corp. | 2,351,000 | 1.9 | 111,460,910 | |
| QUALCOMM, Inc. | 638,383 | 0.8 | 49,647,046 | |
| Texas Instruments, Inc. | 492,648 | 1.0 | 60,965,190 | |
| Other Securities | 2.0 | 116,847,440 | ||
| 5.7 | 338,920,586 | |||
| Software & Services 3.0% | ||||
| International Business Machines Corp. | 465,580 | 1.1 | 63,100,057 | |
| Oracle Corp. | 1,274,191 | 1.1 | 66,334,384 | |
| Other Securities | 0.8 | 48,479,377 | ||
| 3.0 | 177,913,818 | |||
| Technology Hardware & Equipment 3.7% | ||||
| Cisco Systems, Inc. | 2,247,994 | 1.8 | 105,228,599 | |
| Other Securities | 1.9 | 119,348,563 | ||
| 3.7 | 224,577,162 | |||
| Telecommunication Services 4.5% | ||||
| AT&T, Inc. | 3,832,669 | 2.3 | 135,139,909 | |
| Verizon Communications, Inc. | 2,171,881 | 2.1 | 126,316,599 | |
| Other Securities | 0.1 | 5,728,169 | ||
| 4.5 | 267,184,677 | |||
| Security | Number of Shares | % of Net Assets | Value ($) | |
| Transportation 1.8% | ||||
| CSX Corp. | 403,709 | 0.5 | 27,056,577 | |
| United Parcel Service, Inc., Class B | 366,236 | 0.7 | 43,457,564 | |
| Other Securities | 0.6 | 36,065,256 | ||
| 1.8 | 106,579,397 | |||
| Utilities 6.8% | ||||
| Dominion Energy, Inc. | 421,330 | 0.5 | 32,707,848 | |
| Duke Energy Corp. | 382,366 | 0.6 | 35,460,623 | |
| The Southern Co. | 546,560 | 0.5 | 31,842,586 | |
| Other Securities | 5.2 | 307,163,183 | ||
| 6.8 | 407,174,240 | |||
| Total Common Stock | ||||
| (Cost $5,594,658,106) | 5,961,686,966 | |||
| Other Investment Companies0.1% of net assets | ||||
| Money Market Fund 0.1% | ||||
| Other Securities | 0.1 | 5,488,494 | ||
| Securities Lending Collateral 0.0% | ||||
| Other Securities | 0.0 | 2,675,585 | ||
| Total Other Investment Companies | ||||
| (Cost $8,164,079) | 8,164,079 | |||
| Number of Contracts | Notional Amount ($) | Current Value/ Unrealized Appreciation ($) | ||
| Futures Contracts | ||||
| Long | ||||
| Russell 1000 Value Index, e-mini, expires 09/20/19 | 228 | 13,941,060 | 43,613 | |
| * | Non-income producing security. |
| (a) | All or a portion of this security is on loan. Securities on loan were valued at $2,589,308. |
| (b) | The rate shown is the 7-day yield. |
| Description | Quoted Prices in Active Markets for Identical Assets (Level 1) | Other Significant Observable Inputs (Level 2) | Significant Unobservable Inputs (Level 3) | Total | |
| Assets | |||||
| Common Stock1 | $5,961,686,966 | $— | $— | $5,961,686,966 | |
| Other Investment Companies1 | 8,164,079 | — | — | 8,164,079 | |
| Futures Contracts2 | 43,613 | — | — | 43,613 | |
| Total | $5,969,894,658 | $— | $— | $5,969,894,658 |
| 1 | As categorized in the complete schedule of Portfolio Holdings. |
| 2 | Futures contracts are valued at unrealized appreciation or depreciation. |
| Assets | ||
| Investments in unaffiliated issuers, at value (cost $5,600,146,600) including securities on loan of $2,589,308 | $5,967,175,460 | |
| Collateral invested for securities on loan, at value (cost $2,675,585) | 2,675,585 | |
| Deposit with broker for futures contracts | 951,300 | |
| Receivables: | ||
| Fund shares sold | 35,801,301 | |
| Dividends | 17,901,542 | |
| Variation margin on futures contracts | 49,411 | |
| Income from securities on loan | + | 1,170 |
| Total assets | 6,024,555,769 | |
| Liabilities | ||
| Collateral held for securities on loan | 2,675,585 | |
| Payables: | ||
| Investments bought | 44,991,954 | |
| Management fees | + | 214,268 |
| Total liabilities | 47,881,807 | |
| Net Assets | ||
| Total assets | 6,024,555,769 | |
| Total liabilities | – | 47,881,807 |
| Net assets | $5,976,673,962 | |
| Net Assets by Source | ||
| Capital received from investors | 5,623,134,524 | |
| Total distributable earnings1 | 353,539,438 | |
| Net Asset Value (NAV) | ||||
| Net Assets | ÷ | Shares Outstanding | = | NAV |
| $5,976,673,962 | 108,400,000 | $55.14 | ||
| 1 | The SEC eliminated the requirement to disclose total distributable earnings (loss) by each of its components as previously disclosed as the previous presentation did not provide insight into the tax implications of distributions (see financial note 11 for additional information). |
| Investment Income | ||
| Dividends | $184,521,524 | |
| Securities on loan, net | + | 161,278 |
| Total investment income | 184,682,802 | |
| Expenses | ||
| Management fees | 2,153,090 | |
| Total expenses | – | 2,153,090 |
| Net investment income | 182,529,712 | |
| Realized and Unrealized Gains (Losses) | ||
| Net realized losses on investments | (33,485,429) | |
| Net realized gains on in-kind redemptions | 459,996,193 | |
| Net realized losses on futures contracts | + | (555,801) |
| Net realized gains | 425,954,963 | |
| Net change in unrealized appreciation (depreciation) on investments | (486,415,577) | |
| Net change in unrealized appreciation (depreciation) on futures contracts | + | (53,577) |
| Net change in unrealized appreciation (depreciation) | + | (486,469,154) |
| Net realized and unrealized losses | (60,514,191) | |
| Increase in net assets resulting from operations | $122,015,521 | |
| Operations | ||||
| 9/1/18-8/31/19 | 9/1/17-8/31/18 | |||
| Net investment income | $182,529,712 | $112,518,681 | ||
| Net realized gains | 425,954,963 | 32,484,695 | ||
| Net change in unrealized appreciation (depreciation) | + | (486,469,154) | 395,469,632 | |
| Increase in net assets resulting from operations | 122,015,521 | 540,473,008 | ||
| Distributions to Shareholders1 | ||||
| Total distributions | ($153,831,815) | ($104,891,835) | ||
| Transactions in Fund Shares | ||||||||
| 9/1/18-8/31/19 | 9/1/17-8/31/18 | |||||||
| SHARES | VALUE | SHARES | VALUE | |||||
| Shares sold | 50,100,000 | $2,701,585,976 | 17,450,000 | $937,684,002 | ||||
| Shares redeemed | + | (24,950,000) | (1,385,515,156) | (3,950,000) | (213,534,949) | |||
| Net transactions in fund shares | 25,150,000 | $1,316,070,820 | 13,500,000 | $724,149,053 | ||||
| Shares Outstanding and Net Assets | ||||||||
| 9/1/18-8/31/19 | 9/1/17-8/31/18 | |||||||
| SHARES | NET ASSETS | SHARES | NET ASSETS | |||||
| Beginning of period | 83,250,000 | $4,692,419,436 | 69,750,000 | $3,532,689,210 | ||||
| Total increase | + | 25,150,000 | 1,284,254,526 | 13,500,000 | 1,159,730,226 | |||
| End of period2 | 108,400,000 | $5,976,673,962 | 83,250,000 | $4,692,419,436 | ||||
| 1 | For the period ended August 31, 2018, the fund distributed to shareholders $104,891,835 from net investment income. The SEC eliminated the requirement to disclose distributions to shareholders from net investment income and from net realized gains in 2018 (see financial note 11 for additional information). |
| 2 | End of period - Net assets include net investment income not yet distributed of $25,500,760 at August 31, 2018. The SEC eliminated the requirement to disclose undistributed net investment income in 2018. |
| 9/1/18– 8/31/19 | 9/1/17– 8/31/18 | 9/1/16– 8/31/17 | 9/1/15– 8/31/16 | 9/1/14– 8/31/15 | ||
| Per-Share Data | ||||||
| Net asset value at beginning of period | $58.44 | $48.77 | $43.67 | $40.70 | $40.56 | |
| Income (loss) from investment operations: | ||||||
| Net investment income (loss)1 | 0.84 | 0.76 | 0.71 | 0.74 | 0.59 | |
| Net realized and unrealized gains (losses) | (2.76) | 9.59 | 5.09 | 2.84 | 0.12 | |
| Total from investment operations | (1.92) | 10.35 | 5.80 | 3.58 | 0.71 | |
| Less distributions: | ||||||
| Distributions from net investment income | (0.80) | (0.68) | (0.70) | (0.61) | (0.57) | |
| Net asset value at end of period | $55.72 | $58.44 | $48.77 | $43.67 | $40.70 | |
| Total return | (3.24%) | 21.36% | 13.38% | 8.94% | 1.71% | |
| Ratios/Supplemental Data | ||||||
| Ratios to average net assets: | ||||||
| Total expenses | 0.04%2 | 0.05% | 0.06%3 | 0.07% | 0.07% | |
| Net investment income (loss) | 1.52% | 1.42% | 1.54% | 1.83% | 1.42% | |
| Portfolio turnover rate4 | 19% | 13% | 17% | 21% | 12% | |
| Net assets, end of period (x 1,000) | $6,254,639 | $5,358,783 | $3,555,096 | $2,532,590 | $1,841,785 | |
| Security | Number of Shares | % of Net Assets | Value ($) | |
| Common Stock99.8% of net assets | ||||
| Automobiles & Components 1.3% | ||||
| Other Securities | 1.3 | 83,030,408 | ||
| Banks 4.0% | ||||
| Other Securities | 4.0 | 247,514,268 | ||
| Capital Goods 11.3% | ||||
| IDEX Corp. | 152,677 | 0.4 | 25,147,429 | |
| Teledyne Technologies, Inc. * | 73,082 | 0.4 | 22,552,374 | |
| Wabtec Corp. | 367,095 | 0.4 | 25,406,645 | |
| Xylem, Inc. | 362,867 | 0.4 | 27,799,241 | |
| Other Securities | 9.7 | 605,859,956 | ||
| 11.3 | 706,765,645 | |||
| Commercial & Professional Services 1.6% | ||||
| Other Securities | 1.6 | 98,139,948 | ||
| Consumer Durables & Apparel 3.2% | ||||
| NVR, Inc. * | 6,808 | 0.4 | 24,501,992 | |
| Other Securities | 2.8 | 175,493,799 | ||
| 3.2 | 199,995,791 | |||
| Consumer Services 3.4% | ||||
| Other Securities | 3.4 | 214,893,387 | ||
| Diversified Financials 4.8% | ||||
| Cboe Global Markets, Inc. | 225,292 | 0.4 | 26,845,795 | |
| MarketAxess Holdings, Inc. | 76,029 | 0.5 | 30,230,651 | |
| Other Securities | 3.9 | 240,975,624 | ||
| 4.8 | 298,052,070 | |||
| Energy 2.2% | ||||
| Diamondback Energy, Inc. | 311,702 | 0.5 | 30,571,732 | |
| Other Securities | 1.7 | 108,444,760 | ||
| 2.2 | 139,016,492 | |||
| Food & Staples Retailing 0.5% | ||||
| Other Securities | 0.5 | 30,228,960 | ||
| Food, Beverage & Tobacco 1.3% | ||||
| Other Securities | 1.3 | 83,945,006 | ||
| Security | Number of Shares | % of Net Assets | Value ($) | |
| Health Care Equipment & Services 5.8% | ||||
| DENTSPLY SIRONA, Inc. | 471,880 | 0.4 | 24,608,542 | |
| DexCom, Inc. * | 183,630 | 0.5 | 31,512,744 | |
| STERIS plc | 170,528 | 0.4 | 26,329,523 | |
| Teleflex, Inc. | 93,082 | 0.5 | 33,874,401 | |
| Veeva Systems, Inc., Class A * | 257,773 | 0.7 | 41,341,634 | |
| Other Securities | 3.3 | 207,706,192 | ||
| 5.8 | 365,373,036 | |||
| Household & Personal Products 0.4% | ||||
| Other Securities | 0.4 | 22,015,957 | ||
| Insurance 5.0% | ||||
| Alleghany Corp. * | 29,138 | 0.4 | 21,833,395 | |
| Arthur J. Gallagher & Co. | 373,564 | 0.5 | 33,885,990 | |
| Other Securities | 4.1 | 260,238,279 | ||
| 5.0 | 315,957,664 | |||
| Materials 6.2% | ||||
| Amcor plc * | 3,273,256 | 0.5 | 32,143,374 | |
| FMC Corp. | 265,661 | 0.4 | 22,934,514 | |
| International Flavors & Fragrances, Inc. | 204,443 | 0.4 | 22,437,619 | |
| Other Securities | 4.9 | 307,440,869 | ||
| 6.2 | 384,956,376 | |||
| Media & Entertainment 3.1% | ||||
| Snap, Inc., Class A * | 1,524,934 | 0.4 | 24,139,705 | |
| Other Securities | 2.7 | 170,707,531 | ||
| 3.1 | 194,847,236 | |||
| Pharmaceuticals, Biotechnology & Life Sciences 5.0% | ||||
| Exact Sciences Corp. * | 260,450 | 0.5 | 31,050,849 | |
| Other Securities | 4.5 | 283,679,326 | ||
| 5.0 | 314,730,175 | |||
| Real Estate 11.6% | ||||
| Duke Realty Corp. | 724,851 | 0.4 | 24,115,793 | |
| Equity LifeStyle Properties, Inc. | 181,372 | 0.4 | 24,434,436 | |
| Extra Space Storage, Inc. | 257,037 | 0.5 | 31,337,951 | |
| Invitation Homes, Inc. | 846,920 | 0.4 | 24,357,419 | |
| Regency Centers Corp. | 337,073 | 0.3 | 21,744,579 | |
| Sun Communities, Inc. | 181,864 | 0.4 | 26,879,499 | |
| UDR, Inc. | 568,267 | 0.4 | 27,379,104 | |
| Security | Number of Shares | % of Net Assets | Value ($) | |
| WP Carey, Inc. | 343,630 | 0.5 | 30,857,974 | |
| Other Securities | 8.3 | 513,219,793 | ||
| 11.6 | 724,326,548 | |||
| Retailing 4.0% | ||||
| Burlington Stores, Inc. * | 134,039 | 0.4 | 27,141,557 | |
| Tractor Supply Co. | 243,456 | 0.4 | 24,803,297 | |
| Other Securities | 3.2 | 195,606,803 | ||
| 4.0 | 247,551,657 | |||
| Semiconductors & Semiconductor Equipment 2.3% | ||||
| Marvell Technology Group Ltd. | 1,196,531 | 0.5 | 28,680,848 | |
| Other Securities | 1.8 | 114,964,247 | ||
| 2.3 | 143,645,095 | |||
| Software & Services 11.0% | ||||
| Akamai Technologies, Inc. * | 330,927 | 0.5 | 29,495,524 | |
| Cadence Design Systems, Inc. * | 566,697 | 0.6 | 38,807,411 | |
| Fortinet, Inc. * | 292,746 | 0.4 | 23,179,628 | |
| Gartner, Inc. * | 181,676 | 0.4 | 24,284,631 | |
| GoDaddy, Inc., Class A * | 354,180 | 0.4 | 22,433,761 | |
| Jack Henry & Associates, Inc. | 155,693 | 0.4 | 22,569,257 | |
| Leidos Holdings, Inc. | 290,828 | 0.4 | 25,406,734 | |
| Okta, Inc. * | 209,536 | 0.4 | 26,506,304 | |
| Paycom Software, Inc. * | 99,104 | 0.4 | 24,787,893 | |
| Twilio, Inc., Class A * | 236,112 | 0.5 | 30,805,533 | |
| Other Securities | 6.6 | 422,198,328 | ||
| 11.0 | 690,475,004 | |||
| Technology Hardware & Equipment 4.6% | ||||
| CDW Corp. | 294,492 | 0.5 | 34,013,826 | |
| Keysight Technologies, Inc. * | 379,493 | 0.6 | 36,757,692 | |
| Zebra Technologies Corp., Class A * | 108,874 | 0.4 | 22,322,436 | |
| Other Securities | 3.1 | 193,308,650 | ||
| 4.6 | 286,402,604 | |||
| Telecommunication Services 0.5% | ||||
| Other Securities | 0.5 | 30,637,134 | ||
| Transportation 2.7% | ||||
| Expeditors International of Washington, Inc. | 346,989 | 0.4 | 24,670,918 | |
| Other Securities | 2.3 | 146,821,363 | ||
| 2.7 | 171,492,281 | |||
| Security | Number of Shares | % of Net Assets | Value ($) | |
| Utilities 4.0% | ||||
| Alliant Energy Corp. | 476,511 | 0.4 | 24,993,002 | |
| Atmos Energy Corp. | 235,911 | 0.4 | 26,004,469 | |
| NiSource, Inc. | 752,343 | 0.4 | 22,231,736 | |
| Pinnacle West Capital Corp. | 226,434 | 0.3 | 21,581,425 | |
| Other Securities | 2.5 | 155,315,891 | ||
| 4.0 | 250,126,523 | |||
| Total Common Stock | ||||
| (Cost $5,628,672,804) | 6,244,119,265 | |||
| Other Investment Companies0.6% of net assets | ||||
| Money Market Fund 0.1% | ||||
| Other Securities | 0.1 | 3,495,102 | ||
| Securities Lending Collateral 0.5% | ||||
| Wells Fargo Government Money Market Fund, Select Class 2.03%(b) | 0.5 | 33,564,717 | ||
| Total Other Investment Companies | ||||
| (Cost $37,059,819) | 37,059,819 | |||
| Number of Contracts | Notional Amount ($) | Current Value/ Unrealized Appreciation ($) | ||
| Futures Contracts | ||||
| Long | ||||
| S&P Mid-Cap 400 Index, e-mini, expires 09/20/19 | 51 | 9,595,140 | 12,201 | |
| * | Non-income producing security. |
| (a) | All or a portion of this security is on loan. Securities on loan were valued at $32,180,849. |
| (b) | The rate shown is the 7-day yield. |
| Description | Quoted Prices in Active Markets for Identical Assets (Level 1) | Other Significant Observable Inputs (Level 2) | Significant Unobservable Inputs (Level 3) | Total | |
| Assets | |||||
| Common Stock1 | $6,244,119,265 | $— | $— | $6,244,119,265 | |
| Other Investment Companies1 | 37,059,819 | — | — | 37,059,819 | |
| Futures Contracts2 | 12,201 | — | — | 12,201 | |
| Total | $6,281,191,285 | $— | $— | $6,281,191,285 |
| 1 | As categorized in the complete schedule of Portfolio Holdings. |
| 2 | Futures contracts are valued at unrealized appreciation or depreciation. |
| Assets | ||
| Investments in unaffiliated issuers, at value (cost $5,632,167,906) including securities on loan of $32,180,849 | $6,247,614,367 | |
| Collateral invested for securities on loan, at value (cost $33,564,717) | 33,564,717 | |
| Deposit with broker for futures contracts | 331,503 | |
| Receivables: | ||
| Dividends | 6,697,780 | |
| Fund shares sold | 2,786,026 | |
| Income from securities on loan | 178,977 | |
| Variation margin on futures contracts | + | 16,623 |
| Total assets | 6,291,189,993 | |
| Liabilities | ||
| Collateral held for securities on loan | 33,564,717 | |
| Payables: | ||
| Investments bought | 2,760,058 | |
| Management fees | + | 226,156 |
| Total liabilities | 36,550,931 | |
| Net Assets | ||
| Total assets | 6,291,189,993 | |
| Total liabilities | – | 36,550,931 |
| Net assets | $6,254,639,062 | |
| Net Assets by Source | ||
| Capital received from investors | 5,842,357,570 | |
| Total distributable earnings1 | 412,281,492 | |
| Net Asset Value (NAV) | ||||
| Net Assets | ÷ | Shares Outstanding | = | NAV |
| $6,254,639,062 | 112,250,000 | $55.72 | ||
| 1 | The SEC eliminated the requirement to disclose total distributable earnings (loss) by each of its components as previously disclosed as the previous presentation did not provide insight into the tax implications of distributions (see financial note 11 for additional information). |
| Investment Income | ||
| Dividends (net of foreign withholding tax of $50,444) | $87,382,351 | |
| Securities on loan, net | + | 798,794 |
| Total investment income | 88,181,145 | |
| Expenses | ||
| Management fees | 2,508,185 | |
| Total expenses | – | 2,508,185 |
| Net investment income | 85,672,960 | |
| Realized and Unrealized Gains (Losses) | ||
| Net realized losses on investments | (94,830,619) | |
| Net realized gains on in-kind redemptions | 407,217,730 | |
| Net realized losses on futures contracts | + | (1,683,986) |
| Net realized gains | 310,703,125 | |
| Net change in unrealized appreciation (depreciation) on investments | (548,928,868) | |
| Net change in unrealized appreciation (depreciation) on futures contracts | + | (45,347) |
| Net change in unrealized appreciation (depreciation) | + | (548,974,215) |
| Net realized and unrealized losses | (238,271,090) | |
| Decrease in net assets resulting from operations | ($152,598,130) | |
| Operations | ||||
| 9/1/18-8/31/19 | 9/1/17-8/31/18 | |||
| Net investment income | $85,672,960 | $61,992,328 | ||
| Net realized gains | 310,703,125 | 114,807,880 | ||
| Net change in unrealized appreciation (depreciation) | + | (548,974,215) | 660,791,539 | |
| Increase (decrease) in net assets resulting from operations | (152,598,130) | 837,591,747 | ||
| Distributions to Shareholders1 | ||||
| Total distributions | ($80,783,475) | ($53,918,230) | ||
| Transactions in Fund Shares | ||||||||
| 9/1/18-8/31/19 | 9/1/17-8/31/18 | |||||||
| SHARES | VALUE | SHARES | VALUE | |||||
| Shares sold | 39,050,000 | $2,178,261,705 | 24,750,000 | $1,321,549,843 | ||||
| Shares redeemed | + | (18,500,000) | (1,049,023,933) | (5,950,000) | (301,536,961) | |||
| Net transactions in fund shares | 20,550,000 | $1,129,237,772 | 18,800,000 | $1,020,012,882 | ||||
| Shares Outstanding and Net Assets | ||||||||
| 9/1/18-8/31/19 | 9/1/17-8/31/18 | |||||||
| SHARES | NET ASSETS | SHARES | NET ASSETS | |||||
| Beginning of period | 91,700,000 | $5,358,782,895 | 72,900,000 | $3,555,096,496 | ||||
| Total increase | + | 20,550,000 | 895,856,167 | 18,800,000 | 1,803,686,399 | |||
| End of period2 | 112,250,000 | $6,254,639,062 | 91,700,000 | $5,358,782,895 | ||||
| 1 | For the period ended August 31, 2018, the fund distributed to shareholders $53,918,230 from net investment income. The SEC eliminated the requirement to disclose distributions to shareholders from net investment income and from net realized gains in 2018 (see financial note 11 for additional information). |
| 2 | End of period - Net assets include net investment income not yet distributed of $13,616,626 at August 31, 2018. The SEC eliminated the requirement to disclose undistributed net investment income in 2018. |
| 9/1/18– 8/31/19 | 9/1/17– 8/31/18 | 9/1/16– 8/31/17 | 9/1/15– 8/31/16 | 9/1/14– 8/31/15 | ||
| Per-Share Data | ||||||
| Net asset value at beginning of period | $78.24 | $64.03 | $57.42 | $53.54 | $54.53 | |
| Income (loss) from investment operations: | ||||||
| Net investment income (loss)1 | 1.04 | 0.98 | 0.90 | 0.93 | 0.80 | |
| Net realized and unrealized gains (losses) | (9.07) | 14.10 | 6.64 | 3.75 | (1.07) | |
| Total from investment operations | (8.03) | 15.08 | 7.54 | 4.68 | (0.27) | |
| Less distributions: | ||||||
| Distributions from net investment income | (1.01) | (0.87) | (0.93) | (0.80) | (0.72) | |
| Net asset value at end of period | $69.20 | $78.24 | $64.03 | $57.42 | $53.54 | |
| Total return | (10.26%) | 23.71% | 13.21% | 8.89% | (0.54%) | |
| Ratios/Supplemental Data | ||||||
| Ratios to average net assets: | ||||||
| Total expenses | 0.04%2 | 0.05% | 0.06%3 | 0.08%4 | 0.08% | |
| Net investment income (loss) | 1.49% | 1.38% | 1.46% | 1.76% | 1.44% | |
| Portfolio turnover rate5 | 11% | 9% | 11% | 11% | 9% | |
| Net assets, end of period (x 1,000) | $8,100,071 | $8,853,388 | $5,490,843 | $3,772,207 | $2,893,741 | |
| Security | Number of Shares | % of Net Assets | Value ($) | |
| Common Stock99.8% of net assets | ||||
| Automobiles & Components 1.2% | ||||
| Gentex Corp. | 751,722 | 0.3 | 19,995,805 | |
| Other Securities | 0.9 | 73,994,652 | ||
| 1.2 | 93,990,457 | |||
| Banks 10.0% | ||||
| TCF Financial Corp. | 455,489 | 0.2 | 17,563,656 | |
| Other Securities | 9.8 | 793,389,328 | ||
| 10.0 | 810,952,984 | |||
| Capital Goods 9.6% | ||||
| Hexcel Corp. | 249,533 | 0.3 | 20,998,202 | |
| Woodward, Inc. | 164,434 | 0.2 | 17,734,207 | |
| Other Securities | 9.1 | 742,388,736 | ||
| 9.6 | 781,121,145 | |||
| Commercial & Professional Services 3.1% | ||||
| Other Securities | 3.1 | 248,142,496 | ||
| Consumer Durables & Apparel 3.0% | ||||
| Roku, Inc. * | 240,998 | 0.5 | 36,477,457 | |
| Other Securities | 2.5 | 203,376,097 | ||
| 3.0 | 239,853,554 | |||
| Consumer Services 4.0% | ||||
| Grand Canyon Education, Inc. * | 141,931 | 0.2 | 17,826,534 | |
| Planet Fitness, Inc., Class A * | 248,225 | 0.2 | 17,527,167 | |
| Other Securities | 3.6 | 291,790,853 | ||
| 4.0 | 327,144,554 | |||
| Diversified Financials 4.2% | ||||
| LPL Financial Holdings, Inc. | 245,151 | 0.2 | 18,374,067 | |
| New Residential Investment Corp. | 1,221,370 | 0.2 | 17,184,676 | |
| Other Securities | 3.8 | 301,791,661 | ||
| 4.2 | 337,350,404 | |||
| Energy 2.4% | ||||
| Other Securities | 2.4 | 193,066,717 | ||
| Security | Number of Shares | % of Net Assets | Value ($) | |
| Food & Staples Retailing 0.8% | ||||
| Casey's General Stores, Inc. | 107,696 | 0.2 | 18,076,774 | |
| Other Securities | 0.6 | 46,244,999 | ||
| 0.8 | 64,321,773 | |||
| Food, Beverage & Tobacco 1.6% | ||||
| Other Securities | 1.6 | 130,930,376 | ||
| Health Care Equipment & Services 6.6% | ||||
| Chemed Corp. | 46,831 | 0.3 | 20,110,636 | |
| Haemonetics Corp. * | 150,566 | 0.3 | 20,105,078 | |
| Hill-Rom Holdings, Inc. | 196,329 | 0.3 | 21,140,707 | |
| Insulet Corp. * | 175,378 | 0.3 | 27,038,026 | |
| Masimo Corp. * | 144,274 | 0.3 | 22,109,991 | |
| Medidata Solutions, Inc. * | 183,097 | 0.2 | 16,768,023 | |
| Other Securities | 4.9 | 405,706,701 | ||
| 6.6 | 532,979,162 | |||
| Household & Personal Products 0.7% | ||||
| Other Securities | 0.7 | 52,974,641 | ||
| Insurance 2.7% | ||||
| First American Financial Corp. | 329,494 | 0.2 | 19,258,924 | |
| Other Securities | 2.5 | 202,119,609 | ||
| 2.7 | 221,378,533 | |||
| Materials 4.4% | ||||
| Amcor plc * | 4,771,775 | 0.6 | 46,858,831 | |
| AptarGroup, Inc. | 185,733 | 0.3 | 22,700,287 | |
| Other Securities | 3.5 | 290,286,405 | ||
| 4.4 | 359,845,523 | |||
| Media & Entertainment 2.7% | ||||
| Cable One, Inc. | 14,585 | 0.2 | 18,925,788 | |
| Other Securities | 2.5 | 203,662,525 | ||
| 2.7 | 222,588,313 | |||
| Pharmaceuticals, Biotechnology & Life Sciences 7.0% | ||||
| Catalent, Inc. * | 428,336 | 0.3 | 22,590,441 | |
| Charles River Laboratories International, Inc. * | 143,439 | 0.2 | 18,819,197 | |
| Exact Sciences Corp. * | 379,783 | 0.6 | 45,277,729 | |
| Other Securities | 5.9 | 483,046,158 | ||
| 7.0 | 569,733,525 | |||
| Security | Number of Shares | % of Net Assets | Value ($) | |
| Real Estate 9.2% | ||||
| Americold Realty Trust | 563,383 | 0.3 | 20,518,409 | |
| CubeSmart | 554,440 | 0.2 | 19,898,852 | |
| EPR Properties | 222,167 | 0.2 | 17,384,568 | |
| Medical Properties Trust, Inc. | 1,290,583 | 0.3 | 23,991,938 | |
| STORE Capital Corp. | 594,337 | 0.3 | 22,442,165 | |
| Other Securities | 7.9 | 638,576,797 | ||
| 9.2 | 742,812,729 | |||
| Retailing 3.4% | ||||
| Etsy, Inc. * | 353,467 | 0.2 | 18,659,523 | |
| Five Below, Inc. * | 164,543 | 0.3 | 20,217,398 | |
| Pool Corp. | 116,903 | 0.3 | 22,957,411 | |
| Other Securities | 2.6 | 213,238,603 | ||
| 3.4 | 275,072,935 | |||
| Semiconductors & Semiconductor Equipment 3.3% | ||||
| Cypress Semiconductor Corp. | 1,075,064 | 0.3 | 24,737,223 | |
| Entegris, Inc. | 398,419 | 0.2 | 17,064,286 | |
| Monolithic Power Systems, Inc. | 116,443 | 0.2 | 17,531,658 | |
| Universal Display Corp. | 124,781 | 0.3 | 25,638,752 | |
| Versum Materials, Inc. | 321,370 | 0.2 | 16,711,240 | |
| Other Securities | 2.1 | 169,224,765 | ||
| 3.3 | 270,907,924 | |||
| Software & Services 10.6% | ||||
| Alteryx, Inc., Class A * | 136,889 | 0.2 | 19,499,838 | |
| Coupa Software, Inc. * | 160,451 | 0.3 | 22,291,457 | |
| Euronet Worldwide, Inc. * | 152,722 | 0.3 | 23,387,847 | |
| Fair Isaac Corp. * | 85,124 | 0.4 | 30,024,937 | |
| Genpact Ltd. | 447,914 | 0.2 | 18,346,557 | |
| HubSpot, Inc. * | 115,091 | 0.3 | 22,981,371 | |
| Okta, Inc. * | 305,390 | 0.5 | 38,631,835 | |
| Proofpoint, Inc. * | 163,608 | 0.2 | 18,587,505 | |
| RingCentral, Inc., Class A * | 206,713 | 0.4 | 29,173,406 | |
| The Trade Desk, Inc., Class A * | 107,560 | 0.3 | 26,435,021 | |
| Twilio, Inc., Class A * | 344,144 | 0.6 | 44,900,468 | |
| Zendesk, Inc. * | 321,942 | 0.3 | 25,819,748 | |
| Other Securities | 6.6 | 539,027,720 | ||
| 10.6 | 859,107,710 | |||
| Technology Hardware & Equipment 3.7% | ||||
| Ciena Corp. * | 420,793 | 0.2 | 17,223,057 | |
| Other Securities | 3.5 | 286,569,857 | ||
| 3.7 | 303,792,914 | |||
| Telecommunication Services 0.6% | ||||
| Other Securities | 0.6 | 45,465,042 | ||
| Transportation 1.6% | ||||
| Other Securities | 1.6 | 128,052,025 | ||
| Security | Number of Shares | % of Net Assets | Value ($) | |
| Utilities 3.4% | ||||
| Other Securities | 3.4 | 272,397,009 | ||
| Total Common Stock | ||||
| (Cost $7,654,651,871) | 8,083,982,445 | |||
| Rights0.0% of net assets | ||||
| Materials 0.0% | ||||
| Other Securities | 0.0 | 35,598 | ||
| Media 0.0% | ||||
| Other Securities | 0.0 | 15,132 | ||
| Total Rights | ||||
| (Cost $35,598) | 50,730 | |||
| Other Investment Companies1.5% of net assets | ||||
| Money Market Fund 0.0% | ||||
| Other Securities | 0.0 | 2,896,339 | ||
| Securities Lending Collateral 1.5% | ||||
| Wells Fargo Government Money Market Fund, Select Class 2.03%(c) | 1.5 | 117,560,977 | ||
| Total Other Investment Companies | ||||
| (Cost $120,457,316) | 120,457,316 | |||
| Number of Contracts | Notional Amount ($) | Current Value/ Unrealized Appreciation ($) | ||
| Futures Contracts | ||||
| Long | ||||
| Russell 2000 Index, e-mini expires 09/20/19 | 187 | 13,970,770 | 33,945 | |
| * | Non-income producing security. |
| (a) | All or a portion of this security is on loan. Securities on loan were valued at $112,803,065. |
| (b) | Fair-valued by management using significant unobservable inputs in accordance with procedures approved by the fund’s Board of Trustees. |
| (c) | The rate shown is the 7-day yield. |
| CVR — | Contingent Value Rights |
| REIT — | Real Estate Investment Trust |
| Description | Quoted Prices in Active Markets for Identical Assets (Level 1) | Other Significant Observable Inputs (Level 2) | Significant Unobservable Inputs (Level 3) | Total | |
| Assets | |||||
| Common Stock1 | $8,083,982,445 | $— | $— | $8,083,982,445 | |
| Rights1 | |||||
| Materials | — | — | 35,598 | 35,598 | |
| Media & Entertainment | — | — | 15,132 | 15,132 | |
| Other Investment Companies1 | 120,457,316 | — | — | 120,457,316 | |
| Futures Contracts2 | 33,945 | — | — | 33,945 | |
| Total | $8,204,473,706 | $— | $50,730 | $8,204,524,436 |
| 1 | As categorized in the complete schedule of Portfolio Holdings. |
| 2 | Futures contracts are valued at unrealized appreciation or depreciation. |
| Assets | ||
| Investments in unaffiliated issuers, at value (cost $7,657,583,808) including securities on loan of $112,803,065 | $8,086,929,514 | |
| Collateral invested for securities on loan, at value (cost $117,560,977) | 117,560,977 | |
| Cash | 6,080,577 | |
| Deposit with broker for futures contracts | 585,000 | |
| Receivables: | ||
| Investments sold | 362,706 | |
| Dividends | 7,184,172 | |
| Income from securities on loan | + | 690,930 |
| Total assets | 8,219,393,876 | |
| Liabilities | ||
| Collateral held for securities on loan | 117,560,977 | |
| Payables: | ||
| Investments bought | 1,438,968 | |
| Management fees | 293,513 | |
| Variation margin on futures contracts | + | 29,798 |
| Total liabilities | 119,323,256 | |
| Net Assets | ||
| Total assets | 8,219,393,876 | |
| Total liabilities | – | 119,323,256 |
| Net assets | $8,100,070,620 | |
| Net Assets by Source | ||
| Capital received from investors | 7,808,448,316 | |
| Total distributable earnings1 | 291,622,304 | |
| Net Asset Value (NAV) | ||||
| Net Assets | ÷ | Shares Outstanding | = | NAV |
| $8,100,070,620 | 117,050,000 | $69.20 | ||
| 1 | The SEC eliminated the requirement to disclose total distributable earnings (loss) by each of its components as previously disclosed as the previous presentation did not provide insight into the tax implications of distributions (see financial note 11 for additional information). |
| Investment Income | ||
| Dividends (net of foreign withholding tax of $48,170) | $116,904,634 | |
| Securities on loan, net | + | 4,626,855 |
| Total investment income | 121,531,489 | |
| Expenses | ||
| Management fees | 3,557,923 | |
| Total expenses | – | 3,557,923 |
| Net investment income | 117,973,566 | |
| Realized and Unrealized Gains (Losses) | ||
| Net realized losses on investments | (120,802,002) | |
| Net realized gains on in-kind redemptions | 501,484,086 | |
| Net realized losses on futures contracts | + | (2,098,563) |
| Net realized gains | 378,583,521 | |
| Net change in unrealized appreciation (depreciation) on investments | (1,409,685,845) | |
| Net change in unrealized appreciation (depreciation) on futures contracts | + | (53,097) |
| Net change in unrealized appreciation (depreciation) | + | (1,409,738,942) |
| Net realized and unrealized losses | (1,031,155,421) | |
| Decrease in net assets resulting from operations | ($913,181,855) | |
| Operations | ||||
| 9/1/18-8/31/19 | 9/1/17-8/31/18 | |||
| Net investment income | $117,973,566 | $97,958,435 | ||
| Net realized gains | 378,583,521 | 201,304,101 | ||
| Net change in unrealized appreciation (depreciation) | + | (1,409,738,942) | 1,205,726,156 | |
| Increase (decrease) in net assets resulting from operations | (913,181,855) | 1,504,988,692 | ||
| Distributions to Shareholders1 | ||||
| Total distributions | ($113,198,860) | ($84,332,535) | ||
| Transactions in Fund Shares | ||||||||
| 9/1/18-8/31/19 | 9/1/17-8/31/18 | |||||||
| SHARES | VALUE | SHARES | VALUE | |||||
| Shares sold | 21,350,000 | $1,530,345,531 | 34,350,000 | $2,409,489,819 | ||||
| Shares redeemed | + | (17,450,000) | (1,257,281,901) | (6,950,000) | (467,601,727) | |||
| Net transactions in fund shares | 3,900,000 | $273,063,630 | 27,400,000 | $1,941,888,092 | ||||
| Shares Outstanding and Net Assets | ||||||||
| 9/1/18-8/31/19 | 9/1/17-8/31/18 | |||||||
| SHARES | NET ASSETS | SHARES | NET ASSETS | |||||
| Beginning of period | 113,150,000 | $8,853,387,705 | 85,750,000 | $5,490,843,456 | ||||
| Total increase or decrease | + | 3,900,000 | (753,317,085) | 27,400,000 | 3,362,544,249 | |||
| End of period2 | 117,050,000 | $8,100,070,620 | 113,150,000 | $8,853,387,705 | ||||
| 1 | For the period ended August 31, 2018, the fund distributed to shareholders $84,332,535 from net investment income. The SEC eliminated the requirement to disclose distributions to shareholders from net investment income and from net realized gains in 2018 (see financial note 11 for additional information). |
| 2 | End of period - Net assets include net investment income not yet distributed of $17,859,200 at August 31, 2018. The SEC eliminated the requirement to disclose undistributed net investment income in 2018. |
| 9/1/18– 8/31/19 | 9/1/17– 8/31/18 | 9/1/16– 8/31/17 | 9/1/15– 8/31/16 | 9/1/14– 8/31/15 | ||
| Per-Share Data | ||||||
| Net asset value at beginning of period | $52.71 | $45.83 | $42.47 | $36.52 | $38.90 | |
| Income (loss) from investment operations: | ||||||
| Net investment income (loss)1 | 1.66 | 1.49 | 1.40 | 1.29 | 1.19 | |
| Net realized and unrealized gains (losses) | 0.48 | 6.75 | 3.26 | 5.85 | (2.46) | |
| Total from investment operations | 2.14 | 8.24 | 4.66 | 7.14 | (1.27) | |
| Less distributions: | ||||||
| Distributions from net investment income | (1.55) | (1.36) | (1.30) | (1.19) | (1.11) | |
| Net asset value at end of period | $53.30 | $52.71 | $45.83 | $42.47 | $36.52 | |
| Total return | 4.18% | 18.21% | 11.12% | 19.89% | (3.47%) | |
| Ratios/Supplemental Data | ||||||
| Ratios to average net assets: | ||||||
| Total expenses | 0.06%2 | 0.07% | 0.07% | 0.07% | 0.07% | |
| Net investment income (loss) | 3.23% | 2.99% | 3.17% | 3.27% | 3.03% | |
| Portfolio turnover rate3 | 24% | 23% | 15% | 22% | 19% | |
| Net assets, end of period (x 1,000) | $9,820,959 | $8,092,908 | $6,040,705 | $4,300,443 | $2,497,808 | |
| Security | Number of Shares | % of Net Assets | Value ($) | |
| Common Stock99.7% of net assets | ||||
| Automobiles & Components 0.2% | ||||
| Other Securities | 0.2 | 25,530,138 | ||
| Banks 2.7% | ||||
| Fifth Third Bancorp | 2,619,964 | 0.7 | 69,298,048 | |
| Huntington Bancshares, Inc. | 3,564,187 | 0.5 | 47,225,478 | |
| KeyCorp | 3,436,141 | 0.6 | 57,039,941 | |
| Other Securities | 0.9 | 90,134,815 | ||
| 2.7 | 263,698,282 | |||
| Capital Goods 13.1% | ||||
| 3M Co. | 1,960,656 | 3.2 | 317,077,288 | |
| Cummins, Inc. | 492,887 | 0.7 | 73,573,243 | |
| Eaton Corp. plc | 1,442,364 | 1.2 | 116,427,622 | |
| Emerson Electric Co. | 2,092,809 | 1.3 | 124,710,488 | |
| Fastenal Co. | 1,949,476 | 0.6 | 59,692,955 | |
| Illinois Tool Works, Inc. | 1,027,900 | 1.6 | 154,041,094 | |
| Lockheed Martin Corp. | 837,102 | 3.3 | 321,539,249 | |
| Rockwell Automation, Inc. | 407,133 | 0.6 | 62,205,851 | |
| Other Securities | 0.6 | 56,368,828 | ||
| 13.1 | 1,285,636,618 | |||
| Commercial & Professional Services 0.1% | ||||
| Other Securities | 0.1 | 6,398,627 | ||
| Consumer Durables & Apparel 1.1% | ||||
| Hasbro, Inc. | 393,928 | 0.4 | 43,517,226 | |
| Other Securities | 0.7 | 66,356,734 | ||
| 1.1 | 109,873,960 | |||
| Consumer Services 0.8% | ||||
| Darden Restaurants, Inc. | 420,719 | 0.5 | 50,898,585 | |
| Other Securities | 0.3 | 27,812,532 | ||
| 0.8 | 78,711,117 | |||
| Diversified Financials 4.3% | ||||
| Ameriprise Financial, Inc. | 461,410 | 0.6 | 59,512,662 | |
| BlackRock, Inc. | 414,298 | 1.8 | 175,065,763 | |
| T. Rowe Price Group, Inc. | 804,401 | 0.9 | 88,982,839 | |
| Other Securities | 1.0 | 99,003,761 | ||
| 4.3 | 422,565,025 | |||
| Security | Number of Shares | % of Net Assets | Value ($) | |
| Energy 6.2% | ||||
| Exxon Mobil Corp. | 5,864,076 | 4.1 | 401,571,924 | |
| ONEOK, Inc. | 1,401,497 | 1.0 | 99,898,706 | |
| Valero Energy Corp. | 1,421,992 | 1.1 | 107,047,558 | |
| 6.2 | 608,518,188 | |||
| Food, Beverage & Tobacco 14.7% | ||||
| Altria Group, Inc. | 6,382,586 | 2.8 | 279,174,312 | |
| General Mills, Inc. | 2,031,934 | 1.1 | 109,318,049 | |
| Kellogg Co. | 854,761 | 0.6 | 53,678,991 | |
| PepsiCo, Inc. | 3,260,545 | 4.5 | 445,814,318 | |
| The Coca-Cola Co. | 8,406,498 | 4.7 | 462,693,650 | |
| The Hershey Co. | 473,405 | 0.8 | 75,025,224 | |
| Other Securities | 0.2 | 17,999,540 | ||
| 14.7 | 1,443,704,084 | |||
| Health Care Equipment & Services 3.2% | ||||
| Cardinal Health, Inc. | 1,014,815 | 0.5 | 43,768,971 | |
| CVS Health Corp. | 4,416,595 | 2.7 | 269,058,967 | |
| Other Securities | 0.0 | 2,652,664 | ||
| 3.2 | 315,480,602 | |||
| Household & Personal Products 7.3% | ||||
| Kimberly-Clark Corp. | 1,172,788 | 1.7 | 165,492,115 | |
| The Clorox Co. | 436,359 | 0.7 | 69,014,539 | |
| The Procter & Gamble Co. | 3,958,067 | 4.8 | 475,878,395 | |
| Other Securities | 0.1 | 7,629,208 | ||
| 7.3 | 718,014,257 | |||
| Insurance 2.4% | ||||
| Fidelity National Financial, Inc. | 937,733 | 0.4 | 41,203,988 | |
| Principal Financial Group, Inc. | 881,140 | 0.5 | 46,894,271 | |
| Prudential Financial, Inc. | 1,392,607 | 1.1 | 111,533,894 | |
| Other Securities | 0.4 | 35,590,791 | ||
| 2.4 | 235,222,944 | |||
| Materials 1.8% | ||||
| International Paper Co. | 1,363,390 | 0.6 | 53,308,549 | |
| Other Securities | 1.2 | 121,811,352 | ||
| 1.8 | 175,119,901 | |||
| Media & Entertainment 0.6% | ||||
| Omnicom Group, Inc. | 761,749 | 0.6 | 57,938,629 | |
| Security | Number of Shares | % of Net Assets | Value ($) | |
| Pharmaceuticals, Biotechnology & Life Sciences 6.4% | ||||
| Bristol-Myers Squibb Co. | 5,559,294 | 2.7 | 267,235,263 | |
| Pfizer, Inc. | 10,076,629 | 3.7 | 358,224,161 | |
| 6.4 | 625,459,424 | |||
| Retailing 8.8% | ||||
| Best Buy Co., Inc. | 796,641 | 0.5 | 50,706,200 | |
| Genuine Parts Co. | 497,314 | 0.5 | 44,902,481 | |
| Target Corp. | 1,776,934 | 1.9 | 190,203,015 | |
| The Home Depot, Inc. | 2,182,178 | 5.1 | 497,340,188 | |
| Other Securities | 0.8 | 80,819,946 | ||
| 8.8 | 863,971,830 | |||
| Semiconductors & Semiconductor Equipment 13.2% | ||||
| Intel Corp. | 9,371,962 | 4.5 | 444,324,718 | |
| KLA Corp. | 562,482 | 0.9 | 83,191,088 | |
| Maxim Integrated Products, Inc. | 931,229 | 0.5 | 50,789,230 | |
| QUALCOMM, Inc. | 4,121,202 | 3.3 | 320,505,880 | |
| Texas Instruments, Inc. | 3,195,607 | 4.0 | 395,456,366 | |
| 13.2 | 1,294,267,282 | |||
| Software & Services 5.1% | ||||
| International Business Machines Corp. | 3,030,062 | 4.2 | 410,664,303 | |
| Paychex, Inc. | 1,088,143 | 0.9 | 88,901,283 | |
| 5.1 | 499,565,586 | |||
| Technology Hardware & Equipment 0.0% | ||||
| Other Securities | 0.0 | 2,169,680 | ||
| Telecommunication Services 4.5% | ||||
| Verizon Communications, Inc. | 7,567,918 | 4.5 | 440,150,111 | |
| Security | Number of Shares | % of Net Assets | Value ($) | |
| Transportation 3.2% | ||||
| United Parcel Service, Inc., Class B | 2,369,921 | 2.8 | 281,214,826 | |
| Other Securities | 0.4 | 39,334,319 | ||
| 3.2 | 320,549,145 | |||
| Total Common Stock | ||||
| (Cost $9,115,761,049) | 9,792,545,430 | |||
| Other Investment Companies0.2% of net assets | ||||
| Money Market Fund 0.1% | ||||
| Other Securities | 0.1 | 5,078,698 | ||
| Securities Lending Collateral 0.1% | ||||
| Other Securities | 0.1 | 12,662,275 | ||
| Total Other Investment Companies | ||||
| (Cost $17,740,973) | 17,740,973 | |||
| Number of Contracts | Notional Amount ($) | Current Value/ Unrealized Appreciation ($) | ||
| Futures Contracts | ||||
| Long | ||||
| S&P 500 Index, e-mini, expires 09/20/19 | 177 | 25,884,480 | 219,191 | |
| (a) | All or a portion of this security is on loan. Securities on loan were valued at $12,089,459. |
| (b) | The rate shown is the 7-day yield. |
| Description | Quoted Prices in Active Markets for Identical Assets (Level 1) | Other Significant Observable Inputs (Level 2) | Significant Unobservable Inputs (Level 3) | Total | |
| Assets | |||||
| Common Stock1 | $9,792,545,430 | $— | $— | $9,792,545,430 | |
| Other Investment Companies1 | 17,740,973 | — | — | 17,740,973 | |
| Futures Contracts2 | 219,191 | — | — | 219,191 | |
| Total | $9,810,505,594 | $— | $— | $9,810,505,594 |
| 1 | As categorized in the complete schedule of Portfolio Holdings. |
| 2 | Futures contracts are valued at unrealized appreciation or depreciation. |
| Assets | ||
| Investments in unaffiliated issuers, at value (cost $9,120,839,747) including securities on loan of $12,089,459 | $9,797,624,128 | |
| Collateral invested for securities on loan, at value (cost $12,662,275) | 12,662,275 | |
| Deposit with broker for futures contracts | 1,593,900 | |
| Receivables: | ||
| Dividends | 33,375,931 | |
| Income from securities on loan | + | 11,873 |
| Total assets | 9,845,268,107 | |
| Liabilities | ||
| Collateral held for securities on loan | 12,662,275 | |
| Payables: | ||
| Investments bought | 11,108,410 | |
| Management fees | 521,805 | |
| Variation margin on futures contracts | + | 16,120 |
| Total liabilities | 24,308,610 | |
| Net Assets | ||
| Total assets | 9,845,268,107 | |
| Total liabilities | – | 24,308,610 |
| Net assets | $9,820,959,497 | |
| Net Assets by Source | ||
| Capital received from investors | 9,320,172,835 | |
| Total distributable earnings1 | 500,786,662 | |
| Net Asset Value (NAV) | ||||
| Net Assets | ÷ | Shares Outstanding | = | NAV |
| $9,820,959,497 | 184,250,000 | $53.30 | ||
| 1 | The SEC eliminated the requirement to disclose total distributable earnings (loss) by each of its components as previously disclosed as the previous presentation did not provide insight into the tax implications of distributions (see financial note 11 for additional information). |
| Investment Income | ||
| Dividends | $288,257,870 | |
| Securities on loan, net | + | 31,521 |
| Total investment income | 288,289,391 | |
| Expenses | ||
| Management fees | 5,661,305 | |
| Total expenses | – | 5,661,305 |
| Net investment income | 282,628,086 | |
| Realized and Unrealized Gains (Losses) | ||
| Net realized losses on investments | (144,016,829) | |
| Net realized gains on in-kind redemptions | 403,313,183 | |
| Net realized gains on futures contracts | + | 722,403 |
| Net realized gains | 260,018,757 | |
| Net change in unrealized appreciation (depreciation) on investments | (134,572,768) | |
| Net change in unrealized appreciation (depreciation) on futures contracts | + | (152,818) |
| Net change in unrealized appreciation (depreciation) | + | (134,725,586) |
| Net realized and unrealized gains | 125,293,171 | |
| Increase in net assets resulting from operations | $407,921,257 | |
| Operations | ||||
| 9/1/18-8/31/19 | 9/1/17-8/31/18 | |||
| Net investment income | $282,628,086 | $214,128,766 | ||
| Net realized gains | 260,018,757 | 664,488,840 | ||
| Net change in unrealized appreciation (depreciation) | + | (134,725,586) | 248,013,420 | |
| Increase in net assets resulting from operations | 407,921,257 | 1,126,631,026 | ||
| Distributions to Shareholders1 | ||||
| Total distributions | ($258,520,350) | ($202,365,750) | ||
| Transactions in Fund Shares | ||||||||
| 9/1/18-8/31/19 | 9/1/17-8/31/18 | |||||||
| SHARES | VALUE | SHARES | VALUE | |||||
| Shares sold | 67,000,000 | $3,443,124,440 | 85,900,000 | $4,318,218,272 | ||||
| Shares redeemed | + | (36,300,000) | (1,864,473,911) | (64,150,000) | (3,190,280,837) | |||
| Net transactions in fund shares | 30,700,000 | $1,578,650,529 | 21,750,000 | $1,127,937,435 | ||||
| Shares Outstanding and Net Assets | ||||||||
| 9/1/18-8/31/19 | 9/1/17-8/31/18 | |||||||
| SHARES | NET ASSETS | SHARES | NET ASSETS | |||||
| Beginning of period | 153,550,000 | $8,092,908,061 | 131,800,000 | $6,040,705,350 | ||||
| Total increase | + | 30,700,000 | 1,728,051,436 | 21,750,000 | 2,052,202,711 | |||
| End of period2 | 184,250,000 | $9,820,959,497 | 153,550,000 | $8,092,908,061 | ||||
| 1 | For the period ended August 31, 2018, the fund distributed to shareholders $202,365,750 from net investment income. The SEC eliminated the requirement to disclose distributions to shareholders from net investment income and from net realized gains in 2018 (see financial note 11 for additional information). |
| 2 | End of period - Net assets include net investment income not yet distributed of $42,044,359 at August 31, 2018. The SEC eliminated the requirement to disclose undistributed net investment income in 2018. |
| SCHWAB STRATEGIC TRUST (ORGANIZED JANUARY 27, 2009) | |
| Schwab U.S. Broad Market ETF | Schwab Emerging Markets Equity ETF |
| Schwab 1000 Index ETF | Schwab U.S. TIPS ETF |
| Schwab U.S. Large-Cap ETF | Schwab Short-Term U.S. Treasury ETF |
| Schwab U.S. Large-Cap Growth ETF | Schwab Intermediate-Term U.S. Treasury ETF |
| Schwab U.S. Large-Cap Value ETF | Schwab U.S. Aggregate Bond ETF |
| Schwab U.S. Mid-Cap ETF | Schwab Fundamental U.S. Broad Market Index ETF |
| Schwab U.S. Small-Cap ETF | Schwab Fundamental U.S. Large Company Index ETF |
| Schwab U.S. Dividend Equity ETF | Schwab Fundamental U.S. Small Company Index ETF |
| Schwab U.S. REIT ETF | Schwab Fundamental International Large Company Index ETF |
| Schwab International Equity ETF | Schwab Fundamental International Small Company Index ETF |
| Schwab International Small-Cap Equity ETF | Schwab Fundamental Emerging Markets Large Company Index ETF |
2. Significant Accounting Policies:
3. Risk Factors:
4. Affiliates and Affiliated Transactions:
| Schwab U.S. Broad Market ETF | Schwab 1000 Index ETF | Schwab U.S. Large-Cap ETF | Schwab U.S. Large-Cap Growth ETF | Schwab U.S. Large-Cap Value ETF | Schwab U.S. Mid-Cap ETF | Schwab U.S. Small-Cap ETF | Schwab U.S. Dividend Equity ETF |
| 0.03% | 0.05% | 0.03% | 0.04% | 0.04% | 0.04%* | 0.04%* | 0.06%* |
| Underlying Funds | |||
| Schwab U.S. Large-Cap ETF | Schwab U.S. Small-Cap ETF | ||
| Schwab VIT Balanced Portfolio | 0.1% | 0.0%* | |
| Schwab VIT Balanced with Growth Portfolio | 0.2% | 0.1% | |
| Schwab VIT Growth Portfolio | 0.2% | 0.1% | |
| Schwab Target 2010 Index Fund | 0.0%* | 0.0%* | |
| Schwab Target 2015 Index Fund | 0.1% | 0.0%* | |
| Schwab Target 2020 Index Fund | 0.2% | 0.0%* | |
| Schwab Target 2025 Index Fund | 0.4% | 0.1% | |
| Schwab Target 2030 Index Fund | 0.5% | 0.1% | |
| Schwab Target 2035 Index Fund | 0.4% | 0.1% | |
| Schwab Target 2040 Index Fund | 0.5% | 0.1% | |
| Schwab Target 2045 Index Fund | 0.3% | 0.1% | |
| Schwab Target 2050 Index Fund | 0.3% | 0.1% | |
| Schwab Target 2055 Index Fund | 0.2% | 0.1% | |
| Schwab Target 2060 Index Fund | 0.2% | 0.1% | |
| * | Less than 0.05% |
| Total Aggregate Transactions | Realized Gains (Losses) | |
| Schwab U.S. Broad Market ETF | $247,631,760 | ($28,849,642) |
| Schwab 1000 Index ETF | 5,486,623 | (414,753) |
| Schwab U.S. Large-Cap ETF | 352,457,265 | (25,628,947) |
| Schwab U.S. Large-Cap Growth ETF | 440,084,929 | (26,358,963) |
| Schwab U.S. Large-Cap Value ETF | 255,809,407 | (5,201,603) |
| Schwab U.S. Mid-Cap ETF | 302,813,600 | (46,304,345) |
| Schwab U.S. Small-Cap ETF | 425,913,874 | (55,046,270) |
| Schwab U.S. Dividend Equity ETF | 234,880,948 | (9,858,920) |
6. Board of Trustees:
7. Borrowing from Banks:
8. Derivatives:
| Notional Amounts | Number of Contracts | |
| Schwab U.S. Broad Market ETF | $24,063,492 | 172 |
| Schwab 1000 Index ETF | 1,134,367 | 8 |
| Schwab U.S. Large-Cap ETF | 26,193,905 | 187 |
| Schwab U.S. Large-Cap Growth ETF | 5,885,788 | 78 |
| Schwab U.S. Large-Cap Value ETF | 12,555,272 | 208 |
| Schwab U.S. Mid-Cap ETF | 7,670,014 | 41 |
| Schwab U.S. Small-Cap ETF | 14,056,162 | 184 |
| Schwab U.S. Dividend Equity ETF | 20,837,515 | 148 |
| Purchases of Securities | Sales of Securities | |
| Schwab U.S. Broad Market ETF | $761,074,477 | $570,350,331 |
| Schwab 1000 Index ETF | 52,438,910 | 33,501,945 |
| Schwab U.S. Large-Cap ETF | 841,894,154 | 669,378,565 |
| Schwab U.S. Large-Cap Growth ETF | 1,055,566,507 | 983,948,619 |
| Schwab U.S. Large-Cap Value ETF | 432,943,250 | 393,627,302 |
| Schwab U.S. Mid-Cap ETF | 1,155,463,824 | 1,043,898,293 |
| Schwab U.S. Small-Cap ETF | 1,197,647,144 | 870,923,529 |
| Schwab U.S. Dividend Equity ETF | 2,144,642,515 | 2,113,286,016 |
10. In-Kind Transactions:
| In-Kind Purchases of Securities | In-Kind Sales of Securities | |
| Schwab U.S. Broad Market ETF | $2,582,392,902 | $1,094,882,853 |
| Schwab 1000 Index ETF | 382,045,449 | 76,542,390 |
| Schwab U.S. Large-Cap ETF | 3,491,328,222 | 886,009,507 |
| Schwab U.S. Large-Cap Growth ETF | 1,484,519,899 | 515,068,959 |
| Schwab U.S. Large-Cap Value ETF | 2,553,776,616 | 1,243,373,476 |
| Schwab U.S. Mid-Cap ETF | 2,088,690,191 | 953,743,768 |
| Schwab U.S. Small-Cap ETF | 1,461,075,976 | 1,180,663,465 |
| Schwab U.S. Dividend Equity ETF | 3,312,394,673 | 1,735,617,021 |
| Schwab U.S. Broad Market ETF | Schwab 1000 Index ETF | Schwab U.S. Large-Cap ETF | Schwab U.S. Large-Cap Growth ETF | Schwab U.S. Large-Cap Value ETF | |||||
| Tax cost | $11,610,121,892 | $776,602,976 | $14,408,539,427 | $6,007,093,780 | $5,623,831,103 | ||||
| Gross unrealized appreciation | $3,953,737,918 | $102,187,348 | $4,093,783,597 | $2,304,175,607 | $708,100,601 | ||||
| Gross unrealized depreciation | (690,649,388) | (41,258,668) | (723,642,175) | (208,652,516) | (362,037,046) | ||||
| Net unrealized appreciation (depreciation) | $3,263,088,530 | $60,928,680 | $3,370,141,422 | $2,095,523,091 | $346,063,555 |
| Schwab U.S. Mid-Cap ETF | Schwab U.S. Small-Cap ETF | Schwab U.S. Dividend Equity ETF | |||
| Tax cost | $5,684,980,035 | $7,821,625,807 | $9,152,325,765 | ||
| Gross unrealized appreciation | $1,117,675,890 | $1,537,184,503 | $1,146,915,878 | ||
| Gross unrealized depreciation | (521,464,640) | (1,154,285,874) | (488,736,049) | ||
| Net unrealized appreciation (depreciation) | $596,211,250 | $382,898,629 | $658,179,829 |
| Schwab U.S. Broad Market ETF | Schwab 1000 Index ETF | Schwab U.S. Large-Cap ETF | Schwab U.S. Large-Cap Growth ETF | Schwab U.S. Large-Cap Value ETF | Schwab U.S. Mid-Cap ETF | Schwab U.S. Small-Cap ETF | Schwab U.S. Dividend Equity ETF | ||||||||
| Undistributed ordinary income | $74,091,202 | $4,140,128 | $88,330,408 | $14,941,868 | $54,191,973 | $18,528,610 | $22,977,275 | $66,132,364 | |||||||
| Net unrealized appreciation (depreciation) on investments | 3,263,088,530 | 60,928,680 | 3,370,141,422 | 2,095,523,091 | 346,063,555 | 596,211,250 | 382,898,629 | 658,179,829 | |||||||
| Total | $3,337,179,732 | $65,068,808 | $3,458,471,830 | $2,110,464,959 | $400,255,528 | $614,739,860 | $405,875,904 | $724,312,193 |
| Expiration Date | Schwab U.S. Broad Market ETF | Schwab 1000 Index ETF | Schwab U.S. Large-Cap ETF | Schwab U.S. Large-Cap Growth ETF | Schwab U.S. Large-Cap Value ETF | Schwab U.S. Mid-Cap ETF | Schwab U.S. Small-Cap ETF | Schwab U.S. Dividend Equity ETF | |||||||
| No expiration | $62,177,573 | $2,502,538 | $84,669,523 | $85,616,664 | $46,716,090 | $202,458,368 | $114,253,600 | $223,525,531 | |||||||
| Total | $62,177,573 | $2,502,538 | $84,669,523 | $85,616,664 | $46,716,090 | $202,458,368 | $114,253,600 | $223,525,531 |
| Schwab U.S. Broad Market ETF | Schwab 1000 Index ETF | Schwab U.S. Large-Cap ETF | Schwab U.S. Large-Cap Growth ETF | Schwab U.S. Large-Cap Value ETF | Schwab U.S. Mid-Cap ETF | Schwab U.S. Small-Cap ETF | Schwab U.S. Dividend Equity ETF | |
| Capital losses expired | $— | $— | $721,062 | $631,601 | $295,384 | $218,695 | $927,631 | $— |
| Schwab U.S. Broad Market ETF | Schwab 1000 Index ETF | Schwab U.S. Large-Cap ETF | Schwab U.S. Large-Cap Growth ETF | Schwab U.S. Large-Cap Value ETF | Schwab U.S. Mid-Cap ETF | Schwab U.S. Small-Cap ETF | Schwab U.S. Dividend Equity ETF | |
| Current period distributions | ||||||||
| Ordinary income | $265,289,790 | $11,758,680 | $302,865,295 | $80,450,420 | $153,831,815 | $80,783,475 | $113,198,860 | $258,520,350 |
| Long-term capital gains | — | — | — | — | — | — | — | — |
| Prior period distributions | ||||||||
| Ordinary income | $199,698,380 | $3,615,715 | $208,413,000 | $52,664,675 | $104,891,835 | $53,918,230 | $84,332,535 | $202,365,750 |
| Long-term capital gains | — | — | — | — | — | — | — | — |
12. Subsequent Events:
| Schwab U.S. Broad Market ETF, Schwab U.S. Large-Cap ETF, Schwab U.S. Large-Cap Growth ETF, Schwab U.S. Large-Cap Value ETF, Schwab U.S. Mid-Cap ETF, Schwab U.S. Small-Cap ETF and Schwab U.S. Dividend Equity ETF: statements of changes in net assets for each of the two years in the period ended August 31, 2019. |
| Schwab 1000 Index ETF: statements of changes in net assets for the period October 11, 2017 (commencement of operations) through August 31, 2018 and for the year ended August 31, 2019. |
San Francisco, California
October 17, 2019
| Schwab U.S. Broad Market ETF | 89.99% |
| Schwab 1000 Index ETF | 91.76% |
| Schwab U.S. Large-Cap ETF | 91.48% |
| Schwab U.S. Large-Cap Growth ETF | 86.34% |
| Schwab U.S. Large-Cap Value ETF | 94.11% |
| Schwab U.S. Mid-Cap ETF | 70.08% |
| Schwab U.S. Small-Cap ETF | 69.95% |
| Schwab U.S. Dividend Equity ETF | 100.00% |
| Schwab U.S. Broad Market ETF | $243,237,990 |
| Schwab 1000 Index ETF | 11,705,287 |
| Schwab U.S. Large-Cap ETF | 284,993,472 |
| Schwab U.S. Large-Cap Growth ETF | 73,911,841 |
| Schwab U.S. Large-Cap Value ETF | 147,156,788 |
| Schwab U.S. Mid-Cap ETF | 58,875,457 |
| Schwab U.S. Small-Cap ETF | 80,255,761 |
| Schwab U.S. Dividend Equity ETF | 258,520,350 |
Market Price vs. NAV as of August 31, 2019
| Number of Days Market Price Above NAV | Number of Days Market Price Below NAV | |||||||
| 1-49 Basis Points | 50-99 Basis Points | 100-199 Basis Points | >200 Basis Points | 1-49 Basis Points | 50-99 Basis Points | 100-199 Basis Points | >200 Basis Points | |
| Schwab U.S. Broad Market ETF | ||||||||
| Commencement of trading | ||||||||
| 11/3/09 through 8/31/19 | 1,593 | 1 | — | — | 428 | — | — | — |
| Schwab 1000 Index ETF | ||||||||
| Commencement of trading | ||||||||
| 10/11/17 through 8/31/19 | 322 | — | — | — | 67 | — | — | — |
| Schwab U.S. Large-Cap ETF | ||||||||
| Commencement of trading | ||||||||
| 11/3/09 through 8/31/19 | 1,607 | — | — | — | 438 | — | — | — |
| Schwab U.S. Large-Cap Growth ETF | ||||||||
| Commencement of trading | ||||||||
| 12/11/09 through 8/31/19 | 1,383 | — | 1 | — | 521 | — | — | — |
| Schwab U.S. Large-Cap Value ETF | ||||||||
| Commencement of trading | ||||||||
| 12/11/09 through 8/31/19 | 1,536 | — | — | — | 409 | — | — | — |
| Schwab U.S. Mid-Cap ETF | ||||||||
| Commencement of trading | ||||||||
| 1/13/11 through 8/31/19 | 1,489 | — | — | — | 334 | — | — | — |
| Schwab U.S. Small-Cap ETF | ||||||||
| Commencement of trading | ||||||||
| 11/3/09 through 8/31/19 | 1,514 | 1 | — | — | 668 | — | — | — |
| Schwab U.S. Dividend Equity ETF | ||||||||
| Commencement of trading | ||||||||
| 10/20/11 through 8/31/19 | 984 | — | — | — | 438 | — | — | — |
| 1. | the nature, extent and quality of the services provided to the Funds under the Agreement, including the resources of CSIM and its affiliates dedicated to the Funds; |
| 2. | each Fund’s investment performance and how it compared to that of certain other comparable exchange-traded funds and benchmark data; |
| 3. | each Fund’s expenses and how those expenses compared to those of certain other similar exchange-traded funds; |
| 4. | the profitability of CSIM and its affiliates, including Charles Schwab & Co., Inc. (Schwab), with respect to the Funds, including both direct and indirect benefits accruing to CSIM and its affiliates; and |
| 5. | the extent to which economies of scale would be realized as the Funds grow and whether fee levels in the Agreement reflect those economies of scale for the benefit of Fund investors. |
| Independent Trustees | |||
| Name, Year of Birth, and Position(s) with the trust (Terms of office, and length of Time Served1) | Principal Occupations During the Past Five Years | Number of Portfolios in Fund Complex Overseen by the Trustee | Other Directorships |
| Robert W. Burns 1959 Trustee (Trustee of Schwab Strategic Trust since 2009; The Charles Schwab Family of Funds, Schwab Investments, Schwab Capital Trust, Schwab Annuity Portfolios and Laudus Trust since 2016) | Retired/Private Investor (Jan. 2009 – present). Formerly, Managing Director, Pacific Investment Management Company, LLC (PIMCO) (investment management firm) and President, PIMCO Funds. | 101 | None |
| John F. Cogan 1947 Trustee (Trustee of The Charles Schwab Family of Funds, Schwab Investments, Schwab Capital Trust and Schwab Annuity Portfolios since 2008; Laudus Trust since 2010; Schwab Strategic Trust since 2016) | Senior Fellow (Oct. 1979 – present), The Hoover Institution at Stanford University (public policy think tank); Senior Fellow (2000 – present), Stanford Institute for Economic Policy Research; Professor of Public Policy (1994 – 2015), Stanford University. | 101 | Director (2005 – present), Gilead Sciences, Inc. |
| Nancy F. Heller 1956 Trustee (Trustee of The Charles Schwab Family of Funds, Schwab Investments, Schwab Capital Trust, Schwab Annuity Portfolios, Schwab Strategic Trust and Laudus Trust since 2018) | President and Chairman (2014 – 2016), TIAA Charitable (financial services); Senior Managing Director (2003 – 2016), TIAA (financial services). | 101 | None |
| Stephen Timothy Kochis 1946 Trustee (Trustee of Schwab Strategic Trust since 2012; The Charles Schwab Family of Funds, Schwab Investments, Schwab Capital Trust, Schwab Annuity Portfolios and Laudus Trust since 2016) | CEO and Owner (May 2012 – present), Kochis Global (wealth management consulting). | 101 | None |
| Independent Trustees (continued) | |||
| Name, Year of Birth, and Position(s) with the trust (Terms of office, and length of Time Served1) | Principal Occupations During the Past Five Years | Number of Portfolios in Fund Complex Overseen by the Trustee | Other Directorships |
| David L. Mahoney 1954 Trustee (Trustee of The Charles Schwab Family of Funds, Schwab Investments, Schwab Capital Trust, Schwab Annuity Portfolios and Laudus Trust since 2011; Schwab Strategic Trust since 2016) | Private Investor. | 101 | Director (2003 – present), Symantec Corporation Director (2004 – present), Corcept Therapeutics Incorporated Director (2009 – present), Adamas Pharmaceuticals, Inc. |
| Jane P. Moncreiff 1961 Trustee (Trustee of The Charles Schwab Family of Funds, Schwab Investments, Schwab Capital Trust, Schwab Annuity Portfolios, Schwab Strategic Trust and Laudus Trust since 2019) | Chief Investment Officer (2009-2017), CareGroup Healthcare System, Inc. (healthcare). | 101 | None |
| Kiran M. Patel 1948 Trustee (Trustee of The Charles Schwab Family of Funds, Schwab Investments, Schwab Capital Trust, Schwab Annuity Portfolios and Laudus Trust since 2011; Schwab Strategic Trust since 2016) | Retired. Executive Vice President and General Manager of Small Business Group (Dec. 2008 – Sept. 2013), Intuit, Inc. (financial software and services firm for consumers and small businesses). | 101 | Director (2008 – present), KLA-Tencor Corporation |
| Kimberly S. Patmore 1956 Trustee (Trustee of The Charles Schwab Family of Funds, Schwab Investments, Schwab Capital Trust, Schwab Annuity Portfolios, Schwab Strategic Trust and Laudus Trust since 2016) | Consultant (2008 – present), Patmore Management Consulting (management consulting). | 101 | None |
| Gerald B. Smith 1950 Trustee (Trustee of The Charles Schwab Family of Funds, Schwab Investments, Schwab Capital Trust and Schwab Annuity Portfolios since 2000; Laudus Trust since 2010; Schwab Strategic Trust since 2016) | Chairman, Chief Executive Officer and Founder (Mar. 1990 – present), Smith Graham & Co. (investment advisors). | 101 | Director (2012 – present), Eaton Corporation plc |
| Interested Trustees | |||
| Name, Year of Birth, and Position(s) with the trust (Terms of office, and length of Time Served1) | Principal Occupations During the Past Five Years | Number of Portfolios in Fund Complex Overseen by the Trustee | Other Directorships |
| Walter W. Bettinger II2 1960 Chairman and Trustee (Trustee of The Charles Schwab Family of Funds, Schwab Investments, Schwab Capital Trust and Schwab Annuity Portfolios since 2008; Schwab Strategic Trust since 2009; Laudus Trust since 2010) | Director, President and Chief Executive Officer (Oct. 2008 – present), The Charles Schwab Corporation; President and Chief Executive Officer (Oct. 2008 – present) and Director (May 2008 – present), Charles Schwab & Co., Inc.; Director (Apr. 2006 – present), Charles Schwab Bank; Director (Nov. 2017 – present), Charles Schwab Premier Bank; Director (May 2008 – present) and President and Chief Executive Officer (Aug. 2017 – present), Schwab Holdings, Inc.; Director (July 2016 – present), Charles Schwab Investment Management, Inc. | 101 | Director (2008 – present), The Charles Schwab Corporation |
| Jonathan de St. Paer2 1973 Trustee (Trustee of The Charles Schwab Family of Funds, Schwab Investments, Schwab Capital Trust, Schwab Annuity Portfolios, Schwab Strategic Trust and Laudus Trust since 2019) | Director and Chief Executive Officer (Apr. 2019 – present) and President (Oct. 2018 – present), Charles Schwab Investment Management, Inc.; Trustee and Chief Executive Officer (Apr. 2019 – present) and President (Nov. 2018 – present), Schwab Funds, Laudus Funds and Schwab ETFs; Director (Apr. 2019 – present), Charles Schwab Worldwide Funds plc and Charles Schwab Asset Management (Ireland) Limited; Senior Vice President (Apr. 2019 – present), Senior Vice President – Strategy and Product Development (CSIM) (Jan. 2014 – Mar. 2019), and Vice President (Jan. 2009 – Dec. 2013), Charles Schwab & Co., Inc. | 101 | None |
| Joseph R. Martinetto2 1962 Trustee (Trustee of The Charles Schwab Family of Funds, Schwab Investments, Schwab Capital Trust, Schwab Annuity Portfolios, Schwab Strategic Trust and Laudus Trust since 2016) | Chief Operating Officer (Feb. 2018 – present) and Senior Executive Vice President (July 2015 – Feb. 2018), The Charles Schwab Corporation; Senior Executive Vice President (July 2015 – present), Charles Schwab & Co., Inc.; Chief Financial Officer (July 2015 – Aug. 2017) and Executive Vice President and Chief Financial Officer (May 2007 – July 2015), The Charles Schwab Corporation and Charles Schwab & Co., Inc.; Director (May 2007 – present), Charles Schwab & Co., Inc.; Director (Apr. 2010 – present) and Chief Executive Officer (July 2013 – Apr. 2015), Charles Schwab Bank; Director (Nov. 2017 – present), Charles Schwab Premier Bank; Director (May 2007 – present), Chief Financial Officer (May 2007 – Aug. 2017), Senior Executive Vice President (Feb. 2016 – present), and Executive Vice President (May 2007 – Feb. 2016), Schwab Holdings, Inc. | 101 | None |
| Officers of the Trust | |
| Name, Year of Birth, and Position(s) with the trust (Terms of office, and length of Time Served3) | Principal Occupations During the Past Five Years |
| Jonathan de St. Paer 1973 President and Chief Executive Officer (Officer of The Charles Schwab Family of Funds, Schwab Investments, Schwab Capital Trust, Schwab Annuity Portfolios, Schwab Strategic Trust and Laudus Trust since 2018) | Director and Chief Executive Officer (Apr. 2019 – present) and President (Oct. 2018 – present), Charles Schwab Investment Management, Inc.; Trustee and Chief Executive Officer (Apr. 2019 – present) and President (Nov. 2018 – present), Schwab Funds, Laudus Funds and Schwab ETFs; Director (Apr. 2019 – present), Charles Schwab Worldwide Funds plc and Charles Schwab Asset Management (Ireland) Limited; Senior Vice President (Apr. 2019 – present), Senior Vice President – Strategy and Product Development (CSIM) (Jan. 2014 – Mar. 2019), and Vice President (Jan. 2009 – Dec. 2013), Charles Schwab & Co., Inc. |
| Officers of the Trust (continued) | |
| Name, Year of Birth, and Position(s) with the trust (Terms of office, and length of Time Served3) | Principal Occupations During the Past Five Years |
| Mark Fischer 1970 Treasurer and Chief Financial Officer (Officer of The Charles Schwab Family of Funds, Schwab Investments, Schwab Capital Trust, Schwab Annuity Portfolios, Schwab Strategic Trust and Laudus Trust since 2013) | Treasurer and Chief Financial Officer (Jan. 2016 – present), Schwab Funds, Laudus Funds and Schwab ETFs; Assistant Treasurer (Dec. 2013 – Dec. 2015), Schwab Funds and Laudus Funds; Assistant Treasurer (Nov. 2013 – Dec. 2015), Schwab ETFs; Vice President (Oct. 2013 – present), Charles Schwab Investment Management, Inc.; Executive Director (Apr. 2011 – Sept. 2013), J.P. Morgan Investor Services; Assistant Treasurer (May 2005 – Mar. 2011), Massachusetts Financial Service Investment Management. |
| George Pereira 1964 Senior Vice President and Chief Operating Officer (Officer of The Charles Schwab Family of Funds, Schwab Investments, Schwab Capital Trust and Schwab Annuity Portfolios since 2004; Laudus Trust since 2006; Schwab Strategic Trust since 2009) | Senior Vice President and Chief Financial Officer (Nov. 2004 – present) and Chief Operating Officer (Jan. 2011 – present), Charles Schwab Investment Management, Inc.; Senior Vice President and Chief Operating Officer (Jan. 2016 – present), Schwab Funds, Laudus Funds and Schwab ETFs; Treasurer and Chief Financial Officer (June 2006 – Dec. 2015), Laudus Funds; Treasurer and Principal Financial Officer (Nov. 2004 – Dec. 2015), Schwab Funds; Treasurer and Principal Financial Officer (Oct. 2009 – Dec. 2015), Schwab ETFs; Director (Apr. 2005 – present), Charles Schwab Worldwide Funds plc and Charles Schwab Asset Management (Ireland) Limited. |
| Omar Aguilar 1970 Senior Vice President and Chief Investment Officer – Equities and Multi-Asset Strategies (Officer of The Charles Schwab Family of Funds, Schwab Investments, Schwab Capital Trust, Schwab Annuity Portfolios, Schwab Strategic Trust and Laudus Trust since 2011) | Senior Vice President and Chief Investment Officer – Equities and Multi-Asset Strategies (Apr. 2011 – present), Charles Schwab Investment Management, Inc.; Senior Vice President and Chief Investment Officer – Equities and Multi-Asset Strategies (June 2011 – present), Schwab Funds, Laudus Funds and Schwab ETFs; Head of the Portfolio Management Group and Vice President of Portfolio Management (May 2009 – Apr. 2011), Financial Engines, Inc. (investment management firm); Head of Quantitative Equity (July 2004 – Jan. 2009), ING Investment Management. |
| Brett Wander 1961 Senior Vice President and Chief Investment Officer – Fixed Income (Officer of The Charles Schwab Family of Funds, Schwab Investments, Schwab Capital Trust, Schwab Annuity Portfolios, Schwab Strategic Trust and Laudus Trust since 2011) | Senior Vice President and Chief Investment Officer – Fixed Income (Apr. 2011 – present), Charles Schwab Investment Management, Inc.; Senior Vice President and Chief Investment Officer – Fixed Income (June 2011 – present), Schwab Funds, Laudus Funds and Schwab ETFs; Senior Managing Director and Global Head of Active Fixed-Income Strategies (Jan. 2008 – Oct. 2010), State Street Global Advisors; Director of Alpha Strategies (Apr. 2006 – Jan. 2008), Loomis, Sayles & Company (investment management firm). |
| David Lekich 1964 Chief Legal Officer and Secretary, Schwab Funds and Schwab ETFs Vice President and Assistant Clerk, Laudus Funds (Officer of The Charles Schwab Family of Funds, Schwab Investments, Schwab Capital Trust, Schwab Annuity Portfolios, Schwab Strategic Trust and Laudus Trust since 2011) | Senior Vice President (Sept. 2011 – present) and Vice President (Mar. 2004 – Sept. 2011), Charles Schwab & Co., Inc.; Senior Vice President and Chief Counsel (Sept. 2011 – present) and Vice President (Jan. 2011 – Sept. 2011), Charles Schwab Investment Management, Inc.; Secretary (Apr. 2011 – present) and Chief Legal Officer (Dec. 2011 – present), Schwab Funds; Vice President and Assistant Clerk (Apr. 2011 – present), Laudus Funds; Secretary (May 2011 – present) and Chief Legal Officer (Nov. 2011 – present), Schwab ETFs. |
| Catherine MacGregor 1964 Vice President and Assistant Secretary, Schwab Funds and Schwab ETFs Chief Legal Officer, Vice President and Clerk, Laudus Funds (Officer of The Charles Schwab Family of Funds, Schwab Investments, Schwab Capital Trust, Schwab Annuity Portfolios and Laudus Trust since 2005; Schwab Strategic Trust since 2009) | Vice President (July 2005 – present), Charles Schwab & Co., Inc.; Vice President (Sept. 2005 – present), Charles Schwab Investment Management, Inc.; Vice President (Dec. 2005 – present) and Chief Legal Officer and Clerk (Mar. 2007 – present), Laudus Funds; Vice President (Nov. 2005 – present) and Assistant Secretary (June 2007 – present), Schwab Funds; Vice President and Assistant Secretary (Oct. 2009 – present), Schwab ETFs. |
| 1 | Each Trustee shall hold office until the election and qualification of his or her successor, or until he or she dies, resigns or is removed. The retirement policy requires that each independent trustee retire by December 31 of the year in which the Trustee turns 74 or the Trustee’s twentieth year of service as an independent trustee on any trust in the Fund Complex, whichever occurs first. |
| 2 | Mr. Bettinger, Mr. de St. Paer and Mr. Martinetto are Interested Trustees. Mr. Bettinger is an Interested Trustee because he owns stock of The Charles Schwab Corporation (CSC), the parent company of Charles Schwab Investment Management, Inc. (CSIM), the investment adviser for the trusts in the Fund Complex, is an employee and director of Charles Schwab & Co., Inc. (CS&Co), the principal underwriter for The Charles Schwab Family of Funds, Schwab Investments, Schwab Capital Trust, Schwab Annuity Portfolios and Laudus Trust, and is a director of CSIM. Mr. de St. Paer is an Interested Trustee because he owns stock of CSC and is an employee and director of CSIM. Mr. Martinetto is an Interested Trustee because he owns stock of CSC and is an employee and director of CS&Co. |
| 3 | The President, Treasurer and Secretary/Clerk hold office until their respective successors are chosen and qualified or until he or she sooner dies, resigns, is removed or becomes disqualified. Each of the other officers serves at the pleasure of the Board. |
Schwab ETFs
Index ETF
Printed on recycled paper.
| * | FUNDAMENTAL INDEX is a registered trademark of Research Affiliates LLC. |
00234522
Table of Contents
Item 2: Code of Ethics.
| (a) | Registrant has adopted a code of ethics that applies to its principal executive officer, principal financial officer, and any other persons who perform a similar function, regardless of whether these individuals are employed by Registrant or a third party. |
| (c) | During the period covered by the report, no amendments were made to the provisions of this code of ethics. |
| (d) | During the period covered by the report, Registrant did not grant any waivers, including implicit waivers, from the provisions of this code of ethics. |
| (f)(1) | Registrant has filed this code of ethics as an exhibit pursuant to Item 12(a)(1) of FormN-CSR. |
Item 3: Audit Committee Financial Expert.
Registrant’s Board of Trustees has determined that Kiran M. Patel and Kimberly S. Patmore, each currently serving on its audit, compliance and valuation committee, are each an “audit committee financial expert,” as such term is defined in Item 3 of FormN-CSR. Each member of Registrant’s audit, compliance and valuation committee is “independent” under the standards set forth in Item 3 of FormN-CSR.
The designation of each of Mr. Patel and Ms. Patmore as an “audit committee financial expert” pursuant to Item 3 of FormN-CSR does not (i) impose upon such individual any duties, obligations, or liability that are greater than the duties, obligations and liability imposed upon such individual as a member of Registrant’s audit, compliance and valuation committee or Board of Trustees in the absence of such designation; and (ii) affect the duties, obligations or liability of any other member of Registrant’s audit, compliance and valuation committee or Board of Trustees.
Item 4: Principal Accountant Fees and Services.
Registrant is composed oftwenty-two series. Eleven series have a fiscalyear-end of August 31, whose annual financial statements are reported in Item 1, seven series have a fiscalyear-end of February 28 and four series have a fiscalyear-end of December 31. Principal
Table of Contents
accountant fees disclosed in Items 4(a)-(d) and 4(g) include fees billed for services rendered to each of thetwenty-two operational series during 2019 and 2018, based on their respective 2019 and 2018 fiscal years, as applicable.
The following table presents fees billed by the principal accountant in each of the last two fiscal years for the services rendered to the Funds:
| (a) Audit Fees | (b) Audit-Related Fees1 | (c) Tax Fees2 | (d) All Other Fees3 | |||||||||||||||||||||||||
Fiscal Year | Fiscal Year 2018 | Fiscal Year 2019 | Fiscal Year 2018 | Fiscal Year 2019 | Fiscal Year 2018 | Fiscal Year 2019 | Fiscal Year 2018 | |||||||||||||||||||||
| $ 517,489 | $ | 504,395 | $ | 0 | $ | 0 | $ | 92,245 | $ | 91,339 | $ | 0 | $ | 0 | ||||||||||||||
| 1 | The nature of the services includes assurance and related services reasonably related to the performance of the audit of financial statements not included in Audit Fees. |
| 2 | The nature of the services includes tax compliance, tax advice and tax planning. |
| 3 | The nature of the services include agreed upon procedures relating to Charles Schwab Investment Management., Inc.’s, (“CSIM”) expenses for purposes of Section 15(c) of the Investment Company Act of 1940. |
(e)(1) Registrant’s audit, compliance and valuation committee does not havepre-approval policies and procedures as described in paragraph (c)(7) of Rule2-01 of RegulationS-X.
(2) There were no services described in each of paragraphs (b) through (d) above (including services required to be approved by Registrant’s audit, compliance and valuation committee pursuant to paragraph (c)(7)(ii) of Rule2-01 of RegulationS-X) that were approved by Registrant’s audit, compliance and valuation committee pursuant to paragraph (c)(7)(i)(C) of Rule2-01 of RegulationS-X.
(f) Not applicable.
(g)Below are the aggregatenon-audit fees billed in each of the last two fiscal years by Registrant’s principal accountant for services rendered to Registrant, to Registrant’s investment adviser, and to any entity controlling, controlled by, or under common control with Registrant’s investment adviser that provides ongoing services to Registrant.
2019: $92,245 | 2018: $91,339 |
Table of Contents
(h)During the past fiscal year, allnon-audit services provided by Registrant’s principal accountant to either Registrant’s investment adviser or to any entity controlling, controlled by, or under common control with Registrant’s investment adviser that provides ongoing services to Registrant werepre-approved. Included in the audit, compliance and valuation committee’spre-approval was the review and consideration as to whether the provision of thesenon-audit services is compatible with maintaining the principal accountant’s independence.
Item 5: Audit Committee of Listed Registrants.
The Registrant is a listed issuer as defined in Rule10A-3 under the Exchange Act and has separately-designated standing audit, compliance and valuation committee established in accordance with Section 3(a)58)(A) of the Exchange Act. The Registrant’s audit, compliance and valuation committee members are Kiran M. Patel, Nancy F. Heller, John F. Cogan and Kimberly S. Patmore.
Item 6: Schedule of Investments.
The condensed schedules of investments are included as part of the report to shareholders filed under Item 1 of this Form. The complete schedules of investments for the Schwab International Equity ETF, Schwab InternationalSmall-Cap Equity ETF, Schwab Emerging Markets Equity ETF, Schwab 1000 Index ETF, Schwab U.S. Broad Market ETF, Schwab U.S.Large-Cap ETF, Schwab U.S.Large-Cap Growth ETF, Schwab U.S.Large-Cap Value ETF, Schwab U.S.Mid-Cap ETF, Schwab U.S.Small-Cap ETF, and Schwab U.S. Dividend Equity ETF are filed under this Item.
Table of Contents
| Security | Number of Shares | Value ($) |
| Common Stock98.8% of net assets | ||
| Australia 6.4% | ||
| Adelaide Brighton Ltd. | 527,099 | 1,097,361 |
| AGL Energy Ltd. | 732,495 | 9,357,111 |
| ALS Ltd. | 513,593 | 2,654,075 |
| Alumina Ltd. | 2,816,402 | 4,117,685 |
| Amcor plc | 1,825,689 | 17,786,639 |
| AMP Ltd. | 3,354,495 | 3,830,854 |
| Ansell Ltd. | 148,038 | 2,717,932 |
| APA Group | 1,344,854 | 9,976,111 |
| Aristocrat Leisure Ltd. | 712,566 | 14,282,718 |
| ASX Ltd. | 222,240 | 12,923,559 |
| Atlas Arteria Ltd. | 799,685 | 4,579,696 |
| Aurizon Holdings Ltd. | 2,118,984 | 8,437,503 |
| AusNet Services | 2,257,581 | 2,737,881 |
| Australia & New Zealand Banking Group Ltd. | 3,183,024 | 57,345,601 |
| Bank of Queensland Ltd. | 455,658 | 2,815,186 |
| Bendigo & Adelaide Bank Ltd. | 573,138 | 4,317,176 |
| BHP Group Ltd. | 3,316,925 | 81,100,105 |
| BlueScope Steel Ltd. | 600,495 | 5,053,248 |
| Boral Ltd. | 1,271,549 | 3,641,001 |
| Brambles Ltd. | 1,780,438 | 13,555,143 |
| Caltex Australia Ltd. | 277,654 | 4,482,183 |
| Challenger Ltd. | 633,917 | 2,865,852 |
| CIMIC Group Ltd. | 107,122 | 2,237,377 |
| Coca-Cola Amatil Ltd. | 592,877 | 4,342,031 |
| Cochlear Ltd. | 62,943 | 9,244,911 |
| Coles Group Ltd. | 1,275,189 | 11,890,755 |
| Commonwealth Bank of Australia | 1,993,408 | 106,168,789 |
| Computershare Ltd. | 545,631 | 5,653,979 |
| Crown Resorts Ltd. | 418,230 | 3,384,208 |
| CSL Ltd. | 515,171 | 83,605,128 |
| CSR Ltd. | 515,625 | 1,354,869 |
| Dexus | 1,200,180 | 10,431,215 |
| Domino's Pizza Enterprises Ltd. | 70,671 | 2,036,476 |
| Downer EDI Ltd. | 680,859 | 3,536,799 |
| Evolution Mining Ltd. | 1,206,956 | 4,212,307 |
| Flight Centre Travel Group Ltd. | 60,560 | 1,897,715 |
| Fortescue Metals Group Ltd. | 1,804,144 | 9,724,337 |
| Goodman Group | 1,989,356 | 19,461,572 |
| Harvey Norman Holdings Ltd.(a) | 639,967 | 1,888,559 |
| Iluka Resources Ltd. | 456,464 | 2,198,930 |
| Incitec Pivot Ltd. | 1,895,548 | 4,099,573 |
| Insurance Australia Group Ltd. | 2,735,125 | 14,852,892 |
| IOOF Holdings Ltd.(a) | 393,276 | 1,343,396 |
| James Hardie Industries plc | 530,653 | 8,062,244 |
| LendLease Group | 649,689 | 7,467,639 |
| Macquarie Group Ltd. | 345,161 | 28,799,268 |
| Magellan Financial Group Ltd. | 146,084 | 4,994,039 |
| Medibank Pvt Ltd. | 3,140,873 | 7,702,834 |
| Metcash Ltd. | 1,151,490 | 2,249,868 |
| Mirvac Group | 4,372,786 | 9,398,265 |
| National Australia Bank Ltd. | 3,152,558 | 58,113,626 |
| Newcrest Mining Ltd. | 866,623 | 21,603,829 |
| Northern Star Resources Ltd. | 686,905 | 5,507,347 |
| Oil Search Ltd. | 1,540,436 | 6,891,449 |
| Orica Ltd. | 445,101 | 6,456,563 |
| Security | Number of Shares | Value ($) |
| Origin Energy Ltd. | 1,982,261 | 10,190,234 |
| Orora Ltd. | 1,520,714 | 2,858,581 |
| OZ Minerals Ltd. | 337,938 | 2,083,324 |
| Perpetual Ltd. | 48,403 | 1,159,340 |
| Platinum Asset Management Ltd. | 610,661 | 1,575,788 |
| Qantas Airways Ltd. | 685,001 | 2,819,884 |
| QBE Insurance Group Ltd. | 1,477,508 | 12,473,252 |
| Qube Holdings Ltd. | 1,449,616 | 3,135,139 |
| Ramsay Health Care Ltd. | 148,543 | 6,569,307 |
| REA Group Ltd. | 57,374 | 4,039,911 |
| Rio Tinto Ltd. | 414,776 | 24,474,699 |
| Santos Ltd. | 2,053,013 | 9,972,999 |
| Scentre Group | 5,691,219 | 15,491,214 |
| SEEK Ltd. | 432,175 | 5,919,647 |
| Seven Group Holdings Ltd. | 149,587 | 1,677,050 |
| Shopping Centres Australasia Property Group | 1,095,603 | 1,941,368 |
| Sims Metal Management Ltd. | 166,825 | 1,291,457 |
| Sonic Healthcare Ltd. | 545,184 | 10,817,507 |
| South32 Ltd. | 5,718,540 | 10,171,567 |
| Stockland | 2,651,964 | 8,076,159 |
| Suncorp Group Ltd. | 1,496,412 | 13,923,347 |
| Sydney Airport | 1,189,237 | 6,754,525 |
| Tabcorp Holdings Ltd. | 2,127,144 | 6,750,199 |
| Telstra Corp., Ltd. | 5,047,018 | 12,649,594 |
| The GPT Group | 2,089,642 | 8,996,458 |
| The Star Entertainment Grp Ltd. | 953,370 | 2,639,989 |
| TPG Telecom Ltd. | 408,523 | 1,833,114 |
| Transurban Group | 3,022,177 | 30,441,068 |
| Treasury Wine Estates Ltd. | 842,655 | 10,639,426 |
| Vicinity Centres | 3,601,426 | 6,284,534 |
| Vocus Group Ltd. * | 661,538 | 1,444,104 |
| Washington H Soul Pattinson & Co., Ltd. | 99,610 | 1,401,975 |
| Wesfarmers Ltd. | 1,263,987 | 33,298,001 |
| Westpac Banking Corp. | 3,881,836 | 73,806,224 |
| Whitehaven Coal Ltd. | 798,463 | 1,845,218 |
| WiseTech Global Ltd. | 86,427 | 2,150,441 |
| Woodside Petroleum Ltd. | 1,053,080 | 22,796,642 |
| Woolworths Group Ltd. | 1,412,057 | 35,933,375 |
| WorleyParsons Ltd. | 387,650 | 3,209,892 |
| Xero Ltd. * | 106,494 | 4,553,994 |
| 1,158,577,956 | ||
| Austria 0.2% | ||
| ANDRITZ AG | 80,674 | 2,846,505 |
| Erste Group Bank AG * | 318,452 | 10,264,851 |
| OMV AG | 173,884 | 8,887,040 |
| Raiffeisen Bank International AG | 148,021 | 3,241,417 |
| Telekom Austria AG * | 177,044 | 1,358,939 |
| Verbund AG | 72,707 | 4,335,714 |
| Vienna Insurance Group AG Wiener Versicherung Gruppe | 40,743 | 1,005,048 |
| voestalpine AG | 131,364 | 3,030,723 |
| 34,970,237 | ||
| Belgium 0.9% | ||
| Ackermans & van Haaren N.V. | 24,575 | 3,561,520 |
| Ageas | 210,062 | 11,265,809 |
| Security | Number of Shares | Value ($) |
| Anheuser-Busch InBev S.A. | 866,107 | 82,217,591 |
| Colruyt S.A. | 55,281 | 2,835,098 |
| Groupe Bruxelles Lambert S.A. | 84,139 | 7,872,230 |
| KBC Groep N.V. | 305,796 | 17,726,933 |
| Proximus SADP | 159,521 | 4,723,834 |
| Sofina S.A. | 17,775 | 3,437,321 |
| Solvay S.A. | 76,581 | 7,735,190 |
| Telenet Group Holding N.V. | 55,171 | 2,754,725 |
| UCB S.A. | 137,560 | 10,292,092 |
| Umicore S.A. | 231,881 | 7,397,749 |
| 161,820,092 | ||
| Canada 8.0% | ||
| Agnico Eagle Mines Ltd. | 265,795 | 16,650,192 |
| Alimentation Couche-Tard, Inc., B Shares | 482,350 | 30,419,123 |
| Bank of Montreal | 715,272 | 49,123,813 |
| Barrick Gold Corp. | 1,953,225 | 37,938,544 |
| Bausch Health Cos., Inc. * | 399,480 | 8,528,934 |
| BCE, Inc. | 339,151 | 16,079,555 |
| Brookfield Asset Management, Inc., Class A | 949,297 | 49,050,822 |
| Canadian Imperial Bank of Commerce | 500,519 | 38,845,970 |
| Canadian National Railway Co. | 813,602 | 75,065,928 |
| Canadian Natural Resources Ltd. | 1,324,436 | 31,705,531 |
| Canadian Pacific Railway Ltd. | 158,912 | 38,337,161 |
| Canadian Tire Corp., Ltd., Class A | 65,300 | 6,608,627 |
| Canadian Utilities Ltd., Class A | 130,502 | 3,776,190 |
| Cenovus Energy, Inc. | 1,165,259 | 10,189,878 |
| CGI, Inc. * | 272,938 | 21,448,063 |
| Constellation Software, Inc. | 22,458 | 21,915,648 |
| Dollarama, Inc. | 353,868 | 13,568,313 |
| Enbridge, Inc. | 2,222,316 | 74,473,007 |
| Encana Corp. | 2,316,563 | 10,285,763 |
| Fairfax Financial Holdings Ltd. | 31,039 | 13,857,531 |
| Fortis, Inc. | 473,287 | 19,579,008 |
| Franco-Nevada Corp. | 206,043 | 20,167,032 |
| George Weston Ltd. | 78,265 | 6,371,106 |
| Great-West Lifeco, Inc. | 297,374 | 6,351,200 |
| Husky Energy, Inc. | 332,883 | 2,227,069 |
| Hydro One Ltd. | 363,094 | 6,743,799 |
| IGM Financial, Inc. | 90,402 | 2,446,460 |
| Imperial Oil Ltd. | 276,936 | 6,808,774 |
| Intact Financial Corp. | 155,330 | 15,210,370 |
| Inter Pipeline Ltd. | 476,362 | 8,704,146 |
| Loblaw Cos. Ltd. | 212,743 | 11,666,603 |
| Magna International, Inc. | 346,054 | 17,359,994 |
| Manulife Financial Corp. | 2,228,846 | 37,052,384 |
| Metro, Inc. | 267,073 | 11,353,818 |
| National Bank of Canada | 393,421 | 18,510,446 |
| Nutrien Ltd. | 662,382 | 33,423,174 |
| Pembina Pipeline Corp. | 555,578 | 20,378,440 |
| Power Corp. of Canada | 402,954 | 8,512,130 |
| Power Financial Corp. | 254,981 | 5,447,705 |
| Restaurant Brands International, Inc. | 268,335 | 21,084,330 |
| RioCan Real Estate Investment Trust | 348,028 | 6,935,416 |
| Rogers Communications, Inc., B Shares | 413,907 | 20,530,261 |
| Royal Bank of Canada | 1,638,833 | 122,813,810 |
| Saputo, Inc. | 244,789 | 7,372,408 |
| Shaw Communications, Inc., B Shares | 523,304 | 9,963,570 |
| Shopify, Inc., Class A * | 112,103 | 43,263,592 |
| SNC-Lavalin Group, Inc. | 201,839 | 2,492,608 |
| Sun Life Financial, Inc. | 676,889 | 27,797,887 |
| Suncor Energy, Inc. | 1,763,296 | 51,672,747 |
| TC Energy Corp. | 1,038,086 | 53,294,873 |
| Teck Resources Ltd., Class B | 593,270 | 10,121,486 |
| TELUS Corp. | 210,839 | 7,652,593 |
| Security | Number of Shares | Value ($) |
| The Bank of Nova Scotia | 1,383,170 | 73,696,896 |
| The Toronto-Dominion Bank | 2,072,619 | 112,615,211 |
| Thomson Reuters Corp. | 220,070 | 15,152,171 |
| Waste Connections, Inc. | 297,108 | 27,345,205 |
| Wheaton Precious Metals Corp. | 503,478 | 14,837,597 |
| 1,454,824,912 | ||
| Denmark 1.5% | ||
| Ambu A/S, Class B(a) | 186,455 | 3,194,514 |
| AP Moller - Maersk A/S, A Shares | 4,974 | 4,962,539 |
| AP Moller - Maersk A/S, B Shares | 7,667 | 8,173,634 |
| Carlsberg A/S, B Shares | 118,729 | 17,562,268 |
| Chr Hansen Holding A/S | 117,769 | 9,914,680 |
| Coloplast A/S, B Shares | 148,486 | 17,720,245 |
| Danske Bank A/S | 743,510 | 9,795,453 |
| Demant A/S * | 114,619 | 3,478,895 |
| DSV A/S | 232,700 | 23,109,840 |
| Genmab A/S * | 62,549 | 12,790,460 |
| GN Store Nord A/S | 141,063 | 5,917,037 |
| H. Lundbeck A/S | 86,400 | 3,151,981 |
| ISS A/S | 208,213 | 5,294,046 |
| Jyske Bank A/S * | 78,130 | 2,195,985 |
| Novo Nordisk A/S, B Shares | 1,861,306 | 96,850,811 |
| Novozymes A/S, B Shares | 232,133 | 9,918,778 |
| Orsted A/S | 166,319 | 15,913,131 |
| Pandora A/S | 98,644 | 4,210,575 |
| Rockwool International A/S, B Shares | 6,425 | 1,255,468 |
| The Drilling Co. of 1972 A/S * | 24,820 | 1,367,362 |
| Tryg A/S | 135,868 | 4,069,659 |
| Vestas Wind Systems A/S | 225,990 | 16,639,000 |
| 277,486,361 | ||
| Finland 1.0% | ||
| Elisa Oyj | 159,678 | 8,046,686 |
| Fortum Oyj | 496,561 | 10,942,225 |
| Huhtamaki Oyj | 101,959 | 3,943,356 |
| Kesko Oyj, B Shares | 78,003 | 4,918,680 |
| Kone Oyj, B Shares | 434,647 | 25,177,254 |
| Metso Oyj | 115,577 | 4,337,674 |
| Neste Oyj | 473,678 | 14,939,710 |
| Nokia Oyj | 6,357,689 | 31,502,823 |
| Nokian Renkaat Oyj * | 149,656 | 4,103,736 |
| Nordea Bank Abp | 3,643,479 | 22,762,239 |
| Orion Oyj, Class B | 115,823 | 4,307,366 |
| Sampo Oyj, A Shares | 553,885 | 22,044,167 |
| Stora Enso Oyj, R Shares | 670,559 | 7,510,068 |
| UPM-Kymmene Oyj | 591,861 | 15,981,816 |
| Wartsila Oyj Abp | 512,882 | 6,300,470 |
| 186,818,270 | ||
| France 9.3% | ||
| Accor S.A. | 225,673 | 9,756,989 |
| Aeroports de Paris | 30,688 | 5,309,220 |
| Air France-KLM * | 238,628 | 2,692,274 |
| Air Liquide S.A. | 474,536 | 66,185,110 |
| Airbus SE | 618,214 | 85,332,498 |
| ALD S.A. | 89,625 | 1,344,288 |
| Alstom S.A. | 178,593 | 7,644,778 |
| Amundi S.A. | 68,574 | 4,391,320 |
| Arkema S.A. | 84,460 | 7,418,603 |
| Atos SE | 107,088 | 8,123,064 |
| AXA S.A. | 2,193,679 | 50,417,518 |
| BioMerieux | 44,674 | 3,638,136 |
| BNP Paribas S.A. | 1,220,438 | 55,151,343 |
| Bollore S.A. | 1,073,435 | 4,565,349 |
| Security | Number of Shares | Value ($) |
| Bouygues S.A. | 249,747 | 9,502,421 |
| Bureau Veritas S.A. | 309,322 | 7,412,345 |
| Capgemini SE | 172,894 | 20,782,108 |
| Carrefour S.A. | 627,083 | 10,703,915 |
| Casino Guichard Perrachon S.A.(a) | 65,758 | 2,773,533 |
| Cie de Saint-Gobain | 556,106 | 20,099,354 |
| Cie Generale des Etablissements Michelin S.C.A. | 197,786 | 20,822,812 |
| Cie Plastic Omnium S.A. | 77,383 | 1,878,205 |
| CNP Assurances | 181,299 | 3,298,309 |
| Covivio | 51,267 | 5,465,114 |
| Credit Agricole S.A. | 1,313,935 | 15,034,028 |
| Danone S.A. | 669,190 | 60,031,581 |
| Dassault Aviation S.A. | 2,723 | 3,880,323 |
| Dassault Systemes SE | 146,471 | 20,670,748 |
| Edenred | 269,005 | 13,123,510 |
| Eiffage S.A. | 86,687 | 8,996,533 |
| Electricite de France S.A. | 549,475 | 6,695,535 |
| Elis S.A. | 220,852 | 3,935,191 |
| Engie S.A. | 1,855,706 | 28,252,719 |
| EssilorLuxottica S.A. | 331,945 | 49,075,684 |
| Eurazeo SE | 56,883 | 3,767,941 |
| Eurofins Scientific SE | 12,652 | 5,801,708 |
| Eutelsat Communications S.A. | 227,644 | 3,965,963 |
| Faurecia SE | 82,737 | 3,621,786 |
| Gecina S.A. | 58,672 | 9,317,128 |
| Getlink SE | 514,653 | 7,254,549 |
| Hermes International | 34,657 | 23,701,100 |
| ICADE | 35,913 | 3,181,732 |
| Iliad S.A. | 27,517 | 2,886,067 |
| Imerys S.A. | 41,195 | 1,683,078 |
| Ingenico Group S.A. | 69,162 | 6,870,052 |
| Ipsen S.A. | 38,215 | 4,023,256 |
| JCDecaux S.A. | 84,041 | 2,250,820 |
| Kering S.A. | 83,237 | 40,369,155 |
| Klepierre S.A. | 223,194 | 6,823,197 |
| L'Oreal S.A. | 270,229 | 73,980,798 |
| Lagardere S.C.A. | 142,959 | 3,049,489 |
| Legrand S.A. | 303,397 | 21,456,927 |
| LVMH Moet Hennessy Louis Vuitton SE | 280,766 | 112,051,748 |
| Natixis S.A. | 915,307 | 3,550,112 |
| Orange S.A. | 2,159,385 | 32,816,714 |
| Orpea | 49,549 | 6,264,158 |
| Pernod-Ricard S.A. | 236,975 | 45,330,268 |
| Peugeot S.A. | 607,549 | 13,602,058 |
| Publicis Groupe S.A. | 234,429 | 11,261,155 |
| Remy Cointreau S.A. | 28,903 | 4,373,364 |
| Renault S.A. | 206,450 | 11,858,736 |
| Rexel S.A. | 402,109 | 4,273,238 |
| Rubis S.C.A. | 97,757 | 5,662,648 |
| Safran S.A. | 369,481 | 53,770,641 |
| Sanofi | 1,219,089 | 104,877,803 |
| Sartorius Stedim Biotech | 28,003 | 4,342,033 |
| Schneider Electric SE | 587,973 | 49,314,002 |
| SCOR SE | 168,904 | 6,750,141 |
| SEB S.A. | 30,189 | 4,704,258 |
| SES S.A. | 386,282 | 6,234,135 |
| Societe BIC S.A. | 30,429 | 1,946,927 |
| Societe Generale S.A. | 822,825 | 20,890,967 |
| Sodexo S.A. | 95,939 | 10,892,806 |
| STMicroelectronics N.V. | 703,828 | 12,498,336 |
| Suez | 412,625 | 6,418,446 |
| TechnipFMC plc | 518,600 | 12,872,780 |
| Teleperformance | 64,244 | 14,050,693 |
| Thales S.A. | 118,029 | 13,667,338 |
| Total S.A. | 2,710,428 | 135,482,746 |
| Ubisoft Entertainment S.A. * | 94,978 | 7,673,054 |
| Valeo S.A. | 273,207 | 7,473,591 |
| Security | Number of Shares | Value ($) |
| Veolia Environnement S.A. | 555,762 | 13,311,716 |
| Vinci S.A. | 521,246 | 57,115,206 |
| Vivendi S.A. | 1,097,414 | 30,732,847 |
| Wendel S.A. | 34,053 | 4,781,361 |
| Worldline S.A. * | 96,439 | 6,669,577 |
| 1,685,924,807 | ||
| Germany 7.0% | ||
| 1&1 Drillisch AG | 45,557 | 1,252,234 |
| adidas AG | 219,479 | 65,186,828 |
| Allianz SE | 472,934 | 104,424,126 |
| Aroundtown S.A. | 808,260 | 6,734,469 |
| Axel Springer SE * | 49,986 | 3,440,443 |
| BASF SE | 1,028,232 | 68,144,252 |
| Bayer AG | 1,050,852 | 77,929,269 |
| Bayerische Motoren Werke AG | 353,914 | 23,700,564 |
| Beiersdorf AG | 113,136 | 14,265,672 |
| Brenntag AG | 179,146 | 8,646,981 |
| Carl Zeiss Meditec AG | 38,856 | 4,488,689 |
| Commerzbank AG | 1,208,959 | 6,868,518 |
| Continental AG | 124,222 | 15,015,111 |
| Covestro AG | 196,696 | 8,922,227 |
| Daimler AG | 970,149 | 45,625,023 |
| Delivery Hero SE * | 126,757 | 6,415,609 |
| Deutsche Bank AG | 2,283,604 | 16,527,390 |
| Deutsche Boerse AG | 207,631 | 30,582,425 |
| Deutsche Lufthansa AG | 264,825 | 4,077,107 |
| Deutsche Post AG | 1,102,497 | 36,302,333 |
| Deutsche Telekom AG | 3,617,574 | 60,458,960 |
| Deutsche Wohnen SE | 400,226 | 14,218,559 |
| DWS Group GmbH & Co. KGaA | 39,991 | 1,157,153 |
| E.ON SE | 2,450,221 | 22,814,177 |
| Evonik Industries AG | 188,408 | 4,809,486 |
| Fielmann AG | 27,655 | 1,971,966 |
| Fraport AG Frankfurt Airport Services Worldwide | 42,913 | 3,590,658 |
| Fresenius Medical Care AG & Co. KGaA | 238,713 | 16,088,421 |
| Fresenius SE & Co. KGaA | 457,560 | 22,251,692 |
| FUCHS PETROLUB SE | 35,560 | 1,223,764 |
| GEA Group AG | 190,411 | 5,143,699 |
| GRENKE AG | 31,500 | 2,556,607 |
| Hannover Rueck SE | 67,422 | 10,751,180 |
| Hapag-Lloyd AG | 30,361 | 2,119,782 |
| HeidelbergCement AG | 166,039 | 11,526,893 |
| Hella GmbH & Co. KGaA | 66,358 | 2,768,147 |
| Henkel AG & Co. KGaA | 113,171 | 10,475,115 |
| HOCHTIEF AG | 20,860 | 2,273,087 |
| HUGO BOSS AG | 71,422 | 3,986,158 |
| Infineon Technologies AG | 1,421,839 | 24,658,222 |
| Innogy SE | 136,934 | 6,829,667 |
| K+S AG | 213,916 | 3,384,035 |
| KION Group AG | 77,430 | 3,751,018 |
| Knorr-Bremse AG | 56,797 | 5,315,929 |
| LANXESS AG | 106,597 | 6,421,230 |
| LEG Immobilien AG | 71,654 | 8,427,478 |
| Merck KGaA | 145,083 | 15,539,489 |
| METRO AG | 200,819 | 3,113,819 |
| MTU Aero Engines AG | 57,715 | 15,781,612 |
| Muenchener Rueckversicherungs-Gesellschaft AG | 157,297 | 37,745,363 |
| OSRAM Licht AG | 93,811 | 3,770,792 |
| ProSiebenSat.1 Media SE | 262,837 | 3,466,155 |
| Puma SE | 88,978 | 6,766,004 |
| QIAGEN N.V. * | 243,781 | 8,486,142 |
| Rational AG | 4,051 | 2,828,378 |
| Rheinmetall AG | 48,991 | 5,788,979 |
| Rocket Internet SE * | 79,818 | 2,227,375 |
| Security | Number of Shares | Value ($) |
| RTL Group S.A. | 48,838 | 2,279,317 |
| RWE AG | 646,215 | 18,438,703 |
| SAP SE | 1,096,823 | 131,175,373 |
| Scout24 AG | 117,971 | 6,989,458 |
| Siemens AG | 849,294 | 85,064,175 |
| Siemens Healthineers AG | 149,539 | 5,880,717 |
| Suedzucker AG | 112,886 | 1,864,736 |
| Symrise AG | 142,015 | 13,280,980 |
| Talanx AG * | 41,989 | 1,742,338 |
| Telefonica Deutschland Holding AG | 824,650 | 2,103,266 |
| ThyssenKrupp AG | 525,106 | 6,427,504 |
| Uniper SE | 238,477 | 7,240,511 |
| United Internet AG | 130,656 | 4,287,771 |
| Volkswagen AG | 35,541 | 5,810,263 |
| Vonovia SE | 588,082 | 29,337,427 |
| Wacker Chemie AG | 14,767 | 1,151,686 |
| Wirecard AG | 127,811 | 20,423,096 |
| Zalando SE * | 146,687 | 7,269,258 |
| 1,263,803,040 | ||
| Hong Kong 3.3% | ||
| AAC Technologies Holdings, Inc. | 925,591 | 4,004,612 |
| AIA Group Ltd. | 13,628,774 | 132,628,921 |
| ASM Pacific Technology Ltd. | 341,707 | 3,918,443 |
| BOC Aviation Ltd. | 253,845 | 2,206,263 |
| BOC Hong Kong Holdings Ltd. | 4,090,604 | 13,808,761 |
| Brightoil Petroleum Holdings Ltd. *(b) | 2,936,732 | — |
| Cafe de Coral Holdings Ltd. | 420,743 | 1,342,451 |
| Cathay Pacific Airways Ltd.(a) | 849,960 | 1,108,641 |
| Champion REIT | 2,083,470 | 1,403,986 |
| China Mengniu Dairy Co., Ltd. * | 3,145,817 | 12,486,348 |
| Chow Tai Fook Jewellery Group Ltd. | 1,114,903 | 946,238 |
| CK Asset Holdings Ltd. | 3,081,140 | 20,939,805 |
| CK Hutchison Holdings Ltd. | 3,030,095 | 26,413,050 |
| CK Infrastructure Holdings Ltd. | 707,204 | 4,770,142 |
| CLP Holdings Ltd. | 1,896,335 | 19,543,358 |
| Dairy Farm International Holdings Ltd. | 354,311 | 2,536,867 |
| First Pacific Co., Ltd. | 2,704,115 | 1,107,827 |
| Galaxy Entertainment Group Ltd. | 2,410,972 | 15,139,058 |
| Great Eagle Holdings Ltd. | 380,451 | 1,408,116 |
| Hang Lung Group Ltd. | 1,101,715 | 2,739,049 |
| Hang Lung Properties Ltd. | 2,422,919 | 5,479,541 |
| Hang Seng Bank Ltd. | 832,304 | 17,378,284 |
| Henderson Land Development Co., Ltd. | 1,539,594 | 7,172,006 |
| Hong Kong & China Gas Co., Ltd. | 11,197,631 | 21,636,830 |
| Hong Kong Exchanges & Clearing Ltd. | 1,419,164 | 43,469,578 |
| Hongkong Land Holdings Ltd. | 1,303,217 | 7,115,565 |
| Hysan Development Co., Ltd. | 734,100 | 2,974,682 |
| Jardine Matheson Holdings Ltd. | 237,748 | 12,926,359 |
| Jardine Strategic Holdings Ltd. | 209,013 | 6,604,811 |
| Kerry Logistics Network Ltd. | 692,155 | 1,072,417 |
| Kerry Properties Ltd. | 801,188 | 2,704,592 |
| Lenovo Group Ltd. | 8,847,232 | 5,826,379 |
| Li & Fung Ltd. | 7,519,143 | 854,083 |
| Link REIT | 2,415,012 | 27,123,365 |
| Melco International Development Ltd. | 930,282 | 2,077,755 |
| MGM China Holdings Ltd. | 936,523 | 1,403,228 |
| Minth Group Ltd. | 761,043 | 2,306,824 |
| MMG Ltd. * | 2,861,412 | 591,612 |
| MTR Corp. Ltd. | 1,674,968 | 9,705,188 |
| NagaCorp Ltd. | 1,980,224 | 2,780,024 |
| New World Development Co., Ltd. | 6,558,855 | 8,186,693 |
| Nexteer Automotive Group Ltd. | 945,484 | 734,874 |
| NWS Holdings Ltd. | 1,660,566 | 2,861,090 |
| PCCW Ltd. | 5,117,335 | 2,775,712 |
| Power Assets Holdings Ltd. | 1,577,594 | 10,510,112 |
| PRADA S.p.A. | 577,326 | 1,621,009 |
| Security | Number of Shares | Value ($) |
| Samsonite International S.A. | 1,416,186 | 2,678,614 |
| Sands China Ltd. | 2,722,234 | 12,368,500 |
| Semiconductor Manufacturing International Corp. * | 3,487,859 | 3,837,141 |
| Shangri-La Asia Ltd. | 1,439,919 | 1,505,094 |
| Shui On Land Ltd. | 2,992,895 | 622,617 |
| Shun Tak Holdings Ltd. | 2,414,000 | 862,654 |
| Sino Land Co., Ltd. | 3,615,441 | 5,167,981 |
| SJM Holdings Ltd. | 2,246,640 | 2,124,679 |
| Sun Art Retail Group Ltd. | 2,615,248 | 2,546,707 |
| Sun Hung Kai Properties Ltd. | 1,608,620 | 22,809,151 |
| Swire Pacific Ltd., Class A | 619,261 | 6,065,879 |
| Swire Pacific Ltd., Class B | 824,347 | 1,262,504 |
| Swire Properties Ltd. | 1,217,233 | 4,000,300 |
| Techtronic Industries Co., Ltd. | 1,397,277 | 9,665,479 |
| The Bank of East Asia Ltd. | 1,450,798 | 3,669,883 |
| The Wharf Holdings Ltd. | 1,460,599 | 3,198,821 |
| Tingyi Cayman Islands Holding Corp. | 2,132,333 | 2,939,141 |
| Uni-President China Holdings Ltd. | 1,311,742 | 1,458,170 |
| United Energy Group Ltd. * | 9,936,372 | 1,762,724 |
| Vitasoy International Holdings Ltd. | 954,640 | 4,447,071 |
| VTech Holdings Ltd. | 190,513 | 1,507,502 |
| Want Want China Holdings Ltd. | 6,535,168 | 5,096,119 |
| WH Group Ltd. | 9,425,360 | 7,590,474 |
| Wharf Real Estate Investment Co., Ltd. | 1,381,191 | 7,482,953 |
| Wheelock & Co., Ltd. | 942,914 | 5,481,533 |
| Wynn Macau Ltd. | 1,619,769 | 3,241,461 |
| Xinyi Glass Holdings Ltd. | 2,958,990 | 2,945,640 |
| Xinyi Solar Holdings Ltd. | 3,659,299 | 2,311,770 |
| Yue Yuen Industrial Holdings Ltd. | 842,075 | 2,154,799 |
| 607,149,910 | ||
| Ireland 0.2% | ||
| AIB Group plc | 851,084 | 2,157,564 |
| Bank of Ireland Group plc | 1,025,680 | 3,910,433 |
| Glanbia plc | 230,450 | 2,531,486 |
| Kerry Group plc, A Shares | 162,021 | 19,323,496 |
| Kingspan Group plc | 165,944 | 7,591,262 |
| 35,514,241 | ||
| Israel 0.4% | ||
| Airport City Ltd. * | 77,386 | 1,482,076 |
| Alony Hetz Properties & Investments Ltd. | 117,048 | 1,683,741 |
| Amot Investments Ltd. | 141,401 | 994,803 |
| Azrieli Group Ltd. | 40,333 | 3,008,911 |
| Bank Hapoalim B.M. * | 1,270,327 | 9,318,550 |
| Bank Leumi Le-Israel | 1,681,553 | 11,468,327 |
| Bezeq The Israeli Telecommunication Corp., Ltd. | 2,602,790 | 1,636,534 |
| Delek Group Ltd. | 6,911 | 970,858 |
| Elbit Systems Ltd. | 25,238 | 3,897,835 |
| First International Bank of Israel Ltd. * | 58,871 | 1,525,652 |
| Gazit-Globe Ltd. | 107,538 | 1,062,664 |
| Harel Insurance Investments & Financial Services Ltd. | 163,331 | 1,271,676 |
| Israel Chemicals Ltd. | 779,879 | 3,520,858 |
| Israel Discount Bank Ltd., A Shares | 1,314,939 | 5,478,368 |
| Melisron Ltd. | 18,471 | 1,144,122 |
| Mizrahi Tefahot Bank Ltd. | 173,023 | 3,984,074 |
| Nice Ltd. * | 70,887 | 10,851,639 |
| Oil Refineries Ltd. * | 1,825,771 | 905,452 |
| Paz Oil Co., Ltd. | 10,610 | 1,409,358 |
| Phoenix Holdings Ltd. | 152,201 | 922,927 |
| Shufersal Ltd. | 139,364 | 943,369 |
| Strauss Group Ltd. | 43,029 | 1,275,971 |
| Teva Pharmaceutical Industries Ltd. * | 1,089,423 | 7,775,532 |
| Security | Number of Shares | Value ($) |
| The Israel Corp., Ltd. * | 3,246 | 627,182 |
| Tower Semiconductor Ltd. * | 108,902 | 2,065,614 |
| 79,226,093 | ||
| Italy 2.1% | ||
| A2A S.p.A. | 1,755,131 | 3,090,608 |
| Assicurazioni Generali S.p.A. | 1,421,570 | 25,783,851 |
| Atlantia S.p.A. | 592,280 | 14,460,346 |
| Banca Mediolanum S.p.A. | 356,668 | 2,584,497 |
| Banco BPM S.p.A. * | 1,703,356 | 3,431,814 |
| Buzzi Unicem S.p.A. | 108,675 | 2,284,061 |
| CNH Industrial N.V. | 1,127,838 | 11,612,996 |
| Davide Campari-Milano S.p.A. | 605,543 | 5,684,932 |
| DiaSorin S.p.A. | 25,348 | 3,006,390 |
| Enel S.p.A. | 8,815,409 | 64,014,350 |
| Eni S.p.A. | 2,793,809 | 42,089,013 |
| EXOR N.V. | 116,714 | 7,904,675 |
| Ferrari N.V. | 139,831 | 22,051,209 |
| Fiat Chrysler Automobiles N.V. | 1,258,734 | 16,409,609 |
| FinecoBank Banca Fineco S.p.A. | 742,649 | 7,669,724 |
| Hera S.p.A. | 875,817 | 3,499,182 |
| Intesa Sanpaolo S.p.A. | 16,957,615 | 37,222,161 |
| Italgas S.p.A. | 531,580 | 3,453,875 |
| Leonardo S.p.A. | 470,070 | 5,761,607 |
| Mediaset S.p.A. * | 380,625 | 1,169,466 |
| Mediobanca Banca di Credito Finanziario S.p.A. | 834,281 | 8,277,955 |
| Moncler S.p.A. | 204,826 | 7,689,499 |
| Pirelli & C S.p.A. | 489,373 | 2,546,407 |
| Poste Italiane S.p.A. | 514,993 | 5,542,054 |
| Prysmian S.p.A. | 294,449 | 6,454,435 |
| Recordati S.p.A. | 107,599 | 4,723,147 |
| Saipem S.p.A. * | 638,977 | 3,042,684 |
| Salvatore Ferragamo Italia S.p.A. | 76,862 | 1,470,271 |
| Snam S.p.A. | 2,591,106 | 13,123,042 |
| Telecom Italia S.p.A. * | 11,695,303 | 6,238,807 |
| Tenaris S.A. | 503,236 | 5,494,226 |
| Terna Rete Elettrica Nazionale S.p.A. | 1,611,170 | 10,131,259 |
| UniCredit S.p.A. | 2,520,378 | 27,922,197 |
| Unione di Banche Italiane S.p.A. | 1,109,417 | 2,834,450 |
| UnipolSai Assicurazioni S.p.A. | 699,531 | 1,774,906 |
| 390,449,705 | ||
| Japan 22.3% | ||
| ABC-Mart, Inc. | 28,443 | 1,819,473 |
| Acom Co., Ltd. | 484,944 | 1,713,260 |
| Advantest Corp. | 235,804 | 9,696,966 |
| Aeon Co., Ltd. | 801,541 | 14,226,796 |
| AEON Financial Service Co., Ltd. | 122,899 | 1,801,600 |
| Aeon Mall Co., Ltd. | 127,561 | 2,008,144 |
| AGC, Inc. | 204,859 | 5,915,425 |
| Aica Kogyo Co., Ltd. | 59,237 | 1,693,761 |
| Ain Holdings, Inc. | 27,652 | 1,495,336 |
| Air Water, Inc. | 172,782 | 2,938,165 |
| Aisin Seiki Co., Ltd. | 191,160 | 5,672,938 |
| Ajinomoto Co., Inc. | 538,925 | 9,834,639 |
| Alfresa Holdings Corp. | 191,644 | 4,342,209 |
| Alps Alpine Co., Ltd. | 216,618 | 3,785,637 |
| Amada Holdings Co., Ltd. | 384,678 | 4,011,857 |
| ANA Holdings, Inc. | 120,054 | 4,107,929 |
| Aoyama Trading Co., Ltd. | 61,374 | 1,087,033 |
| Aozora Bank Ltd. | 131,374 | 3,038,515 |
| Ariake Japan Co., Ltd. | 22,113 | 1,677,042 |
| Asahi Group Holdings Ltd. | 435,921 | 20,353,521 |
| Asahi Intecc Co., Ltd. | 202,734 | 4,534,274 |
| Asahi Kasei Corp. | 1,439,230 | 13,033,001 |
| Security | Number of Shares | Value ($) |
| Asics Corp. | 212,350 | 2,744,776 |
| Astellas Pharma, Inc. | 2,130,731 | 29,548,599 |
| Autobacs Seven Co., Ltd. | 79,695 | 1,336,446 |
| Azbil Corp. | 166,464 | 4,250,011 |
| Bandai Namco Holdings, Inc. | 225,747 | 13,292,371 |
| Benefit One, Inc. | 65,418 | 1,058,201 |
| Benesse Holdings, Inc. | 74,210 | 1,900,257 |
| Bic Camera, Inc. | 169,477 | 1,681,278 |
| Bridgestone Corp. | 677,040 | 25,851,836 |
| Brother Industries Ltd. | 262,769 | 4,555,042 |
| Calbee, Inc. | 82,566 | 2,520,268 |
| Canon Marketing Japan, Inc. | 96,978 | 1,977,110 |
| Canon, Inc. | 1,160,116 | 30,176,459 |
| Capcom Co., Ltd. | 97,911 | 2,552,355 |
| Casio Computer Co., Ltd. | 239,160 | 3,341,413 |
| Central Japan Railway Co. | 207,269 | 41,035,923 |
| Chubu Electric Power Co., Inc. | 780,547 | 11,519,402 |
| Chugai Pharmaceutical Co., Ltd. | 248,010 | 17,757,558 |
| Citizen Watch Co., Ltd. | 303,743 | 1,385,007 |
| Coca-Cola Bottlers Japan Holdings, Inc. | 160,855 | 3,500,636 |
| COMSYS Holdings Corp. | 129,742 | 3,673,039 |
| Concordia Financial Group Ltd. | 1,296,976 | 4,459,901 |
| Cosmo Energy Holdings Co., Ltd. | 65,542 | 1,188,641 |
| Cosmos Pharmaceutical Corp. | 8,749 | 1,786,974 |
| Credit Saison Co., Ltd. | 180,366 | 2,008,504 |
| CyberAgent, Inc. | 107,990 | 4,873,259 |
| Dai Nippon Printing Co., Ltd. | 329,712 | 7,141,249 |
| Dai-ichi Life Holdings, Inc. | 1,244,372 | 16,975,370 |
| Daicel Corp. | 312,230 | 2,415,006 |
| Daido Steel Co., Ltd. | 42,874 | 1,609,618 |
| Daifuku Co., Ltd. | 112,443 | 5,317,856 |
| Daiichi Sankyo Co., Ltd. | 720,131 | 47,612,976 |
| Daiichikosho Co., Ltd. | 51,668 | 2,331,619 |
| Daikin Industries Ltd. | 297,059 | 36,815,782 |
| Daishi Hokuetsu Financial Group, Inc. | 45,755 | 1,084,550 |
| Daito Trust Construction Co., Ltd. | 74,715 | 9,629,292 |
| Daiwa House Industry Co., Ltd. | 725,831 | 22,784,577 |
| Daiwa Securities Group, Inc. | 1,744,000 | 7,521,816 |
| DeNA Co., Ltd. | 131,807 | 2,785,276 |
| Denka Co., Ltd. | 106,726 | 2,786,167 |
| Denso Corp. | 530,388 | 22,275,846 |
| Dentsu, Inc. | 254,818 | 8,714,394 |
| DIC Corp. | 87,149 | 2,305,473 |
| Disco Corp. | 30,784 | 5,597,355 |
| DMG Mori Co., Ltd. | 112,979 | 1,533,777 |
| Dowa Holdings Co., Ltd. | 53,211 | 1,704,436 |
| East Japan Railway Co. | 406,413 | 38,728,791 |
| Ebara Corp. | 107,107 | 2,545,866 |
| Eisai Co., Ltd. | 300,941 | 15,395,069 |
| Electric Power Development Co., Ltd. | 192,096 | 4,455,607 |
| Ezaki Glico Co., Ltd. | 61,886 | 2,687,781 |
| FamilyMart UNY Holdings Co., Ltd. | 276,313 | 6,377,755 |
| Fancl Corp. | 75,444 | 1,833,770 |
| FANUC Corp. | 218,566 | 38,001,183 |
| Fast Retailing Co., Ltd. | 57,649 | 33,803,512 |
| FP Corp. | 25,096 | 1,652,655 |
| Fuji Electric Co., Ltd. | 135,546 | 3,869,277 |
| Fuji Oil Holdings, Inc. | 52,224 | 1,454,862 |
| Fuji Seal International, Inc. | 40,163 | 1,092,758 |
| FUJIFILM Holdings Corp. | 400,208 | 17,151,502 |
| Fujikura Ltd. | 351,977 | 1,120,809 |
| Fujitsu General Ltd. | 66,081 | 1,064,567 |
| Fujitsu Ltd. | 223,209 | 17,249,832 |
| Fukuoka Financial Group, Inc. | 182,543 | 3,143,705 |
| Fukuyama Transporting Co., Ltd. | 43,209 | 1,498,037 |
| Furukawa Electric Co., Ltd. | 71,593 | 1,568,173 |
| Fuyo General Lease Co., Ltd. | 22,109 | 1,270,572 |
| Glory Ltd. | 63,856 | 1,755,446 |
| Security | Number of Shares | Value ($) |
| GMO internet, Inc. | 62,840 | 1,104,118 |
| GMO Payment Gateway, Inc. | 47,982 | 3,720,306 |
| Goldwin, Inc. | 23,372 | 3,230,178 |
| GS Yuasa Corp. | 86,444 | 1,449,624 |
| GungHo Online Entertainment, Inc. | 34,710 | 789,391 |
| H2O Retailing Corp. | 88,535 | 930,016 |
| Hakuhodo DY Holdings, Inc. | 284,392 | 4,203,788 |
| Hamamatsu Photonics K.K. | 148,419 | 5,131,638 |
| Hankyu Hanshin Holdings, Inc. | 258,440 | 9,800,000 |
| Haseko Corp. | 314,191 | 3,377,379 |
| Heiwa Corp. | 57,593 | 1,161,681 |
| Hikari Tsushin, Inc. | 25,850 | 6,064,016 |
| Hino Motors Ltd. | 294,765 | 2,321,575 |
| Hirose Electric Co., Ltd. | 37,647 | 4,280,930 |
| Hisamitsu Pharmaceutical Co., Inc. | 76,687 | 3,106,638 |
| Hitachi Capital Corp. | 56,915 | 1,136,745 |
| Hitachi Chemical Co., Ltd. | 104,291 | 3,262,011 |
| Hitachi Construction Machinery Co., Ltd. | 125,046 | 2,674,214 |
| Hitachi High-Technologies Corp. | 67,548 | 3,652,791 |
| Hitachi Ltd. | 1,039,613 | 35,543,413 |
| Hitachi Metals Ltd. | 207,639 | 2,237,873 |
| Hitachi Transport System Ltd. | 49,850 | 1,563,903 |
| Hokkaido Electric Power Co., Inc. | 201,230 | 1,021,838 |
| Hokuhoku Financial Group, Inc. | 158,675 | 1,464,991 |
| Hokuriku Electric Power Co. * | 174,748 | 1,099,738 |
| Honda Motor Co., Ltd. | 1,954,297 | 46,461,618 |
| Horiba Ltd. | 39,236 | 2,018,263 |
| Hoshizaki Corp. | 60,901 | 4,383,472 |
| House Foods Group, Inc. | 81,534 | 3,110,959 |
| Hoya Corp. | 415,822 | 33,882,373 |
| Hulic Co., Ltd. | 418,885 | 4,001,596 |
| Ibiden Co., Ltd. | 116,658 | 2,267,327 |
| Ichigo, Inc. | 266,100 | 1,072,974 |
| Idemitsu Kosan Co., Ltd. | 272,425 | 7,327,461 |
| IHI Corp. | 145,984 | 2,845,550 |
| Iida Group Holdings Co., Ltd. | 153,811 | 2,396,753 |
| Inpex Corp. | 1,045,452 | 9,051,490 |
| Isetan Mitsukoshi Holdings Ltd. | 419,237 | 3,179,479 |
| Isuzu Motors Ltd. | 577,828 | 6,222,219 |
| Ito En Ltd. | 61,734 | 2,823,671 |
| ITOCHU Corp. | 1,554,374 | 31,023,047 |
| Itochu Techno-Solutions Corp. | 114,492 | 3,158,251 |
| Itoham Yonekyu Holdings, Inc. | 163,017 | 1,010,553 |
| Izumi Co., Ltd. | 45,913 | 1,749,664 |
| J Front Retailing Co., Ltd. | 280,397 | 3,175,253 |
| Japan Airlines Co., Ltd. | 132,382 | 4,139,393 |
| Japan Airport Terminal Co., Ltd. | 48,440 | 1,932,671 |
| Japan Exchange Group, Inc. | 606,391 | 9,609,022 |
| Japan Petroleum Exploration Co., Ltd. | 40,726 | 995,657 |
| Japan Post Bank Co., Ltd. | 436,756 | 3,983,040 |
| Japan Post Holdings Co., Ltd. | 1,464,007 | 13,323,574 |
| Japan Post Insurance Co., Ltd. | 214,046 | 3,077,245 |
| Japan Tobacco, Inc. | 1,338,516 | 28,379,389 |
| JFE Holdings, Inc. | 565,650 | 6,626,650 |
| JGC Corp. | 248,150 | 2,887,232 |
| JSR Corp. | 200,938 | 3,290,124 |
| JTEKT Corp. | 253,945 | 2,756,085 |
| JXTG Holdings, Inc. | 3,444,671 | 14,249,894 |
| K's Holdings Corp. | 211,019 | 2,264,361 |
| Kagome Co., Ltd. | 87,230 | 2,204,069 |
| Kajima Corp. | 506,250 | 6,166,859 |
| Kakaku.com, Inc. | 143,019 | 3,585,412 |
| Kaken Pharmaceutical Co., Ltd. | 37,846 | 1,814,840 |
| Kamigumi Co., Ltd. | 121,902 | 2,858,487 |
| Kandenko Co., Ltd. | 123,715 | 1,061,796 |
| Kaneka Corp. | 60,999 | 1,830,344 |
| Kansai Mirai Financial Group, Inc. | 215,049 | 1,399,961 |
| Kansai Paint Co., Ltd. | 226,050 | 4,708,621 |
| Security | Number of Shares | Value ($) |
| Kao Corp. | 533,538 | 38,573,372 |
| Kawasaki Heavy Industries Ltd. | 173,880 | 3,412,238 |
| Kawasaki Kisen Kaisha Ltd. *(a) | 94,981 | 956,566 |
| KDDI Corp. | 1,979,914 | 52,881,023 |
| Keihan Holdings Co., Ltd. | 108,855 | 4,563,613 |
| Keikyu Corp. | 290,156 | 5,325,017 |
| Keio Corp. | 126,803 | 7,932,281 |
| Keisei Electric Railway Co., Ltd. | 150,826 | 5,939,542 |
| Kewpie Corp. | 131,482 | 3,078,174 |
| Keyence Corp. | 101,041 | 59,875,443 |
| Kikkoman Corp. | 206,896 | 9,317,093 |
| Kinden Corp. | 149,825 | 2,194,902 |
| Kintetsu Group Holdings Co., Ltd. | 201,279 | 10,031,239 |
| Kirin Holdings Co., Ltd. | 919,764 | 18,183,850 |
| Kobayashi Pharmaceutical Co., Ltd. | 68,665 | 5,149,309 |
| Kobe Steel Ltd. | 351,444 | 1,834,283 |
| Koei Tecmo Holdings Co., Ltd. | 72,230 | 1,508,634 |
| Koito Manufacturing Co., Ltd. | 129,969 | 6,109,994 |
| Kokuyo Co., Ltd. | 102,102 | 1,363,989 |
| Komatsu Ltd. | 1,025,220 | 21,799,628 |
| Konami Holdings Corp. | 103,555 | 4,697,511 |
| Konica Minolta, Inc. | 567,406 | 4,041,254 |
| Kose Corp. | 34,260 | 5,890,480 |
| Kubota Corp. | 1,244,654 | 17,882,117 |
| Kuraray Co., Ltd. | 385,769 | 4,404,843 |
| Kurita Water Industries Ltd. | 121,791 | 3,170,272 |
| Kusuri no Aoki Holdings Co., Ltd. | 15,003 | 1,153,370 |
| Kyocera Corp. | 348,011 | 20,704,597 |
| Kyoritsu Maintenance Co., Ltd. | 28,662 | 1,134,113 |
| Kyowa Exeo Corp. | 108,742 | 2,622,634 |
| Kyowa Kirin Co., Ltd. | 289,919 | 5,312,473 |
| Kyudenko Corp. | 44,344 | 1,376,546 |
| Kyushu Electric Power Co., Inc. | 513,815 | 5,077,883 |
| Kyushu Financial Group, Inc. | 429,691 | 1,675,935 |
| Kyushu Railway Co. | 176,610 | 5,299,382 |
| Lawson, Inc. | 54,156 | 2,688,795 |
| LINE Corp. * | 53,772 | 1,889,581 |
| Lintec Corp. | 55,645 | 1,080,974 |
| Lion Corp. | 277,125 | 5,391,334 |
| LIXIL Group Corp. | 298,590 | 4,897,501 |
| M3, Inc. | 484,882 | 10,301,087 |
| Mabuchi Motor Co., Ltd. | 65,932 | 2,338,631 |
| Maeda Corp. | 173,883 | 1,405,545 |
| Maeda Road Construction Co., Ltd. | 71,490 | 1,584,775 |
| Makita Corp. | 288,707 | 8,499,782 |
| Marubeni Corp. | 1,748,045 | 11,167,265 |
| Maruha Nichiro Corp. | 48,083 | 1,242,561 |
| Marui Group Co., Ltd. | 227,965 | 4,542,333 |
| Maruichi Steel Tube Ltd. | 71,541 | 1,741,598 |
| Matsui Securities Co., Ltd. | 112,285 | 927,730 |
| Matsumotokiyoshi Holdings Co., Ltd. | 85,052 | 3,157,048 |
| Mazda Motor Corp. | 653,625 | 5,494,034 |
| Mebuki Financial Group, Inc. | 1,231,343 | 2,749,336 |
| Medipal Holdings Corp. | 179,076 | 3,807,759 |
| Megmilk Snow Brand Co., Ltd. | 55,223 | 1,272,036 |
| MEIJI Holdings Co., Ltd. | 150,224 | 10,444,704 |
| MINEBEA MITSUMI, Inc. | 481,178 | 7,439,004 |
| Miraca Holdings, Inc. | 60,230 | 1,329,492 |
| MISUMI Group, Inc. | 325,524 | 7,384,821 |
| Mitsubishi Chemical Holdings Corp. | 1,428,321 | 9,812,348 |
| Mitsubishi Corp. | 1,438,247 | 35,026,318 |
| Mitsubishi Electric Corp. | 2,282,153 | 27,595,679 |
| Mitsubishi Estate Co., Ltd. | 1,321,335 | 25,320,038 |
| Mitsubishi Gas Chemical Co., Inc. | 201,863 | 2,430,458 |
| Mitsubishi Heavy Industries Ltd. | 325,457 | 12,240,090 |
| Mitsubishi Logistics Corp. | 69,373 | 1,702,545 |
| Mitsubishi Materials Corp. | 147,850 | 3,586,733 |
| Mitsubishi Motors Corp. | 701,024 | 2,932,353 |
| Security | Number of Shares | Value ($) |
| Mitsubishi Tanabe Pharma Corp. | 265,697 | 2,938,700 |
| Mitsubishi UFJ Financial Group, Inc. | 13,975,047 | 67,199,246 |
| Mitsubishi UFJ Lease & Finance Co., Ltd. | 520,302 | 2,813,636 |
| Mitsui & Co., Ltd. | 1,912,996 | 29,971,382 |
| Mitsui Chemicals, Inc. | 206,558 | 4,419,362 |
| Mitsui Fudosan Co., Ltd. | 1,057,748 | 25,371,204 |
| Mitsui Mining & Smelting Co., Ltd. | 61,519 | 1,291,873 |
| Mitsui OSK Lines Ltd. | 128,396 | 3,026,490 |
| Miura Co., Ltd. | 103,035 | 2,845,123 |
| Mizuho Financial Group, Inc. | 28,434,253 | 41,441,226 |
| Mochida Pharmaceutical Co., Ltd. | 28,260 | 1,104,894 |
| MonotaRO Co., Ltd. | 134,252 | 3,302,388 |
| Morinaga & Co., Ltd. | 45,661 | 2,258,422 |
| Morinaga Milk Industry Co., Ltd. | 50,576 | 2,091,748 |
| MS&AD Insurance Group Holdings, Inc. | 562,883 | 17,908,106 |
| Murata Manufacturing Co., Ltd. | 646,398 | 27,154,258 |
| Nabtesco Corp. | 129,604 | 3,730,183 |
| Nagase & Co., Ltd. | 138,175 | 1,874,530 |
| Nagoya Railroad Co., Ltd. | 230,055 | 6,859,712 |
| Nankai Electric Railway Co., Ltd. | 117,849 | 3,018,809 |
| NEC Corp. | 283,680 | 12,160,196 |
| Nexon Co., Ltd. * | 472,435 | 6,360,258 |
| NGK Insulators Ltd. | 301,091 | 4,044,993 |
| NGK Spark Plug Co., Ltd. | 229,605 | 3,967,173 |
| NH Foods Ltd. | 114,535 | 4,402,495 |
| NHK Spring Co., Ltd. | 205,324 | 1,460,451 |
| Nichirei Corp. | 124,887 | 2,870,830 |
| Nidec Corp. | 263,222 | 34,358,103 |
| Nifco, Inc. | 97,399 | 2,240,787 |
| Nihon Kohden Corp. | 85,611 | 2,377,702 |
| Nihon M&A Center, Inc. | 148,603 | 4,340,000 |
| Nihon Unisys Ltd. | 75,664 | 2,448,592 |
| Nikon Corp. | 392,580 | 4,863,561 |
| Nintendo Co., Ltd. | 119,908 | 45,514,092 |
| Nippo Corp. | 61,850 | 1,100,125 |
| Nippon Electric Glass Co., Ltd. | 88,501 | 1,838,473 |
| Nippon Express Co., Ltd. | 83,931 | 4,341,054 |
| Nippon Gas Co., Ltd. | 44,173 | 1,342,107 |
| Nippon Kayaku Co., Ltd. | 188,613 | 2,055,916 |
| Nippon Paint Holdings Co., Ltd. | 179,082 | 8,486,339 |
| Nippon Paper Industries Co., Ltd. | 110,775 | 1,840,945 |
| Nippon Shinyaku Co., Ltd. | 59,270 | 4,874,720 |
| Nippon Shokubai Co., Ltd. | 36,212 | 2,098,109 |
| Nippon Steel Corp. | 911,755 | 12,764,312 |
| Nippon Telegraph & Telephone Corp. | 713,063 | 34,234,011 |
| Nippon Yusen K.K. | 184,662 | 2,759,187 |
| Nipro Corp. | 132,812 | 1,397,626 |
| Nishi-Nippon Financial Holdings, Inc. | 167,810 | 1,059,237 |
| Nishi-Nippon Railroad Co., Ltd. | 89,384 | 2,054,708 |
| Nissan Chemical Corp. | 160,442 | 6,794,355 |
| Nissan Motor Co., Ltd. | 2,199,898 | 13,604,155 |
| Nisshin Seifun Group, Inc. | 295,069 | 5,554,175 |
| Nisshinbo Holdings, Inc. | 165,851 | 1,239,058 |
| Nissin Foods Holdings Co., Ltd. | 74,690 | 5,185,975 |
| Nitori Holdings Co., Ltd. | 83,156 | 12,005,895 |
| Nitto Denko Corp. | 173,615 | 8,089,875 |
| Noevir Holdings Co., Ltd. | 19,413 | 976,640 |
| NOF Corp. | 75,558 | 2,452,280 |
| NOK Corp. | 133,475 | 1,849,750 |
| Nomura Holdings, Inc. | 3,747,045 | 15,112,440 |
| Nomura Real Estate Holdings, Inc. | 125,830 | 2,669,642 |
| Nomura Research Institute Ltd. | 355,380 | 7,074,454 |
| NS Solutions Corp. | 41,856 | 1,399,866 |
| NSK Ltd. | 502,027 | 4,029,648 |
| NTN Corp. | 530,845 | 1,410,319 |
| NTT Data Corp. | 694,510 | 8,970,495 |
| NTT DOCOMO, Inc. | 1,317,865 | 33,298,921 |
| Obayashi Corp. | 743,568 | 6,858,100 |
| Security | Number of Shares | Value ($) |
| OBIC Business Consultants Co., Ltd. | 17,042 | 715,268 |
| Obic Co., Ltd. | 75,425 | 8,633,603 |
| Odakyu Electric Railway Co., Ltd. | 337,776 | 7,669,133 |
| Oji Holdings Corp. | 1,008,145 | 4,701,416 |
| OKUMA Corp. | 35,800 | 1,753,827 |
| Olympus Corp. | 1,272,582 | 14,914,428 |
| Omron Corp. | 212,972 | 10,553,796 |
| Ono Pharmaceutical Co., Ltd. | 495,729 | 9,165,464 |
| Open House Co., Ltd. | 35,340 | 1,606,439 |
| Oracle Corp. Japan | 36,326 | 3,131,404 |
| Oriental Land Co., Ltd. | 211,241 | 30,787,115 |
| ORIX Corp. | 1,436,192 | 21,229,311 |
| Osaka Gas Co., Ltd. | 443,542 | 7,947,778 |
| OSG Corp. | 90,380 | 1,712,320 |
| Otsuka Corp. | 108,574 | 4,035,277 |
| Otsuka Holdings Co., Ltd. | 471,276 | 19,398,039 |
| PALTAC Corp. | 39,246 | 1,941,132 |
| Pan Pacific International Holdings Corp. | 559,092 | 8,748,898 |
| Panasonic Corp. | 2,384,419 | 18,422,554 |
| Park24 Co., Ltd. | 119,844 | 2,460,220 |
| Penta-Ocean Construction Co., Ltd. | 322,644 | 1,674,849 |
| PeptiDream, Inc. * | 93,256 | 4,893,645 |
| Persol Holdings Co., Ltd. | 195,496 | 3,972,725 |
| Pigeon Corp. | 122,349 | 4,449,264 |
| Pilot Corp. | 42,809 | 1,502,318 |
| Pola Orbis Holdings, Inc. | 87,988 | 2,093,906 |
| Rakuten, Inc. | 875,109 | 8,252,712 |
| Recruit Holdings Co., Ltd. | 1,349,364 | 40,921,407 |
| Relo Group, Inc. | 113,096 | 2,867,223 |
| Renesas Electronics Corp. * | 784,735 | 4,908,983 |
| Rengo Co., Ltd. | 245,842 | 1,762,549 |
| Resona Holdings, Inc. | 2,457,871 | 9,655,963 |
| Resorttrust, Inc. | 93,345 | 1,458,942 |
| Ricoh Co., Ltd. | 778,780 | 7,212,217 |
| Rinnai Corp. | 42,451 | 2,667,560 |
| Rohm Co., Ltd. | 103,525 | 7,392,901 |
| Rohto Pharmaceutical Co., Ltd. | 112,625 | 2,796,924 |
| Ryohin Keikaku Co., Ltd. | 254,070 | 4,382,705 |
| Sankyo Co., Ltd. | 54,071 | 1,872,071 |
| Sankyu, Inc. | 53,567 | 2,715,064 |
| Sanrio Co., Ltd. | 65,905 | 1,257,935 |
| Santen Pharmaceutical Co., Ltd. | 412,813 | 7,237,694 |
| Sanwa Holdings Corp. | 227,601 | 2,534,499 |
| Sapporo Holdings Ltd. | 72,727 | 1,756,082 |
| Sawai Pharmaceutical Co., Ltd. | 53,035 | 2,818,007 |
| SBI Holdings, Inc. | 245,059 | 4,906,028 |
| SCREEN Holdings Co., Ltd. | 40,952 | 2,353,452 |
| SCSK Corp. | 51,255 | 2,530,277 |
| Secom Co., Ltd. | 219,656 | 18,757,002 |
| Sega Sammy Holdings, Inc. | 218,075 | 2,991,353 |
| Seibu Holdings, Inc. | 230,473 | 3,914,860 |
| Seiko Epson Corp. | 323,725 | 4,309,420 |
| Seino Holdings Co., Ltd. | 173,733 | 2,239,076 |
| Sekisui Chemical Co., Ltd. | 400,527 | 5,777,068 |
| Sekisui House Ltd. | 650,138 | 11,548,685 |
| Seven & i Holdings Co., Ltd. | 872,358 | 30,877,093 |
| Seven Bank Ltd. | 743,745 | 1,947,912 |
| SG Holdings Co., Ltd. | 235,574 | 6,309,641 |
| Sharp Corp. | 158,015 | 1,631,584 |
| Shikoku Electric Power Co., Inc. | 173,615 | 1,661,810 |
| Shimachu Co., Ltd. | 47,592 | 1,122,713 |
| Shimadzu Corp. | 313,976 | 7,815,013 |
| Shimamura Co., Ltd. | 25,366 | 1,983,492 |
| Shimano, Inc. | 89,024 | 12,806,976 |
| Shimizu Corp. | 641,845 | 5,357,527 |
| Shin-Etsu Chemical Co., Ltd. | 445,835 | 45,005,625 |
| Shinsei Bank Ltd. | 168,353 | 2,306,140 |
| Shionogi & Co., Ltd. | 318,053 | 17,064,505 |
| Security | Number of Shares | Value ($) |
| Shiseido Co., Ltd. | 440,918 | 36,097,578 |
| SHO-BOND Holdings Co., Ltd. | 59,760 | 2,105,633 |
| Shochiku Co., Ltd.(a) | 14,286 | 1,662,180 |
| Showa Denko K.K. | 163,171 | 4,215,129 |
| Skylark Holdings Co., Ltd. | 212,991 | 3,646,000 |
| SMC Corp. | 64,952 | 24,562,375 |
| Softbank Corp. | 1,822,110 | 25,586,273 |
| SoftBank Group Corp. | 1,926,923 | 87,573,381 |
| Sohgo Security Services Co., Ltd. | 77,436 | 3,910,283 |
| Sojitz Corp. | 1,380,175 | 4,212,885 |
| Sompo Holdings, Inc. | 387,442 | 15,491,110 |
| Sony Corp. | 1,406,635 | 80,068,667 |
| Sony Financial Holdings, Inc. | 171,811 | 3,972,153 |
| Sotetsu Holdings, Inc. | 83,180 | 2,218,499 |
| Square Enix Holdings Co., Ltd. | 92,649 | 3,700,897 |
| Stanley Electric Co., Ltd. | 168,230 | 4,185,741 |
| Subaru Corp. | 697,912 | 18,712,681 |
| Sugi Holdings Co., Ltd. | 42,145 | 2,211,575 |
| SUMCO Corp. | 263,162 | 3,265,197 |
| Sumitomo Bakelite Co., Ltd. | 36,024 | 1,287,965 |
| Sumitomo Chemical Co., Ltd. | 1,702,376 | 7,457,769 |
| Sumitomo Corp. | 1,245,839 | 18,691,400 |
| Sumitomo Dainippon Pharma Co., Ltd. | 191,737 | 3,352,620 |
| Sumitomo Electric Industries Ltd. | 854,801 | 10,074,484 |
| Sumitomo Forestry Co., Ltd. | 153,857 | 1,885,797 |
| Sumitomo Heavy Industries Ltd. | 124,583 | 3,585,671 |
| Sumitomo Metal Mining Co., Ltd. | 265,646 | 7,486,740 |
| Sumitomo Mitsui Financial Group, Inc. | 1,477,423 | 48,493,492 |
| Sumitomo Mitsui Trust Holdings, Inc. | 418,728 | 13,696,581 |
| Sumitomo Osaka Cement Co., Ltd. | 38,148 | 1,593,918 |
| Sumitomo Realty & Development Co., Ltd. | 439,249 | 16,532,100 |
| Sumitomo Rubber Industries Ltd. | 214,234 | 2,419,959 |
| Sundrug Co., Ltd. | 73,200 | 2,279,203 |
| Suntory Beverage & Food Ltd. | 138,973 | 5,996,480 |
| Suzuken Co., Ltd. | 85,370 | 4,592,423 |
| Suzuki Motor Corp. | 487,057 | 18,804,085 |
| Sysmex Corp. | 214,674 | 13,716,323 |
| T&D Holdings, Inc. | 635,654 | 6,195,149 |
| Tadano Ltd. | 144,519 | 1,278,471 |
| Taiheiyo Cement Corp. | 135,546 | 3,424,885 |
| Taisei Corp. | 242,511 | 8,590,526 |
| Taisho Pharmaceutical Holdings Co., Ltd. | 47,650 | 3,321,965 |
| Taiyo Nippon Sanso Corp. | 157,020 | 3,115,400 |
| Taiyo Yuden Co., Ltd.(a) | 139,266 | 2,622,759 |
| Takara Bio, Inc. | 49,901 | 1,105,255 |
| Takara Holdings, Inc. | 196,860 | 1,917,690 |
| Takashimaya Co., Ltd. | 181,190 | 2,031,335 |
| Takeda Pharmaceutical Co., Ltd. | 1,711,909 | 57,899,603 |
| TDK Corp. | 135,804 | 10,823,890 |
| TechnoPro Holdings, Inc. | 37,114 | 2,157,364 |
| Teijin Ltd. | 199,807 | 3,595,378 |
| Terumo Corp. | 734,651 | 21,365,751 |
| The 77 Bank Ltd. | 89,804 | 1,171,780 |
| The Awa Bank Ltd. | 50,660 | 1,090,088 |
| The Bank of Kyoto Ltd. | 85,914 | 3,087,870 |
| The Chiba Bank Ltd. | 852,888 | 4,258,615 |
| The Chugoku Bank Ltd. | 162,420 | 1,358,792 |
| The Chugoku Electric Power Co., Inc. | 333,518 | 4,263,827 |
| The Gunma Bank Ltd. | 509,845 | 1,661,938 |
| The Hachijuni Bank Ltd. | 496,436 | 1,786,599 |
| The Hiroshima Bank Ltd. | 384,915 | 1,758,762 |
| The Iyo Bank Ltd. | 307,316 | 1,467,890 |
| The Japan Steel Works Ltd. | 67,240 | 1,199,165 |
| The Kansai Electric Power Co., Inc. | 840,879 | 10,239,164 |
| The San-In Godo Bank Ltd. | 201,512 | 1,154,263 |
| The Shiga Bank Ltd. | 66,781 | 1,459,625 |
| The Shizuoka Bank Ltd. | 600,618 | 4,062,779 |
| Security | Number of Shares | Value ($) |
| The Yokohama Rubber Co., Ltd. | 115,004 | 2,213,511 |
| THK Co., Ltd. | 137,387 | 3,194,414 |
| TIS, Inc. | 93,416 | 5,482,893 |
| Tobu Railway Co., Ltd. | 227,622 | 6,990,887 |
| Toda Corp. | 305,005 | 1,698,224 |
| Toho Co., Ltd. | 126,255 | 5,358,507 |
| Toho Gas Co., Ltd. | 109,969 | 4,273,608 |
| Tohoku Electric Power Co., Inc. | 519,630 | 5,198,993 |
| Tokai Carbon Co., Ltd.(a) | 210,386 | 2,015,757 |
| Tokio Marine Holdings, Inc. | 736,756 | 37,981,335 |
| Tokuyama Corp. | 77,462 | 1,635,426 |
| Tokyo Century Corp. | 53,801 | 2,169,375 |
| Tokyo Electric Power Co. Holdings, Inc. * | 1,748,957 | 8,337,390 |
| Tokyo Electron Ltd. | 173,794 | 31,117,386 |
| Tokyo Gas Co., Ltd. | 483,232 | 12,225,913 |
| Tokyo Tatemono Co., Ltd. | 243,034 | 3,171,154 |
| Tokyu Corp. | 559,125 | 10,003,094 |
| Tokyu Fudosan Holdings Corp. | 669,095 | 4,154,069 |
| Topcon Corp. | 125,836 | 1,455,807 |
| Toppan Printing Co., Ltd. | 292,660 | 4,667,892 |
| Toray Industries, Inc. | 1,697,854 | 12,118,274 |
| Toshiba Corp. | 586,518 | 18,234,579 |
| Tosoh Corp. | 332,208 | 4,268,988 |
| TOTO Ltd. | 158,225 | 5,731,548 |
| Toyo Seikan Group Holdings Ltd. | 173,462 | 2,529,739 |
| Toyo Suisan Kaisha Ltd. | 97,980 | 3,992,308 |
| Toyo Tire Corp. | 110,180 | 1,348,380 |
| Toyobo Co., Ltd. | 114,321 | 1,457,217 |
| Toyoda Gosei Co., Ltd. | 84,366 | 1,571,356 |
| Toyota Industries Corp. | 178,301 | 9,809,957 |
| Toyota Motor Corp. | 2,823,090 | 185,111,936 |
| Toyota Tsusho Corp. | 254,816 | 7,910,111 |
| Trend Micro, Inc. | 131,922 | 6,400,662 |
| TS Tech Co., Ltd. | 59,267 | 1,630,408 |
| Tsumura & Co. | 68,935 | 1,893,123 |
| Tsuruha Holdings, Inc. | 39,700 | 4,331,113 |
| Ube Industries Ltd. | 114,849 | 2,200,790 |
| Ulvac, Inc. | 55,065 | 2,243,687 |
| Unicharm Corp. | 437,234 | 13,449,235 |
| Ushio, Inc. | 130,308 | 1,673,275 |
| USS Co., Ltd. | 225,671 | 4,269,135 |
| Wacoal Holdings Corp. | 56,396 | 1,318,182 |
| Welcia Holdings Co., Ltd. | 59,606 | 3,116,617 |
| West Japan Railway Co. | 206,150 | 17,382,284 |
| Yahoo Japan Corp. | 2,683,944 | 6,725,980 |
| Yakult Honsha Co., Ltd. | 137,592 | 7,933,139 |
| Yamada Denki Co., Ltd. | 865,525 | 4,077,088 |
| Yamaguchi Financial Group, Inc. | 257,710 | 1,638,836 |
| Yamaha Corp. | 184,235 | 7,958,147 |
| Yamaha Motor Co., Ltd. | 318,884 | 5,221,352 |
| Yamato Holdings Co., Ltd. | 401,650 | 6,958,730 |
| Yamato Kogyo Co., Ltd. | 45,609 | 1,116,753 |
| Yamazaki Baking Co., Ltd. | 147,409 | 2,563,635 |
| Yaoko Co., Ltd. | 24,715 | 1,099,014 |
| Yaskawa Electric Corp. | 293,794 | 9,881,243 |
| Yokogawa Electric Corp. | 259,688 | 4,721,822 |
| Zenkoku Hosho Co., Ltd. | 59,232 | 2,257,228 |
| Zensho Holdings Co., Ltd. | 102,023 | 2,314,489 |
| Zeon Corp. | 181,703 | 2,119,255 |
| ZOZO, Inc. | 228,480 | 4,567,663 |
| 4,039,921,127 | ||
| Netherlands 3.0% | ||
| Aalberts N.V. | 104,522 | 3,955,003 |
| ABN AMRO Bank N.V. | 467,210 | 8,327,426 |
| Adyen N.V. * | 11,068 | 8,029,873 |
| Aegon N.V. | 2,027,267 | 7,731,244 |
| Security | Number of Shares | Value ($) |
| Akzo Nobel N.V. | 256,143 | 22,980,853 |
| ArcelorMittal | 666,718 | 9,612,450 |
| ASML Holding N.V. | 442,518 | 98,561,069 |
| ASR Nederland N.V. | 163,151 | 5,715,304 |
| Boskalis Westminster | 89,545 | 1,784,374 |
| Galapagos N.V. * | 51,717 | 8,742,339 |
| GrandVision N.V. | 64,093 | 1,939,605 |
| Heineken Holding N.V. | 120,695 | 11,955,738 |
| Heineken N.V. | 266,257 | 28,371,534 |
| ING Groep N.V. | 4,406,669 | 42,205,187 |
| Koninklijke Ahold Delhaize N.V. | 1,247,138 | 29,233,048 |
| Koninklijke DSM N.V. | 198,991 | 24,784,603 |
| Koninklijke KPN N.V. | 3,692,773 | 11,711,999 |
| Koninklijke Philips N.V. | 1,048,952 | 49,538,969 |
| Koninklijke Vopak N.V. | 76,728 | 3,663,777 |
| NN Group N.V. | 395,672 | 13,272,452 |
| OCI N.V. * | 115,849 | 2,543,282 |
| Randstad N.V. | 120,821 | 5,648,148 |
| Signify N.V. | 110,893 | 3,249,638 |
| Unibail-Rodamco-Westfield | 151,610 | 19,884,997 |
| Unilever N.V. | 1,633,012 | 101,499,129 |
| VEON Ltd. | 708,044 | 1,824,576 |
| Wolters Kluwer N.V. | 307,190 | 22,164,957 |
| 548,931,574 | ||
| New Zealand 0.3% | ||
| a2 Milk Co., Ltd. * | 824,219 | 7,511,614 |
| Air New Zealand Ltd. | 527,936 | 953,957 |
| Auckland International Airport Ltd. | 1,043,861 | 6,333,453 |
| Contact Energy Ltd. | 816,175 | 4,313,701 |
| Fisher & Paykel Healthcare Corp., Ltd. | 657,914 | 6,908,856 |
| Fletcher Building Ltd. | 1,019,275 | 2,854,284 |
| Kiwi Property Group Ltd. | 1,644,089 | 1,690,191 |
| Mercury NZ Ltd. | 775,338 | 2,535,494 |
| Meridian Energy Ltd. | 1,321,399 | 4,150,363 |
| Ryman Healthcare Ltd. | 469,147 | 3,852,501 |
| SKYCITY Entertainment Group Ltd. | 763,169 | 1,838,683 |
| Spark New Zealand Ltd. | 2,023,046 | 5,639,633 |
| 48,582,730 | ||
| Norway 0.6% | ||
| Adevinta A.S.A., Class A * | 75,663 | 948,877 |
| Adevinta A.S.A., Class B * | 188,513 | 2,351,690 |
| Aker A.S.A., A Shares | 28,689 | 1,471,271 |
| Aker BP A.S.A. | 125,921 | 3,343,604 |
| DNB A.S.A. | 1,198,723 | 19,337,533 |
| Equinor A.S.A. | 1,113,105 | 19,044,256 |
| Gjensidige Forsikring A.S.A. | 184,501 | 3,564,909 |
| Leroy Seafood Group A.S.A. | 274,472 | 1,801,230 |
| Mowi A.S.A. | 472,876 | 11,320,463 |
| Norsk Hydro A.S.A. | 1,493,741 | 4,730,761 |
| Orkla A.S.A. | 840,502 | 7,708,851 |
| Salmar A.S.A. | 56,285 | 2,673,866 |
| Schibsted A.S.A., B Shares | 103,598 | 3,003,418 |
| Schibsted A.S.A., Class A | 96,347 | 2,937,096 |
| Subsea 7 S.A. | 242,551 | 2,348,733 |
| Telenor A.S.A. | 738,508 | 15,173,628 |
| Yara International A.S.A. | 195,515 | 8,487,256 |
| 110,247,442 | ||
| Poland 0.3% | ||
| Bank Polska Kasa Opieki S.A. | 177,550 | 4,351,192 |
| CD Projekt S.A. | 71,873 | 4,578,071 |
| Cyfrowy Polsat S.A. | 289,006 | 2,117,367 |
| Dino Polska S.A. * | 57,544 | 2,228,192 |
| Security | Number of Shares | Value ($) |
| Grupa Lotos S.A. | 110,053 | 2,386,174 |
| KGHM Polska Miedz S.A. * | 156,553 | 3,086,955 |
| LPP S.A. | 832 | 1,556,354 |
| mBank S.A. * | 13,970 | 1,134,637 |
| PGE Polska Grupa Energetyczna S.A. * | 753,767 | 1,462,387 |
| Polski Koncern Naftowy Orlen S.A. | 348,300 | 7,948,215 |
| Polskie Gornictwo Naftowe i Gazownictwo S.A. | 1,920,621 | 2,292,008 |
| Powszechna Kasa Oszczednosci Bank Polski S.A. | 975,016 | 9,610,362 |
| Powszechny Zaklad Ubezpieczen S.A. | 695,544 | 6,547,512 |
| Santander Bank Polska S.A. | 32,125 | 2,466,830 |
| 51,766,256 | ||
| Portugal 0.1% | ||
| Banco Espirito Santo S.A. *(b) | 505,213 | — |
| EDP - Energias de Portugal S.A. | 2,534,176 | 9,594,638 |
| EDP Renovaveis S.A. | 179,991 | 1,986,115 |
| Galp Energia, SGPS, S.A. | 565,266 | 8,129,840 |
| Jeronimo Martins, SGPS, S.A. | 277,079 | 4,580,050 |
| 24,290,643 | ||
| Republic of Korea 3.6% | ||
| Amorepacific Corp. | 34,493 | 3,702,035 |
| AMOREPACIFIC Group | 42,221 | 2,056,585 |
| BGF retail Co., Ltd. | 9,353 | 1,571,381 |
| BNK Financial Group, Inc. | 437,138 | 2,418,018 |
| Celltrion Healthcare Co., Ltd. * | 70,606 | 2,591,073 |
| Celltrion, Inc. * | 112,487 | 14,580,358 |
| Cheil Worldwide, Inc. | 102,977 | 2,244,452 |
| CJ CheilJedang Corp. | 11,077 | 2,089,655 |
| CJ Corp. | 15,110 | 1,016,689 |
| CJ ENM Co., Ltd. | 10,279 | 1,365,442 |
| CJ Logistics Corp. * | 9,480 | 1,119,207 |
| Daelim Industrial Co., Ltd. | 35,424 | 2,857,317 |
| Daewoo Shipbuilding & Marine Engineering Co., Ltd. * | 70,212 | 1,582,487 |
| DB Insurance Co., Ltd. | 51,908 | 2,052,750 |
| DGB Financial Group, Inc. | 184,396 | 1,048,907 |
| Doosan Bobcat, Inc. | 29,199 | 864,218 |
| Doosan Heavy Industries & Construction Co., Ltd. | 149,789 | 739,516 |
| E-MART, Inc. | 24,584 | 2,354,381 |
| Fila Korea Ltd. | 74,947 | 3,539,293 |
| GS Engineering & Construction Corp. | 71,620 | 1,915,780 |
| GS Holdings Corp. | 55,373 | 2,194,348 |
| GS Retail Co., Ltd. | 27,376 | 874,676 |
| Hana Financial Group, Inc. | 329,491 | 8,840,832 |
| Hankook Tire & Technology Co., Ltd. | 80,718 | 1,942,563 |
| Hanmi Pharm Co., Ltd. | 8,893 | 2,059,432 |
| Hanon Systems | 186,785 | 1,788,818 |
| Hanwha Aerospace Co., Ltd. * | 36,156 | 1,161,171 |
| Hanwha Chemical Corp. | 98,710 | 1,409,852 |
| Hanwha Corp. | 69,376 | 1,403,271 |
| HDC Hyundai Development Co-Engineering & Construction | 36,600 | 1,083,269 |
| Helixmith Co., Ltd. * | 18,205 | 2,748,974 |
| HLB, Inc. * | 37,227 | 1,298,527 |
| Hotel Shilla Co., Ltd. | 36,370 | 2,366,114 |
| Hyundai Department Store Co., Ltd. | 23,192 | 1,493,479 |
| Hyundai Engineering & Construction Co., Ltd. | 93,167 | 3,180,562 |
| Hyundai Glovis Co., Ltd. | 21,742 | 2,872,008 |
| Hyundai Heavy Industries Holdings Co., Ltd. | 11,673 | 3,194,716 |
| Security | Number of Shares | Value ($) |
| Hyundai Marine & Fire Insurance Co., Ltd. | 60,462 | 1,193,017 |
| Hyundai Mipo Dockyard Co., Ltd. | 30,237 | 1,029,743 |
| Hyundai Mobis Co., Ltd. | 73,206 | 15,018,940 |
| Hyundai Motor Co. | 158,344 | 16,798,517 |
| Hyundai Steel Co. | 79,924 | 2,461,230 |
| Hyundai Wia Corp. | 19,515 | 695,209 |
| Industrial Bank of Korea | 321,925 | 3,295,662 |
| Kakao Corp. | 60,108 | 6,674,531 |
| Kangwon Land, Inc. | 142,614 | 3,326,188 |
| KB Financial Group, Inc. | 440,158 | 14,426,644 |
| KCC Corp. | 6,731 | 1,253,119 |
| Kia Motors Corp. | 298,730 | 10,777,710 |
| Korea Aerospace Industries Ltd. | 67,992 | 2,206,056 |
| Korea Electric Power Corp. * | 274,050 | 5,780,786 |
| Korea Gas Corp. | 31,935 | 1,029,566 |
| Korea Investment Holdings Co., Ltd. | 50,388 | 3,007,680 |
| Korea Shipbuilding & Offshore Engineering Co., Ltd. * | 50,429 | 4,579,723 |
| Korea Zinc Co., Ltd. | 12,270 | 4,406,564 |
| Korean Air Lines Co., Ltd. | 49,076 | 899,473 |
| KT&G Corp. | 122,311 | 10,299,874 |
| Kumho Petrochemical Co., Ltd. | 19,792 | 1,148,712 |
| LG Chem Ltd. | 50,601 | 13,806,919 |
| LG Corp. | 100,136 | 5,886,219 |
| LG Display Co., Ltd. * | 288,565 | 3,323,411 |
| LG Electronics, Inc. | 131,948 | 6,677,740 |
| LG Household & Health Care Ltd. | 10,332 | 10,056,907 |
| LG Uplus Corp. | 232,871 | 2,537,789 |
| Lotte Chemical Corp. | 17,631 | 3,275,108 |
| Lotte Corp. | 56,945 | 1,567,897 |
| LOTTE Fine Chemical Co., Ltd. | 35,067 | 1,262,267 |
| Lotte Shopping Co., Ltd. | 15,686 | 1,761,235 |
| Medy-Tox, Inc. | 4,415 | 1,283,038 |
| Mirae Asset Daewoo Co., Ltd. | 480,691 | 2,952,604 |
| NAVER Corp. | 145,561 | 17,605,520 |
| NCSoft Corp. | 18,439 | 8,174,814 |
| Netmarble Corp. * | 18,327 | 1,425,307 |
| NH Investment & Securities Co., Ltd. | 177,093 | 1,798,344 |
| NHN Corp. * | 11,701 | 586,378 |
| NongShim Co., Ltd. | 6,524 | 1,292,681 |
| OCI Co., Ltd. | 19,652 | 1,077,311 |
| Orion Corp. | 27,877 | 2,073,658 |
| Paradise Co., Ltd. | 59,222 | 792,071 |
| POSCO | 79,012 | 13,763,907 |
| POSCO Chemical Co., Ltd. | 22,831 | 993,349 |
| S-1 Corp. | 26,095 | 2,175,930 |
| S-Oil Corp. | 44,178 | 3,526,945 |
| Samsung Biologics Co., Ltd. * | 18,090 | 4,017,511 |
| Samsung C&T Corp. | 94,134 | 6,714,698 |
| Samsung Card Co., Ltd. | 32,702 | 895,002 |
| Samsung Electro-Mechanics Co., Ltd. | 71,651 | 5,270,674 |
| Samsung Electronics Co., Ltd. | 5,289,728 | 192,155,238 |
| Samsung Engineering Co., Ltd. * | 201,046 | 2,572,725 |
| Samsung Fire & Marine Insurance Co., Ltd. | 37,078 | 7,010,000 |
| Samsung Heavy Industries Co., Ltd. * | 505,111 | 3,231,876 |
| Samsung Life Insurance Co., Ltd. | 73,873 | 4,159,454 |
| Samsung SDI Co., Ltd. | 58,259 | 12,000,512 |
| Samsung SDS Co., Ltd. | 36,472 | 5,901,764 |
| Samsung Securities Co., Ltd. | 67,984 | 1,981,288 |
| Shinhan Financial Group Co., Ltd. | 494,022 | 16,620,348 |
| Shinsegae, Inc. | 10,395 | 1,982,452 |
| SillaJen, Inc. * | 73,637 | 638,339 |
| SK Holdings Co., Ltd. | 37,540 | 6,198,555 |
| SK Hynix, Inc. | 582,051 | 37,193,600 |
| SK Innovation Co., Ltd. | 65,155 | 8,875,604 |
| SK Networks Co., Ltd. | 189,588 | 834,266 |
| Security | Number of Shares | Value ($) |
| SK Telecom Co., Ltd. | 26,267 | 5,193,764 |
| Woongjin Coway Co., Ltd. | 65,453 | 4,549,963 |
| Woori Financial Group, Inc. | 628,713 | 6,176,830 |
| Yuhan Corp. | 9,235 | 1,749,790 |
| 647,532,702 | ||
| Singapore 1.2% | ||
| Ascendas Real Estate Investment Trust | 2,872,493 | 6,377,796 |
| CapitaLand Commercial Trust | 2,559,540 | 3,930,090 |
| CapitaLand Ltd. | 2,804,699 | 7,015,791 |
| CapitaLand Mall Trust | 2,714,867 | 5,186,273 |
| City Developments Ltd. | 566,307 | 3,910,915 |
| ComfortDelGro Corp., Ltd. | 2,558,632 | 4,518,922 |
| DBS Group Holdings Ltd. | 2,013,643 | 35,607,456 |
| Genting Singapore Ltd. | 6,799,951 | 4,362,714 |
| Golden Agri-Resources Ltd. | 6,895,798 | 1,317,320 |
| Hutchison Port Holdings Trust | 6,252,110 | 981,581 |
| Jardine Cycle & Carriage Ltd. | 107,494 | 2,386,689 |
| Keppel Corp., Ltd. | 1,589,242 | 6,690,580 |
| Keppel REIT | 2,538,985 | 2,251,263 |
| Mapletree Commercial Trust | 2,305,164 | 3,788,764 |
| Mapletree Industrial Trust | 1,593,144 | 2,652,943 |
| Mapletree Logistics Trust | 2,886,240 | 3,266,578 |
| Mapletree North Asia Commercial Trust | 2,632,599 | 2,505,068 |
| Olam International Ltd. | 707,380 | 958,675 |
| Oversea-Chinese Banking Corp., Ltd. | 3,708,172 | 28,468,881 |
| SATS Ltd. | 759,995 | 2,629,740 |
| Sembcorp Industries Ltd. | 956,106 | 1,426,715 |
| Sembcorp Marine Ltd. * | 956,838 | 786,329 |
| Singapore Airlines Ltd. | 595,002 | 3,787,390 |
| Singapore Exchange Ltd. | 928,507 | 5,488,579 |
| Singapore Post Ltd. | 2,187,887 | 1,451,021 |
| Singapore Press Holdings Ltd. | 1,902,965 | 2,729,888 |
| Singapore Technologies Engineering Ltd. | 1,669,321 | 4,741,295 |
| Singapore Telecommunications Ltd. | 8,353,739 | 19,089,787 |
| StarHub Ltd. | 716,791 | 682,068 |
| Suntec Real Estate Investment Trust | 2,289,323 | 3,185,116 |
| United Overseas Bank Ltd. | 1,457,085 | 26,217,446 |
| UOL Group Ltd. | 533,923 | 2,828,961 |
| Venture Corp., Ltd. | 290,426 | 3,178,105 |
| Wilmar International Ltd. | 2,266,530 | 6,225,115 |
| 210,625,854 | ||
| Spain 2.5% | ||
| Acciona S.A.(a) | 24,957 | 2,682,428 |
| Acerinox S.A. | 220,077 | 1,824,969 |
| ACS, Actividades de Construccion y Servicios S.A. | 282,158 | 10,679,670 |
| Aena SME S.A. | 77,272 | 13,955,710 |
| Amadeus IT Group S.A. | 456,859 | 34,091,139 |
| Banco Bilbao Vizcaya Argentaria S.A. | 7,490,367 | 35,543,937 |
| Banco de Sabadell S.A. | 6,371,816 | 5,464,810 |
| Banco Santander S.A. | 18,015,863 | 68,249,496 |
| Bankia S.A. | 1,420,995 | 2,583,602 |
| Bankinter S.A. | 820,187 | 4,785,318 |
| CaixaBank S.A. | 4,406,265 | 10,000,795 |
| Cellnex Telecom S.A. | 231,265 | 9,270,373 |
| Corporacion Financiera Alba S.A. | 25,894 | 1,313,151 |
| Enagas S.A. | 249,594 | 5,457,453 |
| Endesa S.A. | 357,757 | 9,207,310 |
| Ferrovial S.A. | 527,503 | 15,028,211 |
| Fomento de Construcciones y Contratas S.A. | 84,578 | 1,052,499 |
| Grifols S.A. | 387,161 | 12,279,199 |
| Iberdrola S.A. | 7,019,929 | 72,297,479 |
| Industria de Diseno Textil S.A. | 1,178,161 | 36,484,289 |
| Security | Number of Shares | Value ($) |
| Inmobiliaria Colonial Socimi S.A. | 343,659 | 3,973,772 |
| Mapfre S.A. | 1,069,380 | 2,788,687 |
| Merlin Properties Socimi S.A. | 357,483 | 4,787,127 |
| Naturgy Energy Group S.A. | 369,955 | 9,696,428 |
| Red Electrica Corp. S.A. | 497,373 | 9,927,643 |
| Repsol S.A. | 1,573,791 | 22,912,076 |
| Siemens Gamesa Renewable Energy S.A. | 254,660 | 3,473,303 |
| Telefonica S.A. | 5,101,537 | 35,399,445 |
| Zardoya Otis S.A. | 242,167 | 1,669,457 |
| 446,879,776 | ||
| Sweden 2.2% | ||
| Alfa Laval AB | 355,830 | 6,556,520 |
| Assa Abloy AB, B Shares | 1,024,980 | 21,415,589 |
| Atlas Copco AB, A Shares | 704,667 | 21,060,682 |
| Atlas Copco AB, B Shares | 435,899 | 11,623,321 |
| Boliden AB | 301,012 | 6,660,644 |
| Castellum AB | 311,275 | 6,649,683 |
| Electrolux AB, Series B | 277,300 | 6,206,647 |
| Elekta AB, B Shares | 413,621 | 5,278,446 |
| Epiroc AB, A Shares | 673,977 | 6,989,381 |
| Epiroc AB, B Shares | 459,770 | 4,559,819 |
| Essity AB, B Shares | 688,553 | 21,491,830 |
| Fastighets AB Balder, B Shares * | 108,422 | 4,088,434 |
| Hennes & Mauritz AB, B Shares | 972,888 | 18,648,640 |
| Hexagon AB, B Shares | 279,284 | 12,416,673 |
| Husqvarna AB, B Shares | 481,338 | 3,735,145 |
| ICA Gruppen AB | 83,641 | 4,104,949 |
| Industrivarden AB, A Shares | 248,755 | 5,341,988 |
| Industrivarden AB, C Shares | 151,880 | 3,179,525 |
| Investment AB Latour, B Shares | 133,245 | 1,779,897 |
| Investor AB, A Shares | 145,277 | 6,728,476 |
| Investor AB, B Shares | 524,248 | 24,601,188 |
| Kinnevik AB, B Shares | 281,705 | 7,681,192 |
| L E Lundbergfortagen AB, B Shares | 84,276 | 3,159,018 |
| Lundin Petroleum AB | 201,168 | 6,117,010 |
| Nibe Industrier AB, B Shares | 339,392 | 4,249,841 |
| Saab AB, Class B | 112,837 | 3,159,546 |
| Sandvik AB | 1,198,205 | 17,196,981 |
| Securitas AB, B Shares | 336,684 | 5,045,042 |
| Skandinaviska Enskilda Banken AB, A Shares | 1,619,753 | 13,933,430 |
| Skanska AB, B Shares | 392,294 | 7,356,413 |
| SKF AB, B Shares | 419,126 | 6,767,610 |
| Svenska Cellulosa AB SCA, B Shares | 725,135 | 6,259,935 |
| Svenska Handelsbanken AB, A Shares | 1,693,518 | 14,916,801 |
| Swedbank AB, A Shares | 1,141,830 | 14,682,135 |
| Swedish Match AB | 186,347 | 7,315,699 |
| Swedish Orphan Biovitrum AB * | 198,128 | 3,280,987 |
| Tele2 AB, B Shares | 617,339 | 8,715,441 |
| Telefonaktiebolaget LM Ericsson, B Shares | 3,412,775 | 26,608,147 |
| Telia Co. AB | 2,955,380 | 12,946,438 |
| Trelleborg AB, B Shares | 287,721 | 3,931,416 |
| Volvo AB, B Shares | 1,723,540 | 23,814,055 |
| 400,254,614 | ||
| Switzerland 8.1% | ||
| ABB Ltd. | 2,006,334 | 38,019,872 |
| Adecco Group AG | 173,862 | 9,147,765 |
| Alcon, Inc. * | 514,002 | 31,324,797 |
| Baloise Holding AG | 53,912 | 9,191,929 |
| Banque Cantonale Vaudoise | 3,681 | 2,831,109 |
| Barry Callebaut AG | 2,719 | 5,561,934 |
| Chocoladefabriken Lindt & Sprungli AG | 111 | 9,131,740 |
| Security | Number of Shares | Value ($) |
| Chocoladefabriken Lindt & Sprungli AG, Participation Certificate | 1,214 | 8,987,367 |
| Cie Financiere Richemont S.A. | 574,578 | 44,598,100 |
| Clariant AG * | 234,772 | 4,323,155 |
| Credit Suisse Group AG * | 2,860,225 | 33,431,201 |
| DKSH Holding AG | 37,136 | 1,809,791 |
| Dufry AG * | 36,617 | 2,969,476 |
| EMS-Chemie Holding AG | 7,900 | 4,698,722 |
| Flughafen Zuerich AG | 21,163 | 3,884,179 |
| Geberit AG | 40,928 | 18,618,114 |
| Georg Fischer AG | 4,635 | 3,796,723 |
| Givaudan S.A. | 10,332 | 27,943,233 |
| Helvetia Holding AG | 36,751 | 4,791,429 |
| Julius Baer Group Ltd. * | 244,621 | 9,674,081 |
| Kuehne & Nagel International AG | 55,359 | 8,059,492 |
| LafargeHolcim Ltd. * | 552,575 | 26,119,493 |
| Logitech International S.A. | 163,433 | 6,625,193 |
| Lonza Group AG * | 83,253 | 29,432,411 |
| Nestle S.A. | 3,355,283 | 376,407,512 |
| Novartis AG | 2,464,978 | 221,747,124 |
| OC Oerlikon Corp. AG | 228,425 | 2,116,992 |
| Pargesa Holding S.A. | 45,554 | 3,330,974 |
| Partners Group Holding AG | 18,464 | 14,977,216 |
| PSP Swiss Property AG | 43,007 | 5,715,721 |
| Roche Holding AG | 783,410 | 214,251,095 |
| Roche Holding AG, Bearer Shares | 31,210 | 8,485,007 |
| Schindler Holding AG | 18,470 | 4,188,860 |
| Schindler Holding AG, Participation Certificate | 48,147 | 10,997,243 |
| SGS S.A. | 5,940 | 14,588,105 |
| Sika AG | 158,452 | 22,756,106 |
| Sonova Holding AG | 62,485 | 14,505,841 |
| Straumann Holding AG | 11,240 | 8,810,697 |
| Sulzer AG | 16,157 | 1,534,952 |
| Swiss Life Holding AG | 38,071 | 18,057,224 |
| Swiss Prime Site AG | 83,135 | 8,276,110 |
| Swiss Re AG | 339,327 | 32,634,653 |
| Swisscom AG | 27,974 | 13,969,330 |
| Temenos AG * | 66,634 | 11,165,716 |
| The Swatch Group AG | 62,600 | 3,198,171 |
| The Swatch Group AG, Bearer Shares | 30,575 | 8,284,560 |
| UBS Group AG * | 3,908,406 | 41,278,329 |
| Vifor Pharma AG | 50,030 | 7,933,404 |
| Zurich Insurance Group AG | 164,517 | 58,560,703 |
| 1,472,742,951 | ||
| United Kingdom 14.3% | ||
| 3i Group plc | 1,068,044 | 14,262,369 |
| Admiral Group plc | 229,685 | 6,005,630 |
| Anglo American plc | 1,116,851 | 24,131,911 |
| Antofagasta plc | 397,755 | 4,194,956 |
| Ashmore Group plc | 512,979 | 2,818,789 |
| Ashtead Group plc | 531,917 | 14,711,430 |
| Associated British Foods plc | 390,249 | 10,793,265 |
| AstraZeneca plc | 1,477,317 | 131,661,864 |
| Auto Trader Group plc | 997,270 | 6,456,418 |
| AVEVA Group plc | 74,150 | 3,341,233 |
| Aviva plc | 4,387,255 | 18,919,633 |
| B&M European Value Retail S.A. | 892,267 | 3,888,025 |
| Babcock International Group plc | 315,384 | 1,926,598 |
| BAE Systems plc | 3,618,549 | 24,043,778 |
| Barclays plc | 19,448,286 | 32,353,847 |
| Barratt Developments plc | 1,167,338 | 8,990,470 |
| Bellway plc | 132,709 | 4,688,587 |
| Berkeley Group Holdings plc | 136,836 | 6,527,514 |
| BHP Group plc | 2,333,473 | 50,385,482 |
| BP plc | 22,377,584 | 136,317,239 |
| Security | Number of Shares | Value ($) |
| British American Tobacco plc | 2,568,986 | 90,104,841 |
| BT Group plc | 9,491,007 | 19,145,707 |
| Bunzl plc | 393,665 | 9,650,826 |
| Burberry Group plc | 472,461 | 12,451,369 |
| Capital & Counties Properties plc | 766,293 | 1,911,255 |
| Carnival plc | 181,244 | 7,610,703 |
| Centrica plc | 6,310,587 | 5,356,689 |
| Cineworld Group plc | 1,144,056 | 3,042,943 |
| Cobham plc * | 2,690,047 | 5,290,860 |
| Coca-Cola HBC AG * | 225,080 | 7,483,305 |
| Compass Group plc | 1,782,296 | 45,212,966 |
| ConvaTec Group plc | 1,660,537 | 3,525,855 |
| CRH plc | 907,825 | 30,260,133 |
| Croda International plc | 142,067 | 8,135,228 |
| CYBG plc | 1,308,146 | 2,250,290 |
| DCC plc | 110,675 | 9,413,425 |
| Derwent London plc | 116,796 | 4,528,923 |
| Diageo plc | 2,624,340 | 111,973,724 |
| Direct Line Insurance Group plc | 1,577,956 | 5,440,373 |
| DS Smith plc | 1,455,777 | 6,027,923 |
| easyJet plc | 203,427 | 2,386,762 |
| Evraz plc | 616,724 | 3,727,598 |
| Experian plc | 1,027,809 | 31,518,246 |
| Ferguson plc * | 261,267 | 19,231,046 |
| Flutter Entertainment plc | 89,591 | 7,382,276 |
| Fresnillo plc | 227,657 | 2,052,775 |
| G4S plc | 1,744,261 | 3,694,069 |
| GlaxoSmithKline plc | 5,514,703 | 114,952,469 |
| Glencore plc * | 12,532,510 | 36,165,017 |
| GVC Holdings plc | 650,212 | 4,980,805 |
| Halma plc | 429,632 | 10,270,955 |
| Hammerson plc | 828,582 | 2,290,632 |
| Hargreaves Lansdown plc | 308,618 | 7,058,473 |
| Hikma Pharmaceuticals plc | 163,593 | 4,018,505 |
| Hiscox Ltd. | 318,071 | 6,004,124 |
| Howden Joinery Group plc | 684,706 | 4,487,885 |
| HSBC Holdings plc | 22,775,731 | 164,039,163 |
| IMI plc | 316,205 | 3,870,158 |
| Imperial Brands plc | 1,079,406 | 27,927,719 |
| Inchcape plc | 495,040 | 3,484,673 |
| Informa plc | 1,428,762 | 15,138,158 |
| InterContinental Hotels Group plc | 201,549 | 12,579,646 |
| International Consolidated Airlines Group S.A. | 843,039 | 4,329,574 |
| Intertek Group plc | 178,886 | 11,825,243 |
| Investec plc | 725,343 | 3,731,309 |
| ITV plc | 4,162,059 | 5,877,233 |
| J Sainsbury plc | 1,860,040 | 4,442,156 |
| JD Sports Fashion plc | 418,534 | 3,144,921 |
| John Wood Group plc | 784,652 | 3,601,614 |
| Johnson Matthey plc | 213,346 | 7,560,863 |
| Just Eat plc * | 657,107 | 6,288,427 |
| KAZ Minerals plc | 253,305 | 1,242,588 |
| Kingfisher plc | 2,445,280 | 5,790,692 |
| Land Securities Group plc | 827,920 | 7,818,223 |
| Legal & General Group plc | 6,607,471 | 17,671,015 |
| Lloyds Banking Group plc | 79,261,324 | 48,100,114 |
| London Stock Exchange Group plc | 355,209 | 30,082,404 |
| Marks & Spencer Group plc | 2,233,515 | 5,229,367 |
| Mediclinic International plc | 436,241 | 1,803,151 |
| Meggitt plc | 895,861 | 6,753,442 |
| Melrose Industries plc | 5,351,266 | 11,792,585 |
| Merlin Entertainments plc | 833,080 | 4,582,798 |
| Micro Focus International plc | 376,191 | 5,079,904 |
| Mondi plc | 545,628 | 10,611,957 |
| National Grid plc | 3,842,782 | 40,177,226 |
| Next plc | 150,179 | 10,856,679 |
| NMC Health plc | 90,876 | 2,769,048 |
| Security | Number of Shares | Value ($) |
| Ocado Group plc * | 513,854 | 8,107,203 |
| Pearson plc | 891,894 | 9,030,612 |
| Pennon Group plc | 477,982 | 4,396,099 |
| Persimmon plc | 353,659 | 8,194,138 |
| Phoenix Group Holdings plc | 600,470 | 4,731,398 |
| Polymetal International plc | 346,336 | 4,989,721 |
| Prudential plc | 2,914,879 | 48,562,443 |
| Quilter plc | 2,124,277 | 3,231,227 |
| Reckitt Benckiser Group plc | 707,396 | 55,127,539 |
| RELX plc | 2,121,457 | 50,806,828 |
| Renishaw plc | 52,596 | 2,273,919 |
| Rentokil Initial plc | 2,099,716 | 11,512,243 |
| Rightmove plc | 1,019,031 | 6,645,701 |
| Rio Tinto plc | 1,240,480 | 62,687,281 |
| Rolls-Royce Holdings plc * | 1,934,755 | 18,171,338 |
| Royal Bank of Scotland Group plc | 5,116,791 | 11,556,290 |
| Royal Dutch Shell plc, A Shares | 4,948,725 | 137,139,973 |
| Royal Dutch Shell plc, B Shares | 4,251,034 | 117,261,834 |
| Royal Mail plc | 1,017,174 | 2,553,096 |
| RSA Insurance Group plc | 1,163,356 | 7,415,497 |
| Schroders plc | 122,659 | 4,078,082 |
| Segro plc | 1,248,723 | 11,937,948 |
| Severn Trent plc | 261,266 | 6,589,567 |
| Smith & Nephew plc | 984,296 | 23,554,949 |
| Smiths Group plc | 458,391 | 9,320,011 |
| Smurfit Kappa Group plc | 261,978 | 8,091,107 |
| Spirax-Sarco Engineering plc | 83,641 | 8,174,443 |
| SSE plc | 1,219,990 | 17,101,157 |
| St. James's Place plc | 580,283 | 6,486,073 |
| Standard Chartered plc | 3,042,573 | 23,047,578 |
| Standard Life Aberdeen plc | 2,917,863 | 8,858,926 |
| Tate & Lyle plc | 530,810 | 4,650,540 |
| Taylor Wimpey plc | 3,614,971 | 6,425,439 |
| Tesco plc | 10,879,134 | 29,042,151 |
| The British Land Co. plc | 1,051,924 | 6,530,976 |
| The Sage Group plc | 1,220,554 | 10,414,083 |
| The Weir Group plc | 285,174 | 5,086,197 |
| Travis Perkins plc | 291,332 | 4,436,758 |
| TUI AG | 471,124 | 4,687,607 |
| Unilever plc | 1,225,395 | 77,542,383 |
| United Utilities Group plc | 761,273 | 7,546,729 |
| Vodafone Group plc | 30,100,901 | 56,908,486 |
| Whitbread plc(a) | 149,677 | 7,971,287 |
| Wm Morrison Supermarkets plc | 2,425,079 | 5,392,878 |
| WPP plc | 1,439,873 | 17,012,939 |
| 2,588,942,737 | ||
| Total Common Stock | ||
| (Cost $17,366,469,751) | 17,927,284,030 | |
| Preferred Stock0.7% of net assets | ||
| Germany 0.5% | ||
| Bayerische Motoren Werke AG | 70,434 | 3,792,950 |
| FUCHS PETROLUB SE | 92,350 | 3,232,040 |
| Henkel AG & Co. KGaA | 204,515 | 20,517,738 |
| Porsche Automobil Holding SE | 172,950 | 10,867,716 |
| Sartorius AG | 38,627 | 7,737,660 |
| Volkswagen AG | 207,381 | 33,366,074 |
| 79,514,178 | ||
| Italy 0.0% | ||
| Telecom Italia S.p.A. - RSP | 7,043,300 | 3,593,556 |
| Security | Number of Shares | Value ($) |
| Republic of Korea 0.2% | ||
| Amorepacific Corp. | 13,362 | 796,480 |
| Hyundai Motor Co., Ltd. | 36,137 | 2,267,420 |
| Hyundai Motor Co., Ltd. 2nd | 40,291 | 2,874,008 |
| LG Chem Ltd. | 9,801 | 1,456,495 |
| LG Household & Health Care Ltd. | 2,305 | 1,381,573 |
| Samsung Electronics Co., Ltd. | 907,235 | 27,600,916 |
| 36,376,892 | ||
| Spain 0.0% | ||
| Grifols S.A., B Shares | 265,142 | 5,617,842 |
| Total Preferred Stock | ||
| (Cost $126,758,465) | 125,102,468 | |
| Other Investment Companies0.2% of net assets | ||
| United States 0.2% | ||
| Money Market Fund 0.1% | ||
| State Street Institutional U.S. Government Money Market Fund, Premier Class 2.07%(c) | 16,096,739 | 16,096,739 |
| Securities Lending Collateral 0.1% | ||
| Wells Fargo Government Money Market Fund, Select Class 2.03%(c) | 19,458,984 | 19,458,984 |
| Total Other Investment Companies | ||
| (Cost $35,555,723) | 35,555,723 | |
| Number of Contracts | Notional Amount ($) | Current Value/ Unrealized Depreciation ($) | ||
| Futures Contracts | ||||
| Long | ||||
| MSCI EAFE Index, expires 09/20/19 | 894 | 82,422,330 | (63,284) | |
| * | Non-income producing security. |
| (a) | All or a portion of this security is on loan. Securities on loan were valued at $18,723,737. |
| (b) | Fair-valued by management using significant unobservable inputs in accordance with procedures approved by the fund’s Board of Trustees. |
| (c) | The rate shown is the 7-day yield. |
| REIT — | Real Estate Investment Trust |
| RSP — | Risparmio (Convertible Savings Shares) |
| Security | Number of Shares | Value ($) |
| Common Stock99.0% of net assets | ||
| Australia 6.4% | ||
| A2B Australia Ltd. | 136,793 | 140,090 |
| Abacus Property Group | 422,950 | 1,131,301 |
| Accent Group Ltd. | 409,884 | 441,855 |
| Afterpay Touch Group Ltd. * | 218,358 | 4,557,738 |
| Altium Ltd. | 137,094 | 3,396,338 |
| Appen Ltd. | 135,855 | 2,371,602 |
| ARB Corp., Ltd. | 83,701 | 1,061,327 |
| Ardent Leisure Group Ltd. * | 626,577 | 434,821 |
| Arena REIT | 331,420 | 636,389 |
| Asaleo Care Ltd. * | 403,153 | 264,834 |
| Aurelia Metals Ltd. | 970,235 | 339,922 |
| Ausdrill Ltd. | 847,078 | 1,138,584 |
| Australian Agricultural Co., Ltd. * | 567,299 | 391,773 |
| Australian Pharmaceutical Industries Ltd. | 483,599 | 430,089 |
| Automotive Holdings Group Ltd. | 329,928 | 753,560 |
| Aventus Group(a) | 483,426 | 853,356 |
| Aveo Group | 512,394 | 731,878 |
| Bapcor Ltd. | 351,921 | 1,581,502 |
| Beach Energy Ltd. | 2,203,586 | 3,637,432 |
| Bega Cheese Ltd.(a) | 260,449 | 701,910 |
| Bellamy's Australia Ltd. *(a) | 89,045 | 449,955 |
| Bingo Industries Ltd.(a) | 605,979 | 922,709 |
| Blackmores Ltd.(a) | 16,369 | 795,163 |
| Breville Group Ltd. | 161,562 | 1,769,940 |
| Brickworks Ltd. | 75,267 | 812,900 |
| BWP Trust | 603,340 | 1,585,351 |
| Cardno Ltd. * | 342,832 | 220,589 |
| carsales.com Ltd. | 268,866 | 2,858,523 |
| Cedar Woods Properties Ltd. | 74,630 | 324,319 |
| Centuria Industrial REIT | 285,946 | 647,325 |
| Charter Hall Education Trust | 299,486 | 772,812 |
| Charter Hall Group | 587,909 | 5,010,712 |
| Charter Hall Long Wale REIT | 378,702 | 1,505,388 |
| Charter Hall Retail REIT | 481,530 | 1,414,518 |
| Cleanaway Waste Management Ltd. | 1,734,329 | 2,418,804 |
| Clinuvel Pharmaceuticals Ltd. | 49,519 | 903,148 |
| Collins Foods Ltd. | 132,109 | 768,143 |
| Cooper Energy Ltd. * | 1,715,519 | 664,603 |
| Coronado Global Resources, Inc. | 369,384 | 662,001 |
| Corporate Travel Management Ltd.(a) | 103,812 | 1,214,916 |
| Costa Group Holdings Ltd.(a) | 376,622 | 799,310 |
| Credit Corp. Group Ltd. | 58,337 | 1,131,971 |
| Cromwell Property Group | 2,153,633 | 1,784,743 |
| Dacian Gold Ltd. *(a) | 289,573 | 217,536 |
| Eclipx Group Ltd. | 366,556 | 396,382 |
| Elders Ltd. | 163,602 | 755,054 |
| Emeco Holdings Ltd. * | 386,566 | 492,248 |
| ERM Power Ltd. | 177,689 | 292,112 |
| Estia Health Ltd. | 306,963 | 556,336 |
| FlexiGroup Ltd. | 394,130 | 492,586 |
| Freedom Foods Group Ltd.(a) | 128,021 | 435,583 |
| G.U.D. Holdings Ltd. | 106,622 | 647,247 |
| G8 Education Ltd. | 584,843 | 1,004,797 |
| Galaxy Resources Ltd. *(a) | 514,494 | 400,370 |
| GDI Property Group | 538,570 | 566,064 |
| Security | Number of Shares | Value ($) |
| Genworth Mortgage Insurance Australia Ltd. | 259,284 | 538,053 |
| Gold Road Resources Ltd. * | 1,099,948 | 970,828 |
| GrainCorp Ltd., Class A | 288,251 | 1,551,731 |
| Growthpoint Properties Australia Ltd. | 320,426 | 949,903 |
| GWA Group Ltd. | 314,384 | 698,993 |
| Healius Ltd. | 720,291 | 1,557,800 |
| Hotel Property Investments | 181,253 | 424,975 |
| HT&E Ltd. | 324,778 | 396,063 |
| HUB24 Ltd. | 54,820 | 457,255 |
| IDP Education Ltd. | 157,593 | 1,764,683 |
| IMF Bentham Ltd. * | 236,122 | 485,216 |
| Independence Group NL | 608,171 | 2,229,068 |
| Infigen Energy | 822,572 | 326,983 |
| Ingenia Communities Group | 306,108 | 802,275 |
| Inghams Group Ltd. | 244,806 | 522,854 |
| InvoCare Ltd.(a) | 146,719 | 1,448,181 |
| IPH Ltd. | 203,382 | 1,274,366 |
| IRESS Ltd. | 217,401 | 1,830,924 |
| Japara Healthcare Ltd. | 312,400 | 234,685 |
| JB Hi-Fi Ltd. | 141,839 | 3,144,057 |
| Kidman Resources Ltd. * | 472,557 | 603,340 |
| Link Administration Holdings Ltd. | 645,977 | 2,385,044 |
| Lovisa Holdings Ltd.(a) | 68,131 | 580,676 |
| Lynas Corp., Ltd. * | 839,719 | 1,352,168 |
| MACA Ltd. | 351,628 | 216,772 |
| Mayne Pharma Group Ltd. * | 1,974,543 | 592,005 |
| McMillan Shakespeare Ltd. | 69,124 | 742,362 |
| Mesoblast Ltd. *(a) | 552,379 | 534,057 |
| Mineral Resources Ltd. | 177,467 | 1,580,694 |
| Monadelphous Group Ltd. | 108,649 | 1,164,648 |
| Mount Gibson Iron Ltd. | 866,435 | 417,389 |
| Myer Holdings Ltd. * | 957,352 | 338,633 |
| Nanosonics Ltd. * | 292,178 | 1,313,022 |
| Navigator Global Investments Ltd. | 158,930 | 320,166 |
| nearmap Ltd. * | 447,354 | 822,835 |
| Netwealth Group Ltd. | 99,010 | 508,982 |
| New Century Resources Ltd. *(a) | 563,006 | 111,901 |
| New Hope Corp., Ltd. | 280,452 | 430,816 |
| New South Resources Ltd. * | 796,936 | 985,277 |
| NEXTDC Ltd. * | 436,088 | 1,762,886 |
| nib Holdings Ltd. | 567,502 | 2,825,600 |
| Nine Entertainment Co. Holdings Ltd. | 1,832,111 | 2,456,426 |
| NRW Holdings Ltd. | 474,212 | 773,191 |
| OFX Group Ltd. | 299,123 | 276,102 |
| oOh!media Ltd. | 278,967 | 577,019 |
| Orocobre Ltd. *(a) | 285,145 | 470,685 |
| Pact Group Holdings Ltd. * | 252,829 | 413,935 |
| Pendal Group Ltd. | 335,823 | 1,504,634 |
| Perseus Mining Ltd. * | 1,435,134 | 725,191 |
| Pilbara Minerals Ltd. *(a)(b) | 2,054,525 | 474,378 |
| Premier Investments Ltd. | 98,845 | 989,629 |
| Pro Medicus Ltd. | 51,541 | 1,278,255 |
| Quintis Ltd. *(a)(b) | 227,692 | — |
| Regis Healthcare Ltd. | 172,416 | 324,101 |
| Regis Resources Ltd. | 590,394 | 2,044,579 |
| Reliance Worldwide Corp., Ltd.(a) | 979,358 | 2,527,197 |
| Resolute Mining Ltd. | 740,129 | 832,765 |
| Rural Funds Group | 391,591 | 567,244 |
| Sandfire Resources NL | 191,030 | 801,841 |
| Security | Number of Shares | Value ($) |
| Saracen Mineral Holdings Ltd. * | 968,378 | 2,374,899 |
| SeaLink Travel Group Ltd. | 113,211 | 286,797 |
| Select Harvests Ltd. | 121,649 | 639,296 |
| Senex Energy Ltd. * | 1,716,333 | 445,206 |
| Service Stream Ltd. | 406,550 | 786,130 |
| Seven West Media Ltd. * | 1,108,060 | 279,958 |
| SG Fleet Group Ltd. | 138,327 | 232,994 |
| Sigma Healthcare Ltd. | 1,289,625 | 556,086 |
| SmartGroup Corp., Ltd. | 109,336 | 822,103 |
| Southern Cross Media Group Ltd. | 932,866 | 766,792 |
| SpeedCast International Ltd. | 277,664 | 144,984 |
| St. Barbara Ltd. | 869,381 | 1,886,100 |
| Starpharma Holdings Ltd. * | 443,417 | 328,627 |
| Steadfast Group Ltd. | 966,420 | 2,441,721 |
| Super Retail Group Ltd. | 183,927 | 1,158,660 |
| Superloop Ltd. * | 230,780 | 143,049 |
| Syrah Resources Ltd. * | 532,733 | 242,277 |
| Tassal Group Ltd. | 217,754 | 633,795 |
| Technology One Ltd. | 185,542 | 947,568 |
| Village Roadshow Ltd. * | 126,791 | 237,483 |
| Virgin Australia International Holdings Pty Ltd. *(b) | 424,000 | — |
| Virtus Health Ltd. | 76,209 | 210,518 |
| Vita Group Ltd. | 155,844 | 130,725 |
| Viva Energy Group Ltd. | 1,319,509 | 1,746,923 |
| Viva Energy REIT | 608,260 | 1,208,955 |
| Webjet Ltd. | 159,946 | 1,333,036 |
| Western Areas Ltd. | 310,535 | 518,873 |
| Westgold Resources Ltd. * | 374,476 | 590,389 |
| 140,019,741 | ||
| Austria 1.0% | ||
| Agrana Beteiligungs AG | 13,817 | 243,456 |
| BAWAG Group AG * | 55,869 | 2,123,868 |
| CA Immobilien Anlagen AG | 86,789 | 3,077,560 |
| DO & Co. AG | 8,566 | 848,998 |
| EVN AG | 36,021 | 608,509 |
| Flughafen Wien AG | 12,242 | 502,186 |
| IMMOFINANZ AG * | 120,259 | 3,369,814 |
| Kapsch TrafficCom AG | 5,523 | 198,280 |
| Lenzing AG | 16,361 | 1,545,005 |
| Oesterreichische Post AG | 40,531 | 1,446,166 |
| Palfinger AG | 12,920 | 321,556 |
| Porr AG(a) | 12,264 | 252,017 |
| S IMMO AG | 57,863 | 1,260,414 |
| Schoeller-Bleckmann Oilfield Equipment AG | 14,097 | 895,753 |
| Strabag SE | 19,401 | 634,551 |
| UNIQA Insurance Group AG | 137,265 | 1,216,863 |
| Wienerberger AG | 144,949 | 3,339,357 |
| Zumtobel Group AG * | 39,404 | 280,323 |
| 22,164,676 | ||
| Belgium 2.2% | ||
| Aedifica S.A. | 31,061 | 3,516,369 |
| AGFA-Gevaert N.V. * | 213,934 | 852,853 |
| Argenx SE * | 47,559 | 6,190,648 |
| Barco N.V. | 12,223 | 2,603,276 |
| Befimmo S.A. | 26,764 | 1,582,747 |
| Bekaert S.A. | 43,654 | 1,189,350 |
| bpost S.A. | 123,591 | 1,236,102 |
| Cie d'Entreprises CFE | 8,569 | 785,126 |
| Cofinimmo S.A. | 28,303 | 3,939,721 |
| D'Ieteren S.A. N.V. | 28,184 | 1,424,627 |
| Econocom Group S.A. N.V. | 166,180 | 495,946 |
| Elia System Operator S.A. N.V. | 44,301 | 3,678,500 |
| Security | Number of Shares | Value ($) |
| Euronav N.V. | 202,475 | 1,651,134 |
| EVS Broadcast Equipment S.A. | 16,724 | 407,943 |
| Fagron | 47,972 | 861,644 |
| Gimv N.V. | 22,826 | 1,359,919 |
| Ion Beam Applications * | 27,146 | 478,313 |
| KBC Ancora | 43,785 | 1,735,856 |
| Kinepolis Group N.V. | 16,398 | 948,061 |
| Melexis N.V.(a) | 23,138 | 1,470,238 |
| Mithra Pharmaceuticals S.A. *(a) | 17,413 | 527,342 |
| Montea C.V.A. | 14,838 | 1,230,428 |
| Ontex Group N.V. | 105,319 | 1,742,058 |
| Orange Belgium S.A. | 35,470 | 775,758 |
| Retail Estates N.V. | 10,664 | 948,893 |
| Tessenderlo Group S.A. * | 32,897 | 1,072,344 |
| Titan Cement International S.A. * | 52,144 | 1,050,852 |
| Van de Velde N.V. | 6,822 | 177,300 |
| Warehouses De Pauw SCA | 22,441 | 4,186,408 |
| Wereldhave Belgium N.V. | 2,705 | 237,119 |
| 48,356,875 | ||
| Canada 19.5% | ||
| Aecon Group, Inc. | 73,356 | 1,020,735 |
| Air Canada * | 167,895 | 5,654,200 |
| Alacer Gold Corp. * | 360,243 | 1,583,247 |
| Alamos Gold, Inc., Class A | 488,187 | 3,446,112 |
| Algonquin Power & Utilities Corp. | 614,505 | 8,046,649 |
| Allied Properties Real Estate Investment Trust | 137,790 | 5,443,991 |
| AltaGas Ltd. | 340,711 | 4,635,803 |
| Aphria, Inc. *(a) | 250,914 | 1,584,263 |
| ARC Resources Ltd. | 438,850 | 1,856,063 |
| Artis Real Estate Investment Trust | 159,371 | 1,487,207 |
| Atco Ltd., Class I | 94,337 | 3,377,901 |
| ATS Automation Tooling Systems, Inc. * | 92,308 | 1,276,112 |
| Aurora Cannabis, Inc. *(a) | 993,603 | 5,488,445 |
| B2Gold Corp. * | 1,238,347 | 4,454,620 |
| Baytex Energy Corp. * | 665,223 | 861,065 |
| Birchcliff Energy Ltd. | 325,489 | 433,561 |
| BlackBerry Ltd. * | 624,088 | 4,292,719 |
| Boardwalk Real Estate Investment Trust(a) | 47,206 | 1,569,862 |
| Bombardier, Inc., B Shares * | 2,640,759 | 3,418,201 |
| Boyd Group Income Fund | 24,810 | 3,325,675 |
| BRP, Inc. | 50,999 | 1,832,249 |
| CAE, Inc. | 341,355 | 8,952,605 |
| Cameco Corp. | 494,970 | 4,350,730 |
| Canada Goose Holdings, Inc. * | 71,492 | 2,671,266 |
| Canadian Apartment Properties REIT | 183,236 | 7,384,323 |
| Canadian Western Bank | 109,419 | 2,615,252 |
| Canfor Corp. * | 81,832 | 943,457 |
| Canopy Growth Corp. *(a) | 223,364 | 5,288,254 |
| Capital Power Corp. | 126,770 | 2,912,619 |
| Cascades, Inc. | 82,684 | 701,893 |
| CCL Industries, Inc., Class B | 183,363 | 8,325,022 |
| Celestica, Inc. * | 144,741 | 941,122 |
| Centerra Gold, Inc. * | 271,790 | 2,476,954 |
| CES Energy Solutions Corp. | 312,459 | 453,827 |
| Chartwell Retirement Residences | 276,391 | 3,103,367 |
| China Gold International Resources Corp., Ltd. * | 286,908 | 297,963 |
| Choice Properties Real Estate Investment Trust | 289,433 | 3,021,099 |
| CI Financial Corp. | 291,226 | 4,181,662 |
| Cineplex, Inc. | 80,193 | 1,496,679 |
| Cogeco Communications, Inc. | 13,818 | 1,088,136 |
| Colliers International Group, Inc. | 44,961 | 3,038,454 |
| Cominar Real Estate Investment Trust | 230,417 | 2,169,263 |
| Security | Number of Shares | Value ($) |
| Corus Entertainment, Inc., B Shares | 247,447 | 949,714 |
| Cott Corp. | 168,557 | 2,128,527 |
| Crescent Point Energy Corp. | 676,842 | 2,139,326 |
| Cronos Group, Inc. *(a) | 419,976 | 4,642,871 |
| Detour Gold Corp. * | 221,390 | 3,973,624 |
| Dream Global Real Estate Investment Trust | 224,795 | 2,452,986 |
| Dream Office Real Estate Investment Trust | 61,579 | 1,263,278 |
| ECN Capital Corp. | 272,680 | 956,268 |
| Eldorado Gold Corp. * | 196,627 | 1,811,194 |
| Element Fleet Management Corp. | 538,771 | 4,322,170 |
| Emera, Inc. | 293,524 | 12,741,168 |
| Empire Co., Ltd., A Shares | 215,316 | 5,951,653 |
| Endeavour Mining Corp. * | 92,204 | 1,800,643 |
| Enerflex Ltd. | 110,257 | 1,012,293 |
| Enerplus Corp. | 297,270 | 1,948,541 |
| Enghouse Systems Ltd. | 48,016 | 1,378,184 |
| Ensign Energy Services, Inc. | 160,282 | 359,452 |
| Finning International, Inc. | 206,742 | 3,590,913 |
| First Capital Realty, Inc. | 193,664 | 3,232,592 |
| First Majestic Silver Corp. *(a) | 200,784 | 2,187,953 |
| First National Financial Corp. | 19,977 | 548,736 |
| First Quantum Minerals Ltd. | 852,256 | 5,233,601 |
| FirstService Corp. | 38,529 | 4,010,055 |
| Genworth MI Canada, Inc. | 47,695 | 1,809,022 |
| Gibson Energy, Inc. | 184,230 | 3,191,582 |
| Gildan Activewear, Inc. | 258,545 | 9,496,976 |
| Gran Tierra Energy, Inc. * | 489,173 | 695,768 |
| Granite Real Estate Investment Trust | 62,379 | 2,990,793 |
| Great Canadian Gaming Corp. * | 70,470 | 2,111,767 |
| H&R Real Estate Investment Trust | 361,284 | 6,152,812 |
| Home Capital Group, Inc. * | 78,212 | 1,506,794 |
| Hudbay Minerals, Inc. | 297,662 | 1,001,316 |
| Hudson's Bay Co.(a) | 126,428 | 978,085 |
| IA Financial Corp., Inc. * | 137,430 | 5,726,595 |
| IAMGOLD Corp. * | 580,184 | 2,170,014 |
| Innergex Renewable Energy, Inc. | 157,033 | 1,752,558 |
| Ivanhoe Mines Ltd., Class A * | 787,003 | 2,203,229 |
| Just Energy Group, Inc. | 123,384 | 135,566 |
| Kelt Exploration Ltd. * | 191,280 | 405,937 |
| Keyera Corp. | 264,168 | 6,387,506 |
| Kinaxis, Inc. * | 31,766 | 1,854,132 |
| Kinross Gold Corp. * | 1,556,869 | 7,756,226 |
| Kirkland Lake Gold Ltd. | 233,459 | 11,374,274 |
| Laurentian Bank of Canada | 51,731 | 1,691,535 |
| Linamar Corp. | 57,627 | 1,753,790 |
| Lundin Mining Corp. | 803,987 | 3,842,051 |
| Maple Leaf Foods, Inc. | 97,155 | 2,314,816 |
| Martinrea International, Inc. | 107,792 | 828,233 |
| MEG Energy Corp. * | 308,269 | 1,178,512 |
| Methanex Corp. | 95,174 | 3,091,293 |
| Morguard Real Estate Investment Trust | 30,169 | 254,057 |
| Mullen Group Ltd. | 122,590 | 826,615 |
| NFI Group, Inc. | 67,987 | 1,486,832 |
| Norbord, Inc.(a) | 62,810 | 1,538,580 |
| Northland Power, Inc. | 147,126 | 2,795,704 |
| Northview Apartment Real Estate Investment Trust | 60,127 | 1,339,826 |
| NOVAGOLD RESOURCES, Inc. * | 297,590 | 2,223,863 |
| NuVista Energy Ltd. * | 242,218 | 293,476 |
| OceanaGold Corp. | 782,973 | 1,879,654 |
| Onex Corp. | 103,173 | 6,073,293 |
| Open Text Corp. | 325,324 | 12,752,955 |
| Osisko Gold Royalties Ltd. | 192,455 | 2,456,379 |
| Pan American Silver Corp. | 258,086 | 4,766,278 |
| Paramount Resources Ltd., A Shares *(a) | 92,981 | 396,751 |
| Parex Resources, Inc. * | 185,702 | 2,849,536 |
| Parkland Fuel Corp. | 183,809 | 5,743,340 |
| Security | Number of Shares | Value ($) |
| Pason Systems, Inc. | 91,178 | 1,083,459 |
| Peyto Exploration & Development Corp.(a) | 197,397 | 475,369 |
| PrairieSky Royalty Ltd.(a) | 291,889 | 3,705,725 |
| Precision Drilling Corp. * | 371,728 | 447,595 |
| Premium Brands Holdings Corp. | 36,712 | 2,708,367 |
| Pretium Resources, Inc. * | 217,811 | 2,863,605 |
| Quebecor, Inc., Class B | 147,356 | 3,325,712 |
| Ritchie Bros. Auctioneers, Inc. | 136,740 | 5,420,000 |
| Russel Metals, Inc. | 78,518 | 1,182,379 |
| Secure Energy Services, Inc. | 197,124 | 826,295 |
| SEMAFO, Inc. * | 400,698 | 1,492,666 |
| Seven Generations Energy Ltd., A Shares * | 337,120 | 1,826,659 |
| ShawCor Ltd. | 87,394 | 1,095,056 |
| Sierra Wireless, Inc. * | 44,681 | 483,529 |
| SmartCentres Real Estate Investment Trust | 159,799 | 3,807,372 |
| SSR Mining, Inc. * | 151,285 | 2,489,918 |
| Stantec, Inc. | 142,027 | 3,097,488 |
| Stella-Jones, Inc. | 70,107 | 2,067,650 |
| Superior Plus Corp. | 176,213 | 1,536,957 |
| TFI International, Inc. | 102,440 | 2,987,319 |
| The Descartes Systems Group, Inc. * | 97,546 | 3,466,377 |
| The North West Co., Inc. | 60,400 | 1,406,364 |
| The Stars Group, Inc. * | 188,402 | 2,868,282 |
| TMX Group Ltd. | 69,379 | 6,020,539 |
| TORC Oil & Gas Ltd. | 182,165 | 453,767 |
| Torex Gold Resources, Inc. * | 109,535 | 1,762,386 |
| Toromont Industries Ltd. | 98,020 | 4,704,045 |
| Tourmaline Oil Corp. | 319,785 | 3,037,091 |
| TransAlta Corp. | 363,235 | 2,342,658 |
| TransAlta Renewables, Inc. | 120,170 | 1,185,603 |
| Transcontinental, Inc., Class A | 92,055 | 975,417 |
| Turquoise Hill Resources Ltd. * | 1,231,724 | 537,628 |
| Vermilion Energy, Inc.(a) | 170,361 | 2,429,516 |
| West Fraser Timber Co., Ltd. | 75,350 | 2,659,479 |
| WestJet Airlines Ltd. | 69,188 | 1,606,820 |
| Westshore Terminals Investment Corp. | 56,534 | 929,612 |
| Whitecap Resources, Inc. | 502,723 | 1,388,466 |
| Winpak Ltd. | 38,721 | 1,362,578 |
| WSP Global, Inc. | 129,424 | 7,020,531 |
| Yamana Gold, Inc. | 1,178,746 | 4,266,833 |
| 425,563,802 | ||
| Denmark 1.4% | ||
| ALK-Abello A/S * | 8,032 | 1,624,052 |
| Alm Brand A/S | 76,601 | 597,933 |
| Bang & Olufsen A/S * | 42,724 | 284,339 |
| Bavarian Nordic A/S *(a) | 41,160 | 1,083,014 |
| D/S Norden A/S | 33,782 | 440,574 |
| Dfds A/S | 36,783 | 1,268,005 |
| FLSmidth & Co. A/S | 63,647 | 2,745,885 |
| Matas A/S | 37,578 | 296,934 |
| Netcompany Group A/S * | 40,916 | 1,647,373 |
| Nilfisk Holding A/S * | 34,254 | 769,002 |
| NKT A/S *(a) | 34,254 | 449,006 |
| Ringkjoebing Landbobank A/S | 35,653 | 2,140,570 |
| Royal Unibrew A/S | 62,729 | 5,442,208 |
| Scandinavian Tobacco Group A/S, Class A | 83,177 | 958,232 |
| Schouw & Co. A/S | 15,543 | 1,070,237 |
| SimCorp A/S | 49,540 | 4,620,641 |
| Solar A/S, B Shares | 5,727 | 230,921 |
| Spar Nord Bank A/S | 103,099 | 790,305 |
| Sydbank A/S | 69,197 | 969,387 |
| Topdanmark A/S | 52,589 | 2,622,226 |
| 30,050,844 | ||
| Security | Number of Shares | Value ($) |
| Finland 1.1% | ||
| Ahlstrom-Munksjo Oyj | 47,322 | 749,390 |
| Cargotec Oyj, B Shares | 60,499 | 1,720,245 |
| Caverion Oyj | 123,080 | 788,854 |
| Citycon Oyj(a) | 97,442 | 1,051,082 |
| Cramo Oyj | 52,438 | 438,302 |
| DNA Oyj | 78,596 | 1,815,900 |
| F-Secure Oyj * | 115,132 | 322,044 |
| Finnair Oyj | 74,312 | 508,202 |
| Kemira Oyj | 110,253 | 1,554,126 |
| Konecranes Oyj | 91,149 | 2,713,213 |
| Metsa Board Oyj | 216,710 | 1,139,801 |
| Oriola Oyj, B Shares | 151,321 | 337,451 |
| Outokumpu Oyj(a) | 379,452 | 1,097,749 |
| Outotec Oyj * | 184,318 | 1,050,220 |
| Raisio Oyj, V Shares | 146,119 | 506,878 |
| Sanoma Oyj | 97,656 | 1,003,382 |
| Tieto Oyj | 93,495 | 2,304,276 |
| Uponor Oyj | 67,965 | 702,808 |
| Valmet Oyj | 166,704 | 3,021,773 |
| YIT Oyj | 198,111 | 1,094,121 |
| 23,919,817 | ||
| France 3.0% | ||
| Akka Technologies | 13,681 | 887,399 |
| Albioma S.A. | 32,814 | 849,206 |
| Altarea S.C.A. | 5,688 | 1,170,098 |
| Alten S.A. | 35,618 | 4,259,762 |
| Altran Technologies S.A. | 290,817 | 4,634,195 |
| Beneteau S.A. | 43,744 | 412,602 |
| Bonduelle S.C.A. | 18,445 | 474,298 |
| Carmila S.A. | 37,733 | 625,795 |
| CGG S.A. * | 906,418 | 1,847,655 |
| Coface S.A. | 110,698 | 1,309,272 |
| DBV Technologies S.A. *(a) | 36,748 | 672,995 |
| Derichebourg S.A. | 110,095 | 393,794 |
| Elior Group S.A. | 129,361 | 1,649,673 |
| Eramet | 11,120 | 552,535 |
| Etablissements Maurel et Prom S.A. | 69,146 | 221,969 |
| Euronext N.V. | 87,261 | 6,856,462 |
| Europcar Mobility Group | 131,785 | 811,267 |
| FFP | 6,466 | 617,363 |
| Fnac Darty S.A. * | 21,188 | 1,384,831 |
| Gaztransport Et Technigaz S.A. | 27,963 | 2,620,591 |
| Genfit *(a) | 45,537 | 796,846 |
| GL Events | 16,562 | 435,910 |
| Groupe Crit | 3,290 | 239,125 |
| Guerbet | 6,102 | 328,264 |
| Interparfums S.A. | 16,402 | 719,799 |
| IPSOS | 46,923 | 1,266,012 |
| Jacquet Metal Service S.A. | 17,097 | 309,157 |
| Korian S.A. | 58,428 | 2,334,394 |
| LISI | 21,406 | 572,833 |
| Maisons du Monde S.A. | 54,323 | 981,699 |
| Manitou BF S.A. | 15,635 | 314,057 |
| Mercialys S.A. | 76,872 | 920,203 |
| Mersen S.A. | 17,188 | 584,884 |
| Metropole Television S.A. | 79,199 | 1,362,344 |
| Neoen S.A. * | 26,777 | 712,139 |
| Neopost S.A. | 41,723 | 849,568 |
| Nexans S.A. | 37,873 | 1,217,863 |
| Nexity S.A. | 53,617 | 2,495,272 |
| Pharmagest Inter@ctive | 4,547 | 265,391 |
| Rothschild & Co. | 35,888 | 1,023,611 |
| SMCP S.A. * | 30,957 | 419,324 |
| SOITEC * | 22,520 | 2,275,414 |
| Security | Number of Shares | Value ($) |
| Sopra Steria Group | 17,734 | 2,277,148 |
| SPIE S.A. | 150,847 | 2,740,984 |
| Synergie S.A. | 8,305 | 253,798 |
| Tarkett S.A. | 39,811 | 590,112 |
| Technicolor S.A. * | 466,620 | 408,523 |
| Television Francaise 1 S.A. | 128,645 | 1,171,613 |
| Trigano S.A. | 10,269 | 986,687 |
| Vallourec S.A. *(a) | 386,601 | 1,088,203 |
| Vicat S.A. | 18,588 | 813,684 |
| Vilmorin & Cie S.A. | 8,083 | 434,834 |
| Virbac S.A. * | 5,309 | 985,726 |
| X-Fab Silicon Foundries SE * | 65,433 | 263,733 |
| 64,690,916 | ||
| Germany 4.7% | ||
| Aareal Bank AG | 76,521 | 2,175,819 |
| ADO Properties S.A. | 36,177 | 1,486,826 |
| AIXTRON SE * | 135,071 | 1,335,153 |
| alstria Office REIT-AG | 201,976 | 3,345,288 |
| Aurubis AG | 45,218 | 2,006,792 |
| BayWa AG | 17,461 | 466,301 |
| Bechtle AG | 34,286 | 3,398,171 |
| Befesa S.A. | 34,742 | 1,186,048 |
| Bertrandt AG | 5,830 | 290,197 |
| Bilfinger SE | 34,663 | 952,789 |
| CANCOM SE | 42,376 | 2,515,328 |
| CECONOMY AG * | 222,696 | 1,139,158 |
| comdirect bank AG | 37,663 | 378,265 |
| CompuGroup Medical SE | 28,337 | 1,618,037 |
| Corestate Capital Holding S.A. * | 13,643 | 430,448 |
| CTS Eventim AG & Co., KGaA | 69,024 | 3,785,432 |
| Dermapharm Holding SE | 14,548 | 513,793 |
| Deutsche Beteiligungs AG | 13,073 | 463,572 |
| Deutsche Euroshop AG | 64,396 | 1,672,202 |
| Deutsche Pfandbriefbank AG | 152,825 | 1,814,258 |
| Deutz AG | 153,438 | 895,560 |
| Dialog Semiconductor plc * | 95,902 | 4,537,095 |
| DIC Asset AG | 55,276 | 751,169 |
| DMG Mori AG | 23,781 | 1,114,335 |
| Duerr AG | 61,005 | 1,550,555 |
| ElringKlinger AG * | 40,036 | 213,394 |
| Evotec SE * | 168,398 | 3,729,365 |
| Freenet AG | 160,304 | 3,137,906 |
| Gerresheimer AG | 39,950 | 3,020,253 |
| Grand City Properties S.A. | 138,774 | 3,190,983 |
| Hamburger Hafen und Logistik AG | 28,809 | 697,336 |
| Heidelberger Druckmaschinen AG * | 390,867 | 479,943 |
| Hornbach Holding AG & Co. KGaA | 10,473 | 568,020 |
| Hypoport AG * | 4,969 | 1,305,099 |
| Indus Holding AG | 22,801 | 873,814 |
| Isra Vision AG | 20,187 | 731,398 |
| Jenoptik AG | 64,077 | 1,541,841 |
| Kloeckner & Co. SE | 91,815 | 550,551 |
| Koenig & Bauer AG | 16,950 | 586,118 |
| Krones AG | 18,177 | 1,000,871 |
| KWS Saat SE & Co. KGaA | 12,703 | 871,526 |
| Leoni AG * | 39,668 | 500,186 |
| MorphoSys AG * | 39,823 | 4,714,421 |
| Nemetschek SE | 68,759 | 3,648,231 |
| New Work SE * | 3,567 | 1,044,890 |
| Nordex SE * | 78,562 | 794,653 |
| Norma Group SE | 40,060 | 1,267,014 |
| PATRIZIA AG | 55,521 | 1,014,966 |
| Pfeiffer Vacuum Technology AG | 8,226 | 1,235,632 |
| Rhoen-Klinikum AG | 25,598 | 634,270 |
| RIB Software SE | 51,618 | 1,151,666 |
| S&T AG | 61,547 | 1,290,505 |
| Security | Number of Shares | Value ($) |
| Salzgitter AG | 47,347 | 860,585 |
| SGL Carbon SE * | 62,967 | 311,070 |
| Siltronic AG | 25,701 | 1,657,437 |
| Sixt SE | 16,898 | 1,623,628 |
| SMA Solar Technology AG * | 11,362 | 265,263 |
| Software AG | 62,713 | 1,692,036 |
| Stabilus S.A. | 31,090 | 1,398,959 |
| Stroeer SE & CO. KGaA | 30,788 | 2,303,864 |
| TAG Immobilien AG * | 158,301 | 3,702,748 |
| Takkt AG | 40,156 | 509,435 |
| Tele Columbus AG * | 121,107 | 252,601 |
| TLG Immobilien AG | 107,991 | 3,246,655 |
| Varta AG * | 16,524 | 1,401,173 |
| Vossloh AG | 10,166 | 388,477 |
| Wacker Neuson SE | 31,996 | 568,702 |
| Washtec AG | 13,152 | 704,629 |
| Wuestenrot & Wuerttembergische AG | 22,478 | 442,600 |
| zooplus AG * | 7,965 | 1,057,838 |
| 102,005,143 | ||
| Hong Kong 1.5% | ||
| Agritrade Resources Ltd. | 2,842,168 | 330,090 |
| Anton Oilfield Services Group | 2,334,226 | 238,328 |
| Asia Cement China Holdings Corp. | 544,400 | 639,216 |
| Beijing Sports and Entertainment Industry Group Ltd. * | 1,102,976 | 44,342 |
| Beijing Tong Ren Tang Chinese Medicine Co., Ltd. | 305,304 | 516,675 |
| Camsing International Holding Ltd.(b) | 459,925 | 21,108 |
| Canvest Environmental Protection Group Co., Ltd. | 890,988 | 424,153 |
| China Animal Healthcare Ltd. *(b) | 192,752 | — |
| China Harmony New Energy Auto Holding Ltd. | 890,505 | 261,400 |
| China LNG Group Ltd. * | 1,000,000 | 68,918 |
| Chinese Estates Holdings Ltd. | 611,654 | 392,659 |
| Chow Sang Sang Holdings International Ltd. | 287,334 | 328,943 |
| CITIC Telecom International Holdings Ltd. | 1,810,851 | 707,206 |
| COFCO Meat Holdings Ltd. * | 2,135,520 | 613,236 |
| Crystal International Group Ltd. | 592,402 | 236,648 |
| Digital Domain Holdings Ltd. * | 21,146,888 | 221,310 |
| Dynam Japan Holdings Co., Ltd. | 354,196 | 439,843 |
| Emperor Capital Group Ltd. | 4,861,558 | 143,327 |
| Esprit Holdings Ltd. * | 2,163,446 | 325,814 |
| Far East Consortium International Ltd. | 1,251,423 | 563,794 |
| Fortune Real Estate Investment Trust | 1,695,788 | 1,947,851 |
| G-Resources Group Ltd. * | 28,306,770 | 180,635 |
| GCL New Energy Holdings Ltd. * | 8,899,783 | 301,000 |
| Gemdale Properties & Investment Corp., Ltd. | 6,706,916 | 744,704 |
| Giordano International Ltd. | 1,465,834 | 458,345 |
| Goodbaby International Holdings Ltd. * | 1,102,630 | 209,680 |
| HC Group, Inc. * | 598,972 | 181,939 |
| HKBN Ltd. | 1,191,315 | 2,137,733 |
| Hong Kong Television Network Ltd. * | 500,000 | 214,413 |
| Honghua Group Ltd. * | 2,826,000 | 201,977 |
| IGG, Inc. | 1,127,078 | 762,380 |
| IMAX China Holding, Inc. | 126,927 | 274,740 |
| Inspur International Ltd. | 722,364 | 318,066 |
| Ju Teng International Holdings Ltd. | 1,120,636 | 256,011 |
| K Wah International Holdings Ltd. | 1,552,378 | 808,350 |
| Lee's Pharmaceutical Holdings Ltd. | 323,706 | 156,991 |
| Luk Fook Holdings International Ltd. | 427,834 | 1,069,128 |
| Man Wah Holdings Ltd. | 1,894,771 | 868,146 |
| Mandarin Oriental International Ltd. | 379,313 | 527,245 |
| Security | Number of Shares | Value ($) |
| Microport Scientific Corp. | 513,724 | 455,676 |
| Nan Hai Corp., Ltd. | 16,959,772 | 270,565 |
| NewOcean Energy Holdings Ltd. * | 1,175,663 | 243,075 |
| NOVA Group Holdings Ltd. | 1,379,392 | 290,478 |
| Pacific Basin Shipping Ltd. | 5,119,016 | 999,585 |
| Pacific Textiles Holdings Ltd. | 641,707 | 433,246 |
| Pou Sheng International Holdings Ltd. | 2,590,821 | 790,273 |
| Prosperity REIT | 1,436,562 | 533,530 |
| Razer, Inc. * | 4,519,162 | 824,775 |
| Regina Miracle International Holdings Ltd. | 417,118 | 266,709 |
| Road King Infrastructure Ltd. | 333,097 | 585,816 |
| Singamas Container Holdings Ltd. | 1,759,914 | 211,135 |
| SITC International Holdings Co., Ltd. | 1,460,592 | 1,517,382 |
| SmarTone Telecommunications Holdings Ltd. | 494,406 | 439,803 |
| Sun Hung Kai & Co., Ltd. | 661,333 | 279,377 |
| Suncity Group Holdings Ltd. * | 2,673,934 | 395,868 |
| SUNeVision Holdings Ltd. | 747,640 | 504,766 |
| Sunlight Real Estate Investment Trust | 1,379,538 | 903,218 |
| Superb Summit International Group Ltd. *(b) | 1,120,000 | — |
| Texwinca Holdings Ltd. | 803,408 | 190,718 |
| The Hongkong & Shanghai Hotels Ltd. | 972,422 | 1,030,088 |
| The United Laboratories International Holdings Ltd.(a) | 614,170 | 352,730 |
| Town Health International Medical Group Ltd.(a)(b) | 3,638,120 | — |
| TPV Technology Ltd. | 1,010,700 | 470,822 |
| Truly International Holdings Ltd. *(a) | 2,124,772 | 273,889 |
| Value Partners Group Ltd. | 1,228,800 | 627,311 |
| VSTECS Holdings Ltd. | 795,448 | 405,067 |
| We Solutions Ltd. * | 4,398,534 | 238,582 |
| Xiabuxiabu Catering Management China Holdings Co., Ltd. * | 354,640 | 457,142 |
| 32,127,970 | ||
| Ireland 0.4% | ||
| C&C Group plc | 401,146 | 1,758,213 |
| Cairn Homes plc * | 933,288 | 1,056,561 |
| Dalata Hotel Group plc | 228,970 | 1,098,127 |
| Green REIT plc | 855,266 | 1,795,188 |
| Hibernia REIT plc | 866,314 | 1,400,514 |
| Irish Continental Group plc | 199,231 | 822,762 |
| Permanent TSB Group Holdings plc * | 137,950 | 149,031 |
| 8,080,396 | ||
| Israel 0.7% | ||
| AFI Properties Ltd. * | 16,449 | 538,089 |
| Allot Ltd. * | 36,773 | 278,499 |
| AudioCodes Ltd. | 26,982 | 468,684 |
| Bayside Land Corp. | 785 | 464,230 |
| Big Shopping Centers Ltd. | 4,662 | 392,555 |
| Brack Capital Properties N.V. * | 2,992 | 285,272 |
| Cellcom Israel Ltd. * | 82,023 | 190,471 |
| Clal Insurance Enterprises Holdings Ltd. * | 48,861 | 727,639 |
| Delek Automotive Systems Ltd. | 45,397 | 200,322 |
| Delta Galil Industries Ltd. | 10,358 | 270,894 |
| Electra Ltd. | 2,192 | 671,119 |
| Formula Systems 1985 Ltd. | 9,408 | 578,216 |
| Gilat Satellite Networks Ltd. | 35,460 | 284,724 |
| Hilan Ltd. | 17,864 | 715,926 |
| IDI Insurance Co., Ltd. | 9,368 | 340,148 |
| Jerusalem Economy Ltd. * | 205,266 | 872,050 |
| Kamada Ltd. * | 38,618 | 218,096 |
| Kenon Holdings Ltd. | 18,709 | 396,674 |
| Security | Number of Shares | Value ($) |
| Matrix IT Ltd. | 37,694 | 595,289 |
| Menora Mivtachim Holdings Ltd. | 29,006 | 424,482 |
| Naphtha Israel Petroleum Corp., Ltd. | 41,244 | 241,337 |
| Nova Measuring Instruments Ltd. * | 35,521 | 977,878 |
| Partner Communications Co., Ltd. * | 120,657 | 519,774 |
| Rami Levy Chain Stores Hashikma Marketing 2006 Ltd. | 10,059 | 526,490 |
| Reit 1 Ltd. | 218,405 | 1,283,553 |
| Sella Capital Real Estate Ltd. | 252,864 | 615,983 |
| Shapir Engineering and Industry Ltd. | 138,307 | 591,891 |
| Shikun & Binui Ltd. | 248,073 | 797,459 |
| 14,467,744 | ||
| Italy 2.7% | ||
| ACEA S.p.A. | 53,787 | 1,046,054 |
| Amplifon S.p.A. | 148,889 | 3,830,199 |
| Anima Holding S.p.A. | 342,261 | 1,236,281 |
| Arnoldo Mondadori Editore S.p.A. * | 166,869 | 257,638 |
| ASTM S.p.A. | 43,517 | 1,344,722 |
| Autogrill S.p.A. | 161,990 | 1,561,817 |
| Azimut Holding S.p.A. | 151,344 | 2,670,848 |
| Banca Farmafactoring S.p.A. | 135,605 | 688,434 |
| Banca Generali S.p.A. | 71,940 | 2,140,630 |
| Banca IFIS S.p.A. | 27,973 | 430,042 |
| Banca Monte dei Paschi di Siena S.p.A. * | 354,275 | 565,711 |
| Banca Popolare di Sondrio Scarl | 563,579 | 1,055,090 |
| Biesse S.p.A. | 16,152 | 178,230 |
| BPER Banca | 481,274 | 1,708,200 |
| Brunello Cucinelli S.p.A. | 41,631 | 1,294,695 |
| C.I.R. - Compagnie Industriali Riunite S.p.A. | 358,290 | 363,001 |
| Cairo Communication S.p.A. | 82,720 | 202,687 |
| Carel Industries S.p.A. | 51,811 | 631,049 |
| Cementir Holding S.p.A. | 54,678 | 357,070 |
| Cerved Group S.p.A. | 232,577 | 1,876,119 |
| Credito Emiliano S.p.A. | 96,460 | 506,701 |
| Danieli & C Officine Meccaniche S.p.A. | 17,097 | 279,409 |
| Datalogic S.p.A. | 25,783 | 368,832 |
| De'Longhi S.p.A. | 81,011 | 1,575,508 |
| doValue S.p.A. | 49,782 | 548,224 |
| Enav S.p.A. | 312,100 | 1,766,619 |
| ERG S.p.A. | 69,611 | 1,349,967 |
| Fincantieri S.p.A. * | 597,598 | 603,811 |
| Freni Brembo S.p.A. | 184,931 | 1,728,015 |
| Gima TT S.p.A. | 43,349 | 332,973 |
| IMA Industria Macchine Automatiche S.p.A. | 21,557 | 1,476,606 |
| Immobiliare Grande Distribuzione SIIQ S.p.A. | 59,491 | 349,847 |
| Infrastrutture Wireless Italiane S.p.A. | 303,101 | 3,034,151 |
| Interpump Group S.p.A. | 98,750 | 2,820,935 |
| Iren S.p.A. | 816,799 | 2,221,765 |
| Italmobiliare S.p.A. | 13,735 | 302,211 |
| Juventus Football Club S.p.A. *(a) | 472,113 | 766,874 |
| Maire Tecnimont S.p.A.(a) | 179,471 | 437,976 |
| MARR S.p.A. | 40,960 | 891,318 |
| OVS S.p.A. * | 215,357 | 394,400 |
| Piaggio & C S.p.A. | 200,914 | 650,052 |
| RAI Way S.p.A. | 125,294 | 703,698 |
| Reply S.p.A. | 25,438 | 1,505,731 |
| Salini Impregilo S.p.A *(a) | 215,514 | 419,845 |
| Saras S.p.A. | 690,300 | 1,074,913 |
| Societa Cattolica di Assicurazioni SC | 193,390 | 1,577,048 |
| Societa Iniziative Autostradali e Servizi S.p.A. | 70,098 | 1,178,774 |
| Tamburi Investment Partners S.p.A. | 126,204 | 792,198 |
| Security | Number of Shares | Value ($) |
| Technogym S.p.A. | 139,138 | 1,410,443 |
| Tod's S.p.A.(a) | 16,476 | 843,705 |
| Unipol Gruppo S.p.A. | 602,742 | 3,033,427 |
| Zignago Vetro S.p.A. | 39,065 | 432,785 |
| 58,817,278 | ||
| Japan 18.8% | ||
| Achilles Corp. | 15,775 | 219,954 |
| Adastria Co., Ltd. | 34,958 | 677,127 |
| ADEKA Corp. | 123,452 | 1,499,172 |
| Advan Co., Ltd. | 30,508 | 329,669 |
| Aeon Delight Co., Ltd. | 22,941 | 708,903 |
| Ai Holdings Corp. | 42,626 | 699,557 |
| Aichi Corp. | 31,720 | 193,646 |
| Aichi Steel Corp. | 14,441 | 423,115 |
| Aida Engineering Ltd. | 71,794 | 543,130 |
| Aiphone Co., Ltd. | 14,916 | 222,732 |
| Aisan Industry Co., Ltd. | 41,162 | 279,209 |
| Akatsuki, Inc. | 6,174 | 408,905 |
| Alconix Corp. | 25,722 | 278,678 |
| Alpen Co., Ltd. | 20,120 | 293,616 |
| Alpha Systems, Inc. | 8,000 | 195,958 |
| Amano Corp. | 85,193 | 2,548,286 |
| Amuse, Inc. | 11,036 | 263,462 |
| Anest Iwata Corp. | 39,531 | 331,830 |
| Anicom Holdings, Inc. | 24,439 | 953,200 |
| Anritsu Corp.(a) | 172,516 | 3,232,694 |
| AOKI Holdings, Inc. | 46,897 | 459,051 |
| Arakawa Chemical Industries Ltd. | 22,126 | 282,868 |
| Arata Corp. | 15,705 | 538,567 |
| Arcland Sakamoto Co., Ltd. | 31,125 | 352,757 |
| Arcland Service Holdings Co., Ltd. | 16,914 | 303,558 |
| Arcs Co., Ltd. | 42,654 | 885,268 |
| Argo Graphics, Inc. | 18,256 | 458,356 |
| ARTERIA Networks Corp. * | 24,985 | 338,014 |
| Aruhi Corp.(a) | 21,782 | 397,902 |
| AS One Corp. | 14,985 | 1,335,514 |
| Asahi Diamond Industrial Co., Ltd. | 63,419 | 358,485 |
| Asahi Holdings, Inc. | 45,234 | 956,713 |
| ASAHI YUKIZAI Corp. | 15,450 | 179,761 |
| ASKA Pharmaceutical Co., Ltd. | 26,172 | 255,198 |
| Asunaro Aoki Construction Co., Ltd. | 26,472 | 301,518 |
| Atom Corp.(a) | 104,358 | 982,181 |
| Avex, Inc. | 40,266 | 476,842 |
| Axial Retailing, Inc. | 17,144 | 613,757 |
| Bando Chemical Industries Ltd. | 52,872 | 409,447 |
| Bank of the Ryukyus Ltd. | 52,747 | 523,271 |
| Belc Co., Ltd. | 10,817 | 520,749 |
| Bell System24 Holdings, Inc. | 41,467 | 627,015 |
| Belluna Co., Ltd. | 56,539 | 335,042 |
| BML, Inc. | 26,444 | 751,130 |
| Broadleaf Co., Ltd. | 100,064 | 524,147 |
| BRONCO BILLY Co., Ltd. | 12,530 | 259,465 |
| Bunka Shutter Co., Ltd. | 69,307 | 571,328 |
| CAC Holdings Corp. | 14,009 | 163,259 |
| Canon Electronics, Inc. | 21,390 | 361,521 |
| Cawachi Ltd. | 13,939 | 264,742 |
| Central Glass Co., Ltd. | 50,266 | 1,043,726 |
| Central Security Patrols Co., Ltd.(a) | 8,026 | 388,654 |
| Central Sports Co., Ltd. | 7,060 | 203,197 |
| Change, Inc. *(a) | 11,396 | 195,829 |
| CHIMNEY Co., Ltd. | 8,357 | 191,870 |
| Chiyoda Co., Ltd. | 31,202 | 449,753 |
| Chiyoda Corp. * | 190,376 | 530,890 |
| Chiyoda Integre Co., Ltd. | 14,320 | 265,772 |
| Chofu Seisakusho Co., Ltd. | 24,301 | 490,393 |
| Chubu Shiryo Co., Ltd. | 30,031 | 316,592 |
| Security | Number of Shares | Value ($) |
| Chudenko Corp. | 30,809 | 652,201 |
| Chugoku Marine Paints Ltd. | 62,323 | 502,013 |
| CI Takiron Corp. | 48,008 | 283,584 |
| CKD Corp. | 67,584 | 673,643 |
| CMIC Holdings Co., Ltd. | 11,000 | 176,796 |
| CMK Corp. | 63,596 | 298,373 |
| Cocokara fine, Inc. | 23,030 | 1,264,920 |
| COLOPL, Inc. | 62,814 | 407,733 |
| Colowide Co., Ltd. | 72,220 | 1,402,964 |
| Computer Engineering & Consulting Ltd. | 30,193 | 639,729 |
| CONEXIO Corp. | 19,240 | 243,615 |
| Cosel Co., Ltd. | 27,304 | 260,834 |
| Create Restaurants Holdings, Inc.(a) | 55,497 | 847,003 |
| Create SD Holdings Co., Ltd. | 26,461 | 596,055 |
| CTS Co., Ltd. | 32,000 | 205,606 |
| Cybozu, Inc. | 30,062 | 316,919 |
| Dai Nippon Toryo Co., Ltd. | 29,983 | 273,998 |
| Dai-Dan Co., Ltd. | 16,382 | 325,803 |
| Daibiru Corp. | 59,692 | 575,860 |
| Daido Metal Co., Ltd. | 56,598 | 319,395 |
| Daihen Corp. | 25,165 | 723,098 |
| Daiho Corp. | 19,943 | 490,379 |
| Daiichi Jitsugyo Co., Ltd. | 12,163 | 316,952 |
| Daiken Corp. | 20,122 | 348,052 |
| Daikokutenbussan Co., Ltd. | 6,404 | 192,763 |
| Daikyonishikawa Corp. | 66,464 | 456,472 |
| Dainichiseika Color & Chemicals Manufacturing Co., Ltd. | 16,781 | 439,504 |
| Daio Paper Corp. | 90,966 | 1,097,814 |
| Daiseki Co., Ltd. | 48,201 | 1,177,495 |
| Daito Pharmaceutical Co., Ltd. | 12,729 | 368,757 |
| Daiwa Industries Ltd. | 34,782 | 349,639 |
| Daiwabo Holdings Co., Ltd. | 22,724 | 885,239 |
| DCM Holdings Co., Ltd. | 112,675 | 1,118,842 |
| Denki Kogyo Co., Ltd. | 15,076 | 408,058 |
| Denyo Co., Ltd. | 18,596 | 269,274 |
| Descente Ltd. | 47,303 | 647,522 |
| Dexerials Corp. | 58,422 | 394,635 |
| Digital Arts, Inc. | 12,010 | 862,181 |
| Digital Garage, Inc. | 39,850 | 1,300,864 |
| Dip Corp. | 24,279 | 552,165 |
| Doshisha Co., Ltd. | 30,055 | 486,736 |
| Doutor Nichires Holdings Co., Ltd. | 33,355 | 634,765 |
| DTS Corp. | 50,714 | 1,059,717 |
| Duskin Co., Ltd. | 52,838 | 1,357,475 |
| DyDo Group Holdings, Inc. | 11,516 | 470,860 |
| Eagle Industry Co., Ltd. | 35,321 | 325,441 |
| Earth Corp. | 17,034 | 821,650 |
| EDION Corp. | 111,315 | 1,061,291 |
| eGuarantee, Inc. | 35,856 | 429,346 |
| Eiken Chemical Co., Ltd. | 39,674 | 596,913 |
| Eizo Corp. | 23,403 | 781,607 |
| Elecom Co., Ltd. | 25,000 | 983,325 |
| en-japan, Inc. | 38,524 | 1,437,232 |
| Enplas Corp. | 12,019 | 335,959 |
| EPS Holdings, Inc. | 39,276 | 486,579 |
| eRex Co., Ltd. | 39,078 | 433,321 |
| ES-Con Japan Ltd. | 35,700 | 255,276 |
| ESPEC Corp. | 24,138 | 427,296 |
| euglena Co., Ltd. * | 83,409 | 698,578 |
| F@N Communications, Inc. | 59,833 | 307,212 |
| FCC Co., Ltd. | 44,583 | 810,638 |
| Feed One Co., Ltd. | 182,094 | 271,052 |
| FIDEA Holdings Co., Ltd. | 209,016 | 218,576 |
| Financial Products Group Co., Ltd. | 73,448 | 709,258 |
| Fixstars Corp. | 26,079 | 378,120 |
| Foster Electric Co., Ltd. | 26,009 | 429,787 |
| France Bed Holdings Co., Ltd. | 28,240 | 268,712 |
| Security | Number of Shares | Value ($) |
| Fudo Tetra Corp. | 17,572 | 186,572 |
| Fuji Co., Ltd. | 24,175 | 417,702 |
| Fuji Corp. | 101,661 | 1,364,802 |
| Fuji Kyuko Co., Ltd. | 28,839 | 1,214,474 |
| Fuji Pharma Co., Ltd. | 18,864 | 223,926 |
| Fuji Soft, Inc. | 25,879 | 1,112,984 |
| Fujibo Holdings, Inc. | 15,045 | 357,752 |
| Fujicco Co., Ltd. | 25,678 | 461,089 |
| Fujimi, Inc. | 24,941 | 570,745 |
| Fujimori Kogyo Co., Ltd. | 18,631 | 518,498 |
| Fujita Kanko, Inc. | 9,984 | 258,383 |
| Fujitec Co., Ltd. | 97,972 | 1,156,521 |
| Fujiya Co., Ltd. | 12,808 | 238,676 |
| Fukuda Corp. | 6,678 | 236,556 |
| Fukushima Industries Corp. | 13,457 | 380,338 |
| FULLCAST Holdings Co., Ltd. | 26,860 | 504,329 |
| Funai Soken Holdings, Inc. | 39,037 | 834,103 |
| Furukawa Co., Ltd. | 39,613 | 492,620 |
| Furuno Electric Co., Ltd. | 27,899 | 232,875 |
| Fuso Chemical Co., Ltd. | 24,044 | 492,682 |
| Futaba Corp. | 43,284 | 528,893 |
| Futaba Industrial Co., Ltd. | 75,312 | 495,954 |
| Future Corp. | 20,941 | 352,946 |
| G-Tekt Corp. | 28,770 | 416,595 |
| Gakken Holdings Co., Ltd. | 6,184 | 307,030 |
| GCA Corp. | 27,964 | 185,996 |
| Genky DrugStores Co., Ltd. | 9,714 | 191,361 |
| Geo Holdings Corp. | 32,729 | 411,020 |
| Giken Ltd. | 16,778 | 524,782 |
| GLOBERIDE, Inc. | 11,856 | 333,190 |
| Godo Steel Ltd. | 11,500 | 222,969 |
| Goldcrest Co., Ltd. | 18,739 | 356,084 |
| Gree, Inc. | 118,864 | 534,157 |
| Gunosy, Inc. * | 16,588 | 216,287 |
| Gunze Ltd. | 20,398 | 845,553 |
| Halows Co., Ltd. | 10,400 | 205,756 |
| Hamakyorex Co., Ltd. | 18,460 | 635,652 |
| Hanwa Co., Ltd. | 45,119 | 1,216,124 |
| Happinet Corp. | 16,222 | 188,743 |
| Hazama Ando Corp. | 241,312 | 1,611,854 |
| Heiwa Real Estate Co., Ltd. | 42,849 | 1,003,558 |
| Heiwado Co., Ltd. | 36,726 | 680,579 |
| Hibiya Engineering Ltd. | 21,921 | 381,854 |
| Hiday Hidaka Corp. | 34,542 | 696,079 |
| Hioki EE Corp. | 11,862 | 365,432 |
| Hirata Corp. | 10,074 | 626,392 |
| Hisaka Works Ltd. | 26,272 | 199,493 |
| Hitachi Zosen Corp. | 196,216 | 628,512 |
| Hito Communications Holdings, Inc. | 12,400 | 187,031 |
| Hochiki Corp. | 17,800 | 225,382 |
| Hogy Medical Co., Ltd. | 26,205 | 715,703 |
| Hokkaido Gas Co., Ltd. | 14,220 | 197,602 |
| Hokkan Holdings Ltd. | 12,000 | 168,449 |
| Hokuetsu Corp. | 172,474 | 861,192 |
| Hokuto Corp. | 24,799 | 443,436 |
| Hoosiers Holdings | 53,145 | 307,419 |
| Hosiden Corp. | 72,329 | 681,417 |
| Hosokawa Micron Corp. | 7,588 | 265,575 |
| IBJ Leasing Co., Ltd. | 52,714 | 1,323,996 |
| Ichibanya Co., Ltd. | 20,995 | 1,016,669 |
| Ichikoh Industries Ltd. | 66,494 | 452,293 |
| Ichiyoshi Securities Co., Ltd. | 43,580 | 263,997 |
| Icom, Inc. | 12,252 | 255,440 |
| Idec Corp. | 36,877 | 611,461 |
| Iino Kaiun Kaisha Ltd. | 106,183 | 324,116 |
| Inaba Denki Sangyo Co., Ltd. | 34,219 | 1,534,528 |
| Inabata & Co., Ltd. | 50,775 | 594,117 |
| Inageya Co., Ltd. | 29,906 | 442,624 |
| Security | Number of Shares | Value ($) |
| Ines Corp. | 24,283 | 250,734 |
| Infomart Corp. | 129,034 | 1,900,044 |
| Information Services International-Dentsu Ltd. | 14,444 | 455,861 |
| Intage Holdings, Inc. | 43,862 | 359,921 |
| Internet Initiative Japan, Inc. | 32,965 | 733,556 |
| Iriso Electronics Co., Ltd. | 24,836 | 1,190,967 |
| Iseki & Co., Ltd. | 18,476 | 235,856 |
| Ishihara Sangyo Kaisha Ltd. | 42,314 | 345,624 |
| Istyle, Inc. *(a) | 61,853 | 381,100 |
| Itochu Enex Co., Ltd. | 58,083 | 443,783 |
| Itochu-Shokuhin Co., Ltd. | 6,558 | 257,637 |
| Iwatani Corp. | 53,902 | 1,782,430 |
| J Trust Co., Ltd.(a) | 91,397 | 322,897 |
| J-Oil Mills, Inc. | 11,398 | 428,452 |
| JAC Recruitment Co., Ltd. | 17,995 | 336,182 |
| Jaccs Co., Ltd. | 31,107 | 647,959 |
| Jafco Co., Ltd. | 38,524 | 1,350,127 |
| Jamco Corp. | 11,195 | 154,196 |
| Japan Cash Machine Co., Ltd. | 17,950 | 159,638 |
| Japan Display, Inc. *(a) | 843,448 | 508,556 |
| Japan Elevator Service Holdings Co., Ltd.(a) | 39,436 | 947,772 |
| Japan Lifeline Co., Ltd. | 81,974 | 1,284,307 |
| Japan Material Co., Ltd. | 69,914 | 719,921 |
| Japan Pulp & Paper Co., Ltd. | 12,506 | 440,647 |
| Japan Securities Finance Co., Ltd. | 110,733 | 526,828 |
| Japan Transcity Corp. | 63,362 | 260,265 |
| JCR Pharmaceuticals Co., Ltd. | 17,471 | 1,343,100 |
| JCU Corp. | 27,599 | 476,862 |
| Jeol Ltd. | 47,510 | 1,046,478 |
| JINS Holdings, Inc. | 18,861 | 1,043,046 |
| Joshin Denki Co., Ltd. | 22,020 | 402,872 |
| Joyful Honda Co., Ltd. | 77,508 | 987,242 |
| JSP Corp. | 13,727 | 223,212 |
| Juki Corp. | 48,330 | 374,273 |
| Justsystems Corp. | 42,580 | 1,598,580 |
| JVC Kenwood Corp. | 204,175 | 588,606 |
| K&O Energy Group, Inc. | 17,344 | 221,242 |
| Kadokawa Dwango * | 49,230 | 735,586 |
| Kaga Electronics Co., Ltd. | 22,244 | 334,042 |
| Kamakura Shinsho Ltd. | 22,992 | 365,203 |
| Kameda Seika Co., Ltd. | 16,450 | 726,841 |
| Kamei Corp. | 28,965 | 287,890 |
| Kanaden Corp. | 23,092 | 263,455 |
| Kanagawa Chuo Kotsu Co., Ltd. | 7,816 | 277,236 |
| Kanamoto Co., Ltd. | 35,992 | 932,140 |
| Kanematsu Corp. | 104,016 | 1,183,771 |
| Kanematsu Electronics Ltd. | 14,902 | 422,583 |
| Kansai Super Market Ltd. | 24,404 | 254,742 |
| Kanto Denka Kogyo Co., Ltd. | 55,106 | 381,062 |
| Kappa Create Co., Ltd. | 26,920 | 356,330 |
| Kasai Kogyo Co., Ltd. | 32,150 | 216,262 |
| Katakura Industries Co., Ltd. | 26,756 | 318,365 |
| Katitas Co., Ltd. | 30,471 | 1,166,938 |
| Kato Sangyo Co., Ltd. | 27,455 | 805,712 |
| Kato Works Co., Ltd. | 14,061 | 223,741 |
| KAWADA TECHNOLOGIES, Inc. | 5,660 | 342,869 |
| Keihanshin Building Co., Ltd. | 43,427 | 511,820 |
| Keihin Corp. | 52,470 | 717,264 |
| Keiyo Co., Ltd. | 52,700 | 233,351 |
| Kenedix, Inc. | 271,531 | 1,322,545 |
| Kenko Mayonnaise Co., Ltd. | 15,630 | 326,162 |
| Key Coffee, Inc. | 19,926 | 400,979 |
| KFC Holdings Japan Ltd. | 17,307 | 354,309 |
| KH Neochem Co., Ltd. | 43,857 | 917,260 |
| Kintetsu Department Store Co., Ltd. | 11,686 | 336,339 |
| Kintetsu World Express, Inc. | 46,501 | 622,087 |
| Security | Number of Shares | Value ($) |
| Kisoji Co., Ltd. | 25,850 | 641,471 |
| Kitanotatsujin Corp. | 78,746 | 541,567 |
| Kitz Corp. | 106,278 | 687,861 |
| KLab, Inc. *(a) | 39,228 | 392,483 |
| KNT-CT Holdings Co., Ltd. * | 13,198 | 181,287 |
| Koa Corp. | 36,624 | 421,291 |
| Koatsu Gas Kogyo Co., Ltd. | 33,888 | 249,662 |
| Kobe Bussan Co., Ltd. | 13,420 | 662,498 |
| Kohnan Shoji Co., Ltd. | 33,274 | 726,012 |
| Komatsu Matere Co., Ltd. | 42,846 | 299,916 |
| KOMEDA Holdings Co., Ltd. | 40,828 | 760,056 |
| Komori Corp. | 54,641 | 538,971 |
| Konishi Co., Ltd. | 32,019 | 437,096 |
| Konoike Transport Co., Ltd. | 35,869 | 561,969 |
| Koshidaka Holdings Co., Ltd. | 57,000 | 950,492 |
| Kotobuki Spirits Co., Ltd. | 23,795 | 1,542,320 |
| Kourakuen Holdings Corp. | 11,856 | 294,543 |
| Krosaki Harima Corp. | 4,519 | 219,681 |
| Kumagai Gumi Co., Ltd. | 44,478 | 1,228,598 |
| Kumiai Chemical Industry Co., Ltd. | 122,990 | 1,084,541 |
| Kura Sushi, Inc.(a) | 12,524 | 499,096 |
| Kurabo Industries Ltd. | 24,778 | 451,464 |
| Kureha Corp. | 23,450 | 1,261,477 |
| KYB Corp. * | 24,141 | 668,202 |
| Kyodo Printing Co., Ltd. | 10,184 | 261,832 |
| Kyoei Steel Ltd. | 27,752 | 440,027 |
| Kyokuto Kaihatsu Kogyo Co., Ltd. | 38,658 | 438,133 |
| Kyokuto Securities Co., Ltd. | 27,493 | 208,765 |
| Kyokuyo Co., Ltd. | 13,162 | 355,013 |
| Kyosan Electric Manufacturing Co., Ltd. | 57,860 | 188,061 |
| Lasertec Corp. | 47,640 | 2,733,314 |
| LEC, Inc. | 32,836 | 298,523 |
| Leopalace21 Corp. *(a) | 285,336 | 782,258 |
| Life Corp. | 23,627 | 465,662 |
| LIFULL Co., Ltd. | 80,990 | 500,536 |
| Link And Motivation, Inc.(a) | 59,376 | 298,712 |
| LIXIL VIVA Corp. | 27,850 | 363,654 |
| M&A Capital Partners Co., Ltd. * | 7,608 | 445,822 |
| Macnica Fuji Electronics Holdings, Inc. | 58,095 | 746,541 |
| Macromill, Inc. | 46,094 | 403,423 |
| Maeda Kosen Co., Ltd. | 26,724 | 352,980 |
| Maezawa Kyuso Industries Co., Ltd. | 11,065 | 204,527 |
| Makino Milling Machine Co., Ltd. | 26,065 | 1,057,137 |
| Mandom Corp. | 47,596 | 1,172,132 |
| Mani, Inc. | 77,850 | 1,821,108 |
| Mars Group Holdings Corp. | 11,661 | 207,963 |
| Marudai Food Co., Ltd. | 28,827 | 580,098 |
| Marusan Securities Co., Ltd. | 72,595 | 329,651 |
| Maruwa Co., Ltd. | 10,740 | 603,047 |
| Maruwa Unyu Kikan Co., Ltd.(a) | 12,978 | 660,240 |
| Maruzen Showa Unyu Co., Ltd. | 18,978 | 554,259 |
| Marvelous, Inc. | 35,148 | 258,945 |
| Matsuda Sangyo Co., Ltd. | 14,900 | 198,489 |
| Matsuya Co., Ltd. | 50,429 | 360,122 |
| Matsuyafoods Holdings Co., Ltd. | 9,577 | 343,760 |
| Max Co., Ltd. | 50,176 | 810,228 |
| Maxell Holdings Ltd. | 53,100 | 718,372 |
| MCJ Co., Ltd. | 82,394 | 524,738 |
| Medical Data Vision Co., Ltd. * | 24,034 | 229,596 |
| Megachips Corp. | 21,115 | 318,282 |
| Meidensha Corp. | 49,404 | 814,052 |
| Meiko Network Japan Co., Ltd.(a) | 22,300 | 193,073 |
| Meisei Industrial Co., Ltd. | 52,718 | 355,609 |
| Meitec Corp. | 31,457 | 1,624,046 |
| Melco Holdings, Inc. | 12,024 | 312,763 |
| Menicon Co., Ltd. | 29,214 | 1,105,038 |
| METAWATER Co., Ltd. | 14,789 | 512,728 |
| Micronics Japan Co., Ltd. | 41,636 | 302,429 |
| Security | Number of Shares | Value ($) |
| Mie Kotsu Group Holdings, Inc. | 71,038 | 359,390 |
| Milbon Co., Ltd. | 23,368 | 1,144,789 |
| Mimasu Semiconductor Industry Co., Ltd. | 16,688 | 281,107 |
| Ministop Co., Ltd. | 15,220 | 206,910 |
| Mirait Holdings Corp. | 86,368 | 1,276,663 |
| Miroku Jyoho Service Co., Ltd. | 23,308 | 605,180 |
| Misawa Homes Co., Ltd. | 25,100 | 249,475 |
| Mitsuba Corp. | 41,862 | 213,362 |
| Mitsubishi Logisnext Co., Ltd. | 35,316 | 378,297 |
| Mitsubishi Pencil Co., Ltd. | 56,604 | 880,963 |
| Mitsubishi Research Institute, Inc. | 7,200 | 244,873 |
| Mitsuboshi Belting Ltd. | 26,005 | 428,006 |
| Mitsui E&S Holdings Co., Ltd. * | 91,462 | 695,368 |
| Mitsui High-Tec, Inc. | 30,610 | 357,590 |
| Mitsui Sugar Co., Ltd. | 18,654 | 382,588 |
| Mitsui-Soko Holdings Co., Ltd. | 28,397 | 432,864 |
| Mitsuuroko Group Holdings Co., Ltd. | 56,046 | 491,053 |
| Mizuno Corp. | 22,519 | 583,633 |
| Modec, Inc. | 23,791 | 539,721 |
| Monex Group, Inc.(a) | 221,175 | 629,279 |
| Monogatari Corp. | 5,644 | 514,710 |
| Morita Holdings Corp. | 49,970 | 750,409 |
| MOS Food Services, Inc. | 29,864 | 658,643 |
| MTI Ltd. | 32,000 | 209,826 |
| Musashi Seimitsu Industry Co., Ltd. | 55,464 | 643,235 |
| Nachi-Fujikoshi Corp. | 23,616 | 946,687 |
| Nagaileben Co., Ltd. | 32,191 | 631,719 |
| Nagatanien Holdings Co., Ltd. | 14,246 | 269,902 |
| NEC Networks & System Integration Corp. | 28,101 | 734,658 |
| NET One Systems Co., Ltd. | 104,059 | 2,792,030 |
| Neturen Co., Ltd. | 39,202 | 296,199 |
| Nextage Co., Ltd. | 44,438 | 472,241 |
| Nichi-iko Pharmaceutical Co., Ltd. | 55,940 | 599,216 |
| Nichias Corp. | 67,771 | 1,127,548 |
| Nichiban Co., Ltd. | 15,576 | 220,407 |
| Nichicon Corp. | 76,063 | 669,300 |
| Nichiden Corp. | 15,932 | 289,536 |
| Nichiha Corp. | 36,042 | 915,778 |
| NichiiGakkan Co., Ltd. | 49,591 | 769,946 |
| Nihon Chouzai Co., Ltd. | 8,056 | 278,539 |
| Nihon Parkerizing Co., Ltd. | 118,884 | 1,317,138 |
| Nihon Tokushu Toryo Co., Ltd. | 18,459 | 178,077 |
| Nihon Trim Co., Ltd. | 5,622 | 234,901 |
| Nikkiso Co., Ltd. | 75,304 | 789,612 |
| Nippon Beet Sugar Manufacturing Co., Ltd. | 13,464 | 223,755 |
| Nippon Carbon Co., Ltd. | 12,770 | 432,504 |
| Nippon Ceramic Co., Ltd. | 23,596 | 588,205 |
| Nippon Chemi-Con Corp. | 20,824 | 272,108 |
| Nippon Denko Co., Ltd. | 145,650 | 215,432 |
| Nippon Densetsu Kogyo Co., Ltd. | 43,983 | 841,580 |
| Nippon Flour Mills Co., Ltd. | 60,949 | 951,458 |
| Nippon Holdings Co., Ltd. | 63,709 | 1,421,291 |
| Nippon Kanzai Co., Ltd. | 20,410 | 362,263 |
| Nippon Koei Co., Ltd. | 16,542 | 404,725 |
| Nippon Light Metal Holdings Co., Ltd. | 730,297 | 1,265,954 |
| Nippon Parking Development Co., Ltd. | 190,175 | 300,998 |
| Nippon Seiki Co., Ltd. | 55,949 | 867,079 |
| Nippon Sharyo Ltd. * | 8,300 | 176,486 |
| Nippon Sheet Glass Co., Ltd. | 110,497 | 648,543 |
| Nippon Signal Co., Ltd. | 76,942 | 837,232 |
| Nippon Soda Co., Ltd. | 34,615 | 796,362 |
| Nippon Steel Trading Corp. | 17,870 | 682,678 |
| Nippon Suisan Kaisha Ltd. | 327,577 | 1,901,055 |
| Nippon Thompson Co., Ltd. | 82,455 | 330,146 |
| Nippon Yakin Kogyo Co., Ltd.(a) | 190,506 | 382,286 |
| Nishimatsu Construction Co., Ltd. | 65,579 | 1,173,867 |
| Nishimatsuya Chain Co., Ltd. | 55,709 | 473,404 |
| Security | Number of Shares | Value ($) |
| Nishio Rent All Co., Ltd. | 19,500 | 513,656 |
| Nissei ASB Machine Co., Ltd. | 10,348 | 297,830 |
| Nissha Co., Ltd. | 51,702 | 460,786 |
| Nissin Corp. | 14,556 | 200,900 |
| Nissin Electric Co., Ltd. | 58,038 | 686,756 |
| Nissin Kogyo Co., Ltd. | 46,717 | 603,851 |
| Nissin Sugar Co., Ltd. | 14,200 | 253,244 |
| Nisso Corp. | 20,612 | 207,392 |
| Nitta Corp. | 23,921 | 620,871 |
| Nittetsu Mining Co., Ltd. | 6,955 | 255,870 |
| Nitto Boseki Co., Ltd. | 34,765 | 957,679 |
| Nitto Kogyo Corp. | 33,833 | 633,343 |
| Nitto Kohki Co., Ltd. | 13,364 | 258,228 |
| Nohmi Bosai Ltd. | 25,593 | 521,288 |
| Nojima Corp. | 42,925 | 732,368 |
| Nomura Co., Ltd. | 96,568 | 1,226,376 |
| Noritake Co., Ltd. | 15,744 | 574,761 |
| Noritsu Koki Co., Ltd. | 26,734 | 449,827 |
| Noritz Corp. | 41,828 | 452,780 |
| NS United Kaiun Kaisha Ltd. | 13,384 | 270,214 |
| NSD Co., Ltd. | 45,787 | 1,363,106 |
| Obara Group, Inc. | 14,317 | 461,295 |
| Ohsho Food Service Corp. | 13,345 | 910,244 |
| Oiles Corp. | 36,170 | 514,548 |
| Okabe Co., Ltd. | 48,350 | 363,496 |
| Okamoto Industries, Inc. | 18,308 | 694,236 |
| Okamura Corp. | 99,968 | 984,187 |
| Okasan Securities Group, Inc. | 202,780 | 668,642 |
| Oki Electric Industry Co., Ltd. | 104,810 | 1,470,273 |
| Okumura Corp. | 46,711 | 1,228,669 |
| Okuwa Co., Ltd. | 33,312 | 356,203 |
| Onoken Co., Ltd. | 19,668 | 240,511 |
| Onward Holdings Co., Ltd. | 139,964 | 661,943 |
| Open Door, Inc. * | 15,062 | 316,438 |
| OPT Holding, Inc. | 18,707 | 271,586 |
| Optex Group Co., Ltd. | 39,736 | 529,339 |
| Optorun Co., Ltd. | 11,928 | 331,955 |
| Organo Corp. | 8,176 | 313,114 |
| Osaka Soda Co., Ltd. | 22,496 | 522,847 |
| Osaka Steel Co., Ltd. | 14,876 | 186,817 |
| OSAKA Titanium Technologies Co., Ltd. | 21,527 | 302,386 |
| Osaki Electric Co., Ltd. | 53,395 | 332,508 |
| OSJB Holdings Corp. | 114,052 | 244,984 |
| Outsourcing, Inc. | 125,500 | 1,143,328 |
| Oyo Corp. | 26,680 | 268,446 |
| Pacific Industrial Co., Ltd. | 58,424 | 792,050 |
| Pacific Metals Co., Ltd. | 18,716 | 332,196 |
| PAL GROUP Holdings Co., Ltd. | 13,906 | 427,746 |
| Paramount Bed Holdings Co., Ltd. | 25,447 | 933,780 |
| Pasona Group, Inc. | 22,960 | 308,455 |
| Pepper Food Service Co., Ltd.(a) | 15,354 | 224,643 |
| PIA Corp. | 8,045 | 319,845 |
| Piolax, Inc. | 28,915 | 480,532 |
| Plenus Co., Ltd. | 30,905 | 504,869 |
| Press Kogyo Co., Ltd. | 106,921 | 446,239 |
| Pressance Corp. | 39,034 | 567,059 |
| Prestige International, Inc. | 52,107 | 919,463 |
| Prima Meat Packers Ltd. | 36,939 | 731,159 |
| Pronexus, Inc. | 17,875 | 173,454 |
| Qol Holdings Co., Ltd. | 31,414 | 424,398 |
| Raito Kogyo Co., Ltd. | 55,105 | 722,135 |
| Raiznext Corp. | 46,685 | 507,556 |
| Relia, Inc. | 51,722 | 654,413 |
| Remixpoint, Inc. *(a) | 70,700 | 139,209 |
| RENOVA, Inc. * | 53,050 | 404,828 |
| Restar Holdings Corp. | 31,515 | 499,691 |
| Retail Partners Co., Ltd. | 40,973 | 351,269 |
| Rheon Automatic Machinery Co., Ltd. | 25,177 | 351,285 |
| Security | Number of Shares | Value ($) |
| Ricoh Leasing Co., Ltd. | 17,893 | 547,014 |
| Riken Corp. | 10,974 | 375,811 |
| Riken Keiki Co., Ltd. | 22,004 | 373,764 |
| Riken Technos Corp. | 64,525 | 279,632 |
| Riken Vitamin Co., Ltd. | 9,830 | 311,167 |
| Ringer Hut Co., Ltd.(a) | 26,406 | 627,156 |
| Riso Kagaku Corp. | 30,221 | 533,270 |
| Riso Kyoiku Co., Ltd. | 107,968 | 460,780 |
| Rock Field Co., Ltd. | 23,556 | 309,139 |
| Rokko Butter Co., Ltd. | 13,252 | 207,997 |
| Roland DG Corp. | 14,820 | 273,097 |
| Rorze Corp. | 11,700 | 249,333 |
| Round One Corp. | 80,215 | 1,311,159 |
| Royal Holdings Co., Ltd. | 33,073 | 807,312 |
| Ryobi Ltd. | 34,280 | 515,758 |
| Ryoden Corp. | 15,376 | 232,208 |
| Ryosan Co., Ltd. | 30,774 | 751,773 |
| Ryoyo Electro Corp. | 24,304 | 401,155 |
| S Foods, Inc. | 22,821 | 648,220 |
| Sac's Bar Holdings, Inc. | 24,024 | 203,699 |
| Sagami Holdings Corp. | 22,992 | 292,423 |
| Saibu Gas Co., Ltd. | 30,199 | 630,752 |
| Saizeriya Co., Ltd. | 31,743 | 788,005 |
| Sakai Chemical Industry Co., Ltd. | 19,370 | 420,448 |
| Sakai Moving Service Co., Ltd. | 11,236 | 662,654 |
| Sakata INX Corp. | 53,385 | 457,176 |
| Sakata Seed Corp. | 39,316 | 1,331,584 |
| SAMTY Co., Ltd. | 36,330 | 624,296 |
| San ju San Financial Group, Inc. | 26,071 | 368,425 |
| San-A Co., Ltd. | 23,181 | 964,192 |
| San-Ai Oil Co., Ltd. | 69,758 | 647,337 |
| Sangetsu Corp. | 73,628 | 1,394,940 |
| Sanken Electric Co., Ltd. | 29,054 | 507,203 |
| Sanki Engineering Co., Ltd. | 49,283 | 584,552 |
| Sankyo Seiko Co., Ltd. | 44,693 | 205,896 |
| Sankyo Tateyama, Inc. | 33,566 | 363,030 |
| Sanshin Electronics Co., Ltd. | 21,164 | 295,492 |
| Sanyo Chemical Industries Ltd. | 12,865 | 561,772 |
| Sanyo Denki Co., Ltd. | 10,813 | 430,910 |
| Sanyo Electric Railway Co., Ltd. | 21,269 | 416,383 |
| Sanyo Shokai Ltd. | 14,568 | 178,695 |
| Sanyo Special Steel Co., Ltd. | 27,224 | 354,711 |
| Sato Holdings Corp. | 29,837 | 743,501 |
| SBS Holdings, Inc. | 20,924 | 296,084 |
| Seikagaku Corp. | 45,932 | 490,282 |
| Seiko Holdings Corp. | 33,379 | 700,945 |
| Seiren Co., Ltd. | 57,252 | 656,420 |
| Sekisui Jushi Corp. | 35,694 | 637,579 |
| Sekisui Plastics Co., Ltd. | 30,370 | 202,858 |
| Senko Group Holdings Co., Ltd. | 129,229 | 1,027,550 |
| Senshu Ikeda Holdings, Inc. | 348,430 | 587,583 |
| Shibuya Corp. | 24,396 | 627,224 |
| Shikoku Chemicals Corp. | 41,123 | 399,820 |
| Shin Nippon Air Technologies Co., Ltd. | 16,944 | 273,447 |
| Shin-Etsu Polymer Co., Ltd. | 44,166 | 285,439 |
| Shindengen Electric Manufacturing Co., Ltd. | 9,317 | 269,034 |
| Shinko Electric Industries Co., Ltd. | 81,282 | 640,179 |
| Shinko Shoji Co., Ltd. | 22,074 | 390,342 |
| Shinmaywa Industries Ltd. | 68,831 | 804,741 |
| Shinnihon Corp. | 30,480 | 218,237 |
| Shinwa Co., Ltd. | 12,500 | 248,245 |
| Ship Healthcare Holdings, Inc. | 48,924 | 2,263,101 |
| Shizuoka Gas Co., Ltd. | 72,071 | 595,471 |
| Shoei Co., Ltd. | 15,490 | 669,100 |
| Shoei Foods Corp. | 15,370 | 433,682 |
| Showa Corp. | 61,905 | 793,168 |
| Showa Sangyo Co., Ltd. | 30,641 | 883,334 |
| Security | Number of Shares | Value ($) |
| Siix Corp. | 41,534 | 529,422 |
| Sinanen Holdings Co., Ltd. | 11,952 | 195,813 |
| Sinfonia Technology Co., Ltd. | 34,019 | 359,276 |
| Sinko Industries Ltd. | 23,719 | 382,337 |
| Sintokogio Ltd. | 60,160 | 511,795 |
| SMS Co., Ltd. | 61,536 | 1,375,712 |
| Sodick Co., Ltd. | 47,037 | 332,797 |
| Sogo Medical Holdings Co., Ltd. | 21,285 | 291,367 |
| Solasto Corp. | 57,076 | 712,475 |
| Sourcenext Corp.(a) | 97,508 | 397,767 |
| SRA Holdings | 8,200 | 186,797 |
| ST Corp. | 12,378 | 179,702 |
| St Marc Holdings Co., Ltd. | 16,071 | 376,244 |
| Star Micronics Co., Ltd. | 41,046 | 564,965 |
| Starts Corp., Inc. | 36,954 | 826,848 |
| Starzen Co., Ltd. | 8,796 | 332,300 |
| Stella Chemifa Corp. | 10,592 | 260,347 |
| Strike Co., Ltd. | 17,284 | 439,489 |
| Studio Alice Co., Ltd. | 13,048 | 245,975 |
| Sumida Corp. | 26,700 | 251,543 |
| Sumitomo Densetsu Co., Ltd. | 17,444 | 330,819 |
| Sumitomo Mitsui Construction Co., Ltd. | 189,180 | 939,261 |
| Sumitomo Riko Co., Ltd. | 44,284 | 317,491 |
| Sumitomo Seika Chemicals Co., Ltd. | 10,310 | 302,564 |
| Sun Frontier Fudousan Co., Ltd. | 34,296 | 392,896 |
| Suruga Bank Ltd. *(a) | 215,892 | 813,574 |
| Sushiro Global Holdings Ltd. | 31,634 | 1,996,776 |
| Systena Corp. | 85,524 | 1,277,079 |
| T Hasegawa Co., Ltd. | 28,448 | 542,722 |
| T-Gaia Corp. | 26,579 | 534,359 |
| Tachi-S Co., Ltd. | 33,494 | 376,451 |
| Tachibana Eletech Co., Ltd. | 22,234 | 316,506 |
| Taihei Dengyo Kaisha Ltd. | 18,806 | 424,506 |
| Taikisha Ltd. | 37,673 | 1,128,646 |
| Taiyo Holdings Co., Ltd. | 21,604 | 666,570 |
| Takamatsu Construction Group Co., Ltd. | 18,030 | 383,039 |
| Takara Leben Co., Ltd. | 105,477 | 405,432 |
| Takara Standard Co., Ltd. | 59,525 | 944,930 |
| Takasago International Corp. | 19,744 | 475,999 |
| Takasago Thermal Engineering Co., Ltd. | 79,718 | 1,292,521 |
| Takeuchi Manufacturing Co., Ltd. | 43,230 | 641,455 |
| Taki Chemical Co., Ltd. | 5,748 | 235,563 |
| Takuma Co., Ltd. | 92,151 | 1,064,366 |
| Tamron Co., Ltd. | 18,763 | 387,475 |
| Tamura Corp. | 90,130 | 450,884 |
| Tanseisha Co., Ltd. | 37,417 | 451,211 |
| Tayca Corp. | 20,606 | 363,024 |
| Teikoku Electric Manufacturing Co., Ltd. | 19,660 | 206,333 |
| Teikoku Sen-I Co., Ltd. | 27,272 | 420,083 |
| Tekken Corp. | 15,885 | 402,269 |
| Tenma Corp. | 16,358 | 298,819 |
| The Aichi Bank Ltd. | 10,484 | 335,326 |
| The Akita Bank Ltd. | 20,667 | 370,135 |
| The Aomori Bank Ltd. | 23,400 | 560,833 |
| The Bank of Iwate Ltd. | 20,371 | 475,762 |
| The Bank of Nagoya Ltd. | 21,062 | 624,052 |
| The Bank of Okinawa Ltd. | 27,669 | 798,959 |
| The Bank of Saga Ltd. | 15,176 | 196,161 |
| The Chukyo Bank Ltd. | 14,320 | 291,405 |
| The Ehime Bank Ltd. | 45,556 | 474,680 |
| The Fukui Bank Ltd. | 28,657 | 349,354 |
| The Hokkoku Bank Ltd. | 29,300 | 672,979 |
| The Hyakugo Bank Ltd. | 261,686 | 801,243 |
| The Hyakujushi Bank Ltd. | 31,033 | 585,898 |
| The Japan Wool Textile Co., Ltd. | 79,913 | 682,850 |
| The Juroku Bank Ltd. | 44,365 | 895,283 |
| The Keiyo Bank Ltd. | 145,392 | 834,177 |
| The Kiyo Bank Ltd. | 78,737 | 1,079,300 |
| Security | Number of Shares | Value ($) |
| The Michinoku Bank Ltd. | 19,658 | 289,837 |
| The Miyazaki Bank Ltd. | 18,551 | 399,525 |
| The Musashino Bank Ltd. | 40,742 | 678,234 |
| The Nanto Bank Ltd. | 38,974 | 832,757 |
| The Nippon Road Co., Ltd. | 7,064 | 399,303 |
| The Nisshin Oillio Group Ltd. | 29,391 | 913,753 |
| The Ogaki Kyoritsu Bank Ltd. | 47,992 | 996,508 |
| The Oita Bank Ltd. | 18,839 | 529,789 |
| The Okinawa Electric Power Co., Inc. | 54,525 | 829,600 |
| The Pack Corp. | 14,596 | 452,408 |
| The Shibusawa Warehouse Co., Ltd. | 11,165 | 193,122 |
| The Shikoku Bank Ltd. | 43,879 | 379,903 |
| The Shimizu Bank Ltd. | 13,188 | 223,641 |
| The Sumitomo Warehouse Co., Ltd. | 66,468 | 879,811 |
| The Tochigi Bank Ltd. | 104,325 | 160,205 |
| The Toho Bank Ltd. | 225,790 | 514,779 |
| The Towa Bank Ltd. | 44,097 | 291,640 |
| The Yamagata Bank Ltd. | 37,918 | 514,409 |
| The Yamanashi Chuo Bank Ltd. | 36,657 | 323,937 |
| TKC Corp. | 18,304 | 787,204 |
| Toa Corp. | 54,620 | 643,924 |
| Toagosei Co., Ltd. | 159,247 | 1,557,288 |
| TOC Co., Ltd. | 61,862 | 468,576 |
| Tocalo Co., Ltd. | 66,195 | 497,032 |
| Toei Co., Ltd. | 9,333 | 1,346,161 |
| Toenec Corp. | 8,812 | 261,093 |
| Toho Co., Ltd. | 12,471 | 213,245 |
| Toho Holdings Co., Ltd. | 62,163 | 1,485,774 |
| Toho Titanium Co., Ltd. | 41,050 | 289,278 |
| Toho Zinc Co., Ltd. | 16,896 | 294,480 |
| Tokai Corp. | 21,942 | 470,488 |
| TOKAI Holdings Corp. | 142,260 | 1,318,798 |
| Token Corp. | 9,051 | 532,938 |
| Tokushu Tokai Paper Co., Ltd. | 10,782 | 367,205 |
| Tokyo Dome Corp. | 111,366 | 1,083,811 |
| Tokyo Energy & Systems, Inc. | 24,504 | 197,842 |
| Tokyo Individualized Educational Institute, Inc. | 25,074 | 206,932 |
| Tokyo Kiraboshi Financial Group, Inc. | 33,107 | 401,108 |
| Tokyo Ohka Kogyo Co., Ltd. | 46,407 | 1,569,562 |
| Tokyo Seimitsu Co., Ltd. | 46,780 | 1,243,265 |
| Tokyo Steel Manufacturing Co., Ltd. | 117,499 | 912,141 |
| Tokyotokeiba Co., Ltd. | 18,440 | 549,838 |
| Tokyu Construction Co., Ltd. | 89,875 | 620,645 |
| Tomoku Co., Ltd. | 11,776 | 164,084 |
| TOMONY Holdings, Inc. | 182,174 | 554,357 |
| Tomy Co., Ltd. | 111,708 | 1,165,017 |
| Tonami Holdings Co., Ltd. | 7,748 | 314,241 |
| Toppan Forms Co., Ltd. | 50,376 | 449,442 |
| Topre Corp. | 52,289 | 813,313 |
| Topy Industries Ltd. | 21,212 | 363,908 |
| Toridoll Holdings Corp. | 26,713 | 608,023 |
| Torii Pharmaceutical Co., Ltd. | 16,363 | 410,829 |
| Torishima Pump Manufacturing Co., Ltd. | 27,068 | 263,680 |
| Tosei Corp. | 34,746 | 391,177 |
| Toshiba Machine Co., Ltd. | 27,400 | 532,279 |
| Toshiba TEC Corp. | 30,714 | 892,672 |
| Tosho Co., Ltd. | 19,139 | 482,149 |
| Totetsu Kogyo Co., Ltd. | 34,948 | 1,017,375 |
| Towa Corp. | 29,600 | 193,531 |
| Towa Pharmaceutical Co., Ltd. | 31,998 | 734,044 |
| Toyo Construction Co., Ltd. | 88,697 | 354,303 |
| Toyo Corp. | 27,265 | 266,627 |
| Toyo Ink SC Holdings Co., Ltd. | 46,281 | 959,673 |
| Toyo Kanetsu KK | 10,746 | 169,980 |
| Toyo Tanso Co., Ltd. | 19,148 | 350,868 |
| TPR Co., Ltd. | 35,649 | 552,812 |
| Trancom Co., Ltd. | 7,592 | 404,830 |
| Security | Number of Shares | Value ($) |
| Transcosmos, Inc. | 32,770 | 782,627 |
| Trusco Nakayama Corp. | 48,066 | 1,090,423 |
| Trust Tech, Inc. | 20,533 | 239,482 |
| TSI Holdings Co., Ltd. | 102,883 | 514,682 |
| Tsubaki Nakashima Co., Ltd. | 51,956 | 776,317 |
| Tsubakimoto Chain Co. | 41,418 | 1,258,402 |
| Tsugami Corp. | 61,626 | 486,529 |
| Tsukishima Kikai Co., Ltd. | 43,852 | 545,336 |
| Tsukui Corp. | 58,684 | 240,497 |
| Tsurumi Manufacturing Co., Ltd. | 25,470 | 455,674 |
| UACJ Corp. | 38,333 | 560,125 |
| Uchida Yoko Co., Ltd. | 10,748 | 331,113 |
| Union Tool Co. | 10,628 | 309,894 |
| Unipres Corp. | 46,674 | 726,416 |
| United Arrows Ltd. | 32,951 | 991,836 |
| United Super Markets Holdings, Inc. | 69,015 | 622,237 |
| Unitika Ltd. * | 71,142 | 205,762 |
| Unizo Holdings Co., Ltd.(a) | 37,295 | 1,510,844 |
| V Technology Co., Ltd. | 11,252 | 560,771 |
| Valor Holdings Co., Ltd. | 48,516 | 814,961 |
| Valqua Ltd. | 16,765 | 325,681 |
| ValueCommerce Co., Ltd. | 19,192 | 311,715 |
| Vector, Inc. * | 27,556 | 227,675 |
| Vision, Inc./Tokyo Japan *(a) | 10,190 | 434,883 |
| Vital KSK Holdings, Inc. | 43,426 | 427,939 |
| VT Holdings Co., Ltd. | 105,773 | 448,423 |
| W-Scope Corp.(a) | 33,750 | 186,961 |
| Wacom Co., Ltd. | 178,779 | 557,500 |
| Wakita & Co., Ltd. | 51,872 | 502,862 |
| Warabeya Nichiyo Holdings Co., Ltd. | 17,927 | 296,067 |
| WATAMI Co., Ltd. | 21,785 | 292,054 |
| WDB Holdings Co., Ltd. | 9,722 | 215,515 |
| Weathernews, Inc. | 7,140 | 208,190 |
| Wellnet Corp. | 22,148 | 150,442 |
| World Co., Ltd. | 21,180 | 454,947 |
| Xebio Holdings Co., Ltd. | 25,872 | 274,697 |
| YA-MAN Ltd. | 33,434 | 248,208 |
| Yahagi Construction Co., Ltd. | 31,492 | 198,188 |
| Yakuodo Co., Ltd.(b) | 12,740 | 291,059 |
| YAMABIKO Corp. | 37,933 | 368,091 |
| Yamashin-Filter Corp. | 48,774 | 290,866 |
| Yamazen Corp. | 83,225 | 736,241 |
| Yellow Hat Ltd. | 36,624 | 549,990 |
| Yodogawa Steel Works Ltd. | 36,067 | 605,506 |
| Yokogawa Bridge Holdings Corp. | 37,073 | 531,585 |
| Yokohama Reito Co., Ltd. | 49,544 | 480,760 |
| Yomiuri Land Co., Ltd. | 4,600 | 196,316 |
| Yondoshi Holdings, Inc. | 27,039 | 623,085 |
| Yonex Co., Ltd. | 47,126 | 222,877 |
| Yorozu Corp. | 24,429 | 288,145 |
| Yoshinoya Holdings Co., Ltd.(a) | 80,322 | 1,701,862 |
| Yuasa Trading Co., Ltd. | 19,936 | 549,745 |
| Yurtec Corp. | 47,926 | 299,354 |
| Yushin Precision Equipment Co., Ltd. | 24,265 | 212,600 |
| Zenrin Co., Ltd. | 39,082 | 649,495 |
| ZERIA Pharmaceutical Co., Ltd. | 48,936 | 859,359 |
| ZIGExN Co., Ltd. | 68,732 | 383,985 |
| Zojirushi Corp.(a) | 52,868 | 646,499 |
| Zuken, Inc. | 16,206 | 274,057 |
| 411,624,440 | ||
| Netherlands 2.2% | ||
| Accell Group N.V. | 27,051 | 667,294 |
| Altice Europe N.V. * | 670,726 | 2,970,060 |
| AMG Advanced Metallurgical Group N.V.(a) | 37,695 | 839,780 |
| APERAM S.A. | 62,364 | 1,509,550 |
| Security | Number of Shares | Value ($) |
| Arcadis N.V. | 88,734 | 1,681,732 |
| ASM International N.V. | 48,356 | 4,070,587 |
| B&S Group Sarl | 32,006 | 412,385 |
| Basic-Fit N.V * | 42,738 | 1,343,712 |
| BE Semiconductor Industries N.V. | 88,828 | 2,626,516 |
| Brunel International N.V. | 26,726 | 307,859 |
| Corbion N.V. | 74,156 | 2,110,206 |
| Eurocommercial Properties N.V. | 59,702 | 1,531,901 |
| Flow Traders | 34,999 | 941,212 |
| ForFarmers N.V. | 43,409 | 285,391 |
| Fugro N.V. CVA *(a) | 102,714 | 726,643 |
| IMCD N.V. | 65,928 | 4,632,085 |
| Intertrust N.V. | 110,069 | 2,287,299 |
| Koninklijke BAM Groep N.V. | 311,917 | 915,767 |
| Koninklijke Volkerwessels N.V. | 30,990 | 532,393 |
| NIBC Holding N.V. | 45,990 | 363,135 |
| NSI N.V. | 23,192 | 1,006,284 |
| PostNL N.V. | 623,606 | 1,244,727 |
| SBM Offshore N.V. | 221,614 | 3,716,918 |
| Sligro Food Group N.V. | 42,271 | 1,196,359 |
| Takeaway.com N.V. * | 45,605 | 4,361,825 |
| TKH Group N.V. | 53,297 | 2,556,681 |
| TomTom N.V. * | 84,050 | 1,026,121 |
| Vastned Retail N.V. | 22,804 | 664,236 |
| Wereldhave N.V. | 51,809 | 1,037,824 |
| Wessanen | 68,487 | 855,278 |
| 48,421,760 | ||
| New Zealand 1.0% | ||
| Argosy Property Ltd. | 1,049,622 | 969,825 |
| Chorus Ltd. | 545,997 | 1,735,576 |
| EBOS Group Ltd. | 117,412 | 1,756,507 |
| Freightways Ltd. | 194,328 | 976,824 |
| Genesis Energy Ltd. | 644,586 | 1,398,499 |
| Goodman Property Trust | 1,330,931 | 1,829,932 |
| Heartland Group Holdings Ltd. | 498,560 | 496,818 |
| Infratil Ltd. | 555,048 | 1,592,813 |
| Kathmandu Holdings Ltd. | 233,687 | 384,678 |
| Mainfreight Ltd. | 99,891 | 2,592,501 |
| Metlifecare Ltd. | 214,296 | 587,931 |
| New Zealand Refining Co., Ltd. | 228,275 | 295,145 |
| Precinct Properties New Zealand Ltd. | 1,179,841 | 1,387,794 |
| Pushpay Holdings Ltd. * | 227,000 | 436,665 |
| Restaurant Brands New Zealand Ltd. * | 43,525 | 278,630 |
| Scales Corp., Ltd. | 132,369 | 396,554 |
| SKY Network Television Ltd. | 507,134 | 351,834 |
| Summerset Group Holdings Ltd. | 276,778 | 1,054,366 |
| Synlait Milk Ltd. * | 122,394 | 721,763 |
| Tourism Holdings Ltd. | 173,220 | 410,779 |
| Vector Ltd. | 306,963 | 689,222 |
| Vital Healthcare Property Trust | 484,706 | 802,473 |
| Z Energy Ltd. | 464,875 | 1,858,867 |
| 23,005,996 | ||
| Norway 1.8% | ||
| Akastor A.S.A. * | 193,764 | 241,720 |
| Aker Solutions A.S.A. * | 182,886 | 547,277 |
| Atea A.S.A. * | 105,208 | 1,344,814 |
| Austevoll Seafood A.S.A. | 114,349 | 1,174,726 |
| Bakkafrost P/F | 50,105 | 2,946,463 |
| Borr Drilling Ltd. * | 95,577 | 533,185 |
| Borregaard A.S.A. | 124,781 | 1,249,694 |
| BW LPG Ltd. * | 88,337 | 435,950 |
| DNO A.S.A. | 777,887 | 1,030,634 |
| Elkem A.S.A. | 302,945 | 764,494 |
| Entra A.S.A. | 178,177 | 2,684,517 |
| Security | Number of Shares | Value ($) |
| Evry A/S | 218,124 | 766,503 |
| Frontline Ltd. * | 96,470 | 827,907 |
| Grieg Seafood A.S.A. | 66,713 | 819,054 |
| Hoegh LNG Holdings Ltd.(a) | 50,196 | 176,668 |
| Kongsberg Gruppen A.S.A. | 93,258 | 1,221,763 |
| Nordic Semiconductor A.S.A. * | 187,258 | 848,869 |
| Norway Royal Salmon A.S.A. | 20,720 | 424,127 |
| Norwegian Air Shuttle A.S.A. *(a) | 49,649 | 198,514 |
| Norwegian Finans Holding A.S.A. * | 203,180 | 1,573,006 |
| Ocean Yield A.S.A. | 58,829 | 328,829 |
| PGS A.S.A. * | 392,359 | 470,077 |
| Sbanken A.S.A. | 102,770 | 710,996 |
| Scatec Solar A.S.A. | 103,992 | 1,208,220 |
| Seadrill Ltd. *(a) | 81,629 | 193,982 |
| SpareBank 1 Oestlandet | 37,796 | 343,666 |
| SpareBank 1 SMN | 164,449 | 1,733,656 |
| SpareBank 1 SR-Bank A.S.A. | 221,415 | 2,297,732 |
| Stolt-Nielsen Ltd. | 31,319 | 339,458 |
| Storebrand A.S.A. | 582,920 | 3,356,851 |
| TGS Nopec Geophysical Co. A.S.A. | 148,566 | 3,585,977 |
| Tomra Systems A.S.A. | 137,049 | 3,852,798 |
| Veidekke A.S.A. | 133,199 | 1,377,883 |
| Wallenius Wilhelmsen A.S.A. | 128,972 | 283,260 |
| XXL A.S.A. *(a) | 126,237 | 316,901 |
| 40,210,171 | ||
| Poland 0.7% | ||
| Alior Bank S.A. * | 120,185 | 1,222,441 |
| AmRest Holdings SE * | 91,450 | 948,587 |
| Asseco Poland S.A. | 92,577 | 1,304,066 |
| Bank Handlowy w Warszawie S.A. | 40,332 | 511,772 |
| Bank Millennium S.A. * | 754,116 | 1,265,419 |
| Budimex S.A. | 14,213 | 468,763 |
| CCC S.A. | 37,180 | 1,154,167 |
| Ciech S.A. * | 31,127 | 282,121 |
| Enea S.A. * | 272,409 | 594,959 |
| Energa S.A. * | 263,989 | 439,655 |
| Eurocash S.A. | 95,047 | 491,513 |
| Grupa Azoty S.A. * | 57,568 | 549,309 |
| Jastrzebska Spolka Weglowa S.A. | 63,487 | 475,040 |
| Kernel Holding S.A. | 65,752 | 748,245 |
| KRUK S.A. | 20,228 | 845,390 |
| Orange Polska S.A. * | 833,689 | 1,338,075 |
| PKP Cargo S.A. | 36,741 | 256,228 |
| PLAY Communications S.A. | 132,408 | 1,145,417 |
| Tauron Polska Energia S.A. * | 1,228,997 | 462,891 |
| Warsaw Stock Exchange | 33,952 | 335,934 |
| 14,839,992 | ||
| Portugal 0.4% | ||
| Altri, SGPS, S.A. | 90,152 | 570,859 |
| Banco Comercial Portugues S.A. | 9,652,715 | 2,053,726 |
| Corticeira Amorim SGPS S.A. | 45,738 | 460,876 |
| CTT-Correios de Portugal S.A. | 196,972 | 407,801 |
| Mota-Engil, SGPS, S.A. | 104,763 | 218,511 |
| NOS, SGPS S.A. | 281,687 | 1,658,061 |
| REN - Redes Energeticas Nacionais, SGPS, S.A. | 475,858 | 1,336,299 |
| Semapa-Sociedade de Investimento e Gestao | 30,603 | 406,441 |
| Sonae, SGPS, S.A. | 1,227,053 | 1,114,816 |
| The Navigator Co. S.A. | 314,922 | 1,065,394 |
| 9,292,784 | ||
| Security | Number of Shares | Value ($) |
| Republic of Korea 4.2% | ||
| ABLBio, Inc. * | 29,102 | 443,287 |
| Able C&C Co., Ltd. * | 22,268 | 186,601 |
| Advanced Process Systems Corp. | 13,989 | 307,209 |
| Aekyung Industrial Co., Ltd. | 8,320 | 221,867 |
| Ahnlab, Inc. | 7,704 | 393,707 |
| AK Holdings, Inc. | 6,280 | 172,651 |
| Amicogen, Inc. * | 22,767 | 380,625 |
| Ananti, Inc. * | 54,737 | 549,065 |
| Anterogen Co., Ltd. * | 5,564 | 184,663 |
| Aprogen pharmaceuticals, Inc. * | 309,501 | 200,585 |
| Asiana Airlines, Inc. * | 134,535 | 639,770 |
| BH Co., Ltd. * | 26,423 | 342,490 |
| Binex Co., Ltd. * | 29,655 | 199,536 |
| Binggrae Co., Ltd. | 5,919 | 278,541 |
| Bukwang Pharmaceutical Co., Ltd. | 42,855 | 491,793 |
| Cafe24 Corp. * | 6,672 | 367,408 |
| Caregen Co., Ltd. *(b) | 4,634 | 219,505 |
| Celltrion Pharm, Inc. * | 21,139 | 577,668 |
| Chong Kun Dang Pharmaceutical Corp. | 8,596 | 588,325 |
| Chongkundang Holdings Corp. | 4,415 | 323,311 |
| CJ CGV Co., Ltd. | 15,057 | 417,059 |
| CJ Hello Co., Ltd. | 32,776 | 170,205 |
| CMG Pharmaceutical Co., Ltd. * | 154,523 | 357,205 |
| Com2uSCorp | 11,974 | 929,252 |
| Cosmax, Inc. | 8,496 | 500,115 |
| CrystalGenomics, Inc. * | 42,940 | 471,498 |
| Cuckoo Holdings Co., Ltd. | 1,975 | 171,207 |
| Cuckoo Homesys Co., Ltd. | 6,793 | 227,415 |
| Dae Han Flour Mills Co., Ltd. | 1,229 | 180,608 |
| Daea TI Co., Ltd. | 82,210 | 352,935 |
| Daeduck Electronics Co. | 61,318 | 477,382 |
| Daesang Corp. | 23,321 | 417,805 |
| Daewoong Co., Ltd. | 24,823 | 338,146 |
| Daewoong Pharmaceutical Co., Ltd. | 5,587 | 772,609 |
| Daishin Securities Co., Ltd. | 48,000 | 463,653 |
| Daou Technology, Inc. | 32,343 | 520,692 |
| Dawonsys Co., Ltd. | 25,097 | 281,791 |
| DB HiTek Co., Ltd. | 47,497 | 576,434 |
| Dentium Co., Ltd. | 7,932 | 449,234 |
| DIO Corp. * | 12,752 | 463,231 |
| Dong-A Socio Holdings Co., Ltd. | 3,700 | 268,813 |
| Dong-A ST Co., Ltd. | 5,507 | 387,365 |
| Dongjin Semichem Co., Ltd. | 36,489 | 411,207 |
| DongKook Pharmaceutical Co., Ltd. | 6,010 | 324,503 |
| Dongkuk Steel Mill Co., Ltd. * | 72,092 | 360,683 |
| Dongwon F&B Co., Ltd. | 1,263 | 227,314 |
| Dongwon Industries Co., Ltd. | 1,731 | 327,264 |
| DoubleUGames Co., Ltd. | 11,961 | 547,071 |
| Duzone Bizon Co., Ltd. | 22,776 | 1,079,333 |
| Ecopro Co., Ltd. * | 21,698 | 360,962 |
| Enzychem Lifesciences Corp. * | 7,321 | 340,891 |
| Eo Technics Co., Ltd. | 10,140 | 611,121 |
| Esmo Corp. * | 112,396 | 535,418 |
| Eutilex Co., Ltd. * | 5,588 | 271,269 |
| F&F Co., Ltd. | 8,697 | 563,645 |
| Feelux Co., Ltd. * | 62,668 | 222,992 |
| Foosung Co., Ltd. * | 61,968 | 465,559 |
| G-treeBNT Co., Ltd. * | 24,402 | 420,047 |
| Gamevil, Inc. * | 6,036 | 153,485 |
| GemVax & Kael Co., Ltd. * | 38,947 | 382,637 |
| Genexine Co., Ltd. * | 15,103 | 649,632 |
| Grand Korea Leisure Co., Ltd. | 20,676 | 329,450 |
| Green Cross Cell Corp. | 7,115 | 229,677 |
| Green Cross Corp. | 7,126 | 635,383 |
| Green Cross Holdings Corp. | 34,554 | 527,760 |
| GS Home Shopping, Inc. | 3,930 | 517,511 |
| Security | Number of Shares | Value ($) |
| Halla Holdings Corp. | 10,272 | 360,845 |
| Hana Tour Service, Inc. | 11,169 | 385,440 |
| Hanall Biopharma Co., Ltd. * | 44,974 | 987,664 |
| Hancom, Inc. | 20,648 | 172,173 |
| Handsome Co., Ltd. | 16,583 | 403,195 |
| Hanil Cement Co., Ltd. | 2,863 | 238,731 |
| Hanjin Kal Corp. | 38,695 | 942,417 |
| Hanjin Transportation Co., Ltd. | 14,525 | 351,358 |
| Hankook Shell Oil Co., Ltd. | 770 | 205,015 |
| Hankook Technology Group Co., Ltd. | 31,268 | 380,766 |
| Hansae Co., Ltd. | 20,903 | 305,456 |
| Hansol Chemical Co., Ltd. | 10,761 | 698,299 |
| Hansol Paper Co., Ltd. | 21,601 | 283,555 |
| Hanwha General Insurance Co., Ltd. | 113,058 | 305,222 |
| Hanwha Investment & Securities Co., Ltd. * | 122,181 | 208,300 |
| Harim Holdings Co., Ltd. | 33,268 | 265,320 |
| HLB Life Science Co., Ltd. * | 48,668 | 287,689 |
| HS Industries Co., Ltd. | 54,220 | 396,159 |
| Huchems Fine Chemical Corp. | 26,167 | 460,150 |
| Hugel, Inc. * | 2,528 | 768,053 |
| Huons Co., Ltd. | 6,122 | 229,717 |
| Huons Global Co., Ltd. | 6,433 | 154,286 |
| Hyosung Advanced Materials Corp. * | 3,860 | 431,810 |
| Hyosung Chemical Corp. | 2,979 | 370,146 |
| Hyosung Corp. | 11,037 | 787,283 |
| Hyosung Heavy Industries Corp. * | 9,927 | 290,127 |
| Hyundai Electric & Energy System Co., Ltd. * | 14,847 | 155,671 |
| Hyundai Elevator Co., Ltd. * | 19,605 | 1,273,819 |
| Hyundai Greenfood Co., Ltd. | 61,000 | 579,154 |
| Hyundai Home Shopping Network Corp. | 7,598 | 584,003 |
| Hyundai Merchant Marine Co., Ltd. * | 340,142 | 953,380 |
| Hyundai Rotem Co., Ltd. * | 60,685 | 859,234 |
| i-SENS, Inc. | 10,808 | 253,414 |
| Iljin Materials Co., Ltd. * | 20,100 | 707,752 |
| Ilyang Pharmaceutical Co., Ltd. * | 15,839 | 268,070 |
| iMarketKorea, Inc. | 24,649 | 233,008 |
| InBody Co., Ltd. | 14,272 | 282,789 |
| Innocean Worldwide, Inc. | 13,958 | 776,693 |
| Innox Advanced Materials Co., Ltd. * | 7,426 | 299,186 |
| Inscobee, Inc. * | 100,940 | 237,506 |
| Insun ENT Co., Ltd. * | 39,412 | 236,228 |
| INTOPS Co., Ltd. | 14,898 | 158,051 |
| iNtRON Biotechnology, Inc. * | 30,695 | 326,907 |
| IS Dongseo Co., Ltd. | 17,061 | 424,676 |
| JB Financial Group Co., Ltd. | 178,452 | 808,835 |
| Jeil Pharmaceutical Co., Ltd. | 10,046 | 247,159 |
| Jenax, Inc. * | 20,080 | 93,997 |
| Jusung Engineering Co., Ltd. | 37,251 | 206,053 |
| JW Holdings Corp. | 40,673 | 206,177 |
| JW Pharmaceutical Corp. | 16,337 | 361,471 |
| JYP Entertainment Corp. | 33,422 | 528,406 |
| KEPCO Engineering & Construction Co., Inc. | 14,246 | 209,353 |
| KISWIRE Ltd. | 9,102 | 174,713 |
| KIWOOM Securities Co., Ltd. | 13,957 | 758,201 |
| Koh Young Technology, Inc. | 15,186 | 960,370 |
| Kolmar Korea Co., Ltd. | 17,869 | 640,260 |
| Kolmar Korea Holdings Co., Ltd. | 7,400 | 124,326 |
| Kolon Industries, Inc. | 23,522 | 772,900 |
| Kolon Life Science, Inc. * | 8,577 | 111,882 |
| Komipharm International Co., Ltd. * | 44,351 | 443,052 |
| KONA I Co., Ltd. * | 14,607 | 199,584 |
| Korea Asset In Trust Co., Ltd. | 68,106 | 190,894 |
| Korea Electric Terminal Co., Ltd. | 9,126 | 350,725 |
| Korea Line Corp. * | 13,939 | 267,560 |
| Korea PetroChemical Ind Co., Ltd. | 3,660 | 353,536 |
| Security | Number of Shares | Value ($) |
| Korea Real Estate Investment & Trust Co., Ltd. | 199,176 | 348,609 |
| Korean Reinsurance Co. | 115,318 | 773,071 |
| Kumho Industrial Co., Ltd. | 36,412 | 387,793 |
| Kumho Tire Co., Inc. * | 164,544 | 556,970 |
| Kwang Dong Pharmaceutical Co., Ltd. | 43,565 | 256,085 |
| Kyobo Securities Co., Ltd. | 24,390 | 191,898 |
| L&F Co., Ltd. | 19,263 | 465,970 |
| LEENO Industrial, Inc. | 11,202 | 513,280 |
| LegoChem Biosciences, Inc. * | 8,279 | 313,389 |
| LF Corp. | 21,003 | 334,661 |
| LG Hausys Ltd. | 6,928 | 336,891 |
| LG Innotek Co., Ltd. | 17,331 | 1,409,373 |
| LG International Corp. | 30,086 | 427,227 |
| LIG Nex1 Co., Ltd. | 13,673 | 351,632 |
| Lock&Lock Co., Ltd. | 19,634 | 193,706 |
| Lotte Confectionery Co., Ltd. | 1,624 | 202,455 |
| Lotte Food Co., Ltd. | 417 | 152,513 |
| LOTTE Himart Co., Ltd. | 14,045 | 362,938 |
| LS Industrial Systems Co., Ltd. | 19,514 | 740,283 |
| Maeil Dairies Co., Ltd. | 3,914 | 295,671 |
| Medipost Co., Ltd. * | 18,486 | 447,937 |
| Meritz Financial Group, Inc. | 38,679 | 410,341 |
| Meritz Fire & Marine Insurance Co., Ltd. | 69,426 | 1,028,852 |
| Meritz Securities Co., Ltd. | 352,633 | 1,384,330 |
| Mezzion Pharma Co., Ltd. * | 6,037 | 507,881 |
| Mirae Asset Life Insurance Co., Ltd. | 88,492 | 301,366 |
| Modetour Network, Inc. | 18,916 | 231,130 |
| Namhae Chemical Corp. | 31,762 | 231,807 |
| Namyang Dairy Products Co., Ltd. | 591 | 248,842 |
| Naturecell Co., Ltd. * | 46,386 | 239,733 |
| NEPES Corp. | 19,100 | 509,333 |
| Nexen Tire Corp. | 40,335 | 310,692 |
| NICE Holdings Co., Ltd. | 26,520 | 430,232 |
| NICE Information Service Co., Ltd. | 42,859 | 467,070 |
| NKMax Co., Ltd. * | 27,228 | 238,280 |
| NS Shopping Co., Ltd. | 18,871 | 157,356 |
| Orange Life Insurance Ltd. | 40,965 | 911,461 |
| Orion Holdings Corp. | 23,938 | 310,280 |
| Oscotec, Inc. * | 29,169 | 437,083 |
| Osstem Implant Co., Ltd. * | 12,775 | 485,687 |
| Pan Ocean Co., Ltd. * | 236,092 | 947,292 |
| Partron Co., Ltd. | 47,380 | 455,709 |
| Pearl Abyss Corp. * | 7,570 | 1,216,825 |
| Peptron, Inc. * | 16,862 | 177,495 |
| Pharmicell Co., Ltd. * | 73,165 | 454,242 |
| Poongsan Corp. | 21,979 | 399,206 |
| Posco ICT Co., Ltd. | 69,748 | 287,054 |
| S&T Motiv Co., Ltd. | 10,717 | 462,744 |
| Sam Chun Dang Pharm Co., Ltd. | 16,816 | 442,179 |
| Samchully Co., Ltd. | 2,663 | 185,338 |
| Samwha Capacitor Co., Ltd. | 9,501 | 317,681 |
| Samyang Corp. | 4,515 | 186,750 |
| Samyang Holdings Corp. | 7,375 | 366,543 |
| Sangsangin Co., Ltd. * | 44,815 | 432,888 |
| Seah Besteel Corp. | 12,000 | 160,000 |
| Sebang Global Battery Co., Ltd. | 9,699 | 307,085 |
| Seegene, Inc. * | 18,785 | 335,765 |
| Seobu T&D * | 30,782 | 195,429 |
| Seoul Semiconductor Co., Ltd. | 43,746 | 532,717 |
| SFA Engineering Corp. | 21,366 | 702,057 |
| SFA Semicon Co., Ltd. * | 93,959 | 194,318 |
| Shinsegae International, Inc. | 2,978 | 456,073 |
| Silicon Works Co., Ltd. | 10,926 | 296,321 |
| SK Chemicals Co., Ltd. | 10,592 | 380,831 |
| SK Discovery Co., Ltd. | 13,864 | 254,674 |
| SK Gas Ltd. | 4,668 | 294,821 |
| SK Materials Co., Ltd. | 5,678 | 854,571 |
| Security | Number of Shares | Value ($) |
| SK Securities Co., Ltd. | 465,679 | 236,444 |
| SKCKOLONPI, Inc. | 15,970 | 404,771 |
| SL Corp. | 21,736 | 385,820 |
| SM Entertainment Co., Ltd. * | 20,945 | 515,303 |
| Songwon Industrial Co., Ltd. | 20,205 | 306,933 |
| Soulbrain Co., Ltd. | 10,678 | 600,348 |
| SPC SAMLIP Co., Ltd. | 2,628 | 189,845 |
| STCUBE * | 29,292 | 292,618 |
| Studio Dragon Corp. * | 7,892 | 403,966 |
| Taekwang Industrial Co., Ltd. | 722 | 639,592 |
| Taeyoung Engineering & Construction Co., Ltd. | 50,584 | 507,406 |
| Taihan Electric Wire Co., Ltd. * | 292,256 | 142,358 |
| Telcon RF Pharmaceutical, Inc. * | 79,240 | 330,371 |
| TES Co., Ltd. | 17,685 | 217,549 |
| Tongyang, Inc. | 254,709 | 333,303 |
| Vieworks Co., Ltd. | 8,709 | 177,595 |
| Webzen, Inc. * | 19,969 | 288,510 |
| Wemade Co., Ltd. | 11,260 | 283,998 |
| WONIK IPS Co., Ltd. | 46,091 | 894,232 |
| YG Entertainment, Inc. | 13,064 | 228,654 |
| Young Poong Corp. | 674 | 313,281 |
| Youngone Corp. | 38,688 | 1,124,308 |
| Youngone Holdings Co., Ltd. | 6,394 | 260,511 |
| Yuanta Securities Korea Co., Ltd. * | 91,845 | 202,078 |
| Yungjin Pharmaceutical Co., Ltd. * | 110,568 | 409,866 |
| 92,936,622 | ||
| Singapore 1.4% | ||
| Accordia Golf Trust | 961,966 | 367,533 |
| AIMS APAC REIT | 704,468 | 716,047 |
| Ascendas Hospitality Trust | 1,076,416 | 838,040 |
| Ascendas India Trust | 1,006,308 | 1,037,356 |
| Ascott Residence Trust | 1,377,751 | 1,291,145 |
| Asian Pay Television Trust | 1,770,742 | 215,726 |
| Best World International Ltd.(b) | 321,868 | 234,579 |
| Boustead Singapore Ltd. | 386,740 | 199,336 |
| Bukit Sembawang Estates Ltd. | 240,322 | 878,340 |
| Bumitama Agri Ltd. | 399,459 | 161,258 |
| Cache Logistics Trust | 1,287,978 | 663,858 |
| CapitaLand Retail China Trust | 775,844 | 866,896 |
| CDL Hospitality Trusts | 962,865 | 1,110,571 |
| China Hongxing Sports Ltd. *(b) | 884,000 | — |
| ESR-REIT | 2,723,198 | 1,001,176 |
| Far East Hospitality Trust | 1,130,270 | 537,758 |
| First Real Estate Investment Trust | 625,930 | 451,218 |
| First Resources Ltd. | 637,561 | 680,212 |
| Frasers Centrepoint Trust | 708,468 | 1,404,475 |
| Frasers Commercial Trust | 832,231 | 983,895 |
| Frasers Hospitality Trust | 1,011,802 | 514,216 |
| Frasers Logistics & Industrial Trust | 1,844,596 | 1,622,266 |
| GuocoLand Ltd. | 370,064 | 525,538 |
| Keppel DC REIT | 1,031,105 | 1,360,238 |
| Keppel Infrastructure Trust | 4,476,913 | 1,662,061 |
| Lippo Malls Indonesia Retail Trust | 2,577,931 | 427,425 |
| Manulife US Real Estate Investment Trust | 1,430,703 | 1,301,940 |
| NetLink NBN Trust | 3,713,308 | 2,382,385 |
| OUE Hospitality Trust | 1,334,995 | 702,528 |
| OUE Ltd. | 330,286 | 345,238 |
| Parkway Life Real Estate Investment Trust | 483,560 | 1,077,134 |
| Raffles Medical Group Ltd. | 1,178,030 | 832,230 |
| Sabana Shari'ah Compliant Industrial Real Estate Investment Trust | 1,147,020 | 372,087 |
| Sheng Siong Group Ltd. | 535,328 | 455,368 |
| Silverlake Axis Ltd. | 942,827 | 309,246 |
| Soilbuild Business Space REIT | 1,315,471 | 516,819 |
| SPH REIT | 732,583 | 575,631 |
| Security | Number of Shares | Value ($) |
| Starhill Global REIT | 1,682,946 | 909,897 |
| Thomson Medical Group Ltd. | 7,894,020 | 324,365 |
| Yoma Strategic Holdings Ltd. | 1,471,255 | 328,784 |
| 30,184,815 | ||
| Spain 1.6% | ||
| Aedas Homes SAU * | 27,794 | 628,997 |
| Almirall S.A. | 73,282 | 1,397,755 |
| Applus Services S.A. | 183,320 | 2,440,743 |
| Atresmedia Corp de Medios de Comunicaion S.A. | 102,912 | 379,435 |
| Bolsas y Mercados Espanoles SHMSF S.A. | 94,774 | 2,454,779 |
| Cia de Distribucion Integral Logista Holdings S.A. | 80,145 | 1,577,201 |
| Cie Automotive S.A. | 69,032 | 1,602,533 |
| Construcciones y Auxiliar de Ferrocarriles S.A. | 23,024 | 1,001,530 |
| Ebro Foods S.A. | 97,871 | 2,042,439 |
| Ence Energia y Celulosa S.A. | 157,619 | 619,326 |
| Euskaltel S.A. | 120,154 | 1,012,245 |
| Faes Farma S.A. | 343,994 | 1,808,882 |
| Fluidra S.A. * | 74,969 | 913,109 |
| Gestamp Automocion S.A. | 193,161 | 864,914 |
| Global Dominion Access S.A. * | 143,464 | 625,639 |
| Indra Sistemas S.A. * | 151,423 | 1,193,963 |
| Lar Espana Real Estate Socimi S.A. | 84,520 | 631,997 |
| Let's GOWEX S.A. *(b) | 5,361 | — |
| Liberbank S.A. | 1,687,440 | 588,707 |
| Masmovil Ibercom S.A. * | 97,051 | 1,990,058 |
| Mediaset Espana Comunicacion S.A. | 220,288 | 1,396,846 |
| Melia Hotels International S.A. | 137,312 | 1,134,111 |
| Metrovacesa S.A. | 55,490 | 529,810 |
| Neinor Homes S.A. * | 99,125 | 1,221,516 |
| Pharma Mar S.A. * | 210,957 | 467,885 |
| Promotora de Informaciones S.A., Class A * | 523,196 | 731,735 |
| Prosegur Cash S.A. | 456,207 | 711,396 |
| Prosegur Cia de Seguridad S.A. | 329,123 | 1,214,197 |
| Sacyr S.A. | 435,972 | 1,084,098 |
| Tecnicas Reunidas S.A. * | 37,708 | 945,961 |
| Unicaja Banco S.A. | 984,111 | 726,114 |
| Viscofan S.A. | 48,515 | 2,264,242 |
| 36,202,163 | ||
| Sweden 4.8% | ||
| AAK AB | 213,424 | 4,251,374 |
| Adapteo Oyj * | 52,438 | 626,681 |
| AF Poyry AB | 121,518 | 2,740,933 |
| Arjo AB, B Shares | 280,986 | 1,125,457 |
| Atrium Ljungberg AB, B Shares | 58,743 | 1,209,985 |
| Attendo AB | 131,110 | 574,880 |
| Avanza Bank Holding AB | 149,322 | 1,190,702 |
| Axfood AB | 133,399 | 2,799,436 |
| Beijer Ref AB | 78,759 | 1,766,833 |
| Betsson AB * | 151,703 | 734,785 |
| Bilia AB, A Shares | 96,932 | 805,065 |
| BillerudKorsnas AB | 219,639 | 2,432,271 |
| Bonava AB, B Shares | 106,779 | 1,197,709 |
| Bravida Holding AB | 259,083 | 2,168,976 |
| Bure Equity AB | 63,681 | 980,527 |
| Catena AB | 25,672 | 956,797 |
| Clas Ohlson AB, B Shares(a) | 46,580 | 455,740 |
| Cloetta AB, B Shares | 257,841 | 768,780 |
| Collector AB * | 53,362 | 280,228 |
| Concentric AB | 49,318 | 571,290 |
| Dometic Group AB | 368,135 | 3,001,598 |
| Security | Number of Shares | Value ($) |
| Evolution Gaming Group AB | 155,176 | 2,914,653 |
| Fabege AB | 335,395 | 5,613,971 |
| Getinge AB, B Shares | 283,091 | 3,910,009 |
| Haldex AB | 38,072 | 198,381 |
| Hansa Biopharma AB * | 41,531 | 705,961 |
| Hembla AB * | 45,142 | 903,135 |
| Hemfosa Fastigheter AB | 202,025 | 2,040,480 |
| Hexpol AB | 310,937 | 2,331,996 |
| Holmen AB, B Shares | 133,083 | 3,123,925 |
| Hufvudstaden AB, A Shares | 137,699 | 2,551,282 |
| Indutrade AB | 116,889 | 3,342,138 |
| Intrum AB(a) | 91,854 | 2,335,970 |
| Investment AB Oresund | 37,568 | 469,657 |
| JM AB | 87,434 | 2,183,443 |
| Klovern AB, B Shares | 610,922 | 1,105,127 |
| Kungsleden AB | 236,202 | 2,186,966 |
| Lifco AB, B Shares | 56,883 | 2,766,773 |
| Lindab International AB | 85,158 | 821,465 |
| Loomis AB, B Shares | 94,490 | 3,198,870 |
| Mekonomen AB * | 52,259 | 418,049 |
| Modern Times Group MTG AB, B Shares * | 81,568 | 627,139 |
| Munters Group AB * | 66,581 | 271,163 |
| Mycronic AB | 84,600 | 1,033,475 |
| NCC AB, B Shares | 119,352 | 1,906,482 |
| NetEnt AB * | 235,242 | 576,903 |
| Nobia AB | 147,935 | 870,401 |
| Nolato AB, B Shares | 21,588 | 1,155,698 |
| Nordic Entertainment Group AB, Class B | 81,568 | 1,979,564 |
| Nyfosa AB * | 202,550 | 1,361,101 |
| Pandox AB | 93,680 | 1,837,912 |
| Peab AB | 256,888 | 2,106,069 |
| Ratos AB, B Shares | 254,980 | 563,167 |
| Resurs Holding AB | 153,845 | 873,798 |
| Sagax AB, Class D | 118,744 | 452,852 |
| SAS AB * | 237,819 | 326,168 |
| Scandic Hotels Group AB | 86,905 | 671,717 |
| SkiStar AB | 49,453 | 584,956 |
| SSAB AB, A Shares | 298,452 | 827,173 |
| SSAB AB, B Shares | 751,729 | 1,881,086 |
| Sweco AB, B Shares | 82,327 | 2,154,129 |
| Thule Group AB | 128,723 | 2,555,611 |
| Vitrolife AB | 79,706 | 1,381,696 |
| Wallenstam AB, B Shares | 202,973 | 2,282,898 |
| Wihlborgs Fastigheter AB | 165,022 | 2,657,031 |
| 104,700,487 | ||
| Switzerland 4.1% | ||
| Allreal Holding AG * | 18,165 | 3,477,135 |
| Alpiq Holding AG * | 4,343 | 309,446 |
| ALSO Holding AG * | 3,397 | 484,084 |
| ams AG * | 97,346 | 3,898,956 |
| APG SGA S.A. | 1,266 | 333,949 |
| Arbonia AG * | 53,900 | 594,864 |
| Aryzta AG * | 1,187,623 | 960,709 |
| Ascom Holding AG | 44,197 | 452,043 |
| Autoneum Holding AG(a) | 3,375 | 370,774 |
| Bachem Holding AG, Class B | 7,023 | 1,022,095 |
| Basilea Pharmaceutica AG * | 13,456 | 615,240 |
| Belimo Holding AG | 588 | 2,971,348 |
| Bell Food Group AG * | 2,459 | 617,577 |
| Berner Kantonalbank AG | 5,558 | 1,213,329 |
| BKW AG | 23,061 | 1,505,625 |
| Bobst Group S.A. | 9,757 | 474,118 |
| Bossard Holding AG, Class A | 3,002 | 410,805 |
| Bucher Industries AG | 8,007 | 2,361,355 |
| Burckhardt Compression Holding AG | 4,035 | 952,218 |
| Cembra Money Bank AG | 35,253 | 3,577,140 |
| Security | Number of Shares | Value ($) |
| Comet Holding AG | 9,295 | 759,983 |
| Conzzeta AG | 1,600 | 1,296,882 |
| COSMO Pharmaceuticals N.V. * | 9,126 | 763,690 |
| Daetwyler Holding AG | 9,295 | 1,450,450 |
| dormakaba Holding AG * | 3,801 | 2,564,220 |
| EFG International AG * | 90,917 | 555,913 |
| Emmi AG | 2,423 | 1,961,517 |
| Forbo Holding AG | 1,297 | 1,890,216 |
| Galenica AG * | 60,845 | 3,403,680 |
| GAM Holding AG * | 201,639 | 784,180 |
| Hiag Immobilien Holding AG | 3,572 | 427,795 |
| Huber & Suhner AG | 21,458 | 1,374,943 |
| Idorsia Ltd. * | 109,751 | 3,083,610 |
| Implenia AG | 19,021 | 650,149 |
| Inficon Holding AG | 2,443 | 1,533,279 |
| Interroll Holding AG | 712 | 1,319,731 |
| Intershop Holding AG | 1,498 | 805,433 |
| Kardex AG | 7,284 | 1,021,799 |
| Komax Holding AG(a) | 4,325 | 819,584 |
| Kudelski S.A. *(a) | 40,660 | 247,794 |
| Landis & Gyr Group AG * | 32,951 | 2,700,820 |
| LEM Holding S.A. | 587 | 746,320 |
| Leonteq AG *(a) | 12,721 | 394,956 |
| Liechtensteinische Landesbank AG | 14,113 | 882,909 |
| Meyer Burger Technology AG *(a) | 889,451 | 354,899 |
| Mobimo Holding AG * | 8,112 | 2,291,479 |
| Rieter Holding AG | 3,794 | 506,915 |
| Schmolz & Bickenbach AG * | 484,612 | 141,546 |
| Schweiter Technologies AG | 1,212 | 1,133,054 |
| SFS Group AG | 20,962 | 1,531,712 |
| Siegfried Holding AG * | 5,007 | 2,064,638 |
| SIG Combibloc Group AG * | 171,513 | 2,263,843 |
| St. Galler Kantonalbank AG | 3,296 | 1,462,372 |
| Sunrise Communications Group AG * | 42,160 | 3,176,540 |
| Swissquote Group Holding S.A. | 12,155 | 505,389 |
| Tecan Group AG | 14,835 | 3,562,379 |
| u-blox Holding AG * | 8,629 | 562,069 |
| Valiant Holding AG | 19,684 | 2,049,070 |
| Valora Holding AG * | 3,980 | 1,122,260 |
| VAT Group AG * | 32,218 | 3,874,821 |
| Vetropack Holding AG | 245 | 602,936 |
| Vontobel Holding AG | 34,695 | 1,812,857 |
| VP Bank AG | 2,970 | 467,660 |
| VZ Holding AG | 3,384 | 993,534 |
| Ypsomed Holding AG * | 3,956 | 514,966 |
| Zehnder Group AG | 11,607 | 422,894 |
| 89,460,496 | ||
| United Kingdom 13.4% | ||
| 888 Holdings plc | 343,725 | 638,792 |
| AA plc | 774,109 | 525,582 |
| Acacia Mining plc * | 182,562 | 591,406 |
| AG Barr plc | 104,146 | 754,664 |
| Aggreko plc | 302,681 | 2,824,367 |
| AJ Bell plc | 203,726 | 992,431 |
| Alfa Financial Software Holdings plc * | 116,388 | 112,402 |
| Amigo Holdings plc(a) | 183,370 | 177,760 |
| AO World plc *(a) | 366,043 | 309,821 |
| Ascential plc | 491,735 | 2,267,282 |
| Assura plc | 2,958,851 | 2,497,182 |
| Aston Martin Lagonda Global Holdings plc *(a) | 81,646 | 477,873 |
| Avast plc | 505,902 | 2,341,229 |
| Bakkavor Group plc | 181,725 | 243,445 |
| Balfour Beatty plc | 866,749 | 2,275,810 |
| Bank of Cyprus Holdings plc * | 421,104 | 735,493 |
| Bank of Georgia Group plc | 47,222 | 782,702 |
| Security | Number of Shares | Value ($) |
| BBA Aviation plc | 1,322,232 | 5,169,001 |
| BCA Marketplace plc | 939,681 | 2,764,848 |
| Beazley plc | 662,400 | 4,594,179 |
| Big Yellow Group plc | 191,287 | 2,492,660 |
| Bodycote plc | 233,425 | 2,036,843 |
| Bovis Homes Group plc | 167,237 | 2,093,724 |
| Brewin Dolphin Holdings plc | 341,181 | 1,264,804 |
| Britvic plc | 331,952 | 3,507,023 |
| Cairn Energy plc * | 723,674 | 1,471,815 |
| Capita plc * | 2,079,228 | 3,184,227 |
| Card Factory plc | 387,194 | 727,121 |
| Centamin plc | 1,358,709 | 2,400,976 |
| Charter Court Financial Services Group plc | 205,339 | 655,189 |
| Chemring Group plc | 350,860 | 763,149 |
| Chesnara plc | 183,321 | 629,586 |
| Close Brothers Group plc | 188,897 | 2,965,322 |
| Coats Group plc | 1,761,681 | 1,569,407 |
| Computacenter plc | 91,367 | 1,474,345 |
| Countryside Properties plc | 551,193 | 2,008,441 |
| Cranswick plc | 64,638 | 2,172,656 |
| Crest Nicholson Holdings plc | 319,749 | 1,352,019 |
| Daejan Holdings plc | 6,142 | 389,710 |
| Daily Mail & General Trust plc N.V., Class A | 174,260 | 1,719,003 |
| De La Rue plc | 138,305 | 360,450 |
| Dechra Pharmaceuticals plc | 125,105 | 4,570,775 |
| Devro plc | 216,579 | 513,806 |
| Dignity plc | 62,572 | 357,546 |
| Diploma plc | 140,150 | 2,705,305 |
| Dixons Carphone plc | 1,249,351 | 1,634,115 |
| Domino's Pizza Group plc | 574,122 | 1,676,669 |
| Drax Group plc | 493,058 | 1,621,271 |
| Dunelm Group plc | 120,183 | 1,282,157 |
| EI Group plc * | 555,037 | 1,900,777 |
| Electrocomponents plc | 555,118 | 3,927,854 |
| Elementis plc | 728,345 | 1,329,636 |
| Entertainment One Ltd. | 479,764 | 3,418,042 |
| Equiniti Group plc | 400,505 | 999,898 |
| Essentra plc | 332,326 | 1,626,988 |
| Ferrexpo plc | 357,238 | 879,261 |
| Firstgroup plc * | 1,525,353 | 2,414,947 |
| Funding Circle Holdings plc *(a) | 181,442 | 247,485 |
| Galliford Try plc | 138,636 | 988,546 |
| Games Workshop Group plc | 40,759 | 2,174,160 |
| Genus plc | 81,695 | 2,616,647 |
| Georgia Capital plc * | 42,613 | 517,925 |
| GoCo Group plc | 368,365 | 337,357 |
| Grafton Group plc | 272,635 | 2,498,515 |
| Grainger plc | 747,326 | 2,222,540 |
| Great Portland Estates plc | 341,684 | 2,897,027 |
| Greencore Group plc | 554,419 | 1,417,243 |
| Greene King plc | 384,770 | 3,941,798 |
| Greggs plc | 126,055 | 3,245,331 |
| Halfords Group plc | 243,879 | 537,288 |
| Hansteen Holdings plc | 506,028 | 572,511 |
| Hastings Group Holdings plc | 393,898 | 877,867 |
| Hays plc | 1,681,133 | 2,866,316 |
| Helical plc | 132,574 | 568,323 |
| Hill & Smith Holdings plc | 100,139 | 1,402,475 |
| Hochschild Mining plc | 327,373 | 873,931 |
| HomeServe plc | 342,091 | 4,782,747 |
| Hunting plc | 176,584 | 982,792 |
| Ibstock plc | 490,208 | 1,279,968 |
| IG Group Holdings plc | 459,984 | 3,023,914 |
| Indivior plc * | 911,583 | 669,656 |
| Inmarsat plc | 588,644 | 4,329,957 |
| IntegraFin Holdings plc | 257,465 | 1,211,886 |
| Security | Number of Shares | Value ($) |
| Intermediate Capital Group plc | 348,711 | 5,673,695 |
| International Personal Finance plc | 285,184 | 306,676 |
| Intu Properties plc *(a) | 1,106,140 | 548,949 |
| ITE Group plc | 895,202 | 779,509 |
| IWG plc | 842,322 | 4,279,730 |
| J.D. Wetherspoon plc | 89,579 | 1,722,591 |
| John Laing Group plc | 635,590 | 2,738,601 |
| Jupiter Fund Management plc | 520,468 | 2,165,873 |
| Just Group plc * | 1,293,297 | 703,729 |
| Keller Group plc | 92,972 | 737,101 |
| Kier Group plc(a) | 195,979 | 280,441 |
| Lancashire Holdings Ltd. | 250,832 | 2,080,290 |
| LondonMetric Property plc | 807,151 | 2,017,094 |
| Lookers plc | 406,860 | 230,900 |
| Man Group plc | 1,887,742 | 3,831,262 |
| Marshalls plc | 256,000 | 2,163,682 |
| Marston's plc | 773,169 | 1,196,779 |
| McCarthy & Stone plc | 654,803 | 1,070,978 |
| Metro Bank plc *(a) | 195,624 | 640,391 |
| Mitchells & Butlers plc * | 280,199 | 1,190,929 |
| Mitie Group plc | 469,221 | 837,732 |
| Moneysupermarket.com Group plc | 650,183 | 2,957,468 |
| Morgan Advanced Materials plc | 351,834 | 1,095,198 |
| N Brown Group plc | 184,435 | 242,134 |
| National Express Group plc | 531,006 | 2,744,535 |
| NCC Group plc | 333,560 | 717,395 |
| NewRiver REIT plc(a) | 366,489 | 728,408 |
| Northgate plc | 166,384 | 653,484 |
| OneSavings Bank plc | 303,577 | 1,189,731 |
| Pagegroup plc | 389,470 | 1,985,487 |
| Paragon Banking Group plc | 319,794 | 1,698,830 |
| Petra Diamonds Ltd. * | 1,041,962 | 101,136 |
| Petrofac Ltd. | 327,275 | 1,666,828 |
| Pets at Home Group plc | 588,877 | 1,658,083 |
| Playtech plc | 388,827 | 1,756,808 |
| Plus500 Ltd. | 137,072 | 1,137,816 |
| Polypipe Group plc | 239,284 | 1,092,795 |
| Premier Foods plc * | 904,780 | 360,868 |
| Premier Oil plc * | 1,038,370 | 1,021,274 |
| Primary Health Properties plc | 1,394,436 | 2,319,761 |
| Provident Financial plc | 317,623 | 1,560,034 |
| PZ Cussons plc | 225,751 | 577,355 |
| QinetiQ Group plc | 702,094 | 2,467,661 |
| Rank Group plc | 213,431 | 419,002 |
| Rathbone Brothers plc | 67,962 | 1,845,716 |
| RDI REIT plc | 322,161 | 397,837 |
| Redrow plc | 283,309 | 1,904,554 |
| Renewi plc | 765,270 | 287,051 |
| Rhi Magnesita N.V. | 42,902 | 2,310,416 |
| Rotork plc | 1,109,917 | 4,184,903 |
| RPS Group plc | 274,507 | 451,316 |
| Safestore Holdings plc | 259,136 | 2,117,601 |
| Saga plc | 1,431,033 | 716,633 |
| Sanne Group plc | 172,031 | 1,095,727 |
| Savills plc | 166,705 | 1,678,990 |
| Schroder Real Estate Investment Trust Ltd. | 679,938 | 435,561 |
| Senior plc | 535,385 | 1,319,686 |
| Serco Group plc * | 1,373,932 | 2,441,262 |
| Shaftesbury plc | 279,787 | 2,950,797 |
| SIG plc | 748,491 | 1,149,465 |
| Sirius Minerals plc *(a) | 6,051,248 | 762,745 |
| Soco International plc | 402,761 | 308,036 |
| Softcat plc | 153,471 | 1,943,809 |
| Sophos Group plc | 422,649 | 1,972,934 |
| Spectris plc | 147,461 | 4,150,219 |
| Spire Healthcare Group plc | 355,485 | 455,873 |
| Sports Direct International plc * | 240,451 | 729,741 |
| Security | Number of Shares | Value ($) |
| SSP Group plc | 549,818 | 4,734,044 |
| ST Modwen Properties plc | 217,678 | 1,078,954 |
| Stagecoach Group plc | 512,267 | 769,225 |
| Stobart Group Ltd. | 413,533 | 606,360 |
| Superdry plc | 87,461 | 421,158 |
| Synthomer plc | 431,466 | 1,624,725 |
| TalkTalk Telecom Group plc(a) | 833,186 | 1,033,975 |
| TBC Bank Group plc | 46,822 | 702,513 |
| Ted Baker plc | 34,523 | 384,701 |
| Telecom Plus plc | 72,230 | 1,020,398 |
| The Go-Ahead Group plc | 54,804 | 1,388,256 |
| The Restaurant Group plc | 604,473 | 1,128,530 |
| The Unite Group plc | 357,673 | 4,560,650 |
| Thomas Cook Group plc *(a) | 1,713,310 | 107,249 |
| TP ICAP plc | 704,439 | 2,499,066 |
| Tritax Big Box REIT plc | 2,135,535 | 3,643,667 |
| Tullow Oil plc | 1,740,994 | 4,331,712 |
| UDG Healthcare plc | 313,042 | 2,992,721 |
| Ultra Electronics Holdings plc | 86,388 | 2,291,423 |
| Vectura Group plc * | 827,125 | 776,136 |
| Vesuvius plc | 262,720 | 1,489,704 |
| Victrex plc | 103,884 | 2,628,985 |
| WH Smith plc | 130,934 | 3,122,188 |
| William Hill plc | 1,084,977 | 2,354,627 |
| Wizz Air Holdings plc * | 35,756 | 1,565,895 |
| Workspace Group plc | 165,274 | 1,710,871 |
| 294,185,619 | ||
| Total Common Stock | ||
| (Cost $2,259,590,662) | 2,165,330,547 | |
| Preferred Stock0.3% of net assets | ||
| Germany 0.2% | ||
| Draegerwerk AG & Co. KGaA | 9,500 | 452,999 |
| Jungheinrich AG | 60,483 | 1,288,178 |
| Schaeffler AG | 93,373 | 634,443 |
| Sixt SE | 20,598 | 1,408,648 |
| 3,784,268 | ||
| Italy 0.0% | ||
| Danieli & C Officine Meccaniche S.p.A. - RSP | 44,536 | 457,102 |
| Republic of Korea 0.0% | ||
| Daishin Securities Co., Ltd. | 27,998 | 208,497 |
| Sweden 0.1% | ||
| Hemfosa Fastigheter AB | 13,008 | 261,306 |
| Klovern AB | 20,190 | 751,453 |
| 1,012,759 | ||
| Total Preferred Stock | ||
| (Cost $6,791,000) | 5,462,626 | |
| Rights0.0% of net assets | ||
| Singapore 0.0% | ||
| Soilbuild Business Space REIT *(b) | 236,785 | 2,560 |
| Total Rights | ||
| (Cost $—) | 2,560 | |
| Security | Number of Shares | Value ($) |
| Warrants0.0% of net assets | ||
| Singapore 0.0% | ||
| Ezion Holdings Ltd. expires 04/16/23 *(b) | 802,298 | — |
| Total Warrants | ||
| (Cost $—) | — | |
| Other Investment Companies3.6% of net assets | ||
| Switzerland 0.3% | ||
| BB Biotech AG | 69,486 | 4,438,340 |
| HBM Healthcare Investments AG, Class A * | 7,415 | 1,438,860 |
| 5,877,200 | ||
| United Kingdom 0.1% | ||
| BMO Commercial Property Trust Ltd. | 658,552 | 861,367 |
| Picton Property Income Ltd. | 634,577 | 670,034 |
| UK Commercial Property REIT Ltd. | 792,642 | 791,562 |
| 2,322,963 | ||
| United States 3.2% | ||
| Money Market Fund 0.1% | ||
| State Street Institutional U.S. Government Money Market Fund, Premier Class 2.07%(c) | 2,035,557 | 2,035,557 |
| Securities Lending Collateral 3.1% | ||
| Wells Fargo Government Money Market Fund, Select Class 2.03%(c) | 68,896,383 | 68,896,383 |
| 70,931,940 | ||
| Total Other Investment Companies | ||
| (Cost $78,846,277) | 79,132,103 | |
| Number of Contracts | Notional Amount ($) | Current Value/ Unrealized Appreciation ($) | ||
| Futures Contracts | ||||
| Long | ||||
| MSCI EAFE Index, expires 09/20/19 | 77 | 7,099,015 | 139,722 | |
| * | Non-income producing security. |
| (a) | All or a portion of this security is on loan. Securities on loan were valued at $65,060,287. |
| (b) | Fair-valued by management using significant unobservable inputs in accordance with procedures approved by the fund’s Board of Trustees. |
| (c) | The rate shown is the 7-day yield. |
| CVA — | Dutch Certificate |
| REIT — | Real Estate Investment Trust |
| RSP — | Risparmio (Convertible Savings Shares) |
| Security | Number of Shares | Value ($) |
| Common Stock97.3% of net assets | ||
| Brazil 6.8% | ||
| Ambev S.A. | 5,419,070 | 24,549,874 |
| Atacadao S.A. | 412,363 | 2,225,375 |
| B2W Cia Digital * | 225,527 | 2,565,164 |
| B3 S.A. - Brasil Bolsa Balcao | 2,483,100 | 26,920,981 |
| Banco Bradesco S.A. | 1,298,834 | 9,523,903 |
| Banco BTG Pactual S.A. | 301,091 | 4,268,407 |
| Banco do Brasil S.A. | 1,295,228 | 14,493,815 |
| Banco Santander Brasil S.A. | 479,012 | 4,938,268 |
| BB Seguridade Participacoes S.A. | 823,914 | 6,514,029 |
| BR Malls Participacoes S.A. | 952,994 | 3,108,842 |
| BRF S.A. * | 701,975 | 6,479,194 |
| CCR S.A. | 1,414,126 | 5,561,093 |
| Centrais Eletricas Brasileiras S.A. | 461,769 | 5,133,747 |
| Cia Energetica de Minas Gerais | 63,512 | 270,205 |
| Cia Paranaense de Energia | 64,712 | 882,308 |
| Cielo S.A. | 1,327,889 | 2,490,475 |
| Companhia de Saneamento Basico do Estado de Sao Paulo | 416,720 | 5,213,790 |
| Companhia Siderurgica Nacional S.A. | 810,790 | 2,817,614 |
| Cosan S.A. | 214,443 | 2,594,261 |
| CVC Brasil Operadora e Agencia de Viagens S.A. | 151,606 | 1,947,082 |
| EDP - Energias do Brasil S.A. | 360,523 | 1,753,669 |
| Embraer S.A. | 888,123 | 3,857,947 |
| Energisa S.A. | 237,247 | 2,726,601 |
| Engie Brasil Energia S.A. | 208,016 | 2,264,305 |
| Equatorial Energia S.A. | 212,331 | 4,921,093 |
| Fleury S.A. | 285,719 | 1,659,469 |
| Grendene S.A. | 331,253 | 645,319 |
| Guararapes Confeccoes S.A. | 78,948 | 403,127 |
| Hapvida Participacoes e Investimentos S.A. | 174,855 | 2,188,121 |
| Hypera S.A. | 513,443 | 3,997,256 |
| IRB Brasil Resseguros S.A. | 342,199 | 8,985,187 |
| Itau Unibanco Holding S.A. ADR | 5,975,747 | 49,240,155 |
| JBS S.A. | 1,212,774 | 8,699,148 |
| Klabin S.A. | 919,922 | 3,352,700 |
| Kroton Educacional S.A. | 1,845,351 | 4,501,510 |
| Localiza Rent a Car S.A. | 686,707 | 7,817,312 |
| Lojas Americanas S.A. | 150,010 | 523,122 |
| Lojas Renner S.A. | 991,339 | 12,127,241 |
| M Dias Branco S.A. | 118,693 | 1,039,806 |
| Magazine Luiza S.A. | 729,176 | 6,403,803 |
| Multiplan Empreendimentos Imobiliarios S.A. | 366,526 | 2,305,312 |
| Natura Cosmeticos S.A. | 231,327 | 3,693,663 |
| Notre Dame Intermedica Participacoes S.A. | 452,634 | 6,142,906 |
| Odontoprev S.A. | 325,914 | 1,342,398 |
| Petrobras Distribuidora S.A. | 904,153 | 6,301,633 |
| Petroleo Brasileiro S.A. | 3,657,369 | 25,021,495 |
| Porto Seguro S.A. | 124,398 | 1,685,854 |
| Raia Drogasil S.A. | 281,319 | 6,266,057 |
| Rumo S.A. * | 1,390,192 | 7,435,081 |
| Sao Martinho S.A. | 173,638 | 749,650 |
| Sul America S.A. | 267,220 | 3,133,152 |
| Security | Number of Shares | Value ($) |
| Suzano S.A. | 748,454 | 5,267,180 |
| Tim Participacoes S.A. | 1,004,001 | 2,988,532 |
| Transmissora Alianca de Energia Eletrica S.A. | 267,351 | 1,818,054 |
| Ultrapar Participacoes S.A. | 1,069,065 | 4,248,112 |
| Vale S.A. * | 4,282,656 | 47,229,232 |
| Via Varejo S.A. * | 569,610 | 1,065,555 |
| WEG S.A. | 878,818 | 4,785,200 |
| YDUQS Part | 307,295 | 2,339,553 |
| 393,423,937 | ||
| Chile 1.0% | ||
| AES Gener S.A. | 3,236,603 | 694,575 |
| Aguas Andinas S.A., A Shares | 3,632,844 | 2,004,432 |
| Banco de Chile | 32,393,847 | 4,628,175 |
| Banco de Credito e Inversiones S.A. | 54,887 | 3,470,843 |
| Banco Santander Chile | 78,598,228 | 5,631,130 |
| Cencosud S.A. | 1,703,365 | 2,556,734 |
| Cia Cervecerias Unidas S.A. | 185,505 | 2,111,512 |
| Colbun S.A. | 12,020,909 | 2,146,815 |
| Empresa Nacional de Telecomunicaciones S.A. * | 171,938 | 1,501,627 |
| Empresas CMPC S.A. | 1,404,858 | 3,250,879 |
| Empresas COPEC S.A. | 607,720 | 5,490,828 |
| Enel Americas S.A. | 45,481,328 | 7,471,447 |
| Enel Chile S.A. | 32,473,632 | 2,808,116 |
| Engie Energia Chile S.A. | 606,505 | 1,039,326 |
| Itau CorpBanca | 225,857,540 | 1,757,829 |
| Latam Airlines Group S.A. | 389,914 | 3,283,888 |
| Parque Arauco S.A. | 727,774 | 2,041,135 |
| Plaza S.A. | 294,000 | 715,014 |
| S.A.C.I. Falabella | 860,675 | 4,844,493 |
| 57,448,798 | ||
| China 33.7% | ||
| 360 Security Technology, Inc., A Shares | 94,800 | 293,659 |
| 3SBio, Inc. * | 1,593,052 | 2,456,057 |
| 51job, Inc. ADR * | 29,852 | 2,147,254 |
| 58.com, Inc. ADR * | 119,610 | 6,433,822 |
| AECC Aviation Power Co., Ltd., A Shares | 91,100 | 299,890 |
| Agile Group Holdings Ltd. | 1,751,070 | 2,239,303 |
| Agricultural Bank of China Ltd., A Shares | 1,213,300 | 576,390 |
| Agricultural Bank of China Ltd., H Shares | 39,847,031 | 15,358,348 |
| Aier Eye Hospital Group Co., Ltd., A Shares | 68,900 | 325,198 |
| Air China Ltd., H Shares | 2,455,369 | 2,127,787 |
| Aisino Corp., A Shares | 88,400 | 263,829 |
| Alibaba Group Holding Ltd. ADR * | 1,508,451 | 264,024,179 |
| Alibaba Health Information Technology Ltd. * | 4,708,445 | 4,464,861 |
| Alibaba Pictures Group Ltd. * | 17,813,781 | 2,932,834 |
| Aluminum Corp. of China Ltd., H Shares * | 5,229,851 | 1,535,178 |
| Angang Steel Co., Ltd., H Shares | 1,976,930 | 686,281 |
| Anhui Conch Cement Co., Ltd., A Shares | 165,200 | 910,135 |
| Anhui Conch Cement Co., Ltd., H Shares | 1,477,396 | 8,324,712 |
| Anhui Expressway Co., Ltd., H Shares | 506,336 | 286,275 |
| Anhui Gujing Distillery Co., Ltd., A Shares | 59,800 | 1,044,432 |
| Security | Number of Shares | Value ($) |
| ANTA Sports Products Ltd. | 1,502,824 | 12,467,032 |
| Autohome, Inc. ADR * | 68,218 | 5,945,881 |
| Avic Capital Co., Ltd., A Shares | 382,400 | 249,519 |
| AviChina Industry & Technology Co., Ltd., H Shares | 3,312,704 | 1,733,437 |
| BAIC Motor Corp., Ltd., H Shares | 2,867,966 | 1,617,849 |
| Baidu, Inc. ADR * | 343,445 | 35,879,699 |
| Bank of Beijing Co., Ltd., A Shares | 454,000 | 333,031 |
| Bank of China Ltd., H Shares | 96,815,929 | 36,945,335 |
| Bank of Communications Co., Ltd., A Shares | 327,000 | 247,180 |
| Bank of Communications Co., Ltd., H Shares | 9,395,542 | 6,151,497 |
| Bank of Nanjing Co., Ltd., A Shares | 260,800 | 284,231 |
| Bank of Ningbo Co., Ltd., A Shares | 130,700 | 417,100 |
| Bank of Shanghai Co., Ltd., A Shares | 316,170 | 398,470 |
| Baoshan Iron & Steel Co., Ltd., A Shares | 391,400 | 317,736 |
| BBMG Corp., A Shares | 1,264,700 | 595,506 |
| BBMG Corp., H Shares | 2,974,001 | 846,423 |
| BeiGene Ltd. ADR * | 41,194 | 5,921,637 |
| Beijing Capital International Airport Co., Ltd., H Shares | 2,028,619 | 1,703,601 |
| Beijing Enterprises Holdings Ltd. | 603,920 | 2,878,801 |
| Beijing Enterprises Water Group Ltd. * | 6,910,713 | 3,633,805 |
| Beijing Jingneng Clean Energy Co., Ltd., H Shares | 2,100,633 | 340,483 |
| Beijing New Building Materials plc, A Shares | 107,600 | 273,623 |
| Beijing North Star Co., Ltd., H Shares | 756,138 | 259,594 |
| Beijing Oriental Yuhong Waterproof Technology Co., Ltd., A Shares | 97,100 | 275,006 |
| Beijing Shiji Information Technology Co., Ltd., A Shares | 60,800 | 288,836 |
| Beijing Tongrentang Co., Ltd., A Shares | 172,200 | 668,878 |
| Bengang Steel Plates Co., Ltd., A Shares | 477,400 | 264,148 |
| BOE Technology Group Co., Ltd., A Shares | 1,384,100 | 707,811 |
| Bosideng International Holdings Ltd. | 3,345,140 | 1,148,440 |
| Brilliance China Automotive Holdings Ltd. | 3,401,207 | 3,615,927 |
| BYD Co., Ltd., H Shares(a) | 898,397 | 4,655,174 |
| BYD Electronic International Co., Ltd. | 1,092,476 | 1,314,817 |
| CAR, Inc. * | 915,657 | 649,754 |
| Central China Securities Co., Ltd., H Shares | 2,242,925 | 446,561 |
| CGN Power Co., Ltd., H Shares | 14,198,734 | 3,751,125 |
| Changchun High & New Technology Industry Group, Inc., A Shares | 6,600 | 324,283 |
| China Agri-Industries Holdings Ltd. | 2,830,220 | 798,278 |
| China BlueChemical Ltd., H Shares | 2,479,495 | 658,216 |
| China Cinda Asset Management Co., Ltd., H Shares | 10,769,354 | 2,240,365 |
| China CITIC Bank Corp., Ltd., H Shares | 11,946,597 | 6,251,290 |
| China Coal Energy Co., Ltd., A Shares | 938,700 | 632,183 |
| China Coal Energy Co., Ltd., H Shares | 1,726,291 | 685,198 |
| China Communications Construction Co., Ltd., A Shares | 347,000 | 483,870 |
| China Communications Construction Co., Ltd., H Shares | 5,150,799 | 3,996,868 |
| China Communications Services Corp., Ltd., H Shares | 3,108,727 | 1,741,762 |
| China Conch Venture Holdings Ltd. | 2,068,202 | 6,889,299 |
| China Construction Bank Corp., H Shares | 117,095,771 | 86,977,274 |
| China Dongxiang Group Co., Ltd. | 4,858,678 | 520,882 |
| China Eastern Airlines Corp., Ltd., H Shares * | 2,686,540 | 1,265,206 |
| Security | Number of Shares | Value ($) |
| China Everbright Bank Co., Ltd., A Shares | 1,722,200 | 904,775 |
| China Everbright Bank Co., Ltd., H Shares | 2,761,531 | 1,152,496 |
| China Everbright International Ltd. | 4,523,712 | 3,550,681 |
| China Everbright Ltd. | 1,098,071 | 1,254,282 |
| China Evergrande Group | 2,678,054 | 5,550,690 |
| China Foods Ltd. | 961,685 | 417,305 |
| China Fortune Land Development Co., Ltd., A Shares | 69,100 | 257,592 |
| China Galaxy Securities Co., Ltd., H Shares | 4,820,128 | 2,300,762 |
| China Gas Holdings Ltd. | 2,391,486 | 9,889,047 |
| China Hongqiao Group Ltd. | 3,106,472 | 2,037,850 |
| China Huarong Asset Management Co., Ltd., H Shares | 13,281,279 | 2,084,907 |
| China Huishan Dairy Holdings Co., Ltd. *(b) | 3,872,695 | — |
| China International Capital Corp., Ltd., H Shares | 1,311,715 | 2,270,078 |
| China International Marine Containers Group Co., Ltd., H Shares | 528,320 | 484,805 |
| China International Travel Service Corp., Ltd., A Shares | 37,500 | 500,279 |
| China Jinmao Holdings Group Ltd. | 7,404,071 | 4,138,913 |
| China Jushi Co., Ltd., A Shares | 219,400 | 250,760 |
| China Life Insurance Co., Ltd., A Shares | 174,700 | 704,219 |
| China Life Insurance Co., Ltd., H Shares | 9,671,287 | 22,637,330 |
| China Literature Ltd. *(a) | 253,445 | 779,547 |
| China Longyuan Power Group Corp., Ltd., H Shares | 4,059,290 | 2,232,898 |
| China Machinery Engineering Corp., H Shares | 1,283,656 | 502,954 |
| China Medical System Holdings Ltd. | 1,690,636 | 2,110,234 |
| China Merchants Bank Co., Ltd., A Shares | 418,700 | 2,005,454 |
| China Merchants Bank Co., Ltd., H Shares | 4,669,612 | 21,276,031 |
| China Merchants Port Holdings Co., Ltd. | 1,546,490 | 2,415,851 |
| China Merchants Securities Co., Ltd., A Shares | 128,300 | 286,466 |
| China Merchants Securities Co., Ltd., H Shares | 1,208,129 | 1,355,326 |
| China Merchants Shekou Industrial Zone Holdings Co., Ltd., A Shares | 165,000 | 455,323 |
| China Minsheng Banking Corp., Ltd., H Shares | 8,632,155 | 5,684,739 |
| China Mobile Ltd. | 6,627,465 | 54,937,412 |
| China Molybdenum Co., Ltd., H Shares | 5,275,710 | 1,434,175 |
| China National Accord Medicines Corp., Ltd., A Shares | 53,800 | 357,514 |
| China National Building Material Co., Ltd., H Shares | 4,936,965 | 4,234,196 |
| China National Chemical Engineering Co., Ltd., A Shares | 331,700 | 256,295 |
| China National Nuclear Power Co., Ltd., A Shares | 369,300 | 278,123 |
| China Oilfield Services Ltd., A Shares | 473,429 | 797,758 |
| China Oilfield Services Ltd., H Shares | 1,818,666 | 2,251,471 |
| China Overseas Land & Investment Ltd. | 4,806,022 | 15,211,745 |
| China Pacific Insurance (Group) Co., Ltd., A Shares | 220,400 | 1,164,052 |
| China Pacific Insurance (Group) Co., Ltd., H Shares | 3,095,817 | 12,406,421 |
| China Petroleum & Chemical Corp., A Shares | 649,000 | 451,589 |
| Security | Number of Shares | Value ($) |
| China Petroleum & Chemical Corp., H Shares | 31,841,518 | 18,652,972 |
| China Power International Development Ltd. | 6,257,571 | 1,357,677 |
| China Railway Construction Corp., Ltd., A Shares | 200,400 | 254,805 |
| China Railway Construction Corp., Ltd., H Shares | 2,404,749 | 2,596,460 |
| China Railway Group Ltd., H Shares | 4,723,812 | 3,092,798 |
| China Railway Signal & Communication Corp., Ltd., H shares | 2,105,981 | 1,263,263 |
| China Reinsurance Group Corp., H Shares | 8,456,532 | 1,381,478 |
| China Resources Beer Holdings Co., Ltd. | 1,973,300 | 11,207,138 |
| China Resources Cement Holdings Ltd. | 2,726,154 | 2,418,114 |
| China Resources Gas Group Ltd. | 1,001,202 | 4,951,480 |
| China Resources Land Ltd. | 3,352,254 | 13,648,006 |
| China Resources Pharmaceutical Group Ltd. | 2,227,059 | 2,302,281 |
| China Resources Power Holdings Co., Ltd. | 2,296,462 | 3,036,411 |
| China Shenhua Energy Co., Ltd., A Shares | 283,500 | 740,340 |
| China Shenhua Energy Co., Ltd., H Shares | 4,052,871 | 7,924,341 |
| China Shipbuilding Industry Co., Ltd., A Shares | 446,400 | 379,225 |
| China South City Holdings Ltd. | 4,252,351 | 526,432 |
| China Southern Airlines Co., Ltd., A Shares | 721,600 | 662,416 |
| China Southern Airlines Co., Ltd., H Shares | 1,242,689 | 699,427 |
| China State Construction Engineering Corp., Ltd., A Shares | 657,900 | 502,824 |
| China State Construction International Holdings Ltd. | 2,489,022 | 2,245,897 |
| China Taiping Insurance Holdings Co., Ltd. | 1,838,491 | 4,143,752 |
| China Telecom Corp., Ltd., H Shares | 17,386,092 | 7,788,444 |
| China Tower Corp., Ltd., H Shares | 58,436,684 | 13,349,967 |
| China Traditional Chinese Medicine Holdings Co., Ltd. | 3,281,165 | 1,541,053 |
| China Unicom Hong Kong Ltd. | 7,330,873 | 7,307,155 |
| China United Network Communications Ltd., A Shares | 573,000 | 468,360 |
| China Vanke Co., Ltd., A Shares | 308,500 | 1,112,100 |
| China Vanke Co., Ltd., H Shares | 1,851,880 | 6,405,068 |
| China Yangtze Power Co., Ltd., A Shares | 223,700 | 581,989 |
| China Zhongwang Holdings Ltd. | 1,934,591 | 795,036 |
| Chongqing Changan Automobile Co., Ltd., A Shares | 525,875 | 587,816 |
| Chongqing Rural Commercial Bank Co., Ltd., H Shares | 3,075,921 | 1,487,839 |
| Chongqing Zhifei Biological Products Co., Ltd., A Shares | 51,800 | 345,888 |
| CIFI Holdings Group Co., Ltd. | 4,118,500 | 2,218,161 |
| CIMC Enric Holdings Ltd. | 927,660 | 536,326 |
| CITIC Ltd. | 6,031,407 | 7,151,151 |
| CITIC Securities Co., Ltd., A Shares | 95,800 | 298,764 |
| CITIC Securities Co., Ltd., H Shares | 3,060,026 | 5,483,197 |
| CNOOC Ltd. | 19,878,079 | 29,682,595 |
| Contemporary Amperex Technology Co., Ltd., A Shares | 27,600 | 278,699 |
| COSCO Shipping Development Co., Ltd., H Shares | 5,641,802 | 626,439 |
| Security | Number of Shares | Value ($) |
| COSCO Shipping Energy Transportation Co., Ltd., H Shares | 1,572,764 | 891,227 |
| COSCO SHIPPING Holdings Co., Ltd., A Shares * | 567,701 | 364,084 |
| COSCO SHIPPING Holdings Co., Ltd., H Shares * | 2,369,518 | 846,759 |
| COSCO SHIPPING Ports Ltd. | 2,207,886 | 1,935,865 |
| Country Garden Holdings Co., Ltd. | 9,226,137 | 11,480,640 |
| Country Garden Services Holdings Co., Ltd. | 1,565,122 | 4,534,356 |
| CRRC Corp., Ltd., A Shares | 311,300 | 316,650 |
| CRRC Corp., Ltd., H Shares | 5,184,225 | 3,566,270 |
| CSC Financial Co., Ltd., H Shares | 1,077,630 | 761,940 |
| CSG Holding Co., Ltd., A Shares | 838,646 | 487,462 |
| CSPC Pharmaceutical Group Ltd. | 5,514,161 | 11,034,867 |
| CSSC Offshore & Marine Engineering Group Co., Ltd., H Shares * | 385,184 | 342,152 |
| Ctrip.com International Ltd. ADR * | 477,429 | 15,459,151 |
| Dali Foods Group Co., Ltd. | 2,621,367 | 1,746,385 |
| Daqin Railway Co., Ltd., A Shares | 278,300 | 300,970 |
| Datang International Power Generation Co., Ltd., A Shares | 758,200 | 288,152 |
| Datang International Power Generation Co., Ltd., H Shares | 2,709,504 | 594,785 |
| Dazhong Transportation Group Co., Ltd., A Shares | 916,500 | 523,751 |
| Dongfang Electric Corp., Ltd., H Shares | 441,176 | 243,804 |
| Dongfeng Motor Group Co., Ltd., H Shares | 3,489,708 | 3,242,366 |
| East Money Information Co., Ltd., A Shares | 158,500 | 320,455 |
| ENN Energy Holdings Ltd. | 965,110 | 11,024,057 |
| Everbright Securities Co., Ltd., A Shares | 187,900 | 282,756 |
| Everbright Securities Co., Ltd., H Shares | 274,783 | 203,053 |
| Far East Horizon Ltd. | 2,594,598 | 2,321,292 |
| Fiberhome Telecommunication Technologies Co., Ltd., A Shares | 71,400 | 268,461 |
| Financial Street Holdings Co., Ltd., A Shares | 281,000 | 287,792 |
| Focus Media Information Technology Co., Ltd., A Shares | 1,181,900 | 886,797 |
| Foshan Electrical and Lighting Co., Ltd., A Shares | 387,500 | 277,211 |
| Foshan Haitian Flavouring & Food Co., Ltd., A Shares | 19,600 | 314,033 |
| Fosun International Ltd. | 2,861,897 | 3,681,766 |
| Founder Securities Co., Ltd., A Shares | 294,700 | 273,000 |
| Foxconn Industrial Internet Co., Ltd., A Shares | 169,900 | 337,331 |
| Fullshare Holdings Ltd. *(a) | 10,519,751 | 280,604 |
| Future Land Development Holdings Ltd. | 2,029,622 | 1,606,011 |
| Fuyao Glass Industry Group Co., Ltd., H Shares | 669,421 | 1,909,495 |
| GCL-Poly Energy Holdings Ltd. * | 13,334,775 | 519,071 |
| GD Power Development Co., Ltd., A Shares | 798,700 | 274,529 |
| GDS Holdings Ltd. ADR * | 52,772 | 2,128,822 |
| Geely Automobile Holdings Ltd. | 6,265,834 | 9,692,216 |
| Gemdale Corp., A Shares | 167,400 | 262,666 |
| Genscript Biotech Corp. * | 1,106,705 | 2,483,089 |
| GF Securities Co., Ltd., H Shares * | 2,104,061 | 2,161,702 |
| Glodon Co., Ltd., A Shares | 69,400 | 350,054 |
| GOME Retail Holdings Ltd. *(a) | 14,431,937 | 1,307,750 |
| Great Wall Motor Co., Ltd., H Shares | 3,998,993 | 2,541,684 |
| Gree Electric Appliances, Inc. of Zhuhai, A Shares | 114,400 | 887,131 |
| Greenland Holdings Corp., Ltd., A Shares | 302,900 | 280,596 |
| Security | Number of Shares | Value ($) |
| Greentown China Holdings Ltd. | 1,081,463 | 893,013 |
| Guangdong Electric Power Development Co., Ltd., A Shares | 649,800 | 354,998 |
| Guangdong Haid Group Co., Ltd., A Shares | 65,400 | 301,551 |
| Guangdong Investment Ltd. | 3,727,038 | 7,858,062 |
| Guanghui Energy Co., Ltd., A Shares | 580,300 | 268,380 |
| Guangshen Railway Co., Ltd., H shares | 2,407,999 | 737,580 |
| Guangzhou Automobile Group Co., Ltd., A Shares | 431,760 | 707,635 |
| Guangzhou Automobile Group Co., Ltd., H Shares | 3,525,799 | 3,554,891 |
| Guangzhou Baiyunshan Pharmaceutical Holdings Co., Ltd., A Shares | 127,400 | 656,848 |
| Guangzhou Baiyunshan Pharmaceutical Holdings Co., Ltd., H Shares | 174,188 | 652,481 |
| Guangzhou R&F Properties Co., Ltd., H Shares | 1,532,011 | 2,467,532 |
| Guizhou Panjiang Refined Coal Co., Ltd., A Shares | 349,101 | 251,204 |
| Guosen Securities Co., Ltd., A Shares | 167,600 | 302,556 |
| Guotai Junan Securities Co., Ltd., A Shares | 166,200 | 396,864 |
| Guotai Junan Securities Co., Ltd., H Shares | 919,712 | 1,312,306 |
| Haidilao International Holding Ltd. | 459,404 | 2,140,076 |
| Haier Electronics Group Co., Ltd. | 1,558,356 | 4,057,312 |
| Haier Smart Home Co., Ltd., A Shares | 174,700 | 388,358 |
| Haitian International Holdings Ltd. | 748,580 | 1,410,153 |
| Haitong Securities Co., Ltd., H Shares | 4,606,028 | 4,391,256 |
| Hangzhou Hikvision Digital Technology Co., Ltd., A Shares | 201,200 | 869,233 |
| Health & Happiness H&H International Holdings Ltd.(a) | 225,438 | 939,403 |
| Henan Shuanghui Investment & Development Co., Ltd., A Shares | 82,100 | 256,498 |
| Hengan International Group Co., Ltd. | 913,122 | 6,013,400 |
| HengTen Networks Group Ltd. * | 29,276,493 | 467,058 |
| HLA Corp., Ltd., A Shares | 228,000 | 267,917 |
| Hopson Development Holdings Ltd. | 835,223 | 821,861 |
| Huadian Fuxin Energy Corp., Ltd., H Shares | 3,420,300 | 571,843 |
| Huadian Power International Corp., Ltd., A Shares | 1,186,600 | 623,392 |
| Huadian Power International Corp., Ltd., H Shares | 883,478 | 345,031 |
| Huaneng Power International, Inc., A Shares | 312,800 | 275,344 |
| Huaneng Power International, Inc., H Shares | 5,042,562 | 2,773,768 |
| Huaneng Renewables Corp., Ltd., H Shares(b) | 6,550,490 | 1,814,158 |
| Huatai Securities Co., Ltd., A Shares | 102,100 | 270,479 |
| Huatai Securities Co., Ltd., H Shares | 2,251,430 | 3,281,453 |
| Huaxia Bank Co., Ltd., A Shares | 346,600 | 350,620 |
| Huaxin Cement Co., Ltd., B Shares | 458,500 | 831,719 |
| Huayu Automotive Systems Co., Ltd., A Shares | 99,100 | 345,195 |
| Huazhu Group Ltd. ADR | 133,553 | 4,411,256 |
| Hundsun Technologies, Inc., A Shares | 31,400 | 325,977 |
| Iflytek Co., Ltd., A Shares * | 68,500 | 314,888 |
| Industrial & Commercial Bank of China Ltd., A Shares | 608,900 | 458,568 |
| Industrial & Commercial Bank of China Ltd., H Shares | 98,780,485 | 62,404,794 |
| Industrial Bank Co., Ltd., A Shares | 373,500 | 896,045 |
| Security | Number of Shares | Value ($) |
| Inner Mongolia BaoTou Steel Union Co., Ltd., A Shares | 1,176,000 | 246,472 |
| Inner Mongolia Yili Industrial Group Co., Ltd., A Shares | 123,500 | 494,380 |
| Innovent Biologics, Inc. * | 1,261,184 | 4,080,356 |
| iQIYI, Inc. ADR * | 167,666 | 3,066,611 |
| JD.com, Inc. ADR * | 996,731 | 30,400,295 |
| Jiangsu Expressway Co., Ltd., A Shares | 301,900 | 424,778 |
| Jiangsu Expressway Co., Ltd., H Shares | 1,282,657 | 1,702,494 |
| Jiangsu Hengrui Medicine Co., Ltd., A Shares | 86,300 | 965,253 |
| Jiangsu Yanghe Brewery Joint-Stock Co., Ltd., A Shares | 32,000 | 500,679 |
| Jiangsu Zhongtian Technology Co., Ltd., A Shares | 217,300 | 253,218 |
| Jiangxi Bank Co., Ltd., H Shares | 1,101,745 | 674,938 |
| Jiangxi Copper Co., Ltd., H Shares | 1,534,187 | 1,726,985 |
| Jiayuan International Group Ltd. | 1,507,224 | 602,093 |
| Jizhong Energy Resources Co., Ltd., A Shares | 527,000 | 260,665 |
| Kingboard Holdings Ltd. | 945,603 | 2,215,762 |
| Kingboard Laminates Holdings Ltd. | 1,372,885 | 1,084,592 |
| KingClean Electric Co., Ltd., A Shares | 99,093 | 289,373 |
| Kingsoft Corp., Ltd. * | 1,034,106 | 1,908,424 |
| Kunlun Energy Co., Ltd. | 3,693,489 | 3,219,579 |
| Kweichow Moutai Co., Ltd., A Shares | 21,900 | 3,494,453 |
| KWG Group Holdings Ltd. * | 1,590,820 | 1,386,703 |
| Landing International Development Ltd. * | 2,160,025 | 292,217 |
| Lao Feng Xiang Co., Ltd., A Shares | 98,400 | 738,447 |
| Lee & Man Paper Manufacturing Ltd. | 2,056,222 | 1,089,080 |
| Legend Holdings Corp., H Shares | 707,334 | 1,522,032 |
| Li Ning Co., Ltd. | 2,120,577 | 6,265,369 |
| Livzon Pharmaceutical Group, Inc., H Shares | 185,193 | 509,347 |
| Logan Property Holdings Co., Ltd. | 1,355,851 | 1,913,853 |
| Longfor Group Holdings Ltd. | 2,022,843 | 7,215,818 |
| LONGi Green Energy Technology Co., Ltd., A Shares | 92,500 | 357,360 |
| Luxshare Precision Industry Co., Ltd., A Shares | 138,190 | 472,669 |
| Luye Pharma Group Ltd. | 2,215,416 | 1,721,925 |
| Luzhou Laojiao Co., Ltd., A Shares | 32,400 | 438,579 |
| Maanshan Iron & Steel Co., Ltd., H Shares | 2,381,151 | 893,462 |
| Meitu, Inc. * | 2,220,891 | 561,221 |
| Meituan Dianping., B Shares * | 4,269,772 | 40,516,065 |
| Metallurgical Corp. of China Ltd., A Shares | 1,252,400 | 481,221 |
| Metallurgical Corp. of China Ltd., H Shares | 2,232,023 | 498,515 |
| Momo, Inc. ADR | 122,838 | 4,517,982 |
| Muyuan Foodstuff Co., Ltd., A Shares | 36,300 | 407,785 |
| NARI Technology Co., Ltd., A Shares | 112,800 | 272,662 |
| NetEase, Inc. ADR | 89,259 | 22,761,045 |
| New China Life Insurance Co., Ltd., A Shares | 113,800 | 766,882 |
| New China Life Insurance Co., Ltd., H Shares | 980,658 | 3,873,645 |
| New Hope Liuhe Co., Ltd., A Shares | 318,000 | 866,869 |
| New Oriental Education & Technology Group, Inc. ADR * | 171,549 | 19,453,657 |
| Nine Dragons Paper Holdings Ltd. | 2,108,163 | 1,598,204 |
| NIO, Inc. ADR *(a) | 200,133 | 572,380 |
| Orient Securities Co., Ltd., H Shares | 1,301,235 | 800,469 |
| Oriental Pearl Group Co., Ltd., A Shares | 189,500 | 247,301 |
| PetroChina Co., Ltd., H Shares | 25,910,372 | 12,863,669 |
| Security | Number of Shares | Value ($) |
| PICC Property & Casualty Co., Ltd., H Shares | 8,431,482 | 9,673,980 |
| Pinduoduo, Inc. ADR * | 138,801 | 4,548,509 |
| Ping An Bank Co., Ltd., A Shares | 369,900 | 731,841 |
| Ping An Healthcare & Technology Co., Ltd. *(a) | 205,976 | 1,221,079 |
| Ping An Insurance Group Co. of China Ltd., A Shares | 199,000 | 2,427,928 |
| Ping An Insurance Group Co. of China Ltd., H Shares | 6,866,982 | 78,789,292 |
| Poly Developments and Holdings Group Co., Ltd., A Shares | 257,300 | 483,538 |
| Poly Property Group Co., Ltd. | 2,832,098 | 993,991 |
| Postal Savings Bank of China Co., Ltd., H Shares | 11,723,963 | 7,062,493 |
| Power Construction Corp. of China Ltd., A Shares | 392,700 | 256,789 |
| Qingdao Port International Co., Ltd., H Shares | 1,317,944 | 782,153 |
| Red Star Macalline Group Corp., Ltd., H Shares | 826,517 | 654,011 |
| SAIC Motor Corp., Ltd., A Shares | 170,300 | 596,776 |
| Sany Heavy Industry Co., Ltd., A Shares | 173,900 | 327,293 |
| SDIC Power Holdings Co., Ltd., A Shares | 257,000 | 347,957 |
| Seazen Holdings Co., Ltd., A Shares | 49,900 | 172,841 |
| SF Holding Co., Ltd., A Shares | 66,200 | 383,122 |
| Shaanxi Coal Industry Co., Ltd., A Shares | 235,500 | 292,853 |
| Shandong Chenming Paper Holdings Ltd., A Shares | 800,450 | 515,590 |
| Shandong Chenming Paper Holdings Ltd., H Shares | 469,229 | 182,653 |
| Shandong Gold Mining Co., Ltd., A Shares | 79,660 | 443,879 |
| Shandong Weigao Group Medical Polymer Co., Ltd., H Shares | 2,916,771 | 3,011,566 |
| Shanghai Electric Group Co., Ltd., H Shares | 3,966,145 | 1,250,280 |
| Shanghai Fosun Pharmaceutical Group Co., Ltd., H Shares | 711,742 | 2,116,509 |
| Shanghai Huayi Group Co., Ltd., A Shares | 337,600 | 347,176 |
| Shanghai Industrial Holdings Ltd. | 583,314 | 1,137,542 |
| Shanghai International Airport Co., Ltd., A Shares | 38,300 | 449,786 |
| Shanghai International Port Group Co., Ltd., A Shares | 314,500 | 252,233 |
| Shanghai Jahwa United Co., Ltd., A Shares | 68,234 | 324,533 |
| Shanghai Jinjiang International Hotels Co., Ltd., A Shares | 127,775 | 429,011 |
| Shanghai Lujiazui Finance & Trade Zone Development Co., Ltd., A Shares | 297,240 | 574,794 |
| Shanghai Lujiazui Finance & Trade Zone Development Co., Ltd., B Shares | 400,000 | 448,400 |
| Shanghai Mechanical and Electrical Industry Co., Ltd., A Shares | 225,870 | 558,284 |
| Shanghai Pharmaceuticals Holding Co., Ltd., H Shares | 1,013,766 | 1,914,878 |
| Shanghai Pudong Development Bank Co., Ltd., A Shares | 509,600 | 803,170 |
| Shanghai Waigaoqiao Free Trade Zone Group Co., Ltd., A Shares | 128,700 | 318,828 |
| Shanxi Lu'an Environmental Energy Development Co., Ltd., A Shares | 244,900 | 253,557 |
| Shanxi Xinghuacun Fen Wine Factory Co., Ltd., A Shares | 33,500 | 359,246 |
| Security | Number of Shares | Value ($) |
| Shanxi Xishan Coal & Electricity Power Co., Ltd., A Shares | 321,800 | 264,382 |
| Shanying International Holding Co., Ltd., A Shares * | 602,300 | 257,515 |
| Shenwan Hongyuan Group Co., Ltd., A Shares | 456,000 | 304,552 |
| Shenzhen Expressway Co., Ltd., A Shares | 434,999 | 582,876 |
| Shenzhen Expressway Co., Ltd., H Shares | 452,580 | 554,508 |
| Shenzhen Inovance Technology Co., Ltd., A Shares | 86,200 | 277,256 |
| Shenzhen International Holdings Ltd. | 1,069,115 | 2,024,883 |
| Shenzhen Investment Ltd. | 4,180,079 | 1,584,465 |
| Shenzhen Mindray Bio-Medical Electronics Co., Ltd., A Shares | 13,200 | 343,694 |
| Shenzhen Overseas Chinese Town Co., Ltd., A Shares | 290,900 | 276,796 |
| Shenzhou International Group Holdings Ltd. | 903,917 | 12,286,262 |
| Shimao Property Holdings Ltd. | 1,480,080 | 4,193,530 |
| Sihuan Pharmaceutical Holdings Group Ltd. | 4,867,743 | 869,756 |
| SINA Corp. * | 78,199 | 3,219,453 |
| Sino Biopharmaceutical Ltd. | 7,869,524 | 11,710,855 |
| Sino-Ocean Group Holding Ltd. | 3,408,604 | 1,218,081 |
| Sinofert Holdings Ltd. * | 2,493,388 | 273,672 |
| Sinopec Engineering Group Co., Ltd., H Shares | 2,036,821 | 1,330,958 |
| Sinopec Oilfield Service Corp., H Shares * | 2,647,117 | 277,031 |
| Sinopec Shanghai Petrochemical Co., Ltd., A Shares | 1,396,300 | 823,304 |
| Sinopec Shanghai Petrochemical Co., Ltd., H Shares | 3,509,912 | 1,012,386 |
| Sinopharm Group Co., Ltd., H Shares | 1,511,999 | 5,470,741 |
| Sinotrans Ltd., H Shares | 3,340,610 | 1,078,668 |
| Sinotruk Hong Kong Ltd. | 916,003 | 1,414,568 |
| SOHO China Ltd. | 3,003,392 | 881,620 |
| Spring Airlines Co., Ltd., A Shares | 44,000 | 275,300 |
| Sunac China Holdings Ltd. | 2,769,878 | 11,100,228 |
| Suning Universal Co., Ltd., A Shares | 586,900 | 308,334 |
| Suning.com Co., Ltd., A Shares | 189,800 | 284,819 |
| Sunny Optical Technology Group Co., Ltd. | 818,207 | 11,351,005 |
| TAL Education Group ADR * | 398,709 | 14,206,002 |
| TBEA Co., Ltd., A Shares | 285,649 | 262,620 |
| TCL Corp., A Shares | 633,800 | 285,152 |
| Tencent Holdings Ltd. | 7,148,307 | 296,319,898 |
| The People's Insurance Co. Group of China Ltd., H Shares | 10,432,226 | 4,087,492 |
| Tianjin Capital Environmental Protection Group Co., Ltd., A Shares | 304,400 | 306,229 |
| Tongcheng-Elong Holdings Ltd. * | 424,536 | 677,277 |
| TravelSky Technology Ltd., H Shares | 1,216,142 | 2,443,040 |
| Tsingtao Brewery Co., Ltd., H Shares | 491,296 | 3,320,097 |
| Vipshop Holdings Ltd. ADR * | 530,329 | 4,438,854 |
| Walvax Biotechnology Co., Ltd., A Shares | 73,700 | 279,889 |
| Weibo Corp. ADR * | 64,350 | 2,662,159 |
| Weichai Power Co., Ltd., A Shares | 162,800 | 263,410 |
| Weichai Power Co., Ltd., H Shares | 2,465,657 | 3,776,204 |
| Weifu High-Technology Group Co., Ltd., A Shares | 169,100 | 399,536 |
| Wens Foodstuffs Group Co., Ltd. | 52,800 | 306,088 |
| Wuliangye Yibin Co., Ltd., A Shares | 70,000 | 1,383,960 |
| WuXi AppTec Co., Ltd. | 164,720 | 1,847,893 |
| WuXi AppTec Co., Ltd., A Shares | 74,340 | 900,556 |
| Security | Number of Shares | Value ($) |
| Wuxi Biologics Cayman, Inc. * | 771,236 | 8,130,344 |
| XCMG Construction Machinery Co., Ltd., A Shares | 448,900 | 269,077 |
| Xiaomi Corp., B Shares * | 11,521,544 | 12,542,997 |
| Xinhua Winshare Publishing and Media Co., Ltd., H Shares | 553,952 | 387,431 |
| Xinjiang Goldwind Science & Technology Co., Ltd., A Shares | 190,800 | 345,237 |
| Xinjiang Goldwind Science & Technology Co., Ltd., H Shares | 666,423 | 785,043 |
| Yang Quan Coal Industry Group Co., Ltd., A Shares | 352,200 | 258,355 |
| Yangtze Optical Fibre & Cable Joint Stock Ltd. Co., H Shares | 406,667 | 639,427 |
| Yangzijiang Shipbuilding Holdings Ltd. | 2,654,594 | 1,741,408 |
| Yanlord Land Group Ltd. | 861,835 | 683,404 |
| Yantai Changyu Pioneer Wine Co., Ltd., A Shares | 141,183 | 569,900 |
| Yanzhou Coal Mining Co., Ltd., A Shares | 417,100 | 557,726 |
| Yanzhou Coal Mining Co., Ltd., H Shares | 1,943,207 | 1,683,955 |
| Yonghui Superstores Co., Ltd., A Shares | 242,400 | 333,609 |
| Yonyou Network Technology Co., Ltd., A Shares | 83,100 | 372,365 |
| Yuexiu Property Co., Ltd. | 8,120,844 | 1,751,578 |
| Yunnan Baiyao Group Co., Ltd., A Shares | 29,200 | 312,930 |
| YY, Inc. ADR * | 55,086 | 3,148,165 |
| Zhangzhou Pientzehuang Pharmaceutical Co., Ltd., A Shares | 20,700 | 288,389 |
| Zhaojin Mining Industry Co., Ltd., H Shares | 1,383,973 | 1,812,244 |
| Zhejiang Chint Electrics Co., Ltd., A Shares | 85,000 | 266,033 |
| Zhejiang Expressway Co., Ltd., H Shares | 1,852,610 | 1,551,063 |
| Zhejiang Longsheng Group Co., Ltd., A Shares | 130,600 | 254,558 |
| Zhejiang Sanhua Intelligent Controls Co., Ltd., A Shares | 195,500 | 322,328 |
| Zhejiang Supor Co., Ltd., A Shares | 27,700 | 279,748 |
| ZhongAn Online P&C Insurance Co., Ltd., H Shares *(a) | 428,957 | 969,011 |
| Zhongsheng Group Holdings Ltd. | 808,743 | 2,528,822 |
| Zhuzhou CRRC Times Electric Co., Ltd., H Shares | 654,269 | 2,605,269 |
| Zijin Mining Group Co., Ltd., H Shares | 7,756,030 | 2,900,339 |
| Zoomlion Heavy Industry Science & Technology Co., Ltd., A Shares | 829,500 | 614,273 |
| Zoomlion Heavy Industry Science & Technology Co., Ltd., H Shares | 921,784 | 557,634 |
| ZTE Corp., A Shares * | 191,500 | 770,870 |
| ZTE Corp., H Shares * | 844,985 | 2,102,932 |
| ZTO Express Cayman, Inc. ADR | 413,294 | 8,476,660 |
| 1,955,644,462 | ||
| Colombia 0.4% | ||
| Almacenes Exito S.A. | 254,265 | 1,305,103 |
| Bancolombia S.A. | 360,757 | 4,168,982 |
| Bancolombia S.A. ADR | 135,524 | 6,749,095 |
| Corp. Financiera Colombiana S.A. * | 134,382 | 1,031,897 |
| Ecopetrol S.A. ADR | 305,487 | 4,823,640 |
| Grupo de Inversiones Suramericana S.A. | 276,953 | 2,708,883 |
| Interconexion Electrica S.A. ESP | 529,904 | 2,812,746 |
| 23,600,346 | ||
| Security | Number of Shares | Value ($) |
| Czech Republic 0.2% | ||
| CEZ A/S | 199,992 | 4,411,183 |
| Komercni Banka A/S | 97,559 | 3,467,771 |
| Moneta Money Bank A/S | 740,926 | 2,399,512 |
| O2 Czech Republic A/S | 64,067 | 578,833 |
| Philip Morris CR A/S | 953 | 548,140 |
| 11,405,439 | ||
| Egypt 0.1% | ||
| Commercial International Bank Egypt SAE GDR | 1,872,128 | 8,705,395 |
| Greece 0.4% | ||
| Alpha Bank AE * | 1,706,505 | 3,061,361 |
| Eurobank Ergasias S.A. * | 3,260,581 | 2,890,526 |
| FF Group *(b) | 50,437 | — |
| Hellenic Petroleum S.A. | 64,673 | 665,205 |
| Hellenic Telecommunications Organization S.A. | 306,953 | 4,103,709 |
| JUMBO S.A. | 133,610 | 2,571,973 |
| Motor Oil Hellas Corinth Refineries S.A. | 76,116 | 1,864,218 |
| Mytilineos S.A. | 136,174 | 1,514,612 |
| National Bank of Greece S.A. * | 735,609 | 2,137,016 |
| OPAP S.A. | 252,284 | 2,664,368 |
| 21,472,988 | ||
| Hungary 0.4% | ||
| Magyar Telekom Telecommunications plc | 527,321 | 742,007 |
| MOL Hungarian Oil & Gas plc | 542,067 | 5,315,850 |
| OTP Bank Nyrt * | 292,739 | 11,695,422 |
| Richter Gedeon Nyrt | 182,867 | 3,056,777 |
| 20,810,056 | ||
| India 11.0% | ||
| 3M India Ltd. * | 1,751 | 496,149 |
| ABB India Ltd. | 63,824 | 1,196,306 |
| ACC Ltd. | 57,330 | 1,220,222 |
| Adani Enterprises Ltd. | 386,095 | 742,641 |
| Adani Ports & Special Economic Zone Ltd. | 862,594 | 4,417,612 |
| Adani Power Ltd. * | 1,246,694 | 1,019,598 |
| Adani Transmission Ltd. * | 324,572 | 1,064,293 |
| Aditya Birla Capital Ltd. * | 767,707 | 960,071 |
| Alkem Laboratories Ltd. | 51,634 | 1,314,359 |
| Ambuja Cements Ltd. | 949,119 | 2,689,553 |
| Ashok Leyland Ltd. | 1,582,003 | 1,427,863 |
| Asian Paints Ltd. | 356,233 | 8,062,791 |
| Aurobindo Pharma Ltd. | 331,407 | 2,787,889 |
| Avenue Supermarts Ltd. * | 149,728 | 3,294,404 |
| Axis Bank Ltd. | 2,241,253 | 20,837,697 |
| Bajaj Auto Ltd. | 111,129 | 4,339,334 |
| Bajaj Finance Ltd. | 213,790 | 9,977,316 |
| Bajaj Finserv Ltd. | 46,959 | 4,681,958 |
| Bajaj Holdings & Investment Ltd. | 34,066 | 1,551,438 |
| Bandhan Bank Ltd. | 165,064 | 1,085,517 |
| Bank of Baroda * | 707,970 | 918,083 |
| Bank of India * | 483,636 | 443,964 |
| Berger Paints India Ltd. | 315,293 | 1,629,947 |
| Bharat Electronics Ltd. | 755,736 | 1,089,035 |
| Bharat Forge Ltd. | 242,742 | 1,306,556 |
| Bharat Heavy Electricals Ltd. | 1,165,028 | 824,734 |
| Bharat Petroleum Corp., Ltd. | 1,239,608 | 6,167,010 |
| Bharti Airtel Ltd. | 2,050,908 | 9,960,507 |
| Security | Number of Shares | Value ($) |
| Bharti Infratel Ltd. | 1,076,757 | 3,776,547 |
| Biocon Ltd. | 324,931 | 1,072,069 |
| Bosch Ltd. | 11,034 | 2,236,986 |
| Britannia Industries Ltd. | 70,576 | 2,670,191 |
| Cadila Healthcare Ltd. | 302,936 | 955,591 |
| Canara Bank * | 196,875 | 608,208 |
| Castrol India Ltd. | 665,043 | 1,144,145 |
| Cipla Ltd. | 397,834 | 2,632,170 |
| Coal India Ltd. | 1,788,303 | 4,626,811 |
| Colgate-Palmolive (India) Ltd. | 82,608 | 1,474,467 |
| Container Corp. Of India Ltd. | 244,956 | 1,743,670 |
| Cummins India Ltd. | 71,679 | 576,935 |
| Dabur India Ltd. | 684,425 | 4,301,648 |
| Dalmia Bharat Ltd. * | 54,152 | 682,630 |
| Divi's Laboratories Ltd. | 100,150 | 2,279,646 |
| DLF Ltd. | 672,940 | 1,584,636 |
| Dr. Reddy's Laboratories Ltd. | 102,111 | 3,657,163 |
| Eicher Motors Ltd. | 16,283 | 3,707,402 |
| Emami Ltd. | 143,636 | 597,415 |
| Exide Industries Ltd. | 286,679 | 716,823 |
| Federal Bank Ltd. | 1,858,508 | 2,157,621 |
| Future Retail Ltd. * | 274,567 | 1,517,650 |
| GAIL India Ltd. | 1,375,496 | 2,500,289 |
| Gillette India Ltd. | 9,775 | 999,183 |
| GlaxoSmithKline Consumer Healthcare Ltd. | 13,498 | 1,531,550 |
| Glenmark Pharmaceuticals Ltd. | 181,107 | 974,679 |
| GMR Infrastructure Ltd. * | 2,536,565 | 534,612 |
| Godrej Consumer Products Ltd. | 485,556 | 4,140,732 |
| Godrej Industries Ltd. | 93,057 | 547,402 |
| Grasim Industries Ltd. | 406,012 | 4,042,352 |
| GRUH Finance Ltd. | 196,820 | 711,399 |
| Havells India Ltd. | 303,143 | 2,882,740 |
| HCL Technologies Ltd. | 696,217 | 10,728,318 |
| HDFC Asset Management Co., Ltd. | 35,165 | 1,256,844 |
| HDFC Life Insurance Co., Ltd. | 526,263 | 4,106,115 |
| Hero MotoCorp Ltd. | 119,589 | 4,307,515 |
| Hindalco Industries Ltd. | 1,163,136 | 3,004,452 |
| Hindustan Petroleum Corp., Ltd. | 915,654 | 3,335,888 |
| Hindustan Unilever Ltd. | 883,783 | 23,291,548 |
| Hindustan Zinc Ltd. | 233,051 | 707,076 |
| Housing Development Finance Corp., Ltd. | 2,155,234 | 65,388,183 |
| ICICI Lombard General Insurance Co., Ltd. | 194,430 | 3,424,767 |
| ICICI Prudential Life Insurance Co., Ltd. | 403,222 | 2,397,620 |
| IDFC First Bank Ltd. * | 3,214,315 | 1,960,346 |
| IDFC Ltd. * | 587,739 | 291,781 |
| Indiabulls Housing Finance Ltd. | 413,222 | 2,635,026 |
| Indian Oil Corp., Ltd. | 2,648,117 | 4,541,007 |
| Infosys Ltd. | 4,723,356 | 53,902,781 |
| InterGlobe Aviation Ltd. | 119,973 | 2,840,155 |
| ITC Ltd. | 3,675,038 | 12,642,553 |
| Jindal Steel & Power Ltd. * | 504,611 | 682,637 |
| JSW Energy Ltd. | 517,289 | 483,549 |
| JSW Steel Ltd. | 1,471,988 | 4,482,495 |
| Kansai Nerolac Paints Ltd. | 174,245 | 1,123,933 |
| L&T Finance Holdings Ltd. | 655,525 | 866,139 |
| Larsen & Toubro Infotech Ltd. | 41,302 | 940,736 |
| Larsen & Toubro Ltd. | 423,886 | 7,884,698 |
| LIC Housing Finance Ltd. | 295,077 | 1,757,879 |
| Lupin Ltd. | 270,400 | 2,805,957 |
| Mahindra & Mahindra Financial Services Ltd. | 373,282 | 1,672,535 |
| Mahindra & Mahindra Ltd. | 714,880 | 5,293,961 |
| Mangalore Refinery & Petrochemicals Ltd. | 265,398 | 170,781 |
| Security | Number of Shares | Value ($) |
| Marico Ltd. | 564,130 | 3,089,749 |
| Maruti Suzuki India Ltd. | 149,971 | 12,861,183 |
| Motherson Sumi Systems Ltd. | 1,106,437 | 1,518,480 |
| Mphasis Ltd. | 128,765 | 1,759,604 |
| MRF Ltd. | 1,366 | 1,120,807 |
| Muthoot Finance Ltd. | 101,627 | 864,308 |
| Nestle India Ltd. | 29,998 | 5,408,819 |
| NHPC Ltd. | 3,075,108 | 1,001,243 |
| NMDC Ltd. | 945,321 | 1,100,773 |
| NTPC Ltd. | 2,914,669 | 4,965,438 |
| Oil & Natural Gas Corp., Ltd. | 3,756,761 | 6,376,353 |
| Oil India Ltd. | 365,396 | 757,068 |
| Oracle Financial Services Software Ltd. | 26,746 | 1,154,002 |
| Page Industries Ltd. | 4,422 | 1,155,603 |
| Petronet LNG Ltd. | 663,884 | 2,480,936 |
| Pidilite Industries Ltd. | 155,565 | 3,001,392 |
| Piramal Enterprises Ltd. | 111,113 | 3,159,386 |
| Power Finance Corp., Ltd. * | 693,189 | 1,017,347 |
| Power Grid Corp. of India Ltd. | 973,220 | 2,732,635 |
| Punjab National Bank * | 1,184,019 | 1,076,117 |
| Rajesh Exports Ltd. | 192,215 | 1,900,952 |
| RBL Bank Ltd. | 409,325 | 1,875,589 |
| REC Ltd. | 897,812 | 1,813,666 |
| Reliance Capital Ltd. | 199,568 | 97,538 |
| Reliance Industries Ltd. | 3,884,119 | 67,913,269 |
| Reliance Infrastructure Ltd. | 207,474 | 112,878 |
| Reliance Power Ltd. * | 705,952 | 32,130 |
| SBI Life Insurance Co., Ltd. | 296,189 | 3,478,818 |
| Shree Cement Ltd. | 10,177 | 2,647,139 |
| Shriram Transport Finance Co., Ltd. | 215,925 | 2,921,485 |
| Siemens Ltd. | 101,011 | 1,700,668 |
| State Bank of India * | 2,248,255 | 8,622,128 |
| Steel Authority of India Ltd. | 1,327,686 | 580,104 |
| Sun Pharmaceutical Industries Ltd. | 1,357,586 | 8,562,920 |
| Sun TV Network Ltd. | 104,374 | 640,868 |
| Tata Communications Ltd. | 102,194 | 615,890 |
| Tata Consultancy Services Ltd. | 1,127,144 | 35,667,046 |
| Tata Motors Ltd. * | 1,393,900 | 2,278,026 |
| Tata Motors Ltd., A Shares, DVR * | 180,980 | 135,594 |
| Tata Steel Ltd. | 353,338 | 1,706,631 |
| Tech Mahindra Ltd. | 575,174 | 5,587,221 |
| The Tata Power Co., Ltd. | 1,278,545 | 1,016,104 |
| Titan Co., Ltd. | 385,002 | 5,958,278 |
| Torrent Pharmaceuticals Ltd. | 54,617 | 1,306,081 |
| Torrent Power Ltd. | 167,873 | 653,555 |
| TVS Motor Co., Ltd. | 138,153 | 682,857 |
| UltraTech Cement Ltd. | 130,742 | 7,419,379 |
| Union Bank of India * | 467,411 | 385,214 |
| United Breweries Ltd. | 89,008 | 1,710,233 |
| United Spirits Ltd. * | 375,049 | 3,299,717 |
| UPL Ltd. | 658,512 | 5,193,768 |
| Vedanta Ltd. | 2,051,325 | 3,997,365 |
| Vodafone Idea Ltd. * | 11,245,689 | 842,551 |
| Voltas Ltd. | 135,742 | 1,216,607 |
| Wipro Ltd. | 1,876,846 | 6,686,547 |
| Wockhardt Ltd. * | 57,914 | 198,623 |
| Yes Bank Ltd. | 2,233,963 | 1,875,518 |
| Zee Entertainment Enterprises Ltd. | 681,912 | 3,562,950 |
| 639,516,634 | ||
| Indonesia 2.4% | ||
| Barito Pacific Tbk PT | 23,410,065 | 1,493,557 |
| PT Adaro Energy Tbk | 15,113,871 | 1,198,668 |
| PT Astra Agro Lestari Tbk | 504,328 | 373,313 |
| PT Astra International Tbk | 25,220,295 | 11,867,851 |
| PT Bank Central Asia Tbk | 12,006,640 | 25,816,180 |
| PT Bank Danamon Indonesia Tbk | 811,118 | 275,042 |
| Security | Number of Shares | Value ($) |
| PT Bank Mandiri (Persero) Tbk | 23,144,443 | 11,829,201 |
| PT Bank Negara Indonesia (Persero) Tbk | 9,448,137 | 5,128,703 |
| PT Bank Rakyat Indonesia (Persero) Tbk | 65,143,668 | 19,609,691 |
| PT Bukit Asam Tbk | 8,076,590 | 1,406,357 |
| PT Bumi Serpong Damai Tbk * | 8,663,247 | 824,490 |
| PT Charoen Pokphand Indonesia Tbk | 9,374,828 | 3,321,009 |
| PT Gudang Garam Tbk | 590,882 | 2,894,010 |
| PT Hanjaya Mandala Sampoerna Tbk | 11,557,343 | 2,191,699 |
| PT Indah Kiat Pulp & Paper Corp. Tbk | 3,366,794 | 1,625,840 |
| PT Indocement Tunggal Prakarsa Tbk | 1,757,091 | 2,691,068 |
| PT Indofood CBP Sukses Makmur Tbk | 3,027,371 | 2,571,718 |
| PT Indofood Sukses Makmur Tbk | 5,273,342 | 2,946,157 |
| PT Jasa Marga Persero Tbk | 2,493,576 | 984,422 |
| PT Kalbe Farma Tbk | 24,763,510 | 2,950,323 |
| PT Matahari Department Store Tbk | 3,466,674 | 738,058 |
| PT Media Nusantara Citra Tbk | 6,951,325 | 607,659 |
| PT Perusahaan Gas Negara Tbk | 11,929,774 | 1,614,746 |
| PT Semen Indonesia (Persero) Tbk | 3,808,871 | 3,557,810 |
| PT Surya Citra Media Tbk | 6,461,726 | 562,582 |
| PT Telekomunikasi Indonesia (Persero) Tbk | 58,147,565 | 18,241,570 |
| PT Tower Bersama Infrastructure Tbk | 2,087,488 | 879,291 |
| PT Unilever Indonesia Tbk | 1,397,366 | 4,812,219 |
| PT United Tractors Tbk | 1,873,099 | 2,763,102 |
| PT Vale Indonesia Tbk * | 2,709,692 | 674,319 |
| PT XL Axiata Tbk * | 5,450,653 | 1,337,206 |
| 137,787,861 | ||
| Kuwait 1.0% | ||
| Agility Public Warehousing Co. KSC | 1,123,275 | 2,789,713 |
| Ahli United Bank BSC | 5,980,150 | 5,508,033 |
| Boubyan Bank KSCP | 1,119,426 | 2,102,606 |
| Boubyan Petrochemicals Co. KSCP | 482,031 | 1,230,447 |
| Gulf Bank KSCP | 2,237,524 | 2,200,723 |
| Humansoft Holding Co. KSC | 127,615 | 1,343,316 |
| Kuwait Finance House KSCP | 4,493,708 | 11,056,887 |
| Mobile Telecommunications Co. KSC | 2,695,254 | 5,009,271 |
| National Bank of Kuwait SAKP | 7,603,140 | 24,810,246 |
| 56,051,242 | ||
| Malaysia 2.9% | ||
| AirAsia Group Berhad | 1,714,600 | 729,790 |
| Alliance Bank Malaysia Berhad | 1,351,480 | 964,080 |
| AMMB Holdings Berhad | 2,363,672 | 2,360,581 |
| Astro Malaysia Holdings Berhad | 2,002,000 | 628,377 |
| Axiata Group Berhad | 5,542,857 | 6,655,910 |
| British American Tobacco Malaysia Berhad | 186,600 | 874,986 |
| CIMB Group Holdings Berhad | 8,502,243 | 10,229,782 |
| Dialog Group Berhad | 5,584,400 | 4,621,023 |
| DiGi.com Berhad | 4,722,400 | 5,637,011 |
| FGV Holdings Berhad * | 2,845,500 | 646,166 |
| Fraser & Neave Holdings Berhad | 135,400 | 1,136,516 |
| Gamuda Berhad | 2,702,116 | 2,313,070 |
| Genting Berhad | 2,862,300 | 4,083,652 |
| Genting Malaysia Berhad | 3,524,320 | 2,631,403 |
| HAP Seng Consolidated Berhad | 833,234 | 1,965,446 |
| Hartalega Holdings Berhad | 1,931,800 | 2,356,470 |
| Hong Leong Bank Berhad | 812,807 | 3,208,321 |
| Hong Leong Financial Group Berhad | 324,600 | 1,301,333 |
| IHH Healthcare Berhad | 3,685,400 | 5,073,943 |
| IJM Corp. Berhad | 4,112,036 | 2,229,329 |
| IOI Corp. Berhad | 3,921,592 | 4,112,286 |
| IOI Properties Group Berhad | 2,216,550 | 627,201 |
| KLCCP Stapled Group | 732,444 | 1,421,173 |
| Kuala Lumpur Kepong Berhad | 557,648 | 3,179,741 |
| Security | Number of Shares | Value ($) |
| Malayan Banking Berhad | 7,286,151 | 15,055,678 |
| Malaysia Airports Holdings Berhad | 1,087,000 | 2,127,217 |
| Maxis Berhad | 3,431,724 | 4,545,168 |
| MISC Berhad | 1,772,000 | 3,059,023 |
| Nestle Malaysia Berhad | 87,171 | 3,057,359 |
| Petronas Chemicals Group Berhad | 3,528,800 | 5,814,905 |
| Petronas Dagangan Berhad | 382,000 | 2,078,269 |
| Petronas Gas Berhad | 914,836 | 3,497,934 |
| PPB Group Berhad | 853,677 | 3,787,805 |
| Press Metal Aluminium Holdings Berhad | 2,377,132 | 2,780,999 |
| Public Bank Berhad | 3,851,354 | 18,608,849 |
| QL Resources Berhad | 909,800 | 1,501,370 |
| RHB Bank Berhad | 1,922,900 | 2,606,237 |
| Sime Darby Berhad | 4,255,900 | 2,317,444 |
| Sime Darby Plantation Berhad | 4,411,500 | 5,223,938 |
| Sime Darby Property Berhad | 5,017,200 | 1,049,848 |
| Telekom Malaysia Berhad | 1,355,100 | 1,208,328 |
| Tenaga Nasional Berhad | 4,863,274 | 16,143,456 |
| Top Glove Corp. Berhad | 2,147,600 | 2,425,657 |
| UEM Sunrise Berhad * | 2,892,400 | 460,803 |
| Westports Holdings Berhad | 1,383,300 | 1,381,491 |
| YTL Corp. Berhad | 6,240,164 | 1,483,810 |
| YTL Power International Berhad | 3,532,503 | 621,579 |
| 169,824,757 | ||
| Mexico 3.1% | ||
| Alfa S.A.B. de C.V., A Shares | 3,725,694 | 3,178,522 |
| Alpek S.A.B. de C.V. | 500,353 | 548,547 |
| Alsea S.A.B. de C.V. * | 699,797 | 1,490,462 |
| America Movil S.A.B. de C.V., Series L | 34,721,407 | 25,365,626 |
| Arca Continental S.A.B. de C.V. | 496,182 | 2,596,486 |
| Banco del Bajio S.A. | 928,743 | 1,550,439 |
| Banco Santander Mexico S.A. Institucion de Banca Multiple Grupo Financiero Santand | 2,058,220 | 2,612,372 |
| Becle S.A.B. de C.V. | 650,885 | 911,758 |
| Cemex S.A.B. de C.V., Series CPO | 18,842,240 | 7,014,027 |
| Coca-Cola Femsa S.A.B. de C.V. | 635,694 | 3,755,784 |
| Concentradora Fibra Danhos S.A. de C.V. | 95,093 | 126,098 |
| El Puerto de Liverpool S.A.B. de C.V., Series C1 | 250,561 | 1,298,183 |
| Fibra Uno Administracion S.A. de C.V. | 3,691,997 | 5,094,465 |
| Fomento Economico Mexicano S.A.B. de C.V. | 2,616,253 | 23,862,521 |
| GMexico Transportes S.A.B. de C.V. | 619,686 | 710,254 |
| Gruma S.A.B. de C.V., B Shares | 250,342 | 2,328,624 |
| Grupo Aeroportuario del Centro Norte S.A.B. de C.V. | 422,590 | 2,479,673 |
| Grupo Aeroportuario del Pacifico S.A.B. de C.V., B Shares | 447,241 | 4,261,317 |
| Grupo Aeroportuario del Sureste S.A.B. de C.V., B Shares | 247,875 | 3,642,069 |
| Grupo Bimbo S.A.B. de C.V., Series A | 2,878,825 | 5,031,128 |
| Grupo Carso S.A.B. de C.V., Series A1 | 562,808 | 1,616,865 |
| Grupo Comercial Chedraui S.A. de C.V. | 405,065 | 566,606 |
| Grupo Elektra S.A.B. de C.V. | 85,794 | 5,933,111 |
| Grupo Financiero Banorte S.A.B. de C.V., O Shares | 3,509,617 | 18,857,033 |
| Grupo Financiero Inbursa S.A.B. de C.V., O Shares | 2,782,363 | 3,434,426 |
| Grupo Lala S.A.B. de C.V. | 740,871 | 773,096 |
| Grupo Mexico S.A.B. de C.V., Series B | 4,447,510 | 10,230,504 |
| Grupo Televisa S.A.B., Series CPO | 3,469,231 | 6,126,906 |
| Industrias Bachoco S.A.B. de C.V., Series B | 213,046 | 973,016 |
| Industrias Penoles S.A.B. de C.V. | 145,987 | 1,750,492 |
| Security | Number of Shares | Value ($) |
| Infraestructura Energetica Nova S.A.B. de C.V. | 626,633 | 2,633,044 |
| Kimberly-Clark de Mexico S.A.B. de C.V., A Shares * | 943,037 | 1,925,817 |
| Megacable Holdings S.A.B. de C.V., Series CPO | 458,594 | 1,869,830 |
| Mexichem S.A.B. de C.V. | 1,360,120 | 2,490,857 |
| Nemak S.A.B. de C.V. | 803,758 | 372,897 |
| Promotora y Operadora de Infraestructura S.A.B. de C.V. | 259,971 | 2,173,599 |
| Regional S.A.B. de C.V. | 316,808 | 1,433,338 |
| Telesites S.A.B. de C.V. * | 1,636,513 | 1,021,029 |
| Wal-Mart de Mexico S.A.B. de C.V. | 6,426,616 | 18,168,097 |
| 180,208,918 | ||
| Peru 0.1% | ||
| Companhia de Minas Buenaventura S.A. ADR | 270,944 | 4,129,187 |
| Philippines 1.4% | ||
| Aboitiz Power Corp. | 1,795,359 | 1,310,544 |
| Alliance Global Group, Inc. | 5,017,532 | 1,224,082 |
| Ayala Corp. | 308,932 | 5,489,355 |
| Ayala Land, Inc. | 8,665,277 | 7,873,363 |
| Bank of the Philippine Islands | 2,284,353 | 3,859,364 |
| BDO Unibank, Inc. | 2,435,625 | 6,971,294 |
| Bloomberry Resorts Corp. | 4,934,441 | 980,111 |
| DMCI Holdings, Inc. | 5,326,592 | 926,008 |
| Globe Telecom, Inc. | 33,842 | 1,319,680 |
| GT Capital Holdings, Inc. | 122,219 | 2,131,775 |
| International Container Terminal Services, Inc. | 1,383,979 | 3,610,322 |
| JG Summit Holdings, Inc. | 3,552,802 | 4,910,418 |
| Jollibee Foods Corp. | 512,819 | 2,342,570 |
| LT Group, Inc. | 3,555,606 | 1,009,496 |
| Manila Electric Co. | 328,894 | 2,306,033 |
| Megaworld Corp. | 15,026,996 | 1,480,834 |
| Metro Pacific Investments Corp. | 18,140,388 | 1,724,918 |
| Metropolitan Bank & Trust Co. | 2,034,257 | 2,770,568 |
| PLDT, Inc. | 148,854 | 3,371,250 |
| San Miguel Corp. | 458,892 | 1,586,718 |
| San Miguel Food & Beverage, Inc. | 862,246 | 1,490,701 |
| Semirara Mining & Power Corp. | 1,476,509 | 658,023 |
| SM Investments Corp. | 610,225 | 12,026,910 |
| SM Prime Holdings, Inc. | 11,288,696 | 7,654,823 |
| Universal Robina Corp. | 1,106,720 | 3,677,905 |
| 82,707,065 | ||
| Qatar 1.3% | ||
| Al Meera Consumer Goods Co. QSC | 44,160 | 180,678 |
| Barwa Real Estate Co. | 2,452,686 | 2,289,869 |
| Doha Bank QPSC | 1,820,018 | 1,299,388 |
| Ezdan Holding Group QSC * | 1,475,278 | 245,896 |
| Gulf International Services QSC * | 1,448,844 | 620,635 |
| Industries Qatar QSC | 2,470,486 | 7,380,761 |
| Masraf Al Rayan QSC | 4,589,903 | 4,575,094 |
| Mesaieed Petrochemical Holding Co. | 5,322,320 | 4,150,584 |
| Ooredoo QPSC | 1,017,164 | 1,955,145 |
| Qatar Aluminum Manufacturing Co. | 3,284,884 | 694,545 |
| Qatar Electricity & Water Co. QSC | 617,814 | 2,561,678 |
| Qatar Fuel QSC | 667,878 | 3,961,328 |
| Qatar Gas Transport Co., Ltd. | 3,436,929 | 2,246,143 |
| Qatar Insurance Co. SAQ | 2,021,298 | 1,737,259 |
| Qatar International Islamic Bank QSC | 948,187 | 2,015,231 |
| Qatar Islamic Bank SAQ | 1,447,186 | 6,278,723 |
| Security | Number of Shares | Value ($) |
| Qatar National Bank QPSC | 5,544,004 | 29,152,928 |
| Qatar Navigation QSC | 651,564 | 1,082,436 |
| The Commercial Bank QSC | 2,589,056 | 3,384,062 |
| United Development Co. QSC | 2,631,775 | 990,055 |
| Vodafone Qatar QSC | 2,316,750 | 782,482 |
| 77,584,920 | ||
| Russia 4.4% | ||
| Aeroflot PJSC | 831,289 | 1,369,523 |
| Alrosa PJSC | 3,174,684 | 3,539,223 |
| Federal Grid Co. Unified Energy System PJSC | 342,078,255 | 911,639 |
| Gazprom PJSC * | 13,147,549 | 45,821,141 |
| Gazprom PJSC | 1 | 3 |
| Inter RAO UES PJSC | 45,479,779 | 2,929,080 |
| LUKOIL PJSC | 595,619 | 48,101,971 |
| Magnit PJSC | 90,526 | 5,014,783 |
| Magnitogorsk Iron & Steel Works PJSC | 2,180,954 | 1,369,905 |
| MMC Norilsk Nickel PJSC | 64,277 | 15,524,230 |
| Mobile TeleSystems PJSC | 1,191,328 | 4,763,613 |
| Moscow Exchange MICEX-RTS PJSC | 1,956,517 | 2,779,195 |
| Mosenergo PJSC | 16,991,602 | 570,245 |
| NovaTek PJSC | 1,341,631 | 25,941,875 |
| Novolipetsk Steel PJSC | 1,232,302 | 2,753,526 |
| PhosAgro PJSC | 53,347 | 2,040,619 |
| Polyus PJSC * | 35,142 | 4,043,813 |
| Rosneft Oil Co. PJSC | 1,415,378 | 8,647,008 |
| Rosseti PJSC | 38,638,240 | 680,303 |
| Rostelecom PJSC | 1,180,411 | 1,435,570 |
| RusHydro PJSC | 131,379,557 | 1,082,436 |
| RussNeft PJSC * | 55,613 | 478,892 |
| Sberbank of Russia PJSC | 12,820,940 | 43,152,694 |
| Severstal PJSC | 244,495 | 3,680,753 |
| Sistema PJSC | 4,627,640 | 807,963 |
| Surgutneftegas PJSC | 10,429,347 | 4,297,861 |
| Tatneft PJSC | 1,908,820 | 21,294,363 |
| Unipro PJSC | 11,214,690 | 457,941 |
| VTB Bank PJSC GDR | 2,700,722 | 3,127,436 |
| 256,617,604 | ||
| Saudi Arabia 1.7% | ||
| Abdullah Al Othaim Markets Co. | 36,840 | 766,129 |
| Advanced Petrochemical Co. | 64,376 | 961,169 |
| Al Hammadi Co. for Development and Investment * | 47,625 | 285,443 |
| Al Rajhi Bank | 762,654 | 12,301,855 |
| Alinma Bank | 464,626 | 2,725,297 |
| Almarai Co. JSC | 154,190 | 2,036,984 |
| Bank Al-Jazira | 262,902 | 946,270 |
| Bank AlBilad | 233,929 | 1,634,079 |
| Bupa Arabia for Cooperative Insurance Co. | 39,359 | 1,085,056 |
| Dallah Healthcare Co. | 21,861 | 289,094 |
| Dar Al Arkan Real Estate Development Co. * | 337,217 | 1,039,334 |
| Emaar Economic City * | 266,549 | 710,665 |
| Etihad Etisalat Co. * | 238,603 | 1,581,484 |
| Fawaz Abdulaziz Al Hokair & Co. * | 45,202 | 259,110 |
| Jarir Marketing Co. | 35,330 | 1,463,802 |
| Middle East Healthcare Co. * | 39,539 | 270,396 |
| Mobile Telecommunications Co. * | 198,931 | 621,610 |
| Mouwasat Medical Services Co. | 27,605 | 625,596 |
| National Commercial Bank | 842,078 | 10,698,007 |
| National Industrialization Co. * | 217,560 | 792,351 |
| National Petrochemical Co. | 85,179 | 512,795 |
| Rabigh Refining & Petrochemical Co. * | 111,744 | 590,494 |
| Security | Number of Shares | Value ($) |
| Riyad Bank | 827,377 | 5,647,173 |
| Sahara International Petrochemical Co. | 231,774 | 1,117,251 |
| Samba Financial Group | 610,086 | 4,668,320 |
| Saudi Airlines Catering Co. | 28,879 | 673,717 |
| Saudi Arabian Fertilizer Co. | 125,494 | 2,643,247 |
| Saudi Arabian Mining Co. * | 255,120 | 3,013,255 |
| Saudi Basic Industries Corp. | 557,444 | 14,847,537 |
| Saudi Cement Co. | 49,880 | 832,508 |
| Saudi Electricity Co. | 478,826 | 2,617,094 |
| Saudi Ground Services Co. | 48,188 | 385,432 |
| Saudi Industrial Investment Group | 145,260 | 844,287 |
| Saudi Kayan Petrochemical Co. * | 470,556 | 1,317,311 |
| Saudi Pharmaceutical Industries & Medical Appliances Corp. | 40,793 | 279,516 |
| Saudi Research & Marketing Group * | 25,928 | 622,156 |
| Saudi Telecom Co. | 383,440 | 10,120,927 |
| Seera Group Holding | 61,071 | 275,175 |
| The Co. for Cooperative Insurance * | 39,425 | 695,853 |
| The Qassim Cement Co. | 28,900 | 411,459 |
| The Savola Group * | 164,190 | 1,367,995 |
| Yanbu Cement Co. | 40,567 | 368,820 |
| Yanbu National Petrochemical Co. | 147,916 | 2,113,818 |
| 97,059,871 | ||
| South Africa 6.8% | ||
| Absa Group Ltd. | 904,116 | 9,151,467 |
| African Rainbow Minerals Ltd. | 136,577 | 1,490,552 |
| Anglo American Platinum Ltd. | 75,125 | 4,605,044 |
| AngloGold Ashanti Ltd. | 520,597 | 11,867,914 |
| Aspen Pharmacare Holdings Ltd. | 470,829 | 2,440,388 |
| Assore Ltd. | 38,664 | 782,893 |
| Attacq Ltd. | 988,343 | 716,014 |
| AVI Ltd. | 394,994 | 2,158,143 |
| Barloworld Ltd. | 256,336 | 1,870,892 |
| Bid Corp., Ltd. | 413,519 | 8,851,152 |
| Brait SE * | 482,779 | 473,121 |
| Capitec Bank Holdings Ltd. | 65,979 | 4,757,745 |
| Clicks Group Ltd. | 316,133 | 4,143,276 |
| Coronation Fund Managers Ltd. | 324,905 | 909,210 |
| Dis-Chem Pharmacies Ltd. | 531,242 | 778,473 |
| Discovery Ltd. | 455,205 | 3,452,768 |
| Distell Group Holdings Ltd. | 87,974 | 753,214 |
| Exxaro Resources Ltd. | 367,125 | 3,292,428 |
| FirstRand Ltd. | 3,957,255 | 15,634,855 |
| Fortress REIT Ltd., Class A | 1,295,201 | 1,800,721 |
| Fortress REIT Ltd., Class B | 1,327,507 | 941,615 |
| Gold Fields Ltd. | 1,002,708 | 6,000,234 |
| Growthpoint Properties Ltd. | 3,647,874 | 5,525,717 |
| Harmony Gold Mining Co., Ltd. * | 573,851 | 2,099,821 |
| Hyprop Investments Ltd. | 303,189 | 1,314,094 |
| Impala Platinum Holdings Ltd. * | 854,126 | 4,863,041 |
| Imperial Logistics Ltd. | 218,364 | 791,698 |
| Investec Ltd. | 357,920 | 1,887,927 |
| JSE Ltd. | 105,465 | 896,023 |
| KAP Industrial Holdings Ltd. | 3,324,944 | 1,147,457 |
| Kumba Iron Ore Ltd. | 69,446 | 1,797,375 |
| Liberty Holdings Ltd. | 132,811 | 958,924 |
| Life Healthcare Group Holdings Ltd. | 1,772,535 | 2,662,815 |
| MAS Real Estate, Inc. | 572,551 | 601,445 |
| Massmart Holdings Ltd. | 148,262 | 439,306 |
| Momentum Metropolitan Holdings | 1,188,217 | 1,286,526 |
| Motus Holdings Ltd. | 218,364 | 1,078,607 |
| Mr Price Group Ltd. | 306,067 | 3,460,847 |
| MTN Group Ltd. | 2,248,009 | 15,188,820 |
| MultiChoice Group * | 545,857 | 4,785,674 |
| Naspers Ltd., N Shares | 534,181 | 121,508,477 |
| Nedbank Group Ltd. | 508,513 | 7,568,877 |
| Security | Number of Shares | Value ($) |
| NEPI Rockcastle plc | 439,466 | 3,892,568 |
| Netcare Ltd. | 1,864,031 | 2,001,067 |
| Northam Platinum Ltd. * | 449,291 | 2,327,273 |
| Old Mutual Ltd. | 6,162,668 | 7,382,822 |
| Pepkor Holdings Ltd. | 905,693 | 992,557 |
| Pick n Pay Stores Ltd. | 433,433 | 1,649,950 |
| Pioneer Foods Group Ltd. | 156,505 | 1,087,431 |
| PSG Group Ltd. | 206,527 | 2,727,986 |
| Rand Merchant Investment Holdings Ltd. | 875,152 | 1,707,220 |
| Redefine Properties Ltd. | 6,948,337 | 3,592,291 |
| Remgro Ltd. | 635,399 | 7,185,600 |
| Resilient REIT Ltd. | 376,850 | 1,562,375 |
| Reunert Ltd. | 219,091 | 930,690 |
| RMB Holdings Ltd. | 942,455 | 4,434,900 |
| Sanlam Ltd. | 2,171,069 | 10,402,257 |
| Santam Ltd. | 52,891 | 992,768 |
| Sappi Ltd. | 694,226 | 2,067,533 |
| Sasol Ltd. | 717,499 | 13,606,904 |
| Shoprite Holdings Ltd. | 585,645 | 4,358,082 |
| Sibanye Gold Ltd. * | 2,713,839 | 3,730,160 |
| Standard Bank Group Ltd. | 1,623,752 | 18,956,205 |
| Super Group Ltd. * | 456,415 | 859,700 |
| Telkom S.A. SOC Ltd. | 412,684 | 2,163,746 |
| The Bidvest Group Ltd. | 421,825 | 4,964,526 |
| The Foschini Group Ltd. | 270,417 | 2,680,350 |
| The SPAR Group Ltd. | 227,035 | 2,599,193 |
| Tiger Brands Ltd. | 224,074 | 3,083,134 |
| Truworths International Ltd. | 522,741 | 1,813,305 |
| Tsogo Sun Gaming Ltd. * | 689,248 | 627,342 |
| Tsogo Sun Hotels Ltd. * | 689,248 | 176,582 |
| Vodacom Group Ltd. | 746,461 | 5,667,868 |
| Vukile Property Fund Ltd. | 1,122,795 | 1,384,291 |
| Woolworths Holdings Ltd. | 1,160,985 | 4,219,192 |
| 392,563,458 | ||
| Taiwan 12.6% | ||
| Acer, Inc. | 3,668,086 | 2,008,630 |
| Advantech Co., Ltd. | 465,256 | 3,954,898 |
| ASE Technology Holding Co.,Ltd. | 4,364,120 | 9,920,349 |
| Asia Cement Corp. | 2,847,286 | 3,897,908 |
| Asustek Computer, Inc. | 871,426 | 5,659,691 |
| AU Optronics Corp. | 11,061,530 | 2,880,717 |
| Capital Securities Corp. | 2,544,644 | 708,871 |
| Catcher Technology Co., Ltd. | 909,224 | 6,382,805 |
| Cathay Financial Holding Co., Ltd. | 9,761,189 | 12,477,292 |
| Chailease Holding Co., Ltd. | 1,486,290 | 5,891,216 |
| Chang Hwa Commercial Bank Ltd. | 7,762,198 | 4,991,926 |
| Cheng Shin Rubber Industry Co., Ltd. | 2,359,277 | 3,304,941 |
| Chicony Electronics Co., Ltd. | 749,951 | 2,105,880 |
| China Airlines Ltd. | 3,040,872 | 894,545 |
| China Development Financial Holding Corp. | 17,733,308 | 5,131,989 |
| China Life Insurance Co., Ltd. | 3,603,687 | 2,822,372 |
| China Motor Corp. | 809,000 | 643,903 |
| China Steel Corp. | 15,638,956 | 11,526,324 |
| Chunghwa Telecom Co., Ltd. | 4,712,310 | 16,352,811 |
| Compal Electronics, Inc. | 5,292,638 | 3,024,605 |
| CTBC Financial Holding Co., Ltd. | 22,899,792 | 14,836,382 |
| Delta Electronics, Inc. | 2,725,148 | 12,710,416 |
| E.Sun Financial Holding Co., Ltd. | 13,707,368 | 11,019,135 |
| Eclat Textile Co., Ltd. | 292,510 | 3,576,053 |
| Epistar Corp. * | 1,355,828 | 994,964 |
| Eternal Materials Co., Ltd. | 1,293,213 | 1,016,949 |
| Eva Airways Corp. | 2,794,982 | 1,259,121 |
| Evergreen Marine Corp., Ltd. * | 2,748,037 | 1,124,237 |
| Far Eastern International Bank | 2,689,282 | 993,176 |
| Far Eastern New Century Corp. | 4,793,799 | 4,349,674 |
| Security | Number of Shares | Value ($) |
| Far EasTone Telecommunications Co., Ltd. | 1,919,280 | 4,472,821 |
| Feng Hsin Steel Co., Ltd. | 559,000 | 971,710 |
| Feng TAY Enterprise Co., Ltd. | 463,320 | 3,016,521 |
| First Financial Holding Co., Ltd. | 12,464,038 | 8,531,576 |
| Formosa Chemicals & Fibre Corp. | 4,297,008 | 12,052,417 |
| Formosa Petrochemical Corp. | 1,751,660 | 5,420,610 |
| Formosa Plastics Corp. | 6,088,560 | 18,240,481 |
| Formosa Taffeta Co., Ltd. | 1,192,000 | 1,292,187 |
| Foxconn Technology Co., Ltd. | 1,378,315 | 2,782,081 |
| Fubon Financial Holding Co., Ltd. | 9,032,114 | 12,551,792 |
| Giant Manufacturing Co., Ltd. | 380,752 | 2,648,657 |
| Globalwafers Co., Ltd. | 267,451 | 2,452,273 |
| Hon Hai Precision Industry Co., Ltd. | 14,975,092 | 35,375,735 |
| Hotai Motor Co., Ltd. | 394,000 | 5,550,621 |
| HTC Corp. | 853,778 | 944,565 |
| Hua Nan Financial Holdings Co., Ltd. | 11,142,396 | 7,077,071 |
| Innolux Corp. | 11,014,029 | 2,461,588 |
| Inventec Corp. | 3,828,145 | 2,620,348 |
| Largan Precision Co., Ltd. | 128,956 | 15,970,673 |
| Lite-On Technology Corp. | 2,685,107 | 4,274,287 |
| MediaTek, Inc. | 1,861,713 | 21,782,220 |
| Mega Financial Holding Co., Ltd. | 13,704,901 | 12,544,282 |
| Nan Ya Plastics Corp. | 7,025,816 | 15,389,244 |
| Nanya Technology Corp. | 1,035,000 | 2,319,771 |
| Novatek Microelectronics Corp. | 862,608 | 5,108,089 |
| OBI Pharma, Inc. * | 157,261 | 698,437 |
| Oriental Union Chemical Corp. | 1,119,000 | 758,825 |
| Pegatron Corp. | 2,460,657 | 4,105,012 |
| Pou Chen Corp. | 3,319,792 | 4,143,134 |
| President Chain Store Corp. | 690,400 | 6,418,236 |
| Quanta Computer, Inc. | 3,352,000 | 6,029,545 |
| Realtek Semiconductor Corp. | 591,336 | 4,047,668 |
| Shin Kong Financial Holding Co., Ltd. | 14,262,843 | 4,177,592 |
| SinoPac Financial Holdings Co., Ltd. | 13,365,699 | 5,042,456 |
| Synnex Technology International Corp. | 1,799,956 | 2,120,292 |
| Taishin Financial Holding Co., Ltd. | 12,907,566 | 5,506,571 |
| Taiwan Business Bank | 5,829,154 | 2,282,668 |
| Taiwan Cement Corp. | 6,119,706 | 7,491,331 |
| Taiwan Cooperative Financial Holding Co., Ltd. | 11,810,651 | 7,520,313 |
| Taiwan Fertilizer Co., Ltd. | 917,508 | 1,326,166 |
| Taiwan Glass Industry Corp. | 2,101,311 | 779,378 |
| Taiwan High Speed Rail Corp. | 2,709,000 | 3,268,739 |
| Taiwan Mobile Co., Ltd. | 1,968,524 | 7,019,251 |
| Taiwan Secom Co., Ltd. | 428,000 | 1,171,856 |
| Taiwan Semiconductor Manufacturing Co., Ltd. | 30,101,500 | 248,210,395 |
| Teco Electric & Machinery Co., Ltd. | 2,184,000 | 1,731,347 |
| TPK Holding Co., Ltd. * | 461,000 | 833,645 |
| Transcend Information, Inc. | 362,000 | 759,497 |
| U-Ming Marine Transport Corp. | 510,000 | 560,984 |
| Uni-President Enterprises Corp. | 5,977,676 | 14,577,841 |
| Unimicron Technology Corp. | 1,627,348 | 2,023,175 |
| United Microelectronics Corp. | 14,151,850 | 6,059,929 |
| Vanguard International Semiconductor Corp. | 1,118,000 | 2,278,001 |
| Walsin Lihwa Corp. | 4,034,000 | 1,772,340 |
| Walsin Technology Corp. | 626,000 | 3,148,933 |
| Wan Hai Lines Ltd. | 671,000 | 405,890 |
| Wistron Corp. | 3,447,080 | 2,732,642 |
| Yageo Corp. | 484,000 | 3,497,867 |
| Yuanta Financial Holding Co., Ltd. | 13,607,700 | 7,819,770 |
| Yulon Motor Co., Ltd. | 1,068,192 | 710,768 |
| Yulon Nissan Motor Co., Ltd. | 33,000 | 259,503 |
| 733,603,397 | ||
| Security | Number of Shares | Value ($) |
| Thailand 3.8% | ||
| Advanced Info Service PCL NVDR | 1,393,200 | 10,572,325 |
| Airports of Thailand PCL NVDR | 5,460,100 | 12,858,850 |
| Bangkok Bank PCL NVDR | 486,900 | 2,723,359 |
| Bangkok Dusit Medical Services PCL NVDR | 11,073,100 | 8,547,720 |
| Bangkok Expressway & Metro PCL NVDR | 9,963,014 | 3,649,873 |
| Bangkok Life Assurance PCL NVDR | 707,900 | 474,673 |
| Banpu PCL NVDR | 5,689,700 | 2,363,536 |
| Berli Jucker PCL NVDR | 1,420,550 | 2,520,724 |
| BTS Group Holdings PCL NVDR | 9,641,900 | 4,257,606 |
| Bumrungrad Hospital PCL NVDR | 530,300 | 2,402,373 |
| Central Pattana PCL NVDR | 3,117,300 | 6,857,091 |
| Charoen Pokphand Foods PCL NVDR | 4,463,200 | 4,306,629 |
| CP ALL PCL NVDR | 6,549,100 | 17,994,093 |
| Delta Electronics Thailand PCL NVDR | 599,521 | 955,978 |
| Digital Telecommunications Infrastructure Fund | 6,107,400 | 3,376,075 |
| Electricity Generating PCL NVDR | 332,000 | 3,648,769 |
| Energy Absolute PCL NVDR | 2,040,252 | 3,153,223 |
| Global Power Synergy PCL NVDR | 512,449 | 1,215,228 |
| Gulf Energy Development PCL NVDR | 954,459 | 4,526,832 |
| Home Product Center PCL NVDR | 6,920,219 | 4,074,379 |
| Indorama Ventures PCL NVDR | 2,272,900 | 2,620,647 |
| Intouch Holdings PCL NVDR | 2,506,700 | 5,247,487 |
| IRPC PCL NVDR | 12,138,500 | 1,572,278 |
| Kasikornbank PCL NVDR | 2,514,100 | 13,157,445 |
| Krung Thai Bank PCL NVDR | 7,667,900 | 4,313,938 |
| Land & Houses PCL NVDR | 8,326,700 | 2,941,479 |
| Minor International PCL NVDR | 4,385,180 | 5,450,547 |
| Muangthai Capital PCL NVDR | 847,473 | 1,524,606 |
| Osotspa PCL | 1,681,524 | 2,035,044 |
| PTT Exploration & Production PCL NVDR | 1,673,104 | 6,813,360 |
| PTT Global Chemical PCL NVDR | 2,487,914 | 4,333,353 |
| PTT PCL NVDR | 18,024,800 | 26,088,720 |
| Ratch Group PCL NVDR | 984,200 | 2,366,136 |
| Siam City Cement PCL NVDR | 112,600 | 850,784 |
| Siam Makro PCL | 456,400 | 526,228 |
| Thai Airways International PCL NVDR * | 1,467,600 | 477,639 |
| Thai Oil PCL NVDR | 1,283,900 | 2,845,179 |
| Thai Union Group PCL NVDR | 3,352,800 | 1,908,209 |
| The Siam Cement PCL NVDR | 1,050,000 | 14,287,350 |
| The Siam Commercial Bank PCL NVDR | 3,056,300 | 12,346,162 |
| TMB Bank PCL NVDR | 28,934,600 | 1,476,424 |
| Total Access Communication PCL NVDR | 951,100 | 1,913,244 |
| True Corp. PCL NVDR | 13,929,366 | 2,870,390 |
| 218,445,985 | ||
| Turkey 0.7% | ||
| Akbank T.A.S. * | 3,350,036 | 3,990,431 |
| Anadolu Efes Biracilik Ve Malt Sanayii A/S | 284,429 | 1,248,778 |
| Arcelik A/S * | 178,006 | 522,141 |
| Aselsan Elektronik Sanayi Ve Ticaret A/S | 392,406 | 1,228,489 |
| BIM Birlesik Magazalar A/S | 538,580 | 4,346,541 |
| Coca-Cola Icecek A/S | 77,421 | 457,915 |
| Emlak Konut Gayrimenkul Yatirim Ortakligi A/S | 2,356,225 | 477,210 |
| Enerjisa Enerji A/S | 165,186 | 166,993 |
| Enka Insaat ve Sanayi A/S | 725,439 | 722,171 |
| Eregli Demir ve Celik Fabrikalari T.A.S. | 1,672,773 | 1,840,373 |
| Ford Otomotiv Sanayi A/S | 78,036 | 786,890 |
| Haci Omer Sabanci Holding A/S | 1,069,385 | 1,609,699 |
| Iskenderun Demir ve Celik A/S | 266,090 | 276,309 |
| KOC Holding A/S | 1,069,352 | 3,210,121 |
| Koza Altin Isletmeleri A/S * | 61,596 | 723,135 |
| Security | Number of Shares | Value ($) |
| Petkim Petrokimya Holding A/S * | 1,195,776 | 703,971 |
| Soda Sanayii A/S | 531,242 | 503,318 |
| TAV Havalimanlari Holding A/S | 235,751 | 954,941 |
| Tekfen Holding A/S | 220,948 | 785,761 |
| Tofas Turk Otomobil Fabrikasi A/S | 112,166 | 340,180 |
| Tupras-Turkiye Petrol Rafinerileri A/S | 151,087 | 3,267,447 |
| Turk Hava YollariI AO * | 745,367 | 1,445,638 |
| Turk Telekomunikasyon A/S * | 573,087 | 521,324 |
| Turkcell Iletisim Hizmetleri A/S | 1,334,961 | 2,962,634 |
| Turkiye Garanti Bankasi A/S * | 2,696,902 | 4,119,704 |
| Turkiye Halk Bankasi A/S | 775,662 | 756,191 |
| Turkiye Is Bankasi A/S, C Shares * | 2,125,429 | 2,010,060 |
| Turkiye Sise ve Cam Fabrikalari A/S | 849,880 | 631,621 |
| Turkiye Vakiflar Bankasi T.A.O., Class D | 1,287,424 | 1,025,299 |
| Ulker Biskuvi Sanayi A/S | 209,310 | 643,782 |
| Yapi ve Kredi Bankasi A/S * | 2,148,503 | 844,466 |
| 43,123,533 | ||
| United Arab Emirates 1.1% | ||
| Abu Dhabi Commercial Bank PJSC | 3,355,319 | 7,938,070 |
| Abu Dhabi Islamic Bank PJSC | 1,163,012 | 1,598,957 |
| Abu Dhabi National Oil Co. for Distribution PJSC | 1,763,990 | 1,263,029 |
| Air Arabia PJSC * | 2,657,910 | 868,326 |
| Aldar Properties PJSC | 5,049,002 | 3,079,037 |
| Arabtec Holding PJSC | 997,170 | 437,075 |
| DAMAC Properties Dubai Co. PJSC * | 1,982,761 | 514,428 |
| Dana Gas PJSC | 3,811,128 | 1,018,888 |
| DP World PLC | 196,760 | 2,754,640 |
| Dubai Financial Market PJSC * | 2,740,608 | 641,662 |
| Dubai Investments PJSC | 2,950,308 | 1,052,204 |
| Dubai Islamic Bank PJSC | 2,232,837 | 3,112,349 |
| Emaar Development PJSC | 1,055,646 | 1,181,195 |
| Emaar Malls PJSC | 2,565,627 | 1,355,054 |
| Emaar Properties PJSC | 4,416,412 | 5,951,633 |
| Emirates Telecommunications Group Co. PJSC | 2,122,097 | 9,763,674 |
| First Abu Dhabi Bank PJSC | 5,463,365 | 22,697,399 |
| 65,227,620 | ||
| Total Common Stock | ||
| (Cost $5,315,158,228) | 5,646,963,473 | |
| Preferred Stock2.5% of net assets | ||
| Brazil 2.1% | ||
| Alpargatas S.A. * | 214,947 | 1,288,995 |
| Azul S.A. * | 241,746 | 2,755,490 |
| Banco Bradesco S.A. | 5,034,842 | 40,147,632 |
| Banco do Estado do Rio Grande do Sul S.A., Class B | 258,266 | 1,414,394 |
| Bradespar S.A. | 266,487 | 1,833,461 |
| Braskem S.A., A Shares * | 234,565 | 1,601,913 |
| Centrais Eletricas Brasileiras S.A., B Shares | 230,479 | 2,618,699 |
| Cia Brasileira de Distribuicao | 199,445 | 4,226,176 |
| Cia de Transmissao de Energia Electrica Paulista | 237,299 | 1,424,185 |
| Companhia Energetica de Minas Gerais | 1,217,813 | 4,349,964 |
| Companhia Paranaense de Energia, B Shares | 91,048 | 1,147,960 |
| Gerdau S.A. | 1,299,497 | 4,047,366 |
| Itausa - Investimentos Itau S.A. | 5,433,944 | 16,161,650 |
| Lojas Americanas S.A. | 1,157,724 | 5,247,609 |
| Petroleo Brasileiro S.A. | 4,949,214 | 30,541,832 |
| Security | Number of Shares | Value ($) |
| Telefonica Brasil S.A. | 513,515 | 6,669,655 |
| Usinas Siderurgicas de Minas Gerais S.A., A Shares | 532,663 | 1,018,353 |
| 126,495,334 | ||
| Chile 0.1% | ||
| Embotelladora Andina S.A., B Shares | 238,050 | 737,880 |
| Sociedad Quimica y Minera de Chile S.A., B Shares | 115,769 | 2,863,956 |
| 3,601,836 | ||
| Colombia 0.1% | ||
| Grupo Aval Acciones y Valores S.A. | 5,259,344 | 1,973,214 |
| Grupo de Inversiones Suramericana S.A. | 159,455 | 1,439,518 |
| 3,412,732 | ||
| Russia 0.2% | ||
| Bashneft PJSC | 29,356 | 691,468 |
| Surgutneftegas PJSC | 9,024,401 | 4,368,505 |
| Tatneft PJSC | 149,439 | 1,424,591 |
| Transneft PJSC | 1,770 | 3,996,442 |
| 10,481,006 | ||
| Total Preferred Stock | ||
| (Cost $128,252,311) | 143,990,908 | |
| Rights0.0% of net assets | ||
| Brazil 0.0% | ||
| B2W Cia Digital expires 09/21/19 * | 31,595 | 62,621 |
| China 0.0% | ||
| Legend Holdings Corp. expires 05/23/19 *(b) | 38,995 | — |
| Total Rights | ||
| (Cost $—) | 62,621 | |
| Warrants0.0% of net assets | ||
| Thailand 0.0% | ||
| Minor International PCL expires 09/30/21 * | 1 | — |
| Total Warrants | ||
| (Cost $—) | — | |
| Security Rate, Maturity Date | Face Amount ($) | Value ($) |
| Corporate Bond0.0% of net assets | ||
| India 0.0% | ||
| Britannia Industries Ltd. | ||
| 8.00%, 08/28/22 | 2,117,280 | 30,438 |
| Total Corporate Bond | ||
| (Cost $29,483) | 30,438 | |
| Security | Number of Shares | Value ($) |
| Other Investment Companies0.2% of net assets | ||
| United States 0.2% | ||
| Money Market Fund 0.1% | ||
| State Street Institutional U.S. Government Money Market Fund, Premier Class 2.07%(c) | 5,028,748 | 5,028,748 |
| Securities Lending Collateral 0.1% | ||
| Wells Fargo Government Money Market Fund, Select Class 2.03%(c) | 5,664,659 | 5,664,659 |
| Total Other Investment Companies | ||
| (Cost $10,693,407) | 10,693,407 | |
| Number of Contracts | Notional Amount ($) | Current Value/ Unrealized Appreciation ($) | ||
| Futures Contracts | ||||
| Long | ||||
| MSCI Emerging Markets Index, expires 09/20/19 | 253 | 12,447,600 | 192,550 | |
| * | Non-income producing security. |
| (a) | All or a portion of this security is on loan. Securities on loan were valued at $5,258,438. |
| (b) | Fair-valued by management using significant unobservable inputs in accordance with procedures approved by the fund’s Board of Trustees. |
| (c) | The rate shown is the 7-day yield. |
| ADR — | American Depositary Receipt |
| DVR — | Differential Voting Rights |
| GDR — | Global Depositary Receipt |
| NVDR — | Non-Voting Depositary Receipt |
| REIT — | Real Estate Investment Trust |
Table of Contents
| Security | Number of Shares | Value ($) |
| Common Stock99.8% of net assets | ||
| Automobiles & Components 0.7% | ||
| Adient plc | 42,610 | 859,444 |
| American Axle & Manufacturing Holdings, Inc. * | 55,762 | 353,531 |
| Aptiv plc | 132,161 | 10,991,830 |
| Autoliv, Inc. | 44,631 | 3,052,760 |
| BorgWarner, Inc. | 105,773 | 3,451,373 |
| Cooper Tire & Rubber Co. | 26,190 | 615,203 |
| Cooper-Standard Holding, Inc. * | 8,887 | 332,729 |
| Dana, Inc. | 73,108 | 930,665 |
| Delphi Technologies plc | 44,184 | 584,554 |
| Dorman Products, Inc. * | 14,712 | 1,045,729 |
| Ford Motor Co. | 1,994,807 | 18,292,380 |
| Fox Factory Holding Corp. * | 19,325 | 1,392,173 |
| Garrett Motion, Inc. * | 45,359 | 446,333 |
| General Motors Co. | 675,820 | 25,066,164 |
| Gentex Corp. | 128,362 | 3,414,429 |
| Gentherm, Inc. * | 17,617 | 646,544 |
| Harley-Davidson, Inc. | 80,997 | 2,583,804 |
| Horizon Global Corp. * | 7,582 | 31,693 |
| LCI Industries | 13,047 | 1,105,733 |
| Lear Corp. | 31,908 | 3,581,992 |
| Modine Manufacturing Co. * | 29,319 | 299,347 |
| Motorcar Parts of America, Inc. * | 8,240 | 119,727 |
| Standard Motor Products, Inc. | 10,578 | 468,711 |
| Stoneridge, Inc. * | 15,422 | 473,610 |
| Superior Industries International, Inc. | 11,674 | 32,104 |
| Tenneco, Inc., Class A | 26,102 | 227,609 |
| Tesla, Inc. * | 70,760 | 15,964,164 |
| The Goodyear Tire & Rubber Co. | 119,021 | 1,365,171 |
| Thor Industries, Inc. | 26,738 | 1,227,542 |
| Tower International, Inc. | 10,244 | 316,847 |
| Veoneer, Inc. * | 59,204 | 868,523 |
| Visteon Corp. * | 14,452 | 996,754 |
| Winnebago Industries, Inc. | 15,027 | 481,165 |
| 101,620,337 | ||
| Banks 5.5% | ||
| 1st Source Corp. | 8,730 | 387,350 |
| Ameris Bancorp | 31,045 | 1,092,474 |
| Arrow Financial Corp. | 7,986 | 256,830 |
| Associated Banc-Corp. | 83,715 | 1,610,677 |
| Atlantic Union Bankshares Corp. | 36,503 | 1,318,123 |
| Axos Financial, Inc. * | 26,466 | 685,734 |
| Banc of California, Inc. | 22,142 | 322,609 |
| BancFirst Corp. | 8,329 | 447,850 |
| BancorpSouth Bank | 46,217 | 1,275,127 |
| Bank of America Corp. | 4,529,217 | 124,598,760 |
| Bank of Hawaii Corp. | 20,734 | 1,714,287 |
| Bank OZK | 61,672 | 1,591,138 |
| BankUnited, Inc. | 50,501 | 1,603,912 |
| Banner Corp. | 16,036 | 864,501 |
| BB&T Corp. | 391,998 | 18,678,705 |
| Berkshire Hills Bancorp, Inc. | 23,676 | 694,417 |
| BOK Financial Corp. | 16,329 | 1,243,290 |
| Boston Private Financial Holdings, Inc. | 45,770 | 486,077 |
| Security | Number of Shares | Value ($) |
| Bridge Bancorp, Inc. | 9,093 | 244,693 |
| Bridgewater Bancshares, Inc. * | 5,884 | 65,489 |
| Brookline Bancorp, Inc. | 43,071 | 604,717 |
| Bryn Mawr Bank Corp. | 9,897 | 337,488 |
| Byline Bancorp, Inc. * | 7,485 | 128,742 |
| Cadence BanCorp | 62,725 | 964,083 |
| Camden National Corp. | 7,345 | 304,524 |
| Capitol Federal Financial, Inc. | 73,151 | 985,344 |
| Carolina Financial Corp. | 10,715 | 365,917 |
| Carter Bank & Trust * | 10,987 | 207,544 |
| Cathay General Bancorp | 39,291 | 1,304,068 |
| CBTX, Inc. | 9,549 | 257,155 |
| CenterState Bank Corp. | 52,545 | 1,188,568 |
| Central Pacific Financial Corp. | 14,844 | 412,960 |
| CIT Group, Inc. | 49,782 | 2,120,215 |
| Citigroup, Inc. | 1,184,866 | 76,246,127 |
| Citizens Financial Group, Inc. | 234,767 | 7,921,039 |
| City Holding Co. | 8,534 | 634,503 |
| Columbia Banking System, Inc. | 38,349 | 1,323,424 |
| Columbia Financial, Inc. * | 24,991 | 378,864 |
| Comerica, Inc. | 78,836 | 4,860,239 |
| Commerce Bancshares, Inc. | 49,854 | 2,845,168 |
| Community Bank System, Inc. | 25,834 | 1,575,616 |
| Community Trust Bancorp, Inc. | 8,660 | 336,874 |
| ConnectOne Bancorp, Inc. | 16,413 | 336,138 |
| Cullen/Frost Bankers, Inc. | 31,951 | 2,652,253 |
| Customers Bancorp, Inc. * | 14,593 | 275,662 |
| CVB Financial Corp. | 52,211 | 1,073,980 |
| Dime Community Bancshares, Inc. | 15,469 | 306,750 |
| Eagle Bancorp, Inc. | 16,301 | 664,103 |
| East West Bancorp, Inc. | 73,867 | 3,038,150 |
| Enterprise Financial Services Corp. | 11,756 | 463,422 |
| Equity Bancshares, Inc., Class A * | 7,911 | 200,148 |
| Essent Group Ltd. * | 49,946 | 2,422,381 |
| F.N.B. Corp. | 163,985 | 1,762,839 |
| FB Financial Corp. | 9,040 | 324,265 |
| Federal Agricultural Mortgage Corp., Class A | 993 | 73,527 |
| Federal Agricultural Mortgage Corp., Class C | 4,339 | 357,317 |
| Fifth Third Bancorp | 371,685 | 9,831,068 |
| Financial Institutions, Inc. | 8,306 | 241,372 |
| First BanCorp | 110,422 | 1,057,843 |
| First Bancorp (North Carolina) | 15,187 | 534,886 |
| First Busey Corp. | 22,365 | 547,943 |
| First Citizens BancShares, Inc., Class A | 4,423 | 1,966,466 |
| First Commonwealth Financial Corp. | 50,382 | 623,225 |
| First Community Bankshares, Inc. | 6,245 | 198,653 |
| First Defiance Financial Corp. | 10,400 | 271,960 |
| First Financial Bancorp | 51,401 | 1,203,811 |
| First Financial Bankshares, Inc. | 69,512 | 2,128,457 |
| First Financial Corp. | 6,952 | 282,251 |
| First Foundation, Inc. | 18,717 | 261,289 |
| First Hawaiian, Inc. | 45,025 | 1,157,143 |
| First Horizon National Corp. | 162,983 | 2,580,021 |
| First Interstate BancSystem, Inc., Class A | 18,741 | 730,899 |
| First Merchants Corp. | 28,652 | 1,023,449 |
| First Midwest Bancorp, Inc. | 57,590 | 1,105,728 |
| First Republic Bank | 84,474 | 7,579,007 |
| Flagstar Bancorp, Inc. | 13,914 | 505,774 |
| Security | Number of Shares | Value ($) |
| Flushing Financial Corp. | 16,048 | 309,566 |
| Fulton Financial Corp. | 86,922 | 1,386,406 |
| German American Bancorp, Inc. | 11,764 | 359,155 |
| Glacier Bancorp, Inc. | 43,012 | 1,707,146 |
| Great Southern Bancorp, Inc. | 6,323 | 356,238 |
| Great Western Bancorp, Inc. | 29,103 | 868,142 |
| Hancock Whitney Corp. | 43,844 | 1,539,363 |
| Hanmi Financial Corp. | 14,659 | 262,543 |
| Harborone Bancorp, Inc. * | 32,593 | 324,626 |
| Heartland Financial USA, Inc. | 16,871 | 737,769 |
| Heritage Commerce Corp. | 22,439 | 260,068 |
| Heritage Financial Corp. | 17,273 | 452,207 |
| Hilltop Holdings, Inc. | 37,270 | 885,163 |
| Home BancShares, Inc. | 78,598 | 1,392,757 |
| HomeStreet, Inc. * | 14,025 | 369,839 |
| HomeTrust Bancshares, Inc. | 7,180 | 181,080 |
| Hope Bancorp, Inc. | 64,815 | 869,169 |
| Horizon Bancorp, Inc. | 20,329 | 330,550 |
| Huntington Bancshares, Inc. | 536,938 | 7,114,428 |
| IBERIABANK Corp. | 28,242 | 1,948,416 |
| Independent Bank Corp. | 17,486 | 1,182,228 |
| Independent Bank Group, Inc. | 18,219 | 891,091 |
| International Bancshares Corp. | 27,786 | 988,904 |
| Investors Bancorp, Inc. | 119,697 | 1,328,637 |
| JPMorgan Chase & Co. | 1,660,825 | 182,458,234 |
| Kearny Financial Corp. | 48,067 | 604,683 |
| KeyCorp | 514,617 | 8,542,642 |
| Lakeland Bancorp, Inc. | 24,837 | 369,575 |
| Lakeland Financial Corp. | 12,414 | 525,485 |
| LegacyTexas Financial Group, Inc. | 23,904 | 965,722 |
| LendingTree, Inc. * | 3,950 | 1,224,856 |
| Live Oak Bancshares, Inc. | 15,298 | 274,446 |
| Luther Burbank Corp. | 7,162 | 74,915 |
| M&T Bank Corp. | 69,772 | 10,201,364 |
| Mercantile Bank Corp. | 8,790 | 270,468 |
| Merchants Bancorp | 8,527 | 135,238 |
| Meridian Bancorp, Inc. | 27,891 | 487,535 |
| Meta Financial Group, Inc. | 15,147 | 468,194 |
| MGIC Investment Corp. | 182,642 | 2,310,421 |
| Midland States Bancorp, Inc. | 10,496 | 270,482 |
| Mr Cooper Group, Inc. * | 11,752 | 103,535 |
| National Bank Holdings Corp., Class A | 13,225 | 431,664 |
| NBT Bancorp, Inc. | 22,385 | 782,803 |
| New York Community Bancorp, Inc. | 238,351 | 2,750,571 |
| Nicolet Bankshares, Inc. * | 3,934 | 249,337 |
| NMI Holdings, Inc., Class A * | 35,010 | 992,183 |
| Northfield Bancorp, Inc. | 25,893 | 401,859 |
| Northwest Bancshares, Inc. | 56,070 | 886,467 |
| OceanFirst Financial Corp. | 23,217 | 488,021 |
| Ocwen Financial Corp. * | 55,405 | 99,175 |
| OFG Bancorp | 21,506 | 441,303 |
| Old National Bancorp | 77,115 | 1,295,532 |
| Opus Bank | 9,917 | 205,877 |
| Origin Bancorp, Inc. | 3,236 | 103,681 |
| Oritani Financial Corp. | 18,686 | 320,091 |
| Pacific Premier Bancorp, Inc. | 24,198 | 712,873 |
| PacWest Bancorp | 61,810 | 2,106,485 |
| Park National Corp. | 7,773 | 700,192 |
| Peapack Gladstone Financial Corp. | 8,414 | 236,686 |
| People's United Financial, Inc. | 200,607 | 2,882,723 |
| People's Utah Bancorp | 9,016 | 238,924 |
| Peoples Bancorp, Inc. | 9,918 | 304,582 |
| Peoples Financial Services Corp. | 4,249 | 190,228 |
| Pinnacle Financial Partners, Inc. | 37,141 | 1,956,216 |
| Popular, Inc. | 49,050 | 2,578,559 |
| Preferred Bank | 7,209 | 360,162 |
| Prosperity Bancshares, Inc. | 33,592 | 2,180,793 |
| Provident Financial Services, Inc. | 31,352 | 746,491 |
| Security | Number of Shares | Value ($) |
| QCR Holdings, Inc. | 6,275 | 221,570 |
| Radian Group, Inc. | 105,339 | 2,375,394 |
| Regions Financial Corp. | 519,397 | 7,593,584 |
| Renasant Corp. | 24,432 | 801,125 |
| Republic Bancorp, Inc., Class A | 5,421 | 230,121 |
| S&T Bancorp, Inc. | 17,609 | 602,580 |
| Sandy Spring Bancorp, Inc. | 18,282 | 612,081 |
| Seacoast Banking Corp. of Florida * | 25,698 | 599,791 |
| ServisFirst Bancshares, Inc. | 24,307 | 738,933 |
| Signature Bank | 28,103 | 3,278,215 |
| Simmons First National Corp., Class A | 48,419 | 1,162,056 |
| South State Corp. | 18,142 | 1,334,888 |
| Southside Bancshares, Inc. | 16,287 | 536,331 |
| Sterling Bancorp | 107,717 | 2,054,163 |
| Sterling Bancorp, Inc. | 10,126 | 94,476 |
| Stock Yards Bancorp, Inc. | 11,365 | 412,550 |
| SunTrust Banks, Inc. | 227,206 | 13,975,441 |
| SVB Financial Group * | 26,884 | 5,232,164 |
| Synovus Financial Corp. | 81,064 | 2,881,015 |
| TCF Financial Corp. | 80,749 | 3,113,681 |
| Texas Capital Bancshares, Inc. * | 25,806 | 1,390,427 |
| TFS Financial Corp. | 26,455 | 463,227 |
| The Bancorp, Inc. * | 32,433 | 296,113 |
| The First of Long Island Corp. | 13,156 | 286,275 |
| The PNC Financial Services Group, Inc. | 231,056 | 29,790,050 |
| Tompkins Financial Corp. | 6,143 | 485,911 |
| Towne Bank | 33,586 | 882,304 |
| TriCo Bancshares | 14,454 | 511,093 |
| TriState Capital Holdings, Inc. * | 11,242 | 222,030 |
| Triumph Bancorp, Inc. * | 12,671 | 380,003 |
| TrustCo Bank Corp. | 51,430 | 394,468 |
| Trustmark Corp. | 32,117 | 1,049,584 |
| U.S. Bancorp | 767,022 | 40,414,389 |
| UMB Financial Corp. | 22,255 | 1,386,932 |
| Umpqua Holdings Corp. | 112,926 | 1,774,067 |
| United Bankshares, Inc. | 51,905 | 1,914,256 |
| United Community Banks, Inc. | 40,668 | 1,074,042 |
| United Financial Bancorp, Inc. | 25,894 | 323,675 |
| Univest Financial Corp. | 15,211 | 384,990 |
| Valley National Bancorp | 171,101 | 1,798,272 |
| Veritex Holdings, Inc. | 24,917 | 588,041 |
| Walker & Dunlop, Inc. | 14,206 | 793,547 |
| Washington Federal, Inc. | 41,309 | 1,470,600 |
| Washington Trust Bancorp, Inc. | 7,672 | 355,981 |
| Waterstone Financial, Inc. | 14,489 | 240,373 |
| Webster Financial Corp. | 47,194 | 2,112,403 |
| Wells Fargo & Co. | 2,071,190 | 96,455,318 |
| WesBanco, Inc. | 28,164 | 963,772 |
| Westamerica Bancorp | 13,763 | 847,938 |
| Western Alliance Bancorp | 49,379 | 2,144,036 |
| Wintrust Financial Corp. | 28,757 | 1,806,802 |
| WSFS Financial Corp. | 27,756 | 1,144,102 |
| Zions Bancorp NA | 93,071 | 3,824,287 |
| 818,063,633 | ||
| Capital Goods 6.9% | ||
| 3M Co. | 294,970 | 47,702,548 |
| A.O. Smith Corp. | 72,753 | 3,384,470 |
| AAON, Inc. | 20,231 | 970,481 |
| AAR Corp. | 17,068 | 733,241 |
| Actuant Corp., Class A | 32,396 | 719,515 |
| Acuity Brands, Inc. | 20,579 | 2,580,812 |
| Advanced Drainage Systems, Inc. | 22,345 | 701,410 |
| AECOM * | 80,758 | 2,865,294 |
| Aegion Corp. * | 14,931 | 294,738 |
| Aerojet Rocketdyne Holdings, Inc. * | 36,716 | 1,917,677 |
| AeroVironment, Inc. * | 10,602 | 546,321 |
| Security | Number of Shares | Value ($) |
| AGCO Corp. | 32,829 | 2,269,140 |
| Air Lease Corp. | 52,415 | 2,177,319 |
| Aircastle Ltd. | 27,175 | 593,774 |
| Alamo Group, Inc. | 4,684 | 534,819 |
| Albany International Corp., Class A | 16,002 | 1,315,684 |
| Allegion plc | 48,144 | 4,634,823 |
| Allison Transmission Holdings, Inc. | 61,101 | 2,714,717 |
| Altra Industrial Motion Corp. | 34,196 | 888,754 |
| Ameresco, Inc., Class A * | 10,989 | 158,242 |
| American Woodmark Corp. * | 7,777 | 640,591 |
| AMETEK, Inc. | 116,098 | 9,976,301 |
| Apogee Enterprises, Inc. | 13,212 | 487,919 |
| Applied Industrial Technologies, Inc. | 20,475 | 1,093,160 |
| Arconic, Inc. | 205,415 | 5,307,924 |
| Arcosa, Inc. | 24,629 | 800,196 |
| Argan, Inc. | 6,878 | 284,130 |
| Armstrong Flooring, Inc. * | 14,969 | 101,340 |
| Armstrong World Industries, Inc. | 25,326 | 2,417,873 |
| Astec Industries, Inc. | 11,276 | 311,218 |
| Astronics Corp. * | 15,096 | 415,291 |
| Atkore International Group, Inc. * | 23,599 | 684,607 |
| Axon Enterprise, Inc. * | 30,742 | 1,843,598 |
| AZZ, Inc. | 12,829 | 529,453 |
| Babcock & Wilcox Enterprises, Inc. *(a) | 14,424 | 53,080 |
| Barnes Group, Inc. | 23,614 | 1,059,088 |
| Beacon Roofing Supply, Inc. * | 34,730 | 1,107,192 |
| BMC Stock Holdings, Inc. * | 33,337 | 847,760 |
| Briggs & Stratton Corp. | 21,576 | 93,208 |
| Builders FirstSource, Inc. * | 60,828 | 1,183,105 |
| BWX Technologies, Inc. | 48,557 | 2,874,574 |
| CAI International, Inc. * | 9,285 | 196,656 |
| Carlisle Cos., Inc. | 29,226 | 4,236,601 |
| Caterpillar, Inc. | 293,790 | 34,961,010 |
| Chart Industries, Inc. * | 18,253 | 1,147,019 |
| CIRCOR International, Inc. * | 9,998 | 343,631 |
| Colfax Corp. * | 48,864 | 1,329,101 |
| Columbus McKinnon Corp. | 11,071 | 358,368 |
| Comfort Systems USA, Inc. | 18,151 | 701,718 |
| Continental Building Products, Inc. * | 18,695 | 469,992 |
| Cornerstone Building Brands, Inc. * | 20,200 | 94,738 |
| Crane Co. | 25,602 | 1,951,896 |
| CSW Industrials, Inc. | 7,836 | 534,494 |
| Cubic Corp. | 14,198 | 983,495 |
| Cummins, Inc. | 75,160 | 11,219,133 |
| Curtiss-Wright Corp. | 22,078 | 2,707,646 |
| Deere & Co. | 162,848 | 25,226,784 |
| Donaldson Co., Inc. | 64,633 | 3,125,652 |
| Douglas Dynamics, Inc. | 12,307 | 513,940 |
| Dover Corp. | 73,361 | 6,876,860 |
| DXP Enterprises, Inc. * | 7,495 | 243,213 |
| Dycom Industries, Inc. * | 16,501 | 734,294 |
| Eaton Corp. plc | 217,734 | 17,575,488 |
| EMCOR Group, Inc. | 28,699 | 2,509,441 |
| Emerson Electric Co. | 315,053 | 18,774,008 |
| Encore Wire Corp. | 10,293 | 555,719 |
| Energy Recovery, Inc. * | 16,100 | 155,687 |
| EnerSys | 22,536 | 1,262,016 |
| EnPro Industries, Inc. | 10,542 | 656,556 |
| ESCO Technologies, Inc. | 13,324 | 1,014,356 |
| Evoqua Water Technologies Corp. * | 29,952 | 463,058 |
| Fastenal Co. | 293,235 | 8,978,856 |
| Federal Signal Corp. | 29,915 | 888,775 |
| Flowserve Corp. | 67,109 | 2,864,212 |
| Fluor Corp. | 71,437 | 1,262,292 |
| Fortive Corp. | 150,045 | 10,638,190 |
| Fortune Brands Home & Security, Inc. | 71,501 | 3,650,841 |
| Foundation Building Materials, Inc. * | 8,050 | 137,897 |
| Franklin Electric Co., Inc. | 19,657 | 901,273 |
| Security | Number of Shares | Value ($) |
| Gardner Denver Holdings, Inc. * | 66,944 | 1,919,954 |
| Gates Industrial Corp. plc * | 24,098 | 209,653 |
| GATX Corp. | 18,463 | 1,370,324 |
| Generac Holdings, Inc. * | 31,768 | 2,477,586 |
| General Dynamics Corp. | 139,122 | 26,609,865 |
| General Electric Co. | 4,470,162 | 36,878,836 |
| Gibraltar Industries, Inc. * | 16,190 | 651,971 |
| GMS, Inc. * | 18,560 | 546,778 |
| Graco, Inc. | 85,425 | 3,892,817 |
| GrafTech International Ltd. | 31,604 | 385,253 |
| Graham Corp. | 5,408 | 99,561 |
| Granite Construction, Inc. | 23,632 | 672,094 |
| Great Lakes Dredge & Dock Corp. * | 32,512 | 352,430 |
| Griffon Corp. | 18,862 | 329,142 |
| H&E Equipment Services, Inc. | 17,554 | 426,387 |
| Harsco Corp. * | 41,903 | 750,064 |
| HD Supply Holdings, Inc. * | 87,010 | 3,385,559 |
| HEICO Corp. | 21,719 | 3,142,088 |
| HEICO Corp., Class A | 36,327 | 4,009,048 |
| Helios Technologies, Inc. | 15,091 | 645,744 |
| Herc Holdings, Inc. * | 11,782 | 486,361 |
| Hexcel Corp. | 43,126 | 3,629,053 |
| Hillenbrand, Inc. | 33,111 | 908,566 |
| Honeywell International, Inc. | 372,212 | 61,273,539 |
| Hubbell, Inc. | 27,141 | 3,559,271 |
| Huntington Ingalls Industries, Inc. | 21,248 | 4,440,832 |
| Hyster-Yale Materials Handling, Inc. | 4,925 | 268,659 |
| IDEX Corp. | 39,327 | 6,477,550 |
| Illinois Tool Works, Inc. | 153,683 | 23,030,934 |
| Ingersoll-Rand plc | 123,227 | 14,921,557 |
| Insteel Industries, Inc. | 9,116 | 170,469 |
| ITT, Inc. | 44,587 | 2,537,892 |
| Jacobs Engineering Group, Inc. | 58,882 | 5,232,255 |
| JELD-WEN Holding, Inc. * | 33,565 | 579,332 |
| John Bean Technologies Corp. | 16,140 | 1,651,445 |
| Johnson Controls International plc | 408,243 | 17,427,894 |
| Kadant, Inc. | 5,971 | 491,354 |
| Kaman Corp. | 14,544 | 849,224 |
| Kennametal, Inc. | 42,107 | 1,258,578 |
| Kratos Defense & Security Solutions, Inc. * | 47,192 | 942,424 |
| L.B. Foster Co., Class A * | 5,764 | 114,761 |
| L3Harris Technologies, Inc. | 113,308 | 23,954,444 |
| Lennox International, Inc. | 18,016 | 4,572,100 |
| Lincoln Electric Holdings, Inc. | 32,590 | 2,690,630 |
| Lindsay Corp. | 5,871 | 518,174 |
| Lockheed Martin Corp. | 125,734 | 48,295,687 |
| Lydall, Inc. * | 7,818 | 157,220 |
| Masco Corp. | 150,632 | 6,135,241 |
| Masonite International Corp. * | 13,509 | 721,246 |
| MasTec, Inc. * | 31,796 | 1,999,015 |
| Mercury Systems, Inc. * | 28,909 | 2,475,478 |
| Meritor, Inc. * | 43,324 | 728,710 |
| Milacron Holdings Corp. * | 34,253 | 542,910 |
| Moog, Inc., Class A | 16,527 | 1,342,819 |
| MRC Global, Inc. * | 43,180 | 542,773 |
| MSC Industrial Direct Co., Inc., Class A | 22,810 | 1,542,412 |
| Mueller Industries, Inc. | 28,788 | 758,852 |
| Mueller Water Products, Inc., Class A | 78,844 | 824,708 |
| MYR Group, Inc. * | 7,771 | 222,795 |
| National Presto Industries, Inc. | 3,050 | 261,415 |
| Navistar International Corp. * | 33,371 | 767,533 |
| NN, Inc. | 23,919 | 153,560 |
| Nordson Corp. | 26,741 | 3,635,706 |
| Northrop Grumman Corp. | 86,979 | 31,996,965 |
| NOW, Inc. * | 56,798 | 675,328 |
| NV5 Global, Inc. * | 4,672 | 288,403 |
| nVent Electric plc | 80,192 | 1,624,690 |
| Security | Number of Shares | Value ($) |
| Omega Flex, Inc. | 1,630 | 137,246 |
| Oshkosh Corp. | 35,420 | 2,488,963 |
| Owens Corning | 56,197 | 3,223,460 |
| PACCAR, Inc. | 178,618 | 11,710,196 |
| Park Aerospace Corp. | 12,184 | 205,910 |
| Park-Ohio Holdings Corp. | 4,944 | 134,427 |
| Parker-Hannifin Corp. | 65,524 | 10,861,913 |
| Parsons Corp. * | 9,574 | 325,707 |
| Patrick Industries, Inc. * | 11,979 | 432,921 |
| Pentair plc | 80,353 | 2,886,280 |
| PGT Innovations, Inc. * | 30,891 | 494,256 |
| Plug Power, Inc. *(a) | 132,642 | 287,833 |
| Powell Industries, Inc. | 5,767 | 209,457 |
| Preformed Line Products Co. | 1,622 | 83,128 |
| Primoris Services Corp. | 21,733 | 424,663 |
| Proto Labs, Inc. * | 13,822 | 1,309,496 |
| Quanex Building Products Corp. | 17,112 | 294,669 |
| Quanta Services, Inc. | 72,844 | 2,469,412 |
| Raven Industries, Inc. | 18,256 | 532,528 |
| Raytheon Co. | 142,789 | 26,461,657 |
| RBC Bearings, Inc. * | 12,801 | 2,042,144 |
| Regal Beloit Corp. | 21,869 | 1,550,512 |
| Resideo Technologies, Inc. * | 62,103 | 855,779 |
| REV Group, Inc. | 17,880 | 230,473 |
| Rexnord Corp. * | 53,501 | 1,400,656 |
| Rockwell Automation, Inc. | 60,602 | 9,259,380 |
| Roper Technologies, Inc. | 53,127 | 19,484,859 |
| Rush Enterprises, Inc., Class A | 13,872 | 500,918 |
| Rush Enterprises, Inc., Class B | 3,444 | 128,048 |
| Sensata Technologies Holding plc * | 82,272 | 3,749,958 |
| Simpson Manufacturing Co., Inc. | 20,778 | 1,333,948 |
| SiteOne Landscape Supply, Inc. * | 21,655 | 1,693,421 |
| Snap-on, Inc. | 28,342 | 4,213,889 |
| Spirit AeroSystems Holdings, Inc., Class A | 53,515 | 4,313,309 |
| SPX Corp. * | 22,089 | 838,278 |
| SPX FLOW, Inc. * | 22,020 | 742,294 |
| Standex International Corp. | 6,353 | 436,769 |
| Stanley Black & Decker, Inc. | 76,789 | 10,202,187 |
| Sunrun, Inc. * | 42,188 | 646,742 |
| Systemax, Inc. | 8,857 | 177,760 |
| Teledyne Technologies, Inc. * | 18,541 | 5,721,567 |
| Tennant Co. | 9,575 | 654,834 |
| Terex Corp. | 31,839 | 790,562 |
| Textron, Inc. | 117,068 | 5,268,060 |
| The Boeing Co. | 267,831 | 97,514,589 |
| The Gorman-Rupp Co. | 10,714 | 320,027 |
| The Greenbrier Cos., Inc. | 16,061 | 374,061 |
| The Manitowoc Co., Inc. * | 17,938 | 224,225 |
| The Middleby Corp. * | 29,417 | 3,225,868 |
| The Timken Co. | 35,285 | 1,417,751 |
| The Toro Co. | 55,683 | 4,009,733 |
| Thermon Group Holdings, Inc. * | 16,242 | 353,263 |
| Titan International, Inc. | 35,126 | 91,328 |
| Titan Machinery, Inc. * | 10,142 | 152,739 |
| TPI Composites, Inc. * | 8,773 | 154,756 |
| TransDigm Group, Inc. | 25,130 | 13,527,982 |
| Trex Co., Inc. * | 29,872 | 2,554,952 |
| TriMas Corp. * | 22,411 | 658,435 |
| Trinity Industries, Inc. | 68,264 | 1,192,572 |
| Triton International Ltd. | 29,671 | 953,923 |
| Triumph Group, Inc. | 26,444 | 549,506 |
| Tutor Perini Corp. * | 21,479 | 214,575 |
| United Rentals, Inc. * | 40,497 | 4,558,342 |
| United Technologies Corp. | 415,635 | 54,132,302 |
| Univar, Inc. * | 68,321 | 1,322,011 |
| Universal Forest Products, Inc. | 31,076 | 1,215,072 |
| Valmont Industries, Inc. | 11,224 | 1,520,852 |
| Security | Number of Shares | Value ($) |
| Veritiv Corp. * | 4,876 | 80,747 |
| Vicor Corp. * | 9,710 | 296,058 |
| Vivint Solar, Inc. * | 25,919 | 208,907 |
| W.W. Grainger, Inc. | 22,994 | 6,292,308 |
| Wabash National Corp. | 30,140 | 411,110 |
| WABCO Holdings, Inc. * | 26,011 | 3,472,729 |
| Wabtec Corp. | 93,347 | 6,460,546 |
| Watsco, Inc. | 15,965 | 2,611,076 |
| Watts Water Technologies, Inc., Class A | 13,162 | 1,206,034 |
| Welbilt, Inc. * | 65,507 | 1,031,080 |
| Wesco Aircraft Holdings, Inc. * | 27,892 | 306,812 |
| WESCO International, Inc. * | 22,996 | 1,036,660 |
| WillScot Corp. * | 19,336 | 269,737 |
| Woodward, Inc. | 28,478 | 3,071,352 |
| Xylem, Inc. | 90,838 | 6,959,099 |
| 1,021,659,799 | ||
| Commercial & Professional Services 1.2% | ||
| ABM Industries, Inc. | 34,074 | 1,269,597 |
| Acacia Research Corp. * | 22,982 | 59,983 |
| ACCO Brands Corp. | 52,412 | 485,859 |
| ADT, Inc.(a) | 65,964 | 313,989 |
| Advanced Disposal Services, Inc. * | 38,039 | 1,233,224 |
| ASGN, Inc. * | 27,216 | 1,700,184 |
| Barrett Business Services, Inc. | 3,846 | 335,102 |
| Brady Corp., Class A | 25,409 | 1,199,559 |
| BrightView Holdings, Inc. * | 10,396 | 190,559 |
| Casella Waste Systems, Inc., Class A * | 21,326 | 970,333 |
| CBIZ, Inc. * | 28,789 | 643,146 |
| Cintas Corp. | 43,428 | 11,456,306 |
| Clean Harbors, Inc. * | 25,602 | 1,883,027 |
| Copart, Inc. * | 102,802 | 7,750,243 |
| CoStar Group, Inc. * | 18,770 | 11,541,110 |
| Covanta Holding Corp. | 60,594 | 1,042,217 |
| Deluxe Corp. | 22,189 | 1,022,469 |
| Ennis, Inc. | 13,731 | 276,130 |
| Equifax, Inc. | 61,693 | 9,030,621 |
| Exponent, Inc. | 26,277 | 1,862,777 |
| Forrester Research, Inc. | 4,776 | 166,539 |
| Franklin Covey Co. * | 5,251 | 193,184 |
| FTI Consulting, Inc. * | 19,887 | 2,150,580 |
| GP Strategies Corp. * | 9,058 | 116,667 |
| Healthcare Services Group, Inc. | 37,248 | 839,942 |
| Heidrick & Struggles International, Inc. | 9,193 | 244,074 |
| Heritage-Crystal Clean, Inc. * | 8,542 | 209,279 |
| Herman Miller, Inc. | 30,020 | 1,269,246 |
| HNI Corp. | 21,803 | 680,036 |
| Huron Consulting Group, Inc. * | 11,562 | 707,710 |
| IAA, Inc. * | 66,270 | 3,237,290 |
| ICF International, Inc. | 9,750 | 825,435 |
| IHS Markit Ltd. * | 185,636 | 12,179,578 |
| InnerWorkings, Inc. * | 21,925 | 92,962 |
| Insperity, Inc. | 19,021 | 1,884,220 |
| Interface, Inc. | 33,665 | 371,998 |
| KAR Auction Services, Inc. | 66,615 | 1,769,294 |
| Kelly Services, Inc., Class A | 15,904 | 385,036 |
| Kforce, Inc. | 10,935 | 355,825 |
| Kimball International, Inc., Class B | 19,170 | 336,434 |
| Knoll, Inc. | 25,802 | 594,994 |
| Korn Ferry | 29,236 | 1,142,543 |
| ManpowerGroup, Inc. | 30,776 | 2,515,630 |
| Matthews International Corp., Class A | 17,068 | 500,263 |
| McGrath RentCorp | 12,431 | 795,957 |
| Mistras Group, Inc. * | 9,753 | 142,394 |
| Mobile Mini, Inc. | 22,992 | 718,730 |
| MSA Safety, Inc. | 18,038 | 1,905,354 |
| Navigant Consulting, Inc. | 19,996 | 557,289 |
| Security | Number of Shares | Value ($) |
| Nielsen Holdings plc | 182,008 | 3,778,486 |
| PICO Holdings, Inc. * | 12,995 | 125,142 |
| Pitney Bowes, Inc. | 92,353 | 328,777 |
| Quad/Graphics, Inc. | 14,628 | 131,506 |
| Republic Services, Inc. | 111,365 | 9,939,326 |
| Resources Connection, Inc. | 13,462 | 222,796 |
| Robert Half International, Inc. | 60,544 | 3,237,288 |
| Rollins, Inc. | 77,932 | 2,556,949 |
| SP Plus Corp. * | 12,971 | 447,629 |
| Steelcase, Inc., Class A | 47,267 | 734,057 |
| Stericycle, Inc. * | 44,115 | 1,980,322 |
| Team, Inc. * | 14,225 | 234,428 |
| Tetra Tech, Inc. | 28,543 | 2,315,408 |
| The Brink's Co. | 25,602 | 1,926,551 |
| TransUnion | 96,437 | 8,066,955 |
| TriNet Group, Inc. * | 21,695 | 1,456,385 |
| TrueBlue, Inc. * | 20,003 | 388,258 |
| UniFirst Corp. | 7,981 | 1,563,558 |
| Upwork, Inc. * | 30,072 | 434,841 |
| US Ecology, Inc. | 11,953 | 723,993 |
| Verisk Analytics, Inc. | 84,461 | 13,643,830 |
| Viad Corp. | 10,434 | 674,349 |
| VSE Corp. | 4,691 | 149,361 |
| Waste Management, Inc. | 200,971 | 23,985,889 |
| 170,201,002 | ||
| Consumer Durables & Apparel 1.3% | ||
| Acushnet Holdings Corp. | 17,334 | 450,164 |
| American Outdoor Brands Corp. * | 28,595 | 171,856 |
| Beazer Homes USA, Inc. * | 18,668 | 233,910 |
| Brunswick Corp. | 44,858 | 2,090,383 |
| Callaway Golf Co. | 46,603 | 827,669 |
| Capri Holdings Ltd. * | 80,006 | 2,110,558 |
| Carter's, Inc. | 23,019 | 2,105,778 |
| Cavco Industries, Inc. * | 4,411 | 809,286 |
| Century Communities, Inc. * | 15,109 | 425,772 |
| Columbia Sportswear Co. | 15,169 | 1,422,701 |
| Crocs, Inc. * | 35,147 | 783,778 |
| D.R. Horton, Inc. | 173,469 | 8,581,511 |
| Deckers Outdoor Corp. * | 15,037 | 2,217,206 |
| Ethan Allen Interiors, Inc. | 12,744 | 219,197 |
| Fossil Group, Inc. * | 19,729 | 252,531 |
| G-III Apparel Group Ltd. * | 22,224 | 455,814 |
| Garmin Ltd. | 62,016 | 5,058,645 |
| GoPro, Inc., Class A * | 80,684 | 312,247 |
| Hanesbrands, Inc. | 184,508 | 2,520,379 |
| Hasbro, Inc. | 58,941 | 6,511,212 |
| Helen of Troy Ltd. * | 12,869 | 1,975,520 |
| Installed Building Products, Inc. * | 10,766 | 612,693 |
| iRobot Corp. * | 14,330 | 885,737 |
| Johnson Outdoors, Inc., Class A | 3,145 | 176,120 |
| KB Home | 44,580 | 1,252,252 |
| Kontoor Brands, Inc. * | 23,660 | 810,118 |
| La-Z-Boy, Inc. | 23,683 | 754,777 |
| Legacy Housing Corp. * | 2,600 | 38,402 |
| Leggett & Platt, Inc. | 66,494 | 2,472,912 |
| Lennar Corp., B Shares | 9,493 | 384,561 |
| Lennar Corp., Class A | 144,761 | 7,382,811 |
| Levi Strauss & Co., Class A * | 21,792 | 368,285 |
| LGI Homes, Inc. * | 9,413 | 767,254 |
| Lululemon Athletica, Inc. * | 54,217 | 10,012,253 |
| M.D.C Holdings, Inc. | 25,744 | 995,521 |
| M/I Homes, Inc. * | 13,060 | 471,988 |
| Malibu Boats, Inc., Class A * | 11,075 | 308,107 |
| Marine Products Corp. | 4,255 | 64,378 |
| Mattel, Inc. * | 178,083 | 1,745,213 |
| Meritage Homes Corp. * | 18,207 | 1,189,645 |
| Security | Number of Shares | Value ($) |
| Mohawk Industries, Inc. * | 30,816 | 3,663,714 |
| Movado Group, Inc. | 8,907 | 191,679 |
| Nautilus, Inc. * | 31,736 | 44,113 |
| Newell Brands, Inc. | 199,212 | 3,306,919 |
| NIKE, Inc., Class B | 643,408 | 54,367,976 |
| NVR, Inc. * | 1,802 | 6,485,398 |
| Oxford Industries, Inc. | 8,536 | 595,642 |
| Polaris, Inc. | 29,053 | 2,382,927 |
| PulteGroup, Inc. | 127,322 | 4,303,484 |
| PVH Corp. | 38,786 | 2,939,979 |
| Ralph Lauren Corp. | 27,049 | 2,389,509 |
| Roku, Inc. * | 42,352 | 6,410,399 |
| Skechers U.S.A., Inc., Class A * | 68,940 | 2,182,640 |
| Skyline Champion Corp. * | 25,491 | 713,748 |
| Sonos, Inc. * | 9,634 | 139,886 |
| Steven Madden Ltd. | 40,771 | 1,354,413 |
| Sturm Ruger & Co., Inc. | 8,911 | 365,440 |
| Tapestry, Inc. | 147,986 | 3,055,911 |
| Taylor Morrison Home Corp., Class A * | 53,952 | 1,287,295 |
| Tempur Sealy International, Inc. * | 23,722 | 1,829,441 |
| Toll Brothers, Inc. | 68,144 | 2,466,131 |
| TopBuild Corp. * | 17,321 | 1,604,271 |
| TRI Pointe Group, Inc. * | 72,387 | 1,013,418 |
| Tupperware Brands Corp. | 24,924 | 324,261 |
| Under Armour, Inc., Class A * | 94,967 | 1,767,336 |
| Under Armour, Inc., Class C * | 101,555 | 1,718,311 |
| Unifi, Inc. * | 6,785 | 130,543 |
| Universal Electronics, Inc. * | 6,330 | 285,800 |
| Vera Bradley, Inc. * | 9,568 | 101,325 |
| VF Corp. | 166,617 | 13,654,263 |
| Vista Outdoor, Inc. * | 27,898 | 155,950 |
| Whirlpool Corp. | 32,511 | 4,521,955 |
| William Lyon Homes, Class A * | 18,066 | 319,226 |
| Wolverine World Wide, Inc. | 44,530 | 1,155,554 |
| YETI Holdings, Inc. *(a) | 15,454 | 436,576 |
| 197,894,577 | ||
| Consumer Services 2.4% | ||
| Adtalem Global Education, Inc. * | 28,339 | 1,210,642 |
| American Public Education, Inc. * | 9,178 | 222,383 |
| Aramark | 125,880 | 5,143,457 |
| BBX Capital Corp. | 37,315 | 154,857 |
| Biglari Holdings, Inc., Class B * | 1,000 | 87,710 |
| BJ's Restaurants, Inc. | 10,369 | 377,846 |
| Bloomin' Brands, Inc. | 46,343 | 836,028 |
| Bluegreen Vacations Corp. | 6,065 | 57,375 |
| Boyd Gaming Corp. | 41,855 | 1,006,194 |
| Bright Horizons Family Solutions, Inc. * | 29,909 | 4,936,480 |
| Brinker International, Inc. | 19,249 | 731,462 |
| Caesars Entertainment Corp. * | 302,224 | 3,478,598 |
| Career Education Corp. * | 36,592 | 750,502 |
| Carnival Corp. | 204,656 | 9,021,236 |
| Carriage Services, Inc. | 9,243 | 196,599 |
| Carrols Restaurant Group, Inc. * | 21,313 | 155,585 |
| Chegg, Inc. * | 55,034 | 2,181,548 |
| Chipotle Mexican Grill, Inc. * | 12,587 | 10,553,193 |
| Choice Hotels International, Inc. | 17,309 | 1,574,773 |
| Churchill Downs, Inc. | 17,818 | 2,196,247 |
| Chuy's Holdings, Inc. * | 9,574 | 242,892 |
| Cracker Barrel Old Country Store, Inc. | 12,553 | 2,076,266 |
| Darden Restaurants, Inc. | 62,203 | 7,525,319 |
| Dave & Buster's Entertainment, Inc. | 19,276 | 829,832 |
| Del Frisco's Restaurant Group, Inc. * | 14,487 | 115,461 |
| Denny's Corp. * | 29,786 | 702,652 |
| Dine Brands Global, Inc. | 8,782 | 619,570 |
| Domino's Pizza, Inc. | 20,847 | 4,728,933 |
| Drive Shack, Inc. * | 38,425 | 180,982 |
| Security | Number of Shares | Value ($) |
| Dunkin' Brands Group, Inc. | 42,025 | 3,464,541 |
| El Pollo Loco Holdings, Inc. * | 13,099 | 133,741 |
| Eldorado Resorts, Inc. * | 33,779 | 1,300,829 |
| Everi Holdings, Inc. * | 35,830 | 320,320 |
| Extended Stay America, Inc. | 97,235 | 1,366,152 |
| Fiesta Restaurant Group, Inc. * | 12,882 | 111,300 |
| frontdoor, Inc. * | 43,062 | 2,210,803 |
| Golden Entertainment, Inc. * | 9,579 | 135,830 |
| Graham Holdings Co., Class B | 2,320 | 1,633,419 |
| Grand Canyon Education, Inc. * | 24,662 | 3,097,547 |
| H&R Block, Inc. | 107,773 | 2,610,262 |
| Hilton Grand Vacations, Inc. * | 46,567 | 1,572,568 |
| Hilton Worldwide Holdings, Inc. | 149,197 | 13,781,327 |
| Houghton Mifflin Harcourt Co. * | 56,069 | 333,611 |
| Hyatt Hotels Corp., Class A | 19,874 | 1,433,909 |
| International Speedway Corp., Class A | 11,378 | 512,238 |
| Jack in the Box, Inc. | 12,867 | 1,097,812 |
| K12, Inc. * | 19,115 | 503,680 |
| Las Vegas Sands Corp. | 186,138 | 10,325,075 |
| Laureate Education, Inc., Class A * | 55,292 | 1,011,844 |
| Lindblad Expeditions Holdings, Inc. * | 15,481 | 288,875 |
| Marriott International, Inc., Class A | 141,673 | 17,859,298 |
| Marriott Vacations Worldwide Corp. | 19,895 | 1,961,448 |
| McDonald's Corp. | 390,840 | 85,191,395 |
| MGM Resorts International | 260,780 | 7,317,487 |
| Monarch Casino & Resort, Inc. * | 6,097 | 270,585 |
| Noodles & Co. * | 19,515 | 112,602 |
| Norwegian Cruise Line Holdings Ltd. * | 108,174 | 5,489,830 |
| OneSpaWorld Holdings Ltd. * | 17,015 | 267,135 |
| Papa John's International, Inc. | 11,998 | 597,020 |
| Penn National Gaming, Inc. * | 54,440 | 1,043,615 |
| Planet Fitness, Inc., Class A * | 43,517 | 3,072,735 |
| Playa Hotels & Resorts N.V. * | 26,358 | 213,236 |
| PlayAGS, Inc. * | 15,653 | 152,460 |
| Potbelly Corp. * | 12,100 | 56,023 |
| Red Robin Gourmet Burgers, Inc. * | 6,833 | 228,837 |
| Red Rock Resorts, Inc., Class A | 35,335 | 736,735 |
| Regis Corp. * | 13,768 | 222,629 |
| Royal Caribbean Cruises Ltd. | 88,192 | 9,196,662 |
| Ruth's Hospitality Group, Inc. | 13,504 | 262,653 |
| Scientific Games Corp., Class A * | 29,861 | 551,831 |
| SeaWorld Entertainment, Inc. * | 20,625 | 598,331 |
| Service Corp. International | 92,662 | 4,290,251 |
| ServiceMaster Global Holdings, Inc. * | 70,051 | 3,995,709 |
| Shake Shack, Inc., Class A * | 14,000 | 1,388,240 |
| Six Flags Entertainment Corp. | 36,443 | 2,156,332 |
| Sotheby's * | 16,133 | 931,681 |
| Speedway Motorsports, Inc. | 7,758 | 153,221 |
| Starbucks Corp. | 620,401 | 59,905,921 |
| Strategic Education, Inc. | 11,143 | 1,885,730 |
| Target Hospitality Corp. * | 16,431 | 100,229 |
| Texas Roadhouse, Inc. | 33,733 | 1,735,900 |
| The Cheesecake Factory, Inc. | 21,777 | 827,308 |
| The Habit Restaurants, Inc., Class A * | 20,518 | 179,738 |
| The Wendy's Co. | 91,450 | 2,011,900 |
| Vail Resorts, Inc. | 20,588 | 4,864,533 |
| Weight Watchers International, Inc. * | 19,528 | 585,645 |
| Wingstop, Inc. | 14,845 | 1,487,024 |
| Wyndham Destinations, Inc. | 47,227 | 2,094,045 |
| Wyndham Hotels & Resorts, Inc. | 50,318 | 2,585,339 |
| Wynn Resorts Ltd. | 49,506 | 5,453,086 |
| Yum! Brands, Inc. | 157,209 | 18,358,867 |
| 359,533,551 | ||
| Diversified Financials 5.0% | ||
| Affiliated Managers Group, Inc. | 26,759 | 2,050,542 |
| AG Mortgage Investment Trust, Inc. | 18,224 | 273,178 |
| Security | Number of Shares | Value ($) |
| AGNC Investment Corp. | 276,316 | 4,108,819 |
| Ally Financial, Inc. | 202,975 | 6,363,266 |
| American Express Co. | 350,802 | 42,226,037 |
| Ameriprise Financial, Inc. | 68,596 | 8,847,512 |
| Annaly Capital Management, Inc. | 749,726 | 6,222,726 |
| Anworth Mortgage Asset Corp. | 52,161 | 161,699 |
| Apollo Commercial Real Estate Finance, Inc. | 69,332 | 1,286,109 |
| Arbor Realty Trust, Inc.(a) | 42,970 | 539,274 |
| Ares Management Corp., Class A | 34,840 | 1,013,844 |
| Arlington Asset Investment Corp., Class A | 20,988 | 103,681 |
| ARMOUR Residential REIT, Inc. | 26,863 | 441,090 |
| Artisan Partners Asset Management, Inc., Class A | 27,430 | 730,735 |
| AXA Equitable Holdings, Inc. | 127,574 | 2,649,712 |
| Berkshire Hathaway, Inc., Class B * | 992,608 | 201,906,393 |
| BGC Partners, Inc., Class A | 142,423 | 726,357 |
| BlackRock, Inc. | 60,956 | 25,757,567 |
| Blackstone Mortgage Trust, Inc., Class A | 68,637 | 2,388,568 |
| Blucora, Inc. * | 24,285 | 548,355 |
| Cannae Holdings, Inc. * | 35,538 | 988,667 |
| Capital One Financial Corp. | 240,804 | 20,858,443 |
| Capstead Mortgage Corp. | 44,617 | 324,366 |
| Cboe Global Markets, Inc. | 57,647 | 6,869,217 |
| Chimera Investment Corp. | 94,539 | 1,802,859 |
| CME Group, Inc. | 183,243 | 39,816,871 |
| Cohen & Steers, Inc. | 11,055 | 596,196 |
| Colony Credit Real Estate, Inc. | 44,089 | 552,435 |
| Cowen, Inc., Class A * | 13,851 | 216,214 |
| Credit Acceptance Corp. * | 6,263 | 2,834,947 |
| Curo Group Holdings Corp. * | 6,685 | 91,050 |
| Diamond Hill Investment Group, Inc. | 1,801 | 242,955 |
| Discover Financial Services | 165,500 | 13,235,035 |
| Donnelley Financial Solutions, Inc. * | 19,445 | 206,700 |
| Dynex Capital, Inc. | 12,202 | 172,292 |
| E*TRADE Financial Corp. | 125,767 | 5,249,515 |
| Eaton Vance Corp. | 58,034 | 2,502,426 |
| Ellington Financial, Inc. | 13,128 | 229,346 |
| Encore Capital Group, Inc. * | 14,277 | 526,821 |
| Enova International, Inc. * | 18,896 | 451,614 |
| Evercore, Inc., Class A | 21,421 | 1,708,539 |
| Exantas Capital Corp. | 14,245 | 159,686 |
| EZCORP, Inc., Class A * | 30,774 | 242,191 |
| FactSet Research Systems, Inc. | 19,686 | 5,356,364 |
| Federated Investors, Inc., Class B | 49,064 | 1,572,011 |
| FGL Holdings | 88,199 | 703,828 |
| FirstCash, Inc. | 21,937 | 2,165,840 |
| Focus Financial Partners, Inc., Class A * | 11,304 | 231,958 |
| Franklin Resources, Inc. | 149,860 | 3,938,321 |
| GAMCO Investors, Inc., Class A | 3,329 | 58,823 |
| Granite Point Mortgage Trust, Inc. | 26,539 | 485,398 |
| Green Dot Corp., Class A * | 23,952 | 732,452 |
| Greenhill & Co., Inc. | 9,172 | 128,775 |
| Hamilton Lane, Inc., Class A | 9,099 | 565,412 |
| Houlihan Lokey, Inc. | 18,272 | 807,257 |
| Interactive Brokers Group, Inc., Class A | 38,502 | 1,817,294 |
| Intercontinental Exchange, Inc. | 289,777 | 27,088,354 |
| INTL FCStone, Inc. * | 8,726 | 342,146 |
| Invesco Ltd. | 206,743 | 3,245,865 |
| Invesco Mortgage Capital, Inc. | 65,995 | 991,905 |
| Janus Henderson Group plc | 84,161 | 1,608,317 |
| Jefferies Financial Group, Inc. | 130,443 | 2,431,458 |
| KKR & Co., Inc., Class A | 279,115 | 7,212,332 |
| KKR Real Estate Finance Trust, Inc. | 13,955 | 263,889 |
| Ladder Capital Corp., Class A | 43,586 | 731,373 |
| Ladenburg Thalmann Financial Services, Inc. | 52,163 | 102,240 |
| Security | Number of Shares | Value ($) |
| Lazard Ltd., Class A | 66,298 | 2,276,673 |
| Legg Mason, Inc. | 45,375 | 1,669,346 |
| LendingClub Corp. * | 43,726 | 572,373 |
| LPL Financial Holdings, Inc. | 42,501 | 3,185,450 |
| MarketAxess Holdings, Inc. | 19,223 | 7,643,449 |
| MFA Financial, Inc. | 226,082 | 1,621,008 |
| Moelis & Co., Class A | 25,553 | 856,792 |
| Moody's Corp. | 84,354 | 18,185,035 |
| Morgan Stanley | 654,704 | 27,163,669 |
| Morningstar, Inc. | 9,353 | 1,511,258 |
| MSCI, Inc. | 43,382 | 10,178,719 |
| Nasdaq, Inc. | 59,081 | 5,898,647 |
| Navient Corp. | 109,632 | 1,396,712 |
| Nelnet, Inc., Class A | 10,764 | 721,726 |
| New Residential Investment Corp. | 213,639 | 3,005,901 |
| New York Mortgage Trust, Inc. | 107,549 | 661,426 |
| Northern Trust Corp. | 111,495 | 9,803,755 |
| OneMain Holdings, Inc. | 39,683 | 1,422,636 |
| PennyMac Mortgage Investment Trust | 39,029 | 849,271 |
| Piper Jaffray Cos. | 7,407 | 538,933 |
| PJT Partners, Inc., Class A | 10,275 | 427,543 |
| PRA Group, Inc. * | 24,524 | 837,249 |
| Pzena Investment Management, Inc., Class A | 8,652 | 70,341 |
| Raymond James Financial, Inc. | 64,607 | 5,072,296 |
| Redwood Trust, Inc. | 51,399 | 853,223 |
| S&P Global, Inc. | 126,146 | 32,821,928 |
| Safeguard Scientifics, Inc. * | 8,891 | 106,336 |
| Santander Consumer USA Holdings, Inc. | 57,750 | 1,507,853 |
| SEI Investments Co. | 67,013 | 3,853,918 |
| SLM Corp. | 225,188 | 1,900,587 |
| Starwood Property Trust, Inc. | 141,944 | 3,325,748 |
| State Street Corp. | 191,196 | 9,810,267 |
| Stifel Financial Corp. | 36,534 | 1,951,646 |
| Synchrony Financial | 324,306 | 10,394,007 |
| T. Rowe Price Group, Inc. | 121,298 | 13,417,985 |
| TD Ameritrade Holding Corp. | 135,976 | 6,038,694 |
| The Bank of New York Mellon Corp. | 452,988 | 19,052,675 |
| The Charles Schwab Corp.(b) | 604,078 | 23,118,065 |
| The Goldman Sachs Group, Inc. | 174,035 | 35,487,477 |
| TPG RE Finance Trust, Inc. | 27,886 | 541,267 |
| Tradeweb Markets, Inc., Class A | 23,624 | 1,006,146 |
| Two Harbors Investment Corp. | 143,624 | 1,813,971 |
| Virtu Financial, Inc., Class A | 30,673 | 576,652 |
| Virtus Investment Partners, Inc. | 3,653 | 389,739 |
| Voya Financial, Inc. | 73,218 | 3,611,112 |
| Waddell & Reed Financial, Inc., Class A | 40,310 | 651,813 |
| Western Asset Mortgage Capital Corp. | 28,211 | 265,183 |
| Westwood Holdings Group, Inc. | 4,651 | 127,670 |
| WisdomTree Investments, Inc. | 59,680 | 287,061 |
| World Acceptance Corp. * | 3,111 | 413,452 |
| 749,700,144 | ||
| Energy 4.1% | ||
| Antero Midstream Corp.(a) | 117,170 | 833,079 |
| Antero Resources Corp. * | 109,784 | 348,015 |
| Apache Corp. | 194,008 | 4,184,753 |
| Apergy Corp. * | 40,203 | 1,044,474 |
| Arch Coal, Inc., Class A(a) | 8,965 | 686,360 |
| Archrock, Inc. | 70,099 | 680,661 |
| Baker Hughes a GE Co. | 264,780 | 5,743,078 |
| Berry Petroleum Corp. | 9,235 | 73,788 |
| Bonanza Creek Energy, Inc. * | 9,554 | 215,538 |
| Brigham Minerals, Inc., Class A | 8,294 | 165,797 |
| C&J Energy Services, Inc. * | 32,221 | 308,033 |
| Cabot Oil & Gas Corp. | 216,385 | 3,704,511 |
| Cactus, Inc., Class A * | 23,595 | 600,965 |
| Security | Number of Shares | Value ($) |
| California Resources Corp. * | 25,505 | 249,694 |
| Callon Petroleum Co. * | 120,817 | 496,558 |
| Carrizo Oil & Gas, Inc. * | 43,992 | 364,694 |
| Centennial Resource Development, Inc., Class A * | 96,381 | 464,556 |
| Cheniere Energy, Inc. * | 112,833 | 6,737,258 |
| Chesapeake Energy Corp. *(a) | 532,612 | 766,961 |
| Chevron Corp. | 974,561 | 114,725,321 |
| Cimarex Energy Co. | 52,184 | 2,232,432 |
| Clean Energy Fuels Corp. * | 85,584 | 170,312 |
| CNX Resources Corp. * | 102,234 | 814,805 |
| Concho Resources, Inc. | 102,500 | 7,497,875 |
| ConocoPhillips | 578,367 | 30,179,190 |
| CONSOL Energy, Inc. * | 13,840 | 231,958 |
| Contango Oil & Gas Co. * | 19,713 | 19,319 |
| Continental Resources, Inc. * | 44,684 | 1,304,773 |
| Contura Energy, Inc. * | 2,184 | 62,899 |
| Core Laboratories N.V. | 23,866 | 944,855 |
| Covia Holdings Corp. * | 14,909 | 22,364 |
| CVR Energy, Inc. | 15,059 | 599,047 |
| Delek US Holdings, Inc. | 36,348 | 1,190,397 |
| Denbury Resources, Inc. * | 232,850 | 251,478 |
| Devon Energy Corp. | 211,827 | 4,658,076 |
| Diamond Offshore Drilling, Inc. * | 34,091 | 221,251 |
| Diamondback Energy, Inc. | 79,360 | 7,783,629 |
| Dril-Quip, Inc. * | 18,540 | 850,059 |
| EOG Resources, Inc. | 297,299 | 22,056,613 |
| EQT Corp. | 129,035 | 1,312,286 |
| Equitrans Midstream Corp. | 106,345 | 1,434,594 |
| Era Group, Inc. * | 9,752 | 92,449 |
| Evolution Petroleum Corp. | 15,150 | 89,688 |
| Exterran Corp. * | 17,157 | 181,006 |
| Extraction Oil & Gas, Inc. *(a) | 26,199 | 105,582 |
| Exxon Mobil Corp. | 2,167,184 | 148,408,760 |
| Falcon Minerals Corp. | 18,896 | 110,731 |
| Frank's International N.V. * | 44,435 | 193,292 |
| Geospace Technologies Corp. * | 6,363 | 77,883 |
| Green Plains, Inc. | 21,448 | 176,088 |
| Gulfport Energy Corp. * | 81,074 | 194,578 |
| Halliburton Co. | 449,228 | 8,463,456 |
| Helix Energy Solutions Group, Inc. * | 73,423 | 531,583 |
| Helmerich & Payne, Inc. | 57,592 | 2,164,883 |
| Hess Corp. | 130,161 | 8,193,635 |
| HighPoint Resources Corp. * | 113,474 | 132,765 |
| HollyFrontier Corp. | 80,728 | 3,581,094 |
| International Seaways, Inc. * | 14,247 | 245,333 |
| Isramco, Inc. * | 674 | 81,102 |
| Jagged Peak Energy, Inc. * | 32,606 | 224,981 |
| Keane Group, Inc. * | 20,892 | 110,728 |
| Kinder Morgan, Inc. | 999,557 | 20,261,020 |
| KLX Energy Services Holdings, Inc. * | 12,395 | 124,322 |
| Kosmos Energy Ltd. | 117,534 | 742,815 |
| Laredo Petroleum, Inc. * | 83,779 | 207,772 |
| Liberty Oilfield Services, Inc., Class A | 25,918 | 279,137 |
| Magnolia Oil & Gas Corp., Class A * | 44,739 | 456,785 |
| Marathon Oil Corp. | 418,410 | 4,953,974 |
| Marathon Petroleum Corp. | 339,186 | 16,691,343 |
| Matador Resources Co. * | 52,857 | 827,212 |
| Matrix Service Co. * | 15,021 | 298,467 |
| McDermott International, Inc. * | 97,841 | 461,810 |
| Montage Resources Corp. * | 3,056 | 9,107 |
| Murphy Oil Corp. | 71,353 | 1,300,765 |
| Nabors Industries Ltd. | 169,887 | 285,410 |
| NACCO Industries, Inc., Class A | 2,318 | 115,390 |
| National Oilwell Varco, Inc. | 199,219 | 4,070,044 |
| Natural Gas Services Group, Inc. * | 6,419 | 69,197 |
| NCS Multistage Holdings, Inc. * | 14,854 | 32,085 |
| Newpark Resources, Inc. * | 45,109 | 298,170 |
| Security | Number of Shares | Value ($) |
| Noble Corp. plc * | 120,313 | 192,501 |
| Noble Energy, Inc. | 243,895 | 5,507,149 |
| Northern Oil & Gas, Inc. * | 98,860 | 181,902 |
| Oasis Petroleum, Inc. * | 138,500 | 432,120 |
| Occidental Petroleum Corp. | 458,223 | 19,923,536 |
| Oceaneering International, Inc. * | 51,588 | 668,580 |
| Oil States International, Inc. * | 31,497 | 434,344 |
| ONEOK, Inc. | 211,382 | 15,067,309 |
| Overseas Shipholding Group, Inc., Class A * | 44,331 | 72,260 |
| Par Pacific Holdings, Inc. * | 15,682 | 340,927 |
| Parsley Energy, Inc., Class A * | 134,348 | 2,406,173 |
| Patterson-UTI Energy, Inc. | 111,936 | 968,246 |
| PBF Energy, Inc., Class A | 61,871 | 1,466,343 |
| PDC Energy, Inc. * | 33,697 | 1,073,249 |
| Peabody Energy Corp. | 41,752 | 769,489 |
| Penn Virginia Corp. * | 6,749 | 192,346 |
| Phillips 66 | 213,789 | 21,086,009 |
| Pioneer Natural Resources Co. | 86,363 | 10,658,921 |
| ProPetro Holding Corp. * | 38,815 | 413,380 |
| QEP Resources, Inc. | 124,742 | 444,082 |
| Range Resources Corp. | 123,545 | 439,820 |
| Renewable Energy Group, Inc. * | 18,313 | 222,869 |
| REX American Resources Corp. * | 3,397 | 233,306 |
| RigNet, Inc. * | 6,497 | 50,936 |
| Ring Energy, Inc. * | 57,093 | 83,356 |
| RPC, Inc. | 28,690 | 152,344 |
| SandRidge Energy, Inc. * | 15,150 | 70,902 |
| Schlumberger Ltd. | 709,293 | 23,002,372 |
| SEACOR Holdings, Inc. * | 8,592 | 403,566 |
| SEACOR Marine Holdings, Inc. * | 11,507 | 149,936 |
| Select Energy Services, Inc., Class A * | 30,180 | 246,269 |
| SemGroup Corp., Class A | 32,066 | 283,463 |
| SM Energy Co. | 51,243 | 485,784 |
| Smart Sand, Inc. * | 14,784 | 35,038 |
| Southwestern Energy Co. * | 276,148 | 436,314 |
| SRC Energy, Inc. * | 129,404 | 649,608 |
| Talos Energy, Inc. * | 12,893 | 245,483 |
| Targa Resources Corp. | 119,460 | 4,314,895 |
| TechnipFMC plc | 217,484 | 5,402,303 |
| Tellurian, Inc. *(a) | 50,189 | 327,734 |
| TETRA Technologies, Inc. * | 64,480 | 107,037 |
| The Williams Cos., Inc. | 621,043 | 14,656,615 |
| Tidewater, Inc. * | 20,552 | 323,900 |
| Transocean Ltd. * | 262,751 | 1,195,517 |
| U.S. Well Services, Inc. * | 13,852 | 41,556 |
| Unit Corp. * | 28,124 | 85,216 |
| US Silica Holdings, Inc. | 38,948 | 396,101 |
| Valaris plc *(a) | 102,643 | 478,316 |
| Valero Energy Corp. | 213,805 | 16,095,240 |
| W&T Offshore, Inc. * | 47,600 | 208,488 |
| Whiting Petroleum Corp. * | 45,408 | 301,055 |
| World Fuel Services Corp. | 34,517 | 1,325,453 |
| WPX Energy, Inc. * | 203,078 | 2,185,119 |
| 608,011,525 | ||
| Food & Staples Retailing 1.4% | ||
| BJ's Wholesale Club Holdings, Inc. * | 62,260 | 1,634,948 |
| Casey's General Stores, Inc. | 18,757 | 3,148,363 |
| Costco Wholesale Corp. | 225,187 | 66,376,120 |
| Ingles Markets, Inc., Class A | 6,785 | 263,801 |
| Natural Grocers by Vitamin Cottage, Inc. * | 3,751 | 35,409 |
| Performance Food Group Co. * | 53,808 | 2,517,676 |
| PriceSmart, Inc. | 11,508 | 695,429 |
| Rite Aid Corp. *(a) | 27,316 | 176,461 |
| SpartanNash Co. | 17,436 | 187,786 |
| Security | Number of Shares | Value ($) |
| Sprouts Farmers Market, Inc. * | 60,538 | 1,086,657 |
| Sysco Corp. | 241,978 | 17,986,225 |
| The Andersons, Inc. | 10,263 | 235,228 |
| The Chefs' Warehouse, Inc. * | 11,342 | 437,574 |
| The Kroger Co. | 412,974 | 9,779,224 |
| United Natural Foods, Inc. * | 28,971 | 232,927 |
| US Foods Holding Corp. * | 112,032 | 4,531,694 |
| Village Super Market, Inc., Class A | 4,865 | 121,479 |
| Walgreens Boots Alliance, Inc. | 397,911 | 20,369,064 |
| Walmart, Inc. | 716,158 | 81,828,213 |
| Weis Markets, Inc. | 8,584 | 328,166 |
| 211,972,444 | ||
| Food, Beverage & Tobacco 3.6% | ||
| Alico, Inc. | 2,500 | 74,625 |
| Altria Group, Inc. | 959,545 | 41,970,498 |
| Archer-Daniels-Midland Co. | 286,234 | 10,891,204 |
| B&G Foods, Inc.(a) | 33,172 | 561,602 |
| Beyond Meat, Inc. *(a) | 5,222 | 875,364 |
| Brown-Forman Corp., Class A | 31,875 | 1,835,044 |
| Brown-Forman Corp., Class B | 85,231 | 5,027,777 |
| Bunge Ltd. | 72,408 | 3,867,311 |
| Cal-Maine Foods, Inc. | 16,057 | 650,951 |
| Calavo Growers, Inc. | 8,368 | 741,823 |
| Campbell Soup Co. | 98,773 | 4,444,785 |
| Coca-Cola Consolidated, Inc. | 2,487 | 837,149 |
| Conagra Brands, Inc. | 248,425 | 7,045,333 |
| Constellation Brands, Inc., Class A | 85,719 | 17,516,678 |
| Darling Ingredients, Inc. * | 83,776 | 1,558,234 |
| Dean Foods Co.(a) | 69,389 | 70,083 |
| Flowers Foods, Inc. | 93,173 | 2,124,344 |
| Fresh Del Monte Produce, Inc. | 15,436 | 401,953 |
| Freshpet, Inc. * | 17,414 | 854,679 |
| General Mills, Inc. | 306,951 | 16,513,964 |
| Hormel Foods Corp. | 140,368 | 5,981,080 |
| Hostess Brands, Inc. * | 59,214 | 830,180 |
| Ingredion, Inc. | 34,847 | 2,692,628 |
| J&J Snack Foods Corp. | 7,899 | 1,524,981 |
| John B Sanfilippo & Son, Inc. | 4,397 | 407,162 |
| Kellogg Co. | 127,229 | 7,989,981 |
| Keurig Dr Pepper, Inc. | 92,731 | 2,529,702 |
| Lamb Weston Holdings, Inc. | 75,267 | 5,298,044 |
| Lancaster Colony Corp. | 9,402 | 1,371,752 |
| Landec Corp. * | 13,935 | 153,146 |
| Limoneira Co. | 8,629 | 156,703 |
| McCormick & Co., Inc. Non-Voting Shares | 63,341 | 10,316,349 |
| MGP Ingredients, Inc. | 6,389 | 307,758 |
| Molson Coors Brewing Co., Class B | 95,870 | 4,923,883 |
| Mondelez International, Inc., Class A | 738,348 | 40,771,577 |
| Monster Beverage Corp. * | 199,862 | 11,725,904 |
| National Beverage Corp.(a) | 4,589 | 187,690 |
| PepsiCo, Inc. | 717,459 | 98,098,169 |
| Philip Morris International, Inc. | 797,091 | 57,462,290 |
| Pilgrim's Pride Corp. * | 25,567 | 796,668 |
| Post Holdings, Inc. * | 34,009 | 3,390,357 |
| Primo Water Corp. * | 19,889 | 243,242 |
| Sanderson Farms, Inc. | 9,964 | 1,490,814 |
| Seaboard Corp. | 143 | 590,616 |
| Seneca Foods Corp., Class A * | 5,165 | 141,934 |
| Simply Good Foods Co. * | 25,996 | 770,261 |
| The Boston Beer Co., Inc., Class A * | 4,521 | 1,982,097 |
| The Coca-Cola Co. | 1,967,619 | 108,297,750 |
| The Hain Celestial Group, Inc. * | 44,749 | 852,468 |
| The Hershey Co. | 70,812 | 11,222,286 |
| The J.M. Smucker Co. | 58,189 | 6,119,155 |
| The Kraft Heinz Co. | 318,783 | 8,135,342 |
| Security | Number of Shares | Value ($) |
| Tootsie Roll Industries, Inc. | 10,461 | 383,709 |
| TreeHouse Foods, Inc. * | 28,313 | 1,434,053 |
| Tyson Foods, Inc., Class A | 150,903 | 14,040,015 |
| Universal Corp. | 13,199 | 660,742 |
| Vector Group Ltd. | 55,922 | 653,169 |
| 531,797,058 | ||
| Health Care Equipment & Services 6.2% | ||
| Abbott Laboratories | 904,161 | 77,143,017 |
| ABIOMED, Inc. * | 22,864 | 4,414,352 |
| Acadia Healthcare Co., Inc. * | 45,634 | 1,207,476 |
| Accuray, Inc. * | 51,151 | 137,085 |
| Addus HomeCare Corp. * | 5,757 | 506,501 |
| Align Technology, Inc. * | 36,985 | 6,772,323 |
| Allscripts Healthcare Solutions, Inc. * | 85,899 | 779,963 |
| Amedisys, Inc. * | 15,019 | 1,933,096 |
| American Renal Associates Holdings, Inc. * | 11,863 | 73,551 |
| AmerisourceBergen Corp. | 79,415 | 6,533,472 |
| AMN Healthcare Services, Inc. * | 24,160 | 1,410,944 |
| AngioDynamics, Inc. * | 18,228 | 334,848 |
| Antares Pharma, Inc. * | 85,404 | 276,709 |
| Anthem, Inc. | 131,873 | 34,487,427 |
| AtriCure, Inc. * | 18,332 | 502,113 |
| Atrion Corp. | 764 | 593,743 |
| Avanos Medical, Inc. * | 25,286 | 838,989 |
| AxoGen, Inc. * | 17,896 | 283,652 |
| Axonics Modulation Technologies, Inc. * | 3,943 | 131,184 |
| Baxter International, Inc. | 242,533 | 21,330,777 |
| Becton Dickinson & Co. | 138,432 | 35,150,653 |
| BioTelemetry, Inc. * | 17,470 | 692,686 |
| Boston Scientific Corp. * | 710,495 | 30,359,451 |
| Brookdale Senior Living, Inc. * | 92,820 | 759,268 |
| Cantel Medical Corp. | 18,396 | 1,691,144 |
| Capital Senior Living Corp. * | 17,702 | 81,606 |
| Cardinal Health, Inc. | 152,684 | 6,585,261 |
| Cardiovascular Systems, Inc. * | 18,221 | 882,443 |
| Castlight Health, Inc., Class B * | 30,061 | 42,386 |
| Centene Corp. * | 211,324 | 9,851,925 |
| Cerner Corp. | 166,664 | 11,484,816 |
| Cerus Corp. * | 71,681 | 384,927 |
| Chemed Corp. | 8,196 | 3,519,608 |
| Cigna Corp. * | 194,690 | 29,976,419 |
| Community Health Systems, Inc. * | 57,849 | 144,044 |
| Computer Programs & Systems, Inc. | 6,877 | 145,449 |
| CONMED Corp. | 13,752 | 1,385,789 |
| CorVel Corp. * | 4,965 | 418,202 |
| Covetrus, Inc. * | 51,126 | 679,465 |
| CryoLife, Inc. * | 18,624 | 499,123 |
| CVS Health Corp. | 665,908 | 40,567,115 |
| Danaher Corp. | 322,910 | 45,882,282 |
| DaVita, Inc. * | 53,869 | 3,036,596 |
| DENTSPLY SIRONA, Inc. | 119,425 | 6,228,014 |
| DexCom, Inc. * | 46,752 | 8,023,111 |
| Diplomat Pharmacy, Inc. * | 28,256 | 164,167 |
| Edwards Lifesciences Corp. * | 107,176 | 23,775,924 |
| Encompass Health Corp. | 50,651 | 3,079,074 |
| Endologix, Inc. * | 14,033 | 75,217 |
| Enzo Biochem, Inc. * | 20,200 | 65,650 |
| Evolent Health, Inc., Class A * | 38,323 | 263,279 |
| GenMark Diagnostics, Inc. * | 27,314 | 163,611 |
| Glaukos Corp. * | 17,349 | 1,115,714 |
| Globus Medical, Inc., Class A * | 39,305 | 2,007,306 |
| Guardant Health, Inc. * | 19,697 | 1,724,078 |
| Haemonetics Corp. * | 26,014 | 3,473,649 |
| Hanger, Inc. * | 18,092 | 341,577 |
| HCA Healthcare, Inc. | 137,356 | 16,510,191 |
| Security | Number of Shares | Value ($) |
| HealthEquity, Inc. * | 35,549 | 2,110,189 |
| HealthStream, Inc. * | 13,771 | 347,993 |
| Henry Schein, Inc. * | 76,432 | 4,709,740 |
| Heska Corp. * | 4,216 | 295,921 |
| Hill-Rom Holdings, Inc. | 34,115 | 3,673,503 |
| HMS Holdings Corp. * | 45,890 | 1,676,362 |
| Hologic, Inc. * | 136,854 | 6,756,482 |
| Humana, Inc. | 69,088 | 19,566,413 |
| ICU Medical, Inc. * | 8,514 | 1,377,140 |
| IDEXX Laboratories, Inc. * | 44,025 | 12,755,804 |
| Inogen, Inc. * | 10,924 | 506,546 |
| Inovalon Holdings, Inc., Class A * | 36,301 | 614,213 |
| Inspire Medical Systems, Inc. * | 6,021 | 418,520 |
| Insulet Corp. * | 30,800 | 4,748,436 |
| Integer Holdings Corp. * | 15,009 | 1,086,652 |
| Integra LifeSciences Holdings Corp. * | 36,794 | 2,208,376 |
| Intuitive Surgical, Inc. * | 59,148 | 30,244,738 |
| Invacare Corp. | 17,278 | 83,626 |
| iRhythm Technologies, Inc. * | 11,308 | 860,765 |
| Laboratory Corp. of America Holdings * | 50,465 | 8,455,915 |
| Lantheus Holdings, Inc. * | 21,276 | 462,966 |
| LeMaitre Vascular, Inc. | 7,416 | 234,791 |
| LHC Group, Inc. * | 15,362 | 1,820,397 |
| LivaNova plc * | 25,105 | 1,948,901 |
| Magellan Health, Inc. * | 12,378 | 779,938 |
| Masimo Corp. * | 25,398 | 3,892,244 |
| McKesson Corp. | 97,416 | 13,469,710 |
| Medidata Solutions, Inc. * | 31,858 | 2,917,556 |
| MEDNAX, Inc. * | 46,168 | 973,221 |
| Medtronic plc | 687,352 | 74,158,407 |
| Meridian Bioscience, Inc. | 23,606 | 217,883 |
| Merit Medical Systems, Inc. * | 27,835 | 968,101 |
| Mesa Laboratories, Inc. | 1,765 | 390,471 |
| Molina Healthcare, Inc. * | 32,199 | 4,194,886 |
| National HealthCare Corp. | 5,203 | 420,402 |
| National Research Corp. | 6,165 | 394,745 |
| Natus Medical, Inc. * | 18,228 | 504,551 |
| Neogen Corp. * | 26,184 | 1,846,496 |
| Nevro Corp. * | 15,993 | 1,339,094 |
| NextGen Healthcare, Inc. * | 19,744 | 280,562 |
| NuVasive, Inc. * | 26,808 | 1,702,844 |
| Omnicell, Inc. * | 20,770 | 1,491,286 |
| Option Care Health, Inc. * | 69,920 | 244,720 |
| OraSure Technologies, Inc. * | 32,024 | 211,358 |
| Orthofix Medical, Inc. * | 9,267 | 471,134 |
| Owens & Minor, Inc. | 26,405 | 134,137 |
| Patterson Cos., Inc. | 41,444 | 692,944 |
| Penumbra, Inc. * | 16,132 | 2,348,013 |
| Premier, Inc., Class A * | 24,231 | 854,385 |
| Quest Diagnostics, Inc. | 68,555 | 7,017,975 |
| Quidel Corp. * | 17,867 | 1,126,514 |
| R1 RCM, Inc. * | 48,219 | 562,234 |
| RadNet, Inc. * | 25,420 | 353,592 |
| ResMed, Inc. | 73,235 | 10,201,636 |
| SeaSpine Holdings Corp. * | 9,455 | 103,910 |
| Select Medical Holdings Corp. * | 56,046 | 909,066 |
| Senseonics Holdings, Inc. *(a) | 71,477 | 72,907 |
| Shockwave Medical, Inc. *(a) | 3,153 | 131,953 |
| SI-BONE, Inc. * | 3,754 | 72,978 |
| Silk Road Medical, Inc. * | 3,345 | 144,136 |
| STAAR Surgical Co. * | 13,686 | 412,085 |
| STERIS plc | 43,306 | 6,686,446 |
| Stryker Corp. | 158,356 | 34,942,835 |
| Surgery Partners, Inc. * | 8,600 | 55,384 |
| Surmodics, Inc. * | 6,373 | 299,913 |
| Tabula Rasa HealthCare, Inc. * | 8,795 | 499,556 |
| Tactile Systems Technology, Inc. * | 10,495 | 529,368 |
| Tandem Diabetes Care, Inc. * | 30,152 | 2,183,909 |
| Security | Number of Shares | Value ($) |
| Teladoc Health, Inc. * | 37,222 | 2,154,409 |
| Teleflex, Inc. | 23,723 | 8,633,274 |
| Tenet Healthcare Corp. * | 42,049 | 910,361 |
| The Cooper Cos., Inc. | 25,415 | 7,872,296 |
| The Ensign Group, Inc. | 25,404 | 1,267,660 |
| The Providence Service Corp. * | 5,999 | 337,204 |
| Tivity Health, Inc. * | 23,699 | 432,744 |
| TransEnterix, Inc. *(a) | 98,632 | 90,317 |
| TransMedics Group, Inc. * | 3,255 | 77,957 |
| Triple-S Management Corp., Class B * | 10,986 | 225,433 |
| UnitedHealth Group, Inc. | 486,986 | 113,954,724 |
| Universal Health Services, Inc., Class B | 42,236 | 6,106,481 |
| US Physical Therapy, Inc. | 6,326 | 844,648 |
| Varex Imaging Corp. * | 19,727 | 519,806 |
| Varian Medical Systems, Inc. * | 46,652 | 4,941,846 |
| Veeva Systems, Inc., Class A * | 65,489 | 10,503,126 |
| ViewRay, Inc. * | 28,236 | 111,250 |
| Vocera Communications, Inc. * | 16,186 | 371,469 |
| WellCare Health Plans, Inc. * | 25,842 | 6,996,463 |
| West Pharmaceutical Services, Inc. | 37,704 | 5,484,424 |
| Wright Medical Group N.V. * | 60,184 | 1,254,836 |
| Zimmer Biomet Holdings, Inc. | 104,891 | 14,600,827 |
| 926,783,871 | ||
| Household & Personal Products 1.8% | ||
| Avon Products, Inc. * | 227,310 | 988,798 |
| Central Garden & Pet Co. * | 7,935 | 209,643 |
| Central Garden & Pet Co., Class A * | 19,928 | 479,468 |
| Church & Dwight Co., Inc. | 125,607 | 10,020,926 |
| Colgate-Palmolive Co. | 439,649 | 32,599,973 |
| Coty, Inc., Class A | 155,027 | 1,480,508 |
| Edgewell Personal Care Co. * | 28,342 | 789,041 |
| elf Beauty, Inc. * | 8,583 | 140,074 |
| Energizer Holdings, Inc. | 32,976 | 1,269,576 |
| Herbalife Nutrition Ltd. * | 51,102 | 1,759,442 |
| Inter Parfums, Inc. | 8,923 | 573,660 |
| Kimberly-Clark Corp. | 175,597 | 24,778,493 |
| Medifast, Inc. | 6,075 | 607,257 |
| Natural Health Trends Corp. | 3,085 | 23,323 |
| Nu Skin Enterprises, Inc., Class A | 28,751 | 1,167,866 |
| Revlon, Inc., Class A *(a) | 3,422 | 56,566 |
| Spectrum Brands Holdings, Inc. | 21,401 | 1,195,674 |
| The Clorox Co. | 64,967 | 10,275,181 |
| The Estee Lauder Cos., Inc., Class A | 112,393 | 22,252,690 |
| The Procter & Gamble Co. | 1,285,009 | 154,496,632 |
| USANA Health Sciences, Inc. * | 6,936 | 471,440 |
| WD-40 Co. | 7,165 | 1,306,179 |
| 266,942,410 | ||
| Insurance 2.7% | ||
| Aflac, Inc. | 383,776 | 19,257,880 |
| Alleghany Corp. * | 7,542 | 5,651,296 |
| Ambac Financial Group, Inc. * | 26,523 | 478,475 |
| American Equity Investment Life Holding Co. | 47,762 | 1,029,271 |
| American Financial Group, Inc. | 36,666 | 3,702,166 |
| American International Group, Inc. | 443,534 | 23,081,509 |
| American National Insurance Co. | 4,394 | 501,224 |
| AMERISAFE, Inc. | 9,625 | 661,237 |
| Aon plc | 123,060 | 23,978,241 |
| Arch Capital Group Ltd. * | 206,493 | 8,156,473 |
| Argo Group International Holdings Ltd. | 17,329 | 1,138,862 |
| Arthur J. Gallagher & Co. | 94,487 | 8,570,916 |
| Assurant, Inc. | 31,417 | 3,864,291 |
| Assured Guaranty Ltd. | 50,187 | 2,135,457 |
| Athene Holding Ltd., Class A * | 59,011 | 2,293,167 |
| Security | Number of Shares | Value ($) |
| Axis Capital Holdings Ltd. | 41,739 | 2,562,357 |
| Brighthouse Financial, Inc. * | 60,009 | 2,115,917 |
| Brown & Brown, Inc. | 120,070 | 4,429,382 |
| Chubb Ltd. | 235,023 | 36,729,394 |
| Cincinnati Financial Corp. | 77,306 | 8,696,152 |
| Citizens, Inc. *(a) | 22,710 | 142,619 |
| CNA Financial Corp. | 13,752 | 648,132 |
| CNO Financial Group, Inc. | 83,156 | 1,204,099 |
| Crawford & Co., Class A | 7,064 | 68,168 |
| Crawford & Co., Class B | 7,131 | 61,754 |
| Donegal Group, Inc., Class A | 4,633 | 66,854 |
| eHealth, Inc. * | 9,665 | 805,191 |
| EMC Insurance Group, Inc. | 5,198 | 186,816 |
| Employers Holdings, Inc. | 17,068 | 736,143 |
| Enstar Group Ltd. * | 7,644 | 1,365,371 |
| Erie Indemnity Co., Class A | 10,102 | 2,215,470 |
| Everest Re Group Ltd. | 20,628 | 4,865,733 |
| FBL Financial Group, Inc., Class A | 5,025 | 272,506 |
| Fidelity National Financial, Inc. | 141,755 | 6,228,715 |
| First American Financial Corp. | 57,124 | 3,338,898 |
| Genworth Financial, Inc., Class A * | 252,117 | 1,116,878 |
| Global Indemnity Ltd. | 3,150 | 81,112 |
| Globe Life, Inc. * | 51,623 | 4,607,869 |
| Greenlight Capital Re Ltd., Class A * | 15,825 | 145,432 |
| Health Insurance Innovations, Inc., Class A *(a) | 4,347 | 79,724 |
| Horace Mann Educators Corp. | 21,761 | 954,655 |
| James River Group Holdings Ltd. | 16,222 | 799,420 |
| Kemper Corp. | 31,952 | 2,236,001 |
| Kinsale Capital Group, Inc. | 9,981 | 980,434 |
| Lincoln National Corp. | 104,214 | 5,510,836 |
| Loews Corp. | 136,397 | 6,556,604 |
| Maiden Holdings Ltd. | 37,816 | 18,152 |
| Markel Corp. * | 7,178 | 8,205,028 |
| Marsh & McLennan Cos., Inc. | 262,590 | 26,230,115 |
| MBIA, Inc. * | 48,364 | 435,276 |
| Mercury General Corp. | 13,980 | 747,930 |
| MetLife, Inc. | 483,892 | 21,436,416 |
| National General Holdings Corp. | 31,946 | 753,287 |
| National Western Life Group, Inc., Class A | 1,265 | 326,142 |
| NI Holdings, Inc. * | 3,867 | 64,966 |
| Old Republic International Corp. | 146,160 | 3,414,298 |
| Palomar Holdings, Inc. * | 3,051 | 103,826 |
| Primerica, Inc. | 21,912 | 2,611,253 |
| Principal Financial Group, Inc. | 132,319 | 7,042,017 |
| ProAssurance Corp. | 28,290 | 1,105,290 |
| Prudential Financial, Inc. | 208,374 | 16,688,674 |
| Reinsurance Group of America, Inc. | 31,860 | 4,905,484 |
| RenaissanceRe Holdings Ltd. | 22,411 | 4,046,306 |
| RLI Corp. | 19,720 | 1,805,760 |
| Safety Insurance Group, Inc. | 7,506 | 723,879 |
| Selective Insurance Group, Inc. | 30,029 | 2,391,209 |
| State Auto Financial Corp. | 8,926 | 285,364 |
| Stewart Information Services Corp. | 12,473 | 446,783 |
| The Allstate Corp. | 171,739 | 17,584,356 |
| The Hanover Insurance Group, Inc. | 21,533 | 2,867,119 |
| The Hartford Financial Services Group, Inc. | 186,713 | 10,881,634 |
| The Progressive Corp. | 299,031 | 22,666,550 |
| The Travelers Cos., Inc. | 134,926 | 19,828,725 |
| Third Point Reinsurance Ltd. * | 41,809 | 393,841 |
| Trupanion, Inc. *(a) | 13,219 | 318,446 |
| United Fire Group, Inc. | 11,396 | 514,643 |
| United Insurance Holdings Corp. | 11,798 | 138,273 |
| Universal Insurance Holdings, Inc. | 16,126 | 403,150 |
| Unum Group | 109,623 | 2,785,520 |
| W.R. Berkley Corp. | 74,263 | 5,291,239 |
| Security | Number of Shares | Value ($) |
| Watford Holdings Ltd. * | 2,739 | 63,545 |
| White Mountains Insurance Group Ltd. | 1,689 | 1,791,522 |
| Willis Towers Watson plc | 66,656 | 13,195,888 |
| 406,821,007 | ||
| Materials 2.9% | ||
| AdvanSix, Inc. * | 14,108 | 315,173 |
| Air Products & Chemicals, Inc. | 112,971 | 25,522,408 |
| AK Steel Holding Corp. * | 154,160 | 332,986 |
| Albemarle Corp. | 54,107 | 3,340,025 |
| Alcoa Corp. * | 96,297 | 1,726,605 |
| Allegheny Technologies, Inc. * | 66,133 | 1,310,756 |
| Amcor plc * | 827,134 | 8,122,456 |
| American Vanguard Corp. | 13,000 | 184,210 |
| AptarGroup, Inc. | 32,918 | 4,023,238 |
| Ashland Global Holdings, Inc. | 32,457 | 2,377,151 |
| Avery Dennison Corp. | 43,427 | 5,018,858 |
| Axalta Coating Systems Ltd. * | 106,213 | 3,067,431 |
| Balchem Corp. | 16,270 | 1,444,613 |
| Ball Corp. | 172,233 | 13,849,255 |
| Berry Global Group, Inc. * | 67,299 | 2,634,083 |
| Boise Cascade Co. | 20,373 | 639,712 |
| Cabot Corp. | 29,869 | 1,194,760 |
| Carpenter Technology Corp. | 24,147 | 1,174,510 |
| Celanese Corp., Series A | 64,741 | 7,339,687 |
| Century Aluminum Co. * | 24,466 | 134,808 |
| CF Industries Holdings, Inc. | 111,678 | 5,381,763 |
| Chase Corp. | 4,059 | 406,793 |
| Clearwater Paper Corp. * | 8,820 | 141,296 |
| Cleveland-Cliffs, Inc.(a) | 147,886 | 1,174,215 |
| Coeur Mining, Inc. * | 99,339 | 543,384 |
| Commercial Metals Co. | 60,560 | 948,975 |
| Compass Minerals International, Inc. | 17,068 | 848,792 |
| Corteva, Inc. * | 382,413 | 11,212,349 |
| Crown Holdings, Inc. * | 69,132 | 4,551,651 |
| Domtar Corp. | 32,127 | 1,058,585 |
| Dow, Inc. * | 383,972 | 16,368,726 |
| DuPont de Nemours, Inc. | 383,572 | 26,056,046 |
| Eagle Materials, Inc. | 22,659 | 1,907,661 |
| Eastman Chemical Co. | 69,559 | 4,547,072 |
| Ecolab, Inc. | 130,090 | 26,838,868 |
| Element Solutions, Inc. * | 120,314 | 1,122,530 |
| Ferro Corp. * | 42,984 | 438,007 |
| FMC Corp. | 67,597 | 5,835,649 |
| Forterra, Inc. * | 15,859 | 94,837 |
| Freeport-McMoRan, Inc. | 740,453 | 6,804,763 |
| FutureFuel Corp. | 14,082 | 151,804 |
| GCP Applied Technologies, Inc. * | 37,240 | 653,562 |
| Graphic Packaging Holding Co. | 153,731 | 2,123,025 |
| Greif, Inc., Class A | 15,379 | 541,187 |
| Greif, Inc., Class B | 1,387 | 57,713 |
| H.B. Fuller Co. | 26,084 | 1,111,439 |
| Hawkins, Inc. | 5,069 | 224,810 |
| Haynes International, Inc. | 3,615 | 107,980 |
| Hecla Mining Co. | 260,489 | 463,670 |
| Huntsman Corp. | 107,356 | 2,138,531 |
| Ingevity Corp. * | 21,368 | 1,627,601 |
| Innophos Holdings, Inc. | 10,406 | 292,305 |
| Innospec, Inc. | 12,804 | 1,065,037 |
| International Flavors & Fragrances, Inc. | 52,000 | 5,707,000 |
| International Paper Co. | 203,350 | 7,950,985 |
| Kaiser Aluminum Corp. | 8,534 | 754,662 |
| Koppers Holdings, Inc. * | 11,622 | 308,099 |
| Kraton Corp. * | 15,599 | 428,037 |
| Kronos Worldwide, Inc. | 9,366 | 102,558 |
| Linde plc | 277,615 | 52,444,250 |
| Livent Corp. * | 74,054 | 455,432 |
| Security | Number of Shares | Value ($) |
| Loop Industries, Inc. *(a) | 8,177 | 115,705 |
| Louisiana-Pacific Corp. | 62,870 | 1,511,395 |
| LSB Industries, Inc. * | 21,896 | 102,254 |
| LyondellBasell Industries N.V., Class A | 142,102 | 10,995,853 |
| Martin Marietta Materials, Inc. | 32,391 | 8,219,864 |
| Materion Corp. | 10,973 | 645,651 |
| McEwen Mining, Inc. *(a) | 139,656 | 283,502 |
| Mercer International, Inc. | 21,249 | 255,838 |
| Minerals Technologies, Inc. | 18,265 | 880,373 |
| Myers Industries, Inc. | 19,347 | 325,610 |
| Neenah, Inc. | 8,398 | 535,624 |
| NewMarket Corp. | 4,304 | 2,043,324 |
| Newmont Goldcorp Corp. | 418,780 | 16,705,134 |
| Nucor Corp. | 155,836 | 7,632,847 |
| Olin Corp. | 83,386 | 1,415,894 |
| OMNOVA Solutions, Inc. * | 26,446 | 265,782 |
| Owens-Illinois, Inc. | 79,332 | 806,806 |
| P.H. Glatfelter Co. | 23,046 | 331,401 |
| Packaging Corp. of America | 48,727 | 4,900,962 |
| PolyOne Corp. | 40,087 | 1,283,185 |
| PPG Industries, Inc. | 120,563 | 13,357,175 |
| PQ Group Holdings, Inc. * | 18,162 | 259,535 |
| Quaker Chemical Corp. | 6,903 | 1,096,611 |
| Rayonier Advanced Materials, Inc. | 25,794 | 90,537 |
| Reliance Steel & Aluminum Co. | 34,147 | 3,320,113 |
| Resolute Forest Products, Inc. | 45,466 | 194,594 |
| Royal Gold, Inc. | 33,366 | 4,450,357 |
| RPM International, Inc. | 68,224 | 4,616,718 |
| Schnitzer Steel Industries, Inc., Class A | 12,193 | 269,953 |
| Schweitzer-Mauduit International, Inc. | 15,194 | 509,607 |
| Sealed Air Corp. | 79,790 | 3,177,238 |
| Sensient Technologies Corp. | 21,502 | 1,404,511 |
| Silgan Holdings, Inc. | 39,601 | 1,178,526 |
| Sonoco Products Co. | 50,727 | 2,901,584 |
| Steel Dynamics, Inc. | 113,720 | 3,070,440 |
| Stepan Co. | 10,377 | 989,862 |
| Summit Materials, Inc., Class A * | 57,677 | 1,210,063 |
| SunCoke Energy, Inc. * | 45,466 | 283,708 |
| The Chemours Co. | 85,392 | 1,210,005 |
| The Mosaic Co. | 181,235 | 3,332,912 |
| The Scotts Miracle-Gro Co. | 20,137 | 2,140,966 |
| The Sherwin-Williams Co. | 41,828 | 22,032,899 |
| TimkenSteel Corp. * | 21,416 | 111,791 |
| Tredegar Corp. | 13,413 | 231,911 |
| Trinseo S.A. | 20,296 | 712,187 |
| Tronox Holdings plc, Class A * | 44,123 | 327,834 |
| United States Lime & Minerals, Inc. | 1,458 | 112,514 |
| United States Steel Corp. | 89,976 | 996,034 |
| US Concrete, Inc. * | 7,584 | 307,304 |
| Valhi, Inc. | 17,301 | 33,737 |
| Valvoline, Inc. | 95,921 | 2,167,815 |
| Venator Materials plc * | 23,425 | 52,238 |
| Verso Corp., Class A * | 19,340 | 197,461 |
| Vulcan Materials Co. | 67,426 | 9,523,922 |
| W.R. Grace & Co. | 33,866 | 2,293,067 |
| Warrior Met Coal, Inc. | 21,840 | 456,456 |
| Westlake Chemical Corp. | 18,475 | 1,082,450 |
| Westrock Co. | 132,481 | 4,528,201 |
| Worthington Industries, Inc. | 20,326 | 705,312 |
| 432,939,526 | ||
| Media & Entertainment 7.6% | ||
| Activision Blizzard, Inc. | 392,333 | 19,852,050 |
| Alphabet, Inc., Class A * | 153,380 | 182,603,491 |
| Alphabet, Inc., Class C * | 157,079 | 186,625,560 |
| Altice USA, Inc., Class A * | 61,852 | 1,786,286 |
| Security | Number of Shares | Value ($) |
| AMC Entertainment Holdings, Inc., Class A(a) | 29,513 | 327,889 |
| AMC Networks, Inc., Class A * | 23,144 | 1,122,484 |
| ANGI Homeservices, Inc., Class A *(a) | 29,105 | 225,855 |
| Cable One, Inc. | 2,590 | 3,360,836 |
| Cargurus, Inc. * | 17,825 | 581,452 |
| Cars.com, Inc. * | 32,400 | 288,684 |
| CBS Corp., Class A | 2,337 | 105,165 |
| CBS Corp., Class B Non-Voting Shares | 180,153 | 7,577,235 |
| Central European Media Enterprises Ltd., Class A * | 38,243 | 177,448 |
| Charter Communications, Inc., Class A * | 88,036 | 36,058,665 |
| Cinemark Holdings, Inc. | 54,449 | 2,077,774 |
| Clear Channel Outdoor Holdings, Inc. * | 184,039 | 478,501 |
| Comcast Corp., Class A | 2,318,908 | 102,634,868 |
| comScore, Inc. * | 26,899 | 50,032 |
| Discovery, Inc., Class A * | 82,718 | 2,283,017 |
| Discovery, Inc., Class C * | 183,044 | 4,764,635 |
| DISH Network Corp., Class A * | 117,999 | 3,960,046 |
| Electronic Arts, Inc. * | 152,126 | 14,251,164 |
| Emerald Expositions Events, Inc. | 15,503 | 148,209 |
| Entercom Communications Corp., Class A | 61,986 | 220,670 |
| Entravision Communications Corp., Class A | 29,256 | 89,523 |
| Eventbrite, Inc., Class A * | 5,876 | 102,712 |
| Facebook, Inc., Class A * | 1,230,609 | 228,487,173 |
| Fox Corp., Class A | 182,157 | 6,042,148 |
| Fox Corp., Class B * | 82,649 | 2,710,887 |
| Gannett Co., Inc. | 55,874 | 587,794 |
| Global Eagle Entertainment, Inc. * | 27,982 | 19,587 |
| Glu Mobile, Inc. * | 54,330 | 241,225 |
| Gray Television, Inc. * | 41,262 | 631,309 |
| Hemisphere Media Group, Inc. * | 11,068 | 131,377 |
| IAC/InterActiveCorp * | 40,167 | 10,228,125 |
| John Wiley & Sons, Inc., Class A | 22,974 | 1,022,343 |
| Liberty Broadband Corp., Class A * | 13,477 | 1,411,716 |
| Liberty Broadband Corp., Class C * | 78,150 | 8,240,136 |
| Liberty Global plc, Class A * | 105,679 | 2,823,743 |
| Liberty Global plc, Class C * | 265,877 | 6,944,707 |
| Liberty Latin America Ltd., Class A * | 22,222 | 364,885 |
| Liberty Latin America Ltd., Class C * | 61,656 | 1,016,707 |
| Liberty Media Corp. - Liberty Braves, Class A * | 5,450 | 149,712 |
| Liberty Media Corp. - Liberty Braves, Class C * | 17,363 | 476,788 |
| Liberty Media Corp. - Liberty Formula One, Class A * | 12,611 | 499,270 |
| Liberty Media Corp. - Liberty Formula One, Class C * | 104,034 | 4,342,379 |
| Liberty Media Corp. - Liberty SiriusXM, Class A * | 41,991 | 1,700,216 |
| Liberty Media Corp. - Liberty SiriusXM, Class C * | 80,540 | 3,286,837 |
| Liberty TripAdvisor Holdings, Inc., Class A * | 37,070 | 323,992 |
| Lions Gate Entertainment Corp., Class A | 28,135 | 254,059 |
| Lions Gate Entertainment Corp., Class B | 54,678 | 456,015 |
| Live Nation Entertainment, Inc. * | 71,040 | 4,937,990 |
| Loral Space & Communications, Inc. * | 5,742 | 212,397 |
| Match Group, Inc.(a) | 28,404 | 2,408,659 |
| Meredith Corp. | 20,080 | 879,102 |
| MSG Networks, Inc., Class A * | 31,956 | 524,078 |
| National CineMedia, Inc. | 36,068 | 295,758 |
| Netflix, Inc. * | 224,079 | 65,823,206 |
| New Media Investment Group, Inc.(a) | 31,066 | 272,759 |
| News Corp., Class A | 202,295 | 2,781,556 |
| Security | Number of Shares | Value ($) |
| News Corp., Class B | 58,767 | 832,141 |
| Nexstar Media Group, Inc., Class A | 23,781 | 2,351,703 |
| Omnicom Group, Inc. | 112,564 | 8,561,618 |
| Pinterest, Inc., Class A * | 44,459 | 1,530,279 |
| Scholastic Corp. | 13,881 | 486,807 |
| Sciplay Corp., Class A * | 11,541 | 109,755 |
| Sinclair Broadcast Group, Inc., Class A | 33,450 | 1,490,867 |
| Sirius XM Holdings, Inc. | 829,352 | 5,117,102 |
| Snap, Inc., Class A * | 388,316 | 6,147,042 |
| Take-Two Interactive Software, Inc. * | 57,760 | 7,622,587 |
| TEGNA, Inc. | 111,917 | 1,601,532 |
| The E.W. Scripps Co., Class A | 28,014 | 346,253 |
| The Interpublic Group of Cos., Inc. | 196,695 | 3,910,297 |
| The Madison Square Garden Co., Class A * | 8,921 | 2,251,036 |
| The Marcus Corp. | 11,445 | 384,094 |
| The New York Times Co., Class A | 72,639 | 2,121,059 |
| The Walt Disney Co. | 894,518 | 122,781,541 |
| Tribune Media Co., Class A | 41,606 | 1,938,007 |
| Tribune Publishing Co. | 9,100 | 69,615 |
| TripAdvisor, Inc. * | 52,746 | 2,003,821 |
| TrueCar, Inc. * | 45,241 | 179,154 |
| Twitter, Inc. * | 374,068 | 15,954,000 |
| Viacom, Inc., Class A | 5,428 | 148,022 |
| Viacom, Inc., Class B | 180,396 | 4,506,292 |
| WideOpenWest, Inc. * | 15,175 | 85,284 |
| World Wrestling Entertainment, Inc., Class A | 22,056 | 1,575,460 |
| Yelp, Inc. * | 36,346 | 1,217,954 |
| Zillow Group, Inc., Class A * | 25,167 | 859,956 |
| Zillow Group, Inc., Class C * | 60,518 | 2,083,635 |
| Zynga, Inc., Class A * | 433,932 | 2,477,752 |
| 1,133,027,551 | ||
| Pharmaceuticals, Biotechnology & Life Sciences 7.4% | ||
| AbbVie, Inc. | 757,573 | 49,802,849 |
| ACADIA Pharmaceuticals, Inc. * | 56,439 | 1,561,103 |
| Accelerate Diagnostics, Inc. *(a) | 12,996 | 244,195 |
| Acceleron Pharma, Inc. * | 23,758 | 1,066,972 |
| Achillion Pharmaceuticals, Inc. * | 58,847 | 255,984 |
| Aclaris Therapeutics, Inc. * | 15,150 | 15,302 |
| Acorda Therapeutics, Inc. * | 18,432 | 59,535 |
| Aduro Biotech, Inc. * | 27,927 | 34,350 |
| Aerie Pharmaceuticals, Inc. * | 20,833 | 451,243 |
| Agenus, Inc. * | 53,713 | 154,693 |
| Agilent Technologies, Inc. | 162,777 | 11,575,072 |
| Agios Pharmaceuticals, Inc. * | 25,988 | 986,245 |
| Aimmune Therapeutics, Inc. * | 19,991 | 407,616 |
| Akcea Therapeutics, Inc. *(a) | 8,773 | 184,759 |
| Akebia Therapeutics, Inc. * | 55,458 | 229,042 |
| Akorn, Inc. * | 55,114 | 159,279 |
| Alder Biopharmaceuticals, Inc. * | 39,121 | 350,133 |
| Alector, Inc. * | 5,336 | 87,831 |
| Alexion Pharmaceuticals, Inc. * | 114,987 | 11,586,090 |
| Alkermes plc * | 82,324 | 1,727,158 |
| Allakos, Inc. *(a) | 12,326 | 1,090,358 |
| Allergan plc | 157,682 | 25,184,969 |
| Allogene Therapeutics, Inc. *(a) | 9,550 | 260,047 |
| Alnylam Pharmaceuticals, Inc. * | 48,591 | 3,920,808 |
| AMAG Pharmaceuticals, Inc. * | 17,781 | 194,169 |
| Amgen, Inc. | 312,747 | 65,245,279 |
| Amicus Therapeutics, Inc. * | 128,354 | 1,269,421 |
| Amneal Pharmaceuticals, Inc. * | 40,942 | 104,402 |
| Amphastar Pharmaceuticals, Inc. * | 19,936 | 447,763 |
| AnaptysBio, Inc. * | 12,453 | 506,214 |
| ANI Pharmaceuticals, Inc. * | 4,807 | 314,859 |
| Anika Therapeutics, Inc. * | 7,580 | 430,241 |
| Security | Number of Shares | Value ($) |
| Apellis Pharmaceuticals, Inc. * | 21,355 | 621,430 |
| Arena Pharmaceuticals, Inc. * | 26,052 | 1,377,890 |
| Arqule, Inc. * | 49,798 | 446,190 |
| Arrowhead Pharmaceuticals, Inc. * | 48,248 | 1,648,634 |
| Arvinas Holding Co. LLC * | 4,614 | 120,010 |
| Assembly Biosciences, Inc. * | 10,530 | 119,094 |
| Assertio Therapeutics, Inc. * | 29,256 | 42,129 |
| Atara Biotherapeutics, Inc. * | 24,427 | 329,765 |
| Athenex, Inc. * | 29,022 | 427,494 |
| Audentes Therapeutics, Inc. * | 18,060 | 561,666 |
| Avantor, Inc. * | 114,405 | 2,002,087 |
| Avrobio, Inc. * | 11,012 | 214,514 |
| Bellicum Pharmaceuticals, Inc. *(a) | 21,646 | 25,109 |
| Bio-Rad Laboratories, Inc., Class A * | 10,345 | 3,493,610 |
| Bio-Techne Corp. | 19,330 | 3,703,048 |
| BioCryst Pharmaceuticals, Inc. * | 60,837 | 181,903 |
| Biogen, Inc. * | 99,341 | 21,830,185 |
| Biohaven Pharmaceutical Holding Co., Ltd. * | 20,999 | 822,951 |
| BioMarin Pharmaceutical, Inc. * | 92,248 | 6,924,135 |
| Bluebird Bio, Inc. * | 28,135 | 2,906,627 |
| Blueprint Medicines Corp. * | 25,245 | 1,935,534 |
| Bristol-Myers Squibb Co. | 836,389 | 40,205,219 |
| Bruker Corp. | 51,667 | 2,230,464 |
| Cambrex Corp. * | 17,935 | 1,074,845 |
| Cara Therapeutics, Inc. * | 20,867 | 489,122 |
| CASI Pharmaceuticals, Inc. *(a) | 25,250 | 82,315 |
| Catalent, Inc. * | 74,631 | 3,936,039 |
| Celgene Corp. * | 360,715 | 34,917,212 |
| Charles River Laboratories International, Inc. * | 25,164 | 3,301,517 |
| Chimerix, Inc. * | 27,180 | 54,904 |
| Clovis Oncology, Inc. * | 26,310 | 147,599 |
| Codexis, Inc. * | 24,655 | 345,910 |
| Coherus Biosciences, Inc. * | 30,111 | 668,163 |
| Corcept Therapeutics, Inc. * | 50,175 | 632,707 |
| Cortexyme, Inc. *(a) | 2,562 | 50,856 |
| Crinetics Pharmaceuticals, Inc. * | 2,522 | 39,999 |
| Cymabay Therapeutics, Inc. * | 30,596 | 181,128 |
| Cytokinetics, Inc. * | 26,542 | 372,915 |
| CytomX Therapeutics, Inc. * | 23,199 | 203,687 |
| Deciphera Pharmaceuticals, Inc. * | 12,561 | 455,713 |
| Denali Therapeutics, Inc. * | 34,052 | 612,936 |
| Dermira, Inc. * | 24,159 | 193,514 |
| Dicerna Pharmaceuticals, Inc. * | 25,658 | 356,646 |
| Dova Pharmaceuticals, Inc. *(a) | 8,040 | 120,520 |
| Dynavax Technologies Corp. * | 45,481 | 188,291 |
| Eagle Pharmaceuticals, Inc. * | 5,807 | 327,457 |
| Editas Medicine, Inc. * | 23,312 | 578,837 |
| Eidos Therapeutics, Inc. *(a) | 3,553 | 148,551 |
| Elanco Animal Health, Inc. * | 190,682 | 4,961,546 |
| Eli Lilly & Co. | 442,699 | 50,011,706 |
| Eloxx Pharmaceuticals, Inc. * | 12,567 | 77,915 |
| Emergent BioSolutions, Inc. * | 23,213 | 1,016,729 |
| Enanta Pharmaceuticals, Inc. * | 8,609 | 607,365 |
| Endo International plc * | 103,022 | 244,162 |
| Epizyme, Inc. * | 34,858 | 452,108 |
| Esperion Therapeutics, Inc. * | 12,201 | 447,045 |
| Exact Sciences Corp. * | 66,256 | 7,899,040 |
| Exelixis, Inc. * | 153,663 | 3,050,211 |
| FibroGen, Inc. * | 39,027 | 1,742,946 |
| Five Prime Therapeutics, Inc. * | 19,568 | 106,254 |
| Flexion Therapeutics, Inc. *(a) | 16,051 | 211,392 |
| G1 Therapeutics, Inc. * | 13,545 | 491,683 |
| Genomic Health, Inc. * | 10,729 | 822,485 |
| Geron Corp. *(a) | 98,255 | 137,557 |
| Gilead Sciences, Inc. | 650,520 | 41,334,041 |
| Global Blood Therapeutics, Inc. * | 30,537 | 1,404,091 |
| Security | Number of Shares | Value ($) |
| Gossamer Bio, Inc. * | 9,089 | 190,505 |
| Gritstone Oncology, Inc. *(a) | 10,555 | 106,817 |
| Halozyme Therapeutics, Inc. * | 64,374 | 1,063,458 |
| Harpoon Therapeutics, Inc. * | 5,302 | 76,773 |
| Heron Therapeutics, Inc. * | 36,221 | 670,813 |
| Homology Medicines, Inc. * | 12,462 | 235,656 |
| Horizon Therapeutics plc * | 95,812 | 2,647,286 |
| Illumina, Inc. * | 75,270 | 21,176,462 |
| ImmunoGen, Inc. * | 72,808 | 198,038 |
| Immunomedics, Inc. * | 86,100 | 1,102,080 |
| Incyte Corp. * | 90,915 | 7,438,665 |
| Innoviva, Inc. * | 32,252 | 373,801 |
| Inovio Pharmaceuticals, Inc. *(a) | 43,760 | 94,522 |
| Insmed, Inc. * | 43,981 | 723,048 |
| Intellia Therapeutics, Inc. * | 15,421 | 218,824 |
| Intercept Pharmaceuticals, Inc. * | 12,316 | 790,441 |
| Intersect ENT, Inc. * | 15,527 | 254,332 |
| Intra-Cellular Therapies, Inc. * | 24,841 | 212,639 |
| Intrexon Corp. *(a) | 38,250 | 223,380 |
| Invitae Corp. * | 44,677 | 1,083,864 |
| Ionis Pharmaceuticals, Inc. * | 72,015 | 4,552,068 |
| Iovance Biotherapeutics, Inc. * | 66,954 | 1,406,704 |
| IQVIA Holdings, Inc. * | 80,841 | 12,542,481 |
| Ironwood Pharmaceuticals, Inc. * | 81,422 | 758,039 |
| Jazz Pharmaceuticals plc * | 29,038 | 3,721,220 |
| Johnson & Johnson | 1,360,285 | 174,606,183 |
| Jounce Therapeutics, Inc. * | 10,382 | 39,140 |
| Kaleido Biosciences, Inc. * | 5,178 | 48,466 |
| Karyopharm Therapeutics, Inc. *(a) | 23,067 | 199,299 |
| Kodiak Sciences, Inc. * | 3,257 | 35,827 |
| Kura Oncology, Inc. * | 15,433 | 234,273 |
| La Jolla Pharmaceutical Co. * | 11,943 | 114,295 |
| Lannett Co., Inc. *(a) | 20,603 | 212,211 |
| Lexicon Pharmaceuticals, Inc. * | 22,905 | 30,235 |
| Ligand Pharmaceuticals, Inc. * | 10,360 | 941,828 |
| Luminex Corp. | 22,738 | 466,129 |
| MacroGenics, Inc. * | 22,710 | 325,661 |
| Madrigal Pharmaceuticals, Inc. * | 4,325 | 400,927 |
| Mallinckrodt plc * | 42,673 | 110,523 |
| Medpace Holdings, Inc. * | 13,218 | 1,069,468 |
| Merck & Co., Inc. | 1,319,021 | 114,055,746 |
| Mettler-Toledo International, Inc. * | 12,816 | 8,417,421 |
| Mirati Therapeutics, Inc. * | 17,501 | 1,434,557 |
| Momenta Pharmaceuticals, Inc. * | 48,331 | 610,421 |
| Mylan N.V. * | 264,215 | 5,144,266 |
| MyoKardia, Inc. * | 19,075 | 1,025,663 |
| Myriad Genetics, Inc. * | 37,832 | 890,187 |
| Natera, Inc. * | 32,455 | 1,069,392 |
| Nektar Therapeutics * | 89,057 | 1,564,731 |
| NeoGenomics, Inc. * | 55,850 | 1,395,133 |
| Neurocrine Biosciences, Inc. * | 46,500 | 4,623,030 |
| NextCure, Inc. * | 4,746 | 164,829 |
| NGM Biopharmaceuticals, Inc. *(a) | 5,382 | 95,423 |
| Odonate Therapeutics, Inc. * | 4,711 | 145,146 |
| Omeros Corp. *(a) | 24,170 | 446,903 |
| OPKO Health, Inc. * | 203,752 | 374,904 |
| Optinose, Inc. *(a) | 7,737 | 59,265 |
| Organogenesis Holdings, Inc. *(a) | 9,470 | 39,016 |
| Pacific Biosciences of California, Inc. * | 69,401 | 385,176 |
| Pacira BioSciences, Inc. * | 21,588 | 803,937 |
| Paratek Pharmaceuticals, Inc. *(a) | 15,150 | 56,661 |
| PDL BioPharma, Inc. * | 70,956 | 166,037 |
| PerkinElmer, Inc. | 56,798 | 4,697,195 |
| Perrigo Co., plc | 64,709 | 3,027,087 |
| Pfizer, Inc. | 2,844,196 | 101,111,168 |
| Phibro Animal Health Corp., Class A | 10,366 | 214,058 |
| Portola Pharmaceuticals, Inc. * | 34,258 | 995,537 |
| PRA Health Sciences, Inc. * | 30,144 | 2,979,433 |
| Security | Number of Shares | Value ($) |
| Precision BioSciences, Inc. * | 5,704 | 48,598 |
| Prestige Consumer Healthcare, Inc. * | 26,226 | 836,085 |
| Principia Biopharma, Inc. * | 4,444 | 176,427 |
| Progenics Pharmaceuticals, Inc. * | 39,510 | 173,844 |
| Prothena Corp. plc * | 20,265 | 170,429 |
| PTC Therapeutics, Inc. * | 28,819 | 1,284,463 |
| Puma Biotechnology, Inc. * | 15,843 | 170,312 |
| Quanterix Corp. * | 5,316 | 139,970 |
| Radius Health, Inc. * | 21,547 | 609,780 |
| Reata Pharmaceuticals, Inc., Class A * | 8,325 | 641,857 |
| Regeneron Pharmaceuticals, Inc. * | 40,354 | 11,704,678 |
| REGENXBIO, Inc. * | 16,715 | 576,500 |
| Repligen Corp. * | 22,903 | 2,125,627 |
| resTORbio, Inc. *(a) | 11,544 | 111,053 |
| Retrophin, Inc. * | 23,126 | 291,156 |
| Revance Therapeutics, Inc. * | 21,770 | 230,762 |
| Rhythm Pharmaceuticals, Inc. * | 10,139 | 228,330 |
| Rocket Pharmaceuticals, Inc. * | 16,166 | 175,401 |
| Rubius Therapeutics, Inc. *(a) | 6,557 | 60,849 |
| Sage Therapeutics, Inc. * | 26,284 | 4,512,174 |
| Sangamo Therapeutics, Inc. * | 62,125 | 677,162 |
| Sarepta Therapeutics, Inc. * | 35,558 | 3,205,554 |
| Seattle Genetics, Inc. * | 55,092 | 4,001,883 |
| SIGA Technologies, Inc. * | 20,188 | 101,344 |
| Solid Biosciences, Inc. *(a) | 6,836 | 55,235 |
| Spark Therapeutics, Inc. * | 16,814 | 1,637,852 |
| Spectrum Pharmaceuticals, Inc. * | 57,280 | 420,435 |
| Supernus Pharmaceuticals, Inc. * | 26,881 | 726,593 |
| Syneos Health, Inc. * | 30,707 | 1,613,039 |
| Synthorx, Inc. *(a) | 6,487 | 116,182 |
| Syros Pharmaceuticals, Inc. * | 15,150 | 166,196 |
| TCR2 Therapeutics, Inc. *(a) | 5,418 | 91,347 |
| TG Therapeutics, Inc. * | 37,128 | 230,565 |
| The Medicines Co. * | 34,191 | 1,434,654 |
| TherapeuticsMD, Inc. *(a) | 106,562 | 307,964 |
| Theravance Biopharma, Inc. * | 20,777 | 457,717 |
| Thermo Fisher Scientific, Inc. | 204,602 | 58,733,050 |
| Tricida, Inc. * | 14,320 | 499,625 |
| Turning Point Therapeutics * | 5,195 | 283,283 |
| Twist Bioscience Corp. * | 11,217 | 325,630 |
| Ultragenyx Pharmaceutical, Inc. * | 28,387 | 1,546,240 |
| United Therapeutics Corp. * | 23,008 | 1,899,540 |
| Vanda Pharmaceuticals, Inc. * | 26,180 | 368,876 |
| Vertex Pharmaceuticals, Inc. * | 131,160 | 23,611,423 |
| Voyager Therapeutics, Inc. * | 11,379 | 203,343 |
| Waters Corp. * | 35,552 | 7,533,113 |
| WaVe Life Sciences Ltd. * | 9,205 | 211,715 |
| Xencor, Inc. * | 24,531 | 914,516 |
| Y-mAbs Therapeutics, Inc. * | 2,871 | 76,282 |
| ZIOPHARM Oncology, Inc. *(a) | 65,579 | 327,239 |
| Zoetis, Inc. | 244,697 | 30,934,595 |
| Zogenix, Inc. * | 21,891 | 934,527 |
| 1,101,181,045 | ||
| Real Estate 4.3% | ||
| Acadia Realty Trust | 41,890 | 1,145,692 |
| Agree Realty Corp. | 20,332 | 1,518,597 |
| Alexander & Baldwin, Inc. | 35,940 | 822,667 |
| Alexander's, Inc. | 1,999 | 754,762 |
| Alexandria Real Estate Equities, Inc. | 57,634 | 8,635,879 |
| Altisource Portfolio Solutions S.A. * | 4,751 | 94,070 |
| American Assets Trust, Inc. | 24,120 | 1,130,263 |
| American Campus Communities, Inc. | 69,884 | 3,248,208 |
| American Finance Trust, Inc.(a) | 30,466 | 364,678 |
| American Homes 4 Rent, Class A | 134,107 | 3,430,457 |
| American Tower Corp. | 226,268 | 52,084,631 |
| Americold Realty Trust | 97,965 | 3,567,885 |
| Security | Number of Shares | Value ($) |
| Apartment Investment & Management Co., Class A | 76,497 | 3,901,347 |
| Apple Hospitality REIT, Inc. | 106,117 | 1,690,444 |
| Armada Hoffler Properties, Inc. | 28,066 | 486,664 |
| Ashford Hospitality Trust, Inc. | 55,389 | 155,089 |
| AvalonBay Communities, Inc. | 71,808 | 15,263,508 |
| Boston Properties, Inc. | 78,874 | 10,128,999 |
| Braemar Hotels & Resorts, Inc. | 16,055 | 147,224 |
| Brandywine Realty Trust | 90,536 | 1,299,192 |
| Brixmor Property Group, Inc. | 150,918 | 2,781,419 |
| Camden Property Trust | 50,438 | 5,459,914 |
| CareTrust REIT, Inc. | 48,246 | 1,147,772 |
| CBRE Group, Inc., Class A * | 159,289 | 8,326,036 |
| Cedar Realty Trust, Inc. | 48,007 | 113,777 |
| Chatham Lodging Trust | 23,745 | 393,930 |
| Chesapeake Lodging Trust | 30,725 | 791,169 |
| Colony Capital, Inc. | 254,887 | 1,146,992 |
| Columbia Property Trust, Inc. | 60,418 | 1,292,341 |
| CoreCivic, Inc. | 61,411 | 1,040,916 |
| CorePoint Lodging, Inc. | 20,587 | 187,342 |
| CoreSite Realty Corp. | 18,755 | 2,178,956 |
| Corporate Office Properties Trust | 56,676 | 1,637,370 |
| Cousins Properties, Inc. | 74,274 | 2,577,308 |
| Crown Castle International Corp. | 213,837 | 31,042,717 |
| CubeSmart | 95,732 | 3,435,821 |
| CyrusOne, Inc. | 58,220 | 4,276,841 |
| DiamondRock Hospitality Co. | 108,087 | 1,023,584 |
| Digital Realty Trust, Inc. | 105,938 | 13,097,115 |
| Douglas Emmett, Inc. | 81,823 | 3,452,931 |
| Duke Realty Corp. | 184,166 | 6,127,203 |
| Easterly Government Properties, Inc. | 35,811 | 735,916 |
| EastGroup Properties, Inc. | 18,578 | 2,313,333 |
| Empire State Realty Trust, Inc., Class A | 72,525 | 1,019,702 |
| EPR Properties | 38,907 | 3,044,473 |
| Equinix, Inc. | 43,040 | 23,942,291 |
| Equity Commonwealth | 65,037 | 2,189,145 |
| Equity LifeStyle Properties, Inc. | 46,145 | 6,216,654 |
| Equity Residential | 190,364 | 16,135,253 |
| Essex Property Trust, Inc. | 33,716 | 10,831,602 |
| eXp World Holdings, Inc. *(a) | 18,229 | 158,592 |
| Extra Space Storage, Inc. | 66,166 | 8,066,959 |
| Federal Realty Investment Trust | 38,330 | 4,952,619 |
| First Industrial Realty Trust, Inc. | 64,461 | 2,510,756 |
| Forestar Group, Inc. * | 5,819 | 110,910 |
| Four Corners Property Trust, Inc. | 36,213 | 1,031,708 |
| Franklin Street Properties Corp. | 52,349 | 396,282 |
| Front Yard Residential Corp. | 28,229 | 313,060 |
| FRP Holdings, Inc. * | 3,539 | 174,083 |
| Gaming & Leisure Properties, Inc. | 105,802 | 4,138,974 |
| Getty Realty Corp. | 16,420 | 521,499 |
| Gladstone Commercial Corp. | 14,247 | 322,979 |
| Global Net Lease, Inc. | 43,174 | 828,077 |
| Hannon Armstrong Sustainable Infrastructure Capital, Inc. | 31,821 | 879,214 |
| HCP, Inc. | 243,657 | 8,457,334 |
| Healthcare Realty Trust, Inc. | 66,709 | 2,216,740 |
| Healthcare Trust of America, Inc., Class A | 106,143 | 3,010,215 |
| Hersha Hospitality Trust | 18,996 | 264,044 |
| Highwoods Properties, Inc. | 53,919 | 2,329,840 |
| Hospitality Properties Trust | 84,352 | 2,036,257 |
| Host Hotels & Resorts, Inc. | 378,028 | 6,063,569 |
| Hudson Pacific Properties, Inc. | 80,156 | 2,725,304 |
| Independence Realty Trust, Inc. | 46,342 | 644,617 |
| Industrial Logistics Properties Trust | 32,075 | 686,084 |
| Investors Real Estate Trust | 5,959 | 412,661 |
| Invitation Homes, Inc. | 214,671 | 6,173,938 |
| Iron Mountain, Inc. | 146,145 | 4,654,718 |
| Security | Number of Shares | Value ($) |
| iStar, Inc. | 32,475 | 415,680 |
| JBG SMITH Properties | 60,847 | 2,328,006 |
| Jones Lang LaSalle, Inc. | 26,329 | 3,529,402 |
| Kennedy-Wilson Holdings, Inc. | 64,418 | 1,351,490 |
| Kilroy Realty Corp. | 51,571 | 4,015,318 |
| Kimco Realty Corp. | 215,473 | 3,960,394 |
| Kite Realty Group Trust | 43,991 | 628,631 |
| Lamar Advertising Co., Class A | 44,090 | 3,379,499 |
| Lexington Realty Trust | 109,064 | 1,133,175 |
| Liberty Property Trust | 75,485 | 3,934,278 |
| Life Storage, Inc. | 23,795 | 2,521,318 |
| LTC Properties, Inc. | 21,194 | 1,034,267 |
| Mack-Cali Realty Corp. | 46,820 | 953,723 |
| Marcus & Millichap, Inc. * | 11,423 | 412,142 |
| Medical Properties Trust, Inc. | 224,643 | 4,176,113 |
| Mid-America Apartment Communities, Inc. | 58,031 | 7,351,367 |
| Monmouth Real Estate Investment Corp., Class A | 50,978 | 668,831 |
| National Health Investors, Inc. | 21,815 | 1,809,772 |
| National Retail Properties, Inc. | 83,616 | 4,695,038 |
| National Storage Affiliates Trust | 29,868 | 999,383 |
| New Senior Investment Group, Inc. | 41,741 | 260,881 |
| Newmark Group, Inc., Class A | 73,817 | 640,732 |
| NexPoint Residential Trust, Inc. | 10,593 | 491,515 |
| NorthStar Realty Europe Corp. | 26,632 | 450,880 |
| Office Properties Income Trust | 25,959 | 703,749 |
| Omega Healthcare Investors, Inc. | 109,975 | 4,473,783 |
| One Liberty Properties, Inc. | 7,489 | 200,555 |
| Outfront Media, Inc. | 72,522 | 1,992,905 |
| Paramount Group, Inc. | 103,734 | 1,367,214 |
| Park Hotels & Resorts, Inc. | 103,016 | 2,426,027 |
| Pebblebrook Hotel Trust | 66,778 | 1,801,003 |
| Pennsylvania Real Estate Investment Trust(a) | 28,144 | 144,660 |
| Physicians Realty Trust | 93,733 | 1,623,456 |
| Piedmont Office Realty Trust, Inc., Class A | 64,376 | 1,270,782 |
| PotlatchDeltic Corp. | 34,348 | 1,321,711 |
| Preferred Apartment Communities, Inc., Class A | 22,945 | 308,840 |
| Prologis, Inc. | 322,499 | 26,967,366 |
| PS Business Parks, Inc. | 10,215 | 1,834,716 |
| Public Storage | 77,004 | 20,386,039 |
| QTS Realty Trust, Inc., Class A | 28,223 | 1,384,620 |
| Rayonier, Inc. | 67,741 | 1,815,459 |
| RE/MAX Holdings, Inc., Class A | 9,898 | 254,082 |
| Realogy Holdings Corp.(a) | 55,373 | 264,683 |
| Realty Income Corp. | 161,183 | 11,896,917 |
| Redfin Corp. * | 37,158 | 627,599 |
| Regency Centers Corp. | 85,380 | 5,507,864 |
| Retail Opportunity Investments Corp. | 58,834 | 1,030,183 |
| Retail Properties of America, Inc., Class A | 111,422 | 1,265,754 |
| Retail Value, Inc. | 9,525 | 352,330 |
| Rexford Industrial Realty, Inc. | 56,429 | 2,493,598 |
| RLJ Lodging Trust | 89,608 | 1,452,546 |
| RPT Realty | 41,661 | 495,766 |
| Ryman Hospitality Properties, Inc. | 26,432 | 2,105,573 |
| Sabra Health Care REIT, Inc. | 97,192 | 2,101,291 |
| Saul Centers, Inc. | 5,780 | 290,329 |
| SBA Communications Corp. | 58,119 | 15,252,169 |
| Senior Housing Properties Trust | 120,449 | 1,022,612 |
| Seritage Growth Properties, Class A | 14,604 | 570,870 |
| Simon Property Group, Inc. | 158,239 | 23,568,117 |
| SITE Centers Corp. | 71,583 | 992,140 |
| SL Green Realty Corp. | 43,569 | 3,495,105 |
| Security | Number of Shares | Value ($) |
| Spirit MTA REIT | 23,155 | 194,502 |
| Spirit Realty Capital, Inc. | 44,922 | 2,153,561 |
| STAG Industrial, Inc. | 64,596 | 1,878,452 |
| STORE Capital Corp. | 103,193 | 3,896,568 |
| Summit Hotel Properties, Inc. | 54,403 | 607,137 |
| Sun Communities, Inc. | 46,005 | 6,799,539 |
| Sunstone Hotel Investors, Inc. | 115,775 | 1,521,284 |
| Tanger Factory Outlet Centers, Inc.(a) | 48,997 | 692,818 |
| Taubman Centers, Inc. | 31,471 | 1,228,943 |
| Tejon Ranch Co. * | 9,475 | 158,612 |
| Terreno Realty Corp. | 32,869 | 1,661,857 |
| The GEO Group, Inc. | 61,541 | 1,056,044 |
| The Howard Hughes Corp. * | 20,384 | 2,573,888 |
| The Macerich Co. | 53,823 | 1,535,570 |
| The RMR Group, Inc., Class A | 7,902 | 368,154 |
| The St. Joe Co. * | 32,455 | 583,541 |
| UDR, Inc. | 143,725 | 6,924,671 |
| UMH Properties, Inc. | 17,651 | 226,992 |
| Uniti Group, Inc. | 96,266 | 711,406 |
| Universal Health Realty Income Trust | 6,484 | 626,938 |
| Urban Edge Properties | 60,374 | 1,057,149 |
| Urstadt Biddle Properties, Inc. | 4,332 | 73,254 |
| Urstadt Biddle Properties, Inc., Class A | 14,199 | 298,037 |
| Ventas, Inc. | 189,396 | 13,899,772 |
| VEREIT, Inc. | 502,798 | 4,902,281 |
| VICI Properties, Inc. | 209,695 | 4,646,841 |
| Vornado Realty Trust | 89,256 | 5,397,310 |
| Washington Prime Group, Inc.(a) | 96,885 | 312,939 |
| Washington Real Estate Investment Trust | 41,757 | 1,106,143 |
| Weingarten Realty Investors | 59,738 | 1,582,460 |
| Welltower, Inc. | 207,021 | 18,540,801 |
| Weyerhaeuser Co. | 377,380 | 9,928,868 |
| Whitestone REIT | 18,996 | 235,930 |
| WP Carey, Inc. | 87,379 | 7,846,634 |
| Xenia Hotels & Resorts, Inc. | 59,459 | 1,201,666 |
| 634,545,922 | ||
| Retailing 6.0% | ||
| 1-800-Flowers.com, Inc., Class A * | 11,302 | 166,365 |
| Aaron's, Inc. | 34,296 | 2,198,717 |
| Abercrombie & Fitch Co., Class A | 32,934 | 481,495 |
| Advance Auto Parts, Inc. | 36,680 | 5,060,006 |
| Amazon.com, Inc. * | 211,869 | 376,340,786 |
| America's Car-Mart, Inc. * | 3,259 | 279,557 |
| American Eagle Outfitters, Inc. | 84,098 | 1,414,528 |
| Asbury Automotive Group, Inc. * | 10,461 | 986,472 |
| At Home Group, Inc. * | 14,676 | 98,916 |
| AutoNation, Inc. * | 28,970 | 1,374,916 |
| AutoZone, Inc. * | 12,763 | 14,060,869 |
| Barnes & Noble Education, Inc. * | 21,632 | 84,365 |
| Bed Bath & Beyond, Inc.(a) | 66,619 | 644,206 |
| Best Buy Co., Inc. | 119,229 | 7,588,926 |
| Big Lots, Inc. | 21,410 | 487,078 |
| Booking Holdings, Inc. * | 22,242 | 43,736,891 |
| Boot Barn Holdings, Inc. * | 13,697 | 469,122 |
| Burlington Stores, Inc. * | 34,033 | 6,891,342 |
| Caleres, Inc. | 21,499 | 433,205 |
| Camping World Holdings, Inc., Class A(a) | 14,432 | 109,683 |
| CarMax, Inc. * | 85,076 | 7,085,129 |
| Carvana Co. * | 19,057 | 1,546,666 |
| Chico's FAS, Inc. | 60,012 | 187,237 |
| Conn's, Inc. * | 12,792 | 257,887 |
| Core-Mark Holding Co., Inc. | 23,129 | 749,148 |
| Designer Brands, Inc., Class A | 29,383 | 484,526 |
| Dick's Sporting Goods, Inc. | 34,836 | 1,185,817 |
| Dillard's, Inc., Class A(a) | 9,522 | 557,227 |
| Security | Number of Shares | Value ($) |
| Dollar General Corp. | 131,965 | 20,598,417 |
| Dollar Tree, Inc. * | 121,720 | 12,358,232 |
| Duluth Holdings, Inc., Class B * | 5,055 | 46,455 |
| eBay, Inc. | 418,607 | 16,865,676 |
| Etsy, Inc. * | 61,749 | 3,259,730 |
| Expedia Group, Inc. | 70,826 | 9,214,463 |
| Express, Inc. * | 34,136 | 72,368 |
| Five Below, Inc. * | 28,556 | 3,508,676 |
| Floor & Decor Holdings, Inc., Class A * | 29,565 | 1,455,189 |
| Foot Locker, Inc. | 57,149 | 2,068,222 |
| GameStop Corp., Class A(a) | 53,105 | 210,827 |
| Genesco, Inc. * | 8,619 | 307,526 |
| Genuine Parts Co. | 74,566 | 6,732,564 |
| GNC Holdings, Inc., Class A *(a) | 46,494 | 91,128 |
| Group 1 Automotive, Inc. | 9,066 | 677,412 |
| Groupon, Inc. * | 202,288 | 501,674 |
| GrubHub, Inc. * | 46,571 | 2,763,523 |
| Guess?, Inc. | 25,505 | 460,875 |
| Haverty Furniture Cos., Inc. | 10,423 | 199,600 |
| Hibbett Sports, Inc. * | 10,998 | 181,907 |
| J.C. Penney Co., Inc. * | 182,807 | 136,027 |
| Kohl's Corp. | 83,538 | 3,948,006 |
| L Brands, Inc. | 119,047 | 1,965,466 |
| Lands' End, Inc. * | 7,351 | 56,970 |
| Liquidity Services, Inc. * | 14,337 | 108,531 |
| Lithia Motors, Inc., Class A | 11,480 | 1,504,684 |
| LKQ Corp. * | 161,224 | 4,235,355 |
| Lowe's Cos., Inc. | 400,345 | 44,918,709 |
| Lumber Liquidators Holdings, Inc. *(a) | 13,391 | 126,009 |
| Macy's, Inc. | 158,161 | 2,334,456 |
| MarineMax, Inc. * | 11,498 | 166,261 |
| Monro, Inc. | 17,258 | 1,341,292 |
| Murphy USA, Inc. * | 15,482 | 1,384,091 |
| National Vision Holdings, Inc. * | 40,127 | 1,138,002 |
| Nordstrom, Inc.(a) | 54,160 | 1,569,015 |
| O'Reilly Automotive, Inc. * | 40,036 | 15,364,215 |
| Office Depot, Inc. | 281,784 | 366,319 |
| Ollie's Bargain Outlet Holdings, Inc. * | 26,697 | 1,480,349 |
| Overstock.com, Inc. * | 15,092 | 237,397 |
| Party City Holdco, Inc. * | 28,052 | 131,844 |
| Penske Automotive Group, Inc. | 18,889 | 808,071 |
| PetMed Express, Inc.(a) | 9,762 | 154,240 |
| Pier 1 Imports, Inc. * | 2,225 | 9,746 |
| Pool Corp. | 20,474 | 4,020,684 |
| Quotient Technology, Inc. * | 42,984 | 315,503 |
| Qurate Retail, Inc., Series A * | 206,649 | 2,213,211 |
| Rent-A-Center, Inc. * | 22,523 | 575,012 |
| RH * | 8,433 | 1,208,027 |
| Ross Stores, Inc. | 187,918 | 19,921,187 |
| Sally Beauty Holdings, Inc. * | 62,504 | 764,424 |
| Shoe Carnival, Inc. | 4,641 | 142,664 |
| Shutterfly, Inc. * | 17,109 | 870,506 |
| Shutterstock, Inc. * | 8,998 | 315,920 |
| Signet Jewelers Ltd. | 26,376 | 322,842 |
| Sleep Number Corp. * | 15,733 | 658,269 |
| Sonic Automotive, Inc., Class A | 13,605 | 366,111 |
| Sportsman's Warehouse Holdings, Inc. * | 15,074 | 63,612 |
| Stamps.com, Inc. * | 8,549 | 550,214 |
| Stitch Fix, Inc., Class A *(a) | 12,212 | 232,761 |
| Tailored Brands, Inc.(a) | 24,569 | 133,164 |
| Target Corp. | 261,967 | 28,040,948 |
| The Buckle, Inc. | 16,564 | 324,654 |
| The Cato Corp., Class A | 11,290 | 193,398 |
| The Children's Place, Inc. | 8,500 | 741,625 |
| The Container Store Group, Inc. * | 10,494 | 47,013 |
| The Gap, Inc. | 108,045 | 1,706,031 |
| The Home Depot, Inc. | 563,464 | 128,419,080 |
| The Michaels Cos., Inc. * | 44,660 | 253,222 |
| Security | Number of Shares | Value ($) |
| The Rubicon Project, Inc. * | 21,958 | 224,630 |
| The TJX Cos., Inc. | 619,793 | 34,070,021 |
| Tiffany & Co. | 55,693 | 4,726,665 |
| Tile Shop Holdings, Inc. | 49,301 | 132,620 |
| Tractor Supply Co. | 61,962 | 6,312,689 |
| Ulta Salon, Cosmetics & Fragrance, Inc. * | 28,538 | 6,784,339 |
| Urban Outfitters, Inc. * | 35,594 | 833,256 |
| Vitamin Shoppe, Inc. * | 7,760 | 50,052 |
| Waitr Holdings, Inc. *(a) | 35,308 | 61,083 |
| Wayfair, Inc., Class A * | 32,950 | 3,714,783 |
| Weyco Group, Inc. | 3,518 | 86,297 |
| Williams-Sonoma, Inc. | 40,782 | 2,683,456 |
| Winmark Corp. | 1,346 | 218,725 |
| Zumiez, Inc. * | 9,938 | 258,189 |
| 892,577,488 | ||
| Semiconductors & Semiconductor Equipment 3.7% | ||
| Advanced Energy Industries, Inc. * | 18,977 | 979,972 |
| Advanced Micro Devices, Inc. * | 454,021 | 14,278,960 |
| Amkor Technology, Inc. * | 64,265 | 562,319 |
| Analog Devices, Inc. | 188,943 | 20,751,610 |
| Applied Materials, Inc. | 477,438 | 22,926,573 |
| Aquantia Corp. * | 12,100 | 159,478 |
| Axcelis Technologies, Inc. * | 17,888 | 273,865 |
| Broadcom, Inc. | 202,811 | 57,322,501 |
| Brooks Automation, Inc. | 36,336 | 1,211,079 |
| Cabot Microelectronics Corp. | 14,655 | 1,826,746 |
| CEVA, Inc. * | 12,139 | 381,286 |
| Cirrus Logic, Inc. * | 30,559 | 1,639,185 |
| Cohu, Inc. | 21,484 | 256,089 |
| Cree, Inc. * | 54,499 | 2,339,642 |
| Cypress Semiconductor Corp. | 188,458 | 4,336,419 |
| Diodes, Inc. * | 20,475 | 748,361 |
| Entegris, Inc. | 69,503 | 2,976,813 |
| First Solar, Inc. * | 39,263 | 2,437,054 |
| FormFactor, Inc. * | 39,441 | 674,047 |
| Ichor Holdings Ltd. * | 12,270 | 260,860 |
| Impinj, Inc. * | 9,320 | 339,062 |
| Inphi Corp. * | 22,962 | 1,405,045 |
| Intel Corp. | 2,292,366 | 108,681,072 |
| KLA Corp. | 82,502 | 12,202,046 |
| Kulicke & Soffa Industries, Inc. | 34,980 | 728,633 |
| Lam Research Corp. | 76,636 | 16,132,644 |
| Lattice Semiconductor Corp. * | 69,948 | 1,377,276 |
| MACOM Technology Solutions Holdings, Inc. * | 22,753 | 446,869 |
| Marvell Technology Group Ltd. | 304,046 | 7,287,983 |
| Maxim Integrated Products, Inc. | 139,638 | 7,615,857 |
| MaxLinear, Inc., Class A * | 31,518 | 624,687 |
| Microchip Technology, Inc. | 121,823 | 10,516,980 |
| Micron Technology, Inc. * | 567,422 | 25,687,194 |
| MKS Instruments, Inc. | 27,870 | 2,181,942 |
| Monolithic Power Systems, Inc. | 20,650 | 3,109,064 |
| Nanometrics, Inc. * | 13,388 | 365,359 |
| NeoPhotonics Corp. * | 19,518 | 122,183 |
| NVIDIA Corp. | 312,056 | 52,272,501 |
| ON Semiconductor Corp. * | 212,963 | 3,790,741 |
| PDF Solutions, Inc. * | 12,937 | 151,492 |
| Photronics, Inc. * | 34,084 | 368,107 |
| Power Integrations, Inc. | 15,501 | 1,379,899 |
| Qorvo, Inc. * | 60,802 | 4,343,087 |
| QUALCOMM, Inc. | 623,386 | 48,480,729 |
| Rambus, Inc. * | 58,218 | 730,054 |
| Rudolph Technologies, Inc. * | 17,349 | 381,504 |
| Semtech Corp. * | 33,494 | 1,405,743 |
| Silicon Laboratories, Inc. * | 22,214 | 2,421,326 |
| Skyworks Solutions, Inc. | 88,779 | 6,682,395 |
| Security | Number of Shares | Value ($) |
| SMART Global Holdings, Inc. * | 9,101 | 258,559 |
| SolarEdge Technologies, Inc. * | 23,160 | 1,897,267 |
| SunPower Corp. * | 32,270 | 404,020 |
| Synaptics, Inc. * | 17,068 | 546,517 |
| Teradyne, Inc. | 87,981 | 4,660,354 |
| Texas Instruments, Inc. | 480,571 | 59,470,661 |
| Ultra Clean Holdings, Inc. * | 22,049 | 263,265 |
| Universal Display Corp. | 21,955 | 4,511,094 |
| Veeco Instruments, Inc. * | 26,649 | 246,770 |
| Versum Materials, Inc. | 55,504 | 2,886,208 |
| Xilinx, Inc. | 129,976 | 13,525,303 |
| Xperi Corp. | 25,602 | 469,029 |
| 546,713,380 | ||
| Software & Services 12.5% | ||
| 2U, Inc. * | 30,062 | 537,509 |
| 8x8, Inc. * | 49,938 | 1,213,993 |
| A10 Networks, Inc. * | 22,719 | 157,670 |
| Accenture plc, Class A | 326,196 | 64,642,261 |
| ACI Worldwide, Inc. * | 56,658 | 1,687,275 |
| Adobe, Inc. * | 250,178 | 71,178,143 |
| Akamai Technologies, Inc. * | 84,127 | 7,498,240 |
| Alarm.com Holdings, Inc. * | 17,420 | 829,192 |
| Alliance Data Systems Corp. | 20,358 | 2,503,016 |
| Altair Engineering, Inc., Class A * | 14,084 | 483,926 |
| Alteryx, Inc., Class A * | 23,622 | 3,364,954 |
| Anaplan, Inc. * | 10,053 | 546,179 |
| ANSYS, Inc. * | 42,817 | 8,844,280 |
| Appfolio, Inc., Class A * | 6,335 | 625,708 |
| Appian Corp. * | 16,677 | 991,781 |
| Aspen Technology, Inc. * | 35,513 | 4,730,332 |
| Autodesk, Inc. * | 112,614 | 16,083,531 |
| Automatic Data Processing, Inc. | 223,188 | 37,906,250 |
| Avalara, Inc. * | 22,895 | 1,930,964 |
| Avaya Holdings Corp. * | 51,513 | 727,364 |
| Benefitfocus, Inc. * | 13,697 | 357,766 |
| Black Knight, Inc. * | 72,839 | 4,534,228 |
| Blackbaud, Inc. | 25,531 | 2,322,555 |
| Blackline, Inc. * | 23,843 | 1,214,324 |
| Booz Allen Hamilton Holding Corp. | 71,157 | 5,373,065 |
| Bottomline Technologies (DE), Inc. * | 20,272 | 836,017 |
| Box, Inc., Class A * | 76,392 | 1,117,615 |
| Broadridge Financial Solutions, Inc. | 59,493 | 7,700,774 |
| CACI International, Inc., Class A * | 12,801 | 2,845,534 |
| Cadence Design Systems, Inc. * | 143,846 | 9,850,574 |
| Carbon Black, Inc. * | 23,723 | 619,170 |
| Carbonite, Inc. * | 18,269 | 220,141 |
| Cardtronics plc, Class A * | 20,068 | 594,414 |
| Cass Information Systems, Inc. | 5,793 | 293,126 |
| CDK Global, Inc. | 62,313 | 2,689,429 |
| Ceridian HCM Holding, Inc. * | 40,460 | 2,337,374 |
| ChannelAdvisor Corp. * | 11,546 | 99,296 |
| Cision Ltd. * | 39,447 | 272,973 |
| Citrix Systems, Inc. | 63,819 | 5,933,891 |
| Cloudera, Inc. *(a) | 113,286 | 808,862 |
| Cognizant Technology Solutions Corp., Class A | 291,604 | 17,901,570 |
| CommVault Systems, Inc. * | 19,135 | 829,885 |
| Conduent, Inc. * | 97,071 | 631,932 |
| CoreLogic, Inc. * | 42,343 | 2,049,401 |
| Cornerstone OnDemand, Inc. * | 28,573 | 1,490,653 |
| Coupa Software, Inc. * | 28,063 | 3,898,793 |
| CSG Systems International, Inc. | 17,068 | 919,624 |
| DocuSign, Inc. * | 12,851 | 600,013 |
| Dropbox, Inc., Class A * | 100,435 | 1,797,786 |
| DXC Technology Co. | 137,029 | 4,552,103 |
| Ebix, Inc. | 11,746 | 416,043 |
| Security | Number of Shares | Value ($) |
| Elastic N.V. * | 3,821 | 335,828 |
| Endurance International Group Holdings, Inc. * | 39,583 | 199,498 |
| Envestnet, Inc. * | 24,929 | 1,426,188 |
| EPAM Systems, Inc. * | 26,756 | 5,119,225 |
| Euronet Worldwide, Inc. * | 26,676 | 4,085,163 |
| Everbridge, Inc. * | 14,732 | 1,269,898 |
| EVERTEC, Inc. | 29,545 | 1,029,939 |
| Exela Technologies, Inc. * | 35,205 | 40,486 |
| ExlService Holdings, Inc. * | 17,856 | 1,208,851 |
| Fair Isaac Corp. * | 14,869 | 5,244,594 |
| Fidelity National Information Services, Inc. | 313,645 | 42,724,722 |
| FireEye, Inc. * | 106,128 | 1,425,299 |
| Fiserv, Inc. * | 291,884 | 31,214,075 |
| Five9, Inc. * | 31,301 | 1,978,536 |
| FleetCor Technologies, Inc. * | 44,147 | 13,173,465 |
| ForeScout Technologies, Inc. * | 18,395 | 659,093 |
| Fortinet, Inc. * | 74,691 | 5,914,033 |
| Gartner, Inc. * | 46,219 | 6,178,094 |
| Genpact Ltd. | 80,100 | 3,280,896 |
| Global Payments, Inc. | 80,203 | 13,312,094 |
| GoDaddy, Inc., Class A * | 90,087 | 5,706,111 |
| GreenSky, Inc., Class A *(a) | 21,360 | 145,248 |
| GTT Communications, Inc. *(a) | 18,374 | 174,737 |
| GTY Technology Holdings, Inc. * | 18,452 | 115,510 |
| Guidewire Software, Inc. * | 41,769 | 4,017,342 |
| HubSpot, Inc. * | 20,197 | 4,032,937 |
| Instructure, Inc. * | 17,457 | 722,022 |
| Internap Corp. * | 10,579 | 23,274 |
| International Business Machines Corp. | 454,045 | 61,536,719 |
| Intuit, Inc. | 132,501 | 38,207,988 |
| j2 Global, Inc. | 23,653 | 2,001,044 |
| Jack Henry & Associates, Inc. | 39,339 | 5,702,581 |
| KBR, Inc. | 73,122 | 1,866,073 |
| Leidos Holdings, Inc. | 73,772 | 6,444,722 |
| LivePerson, Inc. * | 31,886 | 1,267,150 |
| LiveRamp Holdings, Inc. * | 34,877 | 1,477,390 |
| LogMeIn, Inc. | 25,402 | 1,697,870 |
| Manhattan Associates, Inc. * | 33,126 | 2,737,201 |
| ManTech International Corp., Class A | 13,817 | 971,059 |
| Mastercard, Inc., Class A | 460,094 | 129,456,649 |
| MAXIMUS, Inc. | 32,291 | 2,484,470 |
| Microsoft Corp. | 3,924,136 | 540,981,389 |
| MicroStrategy, Inc., Class A * | 4,267 | 611,418 |
| MoneyGram International, Inc. *(a) | 15,172 | 64,936 |
| MongoDB, Inc. * | 16,859 | 2,567,794 |
| Monotype Imaging Holdings, Inc. | 22,554 | 445,442 |
| New Relic, Inc. * | 24,333 | 1,395,254 |
| NIC, Inc. | 32,653 | 679,835 |
| Nuance Communications, Inc. * | 148,516 | 2,496,554 |
| Nutanix, Inc., Class A * | 76,389 | 1,850,905 |
| Okta, Inc. * | 53,010 | 6,705,765 |
| OneSpan, Inc. * | 14,935 | 201,623 |
| Oracle Corp. | 1,241,462 | 64,630,512 |
| Pagerduty, Inc. *(a) | 4,749 | 186,493 |
| Palo Alto Networks, Inc. * | 49,226 | 10,023,398 |
| Paychex, Inc. | 163,298 | 13,341,447 |
| Paycom Software, Inc. * | 25,223 | 6,308,777 |
| Paylocity Holding Corp. * | 16,312 | 1,781,597 |
| PayPal Holdings, Inc. * | 601,648 | 65,609,714 |
| Pegasystems, Inc. | 18,565 | 1,302,335 |
| Perficient, Inc. * | 17,363 | 639,653 |
| Perspecta, Inc. | 70,866 | 1,838,973 |
| Pivotal Software, Inc., Class A * | 39,721 | 592,240 |
| Pluralsight, Inc., Class A * | 28,785 | 463,438 |
| Presidio, Inc. | 23,937 | 383,471 |
| Progress Software Corp. | 22,625 | 854,772 |
| Security | Number of Shares | Value ($) |
| Proofpoint, Inc. * | 28,395 | 3,225,956 |
| PROS Holdings, Inc. * | 18,413 | 1,307,691 |
| PTC, Inc. * | 53,187 | 3,482,153 |
| Q2 Holdings, Inc. * | 24,142 | 2,171,573 |
| QAD, Inc., Class A | 5,473 | 221,766 |
| Qualys, Inc. * | 17,484 | 1,392,076 |
| Rapid7, Inc. * | 22,232 | 1,193,636 |
| RealPage, Inc. * | 37,508 | 2,388,134 |
| RingCentral, Inc., Class A * | 36,110 | 5,096,204 |
| Sabre Corp. | 141,874 | 3,353,901 |
| SailPoint Technologies Holding, Inc. * | 33,079 | 745,270 |
| salesforce.com, Inc. * | 437,754 | 68,320,267 |
| Science Applications International Corp. | 26,051 | 2,292,749 |
| ServiceNow, Inc. * | 94,256 | 24,679,991 |
| ServiceSource International, Inc. * | 62,538 | 57,535 |
| Splunk, Inc. * | 76,990 | 8,609,022 |
| SPS Commerce, Inc. * | 17,944 | 906,890 |
| Square, Inc., Class A * | 162,045 | 10,020,863 |
| SS&C Technologies Holdings, Inc. | 111,639 | 5,203,494 |
| SVMK, Inc. * | 7,010 | 117,347 |
| Switch, Inc., Class A | 29,757 | 488,015 |
| Sykes Enterprises, Inc. * | 20,080 | 582,320 |
| Symantec Corp. | 316,887 | 7,367,623 |
| Synopsys, Inc. * | 76,483 | 10,846,054 |
| Tenable Holdings, Inc. * | 5,153 | 117,488 |
| Teradata Corp. * | 59,947 | 1,850,564 |
| The Trade Desk, Inc., Class A * | 18,790 | 4,618,018 |
| The Western Union Co. | 222,414 | 4,919,798 |
| TiVo Corp. | 61,200 | 460,836 |
| Total System Services, Inc. | 83,583 | 11,218,510 |
| TTEC Holdings, Inc. | 7,116 | 333,812 |
| Twilio, Inc., Class A * | 59,963 | 7,823,373 |
| Tyler Technologies, Inc. * | 19,625 | 5,034,597 |
| Unisys Corp. * | 27,597 | 180,484 |
| Upland Software, Inc. * | 10,609 | 403,142 |
| USA Technologies, Inc. * | 33,497 | 275,680 |
| Varonis Systems, Inc. * | 15,598 | 1,065,655 |
| Verint Systems, Inc. * | 33,619 | 1,791,557 |
| VeriSign, Inc. * | 53,870 | 10,981,399 |
| Verra Mobility Corp. * | 59,744 | 831,636 |
| VirnetX Holding Corp. *(a) | 30,352 | 159,652 |
| Virtusa Corp. * | 13,721 | 495,877 |
| Visa, Inc., Class A | 890,471 | 161,014,966 |
| VMware, Inc., Class A | 38,841 | 5,493,671 |
| WEX, Inc. * | 22,321 | 4,565,761 |
| Workday, Inc., Class A * | 82,946 | 14,704,667 |
| Workiva, Inc. * | 18,345 | 882,578 |
| Yext, Inc. * | 41,919 | 661,063 |
| Zendesk, Inc. * | 56,247 | 4,511,009 |
| Zoom Video Communications, Inc., Class A *(a) | 12,384 | 1,135,241 |
| Zscaler, Inc. * | 7,670 | 527,236 |
| 1,858,286,108 | ||
| Technology Hardware & Equipment 5.3% | ||
| 3D Systems Corp. * | 65,123 | 455,861 |
| Acacia Communications, Inc. * | 14,376 | 906,407 |
| ADTRAN, Inc. | 26,851 | 275,760 |
| Amphenol Corp., Class A | 152,879 | 13,383,028 |
| Anixter International, Inc. * | 14,733 | 883,538 |
| Apple, Inc. | 2,238,232 | 467,208,548 |
| Applied Optoelectronics, Inc. *(a) | 9,058 | 80,616 |
| Arista Networks, Inc. * | 27,144 | 6,151,373 |
| Arlo Technologies, Inc. * | 39,497 | 124,021 |
| Arrow Electronics, Inc. * | 43,086 | 2,981,551 |
| Avid Technology, Inc. * | 16,631 | 124,067 |
| Avnet, Inc. | 53,812 | 2,254,185 |
| Security | Number of Shares | Value ($) |
| AVX Corp. | 25,701 | 348,249 |
| Badger Meter, Inc. | 14,305 | 737,852 |
| Belden, Inc. | 20,137 | 918,449 |
| Benchmark Electronics, Inc. | 20,381 | 539,689 |
| CalAmp Corp. * | 19,693 | 189,053 |
| Calix, Inc. * | 20,004 | 120,224 |
| Casa Systems, Inc. * | 14,628 | 84,257 |
| CDW Corp. | 74,707 | 8,628,658 |
| Ciena Corp. * | 73,364 | 3,002,788 |
| Cisco Systems, Inc. | 2,192,351 | 102,623,950 |
| Cognex Corp. | 87,840 | 3,959,827 |
| Coherent, Inc. * | 12,480 | 1,809,101 |
| CommScope Holding Co., Inc. * | 98,670 | 1,059,716 |
| Comtech Telecommunications Corp. | 13,275 | 355,106 |
| Corning, Inc. | 401,500 | 11,181,775 |
| Cray, Inc. * | 20,284 | 708,520 |
| CTS Corp. | 16,378 | 467,264 |
| Daktronics, Inc. | 23,911 | 172,877 |
| Dell Technologies, Inc., Class C * | 76,502 | 3,942,148 |
| Diebold Nixdorf, Inc. * | 39,733 | 445,407 |
| Dolby Laboratories, Inc., Class A | 33,168 | 2,041,822 |
| EchoStar Corp., Class A * | 24,955 | 1,054,349 |
| ePlus, Inc. * | 6,829 | 558,066 |
| Extreme Networks, Inc. * | 62,484 | 417,393 |
| F5 Networks, Inc. * | 30,711 | 3,953,427 |
| Fabrinet * | 18,332 | 925,583 |
| FARO Technologies, Inc. * | 9,398 | 462,757 |
| Finisar Corp. * | 61,512 | 1,390,786 |
| Fitbit, Inc., Class A * | 102,968 | 318,171 |
| FLIR Systems, Inc. | 69,329 | 3,415,840 |
| Harmonic, Inc. * | 52,596 | 346,608 |
| Hewlett Packard Enterprise Co. | 686,362 | 9,485,523 |
| HP, Inc. | 771,867 | 14,117,447 |
| II-VI, Inc. * | 30,062 | 1,127,626 |
| Infinera Corp. * | 76,976 | 410,282 |
| Insight Enterprises, Inc. * | 18,266 | 877,864 |
| InterDigital, Inc. | 16,225 | 797,783 |
| IPG Photonics Corp. * | 18,196 | 2,251,391 |
| Itron, Inc. * | 17,679 | 1,227,807 |
| Jabil, Inc. | 71,777 | 2,067,895 |
| Juniper Networks, Inc. | 172,323 | 3,991,001 |
| KEMET Corp. | 31,243 | 523,320 |
| Keysight Technologies, Inc. * | 96,615 | 9,358,129 |
| Kimball Electronics, Inc. * | 11,590 | 153,104 |
| Knowles Corp. * | 46,167 | 936,267 |
| Littelfuse, Inc. | 12,764 | 1,992,077 |
| Lumentum Holdings, Inc. * | 38,980 | 2,173,525 |
| Methode Electronics, Inc. | 20,017 | 635,340 |
| Motorola Solutions, Inc. | 84,381 | 15,265,367 |
| MTS Systems Corp. | 8,969 | 510,067 |
| National Instruments Corp. | 56,900 | 2,389,800 |
| NCR Corp. * | 62,397 | 1,966,129 |
| NetApp, Inc. | 126,376 | 6,073,631 |
| NETGEAR, Inc. * | 15,551 | 539,931 |
| NetScout Systems, Inc. * | 36,550 | 809,582 |
| nLight, Inc. * | 3,594 | 46,434 |
| Novanta, Inc. * | 16,721 | 1,254,075 |
| OSI Systems, Inc. * | 8,636 | 906,866 |
| PC Connection, Inc. | 5,713 | 201,269 |
| Plantronics, Inc. | 17,195 | 534,249 |
| Plexus Corp. * | 14,787 | 845,964 |
| Pure Storage, Inc., Class A * | 90,377 | 1,471,338 |
| Ribbon Communications, Inc. * | 23,111 | 119,484 |
| Rogers Corp. * | 9,584 | 1,269,113 |
| Sanmina Corp. * | 34,136 | 986,530 |
| ScanSource, Inc. * | 12,209 | 345,026 |
| Seagate Technology plc | 128,579 | 6,455,952 |
| SYNNEX Corp. | 21,167 | 1,774,006 |
| Security | Number of Shares | Value ($) |
| TE Connectivity Ltd. | 172,107 | 15,699,601 |
| Tech Data Corp. * | 18,975 | 1,759,552 |
| Trimble, Inc. * | 128,965 | 4,838,767 |
| TTM Technologies, Inc. * | 49,304 | 525,581 |
| Ubiquiti, Inc. | 9,597 | 1,060,564 |
| ViaSat, Inc. * | 29,103 | 2,308,741 |
| Viavi Solutions, Inc. * | 118,257 | 1,642,590 |
| Vishay Intertechnology, Inc. | 68,781 | 1,088,803 |
| Western Digital Corp. | 150,834 | 8,638,263 |
| Xerox Holdings Corp. * | 100,878 | 2,924,453 |
| Zebra Technologies Corp., Class A * | 27,849 | 5,709,880 |
| 793,096,656 | ||
| Telecommunication Services 2.0% | ||
| Anterix, Inc. * | 6,782 | 262,802 |
| AT&T, Inc. | 3,737,505 | 131,784,426 |
| ATN International, Inc. | 5,498 | 312,396 |
| Boingo Wireless, Inc. * | 22,144 | 284,993 |
| CenturyLink, Inc. | 494,004 | 5,621,766 |
| Cincinnati Bell, Inc. * | 26,450 | 143,624 |
| Cogent Communications Holdings, Inc. | 21,874 | 1,331,908 |
| Consolidated Communications Holdings, Inc. | 37,764 | 152,189 |
| Frontier Communications Corp. *(a) | 46,313 | 37,074 |
| GCI Liberty, Inc., Class A * | 49,728 | 3,095,071 |
| Globalstar, Inc. *(a) | 303,550 | 114,833 |
| Gogo, Inc. *(a) | 30,361 | 122,051 |
| Iridium Communications, Inc. * | 50,533 | 1,221,888 |
| ORBCOMM, Inc. * | 42,840 | 197,492 |
| Shenandoah Telecommunications Co. | 24,075 | 759,325 |
| Spok Holdings, Inc. | 8,902 | 104,599 |
| Sprint Corp. * | 298,710 | 2,028,241 |
| T-Mobile US, Inc. * | 161,469 | 12,602,655 |
| Telephone & Data Systems, Inc. | 48,174 | 1,213,985 |
| United States Cellular Corp. * | 7,749 | 278,887 |
| Verizon Communications, Inc. | 2,117,734 | 123,167,409 |
| Vonage Holdings Corp. * | 112,651 | 1,489,246 |
| Zayo Group Holdings, Inc. * | 104,847 | 3,529,150 |
| 289,856,010 | ||
| Transportation 1.9% | ||
| Air Transport Services Group, Inc. * | 30,948 | 625,150 |
| Alaska Air Group, Inc. | 63,044 | 3,764,988 |
| Allegiant Travel Co. | 6,615 | 939,264 |
| AMERCO | 4,042 | 1,421,248 |
| American Airlines Group, Inc. | 202,024 | 5,315,251 |
| ArcBest Corp. | 13,362 | 395,649 |
| Atlas Air Worldwide Holdings, Inc. * | 12,915 | 333,853 |
| Avis Budget Group, Inc. * | 33,032 | 818,203 |
| C.H. Robinson Worldwide, Inc. | 71,204 | 6,016,026 |
| CSX Corp. | 394,960 | 26,470,219 |
| Daseke, Inc. * | 30,295 | 53,319 |
| Delta Air Lines, Inc. | 306,820 | 17,752,605 |
| Echo Global Logistics, Inc. * | 14,674 | 294,067 |
| Expeditors International of Washington, Inc. | 87,825 | 6,244,358 |
| FedEx Corp. | 123,173 | 19,536,470 |
| Forward Air Corp. | 14,613 | 910,390 |
| Genesee & Wyoming, Inc., Class A * | 29,089 | 3,225,388 |
| Hawaiian Holdings, Inc. | 24,079 | 587,768 |
| Heartland Express, Inc. | 25,335 | 521,141 |
| Hertz Global Holdings, Inc. * | 47,559 | 575,939 |
| Hub Group, Inc., Class A * | 17,196 | 740,460 |
| J.B. Hunt Transport Services, Inc. | 44,351 | 4,791,682 |
| JetBlue Airways Corp. * | 154,457 | 2,675,195 |
| Kansas City Southern | 51,414 | 6,467,881 |
| Security | Number of Shares | Value ($) |
| Kirby Corp. * | 27,575 | 2,029,244 |
| Knight-Swift Transportation Holdings, Inc. | 63,398 | 2,164,408 |
| Landstar System, Inc. | 20,335 | 2,267,759 |
| Lyft, Inc., Class A * | 17,429 | 853,498 |
| Macquarie Infrastructure Corp. | 39,320 | 1,487,082 |
| Marten Transport Ltd. | 21,709 | 427,016 |
| Matson, Inc. | 21,857 | 776,579 |
| Norfolk Southern Corp. | 136,091 | 23,686,639 |
| Old Dominion Freight Line, Inc. | 33,093 | 5,419,310 |
| Ryder System, Inc. | 27,106 | 1,305,696 |
| Saia, Inc. * | 13,092 | 1,119,890 |
| Schneider National, Inc., Class B | 15,900 | 309,096 |
| SkyWest, Inc. | 25,776 | 1,475,934 |
| Southwest Airlines Co. | 250,411 | 13,101,504 |
| Spirit Airlines, Inc. * | 35,858 | 1,346,109 |
| Uber Technologies, Inc. *(a) | 104,330 | 3,398,028 |
| Union Pacific Corp. | 362,665 | 58,737,223 |
| United Airlines Holdings, Inc. * | 112,507 | 9,485,465 |
| United Parcel Service, Inc., Class B | 356,902 | 42,349,991 |
| Universal Logistics Holdings, Inc. | 5,437 | 113,905 |
| Werner Enterprises, Inc. | 21,740 | 710,463 |
| XPO Logistics, Inc. * | 47,060 | 3,334,672 |
| 286,376,025 | ||
| Utilities 3.4% | ||
| AES Corp. | 339,904 | 5,210,728 |
| ALLETE, Inc. | 26,218 | 2,247,669 |
| Alliant Energy Corp. | 120,377 | 6,313,774 |
| Ameren Corp. | 125,926 | 9,715,191 |
| American Electric Power Co., Inc. | 252,801 | 23,042,811 |
| American States Water Co. | 18,942 | 1,752,703 |
| American Water Works Co., Inc. | 93,461 | 11,899,454 |
| Aqua America, Inc. | 110,308 | 4,885,541 |
| AquaVenture Holdings Ltd. * | 12,580 | 222,414 |
| Atmos Energy Corp. | 59,661 | 6,576,432 |
| Avangrid, Inc. | 28,511 | 1,440,946 |
| Avista Corp. | 33,523 | 1,572,229 |
| Black Hills Corp. | 27,516 | 2,110,752 |
| California Water Service Group | 24,854 | 1,402,760 |
| CenterPoint Energy, Inc. | 258,242 | 7,150,721 |
| Chesapeake Utilities Corp. | 8,131 | 769,030 |
| Clearway Energy, Inc., Class A | 16,021 | 268,512 |
| Clearway Energy, Inc., Class C | 39,666 | 702,088 |
| CMS Energy Corp. | 145,841 | 9,195,275 |
| Connecticut Water Service, Inc. | 6,297 | 441,672 |
| Consolidated Edison, Inc. | 167,690 | 14,907,641 |
| Dominion Energy, Inc. | 411,460 | 31,941,640 |
| DTE Energy Co. | 93,479 | 12,120,487 |
| Duke Energy Corp. | 373,654 | 34,652,672 |
| Edison International | 181,097 | 13,087,880 |
| El Paso Electric Co. | 21,335 | 1,423,044 |
| Entergy Corp. | 97,391 | 10,989,600 |
| Evergy, Inc. | 125,072 | 8,129,680 |
| Eversource Energy | 165,238 | 13,240,521 |
| Exelon Corp. | 495,091 | 23,398,001 |
| FirstEnergy Corp. | 258,738 | 11,901,948 |
| Hawaiian Electric Industries, Inc. | 55,435 | 2,461,314 |
| IDACORP, Inc. | 25,602 | 2,811,356 |
| MDU Resources Group, Inc. | 101,431 | 2,727,480 |
| MGE Energy, Inc. | 17,440 | 1,322,824 |
| Middlesex Water Co. | 8,878 | 541,913 |
| National Fuel Gas Co. | 42,499 | 1,986,403 |
| New Jersey Resources Corp. | 45,693 | 2,089,998 |
| NextEra Energy, Inc. | 245,936 | 53,879,659 |
| NiSource, Inc. | 190,609 | 5,632,496 |
| Northwest Natural Holding Co. | 15,857 | 1,131,556 |
| Security | Number of Shares | Value ($) |
| NorthWestern Corp. | 26,013 | 1,884,382 |
| NRG Energy, Inc. | 129,625 | 4,718,350 |
| OGE Energy Corp. | 101,839 | 4,365,838 |
| ONE Gas, Inc. | 27,149 | 2,487,120 |
| Ormat Technologies, Inc. | 26,304 | 1,953,598 |
| Otter Tail Corp. | 20,495 | 1,037,457 |
| Pattern Energy Group, Inc., Class A | 47,509 | 1,289,869 |
| Pinnacle West Capital Corp. | 57,234 | 5,454,973 |
| PNM Resources, Inc. | 41,470 | 2,115,385 |
| Portland General Electric Co. | 45,643 | 2,596,630 |
| PPL Corp. | 365,993 | 10,815,093 |
| Public Service Enterprise Group, Inc. | 257,140 | 15,549,256 |
| Sempra Energy | 141,450 | 20,033,563 |
| SJW Group | 12,318 | 841,689 |
| South Jersey Industries, Inc. | 47,470 | 1,535,180 |
| Southwest Gas Holdings, Inc. | 27,237 | 2,484,831 |
| Spire, Inc. | 26,039 | 2,210,711 |
| TerraForm Power, Inc., Class A | 39,933 | 677,264 |
| The Southern Co. | 534,637 | 31,147,952 |
| UGI Corp. | 106,965 | 5,205,987 |
| Unitil Corp. | 7,892 | 476,440 |
| Vistra Energy Corp. | 192,899 | 4,812,830 |
| WEC Energy Group, Inc. | 161,258 | 15,443,679 |
| Xcel Energy, Inc. | 263,083 | 16,895,190 |
| 503,332,082 | ||
| Total Common Stock | ||
| (Cost $11,556,565,092) | 14,842,933,151 | |
| Rights0.0% of net assets | ||
| Materials 0.0% | ||
| A. Schulman, Inc. CVR *(c) | 15,456 | 6,692 |
| Media 0.0% | ||
| Media General, Inc. CVR *(c) | 42,134 | 3,585 |
| Total Rights | ||
| (Cost $6,692) | 10,277 | |
| Other Investment Companies0.2% of net assets | ||
| Money Market Fund 0.0% | ||
| State Street Institutional U.S. Government Money Market Fund, Premier Class 2.07%(d) | 4,400,132 | 4,400,132 |
| Securities Lending Collateral 0.2% | ||
| Wells Fargo Government Money Market Fund, Select Class 2.03%(d) | 25,769,726 | 25,769,726 |
| Total Other Investment Companies | ||
| (Cost $30,169,858) | 30,169,858 | |
| Number of Contracts | Notional Amount ($) | Current Value/ Unrealized Appreciation ($) | ||
| Futures Contracts | ||||
| Long | ||||
| S&P 500 Index, e-mini, expires 09/20/19 | 218 | 31,880,320 | 97,136 | |
| * | Non-income producing security. |
| (a) | All or a portion of this security is on loan. Securities on loan were valued at $24,663,894. |
| (b) | Issuer is affiliated with the fund’s investment adviser. |
| (c) | Fair-valued by management using significant unobservable inputs in accordance with procedures approved by the fund’s Board of Trustees. |
| (d) | The rate shown is the 7-day yield. |
| CVR — | Contingent Value Rights |
| REIT — | Real Estate Investment Trust |
| Security | Number of Shares | Value ($) |
| Common Stock99.8% of net assets | ||
| Automobiles & Components 0.6% | ||
| Aptiv plc | 7,932 | 659,705 |
| Autoliv, Inc. | 2,738 | 187,279 |
| BorgWarner, Inc. | 6,254 | 204,068 |
| Ford Motor Co. | 120,059 | 1,100,941 |
| General Motors Co. | 40,537 | 1,503,517 |
| Gentex Corp. | 7,925 | 210,805 |
| Harley-Davidson, Inc. | 4,891 | 156,023 |
| Lear Corp. | 1,905 | 213,855 |
| Tesla, Inc. * | 4,226 | 953,428 |
| The Goodyear Tire & Rubber Co. | 7,105 | 81,494 |
| Thor Industries, Inc. | 1,579 | 72,492 |
| 5,343,607 | ||
| Banks 5.2% | ||
| Associated Banc-Corp. | 4,999 | 96,181 |
| Bank of America Corp. | 271,382 | 7,465,719 |
| Bank OZK | 3,667 | 94,609 |
| BankUnited, Inc. | 3,087 | 98,043 |
| BB&T Corp. | 23,559 | 1,122,586 |
| BOK Financial Corp. | 951 | 72,409 |
| CIT Group, Inc. | 2,951 | 125,683 |
| Citigroup, Inc. | 71,011 | 4,569,558 |
| Citizens Financial Group, Inc. | 14,025 | 473,203 |
| Comerica, Inc. | 4,751 | 292,899 |
| Commerce Bancshares, Inc. | 2,979 | 170,012 |
| Cullen/Frost Bankers, Inc. | 1,882 | 156,225 |
| East West Bancorp, Inc. | 4,386 | 180,396 |
| Essent Group Ltd. * | 2,929 | 142,056 |
| F.N.B. Corp. | 9,577 | 102,953 |
| Fifth Third Bancorp | 22,099 | 584,519 |
| First Citizens BancShares, Inc., Class A | 261 | 116,041 |
| First Financial Bankshares, Inc. | 4,315 | 132,125 |
| First Hawaiian, Inc. | 2,654 | 68,208 |
| First Horizon National Corp. | 9,523 | 150,749 |
| First Republic Bank | 5,023 | 450,664 |
| Glacier Bancorp, Inc. | 2,629 | 104,345 |
| Hancock Whitney Corp. | 2,575 | 90,408 |
| Huntington Bancshares, Inc. | 32,100 | 425,325 |
| IBERIABANK Corp. | 1,746 | 120,457 |
| Investors Bancorp, Inc. | 6,880 | 76,368 |
| JPMorgan Chase & Co. | 99,599 | 10,941,946 |
| KeyCorp | 30,732 | 510,151 |
| LendingTree, Inc. * | 224 | 69,460 |
| M&T Bank Corp. | 4,198 | 613,790 |
| MGIC Investment Corp. | 10,795 | 136,557 |
| New York Community Bancorp, Inc. | 14,630 | 168,830 |
| PacWest Bancorp | 3,667 | 124,971 |
| People's United Financial, Inc. | 11,872 | 170,601 |
| Pinnacle Financial Partners, Inc. | 2,209 | 116,348 |
| Popular, Inc. | 3,018 | 158,656 |
| Prosperity Bancshares, Inc. | 1,993 | 129,386 |
| Radian Group, Inc. | 6,402 | 144,365 |
| Regions Financial Corp. | 31,092 | 454,565 |
| Signature Bank | 1,708 | 199,238 |
| Sterling Bancorp | 6,654 | 126,892 |
| Security | Number of Shares | Value ($) |
| SunTrust Banks, Inc. | 13,677 | 841,272 |
| SVB Financial Group * | 1,620 | 315,284 |
| Synovus Financial Corp. | 4,782 | 169,952 |
| TFS Financial Corp. | 1,746 | 30,572 |
| The PNC Financial Services Group, Inc. | 13,850 | 1,785,680 |
| U.S. Bancorp | 46,008 | 2,424,162 |
| UMB Financial Corp. | 1,316 | 82,013 |
| Umpqua Holdings Corp. | 6,741 | 105,901 |
| United Bankshares, Inc. | 3,100 | 114,328 |
| Valley National Bancorp | 10,024 | 105,352 |
| Webster Financial Corp. | 2,810 | 125,776 |
| Wells Fargo & Co. | 124,135 | 5,780,967 |
| Western Alliance Bancorp | 3,059 | 132,822 |
| Wintrust Financial Corp. | 1,746 | 109,701 |
| Zions Bancorp NA | 5,629 | 231,296 |
| 43,902,575 | ||
| Capital Goods 6.7% | ||
| 3M Co. | 17,699 | 2,862,282 |
| A.O. Smith Corp. | 4,258 | 198,082 |
| Acuity Brands, Inc. | 1,249 | 156,637 |
| AECOM * | 4,898 | 173,781 |
| AGCO Corp. | 1,964 | 135,752 |
| Air Lease Corp. | 3,204 | 133,094 |
| Allegion plc | 2,860 | 275,332 |
| Allison Transmission Holdings, Inc. | 3,748 | 166,524 |
| AMETEK, Inc. | 7,002 | 601,682 |
| Arconic, Inc. | 12,270 | 317,057 |
| BWX Technologies, Inc. | 2,966 | 175,587 |
| Carlisle Cos., Inc. | 1,767 | 256,144 |
| Caterpillar, Inc. | 17,520 | 2,084,880 |
| Crane Co. | 1,620 | 123,509 |
| Cummins, Inc. | 4,469 | 667,088 |
| Curtiss-Wright Corp. | 1,315 | 161,272 |
| Deere & Co. | 9,713 | 1,504,641 |
| Donaldson Co., Inc. | 3,899 | 188,556 |
| Dover Corp. | 4,472 | 419,205 |
| Eaton Corp. plc | 12,991 | 1,048,633 |
| EMCOR Group, Inc. | 1,746 | 152,670 |
| Emerson Electric Co. | 18,918 | 1,127,324 |
| EnerSys | 1,264 | 70,784 |
| Fastenal Co. | 17,618 | 539,463 |
| Flowserve Corp. | 3,943 | 168,287 |
| Fluor Corp. | 4,330 | 76,511 |
| Fortive Corp. | 9,076 | 643,488 |
| Fortune Brands Home & Security, Inc. | 4,245 | 216,750 |
| Gardner Denver Holdings, Inc. * | 3,956 | 113,458 |
| Gates Industrial Corp. plc * | 1,405 | 12,223 |
| Generac Holdings, Inc. * | 1,878 | 146,465 |
| General Dynamics Corp. | 8,326 | 1,592,514 |
| General Electric Co. | 267,640 | 2,208,030 |
| Graco, Inc. | 5,200 | 236,964 |
| GrafTech International Ltd. | 1,862 | 22,698 |
| HD Supply Holdings, Inc. * | 5,134 | 199,764 |
| HEICO Corp. | 1,286 | 186,046 |
| HEICO Corp., Class A | 2,223 | 245,330 |
| Hexcel Corp. | 2,640 | 222,156 |
| Honeywell International, Inc. | 22,346 | 3,678,598 |
| Hubbell, Inc. | 1,693 | 222,020 |
| Security | Number of Shares | Value ($) |
| Huntington Ingalls Industries, Inc. | 1,274 | 266,266 |
| IDEX Corp. | 2,328 | 383,445 |
| Illinois Tool Works, Inc. | 9,227 | 1,382,758 |
| Ingersoll-Rand plc | 7,386 | 894,371 |
| ITT, Inc. | 2,628 | 149,586 |
| Jacobs Engineering Group, Inc. | 3,557 | 316,075 |
| Johnson Controls International plc | 24,435 | 1,043,130 |
| L3Harris Technologies, Inc. | 6,783 | 1,433,994 |
| Lennox International, Inc. | 1,086 | 275,605 |
| Lincoln Electric Holdings, Inc. | 1,946 | 160,662 |
| Lockheed Martin Corp. | 7,532 | 2,893,116 |
| Masco Corp. | 9,125 | 371,661 |
| MasTec, Inc. * | 1,927 | 121,150 |
| MSC Industrial Direct Co., Inc., Class A | 1,319 | 89,191 |
| Nordson Corp. | 1,568 | 213,185 |
| Northrop Grumman Corp. | 5,211 | 1,916,971 |
| nVent Electric plc | 4,905 | 99,375 |
| Oshkosh Corp. | 2,128 | 149,535 |
| Owens Corning | 3,346 | 191,927 |
| PACCAR, Inc. | 10,658 | 698,738 |
| Parker-Hannifin Corp. | 3,910 | 648,161 |
| Pentair plc | 4,818 | 173,063 |
| Proto Labs, Inc. * | 813 | 77,024 |
| Quanta Services, Inc. | 4,240 | 143,736 |
| Raytheon Co. | 8,529 | 1,580,594 |
| RBC Bearings, Inc. * | 743 | 118,531 |
| Rockwell Automation, Inc. | 3,633 | 555,086 |
| Roper Technologies, Inc. | 3,185 | 1,168,131 |
| Sensata Technologies Holding plc * | 4,876 | 222,248 |
| Snap-on, Inc. | 1,703 | 253,202 |
| Spirit AeroSystems Holdings, Inc., Class A | 3,201 | 258,001 |
| Stanley Black & Decker, Inc. | 4,666 | 619,925 |
| Teledyne Technologies, Inc. * | 1,098 | 338,832 |
| Textron, Inc. | 7,136 | 321,120 |
| The Boeing Co. | 16,059 | 5,846,921 |
| The Middleby Corp. * | 1,677 | 183,900 |
| The Timken Co. | 2,094 | 84,137 |
| The Toro Co. | 3,297 | 237,417 |
| TransDigm Group, Inc. | 1,510 | 812,863 |
| Trex Co., Inc. * | 1,852 | 158,402 |
| United Rentals, Inc. * | 2,436 | 274,196 |
| United Technologies Corp. | 24,891 | 3,241,804 |
| W.W. Grainger, Inc. | 1,364 | 373,259 |
| WABCO Holdings, Inc. * | 1,577 | 210,545 |
| Wabtec Corp. | 5,583 | 386,399 |
| Watsco, Inc. | 1,008 | 164,858 |
| Woodward, Inc. | 1,714 | 184,855 |
| Xylem, Inc. | 5,456 | 417,984 |
| 55,837,216 | ||
| Commercial & Professional Services 1.0% | ||
| ADT, Inc. | 3,682 | 17,526 |
| Cintas Corp. | 2,577 | 679,813 |
| Copart, Inc. * | 6,189 | 466,589 |
| CoStar Group, Inc. * | 1,117 | 686,810 |
| Equifax, Inc. | 3,730 | 545,997 |
| IAA, Inc. * | 4,074 | 199,015 |
| IHS Markit Ltd. * | 11,122 | 729,714 |
| Insperity, Inc. | 1,164 | 115,306 |
| KAR Auction Services, Inc. | 4,074 | 108,205 |
| ManpowerGroup, Inc. | 1,887 | 154,243 |
| MSA Safety, Inc. | 1,042 | 110,067 |
| Nielsen Holdings plc | 10,919 | 226,678 |
| Republic Services, Inc. | 6,632 | 591,906 |
| Robert Half International, Inc. | 3,683 | 196,930 |
| Rollins, Inc. | 4,644 | 152,370 |
| Stericycle, Inc. * | 2,617 | 117,477 |
| Security | Number of Shares | Value ($) |
| The Brink's Co. | 1,528 | 114,982 |
| TransUnion | 5,737 | 479,900 |
| Verisk Analytics, Inc. | 5,053 | 816,262 |
| Waste Management, Inc. | 11,963 | 1,427,784 |
| 7,937,574 | ||
| Consumer Durables & Apparel 1.2% | ||
| Brunswick Corp. | 2,750 | 128,150 |
| Capri Holdings Ltd. * | 4,716 | 124,408 |
| Carter's, Inc. | 1,423 | 130,176 |
| Columbia Sportswear Co. | 897 | 84,130 |
| D.R. Horton, Inc. | 10,491 | 518,990 |
| Deckers Outdoor Corp. * | 871 | 128,429 |
| Garmin Ltd. | 3,743 | 305,316 |
| Hanesbrands, Inc. | 11,170 | 152,582 |
| Hasbro, Inc. | 3,506 | 387,308 |
| Kontoor Brands, Inc. * | 1,407 | 48,176 |
| Leggett & Platt, Inc. | 3,929 | 146,120 |
| Lennar Corp., Class A | 8,761 | 446,811 |
| Lululemon Athletica, Inc. * | 3,260 | 602,024 |
| Mattel, Inc. * | 10,746 | 105,311 |
| Mohawk Industries, Inc. * | 1,877 | 223,157 |
| Newell Brands, Inc. | 12,248 | 203,317 |
| NIKE, Inc., Class B | 38,501 | 3,253,334 |
| NVR, Inc. * | 102 | 367,098 |
| Polaris, Inc. | 1,761 | 144,437 |
| PulteGroup, Inc. | 7,773 | 262,727 |
| PVH Corp. | 2,344 | 177,675 |
| Ralph Lauren Corp. | 1,572 | 138,870 |
| Skechers U.S.A., Inc., Class A * | 4,074 | 128,983 |
| Tapestry, Inc. | 8,992 | 185,685 |
| Toll Brothers, Inc. | 4,147 | 150,080 |
| Under Armour, Inc., Class A * | 5,911 | 110,004 |
| Under Armour, Inc., Class C * | 5,880 | 99,490 |
| VF Corp. | 9,990 | 818,680 |
| Whirlpool Corp. | 1,926 | 267,887 |
| 9,839,355 | ||
| Consumer Services 2.3% | ||
| Aramark | 7,600 | 310,536 |
| Bright Horizons Family Solutions, Inc. * | 1,808 | 298,410 |
| Caesars Entertainment Corp. * | 18,135 | 208,734 |
| Carnival Corp. | 12,235 | 539,319 |
| Chegg, Inc. * | 3,330 | 132,001 |
| Chipotle Mexican Grill, Inc. * | 747 | 626,300 |
| Choice Hotels International, Inc. | 1,027 | 93,437 |
| Churchill Downs, Inc. | 1,082 | 133,367 |
| Cracker Barrel Old Country Store, Inc. | 733 | 121,238 |
| Darden Restaurants, Inc. | 3,753 | 454,038 |
| Domino's Pizza, Inc. | 1,250 | 283,550 |
| Dunkin' Brands Group, Inc. | 2,580 | 212,695 |
| Eldorado Resorts, Inc. *(a) | 1,967 | 75,749 |
| Grand Canyon Education, Inc. * | 1,505 | 189,028 |
| H&R Block, Inc. | 6,379 | 154,499 |
| Hilton Worldwide Holdings, Inc. | 8,879 | 820,153 |
| Las Vegas Sands Corp. | 11,227 | 622,762 |
| Marriott International, Inc., Class A | 8,497 | 1,071,132 |
| Marriott Vacations Worldwide Corp. | 1,229 | 121,167 |
| McDonald's Corp. | 23,432 | 5,107,473 |
| MGM Resorts International | 15,519 | 435,463 |
| Norwegian Cruise Line Holdings Ltd. * | 6,586 | 334,240 |
| Planet Fitness, Inc., Class A * | 2,627 | 185,493 |
| Royal Caribbean Cruises Ltd. | 5,276 | 550,181 |
| Service Corp. International | 5,638 | 261,039 |
| ServiceMaster Global Holdings, Inc. * | 4,193 | 239,169 |
| Six Flags Entertainment Corp. | 2,240 | 132,541 |
| Security | Number of Shares | Value ($) |
| Starbucks Corp. | 37,152 | 3,587,397 |
| Texas Roadhouse, Inc. | 1,993 | 102,560 |
| The Wendy's Co. | 5,594 | 123,068 |
| Vail Resorts, Inc. | 1,223 | 288,970 |
| Wyndham Destinations, Inc. | 2,910 | 129,029 |
| Wyndham Hotels & Resorts, Inc. | 3,017 | 155,014 |
| Wynn Resorts Ltd. | 2,946 | 324,502 |
| Yum! Brands, Inc. | 9,408 | 1,098,666 |
| 19,522,920 | ||
| Diversified Financials 5.1% | ||
| Affiliated Managers Group, Inc. | 1,563 | 119,773 |
| AGNC Investment Corp. | 16,490 | 245,206 |
| Ally Financial, Inc. | 12,270 | 384,664 |
| American Express Co. | 20,984 | 2,525,844 |
| Ameriprise Financial, Inc. | 4,065 | 524,304 |
| Annaly Capital Management, Inc. | 44,639 | 370,504 |
| AXA Equitable Holdings, Inc. | 7,618 | 158,226 |
| Berkshire Hathaway, Inc., Class B * | 59,476 | 12,098,013 |
| BlackRock, Inc. | 3,657 | 1,545,302 |
| Blackstone Mortgage Trust, Inc., Class A | 4,107 | 142,924 |
| Capital One Financial Corp. | 14,433 | 1,250,186 |
| Cboe Global Markets, Inc. | 3,455 | 411,698 |
| Chimera Investment Corp. | 5,664 | 108,012 |
| CME Group, Inc. | 10,976 | 2,384,975 |
| Credit Acceptance Corp. * | 367 | 166,122 |
| Discover Financial Services | 9,903 | 791,943 |
| E*TRADE Financial Corp. | 7,470 | 311,798 |
| Eaton Vance Corp. | 3,507 | 151,222 |
| Evercore, Inc., Class A | 1,275 | 101,694 |
| FactSet Research Systems, Inc. | 1,164 | 316,713 |
| FirstCash, Inc. | 1,314 | 129,731 |
| Franklin Resources, Inc. | 8,987 | 236,178 |
| Green Dot Corp., Class A * | 1,423 | 43,515 |
| Interactive Brokers Group, Inc., Class A | 2,330 | 109,976 |
| Intercontinental Exchange, Inc. | 17,320 | 1,619,074 |
| Invesco Ltd. | 12,297 | 193,063 |
| Janus Henderson Group plc | 4,961 | 94,805 |
| Jefferies Financial Group, Inc. | 7,954 | 148,263 |
| Lazard Ltd., Class A | 3,965 | 136,158 |
| LPL Financial Holdings, Inc. | 2,589 | 194,045 |
| MarketAxess Holdings, Inc. | 1,153 | 458,456 |
| Moody's Corp. | 5,087 | 1,096,655 |
| Morgan Stanley | 39,221 | 1,627,279 |
| Morningstar, Inc. | 582 | 94,040 |
| MSCI, Inc. | 2,620 | 614,731 |
| Nasdaq, Inc. | 3,562 | 355,630 |
| New Residential Investment Corp. | 12,909 | 181,630 |
| Northern Trust Corp. | 6,666 | 586,141 |
| OneMain Holdings, Inc. | 2,241 | 80,340 |
| Raymond James Financial, Inc. | 3,873 | 304,069 |
| S&P Global, Inc. | 7,546 | 1,963,394 |
| Santander Consumer USA Holdings, Inc. | 3,492 | 91,176 |
| SEI Investments Co. | 3,885 | 223,426 |
| SLM Corp. | 13,390 | 113,012 |
| Starwood Property Trust, Inc. | 8,643 | 202,505 |
| State Street Corp. | 11,504 | 590,270 |
| Stifel Financial Corp. | 2,225 | 118,859 |
| Synchrony Financial | 19,437 | 622,956 |
| T. Rowe Price Group, Inc. | 7,279 | 805,203 |
| TD Ameritrade Holding Corp. | 8,158 | 362,297 |
| The Bank of New York Mellon Corp. | 27,027 | 1,136,756 |
| The Charles Schwab Corp.(b) | 36,255 | 1,387,479 |
| The Goldman Sachs Group, Inc. | 10,414 | 2,123,519 |
| Security | Number of Shares | Value ($) |
| Two Harbors Investment Corp. | 8,216 | 103,768 |
| Voya Financial, Inc. | 4,441 | 219,030 |
| 42,476,552 | ||
| Energy 4.1% | ||
| Antero Resources Corp. * | 6,598 | 20,916 |
| Apache Corp. | 11,483 | 247,688 |
| Baker Hughes a GE Co. | 15,929 | 345,500 |
| Cabot Oil & Gas Corp. | 12,993 | 222,440 |
| Centennial Resource Development, Inc., Class A * | 5,550 | 26,751 |
| Cheniere Energy, Inc. * | 6,751 | 403,102 |
| Chevron Corp. | 58,471 | 6,883,206 |
| Cimarex Energy Co. | 3,025 | 129,410 |
| Concho Resources, Inc. | 6,106 | 446,654 |
| ConocoPhillips | 34,652 | 1,808,141 |
| Continental Resources, Inc. * | 2,746 | 80,183 |
| CVR Energy, Inc. | 875 | 34,808 |
| Devon Energy Corp. | 12,634 | 277,822 |
| Diamondback Energy, Inc. | 4,756 | 466,469 |
| EOG Resources, Inc. | 17,816 | 1,321,769 |
| EQT Corp. | 7,808 | 79,407 |
| Equitrans Midstream Corp. | 6,102 | 82,316 |
| Exxon Mobil Corp. | 129,884 | 8,894,456 |
| Halliburton Co. | 26,550 | 500,202 |
| Helmerich & Payne, Inc. | 3,419 | 128,520 |
| Hess Corp. | 7,862 | 494,913 |
| HollyFrontier Corp. | 4,922 | 218,340 |
| Kinder Morgan, Inc. | 59,745 | 1,211,031 |
| Marathon Oil Corp. | 25,231 | 298,735 |
| Marathon Petroleum Corp. | 20,355 | 1,001,670 |
| Murphy Oil Corp. | 4,675 | 85,225 |
| National Oilwell Varco, Inc. | 11,837 | 241,830 |
| Noble Energy, Inc. | 14,487 | 327,116 |
| Occidental Petroleum Corp. | 27,510 | 1,196,135 |
| ONEOK, Inc. | 12,712 | 906,111 |
| Parsley Energy, Inc., Class A * | 8,278 | 148,259 |
| PBF Energy, Inc., Class A | 3,538 | 83,851 |
| Peabody Energy Corp. | 2,520 | 46,444 |
| Phillips 66 | 12,818 | 1,264,239 |
| Pioneer Natural Resources Co. | 5,156 | 636,354 |
| Schlumberger Ltd. | 42,630 | 1,382,491 |
| Targa Resources Corp. | 7,170 | 258,980 |
| TechnipFMC plc | 12,773 | 317,281 |
| The Williams Cos., Inc. | 37,320 | 880,752 |
| Transocean Ltd. * | 15,178 | 69,060 |
| Valero Energy Corp. | 12,768 | 961,175 |
| WPX Energy, Inc. * | 12,580 | 135,361 |
| 34,565,113 | ||
| Food & Staples Retailing 1.5% | ||
| BJ's Wholesale Club Holdings, Inc. * | 3,719 | 97,661 |
| Casey's General Stores, Inc. | 1,127 | 189,167 |
| Costco Wholesale Corp. | 13,497 | 3,978,376 |
| Performance Food Group Co. * | 3,161 | 147,903 |
| Sysco Corp. | 14,507 | 1,078,305 |
| The Kroger Co. | 24,812 | 587,548 |
| US Foods Holding Corp. * | 6,628 | 268,102 |
| Walgreens Boots Alliance, Inc. | 23,851 | 1,220,933 |
| Walmart, Inc. | 42,919 | 4,903,925 |
| 12,471,920 | ||
| Food, Beverage & Tobacco 3.7% | ||
| Altria Group, Inc. | 57,396 | 2,510,501 |
| Archer-Daniels-Midland Co. | 17,092 | 650,351 |
| Security | Number of Shares | Value ($) |
| Brown-Forman Corp., Class B | 5,086 | 300,023 |
| Bunge Ltd. | 4,295 | 229,396 |
| Campbell Soup Co. | 5,820 | 261,900 |
| Conagra Brands, Inc. | 14,986 | 425,003 |
| Constellation Brands, Inc., Class A | 5,128 | 1,047,907 |
| Darling Ingredients, Inc. * | 4,992 | 92,851 |
| Flowers Foods, Inc. | 5,759 | 131,305 |
| General Mills, Inc. | 18,352 | 987,338 |
| Hormel Foods Corp. | 8,291 | 353,280 |
| Ingredion, Inc. | 2,075 | 160,335 |
| Kellogg Co. | 7,636 | 479,541 |
| Keurig Dr Pepper, Inc. | 5,780 | 157,678 |
| Lamb Weston Holdings, Inc. | 4,448 | 313,095 |
| Lancaster Colony Corp. | 632 | 92,209 |
| McCormick & Co., Inc. Non-Voting Shares | 3,735 | 608,319 |
| Molson Coors Brewing Co., Class B | 5,833 | 299,583 |
| Mondelez International, Inc., Class A | 44,206 | 2,441,055 |
| Monster Beverage Corp. * | 12,031 | 705,859 |
| National Beverage Corp. | 365 | 14,929 |
| PepsiCo, Inc. | 43,015 | 5,881,441 |
| Philip Morris International, Inc. | 47,740 | 3,441,577 |
| Pilgrim's Pride Corp. * | 1,643 | 51,196 |
| Post Holdings, Inc. * | 2,095 | 208,851 |
| Seaboard Corp. | 8 | 33,041 |
| The Coca-Cola Co. | 117,816 | 6,484,593 |
| The Hershey Co. | 4,276 | 677,660 |
| The J.M. Smucker Co. | 3,502 | 368,270 |
| The Kraft Heinz Co. | 19,095 | 487,304 |
| TreeHouse Foods, Inc. * | 1,680 | 85,092 |
| Tyson Foods, Inc., Class A | 9,037 | 840,802 |
| 30,822,285 | ||
| Health Care Equipment & Services 6.3% | ||
| Abbott Laboratories | 54,149 | 4,619,993 |
| ABIOMED, Inc. * | 1,367 | 263,927 |
| Align Technology, Inc. * | 2,267 | 415,110 |
| Amedisys, Inc. * | 869 | 111,849 |
| AmerisourceBergen Corp. | 4,745 | 390,371 |
| Anthem, Inc. | 7,885 | 2,062,085 |
| Baxter International, Inc. | 14,577 | 1,282,047 |
| Becton Dickinson & Co. | 8,271 | 2,100,172 |
| Boston Scientific Corp. * | 42,693 | 1,824,272 |
| Cantel Medical Corp. | 1,079 | 99,193 |
| Cardinal Health, Inc. | 9,107 | 392,785 |
| Centene Corp. * | 12,730 | 593,473 |
| Cerner Corp. | 9,967 | 686,826 |
| Chemed Corp. | 498 | 213,856 |
| Cigna Corp. * | 11,642 | 1,792,519 |
| Covetrus, Inc. * | 3,134 | 41,651 |
| CVS Health Corp. | 39,826 | 2,426,200 |
| Danaher Corp. | 19,338 | 2,747,736 |
| DaVita, Inc. * | 3,227 | 181,906 |
| DENTSPLY SIRONA, Inc. | 7,129 | 371,777 |
| DexCom, Inc. * | 2,830 | 485,656 |
| Edwards Lifesciences Corp. * | 6,419 | 1,423,991 |
| Encompass Health Corp. | 2,974 | 180,789 |
| Globus Medical, Inc., Class A * | 2,466 | 125,939 |
| Haemonetics Corp. * | 1,551 | 207,105 |
| HCA Healthcare, Inc. | 8,157 | 980,471 |
| HealthEquity, Inc. * | 2,212 | 131,304 |
| Henry Schein, Inc. * | 4,562 | 281,110 |
| Hill-Rom Holdings, Inc. | 2,015 | 216,975 |
| Hologic, Inc. * | 8,282 | 408,882 |
| Humana, Inc. | 4,150 | 1,175,322 |
| ICU Medical, Inc. * | 520 | 84,110 |
| IDEXX Laboratories, Inc. * | 2,624 | 760,278 |
| Insulet Corp. * | 1,845 | 284,444 |
| Security | Number of Shares | Value ($) |
| Integra LifeSciences Holdings Corp. * | 2,106 | 126,402 |
| Intuitive Surgical, Inc. * | 3,543 | 1,811,678 |
| Laboratory Corp. of America Holdings * | 3,005 | 503,518 |
| LHC Group, Inc. * | 931 | 110,324 |
| LivaNova plc * | 1,465 | 113,728 |
| Masimo Corp. * | 1,497 | 229,415 |
| McKesson Corp. | 5,849 | 808,741 |
| Medidata Solutions, Inc. * | 1,859 | 170,247 |
| MEDNAX, Inc. * | 2,625 | 55,335 |
| Medtronic plc | 41,141 | 4,438,703 |
| Molina Healthcare, Inc. * | 1,905 | 248,183 |
| Penumbra, Inc. * | 970 | 141,184 |
| Quest Diagnostics, Inc. | 4,092 | 418,898 |
| ResMed, Inc. | 4,366 | 608,184 |
| STERIS plc | 2,601 | 401,594 |
| Stryker Corp. | 9,501 | 2,096,491 |
| Teladoc Health, Inc. * | 2,247 | 130,056 |
| Teleflex, Inc. | 1,425 | 518,586 |
| The Cooper Cos., Inc. | 1,519 | 470,510 |
| UnitedHealth Group, Inc. | 29,168 | 6,825,312 |
| Universal Health Services, Inc., Class B | 2,546 | 368,101 |
| Varian Medical Systems, Inc. * | 2,748 | 291,096 |
| Veeva Systems, Inc., Class A * | 3,914 | 627,727 |
| WellCare Health Plans, Inc. * | 1,548 | 419,106 |
| West Pharmaceutical Services, Inc. | 2,232 | 324,667 |
| Wright Medical Group N.V. * | 3,519 | 73,371 |
| Zimmer Biomet Holdings, Inc. | 6,312 | 878,630 |
| 52,573,911 | ||
| Household & Personal Products 1.9% | ||
| Church & Dwight Co., Inc. | 7,509 | 599,068 |
| Colgate-Palmolive Co. | 26,376 | 1,955,780 |
| Coty, Inc., Class A | 9,180 | 87,669 |
| Herbalife Nutrition Ltd. * | 3,157 | 108,696 |
| Kimberly-Clark Corp. | 10,539 | 1,487,158 |
| Nu Skin Enterprises, Inc., Class A | 1,845 | 74,944 |
| The Clorox Co. | 3,925 | 620,778 |
| The Estee Lauder Cos., Inc., Class A | 6,713 | 1,329,107 |
| The Procter & Gamble Co. | 76,978 | 9,255,065 |
| 15,518,265 | ||
| Insurance 2.7% | ||
| Aflac, Inc. | 22,865 | 1,147,366 |
| Alleghany Corp. * | 443 | 331,944 |
| American Financial Group, Inc. | 2,166 | 218,701 |
| American International Group, Inc. | 26,710 | 1,389,988 |
| American National Insurance Co. | 254 | 28,974 |
| Aon plc | 7,394 | 1,440,721 |
| Arch Capital Group Ltd. * | 12,294 | 485,613 |
| Arthur J. Gallagher & Co. | 5,688 | 515,958 |
| Assurant, Inc. | 1,913 | 235,299 |
| Assured Guaranty Ltd. | 3,081 | 131,097 |
| Athene Holding Ltd., Class A * | 3,612 | 140,362 |
| Axis Capital Holdings Ltd. | 2,530 | 155,317 |
| Brighthouse Financial, Inc. * | 3,713 | 130,920 |
| Brown & Brown, Inc. | 7,183 | 264,981 |
| Chubb Ltd. | 14,038 | 2,193,859 |
| Cincinnati Financial Corp. | 4,667 | 524,991 |
| CNA Financial Corp. | 840 | 39,589 |
| Erie Indemnity Co., Class A | 615 | 134,876 |
| Everest Re Group Ltd. | 1,251 | 295,086 |
| Fidelity National Financial, Inc. | 8,452 | 371,381 |
| First American Financial Corp. | 3,381 | 197,619 |
| Globe Life, Inc. * | 3,115 | 278,045 |
| Kemper Corp. | 1,933 | 135,271 |
| Lincoln National Corp. | 6,187 | 327,169 |
| Security | Number of Shares | Value ($) |
| Loews Corp. | 8,293 | 398,644 |
| Markel Corp. * | 425 | 485,809 |
| Marsh & McLennan Cos., Inc. | 15,711 | 1,569,372 |
| MetLife, Inc. | 29,249 | 1,295,731 |
| Old Republic International Corp. | 8,736 | 204,073 |
| Primerica, Inc. | 1,273 | 151,703 |
| Principal Financial Group, Inc. | 8,029 | 427,303 |
| Prudential Financial, Inc. | 12,471 | 998,802 |
| Reinsurance Group of America, Inc. | 1,894 | 291,619 |
| RenaissanceRe Holdings Ltd. | 1,387 | 250,423 |
| Selective Insurance Group, Inc. | 1,778 | 141,582 |
| The Allstate Corp. | 10,202 | 1,044,583 |
| The Hanover Insurance Group, Inc. | 1,224 | 162,976 |
| The Hartford Financial Services Group, Inc. | 11,009 | 641,605 |
| The Progressive Corp. | 17,931 | 1,359,170 |
| The Travelers Cos., Inc. | 8,032 | 1,180,383 |
| Unum Group | 6,569 | 166,918 |
| W.R. Berkley Corp. | 4,453 | 317,276 |
| Willis Towers Watson plc | 3,960 | 783,961 |
| 22,987,060 | ||
| Materials 2.8% | ||
| Air Products & Chemicals, Inc. | 6,768 | 1,529,027 |
| Albemarle Corp. | 3,188 | 196,795 |
| Alcoa Corp. * | 5,625 | 100,856 |
| Amcor plc * | 49,512 | 486,208 |
| AptarGroup, Inc. | 1,929 | 235,762 |
| Ashland Global Holdings, Inc. | 1,904 | 139,449 |
| Avery Dennison Corp. | 2,608 | 301,407 |
| Axalta Coating Systems Ltd. * | 6,300 | 181,944 |
| Ball Corp. | 10,345 | 831,841 |
| Berry Global Group, Inc. * | 4,085 | 159,887 |
| Celanese Corp., Series A | 3,876 | 439,422 |
| CF Industries Holdings, Inc. | 6,756 | 325,572 |
| Corteva, Inc. * | 22,888 | 671,076 |
| Crown Holdings, Inc. * | 4,177 | 275,014 |
| Dow, Inc. * | 22,994 | 980,234 |
| DuPont de Nemours, Inc. | 22,985 | 1,561,371 |
| Eastman Chemical Co. | 4,272 | 279,261 |
| Ecolab, Inc. | 7,803 | 1,609,837 |
| Element Solutions, Inc. * | 7,082 | 66,075 |
| FMC Corp. | 4,038 | 348,601 |
| Freeport-McMoRan, Inc. | 45,021 | 413,743 |
| Graphic Packaging Holding Co. | 9,312 | 128,599 |
| Huntsman Corp. | 6,405 | 127,588 |
| Ingevity Corp. * | 1,268 | 96,584 |
| International Flavors & Fragrances, Inc. | 3,158 | 346,591 |
| International Paper Co. | 12,225 | 477,997 |
| Linde plc | 16,666 | 3,148,374 |
| Livent Corp. * | 4,423 | 27,201 |
| Louisiana-Pacific Corp. | 3,906 | 93,900 |
| LyondellBasell Industries N.V., Class A | 8,400 | 649,992 |
| Martin Marietta Materials, Inc. | 1,922 | 487,746 |
| NewMarket Corp. | 260 | 123,435 |
| Newmont Goldcorp Corp. | 25,164 | 1,003,792 |
| Nucor Corp. | 9,260 | 453,555 |
| Olin Corp. | 4,990 | 84,730 |
| Packaging Corp. of America | 2,930 | 294,699 |
| PPG Industries, Inc. | 7,244 | 802,563 |
| Reliance Steel & Aluminum Co. | 2,087 | 202,919 |
| Royal Gold, Inc. | 2,021 | 269,561 |
| RPM International, Inc. | 4,002 | 270,815 |
| Sealed Air Corp. | 4,792 | 190,817 |
| Sonoco Products Co. | 3,000 | 171,600 |
| Steel Dynamics, Inc. | 6,984 | 188,568 |
| The Chemours Co. | 5,119 | 72,536 |
| The Mosaic Co. | 11,091 | 203,963 |
| Security | Number of Shares | Value ($) |
| The Scotts Miracle-Gro Co. | 1,230 | 130,774 |
| The Sherwin-Williams Co. | 2,491 | 1,312,134 |
| United States Steel Corp. | 5,238 | 57,985 |
| Valvoline, Inc. | 5,820 | 131,532 |
| Vulcan Materials Co. | 4,047 | 571,639 |
| W.R. Grace & Co. | 1,988 | 134,607 |
| Westlake Chemical Corp. | 1,088 | 63,746 |
| Westrock Co. | 7,803 | 266,707 |
| 23,720,631 | ||
| Media & Entertainment 7.9% | ||
| Activision Blizzard, Inc. | 23,473 | 1,187,734 |
| Alphabet, Inc., Class A * | 9,190 | 10,940,971 |
| Alphabet, Inc., Class C * | 9,406 | 11,175,269 |
| Altice USA, Inc., Class A * | 3,494 | 100,907 |
| Cable One, Inc. | 154 | 199,833 |
| Cargurus, Inc. * | 985 | 32,131 |
| CBS Corp., Class B Non-Voting Shares | 10,795 | 454,038 |
| Charter Communications, Inc., Class A * | 5,270 | 2,158,539 |
| Cinemark Holdings, Inc. | 3,356 | 128,065 |
| Comcast Corp., Class A | 138,917 | 6,148,466 |
| Discovery, Inc., Class A * | 5,049 | 139,352 |
| Discovery, Inc., Class C * | 11,008 | 286,538 |
| DISH Network Corp., Class A * | 7,248 | 243,243 |
| Electronic Arts, Inc. * | 9,070 | 849,678 |
| Facebook, Inc., Class A * | 73,734 | 13,690,192 |
| Fox Corp., Class A | 10,854 | 360,027 |
| Fox Corp., Class B * | 4,971 | 163,049 |
| IAC/InterActiveCorp * | 2,401 | 611,391 |
| Liberty Broadband Corp., Class C * | 4,723 | 497,993 |
| Liberty Global plc, Class A * | 6,155 | 164,462 |
| Liberty Global plc, Class C * | 15,938 | 416,301 |
| Liberty Media Corp. - Liberty Formula One, Class C * | 6,302 | 263,045 |
| Liberty Media Corp. - Liberty SiriusXM, Class A * | 2,506 | 101,468 |
| Liberty Media Corp. - Liberty SiriusXM, Class C * | 4,830 | 197,112 |
| Live Nation Entertainment, Inc. * | 4,285 | 297,850 |
| Netflix, Inc. * | 13,418 | 3,941,537 |
| News Corp., Class A | 11,651 | 160,201 |
| Nexstar Media Group, Inc., Class A | 1,436 | 142,006 |
| Omnicom Group, Inc. | 6,712 | 510,515 |
| Sirius XM Holdings, Inc. | 50,056 | 308,845 |
| Snap, Inc., Class A * | 23,194 | 367,161 |
| Take-Two Interactive Software, Inc. * | 3,472 | 458,200 |
| The Interpublic Group of Cos., Inc. | 12,010 | 238,759 |
| The Madison Square Garden Co., Class A * | 514 | 129,698 |
| The New York Times Co., Class A | 4,491 | 131,137 |
| The Walt Disney Co. | 53,564 | 7,352,195 |
| Tribune Media Co., Class A | 2,542 | 118,406 |
| TripAdvisor, Inc. * | 3,203 | 121,682 |
| Twitter, Inc. * | 22,400 | 955,360 |
| Viacom, Inc., Class B | 10,772 | 269,085 |
| World Wrestling Entertainment, Inc., Class A | 1,283 | 91,645 |
| Zillow Group, Inc., Class C * | 3,736 | 128,630 |
| Zynga, Inc., Class A * | 25,158 | 143,652 |
| 66,376,368 | ||
| Pharmaceuticals, Biotechnology & Life Sciences 7.3% | ||
| AbbVie, Inc. | 45,378 | 2,983,150 |
| Agilent Technologies, Inc. | 9,613 | 683,580 |
| Agios Pharmaceuticals, Inc. * | 1,523 | 57,798 |
| Alexion Pharmaceuticals, Inc. * | 6,872 | 692,423 |
| Alkermes plc * | 4,958 | 104,019 |
| Allergan plc | 9,443 | 1,508,236 |
| Security | Number of Shares | Value ($) |
| Alnylam Pharmaceuticals, Inc. * | 2,852 | 230,128 |
| Amgen, Inc. | 18,705 | 3,902,237 |
| Bio-Rad Laboratories, Inc., Class A * | 615 | 207,692 |
| Bio-Techne Corp. | 1,172 | 224,520 |
| Biogen, Inc. * | 5,949 | 1,307,293 |
| BioMarin Pharmaceutical, Inc. * | 5,471 | 410,653 |
| Bluebird Bio, Inc. * | 1,652 | 170,668 |
| Bristol-Myers Squibb Co. | 50,248 | 2,415,421 |
| Bruker Corp. | 3,065 | 132,316 |
| Catalent, Inc. * | 4,507 | 237,699 |
| Celgene Corp. * | 21,661 | 2,096,785 |
| Charles River Laboratories International, Inc. * | 1,532 | 200,998 |
| Eli Lilly & Co. | 26,500 | 2,993,705 |
| Emergent BioSolutions, Inc. * | 1,507 | 66,007 |
| Exact Sciences Corp. * | 3,953 | 471,277 |
| Exelixis, Inc. * | 9,317 | 184,942 |
| FibroGen, Inc. * | 2,419 | 108,032 |
| Gilead Sciences, Inc. | 39,031 | 2,480,030 |
| Horizon Therapeutics plc * | 5,776 | 159,591 |
| Illumina, Inc. * | 4,501 | 1,266,311 |
| Immunomedics, Inc. * | 5,159 | 66,035 |
| Incyte Corp. * | 5,428 | 444,119 |
| Intercept Pharmaceuticals, Inc. * | 761 | 48,841 |
| Ionis Pharmaceuticals, Inc. * | 4,336 | 274,079 |
| IQVIA Holdings, Inc. * | 4,854 | 753,098 |
| Jazz Pharmaceuticals plc * | 1,752 | 224,519 |
| Johnson & Johnson | 81,483 | 10,459,158 |
| Merck & Co., Inc. | 79,021 | 6,832,946 |
| Mettler-Toledo International, Inc. * | 768 | 504,415 |
| Mylan N.V. * | 15,903 | 309,631 |
| Nektar Therapeutics * | 5,279 | 92,752 |
| Neurocrine Biosciences, Inc. * | 2,818 | 280,166 |
| PerkinElmer, Inc. | 3,421 | 282,917 |
| Perrigo Co., plc | 3,885 | 181,740 |
| Pfizer, Inc. | 170,383 | 6,057,116 |
| PRA Health Sciences, Inc. * | 1,850 | 182,854 |
| Regeneron Pharmaceuticals, Inc. * | 2,411 | 699,311 |
| Sage Therapeutics, Inc. * | 1,564 | 268,492 |
| Sarepta Therapeutics, Inc. * | 2,113 | 190,487 |
| Seattle Genetics, Inc. * | 3,309 | 240,366 |
| Syneos Health, Inc. * | 1,831 | 96,182 |
| Thermo Fisher Scientific, Inc. | 12,269 | 3,521,939 |
| United Therapeutics Corp. * | 1,374 | 113,437 |
| Vertex Pharmaceuticals, Inc. * | 7,867 | 1,416,217 |
| Waters Corp. * | 2,121 | 449,419 |
| Zoetis, Inc. | 14,682 | 1,856,098 |
| 61,141,845 | ||
| Real Estate 4.1% | ||
| Alexandria Real Estate Equities, Inc. | 3,463 | 518,896 |
| American Campus Communities, Inc. | 4,215 | 195,913 |
| American Homes 4 Rent, Class A | 8,022 | 205,203 |
| American Tower Corp. | 13,577 | 3,125,290 |
| Americold Realty Trust | 5,953 | 216,808 |
| Apartment Investment & Management Co., Class A | 4,534 | 231,234 |
| Apple Hospitality REIT, Inc. | 6,402 | 101,984 |
| AvalonBay Communities, Inc. | 4,255 | 904,443 |
| Boston Properties, Inc. | 4,719 | 606,014 |
| Brixmor Property Group, Inc. | 9,050 | 166,791 |
| Camden Property Trust | 2,964 | 320,853 |
| CBRE Group, Inc., Class A * | 9,515 | 497,349 |
| CoreSite Realty Corp. | 1,150 | 133,607 |
| Cousins Properties, Inc. | 4,428 | 153,652 |
| Crown Castle International Corp. | 12,763 | 1,852,805 |
| CubeSmart | 5,757 | 206,619 |
| CyrusOne, Inc. | 3,472 | 255,053 |
| Security | Number of Shares | Value ($) |
| Digital Realty Trust, Inc. | 6,411 | 792,592 |
| Douglas Emmett, Inc. | 4,895 | 206,569 |
| Duke Realty Corp. | 10,977 | 365,205 |
| EastGroup Properties, Inc. | 1,082 | 134,731 |
| EPR Properties | 2,346 | 183,574 |
| Equinix, Inc. | 2,573 | 1,431,308 |
| Equity Commonwealth | 3,642 | 122,590 |
| Equity LifeStyle Properties, Inc. | 2,763 | 372,231 |
| Equity Residential | 11,385 | 964,993 |
| Essex Property Trust, Inc. | 2,023 | 649,909 |
| Extra Space Storage, Inc. | 3,922 | 478,170 |
| Federal Realty Investment Trust | 2,303 | 297,571 |
| First Industrial Realty Trust, Inc. | 3,961 | 154,281 |
| Gaming & Leisure Properties, Inc. | 6,234 | 243,874 |
| HCP, Inc. | 14,693 | 509,994 |
| Healthcare Realty Trust, Inc. | 4,014 | 133,385 |
| Healthcare Trust of America, Inc., Class A | 6,406 | 181,674 |
| Highwoods Properties, Inc. | 3,112 | 134,470 |
| Hospitality Properties Trust | 5,183 | 125,118 |
| Host Hotels & Resorts, Inc. | 23,023 | 369,289 |
| Hudson Pacific Properties, Inc. | 4,705 | 159,970 |
| Invitation Homes, Inc. | 12,845 | 369,422 |
| Iron Mountain, Inc. | 8,886 | 283,019 |
| JBG SMITH Properties | 3,754 | 143,628 |
| Jones Lang LaSalle, Inc. | 1,571 | 210,593 |
| Kilroy Realty Corp. | 3,125 | 243,312 |
| Kimco Realty Corp. | 12,804 | 235,337 |
| Lamar Advertising Co., Class A | 2,616 | 200,516 |
| Liberty Property Trust | 4,533 | 236,260 |
| Life Storage, Inc. | 1,392 | 147,496 |
| Medical Properties Trust, Inc. | 13,429 | 249,645 |
| Mid-America Apartment Communities, Inc. | 3,504 | 443,887 |
| National Health Investors, Inc. | 1,354 | 112,328 |
| National Retail Properties, Inc. | 4,935 | 277,100 |
| Omega Healthcare Investors, Inc. | 6,667 | 271,214 |
| Paramount Group, Inc. | 6,431 | 84,761 |
| Park Hotels & Resorts, Inc. | 6,012 | 141,583 |
| Pebblebrook Hotel Trust | 3,883 | 104,724 |
| Prologis, Inc. | 19,391 | 1,621,475 |
| PS Business Parks, Inc. | 640 | 114,950 |
| Public Storage | 4,625 | 1,224,422 |
| Rayonier, Inc. | 4,184 | 112,131 |
| Realty Income Corp. | 9,625 | 710,421 |
| Regency Centers Corp. | 5,163 | 333,065 |
| Ryman Hospitality Properties, Inc. | 1,614 | 128,571 |
| Sabra Health Care REIT, Inc. | 5,719 | 123,645 |
| SBA Communications Corp. | 3,492 | 916,406 |
| Simon Property Group, Inc. | 9,471 | 1,410,611 |
| SL Green Realty Corp. | 2,569 | 206,085 |
| Spirit Realty Capital, Inc. | 2,601 | 124,692 |
| STORE Capital Corp. | 6,268 | 236,680 |
| Sun Communities, Inc. | 2,754 | 407,041 |
| Sunstone Hotel Investors, Inc. | 7,038 | 92,479 |
| The Howard Hughes Corp. * | 1,216 | 153,544 |
| The Macerich Co. | 3,196 | 91,182 |
| UDR, Inc. | 8,658 | 417,142 |
| Uniti Group, Inc. | 5,405 | 39,943 |
| Ventas, Inc. | 11,315 | 830,408 |
| VEREIT, Inc. | 29,394 | 286,591 |
| VICI Properties, Inc. | 12,546 | 278,019 |
| Vornado Realty Trust | 5,359 | 324,059 |
| Weingarten Realty Investors | 3,642 | 96,477 |
| Welltower, Inc. | 12,464 | 1,116,276 |
| Weyerhaeuser Co. | 22,734 | 598,132 |
| WP Carey, Inc. | 5,186 | 465,703 |
| 33,918,987 | ||
| Security | Number of Shares | Value ($) |
| Retailing 6.2% | ||
| Advance Auto Parts, Inc. | 2,231 | 307,766 |
| Amazon.com, Inc. * | 12,692 | 22,544,673 |
| American Eagle Outfitters, Inc. | 5,066 | 85,210 |
| AutoNation, Inc. * | 1,755 | 83,292 |
| AutoZone, Inc. * | 755 | 831,776 |
| Best Buy Co., Inc. | 7,123 | 453,379 |
| Booking Holdings, Inc. * | 1,327 | 2,609,426 |
| Burlington Stores, Inc. * | 2,043 | 413,687 |
| CarMax, Inc. * | 5,122 | 426,560 |
| Dollar General Corp. | 7,919 | 1,236,077 |
| Dollar Tree, Inc. * | 7,312 | 742,387 |
| eBay, Inc. | 25,009 | 1,007,613 |
| Etsy, Inc. * | 3,750 | 197,963 |
| Expedia Group, Inc. | 4,281 | 556,958 |
| Five Below, Inc. * | 1,700 | 208,879 |
| Foot Locker, Inc. | 3,522 | 127,461 |
| Genuine Parts Co. | 4,523 | 408,382 |
| GrubHub, Inc. * | 2,839 | 168,466 |
| Kohl's Corp. | 4,969 | 234,835 |
| L Brands, Inc. | 6,985 | 115,322 |
| LKQ Corp. * | 9,586 | 251,824 |
| Lowe's Cos., Inc. | 24,040 | 2,697,288 |
| Macy's, Inc. | 9,333 | 137,755 |
| Nordstrom, Inc.(a) | 3,232 | 93,631 |
| O'Reilly Automotive, Inc. * | 2,397 | 919,873 |
| Ollie's Bargain Outlet Holdings, Inc. * | 1,628 | 90,273 |
| Penske Automotive Group, Inc. | 1,164 | 49,796 |
| Pool Corp. | 1,199 | 235,460 |
| Qurate Retail, Inc., Series A * | 12,519 | 134,079 |
| Ross Stores, Inc. | 11,312 | 1,199,185 |
| Target Corp. | 15,782 | 1,689,305 |
| The Gap, Inc. | 6,512 | 102,824 |
| The Home Depot, Inc. | 33,767 | 7,695,837 |
| The TJX Cos., Inc. | 37,138 | 2,041,476 |
| Tiffany & Co. | 3,318 | 281,599 |
| Tractor Supply Co. | 3,671 | 374,001 |
| Ulta Salon, Cosmetics & Fragrance, Inc. * | 1,707 | 405,805 |
| Urban Outfitters, Inc. * | 2,010 | 47,054 |
| Wayfair, Inc., Class A * | 1,963 | 221,309 |
| Williams-Sonoma, Inc. | 2,411 | 158,644 |
| 51,587,130 | ||
| Semiconductors & Semiconductor Equipment 3.7% | ||
| Advanced Micro Devices, Inc. * | 27,188 | 855,063 |
| Analog Devices, Inc. | 11,348 | 1,246,351 |
| Applied Materials, Inc. | 28,697 | 1,378,030 |
| Broadcom, Inc. | 12,148 | 3,433,511 |
| Cree, Inc. * | 3,222 | 138,320 |
| Cypress Semiconductor Corp. | 11,511 | 264,868 |
| Entegris, Inc. | 4,134 | 177,059 |
| First Solar, Inc. * | 2,344 | 145,492 |
| Intel Corp. | 137,397 | 6,513,992 |
| KLA Corp. | 4,958 | 733,288 |
| Lam Research Corp. | 4,596 | 967,504 |
| Marvell Technology Group Ltd. | 18,232 | 437,021 |
| Maxim Integrated Products, Inc. | 8,353 | 455,573 |
| Microchip Technology, Inc. | 7,323 | 632,194 |
| Micron Technology, Inc. * | 33,863 | 1,532,978 |
| MKS Instruments, Inc. | 1,679 | 131,449 |
| Monolithic Power Systems, Inc. | 1,214 | 182,780 |
| NVIDIA Corp. | 18,692 | 3,131,097 |
| ON Semiconductor Corp. * | 12,442 | 221,468 |
| Qorvo, Inc. * | 3,722 | 265,862 |
| QUALCOMM, Inc. | 37,308 | 2,901,443 |
| Semtech Corp. * | 2,123 | 89,102 |
| Security | Number of Shares | Value ($) |
| Silicon Laboratories, Inc. * | 1,332 | 145,188 |
| Skyworks Solutions, Inc. | 5,330 | 401,189 |
| Teradyne, Inc. | 5,275 | 279,417 |
| Texas Instruments, Inc. | 28,820 | 3,566,475 |
| Universal Display Corp. | 1,295 | 266,084 |
| Xilinx, Inc. | 7,779 | 809,483 |
| 31,302,281 | ||
| Software & Services 12.8% | ||
| Accenture plc, Class A | 19,576 | 3,879,376 |
| ACI Worldwide, Inc. * | 3,497 | 104,141 |
| Adobe, Inc. * | 14,981 | 4,262,244 |
| Akamai Technologies, Inc. * | 4,996 | 445,293 |
| Alliance Data Systems Corp. | 1,214 | 149,261 |
| Amdocs Ltd. | 4,231 | 273,915 |
| ANSYS, Inc. * | 2,562 | 529,207 |
| Aspen Technology, Inc. * | 2,116 | 281,851 |
| Autodesk, Inc. * | 6,744 | 963,178 |
| Automatic Data Processing, Inc. | 13,351 | 2,267,534 |
| Black Knight, Inc. * | 4,453 | 277,199 |
| Blackbaud, Inc. | 1,544 | 140,458 |
| Booz Allen Hamilton Holding Corp. | 4,290 | 323,938 |
| Broadridge Financial Solutions, Inc. | 3,552 | 459,771 |
| CACI International, Inc., Class A * | 747 | 166,051 |
| Cadence Design Systems, Inc. * | 8,601 | 588,996 |
| CDK Global, Inc. | 3,730 | 160,987 |
| Ceridian HCM Holding, Inc. * | 2,418 | 139,688 |
| Citrix Systems, Inc. | 3,801 | 353,417 |
| Cognizant Technology Solutions Corp., Class A | 17,537 | 1,076,596 |
| Coupa Software, Inc. * | 1,685 | 234,097 |
| DocuSign, Inc. * | 696 | 32,496 |
| Dropbox, Inc., Class A * | 6,000 | 107,400 |
| DXC Technology Co. | 8,167 | 271,308 |
| EPAM Systems, Inc. * | 1,592 | 304,597 |
| Euronet Worldwide, Inc. * | 1,617 | 247,627 |
| Fair Isaac Corp. * | 895 | 315,684 |
| Fidelity National Information Services, Inc. | 18,808 | 2,562,026 |
| FireEye, Inc. * | 6,517 | 87,523 |
| Fiserv, Inc. * | 17,473 | 1,868,563 |
| FleetCor Technologies, Inc. * | 2,646 | 789,566 |
| Fortinet, Inc. * | 4,414 | 349,501 |
| Gartner, Inc. * | 2,791 | 373,073 |
| Genpact Ltd. | 4,557 | 186,655 |
| Global Payments, Inc. | 4,781 | 793,550 |
| GoDaddy, Inc., Class A * | 5,391 | 341,466 |
| Guidewire Software, Inc. * | 2,455 | 236,122 |
| HubSpot, Inc. * | 1,176 | 234,824 |
| International Business Machines Corp. | 27,213 | 3,688,178 |
| Intuit, Inc. | 7,956 | 2,294,192 |
| j2 Global, Inc. | 1,418 | 119,963 |
| Jack Henry & Associates, Inc. | 2,387 | 346,020 |
| Leidos Holdings, Inc. | 4,449 | 388,665 |
| LogMeIn, Inc. | 1,539 | 102,867 |
| Mastercard, Inc., Class A | 27,582 | 7,760,747 |
| MAXIMUS, Inc. | 1,933 | 148,725 |
| Microsoft Corp. | 235,193 | 32,423,707 |
| New Relic, Inc. * | 1,455 | 83,430 |
| Nuance Communications, Inc. * | 8,844 | 148,668 |
| Nutanix, Inc., Class A * | 4,558 | 110,440 |
| Okta, Inc. * | 3,210 | 406,065 |
| Oracle Corp. | 74,492 | 3,878,053 |
| Palo Alto Networks, Inc. * | 2,941 | 598,846 |
| Paychex, Inc. | 9,817 | 802,049 |
| Paycom Software, Inc. * | 1,530 | 382,684 |
| Paylocity Holding Corp. * | 1,007 | 109,985 |
| PayPal Holdings, Inc. * | 36,059 | 3,932,234 |
| Security | Number of Shares | Value ($) |
| Pegasystems, Inc. | 1,114 | 78,147 |
| Proofpoint, Inc. * | 1,721 | 195,523 |
| PTC, Inc. * | 3,149 | 206,165 |
| RealPage, Inc. * | 2,220 | 141,347 |
| RingCentral, Inc., Class A * | 2,158 | 304,559 |
| Sabre Corp. | 8,533 | 201,720 |
| salesforce.com, Inc. * | 26,224 | 4,092,780 |
| Science Applications International Corp. | 1,530 | 134,655 |
| ServiceNow, Inc. * | 5,656 | 1,480,967 |
| Splunk, Inc. * | 4,651 | 520,075 |
| Square, Inc., Class A * | 9,695 | 599,539 |
| SS&C Technologies Holdings, Inc. | 6,573 | 306,368 |
| Symantec Corp. | 18,982 | 441,331 |
| Synopsys, Inc. * | 4,628 | 656,297 |
| Teradata Corp. * | 3,616 | 111,626 |
| The Trade Desk, Inc., Class A * | 1,117 | 274,525 |
| The Western Union Co. | 13,312 | 294,461 |
| Total System Services, Inc. | 5,010 | 672,442 |
| Twilio, Inc., Class A * | 3,586 | 467,865 |
| Tyler Technologies, Inc. * | 1,165 | 298,869 |
| VeriSign, Inc. * | 3,229 | 658,232 |
| Visa, Inc., Class A | 53,375 | 9,651,267 |
| VMware, Inc., Class A | 2,371 | 335,354 |
| WEX, Inc. * | 1,327 | 271,438 |
| Workday, Inc., Class A * | 4,965 | 880,195 |
| Zendesk, Inc. * | 3,348 | 268,510 |
| Zscaler, Inc. * | 423 | 29,077 |
| 107,478,031 | ||
| Technology Hardware & Equipment 5.4% | ||
| Amphenol Corp., Class A | 9,176 | 803,267 |
| Apple, Inc. | 134,150 | 28,002,471 |
| Arista Networks, Inc. * | 1,616 | 366,218 |
| Arrow Electronics, Inc. * | 2,574 | 178,121 |
| Avnet, Inc. | 3,176 | 133,043 |
| CDW Corp. | 4,482 | 517,671 |
| Ciena Corp. * | 4,438 | 181,647 |
| Cisco Systems, Inc. | 131,376 | 6,149,710 |
| Cognex Corp. | 5,250 | 236,670 |
| CommScope Holding Co., Inc. * | 6,369 | 68,403 |
| Corning, Inc. | 23,985 | 667,982 |
| Dell Technologies, Inc., Class C * | 4,674 | 240,851 |
| Dolby Laboratories, Inc., Class A | 2,005 | 123,428 |
| F5 Networks, Inc. * | 1,820 | 234,289 |
| FLIR Systems, Inc. | 4,174 | 205,653 |
| Hewlett Packard Enterprise Co. | 41,152 | 568,721 |
| HP, Inc. | 46,210 | 845,181 |
| IPG Photonics Corp. * | 1,054 | 130,411 |
| Jabil, Inc. | 4,299 | 123,854 |
| Juniper Networks, Inc. | 10,490 | 242,948 |
| Keysight Technologies, Inc. * | 5,757 | 557,623 |
| Littelfuse, Inc. | 780 | 121,735 |
| Lumentum Holdings, Inc. * | 2,348 | 130,924 |
| Motorola Solutions, Inc. | 5,044 | 912,510 |
| National Instruments Corp. | 3,506 | 147,252 |
| NetApp, Inc. | 7,612 | 365,833 |
| Pure Storage, Inc., Class A * | 5,242 | 85,340 |
| Seagate Technology plc | 7,711 | 387,169 |
| SYNNEX Corp. | 1,301 | 109,037 |
| TE Connectivity Ltd. | 10,348 | 943,945 |
| Tech Data Corp. * | 1,172 | 108,680 |
| Trimble, Inc. * | 7,769 | 291,493 |
| Ubiquiti, Inc. | 600 | 66,306 |
| ViaSat, Inc. * | 1,746 | 138,510 |
| Western Digital Corp. | 9,007 | 515,831 |
| Security | Number of Shares | Value ($) |
| Xerox Holdings Corp. * | 6,067 | 175,882 |
| Zebra Technologies Corp., Class A * | 1,640 | 336,249 |
| 45,414,858 | ||
| Telecommunication Services 2.0% | ||
| AT&T, Inc. | 223,940 | 7,896,124 |
| CenturyLink, Inc. | 29,272 | 333,115 |
| GCI Liberty, Inc., Class A * | 2,992 | 186,222 |
| Intelsat S.A. * | 2,036 | 42,105 |
| Sprint Corp. * | 18,114 | 122,994 |
| T-Mobile US, Inc. * | 9,699 | 757,007 |
| Telephone & Data Systems, Inc. | 2,824 | 71,165 |
| Verizon Communications, Inc. | 126,906 | 7,380,853 |
| Zayo Group Holdings, Inc. * | 6,272 | 211,116 |
| 17,000,701 | ||
| Transportation 1.9% | ||
| Alaska Air Group, Inc. | 3,826 | 228,489 |
| AMERCO | 250 | 87,905 |
| American Airlines Group, Inc. | 12,113 | 318,693 |
| C.H. Robinson Worldwide, Inc. | 4,137 | 349,535 |
| CSX Corp. | 23,595 | 1,581,337 |
| Delta Air Lines, Inc. | 18,282 | 1,057,797 |
| Expeditors International of Washington, Inc. | 5,238 | 372,422 |
| FedEx Corp. | 7,371 | 1,169,114 |
| Genesee & Wyoming, Inc., Class A * | 1,746 | 193,596 |
| J.B. Hunt Transport Services, Inc. | 2,687 | 290,303 |
| JetBlue Airways Corp. * | 9,120 | 157,958 |
| Kansas City Southern | 3,044 | 382,935 |
| Kirby Corp. * | 1,623 | 119,437 |
| Knight-Swift Transportation Holdings, Inc. | 3,785 | 129,220 |
| Landstar System, Inc. | 1,243 | 138,619 |
| Macquarie Infrastructure Corp. | 2,329 | 88,083 |
| Norfolk Southern Corp. | 8,153 | 1,419,030 |
| Old Dominion Freight Line, Inc. | 2,002 | 327,848 |
| Southwest Airlines Co. | 14,978 | 783,649 |
| Spirit Airlines, Inc. * | 2,054 | 77,107 |
| Union Pacific Corp. | 21,728 | 3,519,067 |
| United Airlines Holdings, Inc. * | 6,840 | 576,680 |
| United Parcel Service, Inc., Class B | 21,383 | 2,537,307 |
| XPO Logistics, Inc. * | 2,891 | 204,856 |
| 16,110,987 | ||
| Utilities 3.4% | ||
| AES Corp. | 20,341 | 311,828 |
| ALLETE, Inc. | 1,580 | 135,453 |
| Alliant Energy Corp. | 7,310 | 383,410 |
| Ameren Corp. | 7,533 | 581,171 |
| American Electric Power Co., Inc. | 15,198 | 1,385,298 |
| American Water Works Co., Inc. | 5,554 | 707,135 |
| Aqua America, Inc. | 6,634 | 293,820 |
| Atmos Energy Corp. | 3,619 | 398,922 |
| Avangrid, Inc. | 1,746 | 88,243 |
| Black Hills Corp. | 1,709 | 131,097 |
| CenterPoint Energy, Inc. | 15,384 | 425,983 |
| CMS Energy Corp. | 8,761 | 552,381 |
| Consolidated Edison, Inc. | 10,019 | 890,689 |
| Dominion Energy, Inc. | 24,638 | 1,912,648 |
| DTE Energy Co. | 5,615 | 728,041 |
| Duke Energy Corp. | 22,335 | 2,071,348 |
| Edison International | 10,921 | 789,261 |
| Entergy Corp. | 5,836 | 658,534 |
| Evergy, Inc. | 7,514 | 488,410 |
| Eversource Energy | 9,834 | 787,998 |
| Exelon Corp. | 29,791 | 1,407,923 |
| Security | Number of Shares | Value ($) |
| FirstEnergy Corp. | 15,478 | 711,988 |
| Hawaiian Electric Industries, Inc. | 3,291 | 146,120 |
| IDACORP, Inc. | 1,516 | 166,472 |
| MDU Resources Group, Inc. | 6,198 | 166,664 |
| National Fuel Gas Co. | 2,654 | 124,048 |
| New Jersey Resources Corp. | 2,691 | 123,086 |
| NextEra Energy, Inc. | 14,705 | 3,221,571 |
| NiSource, Inc. | 11,334 | 334,920 |
| NRG Energy, Inc. | 7,757 | 282,355 |
| OGE Energy Corp. | 6,095 | 261,293 |
| ONE Gas, Inc. | 1,610 | 147,492 |
| Pinnacle West Capital Corp. | 3,405 | 324,531 |
| PNM Resources, Inc. | 2,541 | 129,616 |
| Portland General Electric Co. | 2,803 | 159,463 |
| PPL Corp. | 21,958 | 648,859 |
| Public Service Enterprise Group, Inc. | 15,473 | 935,652 |
| Sempra Energy | 8,396 | 1,189,126 |
| Southwest Gas Holdings, Inc. | 1,616 | 147,428 |
| Spire, Inc. | 1,617 | 137,283 |
| The Southern Co. | 31,960 | 1,861,990 |
| UGI Corp. | 6,407 | 311,829 |
| Vistra Energy Corp. | 11,552 | 288,222 |
| WEC Energy Group, Inc. | 9,620 | 921,307 |
| Xcel Energy, Inc. | 15,783 | 1,013,584 |
| 28,884,492 | ||
| Total Common Stock | ||
| (Cost $774,069,496) | 836,734,664 | |
| Other Investment Companies0.1% of net assets | ||
| Money Market Fund 0.1% | ||
| State Street Institutional U.S. Government Money Market Fund, Premier Class 2.07%(c) | 639,417 | 639,417 |
| Securities Lending Collateral 0.0% | ||
| Wells Fargo Government Money Market Fund, Select Class 2.03%(c) | 143,525 | 143,525 |
| Total Other Investment Companies | ||
| (Cost $782,942) | 782,942 | |
| Number of Contracts | Notional Amount ($) | Current Value/ Unrealized Appreciation ($) | ||
| Futures Contracts | ||||
| Long | ||||
| S&P 500 Index, e-mini, expires 09/20/19 | 9 | 1,316,160 | 14,050 | |
| * | Non-income producing security. |
| (a) | All or a portion of this security is on loan. Securities on loan were valued at $139,835. |
| (b) | Issuer is affiliated with the fund's investment adviser. |
| (c) | The rate shown is the 7-day yield. |
| REIT — | Real Estate Investment Trust |
| Security | Number of Shares | Value ($) |
| Common Stock99.8% of net assets | ||
| Automobiles & Components 0.6% | ||
| Aptiv plc | 175,313 | 14,580,782 |
| Autoliv, Inc. | 59,387 | 4,062,071 |
| BorgWarner, Inc. | 138,859 | 4,530,969 |
| Ford Motor Co. | 2,652,473 | 24,323,177 |
| General Motors Co. | 892,410 | 33,099,487 |
| Harley-Davidson, Inc. | 109,891 | 3,505,523 |
| Lear Corp. | 41,718 | 4,683,263 |
| Tesla, Inc. * | 93,308 | 21,051,218 |
| The Goodyear Tire & Rubber Co. | 154,602 | 1,773,285 |
| Veoneer, Inc. *(a) | 76,749 | 1,125,908 |
| 112,735,683 | ||
| Banks 5.0% | ||
| Bank of America Corp. | 5,990,064 | 164,786,661 |
| BB&T Corp. | 518,431 | 24,703,237 |
| BOK Financial Corp. | 20,980 | 1,597,417 |
| CIT Group, Inc. | 65,339 | 2,782,788 |
| Citigroup, Inc. | 1,566,851 | 100,826,862 |
| Citizens Financial Group, Inc. | 310,240 | 10,467,498 |
| Comerica, Inc. | 104,407 | 6,436,691 |
| Commerce Bancshares, Inc. | 65,248 | 3,723,703 |
| Cullen/Frost Bankers, Inc. | 42,090 | 3,493,891 |
| East West Bancorp, Inc. | 97,962 | 4,029,177 |
| Fifth Third Bancorp | 492,037 | 13,014,379 |
| First Republic Bank | 112,099 | 10,057,522 |
| Huntington Bancshares, Inc. | 702,299 | 9,305,462 |
| JPMorgan Chase & Co. | 2,197,204 | 241,384,831 |
| KeyCorp | 686,897 | 11,402,490 |
| M&T Bank Corp. | 92,703 | 13,554,106 |
| New York Community Bancorp, Inc. | 314,022 | 3,623,814 |
| People's United Financial, Inc. | 263,497 | 3,786,452 |
| Regions Financial Corp. | 683,752 | 9,996,454 |
| Signature Bank | 37,355 | 4,357,461 |
| SunTrust Banks, Inc. | 301,102 | 18,520,784 |
| SVB Financial Group * | 35,886 | 6,984,133 |
| The PNC Financial Services Group, Inc. | 305,584 | 39,398,945 |
| U.S. Bancorp | 1,013,788 | 53,416,490 |
| Wells Fargo & Co. | 2,740,159 | 127,609,205 |
| Zions Bancorp NA | 124,001 | 5,095,201 |
| 894,355,654 | ||
| Capital Goods 6.6% | ||
| 3M Co. | 390,289 | 63,117,537 |
| A.O. Smith Corp. | 94,751 | 4,407,817 |
| Acuity Brands, Inc. | 27,520 | 3,451,283 |
| AGCO Corp. | 44,513 | 3,076,739 |
| Allegion plc | 64,269 | 6,187,177 |
| Allison Transmission Holdings, Inc. | 82,006 | 3,643,527 |
| AMETEK, Inc. | 153,473 | 13,187,935 |
| Arconic, Inc. | 270,592 | 6,992,097 |
| Carlisle Cos., Inc. | 38,569 | 5,590,962 |
| Caterpillar, Inc. | 387,483 | 46,110,477 |
| Cummins, Inc. | 97,947 | 14,620,549 |
| Deere & Co. | 214,412 | 33,214,563 |
| Security | Number of Shares | Value ($) |
| Donaldson Co., Inc. | 84,966 | 4,108,956 |
| Dover Corp. | 97,792 | 9,167,022 |
| Eaton Corp. plc | 285,441 | 23,040,798 |
| Emerson Electric Co. | 416,947 | 24,845,872 |
| Fastenal Co. | 385,544 | 11,805,357 |
| Flowserve Corp. | 89,132 | 3,804,154 |
| Fluor Corp. | 92,984 | 1,643,027 |
| Fortive Corp. | 200,465 | 14,212,968 |
| Fortune Brands Home & Security, Inc. | 96,127 | 4,908,245 |
| General Dynamics Corp. | 183,925 | 35,179,335 |
| General Electric Co. | 5,903,601 | 48,704,708 |
| Graco, Inc. | 112,271 | 5,116,189 |
| GrafTech International Ltd.(a) | 39,601 | 482,736 |
| HD Supply Holdings, Inc. * | 115,246 | 4,484,222 |
| HEICO Corp. | 27,880 | 4,033,400 |
| HEICO Corp., Class A | 48,298 | 5,330,167 |
| Honeywell International, Inc. | 492,845 | 81,132,144 |
| Hubbell, Inc. | 37,441 | 4,910,013 |
| Huntington Ingalls Industries, Inc. | 28,451 | 5,946,259 |
| IDEX Corp. | 50,952 | 8,392,304 |
| Illinois Tool Works, Inc. | 202,582 | 30,358,938 |
| Ingersoll-Rand plc | 163,332 | 19,777,872 |
| Jacobs Engineering Group, Inc. | 77,171 | 6,857,415 |
| Johnson Controls International plc | 539,633 | 23,036,933 |
| L3Harris Technologies, Inc. | 149,635 | 31,634,335 |
| Lennox International, Inc. | 24,099 | 6,115,844 |
| Lincoln Electric Holdings, Inc. | 41,906 | 3,459,759 |
| Lockheed Martin Corp. | 166,628 | 64,003,481 |
| Masco Corp. | 198,519 | 8,085,679 |
| Nordson Corp. | 34,982 | 4,756,153 |
| Northrop Grumman Corp. | 115,081 | 42,334,847 |
| Owens Corning | 72,596 | 4,164,107 |
| PACCAR, Inc. | 235,047 | 15,409,681 |
| Parker-Hannifin Corp. | 86,744 | 14,379,553 |
| Pentair plc | 109,063 | 3,917,543 |
| Quanta Services, Inc. | 96,249 | 3,262,841 |
| Raytheon Co. | 188,574 | 34,946,534 |
| Rockwell Automation, Inc. | 80,447 | 12,291,497 |
| Roper Technologies, Inc. | 70,405 | 25,821,738 |
| Sensata Technologies Holding plc * | 108,797 | 4,958,967 |
| Snap-on, Inc. | 37,930 | 5,639,432 |
| Spirit AeroSystems Holdings, Inc., Class A | 69,908 | 5,634,585 |
| Stanley Black & Decker, Inc. | 103,020 | 13,687,237 |
| Teledyne Technologies, Inc. * | 24,373 | 7,521,264 |
| Textron, Inc. | 157,677 | 7,095,465 |
| The Boeing Co. | 354,375 | 129,024,394 |
| The Middleby Corp. * | 38,287 | 4,198,552 |
| The Toro Co. | 71,712 | 5,163,981 |
| TransDigm Group, Inc. | 33,038 | 17,785,016 |
| Trinity Industries, Inc. | 89,641 | 1,566,028 |
| United Rentals, Inc. * | 53,072 | 5,973,784 |
| United Technologies Corp. | 549,703 | 71,593,319 |
| W.W. Grainger, Inc. | 30,564 | 8,363,839 |
| WABCO Holdings, Inc. * | 34,415 | 4,594,747 |
| Wabtec Corp. | 123,133 | 8,522,035 |
| Xylem, Inc. | 121,571 | 9,313,554 |
| 1,170,099,488 | ||
| Security | Number of Shares | Value ($) |
| Commercial & Professional Services 0.9% | ||
| ADT, Inc.(a) | 88,831 | 422,836 |
| Cintas Corp. | 57,481 | 15,163,488 |
| Copart, Inc. * | 136,358 | 10,280,030 |
| CoStar Group, Inc. * | 24,854 | 15,281,979 |
| Equifax, Inc. | 81,500 | 11,929,970 |
| IAA, Inc. * | 91,164 | 4,453,361 |
| IHS Markit Ltd. * | 246,506 | 16,173,259 |
| KAR Auction Services, Inc. | 89,128 | 2,367,240 |
| ManpowerGroup, Inc. | 40,014 | 3,270,744 |
| Nielsen Holdings plc | 242,024 | 5,024,418 |
| Republic Services, Inc. | 146,094 | 13,038,889 |
| Robert Half International, Inc. | 80,104 | 4,283,161 |
| Rollins, Inc. | 100,586 | 3,300,227 |
| Stericycle, Inc. * | 57,672 | 2,588,896 |
| TransUnion | 126,588 | 10,589,086 |
| Verisk Analytics, Inc. | 110,692 | 17,881,186 |
| Waste Management, Inc. | 264,633 | 31,583,948 |
| 167,632,718 | ||
| Consumer Durables & Apparel 1.2% | ||
| Capri Holdings Ltd. * | 100,267 | 2,645,043 |
| Carter's, Inc. | 31,348 | 2,867,715 |
| D.R. Horton, Inc. | 229,587 | 11,357,669 |
| Garmin Ltd. | 81,833 | 6,675,118 |
| Hanesbrands, Inc. | 245,904 | 3,359,049 |
| Hasbro, Inc. | 78,305 | 8,650,353 |
| Leggett & Platt, Inc. | 87,337 | 3,248,063 |
| Lennar Corp., B Shares | 9,022 | 365,481 |
| Lennar Corp., Class A | 195,539 | 9,972,489 |
| Lululemon Athletica, Inc. * | 71,724 | 13,245,271 |
| Mattel, Inc. * | 235,154 | 2,304,509 |
| Mohawk Industries, Inc. * | 41,714 | 4,959,378 |
| Newell Brands, Inc. | 261,577 | 4,342,178 |
| NIKE, Inc., Class B | 851,512 | 71,952,764 |
| NVR, Inc. * | 2,280 | 8,205,720 |
| Polaris, Inc. | 39,621 | 3,249,714 |
| PulteGroup, Inc. | 172,983 | 5,846,825 |
| PVH Corp. | 51,672 | 3,916,738 |
| Ralph Lauren Corp. | 34,733 | 3,068,313 |
| Tapestry, Inc. | 196,599 | 4,059,769 |
| Toll Brothers, Inc. | 89,183 | 3,227,533 |
| Under Armour, Inc., Class A * | 127,078 | 2,364,922 |
| Under Armour, Inc., Class C * | 131,114 | 2,218,449 |
| VF Corp. | 219,768 | 18,009,988 |
| Whirlpool Corp. | 43,243 | 6,014,669 |
| 206,127,720 | ||
| Consumer Services 2.2% | ||
| Aramark | 165,548 | 6,764,291 |
| Bright Horizons Family Solutions, Inc. * | 39,561 | 6,529,543 |
| Caesars Entertainment Corp. * | 395,438 | 4,551,491 |
| Carnival Corp. | 269,828 | 11,894,018 |
| Chipotle Mexican Grill, Inc. * | 16,567 | 13,890,104 |
| Darden Restaurants, Inc. | 83,669 | 10,122,276 |
| Domino's Pizza, Inc. | 28,057 | 6,364,450 |
| Dunkin' Brands Group, Inc. | 56,066 | 4,622,081 |
| H&R Block, Inc. | 136,000 | 3,293,920 |
| Hilton Worldwide Holdings, Inc. | 197,344 | 18,228,665 |
| Las Vegas Sands Corp. | 245,524 | 13,619,216 |
| Marriott International, Inc., Class A | 186,926 | 23,563,892 |
| McDonald's Corp. | 517,024 | 112,695,721 |
| MGM Resorts International | 343,110 | 9,627,667 |
| Norwegian Cruise Line Holdings Ltd. * | 145,556 | 7,386,967 |
| Royal Caribbean Cruises Ltd. | 116,605 | 12,159,569 |
| Security | Number of Shares | Value ($) |
| Service Corp. International | 123,526 | 5,719,254 |
| ServiceMaster Global Holdings, Inc. * | 92,082 | 5,252,357 |
| Starbucks Corp. | 820,259 | 79,204,209 |
| Vail Resorts, Inc. | 27,466 | 6,489,667 |
| Wyndham Destinations, Inc. | 62,664 | 2,778,522 |
| Wyndham Hotels & Resorts, Inc. | 66,558 | 3,419,750 |
| Wynn Resorts Ltd. | 65,234 | 7,185,525 |
| Yum! Brands, Inc. | 207,257 | 24,203,473 |
| 399,566,628 | ||
| Diversified Financials 5.1% | ||
| Affiliated Managers Group, Inc. | 34,597 | 2,651,168 |
| AGNC Investment Corp. | 362,990 | 5,397,661 |
| Ally Financial, Inc. | 269,706 | 8,455,283 |
| American Express Co. | 463,180 | 55,752,977 |
| Ameriprise Financial, Inc. | 91,070 | 11,746,209 |
| Annaly Capital Management, Inc. | 985,572 | 8,180,248 |
| AXA Equitable Holdings, Inc. | 168,093 | 3,491,292 |
| Berkshire Hathaway, Inc., Class B * | 1,312,085 | 266,891,210 |
| BlackRock, Inc. | 80,650 | 34,079,464 |
| Capital One Financial Corp. | 317,971 | 27,542,648 |
| Cboe Global Markets, Inc. | 75,299 | 8,972,629 |
| CME Group, Inc. | 242,439 | 52,679,570 |
| Credit Acceptance Corp. * | 8,001 | 3,621,653 |
| Discover Financial Services | 218,819 | 17,498,955 |
| E*TRADE Financial Corp. | 165,479 | 6,907,093 |
| Eaton Vance Corp. | 78,958 | 3,404,669 |
| FactSet Research Systems, Inc. | 26,142 | 7,112,977 |
| Franklin Resources, Inc. | 201,705 | 5,300,807 |
| Intercontinental Exchange, Inc. | 381,589 | 35,670,940 |
| Invesco Ltd. | 267,823 | 4,204,821 |
| Janus Henderson Group plc | 110,714 | 2,115,744 |
| Jefferies Financial Group, Inc. | 176,260 | 3,285,486 |
| KKR & Co., Inc., Class A | 367,539 | 9,497,208 |
| Lazard Ltd., Class A | 86,482 | 2,969,792 |
| MarketAxess Holdings, Inc. | 25,441 | 10,115,850 |
| Moody's Corp. | 111,839 | 24,110,252 |
| Morgan Stanley | 865,737 | 35,919,428 |
| MSCI, Inc. | 57,520 | 13,495,918 |
| Nasdaq, Inc. | 78,548 | 7,842,232 |
| Northern Trust Corp. | 147,763 | 12,992,801 |
| Raymond James Financial, Inc. | 85,487 | 6,711,584 |
| S&P Global, Inc. | 166,824 | 43,405,937 |
| Santander Consumer USA Holdings, Inc. | 74,298 | 1,939,921 |
| SEI Investments Co. | 87,965 | 5,058,867 |
| Starwood Property Trust, Inc. | 193,257 | 4,528,011 |
| State Street Corp. | 252,295 | 12,945,256 |
| Synchrony Financial | 430,833 | 13,808,198 |
| T. Rowe Price Group, Inc. | 159,715 | 17,667,673 |
| TD Ameritrade Holding Corp. | 181,236 | 8,048,691 |
| The Bank of New York Mellon Corp. | 595,929 | 25,064,774 |
| The Charles Schwab Corp.(b) | 798,679 | 30,565,445 |
| The Goldman Sachs Group, Inc. | 230,650 | 47,031,841 |
| Voya Financial, Inc. | 97,858 | 4,826,357 |
| 913,509,540 | ||
| Energy 4.3% | ||
| Antero Midstream Corp.(a) | 153,107 | 1,088,591 |
| Antero Resources Corp. * | 144,350 | 457,590 |
| Apache Corp. | 255,241 | 5,505,548 |
| Baker Hughes a GE Co. | 349,214 | 7,574,452 |
| Cabot Oil & Gas Corp. | 286,300 | 4,901,456 |
| Cheniere Energy, Inc. * | 149,001 | 8,896,850 |
| Chevron Corp. | 1,290,016 | 151,860,684 |
| Cimarex Energy Co. | 68,953 | 2,949,809 |
| Concho Resources, Inc. | 136,542 | 9,988,047 |
| Security | Number of Shares | Value ($) |
| ConocoPhillips | 765,074 | 39,921,561 |
| Continental Resources, Inc. * | 57,690 | 1,684,548 |
| Core Laboratories N.V. | 28,825 | 1,141,182 |
| Devon Energy Corp. | 278,794 | 6,130,680 |
| Diamondback Energy, Inc. | 104,196 | 10,219,544 |
| EOG Resources, Inc. | 393,281 | 29,177,517 |
| EQT Corp. | 173,373 | 1,763,203 |
| Equitrans Midstream Corp. | 139,936 | 1,887,737 |
| Exxon Mobil Corp. | 2,864,851 | 196,184,997 |
| Halliburton Co. | 595,143 | 11,212,494 |
| Helmerich & Payne, Inc. | 75,226 | 2,827,745 |
| Hess Corp. | 173,057 | 10,893,938 |
| HollyFrontier Corp. | 107,586 | 4,772,515 |
| Kinder Morgan, Inc. | 1,318,297 | 26,721,880 |
| Marathon Oil Corp. | 549,792 | 6,509,537 |
| Marathon Petroleum Corp. | 448,650 | 22,078,067 |
| Murphy Oil Corp. | 103,152 | 1,880,461 |
| National Oilwell Varco, Inc. | 259,724 | 5,306,161 |
| Noble Energy, Inc. | 320,777 | 7,243,145 |
| Occidental Petroleum Corp. | 607,171 | 26,399,795 |
| ONEOK, Inc. | 279,557 | 19,926,823 |
| Parsley Energy, Inc., Class A * | 179,285 | 3,210,994 |
| Phillips 66 | 283,203 | 27,932,312 |
| Pioneer Natural Resources Co. | 114,684 | 14,154,299 |
| Schlumberger Ltd. | 936,717 | 30,377,732 |
| Targa Resources Corp. | 160,078 | 5,782,017 |
| TechnipFMC plc | 287,528 | 7,142,196 |
| The Williams Cos., Inc. | 821,542 | 19,388,391 |
| Valero Energy Corp. | 283,064 | 21,309,058 |
| WPX Energy, Inc. * | 272,135 | 2,928,173 |
| 759,331,729 | ||
| Food & Staples Retailing 1.5% | ||
| Costco Wholesale Corp. | 297,905 | 87,810,478 |
| Sysco Corp. | 320,323 | 23,809,609 |
| The Kroger Co. | 544,872 | 12,902,569 |
| US Foods Holding Corp. * | 148,235 | 5,996,106 |
| Walgreens Boots Alliance, Inc. | 525,807 | 26,916,060 |
| Walmart, Inc. | 946,871 | 108,189,480 |
| 265,624,302 | ||
| Food, Beverage & Tobacco 3.8% | ||
| Altria Group, Inc. | 1,266,666 | 55,403,971 |
| Archer-Daniels-Midland Co. | 380,629 | 14,482,933 |
| Brown-Forman Corp., Class A | 44,129 | 2,540,507 |
| Brown-Forman Corp., Class B | 110,475 | 6,516,920 |
| Bunge Ltd. | 96,880 | 5,174,361 |
| Campbell Soup Co. | 131,706 | 5,926,770 |
| Conagra Brands, Inc. | 326,937 | 9,271,933 |
| Constellation Brands, Inc., Class A | 113,102 | 23,112,394 |
| General Mills, Inc. | 405,356 | 21,808,153 |
| Hormel Foods Corp. | 183,602 | 7,823,281 |
| Ingredion, Inc. | 45,864 | 3,543,911 |
| Kellogg Co. | 168,238 | 10,565,346 |
| Keurig Dr Pepper, Inc. | 124,558 | 3,397,942 |
| Lamb Weston Holdings, Inc. | 99,727 | 7,019,784 |
| McCormick & Co., Inc. Non-Voting Shares | 83,219 | 13,553,879 |
| Molson Coors Brewing Co., Class B | 126,465 | 6,495,242 |
| Mondelez International, Inc., Class A | 975,303 | 53,856,232 |
| Monster Beverage Corp. * | 265,327 | 15,566,735 |
| PepsiCo, Inc. | 948,967 | 129,752,258 |
| Philip Morris International, Inc. | 1,054,111 | 75,990,862 |
| Pilgrim's Pride Corp. * | 36,787 | 1,146,283 |
| Post Holdings, Inc. * | 45,162 | 4,502,200 |
| The Coca-Cola Co. | 2,599,480 | 143,075,379 |
| Security | Number of Shares | Value ($) |
| The Hershey Co. | 94,509 | 14,977,786 |
| The J.M. Smucker Co. | 77,066 | 8,104,261 |
| The Kraft Heinz Co. | 421,139 | 10,747,467 |
| Tyson Foods, Inc., Class A | 200,148 | 18,621,770 |
| 672,978,560 | ||
| Health Care Equipment & Services 6.2% | ||
| Abbott Laboratories | 1,194,710 | 101,932,657 |
| ABIOMED, Inc. * | 30,874 | 5,960,843 |
| Align Technology, Inc. * | 49,550 | 9,073,100 |
| AmerisourceBergen Corp. | 105,276 | 8,661,057 |
| Anthem, Inc. | 174,186 | 45,553,123 |
| Baxter International, Inc. | 321,201 | 28,249,628 |
| Becton Dickinson & Co. | 182,639 | 46,375,695 |
| Boston Scientific Corp. * | 940,254 | 40,177,053 |
| Cardinal Health, Inc. | 201,854 | 8,705,963 |
| Centene Corp. * | 279,096 | 13,011,456 |
| Cerner Corp. | 219,787 | 15,145,522 |
| Cigna Corp. * | 257,275 | 39,612,632 |
| CVS Health Corp. | 880,017 | 53,610,636 |
| Danaher Corp. | 426,379 | 60,584,192 |
| DaVita, Inc. * | 71,196 | 4,013,319 |
| DENTSPLY SIRONA, Inc. | 159,471 | 8,316,413 |
| DexCom, Inc. * | 61,541 | 10,561,051 |
| Edwards Lifesciences Corp. * | 140,934 | 31,264,799 |
| Encompass Health Corp. | 67,741 | 4,117,975 |
| HCA Healthcare, Inc. | 181,177 | 21,777,475 |
| Henry Schein, Inc. * | 100,685 | 6,204,210 |
| Hologic, Inc. * | 182,871 | 9,028,341 |
| Humana, Inc. | 91,200 | 25,828,752 |
| IDEXX Laboratories, Inc. * | 58,380 | 16,915,021 |
| Intuitive Surgical, Inc. * | 78,254 | 40,014,400 |
| Laboratory Corp. of America Holdings * | 67,017 | 11,229,369 |
| McKesson Corp. | 128,646 | 17,787,882 |
| Medtronic plc | 908,049 | 97,969,407 |
| Molina Healthcare, Inc. * | 41,903 | 5,459,123 |
| Quest Diagnostics, Inc. | 91,500 | 9,366,855 |
| ResMed, Inc. | 97,312 | 13,555,562 |
| STERIS plc | 57,626 | 8,897,454 |
| Stryker Corp. | 209,446 | 46,216,354 |
| Teleflex, Inc. | 31,151 | 11,336,472 |
| The Cooper Cos., Inc. | 33,337 | 10,326,136 |
| UnitedHealth Group, Inc. | 643,616 | 150,606,144 |
| Universal Health Services, Inc., Class B | 56,609 | 8,184,529 |
| Varian Medical Systems, Inc. * | 61,193 | 6,482,174 |
| Veeva Systems, Inc., Class A * | 86,889 | 13,935,258 |
| WellCare Health Plans, Inc. * | 33,915 | 9,182,147 |
| West Pharmaceutical Services, Inc. | 50,055 | 7,281,000 |
| Zimmer Biomet Holdings, Inc. | 139,051 | 19,355,899 |
| 1,101,867,078 | ||
| Household & Personal Products 1.9% | ||
| Church & Dwight Co., Inc. | 165,964 | 13,240,608 |
| Colgate-Palmolive Co. | 581,882 | 43,146,550 |
| Coty, Inc., Class A | 201,899 | 1,928,135 |
| Herbalife Nutrition Ltd. * | 69,209 | 2,382,866 |
| Kimberly-Clark Corp. | 232,511 | 32,809,627 |
| The Clorox Co. | 86,572 | 13,692,228 |
| The Estee Lauder Cos., Inc., Class A | 148,361 | 29,373,994 |
| The Procter & Gamble Co. | 1,698,221 | 204,177,111 |
| 340,751,119 | ||
| Insurance 2.7% | ||
| Aflac, Inc. | 505,100 | 25,345,918 |
| Alleghany Corp. * | 9,840 | 7,373,210 |
| Security | Number of Shares | Value ($) |
| American Financial Group, Inc. | 47,761 | 4,822,428 |
| American International Group, Inc. | 588,256 | 30,612,842 |
| Aon plc | 162,635 | 31,689,430 |
| Arch Capital Group Ltd. * | 272,105 | 10,748,148 |
| Arthur J. Gallagher & Co. | 125,850 | 11,415,854 |
| Assurant, Inc. | 41,344 | 5,085,312 |
| Athene Holding Ltd., Class A * | 79,685 | 3,096,559 |
| Axis Capital Holdings Ltd. | 57,370 | 3,521,944 |
| Brighthouse Financial, Inc. * | 78,935 | 2,783,248 |
| Brown & Brown, Inc. | 157,892 | 5,824,636 |
| Chubb Ltd. | 310,495 | 48,524,159 |
| Cincinnati Financial Corp. | 102,125 | 11,488,041 |
| CNA Financial Corp. | 19,111 | 900,701 |
| Erie Indemnity Co., Class A | 13,380 | 2,934,368 |
| Everest Re Group Ltd. | 27,415 | 6,466,650 |
| Fidelity National Financial, Inc. | 185,758 | 8,162,207 |
| Globe Life, Inc. * | 68,425 | 6,107,616 |
| Lincoln National Corp. | 137,663 | 7,279,619 |
| Loews Corp. | 181,319 | 8,716,004 |
| Markel Corp. * | 9,416 | 10,763,241 |
| Marsh & McLennan Cos., Inc. | 345,943 | 34,556,246 |
| MetLife, Inc. | 642,085 | 28,444,366 |
| Old Republic International Corp. | 194,227 | 4,537,143 |
| Principal Financial Group, Inc. | 174,678 | 9,296,363 |
| Prudential Financial, Inc. | 275,198 | 22,040,608 |
| Reinsurance Group of America, Inc. | 42,505 | 6,544,495 |
| RenaissanceRe Holdings Ltd. | 29,604 | 5,345,002 |
| The Allstate Corp. | 225,444 | 23,083,211 |
| The Hartford Financial Services Group, Inc. | 245,424 | 14,303,311 |
| The Progressive Corp. | 394,758 | 29,922,656 |
| The Travelers Cos., Inc. | 177,326 | 26,059,829 |
| Unum Group | 141,828 | 3,603,849 |
| W.R. Berkley Corp. | 98,795 | 7,039,144 |
| Willis Towers Watson plc | 87,662 | 17,354,446 |
| 485,792,804 | ||
| Materials 2.8% | ||
| Air Products & Chemicals, Inc. | 149,022 | 33,667,050 |
| Albemarle Corp. | 71,496 | 4,413,448 |
| Alcoa Corp. * | 123,826 | 2,220,200 |
| Ashland Global Holdings, Inc. | 41,843 | 3,064,581 |
| Avery Dennison Corp. | 57,862 | 6,687,111 |
| Axalta Coating Systems Ltd. * | 139,712 | 4,034,883 |
| Ball Corp. | 226,255 | 18,193,164 |
| Berry Global Group, Inc. * | 87,964 | 3,442,911 |
| Celanese Corp., Series A | 86,364 | 9,791,087 |
| CF Industries Holdings, Inc. | 149,678 | 7,212,983 |
| Corteva, Inc. * | 505,647 | 14,825,570 |
| Crown Holdings, Inc. * | 92,708 | 6,103,895 |
| Dow, Inc. * | 508,106 | 21,660,559 |
| DuPont de Nemours, Inc. | 506,386 | 34,398,801 |
| Eastman Chemical Co. | 93,083 | 6,084,836 |
| Ecolab, Inc. | 171,493 | 35,380,721 |
| FMC Corp. | 90,020 | 7,771,427 |
| Freeport-McMoRan, Inc. | 976,050 | 8,969,899 |
| Huntsman Corp. | 140,337 | 2,795,513 |
| International Flavors & Fragrances, Inc. | 69,169 | 7,591,298 |
| International Paper Co. | 267,772 | 10,469,885 |
| Linde plc | 367,903 | 69,500,556 |
| LyondellBasell Industries N.V., Class A | 185,416 | 14,347,490 |
| Martin Marietta Materials, Inc. | 42,278 | 10,728,888 |
| NewMarket Corp. | 5,965 | 2,831,884 |
| Newmont Goldcorp Corp. | 555,838 | 22,172,378 |
| Nucor Corp. | 206,013 | 10,090,517 |
| Packaging Corp. of America | 63,837 | 6,420,725 |
| PPG Industries, Inc. | 160,446 | 17,775,812 |
| Security | Number of Shares | Value ($) |
| Reliance Steel & Aluminum Co. | 45,767 | 4,449,925 |
| Royal Gold, Inc. | 44,150 | 5,888,727 |
| RPM International, Inc. | 88,751 | 6,005,780 |
| Sealed Air Corp. | 104,613 | 4,165,690 |
| Sonoco Products Co. | 69,135 | 3,954,522 |
| Steel Dynamics, Inc. | 148,693 | 4,014,711 |
| The Chemours Co. | 111,094 | 1,574,202 |
| The Mosaic Co. | 241,138 | 4,434,528 |
| The Sherwin-Williams Co. | 54,932 | 28,935,431 |
| Vulcan Materials Co. | 89,833 | 12,688,911 |
| W.R. Grace & Co. | 46,160 | 3,125,494 |
| Westlake Chemical Corp. | 24,277 | 1,422,389 |
| Westrock Co. | 173,299 | 5,923,360 |
| 489,231,742 | ||
| Media & Entertainment 8.1% | ||
| Activision Blizzard, Inc. | 518,583 | 26,240,300 |
| Alphabet, Inc., Class A * | 202,763 | 241,395,434 |
| Alphabet, Inc., Class C * | 207,532 | 246,568,769 |
| Altice USA, Inc., Class A * | 78,895 | 2,278,488 |
| CBS Corp., Class B Non-Voting Shares | 241,955 | 10,176,627 |
| Charter Communications, Inc., Class A * | 116,465 | 47,702,899 |
| Comcast Corp., Class A | 3,066,835 | 135,738,117 |
| Discovery, Inc., Class A * | 107,034 | 2,954,139 |
| Discovery, Inc., Class C * | 243,208 | 6,330,704 |
| DISH Network Corp., Class A * | 154,177 | 5,174,180 |
| Electronic Arts, Inc. * | 200,325 | 18,766,446 |
| Facebook, Inc., Class A * | 1,626,970 | 302,079,520 |
| Fox Corp., Class A | 243,177 | 8,066,181 |
| Fox Corp., Class B * | 108,142 | 3,547,058 |
| IAC/InterActiveCorp * | 53,103 | 13,522,148 |
| Liberty Broadband Corp., Class A * | 17,475 | 1,830,506 |
| Liberty Broadband Corp., Class C * | 102,760 | 10,835,015 |
| Liberty Global plc, Class A * | 140,563 | 3,755,843 |
| Liberty Global plc, Class C * | 350,099 | 9,144,586 |
| Liberty Media Corp. - Liberty Formula One, Class A * | 18,285 | 723,903 |
| Liberty Media Corp. - Liberty Formula One, Class C * | 135,572 | 5,658,775 |
| Liberty Media Corp. - Liberty SiriusXM, Class A * | 57,486 | 2,327,608 |
| Liberty Media Corp. - Liberty SiriusXM, Class C * | 105,893 | 4,321,493 |
| Lions Gate Entertainment Corp., Class A | 42,781 | 386,313 |
| Lions Gate Entertainment Corp., Class B | 72,648 | 605,884 |
| Live Nation Entertainment, Inc. * | 95,247 | 6,620,619 |
| Netflix, Inc. * | 296,277 | 87,031,369 |
| News Corp., Class A | 265,333 | 3,648,329 |
| News Corp., Class B | 84,827 | 1,201,150 |
| Omnicom Group, Inc. | 148,110 | 11,265,247 |
| Sirius XM Holdings, Inc. | 1,089,866 | 6,724,473 |
| Snap, Inc., Class A * | 511,036 | 8,089,700 |
| Take-Two Interactive Software, Inc. * | 76,533 | 10,100,060 |
| The Interpublic Group of Cos., Inc. | 260,439 | 5,177,527 |
| The Walt Disney Co. | 1,182,057 | 162,249,144 |
| TripAdvisor, Inc. * | 70,713 | 2,686,387 |
| Twitter, Inc. * | 494,404 | 21,086,331 |
| Viacom, Inc., Class B | 245,013 | 6,120,425 |
| Zillow Group, Inc., Class A * | 34,717 | 1,186,280 |
| Zillow Group, Inc., Class C * | 77,824 | 2,679,480 |
| 1,445,997,457 | ||
| Pharmaceuticals, Biotechnology & Life Sciences 7.4% | ||
| AbbVie, Inc. | 1,000,790 | 65,791,935 |
| Agilent Technologies, Inc. | 212,888 | 15,138,466 |
| Alexion Pharmaceuticals, Inc. * | 151,904 | 15,305,847 |
| Security | Number of Shares | Value ($) |
| Alkermes plc * | 104,554 | 2,193,543 |
| Allergan plc | 208,426 | 33,289,801 |
| Alnylam Pharmaceuticals, Inc. * | 64,972 | 5,242,591 |
| Amgen, Inc. | 412,962 | 86,152,132 |
| Avantor, Inc. * | 149,782 | 2,621,185 |
| Bio-Rad Laboratories, Inc., Class A * | 13,721 | 4,633,719 |
| Bio-Techne Corp. | 25,714 | 4,926,031 |
| Biogen, Inc. * | 131,085 | 28,805,929 |
| BioMarin Pharmaceutical, Inc. * | 122,258 | 9,176,685 |
| Bluebird Bio, Inc. * | 36,892 | 3,811,313 |
| Bristol-Myers Squibb Co. | 1,108,317 | 53,276,798 |
| Celgene Corp. * | 478,117 | 46,281,726 |
| Elanco Animal Health, Inc. * | 251,600 | 6,546,632 |
| Eli Lilly & Co. | 585,394 | 66,131,960 |
| Exelixis, Inc. * | 204,431 | 4,057,955 |
| Gilead Sciences, Inc. | 861,375 | 54,731,767 |
| Illumina, Inc. * | 99,341 | 27,948,597 |
| Incyte Corp. * | 119,939 | 9,813,409 |
| Ionis Pharmaceuticals, Inc. * | 94,714 | 5,986,872 |
| IQVIA Holdings, Inc. * | 107,142 | 16,623,081 |
| Jazz Pharmaceuticals plc * | 38,036 | 4,874,313 |
| Johnson & Johnson | 1,798,143 | 230,809,635 |
| Merck & Co., Inc. | 1,743,879 | 150,793,217 |
| Mettler-Toledo International, Inc. * | 16,796 | 11,031,445 |
| Mylan N.V. * | 348,000 | 6,775,560 |
| Nektar Therapeutics * | 118,589 | 2,083,609 |
| Neurocrine Biosciences, Inc. * | 61,582 | 6,122,482 |
| PerkinElmer, Inc. | 74,679 | 6,175,953 |
| Perrigo Co., plc | 85,803 | 4,013,864 |
| Pfizer, Inc. | 3,760,808 | 133,696,724 |
| PRA Health Sciences, Inc. * | 40,565 | 4,009,445 |
| Regeneron Pharmaceuticals, Inc. * | 53,051 | 15,387,443 |
| Sage Therapeutics, Inc. * | 34,392 | 5,904,075 |
| Sarepta Therapeutics, Inc. * | 46,810 | 4,219,922 |
| Seattle Genetics, Inc. * | 74,022 | 5,376,958 |
| Syneos Health, Inc. * | 42,020 | 2,207,311 |
| Thermo Fisher Scientific, Inc. | 270,635 | 77,688,483 |
| United Therapeutics Corp. * | 28,999 | 2,394,157 |
| Vertex Pharmaceuticals, Inc. * | 173,352 | 31,206,827 |
| Waters Corp. * | 47,006 | 9,960,101 |
| Zoetis, Inc. | 323,592 | 40,908,501 |
| 1,324,127,999 | ||
| Real Estate 3.8% | ||
| Alexandria Real Estate Equities, Inc. | 76,344 | 11,439,385 |
| American Campus Communities, Inc. | 93,118 | 4,328,125 |
| American Homes 4 Rent, Class A | 175,808 | 4,497,169 |
| American Tower Corp. | 299,477 | 68,936,611 |
| Apartment Investment & Management Co., Class A | 101,216 | 5,162,016 |
| AvalonBay Communities, Inc. | 94,231 | 20,029,741 |
| Boston Properties, Inc. | 105,299 | 13,522,498 |
| Brixmor Property Group, Inc. | 200,313 | 3,691,769 |
| Camden Property Trust | 65,735 | 7,115,814 |
| CBRE Group, Inc., Class A * | 212,826 | 11,124,415 |
| Crown Castle International Corp. | 281,357 | 40,844,596 |
| CyrusOne, Inc. | 76,536 | 5,622,335 |
| Digital Realty Trust, Inc. | 141,654 | 17,512,684 |
| Douglas Emmett, Inc. | 108,335 | 4,571,737 |
| Duke Realty Corp. | 242,023 | 8,052,105 |
| Equinix, Inc. | 56,962 | 31,686,821 |
| Equity LifeStyle Properties, Inc. | 61,295 | 8,257,662 |
| Equity Residential | 251,284 | 21,298,832 |
| Essex Property Trust, Inc. | 44,522 | 14,303,138 |
| Extra Space Storage, Inc. | 86,625 | 10,561,320 |
| Federal Realty Investment Trust | 50,841 | 6,569,166 |
| Gaming & Leisure Properties, Inc. | 137,296 | 5,371,020 |
| Security | Number of Shares | Value ($) |
| HCP, Inc. | 323,281 | 11,221,084 |
| Healthcare Trust of America, Inc., Class A | 137,540 | 3,900,634 |
| Highwoods Properties, Inc. | 71,267 | 3,079,447 |
| Host Hotels & Resorts, Inc. | 499,125 | 8,005,965 |
| Invitation Homes, Inc. | 283,144 | 8,143,221 |
| Iron Mountain, Inc. | 194,466 | 6,193,742 |
| JBG SMITH Properties | 79,907 | 3,057,242 |
| Jones Lang LaSalle, Inc. | 34,655 | 4,645,503 |
| Kilroy Realty Corp. | 68,478 | 5,331,697 |
| Kimco Realty Corp. | 286,721 | 5,269,932 |
| Lamar Advertising Co., Class A | 57,221 | 4,385,990 |
| Liberty Property Trust | 99,386 | 5,179,998 |
| Mid-America Apartment Communities, Inc. | 76,668 | 9,712,302 |
| National Retail Properties, Inc. | 110,032 | 6,178,297 |
| Omega Healthcare Investors, Inc. | 143,982 | 5,857,188 |
| Park Hotels & Resorts, Inc. | 138,167 | 3,253,833 |
| Prologis, Inc. | 427,178 | 35,720,624 |
| Public Storage | 101,825 | 26,957,150 |
| Realty Income Corp. | 213,254 | 15,740,278 |
| Regency Centers Corp. | 113,459 | 7,319,240 |
| SBA Communications Corp. | 76,829 | 20,162,234 |
| Senior Housing Properties Trust | 154,670 | 1,313,148 |
| Simon Property Group, Inc. | 209,444 | 31,194,589 |
| SL Green Realty Corp. | 56,983 | 4,571,176 |
| Sun Communities, Inc. | 61,055 | 9,023,929 |
| The Macerich Co. | 69,995 | 1,996,957 |
| UDR, Inc. | 190,532 | 9,179,832 |
| Ventas, Inc. | 250,232 | 18,364,526 |
| VEREIT, Inc. | 652,028 | 6,357,273 |
| VICI Properties, Inc. | 276,801 | 6,133,910 |
| Vornado Realty Trust | 117,732 | 7,119,254 |
| Welltower, Inc. | 273,841 | 24,525,200 |
| Weyerhaeuser Co. | 507,145 | 13,342,985 |
| WP Carey, Inc. | 115,759 | 10,395,158 |
| 667,332,497 | ||
| Retailing 6.3% | ||
| Advance Auto Parts, Inc. | 48,497 | 6,690,161 |
| Amazon.com, Inc. * | 280,048 | 497,446,462 |
| AutoZone, Inc. * | 16,639 | 18,331,020 |
| Best Buy Co., Inc. | 158,092 | 10,062,556 |
| Booking Holdings, Inc. * | 29,341 | 57,696,436 |
| Burlington Stores, Inc. * | 44,684 | 9,048,063 |
| CarMax, Inc. * | 112,251 | 9,348,263 |
| Dollar General Corp. | 175,080 | 27,328,237 |
| Dollar Tree, Inc. * | 160,309 | 16,276,173 |
| eBay, Inc. | 554,561 | 22,343,263 |
| Expedia Group, Inc. | 93,415 | 12,153,291 |
| Foot Locker, Inc. | 74,796 | 2,706,867 |
| Genuine Parts Co. | 98,389 | 8,883,543 |
| GrubHub, Inc. * | 61,866 | 3,671,128 |
| Kohl's Corp. | 109,804 | 5,189,337 |
| L Brands, Inc. | 156,052 | 2,576,419 |
| LKQ Corp. * | 213,800 | 5,616,526 |
| Lowe's Cos., Inc. | 530,448 | 59,516,266 |
| Macy's, Inc. | 210,343 | 3,104,663 |
| Nordstrom, Inc.(a) | 71,866 | 2,081,958 |
| O'Reilly Automotive, Inc. * | 52,926 | 20,310,882 |
| Qurate Retail, Inc., Series A * | 270,458 | 2,896,605 |
| Ross Stores, Inc. | 248,412 | 26,334,156 |
| Target Corp. | 346,807 | 37,122,221 |
| The Gap, Inc. | 143,420 | 2,264,602 |
| The Home Depot, Inc. | 745,073 | 169,809,587 |
| The TJX Cos., Inc. | 821,647 | 45,165,936 |
| Tiffany & Co. | 73,970 | 6,277,834 |
| Security | Number of Shares | Value ($) |
| Tractor Supply Co. | 81,954 | 8,349,473 |
| Ulta Salon, Cosmetics & Fragrance, Inc. * | 37,431 | 8,898,472 |
| Wayfair, Inc., Class A * | 43,171 | 4,867,099 |
| Williams-Sonoma, Inc. | 53,683 | 3,532,341 |
| 1,115,899,840 | ||
| Semiconductors & Semiconductor Equipment 3.7% | ||
| Advanced Micro Devices, Inc. * | 600,744 | 18,893,399 |
| Analog Devices, Inc. | 249,910 | 27,447,615 |
| Applied Materials, Inc. | 632,938 | 30,393,683 |
| Broadcom, Inc. | 268,249 | 75,817,897 |
| First Solar, Inc. * | 51,735 | 3,211,191 |
| Intel Corp. | 3,032,090 | 143,751,387 |
| KLA Corp. | 109,970 | 16,264,563 |
| Lam Research Corp. | 101,342 | 21,333,504 |
| Marvell Technology Group Ltd. | 400,417 | 9,597,996 |
| Maxim Integrated Products, Inc. | 183,442 | 10,004,927 |
| Microchip Technology, Inc. | 161,049 | 13,903,360 |
| Micron Technology, Inc. * | 750,881 | 33,992,383 |
| NVIDIA Corp. | 412,170 | 69,042,597 |
| ON Semiconductor Corp. * | 283,100 | 5,039,180 |
| Qorvo, Inc. * | 80,310 | 5,736,543 |
| QUALCOMM, Inc. | 823,185 | 64,019,097 |
| Skyworks Solutions, Inc. | 117,843 | 8,870,043 |
| Teradyne, Inc. | 115,597 | 6,123,173 |
| Texas Instruments, Inc. | 635,722 | 78,670,598 |
| Xilinx, Inc. | 171,666 | 17,863,564 |
| 659,976,700 | ||
| Software & Services 12.7% | ||
| Accenture plc, Class A | 432,040 | 85,617,367 |
| Adobe, Inc. * | 330,255 | 93,960,850 |
| Akamai Technologies, Inc. * | 111,614 | 9,948,156 |
| Alliance Data Systems Corp. | 26,775 | 3,291,986 |
| ANSYS, Inc. * | 56,980 | 11,769,789 |
| Aspen Technology, Inc. * | 46,868 | 6,242,818 |
| Autodesk, Inc. * | 148,765 | 21,246,617 |
| Automatic Data Processing, Inc. | 294,707 | 50,053,037 |
| Black Knight, Inc. * | 96,105 | 5,982,536 |
| Booz Allen Hamilton Holding Corp. | 95,482 | 7,209,846 |
| Broadridge Financial Solutions, Inc. | 78,188 | 10,120,655 |
| Cadence Design Systems, Inc. * | 191,103 | 13,086,733 |
| CDK Global, Inc. | 81,355 | 3,511,282 |
| Citrix Systems, Inc. | 84,574 | 7,863,690 |
| Cognizant Technology Solutions Corp., Class A | 385,349 | 23,656,575 |
| DocuSign, Inc. * | 16,527 | 771,646 |
| DXC Technology Co. | 180,110 | 5,983,254 |
| EPAM Systems, Inc. * | 34,950 | 6,686,983 |
| Fidelity National Information Services, Inc. | 415,302 | 56,572,438 |
| Fiserv, Inc. * | 385,949 | 41,273,386 |
| FleetCor Technologies, Inc. * | 58,563 | 17,475,199 |
| Fortinet, Inc. * | 98,994 | 7,838,345 |
| Gartner, Inc. * | 60,499 | 8,086,901 |
| Global Payments, Inc. | 105,619 | 17,530,642 |
| GoDaddy, Inc., Class A * | 118,614 | 7,513,011 |
| Guidewire Software, Inc. * | 55,920 | 5,378,386 |
| International Business Machines Corp. | 600,931 | 81,444,178 |
| Intuit, Inc. | 175,583 | 50,631,114 |
| Jack Henry & Associates, Inc. | 52,232 | 7,571,551 |
| Leidos Holdings, Inc. | 97,182 | 8,489,819 |
| Mastercard, Inc., Class A | 608,458 | 171,201,827 |
| Microsoft Corp. | 5,188,912 | 715,343,408 |
| Nuance Communications, Inc. * | 196,004 | 3,294,827 |
| Nutanix, Inc., Class A * | 100,556 | 2,436,472 |
| Security | Number of Shares | Value ($) |
| Oracle Corp. | 1,644,051 | 85,589,295 |
| Palo Alto Networks, Inc. * | 64,687 | 13,171,567 |
| Paychex, Inc. | 217,209 | 17,745,975 |
| Paycom Software, Inc. * | 33,103 | 8,279,722 |
| PayPal Holdings, Inc. * | 796,165 | 86,821,793 |
| PTC, Inc. * | 69,932 | 4,578,448 |
| Sabre Corp. | 186,931 | 4,419,049 |
| salesforce.com, Inc. * | 578,571 | 90,297,576 |
| ServiceNow, Inc. * | 125,255 | 32,796,769 |
| Splunk, Inc. * | 101,284 | 11,325,577 |
| Square, Inc., Class A * | 213,701 | 13,215,270 |
| SS&C Technologies Holdings, Inc. | 145,954 | 6,802,916 |
| Symantec Corp. | 418,180 | 9,722,685 |
| Synopsys, Inc. * | 101,944 | 14,456,679 |
| Teradata Corp. * | 77,743 | 2,399,926 |
| The Western Union Co. | 290,115 | 6,417,344 |
| Total System Services, Inc. | 109,948 | 14,757,221 |
| Tyler Technologies, Inc. * | 26,185 | 6,717,500 |
| VeriSign, Inc. * | 71,323 | 14,539,194 |
| Visa, Inc., Class A | 1,177,380 | 212,893,852 |
| VMware, Inc., Class A | 51,140 | 7,233,242 |
| WEX, Inc. * | 29,702 | 6,075,544 |
| Workday, Inc., Class A * | 109,585 | 19,427,229 |
| 2,258,769,697 | ||
| Technology Hardware & Equipment 5.5% | ||
| Amphenol Corp., Class A | 201,754 | 17,661,545 |
| Apple, Inc. | 2,960,015 | 617,873,531 |
| Arista Networks, Inc. * | 35,730 | 8,097,133 |
| Arrow Electronics, Inc. * | 56,979 | 3,942,947 |
| Avnet, Inc. | 71,500 | 2,995,135 |
| CDW Corp. | 98,708 | 11,400,774 |
| Cisco Systems, Inc. | 2,899,350 | 135,718,574 |
| Cognex Corp. | 116,411 | 5,247,808 |
| CommScope Holding Co., Inc. * | 128,584 | 1,380,992 |
| Corning, Inc. | 529,460 | 14,745,461 |
| Dell Technologies, Inc., Class C * | 100,902 | 5,199,480 |
| F5 Networks, Inc. * | 40,827 | 5,255,660 |
| FLIR Systems, Inc. | 90,589 | 4,463,320 |
| Hewlett Packard Enterprise Co. | 906,627 | 12,529,585 |
| HP, Inc. | 1,022,046 | 18,693,221 |
| IPG Photonics Corp. * | 24,676 | 3,053,162 |
| Jabil, Inc. | 93,921 | 2,705,864 |
| Juniper Networks, Inc. | 230,533 | 5,339,144 |
| Keysight Technologies, Inc. * | 128,134 | 12,411,059 |
| Motorola Solutions, Inc. | 111,830 | 20,231,165 |
| National Instruments Corp. | 74,426 | 3,125,892 |
| NetApp, Inc. | 167,268 | 8,038,900 |
| Seagate Technology plc | 169,399 | 8,505,524 |
| TE Connectivity Ltd. | 228,143 | 20,811,204 |
| Trimble, Inc. * | 169,841 | 6,372,434 |
| Western Digital Corp. | 198,526 | 11,369,584 |
| Xerox Holdings Corp. * | 130,599 | 3,786,065 |
| Zebra Technologies Corp., Class A * | 36,829 | 7,551,050 |
| 978,506,213 | ||
| Telecommunication Services 2.1% | ||
| AT&T, Inc. | 4,940,765 | 174,211,374 |
| CenturyLink, Inc. | 654,426 | 7,447,368 |
| GCI Liberty, Inc., Class A * | 65,160 | 4,055,558 |
| Sprint Corp. * | 393,297 | 2,670,487 |
| T-Mobile US, Inc. * | 214,335 | 16,728,847 |
| Verizon Communications, Inc. | 2,799,796 | 162,836,135 |
| Zayo Group Holdings, Inc. * | 137,854 | 4,640,166 |
| 372,589,935 | ||
| Security | Number of Shares | Value ($) |
| Transportation 2.0% | ||
| Alaska Air Group, Inc. | 83,837 | 5,006,746 |
| AMERCO | 5,277 | 1,855,499 |
| American Airlines Group, Inc. | 267,396 | 7,035,189 |
| C.H. Robinson Worldwide, Inc. | 91,630 | 7,741,819 |
| CSX Corp. | 520,140 | 34,859,783 |
| Delta Air Lines, Inc. | 403,580 | 23,351,139 |
| Expeditors International of Washington, Inc. | 116,469 | 8,280,946 |
| FedEx Corp. | 162,429 | 25,762,864 |
| Genesee & Wyoming, Inc., Class A * | 37,643 | 4,173,856 |
| J.B. Hunt Transport Services, Inc. | 59,505 | 6,428,920 |
| JetBlue Airways Corp. * | 207,881 | 3,600,499 |
| Kansas City Southern | 68,604 | 8,630,383 |
| Lyft, Inc., Class A * | 22,359 | 1,094,920 |
| Norfolk Southern Corp. | 179,952 | 31,320,646 |
| Old Dominion Freight Line, Inc. | 44,182 | 7,235,244 |
| Southwest Airlines Co. | 329,941 | 17,262,513 |
| Uber Technologies, Inc. *(a) | 135,613 | 4,416,915 |
| Union Pacific Corp. | 479,495 | 77,659,010 |
| United Airlines Holdings, Inc. * | 149,167 | 12,576,270 |
| United Parcel Service, Inc., Class B | 472,526 | 56,069,935 |
| XPO Logistics, Inc. * | 61,946 | 4,389,493 |
| 348,752,589 | ||
| Utilities 3.4% | ||
| AES Corp. | 449,722 | 6,894,238 |
| Alliant Energy Corp. | 160,599 | 8,423,418 |
| Ameren Corp. | 166,782 | 12,867,231 |
| American Electric Power Co., Inc. | 333,587 | 30,406,455 |
| American Water Works Co., Inc. | 122,119 | 15,548,191 |
| Aqua America, Inc. | 145,579 | 6,447,694 |
| Atmos Energy Corp. | 79,813 | 8,797,787 |
| Avangrid, Inc. | 37,843 | 1,912,585 |
| CenterPoint Energy, Inc. | 338,061 | 9,360,909 |
| CMS Energy Corp. | 190,689 | 12,022,941 |
| Consolidated Edison, Inc. | 220,995 | 19,646,456 |
| Dominion Energy, Inc. | 544,068 | 42,235,999 |
| DTE Energy Co. | 123,713 | 16,040,628 |
| Duke Energy Corp. | 493,801 | 45,795,105 |
| Edison International | 238,768 | 17,255,763 |
| Entergy Corp. | 128,871 | 14,541,804 |
| Evergy, Inc. | 165,858 | 10,780,770 |
| Eversource Energy | 216,717 | 17,365,533 |
| Exelon Corp. | 657,776 | 31,086,494 |
| FirstEnergy Corp. | 342,299 | 15,745,754 |
| National Fuel Gas Co. | 57,858 | 2,704,283 |
| NextEra Energy, Inc. | 324,689 | 71,132,866 |
| NiSource, Inc. | 250,171 | 7,392,553 |
| NRG Energy, Inc. | 171,122 | 6,228,841 |
| OGE Energy Corp. | 136,035 | 5,831,820 |
| Pinnacle West Capital Corp. | 75,377 | 7,184,182 |
| PPL Corp. | 490,343 | 14,489,636 |
| Public Service Enterprise Group, Inc. | 343,339 | 20,761,709 |
| Sempra Energy | 185,787 | 26,313,013 |
| The Southern Co. | 703,895 | 41,008,923 |
| UGI Corp. | 141,221 | 6,873,226 |
| Vistra Energy Corp. | 254,453 | 6,348,602 |
| WEC Energy Group, Inc. | 213,521 | 20,448,906 |
| Xcel Energy, Inc. | 348,582 | 22,385,936 |
| 602,280,251 | ||
| Total Common Stock | ||
| (Cost $14,346,497,413) | 17,753,837,943 | |
| Security | Number of Shares | Value ($) |
| Other Investment Companies0.2% of net assets | ||
| Money Market Fund 0.1% | ||
| State Street Institutional U.S. Government Money Market Fund, Premier Class 2.07%(c) | 16,952,458 | 16,952,458 |
| Securities Lending Collateral 0.1% | ||
| Wells Fargo Government Money Market Fund, Select Class 2.03%(c) | 7,638,190 | 7,638,190 |
| Total Other Investment Companies | ||
| (Cost $24,590,648) | 24,590,648 | |
| Number of Contracts | Notional Amount ($) | Current Value/ Unrealized Appreciation ($) | ||
| Futures Contracts | ||||
| Long | ||||
| S&P 500 Index, e-mini, expires 09/20/19 | 199 | 29,101,760 | 252,258 | |
| * | Non-income producing security. |
| (a) | All or a portion of this security is on loan. Securities on loan were valued at $7,403,893. |
| (b) | Issuer is affiliated with the fund’s investment adviser. |
| (c) | The rate shown is the 7-day yield. |
| Security | Number of Shares | Value ($) |
| Common Stock99.8% of net assets | ||
| Automobiles & Components 0.3% | ||
| Lear Corp. | 33,873 | 3,802,583 |
| Tesla, Inc. * | 75,050 | 16,932,031 |
| Veoneer, Inc. *(a) | 60,390 | 885,921 |
| 21,620,535 | ||
| Banks 0.3% | ||
| CIT Group, Inc. | 52,644 | 2,242,108 |
| East West Bancorp, Inc. | 79,602 | 3,274,030 |
| First Republic Bank | 89,540 | 8,033,529 |
| Signature Bank | 29,876 | 3,485,035 |
| SVB Financial Group * | 28,487 | 5,544,140 |
| 22,578,842 | ||
| Capital Goods 6.6% | ||
| 3M Co. | 314,292 | 50,827,302 |
| A.O. Smith Corp. | 77,219 | 3,592,228 |
| Acuity Brands, Inc. | 21,854 | 2,740,710 |
| Allegion plc | 51,112 | 4,920,552 |
| AMETEK, Inc. | 123,922 | 10,648,617 |
| Carlisle Cos., Inc. | 31,146 | 4,514,924 |
| Deere & Co. | 172,507 | 26,723,059 |
| Dover Corp. | 79,319 | 7,435,363 |
| Fastenal Co. | 311,495 | 9,537,977 |
| Fortive Corp. | 160,624 | 11,388,242 |
| Fortune Brands Home & Security, Inc. | 75,867 | 3,873,769 |
| Graco, Inc. | 90,501 | 4,124,131 |
| HD Supply Holdings, Inc. * | 93,224 | 3,627,346 |
| HEICO Corp. | 22,517 | 3,257,534 |
| HEICO Corp., Class A | 38,952 | 4,298,743 |
| Hubbell, Inc. | 29,703 | 3,895,251 |
| Huntington Ingalls Industries, Inc. | 22,487 | 4,699,783 |
| IDEX Corp. | 41,134 | 6,775,181 |
| L3Harris Technologies, Inc. | 120,489 | 25,472,580 |
| Lennox International, Inc. | 19,174 | 4,865,978 |
| Lockheed Martin Corp. | 134,004 | 51,472,276 |
| Nordson Corp. | 27,985 | 3,804,841 |
| Northrop Grumman Corp. | 92,598 | 34,064,026 |
| Owens Corning | 59,046 | 3,386,879 |
| Quanta Services, Inc. | 76,789 | 2,603,147 |
| Raytheon Co. | 151,570 | 28,088,952 |
| Roper Technologies, Inc. | 56,737 | 20,808,862 |
| Sensata Technologies Holding plc * | 87,863 | 4,004,796 |
| Snap-on, Inc. | 29,998 | 4,460,103 |
| Spirit AeroSystems Holdings, Inc., Class A | 56,311 | 4,538,667 |
| Stanley Black & Decker, Inc. | 82,511 | 10,962,411 |
| Teledyne Technologies, Inc. * | 19,638 | 6,060,090 |
| Textron, Inc. | 126,465 | 5,690,925 |
| The Boeing Co. | 285,135 | 103,814,802 |
| The Middleby Corp. * | 30,223 | 3,314,254 |
| The Toro Co. | 58,099 | 4,183,709 |
| TransDigm Group, Inc. | 26,745 | 14,397,368 |
| Trinity Industries, Inc. | 69,648 | 1,216,751 |
| United Rentals, Inc. * | 42,772 | 4,814,416 |
| W.W. Grainger, Inc. | 24,429 | 6,684,996 |
| Security | Number of Shares | Value ($) |
| WABCO Holdings, Inc. * | 28,023 | 3,741,351 |
| Wabtec Corp. | 99,036 | 6,854,282 |
| Xylem, Inc. | 99,056 | 7,588,680 |
| 533,775,854 | ||
| Commercial & Professional Services 1.1% | ||
| Cintas Corp. | 46,023 | 12,140,867 |
| Copart, Inc. * | 109,837 | 8,280,612 |
| CoStar Group, Inc. * | 19,873 | 12,219,312 |
| Equifax, Inc. | 65,715 | 9,619,362 |
| IAA, Inc. * | 71,769 | 3,505,916 |
| IHS Markit Ltd. * | 198,999 | 13,056,324 |
| KAR Auction Services, Inc. | 72,065 | 1,914,046 |
| Robert Half International, Inc. | 64,653 | 3,456,996 |
| Rollins, Inc. | 80,542 | 2,642,583 |
| Stericycle, Inc. * | 46,890 | 2,104,892 |
| TransUnion | 101,980 | 8,530,627 |
| Verisk Analytics, Inc. | 89,530 | 14,462,676 |
| 91,934,213 | ||
| Consumer Durables & Apparel 1.5% | ||
| Capri Holdings Ltd. * | 81,382 | 2,146,857 |
| Carter's, Inc. | 24,753 | 2,264,404 |
| D.R. Horton, Inc. | 184,569 | 9,130,628 |
| Lennar Corp., B Shares | 8,602 | 348,467 |
| Lennar Corp., Class A | 155,370 | 7,923,870 |
| Lululemon Athletica, Inc. * | 57,674 | 10,650,658 |
| Mohawk Industries, Inc. * | 33,416 | 3,972,828 |
| Newell Brands, Inc. | 211,658 | 3,513,523 |
| NIKE, Inc., Class B | 685,253 | 57,903,879 |
| NVR, Inc. * | 1,842 | 6,629,358 |
| Polaris, Inc. | 31,238 | 2,562,141 |
| PulteGroup, Inc. | 139,293 | 4,708,103 |
| PVH Corp. | 41,014 | 3,108,861 |
| Toll Brothers, Inc. | 72,330 | 2,617,623 |
| Under Armour, Inc., Class A * | 102,354 | 1,904,808 |
| Under Armour, Inc., Class C * | 105,719 | 1,788,766 |
| 121,174,774 | ||
| Consumer Services 2.0% | ||
| Bright Horizons Family Solutions, Inc. * | 31,932 | 5,270,377 |
| Chipotle Mexican Grill, Inc. * | 13,342 | 11,186,200 |
| Domino's Pizza, Inc. | 22,266 | 5,050,819 |
| Dunkin' Brands Group, Inc. | 44,912 | 3,702,545 |
| Hilton Worldwide Holdings, Inc. | 158,388 | 14,630,300 |
| Marriott International, Inc., Class A | 150,371 | 18,955,768 |
| MGM Resorts International | 280,562 | 7,872,570 |
| Norwegian Cruise Line Holdings Ltd. * | 117,178 | 5,946,783 |
| Royal Caribbean Cruises Ltd. | 93,567 | 9,757,167 |
| ServiceMaster Global Holdings, Inc. * | 73,857 | 4,212,803 |
| Starbucks Corp. | 660,150 | 63,744,084 |
| Vail Resorts, Inc. | 21,824 | 5,156,575 |
| Wyndham Hotels & Resorts, Inc. | 53,132 | 2,729,922 |
| Wynn Resorts Ltd. | 52,547 | 5,788,052 |
| 164,003,965 | ||
| Security | Number of Shares | Value ($) |
| Diversified Financials 6.2% | ||
| Affiliated Managers Group, Inc. | 27,751 | 2,126,559 |
| Ameriprise Financial, Inc. | 72,926 | 9,405,995 |
| Berkshire Hathaway, Inc., Class B * | 1,055,850 | 214,770,449 |
| BlackRock, Inc. | 65,011 | 27,471,048 |
| Cboe Global Markets, Inc. | 60,958 | 7,263,755 |
| CME Group, Inc. | 195,202 | 42,415,443 |
| Credit Acceptance Corp. * | 6,502 | 2,943,130 |
| E*TRADE Financial Corp. | 132,891 | 5,546,870 |
| FactSet Research Systems, Inc. | 21,120 | 5,746,541 |
| Intercontinental Exchange, Inc. | 306,975 | 28,696,023 |
| MarketAxess Holdings, Inc. | 20,481 | 8,143,655 |
| Moody's Corp. | 89,752 | 19,348,736 |
| Morgan Stanley | 695,697 | 28,864,469 |
| MSCI, Inc. | 46,471 | 10,903,491 |
| Raymond James Financial, Inc. | 68,947 | 5,413,029 |
| S&P Global, Inc. | 133,944 | 34,850,889 |
| SEI Investments Co. | 69,550 | 3,999,821 |
| T. Rowe Price Group, Inc. | 128,620 | 14,227,944 |
| TD Ameritrade Holding Corp. | 144,168 | 6,402,501 |
| The Charles Schwab Corp.(b) | 645,793 | 24,714,498 |
| Voya Financial, Inc. | 78,618 | 3,877,440 |
| 507,132,286 | ||
| Energy 1.3% | ||
| Antero Resources Corp. * | 118,863 | 376,796 |
| Cabot Oil & Gas Corp. | 230,179 | 3,940,664 |
| Cheniere Energy, Inc. * | 120,761 | 7,210,639 |
| Cimarex Energy Co. | 55,055 | 2,355,253 |
| Concho Resources, Inc. | 109,036 | 7,975,983 |
| Continental Resources, Inc. * | 46,569 | 1,359,815 |
| Core Laboratories N.V. | 24,329 | 963,185 |
| Diamondback Energy, Inc. | 84,421 | 8,280,012 |
| EOG Resources, Inc. | 315,772 | 23,427,125 |
| EQT Corp. | 137,453 | 1,397,897 |
| Halliburton Co. | 476,335 | 8,974,151 |
| Parsley Energy, Inc., Class A * | 144,013 | 2,579,273 |
| Pioneer Natural Resources Co. | 91,730 | 11,321,317 |
| Schlumberger Ltd. | 756,241 | 24,524,896 |
| 104,687,006 | ||
| Food & Staples Retailing 1.2% | ||
| Costco Wholesale Corp. | 239,748 | 70,668,121 |
| US Foods Holding Corp. * | 118,520 | 4,794,134 |
| Walgreens Boots Alliance, Inc. | 422,880 | 21,647,227 |
| 97,109,482 | ||
| Food, Beverage & Tobacco 1.0% | ||
| Brown-Forman Corp., Class A | 33,788 | 1,945,175 |
| Brown-Forman Corp., Class B | 91,002 | 5,368,208 |
| Constellation Brands, Inc., Class A | 90,976 | 18,590,946 |
| Keurig Dr Pepper, Inc. | 98,657 | 2,691,363 |
| Molson Coors Brewing Co., Class B | 102,015 | 5,239,490 |
| Monster Beverage Corp. * | 214,020 | 12,556,554 |
| Post Holdings, Inc. * | 36,157 | 3,604,491 |
| The Hershey Co. | 75,809 | 12,014,210 |
| The J.M. Smucker Co. | 61,930 | 6,512,559 |
| Tyson Foods, Inc., Class A | 160,574 | 14,939,805 |
| 83,462,801 | ||
| Health Care Equipment & Services 8.7% | ||
| ABIOMED, Inc. * | 24,601 | 4,749,715 |
| Align Technology, Inc. * | 39,521 | 7,236,690 |
| Security | Number of Shares | Value ($) |
| AmerisourceBergen Corp. | 84,391 | 6,942,848 |
| Anthem, Inc. | 140,303 | 36,692,041 |
| Becton Dickinson & Co. | 146,790 | 37,272,917 |
| Boston Scientific Corp. * | 756,861 | 32,340,671 |
| Centene Corp. * | 224,618 | 10,471,691 |
| Cerner Corp. | 177,105 | 12,204,306 |
| Cigna Corp. * | 207,065 | 31,881,798 |
| Danaher Corp. | 343,654 | 48,829,797 |
| DaVita, Inc. * | 57,276 | 3,228,648 |
| DENTSPLY SIRONA, Inc. | 126,941 | 6,619,973 |
| DexCom, Inc. * | 49,538 | 8,501,216 |
| Edwards Lifesciences Corp. * | 113,443 | 25,166,195 |
| HCA Healthcare, Inc. | 145,290 | 17,463,858 |
| Henry Schein, Inc. * | 81,260 | 5,007,241 |
| Hologic, Inc. * | 146,313 | 7,223,473 |
| Humana, Inc. | 73,471 | 20,807,722 |
| IDEXX Laboratories, Inc. * | 46,811 | 13,563,019 |
| Intuitive Surgical, Inc. * | 63,055 | 32,242,544 |
| Laboratory Corp. of America Holdings * | 53,474 | 8,960,103 |
| McKesson Corp. | 103,431 | 14,301,404 |
| Medtronic plc | 730,641 | 78,828,857 |
| Molina Healthcare, Inc. * | 33,919 | 4,418,967 |
| ResMed, Inc. | 77,855 | 10,845,202 |
| STERIS plc | 45,896 | 7,086,342 |
| Stryker Corp. | 169,047 | 37,301,911 |
| Teleflex, Inc. | 25,130 | 9,145,310 |
| The Cooper Cos., Inc. | 26,888 | 8,328,558 |
| UnitedHealth Group, Inc. | 517,957 | 121,201,938 |
| Universal Health Services, Inc., Class B | 45,196 | 6,534,438 |
| Varian Medical Systems, Inc. * | 49,350 | 5,227,646 |
| Veeva Systems, Inc., Class A * | 69,587 | 11,160,363 |
| WellCare Health Plans, Inc. * | 27,402 | 7,418,817 |
| West Pharmaceutical Services, Inc. | 39,920 | 5,806,763 |
| 705,012,982 | ||
| Household & Personal Products 0.6% | ||
| Church & Dwight Co., Inc. | 133,979 | 10,688,844 |
| Coty, Inc., Class A | 163,347 | 1,559,964 |
| Herbalife Nutrition Ltd. * | 55,235 | 1,901,741 |
| The Clorox Co. | 69,486 | 10,989,906 |
| The Estee Lauder Cos., Inc., Class A | 119,301 | 23,620,405 |
| 48,760,860 | ||
| Insurance 1.0% | ||
| Alleghany Corp. * | 7,847 | 5,879,836 |
| Aon plc | 130,902 | 25,506,255 |
| Arch Capital Group Ltd. * | 220,231 | 8,699,124 |
| Athene Holding Ltd., Class A * | 64,188 | 2,494,346 |
| Everest Re Group Ltd. | 22,082 | 5,208,702 |
| Markel Corp. * | 7,553 | 8,633,683 |
| RenaissanceRe Holdings Ltd. | 23,998 | 4,332,839 |
| W.R. Berkley Corp. | 78,302 | 5,579,017 |
| Willis Towers Watson plc | 70,328 | 13,922,834 |
| 80,256,636 | ||
| Materials 2.3% | ||
| Alcoa Corp. * | 101,668 | 1,822,907 |
| Ashland Global Holdings, Inc. | 34,016 | 2,491,332 |
| Axalta Coating Systems Ltd. * | 112,903 | 3,260,639 |
| Ball Corp. | 182,294 | 14,658,260 |
| Berry Global Group, Inc. * | 71,548 | 2,800,389 |
| Crown Holdings, Inc. * | 73,477 | 4,837,726 |
| Ecolab, Inc. | 138,431 | 28,559,699 |
| FMC Corp. | 71,800 | 6,198,494 |
| International Flavors & Fragrances, Inc. | 55,285 | 6,067,529 |
| Security | Number of Shares | Value ($) |
| Linde plc | 295,847 | 55,888,457 |
| Martin Marietta Materials, Inc. | 33,916 | 8,606,863 |
| NewMarket Corp. | 4,691 | 2,227,052 |
| Packaging Corp. of America | 51,652 | 5,195,158 |
| Royal Gold, Inc. | 35,674 | 4,758,198 |
| Sealed Air Corp. | 84,600 | 3,368,772 |
| The Sherwin-Williams Co. | 44,317 | 23,343,980 |
| Vulcan Materials Co. | 72,253 | 10,205,736 |
| Westlake Chemical Corp. | 19,054 | 1,116,374 |
| 185,407,565 | ||
| Media & Entertainment 13.7% | ||
| Activision Blizzard, Inc. | 416,823 | 21,091,244 |
| Alphabet, Inc., Class A * | 163,120 | 194,199,254 |
| Alphabet, Inc., Class C * | 166,954 | 198,358,047 |
| Altice USA, Inc., Class A * | 64,268 | 1,856,060 |
| Charter Communications, Inc., Class A * | 93,823 | 38,428,963 |
| Comcast Corp., Class A | 2,468,358 | 109,249,525 |
| Discovery, Inc., Class A * | 85,356 | 2,355,826 |
| Discovery, Inc., Class C * | 196,632 | 5,118,331 |
| Electronic Arts, Inc. * | 161,409 | 15,120,795 |
| Facebook, Inc., Class A * | 1,308,518 | 242,952,537 |
| IAC/InterActiveCorp * | 42,657 | 10,862,179 |
| Liberty Broadband Corp., Class A * | 14,068 | 1,473,623 |
| Liberty Broadband Corp., Class C * | 83,276 | 8,780,621 |
| Liberty Global plc, Class A * | 111,421 | 2,977,169 |
| Liberty Global plc, Class C * | 284,211 | 7,423,591 |
| Liberty Media Corp. - Liberty SiriusXM, Class A * | 45,530 | 1,843,510 |
| Liberty Media Corp. - Liberty SiriusXM, Class C * | 84,555 | 3,450,690 |
| Lions Gate Entertainment Corp., Class A | 30,095 | 271,758 |
| Lions Gate Entertainment Corp., Class B | 57,413 | 478,824 |
| Live Nation Entertainment, Inc. * | 75,951 | 5,279,354 |
| Netflix, Inc. * | 238,183 | 69,966,256 |
| Sirius XM Holdings, Inc. | 878,687 | 5,421,499 |
| Take-Two Interactive Software, Inc. * | 61,294 | 8,088,969 |
| The Walt Disney Co. | 951,293 | 130,574,477 |
| TripAdvisor, Inc. * | 57,985 | 2,202,850 |
| Twitter, Inc. * | 397,493 | 16,953,076 |
| Zillow Group, Inc., Class A * | 26,935 | 920,369 |
| Zillow Group, Inc., Class C * | 64,637 | 2,225,452 |
| 1,107,924,849 | ||
| Pharmaceuticals, Biotechnology & Life Sciences 5.4% | ||
| Alexion Pharmaceuticals, Inc. * | 122,065 | 12,299,269 |
| Alkermes plc * | 84,765 | 1,778,370 |
| Allergan plc | 167,647 | 26,776,579 |
| Alnylam Pharmaceuticals, Inc. * | 51,602 | 4,163,765 |
| Amgen, Inc. | 332,450 | 69,355,719 |
| Avantor, Inc. * | 119,558 | 2,092,265 |
| Bio-Rad Laboratories, Inc., Class A * | 10,798 | 3,646,593 |
| Bio-Techne Corp. | 20,820 | 3,988,487 |
| Biogen, Inc. * | 105,457 | 23,174,176 |
| BioMarin Pharmaceutical, Inc. * | 97,640 | 7,328,858 |
| Bluebird Bio, Inc. * | 29,776 | 3,076,159 |
| Celgene Corp. * | 384,600 | 37,229,280 |
| Exelixis, Inc. * | 165,498 | 3,285,135 |
| Illumina, Inc. * | 79,979 | 22,501,292 |
| Incyte Corp. * | 96,567 | 7,901,112 |
| Ionis Pharmaceuticals, Inc. * | 76,367 | 4,827,158 |
| IQVIA Holdings, Inc. * | 85,839 | 13,317,921 |
| Jazz Pharmaceuticals plc * | 30,912 | 3,961,373 |
| Mettler-Toledo International, Inc. * | 13,608 | 8,937,598 |
| Mylan N.V. * | 280,203 | 5,455,552 |
| Nektar Therapeutics * | 95,175 | 1,672,225 |
| Security | Number of Shares | Value ($) |
| Neurocrine Biosciences, Inc. * | 49,784 | 4,949,525 |
| PerkinElmer, Inc. | 60,323 | 4,988,712 |
| Perrigo Co., plc | 68,468 | 3,202,933 |
| PRA Health Sciences, Inc. * | 31,972 | 3,160,113 |
| Regeneron Pharmaceuticals, Inc. * | 42,801 | 12,414,430 |
| Sage Therapeutics, Inc. * | 27,828 | 4,777,233 |
| Sarepta Therapeutics, Inc. * | 37,796 | 3,407,309 |
| Seattle Genetics, Inc. * | 58,855 | 4,275,227 |
| Syneos Health, Inc. * | 33,524 | 1,761,016 |
| Thermo Fisher Scientific, Inc. | 218,197 | 62,635,631 |
| United Therapeutics Corp. * | 23,844 | 1,968,561 |
| Vertex Pharmaceuticals, Inc. * | 139,907 | 25,186,058 |
| Waters Corp. * | 37,829 | 8,015,587 |
| Zoetis, Inc. | 261,091 | 33,007,124 |
| 440,518,345 | ||
| Real Estate 4.0% | ||
| Alexandria Real Estate Equities, Inc. | 61,382 | 9,197,479 |
| American Homes 4 Rent, Class A | 140,538 | 3,594,962 |
| American Tower Corp. | 240,958 | 55,466,122 |
| Apartment Investment & Management Co., Class A | 80,727 | 4,117,077 |
| AvalonBay Communities, Inc. | 75,892 | 16,131,603 |
| Boston Properties, Inc. | 84,096 | 10,799,608 |
| CBRE Group, Inc., Class A * | 170,597 | 8,917,105 |
| Crown Castle International Corp. | 226,834 | 32,929,492 |
| CyrusOne, Inc. | 61,579 | 4,523,593 |
| Digital Realty Trust, Inc. | 113,385 | 14,017,788 |
| Duke Realty Corp. | 195,498 | 6,504,218 |
| Equinix, Inc. | 45,878 | 25,521,014 |
| Equity LifeStyle Properties, Inc. | 48,885 | 6,585,787 |
| Essex Property Trust, Inc. | 35,729 | 11,478,299 |
| Extra Space Storage, Inc. | 69,772 | 8,506,602 |
| Federal Realty Investment Trust | 40,806 | 5,272,543 |
| Invitation Homes, Inc. | 228,527 | 6,572,436 |
| JBG SMITH Properties | 66,030 | 2,526,308 |
| Jones Lang LaSalle, Inc. | 28,068 | 3,762,515 |
| Kilroy Realty Corp. | 54,860 | 4,271,400 |
| Mid-America Apartment Communities, Inc. | 62,023 | 7,857,074 |
| Public Storage | 81,682 | 21,624,493 |
| SBA Communications Corp. | 61,897 | 16,243,630 |
| Simon Property Group, Inc. | 168,127 | 25,040,835 |
| Sun Communities, Inc. | 49,071 | 7,252,694 |
| UDR, Inc. | 153,254 | 7,383,778 |
| 326,098,455 | ||
| Retailing 10.3% | ||
| Advance Auto Parts, Inc. | 38,843 | 5,358,392 |
| Amazon.com, Inc. * | 225,270 | 400,144,848 |
| AutoZone, Inc. * | 13,376 | 14,736,205 |
| Booking Holdings, Inc. * | 23,621 | 46,448,571 |
| Burlington Stores, Inc. * | 36,092 | 7,308,269 |
| CarMax, Inc. * | 90,483 | 7,535,424 |
| Dollar General Corp. | 140,551 | 21,938,606 |
| Dollar Tree, Inc. * | 129,246 | 13,122,346 |
| eBay, Inc. | 447,999 | 18,049,880 |
| Expedia Group, Inc. | 75,324 | 9,799,652 |
| GrubHub, Inc. * | 49,711 | 2,949,851 |
| LKQ Corp. * | 170,254 | 4,472,573 |
| Lowe's Cos., Inc. | 426,874 | 47,895,263 |
| O'Reilly Automotive, Inc. * | 42,556 | 16,331,291 |
| Qurate Retail, Inc., Series A * | 218,302 | 2,338,014 |
| Ross Stores, Inc. | 199,913 | 21,192,777 |
| The Home Depot, Inc. | 599,568 | 136,647,543 |
| The TJX Cos., Inc. | 661,812 | 36,379,806 |
| Tiffany & Co. | 58,921 | 5,000,625 |
| Security | Number of Shares | Value ($) |
| Tractor Supply Co. | 65,787 | 6,702,380 |
| Ulta Salon, Cosmetics & Fragrance, Inc. * | 30,206 | 7,180,872 |
| Wayfair, Inc., Class A * | 34,877 | 3,932,033 |
| 835,465,221 | ||
| Semiconductors & Semiconductor Equipment 2.2% | ||
| Broadcom, Inc. | 215,792 | 60,991,451 |
| First Solar, Inc. * | 40,896 | 2,538,415 |
| Lam Research Corp. | 81,548 | 17,166,669 |
| Micron Technology, Inc. * | 602,176 | 27,260,508 |
| NVIDIA Corp. | 332,052 | 55,622,030 |
| ON Semiconductor Corp. * | 225,430 | 4,012,654 |
| Qorvo, Inc. * | 66,009 | 4,715,023 |
| Skyworks Solutions, Inc. | 93,813 | 7,061,304 |
| 179,368,054 | ||
| Software & Services 20.1% | ||
| Accenture plc, Class A | 347,558 | 68,875,569 |
| Adobe, Inc. * | 266,113 | 75,711,810 |
| Akamai Technologies, Inc. * | 89,469 | 7,974,372 |
| Alliance Data Systems Corp. | 21,567 | 2,651,663 |
| ANSYS, Inc. * | 45,681 | 9,435,867 |
| Aspen Technology, Inc. * | 37,618 | 5,010,718 |
| Autodesk, Inc. * | 119,474 | 17,063,277 |
| Automatic Data Processing, Inc. | 236,867 | 40,229,491 |
| Black Knight, Inc. * | 77,629 | 4,832,405 |
| Broadridge Financial Solutions, Inc. | 63,145 | 8,173,489 |
| Cadence Design Systems, Inc. * | 152,940 | 10,473,331 |
| CDK Global, Inc. | 66,253 | 2,859,479 |
| Citrix Systems, Inc. | 67,997 | 6,322,361 |
| Cognizant Technology Solutions Corp., Class A | 309,739 | 19,014,877 |
| DocuSign, Inc. * | 12,968 | 605,476 |
| EPAM Systems, Inc. * | 28,203 | 5,396,080 |
| Fidelity National Information Services, Inc. | 333,508 | 45,430,460 |
| Fiserv, Inc. * | 310,449 | 33,199,416 |
| FleetCor Technologies, Inc. * | 46,893 | 13,992,871 |
| Fortinet, Inc. * | 78,864 | 6,244,452 |
| Gartner, Inc. * | 48,980 | 6,547,157 |
| Global Payments, Inc. | 85,240 | 14,148,135 |
| GoDaddy, Inc., Class A * | 95,538 | 6,051,377 |
| Guidewire Software, Inc. * | 44,211 | 4,252,214 |
| Intuit, Inc. | 141,474 | 40,795,443 |
| Jack Henry & Associates, Inc. | 41,926 | 6,077,593 |
| Mastercard, Inc., Class A | 489,700 | 137,786,889 |
| Microsoft Corp. | 4,174,149 | 575,448,181 |
| Nuance Communications, Inc. * | 157,645 | 2,650,012 |
| Nutanix, Inc., Class A * | 81,196 | 1,967,379 |
| Palo Alto Networks, Inc. * | 52,232 | 10,635,480 |
| Paycom Software, Inc. * | 26,693 | 6,676,453 |
| PayPal Holdings, Inc. * | 640,389 | 69,834,420 |
| PTC, Inc. * | 56,407 | 3,692,966 |
| salesforce.com, Inc. * | 465,824 | 72,701,152 |
| ServiceNow, Inc. * | 100,924 | 26,425,940 |
| Splunk, Inc. * | 81,716 | 9,137,483 |
| Square, Inc., Class A * | 172,074 | 10,641,056 |
| SS&C Technologies Holdings, Inc. | 118,341 | 5,515,874 |
| Synopsys, Inc. * | 81,553 | 11,565,031 |
| Total System Services, Inc. | 88,966 | 11,941,016 |
| Tyler Technologies, Inc. * | 20,811 | 5,338,854 |
| VeriSign, Inc. * | 57,056 | 11,630,866 |
| Visa, Inc., Class A | 947,356 | 171,300,912 |
| VMware, Inc., Class A | 41,518 | 5,872,306 |
| Security | Number of Shares | Value ($) |
| WEX, Inc. * | 23,383 | 4,782,993 |
| Workday, Inc., Class A * | 88,144 | 15,626,168 |
| 1,632,540,814 | ||
| Technology Hardware & Equipment 6.8% | ||
| Amphenol Corp., Class A | 162,425 | 14,218,685 |
| Apple, Inc. | 2,381,016 | 497,013,280 |
| Arista Networks, Inc. * | 28,713 | 6,506,940 |
| CDW Corp. | 79,493 | 9,181,442 |
| Cognex Corp. | 93,716 | 4,224,717 |
| CommScope Holding Co., Inc. * | 103,830 | 1,115,134 |
| Dell Technologies, Inc., Class C * | 81,232 | 4,185,885 |
| F5 Networks, Inc. * | 32,534 | 4,188,102 |
| IPG Photonics Corp. * | 19,491 | 2,411,621 |
| Trimble, Inc. * | 136,819 | 5,133,449 |
| Zebra Technologies Corp., Class A * | 29,316 | 6,010,659 |
| 554,189,914 | ||
| Telecommunication Services 0.3% | ||
| GCI Liberty, Inc., Class A * | 52,238 | 3,251,293 |
| Sprint Corp. * | 314,188 | 2,133,337 |
| T-Mobile US, Inc. * | 171,799 | 13,408,912 |
| Zayo Group Holdings, Inc. * | 110,609 | 3,723,099 |
| 22,516,641 | ||
| Transportation 2.1% | ||
| Alaska Air Group, Inc. | 68,089 | 4,066,275 |
| AMERCO | 4,197 | 1,475,749 |
| FedEx Corp. | 130,451 | 20,690,833 |
| Genesee & Wyoming, Inc., Class A * | 31,009 | 3,438,278 |
| J.B. Hunt Transport Services, Inc. | 47,114 | 5,090,197 |
| JetBlue Airways Corp. * | 163,840 | 2,837,709 |
| Kansas City Southern | 54,729 | 6,884,908 |
| Lyft, Inc., Class A * | 18,160 | 889,295 |
| Norfolk Southern Corp. | 145,159 | 25,264,924 |
| Old Dominion Freight Line, Inc. | 35,153 | 5,756,655 |
| Southwest Airlines Co. | 265,841 | 13,908,801 |
| Uber Technologies, Inc. *(a) | 109,128 | 3,554,299 |
| Union Pacific Corp. | 385,732 | 62,473,155 |
| United Airlines Holdings, Inc. * | 120,415 | 10,152,189 |
| XPO Logistics, Inc. * | 49,949 | 3,539,386 |
| 170,022,653 | ||
| Utilities 0.8% | ||
| NextEra Energy, Inc. | 260,717 | 57,117,880 |
| NRG Energy, Inc. | 137,829 | 5,016,976 |
| 62,134,856 | ||
| Total Common Stock | ||
| (Cost $5,989,007,279) | 8,097,697,603 | |
| Other Investment Companies0.1% of net assets | ||
| Money Market Fund 0.0% | ||
| State Street Institutional U.S. Government Money Market Fund, Premier Class 2.07%(c) | 1,439,573 | 1,439,573 |
| Security | Number of Shares | Value ($) |
| Securities Lending Collateral 0.1% | ||
| Wells Fargo Government Money Market Fund, Select Class 2.03%(c) | 3,400,683 | 3,400,683 |
| Total Other Investment Companies | ||
| (Cost $4,840,256) | 4,840,256 | |
| Number of Contracts | Notional Amount ($) | Current Value/ Unrealized Appreciation ($) | ||
| Futures Contracts | ||||
| Long | ||||
| Russell 1000 Growth Index, e-mini, expires 09/20/19 | 110 | 8,838,500 | 79,012 | |
| * | Non-income producing security. |
| (a) | All or a portion of this security is on loan. Securities on loan were valued at $3,303,190. |
| (b) | Issuer is affiliated with the fund’s investment adviser. |
| (c) | The rate shown is the 7-day yield. |
| Security | Number of Shares | Value ($) |
| Common Stock99.8% of net assets | ||
| Automobiles & Components 1.1% | ||
| Aptiv plc | 135,253 | 11,248,992 |
| Autoliv, Inc. | 45,640 | 3,121,776 |
| BorgWarner, Inc. | 108,075 | 3,526,487 |
| Ford Motor Co. | 2,059,220 | 18,883,047 |
| General Motors Co. | 692,884 | 25,699,068 |
| Harley-Davidson, Inc. | 83,127 | 2,651,751 |
| The Goodyear Tire & Rubber Co. | 123,608 | 1,417,784 |
| 66,548,905 | ||
| Banks 11.2% | ||
| Bank of America Corp. | 4,643,781 | 127,750,415 |
| BB&T Corp. | 402,408 | 19,174,741 |
| BOK Financial Corp. | 16,650 | 1,267,731 |
| Citigroup, Inc. | 1,214,451 | 78,149,922 |
| Citizens Financial Group, Inc. | 240,508 | 8,114,740 |
| Comerica, Inc. | 80,953 | 4,990,752 |
| Commerce Bancshares, Inc. | 51,191 | 2,921,470 |
| Cullen/Frost Bankers, Inc. | 33,262 | 2,761,079 |
| Fifth Third Bancorp | 381,314 | 10,085,755 |
| Huntington Bancshares, Inc. | 550,214 | 7,290,336 |
| JPMorgan Chase & Co. | 1,703,602 | 187,157,716 |
| KeyCorp | 529,582 | 8,791,061 |
| M&T Bank Corp. | 71,695 | 10,482,526 |
| New York Community Bancorp, Inc. | 243,545 | 2,810,509 |
| People's United Financial, Inc. | 207,395 | 2,980,266 |
| Regions Financial Corp. | 531,959 | 7,777,241 |
| SunTrust Banks, Inc. | 232,705 | 14,313,685 |
| The PNC Financial Services Group, Inc. | 237,085 | 30,567,369 |
| U.S. Bancorp | 785,940 | 41,411,179 |
| Wells Fargo & Co. | 2,124,197 | 98,923,854 |
| Zions Bancorp NA | 95,927 | 3,941,640 |
| 671,663,987 | ||
| Capital Goods 6.6% | ||
| AGCO Corp. | 34,100 | 2,356,992 |
| Allison Transmission Holdings, Inc. | 62,976 | 2,798,024 |
| Arconic, Inc. | 209,683 | 5,418,209 |
| Caterpillar, Inc. | 300,341 | 35,740,579 |
| Cummins, Inc. | 76,053 | 11,352,431 |
| Donaldson Co., Inc. | 67,261 | 3,252,742 |
| Eaton Corp. plc | 222,348 | 17,947,930 |
| Emerson Electric Co. | 322,963 | 19,245,365 |
| Flowserve Corp. | 68,994 | 2,944,664 |
| Fluor Corp. | 72,761 | 1,285,687 |
| General Dynamics Corp. | 142,593 | 27,273,763 |
| General Electric Co. | 4,579,612 | 37,781,799 |
| GrafTech International Ltd.(a) | 31,798 | 387,618 |
| Honeywell International, Inc. | 382,156 | 62,910,521 |
| Illinois Tool Works, Inc. | 157,404 | 23,588,563 |
| Ingersoll-Rand plc | 126,602 | 15,330,236 |
| Jacobs Engineering Group, Inc. | 60,259 | 5,354,615 |
| Johnson Controls International plc | 418,059 | 17,846,939 |
| Lincoln Electric Holdings, Inc. | 32,919 | 2,717,793 |
| Masco Corp. | 154,494 | 6,292,541 |
| Security | Number of Shares | Value ($) |
| PACCAR, Inc. | 181,954 | 11,928,904 |
| Parker-Hannifin Corp. | 67,286 | 11,154,000 |
| Pentair plc | 82,790 | 2,973,817 |
| Rockwell Automation, Inc. | 62,102 | 9,488,564 |
| United Technologies Corp. | 425,934 | 55,473,644 |
| 392,845,940 | ||
| Commercial & Professional Services 0.7% | ||
| ADT, Inc.(a) | 62,784 | 298,852 |
| ManpowerGroup, Inc. | 31,306 | 2,558,952 |
| Nielsen Holdings plc | 186,448 | 3,870,660 |
| Republic Services, Inc. | 112,971 | 10,082,662 |
| Waste Management, Inc. | 205,148 | 24,484,414 |
| 41,295,540 | ||
| Consumer Durables & Apparel 0.7% | ||
| Garmin Ltd. | 63,434 | 5,174,311 |
| Hanesbrands, Inc. | 191,319 | 2,613,418 |
| Hasbro, Inc. | 60,708 | 6,706,413 |
| Leggett & Platt, Inc. | 68,801 | 2,558,709 |
| Mattel, Inc. * | 183,759 | 1,800,838 |
| Ralph Lauren Corp. | 27,405 | 2,420,958 |
| Tapestry, Inc. | 152,417 | 3,147,411 |
| VF Corp. | 170,891 | 14,004,517 |
| Whirlpool Corp. | 33,375 | 4,642,129 |
| 43,068,704 | ||
| Consumer Services 2.5% | ||
| Aramark | 129,113 | 5,275,557 |
| Caesars Entertainment Corp. * | 306,806 | 3,531,337 |
| Carnival Corp. | 209,942 | 9,254,243 |
| Darden Restaurants, Inc. | 64,579 | 7,812,767 |
| H&R Block, Inc. | 107,510 | 2,603,892 |
| Las Vegas Sands Corp. | 190,468 | 10,565,260 |
| McDonald's Corp. | 400,949 | 87,394,854 |
| Service Corp. International | 96,079 | 4,448,458 |
| Wyndham Destinations, Inc. | 49,128 | 2,178,336 |
| Yum! Brands, Inc. | 160,802 | 18,778,458 |
| 151,843,162 | ||
| Diversified Financials 3.7% | ||
| AGNC Investment Corp. | 282,279 | 4,197,489 |
| Ally Financial, Inc. | 208,577 | 6,538,889 |
| American Express Co. | 359,589 | 43,283,728 |
| Annaly Capital Management, Inc. | 763,861 | 6,340,046 |
| AXA Equitable Holdings, Inc. | 132,379 | 2,749,512 |
| Capital One Financial Corp. | 246,707 | 21,369,760 |
| Discover Financial Services | 169,735 | 13,573,708 |
| Eaton Vance Corp. | 59,967 | 2,585,777 |
| Franklin Resources, Inc. | 154,936 | 4,071,718 |
| Invesco Ltd. | 209,841 | 3,294,504 |
| Janus Henderson Group plc | 85,875 | 1,641,071 |
| Jefferies Financial Group, Inc. | 133,317 | 2,485,029 |
| KKR & Co., Inc., Class A | 285,179 | 7,369,025 |
| Lazard Ltd., Class A | 68,701 | 2,359,192 |
| Nasdaq, Inc. | 61,020 | 6,092,237 |
| Security | Number of Shares | Value ($) |
| Northern Trust Corp. | 114,394 | 10,058,664 |
| Santander Consumer USA Holdings, Inc. | 59,532 | 1,554,381 |
| Starwood Property Trust, Inc. | 146,945 | 3,442,921 |
| State Street Corp. | 195,729 | 10,042,855 |
| Synchrony Financial | 332,435 | 10,654,542 |
| The Bank of New York Mellon Corp. | 462,928 | 19,470,752 |
| The Goldman Sachs Group, Inc. | 178,656 | 36,429,745 |
| 219,605,545 | ||
| Energy 8.2% | ||
| Antero Midstream Corp.(a) | 119,339 | 848,500 |
| Apache Corp. | 196,600 | 4,240,662 |
| Baker Hughes a GE Co. | 271,392 | 5,886,492 |
| Chevron Corp. | 1,000,270 | 117,751,784 |
| ConocoPhillips | 593,507 | 30,969,195 |
| Devon Energy Corp. | 217,709 | 4,787,421 |
| Equitrans Midstream Corp. | 106,309 | 1,434,108 |
| Exxon Mobil Corp. | 2,221,775 | 152,147,152 |
| Helmerich & Payne, Inc. | 57,930 | 2,177,589 |
| Hess Corp. | 134,100 | 8,441,595 |
| HollyFrontier Corp. | 82,338 | 3,652,514 |
| Kinder Morgan, Inc. | 1,023,057 | 20,737,365 |
| Marathon Oil Corp. | 427,671 | 5,063,625 |
| Marathon Petroleum Corp. | 347,518 | 17,101,361 |
| Murphy Oil Corp. | 84,755 | 1,545,084 |
| National Oilwell Varco, Inc. | 202,349 | 4,133,990 |
| Noble Energy, Inc. | 251,106 | 5,669,973 |
| Occidental Petroleum Corp. | 470,481 | 20,456,514 |
| ONEOK, Inc. | 216,511 | 15,432,904 |
| Phillips 66 | 219,474 | 21,646,721 |
| Targa Resources Corp. | 121,958 | 4,405,123 |
| TechnipFMC plc | 221,215 | 5,494,981 |
| The Williams Cos., Inc. | 635,596 | 15,000,066 |
| Valero Energy Corp. | 218,828 | 16,473,372 |
| WPX Energy, Inc. * | 210,326 | 2,263,108 |
| 487,761,199 | ||
| Food & Staples Retailing 1.9% | ||
| Sysco Corp. | 248,467 | 18,468,552 |
| The Kroger Co. | 423,057 | 10,017,990 |
| Walmart, Inc. | 734,552 | 83,929,911 |
| 112,416,453 | ||
| Food, Beverage & Tobacco 7.4% | ||
| Altria Group, Inc. | 982,538 | 42,976,212 |
| Archer-Daniels-Midland Co. | 293,986 | 11,186,167 |
| Bunge Ltd. | 74,185 | 3,962,221 |
| Campbell Soup Co. | 101,067 | 4,548,015 |
| Conagra Brands, Inc. | 255,801 | 7,254,516 |
| General Mills, Inc. | 314,695 | 16,930,591 |
| Hormel Foods Corp. | 142,794 | 6,084,452 |
| Ingredion, Inc. | 34,802 | 2,689,151 |
| Kellogg Co. | 130,609 | 8,202,245 |
| Lamb Weston Holdings, Inc. | 76,986 | 5,419,045 |
| McCormick & Co., Inc. Non-Voting Shares | 64,202 | 10,456,580 |
| Mondelez International, Inc., Class A | 756,527 | 41,775,421 |
| PepsiCo, Inc. | 736,107 | 100,647,910 |
| Philip Morris International, Inc. | 817,010 | 58,898,251 |
| Pilgrim's Pride Corp. * | 27,116 | 844,935 |
| The Coca-Cola Co. | 2,016,223 | 110,972,914 |
| The Kraft Heinz Co. | 326,245 | 8,325,772 |
| 441,174,398 | ||
| Security | Number of Shares | Value ($) |
| Health Care Equipment & Services 2.9% | ||
| Abbott Laboratories | 926,262 | 79,028,674 |
| Baxter International, Inc. | 249,188 | 21,916,085 |
| Cardinal Health, Inc. | 156,802 | 6,762,870 |
| CVS Health Corp. | 682,103 | 41,553,715 |
| Encompass Health Corp. | 52,106 | 3,167,524 |
| Quest Diagnostics, Inc. | 70,455 | 7,212,478 |
| Zimmer Biomet Holdings, Inc. | 107,677 | 14,988,638 |
| 174,629,984 | ||
| Household & Personal Products 3.6% | ||
| Colgate-Palmolive Co. | 450,842 | 33,429,934 |
| Kimberly-Clark Corp. | 180,537 | 25,475,576 |
| The Procter & Gamble Co. | 1,317,232 | 158,370,804 |
| 217,276,314 | ||
| Insurance 5.0% | ||
| Aflac, Inc. | 391,611 | 19,651,040 |
| American Financial Group, Inc. | 37,087 | 3,744,674 |
| American International Group, Inc. | 456,804 | 23,772,080 |
| Arthur J. Gallagher & Co. | 97,013 | 8,800,049 |
| Assurant, Inc. | 32,388 | 3,983,724 |
| Axis Capital Holdings Ltd. | 43,937 | 2,697,292 |
| Brighthouse Financial, Inc. * | 60,367 | 2,128,540 |
| Brown & Brown, Inc. | 123,268 | 4,547,356 |
| Chubb Ltd. | 240,460 | 37,579,089 |
| Cincinnati Financial Corp. | 79,716 | 8,967,253 |
| CNA Financial Corp. | 14,104 | 664,722 |
| Erie Indemnity Co., Class A | 10,372 | 2,274,683 |
| Fidelity National Financial, Inc. | 144,106 | 6,332,018 |
| Globe Life, Inc. * | 53,150 | 4,744,169 |
| Lincoln National Corp. | 106,303 | 5,621,303 |
| Loews Corp. | 140,789 | 6,767,727 |
| Marsh & McLennan Cos., Inc. | 268,547 | 26,825,160 |
| MetLife, Inc. | 499,230 | 22,115,889 |
| Old Republic International Corp. | 149,531 | 3,493,044 |
| Principal Financial Group, Inc. | 135,713 | 7,222,646 |
| Prudential Financial, Inc. | 212,879 | 17,049,479 |
| Reinsurance Group of America, Inc. | 32,944 | 5,072,388 |
| The Allstate Corp. | 174,700 | 17,887,533 |
| The Hartford Financial Services Group, Inc. | 190,063 | 11,076,872 |
| The Progressive Corp. | 306,700 | 23,247,860 |
| The Travelers Cos., Inc. | 137,574 | 20,217,875 |
| Unum Group | 111,697 | 2,838,221 |
| 299,322,686 | ||
| Materials 3.4% | ||
| Air Products & Chemicals, Inc. | 115,584 | 26,112,737 |
| Albemarle Corp. | 55,492 | 3,425,521 |
| Avery Dennison Corp. | 44,402 | 5,131,539 |
| Celanese Corp., Series A | 66,474 | 7,536,157 |
| CF Industries Holdings, Inc. | 116,034 | 5,591,678 |
| Corteva, Inc. * | 392,779 | 11,516,280 |
| Dow, Inc. * | 393,592 | 16,778,827 |
| DuPont de Nemours, Inc. | 393,258 | 26,714,016 |
| Eastman Chemical Co. | 72,902 | 4,765,604 |
| Freeport-McMoRan, Inc. | 760,841 | 6,992,129 |
| Huntsman Corp. | 109,359 | 2,178,431 |
| International Paper Co. | 208,536 | 8,153,758 |
| LyondellBasell Industries N.V., Class A | 144,198 | 11,158,041 |
| Newmont Goldcorp Corp. | 430,767 | 17,183,296 |
| Nucor Corp. | 159,768 | 7,825,437 |
| PPG Industries, Inc. | 123,802 | 13,716,023 |
| Reliance Steel & Aluminum Co. | 35,416 | 3,443,498 |
| Security | Number of Shares | Value ($) |
| RPM International, Inc. | 69,092 | 4,675,456 |
| Sonoco Products Co. | 52,443 | 2,999,740 |
| Steel Dynamics, Inc. | 116,733 | 3,151,791 |
| The Chemours Co. | 86,665 | 1,228,043 |
| The Mosaic Co. | 186,037 | 3,421,220 |
| W.R. Grace & Co. | 35,418 | 2,398,153 |
| Westrock Co. | 134,760 | 4,606,097 |
| 200,703,472 | ||
| Media & Entertainment 0.9% | ||
| CBS Corp., Class B Non-Voting Shares | 187,275 | 7,876,786 |
| DISH Network Corp., Class A * | 120,809 | 4,054,350 |
| Fox Corp., Class A | 186,465 | 6,185,044 |
| Fox Corp., Class B * | 84,615 | 2,775,372 |
| Liberty Media Corp. - Liberty Formula One, Class A * | 13,478 | 533,594 |
| Liberty Media Corp. - Liberty Formula One, Class C * | 106,839 | 4,459,460 |
| News Corp., Class A | 203,520 | 2,798,400 |
| News Corp., Class B | 63,692 | 901,879 |
| Omnicom Group, Inc. | 115,538 | 8,787,820 |
| Snap, Inc., Class A * | 396,990 | 6,284,352 |
| The Interpublic Group of Cos., Inc. | 202,379 | 4,023,295 |
| Viacom, Inc., Class B | 190,094 | 4,748,548 |
| 53,428,900 | ||
| Pharmaceuticals, Biotechnology & Life Sciences 10.1% | ||
| AbbVie, Inc. | 776,294 | 51,033,568 |
| Agilent Technologies, Inc. | 165,937 | 11,799,780 |
| Bristol-Myers Squibb Co. | 858,924 | 41,288,477 |
| Elanco Animal Health, Inc. * | 196,271 | 5,106,971 |
| Eli Lilly & Co. | 453,675 | 51,251,665 |
| Gilead Sciences, Inc. | 667,695 | 42,425,340 |
| Johnson & Johnson | 1,394,246 | 178,965,417 |
| Merck & Co., Inc. | 1,351,966 | 116,904,500 |
| Pfizer, Inc. | 2,915,390 | 103,642,114 |
| 602,417,832 | ||
| Real Estate 3.4% | ||
| American Campus Communities, Inc. | 72,021 | 3,347,536 |
| Brixmor Property Group, Inc. | 156,389 | 2,882,249 |
| Camden Property Trust | 50,867 | 5,506,353 |
| Douglas Emmett, Inc. | 84,785 | 3,577,927 |
| Equity Residential | 194,662 | 16,499,551 |
| Gaming & Leisure Properties, Inc. | 106,240 | 4,156,109 |
| HCP, Inc. | 250,609 | 8,698,638 |
| Healthcare Trust of America, Inc., Class A | 108,254 | 3,070,083 |
| Highwoods Properties, Inc. | 54,832 | 2,369,291 |
| Host Hotels & Resorts, Inc. | 387,674 | 6,218,291 |
| Iron Mountain, Inc. | 150,509 | 4,793,712 |
| Kimco Realty Corp. | 221,334 | 4,068,119 |
| Lamar Advertising Co., Class A | 44,856 | 3,438,212 |
| Liberty Property Trust | 78,176 | 4,074,533 |
| National Retail Properties, Inc. | 85,320 | 4,790,718 |
| Omega Healthcare Investors, Inc. | 112,506 | 4,576,744 |
| Park Hotels & Resorts, Inc. | 105,673 | 2,488,599 |
| Prologis, Inc. | 330,700 | 27,653,134 |
| Realty Income Corp. | 165,570 | 12,220,722 |
| Regency Centers Corp. | 87,850 | 5,667,204 |
| Senior Housing Properties Trust | 126,994 | 1,078,179 |
| SL Green Realty Corp. | 44,193 | 3,545,162 |
| The Macerich Co. | 55,062 | 1,570,919 |
| Ventas, Inc. | 194,225 | 14,254,173 |
| VEREIT, Inc. | 510,562 | 4,977,980 |
| VICI Properties, Inc. | 216,076 | 4,788,244 |
| Security | Number of Shares | Value ($) |
| Vornado Realty Trust | 91,397 | 5,526,777 |
| Welltower, Inc. | 212,724 | 19,051,561 |
| Weyerhaeuser Co. | 391,387 | 10,297,392 |
| WP Carey, Inc. | 89,382 | 8,026,504 |
| 203,214,616 | ||
| Retailing 1.0% | ||
| Best Buy Co., Inc. | 121,934 | 7,761,099 |
| Foot Locker, Inc. | 58,669 | 2,123,231 |
| Genuine Parts Co. | 76,768 | 6,931,383 |
| Kohl's Corp. | 85,038 | 4,018,896 |
| L Brands, Inc. | 119,631 | 1,975,108 |
| Macy's, Inc. | 161,867 | 2,389,157 |
| Nordstrom, Inc.(a) | 55,657 | 1,612,383 |
| Target Corp. | 269,057 | 28,799,861 |
| The Gap, Inc. | 112,192 | 1,771,512 |
| Williams-Sonoma, Inc. | 41,593 | 2,736,819 |
| 60,119,449 | ||
| Semiconductors & Semiconductor Equipment 5.7% | ||
| Advanced Micro Devices, Inc. * | 466,331 | 14,666,110 |
| Analog Devices, Inc. | 194,146 | 21,323,055 |
| Applied Materials, Inc. | 491,582 | 23,605,768 |
| Intel Corp. | 2,351,000 | 111,460,910 |
| KLA Corp. | 85,012 | 12,573,275 |
| Marvell Technology Group Ltd. | 311,014 | 7,455,005 |
| Maxim Integrated Products, Inc. | 143,148 | 7,807,292 |
| Microchip Technology, Inc. | 124,776 | 10,771,912 |
| QUALCOMM, Inc. | 638,383 | 49,647,046 |
| Teradyne, Inc. | 90,355 | 4,786,104 |
| Texas Instruments, Inc. | 492,648 | 60,965,190 |
| Xilinx, Inc. | 133,182 | 13,858,919 |
| 338,920,586 | ||
| Software & Services 3.0% | ||
| Booz Allen Hamilton Holding Corp. | 73,449 | 5,546,134 |
| DXC Technology Co. | 141,582 | 4,703,354 |
| International Business Machines Corp. | 465,580 | 63,100,057 |
| Leidos Holdings, Inc. | 75,700 | 6,613,152 |
| Oracle Corp. | 1,274,191 | 66,334,384 |
| Paychex, Inc. | 168,223 | 13,743,819 |
| Sabre Corp. | 143,386 | 3,389,645 |
| Symantec Corp. | 324,437 | 7,543,160 |
| Teradata Corp. * | 62,225 | 1,920,886 |
| The Western Union Co. | 226,909 | 5,019,227 |
| 177,913,818 | ||
| Technology Hardware & Equipment 3.7% | ||
| Arrow Electronics, Inc. * | 44,154 | 3,055,457 |
| Avnet, Inc. | 56,494 | 2,366,534 |
| Cisco Systems, Inc. | 2,247,994 | 105,228,599 |
| Corning, Inc. | 411,446 | 11,458,771 |
| FLIR Systems, Inc. | 71,373 | 3,516,548 |
| Hewlett Packard Enterprise Co. | 702,440 | 9,707,721 |
| HP, Inc. | 789,933 | 14,447,874 |
| Jabil, Inc. | 73,269 | 2,110,880 |
| Juniper Networks, Inc. | 181,024 | 4,192,516 |
| Keysight Technologies, Inc. * | 98,646 | 9,554,851 |
| Motorola Solutions, Inc. | 86,625 | 15,671,329 |
| National Instruments Corp. | 58,429 | 2,454,018 |
| NetApp, Inc. | 130,084 | 6,251,837 |
| Seagate Technology plc | 132,167 | 6,636,105 |
| TE Connectivity Ltd. | 177,077 | 16,152,964 |
| Security | Number of Shares | Value ($) |
| Western Digital Corp. | 153,605 | 8,796,958 |
| Xerox Holdings Corp. * | 102,594 | 2,974,200 |
| 224,577,162 | ||
| Telecommunication Services 4.5% | ||
| AT&T, Inc. | 3,832,669 | 135,139,909 |
| CenturyLink, Inc. | 503,354 | 5,728,169 |
| Verizon Communications, Inc. | 2,171,881 | 126,316,599 |
| 267,184,677 | ||
| Transportation 1.8% | ||
| American Airlines Group, Inc. | 207,710 | 5,464,850 |
| C.H. Robinson Worldwide, Inc. | 71,706 | 6,058,440 |
| CSX Corp. | 403,709 | 27,056,577 |
| Delta Air Lines, Inc. | 313,053 | 18,113,246 |
| Expeditors International of Washington, Inc. | 90,418 | 6,428,720 |
| United Parcel Service, Inc., Class B | 366,236 | 43,457,564 |
| 106,579,397 | ||
| Utilities 6.8% | ||
| AES Corp. | 349,677 | 5,360,548 |
| Alliant Energy Corp. | 123,839 | 6,495,356 |
| Ameren Corp. | 128,824 | 9,938,772 |
| American Electric Power Co., Inc. | 259,116 | 23,618,423 |
| American Water Works Co., Inc. | 94,794 | 12,069,172 |
| Aqua America, Inc. | 113,178 | 5,012,654 |
| Atmos Energy Corp. | 61,596 | 6,789,727 |
| Avangrid, Inc. | 29,194 | 1,475,465 |
| CenterPoint Energy, Inc. | 263,381 | 7,293,020 |
| CMS Energy Corp. | 148,807 | 9,382,281 |
| Consolidated Edison, Inc. | 172,026 | 15,293,111 |
| Dominion Energy, Inc. | 421,330 | 32,707,848 |
| DTE Energy Co. | 96,108 | 12,461,363 |
| Duke Energy Corp. | 382,366 | 35,460,623 |
| Edison International | 185,630 | 13,415,480 |
| Entergy Corp. | 99,550 | 11,233,222 |
| Evergy, Inc. | 128,005 | 8,320,325 |
| Eversource Energy | 168,860 | 13,530,752 |
| Exelon Corp. | 509,977 | 24,101,513 |
| FirstEnergy Corp. | 264,779 | 12,179,834 |
| National Fuel Gas Co. | 45,773 | 2,139,430 |
| NiSource, Inc. | 195,527 | 5,777,823 |
| OGE Energy Corp. | 104,980 | 4,500,493 |
| Pinnacle West Capital Corp. | 58,821 | 5,606,229 |
| PPL Corp. | 378,496 | 11,184,557 |
| Public Service Enterprise Group, Inc. | 265,736 | 16,069,056 |
| Sempra Energy | 144,153 | 20,416,389 |
| The Southern Co. | 546,560 | 31,842,586 |
| UGI Corp. | 109,415 | 5,325,228 |
| Vistra Energy Corp. | 197,801 | 4,935,135 |
| WEC Energy Group, Inc. | 165,722 | 15,871,196 |
| Xcel Energy, Inc. | 270,424 | 17,366,629 |
| 407,174,240 | ||
| Total Common Stock | ||
| (Cost $5,594,658,106) | 5,961,686,966 | |
| Other Investment Companies0.1% of net assets | ||
| Money Market Fund 0.1% | ||
| State Street Institutional U.S. Government Money Market Fund, Premier Class 2.07%(b) | 5,488,494 | 5,488,494 |
| Security | Number of Shares | Value ($) |
| Securities Lending Collateral 0.0% | ||
| Wells Fargo Government Money Market Fund, Select Class 2.03%(b) | 2,675,585 | 2,675,585 |
| Total Other Investment Companies | ||
| (Cost $8,164,079) | 8,164,079 | |
| Number of Contracts | Notional Amount ($) | Current Value/ Unrealized Appreciation ($) | ||
| Futures Contracts | ||||
| Long | ||||
| Russell 1000 Value Index, e-mini, expires 09/20/19 | 228 | 13,941,060 | 43,613 | |
| * | Non-income producing security. |
| (a) | All or a portion of this security is on loan. Securities on loan were valued at $2,589,308. |
| (b) | The rate shown is the 7-day yield. |
| Security | Number of Shares | Value ($) |
| Common Stock99.8% of net assets | ||
| Automobiles & Components 1.3% | ||
| Adient plc | 175,627 | 3,542,397 |
| Autoliv, Inc. | 175,480 | 12,002,832 |
| BorgWarner, Inc. | 418,059 | 13,641,265 |
| Delphi Technologies plc | 177,257 | 2,345,110 |
| Gentex Corp. | 514,892 | 13,696,127 |
| Harley-Davidson, Inc. | 319,545 | 10,193,485 |
| Lear Corp. | 125,583 | 14,097,948 |
| The Goodyear Tire & Rubber Co. | 466,770 | 5,353,852 |
| Thor Industries, Inc. | 105,643 | 4,850,070 |
| Veoneer, Inc. * | 225,448 | 3,307,322 |
| 83,030,408 | ||
| Banks 4.0% | ||
| Associated Banc-Corp. | 331,007 | 6,368,575 |
| Bank OZK | 244,527 | 6,308,797 |
| BankUnited, Inc. | 199,100 | 6,323,416 |
| BOK Financial Corp. | 63,271 | 4,817,454 |
| CIT Group, Inc. | 194,043 | 8,264,291 |
| Commerce Bancshares, Inc. | 198,059 | 11,303,227 |
| Cullen/Frost Bankers, Inc. | 127,003 | 10,542,519 |
| East West Bancorp, Inc. | 292,522 | 12,031,430 |
| F.N.B. Corp. | 653,300 | 7,022,975 |
| First Citizens BancShares, Inc., Class A | 17,273 | 7,679,576 |
| First Hawaiian, Inc. | 182,060 | 4,678,942 |
| First Horizon National Corp. | 637,332 | 10,088,966 |
| IBERIABANK Corp. | 109,556 | 7,558,268 |
| Investors Bancorp, Inc. | 460,405 | 5,110,495 |
| MGIC Investment Corp. | 718,867 | 9,093,668 |
| New York Community Bancorp, Inc. | 940,105 | 10,848,812 |
| PacWest Bancorp | 239,406 | 8,158,956 |
| People's United Financial, Inc. | 796,881 | 11,451,180 |
| Pinnacle Financial Partners, Inc. | 145,671 | 7,672,492 |
| Popular, Inc. | 195,091 | 10,255,934 |
| Prosperity Bancshares, Inc. | 134,156 | 8,709,408 |
| Signature Bank | 110,946 | 12,941,851 |
| Sterling Bancorp | 422,193 | 8,051,220 |
| Synovus Financial Corp. | 318,472 | 11,318,495 |
| TFS Financial Corp. | 106,549 | 1,865,673 |
| Webster Financial Corp. | 186,232 | 8,335,744 |
| Western Alliance Bancorp | 193,614 | 8,406,720 |
| Wintrust Financial Corp. | 113,962 | 7,160,232 |
| Zions Bancorp NA | 368,580 | 15,144,952 |
| 247,514,268 | ||
| Capital Goods 11.3% | ||
| A.O. Smith Corp. | 284,988 | 13,257,642 |
| Acuity Brands, Inc. | 80,303 | 10,070,799 |
| AECOM * | 316,936 | 11,244,889 |
| AGCO Corp. | 130,099 | 8,992,443 |
| Air Lease Corp. | 207,886 | 8,635,584 |
| Allegion plc | 189,469 | 18,240,181 |
| Allison Transmission Holdings, Inc. | 242,199 | 10,760,902 |
| Arconic, Inc. | 805,248 | 20,807,608 |
| BWX Technologies, Inc. | 191,703 | 11,348,818 |
| Security | Number of Shares | Value ($) |
| Carlisle Cos., Inc. | 115,098 | 16,684,606 |
| Colfax Corp. * | 192,630 | 5,239,536 |
| Crane Co. | 103,013 | 7,853,711 |
| Curtiss-Wright Corp. | 86,056 | 10,553,908 |
| Donaldson Co., Inc. | 256,865 | 12,421,991 |
| EMCOR Group, Inc. | 113,063 | 9,886,229 |
| Flowserve Corp. | 264,088 | 11,271,276 |
| Fluor Corp. | 281,657 | 4,976,879 |
| Fortune Brands Home & Security, Inc. | 282,412 | 14,419,957 |
| Gardner Denver Holdings, Inc. * | 260,339 | 7,466,523 |
| Gates Industrial Corp. plc * | 92,295 | 802,967 |
| Graco, Inc. | 335,832 | 15,303,864 |
| GrafTech International Ltd.(a) | 121,686 | 1,483,352 |
| HD Supply Holdings, Inc. * | 344,571 | 13,407,258 |
| HEICO Corp. | 83,336 | 12,056,219 |
| HEICO Corp., Class A | 144,315 | 15,926,603 |
| Hexcel Corp. | 170,700 | 14,364,405 |
| Hubbell, Inc. | 109,947 | 14,418,450 |
| Huntington Ingalls Industries, Inc. | 83,885 | 17,531,965 |
| IDEX Corp. | 152,677 | 25,147,429 |
| ITT, Inc. | 176,884 | 10,068,237 |
| Jacobs Engineering Group, Inc. | 231,571 | 20,577,399 |
| Lennox International, Inc. | 71,190 | 18,066,598 |
| Lincoln Electric Holdings, Inc. | 126,859 | 10,473,479 |
| MSC Industrial Direct Co., Inc., Class A | 90,565 | 6,124,005 |
| Nordson Corp. | 104,524 | 14,211,083 |
| nVent Electric plc | 320,763 | 6,498,658 |
| Oshkosh Corp. | 141,145 | 9,918,259 |
| Owens Corning | 218,721 | 12,545,837 |
| Pentair plc | 319,260 | 11,467,819 |
| Quanta Services, Inc. | 286,159 | 9,700,790 |
| Regal Beloit Corp. | 85,809 | 6,083,858 |
| Sensata Technologies Holding plc * | 326,028 | 14,860,356 |
| Snap-on, Inc. | 111,785 | 16,620,194 |
| Spirit AeroSystems Holdings, Inc., Class A | 208,647 | 16,816,948 |
| Teledyne Technologies, Inc. * | 73,082 | 22,552,374 |
| The Middleby Corp. * | 112,065 | 12,289,048 |
| The Timken Co. | 138,144 | 5,550,626 |
| The Toro Co. | 215,097 | 15,489,135 |
| Trex Co., Inc. * | 117,821 | 10,077,230 |
| Trinity Industries, Inc. | 261,570 | 4,569,628 |
| United Rentals, Inc. * | 158,703 | 17,863,610 |
| WABCO Holdings, Inc. * | 103,137 | 13,769,821 |
| Wabtec Corp. | 367,095 | 25,406,645 |
| Watsco, Inc. | 65,052 | 10,639,255 |
| Woodward, Inc. | 112,652 | 12,149,518 |
| Xylem, Inc. | 362,867 | 27,799,241 |
| 706,765,645 | ||
| Commercial & Professional Services 1.6% | ||
| ADT, Inc.(a) | 240,717 | 1,145,813 |
| ASGN, Inc. * | 106,497 | 6,652,868 |
| Clean Harbors, Inc. * | 102,792 | 7,560,352 |
| IAA, Inc. * | 269,114 | 13,146,219 |
| Insperity, Inc. | 75,835 | 7,512,215 |
| KAR Auction Services, Inc. | 268,226 | 7,124,083 |
| ManpowerGroup, Inc. | 120,450 | 9,845,583 |
| Nielsen Holdings plc | 717,495 | 14,895,196 |
| Robert Half International, Inc. | 239,313 | 12,796,066 |
| Security | Number of Shares | Value ($) |
| Rollins, Inc. | 296,856 | 9,739,845 |
| Stericycle, Inc. * | 172,014 | 7,721,708 |
| 98,139,948 | ||
| Consumer Durables & Apparel 3.2% | ||
| Brunswick Corp. | 175,186 | 8,163,668 |
| Capri Holdings Ltd. * | 304,089 | 8,021,868 |
| Carter's, Inc. | 91,049 | 8,329,162 |
| Columbia Sportswear Co. | 59,017 | 5,535,204 |
| Garmin Ltd. | 244,596 | 19,951,696 |
| Hanesbrands, Inc. | 726,018 | 9,917,406 |
| Leggett & Platt, Inc. | 265,242 | 9,864,350 |
| Mattel, Inc. * | 694,820 | 6,809,236 |
| Newell Brands, Inc. | 783,335 | 13,003,361 |
| NVR, Inc. * | 6,808 | 24,501,992 |
| Polaris, Inc. | 116,114 | 9,523,670 |
| PulteGroup, Inc. | 514,585 | 17,392,973 |
| Ralph Lauren Corp. | 105,098 | 9,284,357 |
| Skechers U.S.A., Inc., Class A * | 270,689 | 8,570,014 |
| Toll Brothers, Inc. | 266,600 | 9,648,254 |
| Under Armour, Inc., Class A * | 379,378 | 7,060,224 |
| Under Armour, Inc., Class C * | 392,263 | 6,637,090 |
| Whirlpool Corp. | 127,840 | 17,781,266 |
| 199,995,791 | ||
| Consumer Services 3.4% | ||
| Aramark | 495,892 | 20,262,147 |
| Bright Horizons Family Solutions, Inc. * | 118,325 | 19,529,541 |
| Caesars Entertainment Corp. * | 1,180,731 | 13,590,214 |
| Cracker Barrel Old Country Store, Inc. | 48,452 | 8,013,961 |
| Domino's Pizza, Inc. | 82,905 | 18,806,170 |
| Dunkin' Brands Group, Inc. | 166,429 | 13,720,407 |
| Extended Stay America, Inc. | 380,416 | 5,344,845 |
| Grand Canyon Education, Inc. * | 97,312 | 12,222,387 |
| H&R Block, Inc. | 409,449 | 9,916,855 |
| Marriott Vacations Worldwide Corp. | 78,479 | 7,737,244 |
| Service Corp. International | 367,563 | 17,018,167 |
| ServiceMaster Global Holdings, Inc. * | 274,222 | 15,641,623 |
| Six Flags Entertainment Corp. | 144,417 | 8,545,154 |
| Texas Roadhouse, Inc. | 134,848 | 6,939,278 |
| Vail Resorts, Inc. | 81,087 | 19,159,236 |
| Wyndham Destinations, Inc. | 188,994 | 8,379,994 |
| Wyndham Hotels & Resorts, Inc. | 195,916 | 10,066,164 |
| 214,893,387 | ||
| Diversified Financials 4.8% | ||
| Affiliated Managers Group, Inc. | 103,072 | 7,898,407 |
| AGNC Investment Corp. | 1,083,097 | 16,105,652 |
| Cboe Global Markets, Inc. | 225,292 | 26,845,795 |
| Chimera Investment Corp. | 377,795 | 7,204,551 |
| Credit Acceptance Corp. * | 24,171 | 10,941,003 |
| Eaton Vance Corp. | 230,448 | 9,936,918 |
| FactSet Research Systems, Inc. | 77,113 | 20,981,676 |
| Invesco Ltd. | 808,475 | 12,693,057 |
| Janus Henderson Group plc | 330,267 | 6,311,402 |
| Jefferies Financial Group, Inc. | 511,928 | 9,542,338 |
| Lazard Ltd., Class A | 261,959 | 8,995,672 |
| LPL Financial Holdings, Inc. | 168,004 | 12,591,900 |
| MarketAxess Holdings, Inc. | 76,029 | 30,230,651 |
| MFA Financial, Inc. | 910,132 | 6,525,646 |
| Morningstar, Inc. | 36,895 | 5,961,494 |
| Navient Corp. | 429,154 | 5,467,422 |
| New Residential Investment Corp. | 837,940 | 11,789,816 |
| OneMain Holdings, Inc. | 151,003 | 5,413,458 |
| Raymond James Financial, Inc. | 254,894 | 20,011,728 |
| Security | Number of Shares | Value ($) |
| Santander Consumer USA Holdings, Inc. | 226,778 | 5,921,174 |
| SEI Investments Co. | 257,969 | 14,835,797 |
| SLM Corp. | 872,853 | 7,366,879 |
| Starwood Property Trust, Inc. | 564,540 | 13,227,172 |
| Two Harbors Investment Corp. | 549,524 | 6,940,488 |
| Voya Financial, Inc. | 290,186 | 14,311,974 |
| 298,052,070 | ||
| Energy 2.2% | ||
| Antero Midstream Corp.(a) | 458,299 | 3,258,506 |
| Antero Resources Corp. * | 437,811 | 1,387,861 |
| Centennial Resource Development, Inc., Class A * | 383,386 | 1,847,921 |
| Chesapeake Energy Corp. *(a) | 2,115,659 | 3,046,549 |
| Cimarex Energy Co. | 205,084 | 8,773,494 |
| CNX Resources Corp. * | 393,379 | 3,135,231 |
| Core Laboratories N.V. | 89,071 | 3,526,321 |
| Diamondback Energy, Inc. | 311,702 | 30,571,732 |
| Equitrans Midstream Corp. | 409,800 | 5,528,202 |
| Helmerich & Payne, Inc. | 222,453 | 8,362,008 |
| HollyFrontier Corp. | 317,175 | 14,069,883 |
| Murphy Oil Corp. | 307,442 | 5,604,668 |
| Parsley Energy, Inc., Class A * | 531,177 | 9,513,380 |
| PBF Energy, Inc., Class A | 241,265 | 5,717,980 |
| Peabody Energy Corp. | 159,250 | 2,934,977 |
| Range Resources Corp. | 421,950 | 1,502,142 |
| Targa Resources Corp. | 469,350 | 16,952,922 |
| Transocean Ltd. * | 1,028,259 | 4,678,578 |
| WPX Energy, Inc. * | 799,641 | 8,604,137 |
| 139,016,492 | ||
| Food & Staples Retailing 0.5% | ||
| Casey's General Stores, Inc. | 73,891 | 12,402,604 |
| US Foods Holding Corp. * | 440,701 | 17,826,356 |
| 30,228,960 | ||
| Food, Beverage & Tobacco 1.3% | ||
| Beyond Meat, Inc. *(a) | 20,496 | 3,435,744 |
| Bunge Ltd. | 284,516 | 15,196,000 |
| Flowers Foods, Inc. | 371,324 | 8,466,187 |
| Ingredion, Inc. | 134,613 | 10,401,547 |
| Lamb Weston Holdings, Inc. | 294,528 | 20,731,826 |
| Lancaster Colony Corp. | 39,218 | 5,721,906 |
| National Beverage Corp.(a) | 24,886 | 1,017,837 |
| Pilgrim's Pride Corp. * | 106,105 | 3,306,232 |
| Post Holdings, Inc. * | 134,585 | 13,416,779 |
| Seaboard Corp. | 545 | 2,250,948 |
| 83,945,006 | ||
| Health Care Equipment & Services 5.8% | ||
| Acadia Healthcare Co., Inc. * | 178,394 | 4,720,305 |
| Chemed Corp. | 32,150 | 13,806,175 |
| Covetrus, Inc. * | 193,868 | 2,576,506 |
| DENTSPLY SIRONA, Inc. | 471,880 | 24,608,542 |
| DexCom, Inc. * | 183,630 | 31,512,744 |
| Encompass Health Corp. | 198,723 | 12,080,371 |
| Haemonetics Corp. * | 103,278 | 13,790,711 |
| HealthEquity, Inc. * | 140,356 | 8,331,532 |
| Hill-Rom Holdings, Inc. | 134,286 | 14,459,917 |
| ICU Medical, Inc. * | 33,682 | 5,448,064 |
| Inogen, Inc. * | 36,232 | 1,680,078 |
| Insulet Corp. * | 120,164 | 18,525,684 |
| Integra LifeSciences Holdings Corp. * | 142,906 | 8,577,218 |
| LivaNova plc * | 97,469 | 7,566,518 |
| Security | Number of Shares | Value ($) |
| Masimo Corp. * | 99,064 | 15,181,558 |
| Medidata Solutions, Inc. * | 125,408 | 11,484,865 |
| MEDNAX, Inc. * | 175,005 | 3,689,105 |
| Molina Healthcare, Inc. * | 126,294 | 16,453,582 |
| STERIS plc | 170,528 | 26,329,523 |
| Teladoc Health, Inc. * | 144,199 | 8,346,238 |
| Teleflex, Inc. | 93,082 | 33,874,401 |
| Varian Medical Systems, Inc. * | 183,419 | 19,429,575 |
| Veeva Systems, Inc., Class A * | 257,773 | 41,341,634 |
| West Pharmaceutical Services, Inc. | 148,207 | 21,558,190 |
| 365,373,036 | ||
| Household & Personal Products 0.4% | ||
| Coty, Inc., Class A | 604,231 | 5,770,406 |
| Herbalife Nutrition Ltd. * | 203,940 | 7,021,654 |
| Nu Skin Enterprises, Inc., Class A | 112,243 | 4,559,311 |
| Spectrum Brands Holdings, Inc. | 83,490 | 4,664,586 |
| 22,015,957 | ||
| Insurance 5.0% | ||
| Alleghany Corp. * | 29,138 | 21,833,395 |
| American Financial Group, Inc. | 142,998 | 14,438,508 |
| American National Insurance Co. | 17,322 | 1,975,921 |
| Arthur J. Gallagher & Co. | 373,564 | 33,885,990 |
| Assurant, Inc. | 123,815 | 15,229,245 |
| Assured Guaranty Ltd. | 204,517 | 8,702,198 |
| Athene Holding Ltd., Class A * | 237,546 | 9,231,038 |
| Axis Capital Holdings Ltd. | 169,358 | 10,396,888 |
| Brighthouse Financial, Inc. * | 233,196 | 8,222,491 |
| Brown & Brown, Inc. | 471,375 | 17,389,024 |
| CNO Financial Group, Inc. | 322,228 | 4,665,861 |
| Erie Indemnity Co., Class A | 39,873 | 8,744,548 |
| Everest Re Group Ltd. | 82,157 | 19,379,193 |
| First American Financial Corp. | 225,794 | 13,197,659 |
| Globe Life, Inc. * | 204,127 | 18,220,376 |
| Kemper Corp. | 125,875 | 8,808,732 |
| Old Republic International Corp. | 574,727 | 13,425,623 |
| Primerica, Inc. | 85,217 | 10,155,310 |
| Reinsurance Group of America, Inc. | 126,234 | 19,436,249 |
| RenaissanceRe Holdings Ltd. | 88,846 | 16,041,145 |
| The Hanover Insurance Group, Inc. | 81,962 | 10,913,240 |
| Unum Group | 428,107 | 10,878,199 |
| W.R. Berkley Corp. | 291,745 | 20,786,831 |
| 315,957,664 | ||
| Materials 6.2% | ||
| Alcoa Corp. * | 373,077 | 6,689,271 |
| Amcor plc * | 3,273,256 | 32,143,374 |
| AptarGroup, Inc. | 127,102 | 15,534,406 |
| Ashland Global Holdings, Inc. | 126,219 | 9,244,280 |
| Avery Dennison Corp. | 170,243 | 19,674,984 |
| Axalta Coating Systems Ltd. * | 421,550 | 12,174,364 |
| Berry Global Group, Inc. * | 265,020 | 10,372,883 |
| CF Industries Holdings, Inc. | 446,067 | 21,495,969 |
| Crown Holdings, Inc. * | 272,941 | 17,970,435 |
| Eagle Materials, Inc. | 88,828 | 7,478,429 |
| FMC Corp. | 265,661 | 22,934,514 |
| Graphic Packaging Holding Co. | 594,550 | 8,210,735 |
| Huntsman Corp. | 424,393 | 8,453,909 |
| International Flavors & Fragrances, Inc. | 204,443 | 22,437,619 |
| NewMarket Corp. | 17,678 | 8,392,630 |
| Olin Corp. | 333,370 | 5,660,623 |
| Packaging Corp. of America | 190,647 | 19,175,275 |
| Reliance Steel & Aluminum Co. | 135,815 | 13,205,292 |
| Royal Gold, Inc. | 132,165 | 17,628,168 |
| Security | Number of Shares | Value ($) |
| RPM International, Inc. | 264,503 | 17,898,918 |
| Sealed Air Corp. | 313,689 | 12,491,096 |
| Sonoco Products Co. | 201,944 | 11,551,197 |
| Steel Dynamics, Inc. | 447,542 | 12,083,634 |
| The Chemours Co. | 330,300 | 4,680,351 |
| The Mosaic Co. | 716,344 | 13,173,566 |
| The Scotts Miracle-Gro Co. | 79,383 | 8,440,001 |
| United States Steel Corp.(a) | 347,115 | 3,842,563 |
| Valvoline, Inc. | 378,861 | 8,562,259 |
| W.R. Grace & Co. | 134,588 | 9,112,953 |
| Westlake Chemical Corp. | 72,413 | 4,242,678 |
| 384,956,376 | ||
| Media & Entertainment 3.1% | ||
| Altice USA, Inc., Class A * | 237,414 | 6,856,516 |
| Cable One, Inc. | 10,011 | 12,990,474 |
| Cinemark Holdings, Inc. | 213,955 | 8,164,523 |
| Discovery, Inc., Class A * | 317,601 | 8,765,788 |
| Discovery, Inc., Class C * | 727,190 | 18,928,756 |
| DISH Network Corp., Class A * | 465,332 | 15,616,542 |
| Liberty Media Corp. - Liberty Formula One, Class A * | 51,232 | 2,028,275 |
| Liberty Media Corp. - Liberty Formula One, Class C * | 408,892 | 17,067,152 |
| Lions Gate Entertainment Corp., Class A | 113,689 | 1,026,612 |
| Lions Gate Entertainment Corp., Class B | 213,379 | 1,779,581 |
| Live Nation Entertainment, Inc. * | 281,689 | 19,580,202 |
| News Corp., Class A | 775,871 | 10,668,226 |
| News Corp., Class B | 246,053 | 3,484,111 |
| Snap, Inc., Class A * | 1,524,934 | 24,139,705 |
| The Interpublic Group of Cos., Inc. | 780,640 | 15,519,123 |
| The Madison Square Garden Co., Class A * | 34,771 | 8,773,766 |
| TripAdvisor, Inc. * | 208,443 | 7,918,750 |
| Zillow Group, Inc., Class A * | 100,949 | 3,449,427 |
| Zillow Group, Inc., Class C * | 234,961 | 8,089,707 |
| 194,847,236 | ||
| Pharmaceuticals, Biotechnology & Life Sciences 5.0% | ||
| Alkermes plc * | 315,710 | 6,623,596 |
| Allogene Therapeutics, Inc. *(a) | 38,704 | 1,053,910 |
| Alnylam Pharmaceuticals, Inc. * | 191,535 | 15,454,959 |
| Amneal Pharmaceuticals, Inc. * | 160,751 | 409,915 |
| Avantor, Inc. * | 444,069 | 7,771,207 |
| Bio-Rad Laboratories, Inc., Class A * | 40,280 | 13,602,959 |
| Bio-Techne Corp. | 76,431 | 14,641,887 |
| Bluebird Bio, Inc. * | 111,180 | 11,486,006 |
| Bruker Corp. | 202,416 | 8,738,299 |
| Catalent, Inc. * | 293,901 | 15,500,339 |
| Charles River Laboratories International, Inc. * | 98,138 | 12,875,706 |
| Exact Sciences Corp. * | 260,450 | 31,050,849 |
| Exelixis, Inc. * | 607,880 | 12,066,418 |
| FibroGen, Inc. * | 154,443 | 6,897,424 |
| Ionis Pharmaceuticals, Inc. * | 283,020 | 17,889,694 |
| Jazz Pharmaceuticals plc * | 114,290 | 14,646,263 |
| Ligand Pharmaceuticals, Inc. * | 39,451 | 3,586,490 |
| Neurocrine Biosciences, Inc. * | 184,121 | 18,305,310 |
| PerkinElmer, Inc. | 223,701 | 18,500,073 |
| Perrigo Co., plc | 252,846 | 11,828,136 |
| PRA Health Sciences, Inc. * | 119,193 | 11,781,036 |
| Sage Therapeutics, Inc. * | 103,166 | 17,710,507 |
| Sarepta Therapeutics, Inc. * | 140,707 | 12,684,736 |
| Seattle Genetics, Inc. * | 217,990 | 15,834,794 |
| Security | Number of Shares | Value ($) |
| Syneos Health, Inc. * | 123,469 | 6,485,827 |
| United Therapeutics Corp. * | 88,467 | 7,303,835 |
| 314,730,175 | ||
| Real Estate 11.6% | ||
| American Campus Communities, Inc. | 276,615 | 12,857,065 |
| American Homes 4 Rent, Class A | 524,092 | 13,406,273 |
| Apartment Investment & Management Co., Class A | 300,245 | 15,312,495 |
| Brixmor Property Group, Inc. | 599,497 | 11,048,730 |
| Camden Property Trust | 194,983 | 21,106,910 |
| CubeSmart | 379,689 | 13,627,038 |
| CyrusOne, Inc. | 227,946 | 16,744,913 |
| Douglas Emmett, Inc. | 326,632 | 13,783,870 |
| Duke Realty Corp. | 724,851 | 24,115,793 |
| EPR Properties | 152,037 | 11,896,895 |
| Equity Commonwealth | 245,178 | 8,252,691 |
| Equity LifeStyle Properties, Inc. | 181,372 | 24,434,436 |
| Extra Space Storage, Inc. | 257,037 | 31,337,951 |
| Federal Realty Investment Trust | 151,155 | 19,530,738 |
| Gaming & Leisure Properties, Inc. | 407,751 | 15,951,219 |
| Healthcare Realty Trust, Inc. | 260,211 | 8,646,812 |
| Healthcare Trust of America, Inc., Class A | 414,331 | 11,750,427 |
| Highwoods Properties, Inc. | 208,176 | 8,995,285 |
| Hospitality Properties Trust | 331,176 | 7,994,589 |
| Hudson Pacific Properties, Inc. | 310,627 | 10,561,318 |
| Invitation Homes, Inc. | 846,920 | 24,357,419 |
| Iron Mountain, Inc. | 579,043 | 18,442,520 |
| Jones Lang LaSalle, Inc. | 104,028 | 13,944,953 |
| Kilroy Realty Corp. | 203,123 | 15,815,157 |
| Kimco Realty Corp. | 851,825 | 15,656,544 |
| Lamar Advertising Co., Class A | 172,317 | 13,208,098 |
| Liberty Property Trust | 299,465 | 15,608,116 |
| Life Storage, Inc. | 93,948 | 9,954,730 |
| Medical Properties Trust, Inc. | 886,755 | 16,484,775 |
| National Retail Properties, Inc. | 328,122 | 18,424,050 |
| Omega Healthcare Investors, Inc. | 432,854 | 17,608,501 |
| Paramount Group, Inc. | 405,847 | 5,349,063 |
| Park Hotels & Resorts, Inc. | 407,676 | 9,600,770 |
| Rayonier, Inc. | 262,062 | 7,023,262 |
| Regency Centers Corp. | 337,073 | 21,744,579 |
| RLJ Lodging Trust | 349,813 | 5,670,469 |
| Senior Housing Properties Trust | 477,410 | 4,053,211 |
| SL Green Realty Corp. | 169,564 | 13,602,424 |
| Spirit Realty Capital, Inc. | 175,921 | 8,433,653 |
| STORE Capital Corp. | 407,105 | 15,372,285 |
| Sun Communities, Inc. | 181,864 | 26,879,499 |
| Taubman Centers, Inc. | 122,887 | 4,798,737 |
| The Howard Hughes Corp. * | 79,031 | 9,979,244 |
| The Macerich Co. | 214,334 | 6,114,949 |
| UDR, Inc. | 568,267 | 27,379,104 |
| Uniti Group, Inc. | 371,010 | 2,741,764 |
| VEREIT, Inc. | 1,963,652 | 19,145,607 |
| VICI Properties, Inc. | 827,743 | 18,342,785 |
| Weingarten Realty Investors | 240,727 | 6,376,858 |
| WP Carey, Inc. | 343,630 | 30,857,974 |
| 724,326,548 | ||
| Retailing 4.0% | ||
| Advance Auto Parts, Inc. | 144,772 | 19,971,297 |
| American Eagle Outfitters, Inc. | 329,595 | 5,543,788 |
| AutoNation, Inc. * | 115,018 | 5,458,754 |
| Burlington Stores, Inc. * | 134,039 | 27,141,557 |
| Etsy, Inc. * | 242,515 | 12,802,367 |
| Five Below, Inc. * | 112,976 | 13,881,361 |
| Floor & Decor Holdings, Inc., Class A * | 116,784 | 5,748,108 |
| Security | Number of Shares | Value ($) |
| Foot Locker, Inc. | 226,072 | 8,181,546 |
| GrubHub, Inc. * | 183,620 | 10,896,011 |
| Kohl's Corp. | 327,030 | 15,455,438 |
| L Brands, Inc. | 461,454 | 7,618,606 |
| LKQ Corp. * | 634,280 | 16,662,536 |
| Macy's, Inc. | 623,713 | 9,206,004 |
| Nordstrom, Inc.(a) | 212,526 | 6,156,878 |
| Penske Automotive Group, Inc. | 72,481 | 3,100,737 |
| Pool Corp. | 80,058 | 15,721,790 |
| Qurate Retail, Inc., Series A * | 806,480 | 8,637,401 |
| Signet Jewelers Ltd. | 105,923 | 1,296,498 |
| The Michaels Cos., Inc. * | 179,160 | 1,015,837 |
| Tractor Supply Co. | 243,456 | 24,803,297 |
| Urban Outfitters, Inc. * | 138,163 | 3,234,396 |
| Wayfair, Inc., Class A * | 129,268 | 14,573,674 |
| Williams-Sonoma, Inc. | 158,720 | 10,443,776 |
| 247,551,657 | ||
| Semiconductors & Semiconductor Equipment 2.3% | ||
| Cypress Semiconductor Corp. | 738,060 | 16,982,760 |
| First Solar, Inc. * | 152,839 | 9,486,717 |
| Marvell Technology Group Ltd. | 1,196,531 | 28,680,848 |
| MKS Instruments, Inc. | 109,840 | 8,599,374 |
| Monolithic Power Systems, Inc. | 79,776 | 12,011,074 |
| ON Semiconductor Corp. * | 832,419 | 14,817,058 |
| Qorvo, Inc. * | 240,402 | 17,171,915 |
| Teradyne, Inc. | 345,803 | 18,317,185 |
| Universal Display Corp. | 85,551 | 17,578,164 |
| 143,645,095 | ||
| Software & Services 11.0% | ||
| Akamai Technologies, Inc. * | 330,927 | 29,495,524 |
| Aspen Technology, Inc. * | 139,092 | 18,527,054 |
| Black Knight, Inc. * | 286,464 | 17,832,384 |
| Blackbaud, Inc. | 99,081 | 9,013,399 |
| Booz Allen Hamilton Holding Corp. | 282,403 | 21,324,251 |
| Cadence Design Systems, Inc. * | 566,697 | 38,807,411 |
| CDK Global, Inc. | 245,527 | 10,596,945 |
| Ceridian HCM Holding, Inc. * | 159,021 | 9,186,643 |
| DocuSign, Inc. * | 48,834 | 2,280,059 |
| Elastic N.V. * | 14,537 | 1,277,657 |
| EPAM Systems, Inc. * | 104,673 | 20,027,085 |
| Euronet Worldwide, Inc. * | 104,798 | 16,048,766 |
| Fair Isaac Corp. * | 58,454 | 20,617,895 |
| Fortinet, Inc. * | 292,746 | 23,179,628 |
| Gartner, Inc. * | 181,676 | 24,284,631 |
| Genpact Ltd. | 306,604 | 12,558,500 |
| GoDaddy, Inc., Class A * | 354,180 | 22,433,761 |
| Guidewire Software, Inc. * | 164,239 | 15,796,507 |
| HubSpot, Inc. * | 79,026 | 15,779,912 |
| Jack Henry & Associates, Inc. | 155,693 | 22,569,257 |
| Leidos Holdings, Inc. | 290,828 | 25,406,734 |
| LogMeIn, Inc. | 100,331 | 6,706,124 |
| Manhattan Associates, Inc. * | 130,026 | 10,744,048 |
| MAXIMUS, Inc. | 128,731 | 9,904,563 |
| New Relic, Inc. * | 93,618 | 5,368,056 |
| Nuance Communications, Inc. * | 584,480 | 9,825,109 |
| Nutanix, Inc., Class A * | 300,339 | 7,277,214 |
| Okta, Inc. * | 209,536 | 26,506,304 |
| Pagerduty, Inc. *(a) | 18,355 | 720,801 |
| Paycom Software, Inc. * | 99,104 | 24,787,893 |
| Perspecta, Inc. | 281,892 | 7,315,097 |
| Proofpoint, Inc. * | 112,328 | 12,761,584 |
| PTC, Inc. * | 208,887 | 13,675,832 |
| RealPage, Inc. * | 148,846 | 9,477,025 |
| RingCentral, Inc., Class A * | 141,907 | 20,027,335 |
| Security | Number of Shares | Value ($) |
| Sabre Corp. | 554,516 | 13,108,758 |
| SS&C Technologies Holdings, Inc. | 438,845 | 20,454,565 |
| Teradata Corp. * | 235,438 | 7,267,971 |
| The Western Union Co. | 868,675 | 19,215,091 |
| Twilio, Inc., Class A * | 236,112 | 30,805,533 |
| Tyler Technologies, Inc. * | 77,313 | 19,833,877 |
| WEX, Inc. * | 87,231 | 17,843,101 |
| Zendesk, Inc. * | 221,020 | 17,725,804 |
| Zscaler, Inc. * | 30,249 | 2,079,316 |
| 690,475,004 | ||
| Technology Hardware & Equipment 4.6% | ||
| Arrow Electronics, Inc. * | 171,220 | 11,848,424 |
| Avnet, Inc. | 214,488 | 8,984,902 |
| CDW Corp. | 294,492 | 34,013,826 |
| Cognex Corp. | 346,227 | 15,607,913 |
| Coherent, Inc. * | 48,694 | 7,058,682 |
| CommScope Holding Co., Inc. * | 390,515 | 4,194,131 |
| Dolby Laboratories, Inc., Class A | 129,360 | 7,963,402 |
| F5 Networks, Inc. * | 120,388 | 15,497,547 |
| FLIR Systems, Inc. | 273,147 | 13,457,953 |
| IPG Photonics Corp. * | 71,483 | 8,844,592 |
| Jabil, Inc. | 280,277 | 8,074,780 |
| Juniper Networks, Inc. | 694,395 | 16,082,188 |
| Keysight Technologies, Inc. * | 379,493 | 36,757,692 |
| Littelfuse, Inc. | 49,720 | 7,759,800 |
| National Instruments Corp. | 225,676 | 9,478,392 |
| NCR Corp. * | 241,891 | 7,621,986 |
| SYNNEX Corp. | 83,718 | 7,016,406 |
| Trimble, Inc. * | 507,466 | 19,040,124 |
| Ubiquiti, Inc. | 38,444 | 4,248,447 |
| ViaSat, Inc. * | 114,920 | 9,116,604 |
| Xerox Holdings Corp. * | 393,666 | 11,412,377 |
| Zebra Technologies Corp., Class A * | 108,874 | 22,322,436 |
| 286,402,604 | ||
| Telecommunication Services 0.5% | ||
| GCI Liberty, Inc., Class A * | 193,676 | 12,054,394 |
| Telephone & Data Systems, Inc. | 190,450 | 4,799,340 |
| Zayo Group Holdings, Inc. * | 409,489 | 13,783,400 |
| 30,637,134 | ||
| Transportation 2.7% | ||
| Alaska Air Group, Inc. | 249,132 | 14,878,163 |
| AMERCO | 15,493 | 5,447,649 |
| Expeditors International of Washington, Inc. | 346,989 | 24,670,918 |
| Genesee & Wyoming, Inc., Class A * | 113,844 | 12,623,023 |
| J.B. Hunt Transport Services, Inc. | 175,626 | 18,974,633 |
| JetBlue Airways Corp. * | 607,276 | 10,518,020 |
| Kirby Corp. * | 108,446 | 7,980,541 |
| Knight-Swift Transportation Holdings, Inc. | 250,739 | 8,560,229 |
| Landstar System, Inc. | 80,644 | 8,993,419 |
| Macquarie Infrastructure Corp. | 156,111 | 5,904,118 |
| Old Dominion Freight Line, Inc. | 130,657 | 21,396,390 |
| Ryder System, Inc. | 107,409 | 5,173,892 |
| Uber Technologies, Inc. *(a) | 407,014 | 13,256,446 |
| XPO Logistics, Inc. * | 185,081 | 13,114,840 |
| 171,492,281 | ||
| Utilities 4.0% | ||
| AES Corp. | 1,338,537 | 20,519,772 |
| Alliant Energy Corp. | 476,511 | 24,993,002 |
| Aqua America, Inc. | 435,090 | 19,270,136 |
| Security | Number of Shares | Value ($) |
| Atmos Energy Corp. | 235,911 | 26,004,469 |
| IDACORP, Inc. | 101,688 | 11,166,359 |
| MDU Resources Group, Inc. | 398,945 | 10,727,631 |
| National Fuel Gas Co. | 173,767 | 8,121,870 |
| NiSource, Inc. | 752,343 | 22,231,736 |
| NRG Energy, Inc. | 510,084 | 18,567,058 |
| OGE Energy Corp. | 402,996 | 17,276,438 |
| Pinnacle West Capital Corp. | 226,434 | 21,581,425 |
| Portland General Electric Co. | 179,847 | 10,231,496 |
| UGI Corp. | 420,958 | 20,488,026 |
| Vistra Energy Corp. | 759,403 | 18,947,105 |
| 250,126,523 | ||
| Total Common Stock | ||
| (Cost $5,628,672,804) | 6,244,119,265 | |
| Other Investment Companies0.6% of net assets | ||
| Money Market Fund 0.1% | ||
| State Street Institutional U.S. Government Money Market Fund, Premier Class 2.07%(b) | 3,495,102 | 3,495,102 |
| Securities Lending Collateral 0.5% | ||
| Wells Fargo Government Money Market Fund, Select Class 2.03%(b) | 33,564,717 | 33,564,717 |
| Total Other Investment Companies | ||
| (Cost $37,059,819) | 37,059,819 | |
| Number of Contracts | Notional Amount ($) | Current Value/ Unrealized Appreciation ($) | ||
| Futures Contracts | ||||
| Long | ||||
| S&P Mid-Cap 400 Index, e-mini, expires 09/20/19 | 51 | 9,595,140 | 12,201 | |
| * | Non-income producing security. |
| (a) | All or a portion of this security is on loan. Securities on loan were valued at $32,180,849. |
| (b) | The rate shown is the 7-day yield. |
| Security | Number of Shares | Value ($) |
| Common Stock99.8% of net assets | ||
| Automobiles & Components 1.2% | ||
| Adient plc | 254,835 | 5,140,022 |
| American Axle & Manufacturing Holdings, Inc. * | 331,836 | 2,103,840 |
| Cooper Tire & Rubber Co. | 146,829 | 3,449,013 |
| Cooper-Standard Holding, Inc. * | 47,787 | 1,789,145 |
| Dana, Inc. | 422,925 | 5,383,835 |
| Delphi Technologies plc | 257,475 | 3,406,394 |
| Dorman Products, Inc. * | 84,906 | 6,035,119 |
| Fox Factory Holding Corp. * | 112,553 | 8,108,318 |
| Garrett Motion, Inc. * | 220,354 | 2,168,284 |
| Gentex Corp. | 751,722 | 19,995,805 |
| Gentherm, Inc. * | 98,619 | 3,619,317 |
| Horizon Global Corp. * | 73,359 | 306,641 |
| LCI Industries | 73,891 | 6,262,262 |
| Modine Manufacturing Co. * | 148,087 | 1,511,968 |
| Motorcar Parts of America, Inc. * | 55,449 | 805,674 |
| Standard Motor Products, Inc. | 58,919 | 2,610,701 |
| Stoneridge, Inc. * | 80,590 | 2,474,919 |
| Superior Industries International, Inc. | 67,459 | 185,512 |
| Tenneco, Inc., Class A | 144,806 | 1,262,708 |
| Thor Industries, Inc. | 153,518 | 7,048,012 |
| Tower International, Inc. | 60,386 | 1,867,739 |
| Visteon Corp. * | 82,608 | 5,697,474 |
| Winnebago Industries, Inc. | 86,126 | 2,757,755 |
| 93,990,457 | ||
| Banks 10.0% | ||
| 1st Source Corp. | 48,954 | 2,172,089 |
| Ameris Bancorp | 169,984 | 5,981,737 |
| Arrow Financial Corp. | 42,096 | 1,353,807 |
| Associated Banc-Corp. | 480,713 | 9,248,918 |
| Atlantic Union Bankshares Corp. | 210,367 | 7,596,352 |
| Axos Financial, Inc. * | 157,995 | 4,093,650 |
| Banc of California, Inc. | 125,484 | 1,828,302 |
| BancFirst Corp. | 50,628 | 2,722,268 |
| BancorpSouth Bank | 271,411 | 7,488,229 |
| Bank of Hawaii Corp. | 120,291 | 9,945,660 |
| Bank OZK | 356,077 | 9,186,787 |
| BankUnited, Inc. | 288,812 | 9,172,669 |
| Banner Corp. | 91,696 | 4,943,331 |
| Berkshire Hills Bancorp, Inc. | 133,552 | 3,917,080 |
| Boston Private Financial Holdings, Inc. | 245,104 | 2,603,004 |
| Bridge Bancorp, Inc. | 53,773 | 1,447,031 |
| Bridgewater Bancshares, Inc. * | 20,693 | 230,313 |
| Brookline Bancorp, Inc. | 234,104 | 3,286,820 |
| Bryn Mawr Bank Corp. | 58,610 | 1,998,601 |
| Byline Bancorp, Inc. * | 48,169 | 828,507 |
| Cadence BanCorp | 351,023 | 5,395,223 |
| Camden National Corp. | 46,371 | 1,922,542 |
| Capitol Federal Financial, Inc. | 415,024 | 5,590,373 |
| Carolina Financial Corp. | 59,833 | 2,043,297 |
| Carter Bank & Trust * | 65,732 | 1,241,677 |
| Cathay General Bancorp | 225,174 | 7,473,525 |
| CBTX, Inc. | 54,211 | 1,459,902 |
| CenterState Bank Corp. | 300,303 | 6,792,854 |
| Security | Number of Shares | Value ($) |
| Central Pacific Financial Corp. | 83,818 | 2,331,817 |
| City Holding Co. | 48,402 | 3,598,689 |
| Columbia Banking System, Inc. | 216,546 | 7,473,002 |
| Columbia Financial, Inc. * | 144,959 | 2,197,578 |
| Community Bank System, Inc. | 151,781 | 9,257,123 |
| Community Trust Bancorp, Inc. | 48,663 | 1,892,991 |
| ConnectOne Bancorp, Inc. | 88,435 | 1,811,149 |
| Customers Bancorp, Inc. * | 83,405 | 1,575,520 |
| CVB Financial Corp. | 300,165 | 6,174,394 |
| Dime Community Bancshares, Inc. | 88,796 | 1,760,825 |
| Eagle Bancorp, Inc. | 93,187 | 3,796,438 |
| Enterprise Financial Services Corp. | 64,964 | 2,560,881 |
| Equity Bancshares, Inc., Class A * | 42,145 | 1,066,268 |
| Essent Group Ltd. * | 289,794 | 14,055,009 |
| F.N.B. Corp. | 957,437 | 10,292,448 |
| FB Financial Corp. | 49,648 | 1,780,874 |
| Federal Agricultural Mortgage Corp., Class C | 29,673 | 2,443,572 |
| Financial Institutions, Inc. | 46,282 | 1,344,955 |
| First BanCorp | 637,068 | 6,103,111 |
| First Bancorp (North Carolina) | 87,002 | 3,064,210 |
| First Busey Corp. | 127,286 | 3,118,507 |
| First Citizens BancShares, Inc., Class A | 25,362 | 11,275,945 |
| First Commonwealth Financial Corp. | 289,135 | 3,576,600 |
| First Community Bankshares, Inc. | 40,314 | 1,282,388 |
| First Defiance Financial Corp. | 58,012 | 1,517,014 |
| First Financial Bancorp | 290,739 | 6,809,107 |
| First Financial Bankshares, Inc. | 399,799 | 12,241,845 |
| First Financial Corp. | 35,485 | 1,440,691 |
| First Foundation, Inc. | 111,696 | 1,559,276 |
| First Hawaiian, Inc. | 266,769 | 6,855,963 |
| First Horizon National Corp. | 927,901 | 14,688,673 |
| First Interstate BancSystem, Inc., Class A | 108,778 | 4,242,342 |
| First Merchants Corp. | 165,220 | 5,901,658 |
| First Midwest Bancorp, Inc. | 327,242 | 6,283,046 |
| Flagstar Bancorp, Inc. | 85,493 | 3,107,671 |
| Flushing Financial Corp. | 83,028 | 1,601,610 |
| Fulton Financial Corp. | 495,519 | 7,903,528 |
| German American Bancorp, Inc. | 67,030 | 2,046,426 |
| Glacier Bancorp, Inc. | 251,794 | 9,993,704 |
| Great Southern Bancorp, Inc. | 35,923 | 2,023,902 |
| Great Western Bancorp, Inc. | 168,169 | 5,016,481 |
| Hancock Whitney Corp. | 252,599 | 8,868,751 |
| Hanmi Financial Corp. | 90,014 | 1,612,151 |
| Harborone Bancorp, Inc. * | 170,032 | 1,693,519 |
| Heartland Financial USA, Inc. | 95,555 | 4,178,620 |
| Heritage Commerce Corp. | 114,623 | 1,328,481 |
| Heritage Financial Corp. | 97,303 | 2,547,393 |
| Hilltop Holdings, Inc. | 211,812 | 5,030,535 |
| Home BancShares, Inc. | 456,007 | 8,080,444 |
| HomeStreet, Inc. * | 71,687 | 1,890,386 |
| HomeTrust Bancshares, Inc. | 49,595 | 1,250,786 |
| Hope Bancorp, Inc. | 352,817 | 4,731,276 |
| Horizon Bancorp, Inc. | 110,429 | 1,795,576 |
| IBERIABANK Corp. | 160,362 | 11,063,374 |
| Independent Bank Corp. | 101,333 | 6,851,124 |
| Independent Bank Group, Inc. | 104,437 | 5,108,014 |
| International Bancshares Corp. | 159,773 | 5,686,321 |
| Investors Bancorp, Inc. | 669,707 | 7,433,748 |
| Kearny Financial Corp. | 268,872 | 3,382,410 |
| Security | Number of Shares | Value ($) |
| Lakeland Bancorp, Inc. | 139,087 | 2,069,615 |
| Lakeland Financial Corp. | 74,611 | 3,158,284 |
| LegacyTexas Financial Group, Inc. | 132,781 | 5,364,352 |
| LendingTree, Inc. * | 21,849 | 6,775,156 |
| Live Oak Bancshares, Inc. | 73,876 | 1,325,335 |
| Luther Burbank Corp. | 48,087 | 502,990 |
| Mercantile Bank Corp. | 48,624 | 1,496,160 |
| Merchants Bancorp | 46,236 | 733,303 |
| Meridian Bancorp, Inc. | 156,300 | 2,732,124 |
| Meta Financial Group, Inc. | 80,778 | 2,496,848 |
| MGIC Investment Corp. | 1,048,441 | 13,262,779 |
| Midland States Bancorp, Inc. | 59,806 | 1,541,201 |
| Mr Cooper Group, Inc. * | 79,929 | 704,174 |
| National Bank Holdings Corp., Class A | 76,877 | 2,509,265 |
| NBT Bancorp, Inc. | 128,200 | 4,483,154 |
| Nicolet Bankshares, Inc. * | 21,380 | 1,355,064 |
| NMI Holdings, Inc., Class A * | 198,019 | 5,611,858 |
| Northfield Bancorp, Inc. | 138,180 | 2,144,554 |
| Northwest Bancshares, Inc. | 312,047 | 4,933,463 |
| OceanFirst Financial Corp. | 128,940 | 2,710,319 |
| Ocwen Financial Corp. * | 329,640 | 590,056 |
| OFG Bancorp | 127,135 | 2,608,810 |
| Old National Bancorp | 441,795 | 7,422,156 |
| Opus Bank | 63,359 | 1,315,333 |
| Origin Bancorp, Inc. | 15,210 | 487,328 |
| Oritani Financial Corp. | 112,767 | 1,931,699 |
| Pacific Premier Bancorp, Inc. | 132,134 | 3,892,668 |
| PacWest Bancorp | 349,874 | 11,923,706 |
| Park National Corp. | 42,938 | 3,867,855 |
| Peapack Gladstone Financial Corp. | 47,776 | 1,343,939 |
| People's Utah Bancorp | 48,820 | 1,293,730 |
| Peoples Bancorp, Inc. | 54,141 | 1,662,670 |
| Peoples Financial Services Corp. | 19,901 | 890,968 |
| Pinnacle Financial Partners, Inc. | 213,118 | 11,224,925 |
| Popular, Inc. | 284,354 | 14,948,490 |
| Preferred Bank | 40,719 | 2,034,321 |
| Prosperity Bancshares, Inc. | 195,452 | 12,688,744 |
| Provident Financial Services, Inc. | 180,032 | 4,286,562 |
| QCR Holdings, Inc. | 39,129 | 1,381,645 |
| Radian Group, Inc. | 608,952 | 13,731,868 |
| Renasant Corp. | 139,268 | 4,566,598 |
| Republic Bancorp, Inc., Class A | 30,054 | 1,275,792 |
| S&T Bancorp, Inc. | 100,766 | 3,448,213 |
| Sandy Spring Bancorp, Inc. | 104,218 | 3,489,219 |
| Seacoast Banking Corp. of Florida * | 152,105 | 3,550,131 |
| ServisFirst Bancshares, Inc. | 134,924 | 4,101,690 |
| Simmons First National Corp., Class A | 281,138 | 6,747,312 |
| South State Corp. | 104,407 | 7,682,267 |
| Southside Bancshares, Inc. | 92,790 | 3,055,575 |
| Sterling Bancorp | 617,171 | 11,769,451 |
| Sterling Bancorp, Inc. | 59,127 | 551,655 |
| Stock Yards Bancorp, Inc. | 63,812 | 2,316,376 |
| Synovus Financial Corp. | 463,088 | 16,458,148 |
| TCF Financial Corp. | 455,489 | 17,563,656 |
| Texas Capital Bancshares, Inc. * | 148,209 | 7,985,501 |
| TFS Financial Corp. | 155,419 | 2,721,387 |
| The Bancorp, Inc. * | 165,599 | 1,511,919 |
| The First of Long Island Corp. | 66,188 | 1,440,251 |
| Tompkins Financial Corp. | 36,313 | 2,872,358 |
| Towne Bank | 190,202 | 4,996,607 |
| TriCo Bancshares | 78,354 | 2,770,597 |
| TriState Capital Holdings, Inc. * | 69,081 | 1,364,350 |
| Triumph Bancorp, Inc. * | 71,476 | 2,143,565 |
| TrustCo Bank Corp. | 283,073 | 2,171,170 |
| Trustmark Corp. | 190,098 | 6,212,403 |
| UMB Financial Corp. | 130,311 | 8,120,982 |
| Umpqua Holdings Corp. | 649,807 | 10,208,468 |
| United Bankshares, Inc. | 299,671 | 11,051,866 |
| Security | Number of Shares | Value ($) |
| United Community Banks, Inc. | 231,778 | 6,121,257 |
| United Financial Bancorp, Inc. | 148,889 | 1,861,112 |
| Univest Financial Corp. | 86,191 | 2,181,494 |
| Valley National Bancorp | 978,286 | 10,281,786 |
| Veritex Holdings, Inc. | 134,506 | 3,174,342 |
| Walker & Dunlop, Inc. | 83,506 | 4,664,645 |
| Washington Federal, Inc. | 236,017 | 8,402,205 |
| Washington Trust Bancorp, Inc. | 43,499 | 2,018,354 |
| Waterstone Financial, Inc. | 81,507 | 1,352,201 |
| Webster Financial Corp. | 271,188 | 12,138,375 |
| WesBanco, Inc. | 161,381 | 5,522,458 |
| Westamerica Bancorp | 78,918 | 4,862,138 |
| Western Alliance Bancorp | 282,749 | 12,276,962 |
| Wintrust Financial Corp. | 166,997 | 10,492,421 |
| WSFS Financial Corp. | 156,564 | 6,453,568 |
| 810,952,984 | ||
| Capital Goods 9.6% | ||
| AAON, Inc. | 119,590 | 5,736,732 |
| AAR Corp. | 95,796 | 4,115,396 |
| Actuant Corp., Class A | 180,538 | 4,009,749 |
| Advanced Drainage Systems, Inc. | 122,062 | 3,831,526 |
| AECOM * | 462,830 | 16,421,208 |
| Aegion Corp. * | 91,778 | 1,811,698 |
| Aerojet Rocketdyne Holdings, Inc. * | 213,265 | 11,138,831 |
| AeroVironment, Inc. * | 62,400 | 3,215,472 |
| Air Lease Corp. | 304,087 | 12,631,774 |
| Aircastle Ltd. | 156,683 | 3,423,524 |
| Alamo Group, Inc. | 28,190 | 3,218,734 |
| Albany International Corp., Class A | 89,323 | 7,344,137 |
| Altra Industrial Motion Corp. | 188,318 | 4,894,385 |
| Ameresco, Inc., Class A * | 54,331 | 782,366 |
| American Woodmark Corp. * | 43,872 | 3,613,737 |
| Apogee Enterprises, Inc. | 77,849 | 2,874,964 |
| Applied Industrial Technologies, Inc. | 113,063 | 6,036,434 |
| Arcosa, Inc. | 141,631 | 4,601,591 |
| Argan, Inc. | 42,728 | 1,765,094 |
| Armstrong Flooring, Inc. * | 49,220 | 333,219 |
| Armstrong World Industries, Inc. | 144,116 | 13,758,755 |
| Astec Industries, Inc. | 66,105 | 1,824,498 |
| Astronics Corp. * | 71,855 | 1,976,731 |
| Atkore International Group, Inc. * | 136,514 | 3,960,271 |
| Axon Enterprise, Inc. * | 174,265 | 10,450,672 |
| AZZ, Inc. | 77,480 | 3,197,600 |
| Babcock & Wilcox Enterprises, Inc. *(a) | 99,677 | 366,811 |
| Barnes Group, Inc. | 138,803 | 6,225,315 |
| Beacon Roofing Supply, Inc. * | 202,215 | 6,446,614 |
| BMC Stock Holdings, Inc. * | 194,931 | 4,957,095 |
| Briggs & Stratton Corp. | 124,323 | 537,075 |
| Builders FirstSource, Inc. * | 338,547 | 6,584,739 |
| BWX Technologies, Inc. | 280,008 | 16,576,474 |
| CAI International, Inc. * | 46,216 | 978,855 |
| Chart Industries, Inc. * | 105,300 | 6,617,052 |
| CIRCOR International, Inc. * | 58,358 | 2,005,764 |
| Colfax Corp. * | 279,010 | 7,589,072 |
| Columbus McKinnon Corp. | 60,804 | 1,968,225 |
| Comfort Systems USA, Inc. | 108,125 | 4,180,112 |
| Continental Building Products, Inc. * | 101,588 | 2,553,922 |
| Cornerstone Building Brands, Inc. * | 129,077 | 605,371 |
| Crane Co. | 150,001 | 11,436,076 |
| CSW Industrials, Inc. | 43,989 | 3,000,490 |
| Cubic Corp. | 83,980 | 5,817,295 |
| Curtiss-Wright Corp. | 125,836 | 15,432,527 |
| Douglas Dynamics, Inc. | 66,488 | 2,776,539 |
| DXP Enterprises, Inc. * | 47,802 | 1,551,175 |
| Dycom Industries, Inc. * | 92,751 | 4,127,419 |
| EMCOR Group, Inc. | 165,080 | 14,434,595 |
| Security | Number of Shares | Value ($) |
| Encore Wire Corp. | 61,067 | 3,297,007 |
| Energy Recovery, Inc. * | 91,083 | 880,773 |
| EnerSys | 126,451 | 7,081,256 |
| EnPro Industries, Inc. | 60,785 | 3,785,690 |
| ESCO Technologies, Inc. | 76,217 | 5,802,400 |
| Evoqua Water Technologies Corp. * | 170,313 | 2,633,039 |
| Federal Signal Corp. | 176,593 | 5,246,578 |
| Foundation Building Materials, Inc. * | 51,528 | 882,675 |
| Franklin Electric Co., Inc. | 112,909 | 5,176,878 |
| Gardner Denver Holdings, Inc. * | 380,883 | 10,923,724 |
| Gates Industrial Corp. plc * | 134,687 | 1,171,777 |
| GATX Corp. | 106,077 | 7,873,035 |
| Generac Holdings, Inc. * | 183,532 | 14,313,661 |
| Gibraltar Industries, Inc. * | 95,050 | 3,827,663 |
| GMS, Inc. * | 94,626 | 2,787,682 |
| Graham Corp. | 28,806 | 530,318 |
| Granite Construction, Inc. | 138,169 | 3,929,526 |
| Great Lakes Dredge & Dock Corp. * | 187,095 | 2,028,110 |
| Griffon Corp. | 103,207 | 1,800,962 |
| H&E Equipment Services, Inc. | 93,141 | 2,262,395 |
| Harsco Corp. * | 234,624 | 4,199,770 |
| Helios Technologies, Inc. | 84,456 | 3,613,872 |
| Herc Holdings, Inc. * | 71,108 | 2,935,338 |
| Hexcel Corp. | 249,533 | 20,998,202 |
| Hillenbrand, Inc. | 185,030 | 5,077,223 |
| Hyster-Yale Materials Handling, Inc. | 28,642 | 1,562,421 |
| Insteel Industries, Inc. | 52,902 | 989,267 |
| ITT, Inc. | 258,430 | 14,709,836 |
| JELD-WEN Holding, Inc. * | 194,647 | 3,359,607 |
| John Bean Technologies Corp. | 93,241 | 9,540,419 |
| Kadant, Inc. | 33,166 | 2,729,230 |
| Kaman Corp. | 81,873 | 4,780,564 |
| Kennametal, Inc. | 241,475 | 7,217,688 |
| Kratos Defense & Security Solutions, Inc. * | 260,766 | 5,207,497 |
| L.B. Foster Co., Class A * | 28,800 | 573,408 |
| Lindsay Corp.(a) | 31,417 | 2,772,864 |
| Lydall, Inc. * | 51,881 | 1,043,327 |
| Masonite International Corp. * | 74,800 | 3,993,572 |
| MasTec, Inc. * | 182,119 | 11,449,822 |
| Mercury Systems, Inc. * | 163,019 | 13,959,317 |
| Meritor, Inc. * | 244,654 | 4,115,080 |
| Milacron Holdings Corp. * | 206,275 | 3,269,459 |
| Moog, Inc., Class A | 95,879 | 7,790,169 |
| MRC Global, Inc. * | 243,268 | 3,057,879 |
| MSC Industrial Direct Co., Inc., Class A | 132,586 | 8,965,465 |
| Mueller Industries, Inc. | 165,815 | 4,370,883 |
| Mueller Water Products, Inc., Class A | 466,965 | 4,884,454 |
| MYR Group, Inc. * | 48,208 | 1,382,123 |
| National Presto Industries, Inc. | 14,641 | 1,254,880 |
| Navistar International Corp. * | 191,532 | 4,405,236 |
| NN, Inc. | 121,739 | 781,564 |
| NOW, Inc. * | 318,474 | 3,786,656 |
| NV5 Global, Inc. * | 27,615 | 1,704,674 |
| nVent Electric plc | 467,776 | 9,477,142 |
| Omega Flex, Inc. | 8,541 | 719,152 |
| Oshkosh Corp. | 205,669 | 14,452,361 |
| Park Aerospace Corp. | 56,680 | 957,892 |
| Park-Ohio Holdings Corp. | 25,521 | 693,916 |
| Parsons Corp. * | 55,387 | 1,884,266 |
| Patrick Industries, Inc. * | 66,267 | 2,394,889 |
| PGT Innovations, Inc. * | 172,798 | 2,764,768 |
| Plug Power, Inc. *(a) | 740,621 | 1,607,148 |
| Powell Industries, Inc. | 25,495 | 925,978 |
| Preformed Line Products Co. | 7,947 | 407,284 |
| Primoris Services Corp. | 122,174 | 2,387,280 |
| Proto Labs, Inc. * | 79,232 | 7,506,440 |
| Quanex Building Products Corp. | 96,339 | 1,658,958 |
| Security | Number of Shares | Value ($) |
| Raven Industries, Inc. | 106,224 | 3,098,554 |
| RBC Bearings, Inc. * | 73,102 | 11,661,962 |
| Regal Beloit Corp. | 125,637 | 8,907,663 |
| Resideo Technologies, Inc. * | 359,385 | 4,952,325 |
| REV Group, Inc. | 85,603 | 1,103,423 |
| Rexnord Corp. * | 309,357 | 8,098,966 |
| Rush Enterprises, Inc., Class A | 83,240 | 3,005,796 |
| Rush Enterprises, Inc., Class B | 13,764 | 511,746 |
| Simpson Manufacturing Co., Inc. | 117,682 | 7,555,184 |
| SiteOne Landscape Supply, Inc. * | 120,895 | 9,453,989 |
| SPX Corp. * | 128,908 | 4,892,059 |
| SPX FLOW, Inc. * | 124,639 | 4,201,581 |
| Standex International Corp. | 36,990 | 2,543,063 |
| Sunrun, Inc. * | 226,078 | 3,465,776 |
| Systemax, Inc. | 42,484 | 852,654 |
| Tennant Co. | 53,717 | 3,673,706 |
| Terex Corp. | 183,667 | 4,560,452 |
| The Gorman-Rupp Co. | 56,100 | 1,675,707 |
| The Greenbrier Cos., Inc. | 94,792 | 2,207,706 |
| The Manitowoc Co., Inc. * | 103,898 | 1,298,725 |
| The Timken Co. | 201,043 | 8,077,908 |
| Thermon Group Holdings, Inc. * | 95,411 | 2,075,189 |
| Titan International, Inc. | 149,272 | 388,107 |
| Titan Machinery, Inc. * | 54,389 | 819,098 |
| TPI Composites, Inc. * | 53,961 | 951,872 |
| Trex Co., Inc. * | 172,193 | 14,727,667 |
| TriMas Corp. * | 134,072 | 3,939,035 |
| Triton International Ltd. | 160,732 | 5,167,534 |
| Triumph Group, Inc. | 147,546 | 3,066,006 |
| Tutor Perini Corp. * | 114,821 | 1,147,062 |
| Univar, Inc. * | 389,814 | 7,542,901 |
| Universal Forest Products, Inc. | 180,877 | 7,072,291 |
| Valmont Industries, Inc. | 64,430 | 8,730,265 |
| Veritiv Corp. * | 37,108 | 614,508 |
| Vicor Corp. * | 46,950 | 1,431,506 |
| Vivint Solar, Inc. * | 122,626 | 988,366 |
| Wabash National Corp. | 163,922 | 2,235,896 |
| Watsco, Inc. | 94,843 | 15,511,573 |
| Watts Water Technologies, Inc., Class A | 81,283 | 7,447,961 |
| Welbilt, Inc. * | 385,382 | 6,065,913 |
| Wesco Aircraft Holdings, Inc. * | 189,821 | 2,088,031 |
| WESCO International, Inc. * | 124,813 | 5,626,570 |
| WillScot Corp. * | 118,892 | 1,658,543 |
| Woodward, Inc. | 164,434 | 17,734,207 |
| 781,121,145 | ||
| Commercial & Professional Services 3.1% | ||
| ABM Industries, Inc. | 194,665 | 7,253,218 |
| Acacia Research Corp. * | 146,779 | 383,093 |
| ACCO Brands Corp. | 297,773 | 2,760,356 |
| Advanced Disposal Services, Inc. * | 212,168 | 6,878,487 |
| ASGN, Inc. * | 155,579 | 9,719,020 |
| Barrett Business Services, Inc. | 21,800 | 1,899,434 |
| Brady Corp., Class A | 145,192 | 6,854,514 |
| BrightView Holdings, Inc. * | 65,349 | 1,197,847 |
| Casella Waste Systems, Inc., Class A * | 127,164 | 5,785,962 |
| CBIZ, Inc. * | 160,918 | 3,594,908 |
| Clean Harbors, Inc. * | 149,111 | 10,967,114 |
| Covanta Holding Corp. | 345,112 | 5,935,926 |
| Deluxe Corp. | 129,007 | 5,944,643 |
| Ennis, Inc. | 77,049 | 1,549,455 |
| Exponent, Inc. | 153,003 | 10,846,383 |
| Forrester Research, Inc. | 30,519 | 1,064,198 |
| Franklin Covey Co. * | 36,280 | 1,334,741 |
| FTI Consulting, Inc. * | 111,819 | 12,092,107 |
| GP Strategies Corp. * | 48,431 | 623,791 |
| Healthcare Services Group, Inc. | 217,065 | 4,894,816 |
| Security | Number of Shares | Value ($) |
| Heidrick & Struggles International, Inc. | 56,894 | 1,510,536 |
| Heritage-Crystal Clean, Inc. * | 39,901 | 977,574 |
| Herman Miller, Inc. | 172,419 | 7,289,875 |
| HNI Corp. | 127,036 | 3,962,253 |
| Huron Consulting Group, Inc. * | 67,765 | 4,147,896 |
| ICF International, Inc. | 55,177 | 4,671,285 |
| InnerWorkings, Inc. * | 122,714 | 520,307 |
| Insperity, Inc. | 110,538 | 10,949,894 |
| Interface, Inc. | 176,245 | 1,947,507 |
| Kelly Services, Inc., Class A | 91,437 | 2,213,690 |
| Kforce, Inc. | 67,076 | 2,182,653 |
| Kimball International, Inc., Class B | 106,187 | 1,863,582 |
| Knoll, Inc. | 147,413 | 3,399,344 |
| Korn Ferry | 165,262 | 6,458,439 |
| LSC Communications, Inc. | 97,850 | 127,205 |
| Matthews International Corp., Class A | 92,962 | 2,724,716 |
| McGrath RentCorp | 70,945 | 4,542,608 |
| Mistras Group, Inc. * | 50,681 | 739,943 |
| Mobile Mini, Inc. | 132,842 | 4,152,641 |
| MSA Safety, Inc. | 103,272 | 10,908,621 |
| Navigant Consulting, Inc. | 115,318 | 3,213,913 |
| NL Industries, Inc. * | 24,278 | 89,586 |
| PICO Holdings, Inc. * | 59,519 | 573,168 |
| Pitney Bowes, Inc. | 499,262 | 1,777,373 |
| Quad/Graphics, Inc. | 87,354 | 785,312 |
| R.R. Donnelley & Sons Co. | 206,509 | 499,752 |
| Resources Connection, Inc. | 87,989 | 1,456,218 |
| SP Plus Corp. * | 66,530 | 2,295,950 |
| Steelcase, Inc., Class A | 261,252 | 4,057,244 |
| Team, Inc. * | 88,114 | 1,452,119 |
| Tetra Tech, Inc. | 161,564 | 13,106,072 |
| The Brink's Co. | 146,821 | 11,048,280 |
| TriNet Group, Inc. * | 127,931 | 8,588,008 |
| TrueBlue, Inc. * | 117,225 | 2,275,337 |
| UniFirst Corp. | 45,289 | 8,872,568 |
| Upwork, Inc. * | 179,571 | 2,596,597 |
| US Ecology, Inc. | 65,085 | 3,942,198 |
| Viad Corp. | 59,435 | 3,841,284 |
| VSE Corp. | 25,155 | 800,935 |
| 248,142,496 | ||
| Consumer Durables & Apparel 3.0% | ||
| Acushnet Holdings Corp. | 100,352 | 2,606,141 |
| American Outdoor Brands Corp. * | 160,757 | 966,150 |
| Beazer Homes USA, Inc. * | 94,550 | 1,184,712 |
| Brunswick Corp. | 255,544 | 11,908,350 |
| Callaway Golf Co. | 259,000 | 4,599,840 |
| Cavco Industries, Inc. * | 25,332 | 4,647,662 |
| Century Communities, Inc. * | 81,196 | 2,288,103 |
| Columbia Sportswear Co. | 86,046 | 8,070,254 |
| Crocs, Inc. * | 191,619 | 4,273,104 |
| Deckers Outdoor Corp. * | 85,802 | 12,651,505 |
| Ethan Allen Interiors, Inc. | 74,432 | 1,280,230 |
| Fossil Group, Inc. * | 134,840 | 1,725,952 |
| G-III Apparel Group Ltd. * | 121,818 | 2,498,487 |
| GoPro, Inc., Class A * | 357,766 | 1,384,554 |
| Helen of Troy Ltd. * | 73,726 | 11,317,678 |
| Hovnanian Enterprises, Inc., Class A *(a) | 14,772 | 121,721 |
| Installed Building Products, Inc. * | 62,468 | 3,555,054 |
| iRobot Corp. * | 82,778 | 5,116,508 |
| Johnson Outdoors, Inc., Class A | 17,126 | 959,056 |
| KB Home | 247,637 | 6,956,123 |
| Kontoor Brands, Inc. * | 136,097 | 4,659,961 |
| La-Z-Boy, Inc. | 136,707 | 4,356,852 |
| Legacy Housing Corp. * | 12,297 | 181,627 |
| Levi Strauss & Co., Class A * | 123,594 | 2,088,739 |
| LGI Homes, Inc. * | 55,358 | 4,512,231 |
| Security | Number of Shares | Value ($) |
| Libbey, Inc. * | 64,911 | 109,700 |
| M.D.C Holdings, Inc. | 144,278 | 5,579,230 |
| M/I Homes, Inc. * | 81,942 | 2,961,384 |
| Malibu Boats, Inc., Class A * | 62,523 | 1,739,390 |
| Marine Products Corp. | 22,252 | 336,673 |
| Meritage Homes Corp. * | 105,389 | 6,886,117 |
| Movado Group, Inc. | 49,248 | 1,059,817 |
| Nautilus, Inc. * | 88,700 | 123,293 |
| Oxford Industries, Inc. | 49,731 | 3,470,229 |
| Roku, Inc. * | 240,998 | 36,477,457 |
| Skechers U.S.A., Inc., Class A * | 394,969 | 12,504,719 |
| Skyline Champion Corp. * | 145,793 | 4,082,204 |
| Sonos, Inc. * | 43,900 | 637,428 |
| Steven Madden Ltd. | 228,777 | 7,599,972 |
| Sturm Ruger & Co., Inc. | 51,001 | 2,091,551 |
| Taylor Morrison Home Corp., Class A * | 314,579 | 7,505,855 |
| Tempur Sealy International, Inc. * | 135,514 | 10,450,840 |
| TopBuild Corp. * | 100,995 | 9,354,157 |
| TRI Pointe Group, Inc. * | 417,201 | 5,840,814 |
| Tupperware Brands Corp. | 144,823 | 1,884,147 |
| Unifi, Inc. * | 42,491 | 817,527 |
| Universal Electronics, Inc. * | 40,551 | 1,830,878 |
| Vera Bradley, Inc. * | 62,451 | 661,356 |
| Vista Outdoor, Inc. * | 167,196 | 934,626 |
| William Lyon Homes, Class A * | 96,595 | 1,706,834 |
| Wolverine World Wide, Inc. | 259,999 | 6,746,974 |
| YETI Holdings, Inc. *(a) | 90,258 | 2,549,788 |
| 239,853,554 | ||
| Consumer Services 4.0% | ||
| Adtalem Global Education, Inc. * | 166,959 | 7,132,489 |
| American Public Education, Inc. * | 48,712 | 1,180,292 |
| BBX Capital Corp. | 189,339 | 785,757 |
| Biglari Holdings, Inc., Class A * | 236 | 103,783 |
| Biglari Holdings, Inc., Class B * | 3,033 | 266,024 |
| BJ's Restaurants, Inc. | 60,744 | 2,213,511 |
| Bloomin' Brands, Inc. | 255,275 | 4,605,161 |
| Bluegreen Vacations Corp. | 21,666 | 204,960 |
| Boyd Gaming Corp. | 234,056 | 5,626,706 |
| Brinker International, Inc. | 109,850 | 4,174,300 |
| Career Education Corp. * | 204,857 | 4,201,617 |
| Carriage Services, Inc. | 48,933 | 1,040,805 |
| Carrols Restaurant Group, Inc. * | 100,784 | 735,723 |
| Chegg, Inc. * | 313,930 | 12,444,185 |
| Choice Hotels International, Inc. | 99,600 | 9,061,608 |
| Churchill Downs, Inc. | 104,192 | 12,842,706 |
| Chuy's Holdings, Inc. * | 49,688 | 1,260,585 |
| Cracker Barrel Old Country Store, Inc. | 70,829 | 11,715,117 |
| Dave & Buster's Entertainment, Inc. | 106,659 | 4,591,670 |
| Del Frisco's Restaurant Group, Inc. * | 89,912 | 716,599 |
| Denny's Corp. * | 176,884 | 4,172,694 |
| Dine Brands Global, Inc. | 51,362 | 3,623,589 |
| Drive Shack, Inc. * | 175,502 | 826,614 |
| El Pollo Loco Holdings, Inc. * | 66,012 | 673,983 |
| Eldorado Resorts, Inc. * | 190,661 | 7,342,355 |
| Empire Resorts, Inc. *(a) | 10,499 | 101,630 |
| Everi Holdings, Inc. * | 208,375 | 1,862,873 |
| Extended Stay America, Inc. | 555,614 | 7,806,377 |
| Fiesta Restaurant Group, Inc. * | 68,764 | 594,121 |
| frontdoor, Inc. * | 249,247 | 12,796,341 |
| Golden Entertainment, Inc. * | 56,101 | 795,512 |
| Graham Holdings Co., Class B | 12,816 | 9,023,233 |
| Grand Canyon Education, Inc. * | 141,931 | 17,826,534 |
| Hilton Grand Vacations, Inc. * | 252,355 | 8,522,028 |
| Houghton Mifflin Harcourt Co. * | 298,399 | 1,775,474 |
| Hyatt Hotels Corp., Class A | 112,063 | 8,085,346 |
| International Speedway Corp., Class A | 69,651 | 3,135,688 |
| Security | Number of Shares | Value ($) |
| Jack in the Box, Inc. | 75,571 | 6,447,718 |
| K12, Inc. * | 109,969 | 2,897,683 |
| Laureate Education, Inc., Class A * | 316,806 | 5,797,550 |
| Lindblad Expeditions Holdings, Inc. * | 79,253 | 1,478,861 |
| Marriott Vacations Worldwide Corp. | 114,902 | 11,328,188 |
| Monarch Casino & Resort, Inc. * | 35,623 | 1,580,949 |
| Noodles & Co. * | 118,186 | 681,933 |
| OneSpaWorld Holdings Ltd. * | 96,867 | 1,520,812 |
| Papa John's International, Inc. | 65,915 | 3,279,930 |
| Penn National Gaming, Inc. * | 314,548 | 6,029,885 |
| Planet Fitness, Inc., Class A * | 248,225 | 17,527,167 |
| Playa Hotels & Resorts N.V. * | 160,723 | 1,300,249 |
| PlayAGS, Inc. * | 79,377 | 773,132 |
| Potbelly Corp. * | 66,599 | 308,353 |
| Red Robin Gourmet Burgers, Inc. * | 38,178 | 1,278,581 |
| Red Rock Resorts, Inc., Class A | 207,774 | 4,332,088 |
| Regis Corp. * | 86,478 | 1,398,349 |
| Ruth's Hospitality Group, Inc. | 84,369 | 1,640,977 |
| Scientific Games Corp., Class A * | 165,423 | 3,057,017 |
| SeaWorld Entertainment, Inc. * | 117,913 | 3,420,656 |
| Shake Shack, Inc., Class A * | 76,861 | 7,621,537 |
| Six Flags Entertainment Corp. | 211,050 | 12,487,829 |
| Sotheby's * | 97,761 | 5,645,698 |
| Speedway Motorsports, Inc. | 34,016 | 671,816 |
| Strategic Education, Inc. | 64,351 | 10,890,120 |
| Target Hospitality Corp. * | 95,789 | 584,313 |
| Texas Roadhouse, Inc. | 196,967 | 10,135,922 |
| The Cheesecake Factory, Inc. | 121,898 | 4,630,905 |
| The Habit Restaurants, Inc., Class A * | 60,162 | 527,019 |
| The Wendy's Co. | 534,677 | 11,762,894 |
| Weight Watchers International, Inc. * | 113,769 | 3,411,932 |
| Wingstop, Inc. | 86,084 | 8,623,034 |
| Zovio, Inc. * | 89,240 | 203,467 |
| 327,144,554 | ||
| Diversified Financials 4.2% | ||
| AG Mortgage Investment Trust, Inc. | 96,826 | 1,451,422 |
| Anworth Mortgage Asset Corp. | 288,855 | 895,450 |
| Apollo Commercial Real Estate Finance, Inc. | 404,010 | 7,494,385 |
| Arbor Realty Trust, Inc.(a) | 245,635 | 3,082,719 |
| Ares Management Corp., Class A | 199,792 | 5,813,947 |
| Arlington Asset Investment Corp., Class A | 108,516 | 536,069 |
| ARMOUR Residential REIT, Inc. | 154,432 | 2,535,773 |
| Artisan Partners Asset Management, Inc., Class A | 154,309 | 4,110,792 |
| BGC Partners, Inc., Class A | 794,739 | 4,053,169 |
| Blackstone Mortgage Trust, Inc., Class A | 394,597 | 13,731,976 |
| Blucora, Inc. * | 141,393 | 3,192,654 |
| Cannae Holdings, Inc. * | 198,785 | 5,530,199 |
| Capstead Mortgage Corp. | 278,061 | 2,021,503 |
| Chimera Investment Corp. | 551,822 | 10,523,246 |
| Cohen & Steers, Inc. | 64,221 | 3,463,439 |
| Colony Credit Real Estate, Inc. | 244,755 | 3,066,780 |
| Cowen, Inc., Class A * | 81,341 | 1,269,733 |
| Curo Group Holdings Corp. * | 38,108 | 519,031 |
| Diamond Hill Investment Group, Inc. | 9,633 | 1,299,492 |
| Donnelley Financial Solutions, Inc. * | 99,297 | 1,055,527 |
| Dynex Capital, Inc. | 70,960 | 1,001,955 |
| Ellington Financial, Inc. | 92,901 | 1,622,980 |
| Encore Capital Group, Inc. * | 75,108 | 2,771,485 |
| Enova International, Inc. * | 99,159 | 2,369,900 |
| Evercore, Inc., Class A | 120,910 | 9,643,782 |
| Exantas Capital Corp. | 92,832 | 1,040,647 |
| EZCORP, Inc., Class A * | 156,220 | 1,229,451 |
| Federated Investors, Inc., Class B | 283,419 | 9,080,745 |
| Security | Number of Shares | Value ($) |
| FGL Holdings | 513,147 | 4,094,913 |
| FirstCash, Inc. | 127,082 | 12,546,806 |
| Focus Financial Partners, Inc., Class A * | 63,009 | 1,292,945 |
| GAMCO Investors, Inc., Class A | 15,091 | 266,658 |
| Granite Point Mortgage Trust, Inc. | 157,469 | 2,880,108 |
| Green Dot Corp., Class A * | 140,110 | 4,284,564 |
| Greenhill & Co., Inc. | 53,436 | 750,241 |
| Hamilton Lane, Inc., Class A | 54,295 | 3,373,891 |
| Houlihan Lokey, Inc. | 108,140 | 4,777,625 |
| Interactive Brokers Group, Inc., Class A | 220,879 | 10,425,489 |
| INTL FCStone, Inc. * | 47,814 | 1,874,787 |
| Invesco Mortgage Capital, Inc. | 418,971 | 6,297,134 |
| KKR Real Estate Finance Trust, Inc. | 82,860 | 1,566,883 |
| Ladder Capital Corp., Class A | 262,265 | 4,400,807 |
| Ladenburg Thalmann Financial Services, Inc. | 349,302 | 684,632 |
| Legg Mason, Inc. | 254,115 | 9,348,891 |
| LendingClub Corp. * | 252,831 | 3,309,558 |
| LPL Financial Holdings, Inc. | 245,151 | 18,374,067 |
| MFA Financial, Inc. | 1,327,491 | 9,518,110 |
| Moelis & Co., Class A | 145,177 | 4,867,785 |
| Morningstar, Inc. | 54,092 | 8,740,185 |
| Navient Corp. | 623,927 | 7,948,830 |
| Nelnet, Inc., Class A | 61,716 | 4,138,058 |
| New Residential Investment Corp. | 1,221,370 | 17,184,676 |
| New York Mortgage Trust, Inc. | 671,546 | 4,130,008 |
| On Deck Capital, Inc. * | 149,008 | 484,276 |
| OneMain Holdings, Inc. | 220,735 | 7,913,350 |
| PennyMac Mortgage Investment Trust | 247,981 | 5,396,067 |
| Piper Jaffray Cos. | 41,615 | 3,027,907 |
| PJT Partners, Inc., Class A | 59,631 | 2,481,246 |
| PRA Group, Inc. * | 133,207 | 4,547,687 |
| Pzena Investment Management, Inc., Class A | 51,219 | 416,410 |
| Redwood Trust, Inc. | 283,806 | 4,711,180 |
| Safeguard Scientifics, Inc. * | 60,553 | 724,214 |
| SLM Corp. | 1,273,333 | 10,746,930 |
| Stifel Financial Corp. | 208,142 | 11,118,946 |
| TPG RE Finance Trust, Inc. | 162,056 | 3,145,507 |
| Tradeweb Markets, Inc., Class A | 134,715 | 5,737,512 |
| Two Harbors Investment Corp. | 803,670 | 10,150,352 |
| Virtu Financial, Inc., Class A | 175,963 | 3,308,104 |
| Virtus Investment Partners, Inc. | 20,413 | 2,177,863 |
| Waddell & Reed Financial, Inc., Class A | 219,764 | 3,553,584 |
| Western Asset Mortgage Capital Corp. | 153,961 | 1,447,233 |
| Westwood Holdings Group, Inc. | 23,837 | 654,326 |
| WisdomTree Investments, Inc. | 344,859 | 1,658,772 |
| World Acceptance Corp. * | 18,533 | 2,463,036 |
| 337,350,404 | ||
| Energy 2.4% | ||
| Alta Mesa Resources, Inc., Class A * | 351,899 | 33,958 |
| Altus Midstream Co., Class A * | 171,576 | 396,341 |
| Apergy Corp. * | 228,365 | 5,932,923 |
| Arch Coal, Inc., Class A(a) | 49,211 | 3,767,594 |
| Archrock, Inc. | 375,127 | 3,642,483 |
| Berry Petroleum Corp. | 54,805 | 437,892 |
| Bonanza Creek Energy, Inc. * | 54,809 | 1,236,491 |
| Brigham Minerals, Inc., Class A | 46,952 | 938,570 |
| C&J Energy Services, Inc. * | 178,985 | 1,711,097 |
| Cactus, Inc., Class A * | 136,922 | 3,487,403 |
| California Resources Corp. * | 145,276 | 1,422,252 |
| Callon Petroleum Co. * | 672,722 | 2,764,887 |
| CARBO Ceramics, Inc. *(a) | 64,141 | 105,833 |
| Carrizo Oil & Gas, Inc. * | 254,297 | 2,108,122 |
| Centennial Resource Development, Inc., Class A * | 563,026 | 2,713,785 |
| Security | Number of Shares | Value ($) |
| Chesapeake Energy Corp. *(a) | 3,061,199 | 4,408,127 |
| Clean Energy Fuels Corp. * | 399,905 | 795,811 |
| CNX Resources Corp. * | 572,219 | 4,560,585 |
| CONSOL Energy, Inc. * | 80,442 | 1,348,208 |
| Contango Oil & Gas Co. * | 82,888 | 81,230 |
| Contura Energy, Inc. * | 14,122 | 406,714 |
| Covia Holdings Corp. * | 88,443 | 132,665 |
| CVR Energy, Inc. | 85,354 | 3,395,382 |
| Delek US Holdings, Inc. | 208,415 | 6,825,591 |
| Denbury Resources, Inc. * | 1,365,214 | 1,474,431 |
| Diamond Offshore Drilling, Inc. * | 194,032 | 1,259,268 |
| Dril-Quip, Inc. * | 107,097 | 4,910,397 |
| Era Group, Inc. * | 59,771 | 566,629 |
| Evolution Petroleum Corp. | 89,609 | 530,485 |
| Exterran Corp. * | 95,370 | 1,006,154 |
| Extraction Oil & Gas, Inc. *(a) | 226,508 | 912,827 |
| Falcon Minerals Corp. | 114,067 | 668,433 |
| Forum Energy Technologies, Inc. * | 238,884 | 336,826 |
| Frank's International N.V. * | 220,579 | 959,519 |
| FTS International, Inc. * | 96,127 | 241,279 |
| Geospace Technologies Corp. * | 39,878 | 488,107 |
| Green Plains, Inc. | 105,202 | 863,708 |
| Gulfport Energy Corp. * | 423,793 | 1,017,103 |
| Helix Energy Solutions Group, Inc. * | 409,302 | 2,963,347 |
| HighPoint Resources Corp. * | 330,615 | 386,820 |
| International Seaways, Inc. * | 86,682 | 1,492,664 |
| Isramco, Inc. * | 2,079 | 250,166 |
| Jagged Peak Energy, Inc. * | 180,367 | 1,244,532 |
| Keane Group, Inc. * | 127,469 | 675,586 |
| KLX Energy Services Holdings, Inc. * | 68,428 | 686,333 |
| Kosmos Energy Ltd. | 700,742 | 4,428,689 |
| Laredo Petroleum, Inc. * | 460,147 | 1,141,165 |
| Liberty Oilfield Services, Inc., Class A | 150,051 | 1,616,049 |
| Magnolia Oil & Gas Corp., Class A * | 299,717 | 3,060,111 |
| Mammoth Energy Services, Inc. | 36,702 | 133,595 |
| Matador Resources Co. * | 303,577 | 4,750,980 |
| Matrix Service Co. * | 78,738 | 1,564,524 |
| McDermott International, Inc. * | 530,962 | 2,506,141 |
| Montage Resources Corp. * | 17,631 | 52,540 |
| Nabors Industries Ltd. | 968,655 | 1,627,340 |
| NACCO Industries, Inc., Class A | 11,441 | 569,533 |
| Natural Gas Services Group, Inc. * | 36,404 | 392,435 |
| NCS Multistage Holdings, Inc. * | 39,428 | 85,164 |
| Newpark Resources, Inc. * | 267,666 | 1,769,272 |
| NextDecade Corp. * | 9,584 | 53,766 |
| Nine Energy Service, Inc. * | 30,158 | 165,266 |
| Noble Corp. plc * | 739,299 | 1,182,878 |
| Northern Oil & Gas, Inc. * | 628,757 | 1,156,913 |
| Oasis Petroleum, Inc. * | 792,004 | 2,471,053 |
| Oceaneering International, Inc. * | 289,621 | 3,753,488 |
| Oil States International, Inc. * | 176,714 | 2,436,886 |
| Overseas Shipholding Group, Inc., Class A * | 195,327 | 318,383 |
| Par Pacific Holdings, Inc. * | 87,928 | 1,911,555 |
| Patterson-UTI Energy, Inc. | 616,078 | 5,329,075 |
| PBF Energy, Inc., Class A | 353,092 | 8,368,280 |
| PDC Energy, Inc. * | 183,933 | 5,858,266 |
| Peabody Energy Corp. | 231,798 | 4,272,037 |
| Penn Virginia Corp. * | 40,239 | 1,146,812 |
| ProPetro Holding Corp. * | 217,565 | 2,317,067 |
| QEP Resources, Inc. | 696,650 | 2,480,074 |
| Range Resources Corp. | 610,291 | 2,172,636 |
| Renewable Energy Group, Inc. * | 111,218 | 1,353,523 |
| REX American Resources Corp. * | 16,757 | 1,150,871 |
| RigNet, Inc. * | 40,853 | 320,288 |
| Ring Energy, Inc. * | 177,655 | 259,376 |
| Roan Resources, Inc. *(a) | 102,656 | 116,001 |
| RPC, Inc. | 172,265 | 914,727 |
| Security | Number of Shares | Value ($) |
| SandRidge Energy, Inc. * | 87,237 | 408,269 |
| SEACOR Holdings, Inc. * | 51,750 | 2,430,698 |
| SEACOR Marine Holdings, Inc. * | 59,182 | 771,141 |
| Select Energy Services, Inc., Class A * | 173,247 | 1,413,696 |
| SemGroup Corp., Class A | 192,976 | 1,705,908 |
| SM Energy Co. | 302,206 | 2,864,913 |
| Smart Sand, Inc. *(a) | 63,452 | 150,381 |
| Southwestern Energy Co. * | 1,583,743 | 2,502,314 |
| SRC Energy, Inc. * | 712,046 | 3,574,471 |
| Superior Energy Services, Inc. * | 463,134 | 155,057 |
| Talos Energy, Inc. * | 62,652 | 1,192,894 |
| Tellurian, Inc. *(a) | 274,410 | 1,791,897 |
| TETRA Technologies, Inc. * | 368,635 | 611,934 |
| Tidewater, Inc. * | 109,746 | 1,729,597 |
| Transocean Ltd. * | 1,498,361 | 6,817,543 |
| U.S. Well Services, Inc. * | 65,910 | 197,730 |
| Unit Corp. * | 162,031 | 490,954 |
| US Silica Holdings, Inc. | 215,185 | 2,188,431 |
| Valaris plc *(a) | 574,767 | 2,678,414 |
| W&T Offshore, Inc. * | 275,486 | 1,206,629 |
| Whiting Petroleum Corp. * | 267,647 | 1,774,500 |
| World Fuel Services Corp. | 198,282 | 7,614,029 |
| 193,066,717 | ||
| Food & Staples Retailing 0.8% | ||
| BJ's Wholesale Club Holdings, Inc. * | 358,461 | 9,413,186 |
| Casey's General Stores, Inc. | 107,696 | 18,076,774 |
| Ingles Markets, Inc., Class A | 41,259 | 1,604,150 |
| Natural Grocers by Vitamin Cottage, Inc. * | 22,907 | 216,242 |
| Performance Food Group Co. * | 309,543 | 14,483,517 |
| PriceSmart, Inc. | 67,013 | 4,049,596 |
| Rite Aid Corp. *(a) | 160,075 | 1,034,084 |
| SpartanNash Co. | 110,069 | 1,185,443 |
| Sprouts Farmers Market, Inc. * | 345,465 | 6,201,097 |
| The Andersons, Inc. | 77,661 | 1,779,990 |
| The Chefs' Warehouse, Inc. * | 67,453 | 2,602,337 |
| United Natural Foods, Inc. * | 156,059 | 1,254,714 |
| Village Super Market, Inc., Class A | 23,636 | 590,191 |
| Weis Markets, Inc. | 47,880 | 1,830,452 |
| 64,321,773 | ||
| Food, Beverage & Tobacco 1.6% | ||
| Alico, Inc. | 6,456 | 192,712 |
| B&G Foods, Inc.(a) | 191,405 | 3,240,487 |
| Beyond Meat, Inc. *(a) | 29,988 | 5,026,888 |
| Cal-Maine Foods, Inc. | 88,700 | 3,595,898 |
| Calavo Growers, Inc. | 45,885 | 4,067,705 |
| Coca-Cola Consolidated, Inc. | 13,590 | 4,574,530 |
| Darling Ingredients, Inc. * | 485,563 | 9,031,472 |
| Dean Foods Co.(a) | 267,963 | 270,643 |
| Farmer Brothers Co. * | 30,749 | 373,293 |
| Flowers Foods, Inc. | 542,010 | 12,357,828 |
| Fresh Del Monte Produce, Inc. | 89,640 | 2,334,226 |
| Freshpet, Inc. * | 99,846 | 4,900,442 |
| Hostess Brands, Inc. * | 320,340 | 4,491,167 |
| J&J Snack Foods Corp. | 44,415 | 8,574,760 |
| John B Sanfilippo & Son, Inc. | 25,692 | 2,379,079 |
| Lancaster Colony Corp. | 57,213 | 8,347,377 |
| Landec Corp. * | 85,633 | 941,107 |
| Limoneira Co. | 43,353 | 787,290 |
| MGP Ingredients, Inc. | 38,230 | 1,841,539 |
| National Beverage Corp.(a) | 35,759 | 1,462,543 |
| Primo Water Corp. * | 99,346 | 1,215,001 |
| Sanderson Farms, Inc. | 57,121 | 8,546,444 |
| Seaboard Corp. | 785 | 3,242,191 |
| Security | Number of Shares | Value ($) |
| Seneca Foods Corp., Class A * | 22,524 | 618,959 |
| Simply Good Foods Co. * | 148,827 | 4,409,744 |
| The Boston Beer Co., Inc., Class A * | 25,738 | 11,284,054 |
| The Hain Celestial Group, Inc. * | 264,589 | 5,040,420 |
| Tootsie Roll Industries, Inc. | 55,081 | 2,020,371 |
| TreeHouse Foods, Inc. * | 165,477 | 8,381,410 |
| Universal Corp. | 73,215 | 3,665,143 |
| Vector Group Ltd. | 318,121 | 3,715,653 |
| 130,930,376 | ||
| Health Care Equipment & Services 6.6% | ||
| AAC Holdings, Inc. *(a) | 35,607 | 21,364 |
| Acadia Healthcare Co., Inc. * | 261,653 | 6,923,338 |
| Accuray, Inc. * | 260,724 | 698,740 |
| Addus HomeCare Corp. * | 29,811 | 2,622,772 |
| Allscripts Healthcare Solutions, Inc. * | 487,874 | 4,429,896 |
| Amedisys, Inc. * | 85,874 | 11,052,843 |
| American Renal Associates Holdings, Inc. * | 50,038 | 310,236 |
| AMN Healthcare Services, Inc. * | 137,620 | 8,037,008 |
| AngioDynamics, Inc. * | 108,507 | 1,993,274 |
| Antares Pharma, Inc. * | 442,542 | 1,433,836 |
| AtriCure, Inc. * | 104,024 | 2,849,217 |
| Atrion Corp. | 4,220 | 3,279,573 |
| Avanos Medical, Inc. * | 140,435 | 4,659,633 |
| AxoGen, Inc. * | 99,708 | 1,580,372 |
| Axonics Modulation Technologies, Inc. * | 24,636 | 819,640 |
| BioTelemetry, Inc. * | 98,854 | 3,919,561 |
| Brookdale Senior Living, Inc. * | 545,383 | 4,461,233 |
| Cantel Medical Corp. | 106,566 | 9,796,612 |
| Capital Senior Living Corp. * | 84,097 | 387,687 |
| Cardiovascular Systems, Inc. * | 102,100 | 4,944,703 |
| Castlight Health, Inc., Class B * | 219,137 | 308,983 |
| Cerus Corp. * | 402,375 | 2,160,754 |
| Chemed Corp. | 46,831 | 20,110,636 |
| Community Health Systems, Inc. * | 341,018 | 849,135 |
| Computer Programs & Systems, Inc. | 35,404 | 748,795 |
| CONMED Corp. | 76,582 | 7,717,168 |
| CorVel Corp. * | 26,525 | 2,234,201 |
| Covetrus, Inc. * | 281,331 | 3,738,889 |
| CryoLife, Inc. * | 100,845 | 2,702,646 |
| Diplomat Pharmacy, Inc. * | 170,003 | 987,717 |
| Endologix, Inc. * | 49,769 | 266,762 |
| Enzo Biochem, Inc. * | 128,821 | 418,668 |
| Evolent Health, Inc., Class A * | 218,690 | 1,502,400 |
| GenMark Diagnostics, Inc. * | 169,293 | 1,014,065 |
| Glaukos Corp. * | 99,764 | 6,415,823 |
| Globus Medical, Inc., Class A * | 225,307 | 11,506,428 |
| Guardant Health, Inc. * | 112,927 | 9,884,500 |
| Haemonetics Corp. * | 150,566 | 20,105,078 |
| Hanger, Inc. * | 108,948 | 2,056,938 |
| HealthEquity, Inc. * | 204,581 | 12,143,928 |
| HealthStream, Inc. * | 74,765 | 1,889,312 |
| Heska Corp. * | 20,571 | 1,443,878 |
| Hill-Rom Holdings, Inc. | 196,329 | 21,140,707 |
| HMS Holdings Corp. * | 255,484 | 9,332,831 |
| ICU Medical, Inc. * | 49,168 | 7,952,924 |
| Inogen, Inc. * | 52,467 | 2,432,895 |
| Inovalon Holdings, Inc., Class A * | 214,347 | 3,626,751 |
| Inspire Medical Systems, Inc. * | 36,972 | 2,569,924 |
| Insulet Corp. * | 175,378 | 27,038,026 |
| Integer Holdings Corp. * | 88,079 | 6,376,920 |
| Integra LifeSciences Holdings Corp. * | 208,907 | 12,538,598 |
| Invacare Corp. | 97,444 | 471,629 |
| iRhythm Technologies, Inc. * | 65,836 | 5,011,436 |
| Lantheus Holdings, Inc. * | 114,220 | 2,485,427 |
| LeMaitre Vascular, Inc. | 47,857 | 1,515,153 |
| Security | Number of Shares | Value ($) |
| LHC Group, Inc. * | 86,020 | 10,193,370 |
| LivaNova plc * | 141,729 | 11,002,422 |
| Magellan Health, Inc. * | 70,395 | 4,435,589 |
| Masimo Corp. * | 144,274 | 22,109,991 |
| Medidata Solutions, Inc. * | 183,097 | 16,768,023 |
| MEDNAX, Inc. * | 252,801 | 5,329,045 |
| Meridian Bioscience, Inc. | 128,231 | 1,183,572 |
| Merit Medical Systems, Inc. * | 161,457 | 5,615,474 |
| Mesa Laboratories, Inc. | 11,468 | 2,537,066 |
| National HealthCare Corp. | 28,142 | 2,273,874 |
| National Research Corp. | 32,600 | 2,087,378 |
| Natus Medical, Inc. * | 99,938 | 2,766,284 |
| Neogen Corp. * | 153,595 | 10,831,519 |
| Nevro Corp. * | 89,446 | 7,489,314 |
| NextGen Healthcare, Inc. * | 143,032 | 2,032,485 |
| NuVasive, Inc. * | 152,565 | 9,690,929 |
| Omnicell, Inc. * | 121,375 | 8,714,725 |
| Option Care Health, Inc. * | 392,659 | 1,374,307 |
| OraSure Technologies, Inc. * | 183,095 | 1,208,427 |
| Orthofix Medical, Inc. * | 55,679 | 2,830,720 |
| Owens & Minor, Inc. | 182,829 | 928,771 |
| Patterson Cos., Inc. | 242,446 | 4,053,697 |
| Penumbra, Inc. * | 91,940 | 13,381,867 |
| Premier, Inc., Class A * | 152,036 | 5,360,789 |
| Quidel Corp. * | 104,505 | 6,589,040 |
| R1 RCM, Inc. * | 287,888 | 3,356,774 |
| RadNet, Inc. * | 125,790 | 1,749,739 |
| SeaSpine Holdings Corp. * | 39,622 | 435,446 |
| Select Medical Holdings Corp. * | 317,065 | 5,142,794 |
| Senseonics Holdings, Inc. *(a) | 417,631 | 425,984 |
| Shockwave Medical, Inc. *(a) | 17,252 | 721,996 |
| SI-BONE, Inc. * | 23,734 | 461,389 |
| Silk Road Medical, Inc. * | 18,011 | 776,094 |
| STAAR Surgical Co. * | 83,797 | 2,523,128 |
| Surgery Partners, Inc. * | 53,038 | 341,565 |
| Surmodics, Inc. * | 39,029 | 1,836,705 |
| Tabula Rasa HealthCare, Inc. * | 53,472 | 3,037,210 |
| Tactile Systems Technology, Inc. * | 50,888 | 2,566,791 |
| Tandem Diabetes Care, Inc. * | 171,075 | 12,390,962 |
| Teladoc Health, Inc. * | 210,833 | 12,203,014 |
| Tenet Healthcare Corp. * | 245,837 | 5,322,371 |
| The Ensign Group, Inc. | 146,114 | 7,291,089 |
| The Providence Service Corp. * | 32,329 | 1,817,213 |
| Tivity Health, Inc. * | 141,328 | 2,580,649 |
| TransEnterix, Inc. *(a) | 559,253 | 512,108 |
| TransMedics Group, Inc. *(a) | 17,377 | 416,179 |
| Triple-S Management Corp., Class B * | 68,917 | 1,414,177 |
| US Physical Therapy, Inc. | 37,358 | 4,988,040 |
| Varex Imaging Corp. * | 111,889 | 2,948,275 |
| ViewRay, Inc. * | 170,341 | 671,144 |
| Vocera Communications, Inc. * | 92,858 | 2,131,091 |
| Wright Medical Group N.V. * | 345,664 | 7,207,094 |
| 532,979,162 | ||
| Household & Personal Products 0.7% | ||
| Avon Products, Inc. * | 1,298,790 | 5,649,737 |
| Central Garden & Pet Co. * | 30,680 | 810,566 |
| Central Garden & Pet Co., Class A * | 120,351 | 2,895,645 |
| Edgewell Personal Care Co. * | 158,387 | 4,409,494 |
| elf Beauty, Inc. * | 68,863 | 1,123,844 |
| Energizer Holdings, Inc. | 187,665 | 7,225,102 |
| Inter Parfums, Inc. | 50,517 | 3,247,738 |
| Medifast, Inc. | 34,844 | 3,483,006 |
| Natural Health Trends Corp. | 21,431 | 162,018 |
| Nu Skin Enterprises, Inc., Class A | 163,964 | 6,660,218 |
| Revlon, Inc., Class A *(a) | 23,185 | 383,248 |
| Spectrum Brands Holdings, Inc. | 122,570 | 6,847,986 |
| Security | Number of Shares | Value ($) |
| USANA Health Sciences, Inc. * | 38,959 | 2,648,043 |
| WD-40 Co. | 40,746 | 7,427,996 |
| 52,974,641 | ||
| Insurance 2.7% | ||
| Ambac Financial Group, Inc. * | 134,642 | 2,428,942 |
| American Equity Investment Life Holding Co. | 267,796 | 5,771,004 |
| American National Insurance Co. | 25,093 | 2,862,359 |
| AMERISAFE, Inc. | 56,447 | 3,877,909 |
| Argo Group International Holdings Ltd. | 100,506 | 6,605,254 |
| Assured Guaranty Ltd. | 298,989 | 12,721,982 |
| Citizens, Inc. *(a) | 143,839 | 903,309 |
| CNO Financial Group, Inc. | 468,742 | 6,787,384 |
| Crawford & Co., Class A | 49,185 | 474,635 |
| Crawford & Co., Class B | 28,887 | 250,161 |
| Donegal Group, Inc., Class A | 37,141 | 535,945 |
| eHealth, Inc. * | 55,731 | 4,642,950 |
| EMC Insurance Group, Inc. | 26,914 | 967,289 |
| Employers Holdings, Inc. | 93,860 | 4,048,182 |
| Enstar Group Ltd. * | 44,514 | 7,951,091 |
| FBL Financial Group, Inc., Class A | 29,081 | 1,577,063 |
| First American Financial Corp. | 329,494 | 19,258,924 |
| Genworth Financial, Inc., Class A * | 1,486,846 | 6,586,728 |
| Global Indemnity Ltd. | 12,111 | 311,858 |
| Greenlight Capital Re Ltd., Class A * | 79,597 | 731,496 |
| Health Insurance Innovations, Inc., Class A *(a) | 31,721 | 581,763 |
| Horace Mann Educators Corp. | 120,540 | 5,288,090 |
| James River Group Holdings Ltd. | 88,320 | 4,352,410 |
| Kemper Corp. | 183,847 | 12,865,613 |
| Kinsale Capital Group, Inc. | 56,776 | 5,577,107 |
| Maiden Holdings Ltd. | 202,433 | 97,168 |
| MBIA, Inc. * | 249,043 | 2,241,387 |
| Mercury General Corp. | 79,470 | 4,251,645 |
| National General Holdings Corp. | 189,831 | 4,476,215 |
| National Western Life Group, Inc., Class A | 6,606 | 1,703,159 |
| NI Holdings, Inc. * | 28,229 | 474,247 |
| Palomar Holdings, Inc. * | 17,182 | 584,703 |
| Primerica, Inc. | 124,540 | 14,841,432 |
| ProAssurance Corp. | 157,434 | 6,150,946 |
| RLI Corp. | 114,952 | 10,526,155 |
| Safety Insurance Group, Inc. | 43,103 | 4,156,853 |
| Selective Insurance Group, Inc. | 174,401 | 13,887,552 |
| State Auto Financial Corp. | 48,321 | 1,544,822 |
| Stewart Information Services Corp. | 69,526 | 2,490,421 |
| The Hanover Insurance Group, Inc. | 119,718 | 15,940,452 |
| Third Point Reinsurance Ltd. * | 219,298 | 2,065,787 |
| Trupanion, Inc. *(a) | 79,059 | 1,904,531 |
| United Fire Group, Inc. | 62,994 | 2,844,809 |
| United Insurance Holdings Corp. | 62,717 | 735,043 |
| Universal Insurance Holdings, Inc. | 93,305 | 2,332,625 |
| Watford Holdings Ltd. * | 10,570 | 245,224 |
| White Mountains Insurance Group Ltd. | 9,356 | 9,923,909 |
| 221,378,533 | ||
| Materials 4.4% | ||
| AdvanSix, Inc. * | 83,139 | 1,857,325 |
| AK Steel Holding Corp. * | 929,830 | 2,008,433 |
| Allegheny Technologies, Inc. * | 371,780 | 7,368,680 |
| Amcor plc * | 4,771,775 | 46,858,831 |
| American Vanguard Corp. | 78,698 | 1,115,151 |
| AptarGroup, Inc. | 185,733 | 22,700,287 |
| Balchem Corp. | 94,859 | 8,422,531 |
| Boise Cascade Co. | 113,715 | 3,570,651 |
| Security | Number of Shares | Value ($) |
| Cabot Corp. | 171,353 | 6,854,120 |
| Carpenter Technology Corp. | 138,843 | 6,753,324 |
| Century Aluminum Co. * | 149,110 | 821,596 |
| Chase Corp. | 21,176 | 2,122,259 |
| Clearwater Paper Corp. * | 48,248 | 772,933 |
| Cleveland-Cliffs, Inc.(a) | 834,644 | 6,627,073 |
| Coeur Mining, Inc. * | 647,953 | 3,544,303 |
| Commercial Metals Co. | 345,572 | 5,415,113 |
| Compass Minerals International, Inc. | 99,282 | 4,937,294 |
| Domtar Corp. | 184,958 | 6,094,366 |
| Eagle Materials, Inc. | 130,065 | 10,950,172 |
| Element Solutions, Inc. * | 694,566 | 6,480,301 |
| Ferro Corp. * | 240,149 | 2,447,118 |
| Forterra, Inc. * | 54,631 | 326,693 |
| FutureFuel Corp. | 75,977 | 819,032 |
| GCP Applied Technologies, Inc. * | 214,906 | 3,771,600 |
| Graphic Packaging Holding Co. | 869,086 | 12,002,078 |
| Greif, Inc., Class A | 77,056 | 2,711,601 |
| Greif, Inc., Class B | 15,494 | 644,705 |
| H.B. Fuller Co. | 149,200 | 6,357,412 |
| Hawkins, Inc. | 28,284 | 1,254,395 |
| Haynes International, Inc. | 36,664 | 1,095,154 |
| Hecla Mining Co. | 1,445,627 | 2,573,216 |
| Ingevity Corp. * | 123,294 | 9,391,304 |
| Innophos Holdings, Inc. | 59,215 | 1,663,349 |
| Innospec, Inc. | 71,778 | 5,970,494 |
| Kaiser Aluminum Corp. | 47,282 | 4,181,147 |
| Koppers Holdings, Inc. * | 62,195 | 1,648,790 |
| Kraton Corp. * | 94,971 | 2,606,004 |
| Kronos Worldwide, Inc. | 64,575 | 707,096 |
| Livent Corp. * | 427,730 | 2,630,540 |
| Loop Industries, Inc. *(a) | 39,982 | 565,745 |
| Louisiana-Pacific Corp. | 361,796 | 8,697,576 |
| LSB Industries, Inc. * | 59,569 | 278,187 |
| Materion Corp. | 60,333 | 3,549,994 |
| McEwen Mining, Inc. *(a) | 814,143 | 1,652,710 |
| Mercer International, Inc. | 127,683 | 1,537,303 |
| Minerals Technologies, Inc. | 103,165 | 4,972,553 |
| Myers Industries, Inc. | 103,647 | 1,744,379 |
| Neenah, Inc. | 50,072 | 3,193,592 |
| Olin Corp. | 486,089 | 8,253,791 |
| OMNOVA Solutions, Inc. * | 131,611 | 1,322,691 |
| Owens-Illinois, Inc. | 455,882 | 4,636,320 |
| P.H. Glatfelter Co. | 128,505 | 1,847,902 |
| PolyOne Corp. | 228,057 | 7,300,105 |
| PQ Group Holdings, Inc. * | 107,122 | 1,530,773 |
| Quaker Chemical Corp. | 37,885 | 6,018,411 |
| Ramaco Resources, Inc. * | 18,029 | 76,804 |
| Rayonier Advanced Materials, Inc. | 146,008 | 512,488 |
| Resolute Forest Products, Inc. | 268,044 | 1,147,228 |
| Schnitzer Steel Industries, Inc., Class A | 78,106 | 1,729,267 |
| Schweitzer-Mauduit International, Inc. | 90,473 | 3,034,464 |
| Sensient Technologies Corp. | 124,272 | 8,117,447 |
| Silgan Holdings, Inc. | 229,691 | 6,835,604 |
| Stepan Co. | 60,126 | 5,735,419 |
| Summit Materials, Inc., Class A * | 329,196 | 6,906,532 |
| SunCoke Energy, Inc. * | 262,760 | 1,639,622 |
| The Scotts Miracle-Gro Co. | 116,038 | 12,337,160 |
| TimkenSteel Corp. * | 116,495 | 608,104 |
| Tredegar Corp. | 75,165 | 1,299,603 |
| Trinseo S.A. | 119,619 | 4,197,431 |
| Tronox Holdings plc, Class A * | 258,053 | 1,917,334 |
| United States Lime & Minerals, Inc. | 6,018 | 464,409 |
| United States Steel Corp. | 508,763 | 5,632,006 |
| US Concrete, Inc. * | 47,240 | 1,914,165 |
| Valhi, Inc. | 79,631 | 155,281 |
| Valvoline, Inc. | 551,904 | 12,473,030 |
| Venator Materials plc * | 142,961 | 318,803 |
| Security | Number of Shares | Value ($) |
| Verso Corp., Class A * | 101,133 | 1,032,568 |
| Warrior Met Coal, Inc. | 125,274 | 2,618,227 |
| Worthington Industries, Inc. | 114,237 | 3,964,024 |
| 359,845,523 | ||
| Media & Entertainment 2.7% | ||
| AMC Entertainment Holdings, Inc., Class A(a) | 151,281 | 1,680,732 |
| AMC Networks, Inc., Class A * | 133,787 | 6,488,669 |
| ANGI Homeservices, Inc., Class A *(a) | 173,978 | 1,350,069 |
| Cable One, Inc. | 14,585 | 18,925,788 |
| Cargurus, Inc. * | 98,180 | 3,202,632 |
| Cars.com, Inc. * | 179,656 | 1,600,735 |
| Central European Media Enterprises Ltd., Class A * | 259,170 | 1,202,549 |
| Cinemark Holdings, Inc. | 313,771 | 11,973,501 |
| Clear Channel Outdoor Holdings, Inc. * | 1,054,293 | 2,741,162 |
| comScore, Inc. * | 138,836 | 258,235 |
| Emerald Expositions Events, Inc. | 74,375 | 711,025 |
| Entercom Communications Corp., Class A | 361,157 | 1,285,719 |
| Entravision Communications Corp., Class A | 173,037 | 529,493 |
| Eventbrite, Inc., Class A * | 33,698 | 589,041 |
| Gannett Co., Inc. | 338,486 | 3,560,873 |
| Global Eagle Entertainment, Inc. * | 146,942 | 102,859 |
| Glu Mobile, Inc. * | 329,069 | 1,461,066 |
| Gray Television, Inc. * | 229,489 | 3,511,182 |
| Hemisphere Media Group, Inc. * | 49,633 | 589,144 |
| John Wiley & Sons, Inc., Class A | 134,848 | 6,000,736 |
| Liberty Latin America Ltd., Class A * | 126,717 | 2,080,693 |
| Liberty Latin America Ltd., Class C * | 352,224 | 5,808,174 |
| Liberty Media Corp. - Liberty Braves, Class A * | 27,310 | 750,206 |
| Liberty Media Corp. - Liberty Braves, Class C * | 103,629 | 2,845,652 |
| Liberty TripAdvisor Holdings, Inc., Class A * | 211,367 | 1,847,348 |
| Loral Space & Communications, Inc. * | 37,065 | 1,371,034 |
| Match Group, Inc.(a) | 161,540 | 13,698,592 |
| Meredith Corp. | 118,074 | 5,169,280 |
| MSG Networks, Inc., Class A * | 179,494 | 2,943,702 |
| National CineMedia, Inc. | 181,654 | 1,489,563 |
| New Media Investment Group, Inc.(a) | 158,299 | 1,389,865 |
| Nexstar Media Group, Inc., Class A | 135,476 | 13,397,222 |
| Pinterest, Inc., Class A * | 254,801 | 8,770,250 |
| Scholastic Corp. | 81,371 | 2,853,681 |
| Sciplay Corp., Class A * | 64,570 | 614,061 |
| Sinclair Broadcast Group, Inc., Class A | 192,970 | 8,600,673 |
| TEGNA, Inc. | 637,750 | 9,126,202 |
| The E.W. Scripps Co., Class A | 165,717 | 2,048,262 |
| The Madison Square Garden Co., Class A * | 50,928 | 12,850,662 |
| The Marcus Corp. | 63,855 | 2,142,974 |
| The New York Times Co., Class A | 418,178 | 12,210,798 |
| Tribune Media Co., Class A | 239,050 | 11,134,949 |
| Tribune Publishing Co. | 59,306 | 453,691 |
| TrueCar, Inc. * | 253,295 | 1,003,048 |
| WideOpenWest, Inc. * | 80,044 | 449,847 |
| World Wrestling Entertainment, Inc., Class A | 128,721 | 9,194,541 |
| Yelp, Inc. * | 192,661 | 6,456,070 |
| Zynga, Inc., Class A * | 2,473,216 | 14,122,063 |
| 222,588,313 | ||
| Security | Number of Shares | Value ($) |
| Pharmaceuticals, Biotechnology & Life Sciences 7.0% | ||
| ACADIA Pharmaceuticals, Inc. * | 331,697 | 9,174,739 |
| Accelerate Diagnostics, Inc. *(a) | 74,249 | 1,395,139 |
| Acceleron Pharma, Inc. * | 130,031 | 5,839,692 |
| Achillion Pharmaceuticals, Inc. * | 406,597 | 1,768,697 |
| Aclaris Therapeutics, Inc. * | 107,340 | 108,413 |
| Acorda Therapeutics, Inc. * | 118,624 | 383,156 |
| Aduro Biotech, Inc. * | 148,393 | 182,523 |
| Aerie Pharmaceuticals, Inc. * | 116,986 | 2,533,917 |
| Agenus, Inc. * | 298,720 | 860,314 |
| Agios Pharmaceuticals, Inc. * | 151,095 | 5,734,055 |
| Aimmune Therapeutics, Inc. * | 108,769 | 2,217,800 |
| Akcea Therapeutics, Inc. *(a) | 49,514 | 1,042,765 |
| Akebia Therapeutics, Inc. * | 313,831 | 1,296,122 |
| Akorn, Inc. * | 275,975 | 797,568 |
| Alder Biopharmaceuticals, Inc. * | 211,421 | 1,892,218 |
| Alector, Inc. * | 28,419 | 467,777 |
| Allakos, Inc. *(a) | 70,144 | 6,204,938 |
| Allogene Therapeutics, Inc. *(a) | 57,033 | 1,553,009 |
| AMAG Pharmaceuticals, Inc. * | 97,622 | 1,066,032 |
| Amicus Therapeutics, Inc. * | 728,037 | 7,200,286 |
| Amneal Pharmaceuticals, Inc. * | 236,193 | 602,292 |
| Amphastar Pharmaceuticals, Inc. * | 103,220 | 2,318,321 |
| AnaptysBio, Inc. * | 68,232 | 2,773,631 |
| ANI Pharmaceuticals, Inc. * | 24,719 | 1,619,095 |
| Anika Therapeutics, Inc. * | 41,442 | 2,352,248 |
| Apellis Pharmaceuticals, Inc. * | 110,634 | 3,219,449 |
| Aptinyx, Inc. * | 19,620 | 66,316 |
| Arcus Biosciences, Inc. * | 26,535 | 207,238 |
| Arena Pharmaceuticals, Inc. * | 146,026 | 7,723,315 |
| Arqule, Inc. * | 311,831 | 2,794,006 |
| Arrowhead Pharmaceuticals, Inc. * | 278,150 | 9,504,386 |
| Arvinas Holding Co. LLC * | 21,707 | 564,599 |
| Assembly Biosciences, Inc. * | 60,059 | 679,267 |
| Assertio Therapeutics, Inc. * | 187,528 | 270,040 |
| Atara Biotherapeutics, Inc. * | 156,282 | 2,109,807 |
| Athenex, Inc. * | 155,523 | 2,290,854 |
| Audentes Therapeutics, Inc. * | 104,960 | 3,264,256 |
| Avrobio, Inc. * | 63,056 | 1,228,331 |
| Bellicum Pharmaceuticals, Inc. *(a) | 127,190 | 147,540 |
| BioCryst Pharmaceuticals, Inc. * | 325,856 | 974,309 |
| Biohaven Pharmaceutical Holding Co., Ltd. * | 121,434 | 4,758,998 |
| Blueprint Medicines Corp. * | 143,843 | 11,028,443 |
| Bruker Corp. | 295,541 | 12,758,505 |
| Cambrex Corp. * | 98,613 | 5,909,877 |
| Cara Therapeutics, Inc. * | 119,201 | 2,794,071 |
| CASI Pharmaceuticals, Inc. *(a) | 153,080 | 499,041 |
| Catalent, Inc. * | 428,336 | 22,590,441 |
| Charles River Laboratories International, Inc. * | 143,439 | 18,819,197 |
| Chimerix, Inc. * | 134,248 | 271,181 |
| Clovis Oncology, Inc. * | 156,235 | 876,478 |
| Codexis, Inc. * | 142,055 | 1,993,032 |
| Coherus Biosciences, Inc. * | 171,868 | 3,813,751 |
| Corcept Therapeutics, Inc. * | 305,820 | 3,856,390 |
| Cortexyme, Inc. *(a) | 13,193 | 261,881 |
| Crinetics Pharmaceuticals, Inc. *(a) | 19,127 | 303,354 |
| Cyclerion Therapeutics, Inc. * | 45,780 | 435,368 |
| Cymabay Therapeutics, Inc. * | 199,752 | 1,182,532 |
| Cytokinetics, Inc. * | 167,775 | 2,357,239 |
| CytomX Therapeutics, Inc. * | 131,912 | 1,158,187 |
| Deciphera Pharmaceuticals, Inc. * | 72,053 | 2,614,083 |
| Denali Therapeutics, Inc. * | 196,155 | 3,530,790 |
| Dermira, Inc. * | 130,696 | 1,046,875 |
| Dicerna Pharmaceuticals, Inc. * | 150,901 | 2,097,524 |
| Dova Pharmaceuticals, Inc. *(a) | 38,810 | 581,762 |
| Security | Number of Shares | Value ($) |
| Dynavax Technologies Corp. *(a) | 260,103 | 1,076,826 |
| Eagle Pharmaceuticals, Inc. * | 30,137 | 1,699,425 |
| Editas Medicine, Inc. * | 129,545 | 3,216,602 |
| Eidos Therapeutics, Inc. *(a) | 18,265 | 763,660 |
| Eloxx Pharmaceuticals, Inc. * | 72,305 | 448,291 |
| Emergent BioSolutions, Inc. * | 133,109 | 5,830,174 |
| Enanta Pharmaceuticals, Inc. * | 46,615 | 3,288,688 |
| Endo International plc * | 591,802 | 1,402,571 |
| Epizyme, Inc. * | 213,248 | 2,765,827 |
| Esperion Therapeutics, Inc. * | 72,309 | 2,649,402 |
| Evelo Biosciences, Inc. *(a) | 14,305 | 78,534 |
| Exact Sciences Corp. * | 379,783 | 45,277,729 |
| FibroGen, Inc. * | 225,877 | 10,087,667 |
| Five Prime Therapeutics, Inc. * | 104,361 | 566,680 |
| Flexion Therapeutics, Inc. *(a) | 97,594 | 1,285,313 |
| G1 Therapeutics, Inc. * | 75,388 | 2,736,584 |
| Genomic Health, Inc. * | 62,901 | 4,821,991 |
| Geron Corp. *(a) | 557,910 | 781,074 |
| Global Blood Therapeutics, Inc. * | 175,875 | 8,086,733 |
| Gossamer Bio, Inc. * | 52,502 | 1,100,442 |
| Gritstone Oncology, Inc. *(a) | 54,961 | 556,205 |
| Halozyme Therapeutics, Inc. * | 373,525 | 6,170,633 |
| Harpoon Therapeutics, Inc. * | 16,428 | 237,877 |
| Heron Therapeutics, Inc. * | 204,131 | 3,780,506 |
| Homology Medicines, Inc. * | 73,039 | 1,381,168 |
| Horizon Therapeutics plc * | 544,039 | 15,031,798 |
| ImmunoGen, Inc. * | 437,176 | 1,189,119 |
| Immunomedics, Inc. * | 508,395 | 6,507,456 |
| Innoviva, Inc. * | 199,416 | 2,311,231 |
| Inovio Pharmaceuticals, Inc. *(a) | 268,350 | 579,636 |
| Insmed, Inc. * | 255,345 | 4,197,872 |
| Intellia Therapeutics, Inc. * | 114,090 | 1,618,937 |
| Intercept Pharmaceuticals, Inc. * | 69,708 | 4,473,859 |
| Intersect ENT, Inc. * | 92,307 | 1,511,989 |
| Intra-Cellular Therapies, Inc. * | 139,911 | 1,197,638 |
| Intrexon Corp. *(a) | 208,994 | 1,220,525 |
| Invitae Corp. * | 249,945 | 6,063,666 |
| Iovance Biotherapeutics, Inc. * | 364,147 | 7,650,728 |
| Ironwood Pharmaceuticals, Inc. * | 455,961 | 4,244,997 |
| Jounce Therapeutics, Inc. * | 45,881 | 172,971 |
| Kaleido Biosciences, Inc. *(a) | 14,762 | 138,172 |
| Karyopharm Therapeutics, Inc. * | 147,507 | 1,274,460 |
| Kodiak Sciences, Inc. * | 26,769 | 294,459 |
| Kura Oncology, Inc. * | 113,327 | 1,720,304 |
| La Jolla Pharmaceutical Co. * | 60,869 | 582,516 |
| Lannett Co., Inc. *(a) | 99,236 | 1,022,131 |
| Lexicon Pharmaceuticals, Inc. *(a) | 142,926 | 188,662 |
| Ligand Pharmaceuticals, Inc. * | 57,952 | 5,268,416 |
| Luminex Corp. | 123,375 | 2,529,188 |
| MacroGenics, Inc. * | 128,237 | 1,838,919 |
| Madrigal Pharmaceuticals, Inc. * | 24,308 | 2,253,352 |
| Mallinckrodt plc * | 247,139 | 640,090 |
| MannKind Corp. *(a) | 506,287 | 556,916 |
| Medpace Holdings, Inc. * | 77,218 | 6,247,708 |
| Melinta Therapeutics, Inc. *(a) | 22,612 | 50,877 |
| Menlo Therapeutics, Inc. * | 21,443 | 105,500 |
| Mirati Therapeutics, Inc. * | 96,517 | 7,911,499 |
| Momenta Pharmaceuticals, Inc. * | 288,599 | 3,645,005 |
| MyoKardia, Inc. * | 111,977 | 6,021,003 |
| Myriad Genetics, Inc. * | 216,773 | 5,100,669 |
| NantKwest, Inc. *(a) | 81,243 | 105,616 |
| Natera, Inc. * | 171,182 | 5,640,447 |
| NeoGenomics, Inc. * | 302,336 | 7,552,353 |
| NextCure, Inc. * | 15,033 | 522,096 |
| NGM Biopharmaceuticals, Inc. *(a) | 19,195 | 340,327 |
| Novavax, Inc. *(a) | 70,357 | 420,031 |
| Odonate Therapeutics, Inc. * | 37,744 | 1,162,893 |
| Omeros Corp. *(a) | 134,145 | 2,480,341 |
| Security | Number of Shares | Value ($) |
| OPKO Health, Inc. * | 1,170,900 | 2,154,456 |
| Optinose, Inc. *(a) | 40,721 | 311,923 |
| Organogenesis Holdings, Inc. *(a) | 49,294 | 203,091 |
| Osmotica Pharmaceuticals plc * | 19,586 | 59,933 |
| Ovid therapeutics, Inc. * | 73,880 | 130,768 |
| Pacific Biosciences of California, Inc. * | 400,634 | 2,223,519 |
| Pacira BioSciences, Inc. * | 121,209 | 4,513,823 |
| Paratek Pharmaceuticals, Inc. *(a) | 84,714 | 316,830 |
| PDL BioPharma, Inc. * | 348,734 | 816,038 |
| Phibro Animal Health Corp., Class A | 58,981 | 1,217,958 |
| Portola Pharmaceuticals, Inc. * | 206,182 | 5,991,649 |
| Precision BioSciences, Inc. * | 23,410 | 199,453 |
| Prestige Consumer Healthcare, Inc. * | 153,261 | 4,885,961 |
| Principia Biopharma, Inc. * | 25,851 | 1,026,285 |
| Progenics Pharmaceuticals, Inc. * | 246,778 | 1,085,823 |
| Prothena Corp. plc * | 116,826 | 982,507 |
| PTC Therapeutics, Inc. * | 160,320 | 7,145,462 |
| Puma Biotechnology, Inc. * | 90,063 | 968,177 |
| Quanterix Corp. * | 39,261 | 1,033,742 |
| Radius Health, Inc. * | 123,515 | 3,495,475 |
| Reata Pharmaceuticals, Inc., Class A * | 46,753 | 3,604,656 |
| REGENXBIO, Inc. * | 90,067 | 3,106,411 |
| Repligen Corp. * | 131,282 | 12,184,282 |
| resTORbio, Inc. *(a) | 43,763 | 421,000 |
| Retrophin, Inc. * | 121,831 | 1,533,852 |
| Revance Therapeutics, Inc. * | 112,621 | 1,193,783 |
| Rhythm Pharmaceuticals, Inc. * | 63,331 | 1,426,214 |
| Rocket Pharmaceuticals, Inc. * | 97,585 | 1,058,797 |
| Rubius Therapeutics, Inc. *(a) | 34,039 | 315,882 |
| Sangamo Therapeutics, Inc. * | 337,632 | 3,680,189 |
| Seres Therapeutics, Inc. * | 138,507 | 558,183 |
| SIGA Technologies, Inc. * | 126,552 | 635,291 |
| Solid Biosciences, Inc. *(a) | 41,651 | 336,540 |
| Spark Therapeutics, Inc. * | 96,743 | 9,423,736 |
| Spectrum Pharmaceuticals, Inc. * | 312,807 | 2,296,003 |
| Supernus Pharmaceuticals, Inc. * | 153,295 | 4,143,564 |
| Surface Oncology, Inc. * | 21,103 | 43,472 |
| Synthorx, Inc. *(a) | 37,070 | 663,924 |
| Syros Pharmaceuticals, Inc. * | 99,861 | 1,095,475 |
| TCR2 Therapeutics, Inc. *(a) | 15,302 | 257,992 |
| TG Therapeutics, Inc. * | 216,593 | 1,345,043 |
| The Medicines Co. * | 206,111 | 8,648,418 |
| TherapeuticsMD, Inc. *(a) | 600,422 | 1,735,220 |
| Theravance Biopharma, Inc. * | 126,661 | 2,790,342 |
| Tricida, Inc. * | 76,367 | 2,664,445 |
| Turning Point Therapeutics * | 28,246 | 1,540,254 |
| Twist Bioscience Corp. * | 66,646 | 1,934,733 |
| Ultragenyx Pharmaceutical, Inc. * | 159,471 | 8,686,385 |
| UNITY Biotechnology, Inc. *(a) | 13,590 | 82,899 |
| Vanda Pharmaceuticals, Inc. * | 156,039 | 2,198,590 |
| Voyager Therapeutics, Inc. * | 70,892 | 1,266,840 |
| WaVe Life Sciences Ltd. * | 53,884 | 1,239,332 |
| Xencor, Inc. * | 140,655 | 5,243,618 |
| Y-mAbs Therapeutics, Inc. * | 17,874 | 474,912 |
| ZIOPHARM Oncology, Inc. *(a) | 439,973 | 2,195,465 |
| Zogenix, Inc. * | 124,162 | 5,300,476 |
| 569,733,525 | ||
| Real Estate 9.2% | ||
| Acadia Realty Trust | 242,456 | 6,631,172 |
| Agree Realty Corp. | 123,362 | 9,213,908 |
| Alexander & Baldwin, Inc. | 198,476 | 4,543,116 |
| Alexander's, Inc. | 11,052 | 4,172,904 |
| Altisource Portfolio Solutions S.A. * | 28,822 | 570,676 |
| American Assets Trust, Inc. | 138,937 | 6,510,588 |
| American Finance Trust, Inc.(a) | 162,132 | 1,940,720 |
| Americold Realty Trust | 563,383 | 20,518,409 |
| Security | Number of Shares | Value ($) |
| Apple Hospitality REIT, Inc. | 617,045 | 9,829,527 |
| Armada Hoffler Properties, Inc. | 153,771 | 2,666,389 |
| Ashford Hospitality Trust, Inc. | 255,835 | 716,338 |
| Braemar Hotels & Resorts, Inc. | 89,612 | 821,742 |
| Brandywine Realty Trust | 516,035 | 7,405,102 |
| CareTrust REIT, Inc. | 279,971 | 6,660,510 |
| CBL & Associates Properties, Inc.(a) | 506,563 | 460,972 |
| Cedar Realty Trust, Inc. | 267,958 | 635,060 |
| Chatham Lodging Trust | 137,055 | 2,273,742 |
| Chesapeake Lodging Trust | 179,544 | 4,623,258 |
| CIM Commercial Trust Corp. | 6,383 | 127,660 |
| Colony Capital, Inc. | 1,421,934 | 6,398,703 |
| Columbia Property Trust, Inc. | 345,002 | 7,379,593 |
| CoreCivic, Inc. | 352,018 | 5,966,705 |
| CorePoint Lodging, Inc. | 114,386 | 1,040,913 |
| CoreSite Realty Corp. | 108,214 | 12,572,303 |
| Corporate Office Properties Trust | 329,940 | 9,531,967 |
| Cousins Properties, Inc. | 427,723 | 14,841,988 |
| CubeSmart | 554,440 | 19,898,852 |
| DiamondRock Hospitality Co. | 589,821 | 5,585,605 |
| Easterly Government Properties, Inc. | 230,452 | 4,735,789 |
| EastGroup Properties, Inc. | 107,886 | 13,433,965 |
| Empire State Realty Trust, Inc., Class A | 417,674 | 5,872,496 |
| EPR Properties | 222,167 | 17,384,568 |
| Equity Commonwealth | 358,818 | 12,077,814 |
| eXp World Holdings, Inc. *(a) | 111,840 | 973,008 |
| First Industrial Realty Trust, Inc. | 372,207 | 14,497,463 |
| Forestar Group, Inc. * | 30,768 | 586,438 |
| Four Corners Property Trust, Inc. | 202,119 | 5,758,370 |
| Franklin Street Properties Corp. | 314,069 | 2,377,502 |
| Front Yard Residential Corp. | 144,516 | 1,602,682 |
| FRP Holdings, Inc. * | 19,160 | 942,480 |
| Getty Realty Corp. | 99,506 | 3,160,311 |
| Gladstone Commercial Corp. | 90,062 | 2,041,706 |
| Global Net Lease, Inc. | 245,857 | 4,715,537 |
| Hannon Armstrong Sustainable Infrastructure Capital, Inc. | 184,999 | 5,111,522 |
| Healthcare Realty Trust, Inc. | 380,776 | 12,653,186 |
| Hersha Hospitality Trust | 106,261 | 1,477,028 |
| Hospitality Properties Trust | 484,320 | 11,691,485 |
| Hudson Pacific Properties, Inc. | 454,178 | 15,442,052 |
| Independence Realty Trust, Inc. | 263,588 | 3,666,509 |
| Industrial Logistics Properties Trust | 190,605 | 4,077,041 |
| Investors Real Estate Trust | 34,478 | 2,387,601 |
| iStar, Inc. | 188,848 | 2,417,254 |
| Kennedy-Wilson Holdings, Inc. | 363,473 | 7,625,664 |
| Kite Realty Group Trust | 246,056 | 3,516,140 |
| Lexington Realty Trust | 617,681 | 6,417,706 |
| Life Storage, Inc. | 137,321 | 14,550,533 |
| LTC Properties, Inc. | 117,329 | 5,725,655 |
| Mack-Cali Realty Corp. | 264,634 | 5,390,595 |
| Marcus & Millichap, Inc. * | 63,362 | 2,286,101 |
| Medical Properties Trust, Inc. | 1,290,583 | 23,991,938 |
| Monmouth Real Estate Investment Corp., Class A | 275,445 | 3,613,838 |
| National Health Investors, Inc. | 126,878 | 10,525,799 |
| National Storage Affiliates Trust | 168,031 | 5,622,317 |
| New Senior Investment Group, Inc. | 240,897 | 1,505,606 |
| Newmark Group, Inc., Class A | 428,458 | 3,719,015 |
| NexPoint Residential Trust, Inc. | 62,223 | 2,887,147 |
| NorthStar Realty Europe Corp. | 148,717 | 2,517,779 |
| Office Properties Income Trust | 140,877 | 3,819,175 |
| One Liberty Properties, Inc. | 43,351 | 1,160,940 |
| Outfront Media, Inc. | 415,364 | 11,414,203 |
| Paramount Group, Inc. | 592,702 | 7,811,812 |
| Pebblebrook Hotel Trust | 384,726 | 10,376,060 |
| Pennsylvania Real Estate Investment Trust(a) | 177,122 | 910,407 |
| Security | Number of Shares | Value ($) |
| Physicians Realty Trust | 543,887 | 9,420,123 |
| Piedmont Office Realty Trust, Inc., Class A | 367,929 | 7,262,918 |
| PotlatchDeltic Corp. | 197,951 | 7,617,154 |
| Preferred Apartment Communities, Inc., Class A | 126,074 | 1,696,956 |
| PS Business Parks, Inc. | 59,010 | 10,598,786 |
| QTS Realty Trust, Inc., Class A | 162,259 | 7,960,427 |
| Rayonier, Inc. | 381,721 | 10,230,123 |
| RE/MAX Holdings, Inc., Class A | 51,749 | 1,328,397 |
| Realogy Holdings Corp.(a) | 333,678 | 1,594,981 |
| Redfin Corp. * | 203,964 | 3,444,952 |
| Retail Opportunity Investments Corp. | 335,016 | 5,866,130 |
| Retail Properties of America, Inc., Class A | 630,593 | 7,163,536 |
| Retail Value, Inc. | 46,375 | 1,715,411 |
| Rexford Industrial Realty, Inc. | 322,406 | 14,247,121 |
| RLJ Lodging Trust | 511,931 | 8,298,401 |
| RPT Realty | 235,366 | 2,800,855 |
| Ryman Hospitality Properties, Inc. | 151,451 | 12,064,587 |
| Sabra Health Care REIT, Inc. | 556,727 | 12,036,438 |
| Saul Centers, Inc. | 34,309 | 1,723,341 |
| Seritage Growth Properties, Class A | 81,507 | 3,186,109 |
| SITE Centers Corp. | 417,713 | 5,789,502 |
| Spirit MTA REIT | 126,900 | 1,065,960 |
| Spirit Realty Capital, Inc. | 256,107 | 12,277,770 |
| STAG Industrial, Inc. | 369,747 | 10,752,243 |
| STORE Capital Corp. | 594,337 | 22,442,165 |
| Summit Hotel Properties, Inc. | 311,835 | 3,480,079 |
| Sunstone Hotel Investors, Inc. | 673,865 | 8,854,586 |
| Tanger Factory Outlet Centers, Inc.(a) | 275,644 | 3,897,606 |
| Taubman Centers, Inc. | 179,119 | 6,994,597 |
| Tejon Ranch Co. * | 61,638 | 1,031,820 |
| Terreno Realty Corp. | 185,235 | 9,365,482 |
| The GEO Group, Inc. | 358,330 | 6,148,943 |
| The Howard Hughes Corp. * | 115,418 | 14,573,831 |
| The RMR Group, Inc., Class A | 44,688 | 2,082,014 |
| The St. Joe Co. * | 176,479 | 3,173,092 |
| UMH Properties, Inc. | 106,569 | 1,370,477 |
| Uniti Group, Inc. | 539,454 | 3,986,565 |
| Universal Health Realty Income Trust | 37,044 | 3,581,784 |
| Urban Edge Properties | 355,208 | 6,219,692 |
| Urstadt Biddle Properties, Inc. | 10,506 | 177,656 |
| Urstadt Biddle Properties, Inc., Class A | 86,523 | 1,816,118 |
| Washington Prime Group, Inc.(a) | 543,619 | 1,755,889 |
| Washington Real Estate Investment Trust | 236,169 | 6,256,117 |
| Weingarten Realty Investors | 352,434 | 9,335,977 |
| Whitestone REIT | 116,573 | 1,447,837 |
| Xenia Hotels & Resorts, Inc. | 329,912 | 6,667,522 |
| 742,812,729 | ||
| Retailing 3.4% | ||
| 1-800-Flowers.com, Inc., Class A * | 70,852 | 1,042,941 |
| Aaron's, Inc. | 198,902 | 12,751,607 |
| Abercrombie & Fitch Co., Class A | 195,096 | 2,852,304 |
| America's Car-Mart, Inc. * | 18,523 | 1,588,903 |
| American Eagle Outfitters, Inc. | 482,633 | 8,117,887 |
| Asbury Automotive Group, Inc. * | 57,178 | 5,391,885 |
| Ascena Retail Group, Inc. * | 515,913 | 128,411 |
| At Home Group, Inc. * | 79,111 | 533,208 |
| AutoNation, Inc. * | 168,440 | 7,994,162 |
| Barnes & Noble Education, Inc. * | 105,955 | 413,225 |
| Bed Bath & Beyond, Inc.(a) | 387,034 | 3,742,619 |
| Big Lots, Inc. | 116,872 | 2,658,838 |
| Boot Barn Holdings, Inc. * | 82,685 | 2,831,961 |
| Caleres, Inc. | 123,751 | 2,493,583 |
| Security | Number of Shares | Value ($) |
| Camping World Holdings, Inc., Class A(a) | 95,479 | 725,640 |
| Carvana Co. * | 106,089 | 8,610,183 |
| Chico's FAS, Inc. | 345,112 | 1,076,749 |
| Conn's, Inc. * | 73,334 | 1,478,413 |
| Core-Mark Holding Co., Inc. | 135,627 | 4,392,959 |
| Designer Brands, Inc., Class A | 170,376 | 2,809,500 |
| Dick's Sporting Goods, Inc. | 197,845 | 6,734,644 |
| Dillard's, Inc., Class A(a) | 52,197 | 3,054,568 |
| Duluth Holdings, Inc., Class B * | 29,120 | 267,613 |
| Etsy, Inc. * | 353,467 | 18,659,523 |
| Express, Inc. * | 200,415 | 424,880 |
| Five Below, Inc. * | 164,543 | 20,217,398 |
| Floor & Decor Holdings, Inc., Class A * | 169,846 | 8,359,820 |
| Francesca's Holdings Corp. *(a) | 8,797 | 38,267 |
| GameStop Corp., Class A(a) | 263,949 | 1,047,878 |
| Genesco, Inc. * | 50,591 | 1,805,087 |
| GNC Holdings, Inc., Class A *(a) | 246,051 | 482,260 |
| Group 1 Automotive, Inc. | 51,823 | 3,872,215 |
| Groupon, Inc. * | 1,197,015 | 2,968,597 |
| Guess?, Inc. | 149,710 | 2,705,260 |
| Haverty Furniture Cos., Inc. | 57,503 | 1,101,182 |
| Hibbett Sports, Inc. * | 53,394 | 883,137 |
| J. Jill, Inc.(a) | 38,910 | 72,762 |
| J.C. Penney Co., Inc. * | 911,866 | 678,520 |
| Lands' End, Inc. * | 47,244 | 366,141 |
| Liquidity Services, Inc. * | 76,174 | 576,637 |
| Lithia Motors, Inc., Class A | 65,922 | 8,640,397 |
| Lumber Liquidators Holdings, Inc. *(a) | 83,820 | 788,746 |
| MarineMax, Inc. * | 66,162 | 956,703 |
| Monro, Inc. | 97,909 | 7,609,487 |
| Murphy USA, Inc. * | 87,661 | 7,836,893 |
| National Vision Holdings, Inc. * | 229,830 | 6,517,979 |
| Office Depot, Inc. | 1,603,588 | 2,084,664 |
| Ollie's Bargain Outlet Holdings, Inc. * | 153,323 | 8,501,760 |
| Overstock.com, Inc. * | 85,947 | 1,351,946 |
| Party City Holdco, Inc. * | 161,999 | 761,395 |
| Penske Automotive Group, Inc. | 105,369 | 4,507,686 |
| PetMed Express, Inc.(a) | 58,105 | 918,059 |
| Pier 1 Imports, Inc. * | 11,802 | 51,693 |
| Pool Corp. | 116,903 | 22,957,411 |
| Quotient Technology, Inc. * | 216,390 | 1,588,303 |
| Rent-A-Center, Inc. * | 133,318 | 3,403,609 |
| RH * | 47,327 | 6,779,593 |
| Sally Beauty Holdings, Inc. * | 353,169 | 4,319,257 |
| Shoe Carnival, Inc. | 27,867 | 856,632 |
| Shutterfly, Inc. * | 100,443 | 5,110,540 |
| Shutterstock, Inc. * | 55,700 | 1,955,627 |
| Signet Jewelers Ltd. | 154,537 | 1,891,533 |
| Sleep Number Corp. * | 88,517 | 3,703,551 |
| Sonic Automotive, Inc., Class A | 69,951 | 1,882,381 |
| Sportsman's Warehouse Holdings, Inc. * | 110,787 | 467,521 |
| Stamps.com, Inc. * | 47,684 | 3,068,942 |
| Stitch Fix, Inc., Class A *(a) | 64,041 | 1,220,621 |
| Tailored Brands, Inc.(a) | 149,490 | 810,236 |
| The Buckle, Inc. | 85,116 | 1,668,274 |
| The Cato Corp., Class A | 67,163 | 1,150,502 |
| The Children's Place, Inc. | 46,407 | 4,049,011 |
| The Container Store Group, Inc. * | 44,480 | 199,270 |
| The Michaels Cos., Inc. * | 268,893 | 1,524,623 |
| The Rubicon Project, Inc. * | 131,101 | 1,341,163 |
| Tile Shop Holdings, Inc. | 108,942 | 293,054 |
| Urban Outfitters, Inc. * | 200,803 | 4,700,798 |
| Vitamin Shoppe, Inc. * | 45,836 | 295,642 |
| Waitr Holdings, Inc. *(a) | 184,668 | 319,476 |
| Weyco Group, Inc. | 18,409 | 451,573 |
| Security | Number of Shares | Value ($) |
| Winmark Corp. | 7,069 | 1,148,713 |
| Zumiez, Inc. * | 55,285 | 1,436,304 |
| 275,072,935 | ||
| Semiconductors & Semiconductor Equipment 3.3% | ||
| Advanced Energy Industries, Inc. * | 112,979 | 5,834,236 |
| Amkor Technology, Inc. * | 378,374 | 3,310,772 |
| Aquantia Corp. * | 77,819 | 1,025,654 |
| Axcelis Technologies, Inc. * | 96,933 | 1,484,044 |
| Brooks Automation, Inc. | 212,513 | 7,083,058 |
| Cabot Microelectronics Corp. | 85,617 | 10,672,159 |
| CEVA, Inc. * | 64,592 | 2,028,835 |
| Cirrus Logic, Inc. * | 171,441 | 9,196,095 |
| Cohu, Inc. | 121,026 | 1,442,630 |
| Cree, Inc. * | 309,358 | 13,280,739 |
| Cypress Semiconductor Corp. | 1,075,064 | 24,737,223 |
| Diodes, Inc. * | 117,111 | 4,280,407 |
| Entegris, Inc. | 398,419 | 17,064,286 |
| FormFactor, Inc. * | 218,700 | 3,737,583 |
| Ichor Holdings Ltd. * | 65,299 | 1,388,257 |
| Impinj, Inc. * | 44,515 | 1,619,456 |
| Inphi Corp. * | 132,588 | 8,113,060 |
| Kulicke & Soffa Industries, Inc. | 190,387 | 3,965,761 |
| Lattice Semiconductor Corp. * | 386,874 | 7,617,549 |
| MACOM Technology Solutions Holdings, Inc. * | 134,845 | 2,648,356 |
| MaxLinear, Inc., Class A * | 190,334 | 3,772,420 |
| MKS Instruments, Inc. | 159,442 | 12,482,714 |
| Monolithic Power Systems, Inc. | 116,443 | 17,531,658 |
| Nanometrics, Inc. * | 72,886 | 1,989,059 |
| NeoPhotonics Corp. * | 105,174 | 658,389 |
| PDF Solutions, Inc. * | 82,386 | 964,740 |
| Photronics, Inc. * | 195,486 | 2,111,249 |
| Power Integrations, Inc. | 86,049 | 7,660,082 |
| Rambus, Inc. * | 323,192 | 4,052,828 |
| Rudolph Technologies, Inc. * | 91,971 | 2,022,442 |
| Semtech Corp. * | 196,422 | 8,243,831 |
| Silicon Laboratories, Inc. * | 127,476 | 13,894,884 |
| SMART Global Holdings, Inc. * | 37,394 | 1,062,363 |
| SolarEdge Technologies, Inc. * | 131,253 | 10,752,246 |
| SunPower Corp. * | 177,921 | 2,227,571 |
| Synaptics, Inc. * | 102,314 | 3,276,094 |
| Ultra Clean Holdings, Inc. * | 114,181 | 1,363,321 |
| Universal Display Corp. | 124,781 | 25,638,752 |
| Veeco Instruments, Inc. * | 143,141 | 1,325,486 |
| Versum Materials, Inc. | 321,370 | 16,711,240 |
| Xperi Corp. | 143,908 | 2,636,395 |
| 270,907,924 | ||
| Software & Services 10.6% | ||
| 2U, Inc. * | 168,137 | 3,006,290 |
| 8x8, Inc. * | 282,721 | 6,872,948 |
| A10 Networks, Inc. * | 157,859 | 1,095,541 |
| ACI Worldwide, Inc. * | 325,936 | 9,706,374 |
| Alarm.com Holdings, Inc. * | 103,399 | 4,921,792 |
| Altair Engineering, Inc., Class A * | 81,359 | 2,795,495 |
| Alteryx, Inc., Class A * | 136,889 | 19,499,838 |
| Anaplan, Inc. * | 48,172 | 2,617,185 |
| Appfolio, Inc., Class A * | 34,590 | 3,416,454 |
| Appian Corp. * | 91,747 | 5,456,194 |
| Avalara, Inc. * | 131,007 | 11,049,130 |
| Avaya Holdings Corp. * | 304,791 | 4,303,649 |
| Benefitfocus, Inc. * | 76,814 | 2,006,382 |
| Blackbaud, Inc. | 144,819 | 13,174,184 |
| Blackline, Inc. * | 137,549 | 7,005,371 |
| Bottomline Technologies (DE), Inc. * | 111,537 | 4,599,786 |
| Security | Number of Shares | Value ($) |
| Box, Inc., Class A * | 432,809 | 6,331,996 |
| CACI International, Inc., Class A * | 73,184 | 16,268,071 |
| Carbon Black, Inc. * | 138,437 | 3,613,206 |
| Carbonite, Inc. * | 95,903 | 1,155,631 |
| Cardtronics plc, Class A * | 109,575 | 3,245,612 |
| Cass Information Systems, Inc. | 34,596 | 1,750,558 |
| Ceridian HCM Holding, Inc. * | 231,745 | 13,387,909 |
| ChannelAdvisor Corp. * | 76,020 | 653,772 |
| Cision Ltd. * | 220,677 | 1,527,085 |
| Cloudera, Inc. *(a) | 666,940 | 4,761,952 |
| CommVault Systems, Inc. * | 112,442 | 4,876,610 |
| Conduent, Inc. * | 536,577 | 3,493,116 |
| CoreLogic, Inc. * | 236,891 | 11,465,524 |
| Cornerstone OnDemand, Inc. * | 160,093 | 8,352,052 |
| Coupa Software, Inc. * | 160,451 | 22,291,457 |
| CSG Systems International, Inc. | 97,394 | 5,247,589 |
| Dropbox, Inc., Class A * | 577,087 | 10,329,857 |
| Ebix, Inc. | 64,260 | 2,276,089 |
| Elastic N.V. * | 21,548 | 1,893,854 |
| Endurance International Group Holdings, Inc. * | 237,228 | 1,195,629 |
| Envestnet, Inc. * | 141,666 | 8,104,712 |
| Euronet Worldwide, Inc. * | 152,722 | 23,387,847 |
| Everbridge, Inc. * | 86,437 | 7,450,869 |
| EVERTEC, Inc. | 175,702 | 6,124,972 |
| Exela Technologies, Inc. * | 132,830 | 152,755 |
| ExlService Holdings, Inc. * | 101,321 | 6,859,432 |
| Fair Isaac Corp. * | 85,124 | 30,024,937 |
| FireEye, Inc. * | 604,872 | 8,123,431 |
| Five9, Inc. * | 175,175 | 11,072,812 |
| ForeScout Technologies, Inc. * | 106,031 | 3,799,091 |
| Genpact Ltd. | 447,914 | 18,346,557 |
| GreenSky, Inc., Class A *(a) | 135,166 | 919,129 |
| GTT Communications, Inc. *(a) | 98,919 | 940,720 |
| GTY Technology Holdings, Inc. * | 98,325 | 615,515 |
| HubSpot, Inc. * | 115,091 | 22,981,371 |
| Instructure, Inc. * | 96,498 | 3,991,157 |
| Internap Corp. *(a) | 53,881 | 118,538 |
| j2 Global, Inc. | 136,973 | 11,587,916 |
| KBR, Inc. | 416,997 | 10,641,763 |
| LivePerson, Inc. * | 174,841 | 6,948,181 |
| LiveRamp Holdings, Inc. * | 202,843 | 8,592,429 |
| LogMeIn, Inc. | 146,892 | 9,818,261 |
| Manhattan Associates, Inc. * | 189,942 | 15,694,907 |
| ManTech International Corp., Class A | 78,127 | 5,490,766 |
| MAXIMUS, Inc. | 187,920 | 14,458,565 |
| MicroStrategy, Inc., Class A * | 24,043 | 3,445,121 |
| MoneyGram International, Inc. *(a) | 84,824 | 363,047 |
| MongoDB, Inc. * | 96,308 | 14,668,671 |
| Monotype Imaging Holdings, Inc. | 121,789 | 2,405,333 |
| New Relic, Inc. * | 136,928 | 7,851,452 |
| NIC, Inc. | 198,117 | 4,124,796 |
| Okta, Inc. * | 305,390 | 38,631,835 |
| OneSpan, Inc. * | 92,254 | 1,245,429 |
| Pagerduty, Inc. *(a) | 26,766 | 1,051,101 |
| Paylocity Holding Corp. * | 93,198 | 10,179,086 |
| Pegasystems, Inc. | 108,810 | 7,633,022 |
| Perficient, Inc. * | 96,620 | 3,559,481 |
| Perspecta, Inc. | 410,416 | 10,650,295 |
| Pivotal Software, Inc., Class A * | 227,645 | 3,394,187 |
| Pluralsight, Inc., Class A * | 175,464 | 2,824,970 |
| Presidio, Inc. | 139,171 | 2,229,519 |
| Progress Software Corp. | 130,431 | 4,927,683 |
| Proofpoint, Inc. * | 163,608 | 18,587,505 |
| PROS Holdings, Inc. * | 109,972 | 7,810,211 |
| Q2 Holdings, Inc. * | 136,761 | 12,301,652 |
| QAD, Inc., Class A | 29,791 | 1,207,131 |
| Qualys, Inc. * | 99,352 | 7,910,406 |
| Security | Number of Shares | Value ($) |
| Rapid7, Inc. * | 123,880 | 6,651,117 |
| RealPage, Inc. * | 216,974 | 13,814,735 |
| RingCentral, Inc., Class A * | 206,713 | 29,173,406 |
| SailPoint Technologies Holding, Inc. * | 192,380 | 4,334,321 |
| Science Applications International Corp. | 149,917 | 13,194,195 |
| ServiceSource International, Inc. * | 220,987 | 203,308 |
| SPS Commerce, Inc. * | 105,704 | 5,342,280 |
| SVMK, Inc. * | 46,396 | 776,669 |
| Switch, Inc., Class A | 152,203 | 2,496,129 |
| Sykes Enterprises, Inc. * | 115,642 | 3,353,618 |
| Tenable Holdings, Inc. * | 33,380 | 761,064 |
| The Trade Desk, Inc., Class A * | 107,560 | 26,435,021 |
| TiVo Corp. | 364,711 | 2,746,274 |
| TTEC Holdings, Inc. | 40,967 | 1,921,762 |
| Twilio, Inc., Class A * | 344,144 | 44,900,468 |
| Unisys Corp. * | 152,778 | 999,168 |
| Upland Software, Inc. * | 62,899 | 2,390,162 |
| USA Technologies, Inc. * | 173,261 | 1,425,938 |
| Varonis Systems, Inc. * | 89,466 | 6,112,317 |
| Verint Systems, Inc. * | 193,167 | 10,293,869 |
| Verra Mobility Corp. * | 339,304 | 4,723,112 |
| VirnetX Holding Corp. *(a) | 172,333 | 906,472 |
| Virtusa Corp. * | 81,494 | 2,945,193 |
| Workiva, Inc. * | 104,997 | 5,051,406 |
| Yext, Inc. * | 247,177 | 3,897,981 |
| Zendesk, Inc. * | 321,942 | 25,819,748 |
| Zoom Video Communications, Inc., Class A *(a) | 71,030 | 6,511,320 |
| Zscaler, Inc. * | 44,136 | 3,033,909 |
| 859,107,710 | ||
| Technology Hardware & Equipment 3.7% | ||
| 3D Systems Corp. * | 344,752 | 2,413,264 |
| Acacia Communications, Inc. * | 83,223 | 5,247,210 |
| ADTRAN, Inc. | 139,815 | 1,435,900 |
| Anixter International, Inc. * | 85,496 | 5,127,195 |
| Applied Optoelectronics, Inc. *(a) | 54,873 | 488,370 |
| Arlo Technologies, Inc. * | 221,611 | 695,858 |
| Avid Technology, Inc. * | 96,861 | 722,583 |
| AVX Corp. | 138,123 | 1,871,567 |
| Badger Meter, Inc. | 85,333 | 4,401,476 |
| Belden, Inc. | 113,581 | 5,180,429 |
| Benchmark Electronics, Inc. | 112,896 | 2,989,486 |
| CalAmp Corp. * | 100,792 | 967,603 |
| Calix, Inc. * | 133,926 | 804,895 |
| Casa Systems, Inc. * | 85,604 | 493,079 |
| Ciena Corp. * | 420,793 | 17,223,057 |
| Coherent, Inc. * | 71,282 | 10,333,039 |
| Comtech Telecommunications Corp. | 71,173 | 1,903,878 |
| Cray, Inc. * | 120,377 | 4,204,769 |
| CTS Corp. | 97,430 | 2,779,678 |
| Daktronics, Inc. | 119,120 | 861,238 |
| Diebold Nixdorf, Inc. * | 227,170 | 2,546,576 |
| Dolby Laboratories, Inc., Class A | 189,337 | 11,655,586 |
| EchoStar Corp., Class A * | 141,791 | 5,990,670 |
| ePlus, Inc. * | 39,828 | 3,254,744 |
| Extreme Networks, Inc. * | 347,135 | 2,318,862 |
| Fabrinet * | 107,933 | 5,449,537 |
| FARO Technologies, Inc. * | 50,585 | 2,490,805 |
| Finisar Corp. * | 348,055 | 7,869,523 |
| Fitbit, Inc., Class A * | 623,051 | 1,925,228 |
| Harmonic, Inc. * | 262,133 | 1,727,456 |
| II-VI, Inc. * | 175,204 | 6,571,902 |
| Infinera Corp. * | 448,785 | 2,392,024 |
| Insight Enterprises, Inc. * | 105,654 | 5,077,731 |
| InterDigital, Inc. | 92,935 | 4,569,614 |
| Itron, Inc. * | 97,999 | 6,806,031 |
| Security | Number of Shares | Value ($) |
| KEMET Corp. | 171,833 | 2,878,203 |
| Kimball Electronics, Inc. * | 76,165 | 1,006,140 |
| Knowles Corp. * | 267,516 | 5,425,224 |
| Littelfuse, Inc. | 72,779 | 11,358,618 |
| Lumentum Holdings, Inc. * | 224,977 | 12,544,717 |
| Methode Electronics, Inc. | 108,232 | 3,435,284 |
| MTS Systems Corp. | 52,386 | 2,979,192 |
| NCR Corp. * | 353,445 | 11,137,052 |
| NETGEAR, Inc. * | 93,294 | 3,239,168 |
| NetScout Systems, Inc. * | 204,344 | 4,526,220 |
| nLight, Inc. * | 18,253 | 235,829 |
| Novanta, Inc. * | 96,528 | 7,239,600 |
| OSI Systems, Inc. * | 49,553 | 5,203,560 |
| PC Connection, Inc. | 33,653 | 1,185,595 |
| Plantronics, Inc. | 96,097 | 2,985,734 |
| Plexus Corp. * | 88,218 | 5,046,952 |
| Pure Storage, Inc., Class A * | 525,913 | 8,561,864 |
| Ribbon Communications, Inc. * | 151,989 | 785,783 |
| Rogers Corp. * | 54,469 | 7,212,785 |
| Sanmina Corp. * | 203,549 | 5,882,566 |
| ScanSource, Inc. * | 74,563 | 2,107,150 |
| SYNNEX Corp. | 122,230 | 10,244,096 |
| Tech Data Corp. * | 106,998 | 9,921,924 |
| TTM Technologies, Inc. * | 274,909 | 2,930,530 |
| Ubiquiti, Inc. | 55,827 | 6,169,442 |
| ViaSat, Inc. * | 167,754 | 13,307,925 |
| Viavi Solutions, Inc. * | 670,640 | 9,315,190 |
| Vishay Intertechnology, Inc. | 387,600 | 6,135,708 |
| 303,792,914 | ||
| Telecommunication Services 0.6% | ||
| Anterix, Inc. * | 31,489 | 1,220,199 |
| ATN International, Inc. | 31,695 | 1,800,910 |
| Boingo Wireless, Inc. * | 128,825 | 1,657,978 |
| Cincinnati Bell, Inc. * | 145,053 | 787,638 |
| Cogent Communications Holdings, Inc. | 123,206 | 7,502,013 |
| Consolidated Communications Holdings, Inc. | 213,884 | 861,952 |
| Frontier Communications Corp. *(a) | 310,320 | 248,411 |
| Globalstar, Inc. * | 1,986,639 | 751,545 |
| Gogo, Inc. *(a) | 158,841 | 638,541 |
| Iridium Communications, Inc. * | 283,839 | 6,863,227 |
| ORBCOMM, Inc. * | 231,782 | 1,068,515 |
| Shenandoah Telecommunications Co. | 135,721 | 4,280,640 |
| Spok Holdings, Inc. | 53,029 | 623,091 |
| Telephone & Data Systems, Inc. | 277,033 | 6,981,232 |
| United States Cellular Corp. * | 42,246 | 1,520,433 |
| Vonage Holdings Corp. * | 654,971 | 8,658,717 |
| 45,465,042 | ||
| Transportation 1.6% | ||
| Air Transport Services Group, Inc. * | 175,846 | 3,552,089 |
| Allegiant Travel Co. | 37,703 | 5,353,449 |
| ArcBest Corp. | 75,176 | 2,225,961 |
| Atlas Air Worldwide Holdings, Inc. * | 75,578 | 1,953,691 |
| Avis Budget Group, Inc. * | 188,405 | 4,666,792 |
| Daseke, Inc. * | 166,395 | 292,855 |
| Echo Global Logistics, Inc. * | 81,096 | 1,625,164 |
| Forward Air Corp. | 84,101 | 5,239,492 |
| Hawaiian Holdings, Inc. | 140,681 | 3,434,023 |
| Heartland Express, Inc. | 139,275 | 2,864,887 |
| Hertz Global Holdings, Inc. * | 270,478 | 3,275,489 |
| Hub Group, Inc., Class A * | 99,894 | 4,301,436 |
| Kirby Corp. * | 158,840 | 11,689,036 |
| Knight-Swift Transportation Holdings, Inc. | 367,006 | 12,529,585 |
| Security | Number of Shares | Value ($) |
| Landstar System, Inc. | 118,242 | 13,186,348 |
| Macquarie Infrastructure Corp. | 227,096 | 8,588,771 |
| Marten Transport Ltd. | 113,887 | 2,240,157 |
| Matson, Inc. | 125,351 | 4,453,721 |
| Ryder System, Inc. | 157,183 | 7,571,505 |
| Saia, Inc. * | 76,128 | 6,511,989 |
| Schneider National, Inc., Class B | 82,685 | 1,607,396 |
| SkyWest, Inc. | 151,079 | 8,650,783 |
| Spirit Airlines, Inc. * | 201,998 | 7,583,005 |
| Universal Logistics Holdings, Inc. | 24,145 | 505,838 |
| Werner Enterprises, Inc. | 126,945 | 4,148,563 |
| 128,052,025 | ||
| Utilities 3.4% | ||
| ALLETE, Inc. | 151,869 | 13,019,729 |
| American States Water Co. | 108,541 | 10,043,299 |
| AquaVenture Holdings Ltd. * | 57,249 | 1,012,162 |
| Avista Corp. | 192,554 | 9,030,783 |
| Black Hills Corp. | 160,084 | 12,280,044 |
| California Water Service Group | 140,995 | 7,957,758 |
| Chesapeake Utilities Corp. | 48,039 | 4,543,529 |
| Clearway Energy, Inc., Class A | 102,761 | 1,722,274 |
| Clearway Energy, Inc., Class C | 214,616 | 3,798,703 |
| Connecticut Water Service, Inc. | 35,152 | 2,465,561 |
| El Paso Electric Co. | 118,955 | 7,934,298 |
| Hawaiian Electric Industries, Inc. | 320,640 | 14,236,416 |
| IDACORP, Inc. | 148,250 | 16,279,332 |
| MDU Resources Group, Inc. | 580,973 | 15,622,364 |
| MGE Energy, Inc. | 101,548 | 7,702,416 |
| Middlesex Water Co. | 48,624 | 2,968,009 |
| New Jersey Resources Corp. | 262,493 | 12,006,430 |
| Northwest Natural Holding Co. | 89,163 | 6,362,672 |
| NorthWestern Corp. | 148,607 | 10,765,091 |
| ONE Gas, Inc. | 155,094 | 14,208,161 |
| Ormat Technologies, Inc. | 149,555 | 11,107,450 |
| Otter Tail Corp. | 117,006 | 5,922,844 |
| Pattern Energy Group, Inc., Class A | 267,774 | 7,270,064 |
| PNM Resources, Inc. | 234,574 | 11,965,620 |
| Portland General Electric Co. | 263,037 | 14,964,175 |
| SJW Group | 69,107 | 4,722,081 |
| South Jersey Industries, Inc. | 270,688 | 8,754,050 |
| Southwest Gas Holdings, Inc. | 157,196 | 14,340,991 |
| Spire, Inc. | 149,490 | 12,691,701 |
| TerraForm Power, Inc., Class A | 238,635 | 4,047,250 |
| Unitil Corp. | 43,925 | 2,651,752 |
| 272,397,009 | ||
| Total Common Stock | ||
| (Cost $7,654,651,871) | 8,083,982,445 | |
| Rights0.0% of net assets | ||
| Materials 0.0% | ||
| A. Schulman, Inc. CVR *(b) | 82,213 | 35,598 |
| Media & Entertainment 0.0% | ||
| Media General, Inc. CVR *(b) | 177,806 | 15,132 |
| Total Rights | ||
| (Cost $35,598) | 50,730 | |
| Security | Number of Shares | Value ($) |
| Other Investment Companies1.5% of net assets | ||
| Money Market Fund 0.0% | ||
| State Street Institutional U.S. Government Money Market Fund, Premier Class 2.07%(c) | 2,896,339 | 2,896,339 |
| Securities Lending Collateral 1.5% | ||
| Wells Fargo Government Money Market Fund, Select Class 2.03%(c) | 117,560,977 | 117,560,977 |
| Total Other Investment Companies | ||
| (Cost $120,457,316) | 120,457,316 | |
| Number of Contracts | Notional Amount ($) | Current Value/ Unrealized Appreciation ($) | ||
| Futures Contracts | ||||
| Long | ||||
| Russell 2000 Index, e-mini expires 09/20/19 | 187 | 13,970,770 | 33,945 | |
| * | Non-income producing security. |
| (a) | All or a portion of this security is on loan. Securities on loan were valued at $112,803,065. |
| (b) | Fair-valued by management using significant unobservable inputs in accordance with procedures approved by the fund’s Board of Trustees. |
| (c) | The rate shown is the 7-day yield. |
| CVR — | Contingent Value Rights |
| REIT — | Real Estate Investment Trust |
| Security | Number of Shares | Value ($) |
| Common Stock99.7% of net assets | ||
| Automobiles & Components 0.2% | ||
| Harley-Davidson, Inc. | 543,537 | 17,338,830 |
| Thor Industries, Inc. | 178,421 | 8,191,308 |
| 25,530,138 | ||
| Banks 2.7% | ||
| Bank of Hawaii Corp. | 140,637 | 11,627,867 |
| Bank OZK | 412,302 | 10,637,392 |
| Boston Private Financial Holdings, Inc. | 289,099 | 3,070,231 |
| Comerica, Inc. | 540,779 | 33,339,025 |
| Fifth Third Bancorp | 2,619,964 | 69,298,048 |
| Huntington Bancshares, Inc. | 3,564,187 | 47,225,478 |
| KeyCorp | 3,436,141 | 57,039,941 |
| Northwest Bancshares, Inc. | 355,074 | 5,613,720 |
| PacWest Bancorp | 411,957 | 14,039,494 |
| Umpqua Holdings Corp. | 751,565 | 11,807,086 |
| 263,698,282 | ||
| Capital Goods 13.1% | ||
| 3M Co. | 1,960,656 | 317,077,288 |
| Cummins, Inc. | 492,887 | 73,573,243 |
| Eaton Corp. plc | 1,442,364 | 116,427,622 |
| Emerson Electric Co. | 2,092,809 | 124,710,488 |
| Fastenal Co. | 1,949,476 | 59,692,955 |
| Illinois Tool Works, Inc. | 1,027,900 | 154,041,094 |
| Lockheed Martin Corp. | 837,102 | 321,539,249 |
| MSC Industrial Direct Co., Inc., Class A | 153,155 | 10,356,341 |
| Rockwell Automation, Inc. | 407,133 | 62,205,851 |
| Snap-on, Inc. | 189,189 | 28,128,621 |
| Watsco, Inc. | 109,348 | 17,883,866 |
| 1,285,636,618 | ||
| Commercial & Professional Services 0.1% | ||
| Ennis, Inc. | 88,647 | 1,782,691 |
| Steelcase, Inc., Class A | 297,227 | 4,615,936 |
| 6,398,627 | ||
| Consumer Durables & Apparel 1.1% | ||
| Garmin Ltd. | 413,219 | 33,706,274 |
| Hasbro, Inc. | 393,928 | 43,517,226 |
| Leggett & Platt, Inc. | 446,993 | 16,623,670 |
| Polaris, Inc. | 195,401 | 16,026,790 |
| 109,873,960 | ||
| Consumer Services 0.8% | ||
| Cracker Barrel Old Country Store, Inc. | 81,762 | 13,523,435 |
| Darden Restaurants, Inc. | 420,719 | 50,898,585 |
| Wyndham Destinations, Inc. | 322,262 | 14,289,097 |
| 78,711,117 | ||
| Security | Number of Shares | Value ($) |
| Diversified Financials 4.3% | ||
| Ameriprise Financial, Inc. | 461,410 | 59,512,662 |
| BlackRock, Inc. | 414,298 | 175,065,763 |
| Cohen & Steers, Inc. | 73,578 | 3,968,062 |
| Eaton Vance Corp. | 392,532 | 16,925,980 |
| Evercore, Inc., Class A | 139,765 | 11,147,656 |
| Federated Investors, Inc., Class B | 325,244 | 10,420,818 |
| Franklin Resources, Inc. | 1,005,448 | 26,423,173 |
| Janus Henderson Group plc | 559,798 | 10,697,740 |
| Lazard Ltd., Class A | 440,827 | 15,137,999 |
| T. Rowe Price Group, Inc. | 804,401 | 88,982,839 |
| Waddell & Reed Financial, Inc., Class A | 264,832 | 4,282,333 |
| 422,565,025 | ||
| Energy 6.2% | ||
| Exxon Mobil Corp. | 5,864,076 | 401,571,924 |
| ONEOK, Inc. | 1,401,497 | 99,898,706 |
| Valero Energy Corp. | 1,421,992 | 107,047,558 |
| 608,518,188 | ||
| Food, Beverage & Tobacco 14.7% | ||
| Altria Group, Inc. | 6,382,586 | 279,174,312 |
| B&G Foods, Inc.(a) | 224,044 | 3,793,065 |
| Flowers Foods, Inc. | 623,091 | 14,206,475 |
| General Mills, Inc. | 2,031,934 | 109,318,049 |
| Kellogg Co. | 854,761 | 53,678,991 |
| PepsiCo, Inc. | 3,260,545 | 445,814,318 |
| The Coca-Cola Co. | 8,406,498 | 462,693,650 |
| The Hershey Co. | 473,405 | 75,025,224 |
| 1,443,704,084 | ||
| Health Care Equipment & Services 3.2% | ||
| Cardinal Health, Inc. | 1,014,815 | 43,768,971 |
| CVS Health Corp. | 4,416,595 | 269,058,967 |
| National HealthCare Corp. | 32,830 | 2,652,664 |
| 315,480,602 | ||
| Household & Personal Products 7.3% | ||
| Kimberly-Clark Corp. | 1,172,788 | 165,492,115 |
| Nu Skin Enterprises, Inc., Class A | 187,819 | 7,629,208 |
| The Clorox Co. | 436,359 | 69,014,539 |
| The Procter & Gamble Co. | 3,958,067 | 475,878,395 |
| 718,014,257 | ||
| Insurance 2.4% | ||
| Assurant, Inc. | 210,115 | 25,844,145 |
| Fidelity National Financial, Inc. | 937,733 | 41,203,988 |
| Mercury General Corp. | 92,976 | 4,974,216 |
| Principal Financial Group, Inc. | 881,140 | 46,894,271 |
| Prudential Financial, Inc. | 1,392,607 | 111,533,894 |
| Safety Insurance Group, Inc. | 49,486 | 4,772,430 |
| 235,222,944 | ||
| Security | Number of Shares | Value ($) |
| Materials 1.8% | ||
| Eastman Chemical Co. | 475,578 | 31,088,534 |
| Huntsman Corp. | 716,242 | 14,267,541 |
| International Paper Co. | 1,363,390 | 53,308,549 |
| Packaging Corp. of America | 321,597 | 32,346,226 |
| Schweitzer-Mauduit International, Inc. | 105,409 | 3,535,418 |
| Sonoco Products Co. | 340,387 | 19,470,136 |
| Steel Dynamics, Inc. | 781,611 | 21,103,497 |
| 175,119,901 | ||
| Media & Entertainment 0.6% | ||
| Omnicom Group, Inc. | 761,749 | 57,938,629 |
| Pharmaceuticals, Biotechnology & Life Sciences 6.4% | ||
| Bristol-Myers Squibb Co. | 5,559,294 | 267,235,263 |
| Pfizer, Inc. | 10,076,629 | 358,224,161 |
| 625,459,424 | ||
| Retailing 8.8% | ||
| American Eagle Outfitters, Inc. | 569,761 | 9,583,380 |
| Best Buy Co., Inc. | 796,641 | 50,706,200 |
| Foot Locker, Inc. | 383,489 | 13,878,467 |
| Genuine Parts Co. | 497,314 | 44,902,481 |
| Macy's, Inc. | 1,048,489 | 15,475,698 |
| Nordstrom, Inc.(a) | 363,600 | 10,533,492 |
| Target Corp. | 1,776,934 | 190,203,015 |
| The Buckle, Inc. | 97,419 | 1,909,412 |
| The Gap, Inc. | 726,091 | 11,464,977 |
| The Home Depot, Inc. | 2,182,178 | 497,340,188 |
| Williams-Sonoma, Inc. | 273,169 | 17,974,520 |
| 863,971,830 | ||
| Semiconductors & Semiconductor Equipment 13.2% | ||
| Intel Corp. | 9,371,962 | 444,324,718 |
| KLA Corp. | 562,482 | 83,191,088 |
| Maxim Integrated Products, Inc. | 931,229 | 50,789,230 |
| QUALCOMM, Inc. | 4,121,202 | 320,505,880 |
| Texas Instruments, Inc. | 3,195,607 | 395,456,366 |
| 1,294,267,282 | ||
| Software & Services 5.1% | ||
| International Business Machines Corp. | 3,030,062 | 410,664,303 |
| Paychex, Inc. | 1,088,143 | 88,901,283 |
| 499,565,586 | ||
| Technology Hardware & Equipment 0.0% | ||
| AVX Corp. | 160,124 | 2,169,680 |
| Telecommunication Services 4.5% | ||
| Verizon Communications, Inc. | 7,567,918 | 440,150,111 |
| Transportation 3.2% | ||
| C.H. Robinson Worldwide, Inc. | 465,550 | 39,334,319 |
| United Parcel Service, Inc., Class B | 2,369,921 | 281,214,826 |
| 320,549,145 | ||
| Total Common Stock | ||
| (Cost $9,115,761,049) | 9,792,545,430 | |
| Security | Number of Shares | Value ($) |
| Other Investment Companies0.2% of net assets | ||
| Money Market Fund 0.1% | ||
| State Street Institutional U.S. Government Money Market Fund, Premier Class 2.07%(b) | 5,078,698 | 5,078,698 |
| Securities Lending Collateral 0.1% | ||
| Wells Fargo Government Money Market Fund, Select Class 2.03%(b) | 12,662,275 | 12,662,275 |
| Total Other Investment Companies | ||
| (Cost $17,740,973) | 17,740,973 | |
| Number of Contracts | Notional Amount ($) | Current Value/ Unrealized Appreciation ($) | ||
| Futures Contracts | ||||
| Long | ||||
| S&P 500 Index, e-mini, expires 09/20/19 | 177 | 25,884,480 | 219,191 | |
| (a) | All or a portion of this security is on loan. Securities on loan were valued at $12,089,459. |
| (b) | The rate shown is the 7-day yield. |
Table of Contents

Report of Independent Registered Public Accounting Firm
TotheBoard of Trustees of Schwab Strategic Trust and Shareholders of theSchwab U.S. Broad Market ETF, Schwab U.S.Large-Cap ETF, Schwab U.S.Large-Cap Growth ETF, Schwab U.S.Large-Cap Value ETF, Schwab U.S.Mid-Cap ETF, Schwab U.S.Small-Cap ETF, Schwab U.S. Dividend Equity ETF, Schwab 1000 Index ETF, Schwab International Equity ETF, Schwab InternationalSmall-Cap Equity ETF and Schwab Emerging Markets Equity ETF
Opinion on the Financial Statements
We have audited the accompanying statements of assets and liabilities, including the condensed portfolio holdings, of Schwab U.S. Broad Market ETF, Schwab U.S.Large-Cap ETF, Schwab U.S.Large-Cap Growth ETF, Schwab U.S.Large-Cap Value ETF, Schwab U.S.Mid-Cap ETF, Schwab U.S.Small-Cap ETF, Schwab U.S. Dividend Equity ETF, Schwab 1000 Index ETF, Schwab International Equity ETF, Schwab InternationalSmall-Cap Equity ETF and Schwab Emerging Markets Equity ETF (eleven of the funds constituting Schwab Strategic Trust, hereafter collectively referred to as the “Funds”) as of August 31, 2019, the related statements of operationsfor the year ended August 31, 2019, the statements of changes in net assetsfor each of the periods indicated in the table below, including the related notes, and the financial highlights for each of the periods indicated therein (included in Item 1 of this FormN-CSR) and the portfolio holdings (included in Item 6 of this FormN-CSR) as of August 31, 2019 (collectively referred to as the “financial statements”). In our opinion, the financial statements present fairly, in all material respects, the financial position of each of the Funds as of August 31, 2019, the results of each of their operations for the year then ended, the changes in each of their net assets for each of the periods indicated in the table below and the financial highlights for each of the periods indicated therein in conformity with accounting principles generally accepted in the United States of America.
Schwab U.S. Broad Market ETF, Schwab U.S.Large-Cap ETF, Schwab U.S.Large-Cap Growth ETF, Schwab U.S.Large-Cap Value ETF, Schwab U.S.Mid-Cap ETF, Schwab U.S.Small-Cap ETF, Schwab U.S. Dividend Equity ETF, Schwab International Equity ETF, Schwab InternationalSmall-Cap Equity ETF and Schwab Emerging Markets Equity ETF: statements of changes in net assets for each of the two years in the period ended August 31, 2019.
Schwab 1000 Index ETF: statements of changes in net assets for the period October 11, 2017 (commencement of operations) through August 31, 2018 and for the year ended August 31, 2019.
Basis for Opinion
These financial statements are the responsibility of the Fund’s management. Our responsibility is to express an opinion on the Fund’s financial statements based on our audits. We are a public accounting firm registered with the Public Company Accounting Oversight Board (United States) (PCAOB) and are required to be independent with respect to the Fund in accordance with the U.S. federal securities laws and the applicable rules and regulations of the Securities and Exchange Commission and the PCAOB.
We conducted our audits of these financial statements in accordance with the standards of the PCAOB. Those standards require that we plan and perform the audit to obtain reasonable assurance about whether the financial statements are free of material misstatement, whether due to error or fraud.
Our audits included performing procedures to assess the risks of material misstatement of the financial statements, whether due to error or fraud, and performing procedures that respond to those risks. Such procedures included examining, on a test basis, evidence regarding the amounts and disclosures in the
PricewaterhouseCoopers LLP, Three Embarcadero Center, San Francisco, CA 94111-4004 T: (415) 498 5000, F: (415) 498 7100, www.pwc.com/us |
Table of Contents
financial statements. Our audits also included evaluating the accounting principles used and significant estimates made by management, as well as evaluating the overall presentation of the financial statements. Our procedures included confirmation of securities owned as of August 31, 2019 by correspondence with the custodian and brokers; when replies were not received from brokers, we performed other auditing procedures. We believe that our audits provide a reasonable basis for our opinion.

San Francisco, California
October 17, 2019
We have served as the auditor of one or more investment companies in the Schwab Funds Complexsince 1989.
2 of 2
Table of Contents
Item 7: Disclosure of Proxy Voting Policies and Procedures forClosed-End Management Investment Companies.
Not applicable.
Item 8: Portfolio Managers ofClosed-End Management Investment Companies.
Not applicable.
Item 9: Purchases of Equity Securities byClosed-End Management Investment Company and Affiliated Purchasers.
Not applicable.
Item 10: Submission of Matters to a Vote of Security Holders.
Not applicable.
Item 11: Controls and Procedures.
| (a) | Based on their evaluation of Registrant’s disclosure controls and procedures, as of a date within 90 days of the filing date, Registrant’s Chief Executive Officer, Jonathan de St. Paer and Registrant’s Chief Financial Officer, Mark Fischer, have concluded that Registrant’s disclosure controls and procedures are: (i) reasonably designed to ensure that information required to be disclosed in this report is appropriately communicated to Registrant’s officers to allow timely decisions regarding disclosures required in this report; (ii) reasonably designed to ensure that information required to be disclosed in this report is recorded, processed, summarized and reported in a timely manner; and (iii) are effective in achieving the goals described in (i) and (ii) above. |
| (b) | During the period covered by this report, there have been no changes in Registrant’s internal control over financial reporting that the above officers believe to have materially affected, or to be reasonably likely to materially affect, Registrant’s internal control over financial reporting. |
Item 12: Disclosure of Securities Lending Activities forClosed-End Management Investment Companies.
Not applicable.
Table of Contents
Item 13: Exhibits.
| (a) (1) | Registrant’s code of ethics (that is the subject of the disclosure required by Item 2(a)) is attached. | |||
| (2) | Separate certifications for Registrant’s principal executive officer and principal financial officer, as required byRule 30a-2(a) under the 1940 Act, are attached. | |||
| (3) | Not applicable. | |||
| (b) | A certification for Registrant’s principal executive officer and principal financial officer, as required by Rule30a-2(b) under the 1940 Act, is attached. This certification is being furnished to the Securities and Exchange Commission solely pursuant to 18 U.S.C. section 1350 and is not being filed as part of the FormN-CSR with the Commission. |
Pursuant to the requirements of the Securities Exchange Act of 1934 and the Investment Company Act of 1940, the registrant has duly caused this report to be signed on its behalf by the undersigned, thereunto duly authorized.
(Registrant)Schwab Strategic Trust
| By: | /s/ Jonathan de St. Paer | |
Jonathan de St. Paer Chief Executive Officer | ||
| Date: | October 17, 2019 | |
Pursuant to the requirements of the Securities Exchange Act of 1934 and the Investment Company Act of 1940, this report has been signed below by the following persons on behalf of the registrant and in the capacities and on the dates indicated.
| By: | /s/ Jonathan de St. Paer | |
Jonathan de St. Paer Chief Executive Officer | ||
| Date: | October 17, 2019 | |
| By: | /s/ Mark Fischer | |
Mark Fischer Chief Financial Officer | ||
| Date: | October 17, 2019 | |