UNITED STATES
SECURITIES AND EXCHANGE COMMISSION
Washington, D.C. 20549
FORM N-CSR
CERTIFIED SHAREHOLDER REPORT OF REGISTERED
MANAGEMENT INVESTMENT COMPANIES
Investment Company Act file number: 811-22311
Schwab Strategic Trust – Schwab U.S. REIT ETF and Schwab Fundamental Index ETFs
(Exact name of registrant as specified in charter)
211 Main Street, San Francisco, California 94105
(Address of principal executive offices) (Zip code)
Jonathan de St. Paer
Schwab Strategic Trust – Schwab U.S. REIT ETF and Schwab Fundamental Index ETFs
211 Main Street, San Francisco, California 94105
(Name and address of agent for service)
Registrant’s telephone number, including area code: (415) 636-7000
Date of fiscal year end: February 28
Date of reporting period: February 28, 2023
Item 1: Report(s) to Shareholders.
Annual Report | February 28, 2023
Schwab U.S. REIT ETF
Ticker Symbol SCHH
This page is intentionally left blank.
Fund investment adviser: Charles Schwab Investment Management, Inc., dba Schwab Asset ManagementTM
Distributor: SEI Investments Distribution Co. (SIDCO)
The Sector/Industry classifications in this report use the Global Industry Classification Standard (GICS) which was developed by and is the exclusive property of MSCI Inc. (MSCI) and Standard & Poor’s (S&P). GICS is a service mark of MSCI and S&P and has been licensed for use by Charles Schwab & Co., Inc. The Industry classifications used in the Portfolio Holdings are sub-categories of Sector classifications.
Schwab U.S. REIT ETF | Annual Report1
The performance data quoted represents past performance. Past performance does not guarantee future results. Investment returns and principal value of an investment will fluctuate so that an investor’s shares, when sold or redeemed, may be worth more or less than the original cost. Current performance may be lower or higher than the performance data quoted. To obtain performance information current to the most recent month end, please visit www.schwabassetmanagement.com/schwabetfs_prospectus.
Total Returns for the 12 Months Ended February 28, 2023 |
Schwab U.S. REIT ETF (Ticker Symbol: SCHH) | |
| |
| |
Dow Jones Equity All REIT Capped Index | |
ETF Category: Morningstar Real Estate2 | |
| |
All total returns on this page assume dividends and distributions were reinvested. Index figures do not include trading and management costs, which would lower performance. Indices are unmanaged and cannot be invested in directly. Performance results less than one year are not annualized.
For index definitions, please see the Glossary.
Small-company stocks are subject to greater volatility than many other asset classes.
The fund is subject to risks associated with the direct ownership of real estate securities and an investment in the fund will be closely linked to the performance of the real estate markets.
Performance does not reflect the deduction of taxes that a shareholder would pay on fund distributions or on the redemption or sale of fund shares.
Shares are bought and sold at market price, which may be higher or lower than the net asset value (NAV). Brokerage commissions will reduce returns.
Index ownership — Dow Jones® is a registered trademark of Dow Jones Trademark Holdings LLC (Dow Jones). The Dow Jones Equity All REIT Capped Index (the Index) is a product of S&P Dow Jones Indices LLC, and the trademark and Index have been licensed for use by Charles Schwab Investment Management, Inc. The Schwab U.S. REIT ETF is not sponsored, endorsed, sold or promoted by S&P Dow Jones Indices LLC, Dow Jones, or any of their respective affiliates and neither S&P Dow Jones Indices LLC, Dow Jones, nor any of their respective affiliates make any representation regarding the advisability of investing in such product.
1
ETF performance must be shown based on both a market price and NAV basis. The fund’s per share NAV is the value of one share of the fund. NAV is calculated by taking the fund’s total assets (including the fair value of securities owned), subtracting liabilities, and dividing by the number of shares outstanding. The NAV Return is based on the NAV of the fund, and the Market Price Return is based on the market price per share of the fund. The price used to calculate market return (Market Price) is determined using the Official Closing Price on the primary stock exchange (generally, 4:00 p.m. Eastern time) and may not represent the returns you would receive if shares were traded at other times. Market Price and NAV returns assume that dividends and capital gain distributions have been reinvested in the fund at Market Price and NAV, respectively.
2
Source for category information: Morningstar, Inc. The Morningstar Category return represents all passively- and actively-managed ETFs and mutual funds within the category as of the report date.
2Schwab U.S. REIT ETF | Annual Report
The Investment Environment
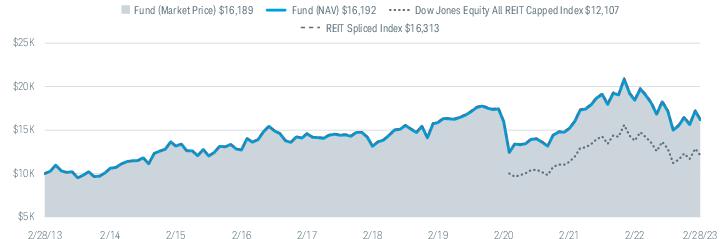
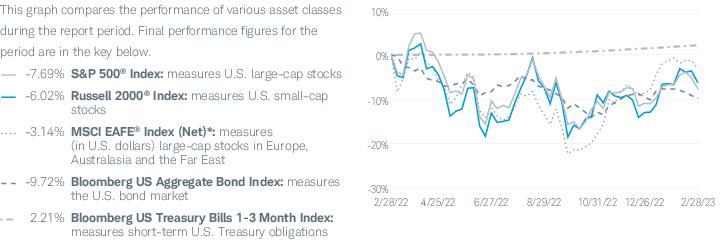
For the 12-month reporting period ended February 28, 2023, U.S. equity markets lost ground as inflation spiked, interest rates rose, and economic growth around the world slowed. The ongoing war between Russia and Ukraine and the continuing, albeit uneven, fallout from the COVID-19 pandemic weighed on economies and markets around the world. U.S. real estate securities mostly underperformed the broader U.S. equity market. For the reporting period, the Dow Jones Equity All REIT Capped IndexTM, which represents U.S. real estate investment trusts (REITs), returned -12.15%. The FTSE EPRA Nareit Global Index (Net)*, which represents general trends in eligible real estate securities worldwide, returned -15.18%. Over the same period, the S&P 500® Index, a bellwether for the overall U.S. stock market, returned -7.69%.
After recovering from severe pressures early in the COVID-19 pandemic, U.S. REITs began to weaken early in the reporting period as inflation continued to rise and the U.S. Federal Reserve (Fed) began raising interest rates, dampening demand. Following a rebound between mid-June and mid-August 2022, U.S. REITs again slumped, hitting reporting-period lows in mid-October 2022 before generally rising again. Among REIT sub-industries in the Dow Jones Equity All REIT Capped Index, all posted losses for the reporting period. Office REITs were the weakest sub-industry, as remote work maintained momentum, even as COVID-19 restrictions diminished, and office vacancies soared. Residential REITs were also comparatively weak, as high valuations, rising interest rates, and slowing rent growth expectations discouraged investors.
Amid fading government stimuli, ongoing supply chain disruptions, persisting inflation, and a widening U.S. trade deficit, U.S. gross domestic product (GDP) contracted for the first and second quarters of 2022, decreasing at an annualized rate of -1.6% and -0.6%, respectively. GDP grew in the last two quarters, at an annualized rate of 3.2% and 2.6% for the third and fourth quarters, respectively. Inflation rose steadily in the first half of 2022, hitting a 40-year high in June 2022, before declining through the end of the reporting period, as certain consumer and energy prices began to recede. The unemployment rate remained low despite inflationary pressures, ending the reporting period near pre-pandemic lows.
Asset Class Performance Comparison % returns during the 12 months ended February 28, 2023
Index figures assume dividends and distributions were reinvested. Index figures do not include trading and management costs, which would lower performance. Indices are unmanaged and cannot be invested in directly. Performance results less than one year are not annualized. Past performance is not a guarantee of future results.
For index definitions, please see the Glossary.
Data source: Index provider websites and Schwab Asset Management.
Nothing in this report represents a recommendation of a security by the investment adviser.
Management views may have changed since the report date.
*
The net version of the index reflects reinvested dividends net of withholding taxes but reflects no deductions for expenses or other taxes.
Schwab U.S. REIT ETF | Annual Report3
The Investment Environment (continued)
Monetary policy around the world varied as central banks responded to the changing conditions. In the United States, after maintaining the federal funds rate in a range of 0.00% to 0.25% from mid-March 2020 through mid-March 2022, the Fed shifted its stance as inflation continued to rise and indicators of economic activity and employment continued to strengthen. After issuing successively stronger signals that interest rates could begin to rise sooner in 2022 than previously anticipated, the Fed raised the federal funds rate eight times during the reporting period. The federal funds rate ended the reporting period in a range of 4.50% to 4.75%. The Fed wrapped up its bond-buying program in March 2022, and in June 2022 began to reduce the $9 trillion in assets held on its balance sheet, vowing to be even more aggressive than during its last round of quantitative tightening between 2017 and 2019.
4Schwab U.S. REIT ETF | Annual Report
| Christopher Bliss, CFA, Managing Director and Head of Passive Equity Strategies for Schwab Asset Management, is responsible for overseeing the investment process and portfolio management of investment strategies for passive equity Schwab Funds and Schwab ETFs. Before joining Schwab in 2016, Mr. Bliss spent 12 years at BlackRock (formerly Barclays Global Investors) managing and leading institutional index teams, most recently as a managing director and the head of the Americas institutional index team. In this role, Mr. Bliss was responsible for overseeing a team of portfolio managers managing domestic, developed international and emerging markets index strategies. Prior to BlackRock, he worked as an equity analyst and portfolio manager for Harris Bretall and before that, as a research analyst for JP Morgan. |
| Jeremy Brown, CFA, Senior Portfolio Manager for Schwab Asset Management, is responsible for the day-to-day co-management of the fund. Prior to joining Schwab in 2017, Mr. Brown spent six years with ALPS Advisors, Inc. in Denver, most recently as a senior analyst on the ETF portfolio management and research team where he performed portfolio management, trading, and analytics/research functions for ALPS ETFs and passive funds. Additionally, Mr. Brown led a number of investment research, commentary, industry trend analysis, and sales and marketing support initiatives. |
| Ferian Juwono, CFA, Senior Portfolio Manager for Schwab Asset Management, is responsible for the day-to-day co-management of the fund. Prior to joining Schwab in 2010, Mr. Juwono worked at BlackRock (formerly Barclays Global Investors) where he spent more than three years as a portfolio manager, managing equity index funds for institutional clients, and two years as a senior business analyst. Prior to that, Mr. Juwono worked for more than four years as a senior financial analyst with Union Bank of California. |
| Sabya Sinha, Portfolio Manager for Schwab Asset Management, is responsible for the day-to-day co-management of the fund. Prior to joining Schwab in 2015, Mr. Sinha spent a year at F-Squared Investments on the product development and analytics team. Prior to F-Squared, he worked at IndexIQ Advisors as a senior index portfolio manager for three years and for Bank of America’s Columbia Management subsidiary as a portfolio manager for three years. Mr. Sinha also spent time as a software consultant at DPM Mellon, LLC and an equity trader at Jane Street Capital. |
Schwab U.S. REIT ETF | Annual Report5
Schwab U.S. REIT ETF as of February 28, 2023
The Schwab U.S. REIT ETF’s (the fund) goal is to track as closely as possible, before fees and expenses, the total return of an index composed of U.S. real estate investment trusts (REITs) classified as equities. To pursue its goal, the fund generally invests in securities that are included in the Dow Jones Equity All REIT Capped Index (the index). The index is a float-adjusted market capitalization weighted index that is subject to capping constraints at each quarterly rebalancing. The index generally includes all publicly traded equity REITs with a minimum float-adjusted market capitalization of $200 million and a three-month median daily value traded of at least $5 million. For more information concerning the fund’s investment objective, strategies, and risks, please see the fund’s prospectus.
Market Highlights. For the 12-month reporting period ended February 28, 2023, U.S. equity markets lost ground as inflation spiked, interest rates rose, and economic growth around the world slowed. The ongoing war between Russia and Ukraine and the continuing, albeit uneven, fallout from the COVID-19 pandemic weighed on economies and markets around the world. U.S. real estate securities mostly underperformed the broader U.S. equity market. After recovering from severe pressures early in the COVID-19 pandemic, U.S. REITs began to weaken early in the reporting period as inflation continued to rise and the U.S. Federal Reserve (Fed) began raising interest rates, dampening demand. Following a rebound between mid-June and mid-August 2022, U.S. REITs again slumped, hitting reporting-period lows in mid-October 2022 before generally rising again.
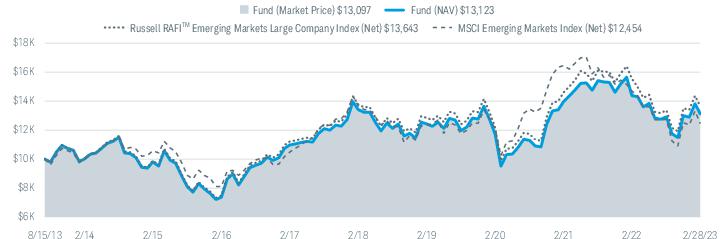
Performance. For the 12-month reporting period ended February 28, 2023, the fund’s market price return was -12.16% and its NAV return was -12.22% (for an explanation of the market price and NAV returns, please refer to footnote 3 on the following page.) The index returned -12.15% during the same period. Differences between the return of the fund and the return of the index may be attributable to, among other things, the trading and management costs incurred by the fund and not the index.
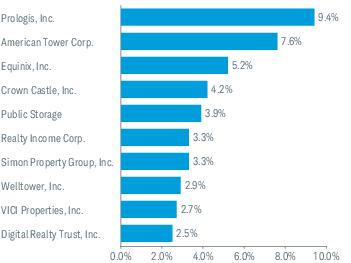
Contributors and Detractors. The specialized REITs sub-industry detracted the most from the total return of the fund over the reporting period. Specialized REITs represented an average weight of approximately 39% of the fund’s investments and returned approximately -8% for the reporting period. One example from this sub-industry is Crown Castle, Inc., which manages and offers wireless communication coverage and infrastructure sites in the United States and Australia. The fund’s holdings of Crown Castle, Inc. represented an average weight of approximately 5% of the fund’s investments and returned approximately -18% for the reporting period.
The residential REITs sub-industry also detracted from the total return of the fund, representing an average weight of approximately 15% of the fund’s investments and returning approximately -20% for the reporting period.
The retail REITs sub-industry was the only sub-industry that contributed to the total return of the fund over the reporting period. Retail REITs represented an average weight of approximately 12% of the fund’s investments and returned approximately -3% for the reporting period. One example from this sub-industry is Realty Income Corp., which owns and manages a portfolio of commercial properties located across the United States. The fund’s Class A holdings of Realty Income Corp. represented an average weight of approximately 3% of the fund’s investments and returned approximately 1% for the reporting period.
While there were no additional sub-industries that contributed to the total return of the fund, the security & alarm services REITs sub-industry was the smallest detractor from the total return of the fund, representing an average weight of less than 1% of the fund’s investments and returning approximately -4% for the reporting period.
Management views and portfolio holdings may have changed since the report date.
6Schwab U.S. REIT ETF | Annual Report
Performance and Fund Facts as of February 28, 2023
The performance data quoted represents past performance. Past performance does not guarantee future results. Investment returns and principal value of an investment will fluctuate so that an investor’s shares, when sold or redeemed, may be worth more or less than the original cost. Current performance may be lower or higher than the performance data quoted. To obtain performance information current to the most recent month end, please visit www.schwabassetmanagement.com/schwabetfs_prospectus.
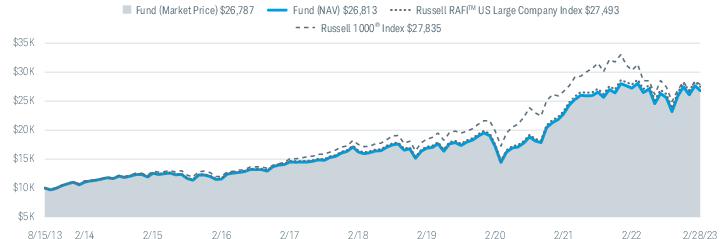
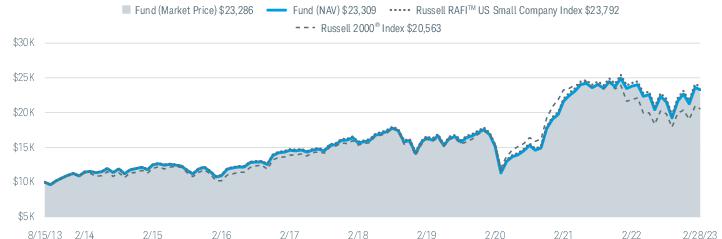
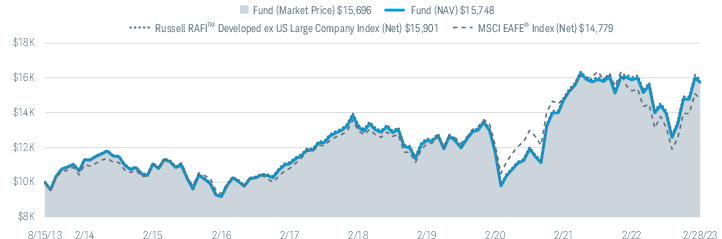
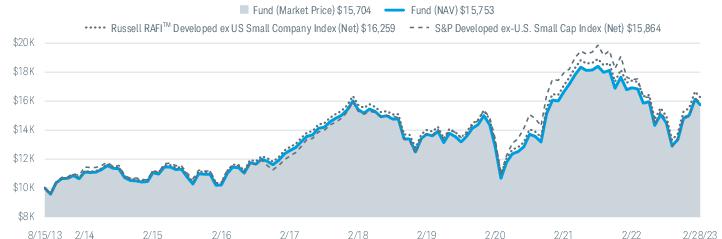
Performance of Hypothetical $10,000 Investment (February 28, 2013 – February 28, 2023)1,2
Average Annual Total Returns1
| | | |
Fund: Schwab U.S. REIT ETF (1/13/11) | | | |
| | | |
| | | |
Dow Jones Equity All REIT Capped Index2 | | | |
| | | |
ETF Category: Morningstar Real Estate4 | | | |
Fund Expense Ratio5: 0.07% |
All total returns on this page assume dividends and distributions were reinvested. Index figures do not include trading and management costs, which would lower performance. Indices are unmanaged and cannot be invested in directly. Performance results less than one year are not annualized.
The first index listed for the fund is the fund’s primary benchmark, as shown in the prospectus. Additional indices shown are provided for comparative purposes.
For index definitions, please see the Glossary.
Small-company stocks may be subject to greater volatility than many other asset classes.
The fund is subject to risks associated with the direct ownership of real estate securities, and an investment in the fund will be closely linked to the performance of the real estate markets.
Shares are bought and sold at market price, which may be higher or lower than the net asset value (NAV). Brokerage commissions will reduce returns.
Index ownership — Dow Jones® is a registered trademark of Dow Jones Trademark Holdings LLC (Dow Jones). The Dow Jones Equity All REIT Capped Index (the Index) is a product of S&P Dow Jones Indices LLC, and the trademark and Index have been licensed for use by Charles Schwab Investment Management, Inc. The Schwab U.S. REIT ETF is not sponsored, endorsed, sold or promoted by S&P Dow Jones Indices LLC, Dow Jones, or any of their respective affiliates and neither S&P Dow Jones Indices LLC, Dow Jones, nor any of their respective affiliates make any representation regarding the advisability of investing in such product.
1
Performance does not reflect the deduction of taxes that a shareholder would pay on fund distributions or on the redemption or sale of fund shares.
2
The inception date of the Dow Jones Equity All REIT Capped Index is April 13, 2020. The fund began tracking the index on June 22, 2020.
3
ETF performance must be shown based on both a market price and NAV basis. The fund’s per share NAV is the value of one share of the fund. NAV is calculated by taking the fund’s total assets (including the fair value of securities owned), subtracting liabilities, and dividing by the number of shares outstanding. The NAV Return is based on the NAV of the fund, and the Market Price Return is based on the market price per share of the fund. The price used to calculate market return (Market Price) is determined using the Official Closing Price on the primary stock exchange (generally, 4:00 p.m. Eastern time) and may not represent the returns you would receive if shares were traded at other times. NAV is used as a proxy for purposes of calculating Market Price Return on inception date. Market Price and NAV returns assume that dividends and capital gain distributions have been reinvested in the fund at Market Price and NAV, respectively.
4
Source for category information: Morningstar, Inc. The Morningstar Category return represents all passively- and actively-managed ETFs and mutual funds within the category as of the report date.
5
As stated in the prospectus.
Schwab U.S. REIT ETF | Annual Report7
Performance and Fund Facts as of February 28, 2023 (continued)
| |
Weighted Average Market Cap (millions) | |
Price/Earnings Ratio (P/E) | |
| |
| |
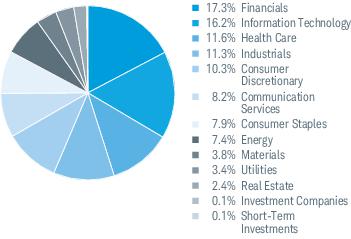
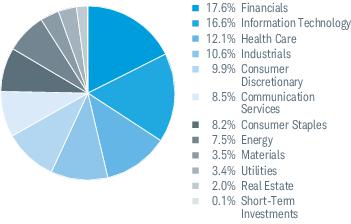
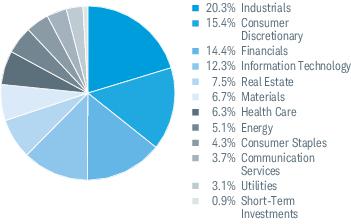
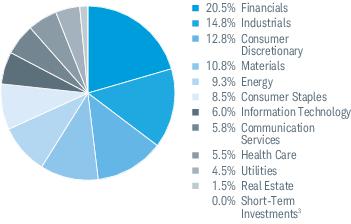
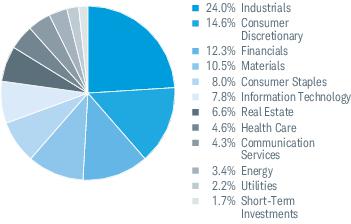
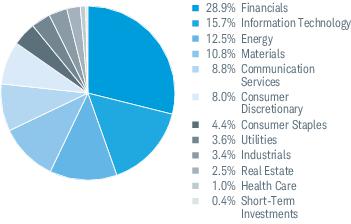
Industry Weightings % of Investments3
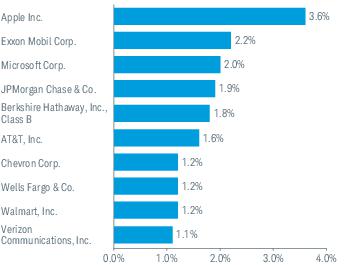
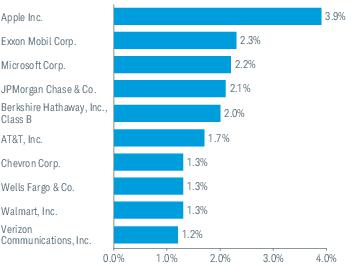
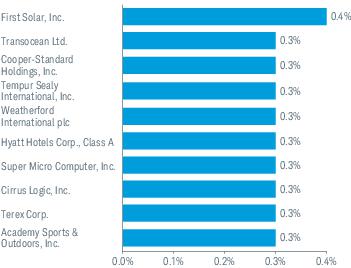
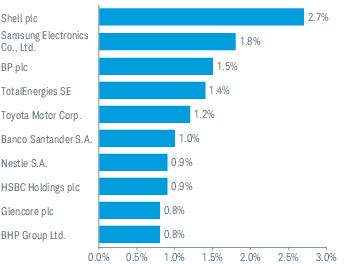
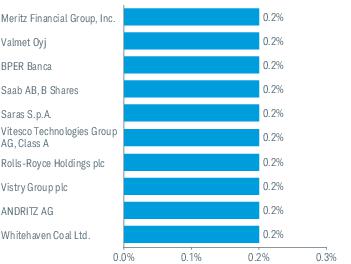
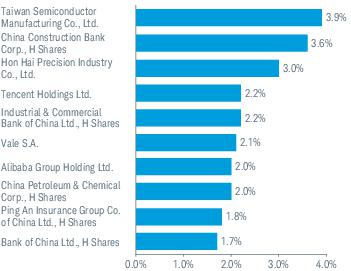
Top Equity Holdings % of Net Assets4
Portfolio holdings may have changed since the report date.
An index is a statistical composite of a specified financial market or sector. Unlike the fund, an index does not actually hold a portfolio of securities and its return is not inclusive of trading and management costs incurred by the fund.
Source of Industry Classification: S&P and MSCI.
2
Portfolio turnover rate excludes securities received or delivered from processing of in-kind creations or redemptions.
3
The percentage may differ from the Portfolio Holdings because the above calculation is based on a percentage of total investments, excluding derivatives, whereas the calculation in the Portfolio Holdings is based on a percentage of net assets.
4
This list is not a recommendation of any security by the investment adviser.
8Schwab U.S. REIT ETF | Annual Report
Fund Expenses (Unaudited)
Examples for a $1,000 Investment
As a fund shareholder, you may incur two types of costs: (1) transaction costs, including brokerage commissions on purchases and sales of fund shares; and, (2) ongoing costs, including management fees.
The expense examples below are intended to help you understand your ongoing cost (in dollars) of investing in the fund and to compare this cost with the ongoing cost of investing in other mutual funds. These examples are based on an investment of $1,000 invested for six months beginning September 1, 2022 and held through February 28, 2023.
The Actual Return line in the table below provides information about actual account values and actual expenses. You may use this information, together with the amount you invested, to estimate the expenses that you paid over the period. To do so, simply divide your account value by $1,000 (for example, an $8,600 account value ÷ $1,000 = 8.6), then multiply the result by the number given for the fund under the heading entitled “Expenses Paid During Period.”
The Hypothetical Return line in the table below provides information about hypothetical account values and hypothetical expenses based on the fund’s actual expense ratio and an assumed return of 5% per year before expenses. Because the return used is not an actual return, it may not be used to estimate the actual ending account value or expenses you paid for the period.
You may use this information to compare the ongoing costs of investing in the fund and other funds. To do so, compare this 5% hypothetical example with the 5% hypothetical examples that appear in the shareholder reports of the other funds.
Please note that the expenses shown in the table are meant to highlight your ongoing costs only and do not reflect any transactional costs, including any brokerage commissions you may pay when purchasing or selling shares of a fund. Therefore, the hypothetical return line of the table is useful in comparing ongoing costs only and will not help you determine the relative total costs of owning different funds. In addition, if these transactional costs were included, your costs would have been higher.
| | BEGINNING
ACCOUNT VALUE
AT 9/1/22 | ENDING
ACCOUNT VALUE
(NET OF EXPENSES)
AT 2/28/23 | EXPENSES PAID
DURING PERIOD
|
| | | | |
| | | | |
| | | | |
| Based on the most recent six-month expense ratio. |
| Expenses for the fund are equal to its annualized expense ratio, multiplied by the average account value over the period, multiplied by 181 days in the period, and divided by 365 days in the fiscal year. |
Schwab U.S. REIT ETF | Annual Report9
Financial Statements
| | | | | | |
|
Net asset value at beginning of period | | | | | | |
Income (loss) from investment operations: | | | | | | |
Net investment income (loss)2 | | | | | | |
Net realized and unrealized gains (losses) | | | | | | |
Total from investment operations | | | | | | |
| | | | | | |
Distributions from net investment income | | | | | | |
Net asset value at end of period | | | | | | |
| | | | | | |
|
Ratios to average net assets: | | | | | | |
| | | | | | |
Net investment income (loss) | | | | | | |
| | | | | | |
Net assets, end of period (x 1,000,000) | | | | | | |
| Per-Share Data has been retroactively adjusted to reflect a 2-for-1 share split effective after market close on March 10, 2022 (see financial note 12 for additional information). |
| Calculated based on the average shares outstanding during the period. |
| Ratio includes less than 0.005% of non-routine proxy expenses. |
| Portfolio turnover rate excludes securities received or delivered from processing of in-kind creations or redemptions. |
10Schwab U.S. REIT ETF | Annual Report
Portfolio Holdings as of February 28, 2023
This section shows all the securities in the fund’s portfolio and their values as of the report date.
The fund files its complete schedule of portfolio holdings with the U.S. Securities and Exchange Commission (SEC) for the first and third quarters of each fiscal year on Form N-PORT Part F. The fund’s Form N-PORT Part F is available on the SEC’s website at www.sec.gov. You can also obtain this information at no cost on the fund’s website at www.schwabassetmanagement.com/schwabetfs_prospectus, by calling 1-866-414-6349, or by sending an email request to orders@mysummaryprospectus.com. The fund also makes available its complete schedule of portfolio holdings on a daily basis on the fund’s website.
| | |
COMMON STOCKS 99.8% OF NET ASSETS |
|
|
Alexander & Baldwin, Inc. | | |
American Assets Trust, Inc. | | |
Armada Hoffler Properties, Inc. | | |
Broadstone Net Lease, Inc. | | |
Empire State Realty Trust, Inc., Class A | | |
Essential Properties Realty Trust, Inc. | | |
| | |
| | |
| | |
| | |
|
|
| | |
Global Medical REIT, Inc. | | |
Healthcare Realty Trust, Inc. | | |
Healthpeak Properties, Inc. | | |
| | |
Medical Properties Trust, Inc. | | |
National Health Investors, Inc. | | |
Omega Healthcare Investors, Inc. | | |
| | |
Sabra Health Care REIT, Inc. | | |
| | |
| | |
| | |
|
Hotel & Resort REITs 3.0% |
Apple Hospitality REIT, Inc. | | |
Ashford Hospitality Trust, Inc. * | | |
| | |
DiamondRock Hospitality Co. | | |
Host Hotels & Resorts, Inc. | | |
Park Hotels & Resorts, Inc. | | |
| | |
| | |
Ryman Hospitality Properties, Inc. | | |
| | |
Summit Hotel Properties, Inc. | | |
Sunstone Hotel Investors, Inc. | | |
Xenia Hotels & Resorts, Inc. | | |
| | |
|
|
Americold Realty Trust, Inc. | | |
EastGroup Properties, Inc. | | |
First Industrial Realty Trust, Inc. | | |
Industrial Logistics Properties Trust | | |
Innovative Industrial Properties, Inc. | | |
| | |
Plymouth Industrial REIT, Inc. | | |
| | |
| | |
Rexford Industrial Realty, Inc. | | |
| | |
| | |
| | |
|
|
Alexandria Real Estate Equities, Inc. | | |
| | |
| | |
| | |
Corporate Office Properties Trust | | |
| | |
| | |
Easterly Government Properties, Inc. | | |
| | |
Highwoods Properties, Inc. | | |
Hudson Pacific Properties, Inc. | | |
| | |
| | |
Office Properties Income Trust | | |
| | |
| | |
Piedmont Office Realty Trust, Inc., Class A | | |
SL Green Realty Corp. (a) | | |
Veris Residential, Inc. * | | |
| | |
| | |
|
|
American Homes 4 Rent, Class A | | |
Apartment Income REIT Corp. | | |
Apartment Investment & Management Co., Class A | | |
AvalonBay Communities, Inc. | | |
| | |
| | |
| | |
Equity LifeStyle Properties, Inc. | | |
| | |
Essex Property Trust, Inc. | | |
Independence Realty Trust, Inc. | | |
| | |
Mid-America Apartment Communities, Inc. | | |
NexPoint Residential Trust, Inc. | | |
| | |
| | |
| | |
| | |
|
Schwab U.S. REIT ETF | Annual Report11
Portfolio Holdings as of February 28, 2023 (continued)
| | |
|
| | |
| | |
Brixmor Property Group, Inc. | | |
Federal Realty Investment Trust | | |
| | |
InvenTrust Properties Corp. | | |
| | |
| | |
National Retail Properties, Inc. | | |
| | |
Phillips Edison & Co., Inc. | | |
| | |
| | |
Retail Opportunity Investments Corp. | | |
| | |
Simon Property Group, Inc. | | |
| | |
Spirit Realty Capital, Inc. | | |
Tanger Factory Outlet Centers, Inc. | | |
| | |
The Necessity Retail REIT, Inc. | | |
| | |
| | |
|
|
| | |
| | |
| | |
Digital Realty Trust, Inc. | | |
| | |
| | |
Extra Space Storage, Inc. | | |
| | |
Four Corners Property Trust, Inc. | | |
Gaming & Leisure Properties, Inc. | | |
| | |
| | |
Lamar Advertising Co., Class A | | |
| | |
National Storage Affiliates Trust | | |
| | |
| | |
| | |
| | |
| | |
| | |
| | |
| | |
| | |
| | |
| | |
Total Common Stocks
(Cost $5,874,284,833) | |
| | |
SHORT-TERM INVESTMENTS 0.2% OF NET ASSETS |
|
|
State Street Institutional U.S. Government Money Market Fund, Premier Class 4.43% (b) | | |
State Street Institutional U.S. Government Money Market Fund, Premier Class 4.43% (b)(c) | | |
| | |
Total Short-Term Investments
(Cost $9,761,293) | |
Total Investments in Securities
(Cost $5,884,046,126) | |
| | | CURRENT VALUE/
UNREALIZED
DEPRECIATION
($) |
|
| | | |
Dow Jones U.S. Real Estate Index, expires 03/17/23 | | | |
| Non-income producing security. |
| All or a portion of this security is on loan. Securities on loan were valued at $4,617,180. |
| The rate shown is the annualized 7-day yield. |
| Security purchased with cash collateral received for securities on loan. |
| Real Estate Investment Trust |
12Schwab U.S. REIT ETF | Annual Report
Portfolio Holdings as of February 28, 2023 (continued)
The following is a summary of the inputs used to value the fund’s investments as of February 28, 2023 (see financial note 2(a) for additional information):
| QUOTED PRICES IN
ACTIVE MARKETS FOR
IDENTICAL ASSETS
(LEVEL 1) | OTHER SIGNIFICANT
OBSERVABLE INPUTS
(LEVEL 2) | SIGNIFICANT
UNOBSERVABLE INPUTS
(LEVEL 3) | |
| | | | |
| | | | |
| | | | |
| | | | |
| | | | |
| | | | |
| As categorized in the Portfolio Holdings. |
| Futures contracts are reported at cumulative unrealized appreciation or depreciation. |
Fund investments in mutual funds are classified as Level 1, without consideration to the classification level of the underlying
securities held by the mutual funds, which could be Level 1, Level 2 or Level 3.
Schwab U.S. REIT ETF | Annual Report13
Statement of Assets and Liabilities
As of February 28, 2023
|
Investments in securities, at value - unaffiliated (cost $5,884,046,126) including securities on loan of $4,617,180 | | |
Deposit with broker for futures contracts | | |
| | |
| | |
| | |
Income from securities on loan | | |
| | |
|
|
Collateral held for securities on loan | | |
| | |
| | |
| | |
Variation margin on futures contracts | | |
| | |
| | |
|
|
Capital received from investors | | |
| | |
| | |
14Schwab U.S. REIT ETF | Annual Report
Statement of Operations
For the period March 1, 2022 through February 28, 2023 |
|
Dividends received from securities - unaffiliated | | |
| | |
| | |
|
|
| | |
| | |
| | |
| | |
|
REALIZED AND UNREALIZED GAINS (LOSSES) |
Net realized losses on sales of securities - unaffiliated | | |
Net realized gains on sales of in-kind redemptions - unaffiliated | | |
Net realized losses on futures contracts | | |
| | |
Net change in unrealized appreciation (depreciation) on securities - unaffiliated | | |
Net change in unrealized appreciation (depreciation) on futures contracts | | |
Net change in unrealized appreciation (depreciation) | | |
Net realized and unrealized losses | | |
Decrease in net assets resulting from operations | | |
| Proxy fees are non-routine expenses (see financial note 2(e) for additional information). |
Schwab U.S. REIT ETF | Annual Report15
Statement of Changes in Net Assets
For the current and prior report periods
|
| | |
| | | |
| | | |
Net change in unrealized appreciation (depreciation) | | | |
Increase (decrease) in net assets resulting from operations | | | |
|
DISTRIBUTIONS TO SHAREHOLDERS |
| | | |
TRANSACTIONS IN FUND SHARES1 |
| | |
| | | | | |
| | | | | |
| | | | | |
Net transactions in fund shares | | | | | |
|
SHARES OUTSTANDING AND NET ASSETS1 |
| | |
| | | | | |
| | | | | |
Total increase (decrease) | | | | | |
| | | | | |
| For the period ended February 28, 2023, and the prior report period, transactions in fund shares have been retroactively adjusted to reflect a 2-for-1 share split effective after market close on March 10, 2022. The retroactive adjustment of the share split does not change the transaction in fund share values (see financial note 12 for additional information). |
16Schwab U.S. REIT ETF | Annual Report
1. Business Structure of the Fund:
Schwab U.S. REIT ETF is a series of Schwab Strategic Trust (the trust), a no-load, open-end management investment company. The trust is organized as a Delaware statutory trust and is registered under the Investment Company Act of 1940, as amended (the 1940 Act). The list below shows all the operational funds in the trust as of the end of the period, including the fund discussed in this report, which is highlighted:
SCHWAB STRATEGIC TRUST (ORGANIZED JANUARY 27, 2009) |
| Schwab Short-Term U.S. Treasury ETF |
Schwab U.S. Broad Market ETF | Schwab Intermediate-Term U.S. Treasury ETF |
| Schwab Long-Term U.S. Treasury ETF |
Schwab U.S. Large-Cap ETF | Schwab U.S. Aggregate Bond ETF |
Schwab U.S. Large-Cap Growth ETF | Schwab 1-5 Year Corporate Bond ETF |
Schwab U.S. Large-Cap Value ETF | Schwab 5-10 Year Corporate Bond ETF |
| Schwab Fundamental U.S. Broad Market Index ETF |
Schwab U.S. Small-Cap ETF | Schwab Fundamental U.S. Large Company Index ETF |
Schwab U.S. Dividend Equity ETF | Schwab Fundamental U.S. Small Company Index ETF |
Schwab International Dividend Equity ETF | Schwab Fundamental International Large Company Index ETF |
Schwab International Equity ETF | Schwab Fundamental International Small Company Index ETF |
Schwab International Small-Cap Equity ETF | Schwab Fundamental Emerging Markets Large Company Index ETF |
Schwab Emerging Markets Equity ETF | |
| Schwab Crypto Thematic ETF |
Schwab Municipal Bond ETF | |
The fund issues and redeems shares at its net asset value per share (NAV) only in large blocks of shares (Creation Units). These transactions are usually in exchange for a basket of securities and/or an amount of cash. As a practical matter, only institutional investors who have entered into an authorized participant agreement purchase or redeem Creation Units. Except when aggregated in Creation Units, shares of the fund are not redeemable securities.
Individual shares of the fund trade on national securities exchanges and elsewhere during the trading day and can only be bought and sold at market prices throughout the trading day through a broker-dealer. Because fund shares trade at market prices rather than NAV, shares may trade at a price greater than NAV (premium) or less than NAV (discount). A chart showing the frequency at which the fund’s daily closing market price was at a discount or premium to the fund’s NAV can be found at www.schwabassetmanagement.com.
The fund maintains its own account for purposes of holding assets and accounting, and is considered a separate entity for tax purposes. Within its account, the fund may also keep certain assets in segregated accounts, as required by securities law. The “Fund Complex” includes The Charles Schwab Family of Funds, Schwab Capital Trust, Schwab Investments, Schwab Annuity Portfolios, Schwab Strategic Trust and Laudus Trust.
2. Significant Accounting Policies:The following is a summary of the significant accounting policies the fund uses in its preparation of financial statements. The fund follows the investment company accounting and reporting guidance of the Financial Accounting Standards Board (FASB) Accounting Standard Codification Topic 946 Financial Services — Investment Companies. The accounting policies are in conformity with accounting principles generally accepted in the United States of America (GAAP).
The fund may invest in certain mutual funds and exchange-traded funds (ETFs), which are referred to as "underlying funds". For more information about the underlying funds’ operations and policies, please refer to those funds’ semiannual and annual reports, which are filed with the U.S. Securities and Exchange Commission (SEC) and are available on the SEC’s website at www.sec.gov.
(a) Security Valuation
Pursuant to Rule 2a-5 under the 1940 Act, the Board of Trustees (the Board) has designated authority to a Valuation Designee, the fund’s investment adviser, to make fair valuation determinations under adopted procedures, subject to Board oversight. The investment adviser has formed a Pricing Committee to administer the pricing and valuation of portfolio securities and other assets and liabilities as well as to ensure that prices used for internal purposes or provided by third parties reasonably reflect fair value. The Valuation Designee may utilize independent pricing services, quotations from securities and financial instrument dealers and other market sources to determine fair value.
Schwab U.S. REIT ETF | Annual Report17
Financial Notes (continued)
2. Significant Accounting Policies (continued):
Securities held in the fund’s portfolio are valued every business day. The following valuation policies and procedures are used by the Valuation Designee to value various types of securities:
• Securities traded on an exchange or over-the-counter: Traded securities are valued at the closing value for the day, or, on days when no closing value has been reported, at the mean of the most recent bid and ask quotes. Securities that are primarily traded on foreign exchanges are valued at the official closing price or the last sales price on the exchange where the securities are principally traded with these values then translated into U.S. dollars at the current exchange rate, unless these securities are fair valued as discussed below.
• Futures contracts: Futures contracts are valued at their settlement prices as of the close of their exchanges.
• Mutual funds: Mutual funds are valued at their respective NAVs.
• Securities for which no quoted value is available: The Valuation Designee has adopted procedures to fair value the fund’s securities when market prices are not “readily available” or are unreliable. For example, a security may be fair valued when it’s de-listed or its trading is halted or suspended; when a security’s primary pricing source is unable or unwilling to provide a price; or when a security’s primary trading market is closed during regular market hours. Fair value determinations are made in good faith in accordance with adopted valuation procedures. The Valuation Designee considers a number of factors, including unobservable market inputs, when arriving at fair value. The Valuation Designee may employ methods such as the review of related or comparable assets or liabilities, related market activities, recent transactions, market multiples, book values, transactional back-testing, disposition analysis and other relevant information. Due to the subjective and variable nature of fair value pricing, there can be no assurance that the fund could obtain the fair value assigned to the security upon the sale of such security.
In accordance with the authoritative guidance on fair value measurements and disclosures under GAAP, the fund discloses the fair value of its investments in a hierarchy that prioritizes the significant inputs to valuation methods used to measure the fair value. The hierarchy gives the highest priority to valuations based upon unadjusted quoted prices in active markets for identical assets or liabilities (Level 1 measurements) and the lowest priority to valuations based upon unobservable inputs that are significant to the valuation (Level 3 measurements). If inputs used to measure the financial instruments fall within different levels of the hierarchy, the categorization is based on the lowest level input that is significant to the valuation. If it is determined that either the volume and/or level of activity for an asset or liability has significantly decreased (from normal conditions for that asset or liability) or price quotations or observable inputs are not associated with orderly transactions, increased analysis and the Valuation Designee’s judgment will be required to estimate fair value.
The three levels of the fair value hierarchy are as follows:
• Level 1 — quoted prices in active markets for identical investments — Investments whose values are based on quoted market prices in active markets. These generally include active listed equities, mutual funds, ETFs and future contracts. Mutual funds and ETFs are classified as Level 1 prices, without consideration to the classification level of the underlying securities held.
• Level 2 — other significant observable inputs (including quoted prices for similar securities, interest rates, prepayment speeds, credit risk, etc.) — Investments that trade in markets that are not considered to be active, but whose values are based on quoted market prices, dealer quotations or valuations provided by alternative pricing sources supported by observable inputs are classified as Level 2 prices. These generally include U.S. government and sovereign obligations, most government agency securities, investment-grade corporate bonds, certain mortgage products, less liquid listed equities, and state, municipal and provincial obligations.
• Level 3 — significant unobservable inputs (including the Valuation Designee’s assumptions in determining the fair value of investments) — Investments whose values are classified as Level 3 prices have significant unobservable inputs, as they may trade infrequently or not at all. When observable prices are not readily available for these securities, one or more valuation methods are used for which sufficient and reliable data is available. The inputs used in estimating the value of Level 3 prices may include the original transaction price, quoted prices for similar securities or assets in active markets, completed or pending third-party transactions in the underlying investment or comparable issuers, and changes in financial ratios or cash flows. Level 3 prices may also be adjusted to reflect illiquidity and/or non-transferability, with the amount of such discount estimated in the absence of market information. Assumptions used due to the lack of observable inputs may significantly impact the resulting fair value and therefore a fund’s results of operations.
The inputs or methodology used for valuing securities are not necessarily an indication of the risk associated with investing in those securities.
18Schwab U.S. REIT ETF | Annual Report
Financial Notes (continued)
2. Significant Accounting Policies (continued):
The levels associated with valuing the fund’s investments as of February 28, 2023, are disclosed in the Portfolio Holdings.
(b) Accounting Policies for certain Portfolio Investments (if held):
Futures Contracts: Futures contracts are instruments that represent an agreement between two parties that obligates one party to buy, and the other party to sell, specific instruments at an agreed upon price on a stipulated future date. The fund must give the broker a deposit of cash and/or securities (initial margin) whenever it enters into a futures contract. The amount of the deposit may vary from one contract to another. Subsequent payments (variation margin) are made or received by the fund depending on the daily fluctuations in the value of the futures contract and are accounted for as unrealized appreciation or depreciation until the contract is closed, at which time the gains or losses are realized. Futures contracts are traded publicly on exchanges, and their value may change daily.
Securities Lending: Under the trust’s Securities Lending Program, the fund (lender) may make short-term loans of its securities to another party (borrower) to generate additional revenue for the fund. The borrower pledges collateral in the form of cash, securities issued or fully guaranteed by the U.S. government or foreign governments, or letters of credit issued by a bank. Collateral at the individual loan level is required to be maintained on a daily marked-to-market basis in an amount at least equal to the current value of the securities loaned. The lending agent provides the fund with indemnification against borrower default (the borrower fails to return the security on loan) reducing the risk of loss as a result of default. The cash collateral of securities loaned is currently invested in money market portfolios operating pursuant to Rule 2a-7 under the 1940 Act. The fund bears the risk of loss with respect to the investment of cash collateral. The terms of the securities lending agreement allow the fund or the lending agent to terminate any loan at any given time and the securities must be returned within the earlier of the standard trade settlement period or the specified time period under the relevant securities lending agreements. Securities lending income, as disclosed in the fund’s Statement of Operations, if applicable, represents the income earned from the investment of the cash collateral plus any fees paid by borrowers, less the fees paid to the lending agent and broker rebates which are subject to adjustments pursuant to the securities lending agreement. On loans not collateralized by cash, a fee is received from the borrower, and is allocated between the fund and the lending agent. The aggregate fair value of securities loaned will not at any time exceed one-third of the total assets of the fund, including collateral received from the loan. Securities lending fees paid to the unaffiliated lending agents start at 9% of gross lending revenue, with subsequent breakpoints to a low of 5%. In this context, the gross lending revenue equals the income received from the investment of cash collateral and fees paid by borrowers less any rebates paid to the borrowers. Any expenses charged by the cash collateral fund are in addition to these fees. All remaining revenue is retained by the fund, as applicable. No portion of lending revenue is paid to or retained by the investment adviser or any of its affiliates.
As of February 28, 2023, the fund had securities on loan, all of which were classified as common stocks. The value of the securities on loan and the related collateral as of February 28, 2023, are disclosed in the fund’s Portfolio Holdings and Statement of Assets and Liabilities.
(c) Security Transactions:
Security transactions are recorded as of the date the order to buy or sell the security is executed. Realized gains and losses from security transactions are based on the identified costs of the securities involved.
When the fund closes out a futures contract position, it calculates the difference between the value of the position at the beginning and at the end of the contract, and records a realized gain or loss accordingly.
The fund invests in real estate investment trusts (REITs) which report information on the source of their distributions annually. The fund’s policy is to record all REIT distributions initially as dividend income on the ex-dividend date and then re-designate them as return of capital and/or capital gain distributions at the end of the reporting period based on information provided annually by each REIT, and management estimates such re-designations when actual information has not yet been reported.
(d) Investment Income:
Interest income is recorded as it accrues. Dividends and distributions from portfolio securities and underlying funds are recorded on the date they are effective (the ex-dividend date), although the fund records certain foreign security dividends on the date the ex-dividend is confirmed. Any distributions from underlying funds are recorded in accordance with the character of the distributions as designated by the underlying funds.
Schwab U.S. REIT ETF | Annual Report19
Financial Notes (continued)
2. Significant Accounting Policies (continued):
(e) Expenses:
Pursuant to the Amended and Restated Advisory Agreement (Advisory Agreement) between the investment adviser and the trust, the investment adviser will pay the operating expenses of the fund, excluding taxes, any brokerage expenses, and extraordinary or non-routine expenses. Taxes, any brokerage expenses and extraordinary or non-routine expenses that are specific to the fund are charged directly to the fund. The Advisory Agreement excludes paying acquired fund fees and expenses, which are indirect expenses incurred by a fund through its investments in underlying funds.
(f) Distributions to Shareholders:
The fund makes distributions from net investment income, if any, quarterly and from net realized capital gains, if any, once a year. To receive a distribution, you must be a registered shareholder on the record date. Distributions are paid to shareholders on the payable date.
(g) Accounting Estimates:
The accounting policies described in this report conform to GAAP. Notwithstanding this, shareholders should understand that in order to follow these principles, fund management has to make estimates and assumptions that affect the information reported in the financial statements. It’s possible that once the results are known, they may turn out to be different from these estimates and these differences may be material.
(h) Federal Income Taxes:
The fund intends to meet federal income and excise tax requirements for regulated investment companies under subchapter M of the Internal Revenue Code, as amended. Accordingly, the fund distributes substantially all of its net investment income and net realized capital gains, if any, to its shareholders each year. As long as the fund meets the tax requirements, it is not required to pay federal income tax.
(i) Indemnification:
Under the fund’s organizational documents, the officers and trustees are indemnified against certain liabilities arising out of the performance of their duties to the fund. In addition, in the normal course of business the fund enters into contracts with its vendors and others that provide general indemnifications. The fund’s maximum exposure under these arrangements is unknown as this would involve future claims that may be made against the fund. However, based on experience, the fund expects the risk of loss attributable to these arrangements to be remote.
(j) Regulatory Update:
Effective January 24, 2023, the SEC adopted rule and form amendments to require mutual funds and ETFs to transmit concise and visually engaging streamlined annual and semiannual reports to shareholders that highlight key information deemed important for retail investors to assess and monitor their fund investments. Other information, including financial statements, will no longer appear in a streamlined shareholder report but must be available online, delivered free of charge upon request, and filed on a semiannual basis on Form N-CSR. The rule and form amendments have a compliance date of July 24, 2024. At this time, management is evaluating the impact of these rule and form amendment changes on the content of the current shareholder report and the newly created annual and semiannual streamlined shareholder reports.
3. Risk Factors:Investing in the fund may involve certain risks, as discussed in the fund’s prospectus, including, but not limited to, those described below. Any of these risks could cause an investor to lose money.
Market Risk. Financial markets rise and fall in response to a variety of factors, sometimes rapidly and unpredictably. Markets may be impacted by economic, political, regulatory and other conditions, including economic sanctions and other government actions. In addition, the occurrence of global events, such as war, terrorism, environmental disasters, natural disasters and epidemics, may also negatively affect the financial markets. As with any investment whose performance is tied to these markets, the value of an investment in the fund will fluctuate, which means that an investor could lose money over short or long periods.
20Schwab U.S. REIT ETF | Annual Report
Financial Notes (continued)
3. Risk Factors (continued):
Investment Style Risk. The fund is an index fund. Therefore, the fund follows the securities included in the index during upturns as well as downturns. Because of its indexing strategy, the fund does not take steps to reduce market exposure or to lessen the effects of a declining market. In addition, because of the fund’s expenses, the fund’s performance may be below that of the index. Errors relating to the index may occur from time to time and may not be identified by the index provider for a period of time. In addition, market disruptions could cause delays in the index’s rebalancing schedule. Such errors and/or market disruptions may result in losses for the fund.
Equity Risk. The prices of equity securities rise and fall daily. These price movements may result from factors affecting individual companies, industries or the securities market as a whole. In addition, equity markets tend to move in cycles, which may cause stock prices to fall over short or extended periods of time.
Market Capitalization Risk. Securities issued by companies of different market capitalizations tend to go in and out of favor based on market and economic conditions. During a period when securities of a particular market capitalization fall behind other types of investments, the fund’s performance could be impacted.
Large-Cap Company Risk. Large-cap companies are generally more mature and the securities issued by these companies may not be able to reach the same levels of growth as the securities issued by small- or mid-cap companies.
Mid-Cap Company Risk. Mid-cap companies may be more vulnerable to adverse business or economic events than larger, more established companies and the value of securities issued by these companies may move sharply.
Small-Cap Company Risk. Securities issued by small-cap companies may be riskier than those issued by larger companies, and their prices may move sharply, especially during market upturns and downturns.
Real Estate Investment Risk. Due to the composition of the index, the fund concentrates its investments in real estate companies and companies related to the real estate industry. As such, the fund is subject to risks associated with the direct ownership of real estate securities and an investment in the fund will be closely linked to the performance of the real estate markets. These risks include, among others: declines in the value of real estate; risks related to general and local economic conditions; possible lack of availability of mortgage funds or other limits to accessing the credit or capital markets; defaults by borrowers or tenants, particularly during an economic downturn; and changes in interest rates.
REITs Risk. In addition to the risks associated with investing in securities of real estate companies and real estate related companies, REITs are subject to certain additional risks. Equity REITs may be affected by changes in the value of the underlying properties owned by the trusts. Further, REITs are dependent upon specialized management skills and cash flows, and may have their investments in relatively few properties, or in a small geographic area or a single property type. Failure of a company to qualify as a REIT under federal tax law may have adverse consequences to the fund. In addition, REITs have their own expenses, and the fund will bear a proportionate share of those expenses.
Tracking Error Risk. As an index fund, the fund seeks to track the performance of its index, although it may not be successful in doing so. The divergence between the performance of the fund and the index, positive or negative, is called “tracking error.” Tracking error can be caused by many factors and it may be significant.
Derivatives Risk. The principal types of derivatives used by the fund are futures contracts. A future is an agreement to buy or sell a financial instrument at a specific price on a specific day. The fund’s use of derivatives that are subject to regulation by the Commodity Futures Trading Commission (CFTC) could cause the fund to become a commodity pool, which would require the fund to comply with certain CFTC rules.
The fund’s use of derivative instruments involves risks different from, or possibly greater than, the risks associated with investing directly in securities and other traditional investments. Certain of these risks, such as liquidity risk, leverage risk and market risk, are discussed elsewhere in this section. The fund’s use of derivatives is also subject to counterparty risk, lack of availability risk, valuation risk, correlation risk and tax risk. Counterparty risk is the risk that the counterparty to a derivatives transaction may not fulfill its contractual obligations either because the financial condition of the counterparty declines, or because the counterparty is otherwise unable or unwilling to perform under the contract. Lack of availability risk is the risk that suitable derivative transactions may not be available in all circumstances for risk management or other purposes. Valuation risk is the risk that a particular derivative may be valued incorrectly. Correlation risk is the risk that changes in the value of the derivative may not correlate perfectly with the underlying asset, rate or index. Tax risk is the risk that the use of derivatives may cause the fund to realize higher amounts of short-term capital gains. The fund’s use of derivatives could reduce the fund’s performance, increase the fund’s volatility and could cause the fund to lose more than the initial amount invested.
Schwab U.S. REIT ETF | Annual Report21
Financial Notes (continued)
3. Risk Factors (continued):
Concentration Risk. To the extent that the fund’s or the index’s portfolio is concentrated in the securities of issuers in a particular market, industry, group of industries, sector or asset class (including the real estate industry, as described above), the fund may be adversely affected by the performance of those securities, may be subject to increased price volatility and may be more vulnerable to adverse economic, market, political or regulatory occurrences affecting that market, industry, group of industries, sector or asset class.
Liquidity Risk. The fund may be unable to sell certain securities, such as illiquid securities, readily at a favorable time or price, or the fund may have to sell them at a loss.
Leverage Risk. Certain fund transactions, such as derivatives transactions, may give rise to a form of leverage and may expose the fund to greater risk. Leverage tends to magnify the effect of any decrease or increase in the value of the fund’s portfolio securities which means even a small amount of leverage can have a disproportionately large impact on the fund. The use of leverage may cause the fund to liquidate portfolio positions when it would not be advantageous to do so in order to satisfy its obligations.
Securities Lending Risk. Securities lending involves the risk of loss of rights in, or delay in recovery of, the loaned securities if the borrower fails to return the security loaned or becomes insolvent.
Market Trading Risk. Although fund shares are listed on national securities exchanges, there can be no assurance that an active trading market for fund shares will develop or be maintained. If an active market is not maintained, investors may find it difficult to buy or sell fund shares.
Shares of the Fund May Trade at Prices Other Than NAV. Fund shares may be bought and sold in the secondary market at market prices. Although it is expected that the market price of the shares of the fund will approximate the fund’s NAV, there may be times when the market price and the NAV vary significantly. An investor may pay more than NAV when buying shares of the fund in the secondary market, and an investor may receive less than NAV when selling those shares in the secondary market. The market price of fund shares may deviate, sometimes significantly, from NAV during periods of market volatility or market disruption.
Please refer to the fund’s prospectus for a more complete description of the principal risks of investing in the fund.
4. Affiliates and Affiliated Transactions:Investment Adviser
Charles Schwab Investment Management, Inc., dba Schwab Asset Management, a wholly owned subsidiary of The Charles Schwab Corporation, serves as the fund’s investment adviser pursuant to the Advisory Agreement between the investment adviser and the trust.
For its advisory services to the fund, the investment adviser is entitled to receive an annual management fee, payable monthly, equal to 0.07% of the fund’s average daily net assets.
22Schwab U.S. REIT ETF | Annual Report
Financial Notes (continued)
4. Affiliates and Affiliated Transactions (continued):
Investment from Affiliates
Certain funds in the Fund Complex may own shares of other funds in the Fund Complex. The table below reflects the percentage of shares of the fund that are owned by other funds in the Fund Complex as of February 28, 2023.
Schwab MarketTrack All Equity Portfolio | |
Schwab MarketTrack Balanced Portfolio | |
Schwab MarketTrack Conservative Portfolio | |
Schwab MarketTrack Growth Portfolio | |
Schwab Target 2010 Index Fund | |
Schwab Target 2015 Index Fund | |
Schwab Target 2020 Index Fund | |
Schwab Target 2025 Index Fund | |
Schwab Target 2030 Index Fund | |
Schwab Target 2035 Index Fund | |
Schwab Target 2040 Index Fund | |
Schwab Target 2045 Index Fund | |
Schwab Target 2050 Index Fund | |
Schwab Target 2055 Index Fund | |
Schwab Target 2060 Index Fund | |
Schwab Target 2065 Index Fund | |
Schwab VIT Balanced Portfolio | |
Schwab VIT Balanced with Growth Portfolio | |
Schwab VIT Growth Portfolio | |
Interfund Transactions
The fund may engage in direct transactions with certain other funds in the Fund Complex in accordance with procedures adopted by the Board pursuant to Rule 17a-7 under the 1940 Act. When one fund is seeking to sell a security that another is seeking to buy, an interfund transaction can allow both funds to benefit by reducing transaction costs. This practice is limited to funds that share the same investment adviser, trustees and/or officers. For the period ended February 28, 2023, the fund’s total purchases and sales of securities with other funds in the Fund Complex was $15,935,636 and $92,824,929, respectively, and includes realized losses of $31,269,361.
Interfund Borrowing and Lending
Pursuant to an exemptive order issued by the SEC, the fund may enter into interfund borrowing and lending transactions with other funds in the Fund Complex. All loans are for temporary or emergency purposes and the interest rate to be charged will be the average of the overnight repurchase agreement rate and the short-term bank loan rate. All loans are subject to numerous conditions designed to ensure fair and equitable treatment of all participating funds. The interfund lending facility is subject to the oversight and periodic review of the Board. The fund had no interfund borrowing or lending activity during the period.
5. Other Service Providers:SEI Investments Distribution Co. is the principal underwriter and distributor of shares of the fund.
State Street Bank and Trust Company (State Street) serves as the fund’s transfer agent. As part of these services, the transfer agent maintains records pertaining to the sale, redemption and transfer of the fund’s shares. The transfer agent is also responsible for the order-taking function for the fund’s shares.
State Street also serves as custodian and accountant for the fund. The custodian is responsible for the daily safekeeping of securities and cash held by the fund. The fund’s accountant maintains all books and records related to the fund’s transactions.
Schwab U.S. REIT ETF | Annual Report23
Financial Notes (continued)
The Board may include people who are officers and/or directors of the investment adviser or its affiliates. Federal securities law limits the percentage of such “interested persons” who may serve on a trust’s board, and the trust was in compliance with these limitations throughout the report period. The trust does not pay any interested or non-interested trustees (independent trustees). The independent trustees are paid by the investment adviser. For information regarding the trustees, please refer to the Trustees and Officers table at the end of this report.
7. Borrowing from Banks:During the period, the fund was a participant with other funds in the Fund Complex in a joint, syndicated, committed $850 million line of credit (the Syndicated Credit Facility), which matured on September 29, 2022. On September 29, 2022, the Syndicated Credit Facility was amended to run for a new 364 day period with the line of credit amount increasing to $1 billion, maturing on September 28, 2023. Under the terms of the Syndicated Credit Facility, in addition to the investment adviser paying the interest charged on any borrowings by the fund, the investment adviser paid a commitment fee of 0.15% per annum on the fund’s proportionate share of the unused portion of the Syndicated Credit Facility.
During the period, the fund was a participant with other funds in the Fund Complex in a joint, unsecured, uncommitted $400 million line of credit (the Uncommitted Credit Facility), with State Street, which matured on September 29, 2022. On September 29, 2022, the Uncommitted Credit Facility was amended to run for a new 364 day period with the line of credit amount remaining unchanged, maturing on September 28, 2023. Under the terms of the Uncommitted Credit Facility, the investment adviser pays interest on the amount it borrows. There were no borrowings from either line of credit during the period.
The fund also has access to custodian overdraft facilities. The fund may have utilized the overdraft facility and incurred an interest expense, which is paid by the investment adviser. The interest expense is determined based on a negotiated rate above the current Federal Funds Rate.
8. Derivatives:The fund entered into equity index futures contracts during the report period. The fund invested in futures contracts to equitize available cash. The value and variation margin for futures contracts held at February 28, 2023, are presented in the Portfolio Holdings and Statement of Assets and Liabilities, respectively. The net realized gains (losses) and net change in unrealized appreciation (depreciation) on futures contracts are presented in the Statement of Operations, if any. Refer to financial note 2(b) for the fund’s accounting policies with respect to futures contracts and financial note 3 for disclosures concerning the risks of investing in futures contracts. During the period ended February 28, 2023, the month-end average notional amounts of futures contracts held by the fund was $11,948,596 and the month-end average number of contracts held was 334.
9. Purchases and Sales of Investment Securities:For the period ended February 28, 2023, purchases and sales of securities (excluding in-kind transactions and short-term obligations) were as follows:
10. In-Kind Transactions:The consideration for the purchase of Creation Units of the fund often consists of the in-kind deposit of a designated portfolio of equity securities, which constitutes an optimized representation of the securities involved in the relevant fund’s underlying index, and an amount of cash. Investors purchasing and redeeming Creation Units are subject to a standard creation transaction fee and a standard redemption transaction fee paid to the custodian to offset transfer and other transaction costs associated with the issuance and redemption of Creation Units. Purchasers and redeemers of Creation Units for cash are subject to an additional variable charge paid to the fund that will offset the transaction costs to the fund of buying or selling portfolio securities. Variable charges paid to the fund generally have no effect on net asset value per share. In addition, purchasers and redeemers of shares in Creation Units are responsible for payment of the costs of transferring securities to or out of the fund. From time to time, the investment adviser may cover the cost of any transaction fees when believed to be in the best interests of the fund.
24Schwab U.S. REIT ETF | Annual Report
Financial Notes (continued)
10. In-Kind Transactions (continued):
The in-kind transactions for the period ended February 28, 2023, were as follows:
IN-KIND PURCHASES
OF SECURITIES | IN-KIND SALES
OF SECURITIES |
| |
For the period ended February 28, 2023, the fund may realize net capital gains or losses resulting from in-kind redemptions of Creation Units. Because such gains or losses are not taxable to the fund and are not distributed to existing fund shareholders, the gains or losses are reclassified from accumulated net realized gains or losses to capital received from investors at the end of the fund’s tax year. These reclassifications have no effect on net assets or net asset value per share. The net realized gains or losses on sales of in-kind redemptions for the period ended February 28, 2023, are disclosed in the fund’s Statement of Operations, if any.
11. Federal Income Taxes:As of February 28, 2023, the tax basis cost of the fund’s investments and gross unrealized appreciation and depreciation were as follows:
| GROSS UNREALIZED
APPRECIATION | GROSS UNREALIZED
DEPRECIATION | NET UNREALIZED
APPRECIATION
(DEPRECIATION) |
| | | |
As of February 28, 2023, the components of distributable earnings on a tax basis were as follows:
UNDISTRIBUTED
ORDINARY
INCOME | NET UNREALIZED
APPRECIATION
(DEPRECIATION)
ON INVESTMENTS | CAPITAL LOSS
CARRYFORWARDS AND OTHER LOSSES | |
| | | |
The primary difference between book basis and tax basis unrealized appreciation or unrealized depreciation of investments is the tax deferral of losses on wash sales and realization for tax purposes of unrealized appreciation or depreciation on futures contracts. The tax cost of the fund’s investments, disclosed above, have been adjusted from its book amounts to reflect these unrealized appreciation or depreciation differences, as applicable.
Capital loss carryforwards have no expiration and may be used to offset future realized capital gains for federal income tax purposes. As of February 28, 2023 , the fund had capital loss carryforwards of $853,268,935.
For the fiscal year ended February 28, 2023, the fund had capital loss carryforwards utilized of $24,373,941.
The tax basis components of distributions paid during the current and prior fiscal years were as follows:
| CURRENT FISCAL YEAR END DISTRIBUTIONS | PRIOR FISCAL YEAR END DISTRIBUTIONS |
| | |
| | |
Distributions paid to shareholders are based on net investment income and net realized gains determined on a tax basis, which may differ from net investment income and net realized gains for financial reporting purposes. These differences reflect the differing character of certain income items and net realized gains and losses for financial statement and tax purposes, and may result in reclassification among certain capital accounts on the financial statements. The fund may also designate a portion of the amount paid to redeeming shareholders as a distribution for tax purposes.
Permanent book and tax basis differences may result in reclassifications between components of net assets as required. The adjustments have no impact on net assets or the results of operations.
As of February 28, 2023, management has reviewed the tax positions for open periods (for federal purposes, three years from the date of filing and for state purposes, four years from the date of filing) as applicable to the fund, and has determined that no provision for income tax is required in the fund’s financial statements. The fund recognizes interest and penalties, if any, related to unrecognized tax benefits as income tax expense in the Statement of Operations. During the period ended February 28, 2023, the fund did not incur any interest or penalties.
Schwab U.S. REIT ETF | Annual Report25
Financial Notes (continued)
The Board authorized a 2-for-1 share split for the Schwab U.S. REIT ETF which applied to shareholders of record as of the close of markets on March 8, 2022, and paid after the close of markets on March 10, 2022. Shares began trading at their post-split price on March 11, 2022. The share split increased the number of shares outstanding and decreased the NAV per share. The share split did not change the total value of a shareholder’s investment. The Financial Highlights and Statement of Changes in Net Assets for the fund have been retroactively adjusted to reflect the share split in the current and prior periods presented.
13. Subsequent Events:Management has determined there are no subsequent events or transactions through the date the financial statements were issued that would have materially impacted the financial statements as presented.
26Schwab U.S. REIT ETF | Annual Report
Report of Independent Registered Public Accounting Firm
To the Board of Trustees of Schwab Strategic Trust and Shareholders of Schwab U.S. REIT ETF:
Opinion on the Financial Statements and Financial Highlights
We have audited the accompanying statement of assets and liabilities, including the portfolio holdings, of Schwab U.S. REIT ETF (the “Fund”), one of the funds constituting Schwab Strategic Trust, as of February 28, 2023, the related statement of operations for the year then ended, the statements of changes in net assets for each of the two years in the period then ended, the financial highlights for each of the three years in the period then ended, and the related notes. In our opinion, the financial statements and financial highlights present fairly, in all material respects, the financial position of the Fund as of February 28, 2023, and the results of its operations for the year then ended, the changes in its net assets for each of the two years in the period then ended, and the financial highlights for each of the three years in the period then ended in conformity with accounting principles generally accepted in the United States of America. The financial highlights for each of the two years in the period ended February 29, 2020 were audited by other auditors, whose report, dated April 16, 2020, expressed an unqualified opinion on such financial highlights.
Basis for Opinion
These financial statements and financial highlights are the responsibility of the Fund’s management. Our responsibility is to express an opinion on the Fund’s financial statements and financial highlights based on our audits. We are a public accounting firm registered with the Public Company Accounting Oversight Board (United States) (PCAOB) and are required to be independent with respect to the Fund in accordance with the U.S. federal securities laws and the applicable rules and regulations of the Securities and Exchange Commission and the PCAOB.
We conducted our audits in accordance with the standards of the PCAOB. Those standards require that we plan and perform the audit to obtain reasonable assurance about whether the financial statements and financial highlights are free of material misstatement, whether due to error or fraud. The Fund is not required to have, nor were we engaged to perform, an audit of its internal control over financial reporting. As part of our audits, we are required to obtain an understanding of internal control over financial reporting but not for the purpose of expressing an opinion on the effectiveness of the Fund’s internal control over financial reporting. Accordingly, we express no such opinion.
Our audits included performing procedures to assess the risks of material misstatement of the financial statements and financial highlights, whether due to error or fraud, and performing procedures that respond to those risks. Such procedures included examining, on a test basis, evidence regarding the amounts and disclosures in the financial statements and financial highlights. Our audits also included evaluating the accounting principles used and significant estimates made by management, as well as evaluating the overall presentation of the financial statements and financial highlights. Our procedures included confirmation of securities owned as of February 28, 2023 by correspondence with the custodian and brokers; when replies were not received from brokers, we performed other auditing procedures. We believe that our audits provide a reasonable basis for our opinion.
Deloitte & Touche LLP
Denver, Colorado
April 17, 2023
We have served as the auditor of one or more investment companies in the Schwab Funds Complex since 2020.
Schwab U.S. REIT ETF | Annual Report27
Other Federal Tax Information (unaudited)
For the fiscal year ended February 28, 2023, the fund designates $1,563,863 of the dividend distributions as qualified dividends for the purposes of the maximum rate under section 1(h)(11) of the Internal Revenue Code. Shareholders will be notified in January 2024 via IRS Form 1099 of the For amounts for use in preparing their 2023 income tax return.
For the fiscal year ended February 28, 2023, the fund designates $137,522,592 as dividends eligible for the 20% qualified business income deduction under section 199A of the Internal Revenue Code. Shareholders will be notified in January 2024 via IRS Form 1099 of the amounts for use in preparing their 2023 income tax return.
28Schwab U.S. REIT ETF | Annual Report
Liquidity Risk Management Program (unaudited)
The fund has adopted and implemented a liquidity risk management program (the “program”) as required by Rule 22e-4 under the Investment Company Act of 1940, as amended. The fund’s Board of Trustees (the “Board”) has designated the fund’s investment adviser, Charles Schwab Investment Management, Inc., dba Schwab Asset Management, as the administrator of the program. Personnel of the investment adviser or its affiliates conduct the day-to-day operation of the program.
Under the program, the investment adviser manages a fund’s liquidity risk, which is the risk that the fund could not meet shareholder redemption requests without significant dilution of remaining shareholders’ interests in the fund. The program is reasonably designed to assess and manage a fund’s liquidity risk, taking into consideration the fund’s investment strategy and the liquidity of its portfolio investments during normal and reasonably foreseeable stressed conditions; its historical redemption history and shareholder concentrations; and its cash holdings and access to other funding sources, including the custodian overdraft facility and lines of credit. The investment adviser’s process of determining the degree of liquidity of each fund’s investments is supported by third-party liquidity assessment vendors.
The fund’s Board reviewed a report at its meeting held on September 19, 2022 prepared by the investment adviser regarding the operation and effectiveness of the program for the period June 1, 2021, through May 31, 2022, which included individual fund liquidity metrics. No significant liquidity events impacting the fund were noted in the report. In addition, the investment adviser provided its assessment that the program had been operating effectively in managing the fund’s liquidity risk.
Schwab U.S. REIT ETF | Annual Report29
Trustees and Officers
The tables below give information about the trustees and officers of Schwab Strategic Trust, which includes the fund covered in this report. The “Fund Complex” includes The Charles Schwab Family of Funds, Schwab Capital Trust, Schwab Investments, Schwab Annuity Portfolios, Schwab Strategic Trust and Laudus Trust. The Fund Complex includes 105 funds.
The address for all trustees and officers is 211 Main Street, San Francisco, CA 94105. You can find more information about the trustees and officers in the Statement of Additional Information, which is available free by calling 1-877-824-5615.
|
Name, Year of Birth, and Position(s) with the trust (Terms of office, and length of Time Served1) | Principal Occupations During the Past Five Years | Number of Portfolios in Fund Complex Overseen by the Trustee | |
Michael J. Beer 1961 Trustee (Trustee of The Charles Schwab Family of Funds, Schwab Investments, Schwab Capital Trust, Schwab Annuity Portfolios, Schwab Strategic Trust and Laudus Trust since 2022) | Retired. Director, President and Chief Executive Officer (Dec. 2016 – Sept. 2019), Principal Funds (investment management). | | Director (2016 – 2019), Principal Funds, Inc. |
Robert W. Burns 1959 Trustee (Trustee of Schwab Strategic Trust since 2009; The Charles Schwab Family of Funds, Schwab Investments, Schwab Capital Trust, Schwab Annuity Portfolios and Laudus Trust since 2016) | Retired/Private Investor. | | |
Nancy F. Heller 1956 Trustee (Trustee of The Charles Schwab Family of Funds, Schwab Investments, Schwab Capital Trust, Schwab Annuity Portfolios, Schwab Strategic Trust and Laudus Trust since 2018) | | | |
David L. Mahoney 1954 Trustee (Trustee of The Charles Schwab Family of Funds, Schwab Investments, Schwab Capital Trust, Schwab Annuity Portfolios and Laudus Trust since 2011; Schwab Strategic Trust since 2016) | | | Director (2004 – present), Corcept Therapeutics Incorporated Director (2009 – 2021), Adamas Pharmaceuticals, Inc. Director (2003 – 2019), Symantec Corporation |
Jane P. Moncreiff 1961 Trustee (Trustee of The Charles Schwab Family of Funds, Schwab Investments, Schwab Capital Trust, Schwab Annuity Portfolios, Schwab Strategic Trust and Laudus Trust since 2019) | Consultant (2018 – present), Fulham Advisers LLC (management consulting); Chief Investment Officer (2009 – 2017), CareGroup Healthcare System, Inc. (healthcare). | | |
30Schwab U.S. REIT ETF | Annual Report
Independent Trustees (continued) |
Name, Year of Birth, and Position(s) with the trust (Terms of office, and length of Time Served1) | Principal Occupations During the Past Five Years | Number of Portfolios in Fund Complex Overseen by the Trustee | |
Kimberly S. Patmore 1956 Trustee (Trustee of The Charles Schwab Family of Funds, Schwab Investments, Schwab Capital Trust, Schwab Annuity Portfolios, Schwab Strategic Trust and Laudus Trust since 2016) | Consultant (2008 – present), Patmore Management Consulting (management consulting). | | |
J. Derek Penn 1957 Trustee (Trustee of The Charles Schwab Family of Funds, Schwab Investments, Schwab Capital Trust, Schwab Annuity Portfolios, Schwab Strategic Trust and Laudus Trust since 2021) | Head of Equity Sales and Trading (2006 – 2018), BNY Mellon (financial services). | | |
Schwab U.S. REIT ETF | Annual Report31
|
Name, Year of Birth, and Position(s) with the trust (Terms of office, and length of Time Served1) | Principal Occupations During the Past Five Years | Number of Portfolios in Fund Complex Overseen by the Trustee | |
Walter W. Bettinger II2 1960 Chairman and Trustee (Trustee of The Charles Schwab Family of Funds, Schwab Investments, Schwab Capital Trust and Schwab Annuity Portfolios since 2008; Schwab Strategic Trust since 2009; Laudus Trust since 2010) | Co-Chairman of the Board (July 2022 – present), Director and Chief Executive Officer (Oct. 2008 – present) and President (Feb. 2007 – Oct. 2021), The Charles Schwab Corporation; President and Chief Executive Officer (Oct. 2008 – Oct. 2021) and Director (May 2008 – Oct. 2021), Charles Schwab & Co., Inc.; Director (Apr. 2006 – present), Charles Schwab Bank, SSB; Director (Nov. 2017 – present), Charles Schwab Premier Bank, SSB; Director (July 2019 – present), Charles Schwab Trust Bank; Director (May 2008 – present), Chief Executive Officer (Aug. 2017 – present) and President (Aug. 2017 – Nov. 2021), Schwab Holdings, Inc.; Director (Oct. 2020 – present), TD Ameritrade Holding Corporation; Director (July 2016 – Oct. 2021), Charles Schwab Investment Management, Inc. | | Director (2008 – present), The Charles Schwab Corporation |
Richard A. Wurster2 1973 Trustee (Trustee of The Charles Schwab Family of Funds, Schwab Investments, Schwab Capital Trust, Schwab Annuity Portfolios, Schwab Strategic Trust and Laudus Trust since 2022) | President (Oct. 2021 – present) and Executive Vice President – Schwab Asset Management Solutions (Apr. 2019 – Oct. 2021), The Charles Schwab Corporation; President, Director (Oct. 2021 – present), Executive Vice President – Schwab Asset Management Solutions (July 2019 – Oct. 2021) and Senior Vice President – Advisory (May 2016 – July 2019), Charles Schwab & Co., Inc.; President (Nov. 2021 – present), Schwab Holdings, Inc.; Director (Oct. 2021 – present) and Chief Executive Officer (Nov. 2019 – Jan. 2022), Charles Schwab Investment Management, Inc.; Director, Chief Executive Officer and President (Mar. 2018 – Oct. 2022), Charles Schwab Investment Advisory, Inc.; Chief Executive Officer (July 2016 – Apr. 2018) and President (Mar. 2017 – Apr. 2018), ThomasPartners, Inc.; Chief Executive Officer (July 2016 – Apr. 2018), Windhaven Investment Management, Inc. | | |
|
Name, Year of Birth, and Position(s) with the trust (Terms of office, and length of Time Served3) | Principal Occupations During the Past Five Years |
Jonathan de St. Paer 1973 President and Chief Executive Officer (Officer of The Charles Schwab Family of Funds, Schwab Investments, Schwab Capital Trust, Schwab Annuity Portfolios, Schwab Strategic Trust and Laudus Trust since 2018) | Director (Apr. 2019 – present), President (Oct. 2018 – present), Chief Operating Officer (Jan. 2021 – present), and Chief Executive Officer (Apr. 2019 – Nov. 2019), Charles Schwab Investment Management, Inc.; Senior Vice President (June 2020 – Mar. 2022) and Chief Operating Officer (Jan. 2021 – Mar. 2022), Charles Schwab Investment Advisory, Inc.; Chief Executive Officer (Apr. 2019 – present), President (Nov. 2018 – present) and Trustee (Apr. 2019 – Dec. 2020), Schwab Funds, Laudus Trust and Schwab ETFs; Managing Director (May 2022 – present), Senior Vice President (Apr. 2019 – May 2022) and Senior Vice President – Strategy and Product Development (CSIM) (Jan. 2014 – Mar. 2019), Charles Schwab & Co., Inc. |
Mark Fischer 1970 Chief Operating Officer (Officer of The Charles Schwab Family of Funds, Schwab Investments, Schwab Capital Trust, Schwab Annuity Portfolios, Schwab Strategic Trust and Laudus Trust since 2013) | Chief Operating Officer (Dec. 2020 – present) and Treasurer and Chief Financial Officer (Jan. 2016 – Dec. 2022), Schwab Funds, Laudus Trust and Schwab ETFs; Chief Financial Officer (Mar. 2020 – present) and Vice President (Oct. 2013 – present), Charles Schwab Investment Management, Inc. |
Dana Smith 1965 Treasurer and Chief Financial Officer (Officer of The Charles Schwab Family of Funds, Schwab Investments, Schwab Capital Trust, Schwab Annuity Portfolios, Schwab Strategic Trust and Laudus Trust since 2023) | Treasurer and Chief Financial Officer (Jan. 2023 – present) and Assistant Treasurer (Dec. 2015 – Dec. 2022), Schwab Funds, Laudus Trust and Schwab ETFs; Vice President (Mar. 2022 – present) and Director (Oct. 2015 – Mar. 2022), Charles Schwab Investment Management, Inc. |
32Schwab U.S. REIT ETF | Annual Report
Officers of the Trust (continued) |
Name, Year of Birth, and Position(s) with the trust (Terms of office, and length of Time Served3) | Principal Occupations During the Past Five Years |
Omar Aguilar 1970 Vice President and Chief Investment Officer (Officer of The Charles Schwab Family of Funds, Schwab Investments, Schwab Capital Trust, Schwab Annuity Portfolios, Schwab Strategic Trust and Laudus Trust since 2011) | Chief Executive Officer (Jan. 2022 – present), Chief Investment Officer (Apr. 2011 – present) and Senior Vice President (Apr. 2011 – Dec. 2021), Charles Schwab Investment Management, Inc.; Director, Chief Executive Officer and President (Oct. 2022 – present), Charles Schwab Investment Advisory, Inc.; Vice President and Chief Investment Officer (June 2011 – present), Schwab Funds, Laudus Trust and Schwab ETFs. |
Brett Wander 1961 Vice President and Chief Investment Officer (Officer of The Charles Schwab Family of Funds, Schwab Investments, Schwab Capital Trust, Schwab Annuity Portfolios, Schwab Strategic Trust and Laudus Trust since 2011) | Senior Vice President and Chief Investment Officer (Apr. 2011 – present), Charles Schwab Investment Management, Inc.; Vice President and Chief Investment Officer (June 2011 – present), Schwab Funds, Laudus Trust and Schwab ETFs. |
William P. McMahon, Jr. 1972 Vice President and Chief Investment Officer (Officer of The Charles Schwab Family of Funds, Schwab Investments, Schwab Capital Trust, Schwab Annuity Portfolios, Schwab Strategic Trust and Laudus Trust since 2021) | Senior Vice President and Chief Investment Officer (Jan. 2020 – present), Charles Schwab Investment Management, Inc.; Vice President and Chief Investment Officer (June 2021 – present), Schwab Funds, Laudus Trust and Schwab ETFs; Senior Vice President and Chief Investment Officer – ThomasPartners Strategies (Apr. 2018 – Dec. 2019), Charles Schwab Investment Advisory, Inc.; Senior Vice President and Chief Investment Officer (May 2001 – Apr. 2018), ThomasPartners, Inc. |
Catherine MacGregor 1964 Chief Legal Officer and Secretary, Schwab Funds and Schwab ETFs Chief Legal Officer, Vice President and Clerk, Laudus Trust (Officer of The Charles Schwab Family of Funds, Schwab Investments, Schwab Capital Trust, Schwab Annuity Portfolios and Laudus Trust since 2005; Schwab Strategic Trust since 2009) | Chief Legal Officer (Mar. 2022 – present) and Vice President (Sept. 2005 – present), Charles Schwab Investment Management, Inc.; Managing Director (May 2022 – present) and Vice President (July 2005 – May 2022), Charles Schwab & Co., Inc.; Vice President (Dec. 2005 – present) and Chief Legal Officer and Clerk (Mar. 2007 – present), Laudus Trust; Chief Legal Officer and Secretary (Oct. 2021 – present), Vice President (Nov. 2005 – Oct. 2021) and Assistant Secretary (June 2007 – Oct. 2021), Schwab Funds; Chief Legal Officer and Secretary (Oct. 2021 – present), Vice President and Assistant Secretary (Oct. 2009 – Oct. 2021), Schwab ETFs. |
1
Each Trustee shall hold office until the election and qualification of his or her successor, or until he or she dies, resigns or is removed. The retirement policy requires that each independent trustee retire by December 31 of the year in which the Trustee turns 74 or the Trustee’s twentieth year of service as an independent trustee on any trust in the Fund Complex, whichever occurs first.
2
Mr. Bettinger and Mr. Wurster are Interested Trustees. Mr. Bettinger and Mr. Wurster are Interested Trustees because each owns stock of The Charles Schwab Corporation (CSC), the parent company of Charles Schwab Investment Management, Inc., the investment adviser for the trusts in the Fund Complex, and is an employee of Charles Schwab & Co., Inc. (Schwab), the principal underwriter for The Charles Schwab Family of Funds, Schwab Investments, Schwab Capital Trust, Schwab Annuity Portfolios and Laudus Trust.
3
The President, Treasurer and Secretary/Clerk hold office until their respective successors are chosen and qualified or until he or she sooner dies, resigns, is removed or becomes disqualified. Each of the other officers serves at the pleasure of the Board.
Schwab U.S. REIT ETF | Annual Report33
ask See “offer.”
asset allocation The practice of dividing a portfolio among different asset classes, with each asset class assigned a particular percentage to help offset risks and rewards, based on your goals, time horizon and risk tolerance.
asset class A group of securities with similar structure and basic characteristics. Stocks, bonds and cash are the three main examples of asset classes.
authorized participant (AP) A large institutional investor that places orders for creation units with the funds’ distributor.
beta A historical measure of an investment’s volatility relative to a market index (usually the S&P 500®). The index is defined as having a beta of 1.00. Investments with a beta higher than 1.00 have been more volatile than the index; those with a beta of less than 1.00 have been less volatile.
bid The highest price at which someone is willing to buy a security.
Bloomberg US Aggregate Bond Index An index that is a broad-based benchmark measuring the performance of the U.S. investment grade, taxable bond market, including U.S. Treasuries, government-related and corporate bonds, mortgage pass-through securities, commercial mortgage-backed securities, and asset-backed securities that are publicly available for sale in the United States. To be eligible for inclusion in the index, securities must be fixed rate, non-convertible, U.S. dollar-denominated with at least $300 million or more of outstanding face value and have one or more years remaining to maturity. The index excludes certain types of securities, including tax-exempt state and local government series bonds, structured notes embedded with swaps or other special features, private placements, floating rate securities, inflation-linked bonds and Eurobonds. The index is market capitalization weighted and the securities in the index are updated on the last business day of each month.
cap, capitalization See “market cap.”
capital gain, capital loss The difference between the amount paid for an investment and its value at a later time. If the investment has been sold, the capital gain or loss is considered a realized gain or loss. If the investment is still held, the gain or loss is still “on paper” and is considered unrealized.
commencement of operations The date that the first NAV was calculated.
creation unit (C.U.) A basket of securities that is delivered by an authorized participant (AP) to the fund equal to the current holdings of the ETF, plus a designated cash component. In return, the APs receive a large block of ETF shares (typically 50,000 shares), which investors can then buy and sell in the secondary market.
Dow Jones Equity All REIT Capped Index A float-adjusted market cap weighted index that is designed to measure all equity real estate investment trusts (REITs) in the Dow Jones U.S. Total Stock Market Index, as defined by the S&P Dow Jones Indices REIT/RESI Industry Classification Hierarchy, that meet the minimum float market capitalization (FMC) and liquidity thresholds. The aggregate weight of all companies weighing more than 4.5% cannot exceed 22.5%, and no single company’s weight can exceed 10%. The index is reviewed daily based on each company’s capped market capitalization weight. Daily capping is only performed when the sum of companies with weights great than 5% exceeds 25%.
Dow Jones U.S. Select REIT Index An index that is a float-adjusted market-capitalization weighted index comprised of income-producing commercial and/or residential real estate investment trusts (REITs). The index excludes mortgage REITs, net-lease REITs, real estate finance companies, mortgage brokers and bankers, commercial and residential real estate brokers and estate agents, homebuilders, large landowners and sub-dividers of unimproved land, hybrid REITs, timber REITs and companies that have more than 25% of their assets in direct mortgage investments.
exchange A marketplace, or any organization or group that provides or maintains a marketplace for trading securities, options, futures, or commodities.
expense ratio The amount that is taken from the fund’s assets each year to cover the operating expenses. An expense ratio of 0.50% means that a fund’s expenses amount to half of one percent of its average net assets a year.
FTSE EPRA Nareit Global Index (Net) An index that provides a diverse representation of publicly traded equity real estate investment trusts (REITs) and listed property companies worldwide. The index constituents are free-float adjusted, and screened on liquidity, size and revenue. The index is comprised of countries in developed and emerging markets. The Net of Tax Index is calculated based on the maximum withholding tax rates applicable to dividends received by institutional investors who are not resident in the same country as the remitting company and who do not benefit from double taxation treaties.
inception date The date that the shares began trading in the secondary market.
indicative optimized portfolio value (IOPV) A calculation disseminated by the stock exchange that approximates the fund’s NAV every 15 seconds throughout the trading day.
liquidity The ability to convert a security or asset quickly into cash.
market cap, market capitalization The value of a company as determined by the total value of all shares of its stock outstanding.
market price return The return based on the change in market price per share of the fund over a given time period. Market price returns assume that dividends and capital gain distributions have been reinvested in the fund at market price.
median market cap The midpoint of the range of market caps of the stocks held by a fund. There are different ways of calculating median market cap. With a simple median, half of the stocks in the fund’s portfolio would be larger than the median, and half would be smaller. With a weighted median (the type that is calculated for these funds), half of the fund’s assets are invested in stocks that are larger than the median market cap, and half in stocks that are smaller.
MSCI EAFE Index (Net) A free float-adjusted market capitalization index that is designed to measure the equity market performance of developed markets in Europe, Australasia, and the Far East. The Net version of the index reflects reinvested dividends net of withholding taxes, but reflects no deductions for expenses or other taxes; returns are calculated applying dividend withholding rates applicable to non-resident persons who do not benefit from double taxation treaties.
net asset value (NAV) The value of one share of a fund. NAV is calculated by taking the fund’s total assets, subtracting liabilities, and dividing by the number of shares outstanding.
34Schwab U.S. REIT ETF | Annual Report
NAV return The return based on the change in NAV of the fund over a given time period. NAV returns assume that dividends and capital gain distributions have been reinvested in the fund.
offer (ask) The lowest price at which an individual is willing to sell a security.
open The price at which a security opened for trading on a given day.
outstanding shares, shares outstanding When speaking of the fund, indicates all shares currently held by investors.
price-to-book ratio (P/B) The market price of a company’s stock compared with its “book value.” A mutual fund’s P/B is the weighted average of the P/B of all stocks in the fund’s portfolio.
price-to-earnings ratio (P/E) The market price of a company’s stock compared with earnings over the past year. A mutual fund’s P/E is the weighted average of the P/E of all stocks in the fund’s portfolio.
primary market The market that deals with the issuance of new securities.
real estate investment trust (REIT) Real estate companies that own and commonly operate income producing commercial and/or residential real estate.
REIT Spliced Index An internally calculated index, comprised of the Dow Jones U.S. Select REIT Index from the inception of the Schwab U.S. REIT ETF until the close of business on June 19, 2020, and the Dow Jones Equity All REIT Capped Index thereafter. The REIT Spliced Index is published with the permission of S&P Dow Jones Indices LLC, but is not calculated, sponsored or endorsed by S&P Dow Jones Indices LLC.
rights and warrants Rights and warrants are types of securities that entitle the holder to purchase a proportionate amount of common stock at a specified price for a specific period of time. Rights allow a
shareholder to buy more shares directly from the company, usually at a price somewhat lower than the current market price of the outstanding shares. Warrants are usually issued with bonds and preferred stock. Rights and warrants can trade on the market separately from the company’s stock. The prices of rights and warrants do not necessarily move parallel to the prices of the underlying common stock. Rights usually expire within a few weeks of issuance, while warrants may not expire for several years. If a right or warrant is not exercised within the specified time period, it will become worthless and a fund will lose the purchase price it paid for the right or warrant and the right to purchase the underlying security.
S&P 500 Index An index that is designed to measure the performance of 500 leading publicly traded companies from a broad range of industries.
sampling If a fund uses a sampling method, the fund will not fully replicate the benchmark index and may hold securities not included in the index. A fund that utilizes a sampling approach may not track the return of the index.
secondary market The market in which investors purchase securities from other investors rather than directly from the issuing companies. Organized exchanges facilitate the trading of securities in the secondary market.
spread The gap between bid and ask prices of a security.
stock A share of ownership, or equity, in the issuing company.
total return The percentage that an investor would have earned or lost on an investment in the fund assuming dividends and distributions were reinvested.
tracking error The difference between the performance of the fund and its benchmark index, positive or negative.
Schwab U.S. REIT ETF | Annual Report35
Schwab ETFs
Schwab ETFs are designed to serve as simple low-cost core investment products for a diversified portfolio. These ETFs seek to provide consistent, repeatable performance through a variety of investment strategies that span the equity and fixed income spectrum. The list below shows all currently available Schwab ETFs.
Investors should carefully consider information contained in the prospectus, or if available, the summary prospectus, including investment objectives, risks, charges and expenses before investing. Please call 1-877-824-5615 for a prospectus for any Schwab ETF. Please read the prospectus carefully before you invest. This report must be preceded or accompanied by a current prospectus.
Proxy Voting Policies, Procedures and Results
A description of the proxy voting policies and procedures used to determine how to vote proxies on behalf of the funds is available without charge, upon request, by visiting the Schwab ETFs’ website at www.schwabassetmanagement.com/schwabetfs_prospectus, the SEC’s website at www.sec.gov, or by contacting Schwab ETFs at 1-877-824-5615.
Information regarding how a fund voted proxies relating to portfolio securities during the most recent twelve-month period ended June 30 is available, without charge, by visiting the fund’s website at www.schwabassetmanagement.com/schwabetfs_prospectus or the SEC’s website at www.sec.gov.
Schwab ETFs
U.S. ETFs
Schwab U.S. Broad Market ETF
Schwab 1000 Index® ETF
Schwab U.S. Large-Cap ETF
Schwab U.S. Large-Cap Growth ETF
Schwab U.S. Large-Cap Value ETF
Schwab U.S. Mid-Cap ETF
Schwab U.S. Small-Cap ETF
Schwab U.S. Dividend Equity ETF
Schwab U.S. REIT ETF
International ETFs
Schwab International Dividend Equity ETF
Schwab International Equity ETF
Schwab International Small-Cap Equity ETF
Schwab Emerging Markets Equity ETF
Fixed-Income ETFs
Schwab U.S. TIPS ETF
Schwab Short-Term U.S. Treasury ETF
Schwab Intermediate-Term U.S. Treasury ETF
Schwab Long-Term U.S. Treasury ETF
Schwab U.S. Aggregate Bond ETF
Schwab 1-5 Year Corporate Bond ETF
Schwab 5-10 Year Corporate Bond ETF
Schwab Municipal Bond ETF
Fundamental Index* ETFs
Schwab Fundamental U.S. Broad Market Index ETF
Schwab Fundamental U.S. Large Company Index ETF
Schwab Fundamental U.S. Small Company Index ETF
Schwab Fundamental International Large Company Index ETF
Schwab Fundamental International Small Company Index ETF
Schwab Fundamental Emerging Markets Large Company
Index ETF
Active, Semi-Transparent (Also Known As Non-Transparent) ETF
Schwab Ariel ESG ETF
Thematic ETFs
Schwab Crypto Thematic ETF
Investment Adviser
Charles Schwab Investment Management, Inc., dba Schwab Asset Management
211 Main Street, San Francisco, CA 94105
Schwab ETFs
1-877-824-5615
© 2023 Charles Schwab Investment Management, Inc., dba Schwab Asset Management. All rights reserved.
Printed on recycled paper.
*
FUNDAMENTAL INDEX is a registered trademark of Research Affiliates LLC.
The Schwab Ariel ESG ETF is different from traditional ETFs. Traditional ETFs tell the public what assets they hold each day. This fund will not. This may create additional risks for your investment. For example:
•
You may have to pay more money to trade the fund’s shares. This fund will provide less information to traders, who tend to charge more for trades when they have less information.
•
The price you pay to buy fund shares on an exchange may not match the value of the fund’s portfolio. The same is true when you sell shares. These price differences may be greater for this fund compared to other ETFs because it provides less information to traders.
•
These additional risks may be even greater in bad or uncertain market conditions.
•
The ETF will publish on its website each day a “Proxy Portfolio” designed to help trading in shares of the ETF. While the Proxy Portfolio includes some of the ETF’s holdings, it is not the ETF’s actual portfolio.
The differences between this fund and other ETFs may also have advantages. By keeping certain information about the fund secret, this fund may face less risk that other traders can predict or copy its investment strategy. This may improve the fund’s performance. If other traders are able to copy or predict the fund’s investment strategy, however, this may hurt the fund’s performance.
For additional information regarding the unique attributes and risks of the fund, see Proxy Portfolio Risk, Premium/Discount Risk, Trading Halt Risk, Authorized Participant Concentration Risk, Tracking Error Risk and Shares of the Fund May Trade at Prices Other Than NAV in the Principal Risks and Proxy Portfolio and Proxy Overlap sections of the prospectus and/or the Statement of Additional Information. These risks are discussed on the next page.
Active semi-transparent ETFs operate differently from other exchange-traded funds (ETFs). Unlike other ETFs, an active semi-transparent ETF does not publicly disclose its entire portfolio composition each business day, which may affect the price at which shares of the ETF trade in the secondary market. Active semi-transparent ETFs have limited public trading history. There can be no assurance that an active trading market will develop, be maintained or operate as intended. There is a risk that the market price of an active semi-transparent ETF may vary significantly from the ETF’s net asset value and that its shares may trade at a wider bid/ask spread and, therefore, cost investors more to trade than shares of other ETFs. These risks are heightened during periods of market disruption or volatility.
Proxy Portfolio Risk: Unlike traditional ETFs, this fund does not disclose its portfolio holdings (Actual Portfolio) daily. The fund instead posts a Proxy Portfolio on its website each day. The Proxy Portfolio is designed to reflect the economic exposures and risk characteristics of the fund’s actual holdings on each trading day, but it is not the same as the fund’s Actual Portfolio. Although the Proxy Portfolio is intended to provide investors with enough information to allow for an effective arbitrage mechanism that will keep the market price of the Fund at or close to the underlying NAV per Share of the Fund, there is a risk (which may increase during periods of market disruption or volatility) that market prices will vary significantly from the underlying NAV of the fund. ETF trading on the basis of a published Proxy Portfolio may trade at a wider bid/ask spread than ETFs that publish their portfolios on a daily basis, especially during periods of market disruption or volatility, and therefore may cost investors more to trade. Also, while the Fund seeks to benefit from keeping its portfolio information secret, market participants may attempt to use the Proxy Portfolio to identify a Fund’s trading strategy, which if successful, could result in such market participants engaging in certain predatory trading practices that may have the potential to harm the Fund and its shareholders.
Proxy Portfolio Construction: The Proxy Portfolio is designed to recreate the daily performance of the Actual Portfolio. This is achieved by performing a “Factor Model” analysis of the Actual Portfolio. The Factor Model is comprised of three sets of factors or analytical metrics: market-based factors, fundamental factors, and industry/sector factors. The fund uses a “Model Universe” to generate its Proxy Portfolio. The Model Universe is comprised of securities that the fund can purchase and will be a financial index or stated portfolio of securities from which fund investments will be selected. The results of the Factor Model analysis are then applied to the Model Universe. The Proxy Portfolio is then generated as a result of this Model Universe analysis with the Proxy Portfolio being a small sub-set of the Model Universe. The Factor Model is applied to both the Actual Portfolio and the Model Universe to construct the fund’s Proxy Portfolio that performs in a manner substantially identical to the performance of its Actual Portfolio. The Proxy Portfolio will only include investments the fund is permitted to hold. The fund’s SAI contains more information on the Proxy Portfolio and its construction.
Proxy Portfolio and Proxy Overlap Information regarding the contents of the Proxy Portfolio, and the percentage weight overlap between the holdings of the Proxy Portfolio and the fund’s Actual Portfolio holdings that formed the basis for its calculation of NAV at the end of the prior Business Day (the Portfolio Overlap), is available by visiting the fund’s website www.schwabassetmanagement.com.
Because environmental, social and governance (ESG) strategies exclude some securities, ESG-focused products may not be able to take advantage of the same opportunities or market trends as products that do not use such strategies. Additionally, the criteria used to select companies for investment may result in investing in securities, industries or sectors that underperform the market as a whole.
This page is intentionally left blank.
Annual Report | February 28, 2023
Schwab Fundamental Index* ETFs
Schwab Fundamental U.S. Broad Market Index ETF | |
Schwab Fundamental U.S. Large Company Index ETF | |
Schwab Fundamental U.S. Small Company Index ETF | |
Schwab Fundamental International Large Company Index ETF | |
Schwab Fundamental International Small Company Index ETF | |
Schwab Fundamental Emerging Markets Large Company Index ETF | |
*
SCHWAB is a registered trademark of Charles Schwab & Co., Inc.
FUNDAMENTAL INDEX is a registered trademark of Research Affiliates LLC.
This page is intentionally left blank.
Fund investment adviser: Charles Schwab Investment Management, Inc., dba Schwab Asset ManagementTM
Distributor: SEI Investments Distribution Co. (SIDCO)
The Sector/Industry classifications in this report use the Global Industry Classification Standard (GICS) which was developed by and is the exclusive property of MSCI Inc. (MSCI) and Standard & Poor’s (S&P). GICS is a service mark of MSCI and S&P and has been licensed for use by Charles Schwab & Co., Inc. The Industry classifications used in the Portfolio Holdings are sub-categories of Sector classifications.
Schwab Fundamental Index ETFs | Annual Report1
Schwab Fundamental Index ETFs
The performance data quoted represents past performance. Past performance does not guarantee future results. Investment returns and principal value of an investment will fluctuate so that an investor’s shares, when sold or redeemed, may be worth more or less than the original cost. Current performance may be lower or higher than the performance data quoted. To obtain performance information current to the most recent month end, please visit www.schwabassetmanagement.com/schwabetfs_prospectus.
Total Returns for the 12 Months Ended February 28, 2023 |
Schwab Fundamental U.S. Broad Market Index ETF (Ticker Symbol: FNDB) | |
| |
| |
| |
| |
ETF Category: Morningstar Large Value2 | |
| |
| |
Schwab Fundamental U.S. Large Company Index ETF (Ticker Symbol: FNDX) | |
| |
| |
Russell RAFITM US Large Company Index | |
| |
ETF Category: Morningstar Large Value2 | |
| |
| |
Schwab Fundamental U.S. Small Company Index ETF (Ticker Symbol: FNDA) | |
| |
| |
Russell RAFITM US Small Company Index | |
| |
ETF Category: Morningstar Small Blend2 | |
| |
Total Returns for the 12 Months Ended February 28, 2023 |
Schwab Fundamental International Large Company Index ETF (Ticker Symbol: FNDF) | |
| |
| |
Russell RAFITM Developed ex US Large Company Index (Net)* | |
| |
ETF Category: Morningstar Foreign Large Value2 | |
| |
| |
Schwab Fundamental International Small Company Index ETF (Ticker Symbol: FNDC) | |
| |
| |
Russell RAFITM Developed ex US Small Company Index (Net)* | |
S&P Developed ex-U.S. Small Cap Index (Net)* | |
ETF Category: Morningstar Foreign Small/Mid Value2 | |
| |
| |
Schwab Fundamental Emerging Markets Large Company Index ETF (Ticker Symbol: FNDE) | |
| |
| |
Russell RAFITM Emerging Markets Large Company Index (Net)* | |
MSCI Emerging Markets Index (Net)* | |
ETF Category: Morningstar Diversified Emerging Markets2 | |
| |
All total returns on this page assume dividends and distributions were reinvested. Index figures do not include trading and management costs, which would lower performance. Indices are unmanaged and cannot be invested in directly. Performance results less than one year are not annualized.
The first index listed for each fund is the fund’s primary benchmark, as shown in the prospectus. Additional indices shown are provided for comparative purposes.
For index definitions, please see the Glossary.
Performance does not reflect the deduction of taxes that a shareholder would pay on fund distributions or on the redemption or sale of fund shares.
Shares are bought and sold at market price, which may be higher or lower than the net asset value (NAV). Brokerage commissions will reduce returns.
Index ownership — The Schwab Fundamental Index ETFs are not in any way sponsored, endorsed, sold or promoted by Frank Russell Company (Russell), by the London Stock Exchange Group companies (LSEG), or by Research Affiliates LLC (RA) (collectively the Licensor Parties), and none of the Licensor Parties make any warranty or representation whatsoever, expressly or impliedly, either as to the results to be obtained from the use of the Russell RAFI™ Index Series (the Indices) or otherwise. The Indices are compiled and calculated by Russell in conjunction with RA. None of the Licensor Parties shall be liable (whether in negligence or otherwise) to any person for any error in the Indices and none of the Licensor Parties shall be under any obligation to advise any person of any error therein. “Russell®” is a trademark of Russell. The trade names “Research Affiliates®”, “Fundamental Index®” and “RAFI®” are registered trademarks of RA. Charles Schwab Investment Management, Inc. has obtained full license from Russell to use the Indices. For full disclaimer please see the funds’ statement of additional information.
*
The net version of the index reflects reinvested dividends net of withholding taxes but reflects no deductions for expenses or other taxes.
1
ETF performance must be shown based on both a market price and NAV basis. The fund’s per share NAV is the value of one share of the fund. NAV is calculated by taking the fund’s total assets (including the fair value of securities owned), subtracting liabilities, and dividing by the number of shares outstanding. The NAV Return is based on the NAV of the fund, and the Market Price Return is based on the market price per share of the fund. The price used to calculate market return (Market Price) is determined using the Official Closing Price on the primary stock exchange (generally, 4:00 p.m. Eastern time) and may not represent the returns you would receive if shares were traded at other times. Market Price and NAV returns assume that dividends and capital gain distributions have been reinvested in the fund at Market Price and NAV, respectively.
2
Source for category information: Morningstar, Inc. The Morningstar Category return represents all passively- and actively-managed ETFs and mutual funds within the category as of the report date.
2Schwab Fundamental Index ETFs | Annual Report
Schwab Fundamental Index ETFs
The Investment Environment
For the 12-month reporting period ended February 28, 2023, U.S. and international equity markets lost ground as inflation spiked, interest rates rose, and economic growth around the world slowed. The ongoing war between Russia and Ukraine and the continuing, albeit uneven, fallout from the COVID-19 pandemic weighed on economies and markets around the world. The U.S. dollar rose against a basket of foreign currencies through October 2022, but generally declined through the remainder of the reporting period, ending it slightly higher than it began. For the reporting period, the S&P 500® Index, a bellwether for the overall U.S. stock market, returned -7.69%. Among U.S. stocks, both large-cap stocks and small-cap stocks lost ground, with the Russell 1000® Index and the Russell RAFI™ US Large Company Index returning -8.21% and -1.33%, respectively, and the Russell 2000®Index and Russell RAFI™ US Small Company Index returning -6.02% and -2.00%, respectively. U.S. growth stocks underperformed U.S. value stocks. Among international markets, the MSCI EAFE® Index (Net)*, a broad measure of developed international equity performance, and the Russell RAFI™ Developed ex US Large Company Index (Net)* returned -3.14% and -0.87%, respectively, and the MSCI Emerging Markets Index (Net)* and the Russell RAFI™ Emerging Markets Large Company Index (Net)* returned -15.28% and -12.26%, respectively.
In the United States, amid fading government stimuli, ongoing supply chain disruptions, persisting inflation, and a widening trade deficit, gross domestic product (GDP) contracted for the first and second quarters of 2022, decreasing at an annualized rate of -1.6% and -0.6%, respectively. GDP grew in the last two quarters, at an annualized rate of 3.2% and 2.6% for the third and fourth quarters, respectively. Inflation rose steadily in the first half of 2022, hitting a 40-year high in June 2022, before declining through the end of the reporting period, as certain consumer and energy prices began to recede. The unemployment rate remained low despite inflationary pressures, ending the reporting period near pre-pandemic lows.
Asset Class Performance Comparison % returns during the 12 months ended February 28, 2023
Index figures assume dividends and distributions were reinvested. Index figures do not include trading and management costs, which would lower performance. Indices are unmanaged and cannot be invested in directly. Performance results less than one year are not annualized. Past performance is not a guarantee of future results.
For index definitions, please see the Glossary.
Data source: Index provider websites and Schwab Asset Management.
Nothing in this report represents a recommendation of a security by the investment adviser.
Management views may have changed since the report date.
*
The net version of the index reflects reinvested dividends net of withholding taxes but reflects no deductions for expenses or other taxes.
Schwab Fundamental Index ETFs | Annual Report3
Schwab Fundamental Index ETFs
The Investment Environment (continued)
Outside the United States, conditions were similar. The eurozone, despite considerable headwinds, managed to maintain positive, albeit waning, GDP growth throughout 2022 as COVID-19 restrictions eased and tourism increased in response to pent-up demand. The United Kingdom posted small gains in GDP growth for the first and second quarters of 2022, in part driven by increased COVID-19 testing and tracing and an expansion of its vaccination program, contracted slightly in the third quarter, and rose slightly for the fourth quarter. Japan’s GDP growth vacillated within a small range throughout 2022. Among emerging markets, China’s GDP growth remained positive during the reporting period but slowed notably as it dealt with numerous headwinds including political turbulence, COVID-19 lockdowns and quarantines, and a severe property downturn, as a result of stalled demand, a decline in financing for property development, halted construction on in progress projects, and homeowners pausing payment of their mortgages on incomplete builds. Although India posted positive gains in GDP for all four quarters of 2022, its growth slowed over the year, in part due to reductions in private spending as borrowing costs escalated. Oil prices peaked at over $120 per barrel in early March 2022 as sanctions were imposed on Russian imports—and again in June on supply-and-demand imbalances—but generally retreated for the rest of the reporting period, ending at just under $80 per barrel.
Monetary policy around the world varied as central banks responded to the changing conditions. In the United States, after maintaining the federal funds rate in a range of 0.00% to 0.25% from mid-March 2020 through mid-March 2022, the U.S. Federal Reserve (Fed) shifted its stance as inflation continued to rise and indicators of economic activity and employment continued to strengthen. After issuing successively stronger signals that interest rates could begin to rise sooner in 2022 than previously anticipated, the Fed raised the federal funds rate eight times during the reporting period. The federal funds rate ended the reporting period in a range of 4.50% to 4.75%. The Fed wrapped up its bond-buying program in March 2022, and in June 2022 began to reduce the $9 trillion in assets held on its balance sheet, vowing to be even more aggressive than during its last round of quantitative tightening between 2017 and 2019. In developed international countries, central banks generally followed suit. The European Central Bank raised its interest rate five times over the reporting period in an effort to dampen demand and control inflation, which rose into double digits in October. The Bank of England raised its key official bank rate eight times during the reporting period, bringing borrowing costs to a 14-year high as it wrestled with soaring inflation. In contrast, the Bank of Japan continued to uphold its short-term interest rate target of -0.1%, unchanged since 2016, but in late December 2022 unexpectedly announced that it would widen the band around the yield target on its 10-year government bond, which pushed the yen higher. Monetary policy rates in emerging markets for the most part rose, with central banks in India, Indonesia, Brazil, Mexico, and Pakistan all raising their rates multiple times over the reporting period in an effort to counteract the impacts of inflation. In contrast, after cutting its prime rate in August 2022, China left its rate unchanged through the remainder of the reporting period. Loan demand began to rebound as China finally eased its stringent COVID-19 policies in early 2023. Russia, which had raised its benchmark policy rate to 20% in February 2022 amid the broadening fallout of Western sanctions in retaliation against its invasion of Ukraine, reduced it several times during the reporting period.
4Schwab Fundamental Index ETFs | Annual Report
Schwab Fundamental Index ETFs
Fund Management
| Christopher Bliss, CFA, Managing Director and Head of Passive Equity Strategies for Schwab Asset Management, is responsible for overseeing the investment process and portfolio management of investment strategies for passive equity Schwab Funds and Schwab ETFs. Before joining Schwab in 2016, Mr. Bliss spent 12 years at BlackRock (formerly Barclays Global Investors) managing and leading institutional index teams, most recently as a managing director and the head of the Americas institutional index team. In this role, Mr. Bliss was responsible for overseeing a team of portfolio managers managing domestic, developed international and emerging markets index strategies. Prior to BlackRock, he worked as an equity analyst and portfolio manager for Harris Bretall and before that, as a research analyst for JP Morgan. |
| Jeremy Brown, CFA, Senior Portfolio Manager for Schwab Asset Management, is responsible for the day-to-day co-management of the Schwab Fundamental U.S. Broad Market Index ETF, Schwab Fundamental U.S. Large Company Index ETF, and Schwab Fundamental U.S. Small Company Index ETF. Prior to joining Schwab in 2017, Mr. Brown spent six years with ALPS Advisors, Inc. in Denver, most recently as a senior analyst on the ETF portfolio management and research team where he performed portfolio management, trading, and analytics/research functions for ALPS ETFs and passive funds. Additionally, Mr. Brown led a number of investment research, commentary, industry trend analysis, and sales and marketing support initiatives. |
| Chuck Craig1, CFA, Senior Portfolio Manager for Schwab Asset Management, is responsible for the oversight and day-to-day co-management of the Schwab Fundamental International Large Company Index ETF, Schwab Fundamental International Small Company Index ETF, and Schwab Fundamental Emerging Markets Large Company Index ETF. Prior to joining Schwab in 2012, Mr. Craig worked at Guggenheim Funds (formerly Claymore Group), where he spent more than five years as a managing director of portfolio management and supervision, and three years as vice president of product research and development. Prior to that, he worked as an equity research analyst at First Trust Portfolios (formerly Niké Securities), and a trader and analyst at PMA Securities, Inc. |
| Ferian Juwono, CFA, Senior Portfolio Manager for Schwab Asset Management, is responsible for the day-to-day co-management of the Schwab Fundamental U.S. Broad Market Index ETF, Schwab Fundamental U.S. Large Company Index ETF, and Schwab Fundamental U.S. Small Company Index ETF. Prior to joining Schwab in 2010, Mr. Juwono worked at BlackRock (formerly Barclays Global Investors) where he spent more than three years as a portfolio manager, managing equity index funds for institutional clients, and two years as a senior business analyst. Prior to that, Mr. Juwono worked for more than four years as a senior financial analyst with Union Bank of California. |
| David Rios, Portfolio Manager for Schwab Asset Management, is responsible for the day-to-day co-management of the Schwab Fundamental International Large Company Index ETF, Schwab Fundamental International Small Company Index ETF, and Schwab Fundamental Emerging Markets Large Company Index ETF. Prior to this role, Mr. Rios was an associate portfolio manager on the equity index strategies team for four years. His first role with Schwab Asset Management was as a trade operations specialist. Prior to joining Schwab in 2008, Mr. Rios was a senior fund accountant at Investors Bank & Trust (subsequently acquired by State Street Corporation). |
| Sabya Sinha, Portfolio Manager for Schwab Asset Management, is responsible for the day-to-day co-management of the Schwab Fundamental U.S. Broad Market Index ETF, Schwab Fundamental U.S. Large Company Index ETF, and Schwab Fundamental U.S. Small Company Index ETF. Prior to joining Schwab in 2015, Mr. Sinha spent a year at F-Squared Investments on the product development and analytics team. Prior to F-Squared, he worked at IndexIQ Advisors as a senior index portfolio manager for three years and for Bank of America’s Columbia Management subsidiary as a portfolio manager for three years. Mr. Sinha also spent time as a software consultant at DPM Mellon, LLC and an equity trader at Jane Street Capital. |
1
Effective on or about May 5, 2023, Chuck Craig will retire and will no longer serve as senior portfolio manager of the Schwab Fundamental International Large Company Index ETF, Schwab Fundamental International Small Company Index ETF, and Schwab Fundamental Emerging Markets Large Company Index ETF.
Schwab Fundamental Index ETFs | Annual Report5
Schwab Fundamental U.S. Broad Market Index ETF as of February 28, 2023
The Schwab Fundamental U.S. Broad Market Index ETF’s (the fund) goal is to track as closely as possible, before fees and expenses, the total return of the Russell RAFITM US Index (the index). The index measures the performance of the constituent companies by fundamental overall company scores, which are created using as the universe the U.S. companies in the FTSE Global Total Cap Index. To pursue its investment objective, the fund invests in a representative sample of the securities included in the index which, when taken together, are expected to perform similarly to the index as a whole. Due to the use of sampling techniques, the fund may not hold all of the securities in the index. For more information concerning the fund’s investment objective, strategies, and risks, please see the fund’s prospectus.
Market Highlights. For the 12-month reporting period ended February 28, 2023, U.S. equity markets lost ground as inflation spiked, interest rates rose, and economic growth around the world slowed. The ongoing war between Russia and Ukraine and the continuing, albeit uneven, fallout from the COVID-19 pandemic weighed on economies and markets around the world. Among U.S. stocks, both large-cap stocks and small-cap stocks lost ground, and U.S. growth stocks underperformed U.S. value stocks.
Performance. For the 12-month reporting period ended February 28, 2023, the fund generally tracked the index. The fund’s market price return was -1.54% and its NAV return was -1.63% (for an explanation of the market price and NAV returns, please refer to footnote 2 on the following page). The index returned -1.36% during the same period. Differences between the return of the fund and the return of the index may be attributable to, among other things, the trading and management costs incurred by the fund and not the index.
Contributors and Detractors. The information technology sector detracted the most from the total return of the fund. Stocks in the information technology sector represented an average weight of approximately 16% of the fund’s investments and returned approximately -11% for the reporting period. One example from this sector is Intel Corp., which designs, manufactures, and sells computer components and related products. The fund’s holdings of Intel Corp. represented an average weight of approximately 1% of the fund’s investments and returned approximately -45% for the reporting period.
The communications services sector also detracted from the total return of the fund, representing an average weight of approximately 8% of the fund’s investments and returning approximately -20% for the reporting period.
The energy sector contributed the most to the total return of the fund. Stocks in the energy sector represented an average weight of approximately 9% of the fund’s investments and returned approximately 32% for the reporting period. One example from this sector is Exxon Mobil Corp., which operates petroleum and petro chemicals businesses. The fund’s holdings of Exxon Mobil Corp. represented an average weight of approximately 3% of the fund’s investments and returned approximately 45% for the reporting period.
The industrials sector also contributed to the total return of the fund, representing an average weight of approximately 11% of the fund’s investments and returning approximately 5% for the reporting period.
Management views and portfolio holdings may have changed since the report date.
6Schwab Fundamental Index ETFs | Annual Report
Schwab Fundamental U.S. Broad Market Index ETF
Performance and Fund Facts as of February 28, 2023
The performance data quoted represents past performance. Past performance does not guarantee future results. Investment returns and principal value of an investment will fluctuate so that an investor’s shares, when sold or redeemed, may be worth more or less than the original cost. Current performance may be lower or higher than the performance data quoted. To obtain performance information current to the most recent month end, please visit www.schwabassetmanagement.com/schwabetfs_prospectus.
Performance of Hypothetical $10,000 Investment (August 15, 2013 – February 28, 2023)1
Average Annual Total Returns1
| | | |
Fund: Schwab Fundamental U.S. Broad Market Index ETF (8/15/13) | | | |
| | | |
| | | |
| | | |
| | | |
ETF Category: Morningstar Large Value3 | | | |
Fund Expense Ratio4: 0.25% |
All total returns on this page assume dividends and distributions were reinvested. Index figures do not include trading and management costs, which would lower performance. Indices are unmanaged and cannot be invested in directly. Performance results less than one year are not annualized.
The first index listed for the fund is the fund’s primary benchmark, as shown in the prospectus. Additional indices shown are provided for comparative purposes.
For index definitions, please see the Glossary.
Shares are bought and sold at market price, which may be higher or lower than the net asset value (NAV). Brokerage commissions will reduce returns.
Index ownership — The Schwab Fundamental U.S. Broad Market Index ETF is not in any way sponsored, endorsed, sold or promoted by Frank Russell Company (Russell), by the London Stock Exchange Group companies (LSEG), or by Research Affiliates LLC (RA) (collectively the Licensor Parties), and none of the Licensor Parties make any warranty or representation whatsoever, expressly or impliedly, either as to the results to be obtained from the use of the Russell RAFI™ US Index (the Index) or otherwise. The Index is compiled and calculated by Russell in conjunction with RA. None of the Licensor Parties shall be liable (whether in negligence or otherwise) to any person for any error in the Index and none of the Licensor Parties shall be under any obligation to advise any person of any error therein. “Russell®” is a trademark of Russell. The trade names “Research Affiliates®”, “Fundamental Index®” and “RAFI®” are registered trademarks of RA. Charles Schwab Investment Management, Inc. has obtained full license from Russell to use the Index. For full disclaimer please see the fund’s statement of additional information.
*
Inception (8/15/13) represents the date that the shares began trading in the secondary market.
1
Performance does not reflect the deduction of taxes that a shareholder would pay on fund distributions or on the redemption or sale of fund shares.
2
ETF performance must be shown based on both a market price and NAV basis. The fund’s per share NAV is the value of one share of the fund. NAV is calculated by taking the fund’s total assets (including the fair value of securities owned), subtracting liabilities, and dividing by the number of shares outstanding. The NAV Return is based on the NAV of the fund, and the Market Price Return is based on the market price per share of the fund. The price used to calculate market return (Market Price) is determined using the Official Closing Price on the primary stock exchange (generally, 4:00 p.m. Eastern time) and may not represent the returns you would receive if shares were traded at other times. NAV is used as a proxy for purposes of calculating Market Price Return on inception date. Market Price and NAV returns assume that dividends and capital gain distributions have been reinvested in the fund at Market Price and NAV, respectively.
3
Source for category information: Morningstar, Inc. The Morningstar Category return represents all passively- and actively-managed ETFs and mutual funds within the category as of the report date.
4
As stated in the prospectus.
Schwab Fundamental Index ETFs | Annual Report7
Schwab Fundamental U.S. Broad Market Index ETF
Performance and Fund Facts as of February 28, 2023 (continued)
| |
Weighted Average Market Cap (millions) | |
Price/Earnings Ratio (P/E) | |
| |
| |
Sector Weightings % of Investments3
Top Equity Holdings % of Net Assets4
Portfolio holdings may have changed since the report date.
An index is a statistical composite of a specified financial market or sector. Unlike the fund, an index does not actually hold a portfolio of securities and its return is not inclusive of trading and management costs incurred by the fund.
Source of Sector Classification: S&P and MSCI.
2
Portfolio turnover rate excludes securities received or delivered from processing of in-kind creations or redemptions.
3
The percentage may differ from the Portfolio Holdings because the above calculation is based on a percentage of total investments, excluding derivatives, whereas the calculation in the Portfolio Holdings is based on a percentage of net assets.
4
This list is not a recommendation of any security by the investment adviser.
8Schwab Fundamental Index ETFs | Annual Report
Schwab Fundamental U.S. Large Company Index ETF as of February 28, 2023
The Schwab Fundamental U.S. Large Company Index ETF’s (the fund) goal is to track as closely as possible, before fees and expenses, the total return of the Russell RAFITM US Large Company Index (the index). The index measures the performance of the large company size segment by fundamental overall company scores, which are created using as the universe the U.S. companies in the FTSE Global Total Cap Index. To pursue its investment objective, the fund uses a replication investment approach and generally gives the same weight to a given stock as the index does. For more information concerning the fund’s investment objective, strategies, and risks, please see the fund’s prospectus.
Market Highlights. For the 12-month reporting period ended February 28, 2023, U.S. equity markets lost ground as inflation spiked, interest rates rose, and economic growth around the world slowed. The ongoing war between Russia and Ukraine and the continuing, albeit uneven, fallout from the COVID-19 pandemic weighed on economies and markets around the world. Among U.S. stocks, both large-cap stocks and small-cap stocks lost ground, and U.S. growth stocks underperformed U.S. value stocks.
Performance. For the 12-month reporting period ended February 28, 2023, the fund generally tracked the index. The fund’s market price return was -1.66% and its NAV return was -1.61% (for an explanation of the market price and NAV returns, please refer to footnote 2 on the following page). The index returned -1.33% during the same period. Differences between the return of the fund and the return of the index may be attributable to, among other things, the trading and management costs incurred by the fund and not the index.
Contributors and Detractors. The information technology sector detracted the most from the total return of the fund. Stocks in the information technology sector represented an average weight of approximately 16% of the fund’s investments and returned approximately -11% for the reporting period. One example from this sector is Intel Corp., which designs, manufactures, and sells computer components and related products. The fund’s holdings of Intel Corp. represented an average weight of approximately 1% and returned approximately -45% for the reporting period.
The communications services sector also detracted from the total return of the fund, representing an average weight of approximately 8% of the fund’s investments and returning approximately -19% for the reporting period.
The energy sector contributed the most to the total return of the fund. Stocks in the energy sector represented an average weight of approximately 10% of the fund’s investments and returned approximately 32% for the reporting period. One example from this sector is Exxon Mobil Corp., which operates petroleum and petro chemicals businesses. The fund’s holdings of Exxon Mobil Corp. represented an average weight of approximately 3% of the fund’s investments and returned approximately 45% for the reporting period.
The health care sector also contributed to the total return of the fund, representing an average weight of approximately 13% of the fund’s investments and returning approximately 4% for the reporting period.
Management views and portfolio holdings may have changed since the report date.
Schwab Fundamental Index ETFs | Annual Report9
Schwab Fundamental U.S. Large Company Index ETF
Performance and Fund Facts as of February 28, 2023
The performance data quoted represents past performance. Past performance does not guarantee future results. Investment returns and principal value of an investment will fluctuate so that an investor’s shares, when sold or redeemed, may be worth more or less than the original cost. Current performance may be lower or higher than the performance data quoted. To obtain performance information current to the most recent month end, please visit www.schwabassetmanagement.com/schwabetfs_prospectus.
Performance of Hypothetical $10,000 Investment (August 15, 2013 – February 28, 2023)1
Average Annual Total Returns1
| | | |
Fund: Schwab Fundamental U.S. Large Company Index ETF (8/15/13) | | | |
| | | |
| | | |
Russell RAFITM US Large Company Index | | | |
| | | |
ETF Category: Morningstar Large Value3 | | | |
Fund Expense Ratio4: 0.25% |
All total returns on this page assume dividends and distributions were reinvested. Index figures do not include trading and management costs, which would lower performance. Indices are unmanaged and cannot be invested in directly. Performance results less than one year are not annualized.
The first index listed for the fund is the fund’s primary benchmark, as shown in the prospectus. Additional indices shown are provided for comparative purposes.
For index definitions, please see the Glossary.
Shares are bought and sold at market price, which may be higher or lower than the net asset value (NAV). Brokerage commissions will reduce returns.
Index ownership — The Schwab Fundamental U.S. Large Company Index ETF is not in any way sponsored, endorsed, sold or promoted by Frank Russell Company (Russell), by the London Stock Exchange Group companies (LSEG), or by Research Affiliates LLC (RA) (collectively the Licensor Parties), and none of the Licensor Parties make any warranty or representation whatsoever, expressly or impliedly, either as to the results to be obtained from the use of the Russell RAFI™ US Large Company Index (the Index) or otherwise. The Index is compiled and calculated by Russell in conjunction with RA. None of the Licensor Parties shall be liable (whether in negligence or otherwise) to any person for any error in the Index and none of the Licensor Parties shall be under any obligation to advise any person of any error therein. “Russell®” is a trademark of Russell. The trade names “Research Affiliates®”, “Fundamental Index®” and “RAFI®” are registered trademarks of RA. Charles Schwab Investment Management, Inc. has obtained full license from Russell to use the Index. For full disclaimer please see the fund’s statement of additional information.
*
Inception (8/15/13) represents the date that the shares began trading in the secondary market.
1
Performance does not reflect the deduction of taxes that a shareholder would pay on fund distributions or on the redemption or sale of fund shares.
2
ETF performance must be shown based on both a market price and NAV basis. The fund’s per share NAV is the value of one share of the fund. NAV is calculated by taking the fund’s total assets (including the fair value of securities owned), subtracting liabilities, and dividing by the number of shares outstanding. The NAV Return is based on the NAV of the fund, and the Market Price Return is based on the market price per share of the fund. The price used to calculate market return (Market Price) is determined using the Official Closing Price on the primary stock exchange (generally, 4:00 p.m. Eastern time) and may not represent the returns you would receive if shares were traded at other times. NAV is used as a proxy for purposes of calculating Market Price Return on inception date. Market Price and NAV returns assume that dividends and capital gain distributions have been reinvested in the fund at Market Price and NAV, respectively.
3
Source for category information: Morningstar, Inc. The Morningstar Category return represents all passively- and actively-managed ETFs and mutual funds within the category as of the report date.
4
As stated in the prospectus.
10Schwab Fundamental Index ETFs | Annual Report
Schwab Fundamental U.S. Large Company Index ETF
Performance and Fund Facts as of February 28, 2023 (continued)
| |
Weighted Average Market Cap (millions) | |
Price/Earnings Ratio (P/E) | |
| |
| |
Sector Weightings % of Investments3
Top Equity Holdings % of Net Assets4
Portfolio holdings may have changed since the report date.
An index is a statistical composite of a specified financial market or sector. Unlike the fund, an index does not actually hold a portfolio of securities and its return is not inclusive of trading and management costs incurred by the fund.
Source of Sector Classification: S&P and MSCI.
2
Portfolio turnover rate excludes securities received or delivered from processing of in-kind creations or redemptions.
3
The percentage may differ from the Portfolio Holdings because the above calculation is based on a percentage of total investments, excluding derivatives, whereas the calculation in the Portfolio Holdings is based on a percentage of net assets.
4
This list is not a recommendation of any security by the investment adviser.
Schwab Fundamental Index ETFs | Annual Report11
Schwab Fundamental U.S. Small Company Index ETF as of February 28, 2023
The Schwab Fundamental U.S. Small Company Index ETF’s (the fund) goal is to track as closely as possible, before fees and expenses, the total return of the Russell RAFITM US Small Company Index (the index). The index measures the performance of the small company size segment by fundamental overall company scores, which are created using as the universe the U.S. companies in the FTSE Global Total Cap Index. To pursue its investment objective, the fund uses a replication investment approach and generally gives the same weight to a given stock as the index does. For more information concerning the fund’s investment objective, strategies, and risks, please see the fund’s prospectus.
Market Highlights. For the 12-month reporting period ended February 28, 2023, U.S. equity markets lost ground as inflation spiked, interest rates rose, and economic growth around the world slowed. The ongoing war between Russia and Ukraine and the continuing, albeit uneven, fallout from the COVID-19 pandemic weighed on economies and markets around the world. Among U.S. stocks, both large-cap stocks and small-cap stocks lost ground, and U.S. growth stocks underperformed U.S. value stocks.
Performance. For the 12-month reporting period ended February 28, 2023, the fund generally tracked the index. The fund’s market price return was -2.28% and the fund’s NAV return was -2.13% (for an explanation of the market price and NAV returns, please refer to footnote 2 on the following page). The index returned -2.00% during the same period. Differences between the return of the fund and the return of the index may be attributable to, among other things, the trading and management costs incurred by the fund and not the index.
Contributors and Detractors. The real estate sector detracted the most from the total return of the fund. Stocks from the real estate sector represented an average weight of approximately 9% of the fund’s investments and returned approximately -19% for the reporting period. One example from this sector is Uniti Group, Inc., which provides wireless infrastructure solutions for the communications industry. The fund’s holdings of Uniti Group, Inc. represented an average weight of less than 1% of the fund’s investments and returned approximately -55% for the reporting period.
The communications services sector also detracted from the total return of the fund, representing an average weight of approximately 4% of the fund’s investments and returning approximately -24% for the reporting period.
The energy sector contributed the most to the total return of the fund. Stocks in the energy sector represented an average weight of approximately 7% of the fund’s investments and returned approximately 43% for the reporting period. One example from this sector is Scorpio Tankers, Inc., a shipping company that provides seaborne transportation of crude oil and other petroleum products. The fund’s holdings of Scorpio Tankers, Inc. represented an average weight of less than 1% of the fund’s investments and returned approximately 252% for the reporting period.
The industrials sector also contributed to the total return of the fund, representing an average weight of approximately 19% of the fund’s investments and returning approximately 4% for the reporting period.
Management views and portfolio holdings may have changed since the report date.
12Schwab Fundamental Index ETFs | Annual Report
Schwab Fundamental U.S. Small Company Index ETF
Performance and Fund Facts as of February 28, 2023
The performance data quoted represents past performance. Past performance does not guarantee future results. Investment returns and principal value of an investment will fluctuate so that an investor’s shares, when sold or redeemed, may be worth more or less than the original cost. Current performance may be lower or higher than the performance data quoted. To obtain performance information current to the most recent month end, please visit www.schwabassetmanagement.com/schwabetfs_prospectus.
Performance of Hypothetical $10,000 Investment (August 15, 2013 – February 28, 2023)1
Average Annual Total Returns1
| | | |
Fund: Schwab Fundamental U.S. Small Company Index ETF (8/15/13) | | | |
| | | |
| | | |
Russell RAFITM US Small Company Index | | | |
| | | |
ETF Category: Morningstar Small Blend3 | | | |
Fund Expense Ratio4: 0.25% |
All total returns on this page assume dividends and distributions were reinvested. Index figures do not include trading and management costs, which would lower performance. Indices are unmanaged and cannot be invested in directly. Performance results less than one year are not annualized.
The first index listed for the fund is the fund’s primary benchmark, as shown in the prospectus. Additional indices shown are provided for comparative purposes.
For index definitions, please see the Glossary.
Shares are bought and sold at market price, which may be higher or lower than the net asset value (NAV). Brokerage commissions will reduce returns.
Small-company stocks may be subject to greater volatility than many other asset classes.
Index ownership — The Schwab Fundamental U.S. Small Company Index ETF is not in any way sponsored, endorsed, sold or promoted by Frank Russell Company (Russell), by the London Stock Exchange Group companies (LSEG), or by Research Affiliates LLC (RA) (collectively the Licensor Parties), and none of the Licensor Parties make any warranty or representation whatsoever, expressly or impliedly, either as to the results to be obtained from the use of the Russell RAFI™ US Small Company Index (the Index) or otherwise. The Index is compiled and calculated by Russell in conjunction with RA. None of the Licensor Parties shall be liable (whether in negligence or otherwise) to any person for any error in the Index and none of the Licensor Parties shall be under any obligation to advise any person of any error therein. “Russell®” is a trademark of Russell. The trade names “Research Affiliates®”, “Fundamental Index®” and “RAFI®” are registered trademarks of RA. Charles Schwab Investment Management, Inc. has obtained full license from Russell to use the Index. For full disclaimer please see the fund’s statement of additional information.
*
Inception (8/15/13) represents the date that the shares began trading in the secondary market.
1
Performance does not reflect the deduction of taxes that a shareholder would pay on fund distributions or on the redemption or sale of fund shares.
2
ETF performance must be shown based on both a market price and NAV basis. The fund’s per share NAV is the value of one share of the fund. NAV is calculated by taking the fund’s total assets (including the fair value of securities owned), subtracting liabilities, and dividing by the number of shares outstanding. The NAV Return is based on the NAV of the fund, and the Market Price Return is based on the market price per share of the fund. The price used to calculate market return (Market Price) is determined using the Official Closing Price on the primary stock exchange (generally, 4:00 p.m. Eastern time) and may not represent the returns you would receive if shares were traded at other times. NAV is used as a proxy for purposes of calculating Market Price Return on inception date. Market Price and NAV returns assume that dividends and capital gain distributions have been reinvested in the fund at Market Price and NAV, respectively.
3
Source for category information: Morningstar, Inc. The Morningstar Category return represents all passively- and actively-managed ETFs and mutual funds within the category as of the report date.
4
As stated in the prospectus.
Schwab Fundamental Index ETFs | Annual Report13
Schwab Fundamental U.S. Small Company Index ETF
Performance and Fund Facts as of February 28, 2023 (continued)
| |
Weighted Average Market Cap (millions) | |
Price/Earnings Ratio (P/E) | |
| |
| |
Sector Weightings % of Investments3
Top Equity Holdings % of Net Assets4
Portfolio holdings may have changed since the report date.
An index is a statistical composite of a specified financial market or sector. Unlike the fund, an index does not actually hold a portfolio of securities and its return is not inclusive of trading and management costs incurred by the fund.
Source of Sector Classification: S&P and MSCI.
2
Portfolio turnover rate excludes securities received or delivered from processing of in-kind creations or redemptions.
3
The percentage may differ from the Portfolio Holdings because the above calculation is based on a percentage of total investments, excluding derivatives, whereas the calculation in the Portfolio Holdings is based on a percentage of net assets.
4
This list is not a recommendation of any security by the investment adviser.
14Schwab Fundamental Index ETFs | Annual Report
Schwab Fundamental International Large Company Index ETF as of February 28, 2023
The Schwab Fundamental International Large Company Index ETF’s (the fund) goal is to track as closely as possible, before fees and expenses, the total return of the Russell RAFITM Developed ex US Large Company Index (the index). The index measures the performance of the large company size segment by fundamental overall company scores, which are created using as the universe the developed ex U.S. companies in the FTSE Global Total Cap Index. To pursue its investment objective, the fund invests in a representative sample of the securities included in the index which, when taken together, are expected to perform similarly to the index as a whole. Due to the use of sampling techniques, the fund may not hold all of the securities in the index. For more information concerning the fund’s investment objective, strategies, and risks, please see the fund’s prospectus.
Market Highlights. For the 12-month reporting period ended February 28, 2023, U.S. and international equity markets lost ground as inflation spiked, interest rates rose, and economic growth around the world slowed. The ongoing war between Russia and Ukraine and the continuing, albeit uneven, fallout from the COVID-19 pandemic weighed on economies and markets around the world. Among U.S. and international stocks, both large-cap stocks and small-cap stocks lost ground, and growth stocks underperformed value stocks. The U.S. dollar rose against a basket of foreign currencies through October 2022, but generally declined through the remainder of the reporting period, ending it slightly higher than it began.
Performance. For the 12-month reporting period ended February 28, 2023, the fund generally tracked the index. The fund’s market price return was -0.80% and its NAV return was -0.91% (for an explanation of the market price and NAV returns, please refer to footnote 2 on the following page). The index returned -0.87%1 during the same period.
Contributors and Detractors. Stocks from France contributed the most to the total return of the fund. French stocks represented an average weight of approximately 8% of the fund’s investments and returned approximately 10% in U.S. dollar terms for the reporting period. One example from this market is TotalEnergies SE, which produces, transports, and supplies crude oil, natural gas, and low carbon electricity, as well as refines petrochemical products. The fund’s holdings of TotalEnergies SE represented an average weight of approximately 1% of the fund’s investments and returned approximately 30% in U.S. dollar terms for the reporting period.
Stocks from the United Kingdom also contributed to the total return of the fund, representing an average weight of approximately 17% of the fund’s investments and returning approximately 5% in U.S. dollar terms for the reporting period.
Stocks from Japan detracted the most from the total return of the fund. Japanese stocks represented an average weight of approximately 26% of the fund’s investments and returned approximately -5% in U.S. dollar terms for the reporting period. One example from this market is Toyota Motor Corp, which manufactures, sells, leases, and repairs passenger cars, trucks, buses, and their related parts worldwide. The fund’s holdings of Toyota Motor Corp. represented an average weight of approximately 1% of the fund’s investments and returned approximately -24% in U.S. dollar terms for the reporting period.
Stocks from the Republic of Korea also detracted from the total return of the fund, representing an average weight of approximately 6% of the fund’s investments and retuning approximately -16% in U.S. dollar terms for the reporting period.
Management views and portfolio holdings may have changed since the report date.
1
The net version of the index reflects reinvested dividends net of withholding taxes but reflects no deductions for expenses or other taxes.
Schwab Fundamental Index ETFs | Annual Report15
Schwab Fundamental International Large Company Index ETF
Performance and Fund Facts as of February 28, 2023
The performance data quoted represents past performance. Past performance does not guarantee future results. Investment returns and principal value of an investment will fluctuate so that an investor’s shares, when sold or redeemed, may be worth more or less than the original cost. Current performance may be lower or higher than the performance data quoted. To obtain performance information current to the most recent month end, please visit www.schwabassetmanagement.com/schwabetfs_prospectus.
Performance of Hypothetical $10,000 Investment (August 15, 2013 – February 28, 2023)1
Average Annual Total Returns1
| | | |
Fund: Schwab Fundamental International Large Company Index ETF (8/15/13) | | | |
| | | |
| | | |
Russell RAFITM Developed ex US Large Company Index (Net)3 | | | |
| | | |
ETF Category: Morningstar Foreign Large Value4 | | | |
Fund Expense Ratio5: 0.25% |
All total returns on this page assume dividends and distributions were reinvested. Index figures do not include trading and management costs, which would lower performance. Indices are unmanaged and cannot be invested in directly. Performance results less than one year are not annualized.
The first index listed for the fund is the fund’s primary benchmark, as shown in the prospectus. Additional indices shown are provided for comparative purposes.
For index definitions, please see the Glossary.
Shares are bought and sold at market price, which may be higher or lower than the net asset value (NAV). Brokerage commissions will reduce returns.
International investing may involve risk of capital loss from unfavorable fluctuations in currency values, from differences in generally accepted accounting principles, or from economic or political instability in other nations.
Index ownership — The Schwab Fundamental International Large Company Index ETF is not in any way sponsored, endorsed, sold or promoted by Frank Russell Company (Russell), by the London Stock Exchange Group companies (LSEG), or by Research Affiliates LLC (RA) (collectively the Licensor Parties), and none of the Licensor Parties make any warranty or representation whatsoever, expressly or impliedly, either as to the results to be obtained from the use of the Russell RAFI™ Developed ex US Large Company Index (the Index) or otherwise. The Index is compiled and calculated by Russell in conjunction with RA. None of the Licensor Parties shall be liable (whether in negligence or otherwise) to any person for any error in the Index and none of the Licensor Parties shall be under any obligation to advise any person of any error therein. “Russell®” is a trademark of Russell. The trade names “Research Affiliates®”, “Fundamental Index®” and “RAFI®” are registered trademarks of RA. Charles Schwab Investment Management, Inc. has obtained full license from Russell to use the Index. For full disclaimer please see the fund’s statement of additional information.
*
Inception (8/15/13) represents the date that the shares began trading in the secondary market.
1
Performance does not reflect the deduction of taxes that a shareholder would pay on fund distributions or on the redemption or sale of fund shares.
2
ETF performance must be shown based on both a market price and NAV basis. The fund’s per share NAV is the value of one share of the fund. NAV is calculated by taking the fund’s total assets (including the fair value of securities owned), subtracting liabilities, and dividing by the number of shares outstanding. The NAV Return is based on the NAV of the fund, and the Market Price Return is based on the market price per share of the fund. The price used to calculate market return (Market Price) is determined using the Official Closing Price on the primary stock exchange (generally, 4:00 p.m. Eastern time) and may not represent the returns you would receive if shares were traded at other times. NAV is used as a proxy for purposes of calculating Market Price Return on inception date. Market Price and NAV returns assume that dividends and capital gain distributions have been reinvested in the fund at Market Price and NAV, respectively.
3
The net version of the index reflects reinvested dividends net of withholding taxes but reflects no deductions for expenses or other taxes.
4
Source for category information: Morningstar, Inc. The Morningstar Category return represents all passively- and actively-managed ETFs and mutual funds within the category as of the report date.
5
As stated in the prospectus.
16Schwab Fundamental Index ETFs | Annual Report
Schwab Fundamental International Large Company Index ETF
Performance and Fund Facts as of February 28, 2023 (continued)
| |
Weighted Average Market Cap (millions) | |
Price/Earnings Ratio (P/E) | |
| |
| |
Sector Weightings % of Investments1
Top Equity Holdings % of Net Assets4
Country Weightings % of Investments5
Portfolio holdings may have changed since the report date.
An index is a statistical composite of a specified financial market or sector. Unlike the fund, an index does not actually hold a portfolio of securities and its return is not inclusive of trading and management costs incurred by the fund.
Source of Sector Classification: S&P and MSCI.
2
Portfolio turnover rate excludes securities received or delivered from processing of in-kind creations or redemptions.
3
Amount is less than 0.05%.
4
This list is not a recommendation of any security by the investment adviser.
5
The percentage may differ from the Portfolio Holdings because the above calculation is based on a percentage of total investments, excluding derivatives, whereas the calculation in the Portfolio Holdings is based on a percentage of net assets.
Schwab Fundamental Index ETFs | Annual Report17
Schwab Fundamental International Small Company Index ETF as of February 28, 2023
The Schwab Fundamental International Small Company Index ETF’s (the fund) goal is to track as closely as possible, before fees and expenses, the total return of the Russell RAFITM Developed ex US Small Company Index (the index). The index measures the performance of the small company size segment by fundamental overall company scores, which are created using as the universe the developed ex U.S. companies in the FTSE Global Total Cap Index. To pursue its investment objective, the fund invests in a representative sample of the securities included in the index which, when taken together, are expected to perform similarly to the index as a whole. Due to the use of sampling techniques, the fund may not hold all of the securities in the index. For more information concerning the fund’s investment objective, strategies, and risks, please see the fund’s prospectus.
Market Highlights. For the 12-month reporting period ended February 28, 2023, U.S. and international equity markets lost ground as inflation spiked, interest rates rose, and economic growth around the world slowed. The ongoing war between Russia and Ukraine and the continuing, albeit uneven, fallout from the COVID-19 pandemic weighed on economies and markets around the world. Among U.S. and international stocks, both large-cap stocks and small-cap stocks lost ground, and growth stocks underperformed value stocks. The U.S. dollar rose against a basket of foreign currencies through October 2022, but generally declined through the remainder of the reporting period, ending it slightly higher than it began.
Performance. For the 12-month reporting period ended February 28, 2023, the fund generally tracked the index. The fund’s market price return was -6.99% and its NAV return was -6.91% (for an explanation of the market price and NAV returns, please refer to footnote 2 on the following page). The index returned -6.63%1 during the same period. Differences between the return of the fund and the return of the index may be attributable to, among other things, the trading and management costs incurred by the fund and not the index.
Contributors and Detractors. Stocks from Japan detracted the most from the total return of the fund. Japanese stocks represented an average weight of approximately 34% of the fund’s investments and returned approximately -6% in U.S. dollar terms for the reporting period. One example from this market is Nichi-iko Pharmaceutical Co., Ltd., which manufactures and sells prescription drugs. The fund’s holdings of Nichi-iko Pharmaceutical Co., Ltd. represented an average weight of less than 1% of the fund’s investments and returned approximately -95% in U.S. dollar terms for the reporting period.
Stocks from the Republic of Korea also detracted from the total return of the fund, representing an average weight of approximately 8% of the fund’s investments and returning approximately -10% in U.S. dollar terms for the reporting period.
Stocks from Denmark contributed the most to the total return of the fund. Danish stocks represented an average weight of approximately 2% of the fund’s investments and returned approximately 10% in U.S. dollar terms for the reporting period. One example from this market is D/S Norden A/S, an international shipping company. The fund’s holdings of D/S Norden A/S represented an average weight of less than 1% of the fund’s investments and returned approximately 242% in U.S. dollar terms for the reporting period.
Stocks from Finland also contributed to the total return of the fund, representing an average weight of approximately 1% of the fund’s investments and returning approximately 3% in U.S. dollar terms for the reporting period.
Management views and portfolio holdings may have changed since the report date.
1
The net version of the index reflects reinvested dividends net of withholding taxes but reflects no deductions for expenses or other taxes.
18Schwab Fundamental Index ETFs | Annual Report
Schwab Fundamental International Small Company Index ETF
Performance and Fund Facts as of February 28, 2023
The performance data quoted represents past performance. Past performance does not guarantee future results. Investment returns and principal value of an investment will fluctuate so that an investor’s shares, when sold or redeemed, may be worth more or less than the original cost. Current performance may be lower or higher than the performance data quoted. To obtain performance information current to the most recent month end, please visit www.schwabassetmanagement.com/schwabetfs_prospectus.
Performance of Hypothetical $10,000 Investment (August 15, 2013 – February 28, 2023)1
Average Annual Total Returns1
| | | |
Fund: Schwab Fundamental International Small Company Index ETF (8/15/13) | | | |
| | | |
| | | |
Russell RAFITM Developed ex US Small Company Index (Net)3 | | | |
S&P Developed ex-U.S. Small Cap Index (Net)3 | | | |
ETF Category: Morningstar Foreign Small/Mid Value4 | | | |
Fund Expense Ratio5: 0.39% |
All total returns on this page assume dividends and distributions were reinvested. Index figures do not include trading and management costs, which would lower performance. Indices are unmanaged and cannot be invested in directly. Performance results less than one year are not annualized.
The first index listed for the fund is the fund’s primary benchmark, as shown in the prospectus. Additional indices shown are provided for comparative purposes.
For index definitions, please see the Glossary.
Shares are bought and sold at market price, which may be higher or lower than the net asset value (NAV). Brokerage commissions will reduce returns.
International investing may involve risk of capital loss from unfavorable fluctuations in currency values, from differences in generally accepted accounting principles, or from economic or political instability in other nations.
Small-company stocks may be subject to greater volatility than many other asset classes.
Index ownership — The Schwab Fundamental International Small Company Index ETF is not in any way sponsored, endorsed, sold or promoted by Frank Russell Company (Russell), by the London Stock Exchange Group companies (LSEG), or by Research Affiliates LLC (RA) (collectively the Licensor Parties), and none of the Licensor Parties make any warranty or representation whatsoever, expressly or impliedly, either as to the results to be obtained from the use of the Russell RAFI™ Developed ex US Small Company Index (the Index) or otherwise. The Index is compiled and calculated by Russell in conjunction with RA. None of the Licensor Parties shall be liable (whether in negligence or otherwise) to any person for any error in the Index and none of the Licensor Parties shall be under any obligation to advise any person of any error therein. “Russell®” is a trademark of Russell. The trade names “Research Affiliates®”, “Fundamental Index®” and “RAFI®” are registered trademarks of RA. Charles Schwab Investment Management, Inc. has obtained full license from Russell to use the Index. For full disclaimer please see the fund’s statement of additional information.
*
Inception (8/15/13) represents the date that the shares began trading in the secondary market.
1
Performance does not reflect the deduction of taxes that a shareholder would pay on fund distributions or on the redemption or sale of fund shares.
2
ETF performance must be shown based on both a market price and NAV basis. The fund’s per share NAV is the value of one share of the fund. NAV is calculated by taking the fund’s total assets (including the fair value of securities owned), subtracting liabilities, and dividing by the number of shares outstanding. The NAV Return is based on the NAV of the fund, and the Market Price Return is based on the market price per share of the fund. The price used to calculate market return (Market Price) is determined using the Official Closing Price on the primary stock exchange (generally, 4:00 p.m. Eastern time) and may not represent the returns you would receive if shares were traded at other times. NAV is used as a proxy for purposes of calculating Market Price Return on inception date. Market Price and NAV returns assume that dividends and capital gain distributions have been reinvested in the fund at Market Price and NAV, respectively.
3
The net version of the index reflects reinvested dividends net of withholding taxes but reflects no deductions for expenses or other taxes.
4
Source for category information: Morningstar, Inc. The Morningstar Category return represents all passively- and actively-managed ETFs and mutual funds within the category as of the report date.
5
As stated in the prospectus.
Schwab Fundamental Index ETFs | Annual Report19
Schwab Fundamental International Small Company Index ETF
Performance and Fund Facts as of February 28, 2023 (continued)
| |
Weighted Average Market Cap (millions) | |
Price/Earnings Ratio (P/E) | |
| |
| |
Sector Weightings % of Investments1
Top Equity Holdings % of Net Assets3
Country Weightings % of Investments4
Portfolio holdings may have changed since the report date.
An index is a statistical composite of a specified financial market or sector. Unlike the fund, an index does not actually hold a portfolio of securities and its return is not inclusive of trading and management costs incurred by the fund.
Source of Sector Classification: S&P and MSCI.
2
Portfolio turnover rate excludes securities received or delivered from processing of in-kind creations or redemptions.
3
This list is not a recommendation of any security by the investment adviser.
4
The percentage may differ from the Portfolio Holdings because the above calculation is based on a percentage of total investments, excluding derivatives, whereas the calculation in the Portfolio Holdings is based on a percentage of net assets.
20Schwab Fundamental Index ETFs | Annual Report
Schwab Fundamental Emerging Markets Large Company Index ETF as of February 28, 2023
The Schwab Fundamental Emerging Markets Large Company Index ETF’s (the fund) goal is to track as closely as possible, before fees and expenses, the total return of the Russell RAFITM Emerging Markets Large Company Index (the index). The index measures the performance of the large company size segment by fundamental overall company scores, which are created using as the universe the emerging markets companies in the FTSE Global Total Cap Index. To pursue its investment objective, the fund invests in a representative sample of the securities included in the index which, when taken together, are expected to perform similarly to the index as a whole. Due to the use of sampling techniques, the fund may not hold all of the securities in the index. For more information concerning the fund’s investment objective, strategies, and risks, please see the fund’s prospectus.
Market Highlights. For the 12-month reporting period ended February 28, 2023, U.S. and international equity markets lost ground as inflation spiked, interest rates rose, and economic growth around the world slowed. The ongoing war between Russia and Ukraine and the continuing, albeit uneven, fallout from the COVID-19 pandemic weighed on economies and markets around the world. Among U.S. and international stocks, both large-cap stocks and small-cap stocks lost ground, and growth stocks underperformed value stocks. The U.S. dollar rose against a basket of foreign currencies through October 2022, but generally declined through the remainder of the reporting period, ending it slightly higher than it began.
Performance. For the 12-month reporting period ended February 28, 2023, the fund’s market price return was -10.66% and its NAV return was -8.72% (for an explanation of the market price and NAV returns, please refer to footnote 2 on the following page). The index returned -12.26%1 during the same period. Stocks from Russia were the largest contributors to the fund’s outperformance relative to the index. Russian securities were removed from the index in March 2022. Some of these securities were sold by the fund during the reporting period and some are illiquid and still held by the fund at fair value2 prices.
Contributors and Detractors. Stocks from Turkey contributed the most to the total return of the fund. Turkish stocks represented an average weight of approximately 2% of the fund’s investments and returned approximately 97% in U.S. dollar terms for the reporting period. One example from this market is Turk Hava Yollari AO, also known as Turkish Airlines, which provides passenger and cargo air transportation services. The fund’s holdings of Turk Hava Yollari AO represented an average weight of less than 1% of the fund’s investments and returned approximately 311% in U.S. dollar terms for the reporting period.
Stocks from Mexico also contributed to the total return of the fund, representing an average weight of approximately 4% of the fund’s investments and returning approximately 12% in U.S. dollar terms for the reporting period.
Stocks from China detracted the most from the total return of the fund. Chinese stocks represented an average weight of approximately 32% of the fund’s investments and returned approximately -9% in U.S. dollar terms for the reporting period. One example from this sector is China Construction Bank Corp., which provides banking services. The fund’s Class H holdings of China Construction Bank Corp. represented an average weight of approximately 4% of the fund’s investments and returned approximately -12% in U.S. dollar terms for the reporting period.
Stocks from Taiwan also detracted from the total return of the fund, representing an average weight of approximately 18% of the fund’s investments and returning approximately -10% in U.S. dollar terms for the reporting period.
Management views and portfolio holdings may have changed since the report date.
1
The net version of the index reflects reinvested dividends net of withholding taxes but reflects no deductions for expenses or other taxes.
2
Fair valued by management using significant unobservable inputs in accordance with procedures approved by the fund’s Board of Trustees (see financial note 2(a) for additional information).
Schwab Fundamental Index ETFs | Annual Report21
Schwab Fundamental Emerging Markets Large Company Index ETF
Performance and Fund Facts as of February 28, 2023
The performance data quoted represents past performance. Past performance does not guarantee future results. Investment returns and principal value of an investment will fluctuate so that an investor’s shares, when sold or redeemed, may be worth more or less than the original cost. Current performance may be lower or higher than the performance data quoted. To obtain performance information current to the most recent month end, please visit www.schwabassetmanagement.com/schwabetfs_prospectus.
Performance of Hypothetical $10,000 Investment (August 15, 2013 – February 28, 2023)1
Average Annual Total Returns1
| | | |
Fund: Schwab Fundamental Emerging Markets Large Company Index ETF (8/15/13) | | | |
| | | |
| | | |
Russell RAFITM Emerging Markets Large Company Index (Net)3 | | | |
MSCI Emerging Markets Index (Net)3 | | | |
ETF Category: Morningstar Diversified Emerging Markets4 | | | |
Fund Expense Ratio5: 0.39% |
All total returns on this page assume dividends and distributions were reinvested. Index figures do not include trading and management costs, which would lower performance. Indices are unmanaged and cannot be invested in directly. Performance results less than one year are not annualized.
The first index listed for the fund is the fund’s primary benchmark, as shown in the prospectus. Additional indices shown are provided for comparative purposes.
For index definitions, please see the Glossary.
Shares are bought and sold at market price, which may be higher or lower than the net asset value (NAV). Brokerage commissions will reduce returns.
International investing may involve risk of capital loss from unfavorable fluctuations in currency values, from differences in generally accepted accounting principles, or from economic or political instability in other nations.
Emerging markets involve heightened risks related to the same factors as international investing, as well as increased volatility and lower trading volume.
Index ownership — The Schwab Fundamental Emerging Markets Large Company Index ETF is not in any way sponsored, endorsed, sold or promoted by Frank Russell Company (Russell), by the London Stock Exchange Group companies (LSEG), or by Research Affiliates LLC (RA) (collectively the Licensor Parties), and none of the Licensor Parties make any warranty or representation whatsoever, expressly or impliedly, either as to the results to be obtained from the use of the Russell RAFI™ Emerging Markets Large Company Index (the Index) or otherwise. The Index is compiled and calculated by Russell in conjunction with RA. None of the Licensor Parties shall be liable (whether in negligence or otherwise) to any person for any error in the Index and none of the Licensor Parties shall be under any obligation to advise any person of any error therein. “Russell®” is a trademark of Russell. The trade names “Research Affiliates®”, “Fundamental Index®” and “RAFI®” are registered trademarks of RA. Charles Schwab Investment Management, Inc. has obtained full license from Russell to use the Index. For full disclaimer please see the fund’s statement of additional information.
*
Inception (8/15/13) represents the date that the shares began trading in the secondary market.
1
Performance does not reflect the deduction of taxes that a shareholder would pay on fund distributions or on the redemption or sale of fund shares.
2
ETF performance must be shown based on both a market price and NAV basis. The fund’s per share NAV is the value of one share of the fund. NAV is calculated by taking the fund’s total assets (including the fair value of securities owned), subtracting liabilities, and dividing by the number of shares outstanding. The NAV Return is based on the NAV of the fund, and the Market Price Return is based on the market price per share of the fund. The price used to calculate market return (Market Price) is determined using the Official Closing Price on the primary stock exchange (generally, 4:00 p.m. Eastern time) and may not represent the returns you would receive if shares were traded at other times. NAV is used as a proxy for purposes of calculating Market Price Return on inception date. Market Price and NAV returns assume that dividends and capital gain distributions have been reinvested in the fund at Market Price and NAV, respectively.
3
The net version of the index reflects reinvested dividends net of withholding taxes but reflects no deductions for expenses or other taxes.
4
Source for category information: Morningstar, Inc. The Morningstar Category return represents all passively- and actively-managed ETFs and mutual funds within the category as of the report date.
5
As stated in the prospectus.
22Schwab Fundamental Index ETFs | Annual Report
Schwab Fundamental Emerging Markets Large Company Index ETF
Performance and Fund Facts as of February 28, 2023 (continued)
| |
Weighted Average Market Cap (millions) | |
Price/Earnings Ratio (P/E) | |
| |
| |
Sector Weightings % of Investments1
Top Equity Holdings % of Net Assets3
Country Weightings % of Investments4
Portfolio holdings may have changed since the report date.
An index is a statistical composite of a specified financial market or sector. Unlike the fund, an index does not actually hold a portfolio of securities and its return is not inclusive of trading and management costs incurred by the fund.
Source of Sector Classification: S&P and MSCI.
2
Portfolio turnover rate excludes securities received or delivered from processing of in-kind creations or redemptions.
3
This list is not a recommendation of any security by the investment adviser.
4
The percentage may differ from the Portfolio Holdings because the above calculation is based on a percentage of total investments, excluding derivatives, whereas the calculation in the Portfolio Holdings is based on a percentage of net assets.
Schwab Fundamental Index ETFs | Annual Report23
Schwab Fundamental Index ETFs
Fund Expenses (Unaudited)
Examples for a $1,000 Investment
As a fund shareholder, you may incur two types of costs: (1) transaction costs, including brokerage commissions on purchases and sales of fund shares; and, (2) ongoing costs, including management fees.
The expense examples below are intended to help you understand your ongoing cost (in dollars) of investing in a fund and to compare this cost with the ongoing cost of investing in other mutual funds. These examples are based on an investment of $1,000 invested for six months beginning September 1, 2022 and held through February 28, 2023.
Actual Return lines in the table below provide information about actual account values and actual expenses. You may use this information, together with the amount you invested, to estimate the expenses that you paid over the period. To do so, simply divide your account value by $1,000 (for example, an $8,600 account value ÷ $1,000 = 8.6), then multiply the result by the number given for your fund under the heading entitled “Expenses Paid During Period.”
Hypothetical Return lines in the table below provide information about hypothetical account values and hypothetical expenses based on a fund’s actual expense ratio and an assumed return of 5% per year before expenses. Because the return used is not an actual return, it may not be used to estimate the actual ending account value or expenses you paid for the period.
You may use this information to compare the ongoing costs of investing in a fund and other funds. To do so, compare this 5% hypothetical example with the 5% hypothetical examples that appear in the shareholder reports of the other funds.
Please note that the expenses shown in the table are meant to highlight your ongoing costs only and do not reflect any transactional costs, including any brokerage commissions you may pay when purchasing or selling shares of a fund. Therefore, the hypothetical return lines of the table are useful in comparing ongoing costs only and will not help you determine the relative total costs of owning different funds. In addition, if these transactional costs were included, your costs would have been higher.
| | BEGINNING
ACCOUNT VALUE
AT 9/1/22 | ENDING
ACCOUNT VALUE
(NET OF EXPENSES)
AT 2/28/23 | EXPENSES PAID
DURING PERIOD
|
Schwab Fundamental U.S. Broad Market Index ETF | | | | |
| | | | |
| | | | |
Schwab Fundamental U.S. Large Company Index ETF | | | | |
| | | | |
| | | | |
Schwab Fundamental U.S. Small Company Index ETF | | | | |
| | | | |
| | | | |
Schwab Fundamental International Large Company Index ETF | | | | |
| | | | |
| | | | |
Schwab Fundamental International Small Company Index ETF | | | | |
| | | | |
| | | | |
Schwab Fundamental Emerging Markets Large Company Index ETF | | | | |
| | | | |
| | | | |
| Based on the most recent six-month expense ratio. |
| Expenses for each fund are equal to its annualized expense ratio, multiplied by the average account value over the period, multiplied by 181 days in the period, and divided by 365 days in the fiscal year. |
24Schwab Fundamental Index ETFs | Annual Report
Schwab Fundamental U.S. Broad Market Index ETF
Financial Statements
| | | | | | |
|
Net asset value at beginning of period | | | | | | |
Income (loss) from investment operations: | | | | | | |
Net investment income (loss)1 | | | | | | |
Net realized and unrealized gains (losses) | | | | | | |
Total from investment operations | | | | | | |
| | | | | | |
Distributions from net investment income | | | | | | |
Net asset value at end of period | | | | | | |
| | | | | | |
|
Ratios to average net assets: | | | | | | |
| | | | | | |
Net investment income (loss) | | | | | | |
| | | | | | |
Net assets, end of period (x 1,000) | | | | | | |
| Calculated based on the average shares outstanding during the period. |
| Ratio includes less than 0.005% of non-routine proxy expenses. |
| Portfolio turnover rate excludes securities received or delivered from processing of in-kind creations or redemptions. |
Schwab Fundamental Index ETFs | Annual Report25
Schwab Fundamental U.S. Broad Market Index ETF
Portfolio Holdings as of February 28, 2023
This section shows all the securities in the fund’s portfolio and their values as of the report date.
The fund files its complete schedule of portfolio holdings with the U.S. Securities and Exchange Commission (SEC) for the first and third quarters of each fiscal year on Form N-PORT Part F. The fund’s Form N-PORT Part F is available on the SEC’s website at www.sec.gov. You can also obtain this information at no cost on the fund’s website at www.schwabassetmanagement.com/schwabetfs_prospectus, by calling 1-866-414-6349, or by sending an email request to orders@mysummaryprospectus.com. The fund also makes available its complete schedule of portfolio holdings on a daily basis on the fund’s website.
| | |
COMMON STOCKS 99.7% OF NET ASSETS |
|
Automobiles & Components 1.6% |
| | |
American Axle & Manufacturing Holdings, Inc. * | | |
| | |
| | |
| | |
Cooper-Standard Holdings, Inc. * | | |
| | |
| | |
| | |
Fox Factory Holding Corp. * | | |
| | |
| | |
| | |
| | |
| | |
| | |
Modine Manufacturing Co. * | | |
| | |
Standard Motor Products, Inc. | | |
| | |
| | |
The Goodyear Tire & Rubber Co. * | | |
| | |
| | |
Winnebago Industries, Inc. | | |
| | |
|
|
| | |
| | |
| | |
Atlantic Union Bankshares Corp. | | |
| | |
| | |
| | |
| | |
| | |
| | |
| | |
| | |
| | |
Capitol Federal Financial, Inc. | | |
| | |
Central Pacific Financial Corp. | | |
| | |
Citizens Financial Group, Inc. | | |
| | |
Columbia Banking System, Inc. | | |
| | |
Commerce Bancshares, Inc. | | |
Community Bank System, Inc. | | |
| | |
| | |
Cullen/Frost Bankers, Inc. | | |
Customers Bancorp, Inc. * | | |
| | |
| | |
| | |
| | |
Enterprise Financial Services Corp. | | |
| | |
| | |
Federal Agricultural Mortgage Corp., Class C | | |
| | |
| | |
First Bancorp/Southern Pines NC | | |
| | |
First Citizens BancShares, Inc., Class A | | |
First Commonwealth Financial Corp. | | |
| | |
First Financial Bankshares, Inc. | | |
| | |
| | |
First Interstate BancSystem, Inc., Class A | | |
| | |
| | |
| | |
| | |
| | |
| | |
Heartland Financial USA, Inc. | | |
| | |
| | |
| | |
| | |
Huntington Bancshares, Inc. | | |
| | |
Independent Bank Group, Inc. | | |
International Bancshares Corp. | | |
| | |
| | |
| | |
| | |
| | |
| | |
| | |
National Bank Holdings Corp., Class A | | |
| | |
New York Community Bancorp, Inc. | | |
NMI Holdings, Inc., Class A * | | |
Northwest Bancshares, Inc. | | |
OceanFirst Financial Corp. | | |
| | |
| | |
Pacific Premier Bancorp, Inc. | | |
| | |
| | |
| | |
26Schwab Fundamental Index ETFs | Annual Report
Schwab Fundamental U.S. Broad Market Index ETF
Portfolio Holdings as of February 28, 2023 (continued)
| | |
PennyMac Financial Services, Inc. | | |
Pinnacle Financial Partners, Inc. | | |
| | |
Prosperity Bancshares, Inc. | | |
Provident Financial Services, Inc. | | |
| | |
| | |
| | |
| | |
Sandy Spring Bancorp, Inc. | | |
| | |
Simmons First National Corp., Class A | | |
Southside Bancshares, Inc. | | |
| | |
| | |
| | |
Texas Capital Bancshares, Inc. * | | |
The Bank of N.T. Butterfield & Son Ltd. | | |
The PNC Financial Services Group, Inc. | | |
| | |
| | |
| | |
| | |
| | |
| | |
| | |
| | |
| | |
United Community Banks, Inc. | | |
| | |
| | |
| | |
Washington Trust Bancorp, Inc. | | |
| | |
| | |
| | |
| | |
| | |
| | |
| | |
| | |
| | |
|
|
| | |
| | |
| | |
| | |
| | |
| | |
Advanced Drainage Systems, Inc. | | |
| | |
| | |
Aerojet Rocketdyne Holdings, Inc. * | | |
| | |
| | |
| | |
Albany International Corp., Class A | | |
| | |
Allison Transmission Holdings, Inc. | | |
Altra Industrial Motion Corp. | | |
American Woodmark Corp. * | | |
| | |
| | |
| | |
Applied Industrial Technologies, Inc. | | |
| | |
| | |
| | |
Armstrong World Industries, Inc. | | |
| | |
| | |
| | |
| | |
| | |
| | |
Beacon Roofing Supply, Inc. * | | |
| | |
| | |
| | |
| | |
| | |
| | |
Comfort Systems USA, Inc. | | |
Construction Partners, Inc., Class A * | | |
Core & Main, Inc., Class A * | | |
| | |
| | |
| | |
| | |
| | |
| | |
| | |
| | |
| | |
| | |
| | |
| | |
| | |
| | |
| | |
| | |
| | |
| | |
| | |
Evoqua Water Technologies Corp. * | | |
| | |
| | |
| | |
| | |
| | |
Fortune Brands Innovations, Inc. | | |
Franklin Electric Co., Inc. | | |
Gates Industrial Corp. plc * | | |
| | |
| | |
| | |
| | |
Gibraltar Industries, Inc. * | | |
| | |
| | |
GrafTech International Ltd. | | |
Granite Construction, Inc. | | |
Great Lakes Dredge & Dock Corp. * | | |
| | |
H&E Equipment Services, Inc. | | |
| | |
| | |
| | |
| | |
| | |
Honeywell International, Inc. | | |
| | |
| | |
Huntington Ingalls Industries, Inc. | | |
Hyster-Yale Materials Handling, Inc. | | |
Schwab Fundamental Index ETFs | Annual Report27
Schwab Fundamental U.S. Broad Market Index ETF
Portfolio Holdings as of February 28, 2023 (continued)
| | |
| | |
Illinois Tool Works, Inc. | | |
| | |
| | |
| | |
John Bean Technologies Corp. | | |
Johnson Controls International plc | | |
| | |
| | |
| | |
Kratos Defense & Security Solutions, Inc. * | | |
L3Harris Technologies, Inc. | | |
Lennox International, Inc. | | |
Lincoln Electric Holdings, Inc. | | |
| | |
| | |
| | |
Masonite International Corp. * | | |
| | |
| | |
| | |
| | |
MDU Resources Group, Inc. | | |
| | |
| | |
| | |
MSC Industrial Direct Co., Inc., Class A | | |
| | |
Mueller Water Products, Inc., Class A | | |
| | |
National Presto Industries, Inc. | | |
| | |
| | |
| | |
| | |
| | |
| | |
| | |
| | |
| | |
| | |
| | |
| | |
| | |
| | |
Quanex Building Products Corp. | | |
| | |
Raytheon Technologies Corp. | | |
| | |
| | |
Resideo Technologies, Inc. * | | |
| | |
Rockwell Automation, Inc. | | |
Rush Enterprises, Inc., Class A | | |
Sensata Technologies Holding plc | | |
Simpson Manufacturing Co., Inc. | | |
SiteOne Landscape Supply, Inc. * | | |
| | |
Spirit AeroSystems Holdings, Inc., Class A | | |
| | |
Standex International Corp. | | |
Stanley Black & Decker, Inc. | | |
Sterling Infrastructure, Inc. * | | |
| | |
| | |
Textainer Group Holdings Ltd. | | |
| | |
| | |
| | |
| | |
| | |
The Greenbrier Cos., Inc. | | |
The Manitowoc Co., Inc. * | | |
| | |
| | |
| | |
| | |
| | |
| | |
| | |
| | |
| | |
| | |
Triton International Ltd. | | |
| | |
| | |
| | |
| | |
| | |
| | |
| | |
| | |
| | |
| | |
| | |
Watts Water Technologies, Inc., Class A | | |
WESCO International, Inc. * | | |
Westinghouse Air Brake Technologies Corp. | | |
WillScot Mobile Mini Holdings Corp. * | | |
| | |
| | |
Zurn Elkay Water Solutions Corp. | | |
| | |
|
Commercial & Professional Services 1.1% |
| | |
| | |
| | |
Barrett Business Services, Inc. | | |
Booz Allen Hamilton Holding Corp. | | |
| | |
BrightView Holdings, Inc. * | | |
CACI International, Inc., Class A * | | |
Casella Waste Systems, Inc., Class A * | | |
| | |
| | |
| | |
| | |
| | |
| | |
| | |
| | |
| | |
Dun & Bradstreet Holdings, Inc. | | |
| | |
| | |
| | |
| | |
Healthcare Services Group, Inc. * | | |
Heidrick & Struggles International, Inc. | | |
| | |
Huron Consulting Group, Inc. * | | |
| | |
| | |
| | |
| | |
28Schwab Fundamental Index ETFs | Annual Report
Schwab Fundamental U.S. Broad Market Index ETF
Portfolio Holdings as of February 28, 2023 (continued)
| | |
| | |
KAR Auction Services, Inc. * | | |
| | |
Kelly Services, Inc., Class A | | |
| | |
Kimball International, Inc., Class B | | |
| | |
| | |
| | |
Matthews International Corp., Class A | | |
| | |
| | |
| | |
| | |
Resources Connection, Inc. | | |
Robert Half International, Inc. | | |
| | |
Science Applications International Corp. | | |
| | |
| | |
| | |
| | |
| | |
| | |
| | |
| | |
| | |
| | |
| | |
| | |
| | |
| | |
|
Consumer Durables & Apparel 1.7% |
| | |
| | |
| | |
| | |
| | |
| | |
Century Communities, Inc. | | |
| | |
| | |
| | |
| | |
Ethan Allen Interiors, Inc. | | |
| | |
G-III Apparel Group Ltd. * | | |
| | |
| | |
| | |
Installed Building Products, Inc. | | |
| | |
| | |
| | |
| | |
| | |
| | |
| | |
Lululemon Athletica, Inc. * | | |
| | |
| | |
Malibu Boats, Inc., Class A * | | |
| | |
| | |
Mohawk Industries, Inc. * | | |
| | |
| | |
| | |
| | |
| | |
| | |
| | |
| | |
| | |
| | |
Skechers U.S.A., Inc., Class A * | | |
| | |
Smith & Wesson Brands, Inc. | | |
| | |
| | |
| | |
| | |
Taylor Morrison Home Corp. * | | |
Tempur Sealy International, Inc. | | |
| | |
| | |
Topgolf Callaway Brands Corp. * | | |
| | |
Tupperware Brands Corp. * | | |
Under Armour, Inc., Class A * | | |
Under Armour, Inc., Class C * | | |
Universal Electronics, Inc. * | | |
| | |
| | |
| | |
| | |
Wolverine World Wide, Inc. | | |
| | |
| | |
|
|
| | |
Adtalem Global Education, Inc. * | | |
American Public Education, Inc. * | | |
| | |
Arcos Dorados Holdings, Inc., Class A | | |
| | |
| | |
| | |
| | |
| | |
Bright Horizons Family Solutions, Inc. * | | |
Brinker International, Inc. * | | |
Caesars Entertainment, Inc. * | | |
| | |
Chipotle Mexican Grill, Inc. * | | |
Choice Hotels International, Inc. | | |
| | |
Cracker Barrel Old Country Store, Inc. | | |
| | |
Dave & Buster's Entertainment, Inc. * | | |
| | |
| | |
| | |
| | |
| | |
| | |
Graham Holdings Co., Class B | | |
Grand Canyon Education, Inc. * | | |
| | |
Hilton Grand Vacations, Inc. * | | |
Hilton Worldwide Holdings, Inc. | | |
Hyatt Hotels Corp., Class A * | | |
International Game Technology plc | | |
Schwab Fundamental Index ETFs | Annual Report29
Schwab Fundamental U.S. Broad Market Index ETF
Portfolio Holdings as of February 28, 2023 (continued)
| | |
| | |
| | |
| | |
| | |
Marriott International, Inc., Class A | | |
Marriott Vacations Worldwide Corp. | | |
| | |
MGM Resorts International | | |
Norwegian Cruise Line Holdings Ltd. * | | |
Papa John's International, Inc. | | |
Penn Entertainment, Inc. * | | |
Perdoceo Education Corp. * | | |
Planet Fitness, Inc., Class A * | | |
Red Robin Gourmet Burgers, Inc. * | | |
Red Rock Resorts, Inc., Class A | | |
| | |
Royal Caribbean Cruises Ltd. * | | |
SeaWorld Entertainment, Inc. * | | |
Service Corp. International | | |
Six Flags Entertainment Corp. * | | |
| | |
Strategic Education, Inc. | | |
| | |
| | |
The Cheesecake Factory, Inc. | | |
| | |
| | |
| | |
| | |
| | |
Wyndham Hotels & Resorts, Inc. | | |
| | |
| | |
| | |
|
Diversified Financials 6.3% |
Affiliated Managers Group, Inc. | | |
| | |
| | |
A-Mark Precious Metals, Inc. | | |
| | |
Ameriprise Financial, Inc. | | |
Annaly Capital Management, Inc. | | |
Apollo Commercial Real Estate Finance, Inc. | | |
| | |
Ares Management Corp., Class A | | |
Artisan Partners Asset Management, Inc., Class A | | |
| | |
Berkshire Hathaway, Inc., Class B * | | |
BGC Partners, Inc., Class A | | |
| | |
Blackstone Mortgage Trust, Inc., Class A | | |
| | |
Bread Financial Holdings, Inc. | | |
Brightsphere Investment Group, Inc. | | |
BrightSpire Capital, Inc. | | |
Broadmark Realty Capital, Inc. | | |
| | |
Capital One Financial Corp. | | |
Cboe Global Markets, Inc. | | |
| | |
| | |
| | |
Compass Diversified Holdings | | |
| | |
| | |
Credit Acceptance Corp. * | | |
Discover Financial Services | | |
Donnelley Financial Solutions, Inc. * | | |
Encore Capital Group, Inc. * | | |
Enova International, Inc. * | | |
| | |
| | |
FactSet Research Systems, Inc. | | |
| | |
Focus Financial Partners, Inc., Class A * | | |
| | |
Green Dot Corp., Class A * | | |
| | |
Interactive Brokers Group, Inc., Class A | | |
Intercontinental Exchange, Inc. | | |
| | |
Janus Henderson Group plc | | |
Jefferies Financial Group, Inc. | | |
| | |
| | |
| | |
| | |
| | |
LPL Financial Holdings, Inc. | | |
MarketAxess Holdings, Inc. | | |
| | |
| | |
| | |
| | |
| | |
| | |
| | |
| | |
| | |
New York Mortgage Trust, Inc. | | |
| | |
| | |
PennyMac Mortgage Investment Trust | | |
| | |
| | |
| | |
Raymond James Financial, Inc. | | |
| | |
| | |
Regional Management Corp. | | |
| | |
| | |
| | |
| | |
Starwood Property Trust, Inc. | | |
| | |
| | |
| | |
T. Rowe Price Group, Inc. | | |
The Bank of New York Mellon Corp. | | |
| | |
The Charles Schwab Corp. (c) | | |
The Goldman Sachs Group, Inc. | | |
TPG RE Finance Trust, Inc. | | |
Tradeweb Markets, Inc., Class A | | |
Two Harbors Investment Corp. | | |
Virtu Financial, Inc., Class A | | |
Virtus Investment Partners, Inc. | | |
| | |
| | |
| | |
| | |
|
30Schwab Fundamental Index ETFs | Annual Report
Schwab Fundamental U.S. Broad Market Index ETF
Portfolio Holdings as of February 28, 2023 (continued)
| | |
|
| | |
| | |
| | |
| | |
| | |
| | |
| | |
| | |
| | |
| | |
| | |
| | |
| | |
| | |
| | |
| | |
| | |
| | |
| | |
| | |
| | |
| | |
| | |
| | |
| | |
| | |
Equitrans Midstream Corp. | | |
| | |
| | |
| | |
| | |
Helix Energy Solutions Group, Inc. * | | |
| | |
| | |
| | |
International Seaways, Inc. | | |
| | |
| | |
| | |
| | |
| | |
| | |
| | |
| | |
NexTier Oilfield Solutions, Inc. * | | |
Nordic American Tankers Ltd. | | |
| | |
Occidental Petroleum Corp. | | |
Oceaneering International, Inc. * | | |
Oil States International, Inc. * | | |
| | |
| | |
Par Pacific Holdings, Inc. * | | |
Patterson-UTI Energy, Inc. | | |
PBF Energy, Inc., Class A | | |
| | |
| | |
| | |
| | |
Pioneer Natural Resources Co. | | |
| | |
| | |
| | |
| | |
| | |
| | |
| | |
| | |
Southwestern Energy Co. * | | |
| | |
| | |
| | |
Teekay Tankers Ltd., Class A * | | |
| | |
| | |
| | |
US Silica Holdings, Inc. * | | |
| | |
| | |
| | |
Weatherford International plc * | | |
World Fuel Services Corp. | | |
| | |
|
Food & Staples Retailing 2.8% |
BJ's Wholesale Club Holdings, Inc. * | | |
Casey's General Stores, Inc. | | |
| | |
Grocery Outlet Holding Corp. * | | |
Ingles Markets, Inc., Class A | | |
Performance Food Group Co. * | | |
| | |
| | |
| | |
Sprouts Farmers Market, Inc. * | | |
| | |
| | |
The Chefs' Warehouse, Inc. * | | |
| | |
United Natural Foods, Inc. * | | |
| | |
Walgreens Boots Alliance, Inc. | | |
| | |
| | |
| | |
|
Food, Beverage & Tobacco 3.8% |
| | |
| | |
Archer-Daniels-Midland Co. | | |
| | |
Brown-Forman Corp., Class B | | |
| | |
| | |
| | |
| | |
Coca-Cola Consolidated, Inc. | | |
Coca-Cola Europacific Partners plc | | |
| | |
Constellation Brands, Inc., Class A | | |
Darling Ingredients, Inc. * | | |
| | |
| | |
Fresh Del Monte Produce, Inc. | | |
| | |
| | |
| | |
| | |
| | |
John B Sanfilippo & Son, Inc. | | |
| | |
| | |
Lamb Weston Holdings, Inc. | | |
Schwab Fundamental Index ETFs | Annual Report31
Schwab Fundamental U.S. Broad Market Index ETF
Portfolio Holdings as of February 28, 2023 (continued)
| | |
| | |
McCormick & Co., Inc. Non Voting Shares | | |
| | |
Molson Coors Beverage Co., Class B | | |
Mondelez International, Inc., Class A | | |
| | |
National Beverage Corp. * | | |
| | |
| | |
Philip Morris International, Inc. | | |
| | |
| | |
The Boston Beer Co., Inc., Class A * | | |
| | |
The Hain Celestial Group, Inc. * | | |
| | |
| | |
| | |
| | |
Tyson Foods, Inc., Class A | | |
| | |
| | |
| | |
|
Health Care Equipment & Services 5.9% |
| | |
Acadia Healthcare Co., Inc. * | | |
| | |
| | |
| | |
| | |
AMN Healthcare Services, Inc. * | | |
| | |
Baxter International, Inc. | | |
| | |
Boston Scientific Corp. * | | |
Brookdale Senior Living, Inc. * | | |
| | |
| | |
| | |
Community Health Systems, Inc. * | | |
| | |
Cross Country Healthcare, Inc. * | | |
| | |
| | |
| | |
| | |
Edwards Lifesciences Corp. * | | |
| | |
| | |
| | |
| | |
| | |
| | |
| | |
Globus Medical, Inc., Class A * | | |
| | |
| | |
| | |
| | |
| | |
| | |
| | |
IDEXX Laboratories, Inc. * | | |
| | |
Integra LifeSciences Holdings Corp. * | | |
Intuitive Surgical, Inc. * | | |
| | |
Laboratory Corp. of America Holdings | | |
| | |
| | |
| | |
| | |
Merit Medical Systems, Inc. * | | |
| | |
Molina Healthcare, Inc. * | | |
| | |
| | |
NextGen Healthcare, Inc. * | | |
| | |
OmniAb, Inc., Class A *(e) | | |
OmniAb, Inc., Class B *(e) | | |
| | |
| | |
Option Care Health, Inc. * | | |
| | |
| | |
| | |
Pediatrix Medical Group, Inc. * | | |
| | |
| | |
| | |
| | |
| | |
Select Medical Holdings Corp. | | |
| | |
| | |
| | |
| | |
| | |
| | |
| | |
| | |
| | |
Universal Health Services, Inc., Class B | | |
US Physical Therapy, Inc. | | |
| | |
Veeva Systems, Inc., Class A * | | |
| | |
Zimmer Biomet Holdings, Inc. | | |
| | |
| | |
|
Household & Personal Products 1.3% |
Central Garden & Pet Co., Class A * | | |
Church & Dwight Co., Inc. | | |
| | |
| | |
Edgewell Personal Care Co. | | |
| | |
Herbalife Nutrition Ltd. * | | |
| | |
| | |
| | |
Nu Skin Enterprises, Inc., Class A | | |
Reynolds Consumer Products, Inc. | | |
Spectrum Brands Holdings, Inc. | | |
| | |
The Estee Lauder Cos., Inc., Class A | | |
| | |
USANA Health Sciences, Inc. * | | |
| | |
| | |
|
32Schwab Fundamental Index ETFs | Annual Report
Schwab Fundamental U.S. Broad Market Index ETF
Portfolio Holdings as of February 28, 2023 (continued)
| | |
|
| | |
Ambac Financial Group, Inc. * | | |
American Equity Investment Life Holding Co. | | |
American Financial Group, Inc. | | |
American International Group, Inc. | | |
| | |
| | |
Arch Capital Group Ltd. * | | |
Argo Group International Holdings Ltd. | | |
Arthur J. Gallagher & Co. | | |
| | |
| | |
Axis Capital Holdings Ltd. | | |
Brighthouse Financial, Inc. * | | |
| | |
| | |
Cincinnati Financial Corp. | | |
| | |
CNO Financial Group, Inc. | | |
| | |
| | |
| | |
F&G Annuities & Life, Inc. | | |
Fidelity National Financial, Inc. | | |
First American Financial Corp. | | |
Genworth Financial, Inc., Class A * | | |
| | |
Horace Mann Educators Corp. | | |
James River Group Holdings Ltd. | | |
| | |
| | |
| | |
| | |
Marsh & McLennan Cos., Inc. | | |
| | |
| | |
| | |
Old Republic International Corp. | | |
| | |
Principal Financial Group, Inc. | | |
| | |
Prudential Financial, Inc. | | |
Reinsurance Group of America, Inc. | | |
RenaissanceRe Holdings Ltd. | | |
| | |
Safety Insurance Group, Inc. | | |
Selective Insurance Group, Inc. | | |
| | |
Stewart Information Services Corp. | | |
| | |
The Hanover Insurance Group, Inc. | | |
The Hartford Financial Services Group, Inc. | | |
| | |
| | |
| | |
Universal Insurance Holdings, Inc. | | |
| | |
| | |
White Mountains Insurance Group Ltd. | | |
| | |
| | |
|
| | |
|
| | |
Air Products and Chemicals, Inc. | | |
| | |
| | |
Alpha Metallurgical Resources, Inc. | | |
| | |
| | |
| | |
| | |
| | |
| | |
| | |
Axalta Coating Systems Ltd. * | | |
| | |
| | |
| | |
| | |
Carpenter Technology Corp. | | |
| | |
| | |
CF Industries Holdings, Inc. | | |
| | |
| | |
| | |
| | |
Compass Minerals International, Inc. | | |
| | |
| | |
| | |
| | |
| | |
| | |
| | |
| | |
| | |
| | |
| | |
| | |
| | |
Graphic Packaging Holding Co. | | |
| | |
| | |
| | |
| | |
| | |
| | |
| | |
International Flavors & Fragrances, Inc. | | |
| | |
| | |
| | |
| | |
| | |
| | |
LyondellBasell Industries N.V., Class A | | |
Martin Marietta Materials, Inc. | | |
| | |
| | |
Mercer International, Inc. | | |
Minerals Technologies, Inc. | | |
| | |
| | |
| | |
| | |
| | |
| | |
Schwab Fundamental Index ETFs | Annual Report33
Schwab Fundamental U.S. Broad Market Index ETF
Portfolio Holdings as of February 28, 2023 (continued)
| | |
| | |
Orion Engineered Carbons S.A. | | |
Packaging Corp. of America | | |
| | |
| | |
| | |
Rayonier Advanced Materials, Inc. * | | |
Reliance Steel & Aluminum Co. | | |
| | |
| | |
Schnitzer Steel Industries, Inc., Class A | | |
| | |
Sensient Technologies Corp. | | |
| | |
| | |
| | |
| | |
| | |
Summit Materials, Inc., Class A * | | |
| | |
| | |
| | |
| | |
The Scotts Miracle-Gro Co. | | |
| | |
| | |
| | |
| | |
Tronox Holdings plc, Class A | | |
United States Steel Corp. | | |
| | |
| | |
| | |
| | |
| | |
Worthington Industries, Inc. | | |
| | |
|
Media & Entertainment 5.0% |
Activision Blizzard, Inc. | | |
Alphabet, Inc., Class A * | | |
Alphabet, Inc., Class C * | | |
AMC Entertainment Holdings, Inc., Class A *(d) | | |
AMC Networks, Inc., Class A * | | |
| | |
| | |
| | |
| | |
Charter Communications, Inc., Class A * | | |
Cinemark Holdings, Inc. * | | |
Clear Channel Outdoor Holdings, Inc. * | | |
| | |
DISH Network Corp., Class A * | | |
| | |
| | |
| | |
| | |
| | |
| | |
iHeartMedia, Inc., Class A * | | |
John Wiley & Sons, Inc., Class A | | |
Liberty Media Corp. - Liberty Formula One, Class C * | | |
Liberty Media Corp. - Liberty SiriusXM, Class A * | | |
| | |
Liberty Media Corp. - Liberty SiriusXM, Class C * | | |
Lions Gate Entertainment Corp., Class A * | | |
Lions Gate Entertainment Corp., Class B * | | |
Live Nation Entertainment, Inc. * | | |
Madison Square Garden Entertainment Corp. * | | |
Madison Square Garden Sports Corp. | | |
| | |
Meta Platforms, Inc., Class A * | | |
| | |
| | |
| | |
Nexstar Media Group, Inc. | | |
| | |
Paramount Global, Class B | | |
Pinterest, Inc., Class A * | | |
| | |
| | |
| | |
Sinclair Broadcast Group, Inc., Class A | | |
Sirius XM Holdings, Inc. (d) | | |
Spotify Technology S.A. * | | |
Take-Two Interactive Software, Inc. * | | |
| | |
The E.W. Scripps Co., Class A * | | |
The Interpublic Group of Cos., Inc. | | |
| | |
The New York Times Co., Class A | | |
The Trade Desk, Inc., Class A * | | |
| | |
| | |
Warner Bros Discovery, Inc. * | | |
| | |
World Wrestling Entertainment, Inc., Class A | | |
| | |
| | |
| | |
|
Pharmaceuticals, Biotechnology & Life Sciences 5.8% |
| | |
Agilent Technologies, Inc. | | |
| | |
| | |
| | |
| | |
| | |
BioMarin Pharmaceutical, Inc. * | | |
Bio-Rad Laboratories, Inc., Class A * | | |
| | |
| | |
| | |
| | |
Charles River Laboratories International, Inc. * | | |
Corcept Therapeutics, Inc. * | | |
| | |
Eagle Pharmaceuticals, Inc. * | | |
Elanco Animal Health, Inc. * | | |
| | |
Emergent BioSolutions, Inc. * | | |
| | |
| | |
| | |
Horizon Therapeutics plc * | | |
| | |
34Schwab Fundamental Index ETFs | Annual Report
Schwab Fundamental U.S. Broad Market Index ETF
Portfolio Holdings as of February 28, 2023 (continued)
| | |
| | |
| | |
Ionis Pharmaceuticals, Inc. * | | |
| | |
Jazz Pharmaceuticals plc * | | |
| | |
Ligand Pharmaceuticals, Inc. * | | |
| | |
| | |
Mettler-Toledo International, Inc. * | | |
| | |
| | |
| | |
| | |
| | |
Prestige Consumer Healthcare, Inc. * | | |
Regeneron Pharmaceuticals, Inc. * | | |
Royalty Pharma plc, Class A | | |
| | |
Supernus Pharmaceuticals, Inc. * | | |
| | |
Thermo Fisher Scientific, Inc. | | |
United Therapeutics Corp. * | | |
Vertex Pharmaceuticals, Inc. * | | |
| | |
| | |
West Pharmaceutical Services, Inc. | | |
| | |
| | |
|
|
| | |
| | |
Alexander & Baldwin, Inc. | | |
Alexandria Real Estate Equities, Inc. | | |
American Assets Trust, Inc. | | |
American Homes 4 Rent, Class A | | |
| | |
Americold Realty Trust, Inc. | | |
Anywhere Real Estate, Inc. * | | |
Apartment Income REIT Corp. | | |
Apartment Investment & Management Co., Class A | | |
Apple Hospitality REIT, Inc. | | |
Ashford Hospitality Trust, Inc. * | | |
AvalonBay Communities, Inc. | | |
| | |
| | |
Brixmor Property Group, Inc. | | |
Broadstone Net Lease, Inc. | | |
| | |
| | |
CBRE Group, Inc., Class A * | | |
| | |
| | |
Corporate Office Properties Trust | | |
| | |
| | |
| | |
Cushman & Wakefield plc * | | |
DiamondRock Hospitality Co. | | |
Digital Realty Trust, Inc. | | |
DigitalBridge Group, Inc. | | |
Diversified Healthcare Trust | | |
| | |
Easterly Government Properties, Inc. | | |
EastGroup Properties, Inc. | | |
| | |
| | |
Empire State Realty Trust, Inc., Class A | | |
| | |
| | |
| | |
Equity LifeStyle Properties, Inc. | | |
| | |
Essential Properties Realty Trust, Inc. | | |
Essex Property Trust, Inc. | | |
Extra Space Storage, Inc. | | |
Federal Realty Investment Trust | | |
First Industrial Realty Trust, Inc. | | |
Four Corners Property Trust, Inc. | | |
Gaming & Leisure Properties, Inc. | | |
| | |
| | |
Healthcare Realty Trust, Inc. | | |
Healthpeak Properties, Inc. | | |
Hersha Hospitality Trust, Class A | | |
Highwoods Properties, Inc. | | |
Host Hotels & Resorts, Inc. | | |
Hudson Pacific Properties, Inc. | | |
Industrial Logistics Properties Trust | | |
| | |
| | |
| | |
| | |
Jones Lang LaSalle, Inc. * | | |
Kennedy-Wilson Holdings, Inc. | | |
| | |
| | |
| | |
Lamar Advertising Co., Class A | | |
| | |
| | |
| | |
| | |
Medical Properties Trust, Inc. | | |
Mid-America Apartment Communities, Inc. | | |
National Health Investors, Inc. | | |
National Retail Properties, Inc. | | |
National Storage Affiliates Trust | | |
Newmark Group, Inc., Class A | | |
Office Properties Income Trust | | |
Omega Healthcare Investors, Inc. | | |
| | |
| | |
Park Hotels & Resorts, Inc. | | |
| | |
| | |
Piedmont Office Realty Trust, Inc., Class A | | |
| | |
| | |
| | |
| | |
| | |
| | |
Retail Opportunity Investments Corp. | | |
Rexford Industrial Realty, Inc. | | |
| | |
| | |
Ryman Hospitality Properties, Inc. | | |
Sabra Health Care REIT, Inc. | | |
| | |
| | |
Simon Property Group, Inc. | | |
| | |
| | |
Schwab Fundamental Index ETFs | Annual Report35
Schwab Fundamental U.S. Broad Market Index ETF
Portfolio Holdings as of February 28, 2023 (continued)
| | |
Spirit Realty Capital, Inc. | | |
| | |
Summit Hotel Properties, Inc. | | |
| | |
Sunstone Hotel Investors, Inc. | | |
Tanger Factory Outlet Centers, Inc. | | |
| | |
The Howard Hughes Corp. * | | |
| | |
The Necessity Retail REIT, Inc. | | |
| | |
| | |
| | |
| | |
Veris Residential, Inc. * | | |
| | |
| | |
| | |
| | |
| | |
Xenia Hotels & Resorts, Inc. | | |
Zillow Group, Inc., Class C * | | |
| | |
|
|
1-800-Flowers.com, Inc., Class A * | | |
Abercrombie & Fitch Co., Class A * | | |
Academy Sports & Outdoors, Inc. | | |
| | |
| | |
American Eagle Outfitters, Inc. | | |
America's Car-Mart, Inc. * | | |
| | |
Asbury Automotive Group, Inc. * | | |
| | |
| | |
Barnes & Noble Education, Inc. * | | |
| | |
Bed Bath & Beyond, Inc. *(d) | | |
| | |
Big 5 Sporting Goods Corp. | | |
| | |
Boot Barn Holdings, Inc. * | | |
Burlington Stores, Inc. * | | |
| | |
Camping World Holdings, Inc., Class A | | |
| | |
| | |
| | |
| | |
Designer Brands, Inc., Class A | | |
Dick's Sporting Goods, Inc. | | |
| | |
| | |
| | |
| | |
| | |
| | |
| | |
Floor & Decor Holdings, Inc., Class A * | | |
| | |
GameStop Corp., Class A * | | |
| | |
| | |
| | |
| | |
| | |
| | |
Haverty Furniture Cos., Inc. | | |
| | |
| | |
| | |
| | |
| | |
| | |
| | |
| | |
| | |
| | |
National Vision Holdings, Inc. * | | |
| | |
Ollie's Bargain Outlet Holdings, Inc. * | | |
O'Reilly Automotive, Inc. * | | |
| | |
Penske Automotive Group, Inc. | | |
| | |
| | |
Qurate Retail, Inc., Class A * | | |
| | |
| | |
Sally Beauty Holdings, Inc. * | | |
| | |
| | |
| | |
Sonic Automotive, Inc., Class A | | |
Sportsman's Warehouse Holdings, Inc. * | | |
Stitch Fix, Inc., Class A * | | |
| | |
| | |
| | |
The Children's Place, Inc. * | | |
| | |
| | |
| | |
| | |
| | |
TravelCenters of America, Inc. * | | |
| | |
| | |
| | |
Victoria's Secret & Co. * | | |
| | |
| | |
| | |
| | |
|
Semiconductors & Semiconductor Equipment 3.5% |
Advanced Micro Devices, Inc. * | | |
| | |
| | |
| | |
| | |
Axcelis Technologies, Inc. * | | |
| | |
| | |
| | |
| | |
| | |
| | |
| | |
| | |
| | |
Kulicke & Soffa Industries, Inc. | | |
| | |
Lattice Semiconductor Corp. * | | |
36Schwab Fundamental Index ETFs | Annual Report
Schwab Fundamental U.S. Broad Market Index ETF
Portfolio Holdings as of February 28, 2023 (continued)
| | |
| | |
Microchip Technology, Inc. | | |
| | |
| | |
Monolithic Power Systems, Inc. | | |
| | |
| | |
| | |
| | |
| | |
| | |
| | |
| | |
| | |
Silicon Laboratories, Inc. * | | |
| | |
SMART Global Holdings, Inc. * | | |
SolarEdge Technologies, Inc. * | | |
| | |
| | |
| | |
Ultra Clean Holdings, Inc. * | | |
| | |
| | |
| | |
|
|
| | |
| | |
| | |
| | |
Akamai Technologies, Inc. * | | |
Alarm.com Holdings, Inc. * | | |
| | |
| | |
| | |
| | |
Automatic Data Processing, Inc. | | |
Bentley Systems, Inc., Class B | | |
| | |
| | |
| | |
Broadridge Financial Solutions, Inc. | | |
Cadence Design Systems, Inc. * | | |
| | |
Ceridian HCM Holding, Inc. * | | |
Check Point Software Technologies Ltd. * | | |
Cognizant Technology Solutions Corp., Class A | | |
CommVault Systems, Inc. * | | |
| | |
| | |
Consensus Cloud Solutions, Inc. * | | |
CSG Systems International, Inc. | | |
Dolby Laboratories, Inc., Class A | | |
| | |
| | |
| | |
| | |
| | |
Euronet Worldwide, Inc. * | | |
| | |
ExlService Holdings, Inc. * | | |
| | |
Fidelity National Information Services, Inc. | | |
| | |
FleetCor Technologies, Inc. * | | |
| | |
| | |
| | |
| | |
| | |
| | |
| | |
| | |
Guidewire Software, Inc. * | | |
| | |
International Business Machines Corp. | | |
| | |
Jack Henry & Associates, Inc. | | |
| | |
LiveRamp Holdings, Inc. * | | |
Manhattan Associates, Inc. * | | |
Mastercard, Inc., Class A | | |
| | |
| | |
MicroStrategy, Inc., Class A *(d) | | |
| | |
| | |
Pagseguro Digital Ltd., Class A * | | |
Palo Alto Networks, Inc. * | | |
| | |
| | |
| | |
| | |
| | |
| | |
| | |
| | |
| | |
RingCentral, Inc., Class A * | | |
| | |
| | |
| | |
| | |
| | |
SS&C Technologies Holdings, Inc. | | |
| | |
| | |
| | |
| | |
| | |
| | |
Tyler Technologies, Inc. * | | |
| | |
| | |
| | |
| | |
| | |
| | |
| | |
| | |
| | |
Zoom Video Communications, Inc., Class A * | | |
| | |
|
Technology Hardware & Equipment 6.5% |
| | |
Advanced Energy Industries, Inc. | | |
| | |
| | |
| | |
Arrow Electronics, Inc. * | | |
| | |
Schwab Fundamental Index ETFs | Annual Report37
Schwab Fundamental U.S. Broad Market Index ETF
Portfolio Holdings as of February 28, 2023 (continued)
| | |
| | |
| | |
Benchmark Electronics, Inc. | | |
| | |
| | |
| | |
| | |
| | |
CommScope Holding Co., Inc. * | | |
Comtech Telecommunications Corp. | | |
| | |
| | |
Dell Technologies, Inc., Class C | | |
| | |
| | |
| | |
| | |
Hewlett Packard Enterprise Co. | | |
| | |
Insight Enterprises, Inc. * | | |
| | |
| | |
| | |
| | |
Keysight Technologies, Inc. * | | |
Kimball Electronics, Inc. * | | |
| | |
| | |
Lumentum Holdings, Inc. * | | |
Methode Electronics, Inc. | | |
| | |
National Instruments Corp. | | |
| | |
| | |
| | |
| | |
| | |
| | |
| | |
Pure Storage, Inc., Class A * | | |
| | |
| | |
| | |
Seagate Technology Holdings plc | | |
| | |
Super Micro Computer, Inc. * | | |
| | |
| | |
Teledyne Technologies, Inc. * | | |
| | |
| | |
| | |
| | |
Vishay Intertechnology, Inc. | | |
| | |
| | |
| | |
Zebra Technologies Corp., Class A * | | |
| | |
|
Telecommunication Services 3.1% |
| | |
| | |
Cogent Communications Holdings, Inc. | | |
Consolidated Communications Holdings, Inc. * | | |
EchoStar Corp., Class A * | | |
| | |
Frontier Communications Parent, Inc. * | | |
Iridium Communications, Inc. * | | |
Liberty Global plc, Class A * | | |
Liberty Global plc, Class C * | | |
Liberty Latin America Ltd., Class A * | | |
Liberty Latin America Ltd., Class C * | | |
| | |
Shenandoah Telecommunications Co. | | |
Telephone and Data Systems, Inc. | | |
| | |
Verizon Communications, Inc. | | |
| | |
|
|
Air Transport Services Group, Inc. * | | |
| | |
| | |
American Airlines Group, Inc. * | | |
| | |
Atlas Air Worldwide Holdings, Inc. * | | |
| | |
Avis Budget Group, Inc. * | | |
C.H. Robinson Worldwide, Inc. | | |
| | |
Covenant Logistics Group, Inc. | | |
| | |
| | |
| | |
| | |
Expeditors International of Washington, Inc. | | |
| | |
| | |
| | |
| | |
Hawaiian Holdings, Inc. * | | |
| | |
Hub Group, Inc., Class A * | | |
J.B. Hunt Transport Services, Inc. | | |
| | |
| | |
Knight-Swift Transportation Holdings, Inc. | | |
| | |
| | |
| | |
| | |
| | |
Old Dominion Freight Line, Inc. | | |
| | |
| | |
| | |
Schneider National, Inc., Class B | | |
| | |
| | |
| | |
Uber Technologies, Inc. * | | |
| | |
U-Haul Holding Co., Non Voting Shares | | |
| | |
United Airlines Holdings, Inc. * | | |
United Parcel Service, Inc., Class B | | |
| | |
| | |
| | |
| | |
|
38Schwab Fundamental Index ETFs | Annual Report
Schwab Fundamental U.S. Broad Market Index ETF
Portfolio Holdings as of February 28, 2023 (continued)
| | |
|
| | |
| | |
| | |
American Electric Power Co., Inc. | | |
American States Water Co. | | |
American Water Works Co., Inc. | | |
Atlantica Sustainable Infrastructure plc | | |
| | |
| | |
| | |
| | |
California Water Service Group | | |
| | |
Chesapeake Utilities Corp. | | |
Clearway Energy, Inc., Class A | | |
Clearway Energy, Inc., Class C | | |
| | |
Consolidated Edison, Inc. | | |
| | |
| | |
| | |
| | |
| | |
Essential Utilities, Inc. | | |
| | |
| | |
| | |
| | |
Hawaiian Electric Industries, Inc. | | |
| | |
| | |
| | |
New Jersey Resources Corp. | | |
| | |
| | |
Northwest Natural Holding Co. | | |
| | |
| | |
| | |
| | |
| | |
| | |
| | |
Pinnacle West Capital Corp. | | |
| | |
Portland General Electric Co. | | |
| | |
Public Service Enterprise Group, Inc. | | |
| | |
| | |
Southwest Gas Holdings, Inc. | | |
| | |
| | |
| | |
| | |
| | |
| | |
| | |
| | |
| | |
Total Common Stocks
(Cost $402,160,439) | |
| | |
INVESTMENT COMPANIES 0.1% OF NET ASSETS |
|
|
iShares Core S&P Total U.S. Stock Market ETF | | |
Total Investment Companies
(Cost $293,538) | |
| | |
SHORT-TERM INVESTMENTS 0.1% OF NET ASSETS |
|
|
State Street Institutional U.S. Government Money Market Fund, Premier Class 4.43% (f) | | |
State Street Institutional U.S. Government Money Market Fund, Premier Class 4.43% (f)(g) | | |
| | |
Total Short-Term Investments
(Cost $406,189) | |
Total Investments in Securities
(Cost $402,860,166) | |
| | | CURRENT VALUE/
UNREALIZED
APPRECIATION
(DEPRECIATION)
($) |
|
| | | |
Russell 1000 Value Index, e-mini, expires 03/17/23 | | | |
S&P 500 Index, e-mini, expires 03/17/23 | | | |
Net Unrealized Depreciation | |
| Non-income producing security. |
| Subsequent to the period ended February 28, 2023, the issuer was placed into receivership with the Federal Deposit Insurance Corp. due to inadequate liquidity and insolvency on March 12, 2023. |
| Subsequent to the period ended February 28, 2023, the Silicon Valley Bank, N.A. was placed into receivership with the Federal Deposit Insurance Corp. due to inadequate liquidity and insolvency on March 10, 2023, and, subsequently on March 17, 2023, SVB Financial Group, the parent of Silicon Valley Bank, filed for bankruptcy. |
| Issuer is affiliated with the fund’s investment adviser. |
| All or a portion of this security is on loan. Securities on loan were valued at $128,163. |
| Fair valued using significant unobservable inputs (see financial note 2(a), Securities for which no quoted value is available, for additional information). |
| The rate shown is the annualized 7-day yield. |
| Security purchased with cash collateral received for securities on loan. |
| |
| Real Estate Investment Trust |
Schwab Fundamental Index ETFs | Annual Report39
Schwab Fundamental U.S. Broad Market Index ETF
Portfolio Holdings as of February 28, 2023 (continued)
Below is a summary of the fund’s transactions with affiliated issuers during the period ended February 28, 2023:
| | | | | NET CHANGE IN UNREALIZED APPRECIATION (DEPRECIATION) | | BALANCE OF SHARES HELD AT 2/28/23 | |
COMMON STOCKS 0.1% OF NET ASSETS |
|
Diversified Financials 0.1% |
| | | | | | | | |
The following is a summary of the inputs used to value the fund’s investments as of February 28, 2023 (see financial note 2(a) for additional information):
| QUOTED PRICES IN
ACTIVE MARKETS FOR
IDENTICAL ASSETS
(LEVEL 1) | OTHER SIGNIFICANT
OBSERVABLE INPUTS
(LEVEL 2) | SIGNIFICANT
UNOBSERVABLE INPUTS
(LEVEL 3) | |
| | | | |
| | | | |
Health Care Equipment & Services | | | | |
| | | | |
| | | | |
| | | | |
| | | | |
| | | | |
| | | | |
| Level 3 amount shown includes securities determined to have no value at February 28, 2023. |
| As categorized in the Portfolio Holdings. |
| Futures contracts are reported at cumulative unrealized appreciation or depreciation. |
Fund investments in mutual funds and ETFs are classified as Level 1, without consideration to the classification level of the
underlying securities held by the mutual funds and ETFs, which could be Level 1, Level 2 or Level 3.
40Schwab Fundamental Index ETFs | Annual Report
Schwab Fundamental U.S. Broad Market Index ETF
Statement of Assets and Liabilities
As of February 28, 2023
|
Investments in securities, at value - affiliated (cost $290,511) | | |
Investments in securities, at value - unaffiliated (cost $402,569,655) including securities on loan of $128,163 | | |
Deposit with broker for futures contracts | | |
| | |
| | |
| | |
Income from securities on loan | | |
| | |
|
|
Collateral held for securities on loan | | |
| | |
| | |
| | |
Variation margin on futures contracts | | |
| | |
| | |
|
|
Capital received from investors | | |
Total distributable earnings | | |
| | |
Schwab Fundamental Index ETFs | Annual Report41
Schwab Fundamental U.S. Broad Market Index ETF
Statement of Operations
For the period March 1, 2022 through February 28, 2023 |
|
Dividends received from securities - unaffiliated (net of foreign withholding tax of $1,738) | | |
Dividends received from securities - affiliated | | |
| | |
| | |
|
|
| | |
| | |
| | |
| | |
|
REALIZED AND UNREALIZED GAINS (LOSSES) |
Net realized losses on sales of securities - affiliated | | |
Net realized losses on sales of securities - unaffiliated | | |
Net realized gains on sales of in-kind redemptions - affiliated | | |
Net realized gains on sales of in-kind redemptions - unaffiliated | | |
Net realized losses on futures contracts | | |
| | |
Net change in unrealized appreciation (depreciation) on securities - affiliated | | |
Net change in unrealized appreciation (depreciation) on securities - unaffiliated | | |
Net change in unrealized appreciation (depreciation) on futures contracts | | |
Net change in unrealized appreciation (depreciation) | | |
Net realized and unrealized losses | | |
Decrease in net assets resulting from operations | | |
| Proxy fees are non-routine expenses (see financial note 2(e) for additional information). |
42Schwab Fundamental Index ETFs | Annual Report
Schwab Fundamental U.S. Broad Market Index ETF
Statement of Changes in Net Assets
For the current and prior report periods
|
| | |
| | | |
| | | |
Net change in unrealized appreciation (depreciation) | | | |
Increase (decrease) in net assets resulting from operations | | | |
|
DISTRIBUTIONS TO SHAREHOLDERS |
| | | |
TRANSACTIONS IN FUND SHARES |
| | |
| | | | | |
| | | | | |
| | | | | |
Net transactions in fund shares | | | | | |
|
SHARES OUTSTANDING AND NET ASSETS |
| | |
| | | | | |
| | | | | |
| | | | | |
| | | | | |
Schwab Fundamental Index ETFs | Annual Report43
Schwab Fundamental U.S. Large Company Index ETF
Financial Statements
| | | | | | |
|
Net asset value at beginning of period | | | | | | |
Income (loss) from investment operations: | | | | | | |
Net investment income (loss)1 | | | | | | |
Net realized and unrealized gains (losses) | | | | | | |
Total from investment operations | | | | | | |
| | | | | | |
Distributions from net investment income | | | | | | |
Net asset value at end of period | | | | | | |
| | | | | | |
|
Ratios to average net assets: | | | | | | |
| | | | | | |
Net investment income (loss) | | | | | | |
| | | | | | |
Net assets, end of period (x 1,000,000) | | | | | | |
| Calculated based on the average shares outstanding during the period. |
| Ratio includes less than 0.005% of non-routine proxy expenses. |
| Portfolio turnover rate excludes securities received or delivered from processing of in-kind creations or redemptions. |
44Schwab Fundamental Index ETFs | Annual Report
Schwab Fundamental U.S. Large Company Index ETF
Portfolio Holdings as of February 28, 2023
This section shows all the securities in the fund’s portfolio and their values as of the report date.
The fund files its complete schedule of portfolio holdings with the U.S. Securities and Exchange Commission (SEC) for the first and third quarters of each fiscal year on Form N-PORT Part F. The fund’s Form N-PORT Part F is available on the SEC’s website at www.sec.gov. You can also obtain this information at no cost on the fund’s website at www.schwabassetmanagement.com/schwabetfs_prospectus, by calling 1-866-414-6349, or by sending an email request to orders@mysummaryprospectus.com. The fund also makes available its complete schedule of portfolio holdings on a daily basis on the fund’s website.
| | |
COMMON STOCKS 99.8% OF NET ASSETS |
|
Automobiles & Components 1.6% |
| | |
| | |
| | |
| | |
| | |
| | |
| | |
| | |
| | |
| | |
| | |
The Goodyear Tire & Rubber Co. * | | |
| | |
| | |
| | |
|
|
| | |
| | |
Citizens Financial Group, Inc. | | |
| | |
| | |
| | |
| | |
| | |
| | |
Huntington Bancshares, Inc. | | |
| | |
| | |
| | |
| | |
New York Community Bancorp, Inc. | | |
| | |
| | |
| | |
| | |
| | |
| | |
The PNC Financial Services Group, Inc. | | |
| | |
| | |
| | |
| | |
| | |
|
|
| | |
| | |
| | |
| | |
| | |
| | |
| | |
| | |
| | |
Allison Transmission Holdings, Inc. | | |
| | |
| | |
| | |
| | |
| | |
| | |
| | |
| | |
| | |
| | |
| | |
| | |
| | |
| | |
| | |
| | |
| | |
Fortune Brands Innovations, Inc. | | |
| | |
| | |
| | |
| | |
| | |
Honeywell International, Inc. | | |
| | |
| | |
Huntington Ingalls Industries, Inc. | | |
| | |
Illinois Tool Works, Inc. | | |
| | |
| | |
Johnson Controls International plc | | |
L3Harris Technologies, Inc. | | |
Lennox International, Inc. | | |
Lincoln Electric Holdings, Inc. | | |
| | |
| | |
| | |
| | |
MDU Resources Group, Inc. | | |
MSC Industrial Direct Co., Inc., Class A | | |
| | |
| | |
| | |
| | |
| | |
| | |
| | |
| | |
| | |
| | |
Raytheon Technologies Corp. | | |
| | |
Schwab Fundamental Index ETFs | Annual Report45
Schwab Fundamental U.S. Large Company Index ETF
Portfolio Holdings as of February 28, 2023 (continued)
| | |
Rockwell Automation, Inc. | | |
Sensata Technologies Holding plc | | |
| | |
Spirit AeroSystems Holdings, Inc., Class A | | |
Stanley Black & Decker, Inc. | | |
| | |
| | |
| | |
| | |
| | |
| | |
| | |
| | |
| | |
| | |
| | |
| | |
WESCO International, Inc. * | | |
Westinghouse Air Brake Technologies Corp. | | |
| | |
| | |
|
Commercial & Professional Services 0.8% |
| | |
Booz Allen Hamilton Holding Corp. | | |
CACI International, Inc., Class A * | | |
| | |
| | |
| | |
| | |
| | |
| | |
| | |
| | |
| | |
Robert Half International, Inc. | | |
Science Applications International Corp. | | |
| | |
| | |
| | |
| | |
|
Consumer Durables & Apparel 1.5% |
| | |
| | |
| | |
| | |
| | |
| | |
| | |
| | |
| | |
| | |
Lululemon Athletica, Inc. * | | |
| | |
Mohawk Industries, Inc. * | | |
| | |
| | |
| | |
| | |
| | |
| | |
| | |
| | |
Skechers U.S.A., Inc., Class A * | | |
| | |
Taylor Morrison Home Corp. * | | |
| | |
| | |
| | |
| | |
| | |
|
|
| | |
| | |
| | |
Chipotle Mexican Grill, Inc. * | | |
| | |
| | |
| | |
| | |
Hilton Worldwide Holdings, Inc. | | |
| | |
Marriott International, Inc., Class A | | |
| | |
MGM Resorts International | | |
Norwegian Cruise Line Holdings Ltd. * | | |
Royal Caribbean Cruises Ltd. * | | |
Service Corp. International | | |
| | |
| | |
| | |
| | |
| | |
| | |
|
Diversified Financials 6.5% |
Affiliated Managers Group, Inc. | | |
| | |
| | |
| | |
Ameriprise Financial, Inc. | | |
Annaly Capital Management, Inc. | | |
Berkshire Hathaway, Inc., Class B * | | |
| | |
| | |
Bread Financial Holdings, Inc. | | |
Capital One Financial Corp. | | |
Cboe Global Markets, Inc. | | |
| | |
| | |
Discover Financial Services | | |
| | |
| | |
| | |
Intercontinental Exchange, Inc. | | |
| | |
Janus Henderson Group plc | | |
Jefferies Financial Group, Inc. | | |
| | |
| | |
LPL Financial Holdings, Inc. | | |
| | |
| | |
| | |
| | |
| | |
| | |
| | |
46Schwab Fundamental Index ETFs | Annual Report
Schwab Fundamental U.S. Large Company Index ETF
Portfolio Holdings as of February 28, 2023 (continued)
| | |
| | |
Raymond James Financial, Inc. | | |
| | |
| | |
| | |
| | |
Starwood Property Trust, Inc. | | |
| | |
| | |
T. Rowe Price Group, Inc. | | |
The Bank of New York Mellon Corp. | | |
The Charles Schwab Corp. (c) | | |
The Goldman Sachs Group, Inc. | | |
| | |
| | |
|
|
| | |
| | |
| | |
| | |
| | |
| | |
| | |
| | |
| | |
Equitrans Midstream Corp. | | |
| | |
| | |
| | |
| | |
| | |
| | |
| | |
| | |
| | |
| | |
Occidental Petroleum Corp. | | |
| | |
| | |
PBF Energy, Inc., Class A | | |
| | |
| | |
Pioneer Natural Resources Co. | | |
| | |
| | |
| | |
| | |
| | |
| | |
World Fuel Services Corp. | | |
| | |
|
Food & Staples Retailing 3.0% |
Casey's General Stores, Inc. | | |
| | |
Performance Food Group Co. * | | |
| | |
| | |
Sprouts Farmers Market, Inc. * | | |
| | |
| | |
United Natural Foods, Inc. * | | |
| | |
Walgreens Boots Alliance, Inc. | | |
| | |
| | |
| | |
|
Food, Beverage & Tobacco 3.9% |
| | |
Archer-Daniels-Midland Co. | | |
| | |
| | |
Coca-Cola Europacific Partners plc | | |
| | |
Constellation Brands, Inc., Class A | | |
Darling Ingredients, Inc. * | | |
| | |
| | |
| | |
| | |
| | |
| | |
Lamb Weston Holdings, Inc. | | |
McCormick & Co., Inc. Non Voting Shares | | |
Molson Coors Beverage Co., Class B | | |
Mondelez International, Inc., Class A | | |
| | |
| | |
Philip Morris International, Inc. | | |
| | |
| | |
| | |
| | |
| | |
Tyson Foods, Inc., Class A | | |
| | |
|
Health Care Equipment & Services 6.1% |
| | |
| | |
| | |
Baxter International, Inc. | | |
| | |
Boston Scientific Corp. * | | |
| | |
| | |
| | |
| | |
| | |
Edwards Lifesciences Corp. * | | |
| | |
| | |
| | |
| | |
| | |
| | |
| | |
| | |
| | |
| | |
IDEXX Laboratories, Inc. * | | |
Intuitive Surgical, Inc. * | | |
Laboratory Corp. of America Holdings | | |
| | |
| | |
Molina Healthcare, Inc. * | | |
| | |
| | |
| | |
Schwab Fundamental Index ETFs | Annual Report47
Schwab Fundamental U.S. Large Company Index ETF
Portfolio Holdings as of February 28, 2023 (continued)
| | |
| | |
| | |
| | |
| | |
| | |
| | |
| | |
Universal Health Services, Inc., Class B | | |
Zimmer Biomet Holdings, Inc. | | |
| | |
| | |
|
Household & Personal Products 1.3% |
Church & Dwight Co., Inc. | | |
| | |
| | |
Nu Skin Enterprises, Inc., Class A | | |
Spectrum Brands Holdings, Inc. | | |
| | |
The Estee Lauder Cos., Inc., Class A | | |
| | |
| | |
|
|
| | |
American Financial Group, Inc. | | |
American International Group, Inc. | | |
| | |
Arch Capital Group Ltd. * | | |
Arthur J. Gallagher & Co. | | |
| | |
| | |
| | |
| | |
Cincinnati Financial Corp. | | |
CNO Financial Group, Inc. | | |
| | |
F&G Annuities & Life, Inc. | | |
Fidelity National Financial, Inc. | | |
First American Financial Corp. | | |
Genworth Financial, Inc., Class A * | | |
| | |
| | |
| | |
| | |
| | |
Marsh & McLennan Cos., Inc. | | |
| | |
Old Republic International Corp. | | |
| | |
Principal Financial Group, Inc. | | |
Prudential Financial, Inc. | | |
Reinsurance Group of America, Inc. | | |
RenaissanceRe Holdings Ltd. | | |
| | |
The Hanover Insurance Group, Inc. | | |
The Hartford Financial Services Group, Inc. | | |
| | |
| | |
| | |
| | |
| | |
| | |
|
| | |
|
Air Products and Chemicals, Inc. | | |
| | |
| | |
| | |
| | |
| | |
Axalta Coating Systems Ltd. * | | |
| | |
| | |
| | |
CF Industries Holdings, Inc. | | |
| | |
| | |
| | |
| | |
| | |
| | |
| | |
| | |
| | |
Graphic Packaging Holding Co. | | |
| | |
International Flavors & Fragrances, Inc. | | |
| | |
| | |
| | |
LyondellBasell Industries N.V., Class A | | |
Martin Marietta Materials, Inc. | | |
| | |
| | |
| | |
| | |
Packaging Corp. of America | | |
| | |
Reliance Steel & Aluminum Co. | | |
| | |
| | |
| | |
| | |
| | |
| | |
| | |
| | |
United States Steel Corp. | | |
| | |
| | |
| | |
| | |
|
Media & Entertainment 5.2% |
Activision Blizzard, Inc. | | |
Alphabet, Inc., Class A * | | |
Alphabet, Inc., Class C * | | |
Charter Communications, Inc., Class A * | | |
| | |
DISH Network Corp., Class A * | | |
| | |
| | |
| | |
Liberty Media Corp. - Liberty SiriusXM, Class A * | | |
Liberty Media Corp. - Liberty SiriusXM, Class C * | | |
Meta Platforms, Inc., Class A * | | |
| | |
48Schwab Fundamental Index ETFs | Annual Report
Schwab Fundamental U.S. Large Company Index ETF
Portfolio Holdings as of February 28, 2023 (continued)
| | |
| | |
| | |
Nexstar Media Group, Inc. | | |
| | |
Paramount Global, Class B | | |
Take-Two Interactive Software, Inc. * | | |
| | |
The Interpublic Group of Cos., Inc. | | |
| | |
Warner Bros Discovery, Inc. * | | |
| | |
|
Pharmaceuticals, Biotechnology & Life Sciences 6.0% |
| | |
Agilent Technologies, Inc. | | |
| | |
| | |
| | |
| | |
| | |
| | |
| | |
| | |
| | |
Jazz Pharmaceuticals plc * | | |
| | |
| | |
Mettler-Toledo International, Inc. * | | |
| | |
| | |
| | |
Regeneron Pharmaceuticals, Inc. * | | |
Thermo Fisher Scientific, Inc. | | |
United Therapeutics Corp. * | | |
Vertex Pharmaceuticals, Inc. * | | |
| | |
| | |
| | |
| | |
|
|
Alexandria Real Estate Equities, Inc. | | |
| | |
Anywhere Real Estate, Inc. * | | |
AvalonBay Communities, Inc. | | |
| | |
Brixmor Property Group, Inc. | | |
| | |
CBRE Group, Inc., Class A * | | |
| | |
Digital Realty Trust, Inc. | | |
DigitalBridge Group, Inc. | | |
Diversified Healthcare Trust | | |
| | |
| | |
Essex Property Trust, Inc. | | |
Extra Space Storage, Inc. | | |
Federal Realty Investment Trust | | |
Gaming & Leisure Properties, Inc. | | |
Healthpeak Properties, Inc. | | |
Host Hotels & Resorts, Inc. | | |
| | |
| | |
Jones Lang LaSalle, Inc. * | | |
| | |
Lamar Advertising Co., Class A | | |
| | |
Medical Properties Trust, Inc. | | |
Mid-America Apartment Communities, Inc. | | |
Omega Healthcare Investors, Inc. | | |
Park Hotels & Resorts, Inc. | | |
| | |
| | |
| | |
| | |
| | |
| | |
Simon Property Group, Inc. | | |
SL Green Realty Corp. (d) | | |
| | |
| | |
| | |
| | |
| | |
| | |
| | |
| | |
| | |
| | |
|
|
| | |
| | |
American Eagle Outfitters, Inc. | | |
Asbury Automotive Group, Inc. * | | |
| | |
| | |
| | |
Bed Bath & Beyond, Inc. *(d) | | |
| | |
| | |
Burlington Stores, Inc. * | | |
| | |
Dick's Sporting Goods, Inc. | | |
| | |
| | |
| | |
| | |
| | |
| | |
| | |
| | |
| | |
| | |
| | |
| | |
| | |
O'Reilly Automotive, Inc. * | | |
Penske Automotive Group, Inc. | | |
| | |
Qurate Retail, Inc., Class A * | | |
| | |
| | |
| | |
| | |
| | |
| | |
| | |
| | |
| | |
| | |
|
Schwab Fundamental Index ETFs | Annual Report49
Schwab Fundamental U.S. Large Company Index ETF
Portfolio Holdings as of February 28, 2023 (continued)
| | |
Semiconductors & Semiconductor Equipment 3.6% |
Advanced Micro Devices, Inc. * | | |
| | |
| | |
| | |
| | |
| | |
| | |
| | |
Microchip Technology, Inc. | | |
| | |
| | |
| | |
| | |
| | |
| | |
| | |
| | |
| | |
| | |
| | |
|
|
| | |
| | |
Akamai Technologies, Inc. * | | |
| | |
| | |
| | |
Automatic Data Processing, Inc. | | |
Broadridge Financial Solutions, Inc. | | |
Cadence Design Systems, Inc. * | | |
Check Point Software Technologies Ltd. * | | |
Cognizant Technology Solutions Corp., Class A | | |
| | |
Fidelity National Information Services, Inc. | | |
| | |
FleetCor Technologies, Inc. * | | |
| | |
| | |
| | |
International Business Machines Corp. | | |
| | |
Jack Henry & Associates, Inc. | | |
| | |
Mastercard, Inc., Class A | | |
| | |
| | |
| | |
| | |
Palo Alto Networks, Inc. * | | |
| | |
| | |
| | |
| | |
SS&C Technologies Holdings, Inc. | | |
| | |
| | |
| | |
| | |
| | |
| | |
|
| | |
Technology Hardware & Equipment 6.7% |
| | |
| | |
Arrow Electronics, Inc. * | | |
| | |
| | |
| | |
| | |
| | |
Dell Technologies, Inc., Class C | | |
| | |
| | |
Hewlett Packard Enterprise Co. | | |
| | |
Insight Enterprises, Inc. * | | |
| | |
| | |
Keysight Technologies, Inc. * | | |
| | |
| | |
| | |
Seagate Technology Holdings plc | | |
| | |
Teledyne Technologies, Inc. * | | |
| | |
Vishay Intertechnology, Inc. | | |
| | |
| | |
Zebra Technologies Corp., Class A * | | |
| | |
|
Telecommunication Services 3.4% |
| | |
Liberty Global plc, Class A * | | |
Liberty Global plc, Class C * | | |
Liberty Latin America Ltd., Class A * | | |
Liberty Latin America Ltd., Class C * | | |
| | |
Telephone and Data Systems, Inc. | | |
| | |
Verizon Communications, Inc. | | |
| | |
|
|
American Airlines Group, Inc. * | | |
Avis Budget Group, Inc. * | | |
C.H. Robinson Worldwide, Inc. | | |
| | |
| | |
Expeditors International of Washington, Inc. | | |
| | |
| | |
J.B. Hunt Transport Services, Inc. | | |
Knight-Swift Transportation Holdings, Inc. | | |
| | |
| | |
Old Dominion Freight Line, Inc. | | |
| | |
| | |
| | |
Uber Technologies, Inc. * | | |
| | |
United Airlines Holdings, Inc. * | | |
50Schwab Fundamental Index ETFs | Annual Report
Schwab Fundamental U.S. Large Company Index ETF
Portfolio Holdings as of February 28, 2023 (continued)
| | |
United Parcel Service, Inc., Class B | | |
| | |
| | |
| | |
|
|
| | |
| | |
American Electric Power Co., Inc. | | |
American Water Works Co., Inc. | | |
| | |
| | |
| | |
| | |
Consolidated Edison, Inc. | | |
| | |
| | |
| | |
| | |
| | |
| | |
| | |
| | |
| | |
| | |
| | |
| | |
| | |
| | |
Pinnacle West Capital Corp. | | |
Portland General Electric Co. | | |
| | |
Public Service Enterprise Group, Inc. | | |
| | |
Southwest Gas Holdings, Inc. | | |
| | |
| | |
| | |
| | |
| | |
| | |
| | |
Total Common Stocks
(Cost $9,676,052,324) | |
| | |
SHORT-TERM INVESTMENTS 0.1% OF NET ASSETS |
|
|
State Street Institutional U.S. Government Money Market Fund, Premier Class 4.43% (e) | | |
State Street Institutional U.S. Government Money Market Fund, Premier Class 4.43% (e)(f) | | |
| | |
Total Short-Term Investments
(Cost $13,267,302) | |
Total Investments in Securities
(Cost $9,689,319,626) | |
| | | CURRENT VALUE/
UNREALIZED
DEPRECIATION
($) |
|
| | | |
S&P 500 Index, e-mini, expires 03/17/23 | | | |
| Non-income producing security. |
| Subsequent to the period ended February 28, 2023, the issuer was placed into receivership with the Federal Deposit Insurance Corp. due to inadequate liquidity and insolvency on March 12, 2023. |
| Subsequent to the period ended February 28, 2023, the Silicon Valley Bank, N.A. was placed into receivership with the Federal Deposit Insurance Corp. due to inadequate liquidity and insolvency on March 10, 2023, and, subsequently on March 17, 2023, SVB Financial Group, the parent of Silicon Valley Bank, filed for bankruptcy. |
| Issuer is affiliated with the fund’s investment adviser. |
| All or a portion of this security is on loan. Securities on loan were valued at $2,040,735. |
| The rate shown is the annualized 7-day yield. |
| Security purchased with cash collateral received for securities on loan. |
Below is a summary of the fund’s transactions with affiliated issuers during the period ended February 28, 2023:
| | | | | NET CHANGE IN UNREALIZED APPRECIATION (DEPRECIATION) | | BALANCE OF SHARES HELD AT 2/28/23 | |
COMMON STOCKS 0.1% OF NET ASSETS |
|
Diversified Financials 0.1% |
| | | | | | | | |
Schwab Fundamental Index ETFs | Annual Report51
Schwab Fundamental U.S. Large Company Index ETF
Portfolio Holdings as of February 28, 2023 (continued)
The following is a summary of the inputs used to value the fund’s investments as of February 28, 2023 (see financial note 2(a) for additional information):
| QUOTED PRICES IN
ACTIVE MARKETS FOR
IDENTICAL ASSETS
(LEVEL 1) | OTHER SIGNIFICANT
OBSERVABLE INPUTS
(LEVEL 2) | SIGNIFICANT
UNOBSERVABLE INPUTS
(LEVEL 3) | |
| | | | |
| | | | |
| | | | |
| | | | |
| | | | |
| | | | |
| As categorized in the Portfolio Holdings. |
| Futures contracts are reported at cumulative unrealized appreciation or depreciation. |
Fund investments in mutual funds are classified as Level 1, without consideration to the classification level of the underlying
securities held by the mutual funds, which could be Level 1, Level 2 or Level 3.
52Schwab Fundamental Index ETFs | Annual Report
Schwab Fundamental U.S. Large Company Index ETF
Statement of Assets and Liabilities
As of February 28, 2023
|
Investments in securities, at value - affiliated (cost $7,808,485) | | |
Investments in securities, at value - unaffiliated (cost $9,681,511,141) including securities on loan of $2,040,735 | | |
Deposit with broker for futures contracts | | |
| | |
| | |
| | |
Income from securities on loan | | |
| | |
|
|
Collateral held for securities on loan | | |
| | |
| | |
| | |
Variation margin on futures contracts | | |
| | |
| | |
|
|
Capital received from investors | | |
Total distributable earnings | | |
| | |
Schwab Fundamental Index ETFs | Annual Report53
Schwab Fundamental U.S. Large Company Index ETF
Statement of Operations
For the period March 1, 2022 through February 28, 2023 |
|
Dividends received from securities - unaffiliated (net of foreign withholding tax of $35,474) | | |
Dividends received from securities - affiliated | | |
| | |
| | |
|
|
| | |
| | |
| | |
| | |
|
REALIZED AND UNREALIZED GAINS (LOSSES) |
Net realized losses on sales of securities - affiliated | | |
Net realized losses on sales of securities - unaffiliated | | |
Net realized gains on sales of in-kind redemptions - affiliated | | |
Net realized gains on sales of in-kind redemptions - unaffiliated | | |
Net realized losses on futures contracts | | |
| | |
Net change in unrealized appreciation (depreciation) on securities - affiliated | | |
Net change in unrealized appreciation (depreciation) on securities - unaffiliated | | |
Net change in unrealized appreciation (depreciation) on futures contracts | | |
Net change in unrealized appreciation (depreciation) | | |
Net realized and unrealized losses | | |
Decrease in net assets resulting from operations | | |
| Proxy fees are non-routine expenses (see financial note 2(e) for additional information). |
54Schwab Fundamental Index ETFs | Annual Report
Schwab Fundamental U.S. Large Company Index ETF
Statement of Changes in Net Assets
For the current and prior report periods
|
| | |
| | | |
| | | |
Net change in unrealized appreciation (depreciation) | | | |
Increase (decrease) in net assets resulting from operations | | | |
|
DISTRIBUTIONS TO SHAREHOLDERS |
| | | |
TRANSACTIONS IN FUND SHARES |
| | |
| | | | | |
| | | | | |
| | | | | |
Net transactions in fund shares | | | | | |
|
SHARES OUTSTANDING AND NET ASSETS |
| | |
| | | | | |
| | | | | |
| | | | | |
| | | | | |
Schwab Fundamental Index ETFs | Annual Report55
Schwab Fundamental U.S. Small Company Index ETF
Financial Statements
| | | | | | |
|
Net asset value at beginning of period | | | | | | |
Income (loss) from investment operations: | | | | | | |
Net investment income (loss)1 | | | | | | |
Net realized and unrealized gains (losses) | | | | | | |
Total from investment operations | | | | | | |
| | | | | | |
Distributions from net investment income | | | | | | |
Net asset value at end of period | | | | | | |
| | | | | | |
|
Ratios to average net assets: | | | | | | |
| | | | | | |
Net investment income (loss) | | | | | | |
| | | | | | |
Net assets, end of period (x 1,000,000) | | | | | | |
| Calculated based on the average shares outstanding during the period. |
| Ratio includes less than 0.005% of non-routine proxy expenses. |
| Portfolio turnover rate excludes securities received or delivered from processing of in-kind creations or redemptions. |
56Schwab Fundamental Index ETFs | Annual Report
Schwab Fundamental U.S. Small Company Index ETF
Portfolio Holdings as of February 28, 2023
This section shows all the securities in the fund’s portfolio and their values as of the report date.
The fund files its complete schedule of portfolio holdings with the U.S. Securities and Exchange Commission (SEC) for the first and third quarters of each fiscal year on Form N-PORT Part F. The fund’s Form N-PORT Part F is available on the SEC’s website at www.sec.gov. You can also obtain this information at no cost on the fund’s website at www.schwabassetmanagement.com/schwabetfs_prospectus, by calling 1-866-414-6349, or by sending an email request to orders@mysummaryprospectus.com. The fund also makes available its complete schedule of portfolio holdings on a daily basis on the fund’s website.
| | |
COMMON STOCKS 99.9% OF NET ASSETS |
|
Automobiles & Components 1.5% |
American Axle & Manufacturing Holdings, Inc. * | | |
Cooper-Standard Holdings, Inc. * | | |
| | |
Fox Factory Holding Corp. * | | |
| | |
| | |
Modine Manufacturing Co. * | | |
| | |
Standard Motor Products, Inc. | | |
| | |
Winnebago Industries, Inc. | | |
| | |
|
|
| | |
| | |
| | |
Atlantic Union Bankshares Corp. | | |
| | |
| | |
| | |
| | |
| | |
| | |
| | |
| | |
Capitol Federal Financial, Inc. | | |
| | |
Central Pacific Financial Corp. | | |
| | |
Columbia Banking System, Inc. | | |
Commerce Bancshares, Inc. | | |
Community Bank System, Inc. | | |
Cullen/Frost Bankers, Inc. | | |
Customers Bancorp, Inc. * | | |
| | |
| | |
| | |
Enterprise Financial Services Corp. | | |
| | |
| | |
Federal Agricultural Mortgage Corp., Class C | | |
| | |
First Bancorp/Southern Pines NC | | |
| | |
First Citizens BancShares, Inc., Class A | | |
First Commonwealth Financial Corp. | | |
| | |
First Financial Bankshares, Inc. | | |
| | |
| | |
First Interstate BancSystem, Inc., Class A | | |
| | |
| | |
| | |
| | |
| | |
Heartland Financial USA, Inc. | | |
| | |
| | |
| | |
| | |
| | |
Independent Bank Group, Inc. | | |
International Bancshares Corp. | | |
| | |
| | |
| | |
National Bank Holdings Corp., Class A | | |
| | |
NMI Holdings, Inc., Class A * | | |
Northwest Bancshares, Inc. | | |
OceanFirst Financial Corp. | | |
| | |
| | |
Pacific Premier Bancorp, Inc. | | |
| | |
| | |
| | |
PennyMac Financial Services, Inc. | | |
Pinnacle Financial Partners, Inc. | | |
Prosperity Bancshares, Inc. | | |
Provident Financial Services, Inc. | | |
| | |
| | |
Sandy Spring Bancorp, Inc. | | |
Simmons First National Corp., Class A | | |
Southside Bancshares, Inc. | | |
| | |
Texas Capital Bancshares, Inc. * | | |
The Bank of N.T. Butterfield & Son Ltd. | | |
| | |
| | |
| | |
| | |
| | |
| | |
| | |
United Community Banks, Inc. | | |
| | |
| | |
| | |
Washington Trust Bancorp, Inc. | | |
| | |
| | |
| | |
| | |
Schwab Fundamental Index ETFs | Annual Report57
Schwab Fundamental U.S. Small Company Index ETF
Portfolio Holdings as of February 28, 2023 (continued)
| | |
| | |
| | |
| | |
|
|
| | |
| | |
| | |
Advanced Drainage Systems, Inc. | | |
Aerojet Rocketdyne Holdings, Inc. * | | |
| | |
Albany International Corp., Class A | | |
Altra Industrial Motion Corp. | | |
American Woodmark Corp. * | | |
| | |
| | |
Applied Industrial Technologies, Inc. | | |
| | |
| | |
Armstrong World Industries, Inc. | | |
| | |
| | |
| | |
| | |
| | |
| | |
Beacon Roofing Supply, Inc. * | | |
| | |
| | |
Comfort Systems USA, Inc. | | |
Construction Partners, Inc., Class A * | | |
Core & Main, Inc., Class A * | | |
| | |
| | |
| | |
| | |
| | |
| | |
| | |
| | |
| | |
| | |
| | |
Evoqua Water Technologies Corp. * | | |
| | |
Franklin Electric Co., Inc. | | |
Gates Industrial Corp. plc * | | |
| | |
Gibraltar Industries, Inc. * | | |
| | |
GrafTech International Ltd. | | |
Granite Construction, Inc. | | |
Great Lakes Dredge & Dock Corp. * | | |
| | |
H&E Equipment Services, Inc. | | |
| | |
| | |
| | |
| | |
Hyster-Yale Materials Handling, Inc. | | |
| | |
John Bean Technologies Corp. | | |
| | |
| | |
| | |
Kratos Defense & Security Solutions, Inc. * | | |
| | |
| | |
Masonite International Corp. * | | |
| | |
| | |
| | |
| | |
| | |
| | |
Mueller Water Products, Inc., Class A | | |
| | |
National Presto Industries, Inc. | | |
| | |
| | |
| | |
| | |
| | |
Quanex Building Products Corp. | | |
| | |
Resideo Technologies, Inc. * | | |
| | |
Rush Enterprises, Inc., Class A | | |
Simpson Manufacturing Co., Inc. | | |
SiteOne Landscape Supply, Inc. * | | |
| | |
Standex International Corp. | | |
Sterling Infrastructure, Inc. * | | |
| | |
| | |
Textainer Group Holdings Ltd. | | |
| | |
| | |
The Greenbrier Cos., Inc. | | |
The Manitowoc Co., Inc. * | | |
| | |
| | |
| | |
| | |
| | |
Triton International Ltd. | | |
| | |
| | |
| | |
| | |
| | |
| | |
Watts Water Technologies, Inc., Class A | | |
WillScot Mobile Mini Holdings Corp. * | | |
| | |
Zurn Elkay Water Solutions Corp. | | |
| | |
|
Commercial & Professional Services 5.2% |
| | |
| | |
Barrett Business Services, Inc. | | |
| | |
BrightView Holdings, Inc. * | | |
Casella Waste Systems, Inc., Class A * | | |
| | |
| | |
| | |
| | |
| | |
| | |
Dun & Bradstreet Holdings, Inc. | | |
| | |
| | |
58Schwab Fundamental Index ETFs | Annual Report
Schwab Fundamental U.S. Small Company Index ETF
Portfolio Holdings as of February 28, 2023 (continued)
| | |
| | |
Healthcare Services Group, Inc. * | | |
Heidrick & Struggles International, Inc. | | |
| | |
Huron Consulting Group, Inc. * | | |
| | |
| | |
| | |
| | |
KAR Auction Services, Inc. * | | |
Kelly Services, Inc., Class A | | |
| | |
Kimball International, Inc., Class B | | |
| | |
Matthews International Corp., Class A | | |
| | |
| | |
| | |
Resources Connection, Inc. | | |
| | |
| | |
| | |
| | |
| | |
| | |
| | |
| | |
| | |
| | |
| | |
| | |
|
Consumer Durables & Apparel 3.9% |
| | |
| | |
| | |
Century Communities, Inc. | | |
| | |
| | |
Ethan Allen Interiors, Inc. | | |
| | |
G-III Apparel Group Ltd. * | | |
| | |
Installed Building Products, Inc. | | |
| | |
| | |
| | |
| | |
| | |
| | |
Malibu Boats, Inc., Class A * | | |
| | |
| | |
| | |
| | |
Smith & Wesson Brands, Inc. | | |
| | |
| | |
| | |
Tempur Sealy International, Inc. | | |
| | |
Topgolf Callaway Brands Corp. * | | |
Tupperware Brands Corp. * | | |
Under Armour, Inc., Class A * | | |
Under Armour, Inc., Class C * | | |
Universal Electronics, Inc. * | | |
| | |
| | |
| | |
Wolverine World Wide, Inc. | | |
| | |
| | |
|
|
| | |
Adtalem Global Education, Inc. * | | |
American Public Education, Inc. * | | |
Arcos Dorados Holdings, Inc., Class A | | |
| | |
| | |
| | |
| | |
Bright Horizons Family Solutions, Inc. * | | |
Brinker International, Inc. * | | |
Caesars Entertainment, Inc. * | | |
Choice Hotels International, Inc. | | |
| | |
Cracker Barrel Old Country Store, Inc. | | |
Dave & Buster's Entertainment, Inc. * | | |
| | |
| | |
| | |
| | |
Graham Holdings Co., Class B | | |
Grand Canyon Education, Inc. * | | |
Hilton Grand Vacations, Inc. * | | |
Hyatt Hotels Corp., Class A * | | |
International Game Technology plc | | |
| | |
| | |
| | |
Marriott Vacations Worldwide Corp. | | |
Papa John's International, Inc. | | |
Penn Entertainment, Inc. * | | |
Perdoceo Education Corp. * | | |
Planet Fitness, Inc., Class A * | | |
Red Robin Gourmet Burgers, Inc. * | | |
Red Rock Resorts, Inc., Class A | | |
| | |
SeaWorld Entertainment, Inc. * | | |
Six Flags Entertainment Corp. * | | |
Strategic Education, Inc. | | |
| | |
| | |
The Cheesecake Factory, Inc. | | |
| | |
| | |
| | |
Wyndham Hotels & Resorts, Inc. | | |
| | |
|
Diversified Financials 3.8% |
A-Mark Precious Metals, Inc. | | |
Apollo Commercial Real Estate Finance, Inc. | | |
| | |
Ares Management Corp., Class A | | |
Artisan Partners Asset Management, Inc., Class A | | |
B. Riley Financial, Inc. (a) | | |
BGC Partners, Inc., Class A | | |
Blackstone Mortgage Trust, Inc., Class A | | |
Brightsphere Investment Group, Inc. | | |
BrightSpire Capital, Inc. | | |
Schwab Fundamental Index ETFs | Annual Report59
Schwab Fundamental U.S. Small Company Index ETF
Portfolio Holdings as of February 28, 2023 (continued)
| | |
Broadmark Realty Capital, Inc. | | |
| | |
| | |
Compass Diversified Holdings | | |
| | |
Credit Acceptance Corp. *(a) | | |
Donnelley Financial Solutions, Inc. * | | |
Encore Capital Group, Inc. * | | |
Enova International, Inc. * | | |
FactSet Research Systems, Inc. | | |
| | |
Focus Financial Partners, Inc., Class A * | | |
Green Dot Corp., Class A * | | |
| | |
Interactive Brokers Group, Inc., Class A | | |
| | |
| | |
| | |
MarketAxess Holdings, Inc. | | |
| | |
| | |
| | |
| | |
New York Mortgage Trust, Inc. | | |
PennyMac Mortgage Investment Trust | | |
| | |
| | |
| | |
| | |
Regional Management Corp. | | |
| | |
| | |
TPG RE Finance Trust, Inc. | | |
Tradeweb Markets, Inc., Class A | | |
Two Harbors Investment Corp. | | |
Virtu Financial, Inc., Class A | | |
Virtus Investment Partners, Inc. | | |
| | |
| | |
| | |
|
|
| | |
| | |
| | |
| | |
| | |
| | |
| | |
| | |
| | |
| | |
| | |
| | |
| | |
| | |
| | |
| | |
| | |
| | |
| | |
Helix Energy Solutions Group, Inc. * | | |
International Seaways, Inc. | | |
| | |
| | |
| | |
| | |
| | |
NexTier Oilfield Solutions, Inc. * | | |
Nordic American Tankers Ltd. | | |
Oceaneering International, Inc. * | | |
Oil States International, Inc. * | | |
Par Pacific Holdings, Inc. * | | |
Patterson-UTI Energy, Inc. | | |
| | |
| | |
| | |
| | |
| | |
| | |
| | |
| | |
Southwestern Energy Co. * | | |
| | |
Teekay Tankers Ltd., Class A * | | |
| | |
| | |
US Silica Holdings, Inc. * | | |
| | |
Weatherford International plc * | | |
| | |
|
Food & Staples Retailing 0.9% |
BJ's Wholesale Club Holdings, Inc. * | | |
Grocery Outlet Holding Corp. * | | |
Ingles Markets, Inc., Class A | | |
| | |
| | |
The Chefs' Warehouse, Inc. * | | |
| | |
| | |
|
Food, Beverage & Tobacco 2.4% |
| | |
| | |
Brown-Forman Corp., Class B | | |
| | |
| | |
Coca-Cola Consolidated, Inc. | | |
| | |
Fresh Del Monte Produce, Inc. | | |
| | |
| | |
John B Sanfilippo & Son, Inc. | | |
| | |
| | |
National Beverage Corp. * | | |
| | |
| | |
The Boston Beer Co., Inc., Class A * | | |
The Hain Celestial Group, Inc. * | | |
| | |
| | |
| | |
| | |
|
Health Care Equipment & Services 3.6% |
Acadia Healthcare Co., Inc. * | | |
| | |
| | |
AMN Healthcare Services, Inc. * | | |
| | |
Brookdale Senior Living, Inc. * | | |
60Schwab Fundamental Index ETFs | Annual Report
Schwab Fundamental U.S. Small Company Index ETF
Portfolio Holdings as of February 28, 2023 (continued)
| | |
| | |
Community Health Systems, Inc. * | | |
| | |
Cross Country Healthcare, Inc. * | | |
| | |
| | |
Globus Medical, Inc., Class A * | | |
| | |
| | |
| | |
| | |
Integra LifeSciences Holdings Corp. * | | |
| | |
| | |
Merit Medical Systems, Inc. * | | |
| | |
| | |
| | |
NextGen Healthcare, Inc. * | | |
| | |
OmniAb, Inc., Class A *(b) | | |
OmniAb, Inc., Class B *(b) | | |
| | |
| | |
Option Care Health, Inc. * | | |
| | |
| | |
Pediatrix Medical Group, Inc. * | | |
| | |
| | |
| | |
Select Medical Holdings Corp. | | |
| | |
| | |
US Physical Therapy, Inc. | | |
| | |
Veeva Systems, Inc., Class A * | | |
| | |
| | |
|
Household & Personal Products 1.0% |
Central Garden & Pet Co., Class A * | | |
| | |
Edgewell Personal Care Co. | | |
| | |
Herbalife Nutrition Ltd. * | | |
| | |
| | |
Reynolds Consumer Products, Inc. | | |
USANA Health Sciences, Inc. * | | |
| | |
| | |
|
|
Ambac Financial Group, Inc. * | | |
American Equity Investment Life Holding Co. | | |
| | |
Argo Group International Holdings Ltd. | | |
Axis Capital Holdings Ltd. | | |
Brighthouse Financial, Inc. * | | |
| | |
| | |
| | |
Horace Mann Educators Corp. | | |
James River Group Holdings Ltd. | | |
| | |
| | |
| | |
| | |
| | |
Safety Insurance Group, Inc. | | |
Selective Insurance Group, Inc. | | |
| | |
Stewart Information Services Corp. | | |
| | |
Universal Insurance Holdings, Inc. | | |
White Mountains Insurance Group Ltd. | | |
| | |
|
|
| | |
Alpha Metallurgical Resources, Inc. | | |
| | |
| | |
| | |
| | |
| | |
| | |
Carpenter Technology Corp. | | |
| | |
| | |
| | |
| | |
Compass Minerals International, Inc. | | |
| | |
| | |
| | |
| | |
| | |
| | |
| | |
| | |
| | |
| | |
| | |
| | |
| | |
| | |
| | |
| | |
Mercer International, Inc. | | |
Minerals Technologies, Inc. | | |
| | |
| | |
| | |
Orion Engineered Carbons S.A. | | |
| | |
| | |
Rayonier Advanced Materials, Inc. * | | |
| | |
Schnitzer Steel Industries, Inc., Class A | | |
Sensient Technologies Corp. | | |
| | |
| | |
| | |
Summit Materials, Inc., Class A * | | |
| | |
The Scotts Miracle-Gro Co. | | |
| | |
| | |
| | |
Tronox Holdings plc, Class A | | |
| | |
Schwab Fundamental Index ETFs | Annual Report61
Schwab Fundamental U.S. Small Company Index ETF
Portfolio Holdings as of February 28, 2023 (continued)
| | |
| | |
Worthington Industries, Inc. | | |
| | |
|
Media & Entertainment 3.2% |
AMC Entertainment Holdings, Inc., Class A *(a) | | |
AMC Networks, Inc., Class A * | | |
| | |
| | |
| | |
| | |
Cinemark Holdings, Inc. * | | |
Clear Channel Outdoor Holdings, Inc. * | | |
| | |
| | |
| | |
iHeartMedia, Inc., Class A * | | |
John Wiley & Sons, Inc., Class A | | |
Liberty Media Corp. - Liberty Formula One, Class A * | | |
Liberty Media Corp. - Liberty Formula One, Class C * | | |
Lions Gate Entertainment Corp., Class A * | | |
Lions Gate Entertainment Corp., Class B * | | |
Live Nation Entertainment, Inc. * | | |
Madison Square Garden Entertainment Corp. * | | |
Madison Square Garden Sports Corp. | | |
| | |
Pinterest, Inc., Class A * | | |
| | |
| | |
| | |
Sinclair Broadcast Group, Inc., Class A | | |
Sirius XM Holdings, Inc. (a) | | |
Spotify Technology S.A. * | | |
The E.W. Scripps Co., Class A * | | |
| | |
The New York Times Co., Class A | | |
The Trade Desk, Inc., Class A * | | |
| | |
| | |
World Wrestling Entertainment, Inc., Class A | | |
| | |
| | |
| | |
|
Pharmaceuticals, Biotechnology & Life Sciences 2.8% |
| | |
| | |
| | |
BioMarin Pharmaceutical, Inc. * | | |
Bio-Rad Laboratories, Inc., Class A * | | |
| | |
| | |
| | |
Charles River Laboratories International, Inc. * | | |
Corcept Therapeutics, Inc. * | | |
Eagle Pharmaceuticals, Inc. * | | |
Elanco Animal Health, Inc. * | | |
| | |
Emergent BioSolutions, Inc. * | | |
| | |
| | |
Horizon Therapeutics plc * | | |
| | |
Ionis Pharmaceuticals, Inc. * | | |
Ligand Pharmaceuticals, Inc. * | | |
| | |
| | |
| | |
Prestige Consumer Healthcare, Inc. * | | |
Royalty Pharma plc, Class A | | |
| | |
Supernus Pharmaceuticals, Inc. * | | |
| | |
West Pharmaceutical Services, Inc. | | |
| | |
|
|
| | |
| | |
Alexander & Baldwin, Inc. | | |
American Assets Trust, Inc. | | |
American Homes 4 Rent, Class A | | |
Americold Realty Trust, Inc. | | |
Apartment Income REIT Corp. | | |
Apartment Investment & Management Co., Class A | | |
Apple Hospitality REIT, Inc. | | |
Ashford Hospitality Trust, Inc. * | | |
| | |
Broadstone Net Lease, Inc. | | |
| | |
| | |
| | |
Corporate Office Properties Trust | | |
| | |
| | |
Cushman & Wakefield plc * | | |
DiamondRock Hospitality Co. | | |
| | |
Easterly Government Properties, Inc. | | |
EastGroup Properties, Inc. | | |
| | |
Empire State Realty Trust, Inc., Class A | | |
| | |
| | |
Equity LifeStyle Properties, Inc. | | |
Essential Properties Realty Trust, Inc. | | |
First Industrial Realty Trust, Inc. | | |
Four Corners Property Trust, Inc. | | |
| | |
| | |
Healthcare Realty Trust, Inc. | | |
Hersha Hospitality Trust, Class A | | |
Highwoods Properties, Inc. | | |
Hudson Pacific Properties, Inc. | | |
Industrial Logistics Properties Trust | | |
| | |
| | |
Kennedy-Wilson Holdings, Inc. | | |
| | |
| | |
| | |
| | |
| | |
| | |
62Schwab Fundamental Index ETFs | Annual Report
Schwab Fundamental U.S. Small Company Index ETF
Portfolio Holdings as of February 28, 2023 (continued)
| | |
National Health Investors, Inc. | | |
National Retail Properties, Inc. | | |
National Storage Affiliates Trust | | |
Newmark Group, Inc., Class A | | |
Office Properties Income Trust | | |
| | |
| | |
| | |
| | |
Piedmont Office Realty Trust, Inc., Class A | | |
| | |
| | |
Retail Opportunity Investments Corp. | | |
Rexford Industrial Realty, Inc. | | |
| | |
| | |
Ryman Hospitality Properties, Inc. | | |
Sabra Health Care REIT, Inc. | | |
| | |
Spirit Realty Capital, Inc. | | |
| | |
Summit Hotel Properties, Inc. | | |
Sunstone Hotel Investors, Inc. | | |
Tanger Factory Outlet Centers, Inc. | | |
| | |
The Howard Hughes Corp. * | | |
The Necessity Retail REIT, Inc. | | |
| | |
| | |
Veris Residential, Inc. * | | |
Xenia Hotels & Resorts, Inc. | | |
Zillow Group, Inc., Class A * | | |
Zillow Group, Inc., Class C * | | |
| | |
|
|
1-800-Flowers.com, Inc., Class A * | | |
Abercrombie & Fitch Co., Class A * | | |
Academy Sports & Outdoors, Inc. | | |
America's Car-Mart, Inc. * | | |
| | |
Barnes & Noble Education, Inc. * | | |
Big 5 Sporting Goods Corp. (a) | | |
Boot Barn Holdings, Inc. * | | |
| | |
Camping World Holdings, Inc., Class A (a) | | |
| | |
| | |
| | |
Designer Brands, Inc., Class A | | |
| | |
| | |
| | |
| | |
Floor & Decor Holdings, Inc., Class A * | | |
GameStop Corp., Class A *(a) | | |
| | |
| | |
| | |
Haverty Furniture Cos., Inc. | | |
| | |
| | |
| | |
| | |
National Vision Holdings, Inc. * | | |
| | |
Ollie's Bargain Outlet Holdings, Inc. * | | |
| | |
| | |
| | |
Sally Beauty Holdings, Inc. * | | |
| | |
| | |
| | |
Sonic Automotive, Inc., Class A | | |
Sportsman's Warehouse Holdings, Inc. * | | |
Stitch Fix, Inc., Class A * | | |
| | |
| | |
The Children's Place, Inc. * | | |
TravelCenters of America, Inc. * | | |
| | |
| | |
Victoria's Secret & Co. * | | |
| | |
| | |
| | |
|
Semiconductors & Semiconductor Equipment 2.5% |
| | |
| | |
Axcelis Technologies, Inc. * | | |
| | |
| | |
| | |
| | |
| | |
| | |
Kulicke & Soffa Industries, Inc. | | |
Lattice Semiconductor Corp. * | | |
Monolithic Power Systems, Inc. | | |
| | |
| | |
| | |
| | |
Silicon Laboratories, Inc. * | | |
SMART Global Holdings, Inc. * | | |
SolarEdge Technologies, Inc. * | | |
| | |
Ultra Clean Holdings, Inc. * | | |
| | |
| | |
| | |
|
|
| | |
| | |
Alarm.com Holdings, Inc. * | | |
| | |
Bentley Systems, Inc., Class B | | |
| | |
| | |
| | |
| | |
Ceridian HCM Holding, Inc. * | | |
CommVault Systems, Inc. * | | |
| | |
| | |
Consensus Cloud Solutions, Inc. * | | |
CSG Systems International, Inc. | | |
Dolby Laboratories, Inc., Class A | | |
| | |
Schwab Fundamental Index ETFs | Annual Report63
Schwab Fundamental U.S. Small Company Index ETF
Portfolio Holdings as of February 28, 2023 (continued)
| | |
| | |
| | |
| | |
Euronet Worldwide, Inc. * | | |
| | |
ExlService Holdings, Inc. * | | |
| | |
| | |
| | |
| | |
| | |
Guidewire Software, Inc. * | | |
| | |
LiveRamp Holdings, Inc. * | | |
Manhattan Associates, Inc. * | | |
MicroStrategy, Inc., Class A *(a) | | |
Pagseguro Digital Ltd., Class A * | | |
| | |
| | |
| | |
| | |
| | |
| | |
| | |
RingCentral, Inc., Class A * | | |
| | |
| | |
| | |
| | |
| | |
| | |
| | |
Tyler Technologies, Inc. * | | |
| | |
| | |
| | |
| | |
| | |
| | |
Zoom Video Communications, Inc., Class A * | | |
| | |
|
Technology Hardware & Equipment 4.6% |
| | |
Advanced Energy Industries, Inc. | | |
| | |
| | |
| | |
Benchmark Electronics, Inc. | | |
| | |
| | |
CommScope Holding Co., Inc. * | | |
Comtech Telecommunications Corp. | | |
| | |
| | |
| | |
| | |
| | |
Kimball Electronics, Inc. * | | |
| | |
| | |
Lumentum Holdings, Inc. * | | |
Methode Electronics, Inc. | | |
National Instruments Corp. | | |
| | |
| | |
| | |
| | |
| | |
| | |
| | |
Pure Storage, Inc., Class A * | | |
| | |
| | |
| | |
Super Micro Computer, Inc. * | | |
| | |
| | |
| | |
| | |
| | |
| | |
|
Telecommunication Services 0.5% |
| | |
Cogent Communications Holdings, Inc. | | |
Consolidated Communications Holdings, Inc. * | | |
EchoStar Corp., Class A * | | |
Frontier Communications Parent, Inc. * | | |
Iridium Communications, Inc. * | | |
Shenandoah Telecommunications Co. | | |
| | |
|
|
Air Transport Services Group, Inc. * | | |
| | |
| | |
| | |
Atlas Air Worldwide Holdings, Inc. * | | |
| | |
| | |
Covenant Logistics Group, Inc. | | |
| | |
| | |
| | |
Golden Ocean Group Ltd. (a) | | |
Hawaiian Holdings, Inc. * | | |
| | |
Hub Group, Inc., Class A * | | |
| | |
| | |
| | |
| | |
| | |
| | |
Schneider National, Inc., Class B | | |
| | |
| | |
| | |
U-Haul Holding Co., Non Voting Shares | | |
| | |
| | |
|
|
| | |
American States Water Co. | | |
Atlantica Sustainable Infrastructure plc | | |
| | |
| | |
California Water Service Group | | |
Chesapeake Utilities Corp. | | |
64Schwab Fundamental Index ETFs | Annual Report
Schwab Fundamental U.S. Small Company Index ETF
Portfolio Holdings as of February 28, 2023 (continued)
| | |
Clearway Energy, Inc., Class A | | |
Clearway Energy, Inc., Class C | | |
Essential Utilities, Inc. | | |
Hawaiian Electric Industries, Inc. | | |
| | |
| | |
| | |
New Jersey Resources Corp. | | |
Northwest Natural Holding Co. | | |
| | |
| | |
| | |
| | |
| | |
| | |
| | |
| | |
| | |
Total Common Stocks
(Cost $5,964,403,578) | |
| | |
SHORT-TERM INVESTMENTS 0.8% OF NET ASSETS |
|
|
State Street Institutional U.S. Government Money Market Fund, Premier Class 4.43% (c) | | |
State Street Institutional U.S. Government Money Market Fund, Premier Class 4.43% (c)(d) | | |
| | |
Total Short-Term Investments
(Cost $55,409,958) | |
Total Investments in Securities
(Cost $6,019,813,536) | |
| | | CURRENT VALUE/
UNREALIZED
DEPRECIATION
($) |
|
| | | |
Russell 2000 Index, e-mini, expires 03/17/23 | | | |
| Non-income producing security. |
| All or a portion of this security is on loan. Securities on loan were valued at $43,920,299. |
| Fair valued using significant unobservable inputs (see financial note 2(a), Securities for which no quoted value is available, for additional information). |
| The rate shown is the annualized 7-day yield. |
| Security purchased with cash collateral received for securities on loan. |
| Real Estate Investment Trust |
The following is a summary of the inputs used to value the fund’s investments as of February 28, 2023 (see financial note 2(a) for additional information):
| QUOTED PRICES IN
ACTIVE MARKETS FOR
IDENTICAL ASSETS
(LEVEL 1) | OTHER SIGNIFICANT
OBSERVABLE INPUTS
(LEVEL 2) | SIGNIFICANT
UNOBSERVABLE INPUTS
(LEVEL 3) | |
| | | | |
| | | | |
Health Care Equipment & Services | | | | |
| | | | |
| | | | |
| | | | |
| | | | |
| Level 3 amount shown includes securities determined to have no value at February 28, 2023. |
| As categorized in the Portfolio Holdings. |
| Futures contracts are reported at cumulative unrealized appreciation or depreciation. |
Fund investments in mutual funds are classified as Level 1, without consideration to the classification level of the underlying
securities held by the mutual funds, which could be Level 1, Level 2 or Level 3.
Schwab Fundamental Index ETFs | Annual Report65
Schwab Fundamental U.S. Small Company Index ETF
Statement of Assets and Liabilities
As of February 28, 2023
|
Investments in securities, at value - unaffiliated (cost $6,019,813,536) including securities on loan of $43,920,299 | | |
| | |
Deposit with broker for futures contracts | | |
| | |
| | |
| | |
| | |
Income from securities on loan | | |
Variation margin on future contracts | | |
| | |
|
|
Collateral held for securities on loan | | |
| | |
| | |
| | |
| | |
| | |
|
|
Capital received from investors | | |
| | |
| | |
66Schwab Fundamental Index ETFs | Annual Report
Schwab Fundamental U.S. Small Company Index ETF
Statement of Operations
For the period March 1, 2022 through February 28, 2023 |
|
Dividends received from securities - unaffiliated (net of foreign withholding tax of $43,791) | | |
| | |
| | |
|
|
| | |
| | |
| | |
| | |
|
REALIZED AND UNREALIZED GAINS (LOSSES) |
Net realized losses on sales of securities - unaffiliated | | |
Net realized gains on sales of in-kind redemptions - unaffiliated | | |
Net realized losses on futures contracts | | |
| | |
Net change in unrealized appreciation (depreciation) on securities - unaffiliated | | |
Net change in unrealized appreciation (depreciation) on futures contracts | | |
Net change in unrealized appreciation (depreciation) | | |
Net realized and unrealized losses | | |
Decrease in net assets resulting from operations | | |
| Proxy fees are non-routine expenses (see financial note 2(e) for additional information). |
Schwab Fundamental Index ETFs | Annual Report67
Schwab Fundamental U.S. Small Company Index ETF
Statement of Changes in Net Assets
For the current and prior report periods
|
| | |
| | | |
| | | |
Net change in unrealized appreciation (depreciation) | | | |
Increase (decrease) in net assets resulting from operations | | | |
|
DISTRIBUTIONS TO SHAREHOLDERS |
| | | |
TRANSACTIONS IN FUND SHARES |
| | |
| | | | | |
| | | | | |
| | | | | |
Net transactions in fund shares | | | | | |
|
SHARES OUTSTANDING AND NET ASSETS |
| | |
| | | | | |
| | | | | |
| | | | | |
| | | | | |
68Schwab Fundamental Index ETFs | Annual Report
Schwab Fundamental International Large Company Index ETF
Financial Statements
| | | | | | |
|
Net asset value at beginning of period | | | | | | |
Income (loss) from investment operations: | | | | | | |
Net investment income (loss)1 | | | | | | |
Net realized and unrealized gains (losses) | | | | | | |
Total from investment operations | | | | | | |
| | | | | | |
Distributions from net investment income | | | | | | |
Net asset value at end of period | | | | | | |
| | | | | | |
|
Ratios to average net assets: | | | | | | |
| | | | | | |
Net investment income (loss) | | | | | | |
| | | | | | |
Net assets, end of period (x 1,000,000) | | | | | | |
| Calculated based on the average shares outstanding during the period. |
| Ratio includes less than 0.005% of non-routine proxy expenses. |
| Portfolio turnover rate excludes securities received or delivered from processing of in-kind creations or redemptions. |
Schwab Fundamental Index ETFs | Annual Report69
Schwab Fundamental International Large Company Index ETF
Portfolio Holdings as of February 28, 2023
This section shows all the securities in the fund’s portfolio and their values as of the report date.
The fund files its complete schedule of portfolio holdings with the U.S. Securities and Exchange Commission (SEC) for the first and third quarters of each fiscal year on Form N-PORT Part F. The fund’s Form N-PORT Part F is available on the SEC’s website at www.sec.gov. You can also obtain this information at no cost on the fund’s website at www.schwabassetmanagement.com/schwabetfs_prospectus, by calling 1-866-414-6349, or by sending an email request to orders@mysummaryprospectus.com. The fund also makes available its complete schedule of portfolio holdings on a daily basis on the fund’s website.
| | |
COMMON STOCKS 98.6% OF NET ASSETS |
|
|
| | |
| | |
| | |
| | |
| | |
| | |
| | |
| | |
| | |
| | |
| | |
| | |
Commonwealth Bank of Australia | | |
| | |
| | |
| | |
Fortescue Metals Group Ltd. | | |
| | |
| | |
Insurance Australia Group Ltd. | | |
James Hardie Industries plc | | |
| | |
| | |
| | |
| | |
| | |
| | |
National Australia Bank Ltd. | | |
| | |
| | |
| | |
| | |
| | |
| | |
| | |
| | |
| | |
| | |
| | |
| | |
| | |
| | |
| | |
| | |
| | |
The Lottery Corp., Ltd. * | | |
| | |
Treasury Wine Estates Ltd. | | |
| | |
| | |
| | |
| | |
Woodside Energy Group Ltd. | | |
| | |
| | |
| | |
| | |
|
|
| | |
| | |
| | |
Raiffeisen Bank International AG * | | |
| | |
| | |
| | |
|
|
| | |
Anheuser-Busch InBev S.A./N.V. | | |
Etablissements Franz Colruyt N.V. | | |
Groupe Bruxelles Lambert N.V. | | |
| | |
| | |
| | |
| | |
| | |
| | |
|
|
| | |
Algonquin Power & Utilities Corp. | | |
Alimentation Couche-Tard, Inc. | | |
| | |
| | |
| | |
| | |
Bausch Health Cos., Inc. * | | |
| | |
Brookfield Asset Management Ltd. | | |
| | |
Canadian Imperial Bank of Commerce | | |
Canadian National Railway Co. | | |
Canadian Natural Resources Ltd. | | |
Canadian Pacific Railway Ltd. | | |
Canadian Tire Corp., Ltd., Class A | | |
Canadian Utilities Ltd., Class A | | |
CCL Industries, Inc., Class B | | |
| | |
| | |
| | |
Constellation Software, Inc. | | |
Crescent Point Energy Corp. | | |
| | |
| | |
| | |
Fairfax Financial Holdings Ltd. | | |
Finning International, Inc. | | |
70Schwab Fundamental Index ETFs | Annual Report
Schwab Fundamental International Large Company Index ETF
Portfolio Holdings as of February 28, 2023 (continued)
| | |
First Quantum Minerals Ltd. | | |
| | |
| | |
| | |
| | |
| | |
| | |
| | |
| | |
| | |
| | |
| | |
| | |
| | |
| | |
| | |
Magna International, Inc. | | |
| | |
| | |
| | |
| | |
| | |
| | |
| | |
| | |
| | |
| | |
| | |
Restaurant Brands International, Inc. | | |
RioCan Real Estate Investment Trust | | |
| | |
| | |
Shaw Communications, Inc., Class B | | |
| | |
| | |
| | |
| | |
Teck Resources Ltd., Class B | | |
| | |
| | |
| | |
The Toronto-Dominion Bank | | |
| | |
| | |
| | |
West Fraser Timber Co., Ltd. | | |
Wheaton Precious Metals Corp. | | |
| | |
| | |
|
|
AP Moller - Maersk A/S, Class A | | |
AP Moller - Maersk A/S, Class B | | |
| | |
| | |
| | |
| | |
| | |
Novo Nordisk A/S, Class B | | |
| | |
| | |
| | |
| | |
| | |
|
| | |
|
| | |
| | |
| | |
| | |
| | |
| | |
| | |
| | |
| | |
| | |
| | |
| | |
| | |
| | |
| | |
|
|
| | |
| | |
| | |
| | |
| | |
| | |
| | |
| | |
| | |
| | |
| | |
| | |
| | |
| | |
Casino Guichard Perrachon S.A. *(b) | | |
| | |
Cie Generale des Etablissements Michelin S.C.A. | | |
| | |
| | |
| | |
| | |
| | |
| | |
| | |
| | |
| | |
Eutelsat Communications S.A. (b) | | |
| | |
| | |
| | |
| | |
| | |
| | |
LVMH Moet Hennessy Louis Vuitton SE | | |
| | |
| | |
| | |
| | |
| | |
| | |
| | |
| | |
| | |
| | |
| | |
| | |
Schwab Fundamental Index ETFs | Annual Report71
Schwab Fundamental International Large Company Index ETF
Portfolio Holdings as of February 28, 2023 (continued)
| | |
| | |
| | |
| | |
| | |
| | |
| | |
| | |
Veolia Environnement S.A. | | |
| | |
| | |
| | |
| | |
|
|
| | |
| | |
| | |
| | |
| | |
Bayerische Motoren Werke AG | | |
| | |
| | |
| | |
| | |
| | |
Daimler Truck Holding AG * | | |
| | |
| | |
| | |
| | |
| | |
| | |
| | |
| | |
Fresenius Medical Care AG & Co. KGaA | | |
| | |
| | |
| | |
| | |
| | |
| | |
| | |
| | |
| | |
| | |
| | |
| | |
| | |
| | |
Muenchener Rueckversicherungs-Gesellschaft AG in Muenchen | | |
| | |
| | |
| | |
| | |
| | |
| | |
| | |
| | |
| | |
Telefonica Deutschland Holding AG | | |
| | |
| | |
| | |
| | |
| | |
| | |
| | |
|
|
AAC Technologies Holdings, Inc. * | | |
| | |
BOC Hong Kong Holdings Ltd. | | |
| | |
CK Hutchison Holdings Ltd. | | |
| | |
Galaxy Entertainment Group Ltd. | | |
| | |
Henderson Land Development Co., Ltd. | | |
Hong Kong & China Gas Co., Ltd. | | |
Hong Kong Exchanges & Clearing Ltd. | | |
Hongkong Land Holdings Ltd. | | |
Jardine Matheson Holdings Ltd. | | |
| | |
| | |
| | |
New World Development Co., Ltd. | | |
| | |
| | |
Sun Hung Kai Properties Ltd. | | |
Swire Pacific Ltd., A Shares | | |
Techtronic Industries Co., Ltd. | | |
| | |
Want Want China Holdings Ltd. | | |
| | |
Wharf Real Estate Investment Co., Ltd. | | |
Yue Yuen Industrial Holdings Ltd. | | |
| | |
|
|
Bank of Ireland Group plc | | |
| | |
| | |
| | |
|
|
| | |
Bank Leumi Le-Israel B.M. | | |
| | |
Israel Discount Bank Ltd., A Shares | | |
Teva Pharmaceutical Industries Ltd. * | | |
| | |
|
|
| | |
Assicurazioni Generali S.p.A. | | |
| | |
| | |
| | |
| | |
| | |
| | |
| | |
| | |
Mediobanca Banca di Credito Finanziario S.p.A. | | |
| | |
| | |
| | |
72Schwab Fundamental Index ETFs | Annual Report
Schwab Fundamental International Large Company Index ETF
Portfolio Holdings as of February 28, 2023 (continued)
| | |
| | |
| | |
| | |
| | |
Terna - Rete Elettrica Nazionale | | |
| | |
| | |
| | |
|
|
| | |
| | |
| | |
| | |
| | |
| | |
| | |
| | |
| | |
| | |
Asahi Group Holdings Ltd. | | |
| | |
| | |
Bandai Namco Holdings, Inc. | | |
| | |
| | |
| | |
| | |
| | |
Central Japan Railway Co. | | |
Chubu Electric Power Co., Inc. | | |
Chugai Pharmaceutical Co., Ltd. | | |
Coca-Cola Bottlers Japan Holdings, Inc. | | |
| | |
Concordia Financial Group Ltd. | | |
Cosmo Energy Holdings Co., Ltd. | | |
Dai Nippon Printing Co., Ltd. | | |
| | |
| | |
| | |
Dai-ichi Life Holdings, Inc. | | |
| | |
| | |
Daito Trust Construction Co., Ltd. | | |
Daiwa House Industry Co., Ltd. | | |
Daiwa Securities Group, Inc. | | |
Daiwabo Holdings Co., Ltd. | | |
| | |
| | |
| | |
| | |
| | |
| | |
| | |
| | |
| | |
Electric Power Development Co., Ltd. | | |
| | |
| | |
| | |
| | |
| | |
| | |
| | |
| | |
Furukawa Electric Co., Ltd. | | |
| | |
| | |
| | |
Hakuhodo DY Holdings, Inc. | | |
Hankyu Hanshin Holdings, Inc. | | |
| | |
| | |
| | |
Hitachi Construction Machinery Co., Ltd. | | |
| | |
Hokkaido Electric Power Co., Inc. | | |
Hokuriku Electric Power Co. | | |
| | |
| | |
| | |
| | |
Iida Group Holdings Co., Ltd. | | |
| | |
Isetan Mitsukoshi Holdings Ltd. | | |
| | |
| | |
Itoham Yonekyu Holdings, Inc. | | |
| | |
J. Front Retailing Co., Ltd. | | |
Japan Airlines Co., Ltd. * | | |
Japan Exchange Group, Inc. | | |
Japan Post Holdings Co., Ltd. | | |
Japan Post Insurance Co., Ltd. | | |
| | |
| | |
| | |
| | |
| | |
| | |
| | |
| | |
| | |
Kawasaki Heavy Industries Ltd. | | |
| | |
| | |
| | |
| | |
| | |
| | |
Kintetsu Group Holdings Co., Ltd. | | |
| | |
| | |
Koito Manufacturing Co., Ltd. | | |
| | |
| | |
| | |
| | |
| | |
Kurita Water Industries Ltd. | | |
| | |
Kyushu Electric Power Co., Inc. | | |
| | |
| | |
| | |
| | |
| | |
| | |
| | |
| | |
| | |
| | |
| | |
Mitsubishi Chemical Group Corp. | | |
Schwab Fundamental Index ETFs | Annual Report73
Schwab Fundamental International Large Company Index ETF
Portfolio Holdings as of February 28, 2023 (continued)
| | |
| | |
Mitsubishi Electric Corp. | | |
Mitsubishi Estate Co., Ltd. | | |
Mitsubishi Gas Chemical Co., Inc. | | |
Mitsubishi Heavy Industries Ltd. | | |
Mitsubishi Materials Corp. | | |
Mitsubishi Motors Corp. * | | |
Mitsubishi Shokuhin Co., Ltd. | | |
Mitsubishi UFJ Financial Group, Inc. | | |
| | |
| | |
| | |
Mitsui Mining & Smelting Co., Ltd. | | |
Mitsui O.S.K. Lines Ltd. (b) | | |
Mizuho Financial Group, Inc. | | |
Morinaga Milk Industry Co., Ltd. | | |
MS&AD Insurance Group Holdings, Inc. | | |
Murata Manufacturing Co., Ltd. | | |
| | |
Nagoya Railroad Co., Ltd. | | |
| | |
| | |
| | |
| | |
| | |
| | |
| | |
| | |
| | |
Nippon Electric Glass Co., Ltd. | | |
Nippon Light Metal Holdings Co., Ltd. | | |
Nippon Paper Industries Co., Ltd. | | |
| | |
Nippon Steel Trading Corp. | | |
Nippon Telegraph & Telephone Corp. | | |
| | |
| | |
| | |
Nisshin Seifun Group, Inc. | | |
Nissin Foods Holdings Co., Ltd. | | |
| | |
Nitori Holdings Co., Ltd. | | |
| | |
| | |
| | |
Nomura Real Estate Holdings, Inc. | | |
| | |
| | |
| | |
Odakyu Electric Railway Co., Ltd. | | |
| | |
| | |
| | |
Ono Pharmaceutical Co., Ltd. | | |
| | |
| | |
| | |
| | |
Otsuka Holdings Co., Ltd. | | |
| | |
Pan Pacific International Holdings Corp. | | |
| | |
Penta-Ocean Construction Co., Ltd. | | |
Persol Holdings Co., Ltd. | | |
Recruit Holdings Co., Ltd. | | |
Renesas Electronics Corp. * | | |
| | |
| | |
| | |
| | |
| | |
| | |
| | |
| | |
| | |
Santen Pharmaceutical Co., Ltd. | | |
| | |
| | |
| | |
Sega Sammy Holdings, Inc. | | |
| | |
| | |
Sekisui Chemical Co., Ltd. | | |
| | |
Seven & i Holdings Co., Ltd. | | |
| | |
Shikoku Electric Power Co., Inc. | | |
| | |
| | |
| | |
| | |
Shin-Etsu Chemical Co., Ltd. | | |
| | |
| | |
| | |
| | |
| | |
Sohgo Security Services Co., Ltd. | | |
| | |
| | |
| | |
Stanley Electric Co., Ltd. | | |
| | |
| | |
Sumitomo Chemical Co., Ltd. | | |
| | |
Sumitomo Electric Industries Ltd. | | |
Sumitomo Forestry Co., Ltd. | | |
Sumitomo Heavy Industries Ltd. | | |
Sumitomo Metal Mining Co., Ltd. | | |
Sumitomo Mitsui Financial Group, Inc. | | |
Sumitomo Mitsui Trust Holdings, Inc. | | |
Sumitomo Realty & Development Co., Ltd. | | |
Sumitomo Rubber Industries Ltd. | | |
| | |
Suntory Beverage & Food Ltd. | | |
| | |
| | |
| | |
| | |
| | |
| | |
| | |
| | |
Takeda Pharmaceutical Co., Ltd. | | |
| | |
| | |
| | |
The Chugoku Electric Power Co., Inc. | | |
The Kansai Electric Power Co., Inc. | | |
The Yokohama Rubber Co., Ltd. | | |
| | |
| | |
| | |
74Schwab Fundamental Index ETFs | Annual Report
Schwab Fundamental International Large Company Index ETF
Portfolio Holdings as of February 28, 2023 (continued)
| | |
| | |
Tohoku Electric Power Co., Inc. | | |
Tokio Marine Holdings, Inc. | | |
| | |
Tokyo Electric Power Co. Holdings, Inc. * | | |
| | |
| | |
| | |
Tokyu Fudosan Holdings Corp. | | |
| | |
| | |
| | |
| | |
| | |
Toyo Seikan Group Holdings Ltd. | | |
| | |
| | |
| | |
| | |
| | |
| | |
| | |
| | |
| | |
| | |
| | |
Yamada Holdings Co., Ltd. | | |
| | |
| | |
Yamato Holdings Co., Ltd. | | |
Yamazaki Baking Co., Ltd. | | |
| | |
| | |
| | |
| | |
|
|
| | |
| | |
| | |
| | |
| | |
| | |
| | |
| | |
| | |
| | |
| | |
| | |
Koninklijke Ahold Delhaize N.V. | | |
| | |
| | |
| | |
| | |
| | |
| | |
| | |
Unibail-Rodamco-Westfield * | | |
| | |
| | |
|
| | |
|
| | |
| | |
| | |
|
|
| | |
| | |
| | |
| | |
| | |
| | |
| | |
Yara International A.S.A. | | |
| | |
|
|
Bank Polska Kasa Opieki S.A. | | |
| | |
PGE Polska Grupa Energetyczna S.A. * | | |
Polski Koncern Naftowy Orlen S.A. | | |
Powszechna Kasa Oszczednosci Bank Polski S.A. | | |
Powszechny Zaklad Ubezpieczen S.A. | | |
| | |
|
|
EDP - Energias de Portugal S.A. | | |
| | |
Jeronimo Martins, SGPS, S.A. | | |
| | |
|
|
| | |
BNK Financial Group, Inc. | | |
| | |
| | |
| | |
| | |
Doosan Enerbility Co., Ltd. * | | |
| | |
GS Engineering & Construction Corp. | | |
| | |
Hana Financial Group, Inc. | | |
Hankook Tire & Technology Co., Ltd. | | |
| | |
Hanwha Solutions Corp. *(a) | | |
| | |
Hyundai Engineering & Construction Co., Ltd. | | |
| | |
Hyundai Marine & Fire Insurance Co., Ltd. | | |
| | |
| | |
| | |
| | |
| | |
| | |
Korea Electric Power Corp. | | |
| | |
Korea Shipbuilding & Offshore Engineering Co., Ltd. | | |
Schwab Fundamental Index ETFs | Annual Report75
Schwab Fundamental International Large Company Index ETF
Portfolio Holdings as of February 28, 2023 (continued)
| | |
| | |
Korean Air Lines Co., Ltd. | | |
| | |
| | |
| | |
| | |
| | |
| | |
| | |
| | |
| | |
| | |
| | |
| | |
| | |
Posco International Corp. | | |
| | |
Samsung Electro-Mechanics Co., Ltd. | | |
Samsung Electronics Co., Ltd. | | |
Samsung Fire & Marine Insurance Co., Ltd. | | |
Samsung Life Insurance Co., Ltd. | | |
| | |
| | |
Shinhan Financial Group Co., Ltd. | | |
| | |
SK Innovation Co., Ltd. * | | |
| | |
| | |
| | |
Woori Financial Group, Inc. | | |
| | |
|
|
ComfortDelGro Corp., Ltd. | | |
| | |
Jardine Cycle & Carriage Ltd. | | |
| | |
Oversea-Chinese Banking Corp., Ltd. | | |
Sembcorp Marine Ltd. *(a) | | |
| | |
Singapore Telecommunications Ltd. | | |
United Overseas Bank Ltd. | | |
| | |
Wilmar International Ltd. | | |
| | |
|
|
| | |
| | |
ACS, Actividades de Construccion y Servicios S.A. | | |
| | |
| | |
Banco Bilbao Vizcaya Argentaria S.A. | | |
| | |
| | |
| | |
| | |
| | |
| | |
| | |
| | |
Industria de Diseno Textil S.A. | | |
| | |
Naturgy Energy Group S.A. | | |
| | |
| | |
| | |
| | |
| | |
|
|
| | |
| | |
| | |
| | |
| | |
| | |
| | |
| | |
| | |
| | |
H & M Hennes & Mauritz AB, B Shares (b) | | |
| | |
| | |
Industrivarden AB, A Shares | | |
Industrivarden AB, C Shares | | |
| | |
| | |
| | |
| | |
| | |
Skandinaviska Enskilda Banken AB, A Shares | | |
| | |
| | |
| | |
| | |
Svenska Cellulosa AB, S.C.A., B Shares | | |
Svenska Handelsbanken AB, A Shares | | |
| | |
| | |
Telefonaktiebolaget LM Ericsson, B Shares | | |
| | |
| | |
| | |
| | |
| | |
|
|
| | |
Accelleron Industries AG * | | |
| | |
| | |
| | |
| | |
Chocoladefabriken Lindt & Spruengli AG | | |
Chocoladefabriken Lindt & Spruengli AG, Participation Certificates | | |
Cie Financiere Richemont S.A., Class A | | |
| | |
| | |
| | |
| | |
| | |
| | |
| | |
76Schwab Fundamental Index ETFs | Annual Report
Schwab Fundamental International Large Company Index ETF
Portfolio Holdings as of February 28, 2023 (continued)
| | |
| | |
| | |
Kuehne & Nagel International AG | | |
Logitech International S.A. | | |
| | |
| | |
| | |
Partners Group Holding AG | | |
| | |
Roche Holding AG, Bearer Shares | | |
| | |
Schindler Holding AG, Participation Certificates | | |
| | |
| | |
| | |
| | |
| | |
| | |
| | |
| | |
| | |
The Swatch Group AG, Bearer Shares | | |
| | |
Zurich Insurance Group AG | | |
| | |
|
|
| | |
| | |
| | |
| | |
| | |
| | |
Associated British Foods plc | | |
| | |
| | |
B&M European Value Retail S.A. | | |
| | |
| | |
| | |
| | |
| | |
Berkeley Group Holdings plc | | |
| | |
British American Tobacco plc | | |
| | |
| | |
| | |
| | |
| | |
| | |
| | |
| | |
| | |
| | |
| | |
Direct Line Insurance Group plc | | |
| | |
| | |
| | |
| | |
| | |
| | |
Flutter Entertainment plc * | | |
| | |
| | |
| | |
| | |
| | |
| | |
| | |
| | |
| | |
| | |
InterContinental Hotels Group plc | | |
International Consolidated Airlines Group S.A. * | | |
International Distributions Services plc | | |
| | |
| | |
| | |
| | |
| | |
| | |
Land Securities Group plc | | |
Legal & General Group plc | | |
| | |
London Stock Exchange Group plc | | |
| | |
Marks & Spencer Group plc * | | |
| | |
| | |
| | |
| | |
| | |
| | |
| | |
| | |
Phoenix Group Holdings plc | | |
| | |
Reckitt Benckiser Group plc | | |
| | |
| | |
| | |
| | |
| | |
| | |
| | |
| | |
| | |
| | |
| | |
| | |
| | |
| | |
| | |
| | |
| | |
| | |
| | |
| | |
United Utilities Group plc | | |
| | |
| | |
| | |
| | |
Total Common Stocks
(Cost $8,220,581,735) | |
|
Schwab Fundamental Index ETFs | Annual Report77
Schwab Fundamental International Large Company Index ETF
Portfolio Holdings as of February 28, 2023 (continued)
| | |
PREFERRED STOCKS 1.1% OF NET ASSETS |
|
|
Bayerische Motoren Werke AG | | |
| | |
| | |
| | |
| | |
|
|
Telecom Italia S.p.A. - RSP * | | |
|
|
| | |
| | |
Hyundai Motor Co., Ltd. 2nd | | |
| | |
| | |
| | |
Samsung Electronics Co., Ltd. | | |
| | |
| | |
|
|
| | |
Total Preferred Stocks
(Cost $100,300,142) | |
|
RIGHTS 0.0% OF NET ASSETS |
|
|
|
expires 03/21/23, strike HKD 44.20 *(a) | | |
| |
| | |
SHORT-TERM INVESTMENTS 0.4% OF NET ASSETS |
|
|
State Street Institutional U.S. Government Money Market Fund, Premier Class 4.43% (c) | | |
State Street Institutional U.S. Government Money Market Fund, Premier Class 4.43% (c)(d) | | |
| | |
Total Short-Term Investments
(Cost $38,602,139) | |
Total Investments in Securities
(Cost $8,359,484,016) | |
| | | CURRENT VALUE/
UNREALIZED
DEPRECIATION
($) |
|
| | | |
MSCI EAFE Index, expires 03/17/23 | | | |
| Non-income producing security. |
| Fair valued using significant unobservable inputs (see financial note 2(a), Securities for which no quoted value is available, for additional information). |
| All or a portion of this security is on loan. Securities on loan were valued at $35,038,206. |
| The rate shown is the annualized 7-day yield. |
| Security purchased with cash collateral received for securities on loan. |
| Global Depositary Receipt |
| Real Estate Investment Trust |
| Risparmio (Savings Shares) |
| |
78Schwab Fundamental Index ETFs | Annual Report
Schwab Fundamental International Large Company Index ETF
Portfolio Holdings as of February 28, 2023 (continued)
The following is a summary of the inputs used to value the fund’s investments as of February 28, 2023 (see financial note 2(a) for additional information):
| QUOTED PRICES IN
ACTIVE MARKETS FOR
IDENTICAL ASSETS
(LEVEL 1) | OTHER SIGNIFICANT
OBSERVABLE INPUTS
(LEVEL 2) | SIGNIFICANT
UNOBSERVABLE INPUTS
(LEVEL 3) | |
| | | | |
| | | | |
| | | | |
| | | | |
| | | | |
| | | | |
| | | | |
| | | | |
| | | | |
| | | | |
| | | | |
| | | | |
| As categorized in the Portfolio Holdings. |
| Futures contracts are reported at cumulative unrealized appreciation or depreciation. |
Fund investments in mutual funds are classified as Level 1, without consideration to the classification level of the underlying
securities held by the mutual funds, which could be Level 1, Level 2 or Level 3.
Schwab Fundamental Index ETFs | Annual Report79
Schwab Fundamental International Large Company Index ETF
Statement of Assets and Liabilities
As of February 28, 2023
|
Investments in securities, at value - unaffiliated (cost $8,359,484,016) including securities on loan of $35,038,206 | | |
Foreign currency, at value (cost $2,307,465) | | |
Deposit with broker for futures contracts | | |
| | |
| | |
| | |
| | |
| | |
Income from securities on loan | | |
| | |
|
|
Collateral held for securities on loan | | |
| | |
| | |
| | |
Variation margin on futures contracts | | |
| | |
| | |
| | |
|
|
Capital received from investors | | |
Total distributable earnings | | |
| | |
80Schwab Fundamental Index ETFs | Annual Report
Schwab Fundamental International Large Company Index ETF
Statement of Operations
For the period March 1, 2022 through February 28, 2023 |
|
Dividends received from securities - unaffiliated (net of foreign withholding tax of $28,917,569) | | |
| | |
| | |
|
|
| | |
| | |
| | |
| | |
| | |
| | |
| | |
|
REALIZED AND UNREALIZED GAINS (LOSSES) |
Net realized losses on sales of securities - unaffiliated | | |
Net realized gains on sales of in-kind redemptions - unaffiliated | | |
Net realized losses on futures contracts | | |
Net realized losses on foreign currency transactions | | |
| | |
Net change in unrealized appreciation (depreciation) on securities - unaffiliated | | |
Net change in unrealized appreciation (depreciation) on futures contracts | | |
Net change in unrealized appreciation (depreciation) on foreign currency translations | | |
Net change in unrealized appreciation (depreciation) | | |
Net realized and unrealized losses | | |
Increase in net assets resulting from operations | | |
| Proxy fees are non-routine expenses (see financial note 2(e) for additional information). |
| Professional fees associated with the filing of tax claims in the European Union deemed to be non-contingent and non-routine expenses of the fund (see financial notes 2(d) and 4 for additional information). |
Schwab Fundamental Index ETFs | Annual Report81
Schwab Fundamental International Large Company Index ETF
Statement of Changes in Net Assets
For the current and prior report periods
|
| | |
| | | |
| | | |
Net change in unrealized appreciation (depreciation) | | | |
Increase in net assets resulting from operations | | | |
|
DISTRIBUTIONS TO SHAREHOLDERS |
| | | |
TRANSACTIONS IN FUND SHARES |
| | |
| | | | | |
| | | | | |
| | | | | |
Net transactions in fund shares | | | | | |
|
SHARES OUTSTANDING AND NET ASSETS |
| | |
| | | | | |
| | | | | |
| | | | | |
| | | | | |
82Schwab Fundamental Index ETFs | Annual Report
Schwab Fundamental International Small Company Index ETF
Financial Statements
| | | | | | |
|
Net asset value at beginning of period | | | | | | |
Income (loss) from investment operations: | | | | | | |
Net investment income (loss)1 | | | | | | |
Net realized and unrealized gains (losses) | | | | | | |
Total from investment operations | | | | | | |
| | | | | | |
Distributions from net investment income | | | | | | |
Net asset value at end of period | | | | | | |
| | | | | | |
|
Ratios to average net assets: | | | | | | |
| | | | | | |
Net investment income (loss) | | | | | | |
| | | | | | |
Net assets, end of period (x 1,000,000) | | | | | | |
| Calculated based on the average shares outstanding during the period. |
| Ratio includes less than 0.005% of non-routine proxy expenses. |
| Portfolio turnover rate excludes securities received or delivered from processing of in-kind creations or redemptions. |
Schwab Fundamental Index ETFs | Annual Report83
Schwab Fundamental International Small Company Index ETF
Portfolio Holdings as of February 28, 2023
This section shows all the securities in the fund’s portfolio and their values as of the report date.
The fund files its complete schedule of portfolio holdings with the U.S. Securities and Exchange Commission (SEC) for the first and third quarters of each fiscal year on Form N-PORT Part F. The fund’s Form N-PORT Part F is available on the SEC’s website at www.sec.gov. You can also obtain this information at no cost on the fund’s website at www.schwabassetmanagement.com/schwabetfs_prospectus, by calling 1-866-414-6349, or by sending an email request to orders@mysummaryprospectus.com. The fund also makes available its complete schedule of portfolio holdings on a daily basis on the fund’s website.
| | |
COMMON STOCKS 99.4% OF NET ASSETS |
|
|
| | |
| | |
| | |
| | |
| | |
| | |
| | |
| | |
| | |
| | |
| | |
Bendigo & Adelaide Bank Ltd. | | |
| | |
| | |
| | |
| | |
| | |
| | |
| | |
| | |
Cleanaway Waste Management Ltd. | | |
| | |
| | |
Coronado Global Resources, Inc. | | |
Costa Group Holdings Ltd. | | |
| | |
| | |
| | |
| | |
Domino's Pizza Enterprises Ltd. | | |
| | |
| | |
| | |
| | |
Event Hospitality & Entertainment Ltd. | | |
| | |
Flight Centre Travel Group Ltd. * | | |
| | |
| | |
| | |
| | |
Harvey Norman Holdings Ltd. | | |
| | |
| | |
| | |
| | |
| | |
| | |
| | |
| | |
| | |
Link Administration Holdings Ltd. | | |
Magellan Financial Group Ltd. (a) | | |
| | |
McMillan Shakespeare Ltd. | | |
| | |
| | |
| | |
| | |
Nine Entertainment Co. Holdings Ltd. | | |
Northern Star Resources Ltd. | | |
| | |
| | |
| | |
| | |
| | |
| | |
| | |
| | |
Platinum Asset Management Ltd. | | |
| | |
| | |
| | |
| | |
| | |
| | |
| | |
Reliance Worldwide Corp., Ltd. | | |
| | |
| | |
| | |
Seven Group Holdings Ltd. | | |
Sierra Rutile Holdings Ltd. * | | |
Silver Lake Resources Ltd. * | | |
Southern Cross Media Group Ltd. | | |
| | |
| | |
| | |
| | |
The Star Entertainment Grp Ltd. * | | |
| | |
Washington H Soul Pattinson & Co., Ltd. | | |
| | |
| | |
| | |
| | |
|
|
| | |
AT&S Austria Technologie & Systemtechnik AG | | |
| | |
| | |
| | |
| | |
| | |
Oesterreichische Post AG (a) | | |
| | |
| | |
| | |
84Schwab Fundamental Index ETFs | Annual Report
Schwab Fundamental International Small Company Index ETF
Portfolio Holdings as of February 28, 2023 (continued)
| | |
| | |
Vienna Insurance Group AG Wiener Versicherung Gruppe | | |
| | |
|
|
Ackermans & van Haaren N.V. | | |
| | |
| | |
| | |
| | |
| | |
| | |
| | |
| | |
| | |
| | |
| | |
| | |
| | |
| | |
| | |
| | |
| | |
Telenet Group Holding N.V. | | |
| | |
| | |
| | |
|
|
| | |
| | |
Ag Growth International, Inc. | | |
| | |
Alamos Gold, Inc., Class A | | |
Allied Properties Real Estate Investment Trust | | |
| | |
| | |
| | |
Artis Real Estate Investment Trust | | |
| | |
| | |
| | |
Badger Infrastructure Solutions Ltd. | | |
| | |
| | |
Boardwalk Real Estate Investment Trust | | |
Bombardier, Inc., Class B * | | |
| | |
Boyd Group Services, Inc. | | |
Brookfield Infrastructure Corp., Class A | | |
Brookfield Renewable Corp., Class A | | |
| | |
| | |
| | |
Canaccord Genuity Group, Inc. | | |
Canadian Apartment Properties REIT | | |
| | |
| | |
| | |
| | |
| | |
| | |
| | |
Chartwell Retirement Residences | | |
| | |
Chemtrade Logistics Income Fund | | |
Choice Properties Real Estate Investment Trust | | |
| | |
| | |
Cogeco Communications, Inc. | | |
| | |
Colliers International Group, Inc. | | |
Crombie Real Estate Investment Trust | | |
Doman Building Materials Group Ltd. | | |
Dream Industrial Real Estate Investment Trust | | |
Dream Office Real Estate Investment Trust | | |
Dundee Precious Metals, Inc. | | |
| | |
| | |
Element Fleet Management Corp. | | |
| | |
| | |
| | |
| | |
| | |
| | |
| | |
First Capital Real Estate Investment Trust | | |
| | |
Fortuna Silver Mines, Inc. * | | |
| | |
| | |
Granite Real Estate Investment Trust | | |
H&R Real Estate Investment Trust | | |
| | |
| | |
| | |
| | |
Innergex Renewable Energy, Inc. | | |
| | |
Killam Apartment Real Estate Investment Trust | | |
Labrador Iron Ore Royalty Corp. | | |
Laurentian Bank of Canada | | |
| | |
Martinrea International, Inc. | | |
| | |
| | |
| | |
| | |
NorthWest Healthcare Properties Real Estate Investment Trust | | |
| | |
| | |
| | |
Pan American Silver Corp. | | |
| | |
| | |
Peyto Exploration & Development Corp. | | |
| | |
Precision Drilling Corp. * | | |
Premium Brands Holdings Corp. | | |
| | |
| | |
Ritchie Bros. Auctioneers, Inc. | | |
| | |
Secure Energy Services, Inc. | | |
| | |
Schwab Fundamental Index ETFs | Annual Report85
Schwab Fundamental International Small Company Index ETF
Portfolio Holdings as of February 28, 2023 (continued)
| | |
| | |
Sienna Senior Living, Inc. | | |
| | |
Sleep Country Canada Holdings, Inc. | | |
SmartCentres Real Estate Investment Trust | | |
| | |
| | |
| | |
| | |
| | |
The Descartes Systems Group, Inc. * | | |
| | |
| | |
Torex Gold Resources, Inc. * | | |
| | |
| | |
TransAlta Renewables, Inc. | | |
Transcontinental, Inc., Class A | | |
Trican Well Service Ltd. * | | |
| | |
| | |
| | |
| | |
Western Forest Products, Inc. | | |
Westshore Terminals Investment Corp. | | |
| | |
| | |
| | |
| | |
|
|
| | |
| | |
| | |
| | |
| | |
| | |
| | |
| | |
| | |
H. Lundbeck A/S, Class A * | | |
| | |
| | |
| | |
| | |
Ringkjoebing Landbobank A/S | | |
| | |
| | |
Scandinavian Tobacco Group A/S, Class A | | |
| | |
| | |
| | |
| | |
| | |
| | |
| | |
| | |
|
|
| | |
| | |
| | |
| | |
| | |
| | |
| | |
| | |
Metsa Board Oyj, B Shares | | |
| | |
| | |
| | |
| | |
| | |
| | |
| | |
| | |
| | |
| | |
|
|
| | |
| | |
| | |
| | |
| | |
| | |
| | |
| | |
| | |
| | |
| | |
| | |
| | |
| | |
| | |
| | |
| | |
| | |
| | |
| | |
Gaztransport Et Technigaz S.A. | | |
| | |
| | |
| | |
| | |
| | |
| | |
| | |
| | |
| | |
La Francaise des Jeux SAEM | | |
| | |
| | |
| | |
| | |
Metropole Television S.A. | | |
| | |
| | |
| | |
| | |
| | |
| | |
| | |
| | |
| | |
| | |
| | |
| | |
Technicolor Creative Studios S.A. * | | |
| | |
| | |
| | |
86Schwab Fundamental Index ETFs | Annual Report
Schwab Fundamental International Small Company Index ETF
Portfolio Holdings as of February 28, 2023 (continued)
| | |
UbiSoft Entertainment S.A. * | | |
| | |
| | |
| | |
| | |
| | |
|
|
| | |
| | |
Aareal Bank AG, Tender Shares * | | |
| | |
ADVA Optical Networking SE * | | |
| | |
| | |
| | |
| | |
Borussia Dortmund GmbH & Co. KGaA *(a) | | |
| | |
Carl Zeiss Meditec AG, Class B | | |
| | |
| | |
CompuGroup Medical SE & Co. KgaA | | |
CTS Eventim AG & Co., KGaA * | | |
| | |
Deutsche Pfandbriefbank AG | | |
| | |
| | |
| | |
| | |
DWS Group GmbH & Co. KGaA | | |
| | |
| | |
| | |
| | |
Fraport AG Frankfurt Airport Services Worldwide * | | |
| | |
Global Fashion Group S.A. * | | |
Grand City Properties S.A. | | |
| | |
Hamburger Hafen und Logistik AG | | |
Heidelberger Druckmaschinen AG * | | |
| | |
| | |
| | |
Hornbach Holding AG & Co. KGaA | | |
| | |
| | |
| | |
| | |
| | |
| | |
| | |
| | |
| | |
| | |
| | |
| | |
| | |
| | |
| | |
| | |
| | |
| | |
| | |
| | |
| | |
| | |
| | |
| | |
| | |
| | |
| | |
| | |
| | |
| | |
| | |
Vitesco Technologies Group AG, Class A * | | |
| | |
| | |
| | |
|
|
Asia Cement China Holdings Corp. | | |
| | |
| | |
Brightoil Petroleum Holdings Ltd. *(b) | | |
Budweiser Brewing Co. APAC Ltd. | | |
Cathay Pacific Airways Ltd. * | | |
Chow Sang Sang Holdings International Ltd. | | |
Chow Tai Fook Jewellery Group Ltd. | | |
CITIC Telecom International Holdings Ltd. | | |
CK Infrastructure Holdings Ltd. | | |
Cowell e Holdings, Inc. *(a) | | |
DFI Retail Group Holdings Ltd. | | |
| | |
Fortune Real Estate Investment Trust | | |
Haitong International Securities Group Ltd. *(a) | | |
Hang Lung Properties Ltd. | | |
| | |
Huabao International Holdings Ltd. (a) | | |
Hysan Development Co., Ltd. | | |
| | |
Jinchuan Group International Resources Co., Ltd. | | |
JS Global Lifestyle Co., Ltd. | | |
Kerry Logistics Network Ltd. | | |
| | |
L'Occitane International S.A. | | |
Luk Fook Holdings International Ltd. | | |
| | |
Melco International Development Ltd. * | | |
MGM China Holdings Ltd. * | | |
| | |
| | |
Nexteer Automotive Group Ltd. | | |
| | |
Orient Overseas International Ltd. | | |
Pacific Basin Shipping Ltd. | | |
Power Assets Holdings Ltd. | | |
Powerlong Real Estate Holdings Ltd. (a) | | |
| | |
Samsonite International S.A. * | | |
Singamas Container Holdings Ltd. | | |
| | |
SITC International Holdings Co., Ltd. | | |
| | |
| | |
Schwab Fundamental Index ETFs | Annual Report87
Schwab Fundamental International Small Company Index ETF
Portfolio Holdings as of February 28, 2023 (continued)
| | |
Super Hi International Holding Ltd. * | | |
| | |
Texhong Textile Group Ltd. | | |
The Bank of East Asia Ltd. | | |
Truly International Holdings Ltd. | | |
| | |
Value Partners Group Ltd. | | |
Vitasoy International Holdings Ltd. | | |
| | |
| | |
| | |
Xinyi Glass Holdings Ltd. | | |
| | |
|
|
| | |
| | |
| | |
Irish Continental Group plc | | |
| | |
|
|
Alony Hetz Properties & Investments Ltd. | | |
| | |
Bezeq The Israeli Telecommunication Corp., Ltd. | | |
| | |
Clal Insurance Enterprises Holdings Ltd. * | | |
Delek Automotive Systems Ltd. | | |
| | |
| | |
| | |
Formula Systems 1985 Ltd. | | |
| | |
Harel Insurance Investments & Financial Services Ltd. | | |
| | |
| | |
Mivne Real Estate KD Ltd. | | |
Mizrahi Tefahot Bank Ltd. | | |
| | |
| | |
Partner Communications Co., Ltd. * | | |
| | |
| | |
| | |
| | |
The First International Bank of Israel Ltd. | | |
The Phoenix Holdings Ltd. | | |
Tower Semiconductor Ltd. * | | |
| | |
|
|
| | |
| | |
| | |
| | |
| | |
| | |
| | |
| | |
| | |
Banca Monte dei Paschi di Siena S.p.A. *(a) | | |
Banca Popolare di Sondrio S.p.A. | | |
| | |
| | |
| | |
| | |
| | |
| | |
Danieli & C Officine Meccaniche S.p.A. (a) | | |
Davide Campari-Milano N.V. | | |
| | |
| | |
| | |
| | |
| | |
| | |
FinecoBank Banca Fineco S.p.A. | | |
Infrastrutture Wireless Italiane S.p.A. | | |
| | |
| | |
| | |
Maire Tecnimont S.p.A. (a) | | |
| | |
MFE-MediaForEurope N.V., Class A | | |
MFE-MediaForEurope N.V., Class B | | |
| | |
| | |
| | |
| | |
Recordati Industria Chimica e Farmaceutica S.p.A. | | |
| | |
Salvatore Ferragamo S.p.A. | | |
| | |
| | |
| | |
| | |
UnipolSai Assicurazioni S.p.A. | | |
| | |
| | |
|
|
| | |
| | |
| | |
| | |
| | |
Advance Residence Investment Corp. | | |
| | |
AEON Financial Service Co., Ltd. | | |
| | |
| | |
AEON REIT Investment Corp. | | |
| | |
| | |
| | |
| | |
| | |
| | |
| | |
| | |
Akebono Brake Industry Co., Ltd. * | | |
| | |
| | |
| | |
88Schwab Fundamental Index ETFs | Annual Report
Schwab Fundamental International Small Company Index ETF
Portfolio Holdings as of February 28, 2023 (continued)
| | |
| | |
| | |
| | |
| | |
| | |
Arcland Sakamoto Co., Ltd. | | |
| | |
| | |
| | |
Asahi Diamond Industrial Co., Ltd. | | |
| | |
| | |
| | |
| | |
| | |
| | |
| | |
| | |
| | |
BayCurrent Consulting, Inc. | | |
| | |
Bell System24 Holdings, Inc. | | |
| | |
| | |
| | |
| | |
| | |
| | |
| | |
Canon Marketing Japan, Inc. | | |
| | |
| | |
| | |
| | |
Chugin Financial Group, Inc. | | |
Chugoku Marine Paints Ltd. | | |
| | |
| | |
| | |
| | |
Comforia Residential REIT, Inc. | | |
Cosmos Pharmaceutical Corp. | | |
Create SD Holdings Co., Ltd. | | |
| | |
| | |
| | |
| | |
| | |
| | |
Daiki Aluminium Industry Co., Ltd. | | |
Daikokutenbussan Co., Ltd. | | |
| | |
| | |
Daishi Hokuetsu Financial Group, Inc. | | |
Daito Pharmaceutical Co., Ltd. | | |
Daiwa House REIT Investment Corp. | | |
Daiwa Office Investment Corp. | | |
Daiwa Securities Living Investments Corp. | | |
| | |
| | |
| | |
| | |
| | |
| | |
| | |
Doutor Nichires Holdings Co., Ltd. (a) | | |
| | |
| | |
| | |
DyDo Group Holdings, Inc. | | |
| | |
| | |
| | |
| | |
| | |
| | |
| | |
| | |
| | |
| | |
| | |
Foster Electric Co., Ltd. | | |
| | |
Frontier Real Estate Investment Corp. | | |
| | |
| | |
| | |
Fuji Media Holdings, Inc. | | |
| | |
| | |
Fuji Seal International, Inc. | | |
| | |
| | |
| | |
| | |
| | |
| | |
Fukuoka Financial Group, Inc. | | |
| | |
Fukuyama Transporting Co., Ltd. | | |
| | |
Furuno Electric Co., Ltd. | | |
| | |
| | |
Futaba Industrial Co., Ltd. | | |
Fuyo General Lease Co., Ltd. | | |
Gakken Holdings Co., Ltd. | | |
| | |
| | |
| | |
| | |
| | |
| | |
| | |
| | |
GungHo Online Entertainment, Inc. | | |
| | |
| | |
H.U. Group Holdings, Inc. | | |
| | |
| | |
| | |
| | |
| | |
Heiwa Real Estate Co., Ltd. | | |
| | |
| | |
| | |
Hirose Electric Co., Ltd. | | |
Hisamitsu Pharmaceutical Co., Inc. | | |
| | |
| | |
| | |
Hokuhoku Financial Group, Inc. | | |
| | |
| | |
Schwab Fundamental Index ETFs | Annual Report89
Schwab Fundamental International Small Company Index ETF
Portfolio Holdings as of February 28, 2023 (continued)
| | |
| | |
| | |
| | |
| | |
| | |
| | |
| | |
| | |
| | |
| | |
| | |
Inaba Denki Sangyo Co., Ltd. | | |
| | |
Industrial & Infrastructure Fund Investment Corp. | | |
| | |
INFRONEER Holdings, Inc. * | | |
| | |
Internet Initiative Japan, Inc. | | |
Invincible Investment Corp. | | |
Iriso Electronics Co., Ltd. | | |
| | |
Ishihara Sangyo Kaisha Ltd. | | |
| | |
| | |
Itochu Techno-Solutions Corp. | | |
| | |
| | |
| | |
| | |
Japan Airport Terminal Co., Ltd. * | | |
Japan Aviation Electronics Industry Ltd. | | |
| | |
| | |
Japan Hotel REIT Investment Corp. | | |
| | |
Japan Logistics Fund, Inc. | | |
Japan Metropolitan Fund Invest | | |
Japan Petroleum Exploration Co., Ltd. | | |
Japan Post Bank Co., Ltd. | | |
Japan Prime Realty Investment Corp. | | |
Japan Real Estate Investment Corp. | | |
| | |
| | |
| | |
| | |
| | |
| | |
| | |
Kaga Electronics Co., Ltd. | | |
| | |
| | |
Kaken Pharmaceutical Co., Ltd. | | |
| | |
| | |
| | |
| | |
Kanto Denka Kogyo Co., Ltd. | | |
| | |
| | |
Kawasaki Kisen Kaisha Ltd. | | |
Keihan Holdings Co., Ltd. | | |
| | |
Keisei Electric Railway Co., Ltd. | | |
| | |
Kenedix Office Investment Corp. | | |
Kenedix Residential Next Investment Corp. | | |
| | |
Kenedix Retail REIT Corp. | | |
| | |
| | |
Kissei Pharmaceutical Co., Ltd. | | |
| | |
| | |
Kobayashi Pharmaceutical Co., Ltd. | | |
Koei Tecmo Holdings Co., Ltd. | | |
Kohnan Shoji Co., Ltd. (a) | | |
| | |
Kokusai Pulp & Paper Co., Ltd. | | |
| | |
| | |
| | |
| | |
| | |
Kumiai Chemical Industry Co., Ltd. | | |
| | |
| | |
Kusuri no Aoki Holdings Co., Ltd. | | |
| | |
| | |
Kyokuto Kaihatsu Kogyo Co., Ltd. | | |
| | |
Kyoritsu Maintenance Co., Ltd. | | |
| | |
| | |
Kyushu Financial Group, Inc. | | |
| | |
| | |
| | |
| | |
| | |
| | |
Makino Milling Machine Co., Ltd. | | |
| | |
| | |
| | |
| | |
| | |
| | |
| | |
| | |
| | |
Mebuki Financial Group, Inc. | | |
| | |
Megmilk Snow Brand Co., Ltd. | | |
| | |
Meiko Electronics Co., Ltd. | | |
| | |
| | |
| | |
Mimasu Semiconductor Industry Co., Ltd. | | |
| | |
| | |
Mitsubishi HC Capital, Inc. | | |
Mitsubishi Logisnext Co., Ltd. | | |
Mitsubishi Logistics Corp. | | |
Mitsui E&S Holdings Co., Ltd. * | | |
| | |
Mitsui Matsushima Holdings Co., Ltd. (a) | | |
Mitsui-Soko Holdings Co., Ltd. | | |
| | |
| | |
| | |
| | |
Mochida Pharmaceutical Co., Ltd. | | |
90Schwab Fundamental Index ETFs | Annual Report
Schwab Fundamental International Small Company Index ETF
Portfolio Holdings as of February 28, 2023 (continued)
| | |
| | |
| | |
Mori Hills Reit Investment Corp. | | |
Mori Trust Sogo REIT, Inc. | | |
| | |
| | |
Musashi Seimitsu Industry Co., Ltd. | | |
| | |
| | |
Namura Shipbuilding Co., Ltd. *(a) | | |
Nankai Electric Railway Co., Ltd. | | |
NEC Networks & System Integration Corp. | | |
NET One Systems Co., Ltd. | | |
| | |
| | |
| | |
| | |
Nichi-iko Pharmaceutical Co., Ltd. *(a) | | |
| | |
| | |
| | |
| | |
Nihon M&A Center Holdings, Inc. | | |
Nihon Parkerizing Co., Ltd. | | |
| | |
Nikkon Holdings Co., Ltd. | | |
| | |
Nippon Accommodations Fund, Inc. | | |
Nippon Building Fund, Inc. | | |
| | |
| | |
Nippon Coke & Engineering Co., Ltd. | | |
| | |
Nippon Densetsu Kogyo Co., Ltd. | | |
| | |
| | |
| | |
Nippon Paint Holdings Co., Ltd. | | |
Nippon Prologis REIT, Inc. | | |
NIPPON REIT Investment Corp. | | |
Nippon Sanso Holdings Corp. | | |
Nippon Sheet Glass Co., Ltd. * | | |
Nippon Shinyaku Co., Ltd. | | |
Nippon Shokubai Co., Ltd. | | |
| | |
| | |
Nippon Television Holdings, Inc. | | |
Nippon Thompson Co., Ltd. | | |
Nippon Yakin Kogyo Co., Ltd. | | |
| | |
Nishimatsu Construction Co., Ltd. | | |
Nishimatsuya Chain Co., Ltd. | | |
Nishi-Nippon Financial Holdings, Inc. | | |
Nishi-Nippon Railroad Co., Ltd. | | |
Nishio Rent All Co., Ltd. | | |
| | |
| | |
Nissin Electric Co., Ltd. | | |
| | |
Nittetsu Mining Co., Ltd. | | |
| | |
| | |
Noevir Holdings Co., Ltd. | | |
| | |
| | |
| | |
| | |
| | |
Nomura Real Estate Master Fund, Inc. | | |
Nomura Research Institute Ltd. | | |
| | |
| | |
| | |
| | |
NS United Kaiun Kaisha Ltd. | | |
| | |
| | |
NTT UD REIT Investment Corp. | | |
| | |
| | |
| | |
Okasan Securities Group, Inc. | | |
Oki Electric Industry Co., Ltd. | | |
| | |
| | |
| | |
| | |
Onward Holdings Co., Ltd. (a) | | |
Open House Group Co., Ltd. | | |
| | |
| | |
| | |
| | |
| | |
| | |
| | |
| | |
| | |
Pacific Industrial Co., Ltd. | | |
PAL GROUP Holdings Co., Ltd. | | |
Paramount Bed Holdings Co., Ltd. | | |
| | |
| | |
| | |
| | |
Pola Orbis Holdings, Inc. | | |
| | |
| | |
| | |
| | |
| | |
| | |
| | |
| | |
| | |
| | |
Retail Partners Co., Ltd. (a) | | |
| | |
| | |
| | |
Rohto Pharmaceutical Co., Ltd. | | |
| | |
| | |
| | |
| | |
| | |
| | |
| | |
Sakai Chemical Industry Co., Ltd. | | |
Sakai Moving Service Co., Ltd. | | |
| | |
| | |
| | |
| | |
| | |
Sanken Electric Co., Ltd. | | |
Schwab Fundamental Index ETFs | Annual Report91
Schwab Fundamental International Small Company Index ETF
Portfolio Holdings as of February 28, 2023 (continued)
| | |
Sanki Engineering Co., Ltd. | | |
| | |
Sanoh Industrial Co., Ltd. | | |
| | |
Sanyo Chemical Industries Ltd. | | |
| | |
Sanyo Special Steel Co., Ltd. | | |
| | |
| | |
| | |
| | |
SCREEN Holdings Co., Ltd. | | |
| | |
| | |
| | |
| | |
| | |
| | |
Senko Group Holdings Co., Ltd. | | |
Senshu Ikeda Holdings, Inc. | | |
| | |
| | |
Shibaura Machine Co., Ltd. | | |
Shima Seiki Manufacturing Ltd. | | |
Shindengen Electric Manufacturing Co., Ltd. | | |
Shin-Etsu Polymer Co., Ltd. | | |
Shinko Electric Industries Co., Ltd. | | |
Shinmaywa Industries Ltd. | | |
Ship Healthcare Holdings, Inc. | | |
Shizuoka Financial Group, Inc. | | |
| | |
SHO-BOND Holdings Co., Ltd. | | |
| | |
| | |
| | |
| | |
Sinfonia Technology Co., Ltd. | | |
SKY Perfect JSAT Holdings, Inc. | | |
Skylark Holdings Co., Ltd. * | | |
| | |
| | |
Square Enix Holdings Co., Ltd. | | |
St Marc Holdings Co., Ltd. | | |
| | |
| | |
| | |
| | |
Sumitomo Bakelite Co., Ltd. | | |
Sumitomo Mitsui Construction Co., Ltd. | | |
Sumitomo Osaka Cement Co., Ltd. | | |
Sumitomo Pharma Co., Ltd. | | |
| | |
Sun Frontier Fudousan Co., Ltd. | | |
| | |
SWCC Showa Holdings Co., Ltd. | | |
| | |
| | |
| | |
| | |
| | |
| | |
Taisho Pharmaceutical Holdings Co., Ltd. | | |
| | |
Takamatsu Construction Group Co., Ltd. | | |
| | |
| | |
| | |
| | |
Takara Standard Co., Ltd. | | |
Takasago Thermal Engineering Co., Ltd. | | |
Takeuchi Manufacturing Co., Ltd. | | |
| | |
| | |
| | |
| | |
| | |
| | |
| | |
| | |
| | |
| | |
| | |
| | |
| | |
| | |
The Japan Steel Works Ltd. | | |
The Japan Wool Textile Co., Ltd. | | |
| | |
| | |
| | |
| | |
The Nisshin Oillio Group Ltd. | | |
The Ogaki Kyoritsu Bank Ltd. | | |
The Okinawa Electric Power Co., Inc. | | |
The San-in Godo Bank Ltd. | | |
| | |
The Sumitomo Warehouse Co., Ltd. | | |
| | |
| | |
| | |
| | |
| | |
| | |
| | |
| | |
| | |
| | |
| | |
| | |
Tokai Tokyo Financial Holdings, Inc. | | |
| | |
| | |
Tokyo Ohka Kogyo Co., Ltd. | | |
| | |
Tokyo Steel Manufacturing Co., Ltd. | | |
| | |
| | |
Tokyu Construction Co., Ltd. | | |
| | |
| | |
| | |
| | |
| | |
| | |
Towa Pharmaceutical Co., Ltd. | | |
Toyo Construction Co., Ltd. | | |
Toyo Ink SC Holdings Co., Ltd. | | |
| | |
| | |
| | |
| | |
| | |
| | |
| | |
| | |
92Schwab Fundamental Index ETFs | Annual Report
Schwab Fundamental International Small Company Index ETF
Portfolio Holdings as of February 28, 2023 (continued)
| | |
| | |
Tsubaki Nakashima Co., Ltd. | | |
| | |
| | |
| | |
| | |
| | |
| | |
| | |
| | |
| | |
United Super Markets Holdings, Inc. | | |
United Urban Investment Corp. | | |
| | |
| | |
| | |
| | |
| | |
| | |
| | |
| | |
| | |
| | |
| | |
Warabeya Nichiyo Holdings Co., Ltd. | | |
Welcia Holdings Co., Ltd. | | |
| | |
| | |
Yamaguchi Financial Group, Inc. | | |
| | |
| | |
| | |
| | |
Yodogawa Steel Works Ltd. | | |
Yokogawa Bridge Holdings Corp. | | |
| | |
| | |
Yondoshi Holdings, Inc. (a) | | |
Yoshinoya Holdings Co., Ltd. (a) | | |
| | |
| | |
| | |
Zensho Holdings Co., Ltd. | | |
| | |
ZERIA Pharmaceutical Co., Ltd. | | |
| | |
| | |
| | |
|
|
Espirito Santo Financial Group S.A. *(b) | | |
|
|
| | |
AMG Advanced Metallurgical Group N.V. | | |
| | |
| | |
| | |
BE Semiconductor Industries N.V. | | |
| | |
Eurocommercial Properties N.V. | | |
| | |
| | |
| | |
| | |
| | |
| | |
| | |
Koninklijke BAM Groep N.V. * | | |
| | |
| | |
| | |
| | |
| | |
| | |
| | |
| | |
| | |
| | |
|
|
Auckland International Airport Ltd. * | | |
| | |
| | |
| | |
Fisher & Paykel Healthcare Corp., Ltd. | | |
| | |
| | |
| | |
| | |
| | |
| | |
| | |
| | |
| | |
| | |
|
|
| | |
| | |
| | |
| | |
| | |
| | |
| | |
| | |
| | |
| | |
| | |
| | |
| | |
Gjensidige Forsikring A.S.A. | | |
| | |
Kongsberg Automotive A.S.A. * | | |
| | |
Leroy Seafood Group A.S.A. | | |
| | |
| | |
Odfjell Technology Ltd. * | | |
| | |
| | |
Schibsted A.S.A., A Shares | | |
Schibsted A.S.A., B Shares | | |
| | |
| | |
SpareBank 1 SR-Bank A.S.A. | | |
| | |
| | |
| | |
| | |
Wallenius Wilhelmsen A.S.A. | | |
Schwab Fundamental Index ETFs | Annual Report93
Schwab Fundamental International Small Company Index ETF
Portfolio Holdings as of February 28, 2023 (continued)
| | |
| | |
| | |
|
|
| | |
| | |
| | |
| | |
| | |
| | |
| | |
| | |
| | |
| | |
| | |
Jastrzebska Spolka Weglowa S.A. * | | |
| | |
| | |
| | |
| | |
| | |
| | |
Santander Bank Polska S.A. | | |
Tauron Polska Energia S.A. * | | |
| | |
|
|
CTT-Correios de Portugal S.A. | | |
| | |
| | |
REN - Redes Energeticas Nacionais, SGPS, S.A. | | |
| | |
| | |
| | |
|
|
| | |
| | |
| | |
| | |
| | |
| | |
Celltrion Healthcare Co., Ltd. | | |
| | |
| | |
Chong Kun Dang Pharmaceutical Corp. | | |
| | |
| | |
| | |
Daehan Flour Mill Co., Ltd. * | | |
| | |
Daesang Holdings Co., Ltd. * | | |
Daewoo Engineering & Construction Co., Ltd. * | | |
Daewoo Shipbuilding & Marine Engineering Co., Ltd. * | | |
| | |
| | |
| | |
DGB Financial Group, Inc. | | |
| | |
Dongjin Semichem Co., Ltd. | | |
Dongkuk Steel Mill Co., Ltd. | | |
| | |
| | |
Dongwon Industries Co., Ltd. | | |
| | |
| | |
| | |
| | |
| | |
| | |
| | |
Green Cross Holdings Corp. | | |
| | |
| | |
| | |
| | |
Hanjin Transportation Co., Ltd. * | | |
| | |
| | |
| | |
| | |
Hanshin Construction Co., Ltd. * | | |
Hansol Chemical Co., Ltd. | | |
Hansol Holdings Co., Ltd. | | |
| | |
Hansol Technics Co., Ltd. | | |
| | |
Hanwha Aerospace Co., Ltd. | | |
Hanwha General Insurance Co., Ltd. * | | |
Hanwha Life Insurance Co., Ltd. * | | |
| | |
| | |
HDC Hyundai Development Co-Engineering & Construction, Class E * | | |
Heungkuk Fire & Marine Insurance Co., Ltd. * | | |
| | |
HJ Shipbuilding & Construction Co., Ltd. * | | |
| | |
| | |
| | |
HS Industries Co., Ltd. * | | |
Hyosung Advanced Materials Corp. | | |
| | |
| | |
Hyosung Heavy Industries Corp. * | | |
| | |
Hyundai Construction Equipment Co., Ltd. | | |
| | |
Hyundai Department Store Co., Ltd. | | |
Hyundai Doosan Infracore Co., Ltd. | | |
Hyundai Elevator Co., Ltd. * | | |
Hyundai Greenfood Co., Ltd. (b) | | |
Hyundai Heavy Industries Co., Ltd. | | |
Hyundai Home Shopping Network Corp. | | |
Hyundai Mipo Dockyard Co., Ltd. | | |
Hyundai Rotem Co., Ltd. * | | |
| | |
| | |
| | |
| | |
| | |
JB Financial Group Co., Ltd. | | |
| | |
| | |
| | |
| | |
94Schwab Fundamental Index ETFs | Annual Report
Schwab Fundamental International Small Company Index ETF
Portfolio Holdings as of February 28, 2023 (continued)
| | |
KEPCO Plant Service & Engineering Co., Ltd. * | | |
| | |
KIWOOM Securities Co., Ltd. * | | |
| | |
| | |
| | |
Korea Aerospace Industries Ltd. * | | |
Korea Electric Terminal Co., Ltd. | | |
Korea Investment Holdings Co., Ltd. * | | |
Korea Petrochemical Ind Co., Ltd. * | | |
| | |
| | |
| | |
Kumho Petrochemical Co., Ltd. * | | |
| | |
| | |
Kwang Dong Pharmaceutical Co., Ltd. | | |
| | |
| | |
| | |
Lotte Chilsung Beverage Co., Ltd. | | |
| | |
LOTTE Fine Chemical Co., Ltd. | | |
| | |
| | |
| | |
| | |
| | |
| | |
| | |
Meritz Financial Group, Inc. | | |
Meritz Securities Co., Ltd. | | |
Mirae Asset Securities Co., Ltd. | | |
| | |
Namyang Dairy Products Co., Ltd. * | | |
| | |
| | |
NH Investment & Securities Co., Ltd. * | | |
| | |
NICE Holdings Co., Ltd. * | | |
| | |
| | |
| | |
| | |
| | |
| | |
| | |
| | |
| | |
| | |
| | |
| | |
| | |
| | |
Samsung Engineering Co., Ltd. * | | |
Samsung Heavy Industries Co., Ltd. * | | |
Samsung Securities Co., Ltd. | | |
| | |
| | |
| | |
Seah Besteel Holdings Corp. | | |
Sebang Global Battery Co., Ltd. | | |
| | |
Seohee Construction Co., Ltd. | | |
Seoul Semiconductor Co., Ltd. * | | |
| | |
| | |
| | |
| | |
| | |
| | |
| | |
| | |
| | |
| | |
| | |
| | |
Songwon Industrial Co., Ltd. | | |
| | |
| | |
Taekwang Industrial Co., Ltd. * | | |
| | |
Tongyang Life Insurance Co., Ltd. * | | |
| | |
| | |
| | |
| | |
| | |
| | |
|
|
| | |
| | |
| | |
CapitaLand Integrated Commercial Trust | | |
CapitaLand Investment Ltd. | | |
| | |
Cromwell European Real Estate Investment Trust | | |
| | |
Frasers Logistics & Commercial Trust | | |
| | |
Hutchison Port Holdings Trust, Class U | | |
Keppel Infrastructure Trust | | |
Manulife US Real Estate Investment Trust | | |
Mapletree Industrial Trust | | |
Mapletree Logistics Trust | | |
Mapletree Pan Asia Commercial Trust | | |
| | |
| | |
| | |
| | |
Sembcorp Marine Ltd. *(b) | | |
| | |
| | |
Singapore Technologies Engineering Ltd. | | |
Suntec Real Estate Investment Trust | | |
| | |
| | |
|
|
Abengoa S.A., B Shares *(b) | | |
| | |
| | |
Atresmedia Corp de Medios de Comunicaion S.A. | | |
| | |
| | |
Cia de Distribucion Integral Logista Holdings S.A. | | |
| | |
Schwab Fundamental Index ETFs | Annual Report95
Schwab Fundamental International Small Company Index ETF
Portfolio Holdings as of February 28, 2023 (continued)
| | |
Construcciones y Auxiliar de Ferrocarriles S.A. | | |
| | |
Ence Energia y Celulosa S.A. | | |
| | |
| | |
| | |
Grupo Catalana Occidente S.A. | | |
| | |
Inmobiliaria Colonial Socimi S.A. | | |
Linea Directa Aseguradora S.A. Cia de Seguros y Reaseguros | | |
Mediaset Espana Comunicacion S.A. * | | |
Melia Hotels International S.A. * | | |
Merlin Properties Socimi S.A. | | |
Obrascon Huarte Lain S.A. *(a) | | |
Prosegur Cia de Seguridad S.A. | | |
| | |
| | |
| | |
| | |
| | |
|
|
| | |
| | |
| | |
| | |
| | |
| | |
| | |
| | |
| | |
| | |
| | |
| | |
| | |
| | |
| | |
| | |
| | |
| | |
| | |
Coor Service Management Holding AB | | |
| | |
| | |
Electrolux Professional AB, B Shares | | |
| | |
| | |
| | |
| | |
Fastighets AB Balder, B Shares * | | |
Fingerprint Cards AB, B Shares *(a) | | |
| | |
| | |
| | |
| | |
Hufvudstaden AB, A Shares | | |
| | |
| | |
Investment AB Latour, B Shares | | |
| | |
| | |
| | |
L E Lundbergfortagen AB, B Shares | | |
| | |
| | |
| | |
| | |
| | |
Modern Times Group MTG AB, B Shares * | | |
| | |
| | |
New Wave Group AB, B Shares | | |
Nibe Industrier AB, B Shares | | |
| | |
| | |
| | |
| | |
| | |
| | |
| | |
Samhallsbyggnadsbolaget i Norden AB (a) | | |
Samhallsbyggnadsbolaget i Norden AB, Class D | | |
| | |
Scandic Hotels Group AB *(a) | | |
| | |
Swedish Orphan Biovitrum AB * | | |
| | |
| | |
Viaplay Group AB, B Shares * | | |
| | |
| | |
| | |
| | |
|
|
| | |
| | |
| | |
| | |
| | |
| | |
Banque Cantonale Vaudoise | | |
| | |
| | |
| | |
Burckhardt Compression Holding AG | | |
| | |
| | |
| | |
| | |
| | |
| | |
| | |
| | |
| | |
| | |
| | |
| | |
| | |
| | |
| | |
| | |
| | |
| | |
| | |
| | |
| | |
| | |
Schweiter Technologies AG | | |
| | |
96Schwab Fundamental Index ETFs | Annual Report
Schwab Fundamental International Small Company Index ETF
Portfolio Holdings as of February 28, 2023 (continued)
| | |
| | |
| | |
St. Galler Kantonalbank AG | | |
| | |
| | |
| | |
| | |
| | |
| | |
| | |
| | |
| | |
| | |
| | |
| | |
|
|
| | |
| | |
| | |
| | |
| | |
| | |
Aston Martin Lagonda Global Holdings plc *(a) | | |
| | |
Babcock International Group plc * | | |
Bank of Georgia Group plc | | |
| | |
| | |
| | |
| | |
| | |
| | |
| | |
| | |
| | |
| | |
| | |
| | |
| | |
| | |
| | |
| | |
| | |
Crest Nicholson Holdings plc | | |
| | |
Dechra Pharmaceuticals plc | | |
| | |
| | |
| | |
Diversified Energy Co., plc | | |
| | |
| | |
| | |
| | |
| | |
| | |
| | |
| | |
| | |
| | |
| | |
| | |
| | |
| | |
| | |
| | |
| | |
| | |
| | |
Great Portland Estates plc | | |
| | |
| | |
| | |
| | |
| | |
| | |
| | |
Hikma Pharmaceuticals plc | | |
| | |
| | |
| | |
| | |
| | |
| | |
| | |
| | |
Intermediate Capital Group plc | | |
| | |
| | |
| | |
| | |
Jupiter Fund Management plc | | |
| | |
| | |
| | |
LondonMetric Property plc | | |
LSL Property Services plc | | |
| | |
| | |
| | |
Mediclinic International plc | | |
Mitchells & Butlers plc * | | |
| | |
Moneysupermarket.com Group plc | | |
Morgan Advanced Materials plc | | |
| | |
National Express Group plc * | | |
| | |
| | |
| | |
| | |
| | |
Paragon Banking Group plc | | |
| | |
| | |
| | |
| | |
| | |
| | |
Primary Health Properties plc | | |
| | |
| | |
| | |
| | |
| | |
| | |
| | |
| | |
| | |
| | |
| | |
| | |
Rolls-Royce Holdings plc * | | |
| | |
Schwab Fundamental Index ETFs | Annual Report97
Schwab Fundamental International Small Company Index ETF
Portfolio Holdings as of February 28, 2023 (continued)
| | |
| | |
Sabre Insurance Group plc | | |
| | |
| | |
| | |
| | |
| | |
| | |
| | |
| | |
| | |
| | |
| | |
Spirax-Sarco Engineering plc | | |
Spire Healthcare Group plc * | | |
Spirent Communications plc | | |
| | |
| | |
| | |
| | |
| | |
The British Land Co., plc | | |
The Restaurant Group plc * | | |
| | |
| | |
| | |
| | |
| | |
| | |
| | |
| | |
| | |
| | |
| | |
Watches of Switzerland Group plc * | | |
| | |
| | |
| | |
| | |
| | |
Total Common Stocks
(Cost $2,771,724,519) | |
|
PREFERRED STOCKS 0.2% OF NET ASSETS |
|
|
Draegerwerk AG & Co. KGaA | | |
| | |
| | |
| | |
|
|
Danieli & C Officine Meccaniche S.p.A. - RSP | | |
Total Preferred Stocks
(Cost $4,784,010) | |
|
| | |
RIGHTS 0.0% OF NET ASSETS |
|
|
Star Entertainment Group Ltd. |
expires 03/13/23, strike HKD 44.20 *(b) | | |
|
|
|
expires 03/16/23, strike SEK 110.00 *(b) | | |
| |
|
WARRANTS 0.0% OF NET ASSETS |
|
|
|
| | |
| |
| | |
SHORT-TERM INVESTMENTS 1.8% OF NET ASSETS |
|
|
State Street Institutional U.S. Government Money Market Fund, Premier Class 4.43% (c) | | |
State Street Institutional U.S. Government Money Market Fund, Premier Class 4.43% (c)(d) | | |
| | |
Total Short-Term Investments
(Cost $50,505,260) | |
Total Investments in Securities
(Cost $2,827,013,789) | |
| | | CURRENT VALUE/
UNREALIZED
DEPRECIATION
($) |
|
| | | |
MSCI EAFE Index, expires 03/17/23 | | | |
| Non-income producing security. |
| All or a portion of this security is on loan. Securities on loan were valued at $47,376,659. |
| Fair valued using significant unobservable inputs (see financial note 2(a), Securities for which no quoted value is available, for additional information). |
| The rate shown is the annualized 7-day yield. |
| Security purchased with cash collateral received for securities on loan. |
98Schwab Fundamental Index ETFs | Annual Report
Schwab Fundamental International Small Company Index ETF
Portfolio Holdings as of February 28, 2023 (continued)
| |
| Real Estate Investment Trust |
| Risparmio (Savings Shares) |
| |
| |
The following is a summary of the inputs used to value the fund’s investments as of February 28, 2023 (see financial note 2(a) for additional information):
| QUOTED PRICES IN
ACTIVE MARKETS FOR
IDENTICAL ASSETS
(LEVEL 1) | OTHER SIGNIFICANT
OBSERVABLE INPUTS
(LEVEL 2) | SIGNIFICANT
UNOBSERVABLE INPUTS
(LEVEL 3) | |
| | | | |
| | | | |
| | | | |
| | | | |
| | | | |
| | | | |
| | | | |
| | | | |
| | | | |
| | | | |
| | | | |
| | | | |
| | | | |
| | | | |
| | | | |
| | | | |
| | | | |
| Level 3 amount shown includes securities determined to have no value at February 28, 2023. |
| As categorized in the Portfolio Holdings. |
| Futures contracts are reported at cumulative unrealized appreciation or depreciation. |
Fund investments in mutual funds are classified as Level 1, without consideration to the classification level of the underlying
securities held by the mutual funds, which could be Level 1, Level 2 or Level 3.
Schwab Fundamental Index ETFs | Annual Report99
Schwab Fundamental International Small Company Index ETF
Statement of Assets and Liabilities
As of February 28, 2023
|
Investments in securities, at value - unaffiliated (cost $2,827,013,789) including securities on loan of $47,376,659 | | |
Foreign currency, at value (cost $1,606,255) | | |
Deposit with broker for futures contracts | | |
| | |
| | |
| | |
| | |
Income from securities on loan | | |
| | |
|
|
Collateral held for securities on loan | | |
| | |
| | |
Variation margin on futures contracts | | |
| | |
| | |
|
|
Capital received from investors | | |
| | |
| | |
100Schwab Fundamental Index ETFs | Annual Report
Schwab Fundamental International Small Company Index ETF
Statement of Operations
For the period March 1, 2022 through February 28, 2023 |
|
Dividends received from securities - unaffiliated (net of foreign withholding tax of $9,221,326) | | |
| | |
| | |
|
|
| | |
| | |
| | |
| | |
| | |
| | |
| | |
|
REALIZED AND UNREALIZED GAINS (LOSSES) |
Net realized losses on sales of securities - unaffiliated | | |
Net realized gains on sales of in-kind redemptions - unaffiliated | | |
Net realized losses on futures contracts | | |
Net realized losses on foreign currency transactions | | |
| | |
Net change in unrealized appreciation (depreciation) on securities - unaffiliated | | |
Net change in unrealized appreciation (depreciation) on futures contracts | | |
Net change in unrealized appreciation (depreciation) on foreign currency translations | | |
Net change in unrealized appreciation (depreciation) | | |
Net realized and unrealized losses | | |
Decrease in net assets resulting from operations | | |
| Proxy fees are non-routine expenses (see financial note 2(e) for additional information). |
| Professional fees associated with the filing of tax claims in the European Union deemed to be non-contingent and non-routine expenses of the fund (see financial notes 2(d) and 4 for additional information). |
Schwab Fundamental Index ETFs | Annual Report101
Schwab Fundamental International Small Company Index ETF
Statement of Changes in Net Assets
For the current and prior report periods
|
| | |
| | | |
Net realized gains (losses) | | | |
Net change in unrealized appreciation (depreciation) | | | |
Increase (decrease) in net assets resulting from operations | | | |
|
DISTRIBUTIONS TO SHAREHOLDERS |
| | | |
TRANSACTIONS IN FUND SHARES |
| | |
| | | | | |
| | | | | |
| | | | | |
Net transactions in fund shares | | | | | |
|
SHARES OUTSTANDING AND NET ASSETS |
| | |
| | | | | |
| | | | | |
| | | | | |
| | | | | |
102Schwab Fundamental Index ETFs | Annual Report
Schwab Fundamental Emerging Markets Large Company Index ETF
Financial Statements
| | | | | | |
|
Net asset value at beginning of period | | | | | | |
Income (loss) from investment operations: | | | | | | |
Net investment income (loss)1 | | | | | | |
Net realized and unrealized gains (losses) | | | | | | |
Total from investment operations | | | | | | |
| | | | | | |
Distributions from net investment income | | | | | | |
| | | | | | |
Net asset value at end of period | | | | | | |
| | | | | | |
|
Ratios to average net assets: | | | | | | |
| | | | | | |
Net investment income (loss) | | | | | | |
| | | | | | |
Net assets, end of period (x 1,000,000) | | | | | | |
| Calculated based on the average shares outstanding during the period. |
| Includes additional variable charges paid by the cash purchasers and redeemers of creation units to the fund to offset the transaction costs of the fund of buying or selling portfolio securities (see financial note 10 for additional information). |
| Ratio includes less than 0.005% of non-routine proxy expenses. |
| Portfolio turnover rate excludes securities received or delivered from processing of in-kind creations or redemptions. |
Schwab Fundamental Index ETFs | Annual Report103
Schwab Fundamental Emerging Markets Large Company Index ETF
Portfolio Holdings as of February 28, 2023
This section shows all the securities in the fund’s portfolio and their values as of the report date.
The fund files its complete schedule of portfolio holdings with the U.S. Securities and Exchange Commission (SEC) for the first and third quarters of each fiscal year on Form N-PORT Part F. The fund’s Form N-PORT Part F is available on the SEC’s website at www.sec.gov. You can also obtain this information at no cost on the fund’s website at www.schwabassetmanagement.com/schwabetfs_prospectus, by calling 1-866-414-6349, or by sending an email request to orders@mysummaryprospectus.com. The fund also makes available its complete schedule of portfolio holdings on a daily basis on the fund’s website.
| | |
COMMON STOCKS 95.9% OF NET ASSETS |
|
|
| | |
B3 S.A. - Brasil Bolsa Balcao | | |
| | |
| | |
| | |
| | |
Centrais Eletricas Brasileiras S.A. | | |
Cia de Saneamento Basico do Estado de Sao Paulo | | |
Cia Paranaense de Energia | | |
| | |
Itau Unibanco Holding S.A. | | |
| | |
| | |
| | |
| | |
| | |
Ultrapar Participacoes S.A. | | |
| | |
| | |
| | |
|
|
| | |
| | |
| | |
| | |
| | |
| | |
|
|
Agile Group Holdings Ltd. * | | |
Agricultural Bank of China Ltd., A Shares | | |
Agricultural Bank of China Ltd., H Shares | | |
Alibaba Group Holding Ltd. * | | |
Aluminum Corp. of China Ltd., A Shares | | |
Aluminum Corp. of China Ltd., H Shares | | |
Anhui Conch Cement Co., Ltd., A Shares | | |
Anhui Conch Cement Co., Ltd., H Shares | | |
BAIC Motor Corp., Ltd., H Shares | | |
| | |
Bank of China Ltd., A Shares | | |
Bank of China Ltd., H Shares | | |
Bank of Communications Co., Ltd., A Shares | | |
| | |
Bank of Communications Co., Ltd., H Shares | | |
Beijing Enterprises Holdings Ltd. | | |
| | |
| | |
China Cinda Asset Management Co., Ltd., H Shares | | |
China CITIC Bank Corp., Ltd., A Shares | | |
China CITIC Bank Corp., Ltd., H Shares | | |
China Communications Services Corp., Ltd., H Shares | | |
China Construction Bank Corp., A Shares | | |
China Construction Bank Corp., H Shares | | |
China Everbright Bank Co., Ltd., A Shares | | |
China Everbright Bank Co., Ltd., H Shares | | |
China Everbright Environment Group Ltd. | | |
China Evergrande Group *(a) | | |
| | |
China Hongqiao Group Ltd. | | |
China Jinmao Holdings Group Ltd. | | |
China Life Insurance Co., Ltd., H Shares | | |
China Mengniu Dairy Co., Ltd. * | | |
China Merchants Bank Co., Ltd., A Shares | | |
China Merchants Bank Co., Ltd., H Shares | | |
China Minsheng Banking Corp., Ltd., A Shares | | |
China Minsheng Banking Corp., Ltd., H Shares | | |
China National Building Material Co., Ltd., H Shares | | |
China Oriental Group Co., Ltd. | | |
China Overseas Land & Investment Ltd. | | |
China Pacific Insurance Group Co., Ltd., A Shares | | |
China Pacific Insurance Group Co., Ltd., H Shares | | |
China Petroleum & Chemical Corp., A Shares | | |
China Petroleum & Chemical Corp., H Shares | | |
China Railway Group Ltd., A Shares | | |
China Railway Group Ltd., H Shares | | |
China Resources Cement Holdings Ltd. | | |
China Resources Land Ltd. | | |
China Resources Pharmaceutical Group Ltd. | | |
104Schwab Fundamental Index ETFs | Annual Report
Schwab Fundamental Emerging Markets Large Company Index ETF
Portfolio Holdings as of February 28, 2023 (continued)
| | |
China Resources Power Holdings Co., Ltd. | | |
China Shenhua Energy Co., Ltd., A Shares | | |
China Shenhua Energy Co., Ltd., H Shares | | |
China State Construction Engineering Corp., Ltd., A Shares | | |
China Taiping Insurance Holdings Co., Ltd. | | |
China Tower Corp., Ltd., H Shares | | |
China United Network Communications Ltd., A Shares | | |
China Vanke Co., Ltd., A Shares | | |
China Vanke Co., Ltd., H Shares | | |
| | |
Country Garden Holdings Co., Ltd. | | |
CRRC Corp., Ltd., A Shares | | |
CRRC Corp., Ltd., H Shares | | |
CSPC Pharmaceutical Group Ltd. | | |
Dongfeng Motor Group Co., Ltd., H Shares | | |
| | |
| | |
Geely Automobile Holdings Ltd. | | |
Guangzhou R&F Properties Co., Ltd., H Shares *(b) | | |
Haier Smart Home Co., Ltd., A Shares | | |
Haier Smart Home Co., Ltd., H Shares | | |
Hengan International Group Co., Ltd. | | |
Huaneng Power International, Inc., A Shares * | | |
Huaneng Power International, Inc., H Shares * | | |
Industrial & Commercial Bank of China Ltd., A Shares | | |
Industrial & Commercial Bank of China Ltd., H Shares | | |
Industrial Bank Co., Ltd., A Shares | | |
| | |
Jiangxi Copper Co., Ltd., A Shares | | |
Jiangxi Copper Co., Ltd., H Shares | | |
| | |
| | |
Legend Holdings Corp., H Shares | | |
Longfor Group Holdings Ltd. | | |
| | |
| | |
Nine Dragons Paper Holdings Ltd. | | |
PetroChina Co., Ltd., H Shares | | |
PICC Property & Casualty Co., Ltd., H Shares | | |
Ping An Insurance Group Co. of China Ltd., A Shares | | |
Ping An Insurance Group Co. of China Ltd., H Shares | | |
Postal Savings Bank of China Co., Ltd., A Shares | | |
Postal Savings Bank of China Co., Ltd., H Shares | | |
SAIC Motor Corp., Ltd., A Shares | | |
Shanghai Pharmaceuticals Holding Co., Ltd., A Shares | | |
Shanghai Pharmaceuticals Holding Co., Ltd., H Shares | | |
Shanghai Pudong Development Bank Co., Ltd., A Shares | | |
| | |
Shenzhou International Group Holdings Ltd. | | |
Sinopharm Group Co., Ltd., H Shares | | |
| | |
Tingyi Cayman Islands Holding Corp. | | |
Trip.com Group Ltd., ADR * | | |
Vipshop Holdings Ltd., ADR * | | |
Weichai Power Co., Ltd., A Shares | | |
Weichai Power Co., Ltd., H Shares | | |
| | |
Yankuang Energy Group Co., Ltd., A Shares | | |
Yankuang Energy Group Co., Ltd., H Shares | | |
| | |
Zhongsheng Group Holdings Ltd. | | |
Zijin Mining Group Co., Ltd., A Shares | | |
Zijin Mining Group Co., Ltd., H Shares | | |
| | |
|
|
| | |
| | |
| | |
|
|
| | |
|
|
Commercial International Bank Egypt S.A.E., GDR | | |
|
|
Alpha Services and Holdings S.A. * | | |
Eurobank Ergasias Services & Holdings S.A., A Shares * | | |
Hellenic Telecommunications Organization S.A. | | |
| | |
|
|
MOL Hungarian Oil & Gas plc | | |
| | |
| | |
|
|
| | |
Bharat Petroleum Corp., Ltd. | | |
| | |
| | |
| | |
| | |
| | |
| | |
| | |
Hindustan Petroleum Corp., Ltd. | | |
| | |
Housing Development Finance Corp., Ltd. | | |
| | |
| | |
| | |
Schwab Fundamental Index ETFs | Annual Report105
Schwab Fundamental Emerging Markets Large Company Index ETF
Portfolio Holdings as of February 28, 2023 (continued)
| | |
| | |
| | |
| | |
| | |
| | |
| | |
Oil & Natural Gas Corp., Ltd. | | |
Power Finance Corp., Ltd. | | |
Power Grid Corp. of India Ltd. | | |
| | |
| | |
| | |
Sun Pharmaceutical Industries Ltd. | | |
Tata Consultancy Services Ltd. | | |
| | |
Tata Motors Ltd., A Shares, DVR * | | |
| | |
| | |
| | |
| | |
| | |
|
|
PT Astra International Tbk | | |
| | |
PT Bank Mandiri (Persero) Tbk | | |
PT Bank Negara Indonesia (Persero) Tbk | | |
PT Bank Rakyat Indonesia (Persero) Tbk | | |
PT Telkom Indonesia (Persero) Tbk | | |
| | |
| | |
|
|
Kuwait Finance House KSCP | | |
Mobile Telecommunications Co. KSCP | | |
National Bank of Kuwait SAKP | | |
| | |
|
|
| | |
CIMB Group Holdings Berhad | | |
| | |
| | |
Petronas Chemicals Group Berhad | | |
| | |
| | |
| | |
|
|
Alfa S.A.B. de C.V., A Shares | | |
America Movil S.A.B. de C.V., Series L | | |
| | |
Fomento Economico Mexicano S.A.B. de C.V. | | |
Grupo Bimbo S.A.B. de C.V., Series A | | |
Grupo Financiero Banorte S.A.B. de C.V., O Shares | | |
Grupo Mexico S.A.B. de C.V., Series B | | |
Grupo Televisa S.A.B., Series CPO | | |
| | |
Orbia Advance Corp. S.A.B. de C.V. | | |
Sitios Latinoamerica S.A.B. de C.V. * | | |
| | |
Wal-Mart de Mexico S.A.B. de C.V. | | |
| | |
|
|
| | |
| | |
| | |
| | |
|
|
| | |
Federal Grid Co. Unified Energy System PJSC *(a)(c) | | |
| | |
Inter RAO UES PJSC *(a)(c) | | |
| | |
| | |
MMC Norilsk Nickel PJSC *(a)(c) | | |
Mobile TeleSystems PJSC *(a)(c) | | |
| | |
Novolipetsk Steel PJSC *(a)(c) | | |
Rosneft Oil Co. PJSC *(a)(c) | | |
Sberbank of Russia PJSC *(a)(c) | | |
| | |
| | |
| | |
| | |
|
|
| | |
| | |
| | |
| | |
Saudi Basic Industries Corp. | | |
| | |
| | |
| | |
| | |
|
|
| | |
| | |
Aspen Pharmacare Holdings Ltd. | | |
| | |
| | |
| | |
| | |
| | |
Impala Platinum Holdings Ltd. | | |
| | |
| | |
| | |
| | |
| | |
| | |
| | |
| | |
| | |
| | |
| | |
| | |
| | |
106Schwab Fundamental Index ETFs | Annual Report
Schwab Fundamental Emerging Markets Large Company Index ETF
Portfolio Holdings as of February 28, 2023 (continued)
| | |
| | |
| | |
|
|
| | |
ASE Technology Holding Co., Ltd. | | |
| | |
| | |
| | |
Catcher Technology Co., Ltd. | | |
Cathay Financial Holding Co., Ltd. | | |
Chailease Holding Co., Ltd. | | |
Cheng Shin Rubber Industry Co., Ltd. | | |
China Development Financial Holding Corp. | | |
| | |
Chunghwa Telecom Co., Ltd. | | |
| | |
CTBC Financial Holding Co., Ltd. | | |
| | |
E.Sun Financial Holding Co., Ltd. | | |
Far Eastern New Century Corp. | | |
Far EasTone Telecommunications Co., Ltd. | | |
First Financial Holding Co., Ltd. | | |
Formosa Chemicals & Fibre Corp. | | |
Formosa Petrochemical Corp. | | |
| | |
Foxconn Technology Co., Ltd. | | |
Fubon Financial Holding Co., Ltd. | | |
Hon Hai Precision Industry Co., Ltd. | | |
| | |
| | |
| | |
Largan Precision Co., Ltd. | | |
| | |
| | |
Mega Financial Holding Co., Ltd. | | |
Micro-Star International Co., Ltd. | | |
| | |
Novatek Microelectronics Corp. | | |
| | |
| | |
Powertech Technology, Inc. | | |
President Chain Store Corp. | | |
| | |
Shin Kong Financial Holding Co., Ltd. | | |
Synnex Technology International Corp. | | |
| | |
Taiwan Cooperative Financial Holding Co., Ltd. | | |
| | |
Taiwan Semiconductor Manufacturing Co., Ltd. | | |
Uni-President Enterprises Corp. | | |
United Microelectronics Corp. * | | |
| | |
| | |
| | |
| | |
Yuanta Financial Holding Co., Ltd. | | |
| | |
|
|
Advanced Info Service PCL NVDR | | |
| | |
| | |
Charoen Pokphand Foods PCL NVDR | | |
| | |
| | |
PTT Exploration & Production PCL NVDR | | |
PTT Global Chemical PCL NVDR | | |
| | |
| | |
| | |
| | |
| | |
|
|
| | |
BIM Birlesik Magazalar A/S | | |
Eregli Demir ve Celik Fabrikalari T.A.S. | | |
Haci Omer Sabanci Holding A/S | | |
| | |
| | |
Turkcell Iletisim Hizmetleri A/S | | |
Turkiye Garanti Bankasi A/S | | |
Turkiye Is Bankasi A/S, Class C | | |
Turkiye Petrol Rafinerileri A/S * | | |
| | |
|
United Arab Emirates 1.1% |
Abu Dhabi Commercial Bank PJSC | | |
| | |
| | |
Emirates Telecommunications Group Co. PJSC | | |
First Abu Dhabi Bank PJSC | | |
| | |
Total Common Stocks
(Cost $4,071,630,332) | |
|
PREFERRED STOCKS 3.8% OF NET ASSETS |
|
|
| | |
Centrais Eletricas Brasileiras S.A., B Shares | | |
Cia Energetica de Minas Gerais | | |
Cia Paranaense de Energia, B Shares | | |
| | |
Itau Unibanco Holding S.A. | | |
| | |
| | |
| | |
|
|
| | |
|
|
Surgutneftegas PJSC *(a)(c) | | |
| | |
| | |
| | |
Total Preferred Stocks
(Cost $162,240,261) | |
Schwab Fundamental Index ETFs | Annual Report107
Schwab Fundamental Emerging Markets Large Company Index ETF
Portfolio Holdings as of February 28, 2023 (continued)
| | |
SHORT-TERM INVESTMENTS 0.4% OF NET ASSETS |
|
|
State Street Institutional U.S. Government Money Market Fund, Premier Class 4.43% (d) | | |
State Street Institutional U.S. Government Money Market Fund, Premier Class 4.43% (d)(e) | | |
| | |
Total Short-Term Investments
(Cost $18,200,221) | |
Total Investments in Securities
(Cost $4,252,070,814) | |
| | | CURRENT VALUE/
UNREALIZED
DEPRECIATION
($) |
|
| | | |
MSCI Emerging Markets Index, expires 03/17/23 | | | |
| Non-income producing security. |
| Fair valued using significant unobservable inputs (see financial note 2(a), Securities for which no quoted value is available, for additional information). |
| All or a portion of this security is on loan. Securities on loan were valued at $4,872,771. |
| Trading in Russian securities listed on the Moscow Exchange, Russian ADRs, and Russian GDRs are subject to trade restrictions; and therefore, the ability of the fund to buy these securities is currently not permitted, and the ability of the fund to sell these securities is uncertain. |
| The rate shown is the annualized 7-day yield. |
| Security purchased with cash collateral received for securities on loan. |
| American Depositary Receipt |
| Differential Voting Rights |
| Global Depositary Receipt |
| Non-Voting Depositary Receipt |
The following is a summary of the inputs used to value the fund’s investments as of February 28, 2023 (see financial note 2(a) for additional information):
| QUOTED PRICES IN
ACTIVE MARKETS FOR
IDENTICAL ASSETS
(LEVEL 1) | OTHER SIGNIFICANT
OBSERVABLE INPUTS
(LEVEL 2) | SIGNIFICANT
UNOBSERVABLE INPUTS
(LEVEL 3) | |
| | | | |
| | | | |
| | | | |
| | | | |
| | | | |
| | | | |
| | | | |
| | | | |
| | | | |
| | | | |
| As categorized in the Portfolio Holdings. |
| Futures contracts are reported at cumulative unrealized appreciation or depreciation. |
Fund investments in mutual funds are classified as Level 1, without consideration to the classification level of the underlying
securities held by the mutual funds, which could be Level 1, Level 2 or Level 3.
108Schwab Fundamental Index ETFs | Annual Report
Schwab Fundamental Emerging Markets Large Company Index ETF
Statement of Assets and Liabilities
As of February 28, 2023
|
Investments in securities, at value - unaffiliated (cost $4,252,070,814) including securities on loan of $4,872,771 | | |
Foreign currency, at value (cost $3,551,278) | | |
Deposit with broker for futures contracts | | |
| | |
| | |
Income from securities on loan | | |
| | |
|
|
Collateral held for securities on loan | | |
| | |
Foreign capital gains tax | | |
| | |
| | |
Variation margin on futures contracts | | |
| | |
| | |
|
|
Capital received from investors | | |
| | |
| | |
Schwab Fundamental Index ETFs | Annual Report109
Schwab Fundamental Emerging Markets Large Company Index ETF
Statement of Operations
For the period March 1, 2022 through February 28, 2023 |
|
Dividends received from securities - unaffiliated (net of foreign withholding tax of $28,051,268) | | |
| | |
| | |
|
|
| | |
| | |
| | |
| | |
|
REALIZED AND UNREALIZED GAINS (LOSSES) |
Net realized losses on sales of securities - unaffiliated (net of foreign capital gains tax paid of $5,425,250) | | |
Net realized gains on sales of in-kind redemptions - unaffiliated | | |
Net realized losses on futures contracts | | |
Net realized losses on foreign currency transactions | | |
| | |
Net change in unrealized appreciation (depreciation) on securities - unaffiliated (net of change in foreign capital gains tax of $5,120,214) | | |
Net change in unrealized appreciation (depreciation) on futures contracts | | |
Net change in unrealized appreciation (depreciation) on foreign currency translations | | |
Net change in unrealized appreciation (depreciation) | | |
Net realized and unrealized losses | | |
Decrease in net assets resulting from operations | | |
| Proxy fees are non-routine expenses (see financial note 2(e) for additional information). |
110Schwab Fundamental Index ETFs | Annual Report
Schwab Fundamental Emerging Markets Large Company Index ETF
Statement of Changes in Net Assets
For the current and prior report periods
|
| | |
| | | |
Net realized gains (losses) | | | |
Net change in unrealized appreciation (depreciation) | | | |
Increase (decrease) in net assets resulting from operations | | | |
|
DISTRIBUTIONS TO SHAREHOLDERS |
| | | |
TRANSACTIONS IN FUND SHARES |
| | |
| | | | | |
| | | | | |
| | | | | |
| | | | | |
Net transactions in fund shares | | | | | |
|
SHARES OUTSTANDING AND NET ASSETS |
| | |
| | | | | |
| | | | | |
Total increase (decrease) | | | | | |
| | | | | |
Schwab Fundamental Index ETFs | Annual Report111
Schwab Fundamental Index ETFs
1. Business Structure of the Funds:
Each of the funds in this report is a series of Schwab Strategic Trust (the trust), a no-load, open-end management investment company. The trust is organized as a Delaware statutory trust and is registered under the Investment Company Act of 1940, as amended (the 1940 Act). The list below shows all the operational funds in the trust as of the end of the period, including the funds discussed in this report, which are highlighted:
SCHWAB STRATEGIC TRUST (ORGANIZED JANUARY 27, 2009) |
Schwab Fundamental U.S. Broad Market Index ETF | |
Schwab Fundamental U.S. Large Company Index ETF | Schwab International Dividend Equity ETF |
Schwab Fundamental U.S. Small Company Index ETF | Schwab International Equity ETF |
Schwab Fundamental International Large Company Index ETF | Schwab International Small-Cap Equity ETF |
Schwab Fundamental International Small Company Index ETF | Schwab Emerging Markets Equity ETF |
Schwab Fundamental Emerging Markets Large Company Index ETF | |
Schwab U.S. Broad Market ETF | Schwab Short-Term U.S. Treasury ETF |
| Schwab Intermediate-Term U.S. Treasury ETF |
Schwab U.S. Large-Cap ETF | Schwab Long-Term U.S. Treasury ETF |
Schwab U.S. Large-Cap Growth ETF | Schwab U.S. Aggregate Bond ETF |
Schwab U.S. Large-Cap Value ETF | Schwab 1-5 Year Corporate Bond ETF |
| Schwab 5-10 Year Corporate Bond ETF |
Schwab U.S. Small-Cap ETF | |
Schwab U.S. Dividend Equity ETF | Schwab Crypto Thematic ETF |
Schwab Municipal Bond ETF | |
The funds issue and redeem shares at their net asset value per share (NAV) only in large blocks of shares (Creation Units). These transactions are usually in exchange for a basket of securities and/or an amount of cash. As a practical matter, only institutional investors who have entered into an authorized participant agreement purchase or redeem Creation Units. Except when aggregated in Creation Units, shares of the funds are not redeemable securities.
Individual shares of the funds trade on national securities exchanges and elsewhere during the trading day and can only be bought and sold at market prices throughout the trading day through a broker-dealer. Because fund shares trade at market prices rather than NAV, shares may trade at a price greater than NAV (premium) or less than NAV (discount). A chart showing the frequency at which each fund’s daily closing market price was at a discount or premium to each fund’s NAV can be found at www.schwabassetmanagement.com
Each fund maintains its own account for purposes of holding assets and accounting, and is considered a separate entity for tax purposes. Within its account, each fund may also keep certain assets in segregated accounts, as required by securities law. The “Fund Complex” includes The Charles Schwab Family of Funds, Schwab Capital Trust, Schwab Investments, Schwab Annuity Portfolios, Schwab Strategic Trust and Laudus Trust.
2. Significant Accounting Policies:The following is a summary of the significant accounting policies the funds use in their preparation of financial statements. The funds follow the investment company accounting and reporting guidance of the Financial Accounting Standards Board (FASB) Accounting Standard Codification Topic 946 Financial Services — Investment Companies. The accounting policies are in conformity with accounting principles generally accepted in the United States of America (GAAP).
The funds may invest in certain mutual funds and exchange-traded funds (ETFs) which are referred to as “underlying funds”. For more information about the underlying funds’ operations and policies, please refer to those funds’ semiannual and annual reports, which are filed with the U.S. Securities and Exchange Commission (SEC) and available on the SEC’s website at www.sec.gov
(a) Security Valuation:
Pursuant to Rule 2a-5 under the 1940 Act, the Board of Trustees (the Board) has designated authority to a Valuation Designee, the funds’ investment adviser, to make fair valuation determinations under adopted procedures, subject to Board oversight. The investment adviser has formed a Pricing Committee to administer the pricing and valuation of portfolio securities and other assets and liabilities as well as to ensure that prices used for internal purposes or provided by third parties reasonably reflect fair value. The Valuation Designee may utilize independent pricing services, quotations from securities and financial instrument dealers and other market sources to determine fair value.
112Schwab Fundamental Index ETFs | Annual Report
Schwab Fundamental Index ETFs
Financial Notes (continued)
2. Significant Accounting Policies (continued):
Securities held in the funds’ portfolio are valued every business day. The following valuation policies and procedures are used by the Valuation Designee to value various types of securities:
• Securities traded on an exchange or over-the-counter: Traded securities are valued at the closing value for the day, or, on days when no closing value has been reported, at the mean of the most recent bid and ask quotes. Securities that are primarily traded on foreign exchanges are valued at the official closing price or the last sales price on the exchange where the securities are principally traded with these values then translated into U.S. dollars at the current exchange rate, unless these securities are fair valued as discussed below.
• Futures contracts: Futures contracts are valued at their settlement prices as of the close of their exchanges.
• Mutual funds: Mutual funds are valued at their respective NAVs.
• Securities for which no quoted value is available: The Valuation Designee has adopted procedures to fair value a fund’s securities when market prices are not “readily available” or are unreliable. For example, a security may be fair valued when it’s de-listed or its trading is halted or suspended; when a security’s primary pricing source is unable or unwilling to provide a price; or when a security’s primary trading market is closed during regular market hours. Fair value determinations are made in good faith in accordance with adopted valuation procedures. The Valuation Designee considers a number of factors, including unobservable market inputs, when arriving at fair value. The Valuation Designee may employ methods such as the review of related or comparable assets or liabilities, related market activities, recent transactions, market multiples, book values, transactional back-testing, disposition analysis and other relevant information. Due to the subjective and variable nature of fair value pricing, there can be no assurance that a fund could obtain the fair value assigned to the security upon the sale of such security.
In accordance with the authoritative guidance on fair value measurements and disclosures under GAAP, the funds disclose the fair value of their investments in a hierarchy that prioritizes the significant inputs to valuation methods used to measure the fair value. The hierarchy gives the highest priority to valuations based upon unadjusted quoted prices in active markets for identical assets or liabilities (Level 1 measurements) and the lowest priority to valuations based upon unobservable inputs that are significant to the valuation (Level 3 measurements). If inputs used to measure the financial instruments fall within different levels of the hierarchy, the categorization is based on the lowest level input that is significant to the valuation. If it is determined that either the volume and/or level of activity for an asset or liability has significantly decreased (from normal conditions for that asset or liability) or price quotations or observable inputs are not associated with orderly transactions, increased analysis and the Valuation Designee’s judgment will be required to estimate fair value.
• Level 1 — quoted prices in active markets for identical investments - Investments whose values are based on quoted market prices in active markets. These generally include active listed equities, mutual funds, ETFs and futures contracts. Mutual funds and ETFs are classified as Level 1 prices, without consideration to the classification level of the underlying securities held.
• Level 2 — other significant observable inputs (including quoted prices for similar securities, interest rates, prepayment speeds, credit risk, etc.) — Investments that trade in markets that are not considered to be active, but whose values are based on quoted market prices, dealer quotations or valuations provided by alternative pricing sources supported by observable inputs are classified as Level 2 prices. These generally include U.S. government and sovereign obligations, most government agency securities, investment-grade corporate bonds, certain mortgage products, less liquid listed equities, and state, municipal and provincial obligations.
• Level 3 — significant unobservable inputs (including the Valuation Designee’s assumptions in determining the fair value of investments) — Investments whose values are classified as Level 3 prices have significant unobservable inputs, as they may trade infrequently or not at all. When observable prices are not readily available for these securities, one or more valuation methods are used for which sufficient and reliable data is available. The inputs used in estimating the value of Level 3 prices may include the original transaction price, quoted prices for similar securities or assets in active markets, completed or pending third-party transactions in the underlying investment or comparable issuers, and changes in financial ratios or cash flows. Level 3 prices may also be adjusted to reflect illiquidity and/or non-transferability, with the amount of such discount estimated in the absence of market information. Assumptions used due to the lack of observable inputs may significantly impact the resulting fair value and therefore a fund’s results of operations.
The inputs or methodology used for valuing securities are not necessarily an indication of the risk associated with investing in those securities.
The levels associated with valuing the funds’ investments as of February 28, 2023, are disclosed in the Portfolio Holdings.
Schwab Fundamental Index ETFs | Annual Report113
Schwab Fundamental Index ETFs
Financial Notes (continued)
2. Significant Accounting Policies (continued):
(b) Accounting Policies for certain Portfolio Investments (if held):
Futures Contracts: Futures contracts are instruments that represent an agreement between two parties that obligates one party to buy, and the other party to sell, specific instruments at an agreed upon price on a stipulated future date. A fund must give the broker a deposit of cash and/or securities (initial margin) whenever it enters into a futures contract. The amount of the deposit may vary from one contract to another. Subsequent payments (variation margin) are made or received by a fund depending on the daily fluctuations in the value of the futures contract and are accounted for as unrealized appreciation or depreciation until the contract is closed, at which time the gains or losses are realized. Futures contracts are traded publicly on exchanges, and their value may change daily.
Securities Lending: Under the trust’s Securities Lending Program, a fund (lender) may make short-term loans of its securities to another party (borrower) to generate additional revenue for the fund. The borrower pledges collateral in the form of cash, securities issued or fully guaranteed by the U.S. government or foreign governments, or letters of credit issued by a bank. Collateral at the individual loan level is required to be maintained on a daily marked-to-market basis in an amount at least equal to the current value of the securities loaned. The lending agent provides a fund with indemnification against borrower default (the borrower fails to return the security on loan) reducing the risk of loss as a result of default. The cash collateral of securities loaned is currently invested in money market portfolios operating pursuant to Rule 2a-7 under the 1940 Act. Each fund bears the risk of loss with respect to the investment of cash collateral. The terms of the securities lending agreement allow the funds or the lending agent to terminate any loan at any given time and the securities must be returned within the earlier of the standard trade settlement period or the specified time period under the relevant securities lending agreement. Securities lending income, as disclosed in each fund’s Statement of Operations, if applicable, represents the income earned from the investment of the cash collateral plus any fees paid by borrowers, less the fees paid to the lending agent and broker rebates which are subject to adjustments pursuant to the securities lending agreement. On loans not collateralized by cash, a fee is received from the borrower, and is allocated between a fund and the lending agent. The aggregate fair value of securities loaned will not at any time exceed one-third of the total assets of a fund, including collateral received from the loan. Securities lending fees paid to the unaffiliated lending agents start at 9% of gross lending revenue, with subsequent breakpoints to a low of 5%. In this context, the gross lending revenue equals the income received from the investment of cash collateral and fees paid by borrowers less any rebates paid to the borrowers. Any expenses charged by the cash collateral fund are in addition to these fees. All remaining revenue is retained by the fund, as applicable. No portion of lending revenue is paid to or retained by the investment adviser or any of its affiliates.
As of February 28, 2023, Schwab Fundamental U.S. Broad Market Index ETF, Schwab Fundamental U.S. Large Company Index ETF, Schwab Fundamental U.S. Small Company Index ETF, Schwab Fundamental International Large Company Index ETF, Schwab Fundamental International Small Company Index ETF and Schwab Fundamental Emerging Markets Large Company Index ETF had securities on loan, all of which were classified as common stocks, rights and warrants. The value of the securities on loan and the related collateral as of February 28, 2023 are disclosed in each fund’s Portfolio Holdings and Statement of Assets and Liabilities.
Passive Foreign Investment Companies: Certain funds may own shares in certain foreign corporations that meet the Internal Revenue Code definition of a passive foreign investment company (PFIC). The funds may elect for tax purposes to mark-to-market annually the shares of each PFIC lot held and would be required to distribute as ordinary income to shareholders any such marked-to-market gains (as well as any gains realized on sale).
Central Securities Depositories Regulation: The Central Securities Depositories Regulation (CSDR) introduced measures for the authorization and supervision of European Union Central Security Depositories and created a common set of prudential, organizational, and conduct of business standards at a European level. CSDR is designed to support securities settlement and operational aspects of securities settlement, including the provision of shorter settlement periods; mandatory buy-ins; and cash penalties, to prevent and address settlement fails. CSDR measures are aimed to prevent settlement fails by ensuring that all transaction details are provided to facilitate settlement, as well as further incentivizing timely settlement by imposing cash penalty fines and buy-ins. The Schwab Fundamental International Large Company Index ETF, Schwab Fundamental International Small Company Index ETF and Schwab Fundamental Emerging Markets Large Company Index ETF may be subject to pay cash penalties and may also receive cash penalties with certain counterparties in instances where there are settlement fails. These cash penalties are included in net realized gains (losses) on sales of securities in each fund’s Statement of Operations, if any.
(c) Security Transactions:
Security transactions are recorded as of the date the order to buy or sell the security is executed. Realized gains and losses from security transactions are based on the identified costs of the securities involved.
114Schwab Fundamental Index ETFs | Annual Report
Schwab Fundamental Index ETFs
Financial Notes (continued)
2. Significant Accounting Policies (continued):
Assets and liabilities denominated in foreign currencies are reported in U.S. dollars. For assets and liabilities held on a given date, the dollar value is based on market exchange rates in effect on that date. Transactions involving foreign currencies, including purchases, sales, income receipts and expense payments, are calculated using exchange rates in effect on the transaction date. Realized foreign exchange gains or losses arise from sales of foreign currencies, currency gains or losses realized between the trade and settlement dates on securities transactions and the difference between the recorded amounts of dividends, interest, and foreign withholding taxes and the U.S. dollar equivalent of the amounts actually received or paid. Net unrealized foreign exchange appreciation or depreciation arises from changes in foreign exchange rates on foreign denominated assets and liabilities other than investments in securities held at the end of the reporting period. These realized and unrealized foreign exchange gains or losses are reported in foreign currency transactions or translations in the Statement of Operations. The funds do not isolate the portion of the fluctuations on investments resulting from changes in foreign currency exchange rates from the fluctuations in market prices of investments held. Such fluctuations are included with the net realized and unrealized gain or loss from investments.
Gains realized by the funds on the sale of securities in certain foreign countries may be subject to non-U.S. taxes. In those instances, the funds record a liability based on unrealized gains to provide for potential non-U.S. taxes payable upon the sale of these securities.
When a fund closes out a futures contract position, it calculates the difference between the value of the position at the beginning and at the end of the contract, and records a realized gain or loss accordingly.
(d) Investment Income:
Interest income is recorded as it accrues. Dividends, in the form of cash or non-cash income such as in the form of additional securities, and distributions from portfolio securities and underlying funds are recorded on the date they are effective (the ex-dividend date), although the funds record certain foreign security dividends on the date the ex-dividend is confirmed. Any distributions from underlying funds are recorded in accordance with the character of the distributions as designated by the underlying funds.
Income received from foreign sources may result in withholding tax. Withholding taxes are accrued at the same time as the related income if the tax rate is fixed and known, unless a tax withheld is reclaimable from the local tax authorities in which case it is recorded as receivable. If the tax rate is not known or estimable, such expense or reclaim receivable is recorded when the net proceeds are received.
The Schwab Fundamental International Large Company Index ETF and Schwab Fundamental International Small Company Index ETF filed claims to recover taxes previously withheld in certain European Union countries on the basis that those countries had purportedly violated certain provisions in the Treaty on the Functioning of the European Union. These filings are subject to various administrative and judicial proceedings within these countries, and all professional fees associated with these filings have been paid by the investment adviser. The professional fees are non-contingent and non-routine fees which are subject to repayment to the investment adviser (see financial note 4 for additional information).
(e) Expenses:
Pursuant to the Amended and Restated Advisory Agreement (Advisory Agreement) between the investment adviser and the trust, the investment adviser will pay the operating expenses of each fund, excluding taxes, any brokerage expenses, and extraordinary or non-routine expenses. Taxes, any brokerage expenses and extraordinary or non-routine expenses that are specific to a fund are charged directly to the fund. The Advisory Agreement excludes paying acquired fund fees and expenses, which are indirect expenses incurred by a fund through its investments in underlying funds.
(f) Distributions to Shareholders:
Schwab Fundamental U.S. Broad Market Index ETF, Schwab Fundamental U.S. Large Company Index ETF, and Schwab Fundamental U.S. Small Company Index ETF make distributions from net investment income, if any, quarterly. Schwab Fundamental International Large Company Index ETF, Schwab Fundamental International Small Company Index ETF, and Schwab Fundamental Emerging Markets Large Company Index ETF make distributions from net investment income, if any, semiannually. All funds make distributions from net realized capital gains, if any, once a year. To receive a distribution, you must be a registered shareholder on the record date. Distributions are paid to shareholders on the payable date.
Schwab Fundamental Index ETFs | Annual Report115
Schwab Fundamental Index ETFs
Financial Notes (continued)
2. Significant Accounting Policies (continued):
(g) Accounting Estimates:
The accounting policies described in this report conform to GAAP. Notwithstanding this, shareholders should understand that in order to follow these principles, fund management has to make estimates and assumptions that affect the information reported in the financial statements. It’s possible that once the results are known, they may turn out to be different from these estimates and these differences may be material.
(h) Federal Income Taxes:
The funds intend to meet federal income and excise tax requirements for regulated investment companies under subchapter M of the Internal Revenue Code, as amended. Accordingly, the funds distribute substantially all of their net investment income and net realized capital gains, if any, to their respective shareholders each year. As long as a fund meets the tax requirements, it is not required to pay federal income tax.
(i) Foreign Taxes:
The funds may be subject to foreign taxes (a portion of which may be reclaimable) on income, corporate events, foreign currency exchanges and capital gains on investments. All foreign taxes are recorded in accordance with the applicable foreign tax regulations and rates that exist in foreign markets in which the funds invest. These foreign taxes, if any, are paid by the funds and are disclosed in the Statement of Operations. Foreign taxes accrued as of February 28, 2023, if any, are reflected in each fund’s Statement of Assets and Liabilities.
(j) Indemnification:
Under the funds’ organizational documents, the officers and trustees are indemnified against certain liabilities arising out of the performance of their duties to the funds. In addition, in the normal course of business the funds enter into contracts with their vendors and others that provide general indemnifications. The funds’ maximum exposure under these arrangements is unknown as this would involve future claims that may be made against the funds. However, based on experience, the funds expect the risk of loss attributable to these arrangements to be remote.
(k) Regulatory Update:
Effective January 24, 2023, the SEC adopted rule and form amendments to require mutual funds and ETFs to transmit concise and visually engaging streamlined annual and semiannual reports to shareholders that highlight key information deemed important for retail investors to assess and monitor their fund investments. Other information, including financial statements, will no longer appear in a streamlined shareholder report but must be available online, delivered free of charge upon request, and filed on a semiannual basis on Form N-CSR. The rule and form amendments have a compliance date of July 24, 2024. At this time, management is evaluating the impact of these rule and form amendment changes on the content of the current shareholder report and the newly created annual and semiannual streamlined shareholder reports.
3. Risk Factors:Investing in the funds may involve certain risks, as discussed in the funds’ prospectus, including, but not limited to, those described below. Any of these risks could cause an investor to lose money.
Market Risk. Financial markets rise and fall in response to a variety of factors, sometimes rapidly and unpredictably. Markets may be impacted by economic, political, regulatory and other conditions, including economic sanctions and other government actions. In addition, the occurrence of global events, such as war, terrorism, environmental disasters, natural disasters and epidemics, may also negatively affect the financial markets. As with any investment whose performance is tied to these markets, the value of an investment in a fund will fluctuate, which means that an investor could lose money over short or long periods.
Investment Style Risk. The funds are index funds. Therefore, each fund follows their respective securities included in the index during upturns as well as downturns. Because of their indexing strategies, the funds do not take steps to reduce market exposure or to lessen the effects of a declining market. In addition, because of the funds’ expenses, the funds’ performance may be below that of their respective index. Errors relating to an index may occur from time to time and may not be identified by the index provider for a period of time. In addition, market disruptions could cause delays in an index’s rebalancing schedule. Such errors and/or market disruptions may result in losses for a fund.
116Schwab Fundamental Index ETFs | Annual Report
Schwab Fundamental Index ETFs
Financial Notes (continued)
3. Risk Factors (continued):
Equity Risk. The prices of equity securities rise and fall daily. These price movements may result from factors affecting individual companies, industries or the securities market as a whole. In addition, equity markets tend to move in cycles, which may cause stock prices to fall over short or extended periods of time.
Market Capitalization Risk. Securities issued by companies of different market capitalizations tend to go in and out of favor based on market and economic conditions. During a period when securities of a particular market capitalization fall behind other types of investments, a fund’s performance could be impacted.
Large-Cap Company Risk. Certain funds invest in large-cap company stocks. Large-cap companies are generally more mature and the securities issued by these companies may not be able to reach the same levels of growth as the securities issued by small- or mid-cap companies.
Mid-Cap Company Risk. Certain funds invest in mid-cap company stocks. Mid-cap companies may be more vulnerable to adverse business or economic events than larger, more established companies and the value of securities issued by these companies may move sharply.
Small-Cap Company Risk. Certain funds invest in small-cap company stocks. Securities issued by small-cap companies may be riskier than those issued by larger companies, and their prices may move sharply, especially during market upturns and downturns.
Foreign Investment Risk. A fund’s investments in securities of foreign issuers involve certain risks that may be greater than those associated with investments in securities of U.S. issuers. These include risks of adverse changes in foreign economic, political, regulatory and other conditions; changes in currency exchange rates or exchange control regulations (including limitations on currency movements and exchanges); the imposition of economic sanctions or other government restrictions; differing accounting, auditing, financial reporting and legal standards and practices; differing securities market structures; and higher transaction costs. These risks may negatively impact the value or liquidity of a fund’s investments and could impair the fund’s ability to meet its investment objective or invest in accordance with its investment strategy. There is a risk that investments in securities denominated in, and/or receiving revenues in, foreign currencies will decline in value relative to the U.S. dollar. Foreign securities also include American Depositary Receipts (ADRs), Global Depositary Receipts (GDRs) and European Depositary Receipts (EDRs), which may be less liquid than the underlying shares in their primary trading market, and GDRs, in particular, many of which are issued by companies in emerging markets, may be more volatile. Foreign securities may also include investments in variable interest entities (VIEs) structures, which are created by China-based operating companies in jurisdictions outside of China to obtain indirect financing due to Chinese regulations that prohibit non-Chinese ownership of those companies. To the extent a fund’s investments in a single country or a limited number of countries represent a large percentage of the fund’s assets, the fund’s performance may be adversely affected by the economic, political, regulatory and social conditions in those countries, and the fund’s price may be more volatile than the price of a fund that is geographically diversified.
Emerging Markets Risk. Certain funds invest in emerging markets. Emerging market countries may be more likely to experience political turmoil or rapid changes in market or economic conditions than more developed countries. Emerging market countries often have less uniformity in accounting, auditing, financial reporting and record keeping requirements and greater risk associated with the custody of securities. In addition, the financial stability of issuers (including governments) in emerging market countries may be more precarious than in developed countries. As a result, there may be an increased risk of illiquidity and price volatility associated with a fund’s investments in emerging market countries, which may be magnified by currency fluctuations relative to the U.S. dollar, and, at times, it may be difficult to value such investments.
Sampling Index Tracking Risk. Certain funds may not fully replicate the index and may hold securities not included in the index. As a result, a fund is subject to the risk that the investment adviser’s investment management strategy, the implementation of which is subject to a number of constraints, may not produce the intended results. Because certain funds utilize a sampling approach they may not track the return of their respective index as well as they would if the funds purchased all of the securities in their respective index.
Tracking Error Risk. As index funds, each fund seeks to track the performance of its respective index, although it may not be successful in doing so. The divergence between the performance of a fund and the index, positive or negative, is called “tracking error.” Tracking error can be caused by many factors and it may be significant.
Derivatives Risk. Each fund may use derivatives to enhance returns or hedge against market declines. Examples of derivatives are options, futures, options on futures and swaps. An option is the right, but not the obligation, to buy or sell an instrument at a specific price on or before a specific date. A future is an agreement to buy or sell a financial instrument at a specific price on a
Schwab Fundamental Index ETFs | Annual Report117
Schwab Fundamental Index ETFs
Financial Notes (continued)
3. Risk Factors (continued):
specific day. A swap is an agreement whereby two parties agree to exchange payment streams calculated in relation to a rate, index, instrument or certain securities and a predetermined amount. A fund’s use of derivatives that are subject to regulation by the Commodity Futures Trading Commission (CFTC) could cause the fund to become a commodity pool, which would require the fund to comply with certain CFTC rules.
A fund’s use of derivative instruments involves risks different from, or possibly greater than, the risks associated with investing directly in securities and other traditional investments. Certain of these risks, such as liquidity risk, leverage risk and market risk, are discussed elsewhere in this section. A fund’s use of derivatives is also subject to counterparty risk, lack of availability risk, valuation risk, correlation risk and tax risk. Counterparty risk is the risk that the counterparty to a derivatives transaction may not fulfill its contractual obligations either because the financial condition of the counterparty declines, or because the counterparty is otherwise unable or unwilling to perform under the contract. Lack of availability risk is the risk that suitable derivative transactions may not be available in all circumstances for risk management or other purposes. Valuation risk is the risk that a particular derivative may be valued incorrectly. Correlation risk is the risk that changes in the value of the derivative may not correlate perfectly with the underlying asset, rate or index. Tax risk is the risk that the use of derivatives may cause the fund to realize higher amounts of short-term capital gains. A fund’s use of derivatives could reduce the fund’s performance, increase the fund’s volatility, and could cause the fund to lose more than the initial amount invested.
Liquidity Risk. A fund may be unable to sell certain securities, such as illiquid securities, readily at a favorable time or price, or the fund may have to sell them at a loss.
Leverage Risk. Certain fund transactions, such as derivatives transactions, may give rise to a form of leverage and may expose a fund to greater risk. Leverage tends to magnify the effect of any decrease or increase in the value of a fund’s portfolio securities which means even a small amount of leverage can have a disproportionately large impact on the fund. The use of leverage may cause a fund to liquidate portfolio positions when it would not be advantageous to do so in order to satisfy its obligations.
Securities Lending Risk. Securities lending involves the risk of loss of rights in, or delay in recovery of, the loaned securities if the borrower fails to return the security loaned or becomes insolvent.
Concentration Risk. To the extent that a fund’s or an index’s portfolio is concentrated in the securities of issuers in a particular market, industry, group of industries, sector, country or asset class, the fund may be adversely affected by the performance of those securities, may be subject to increased price volatility and may be more vulnerable to adverse economic, market, political or regulatory occurrences affecting that market, industry, group of industries, sector, country or asset class.
Market Trading Risk. Although fund shares are listed on national securities exchanges, there can be no assurance that an active trading market for fund shares will develop or be maintained. If an active market is not maintained, investors may find it difficult to buy or sell fund shares.
Shares of the Fund May Trade at Prices Other Than NAV. Fund shares may be bought and sold in the secondary market at market prices. Although it is expected that the market price of the shares of a fund will approximate the fund’s NAV, there may be times when the market price and the NAV vary significantly. An investor may pay more than NAV when buying shares of a fund in the secondary market, and an investor may receive less than NAV when selling those shares in the secondary market. The market price of fund shares may deviate, sometimes significantly, from NAV during periods of market volatility or market disruption, or as a result of other factors impacting foreign securities, including liquidity, irregular trading activity and timing differences between foreign markets where securities trade and the secondary market where fund shares are sold.
4. Affiliates and Affiliated Transactions:Investment Adviser
Charles Schwab Investment Management, Inc., dba Schwab Asset Management, a wholly owned subsidiary of The Charles Schwab Corporation, serves as each fund’s investment adviser pursuant to the Advisory Agreement between the investment adviser and the trust.
118Schwab Fundamental Index ETFs | Annual Report
Schwab Fundamental Index ETFs
Financial Notes (continued)
4. Affiliates and Affiliated Transactions (continued):
For its advisory services to the funds, the investment adviser is entitled to receive an annual management fee, payable monthly, based on a percentage of each fund’s average daily net assets as follows:
SCHWAB FUNDAMENTAL U.S. BROAD MARKET INDEX ETF | SCHWAB FUNDAMENTAL U.S. LARGE COMPANY INDEX ETF | SCHWAB FUNDAMENTAL U.S. SMALL COMPANY INDEX ETF | SCHWAB FUNDAMENTAL INTERNATIONAL LARGE COMPANY INDEX ETF | SCHWAB FUNDAMENTAL INTERNATIONAL SMALL COMPANY INDEX ETF | SCHWAB FUNDAMENTAL EMERGING MARKETS LARGE COMPANY INDEX ETF |
| | | | | |
Other Affiliated Transactions
The professional fees related to foreign withholding tax claims discussed in financial note 2(d) are non-contingent and non-routine fees. The investment adviser agreed to pay these professional fees, on behalf of the funds, subject to reimbursement by the funds to the extent the funds are able to successfully recover taxes withheld in the future.
For the period ended February 28, 2023, the professional fees incurred by the Schwab Fundamental International Large Company Index ETF and Schwab Fundamental International Small Company Index ETF and paid by the investment adviser were $22,400 and $2,577, respectively, as shown in the Statement of Operations.
For the period ended February 28, 2023, Schwab Fundamental International Large Company Index ETF and Schwab Fundamental International Small Company Index ETF recovered previously withheld foreign taxes from France and Sweden. The payments received by Schwab Fundamental International Large Company Index ETF and Schwab Fundamental International Small Company Index ETF amounted to $4,519,977 and $559,284 , which includes $345,253 and $0 of interest income, and are recorded as income in the fund’s Statement of Operations. The investment adviser had paid upfront professional fees associated with recovering these foreign taxes in the amount of $25,665 and $5,178, for Schwab Fundamental International Large Company Index ETF and Schwab Fundamental International Small Company Index ETF, respectively. Those amounts have been reimbursed to the investment adviser. During the period ended February 28, 2023, Schwab Fundamental Emerging Markets Large Company Index ETF did not recover any previously withheld foreign taxes and made no reimbursements to the investment adviser.
As of February 28, 2023, the balance of professional fees related to foreign withholding tax subject to future reimbursement by the Schwab Fundamental International Large Company Index ETF and Schwab Fundamental International Small Company Index ETF to the investment adviser were $16,263 and $1,987. Schwab Fundamental Emerging Markets Large Company Index ETF had no balance of professional fees related to foreign withholding tax subject to future reimbursement by the fund to the investment adviser.
No other amounts for additional tax reclaims are reflected in the financial statements due to the uncertainty surrounding the ultimate resolution of proceedings, the likelihood of receipt of these claims, and the potential timing of payment.
Interfund Transactions
The funds may engage in direct transactions with certain other funds in the Fund Complex in accordance with procedures adopted by the Board pursuant to Rule 17a-7 under the 1940 Act. When one fund is seeking to sell a security that another is seeking to buy, an interfund transaction can allow both funds to benefit by reducing transaction costs. This practice is limited to funds that share the same investment adviser, trustees and/or officers. For the period ended February 28, 2023, each fund’s total purchases and sales of securities with other funds in the Fund Complex as well as any realized gains (losses) were as follows:
| | | |
Schwab Fundamental U.S. Broad Market Index ETF | | | |
Schwab Fundamental U.S. Large Company Index ETF | | | |
Schwab Fundamental U.S. Small Company Index ETF | | | |
Schwab Fundamental International Large Company Index ETF | | | |
Schwab Fundamental International Small Company Index ETF | | | |
Schwab Fundamental Emerging Markets Large Company Index ETF | | | |
| | | |
Schwab Fundamental Index ETFs | Annual Report119
Schwab Fundamental Index ETFs
Financial Notes (continued)
4. Affiliates and Affiliated Transactions (continued):
Interfund Borrowing and Lending
Pursuant to an exemptive order issued by the SEC, the funds may enter into interfund borrowing and lending transactions with other funds in the Fund Complex . All loans are for temporary or emergency purposes and the interest rate to be charged will be the average of the overnight repurchase agreement rate and the short-term bank loan rate. All loans are subject to numerous conditions designed to ensure fair and equitable treatment of all participating funds. The interfund lending facility is subject to the oversight and periodic review of the Board. The funds had no interfund borrowing or lending activity during the period.
5. Other Service Providers:SEI Investments Distribution Co. is the principal underwriter and distributor of shares of the funds.
State Street Bank and Trust Company (State Street) serves as the funds’ transfer agent. As part of these services, the transfer agent maintains records pertaining to the sale, redemption and transfer of the funds’ shares. The transfer agent is also responsible for the order-taking function for the funds’ shares.
State Street also serves as custodian and accountant for the funds. The custodian is responsible for the daily safekeeping of securities and cash held by the funds. The funds’ accountant maintains all books and records related to the funds’ transactions.
6. Board of Trustees:The Board may include people who are officers and/or directors of the investment adviser or its affiliates. Federal securities law limits the percentage of such “interested persons” who may serve on a trust’s board, and the trust was in compliance with these limitations throughout the report period. The funds did not pay any interested or non-interested (independent trustees) trustees. The independent trustees are paid by the investment adviser. For information regarding the trustees, please refer to the Trustees and Officers table at the end of this report.
7. Borrowing from Banks:During the period, the funds were participants with other funds in the Fund Complex in a joint, syndicated, committed $850 million line of credit (the Syndicated Credit Facility), which matured on September 29, 2022. On September 29, 2022, the Syndicated Credit Facility was amended to run for a new 364 day period with the line of credit amount increasing to $1 billion, maturing on September 28, 2023. Under the terms of the Syndicated Credit Facility, in addition to the investment adviser paying the interest charged on any borrowings by a fund, the investment adviser paid a commitment fee of 0.15% per annum on the funds’ proportionate share of the unused portion of the Syndicated Credit Facility.
During the period, the funds were participants with other funds in the Fund Complex in a joint, unsecured, uncommitted $400 million line of credit (the Uncommitted Credit Facility), with State Street which matured on September 29, 2022. On September 29, 2022, the Uncommitted Credit Facility was amended to run for a new 364 day period with the line of credit amount remaining unchanged, maturing on September 28, 2023. Under the terms of the Uncommitted Credit Facility, the investment adviser pays interest on the amount a fund borrows. There were no borrowings from either line of credit during the period.
The funds also have access to custodian overdraft facilities. A fund may have utilized the overdraft facility and incurred an interest expense, which is paid by the investment adviser. The interest expense is determined based on a negotiated rate above the current Federal Funds Rate.
8. Derivatives:Certain funds entered into equity index futures contracts during the report period. The funds invested in futures contracts to equitize available cash. The value and variation margin for futures contracts held at February 28, 2023 are presented in the Portfolio Holdings and Statement of Assets and Liabilities, respectively. The net realized gains (losses) and net change in unrealized appreciation (depreciation) on futures contracts are presented in the Statement of Operations. Refer to financial note 2(b) for the
120Schwab Fundamental Index ETFs | Annual Report
Schwab Fundamental Index ETFs
Financial Notes (continued)
8. Derivatives (continued):
funds’ accounting policies with respect to futures contracts and financial note 3 for disclosures concerning the risks of investing in futures contracts. During the period ended February 28, 2023, the month-end average notional amounts of futures contracts held by the funds and the month-end average number of contracts held were as follows:
| | |
Schwab Fundamental U.S. Broad Market Index ETF | | |
Schwab Fundamental U.S. Large Company Index ETF | | |
Schwab Fundamental U.S. Small Company Index ETF | | |
Schwab Fundamental International Large Company Index ETF | | |
Schwab Fundamental International Small Company Index ETF | | |
Schwab Fundamental Emerging Markets Large Company Index ETF | | |
9. Purchases and Sales of Investment Securities:For the period ended February 28, 2023, purchases and sales of securities (excluding in-kind transactions and short-term obligations) were as follows:
| | |
Schwab Fundamental U.S. Broad Market Index ETF | | |
Schwab Fundamental U.S. Large Company Index ETF | | |
Schwab Fundamental U.S. Small Company Index ETF | | |
Schwab Fundamental International Large Company Index ETF | | |
Schwab Fundamental International Small Company Index ETF | | |
Schwab Fundamental Emerging Markets Large Company Index ETF | | |
10. In-Kind Transactions:The consideration for the purchase of Creation Units of a fund often consists of the in-kind deposit of a designated portfolio of equity securities, which constitutes an optimized representation of the securities involved in a relevant fund’s underlying index, and an amount of cash. Investors purchasing and redeeming Creation Units are subject to a standard creation transaction fee and a standard redemption transaction fee paid to the custodian to offset transfer and other transaction costs associated with the issuance and redemption of Creation Units. Purchasers and redeemers of Creation Units for cash are subject to an additional variable charge paid to the fund that will offset the transaction costs to the fund of buying or selling portfolio securities. Variable charges paid to the funds, except for Schwab Fundamental Emerging Markets Large Company Index ETF, generally have no effect on net asset value per share. Variable charges were larger than the other funds for the Schwab Fundamental Emerging Markets Large Company Index ETF in the current period and are disclosed in Other Capital on the Financial Highlights and on the Statement of Changes in Net Assets. In addition, purchasers and redeemers of shares in Creation Units are responsible for payment of the costs of transferring securities to or out of the fund. From time to time, the investment adviser may cover the cost of any transaction fees when believed to be in the best interests of a fund.
The in-kind transactions for the period ended February 28, 2023, were as follows:
| IN-KIND PURCHASES
OF SECURITIES | IN-KIND SALES
OF SECURITIES |
Schwab Fundamental U.S. Broad Market Index ETF | | |
Schwab Fundamental U.S. Large Company Index ETF | | |
Schwab Fundamental U.S. Small Company Index ETF | | |
Schwab Fundamental International Large Company Index ETF | | |
Schwab Fundamental International Small Company Index ETF | | |
Schwab Fundamental Emerging Markets Large Company Index ETF | | |
Schwab Fundamental Index ETFs | Annual Report121
Schwab Fundamental Index ETFs
Financial Notes (continued)
10. In-Kind Transactions (continued):
For the period ended February 28, 2023, the funds may realize net capital gains or losses resulting from in-kind redemptions of Creation Units. Because such gains or losses are not taxable to the funds and are not distributed to existing fund shareholders, the gains or losses are reclassified from accumulated net realized gains or losses to capital received from investors at the end of the funds’ tax year. These reclassifications have no effect on net assets or net asset values per share. The net realized gains or losses on sales of in-kind redemptions for the period ended February 28, 2023 are disclosed in the funds’ Statements of Operations, if any.
11. Federal Income Taxes:As of February 28, 2023, the tax basis cost of the funds’ investments and gross unrealized appreciation and depreciation were as follows:
| | GROSS UNREALIZED
APPRECIATION | GROSS UNREALIZED
DEPRECIATION | NET UNREALIZED
APPRECIATION
(DEPRECIATION) |
Schwab Fundamental U.S. Broad Market Index ETF | | | | |
Schwab Fundamental U.S. Large Company Index ETF | | | | |
Schwab Fundamental U.S. Small Company Index ETF | | | | |
Schwab Fundamental International Large Company Index ETF | | | | |
Schwab Fundamental International Small Company Index ETF | | | | |
Schwab Fundamental Emerging Markets Large Company Index ETF | | | | |
As of February 28, 2023, the components of distributable earnings on a tax basis were as follows:
| UNDISTRIBUTED
ORDINARY
INCOME | NET UNREALIZED
APPRECIATION
(DEPRECIATION)
ON INVESTMENTS | NET OTHER UNREALIZED
APPRECIATION
(DEPRECIATION) | CAPITAL LOSS
CARRYFORWARDS
AND OTHER LOSSES | |
Schwab Fundamental U.S. Broad Market Index ETF | | | | | |
Schwab Fundamental U.S. Large Company Index ETF | | | | | |
Schwab Fundamental U.S. Small Company Index ETF | | | | | |
Schwab Fundamental International Large Company Index ETF | | | | | |
Schwab Fundamental International Small Company Index ETF | | | | | |
Schwab Fundamental Emerging Markets Large Company Index ETF | | | | | |
The primary difference between book basis and tax basis unrealized appreciation or unrealized depreciation of investments is the tax deferral of losses on wash sales, the realization for tax purposes of unrealized appreciation (depreciation) on futures contracts, the realization for tax purposes of unrealized appreciation on investments in PFICs and partnership investments. The tax cost of the funds’ investments, disclosed above, have been adjusted from their book amounts to reflect these unrealized appreciation or depreciation differences, as applicable.
Capital loss carryforwards have no expiration and may be used to offset future realized capital gains for federal income tax purposes. As of February 28, 2023, the funds had capital loss carryforwards available as follows:
| |
Schwab Fundamental U.S. Broad Market Index ETF | |
Schwab Fundamental U.S. Large Company Index ETF | |
Schwab Fundamental U.S. Small Company Index ETF | |
Schwab Fundamental International Large Company Index ETF | |
Schwab Fundamental International Small Company Index ETF | |
Schwab Fundamental Emerging Markets Large Company Index ETF | |
122Schwab Fundamental Index ETFs | Annual Report
Schwab Fundamental Index ETFs
Financial Notes (continued)
11. Federal Income Taxes (continued):
The tax basis components of distributions paid during the current and prior fiscal years were as follows:
| CURRENT FISCAL YEAR END DISTRIBUTIONS | PRIOR FISCAL YEAR END DISTRIBUTIONS |
| | |
Schwab Fundamental U.S. Broad Market Index ETF | | |
Schwab Fundamental U.S. Large Company Index ETF | | |
Schwab Fundamental U.S. Small Company Index ETF | | |
Schwab Fundamental International Large Company Index ETF | | |
Schwab Fundamental International Small Company Index ETF | | |
Schwab Fundamental Emerging Markets Large Company Index ETF | | |
Distributions paid to shareholders are based on net investment income and net realized gains determined on a tax basis, which may differ from net investment income and net realized gains for financial reporting purposes. These differences reflect the differing character of certain income items and net realized gains and losses for financial statement and tax purposes, and may result in reclassification among certain capital accounts on the financial statements. The funds may also designate a portion of the amount paid to redeeming shareholders as a distribution for tax purposes.
Permanent book and tax basis differences may result in reclassifications between components of net assets as required. The adjustments will have no impact on net assets or the results of operations.
As of February 28, 2023, management has reviewed the tax positions for open periods (for federal purposes, three years from the date of filing and for state purposes, four years from the date of filing) as applicable to the funds, and has determined that no provision for income tax is required in the funds’ financial statements. The funds recognize interest and penalties, if any, related to unrecognized tax benefits as income tax expense in the Statement of Operations. During the fiscal year ended February 28, 2023, the funds did not incur any interest or penalties.
12. Subsequent Events:Management has determined there are no subsequent events or transactions through the date the financial statements were issued that would have materially impacted the financial statements as presented.
Schwab Fundamental Index ETFs | Annual Report123
Schwab Fundamental Index ETFs
Report of Independent Registered Public Accounting Firm
To the Board of Trustees of Schwab Strategic Trust and Shareholders of Schwab Fundamental U.S. Broad Market Index ETF, Schwab Fundamental U.S. Large Company Index ETF, Schwab Fundamental U.S. Small Company Index ETF, Schwab Fundamental International Large Company Index ETF, Schwab Fundamental International Small Company Index ETF, and Schwab Fundamental Emerging Markets Large Company Index ETF:
Opinion on the Financial Statements and Financial Highlights
We have audited the accompanying statements of assets and liabilities, including the portfolio holdings, of Schwab Fundamental U.S. Broad Market Index ETF, Schwab Fundamental U.S. Large Company Index ETF, Schwab Fundamental U.S. Small Company Index ETF, Schwab Fundamental International Large Company Index ETF, Schwab Fundamental International Small Company Index ETF, and Schwab Fundamental Emerging Markets Large Company Index ETF (the “Funds”), six of the funds constituting Schwab Strategic Trust, as of February 28, 2023, and the related statements of operations for the year then ended, the statements of changes in net assets for each of the two years in the period then ended, the financial highlights for each of the three years in the period then ended, and the related notes. In our opinion, the financial statements and financial highlights present fairly, in all material respects, the financial position of each of the Funds as of February 28, 2023, and the results of their operations for the year then ended, the changes in their net assets for the two years in the period then ended, and the financial highlights for each of the three years in the period then ended in conformity with accounting principles generally accepted in the United States of America. The financial highlights for each of the two years in the period ended February 29, 2020 were audited by other auditors, whose report, dated April 16, 2020, expressed an unqualified opinion on such financial highlights.
Basis for Opinions
These financial statements and financial highlights are the responsibility of the Funds’ management. Our responsibility is to express an opinion on the Funds’ financial statements and financial highlights based on our audits. We are a public accounting firm registered with the Public Company Accounting Oversight Board (United States) (PCAOB) and are required to be independent with respect to the Funds in accordance with the U.S. federal securities laws and the applicable rules and regulations of the Securities and Exchange Commission and the PCAOB.
We conducted our audits in accordance with the standards of the PCAOB. Those standards require that we plan and perform the audit to obtain reasonable assurance about whether the financial statements and financial highlights are free of material misstatement, whether due to error or fraud. The Funds are not required to have, nor were we engaged to perform, an audit of their internal control over financial reporting. As part of our audits, we are required to obtain an understanding of internal control over financial reporting but not for the purpose of expressing an opinion on the effectiveness of the Funds’ internal control over financial reporting. Accordingly, we express no such opinion.
Our audits included performing procedures to assess the risks of material misstatement of the financial statements and financial highlights, whether due to error or fraud, and performing procedures that respond to those risks. Such procedures included examining, on a test basis, evidence regarding the amounts and disclosures in the financial statements and financial highlights. Our audits also included evaluating the accounting principles used and significant estimates made by management, as well as evaluating the overall presentation of the financial statements and financial highlights. Our procedures included confirmation of securities owned as of February 28, 2023, by correspondence with the custodian and brokers; when replies were not received from brokers, we performed other auditing procedures. We believe that our audits provide a reasonable basis for our opinion.
Deloitte & Touche LLP
Denver, Colorado
April 17, 2023
We have served as the auditor of one or more investment companies in the Schwab Funds Complex since 2020.
124Schwab Fundamental Index ETFs | Annual Report
Schwab Fundamental Index ETFs
Other Federal Tax Information (unaudited)
The funds may elect to pass through, under section 853(a) of the Internal Revenue Code, the foreign tax credit to their shareholders for the fiscal year ended February 28, 2023. The foreign tax credit and the foreign source income amounts are as follows:
| | |
Schwab Fundamental U.S. Broad Market Index ETF | | |
Schwab Fundamental U.S. Large Company Index ETF | | |
Schwab Fundamental U.S. Small Company Index ETF | | |
Schwab Fundamental International Large Company Index ETF | | |
Schwab Fundamental International Small Company Index ETF | | |
Schwab Fundamental Emerging Markets Large Company Index ETF | | |
For corporate shareholders, the following percentage of the funds dividend distributions paid during the fiscal year ended February 28, 2023, qualify for the corporate dividends received deduction:
| |
Schwab Fundamental U.S. Broad Market Index ETF | |
Schwab Fundamental U.S. Large Company Index ETF | |
Schwab Fundamental U.S. Small Company Index ETF | |
Schwab Fundamental International Large Company Index ETF | |
Schwab Fundamental International Small Company Index ETF | |
Schwab Fundamental Emerging Markets Large Company Index ETF | |
For the fiscal year ended February 28, 2023, the funds designate the following amounts of the dividend distributions as qualified dividends for the purposes of the maximum rate under section 1(h)(11) of the Internal Revenue Code. Shareholders will be notified in January 2024 via IRS Form 1099 of the amounts for use in preparing their 2023 income tax return.
Schwab Fundamental U.S. Broad Market Index ETF | |
Schwab Fundamental U.S. Large Company Index ETF | |
Schwab Fundamental U.S. Small Company Index ETF | |
Schwab Fundamental International Large Company Index ETF | |
Schwab Fundamental International Small Company Index ETF | |
Schwab Fundamental Emerging Markets Large Company Index ETF | |
For the fiscal year ended February 28, 2023, the funds designate the following amounts as dividends eligible for the 20% qualified business income deduction under section 199A of the Internal Revenue Code. Shareholders will be notified in January 2024 via IRS Form 1099 of the amounts for use in preparing their 2023 income tax return.
Schwab Fundamental U.S. Broad Market Index ETF | |
Schwab Fundamental U.S. Large Company Index ETF | |
Schwab Fundamental U.S. Small Company Index ETF | |
Schwab Fundamental International Large Company Index ETF | |
Schwab Fundamental International Small Company Index ETF | |
Schwab Fundamental Emerging Markets Large Company Index ETF | |
Schwab Fundamental Index ETFs | Annual Report125
Schwab Fundamental Index ETFs
Liquidity Risk Management Program (unaudited)
The funds have adopted and implemented a liquidity risk management program (the “program”) as required by Rule 22e-4 under the Investment Company Act of 1940, as amended. The funds’ Board of Trustees (the “Board”) has designated the funds’ investment adviser, Charles Schwab Investment Management, Inc., dba Schwab Asset Management, as the administrator of the program. Personnel of the investment adviser or its affiliates conduct the day-to-day operation of the program.
Under the program, the investment adviser manages a fund’s liquidity risk, which is the risk that the fund could not meet shareholder redemption requests without significant dilution of remaining shareholders’ interests in the fund. The program is reasonably designed to assess and manage a fund’s liquidity risk, taking into consideration the fund’s investment strategy and the liquidity of its portfolio investments during normal and reasonably foreseeable stressed conditions; its historical redemption history and shareholder concentrations; and its cash holdings and access to other funding sources, including the custodian overdraft facility and lines of credit. The investment adviser’s process of determining the degree of liquidity of each fund’s investments is supported by third-party liquidity assessment vendors.
The funds’ Board reviewed a report at its meeting held on September 19, 2022 prepared by the investment adviser regarding the operation and effectiveness of the program for the period June 1, 2021, through May 31, 2022, which included individual fund liquidity risk metrics. No significant liquidity events impacting any of the funds were noted in the report. In addition, the investment adviser provided its assessment that the program had been operating effectively in managing each fund’s liquidity risk.
126Schwab Fundamental Index ETFs | Annual Report
Schwab Fundamental Index ETFs
Trustees and Officers
The tables below give information about the trustees and officers of Schwab Strategic Trust, which includes the funds covered in this report. The “Fund Complex” includes The Charles Schwab Family of Funds, Schwab Capital Trust, Schwab Investments, Schwab Annuity Portfolios, Schwab Strategic Trust and Laudus Trust. The Fund Complex includes 105 funds.
The address for all trustees and officers is 211 Main Street, San Francisco, CA 94105. You can find more information about the trustees and officers in the Statement of Additional Information, which is available free by calling 1-877-824-5615.
|
Name, Year of Birth, and Position(s) with the trust (Terms of office, and length of Time Served1) | Principal Occupations During the Past Five Years | Number of Portfolios in Fund Complex Overseen by the Trustee | |
Michael J. Beer 1961 Trustee (Trustee of The Charles Schwab Family of Funds, Schwab Investments, Schwab Capital Trust, Schwab Annuity Portfolios, Schwab Strategic Trust and Laudus Trust since 2022) | Retired. Director, President and Chief Executive Officer (Dec. 2016 – Sept. 2019), Principal Funds (investment management). | | Director (2016 – 2019), Principal Funds, Inc. |
Robert W. Burns 1959 Trustee (Trustee of Schwab Strategic Trust since 2009; The Charles Schwab Family of Funds, Schwab Investments, Schwab Capital Trust, Schwab Annuity Portfolios and Laudus Trust since 2016) | Retired/Private Investor. | | |
Nancy F. Heller 1956 Trustee (Trustee of The Charles Schwab Family of Funds, Schwab Investments, Schwab Capital Trust, Schwab Annuity Portfolios, Schwab Strategic Trust and Laudus Trust since 2018) | | | |
David L. Mahoney 1954 Trustee (Trustee of The Charles Schwab Family of Funds, Schwab Investments, Schwab Capital Trust, Schwab Annuity Portfolios and Laudus Trust since 2011; Schwab Strategic Trust since 2016) | | | Director (2004 – present), Corcept Therapeutics Incorporated Director (2009 – 2021), Adamas Pharmaceuticals, Inc. Director (2003 – 2019), Symantec Corporation |
Jane P. Moncreiff 1961 Trustee (Trustee of The Charles Schwab Family of Funds, Schwab Investments, Schwab Capital Trust, Schwab Annuity Portfolios, Schwab Strategic Trust and Laudus Trust since 2019) | Consultant (2018 – present), Fulham Advisers LLC (management consulting); Chief Investment Officer (2009 – 2017), CareGroup Healthcare System, Inc. (healthcare). | | |
Schwab Fundamental Index ETFs | Annual Report127
Schwab Fundamental Index ETFs
Independent Trustees (continued) |
Name, Year of Birth, and Position(s) with the trust (Terms of office, and length of Time Served1) | Principal Occupations During the Past Five Years | Number of Portfolios in Fund Complex Overseen by the Trustee | |
Kimberly S. Patmore 1956 Trustee (Trustee of The Charles Schwab Family of Funds, Schwab Investments, Schwab Capital Trust, Schwab Annuity Portfolios, Schwab Strategic Trust and Laudus Trust since 2016) | Consultant (2008 – present), Patmore Management Consulting (management consulting). | | |
J. Derek Penn 1957 Trustee (Trustee of The Charles Schwab Family of Funds, Schwab Investments, Schwab Capital Trust, Schwab Annuity Portfolios, Schwab Strategic Trust and Laudus Trust since 2021) | Head of Equity Sales and Trading (2006 – 2018), BNY Mellon (financial services). | | |
128Schwab Fundamental Index ETFs | Annual Report
Schwab Fundamental Index ETFs
|
Name, Year of Birth, and Position(s) with the trust (Terms of office, and length of Time Served1) | Principal Occupations During the Past Five Years | Number of Portfolios in Fund Complex Overseen by the Trustee | |
Walter W. Bettinger II2 1960 Chairman and Trustee (Trustee of The Charles Schwab Family of Funds, Schwab Investments, Schwab Capital Trust and Schwab Annuity Portfolios since 2008; Schwab Strategic Trust since 2009; Laudus Trust since 2010) | Co-Chairman of the Board (July 2022 – present), Director and Chief Executive Officer (Oct. 2008 – present) and President (Feb. 2007 – Oct. 2021), The Charles Schwab Corporation; President and Chief Executive Officer (Oct. 2008 – Oct. 2021) and Director (May 2008 – Oct. 2021), Charles Schwab & Co., Inc.; Director (Apr. 2006 – present), Charles Schwab Bank, SSB; Director (Nov. 2017 – present), Charles Schwab Premier Bank, SSB; Director (July 2019 – present), Charles Schwab Trust Bank; Director (May 2008 – present), Chief Executive Officer (Aug. 2017 – present) and President (Aug. 2017 – Nov. 2021), Schwab Holdings, Inc.; Director (Oct. 2020 – present), TD Ameritrade Holding Corporation; Director (July 2016 – Oct. 2021), Charles Schwab Investment Management, Inc. | | Director (2008 – present), The Charles Schwab Corporation |
Richard A. Wurster2 1973 Trustee (Trustee of The Charles Schwab Family of Funds, Schwab Investments, Schwab Capital Trust, Schwab Annuity Portfolios, Schwab Strategic Trust and Laudus Trust since 2022) | President (Oct. 2021 – present) and Executive Vice President – Schwab Asset Management Solutions (Apr. 2019 – Oct. 2021), The Charles Schwab Corporation; President, Director (Oct. 2021 – present), Executive Vice President – Schwab Asset Management Solutions (July 2019 – Oct. 2021) and Senior Vice President – Advisory (May 2016 – July 2019), Charles Schwab & Co., Inc.; President (Nov. 2021 – present), Schwab Holdings, Inc.; Director (Oct. 2021 – present) and Chief Executive Officer (Nov. 2019 – Jan. 2022), Charles Schwab Investment Management, Inc.; Director, Chief Executive Officer and President (Mar. 2018 – Oct. 2022), Charles Schwab Investment Advisory, Inc.; Chief Executive Officer (July 2016 – Apr. 2018) and President (Mar. 2017 – Apr. 2018), ThomasPartners, Inc.; Chief Executive Officer (July 2016 – Apr. 2018), Windhaven Investment Management, Inc. | | |
|
Name, Year of Birth, and Position(s) with the trust (Terms of office, and length of Time Served3) | Principal Occupations During the Past Five Years |
Jonathan de St. Paer 1973 President and Chief Executive Officer (Officer of The Charles Schwab Family of Funds, Schwab Investments, Schwab Capital Trust, Schwab Annuity Portfolios, Schwab Strategic Trust and Laudus Trust since 2018) | Director (Apr. 2019 – present), President (Oct. 2018 – present), Chief Operating Officer (Jan. 2021 – present), and Chief Executive Officer (Apr. 2019 – Nov. 2019), Charles Schwab Investment Management, Inc.; Senior Vice President (June 2020 – Mar. 2022) and Chief Operating Officer (Jan. 2021 – Mar. 2022), Charles Schwab Investment Advisory, Inc.; Chief Executive Officer (Apr. 2019 – present), President (Nov. 2018 – present) and Trustee (Apr. 2019 – Dec. 2020), Schwab Funds, Laudus Trust and Schwab ETFs; Managing Director (May 2022 – present), Senior Vice President (Apr. 2019 – May 2022) and Senior Vice President – Strategy and Product Development (CSIM) (Jan. 2014 – Mar. 2019), Charles Schwab & Co., Inc. |
Mark Fischer 1970 Chief Operating Officer (Officer of The Charles Schwab Family of Funds, Schwab Investments, Schwab Capital Trust, Schwab Annuity Portfolios, Schwab Strategic Trust and Laudus Trust since 2013) | Chief Operating Officer (Dec. 2020 – present) and Treasurer and Chief Financial Officer (Jan. 2016 – Dec. 2022), Schwab Funds, Laudus Trust and Schwab ETFs; Chief Financial Officer (Mar. 2020 – present) and Vice President (Oct. 2013 – present), Charles Schwab Investment Management, Inc. |
Dana Smith 1965 Treasurer and Chief Financial Officer (Officer of The Charles Schwab Family of Funds, Schwab Investments, Schwab Capital Trust, Schwab Annuity Portfolios, Schwab Strategic Trust and Laudus Trust since 2023) | Treasurer and Chief Financial Officer (Jan. 2023 – present) and Assistant Treasurer (Dec. 2015 – Dec. 2022), Schwab Funds, Laudus Trust and Schwab ETFs; Vice President (Mar. 2022 – present) and Director (Oct. 2015 – Mar. 2022), Charles Schwab Investment Management, Inc. |
Schwab Fundamental Index ETFs | Annual Report129
Schwab Fundamental Index ETFs
Officers of the Trust (continued) |
Name, Year of Birth, and Position(s) with the trust (Terms of office, and length of Time Served3) | Principal Occupations During the Past Five Years |
Omar Aguilar 1970 Vice President and Chief Investment Officer (Officer of The Charles Schwab Family of Funds, Schwab Investments, Schwab Capital Trust, Schwab Annuity Portfolios, Schwab Strategic Trust and Laudus Trust since 2011) | Chief Executive Officer (Jan. 2022 – present), Chief Investment Officer (Apr. 2011 – present) and Senior Vice President (Apr. 2011 – Dec. 2021), Charles Schwab Investment Management, Inc.; Director, Chief Executive Officer and President (Oct. 2022 – present), Charles Schwab Investment Advisory, Inc.; Vice President and Chief Investment Officer (June 2011 – present), Schwab Funds, Laudus Trust and Schwab ETFs. |
Brett Wander 1961 Vice President and Chief Investment Officer (Officer of The Charles Schwab Family of Funds, Schwab Investments, Schwab Capital Trust, Schwab Annuity Portfolios, Schwab Strategic Trust and Laudus Trust since 2011) | Senior Vice President and Chief Investment Officer (Apr. 2011 – present), Charles Schwab Investment Management, Inc.; Vice President and Chief Investment Officer (June 2011 – present), Schwab Funds, Laudus Trust and Schwab ETFs. |
William P. McMahon, Jr. 1972 Vice President and Chief Investment Officer (Officer of The Charles Schwab Family of Funds, Schwab Investments, Schwab Capital Trust, Schwab Annuity Portfolios, Schwab Strategic Trust and Laudus Trust since 2021) | Senior Vice President and Chief Investment Officer (Jan. 2020 – present), Charles Schwab Investment Management, Inc.; Vice President and Chief Investment Officer (June 2021 – present), Schwab Funds, Laudus Trust and Schwab ETFs; Senior Vice President and Chief Investment Officer – ThomasPartners Strategies (Apr. 2018 – Dec. 2019), Charles Schwab Investment Advisory, Inc.; Senior Vice President and Chief Investment Officer (May 2001 – Apr. 2018), ThomasPartners, Inc. |
Catherine MacGregor 1964 Chief Legal Officer and Secretary, Schwab Funds and Schwab ETFs Chief Legal Officer, Vice President and Clerk, Laudus Trust (Officer of The Charles Schwab Family of Funds, Schwab Investments, Schwab Capital Trust, Schwab Annuity Portfolios and Laudus Trust since 2005; Schwab Strategic Trust since 2009) | Chief Legal Officer (Mar. 2022 – present) and Vice President (Sept. 2005 – present), Charles Schwab Investment Management, Inc.; Managing Director (May 2022 – present) and Vice President (July 2005 – May 2022), Charles Schwab & Co., Inc.; Vice President (Dec. 2005 – present) and Chief Legal Officer and Clerk (Mar. 2007 – present), Laudus Trust; Chief Legal Officer and Secretary (Oct. 2021 – present), Vice President (Nov. 2005 – Oct. 2021) and Assistant Secretary (June 2007 – Oct. 2021), Schwab Funds; Chief Legal Officer and Secretary (Oct. 2021 – present), Vice President and Assistant Secretary (Oct. 2009 – Oct. 2021), Schwab ETFs. |
1
Each Trustee shall hold office until the election and qualification of his or her successor, or until he or she dies, resigns or is removed. The retirement policy requires that each independent trustee retire by December 31 of the year in which the Trustee turns 74 or the Trustee’s twentieth year of service as an independent trustee on any trust in the Fund Complex, whichever occurs first.
2
Mr. Bettinger and Mr. Wurster are Interested Trustees. Mr. Bettinger and Mr. Wurster are Interested Trustees because each owns stock of The Charles Schwab Corporation (CSC), the parent company of Charles Schwab Investment Management, Inc., the investment adviser for the trusts in the Fund Complex, and is an employee of Charles Schwab & Co., Inc. (Schwab), the principal underwriter for The Charles Schwab Family of Funds, Schwab Investments, Schwab Capital Trust, Schwab Annuity Portfolios and Laudus Trust.
3
The President, Treasurer and Secretary/Clerk hold office until their respective successors are chosen and qualified or until he or she sooner dies, resigns, is removed or becomes disqualified. Each of the other officers serves at the pleasure of the Board.
130Schwab Fundamental Index ETFs | Annual Report
Schwab Fundamental Index ETFs
144A securities These securities may be sold only to qualified institutional buyers under Securities Act Rule 144A.
American Depositary Receipt (ADR) U.S. dollar-denominated receipts issued by U.S. banks or trust companies that represent shares of foreign-based corporations.
ask See “offer.”
asset allocation The practice of dividing a portfolio among different asset classes, with each asset class assigned a particular percentage to help offset risks and rewards, based on your goals, time horizon and risk tolerance.
asset class A group of securities with similar structure and basic characteristics. Stocks, bonds and cash are the three main examples of asset classes.
authorized participant (AP) A large institutional investor that places orders for creation units with the funds’ distributor.
beta A historical measure of an investment’s volatility relative to a market index (usually the S&P 500®). The index is defined as having a beta of 1.00. Investments with a beta higher than 1.00 have been more volatile than the index; those with a beta of less than 1.00 have been less volatile.
bid The highest price at which someone is willing to buy a security.
Bloomberg US Aggregate Bond Index An index that is a broad-based benchmark measuring the performance of the U.S. investment grade, taxable bond market, including U.S. Treasuries, government-related and corporate bonds, mortgage pass-through securities, commercial mortgage-backed securities, and asset-backed securities that are publicly available for sale in the United States. To be eligible for inclusion in the index, securities must be fixed rate, non-convertible, U.S. dollar-denominated with at least $300 million or more of outstanding face value and have one or more years remaining to maturity. The index excludes certain types of securities, including tax-exempt state and local government series bonds, structured notes embedded with swaps or other special features, private placements, floating rate securities, inflation-linked bonds and Eurobonds. The index is market capitalization weighted and the securities in the index are updated on the last business day of each month.
Bloomberg US Treasury Bills 1–3 Month Index An index that includes all publicly issued zero-coupon U.S. Treasury Bills that have a remaining maturity of less than 3 months but more than 1 month, are rated investment grade and have $300 million or more of outstanding face value. It excludes zero-coupon STRIPS.
cap, capitalization See “market cap.”
capital gain, capital loss The difference between the amount paid for an investment and its value at a later time. If the investment has been sold, the capital gain or loss is considered a realized gain or loss. If the investment is still held, the gain or loss is still “on paper” and is considered unrealized.
commencement of operations The date that the first NAV was calculated.
creation unit (C.U.) A basket of securities that is delivered by an authorized participant (AP) to the fund equal to the current holdings of the ETF, plus a designated cash component. In return, the APs receive a large block of ETF shares (typically 50,000 shares), which investors can then buy and sell in the secondary market.
European Depositary Receipt (EDR) A negotiable security (receipt) that is issued by a European bank, and that represents shares of foreign-based corporations.
exchange A marketplace, or any organization or group that provides or maintains a marketplace for trading securities, options, futures, or commodities.
expense ratio The amount that is taken from the fund’s assets each year to cover the operating expenses. An expense ratio of 0.50% means that a fund’s expenses amount to half of one percent of its average net assets a year.
Global Depositary Receipt (GDR) A negotiable security (receipt) that is issued by a foreign bank, and that represents shares of foreign-based corporations.
gross domestic product (GDP) The output of goods and services produced by labor and property located in the United States.
inception date The date that the shares began trading in the secondary market.
indicative optimized portfolio value (IOPV) A calculation disseminated by the stock exchange that approximates the fund’s NAV every 15 seconds throughout the trading day.
liquidity The ability to convert a security or asset quickly into cash.
market cap, market capitalization The value of a company as determined by the total value of all shares of its stock outstanding.
market price return The return based on the change in market price per share of the fund over a given time period. Market price returns assume that dividends and capital gain distributions have been reinvested in the fund at market price.
median market cap The midpoint of the range of market caps of the stocks held by a fund. There are different ways of calculating median market cap. With a simple median, half of the stocks in the fund’s portfolio would be larger than the median, and half would be smaller. With a weighted median (the type that is calculated for these funds), half of the fund’s assets are invested in stocks that are larger than the median market cap, and half in stocks that are smaller.
MSCI EAFE Index (Net) A free float-adjusted market capitalization index that is designed to measure the equity market performance of developed markets in Europe, Australasia, and the Far East. The Net version of the index reflects reinvested dividends net of withholding taxes, but reflects no deductions for expenses or other taxes; returns are calculated applying dividend withholding rates applicable to non-resident persons who do not benefit from double taxation treaties.
MSCI Emerging Markets Index (Net) A free float-adjusted market capitalization weighted index that is designed to measure equity market performance in the global emerging markets. This series approximates the minimum possible dividend reinvestment. The returns are calculated applying dividend withholding rates applicable to non-resident persons who do not benefit from double taxation treaties.
net asset value (NAV) The value of one share of a fund. NAV is calculated by taking the fund’s total assets, subtracting liabilities, and dividing by the number of shares outstanding.
NAV return The return based on the change in NAV of the fund over a given time period. NAV returns assume that dividends and capital gain distributions have been reinvested in the fund.
offer (ask) The lowest price at which an individual is willing to sell a security.
Schwab Fundamental Index ETFs | Annual Report131
Schwab Fundamental Index ETFs
open The price at which a security opened for trading on a given day.
outstanding shares, shares outstanding When speaking of the fund, indicates all shares currently held by investors.
price-to-book ratio (P/B) The market price of a company’s stock compared with its “book value.” A mutual fund’s P/B is the weighted average of the P/B of all stocks in the fund’s portfolio.
price-to-earnings ratio (P/E) The market price of a company’s stock compared with earnings over the past year. A mutual fund’s P/E is the weighted average of the P/E of all stocks in the fund’s portfolio.
primary market The market that deals with the issuance of new securities.
rights and warrants Rights and warrants are types of securities that entitle the holder to purchase a proportionate amount of common stock at a specified price for a specific period of time. Rights allow a shareholder to buy more shares directly from the company, usually at a price somewhat lower than the current market price of the outstanding shares. Warrants are usually issued with bonds and preferred stock. Rights and warrants can trade on the market separately from the company’s stock. The prices of rights and warrants do not necessarily move parallel to the prices of the underlying common stock. Rights usually expire within a few weeks of issuance, while warrants may not expire for several years. If a right or warrant is not exercised within the specified time period, it will become worthless and a fund will lose the purchase price it paid for the right or warrant and the right to purchase the underlying security.
Russell 1000 Index An index that measures the performance of the 1,000 largest companies in the Russell 3000 Index, and represents approximately 92% of the total market capitalization of the Russell 3000 Index. The Russell 3000 Index measures the performance of the largest 3,000 U.S. companies representing approximately 98% of the investable U.S. equity market.
Russell 2000 Index An index that measures the performance of the 2,000 smallest companies in the Russell 3000 Index. The Russell 3000 Index measures the performance of the largest 3,000 U.S. companies representing approximately 98% of the investable U.S. equity market.
Russell RAFI Developed ex US Large Company Index (Net) An index that ranks developed ex-U.S. companies in the FTSE Global Total Cap Index by fundamental measures of size and tracks the performance of those companies whose fundamental scores are in the top 87.5%. The index uses a partial quarterly reconstitution methodology in which the index is split into four equal segments at the annual reconstitution and each segment is then rebalanced on a rolling quarterly basis. The Net series reduces index performance by adjusting for local taxes. Selecting the developed ex-U.S. companies in the FTSE Global Total Cap Index measures the performance of the largest investable securities in developed countries globally, excluding companies assigned to the United States.
Russell RAFI Developed ex US Small Company Index (Net) An index that ranks developed ex-U.S. companies in the FTSE Global Total Cap Index by fundamental measures of size and tracks the performance of those companies whose fundamental scores rank below the 87.5% threshold. The index uses a partial quarterly reconstitution methodology in which the index is split into four equal segments at the annual reconstitution and each segment is then rebalanced on a rolling quarterly basis. The Net series reduces index performance by adjusting for local taxes. Selecting the developed ex-U.S. companies in the FTSE Global Total Cap Index measures the performance of the smallest investable securities in developed countries globally, excluding companies assigned to the United States.
Russell RAFI Emerging Markets Large Company Index (Net) An index that ranks emerging market companies in the FTSE Global Total Cap Index by measures of fundamental size and tracks the performance of those companies whose fundamental scores are in the top 87.5%. The index uses a partial quarterly reconstitution methodology in which the index is split into four equal segments at the annual reconstitution and each segment is then rebalanced on a rolling quarterly basis. The Net series reduces index performance by adjusting for local taxes. Selecting the emerging companies in the FTSE Global Total Cap Index measures the performance of the investable securities in emerging markets globally.
Russell RAFI US Index An index that selects, ranks, and weights securities by fundamental measures of company size rather than market capitalization. The index measures the performance of the constituent companies by fundamental overall company scores, which are created using as the universe U.S. companies in the FTSE Global Total Cap Index. Securities are grouped in order of decreasing company score and each company receives a weight based on its percentage of the total scores of the companies. The index uses a partial quarterly reconstitution methodology in which the index is split into four equal segments at the annual reconstitution and each segment is then rebalanced on a rolling quarterly basis.
Russell RAFI US Large Company Index An index that ranks U.S. companies in the FTSE Global Total Cap Index. The Russell RAFI US Large Company Index includes only those securities that are members of the U.S. portion whose fundamental scores are in the top 87.5%. The index uses a partial quarterly reconstitution methodology in which the index is split into four equal segments at the annual reconstitution and each segment is then rebalanced on a rolling quarterly basis.
Russell RAFI US Small Company Index An index that ranks U.S. companies in the FTSE Global Total Cap Index. The Russell RAFI US Small Company Index includes only those securities that are members of the U.S. portion and rank below the 87.5% fundamental score threshold. The index uses a partial quarterly reconstitution methodology in which the index is split into four equal segments at the annual reconstitution and each segment is then rebalanced on a rolling quarterly basis.
S&P 500 Index An index that is designed to measure the performance of 500 leading publicly traded companies from a broad range of industries.
S&P Developed ex-U.S. Small Cap Index (Net) An index composed of the stocks representing the lowest 15% of float-adjusted market cap in each developed market country, excluding the U.S. The returns are calculated applying dividend withholding rates applicable to non-resident persons who do not benefit from double taxation treaties.
sampling If a fund uses a sampling method, the fund will not fully replicate the benchmark index and may hold securities not included in the index. A fund that utilizes a sampling approach may not track the return of the index.
secondary market The market in which investors purchase securities from other investors rather than directly from the issuing companies. Organized exchanges facilitate the trading of securities in the secondary market.
spread The gap between bid and ask prices of a security.
stock A share of ownership, or equity, in the issuing company.
total return The percentage that an investor would have earned or lost on an investment in the fund assuming dividends and distributions were reinvested.
tracking error The difference between the performance of the fund and its benchmark index, positive or negative.
132Schwab Fundamental Index ETFs | Annual Report
Schwab Fundamental Index ETFs
Schwab ETFs
Schwab ETFs are designed to serve as simple low-cost core investment products for a diversified portfolio. These ETFs seek to provide consistent, repeatable performance through a variety of investment strategies that span the equity and fixed income spectrum. The list below shows all currently available Schwab ETFs.
Investors should carefully consider information contained in the prospectus, or if available, the summary prospectus, including investment objectives, risks, charges and expenses before investing. Please call 1-877-824-5615 for a prospectus for any Schwab ETF. Please read the prospectus carefully before you invest. This report must be preceded or accompanied by a current prospectus.
Proxy Voting Policies, Procedures and Results
A description of the proxy voting policies and procedures used to determine how to vote proxies on behalf of the funds is available without charge, upon request, by visiting the Schwab ETFs’ website at www.schwabassetmanagement.com/schwabetfs_prospectus, the SEC’s website at www.sec.gov, or by contacting Schwab ETFs at 1-877-824-5615.
Information regarding how a fund voted proxies relating to portfolio securities during the most recent twelve-month period ended June 30 is available, without charge, by visiting the fund’s website at www.schwabassetmanagement.com/schwabetfs_prospectus or the SEC’s website at www.sec.gov.
Schwab ETFs
U.S. ETFs
Schwab U.S. Broad Market ETF
Schwab 1000 Index® ETF
Schwab U.S. Large-Cap ETF
Schwab U.S. Large-Cap Growth ETF
Schwab U.S. Large-Cap Value ETF
Schwab U.S. Mid-Cap ETF
Schwab U.S. Small-Cap ETF
Schwab U.S. Dividend Equity ETF
Schwab U.S. REIT ETF
International ETFs
Schwab International Dividend Equity ETF
Schwab International Equity ETF
Schwab International Small-Cap Equity ETF
Schwab Emerging Markets Equity ETF
Fixed-Income ETFs
Schwab U.S. TIPS ETF
Schwab Short-Term U.S. Treasury ETF
Schwab Intermediate-Term U.S. Treasury ETF
Schwab Long-Term U.S. Treasury ETF
Schwab U.S. Aggregate Bond ETF
Schwab 1-5 Year Corporate Bond ETF
Schwab 5-10 Year Corporate Bond ETF
Schwab Municipal Bond ETF
Fundamental Index* ETFs
Schwab Fundamental U.S. Broad Market Index ETF
Schwab Fundamental U.S. Large Company Index ETF
Schwab Fundamental U.S. Small Company Index ETF
Schwab Fundamental International Large Company Index ETF
Schwab Fundamental International Small Company Index ETF
Schwab Fundamental Emerging Markets Large Company
Index ETF
Active, Semi-Transparent (Also Known As Non-Transparent) ETF
Schwab Ariel ESG ETF
Thematic ETFs
Schwab Crypto Thematic ETF
Investment Adviser
Charles Schwab Investment Management, Inc., dba Schwab Asset Management
211 Main Street, San Francisco, CA 94105
Schwab ETFs
1-877-824-5615
© 2023 Charles Schwab Investment Management, Inc., dba Schwab Asset Management. All rights reserved.
Printed on recycled paper.
*
FUNDAMENTAL INDEX is a registered trademark of Research Affiliates LLC.
The Schwab Ariel ESG ETF is different from traditional ETFs. Traditional ETFs tell the public what assets they hold each day. This fund will not. This may create additional risks for your investment. For example:
•
You may have to pay more money to trade the fund’s shares. This fund will provide less information to traders, who tend to charge more for trades when they have less information.
•
The price you pay to buy fund shares on an exchange may not match the value of the fund’s portfolio. The same is true when you sell shares. These price differences may be greater for this fund compared to other ETFs because it provides less information to traders.
•
These additional risks may be even greater in bad or uncertain market conditions.
•
The ETF will publish on its website each day a “Proxy Portfolio” designed to help trading in shares of the ETF. While the Proxy Portfolio includes some of the ETF’s holdings, it is not the ETF’s actual portfolio.
The differences between this fund and other ETFs may also have advantages. By keeping certain information about the fund secret, this fund may face less risk that other traders can predict or copy its investment strategy. This may improve the fund’s performance. If other traders are able to copy or predict the fund’s investment strategy, however, this may hurt the fund’s performance.
For additional information regarding the unique attributes and risks of the fund, see Proxy Portfolio Risk, Premium/Discount Risk, Trading Halt Risk, Authorized Participant Concentration Risk, Tracking Error Risk and Shares of the Fund May Trade at Prices Other Than NAV in the Principal Risks and Proxy Portfolio and Proxy Overlap sections of the prospectus and/or the Statement of Additional Information. These risks are discussed on the next page.
Schwab Fundamental Index ETFs
Active semi-transparent ETFs operate differently from other exchange-traded funds (ETFs). Unlike other ETFs, an active semi-transparent ETF does not publicly disclose its entire portfolio composition each business day, which may affect the price at which shares of the ETF trade in the secondary market. Active semi-transparent ETFs have limited public trading history. There can be no assurance that an active trading market will develop, be maintained or operate as intended. There is a risk that the market price of an active semi-transparent ETF may vary significantly from the ETF’s net asset value and that its shares may trade at a wider bid/ask spread and, therefore, cost investors more to trade than shares of other ETFs. These risks are heightened during periods of market disruption or volatility.
Proxy Portfolio Risk: Unlike traditional ETFs, this fund does not disclose its portfolio holdings (Actual Portfolio) daily. The fund instead posts a Proxy Portfolio on its website each day. The Proxy Portfolio is designed to reflect the economic exposures and risk characteristics of the fund’s actual holdings on each trading day, but it is not the same as the fund’s Actual Portfolio. Although the Proxy Portfolio is intended to provide investors with enough information to allow for an effective arbitrage mechanism that will keep the market price of the Fund at or close to the underlying NAV per Share of the Fund, there is a risk (which may increase during periods of market disruption or volatility) that market prices will vary significantly from the underlying NAV of the fund. ETF trading on the basis of a published Proxy Portfolio may trade at a wider bid/ask spread than ETFs that publish their portfolios on a daily basis, especially during periods of market disruption or volatility, and therefore may cost investors more to trade. Also, while the Fund seeks to benefit from keeping its portfolio information secret, market participants may attempt to use the Proxy Portfolio to identify a Fund’s trading strategy, which if successful, could result in such market participants engaging in certain predatory trading practices that may have the potential to harm the Fund and its shareholders.
Proxy Portfolio Construction: The Proxy Portfolio is designed to recreate the daily performance of the Actual Portfolio. This is achieved by performing a “Factor Model” analysis of the Actual Portfolio. The Factor Model is comprised of three sets of factors or analytical metrics: market-based factors, fundamental factors, and industry/sector factors. The fund uses a “Model Universe” to generate its Proxy Portfolio. The Model Universe is comprised of securities that the fund can purchase and will be a financial index or stated portfolio of securities from which fund investments will be selected. The results of the Factor Model analysis are then applied to the Model Universe. The Proxy Portfolio is then generated as a result of this Model Universe analysis with the Proxy Portfolio being a small sub-set of the Model Universe. The Factor Model is applied to both the Actual Portfolio and the Model Universe to construct the fund’s Proxy Portfolio that performs in a manner substantially identical to the performance of its Actual Portfolio. The Proxy Portfolio will only include investments the fund is permitted to hold. The fund’s SAI contains more information on the Proxy Portfolio and its construction.
Proxy Portfolio and Proxy Overlap Information regarding the contents of the Proxy Portfolio, and the percentage weight overlap between the holdings of the Proxy Portfolio and the fund’s Actual Portfolio holdings that formed the basis for its calculation of NAV at the end of the prior Business Day (the Portfolio Overlap), is available by visiting the fund’s website www.schwabassetmanagement.com.
Because environmental, social and governance (ESG) strategies exclude some securities, ESG-focused products may not be able to take advantage of the same opportunities or market trends as products that do not use such strategies. Additionally, the criteria used to select companies for investment may result in investing in securities, industries or sectors that underperform the market as a whole.
This page is intentionally left blank.
Item 2: Code of Ethics.
| (a) | Registrant has adopted a code of ethics that applies to its principal executive officer, principal financial officer, and any other persons who perform a similar function, regardless of whether these individuals are employed by Registrant or a third party. |
| (c) | During the period covered by the report, no amendments were made to the provisions of this code of ethics. |
| (d) | During the period covered by the report, Registrant did not grant any waivers, including implicit waivers, from the provisions of this code of ethics. |
| (f)(1) | Registrant has filed this code of ethics as an exhibit pursuant to Item 13(a)(1) of Form N-CSR. |
Item 3: Audit Committee Financial Expert.
Registrant’s Board of Trustees has determined that Kimberly S. Patmore, Michael J. Beer and J. Derek Penn, each currently serving on its audit, compliance and valuation committee, are each an “audit committee financial expert,” as such term is defined in Item 3 of Form N-CSR. Each member of Registrant’s audit, compliance and valuation committee is “independent” under the standards set forth in Item 3 of Form N-CSR.
The designation of each of Ms. Patmore, Mr. Beer and Mr. Penn as an “audit committee financial expert” pursuant to Item 3 of Form N-CSR does not (i) impose upon such individual any duties, obligations, or liability that are greater than the duties, obligations and liability imposed upon such individual as a member of Registrant’s audit, compliance and valuation committee or Board of Trustees in the absence of such designation; and (ii) affect the duties, obligations or liability of any other member of Registrant’s audit, compliance and valuation committee or Board of Trustees.
Item 4: Principal Accountant Fees and Services.
Registrant is composed of twenty-nine operational series. Seven series have a fiscal year-end of the last day of February, whose annual financial statements are reported in Item 1, two series have a fiscal year-end of March 31, twelve series have a fiscal year-end of August 31, and eight series have a fiscal year-end of December 31. Principal accountant fees disclosed in Items 4(a)-(d) and 4(g) include fees billed for services rendered to each of the twenty-nine operational series during 2022/2023 and the twenty-seven operational series during 2021/2022, based on their respective 2022/2023 and 2021/2022 fiscal years, as applicable.
The following table presents fees billed by the principal accountant in each of the last two fiscal years for the services rendered to the Funds:
| | | | | | | | | | | | | | |
(a)Audit Fees1 | | (b)Audit-Related Fees | | (c) Tax Fees2 | | (d) All Other Fees |
Fiscal Year 2022/2023 | | Fiscal Year 2021/2022 | | Fiscal Year 2022/2023 | | Fiscal Year 2021/2022 | | Fiscal Year 2022/2023 | | Fiscal Year 2021/2022 | | Fiscal Year 2022/2023 | | Fiscal Year 2021/2022 |
$505,650 | | $468,400 | | $0 | | $0 | | $89,900 | | $83,700 | | $0 | | $0 |
| 1 | The nature of the services includes audit of the registrant’s annual financial statements and normally provided services in connection with regulatory filings for those fiscal years. |
| 2 | The nature of the services includes tax compliance, tax advice and tax planning. |
(e) (1) Registrant’s audit, compliance and valuation committee does not have pre-approval policies and procedures as described in paragraph (c)(7) of Rule 2-01 of Regulation S-X.
(2) There were no services described in each of paragraphs (b) through (d) above that were approved by Registrant’s audit, compliance and valuation committee pursuant to paragraph (c)(7)(i)(C) of Rule 2-01 of Regulation S-X.
(f) Not applicable.
(g) Below are the aggregate non-audit fees billed in each of the last two fiscal years by Registrant’s principal accountant for services rendered to Registrant, to Registrant’s investment adviser, and to any entity controlling, controlled by, or under common control with Registrant’s investment adviser that provides ongoing services to Registrant.
| | |
2022/2023: $2,859,315 | | 2021/2022: $2,523,317 |
(h) During the past fiscal year, all non-audit services provided by Registrant’s principal accountant to either Registrant’s investment adviser or to any entity controlling, controlled by, or under common control with Registrant’s investment adviser that provides ongoing services to Registrant were pre-approved. Included in the audit, compliance and valuation committee’s pre-approval was the review and consideration as to whether the provision of these non-audit services is compatible with maintaining the principal accountant’s independence.
(i) Not applicable.
(j) Not applicable.
Item 5: Audit Committee of Listed Registrants.
The Registrant is a listed issuer as defined in Rule 10A-3 under the Exchange Act and has separately-designated standing audit, compliance and valuation committee established in accordance with Section 3(a)(58)(A) of the Exchange Act. The Registrant’s audit, compliance and valuation committee members are J. Derek Penn, Michael J. Beer and Kimberly S. Patmore.
Item 6: Schedule of Investments.
The schedules of investments are included as part of the report to shareholders filed under Item 1 of this Form.
Item 7: Disclosure of Proxy Voting Policies and Procedures for Closed-End Management Investment Companies.
Not applicable.
Item 8: Portfolio Managers of Closed-End Management Investment Companies.
Not applicable.
Item 9: Purchases of Equity Securities by Closed-End Management Investment Company and Affiliated Purchasers.
Not applicable.
Item 10: Submission of Matters to a Vote of Security Holders.
Not applicable.
Item 11: Controls and Procedures.
| (a) | Based on their evaluation of Registrant’s disclosure controls and procedures, as of a date within 90 days of the filing date, Registrant’s Chief Executive Officer, Jonathan de St. Paer and Registrant’s Chief Financial Officer, Dana Smith, have concluded that Registrant’s disclosure controls and procedures are: (i) reasonably designed to ensure that information required to be disclosed in this report is appropriately communicated to Registrant’s officers to allow timely decisions regarding disclosures required in this report; (ii) reasonably designed to ensure that information required to be disclosed in this report is recorded, processed, summarized and reported in a timely manner; and (iii) are effective in achieving the goals described in (i) and (ii) above. |
| (b) | During the period covered by this report, there have been no changes in Registrant’s internal control over financial reporting that the above officers believe to have materially affected, or to be reasonably likely to materially affect, Registrant’s internal control over financial reporting. |
Item 12: Disclosure of Securities Lending Activities for Closed-End Management Investment Companies.
Not applicable.
Item 13: Exhibits.
Pursuant to the requirements of the Securities Exchange Act of 1934 and the Investment Company Act of 1940, the registrant has duly caused this report to be signed on its behalf by the undersigned, thereunto duly authorized.
(Registrant) Schwab Strategic Trust – Schwab U.S. REIT ETF and Schwab Fundamental Index ETFs
| | |
| |
| By: | | /s/ Jonathan de St. Paer |
| | Jonathan de St. Paer Chief Executive Officer |
| |
| Date: | | April 17, 2023 |
Pursuant to the requirements of the Securities Exchange Act of 1934 and the Investment Company Act of 1940, this report has been signed below by the following persons on behalf of the registrant and in the capacities and on the dates indicated.
| | |
| |
| By: | | /s/ Jonathan de St. Paer |
| | Jonathan de St. Paer Chief Executive Officer |
| |
| Date: | | April 17, 2023 |
| | |
| |
| By: | | /s/ Dana Smith |
| | Dana Smith Chief Financial Officer |
| |
| Date: | | April 17, 2023 |