UNITED STATES
SECURITIES AND EXCHANGE COMMISSION
Washington, D.C. 20549
FORM N-CSR
CERTIFIED SHAREHOLDER REPORT OF REGISTERED
MANAGEMENT INVESTMENT COMPANIES
Investment Company Act file number: 811-22311
Schwab Strategic Trust – Schwab Fixed-Income ETFs and Schwab Municipal Bond ETF
(Exact name of registrant as specified in charter)
211 Main Street, San Francisco, California 94105
(Address of principal executive offices) (Zip code)
Omar Aguilar
Schwab Strategic Trust
211 Main Street, San Francisco, California 94105
(Name and address of agent for service)
Registrant’s telephone number, including area code: (415) 636-7000
Date of fiscal year end: December 31
Date of reporting period: December 31, 2023
Item 1: Report(s) to Stockholders.
Annual Report | December 31, 2023
Schwab Fixed-Income ETFs
| |
Schwab Short-Term U.S. Treasury ETF | |
Schwab Intermediate-Term U.S. Treasury ETF | |
Schwab Long-Term U.S. Treasury ETF | |
Schwab U.S. Aggregate Bond ETF | |
Schwab 1-5 Year Corporate Bond ETF | |
Schwab 5-10 Year Corporate Bond ETF | |
No Action Required – Notice Regarding Shareholder Report Delivery |
Beginning on July 24, 2024, fund shareholder reports will be streamlined to highlight key information deemed important for investors to assess and monitor their fund investments. Other information, including financial statements, will not appear in the streamlined shareholder reports but will available online and delivered free of charge upon request. |
• If you already receive the full shareholder reports, you will receive the streamlined shareholder reports in the same way that you currently receive the full shareholder reports (either in paper or electronically). |
• If you currently receive a notification when a shareholder report is available on a fund’s website, beginning July 24, 2024, you will begin to receive the streamlined shareholder report (in paper). |
This page is intentionally left blank.
Fund investment adviser: Charles Schwab Investment Management, Inc., dba Schwab Asset Management®
Distributor: SEI Investments Distribution Co. (SIDCO)
Schwab Fixed-Income ETFs | Annual Report1
The performance data quoted represents past performance. Past performance does not guarantee future results. Investment returns and principal value of an investment will fluctuate so that an investor’s shares, when sold or redeemed, may be worth more or less than the original cost. Current performance may be lower or higher than the performance data quoted. To obtain performance information current to the most recent month end, please visit www.schwabassetmanagement.com/schwabetfs_prospectus.
Total Returns for the 12 Months Ended December 31, 2023 |
Schwab U.S. TIPS ETF (Ticker Symbol: SCHP) | |
| |
| |
Bloomberg US Treasury Inflation-Linked Bond Index (Series-L)SM | |
ETF Category: Morningstar Inflation-Protected Bond2 | |
| |
| |
Schwab Short-Term U.S. Treasury ETF (Ticker Symbol: SCHO) | |
| |
| |
Bloomberg US Treasury 1-3 Year Index | |
ETF Category: Morningstar Short Government2 | |
| |
| |
Schwab Intermediate-Term U.S. Treasury ETF (Ticker Symbol: SCHR) | |
| |
| |
Bloomberg US Treasury 3-10 Year Index | |
ETF Category: Morningstar Intermediate Government2 | |
| |
| |
Schwab Long-Term U.S. Treasury ETF (Ticker Symbol: SCHQ) | |
| |
| |
Bloomberg US Long Treasury Index | |
ETF Category: Morningstar Long Government2 | |
| |
Total Returns for the 12 Months Ended December 31, 2023 |
Schwab U.S. Aggregate Bond ETF (Ticker Symbol: SCHZ) | |
| |
| |
Bloomberg US Aggregate Bond Index | |
ETF Category: Morningstar Intermediate Core Bond2 | |
| |
| |
Schwab 1-5 Year Corporate Bond ETF (Ticker Symbol: SCHJ) | |
| |
| |
Bloomberg US 1-5 Year Corporate Bond Index | |
ETF Category: Morningstar Short-Term Bond2 | |
| |
| |
Schwab 5-10 Year Corporate Bond ETF (Ticker Symbol: SCHI) | |
| |
| |
Bloomberg US 5-10 Year Corporate Bond Index | |
ETF Category: Morningstar Corporate Bond2 | |
| |
All total returns on this page assume dividends and distributions were reinvested. Index figures do not include trading and management costs, which would lower performance. Indices are unmanaged and cannot be invested in directly. Performance results less than one year are not annualized.
For index definitions, please see the Glossary.
Performance does not reflect the deduction of taxes that a shareholder would pay on fund distributions or on the redemption or sale of fund shares.
Shares are bought and sold at market price, which may be higher or lower than the net asset value (NAV). Brokerage commissions will reduce returns.
Fixed-income securities are subject to increased loss of principal during periods of rising interest rates. An investment in the fund(s) is not insured or guaranteed by the Federal Deposit Insurance Corporation (FDIC) or any other government agency.
U.S. Treasury Inflation-Protected Securities (TIPS) generally have lower yields than conventional fixed rate bonds and will likely decline in price during periods of deflation, which could result in losses.
Index ownership — Bloomberg Index Services Limited. BLOOMBERG® is a trademark and service mark of Bloomberg Finance L.P. and its affiliates (collectively Bloomberg). Bloomberg or Bloomberg’s licensors own all proprietary rights in the Bloomberg Indices. Neither Bloomberg nor Bloomberg’s licensors approves or endorses this material, or guarantees the accuracy or completeness of any information herein, or makes any warranty, express or implied, as to the results to be obtained therefrom and, to the maximum extent allowed by law, neither shall have any liability or responsibility for injury or damages arising in connection therewith.
1
ETF performance must be shown based on both a Market Price and a NAV basis. The fund’s per share NAV is the value of one share of the fund. NAV is calculated by taking the fund’s total assets (including the fair value of securities owned), subtracting liabilities, and dividing by the number of shares outstanding. The NAV Return is based on the NAV of the fund, and the Market Price Return is based on the market price per share of the fund. The price used to calculate market return (Market Price) is determined using the Official Closing Price of the primary stock exchange (generally, 4:00 p.m. Eastern time) and may not represent the returns you would receive if shares were traded at other times. Market Price and NAV returns assume that dividends and capital gain distributions have been reinvested in the fund at Market Price and NAV, respectively.
2
Source for category information: Morningstar, Inc. The Morningstar Category return represents all passively- and actively-managed ETFs and mutual funds within the category as of the report date.
2Schwab Fixed-Income ETFs | Annual Report
The Investment Environment
For the 12-month reporting period ended December 31, 2023, U.S. fixed-income markets rebounded from their losses in 2022. Inflation remained elevated, the U.S. Federal Reserve (Fed) continued to raise interest rates, and the failure of three U.S. regional banks between early March and early May raised concerns about the stability of the banking sector. As the year wore on, inflation began to ease, as did the likelihood of further rate increases. Outside the United States, the ongoing war between Russia and Ukraine and the Israel-Hamas war that broke out following Hamas’ attack on Israel in early October weighed on the global economy. U.S. Treasury yields soared during the period, peaking in October before falling sharply over the final two months of the year. For the reporting period, the Bloomberg US Aggregate Bond Index, representing the broad U.S. bond market, returned 5.53%. The Bloomberg US 1-5 Year Corporate Bond Index and the Bloomberg US 5-10 Year Corporate Bond Index returned 6.20% and 8.84%, respectively, and the Bloomberg US Treasury 1-3 Year Index and the Bloomberg US Treasury 3-10 Year index returned 4.29% and 4.27%, respectively. The Bloomberg US Treasury Inflation-Linked Bond Index (Series-L)SM returned 3.90%.
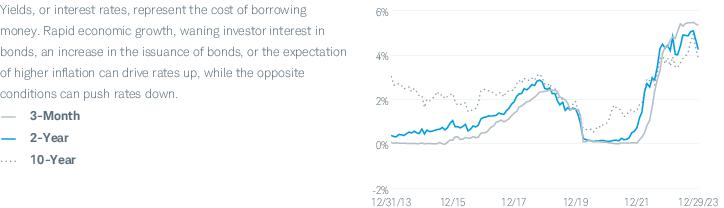
Over the first half of the reporting period, bond yields were volatile, generally following the course of U.S. Treasury yields, with a few short-lived market-moving events. The failure of three U.S. regional banks between early March and early May raised concerns about the stability of the banking sector. In addition, debt ceiling negotiations during the second quarter of 2023 created fear that the federal government could default on its obligations, and on August 1, 2023, Fitch Ratings downgraded long-term U.S. debt from AAA to AA+ after indicating earlier in the year that a country refusing to pay its debts in a timely way was not entitled to a AAA rating. Yields rose throughout the third quarter, peaking early in the fourth quarter and driving bond prices to their lowest levels of the year. (Bond yields and bond prices typically move in opposite directions.) Over the final two months of the year, yields retreated and bond prices rallied to end the year sharply higher. In October, the yield on the 10-year U.S. Treasury briefly touched 5%—a level not seen since 2007—but declined sharply to end the year at 3.88%, where it began the year. The yield on the three-month U.S. Treasury rose from 4.42% to 5.40% over the reporting period resulting in the yield curve inverting for the reporting period.
Yields of U.S. Treasury Securities: Effective Yields of Three-Month, Two-Year and 10-Year Treasuries
Index figures assume dividends and distributions were reinvested. Index figures do not include trading and management costs, which would lower performance. Indices are unmanaged and cannot be invested in directly. Performance results less than one year are not annualized. Past performance is not an indication of future results.
For index definitions, please see the Glossary.
Data source: Bloomberg L.P.
Nothing in this report represents a recommendation of a security by the investment adviser.
Management views may have changed since the report date.
Schwab Fixed-Income ETFs | Annual Report3
The Investment Environment (continued)
The U.S. economy continued to show unexpected resiliency over the reporting period. Surprisingly robust job growth and strong consumer spending helped propel U.S. gross domestic product (GDP) to a 4.9% annualized growth rate for the third quarter of 2023, up from roughly 2% for the prior three quarters. Inflation remained above the Fed’s historical 2% target over the reporting period but declined in the first half of the year, as rents and wage growth eased, profit margins declined, and monetary policy remained restrictive, before ticking up slightly in July through September, declining again in October through November, and then ticking up again in December. The unemployment rate remained low throughout the reporting period.
In its efforts to lower inflation, the Fed raised interest rates four times between January and July, increasing the federal funds rate from a range of 4.25% to 4.50% to a range of 5.25% to 5.50%. At its meetings in June, September, October, and December, the Fed maintained the then current rates citing robust economic activity, strong—though moderating—job gains, and low unemployment while acknowledging tighter financial and credit conditions for households and businesses. The Fed also maintained its program to reduce the assets held on its balance sheet, though its balance sheet temporarily spiked in March when the Fed supported banks after the failure of two U.S. regional banks (a third U.S. regional bank failed in early May). Despite that spike, the Fed’s balance sheet assets declined over the reporting period. Central banks outside the United States also battled with persistently high, albeit waning, inflation. After raising rates six times during the year, the European Central Bank held its rate steady since its October meeting as inflation and pricing pressures finally showed signs of easing. Similarly, the Bank of England maintained its key official bank rate since its September meeting, after five rate hikes through August, with borrowing costs at a 15-year high. In contrast, despite inflationary pressures, the Bank of Japan continued to uphold its short-term interest rate target of -0.1%, unchanged since 2016, but maintained its pledge to ramp up stimulus “without hesitation” if needed.
4Schwab Fixed-Income ETFs | Annual Report
| Matthew Hastings, CFA, Managing Director and Head of Taxable Bond Strategies for Schwab Asset Management, leads the portfolio management team for the Schwab Fixed-Income ETFs and Schwab Taxable Bond Funds. He also has overall responsibility for all aspects of the management of the funds. Prior to joining Schwab in 1999, Mr. Hastings was in fixed-income sales and trading at Lehman Brothers. He has worked in the fixed-income securities industry since 1996. |
| Steven Hung, Senior Portfolio Manager for Schwab Asset Management, is responsible for the day-to-day co-management of the Schwab U.S. Aggregate Bond ETF, Schwab 1-5 Year Corporate Bond ETF and Schwab 5-10 Year Corporate Bond ETF. He is primarily responsible for the management and oversight of corporate bonds within the taxable bond strategies, with additional responsibility for managing municipal bond index strategies. Mr. Hung has been a portfolio manager with Schwab Asset Management since 2005 and prior to that, served in various roles as an associate portfolio manager and trader since 1999. In 1998, he joined Charles Schwab & Co.’s management training program and worked as a clerk on the options trading floor of the Pacific Coast Stock Exchange. |
| Mark McKissick, CFA, Senior Portfolio Manager for Schwab Asset Management, is responsible for the day-to-day co-management of the Schwab U.S. TIPS ETF, Schwab Short-Term U.S. Treasury ETF, Schwab Intermediate-Term U.S. Treasury ETF, Schwab Long-Term U.S. Treasury ETF and Schwab U.S. Aggregate Bond ETF. Prior to joining Schwab in 2016, Mr. McKissick worked at Denver Investments for 17 years, most recently as a director of fixed income and portfolio manager. In this role he co-managed multiple bond strategies, as well as oversaw the firm’s fixed-income business including the investment process, client service and other administrative functions. He also served as a credit/security analyst from 1999 to 2005. Prior to that, he worked as a senior research analyst with Hotchkis & Wiley, a portfolio manager at Payden & Rygel, and a vice president in fixed income at Salomon Brothers. |
| Alfonso Portillo, Jr., Senior Portfolio Manager for Schwab Asset Management, is responsible for the day-to-day co-management of the Schwab U.S. Aggregate Bond ETF. His primary focus is securitized products. Prior to joining Schwab in 2007, Mr. Portillo worked for ten years at Pacific Investment Management Company, most recently as a vice president and member of the mortgage- and asset-backed portfolio management team. He has worked in fixed-income asset management since 1996. |
Schwab Fixed-Income ETFs | Annual Report5
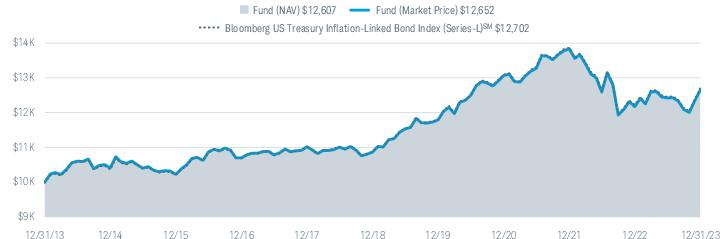
The Schwab U.S. TIPS ETF’s (the fund) goal is to track as closely as possible, before fees and expenses, the total return of an index composed of inflation-protected U.S. Treasury securities. To pursue its goal, the fund generally invests in securities that are included in the Bloomberg US Treasury Inflation-Linked Bond Index (Series-L)SM (the index). For more information about the fund’s investment objective, strategy, and risks, please see the fund’s prospectus.
Market Highlights. For the 12-month reporting period ended December 31, 2023, U.S. fixed-income markets rebounded from their losses in 2022. Inflation remained elevated, the U.S. Federal Reserve (Fed) continued to raise interest rates, and the failure of three U.S. regional banks between early March and early May raised concerns about the stability of the banking sector. As the year wore on, inflation began to ease, as did the likelihood of further rate increases. In its efforts to lower inflation, the U.S. Federal Reserve (Fed) raised interest rates four times between January and July, increasing the federal funds rate from a range of 4.25% to 4.50% to a range of 5.25% to 5.50%. At its meetings in June, September, October, and December, the Fed maintained the then current rates citing robust economic activity, strong—though moderating—job gains, and low unemployment while acknowledging tighter financial and credit conditions for households and businesses. The Fed also maintained its program to reduce the assets held on its balance sheet, though its balance sheet temporarily spiked in March when the Fed supported banks after the failure of two U.S. regional banks (a third U.S. regional bank failed in early May). Despite that spike, the Fed’s balance sheet assets declined over the reporting period.
U.S. Treasury yields, including U.S. Treasury Inflation-Protected Securities (TIPS) yields, were volatile over the reporting period. In October, the yield on the 10-year U.S. Treasury briefly touched 5%—a level not seen since 2007—but declined sharply to end the year at 3.88%, where it began the year. The yield on the 10-year U.S. TIPS began the year at 1.58%, rose to a high of 2.52% in late October, and ended the year at 1.72%.
Performance. Over the 12-month reporting period, the fund tracked the performance of the index. For the 12 months ended December 31, 2023, the fund’s market price return was 3.91% and its NAV return was 3.87% (for an explanation of market price and NAV returns, please refer to footnote 2 on the following page). The index returned 3.90% for the same period. Coupon income generated by the fund’s holdings contributed to fund performance while negative price returns detracted from fund performance, albeit to a much smaller degree.
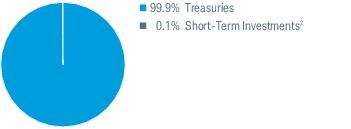
Portfolio Composition % of Investments1
By Security Type
Weighted Average Maturity4 | |
Weighted Average Duration4 | |
Management views and portfolio holdings may have changed since the report date.
An index is a statistical composite of a specified financial market or sector. Unlike the fund, an index does not actually hold a portfolio of securities and its return is not inclusive of operational and transaction costs incurred by the fund.
Fixed-income securities are subject to increased loss of principal during periods of rising interest rates. An investment in the fund is not insured or guaranteed by the Federal Deposit Insurance Corporation (FDIC) or any other government agency.
TIPS generally have lower yields than conventional fixed rate bonds and will likely decline in price during periods of deflation, which could result in losses.
1
The percentage may differ from the Portfolio Holdings because the above calculation is based on a percentage of total investments, whereas the calculation in the Portfolio Holdings is based on a percentage of net assets.
2
Includes the fund’s position in money market mutual funds registered under the Investment Company Act of 1940, as amended.
4
See Glossary for definitions of maturity and duration.
6Schwab Fixed-Income ETFs | Annual Report
Performance and Fund Facts as of December 31, 2023
The performance data quoted represents past performance. Past performance does not guarantee future results. Investment returns and principal value of an investment will fluctuate so that an investor’s shares, when sold or redeemed, may be worth more or less than the original cost. Current performance may be lower or higher than the performance data quoted. To obtain performance information current to the most recent month end, please visit www.schwabassetmanagement.com/schwabetfs_prospectus.
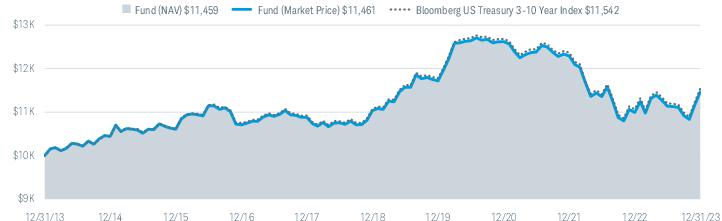
Performance of Hypothetical $10,000 Investment (December 31, 2013 – December 31, 2023)1
Average Annual Total Returns1
| | | |
Fund: Schwab U.S. TIPS ETF (8/5/10) | | | |
| | | |
| | | |
Bloomberg US Treasury Inflation-Linked Bond Index (Series-L)SM | | | |
ETF Category: Morningstar Inflation-Protected Bond3 | | | |
Fund Expense Ratio4: 0.03% |
All total returns on this page assume dividends and distributions were reinvested. Index figures do not include trading and management costs, which would lower performance. Indices are unmanaged and cannot be invested in directly. Performance results less than one year are not annualized.
For index definitions, please see the Glossary.
Shares are bought and sold at market price, which may be higher or lower than the net asset value (NAV). Brokerage commissions will reduce returns.
Index ownership — Bloomberg® and Bloomberg US Treasury Inflation-Linked Bond Index (Series-L)SM are service marks of Bloomberg Finance L.P. and its affiliates, including Bloomberg Index Services Limited (BISL), the administrator of the indices (collectively, Bloomberg). Bloomberg is not affiliated with Charles Schwab Investment Management, Inc., and Bloomberg does not approve, endorse, review, or recommend Schwab U.S. TIPS ETF. Bloomberg does not guarantee the timeliness, accurateness, or completeness of any data or information relating to Schwab U.S. TIPS ETF.
1
Performance does not reflect the deduction of taxes that a shareholder would pay on fund distributions or on the redemption or sale of fund shares.
2
ETF performance must be shown based on both a Market Price and a NAV basis. The fund’s per share NAV is the value of one share of the fund. NAV is calculated by taking the fund’s total assets (including the fair value of securities owned), subtracting liabilities, and dividing by the number of shares outstanding. The NAV Return is based on the NAV of the fund, and the Market Price Return is based on the market price per share of the fund. The price used to calculate market return (Market Price) is determined using the Official Closing Price of the primary stock exchange (generally, 4:00 p.m. Eastern time) and may not represent the returns you would receive if shares were traded at other times. NAV is used as a proxy for purposes of calculating Market Price Return on inception date. Market Price and NAV returns assume that dividends and capital gain distributions have been reinvested in the fund at Market Price and NAV, respectively.
3
Source for category information: Morningstar, Inc. The Morningstar Category return represents all passively- and actively-managed ETFs and mutual funds within the category as of the report date.
4
As stated in the prospectus. Effective September 25, 2023, the management fee was reduced to 0.03%. For more information, see financial note 4 or refer to the prospectus.
Schwab Fixed-Income ETFs | Annual Report7
Schwab Short-Term U.S. Treasury ETF
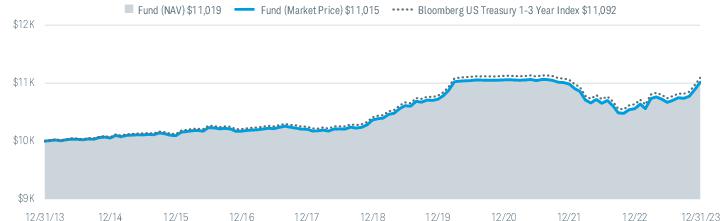
The Schwab Short-Term U.S. Treasury ETF’s (the fund) goal is to track as closely as possible, before fees and expenses, the total return of an index that measures the performance of the short-term U.S. Treasury bond market. To pursue its goal, the fund generally invests in a representative sample of securities that are included in the Bloomberg US Treasury 1-3 Year Index (the index). For more information about the fund’s investment objective, strategy, and risks, please see the fund’s prospectus.
Market Highlights. For the 12-month reporting period ended December 31, 2023, U.S. fixed-income markets rebounded from their losses in 2022. Inflation remained elevated, the U.S. Federal Reserve (Fed) continued to raise interest rates, and the failure of three U.S. regional banks between early March and early May raised concerns about the stability of the banking sector. As the year wore on, inflation began to ease, as did the likelihood of further rate increases. In its efforts to lower inflation, the U.S. Federal Reserve (Fed) raised interest rates four times between January and July, increasing the federal funds rate from a range of 4.25% to 4.50% to a range of 5.25% to 5.50%. At its meetings in June, September, October, and December, the Fed maintained the then current rates citing robust economic activity, strong—though moderating—job gains, and low unemployment while acknowledging tighter financial and credit conditions for households and businesses. The Fed also maintained its program to reduce the assets held on its balance sheet, though its balance sheet temporarily spiked in March when the Fed supported banks after the failure of two U.S. regional banks (a third U.S. regional bank failed in early May). Despite that spike, the Fed’s balance sheet assets declined over the reporting period.
U.S. Treasury yields were volatile over the reporting period. In addition, shorter-term bonds had higher yields than longer-term bonds, an inversion of the yield curve, over the reporting period. The yield on the one-year U.S. Treasury rose from 4.73% to 4.79%, the yield on the two-year U.S. Treasury fell from 4.41% to 4.23%, and the yield on the three-year U.S. Treasury fell from 4.22% to 4.01% over the reporting period.
Performance. Over the 12-month reporting period, the fund tracked the performance of the index. For the 12 months ended December 31, 2023, the fund’s market price return was 4.31% and its and its NAV return was 4.26% (for an explanation of market price and NAV returns, please refer to footnote 2 on the following page). The index returned 4.29% for the same period. The fund’s gains came from both coupon income generated by the fund’s holdings and price appreciation.
Portfolio Composition % of Investments1
By Security Type
Weighted Average Maturity3 | |
Weighted Average Duration3 | |
Management views and portfolio holdings may have changed since the report date.
An index is a statistical composite of a specified financial market or sector. Unlike the fund, an index does not actually hold a portfolio of securities and its return is not inclusive of operational and transaction costs incurred by the fund.
Fixed-income securities are subject to increased loss of principal during periods of rising interest rates. An investment in the fund is not insured or guaranteed by the Federal Deposit Insurance Corporation (FDIC) or any other government agency.
1
The percentage may differ from the Portfolio Holdings because the above calculation is based on a percentage of total investments, whereas the calculation in the Portfolio Holdings is based on a percentage of net assets.
2
Includes the fund’s position in money market mutual funds registered under the Investment Company Act of 1940, as amended.
3
See Glossary for definitions of maturity and duration.
8Schwab Fixed-Income ETFs | Annual Report
Schwab Short-Term U.S. Treasury ETF
Performance and Fund Facts as of December 31, 2023
The performance data quoted represents past performance. Past performance does not guarantee future results. Investment returns and principal value of an investment will fluctuate so that an investor’s shares, when sold or redeemed, may be worth more or less than the original cost. Current performance may be lower or higher than the performance data quoted. To obtain performance information current to the most recent month end, please visit www.schwabassetmanagement.com/schwabetfs_prospectus.
Performance of Hypothetical $10,000 Investment (December 31, 2013 – December 31, 2023)1
Average Annual Total Returns1
| | | |
Fund: Schwab Short-Term U.S. Treasury ETF (8/5/10) | | | |
| | | |
| | | |
Bloomberg US Treasury 1-3 Year Index | | | |
ETF Category: Morningstar Short Government3 | | | |
Fund Expense Ratio4: 0.03% |
All total returns on this page assume dividends and distributions were reinvested. Index figures do not include trading and management costs, which would lower performance. Indices are unmanaged and cannot be invested in directly. Performance results less than one year are not annualized.
For index definitions, please see the Glossary.
Shares are bought and sold at market price, which may be higher or lower than the net asset value (NAV). Brokerage commissions will reduce returns.
Index ownership — Bloomberg® and Bloomberg US Treasury 1-3 Year Index are service marks of Bloomberg Finance L.P. and its affiliates, including Bloomberg Index Services Limited (BISL), the administrator of the indices (collectively, Bloomberg). Bloomberg is not affiliated with Charles Schwab Investment Management, Inc., and Bloomberg does not approve, endorse, review, or recommend Schwab Short-Term U.S. Treasury ETF. Bloomberg does not guarantee the timeliness, accurateness, or completeness of any data or information relating to Schwab Short-Term U.S. Treasury ETF.
1
Performance does not reflect the deduction of taxes that a shareholder would pay on fund distributions or on the redemption or sale of fund shares.
2
ETF performance must be shown based on both a Market Price and a NAV basis. The fund’s per share NAV is the value of one share of the fund. NAV is calculated by taking the fund’s total assets (including the fair value of securities owned), subtracting liabilities, and dividing by the number of shares outstanding. The NAV Return is based on the NAV of the fund, and the Market Price Return is based on the market price per share of the fund. The price used to calculate market return (Market Price) is determined using the Official Closing Price of the primary stock exchange (generally, 4:00 p.m. Eastern time) and may not represent the returns you would receive if shares were traded at other times. NAV is used as a proxy for purposes of calculating Market Price Return on inception date. Market Price and NAV returns assume that dividends and capital gain distributions have been reinvested in the fund at Market Price and NAV, respectively.
3
Source for category information: Morningstar, Inc. The Morningstar Category return represents all passively- and actively-managed ETFs and mutual funds within the category as of the report date.
4
As stated in the prospectus.
Schwab Fixed-Income ETFs | Annual Report9
Schwab Intermediate-Term U.S. Treasury ETF
The Schwab Intermediate-Term U.S. Treasury ETF’s (the fund) goal is to track as closely as possible, before fees and expenses, the total return of an index that measures the performance of the intermediate-term U.S. Treasury bond market. To pursue its goal, the fund generally invests in a representative sample of securities that are included in the Bloomberg US Treasury 3-10 Year Index (the index). For more information about the fund’s investment objective, strategy, and risks, please see the fund’s prospectus.
Market Highlights. For the 12-month reporting period ended December 31, 2023, U.S. fixed-income markets rebounded from their losses in 2022. Inflation remained elevated, the U.S. Federal Reserve (Fed) continued to raise interest rates, and the failure of three U.S. regional banks between early March and early May raised concerns about the stability of the banking sector. As the year wore on, inflation began to ease, as did the likelihood of further rate increases. In its efforts to lower inflation, the U.S. Federal Reserve (Fed) raised interest rates four times between January and July, increasing the federal funds rate from a range of 4.25% to 4.50% to a range of 5.25% to 5.50%. At its meetings in June, September, October, and December, the Fed maintained the then current rates citing robust economic activity, strong—though moderating—job gains, and low unemployment while acknowledging tighter financial and credit conditions for households and businesses. The Fed also maintained its program to reduce the assets held on its balance sheet, though its balance sheet temporarily spiked in March when the Fed supported banks after the failure of two U.S. regional banks (a third U.S. regional bank failed in early May). Despite that spike, the Fed’s balance sheet assets declined over the reporting period.
U.S. Treasury yields were volatile over the reporting period. The yield on the three-year U.S. Treasury fell from 4.22% to 4.01% and the yield on the five-year U.S. Treasury fell from 3.99% to 3.84%. In October, the yield on the 10-year U.S. Treasury briefly touched 5%—a level not seen since 2007—but declined sharply to end the year at 3.88%, where it began the year.
Performance. Over the 12-month reporting period, the fund tracked the performance of the index. For the 12 months ended December 31, 2023, the fund’s market price return was 4.27% and its NAV return was 4.29% (for an explanation of market price and NAV returns, please refer to footnote 2 on the following page). The index returned 4.27% for the same period. The fund’s gains came from both coupon income generated by the fund’s holdings and price appreciation.
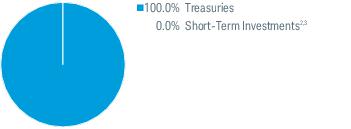
Portfolio Composition % of Investments1
By Security Type
Weighted Average Maturity4 | |
Weighted Average Duration4 | |
Management views and portfolio holdings may have changed since the report date.
An index is a statistical composite of a specified financial market or sector. Unlike the fund, an index does not actually hold a portfolio of securities and its return is not inclusive of operational and transaction costs incurred by the fund.
Fixed-income securities are subject to increased loss of principal during periods of rising interest rates. An investment in the fund is not insured or guaranteed by the Federal Deposit Insurance Corporation (FDIC) or any other government agency.
1
The percentage may differ from the Portfolio Holdings because the above calculation is based on a percentage of total investments, whereas the calculation in the Portfolio Holdings is based on a percentage of net assets.
2
Includes the fund’s position in money market mutual funds registered under the Investment Company Act of 1940, as amended.
4
See Glossary for definitions of maturity and duration.
10Schwab Fixed-Income ETFs | Annual Report
Schwab Intermediate-Term U.S. Treasury ETF
Performance and Fund Facts as of December 31, 2023
The performance data quoted represents past performance. Past performance does not guarantee future results. Investment returns and principal value of an investment will fluctuate so that an investor’s shares, when sold or redeemed, may be worth more or less than the original cost. Current performance may be lower or higher than the performance data quoted. To obtain performance information current to the most recent month end, please visit www.schwabassetmanagement.com/schwabetfs_prospectus.
Performance of Hypothetical $10,000 Investment (December 31, 2013 – December 31, 2023)1
Average Annual Total Returns1
| | | |
Fund: Schwab Intermediate-Term U.S. Treasury ETF (8/5/10) | | | |
| | | |
| | | |
Bloomberg US Treasury 3-10 Year Index | | | |
ETF Category: Morningstar Intermediate Government3 | | | |
Fund Expense Ratio4: 0.03% |
All total returns on this page assume dividends and distributions were reinvested. Index figures do not include trading and management costs, which would lower performance. Indices are unmanaged and cannot be invested in directly. Performance results less than one year are not annualized.
For index definitions, please see the Glossary.
Shares are bought and sold at market price, which may be higher or lower than the net asset value (NAV). Brokerage commissions will reduce returns.
Index ownership — Bloomberg® and Bloomberg US Treasury 3-10 Year Index are service marks of Bloomberg Finance L.P. and its affiliates, including Bloomberg Index Services Limited (BISL), the administrator of the indices (collectively, Bloomberg). Bloomberg is not affiliated with Charles Schwab Investment Management, Inc., and Bloomberg does not approve, endorse, review, or recommend Schwab Intermediate-Term U.S. Treasury ETF. Bloomberg does not guarantee the timeliness, accurateness, or completeness of any data or information relating to Schwab Intermediate-Term U.S. Treasury ETF.
1
Performance does not reflect the deduction of taxes that a shareholder would pay on fund distributions or on the redemption or sale of fund shares.
2
ETF performance must be shown based on both a Market Price and a NAV basis. The fund’s per share NAV is the value of one share of the fund. NAV is calculated by taking the fund’s total assets (including the fair value of securities owned), subtracting liabilities, and dividing by the number of shares outstanding. The NAV Return is based on the NAV of the fund, and the Market Price Return is based on the market price per share of the fund. The price used to calculate market return (Market Price) is determined using the Official Closing Price of the primary stock exchange (generally, 4:00 p.m. Eastern time) and may not represent the returns you would receive if shares were traded at other times. NAV is used as a proxy for purposes of calculating Market Price Return on inception date. Market Price and NAV returns assume that dividends and capital gain distributions have been reinvested in the fund at Market Price and NAV, respectively.
3
Source for category information: Morningstar, Inc. The Morningstar Category return represents all passively- and actively-managed ETFs and mutual funds within the category as of the report date.
4
As stated in the prospectus.
Schwab Fixed-Income ETFs | Annual Report11
Schwab Long-Term U.S. Treasury ETF
The Schwab Long-Term U.S. Treasury ETF’s (the fund) goal is to track as closely as possible, before fees and expenses, the total return of an index that measures the performance of the long-term U.S. Treasury bond market. To pursue its goal, the fund generally invests in a representative sample of securities that are included in the Bloomberg US Long Treasury Index (the index). For more information about the fund’s investment objective, strategy, and risks, please see the fund’s prospectus.
Market Highlights. For the 12-month reporting period ended December 31, 2023, U.S. fixed-income markets rebounded from their losses in 2022. Inflation remained elevated, the U.S. Federal Reserve (Fed) continued to raise interest rates, and the failure of three U.S. regional banks between early March and early May raised concerns about the stability of the banking sector. As the year wore on, inflation began to ease, as did the likelihood of further rate increases. In its efforts to lower inflation, the U.S. Federal Reserve (Fed) raised interest rates four times between January and July, increasing the federal funds rate from a range of 4.25% to 4.50% to a range of 5.25% to 5.50%. At its meetings in June, September, October, and December, the Fed maintained the then current rates citing robust economic activity, strong—though moderating—job gains, and low unemployment while acknowledging tighter financial and credit conditions for households and businesses. The Fed also maintained its program to reduce the assets held on its balance sheet, though its balance sheet temporarily spiked in March when the Fed supported banks after the failure of two U.S. regional banks (a third U.S. regional bank failed in early May). Despite that spike, the Fed’s balance sheet assets declined over the reporting period.
U.S. Treasury yields were volatile over the reporting period. In October, the yield on the 10-year U.S. Treasury briefly touched 5%—a level not seen since 2007—but declined steeply to end the year at 3.88%, where it began the year. The yield on the 30-year U.S. Treasury rose marginally for the reporting period, from 3.97% to 4.03%.
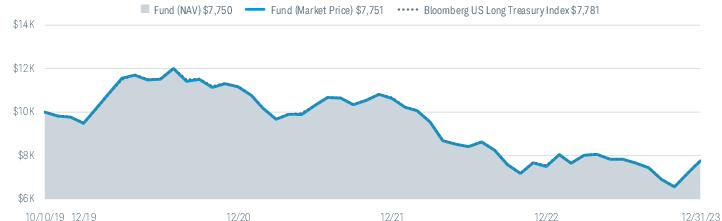
Performance. Over the 12-month reporting period, the fund tracked the performance of the index. For the 12 months ended December 31, 2023, the fund’s market price return was 3.43% and its NAV return was 3.29% (for an explanation of market price and NAV returns, please refer to footnote 2 on the following page). The index returned 3.06% for the same period. A timing difference between the closing time of prices used for the fund’s NAV and of prices used by the index contributed to relative performance. This deviation was temporary as the two pricing methodologies moved back into alignment the following day. Coupon income generated by the fund’s holdings contributed to fund performance while negative price returns detracted from fund performance, albeit to a much smaller degree.
Portfolio Composition % of Investments1
By Security Type
Weighted Average Maturity4 | |
Weighted Average Duration4 | |
Management views and portfolio holdings may have changed since the report date.
An index is a statistical composite of a specified financial market or sector. Unlike the fund, an index does not actually hold a portfolio of securities and its return is not inclusive of operational and transaction costs incurred by the fund.
Fixed-income securities are subject to increased loss of principal during periods of rising interest rates. An investment in the fund is not insured or guaranteed by the Federal Deposit Insurance Corporation (FDIC) or any other government agency.
1
The percentage may differ from the Portfolio Holdings because the above calculation is based on a percentage of total investments, whereas the calculation in the Portfolio Holdings is based on a percentage of net assets.
2
Includes the fund’s position in money market mutual funds registered under the Investment Company Act of 1940, as amended.
4
See Glossary for definitions of maturity and duration.
12Schwab Fixed-Income ETFs | Annual Report
Schwab Long-Term U.S. Treasury ETF
Performance and Fund Facts as of December 31, 2023
The performance data quoted represents past performance. Past performance does not guarantee future results. Investment returns and principal value of an investment will fluctuate so that an investor’s shares, when sold or redeemed, may be worth more or less than the original cost. Current performance may be lower or higher than the performance data quoted. To obtain performance information current to the most recent month end, please visit www.schwabassetmanagement.com/schwabetfs_prospectus.
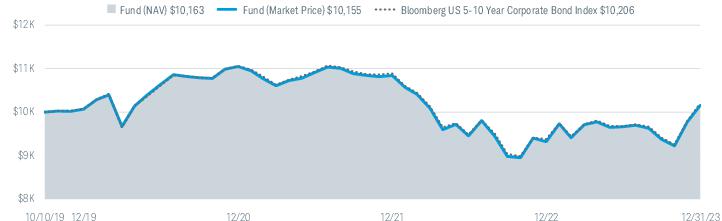
Performance of Hypothetical $10,000 Investment (October 10, 2019 – December 31, 2023)1
Average Annual Total Returns1
| | | |
Fund: Schwab Long-Term U.S. Treasury ETF (10/10/19) | | | |
| | | |
| | | |
Bloomberg US Long Treasury Index | | | |
ETF Category: Morningstar Long Government3 | | | |
Fund Expense Ratio4: 0.03% |
All total returns on this page assume dividends and distributions were reinvested. Index figures do not include trading and management costs, which would lower performance. Indices are unmanaged and cannot be invested in directly. Performance results less than one year are not annualized.
For index definitions, please see the Glossary.
Shares are bought and sold at market price, which may be higher or lower than the net asset value (NAV). Brokerage commissions will reduce returns.
Index ownership — Bloomberg® and Bloomberg US Long Treasury Index are service marks of Bloomberg Finance L.P. and its affiliates, including Bloomberg Index Services Limited (BISL), the administrator of the indices (collectively, Bloomberg). Bloomberg is not affiliated with Charles Schwab Investment Management, Inc., and Bloomberg does not approve, endorse, review, or recommend Schwab Long-Term U.S. Treasury ETF. Bloomberg does not guarantee the timeliness, accurateness, or completeness of any data or information relating to Schwab Long-Term U.S. Treasury ETF.
*
Inception (10/10/19) represents the date that the shares began trading in the secondary market.
1
Performance does not reflect the deduction of taxes that a shareholder would pay on fund distributions or on the redemption or sale of fund shares.
2
ETF performance must be shown based on both a Market Price and a NAV basis. The fund’s per share NAV is the value of one share of the fund. NAV is calculated by taking the fund’s total assets (including the fair value of securities owned), subtracting liabilities, and dividing by the number of shares outstanding. The NAV Return is based on the NAV of the fund, and the Market Price Return is based on the market price per share of the fund. The price used to calculate market return (Market Price) is determined using the Official Closing Price of the primary stock exchange (generally, 4:00 p.m. Eastern time) and may not represent the returns you would receive if shares were traded at other times. NAV is used as a proxy for purposes of calculating Market Price Return on inception date. Market Price and NAV returns assume that dividends and capital gain distributions have been reinvested in the fund at Market Price and NAV, respectively.
3
Source for category information: Morningstar, Inc. The Morningstar Category return represents all passively- and actively-managed ETFs and mutual funds within the category as of the report date.
4
As stated in the prospectus.
Schwab Fixed-Income ETFs | Annual Report13
Schwab U.S. Aggregate Bond ETF
The Schwab U.S. Aggregate Bond ETF’s (the fund) goal is to track as closely as possible, before fees and expenses, the total return of an index that measures the performance of the broad U.S. investment-grade bond market. To pursue its goal, the fund generally invests in a representative sample of securities that are included in the Bloomberg US Aggregate Bond Index (the index). In addition, for the 12-month reporting period ended December 31, 2023, the fund also held positions in TBAs, or “to be announced” securities. TBAs are mortgage-backed bonds that settle on a forward date and are used to gain exposure to the mortgage market. The average month-end position in these securities was 2.1% of the fund, with a minimum exposure of 1.9% and a maximum exposure of 2.7%. For more information about the fund’s investment objective, strategy, and risks, please see the fund’s prospectus.
Market Highlights. For the 12-month reporting period ended December 31, 2023, U.S. fixed-income markets rebounded from their losses in 2022. Inflation remained elevated, the U.S. Federal Reserve (Fed) continued to raise interest rates, and the failure of three U.S. regional banks between early March and early May raised concerns about the stability of the banking sector. As the year wore on, inflation began to ease, as did the likelihood of further rate increases. In its efforts to lower inflation, the U.S. Federal Reserve (Fed) raised interest rates four times between January and July, increasing the federal funds rate from a range of 4.25% to 4.50% to a range of 5.25% to 5.50%. At its meetings in June, September, October, and December, the Fed maintained the then current rates citing robust economic activity, strong—though moderating—job gains, and low unemployment while acknowledging tighter financial and credit conditions for households and businesses. The Fed also maintained its program to reduce the assets held on its balance sheet, though its balance sheet temporarily spiked in March when the Fed supported banks after the failure of two U.S. regional banks (a third U.S. regional bank failed in early May). Despite that spike, the Fed’s balance sheet assets declined over the reporting period.
Yields were volatile over the reporting period, generally following the course of U.S. Treasury yields. The yield on the three-month U.S. Treasury rose from 4.42% to 5.40% over the reporting period resulting in the yield curve inverting for the reporting period. In October, the yield on the 10-year U.S. Treasury briefly touched 5%—a level not seen since 2007—but declined sharply to end the year at 3.88%, where it began the year. The yield on the 30-year U.S. Treasury rose marginally, from 3.97% to 4.03%. Credit spreads and the mortgage bond option-adjusted spread also experienced elevated volatility over the reporting period.
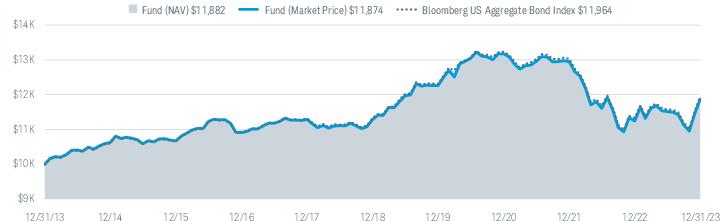
Performance. Over the 12-month reporting period, the fund tracked the performance of the index, which meant keeping the fund’s credit quality, duration, and sector allocations aligned to the index. For the 12 months ended December 31, 2023, the fund’s market price return was 5.60% and its NAV return was 5.53% (for an explanation of market price and NAV returns, please refer to footnote 2 on the following page). The index returned 5.53% for the same period. The fund’s gains came from both coupon income generated by the fund’s holdings and price appreciation.
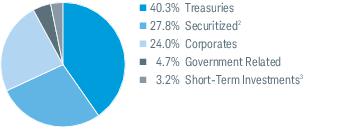
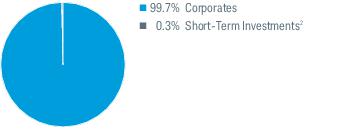
Portfolio Composition % of Investments1
By Security Type
Weighted Average Maturity4 | |
Weighted Average Duration4 | |
Management views and portfolio holdings may have changed since the report date.
An index is a statistical composite of a specified financial market or sector. Unlike the fund, an index does not actually hold a portfolio of securities and its return is not inclusive of operational and transaction costs incurred by the fund.
Fixed-income securities are subject to increased loss of principal during periods of rising interest rates. An investment in the fund is not insured or guaranteed by the Federal Deposit Insurance Corporation (FDIC) or any other government agency.
1
The percentage may differ from the Portfolio Holdings because the above calculation is based on a percentage of total investments, whereas the calculation in the Portfolio Holdings is based on a percentage of net assets.
2
The fund may seek to obtain exposure to U.S. agency mortgage pass-through securities, in part or in full, through the use of “to-be-announced” or “TBA” transactions, which are standardized contracts for future delivery of mortgage pass-through securities in which the exact mortgage pools to be delivered are not specified until a few days prior to settlement. These transactions represented approximately 2.3% of total investments on December 31, 2023.
3
Includes the fund’s position in money market mutual funds registered under the Investment Company Act of 1940, as amended.
4
See Glossary for definitions of maturity and duration.
14Schwab Fixed-Income ETFs | Annual Report
Schwab U.S. Aggregate Bond ETF
Performance and Fund Facts as of December 31, 2023
The performance data quoted represents past performance. Past performance does not guarantee future results. Investment returns and principal value of an investment will fluctuate so that an investor’s shares, when sold or redeemed, may be worth more or less than the original cost. Current performance may be lower or higher than the performance data quoted. To obtain performance information current to the most recent month end, please visit www.schwabassetmanagement.com/schwabetfs_prospectus.
Performance of Hypothetical $10,000 Investment (December 31, 2013 – December 31, 2023)1
Average Annual Total Returns1
| | | |
Fund: Schwab U.S. Aggregate Bond ETF (7/14/11) | | | |
| | | |
| | | |
Bloomberg US Aggregate Bond Index | | | |
ETF Category: Morningstar Intermediate Core Bond3 | | | |
Fund Expense Ratio4: 0.03% |
All total returns on this page assume dividends and distributions were reinvested. Index figures do not include trading and management costs, which would lower performance. Indices are unmanaged and cannot be invested in directly. Performance results less than one year are not annualized.
For index definitions, please see the Glossary.
Shares are bought and sold at market price, which may be higher or lower than the net asset value (NAV). Brokerage commissions will reduce returns.
Index ownership — Bloomberg® and Bloomberg US Aggregate Bond Index are service marks of Bloomberg Finance L.P. and its affiliates, including Bloomberg Index Services Limited (BISL), the administrator of the indices (collectively, Bloomberg). Bloomberg is not affiliated with Charles Schwab Investment Management, Inc., and Bloomberg does not approve, endorse, review, or recommend Schwab U.S. Aggregate Bond ETF. Bloomberg does not guarantee the timeliness, accurateness, or completeness of any data or information relating to Schwab U.S. Aggregate Bond ETF.
1
Performance does not reflect the deduction of taxes that a shareholder would pay on fund distributions or on the redemption or sale of fund shares.
2
ETF performance must be shown based on both a Market Price and a NAV basis. The fund’s per share NAV is the value of one share of the fund. NAV is calculated by taking the fund’s total assets (including the fair value of securities owned), subtracting liabilities, and dividing by the number of shares outstanding. The NAV Return is based on the NAV of the fund, and the Market Price Return is based on the market price per share of the fund. The price used to calculate market return (Market Price) is determined using the Official Closing Price of the primary stock exchange (generally, 4:00 p.m. Eastern time) and may not represent the returns you would receive if shares were traded at other times. NAV is used as a proxy for purposes of calculating Market Price Return on inception date. Market Price and NAV returns assume that dividends and capital gain distributions have been reinvested in the fund at Market Price and NAV, respectively.
3
Source for category information: Morningstar, Inc. The Morningstar Category return represents all passively- and actively-managed ETFs and mutual funds within the category as of the report date.
4
As stated in the prospectus.
Schwab Fixed-Income ETFs | Annual Report15
Schwab 1-5 Year Corporate Bond ETF
The Schwab 1-5 Year Corporate Bond ETF’s (the fund) goal is to track as closely as possible, before fees and expenses, the total return of an index that measures the performance of the short-term U.S. corporate bond market. To pursue its goal, the fund generally invests in a representative sample of securities that are included in the Bloomberg US 1-5 Year Corporate Bond Index (the index). For more information about the fund’s investment objective, strategy, and risks, please see the fund’s prospectus.
Market Highlights. For the 12-month reporting period ended December 31, 2023, U.S. fixed-income markets rebounded from their losses in 2022. Inflation remained elevated, the U.S. Federal Reserve (Fed) continued to raise interest rates, and the failure of three U.S. regional banks between early March and early May raised concerns about the stability of the banking sector. As the year wore on, inflation began to ease, as did the likelihood of further rate increases. In its efforts to lower inflation, the U.S. Federal Reserve (Fed) raised interest rates four times between January and July, increasing the federal funds rate from a range of 4.25% to 4.50% to a range of 5.25% to 5.50%. At its meetings in June, September, October, and December, the Fed maintained the then current rates citing robust economic activity, strong—though moderating—job gains, and low unemployment while acknowledging tighter financial and credit conditions for households and businesses. The Fed also maintained its program to reduce the assets held on its balance sheet, though its balance sheet temporarily spiked in March when the Fed supported banks after the failure of two U.S. regional banks (a third U.S. regional bank failed in early May). Despite that spike, the Fed’s balance sheet assets declined over the reporting period.
U.S. corporate bonds outperformed most other bond categories for the reporting period, with longer-term bonds outperforming shorter-term bonds, but yields were volatile over the reporting period. Rising interest rates in the first half of the year exerted downward pressure on one-to-five-year corporate bond prices, as did the sudden failure of three regional U.S. banks between early March and early May. Prices drifted lower as yields climbed in the third quarter before rising sharply over the final quarter of the year as yields moderated. (Bond yields and bond prices typically move in opposite directions.) Corporate bond spreads—a measure of risk premium—also exhibited elevated volatility over the reporting period and ended the year lower than where they began.
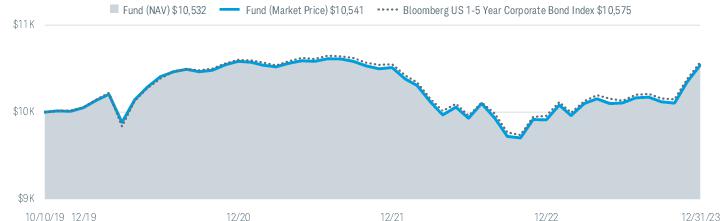
Performance. Over the 12-month reporting period, the fund closely tracked the performance of the index. For the 12 months ended December 31, 2023, the fund’s market price return was 6.36% and its NAV return was 6.14% (for an explanation of market price and NAV returns, please refer to footnote 2 on the following page). The index returned 6.20% for the same period. The fund’s gains came from both coupon income generated by the fund’s holdings and price appreciation.
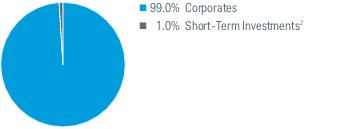
Portfolio Composition % of Investments1
By Security Type
Weighted Average Maturity3 | |
Weighted Average Duration3 | |
Management views and portfolio holdings may have changed since the report date.
An index is a statistical composite of a specified financial market or sector. Unlike the fund, an index does not actually hold a portfolio of securities and its return is not inclusive of operational and transaction costs incurred by the fund.
Fixed-income securities are subject to increased loss of principal during periods of rising interest rates. An investment in the fund is not insured or guaranteed by the Federal Deposit Insurance Corporation (FDIC) or any other government agency.
1
The percentage may differ from the Portfolio Holdings because the above calculation is based on a percentage of total investments, whereas the calculation in the Portfolio Holdings is based on a percentage of net assets.
2
Includes the fund’s position in money market mutual funds registered under the Investment Company Act of 1940, as amended.
3
See Glossary for definitions of maturity and duration.
16Schwab Fixed-Income ETFs | Annual Report
Schwab 1-5 Year Corporate Bond ETF
Performance and Fund Facts as of December 31, 2023
The performance data quoted represents past performance. Past performance does not guarantee future results. Investment returns and principal value of an investment will fluctuate so that an investor’s shares, when sold or redeemed, may be worth more or less than the original cost. Current performance may be lower or higher than the performance data quoted. To obtain performance information current to the most recent month end, please visit www.schwabassetmanagement.com/schwabetfs_prospectus.
Performance of Hypothetical $10,000 Investment (October 10, 2019 – December 31, 2023)1
Average Annual Total Returns1
| | | |
Fund: Schwab 1-5 Year Corporate Bond ETF (10/10/19) | | | |
| | | |
| | | |
Bloomberg US 1-5 Year Corporate Bond Index | | | |
ETF Category: Morningstar Short-Term Bond3 | | | |
Fund Expense Ratio4: 0.03% |
All total returns on this page assume dividends and distributions were reinvested. Index figures do not include trading and management costs, which would lower performance. Indices are unmanaged and cannot be invested in directly. Performance results less than one year are not annualized.
For index definitions, please see the Glossary.
Shares are bought and sold at market price, which may be higher or lower than the net asset value (NAV). Brokerage commissions will reduce returns.
Index ownership — Bloomberg® and Bloomberg US 1-5 Year Corporate Bond Index are service marks of Bloomberg Finance L.P. and its affiliates, including Bloomberg Index Services Limited (BISL), the administrator of the indices (collectively, Bloomberg). Bloomberg is not affiliated with Charles Schwab Investment Management, Inc., and Bloomberg does not approve, endorse, review, or recommend Schwab 1-5 Year Corporate Bond ETF. Bloomberg does not guarantee the timeliness, accurateness, or completeness of any data or information relating to Schwab 1-5 Year Corporate Bond ETF.
*
Inception (10/10/19) represents the date that the shares began trading in the secondary market.
1
Performance does not reflect the deduction of taxes that a shareholder would pay on fund distributions or on the redemption or sale of fund shares.
2
ETF performance must be shown based on both a Market Price and a NAV basis. The fund’s per share NAV is the value of one share of the fund. NAV is calculated by taking the fund’s total assets (including the fair value of securities owned), subtracting liabilities, and dividing by the number of shares outstanding. The NAV Return is based on the NAV of the fund, and the Market Price Return is based on the market price per share of the fund. The price used to calculate market return (Market Price) is determined using the Official Closing Price of the primary stock exchange (generally, 4:00 p.m. Eastern time) and may not represent the returns you would receive if shares were traded at other times. NAV is used as a proxy for purposes of calculating Market Price Return on inception date. Market Price and NAV returns assume that dividends and capital gain distributions have been reinvested in the fund at Market Price and NAV, respectively.
3
Source for category information: Morningstar, Inc. The Morningstar Category return represents all passively- and actively-managed ETFs and mutual funds within the category as of the report date.
4
As stated in the prospectus.
Schwab Fixed-Income ETFs | Annual Report17
Schwab 5-10 Year Corporate Bond ETF
The Schwab 5-10 Year Corporate Bond ETF’s (the fund) goal is to track as closely as possible, before fees and expenses, the total return of an index that measures the performance of the intermediate-term U.S. corporate bond market. To pursue its goal, the fund generally invests in a representative sample of securities that are included in the Bloomberg US 5-10 Year Corporate Bond Index (the index). For more information about the fund’s investment objective, strategy, and risks, please see the fund’s prospectus.
Market Highlights. For the 12-month reporting period ended December 31, 2023, U.S. fixed-income markets rebounded from their losses in 2022. Inflation remained elevated, the U.S. Federal Reserve (Fed) continued to raise interest rates, and the failure of three U.S. regional banks between early March and early May raised concerns about the stability of the banking sector. As the year wore on, inflation began to ease, as did the likelihood of further rate increases. In its efforts to lower inflation, the U.S. Federal Reserve (Fed) raised interest rates four times between January and July, increasing the federal funds rate from a range of 4.25% to 4.50% to a range of 5.25% to 5.50%. At its meetings in June, September, October, and December, the Fed maintained the then current rates citing robust economic activity, strong—though moderating—job gains, and low unemployment while acknowledging tighter financial and credit conditions for households and businesses. The Fed also maintained its program to reduce the assets held on its balance sheet, though its balance sheet temporarily spiked in March when the Fed supported banks after the failure of two U.S. regional banks (a third U.S. regional bank failed in early May). Despite that spike, the Fed’s balance sheet assets declined over the reporting period.
U.S. corporate bonds outperformed most other bond categories for the reporting period, with longer-term bonds outperforming shorter-term bonds, but yields were volatile over the reporting period. Rising interest rates in the first half of the year exerted downward pressure on five-to-10-year corporate bond prices, as did the sudden failure of three regional U.S. banks between early March and early May. Prices drifted lower as yields climbed in the third quarter before rising sharply over the final quarter of the year as yields moderated. (Bond yields and bond typically prices move in opposite directions.) Corporate bond spreads—a measure of risk premium—also exhibited elevated volatility over the reporting period and ended the year lower than where they began.
Performance. Over the 12-month reporting period, the fund closely tracked the performance of the index. For the 12 months ended December 31, 2023, the fund’s market price return was 8.97% and its NAV return was 8.84% (for an explanation of market price and NAV returns, please refer to footnote 2 on the following page). The index returned 8.84% for the same period. The fund’s gains came from both price appreciation and coupon income generated by the fund’s holdings.
Portfolio Composition % of Investments1
By Security Type
Weighted Average Maturity3 | |
Weighted Average Duration3 | |
Management views and portfolio holdings may have changed since the report date.
An index is a statistical composite of a specified financial market or sector. Unlike the fund, an index does not actually hold a portfolio of securities and its return is not inclusive of operational and transaction costs incurred by the fund.
Fixed-income securities are subject to increased loss of principal during periods of rising interest rates. An investment in the fund is not insured or guaranteed by the Federal Deposit Insurance Corporation (FDIC) or any other government agency.
1
The percentage may differ from the Portfolio Holdings because the above calculation is based on a percentage of total investments, excluding derivatives, whereas the calculation in the Portfolio Holdings is based on a percentage of net assets.
2
Includes the fund’s position in money market mutual funds registered under the Investment Company Act of 1940, as amended.
3
See Glossary for definitions of maturity and duration.
18Schwab Fixed-Income ETFs | Annual Report
Schwab 5-10 Year Corporate Bond ETF
Performance and Fund Facts as of December 31, 2023
The performance data quoted represents past performance. Past performance does not guarantee future results. Investment returns and principal value of an investment will fluctuate so that an investor’s shares, when sold or redeemed, may be worth more or less than the original cost. Current performance may be lower or higher than the performance data quoted. To obtain performance information current to the most recent month end, please visit www.schwabassetmanagement.com/schwabetfs_prospectus.
Performance of Hypothetical $10,000 Investment (October 10, 2019 – December 31, 2023)1
Average Annual Total Returns1
| | | |
Fund: Schwab 5-10 Year Corporate Bond ETF (10/10/19) | | | |
| | | |
| | | |
Bloomberg US 5-10 Year Corporate Bond Index | | | |
ETF Category: Morningstar Corporate Bond3 | | | |
Fund Expense Ratio4: 0.03% |
All total returns on this page assume dividends and distributions were reinvested. Index figures do not include trading and management costs, which would lower performance. Indices are unmanaged and cannot be invested in directly. Performance results less than one year are not annualized.
For index definitions, please see the Glossary.
Shares are bought and sold at market price, which may be higher or lower than the net asset value (NAV). Brokerage commissions will reduce returns.
Index ownership — Bloomberg® and Bloomberg US 5-10 Year Corporate Bond Index are service marks of Bloomberg Finance L.P. and its affiliates, including Bloomberg Index Services Limited (BISL), the administrator of the indices (collectively, Bloomberg). Bloomberg is not affiliated with Charles Schwab Investment Management, Inc., and Bloomberg does not approve, endorse, review, or recommend Schwab 5-10 Year Corporate Bond ETF. Bloomberg does not guarantee the timeliness, accurateness, or completeness of any data or information relating to Schwab 5-10 Year Corporate Bond ETF.
*
Inception (10/10/19) represents the date that the shares began trading in the secondary market.
1
Performance does not reflect the deduction of taxes that a shareholder would pay on fund distributions or on the redemption or sale of fund shares.
2
ETF performance must be shown based on both a Market Price and a NAV basis. The fund’s per share NAV is the value of one share of the fund. NAV is calculated by taking the fund’s total assets (including the fair value of securities owned), subtracting liabilities, and dividing by the number of shares outstanding. The NAV Return is based on the NAV of the fund, and the Market Price Return is based on the market price per share of the fund. The price used to calculate market return (Market Price) is determined using the Official Closing Price of the primary stock exchange (generally, 4:00 p.m. Eastern time) and may not represent the returns you would receive if shares were traded at other times. NAV is used as a proxy for purposes of calculating Market Price Return on inception date. Market Price and NAV returns assume that dividends and capital gain distributions have been reinvested in the fund at Market Price and NAV, respectively.
3
Source for category information: Morningstar, Inc. The Morningstar Category return represents all passively- and actively-managed ETFs and mutual funds within the category as of the report date.
4
As stated in the prospectus.
Schwab Fixed-Income ETFs | Annual Report19
Fund Expenses (Unaudited)
Examples for a $1,000 Investment
As a fund shareholder, you may incur two types of costs: (1) transaction costs, including brokerage commissions on purchases and sales of fund shares; and, (2) ongoing costs, including management fees.
The expense examples below are intended to help you understand your ongoing cost (in dollars) of investing in a fund and to compare this cost with the ongoing cost of investing in other mutual funds. These examples are based on an investment of $1,000 invested for six months beginning July 1, 2023 and held through December 31, 2023.
Actual Return lines in the table below provide information about actual account values and actual expenses. You may use this information, together with the amount you invested, to estimate the expenses that you paid over the period. To do so, simply divide your account value by $1,000 (for example, an $8,600 account value ÷ $1,000 = 8.6), then multiply the result by the number given for your fund under the heading entitled “Expenses Paid During Period.”
Hypothetical Return lines in the table below provide information about hypothetical account values and hypothetical expenses based on a fund’s actual expense ratio and an assumed return of 5% per year before expenses. Because the return used is not an actual return, it may not be used to estimate the actual ending account value or expenses you paid for the period.
You may use this information to compare the ongoing costs of investing in a fund and other funds. To do so, compare this 5% hypothetical example with the 5% hypothetical examples that appear in the shareholder reports of the other funds.
Please note that the expenses shown in the table are meant to highlight your ongoing costs only and do not reflect any transactional costs, including any brokerage commissions you may pay when purchasing or selling shares of a fund. Therefore, the hypothetical return lines of the table are useful in comparing ongoing costs only and will not help you determine the relative total costs of owning different funds. In addition, if these transactional costs were included, your costs would have been higher.
| | BEGINNING
ACCOUNT VALUE
AT 7/1/23 | ENDING
ACCOUNT VALUE
(NET OF EXPENSES)
AT 12/31/23 | EXPENSES PAID
DURING PERIOD
|
| | | | |
| | | | |
| | | | |
Schwab Short-Term U.S. Treasury ETF | | | | |
| | | | |
| | | | |
Schwab Intermediate-Term U.S. Treasury ETF | | | | |
| | | | |
| | | | |
Schwab Long-Term U.S. Treasury ETF | | | | |
| | | | |
| | | | |
Schwab U.S. Aggregate Bond ETF | | | | |
| | | | |
| | | | |
Schwab 1-5 Year Corporate Bond ETF | | | | |
| | | | |
| | | | |
Schwab 5-10 Year Corporate Bond ETF | | | | |
| | | | |
| | | | |
| Based on the most recent six-month expense ratio; may differ from the expense ratio provided in the Financial Highlights. Effective September 25, 2023, the advisory fee of the Schwab U.S. TIPS ETF, was reduced to 0.03%. If the fund expense changes had been in place throughout the entire most recent fiscal half-year the expenses paid during the period under the actual return and hypothetical 5% return example would have been $0.15 and $0.15, respectively (see financial note 4). |
| Expenses for each fund are equal to its annualized expense ratio, multiplied by the average account value over the period, multiplied by 184 days in the period, and divided by 365 days in the fiscal year. |
20Schwab Fixed-Income ETFs | Annual Report
Financial Statements
| | | | | | |
|
Net asset value at beginning of period | | | | | | |
Income (loss) from investment operations: | | | | | | |
Net investment income (loss)1 | | | | | | |
Net realized and unrealized gains (losses) | | | | | | |
Total from investment operations | | | | | | |
| | | | | | |
Distributions from net investment income | | | | | | |
Net asset value at end of period | | | | | | |
| | | | | | |
|
Ratios to average net assets: | | | | | | |
| | | | | | |
Net investment income (loss) | | | | | | |
| | | | | | |
Net assets, end of period (x 1,000,000) | | | | | | |
| Calculated based on the average shares outstanding during the period. |
| Effective September 25, 2023, the annual operating expense ratio was reduced to 0.03%. The ratio presented for the period ended December 31, 2023 is a blended ratio (see financial note 4 for additional information). |
| Effective July 1, 2022, the annual operating expense ratio was reduced to 0.04%. The ratio presented for the period ended December 31, 2022 is a blended ratio. |
| Ratio includes less than 0.005% of non-routine proxy expenses. |
| Portfolio turnover rate excludes securities received or delivered from processing of in-kind creations or redemptions. |
Schwab Fixed-Income ETFs | Annual Report21
Portfolio Holdings as of December 31, 2023
This section shows all the securities in the fund’s portfolio and their values as of the report date.
The fund files its complete schedule of portfolio holdings with the U.S. Securities and Exchange Commission (SEC) for the first and third quarters of each fiscal year on Form N-PORT Part F. The fund’s Form N-PORT Part F is available on the SEC’s website at www.sec.gov. You can also obtain this information at no cost on the fund’s website at www.schwabassetmanagement.com/schwabetfs_prospectus, by calling 1-866-414-6349, or by sending an email request to orders@mysummaryprospectus.com. The fund also makes available its complete schedule of portfolio holdings on a daily basis on the fund’s website.
For fixed rate securities, the rate shown is the interest rate (the rate established when the security was issued). The maturity date shown for all the securities is the final legal maturity. Inflation-protected securities are fixed-income securities whose principal value is periodically adjusted by the rate of inflation. The interest rate on these instruments is generally lower at issuance than typical bonds or notes. Over the life of an inflation-indexed instrument interest will be paid based on a principal value, which is adjusted for any inflation or deflation.
SECURITY RATE, MATURITY DATE | | |
TREASURIES 99.7% OF NET ASSETS |
U.S. Treasury Inflation Protected Securities |
| | |
| | |
| | |
| | |
| | |
| | |
| | |
| | |
| | |
| | |
| | |
| | |
| | |
| | |
| | |
| | |
| | |
| | |
| | |
| | |
| | |
| | |
| | |
| | |
| | |
| | |
| | |
| | |
| | |
| | |
| | |
| | |
| | |
SECURITY RATE, MATURITY DATE | | |
| | |
| | |
| | |
| | |
| | |
| | |
| | |
| | |
| | |
| | |
| | |
| | |
| | |
| | |
| | |
Total Treasuries
(Cost $12,611,934,239) | |
| | |
SHORT-TERM INVESTMENTS 0.0% OF NET ASSETS |
|
|
State Street Institutional U.S. Government Money Market Fund, Premier Class 5.32% (a) | | |
Total Short-Term Investments
(Cost $101,762) | |
Total Investments in Securities
(Cost $12,612,036,001) | |
| The rate shown is the annualized 7-day yield. |
22Schwab Fixed-Income ETFs | Annual Report
Portfolio Holdings as of December 31, 2023 (continued)
The following is a summary of the inputs used to value the fund’s investments as of December 31, 2023 (see financial note 2(a) for additional information):
| QUOTED PRICES IN
ACTIVE MARKETS FOR
IDENTICAL ASSETS
(LEVEL 1) | OTHER SIGNIFICANT
OBSERVABLE INPUTS
(LEVEL 2) | SIGNIFICANT
UNOBSERVABLE INPUTS
(LEVEL 3) | |
| | | | |
| | | | |
| | | | |
| | | | |
| As categorized in the Portfolio Holdings. |
Schwab Fixed-Income ETFs | Annual Report23
Statement of Assets and Liabilities
|
Investments in securities, at value - unaffiliated (cost $12,612,036,001) | | |
| | |
| | |
| | |
| | |
| | |
|
|
| | |
| | |
| | |
| | |
| | |
| | |
|
|
Capital received from investors | | |
| | |
| | |
24Schwab Fixed-Income ETFs | Annual Report
Statement of Operations
For the period January 1, 2023 through December 31, 2023 |
|
Interest received from securities - unaffiliated | | |
Dividends received from securities - unaffiliated | | |
| | |
|
|
| | |
| | |
| | |
|
REALIZED AND UNREALIZED GAINS (LOSSES) |
Net realized losses on sales of securities - unaffiliated | | |
Net realized losses on sales of in-kind redemptions - unaffiliated | | |
| | |
Net change in unrealized appreciation (depreciation) on securities - unaffiliated | | |
Net realized and unrealized gains | | |
Increase in net assets resulting from operations | | |
Schwab Fixed-Income ETFs | Annual Report25
Statement of Changes in Net Assets
For the current and prior report periods
|
| | |
| | | |
| | | |
Net change in unrealized appreciation (depreciation) | | | |
Increase (decrease) in net assets resulting from operations | | | |
|
DISTRIBUTIONS TO SHAREHOLDERS |
| | | |
TRANSACTIONS IN FUND SHARES |
| | |
| | | | | |
| | | | | |
| | | | | |
Net transactions in fund shares | | | | | |
|
SHARES OUTSTANDING AND NET ASSETS |
| | |
| | | | | |
| | | | | |
| | | | | |
| | | | | |
26Schwab Fixed-Income ETFs | Annual Report
Schwab Short-Term U.S. Treasury ETF
Financial Statements
| | | | | | |
|
Net asset value at beginning of period | | | | | | |
Income (loss) from investment operations: | | | | | | |
Net investment income (loss)1 | | | | | | |
Net realized and unrealized gains (losses) | | | | | | |
Total from investment operations | | | | | | |
| | | | | | |
Distributions from net investment income | | | | | | |
Net asset value at end of period | | | | | | |
| | | | | | |
|
Ratios to average net assets: | | | | | | |
| | | | | | |
Net investment income (loss) | | | | | | |
| | | | | | |
Net assets, end of period (x 1,000,000) | | | | | | |
| Calculated based on the average shares outstanding during the period. |
| Effective July 1, 2022, the annual operating expense ratio was reduced to 0.03%. The ratio presented for the period ended December 31, 2022 is a blended ratio. |
| Ratio includes less than 0.005% of non-routine proxy expenses. |
| Effective December 20, 2021, the annual operating expense ratio was reduced to 0.04%. The ratio presented for the period ended December 31, 2021 is a blended ratio. |
| Effective December 13, 2019, the annual operating expense ratio was reduced to 0.05%. The ratio presented for the period ended December 31, 2019 is a blended ratio. |
| Portfolio turnover rate excludes securities received or delivered from processing of in-kind creations or redemptions. |
Schwab Fixed-Income ETFs | Annual Report27
Schwab Short-Term U.S. Treasury ETF
Portfolio Holdings as of December 31, 2023
This section shows all the securities in the fund’s portfolio and their values as of the report date.
The fund files its complete schedule of portfolio holdings with the U.S. Securities and Exchange Commission (SEC) for the first and third quarters of each fiscal year on Form N-PORT Part F. The fund’s Form N-PORT Part F is available on the SEC’s website at www.sec.gov. You can also obtain this information at no cost on the fund’s website at www.schwabassetmanagement.com/schwabetfs_prospectus, by calling 1-866-414-6349, or by sending an email request to orders@mysummaryprospectus.com. The fund also makes available its complete schedule of portfolio holdings on a daily basis on the fund’s website.
For fixed rate securities, the rate shown is the interest rate (the rate established when the security was issued). All securities are currently in a fixed rate coupon period based on index eligibility requirements and the fund’s investment objective. Variable rate securities are subject to index requirements and will be removed from the index and fund prior to converting from a fixed rate coupon to a variable rate coupon. The maturity date shown for all the securities is the final legal maturity.
SECURITY RATE, MATURITY DATE | | |
TREASURIES 99.4% OF NET ASSETS |
|
| | |
| | |
| | |
| | |
| | |
|
| | |
| | |
| | |
| | |
| | |
| | |
| | |
| | |
| | |
| | |
| | |
| | |
| | |
| | |
| | |
| | |
| | |
| | |
| | |
| | |
| | |
| | |
| | |
| | |
| | |
| | |
| | |
| | |
| | |
| | |
| | |
| | |
| | |
| | |
| | |
| | |
| | |
| | |
| | |
| | |
| | |
| | |
| | |
| | |
SECURITY RATE, MATURITY DATE | | |
| | |
| | |
| | |
| | |
| | |
| | |
| | |
| | |
| | |
| | |
| | |
| | |
| | |
| | |
| | |
| | |
| | |
| | |
| | |
| | |
| | |
| | |
| | |
| | |
| | |
| | |
| | |
| | |
| | |
| | |
| | |
| | |
| | |
| | |
| | |
| | |
| | |
| | |
| | |
| | |
| | |
| | |
| | |
| | |
| | |
| | |
| | |
| | |
Total Treasuries
(Cost $11,812,172,108) | |
28Schwab Fixed-Income ETFs | Annual Report
Schwab Short-Term U.S. Treasury ETF
Portfolio Holdings as of December 31, 2023 (continued)
| | |
SHORT-TERM INVESTMENTS 0.0% OF NET ASSETS |
|
|
State Street Institutional U.S. Government Money Market Fund, Premier Class 5.32% (a) | | |
Total Short-Term Investments
(Cost $6,844,438) | |
Total Investments in Securities
(Cost $11,819,016,546) | |
| The rate shown is the annualized 7-day yield. |
The following is a summary of the inputs used to value the fund’s investments as of December 31, 2023 (see financial note 2(a) for additional information):
| QUOTED PRICES IN
ACTIVE MARKETS FOR
IDENTICAL ASSETS
(LEVEL 1) | OTHER SIGNIFICANT
OBSERVABLE INPUTS
(LEVEL 2) | SIGNIFICANT
UNOBSERVABLE INPUTS
(LEVEL 3) | |
| | | | |
| | | | |
| | | | |
| | | | |
| As categorized in the Portfolio Holdings. |
Schwab Fixed-Income ETFs | Annual Report29
Schwab Short-Term U.S. Treasury ETF
Statement of Assets and Liabilities
|
Investments in securities, at value - unaffiliated (cost $11,819,016,546) | | |
| | |
| | |
| | |
| | |
| | |
| | |
|
|
| | |
| | |
| | |
| | |
| | |
|
|
Capital received from investors | | |
| | |
| | |
30Schwab Fixed-Income ETFs | Annual Report
Schwab Short-Term U.S. Treasury ETF
Statement of Operations
For the period January 1, 2023 through December 31, 2023 |
|
Interest received from securities - unaffiliated | | |
Dividends received from securities - unaffiliated | | |
| | |
|
|
| | |
| | |
| | |
|
REALIZED AND UNREALIZED GAINS (LOSSES) |
Net realized losses on sales of securities - unaffiliated | | |
Net realized losses on sales of in-kind redemptions - unaffiliated | | |
| | |
Net change in unrealized appreciation (depreciation) on securities - unaffiliated | | |
Net realized and unrealized gains | | |
Increase in net assets resulting from operations | | |
Schwab Fixed-Income ETFs | Annual Report31
Schwab Short-Term U.S. Treasury ETF
Statement of Changes in Net Assets
For the current and prior report periods
|
| | |
| | | |
| | | |
Net change in unrealized appreciation (depreciation) | | | |
Increase (decrease) in net assets resulting from operations | | | |
|
DISTRIBUTIONS TO SHAREHOLDERS |
| | | |
TRANSACTIONS IN FUND SHARES |
| | |
| | | | | |
| | | | | |
| | | | | |
Net transactions in fund shares | | | | | |
|
SHARES OUTSTANDING AND NET ASSETS |
| | |
| | | | | |
| | | | | |
| | | | | |
| | | | | |
32Schwab Fixed-Income ETFs | Annual Report
Schwab Intermediate-Term U.S. Treasury ETF
Financial Statements
| | | | | | |
|
Net asset value at beginning of period | | | | | | |
Income (loss) from investment operations: | | | | | | |
Net investment income (loss)1 | | | | | | |
Net realized and unrealized gains (losses) | | | | | | |
Total from investment operations | | | | | | |
| | | | | | |
Distributions from net investment income | | | | | | |
Net asset value at end of period | | | | | | |
| | | | | | |
|
Ratios to average net assets: | | | | | | |
| | | | | | |
Net investment income (loss) | | | | | | |
| | | | | | |
Net assets, end of period (x 1,000,000) | | | | | | |
| Calculated based on the average shares outstanding during the period. |
| Effective July 1, 2022, the annual operating expense ratio was reduced to 0.03%. The ratio presented for the period ended December 31, 2022 is a blended ratio. |
| Ratio includes less than 0.005% of non-routine proxy expenses. |
| Effective December 20, 2021, the annual operating expense ratio was reduced to 0.04%. The ratio presented for the period ended December 31, 2021 is a blended ratio. |
| Effective December 13, 2019, the annual operating expense ratio was reduced to 0.05%. The ratio presented for the period ended December 31, 2019 is a blended ratio. |
| Portfolio turnover rate excludes securities received or delivered from processing of in-kind creations or redemptions. |
Schwab Fixed-Income ETFs | Annual Report33
Schwab Intermediate-Term U.S. Treasury ETF
Portfolio Holdings as of December 31, 2023
This section shows all the securities in the fund’s portfolio and their values as of the report date.
The fund files its complete schedule of portfolio holdings with the U.S. Securities and Exchange Commission (SEC) for the first and third quarters of each fiscal year on Form N-PORT Part F. The fund’s Form N-PORT Part F is available on the SEC’s website at www.sec.gov. You can also obtain this information at no cost on the fund’s website at www.schwabassetmanagement.com/schwabetfs_prospectus, by calling 1-866-414-6349, or by sending an email request to orders@mysummaryprospectus.com. The fund also makes available its complete schedule of portfolio holdings on a daily basis on the fund’s website.
For fixed rate securities, the rate shown is the interest rate (the rate established when the security was issued). All securities are currently in a fixed rate coupon period based on index eligibility requirements and the fund’s investment objective. Variable rate securities are subject to index requirements and will be removed from the index and fund prior to converting from a fixed rate coupon to a variable rate coupon. The maturity date shown for all the securities is the final legal maturity.
SECURITY RATE, MATURITY DATE | | |
TREASURIES 99.3% OF NET ASSETS |
|
| | |
| | |
| | |
| | |
| | |
| | |
| | |
| | |
| | |
|
| | |
| | |
| | |
| | |
| | |
| | |
| | |
| | |
| | |
| | |
| | |
| | |
| | |
| | |
| | |
| | |
| | |
| | |
| | |
| | |
| | |
| | |
| | |
| | |
| | |
| | |
| | |
| | |
| | |
| | |
| | |
| | |
| | |
| | |
| | |
| | |
| | |
| | |
| | |
| | |
SECURITY RATE, MATURITY DATE | | |
| | |
| | |
| | |
| | |
| | |
| | |
| | |
| | |
| | |
| | |
| | |
| | |
| | |
| | |
| | |
| | |
| | |
| | |
| | |
| | |
| | |
| | |
| | |
| | |
| | |
| | |
| | |
| | |
| | |
| | |
| | |
| | |
| | |
| | |
| | |
| | |
| | |
| | |
| | |
| | |
| | |
| | |
| | |
| | |
| | |
| | |
| | |
| | |
| | |
| | |
| | |
| | |
| | |
34Schwab Fixed-Income ETFs | Annual Report
Schwab Intermediate-Term U.S. Treasury ETF
Portfolio Holdings as of December 31, 2023 (continued)
SECURITY RATE, MATURITY DATE | | |
| | |
| | |
| | |
| | |
| | |
Total Treasuries
(Cost $7,927,955,345) | |
| | |
SHORT-TERM INVESTMENTS 0.0% OF NET ASSETS |
|
|
State Street Institutional U.S. Government Money Market Fund, Premier Class
5.32% (a) | | |
Total Short-Term Investments
(Cost $2,588,319) | |
Total Investments in Securities
(Cost $7,930,543,664) | |
| The rate shown is the annualized 7-day yield. |
The following is a summary of the inputs used to value the fund’s investments as of December 31, 2023 (see financial note 2(a) for additional information):
| QUOTED PRICES IN
ACTIVE MARKETS FOR
IDENTICAL ASSETS
(LEVEL 1) | OTHER SIGNIFICANT
OBSERVABLE INPUTS
(LEVEL 2) | SIGNIFICANT
UNOBSERVABLE INPUTS
(LEVEL 3) | |
| | | | |
| | | | |
| | | | |
| | | | |
| As categorized in the Portfolio Holdings. |
Schwab Fixed-Income ETFs | Annual Report35
Schwab Intermediate-Term U.S. Treasury ETF
Statement of Assets and Liabilities
|
Investments in securities, at value - unaffiliated (cost $7,930,543,664) | | |
| | |
| | |
| | |
| | |
| | |
| | |
|
|
| | |
| | |
| | |
| | |
| | |
|
|
Capital received from investors | | |
| | |
| | |
36Schwab Fixed-Income ETFs | Annual Report
Schwab Intermediate-Term U.S. Treasury ETF
Statement of Operations
For the period January 1, 2023 through December 31, 2023 |
|
Interest received from securities - unaffiliated | | |
Dividends received from securities - unaffiliated | | |
| | |
|
|
| | |
| | |
| | |
|
REALIZED AND UNREALIZED GAINS (LOSSES) |
Net realized losses on sales of securities - unaffiliated | | |
Net realized losses on sales of in-kind redemptions - unaffiliated | | |
| | |
Net change in unrealized appreciation (depreciation) on securities - unaffiliated | | |
Net realized and unrealized gains | | |
Increase in net assets resulting from operations | | |
Schwab Fixed-Income ETFs | Annual Report37
Schwab Intermediate-Term U.S. Treasury ETF
Statement of Changes in Net Assets
For the current and prior report periods
|
| | |
| | | |
| | | |
Net change in unrealized appreciation (depreciation) | | | |
Increase (decrease) in net assets resulting from operations | | | |
|
DISTRIBUTIONS TO SHAREHOLDERS |
| | | |
TRANSACTIONS IN FUND SHARES |
| | |
| | | | | |
| | | | | |
| | | | | |
Net transactions in fund shares | | | | | |
|
SHARES OUTSTANDING AND NET ASSETS |
| | |
| | | | | |
| | | | | |
| | | | | |
| | | | | |
38Schwab Fixed-Income ETFs | Annual Report
Schwab Long-Term U.S. Treasury ETF
Financial Statements
| | | | | | |
|
Net asset value at beginning of period | | | | | | |
Income (loss) from investment operations: | | | | | | |
Net investment income (loss)2 | | | | | | |
Net realized and unrealized gains (losses) | | | | | | |
Total from investment operations | | | | | | |
| | | | | | |
Distributions from net investment income | | | | | | |
Net asset value at end of period | | | | | | |
| | | | | | |
|
Ratios to average net assets: | | | | | | |
| | | | | | |
Net investment income (loss) | | | | | | |
Portfolio turnover rate10 | | | | | | |
Net assets, end of period (x 1,000) | | | | | | |
| Commencement of operations. |
| Calculated based on the average shares outstanding during the period. |
| The per share amount does not accord with the change in aggregate gains and losses in securities during the period because of the timing of fund transactions in relation to fluctuating market values. |
| |
| Effective July 1, 2022, the annual operating expense ratio was reduced to 0.03%. The ratio presented for the period ended December 31, 2022 is a blended ratio. |
| Ratio includes less than 0.005% of non-routine proxy expenses. |
| Effective December 20, 2021, the annual operating expense ratio was reduced to 0.04%. The ratio presented for the period ended December 31, 2021 is a blended ratio. |
| |
| Effective December 13, 2019, the annual operating expense ratio was reduced to 0.05%. The ratio presented for the period ended December 31, 2019 is a blended ratio. |
| Portfolio turnover rate excludes securities received or delivered from processing of in-kind creations or redemptions. |
Schwab Fixed-Income ETFs | Annual Report39
Schwab Long-Term U.S. Treasury ETF
Portfolio Holdings as of December 31, 2023
This section shows all the securities in the fund’s portfolio and their values as of the report date.
The fund files its complete schedule of portfolio holdings with the U.S. Securities and Exchange Commission (SEC) for the first and third quarters of each fiscal year on Form N-PORT Part F. The fund’s Form N-PORT Part F is available on the SEC’s website at www.sec.gov. You can also obtain this information at no cost on the fund’s website at www.schwabassetmanagement.com/schwabetfs_prospectus, by calling 1-866-414-6349, or by sending an email request to orders@mysummaryprospectus.com. The fund also makes available its complete schedule of portfolio holdings on a daily basis on the fund’s website.
For fixed rate securities, the rate shown is the interest rate (the rate established when the security was issued). All securities are currently in a fixed rate coupon period based on index eligibility requirements and the fund’s investment objective. Variable rate securities are subject to index requirements and will be removed from the index and fund prior to converting from a fixed rate coupon to a variable rate coupon. The maturity date shown for all the securities is the final legal maturity.
SECURITY RATE, MATURITY DATE | | |
TREASURIES 99.1% OF NET ASSETS |
|
| | |
| | |
| | |
| | |
| | |
| | |
| | |
| | |
| | |
| | |
| | |
| | |
| | |
| | |
| | |
| | |
| | |
| | |
| | |
| | |
| | |
| | |
| | |
| | |
| | |
| | |
| | |
| | |
| | |
| | |
| | |
| | |
| | |
| | |
| | |
| | |
| | |
| | |
| | |
| | |
| | |
| | |
| | |
| | |
| | |
| | |
| | |
| | |
| | |
SECURITY RATE, MATURITY DATE | | |
| | |
| | |
| | |
| | |
| | |
| | |
| | |
| | |
| | |
| | |
| | |
| | |
| | |
| | |
| | |
| | |
| | |
| | |
| | |
| | |
| | |
| | |
| | |
| | |
| | |
| | |
| | |
| | |
| | |
| | |
| | |
Total Treasuries
(Cost $601,475,202) | |
| | |
SHORT-TERM INVESTMENTS 0.0% OF NET ASSETS |
|
|
State Street Institutional U.S. Government Money Market Fund, Premier Class 5.32% (a) | | |
Total Short-Term Investments
(Cost $1,032) | |
Total Investments in Securities
(Cost $601,476,234) | |
| The rate shown is the annualized 7-day yield. |
40Schwab Fixed-Income ETFs | Annual Report
Schwab Long-Term U.S. Treasury ETF
Portfolio Holdings as of December 31, 2023 (continued)
The following is a summary of the inputs used to value the fund’s investments as of December 31, 2023 (see financial note 2(a) for additional information):
| QUOTED PRICES IN
ACTIVE MARKETS FOR
IDENTICAL ASSETS
(LEVEL 1) | OTHER SIGNIFICANT
OBSERVABLE INPUTS
(LEVEL 2) | SIGNIFICANT
UNOBSERVABLE INPUTS
(LEVEL 3) | |
| | | | |
| | | | |
| | | | |
| | | | |
| As categorized in the Portfolio Holdings. |
Schwab Fixed-Income ETFs | Annual Report41
Schwab Long-Term U.S. Treasury ETF
Statement of Assets and Liabilities
|
Investments in securities, at value - unaffiliated (cost $601,476,234) | | |
| | |
| | |
| | |
| | |
| | |
| | |
| | |
|
|
| | |
| | |
| | |
| | |
| | |
|
|
Capital received from investors | | |
| | |
| | |
42Schwab Fixed-Income ETFs | Annual Report
Schwab Long-Term U.S. Treasury ETF
Statement of Operations
For the period January 1, 2023 through December 31, 2023 |
|
Interest received from securities - unaffiliated | | |
Dividends received from securities - unaffiliated | | |
| | |
|
|
| | |
| | |
| | |
|
REALIZED AND UNREALIZED GAINS (LOSSES) |
Net realized losses on sales of securities - unaffiliated | | |
Net realized gains on sales of in-kind redemptions - unaffiliated | | |
| | |
Net change in unrealized appreciation (depreciation) on securities - unaffiliated | | |
Net realized and unrealized gains | | |
Increase in net assets resulting from operations | | |
Schwab Fixed-Income ETFs | Annual Report43
Schwab Long-Term U.S. Treasury ETF
Statement of Changes in Net Assets
For the current and prior report periods
|
| | |
| | | |
| | | |
Net change in unrealized appreciation (depreciation) | | | |
Increase (decrease) in net assets resulting from operations | | | |
|
DISTRIBUTIONS TO SHAREHOLDERS |
| | | |
TRANSACTIONS IN FUND SHARES |
| | |
| | | | | |
| | | | | |
| | | | | |
Net transactions in fund shares | | | | | |
|
SHARES OUTSTANDING AND NET ASSETS |
| | |
| | | | | |
| | | | | |
| | | | | |
| | | | | |
44Schwab Fixed-Income ETFs | Annual Report
Schwab U.S. Aggregate Bond ETF
Financial Statements
| | | | | | |
|
Net asset value at beginning of period | | | | | | |
Income (loss) from investment operations: | | | | | | |
Net investment income (loss)1 | | | | | | |
Net realized and unrealized gains (losses) | | | | | | |
Total from investment operations | | | | | | |
| | | | | | |
Distributions from net investment income | | | | | | |
Net asset value at end of period | | | | | | |
| | | | | | |
|
Ratios to average net assets: | | | | | | |
| | | | | | |
Net investment income (loss) | | | | | | |
Portfolio turnover rate4,5 | | | | | | |
Net assets, end of period (x 1,000,000) | | | | | | |
| Calculated based on the average shares outstanding during the period. |
| Effective July 1, 2022, the annual operating expense ratio was reduced to 0.03%. The ratio presented for the period ended December 31, 2022 is a blended ratio. |
| Ratio includes less than 0.005% of non-routine proxy expenses. |
| Portfolio turnover rate excludes securities received or delivered from processing of in-kind creations or redemptions. |
| Includes to-be-announced (TBA) transactions. |
Schwab Fixed-Income ETFs | Annual Report45
Schwab U.S. Aggregate Bond ETF
Portfolio Holdings as of December 31, 2023
This section shows all the securities in the fund’s portfolio and their values as of the report date.
The fund files its complete schedule of portfolio holdings with the U.S. Securities and Exchange Commission (SEC) for the first and third quarters of each fiscal year on Form N-PORT Part F. The fund’s Form N-PORT Part F is available on the SEC’s website at www.sec.gov. You can also obtain this information at no cost on the fund’s website at www.schwabassetmanagement.com/schwabetfs_prospectus, by calling 1-866-414-6349, or by sending an email request to orders@mysummaryprospectus.com. The fund also makes available its complete schedule of portfolio holdings on a daily basis on the fund’s website.
All securities are currently in a fixed rate coupon period based on index eligibility requirements and the fund’s investment objective. Generally, for fixed rate securities, the rate shown is the interest rate that was established when the security was issued. In some cases, for securitized products, the fixed interest rate can change but remains index eligible as a fixed rate coupon. Variable rate securities are subject to index requirements and will be removed from the index and fund prior to converting from a fixed rate coupon to a variable rate coupon. The maturity date shown for all the securities is the final legal maturity.
SECURITY RATE, MATURITY DATE | | |
CORPORATES 24.6% OF NET ASSETS |
|
Financial Institutions 8.1% |
|
|
| | |
| | |
| | |
| | |
| | |
| | |
| | |
|
| | |
| | |
| | |
| | |
| | |
| | |
| | |
| | |
| | |
| | |
| | |
| | |
| | |
| | |
| | |
| | |
| | |
| | |
| | |
American Express Credit Corp. |
| | |
Australia & New Zealand Banking Group Ltd. |
| | |
| | |
| | |
| | |
Banco Bilbao Vizcaya Argentaria SA |
| | |
| | |
| | |
| | |
|
| | |
| | |
| | |
| | |
SECURITY RATE, MATURITY DATE | | |
| | |
| | |
| | |
| | |
| | |
| | |
| | |
| | |
| | |
| | |
| | |
| | |
| | |
| | |
|
| | |
| | |
| | |
| | |
| | |
| | |
| | |
| | |
| | |
| | |
| | |
| | |
| | |
| | |
| | |
| | |
| | |
| | |
| | |
| | |
| | |
| | |
| | |
| | |
| | |
| | |
| | |
| | |
| | |
| | |
| | |
| | |
| | |
| | |
| | |
| | |
46Schwab Fixed-Income ETFs | Annual Report
Schwab U.S. Aggregate Bond ETF
Portfolio Holdings as of December 31, 2023 (continued)
SECURITY RATE, MATURITY DATE | | |
| | |
| | |
| | |
| | |
| | |
| | |
| | |
| | |
| | |
| | |
| | |
| | |
| | |
| | |
| | |
| | |
| | |
| | |
| | |
| | |
| | |
| | |
| | |
| | |
| | |
| | |
| | |
| | |
| | |
| | |
| | |
| | |
|
| | |
| | |
| | |
|
| | |
| | |
| | |
| | |
| | |
| | |
| | |
| | |
| | |
| | |
| | |
| | |
| | |
Bank of New York Mellon Corp. |
| | |
| | |
| | |
| | |
| | |
| | |
| | |
| | |
| | |
| | |
| | |
| | |
| | |
| | |
| | |
| | |
SECURITY RATE, MATURITY DATE | | |
| | |
| | |
| | |
| | |
| | |
| | |
| | |
| | |
| | |
| | |
| | |
|
| | |
| | |
| | |
| | |
| | |
| | |
| | |
| | |
| | |
| | |
| | |
| | |
| | |
| | |
| | |
| | |
| | |
| | |
| | |
|
| | |
|
| | |
| | |
|
| | |
| | |
| | |
| | |
| | |
| | |
| | |
| | |
| | |
| | |
| | |
| | |
| | |
| | |
| | |
| | |
| | |
| | |
| | |
| | |
| | |
| | |
| | |
| | |
| | |
| | |
| | |
| | |
| | |
Schwab Fixed-Income ETFs | Annual Report47
Schwab U.S. Aggregate Bond ETF
Portfolio Holdings as of December 31, 2023 (continued)
SECURITY RATE, MATURITY DATE | | |
|
| | |
Canadian Imperial Bank of Commerce |
| | |
| | |
| | |
| | |
| | |
| | |
| | |
| | |
| | |
| | |
Capital One Financial Corp. |
| | |
| | |
| | |
| | |
| | |
| | |
| | |
| | |
| | |
| | |
| | |
| | |
| | |
| | |
| | |
| | |
| | |
| | |
| | |
|
| | |
|
| | |
| | |
|
| | |
| | |
| | |
| | |
| | |
| | |
| | |
| | |
| | |
| | |
| | |
| | |
| | |
| | |
| | |
| | |
| | |
| | |
| | |
| | |
| | |
| | |
| | |
| | |
| | |
| | |
| | |
| | |
SECURITY RATE, MATURITY DATE | | |
| | |
| | |
| | |
| | |
| | |
| | |
| | |
| | |
| | |
| | |
| | |
| | |
| | |
| | |
| | |
| | |
| | |
| | |
| | |
| | |
| | |
| | |
| | |
|
| | |
| | |
Citizens Financial Group, Inc. |
| | |
| | |
| | |
| | |
| | |
| | |
|
| | |
|
| | |
Commonwealth Bank of Australia |
| | |
| | |
| | |
|
| | |
| | |
| | |
| | |
| | |
| | |
| | |
| | |
|
| | |
| | |
| | |
| | |
| | |
| | |
|
| | |
|
| | |
| | |
| | |
| | |
| | |
| | |
48Schwab Fixed-Income ETFs | Annual Report
Schwab U.S. Aggregate Bond ETF
Portfolio Holdings as of December 31, 2023 (continued)
SECURITY RATE, MATURITY DATE | | |
| | |
| | |
| | |
| | |
| | |
| | |
| | |
| | |
| | |
| | |
| | |
| | |
|
| | |
| | |
Discover Financial Services |
| | |
| | |
| | |
| | |
| | |
|
| | |
| | |
| | |
| | |
| | |
| | |
| | |
| | |
|
| | |
| | |
| | |
First Citizens BancShares, Inc. |
| | |
|
| | |
First-Citizens Bank & Trust Co. |
| | |
|
| | |
|
| | |
Goldman Sachs Group, Inc. |
| | |
| | |
| | |
| | |
| | |
| | |
| | |
| | |
| | |
| | |
| | |
| | |
| | |
| | |
| | |
| | |
| | |
| | |
| | |
| | |
| | |
SECURITY RATE, MATURITY DATE | | |
| | |
| | |
| | |
| | |
| | |
| | |
| | |
| | |
| | |
| | |
| | |
| | |
| | |
| | |
| | |
| | |
| | |
| | |
| | |
| | |
|
| | |
| | |
|
| | |
| | |
| | |
| | |
| | |
| | |
| | |
| | |
| | |
| | |
| | |
| | |
| | |
| | |
| | |
| | |
| | |
| | |
| | |
| | |
| | |
| | |
| | |
| | |
| | |
| | |
| | |
| | |
| | |
| | |
| | |
| | |
| | |
| | |
| | |
| | |
| | |
| | |
Huntington Bancshares, Inc. |
| | |
| | |
| | |
| | |
Schwab Fixed-Income ETFs | Annual Report49
Schwab U.S. Aggregate Bond ETF
Portfolio Holdings as of December 31, 2023 (continued)
SECURITY RATE, MATURITY DATE | | |
|
| | |
| | |
|
| | |
| | |
| | |
| | |
| | |
| | |
| | |
| | |
| | |
| | |
|
| | |
| | |
| | |
| | |
| | |
| | |
| | |
| | |
| | |
| | |
| | |
| | |
| | |
| | |
| | |
| | |
| | |
| | |
| | |
| | |
| | |
| | |
| | |
| | |
| | |
| | |
| | |
| | |
| | |
| | |
| | |
| | |
| | |
| | |
| | |
| | |
| | |
| | |
| | |
| | |
| | |
| | |
| | |
| | |
| | |
| | |
| | |
| | |
| | |
| | |
| | |
| | |
SECURITY RATE, MATURITY DATE | | |
| | |
| | |
| | |
| | |
| | |
| | |
| | |
| | |
| | |
| | |
| | |
| | |
| | |
| | |
|
| | |
|
| | |
| | |
| | |
| | |
| | |
| | |
| | |
| | |
|
| | |
| | |
| | |
| | |
| | |
|
| | |
| | |
| | |
| | |
| | |
| | |
| | |
| | |
| | |
| | |
| | |
| | |
| | |
| | |
| | |
| | |
| | |
| | |
| | |
|
| | |
| | |
| | |
Manufacturers & Traders Trust Co. |
| | |
| | |
| | |
| | |
Mitsubishi UFJ Financial Group, Inc. |
| | |
| | |
| | |
| | |
| | |
50Schwab Fixed-Income ETFs | Annual Report
Schwab U.S. Aggregate Bond ETF
Portfolio Holdings as of December 31, 2023 (continued)
SECURITY RATE, MATURITY DATE | | |
| | |
| | |
| | |
| | |
| | |
| | |
| | |
| | |
| | |
| | |
| | |
| | |
| | |
| | |
| | |
| | |
| | |
| | |
| | |
| | |
| | |
| | |
| | |
| | |
| | |
Mizuho Financial Group, Inc. |
| | |
| | |
| | |
| | |
| | |
| | |
| | |
| | |
| | |
| | |
| | |
| | |
| | |
| | |
| | |
| | |
| | |
| | |
| | |
| | |
| | |
|
| | |
| | |
| | |
| | |
| | |
| | |
| | |
| | |
| | |
| | |
| | |
| | |
| | |
| | |
| | |
| | |
| | |
| | |
| | |
SECURITY RATE, MATURITY DATE | | |
| | |
| | |
| | |
| | |
| | |
| | |
| | |
| | |
| | |
| | |
| | |
| | |
| | |
| | |
| | |
| | |
| | |
| | |
| | |
| | |
| | |
| | |
| | |
| | |
| | |
| | |
| | |
| | |
| | |
| | |
| | |
|
| | |
| | |
| | |
National Australia Bank Ltd. |
| | |
| | |
| | |
| | |
| | |
|
| | |
| | |
|
| | |
| | |
| | |
| | |
| | |
| | |
| | |
| | |
| | |
| | |
| | |
|
| | |
| | |
| | |
| | |
| | |
| | |
|
| | |
| | |
Schwab Fixed-Income ETFs | Annual Report51
Schwab U.S. Aggregate Bond ETF
Portfolio Holdings as of December 31, 2023 (continued)
SECURITY RATE, MATURITY DATE | | |
| | |
| | |
| | |
| | |
| | |
PNC Financial Services Group, Inc. |
| | |
| | |
| | |
| | |
| | |
| | |
| | |
| | |
| | |
| | |
| | |
| | |
| | |
| | |
|
| | |
|
| | |
| | |
|
| | |
| | |
| | |
| | |
| | |
| | |
| | |
| | |
| | |
| | |
| | |
| | |
| | |
| | |
| | |
| | |
| | |
Santander Holdings USA, Inc. |
| | |
| | |
| | |
| | |
| | |
| | |
| | |
| | |
Santander U.K. Group Holdings PLC |
| | |
| | |
| | |
| | |
| | |
| | |
|
| | |
| | |
| | |
| | |
| | |
| | |
SECURITY RATE, MATURITY DATE | | |
| | |
| | |
| | |
| | |
| | |
| | |
| | |
| | |
| | |
| | |
| | |
| | |
| | |
Sumitomo Mitsui Banking Corp. |
| | |
Sumitomo Mitsui Financial Group, Inc. |
| | |
| | |
| | |
| | |
| | |
| | |
| | |
| | |
| | |
| | |
| | |
| | |
| | |
| | |
| | |
| | |
| | |
| | |
| | |
| | |
| | |
| | |
| | |
| | |
| | |
| | |
| | |
| | |
| | |
| | |
|
| | |
|
| | |
| | |
| | |
| | |
| | |
| | |
|
| | |
|
| | |
| | |
| | |
| | |
| | |
| | |
| | |
| | |
52Schwab Fixed-Income ETFs | Annual Report
Schwab U.S. Aggregate Bond ETF
Portfolio Holdings as of December 31, 2023 (continued)
SECURITY RATE, MATURITY DATE | | |
| | |
| | |
| | |
| | |
| | |
| | |
| | |
| | |
| | |
| | |
| | |
|
| | |
| | |
| | |
| | |
| | |
| | |
|
| | |
| | |
| | |
| | |
| | |
| | |
| | |
| | |
| | |
| | |
| | |
| | |
| | |
| | |
| | |
| | |
|
| | |
| | |
| | |
| | |
| | |
| | |
| | |
| | |
| | |
| | |
| | |
| | |
| | |
| | |
| | |
| | |
| | |
| | |
|
| | |
| | |
|
| | |
| | |
| | |
| | |
|
| | |
| | |
| | |
SECURITY RATE, MATURITY DATE | | |
|
| | |
| | |
|
| | |
|
| | |
| | |
| | |
| | |
| | |
| | |
| | |
| | |
| | |
| | |
| | |
| | |
| | |
| | |
| | |
| | |
| | |
| | |
| | |
| | |
| | |
| | |
| | |
| | |
| | |
| | |
| | |
| | |
| | |
| | |
| | |
| | |
| | |
| | |
| | |
| | |
| | |
| | |
| | |
|
| | |
| | |
| | |
| | |
| | |
| | |
|
| | |
| | |
| | |
| | |
| | |
| | |
| | |
| | |
| | |
| | |
| | |
| | |
| | |
| | |
Schwab Fixed-Income ETFs | Annual Report53
Schwab U.S. Aggregate Bond ETF
Portfolio Holdings as of December 31, 2023 (continued)
SECURITY RATE, MATURITY DATE | | |
| | |
| | |
| | |
| | |
| | |
| | |
| | |
| | |
|
| | |
|
| | |
| | |
Brokerage/Asset Managers/Exchanges 0.4% |
Affiliated Managers Group, Inc. |
| | |
| | |
Ameriprise Financial, Inc. |
| | |
| | |
| | |
| | |
Apollo Global Management, Inc. |
| | |
|
| | |
|
| | |
| | |
| | |
| | |
| | |
Brookfield Capital Finance LLC |
| | |
|
| | |
Brookfield Finance I U.K. PLC/Brookfield Finance, Inc. |
| | |
Brookfield Finance LLC/Brookfield Finance, Inc. |
| | |
|
| | |
| | |
| | |
| | |
| | |
| | |
| | |
| | |
Cboe Global Markets, Inc. |
| | |
| | |
| | |
|
| | |
| | |
| | |
| | |
| | |
| | |
| | |
| | |
| | |
SECURITY RATE, MATURITY DATE | | |
| | |
| | |
| | |
| | |
| | |
5.64%, 05/19/29 (a)(b)(f) | | |
| | |
| | |
6.20%, 11/17/29 (a)(b)(f) | | |
| | |
| | |
| | |
| | |
| | |
5.85%, 05/19/34 (a)(b)(f) | | |
6.14%, 08/24/34 (a)(b)(f) | | |
|
| | |
| | |
|
| | |
| | |
| | |
| | |
| | |
|
| | |
|
| | |
| | |
| | |
Intercontinental Exchange, Inc. |
| | |
| | |
| | |
| | |
| | |
| | |
| | |
| | |
| | |
| | |
| | |
| | |
| | |
| | |
| | |
|
| | |
| | |
Janus Henderson U.S. Holdings, Inc. |
| | |
Jefferies Financial Group, Inc. |
| | |
| | |
| | |
| | |
| | |
| | |
| | |
| | |
|
| | |
| | |
| | |
| | |
54Schwab Fixed-Income ETFs | Annual Report
Schwab U.S. Aggregate Bond ETF
Portfolio Holdings as of December 31, 2023 (continued)
SECURITY RATE, MATURITY DATE | | |
|
| | |
| | |
|
| | |
|
| | |
| | |
| | |
| | |
| | |
| | |
| | |
| | |
| | |
| | |
|
| | |
| | |
| | |
| | |
| | |
| | |
| | |
| | |
| | |
| | |
Raymond James Financial, Inc. |
| | |
| | |
| | |
|
| | |
| | |
|
AerCap Ireland Capital DAC/AerCap Global Aviation Trust |
| | |
| | |
| | |
| | |
| | |
| | |
| | |
| | |
| | |
| | |
| | |
| | |
| | |
| | |
| | |
| | |
|
| | |
| | |
| | |
| | |
| | |
| | |
| | |
| | |
| | |
| | |
| | |
| | |
SECURITY RATE, MATURITY DATE | | |
| | |
| | |
| | |
|
| | |
|
| | |
| | |
| | |
| | |
| | |
| | |
| | |
Bain Capital Specialty Finance, Inc. |
| | |
BlackRock TCP Capital Corp. |
| | |
Blackstone Private Credit Fund |
| | |
| | |
| | |
| | |
| | |
| | |
Blackstone Secured Lending Fund |
| | |
| | |
| | |
| | |
|
| | |
| | |
| | |
| | |
| | |
| | |
Blue Owl Capital Corp. II |
| | |
Blue Owl Capital Corp. III |
| | |
Blue Owl Credit Income Corp. |
| | |
| | |
| | |
Blue Owl Technology Finance Corp. |
| | |
|
| | |
| | |
| | |
| | |
| | |
|
| | |
| | |
| | |
| | |
| | |
| | |
| | |
| | |
| | |
| | |
Schwab Fixed-Income ETFs | Annual Report55
Schwab U.S. Aggregate Bond ETF
Portfolio Holdings as of December 31, 2023 (continued)
SECURITY RATE, MATURITY DATE | | |
|
| | |
| | |
|
| | |
| | |
|
| | |
Main Street Capital Corp. |
| | |
Morgan Stanley Direct Lending Fund |
| | |
Oaktree Specialty Lending Corp. |
| | |
| | |
|
| | |
| | |
| | |
Sixth Street Specialty Lending, Inc. |
| | |
| | |
|
Andrew W Mellon Foundation |
| | |
|
| | |
| | |
| | |
| | |
| | |
|
|
| | |
|
| | |
|
| | |
| | |
| | |
| | |
| | |
| | |
|
| | |
| | |
| | |
| | |
|
| | |
| | |
Allied World Assurance Co. Holdings Ltd. |
| | |
|
| | |
| | |
| | |
| | |
| | |
| | |
| | |
SECURITY RATE, MATURITY DATE | | |
| | |
| | |
| | |
American Equity Investment Life Holding Co. |
| | |
American Financial Group, Inc. |
| | |
| | |
American International Group, Inc. |
| | |
| | |
| | |
| | |
| | |
| | |
| | |
| | |
| | |
|
| | |
| | |
| | |
| | |
| | |
Aon Corp./Aon Global Holdings PLC |
| | |
| | |
| | |
| | |
|
| | |
| | |
| | |
|
| | |
| | |
|
| | |
Arch Capital Group U.S., Inc. |
| | |
|
| | |
| | |
| | |
| | |
| | |
|
| | |
| | |
| | |
Assured Guaranty U.S. Holdings, Inc. |
| | |
| | |
|
| | |
| | |
| | |
| | |
| | |
|
| | |
AXIS Specialty Finance LLC |
| | |
| | |
56Schwab Fixed-Income ETFs | Annual Report
Schwab U.S. Aggregate Bond ETF
Portfolio Holdings as of December 31, 2023 (continued)
SECURITY RATE, MATURITY DATE | | |
AXIS Specialty Finance PLC |
| | |
Berkshire Hathaway Finance Corp. |
| | |
| | |
| | |
| | |
| | |
| | |
| | |
| | |
| | |
| | |
| | |
| | |
|
| | |
| | |
Brighthouse Financial, Inc. |
| | |
| | |
| | |
| | |
|
| | |
| | |
| | |
| | |
|
| | |
| | |
| | |
| | |
| | |
| | |
| | |
|
| | |
| | |
|
| | |
| | |
| | |
| | |
| | |
| | |
Cincinnati Financial Corp. |
| | |
| | |
|
| | |
| | |
| | |
| | |
CNO Financial Group, Inc. |
| | |
| | |
Corebridge Financial, Inc. |
| | |
| | |
| | |
| | |
| | |
| | |
| | |
SECURITY RATE, MATURITY DATE | | |
|
| | |
| | |
| | |
| | |
| | |
| | |
| | |
| | |
| | |
| | |
| | |
| | |
| | |
| | |
| | |
| | |
| | |
| | |
| | |
| | |
| | |
| | |
| | |
| | |
| | |
| | |
|
| | |
|
| | |
| | |
|
| | |
| | |
Everest Reinsurance Holdings, Inc. |
| | |
| | |
| | |
F&G Annuities & Life, Inc. |
| | |
Fairfax Financial Holdings Ltd. |
| | |
| | |
Fidelity National Financial, Inc. |
| | |
| | |
| | |
| | |
First American Financial Corp. |
| | |
| | |
|
| | |
| | |
| | |
Hanover Insurance Group, Inc. |
| | |
| | |
Hartford Financial Services Group, Inc. |
| | |
| | |
| | |
| | |
| | |
Schwab Fixed-Income ETFs | Annual Report57
Schwab U.S. Aggregate Bond ETF
Portfolio Holdings as of December 31, 2023 (continued)
SECURITY RATE, MATURITY DATE | | |
|
| | |
| | |
| | |
| | |
| | |
| | |
| | |
| | |
| | |
| | |
| | |
| | |
| | |
| | |
| | |
|
| | |
| | |
| | |
| | |
|
| | |
| | |
|
| | |
| | |
| | |
| | |
| | |
| | |
| | |
| | |
| | |
|
| | |
| | |
| | |
| | |
|
| | |
| | |
| | |
| | |
| | |
|
| | |
| | |
| | |
| | |
| | |
| | |
| | |
Marsh & McLennan Cos., Inc. |
| | |
| | |
| | |
| | |
| | |
| | |
| | |
| | |
| | |
| | |
| | |
SECURITY RATE, MATURITY DATE | | |
|
| | |
|
| | |
| | |
| | |
| | |
| | |
| | |
| | |
| | |
| | |
| | |
| | |
| | |
| | |
| | |
|
| | |
Nationwide Financial Services, Inc. |
| | |
Old Republic International Corp. |
| | |
| | |
|
| | |
| | |
|
| | |
Principal Financial Group, Inc. |
| | |
| | |
| | |
| | |
| | |
| | |
|
| | |
| | |
| | |
| | |
| | |
| | |
| | |
| | |
| | |
Prudential Financial, Inc. |
| | |
| | |
| | |
| | |
| | |
| | |
| | |
| | |
| | |
| | |
| | |
| | |
| | |
| | |
| | |
| | |
| | |
| | |
| | |
58Schwab Fixed-Income ETFs | Annual Report
Schwab U.S. Aggregate Bond ETF
Portfolio Holdings as of December 31, 2023 (continued)
SECURITY RATE, MATURITY DATE | | |
Prudential Funding Asia PLC |
| | |
| | |
|
| | |
| | |
Reinsurance Group of America, Inc. |
| | |
| | |
RenaissanceRe Finance, Inc. |
| | |
| | |
RenaissanceRe Holdings Ltd. |
| | |
Selective Insurance Group, Inc. |
| | |
Stewart Information Services Corp. |
| | |
Transatlantic Holdings, Inc. |
| | |
|
| | |
| | |
| | |
| | |
| | |
| | |
| | |
| | |
| | |
| | |
Travelers Property Casualty Corp. |
| | |
|
| | |
|
| | |
| | |
| | |
| | |
| | |
| | |
| | |
| | |
| | |
| | |
| | |
| | |
| | |
| | |
| | |
| | |
| | |
| | |
| | |
| | |
| | |
| | |
| | |
| | |
| | |
| | |
| | |
| | |
| | |
SECURITY RATE, MATURITY DATE | | |
| | |
| | |
| | |
| | |
| | |
| | |
| | |
| | |
| | |
| | |
| | |
| | |
| | |
| | |
| | |
| | |
| | |
| | |
| | |
| | |
|
| | |
| | |
| | |
| | |
|
| | |
| | |
| | |
| | |
|
| | |
| | |
| | |
| | |
Willis North America, Inc. |
| | |
| | |
| | |
| | |
| | |
| | |
|
| | |
| | |
|
|
| | |
| | |
Alexandria Real Estate Equities, Inc. |
| | |
| | |
| | |
| | |
| | |
| | |
| | |
| | |
| | |
| | |
| | |
| | |
| | |
| | |
| | |
Schwab Fixed-Income ETFs | Annual Report59
Schwab U.S. Aggregate Bond ETF
Portfolio Holdings as of December 31, 2023 (continued)
SECURITY RATE, MATURITY DATE | | |
| | |
| | |
|
| | |
|
| | |
| | |
| | |
| | |
| | |
| | |
AvalonBay Communities, Inc. |
| | |
| | |
| | |
| | |
| | |
| | |
| | |
| | |
| | |
| | |
| | |
| | |
|
| | |
| | |
| | |
| | |
| | |
| | |
| | |
| | |
| | |
| | |
Brixmor Operating Partnership LP |
| | |
| | |
| | |
| | |
| | |
| | |
|
| | |
|
| | |
| | |
| | |
| | |
Corporate Office Properties LP |
| | |
| | |
| | |
|
| | |
| | |
| | |
| | |
| | |
|
| | |
| | |
| | |
| | |
SECURITY RATE, MATURITY DATE | | |
|
| | |
| | |
| | |
| | |
|
| | |
| | |
| | |
| | |
| | |
| | |
| | |
| | |
| | |
|
| | |
|
| | |
| | |
| | |
| | |
| | |
| | |
| | |
| | |
| | |
| | |
|
| | |
| | |
| | |
| | |
| | |
| | |
| | |
| | |
|
| | |
| | |
| | |
| | |
| | |
Healthcare Realty Holdings LP |
| | |
| | |
| | |
|
| | |
| | |
| | |
| | |
| | |
| | |
| | |
|
| | |
| | |
| | |
| | |
| | |
|
| | |
| | |
| | |
| | |
60Schwab Fixed-Income ETFs | Annual Report
Schwab U.S. Aggregate Bond ETF
Portfolio Holdings as of December 31, 2023 (continued)
SECURITY RATE, MATURITY DATE | | |
Hudson Pacific Properties LP |
| | |
| | |
| | |
| | |
Invitation Homes Operating Partnership LP |
| | |
| | |
| | |
| | |
| | |
|
| | |
| | |
| | |
| | |
| | |
|
| | |
| | |
| | |
| | |
| | |
| | |
| | |
| | |
|
| | |
|
| | |
| | |
|
| | |
Mid-America Apartments LP |
| | |
| | |
| | |
| | |
| | |
| | |
| | |
National Health Investors, Inc. |
| | |
|
| | |
| | |
| | |
| | |
| | |
| | |
| | |
| | |
Omega Healthcare Investors, Inc. |
| | |
| | |
| | |
| | |
| | |
| | |
| | |
Phillips Edison Grocery Center Operating Partnership I LP |
| | |
|
| | |
| | |
SECURITY RATE, MATURITY DATE | | |
Piedmont Operating Partnership LP |
| | |
| | |
|
| | |
| | |
| | |
| | |
| | |
| | |
| | |
| | |
| | |
| | |
| | |
| | |
| | |
| | |
| | |
| | |
| | |
| | |
Public Storage Operating Co. |
| | |
| | |
| | |
| | |
| | |
| | |
| | |
| | |
|
| | |
| | |
| | |
| | |
| | |
| | |
| | |
| | |
| | |
| | |
| | |
| | |
| | |
| | |
|
| | |
| | |
| | |
| | |
| | |
| | |
Retail Opportunity Investments Partnership LP |
| | |
Rexford Industrial Realty LP |
| | |
|
| | |
| | |
| | |
|
| | |
| | |
Schwab Fixed-Income ETFs | Annual Report61
Schwab U.S. Aggregate Bond ETF
Portfolio Holdings as of December 31, 2023 (continued)
SECURITY RATE, MATURITY DATE | | |
|
| | |
| | |
| | |
| | |
| | |
| | |
| | |
| | |
| | |
| | |
| | |
| | |
| | |
| | |
| | |
| | |
| | |
| | |
| | |
| | |
| | |
|
| | |
| | |
| | |
|
| | |
| | |
| | |
| | |
|
| | |
| | |
| | |
| | |
Sun Communities Operating LP |
| | |
| | |
| | |
|
| | |
| | |
| | |
|
| | |
| | |
| | |
| | |
| | |
|
| | |
| | |
| | |
| | |
| | |
| | |
| | |
| | |
| | |
| | |
| | |
|
| | |
| | |
| | |
SECURITY RATE, MATURITY DATE | | |
| | |
| | |
| | |
| | |
| | |
| | |
|
| | |
| | |
| | |
| | |
| | |
| | |
| | |
|
|
|
Air Products & Chemicals, Inc. |
| | |
| | |
| | |
| | |
| | |
|
| | |
| | |
| | |
AngloGold Ashanti Holdings PLC |
| | |
| | |
|
| | |
| | |
| | |
| | |
| | |
| | |
Barrick North America Finance LLC |
| | |
| | |
Barrick PD Australia Finance Pty. Ltd. |
| | |
BHP Billiton Finance USA Ltd. |
| | |
| | |
| | |
| | |
| | |
| | |
| | |
| | |
| | |
| | |
| | |
|
| | |
Celanese U.S. Holdings LLC |
| | |
| | |
| | |
| | |
| | |
| | |
| | |
62Schwab Fixed-Income ETFs | Annual Report
Schwab U.S. Aggregate Bond ETF
Portfolio Holdings as of December 31, 2023 (continued)
SECURITY RATE, MATURITY DATE | | |
Celulosa Arauco y Constitucion SA |
| | |
| | |
|
| | |
| | |
| | |
|
| | |
| | |
| | |
| | |
| | |
| | |
| | |
| | |
| | |
| | |
| | |
| | |
|
| | |
| | |
| | |
| | |
|
| | |
| | |
| | |
| | |
|
| | |
| | |
| | |
| | |
| | |
| | |
| | |
| | |
|
| | |
| | |
| | |
|
| | |
| | |
| | |
| | |
| | |
|
| | |
| | |
| | |
| | |
| | |
| | |
| | |
| | |
|
| | |
Huntsman International LLC |
| | |
| | |
SECURITY RATE, MATURITY DATE | | |
International Flavors & Fragrances, Inc. |
| | |
| | |
| | |
|
| | |
| | |
| | |
| | |
| | |
| | |
| | |
|
| | |
|
| | |
| | |
| | |
| | |
| | |
|
| | |
LYB International Finance BV |
| | |
| | |
LYB International Finance II BV |
| | |
LYB International Finance III LLC |
| | |
| | |
| | |
| | |
| | |
| | |
| | |
| | |
LyondellBasell Industries NV |
| | |
|
| | |
| | |
| | |
| | |
|
| | |
|
| | |
| | |
| | |
| | |
| | |
| | |
| | |
|
| | |
| | |
| | |
| | |
| | |
| | |
| | |
|
| | |
| | |
| | |
Schwab Fixed-Income ETFs | Annual Report63
Schwab U.S. Aggregate Bond ETF
Portfolio Holdings as of December 31, 2023 (continued)
SECURITY RATE, MATURITY DATE | | |
| | |
| | |
| | |
| | |
| | |
| | |
| | |
| | |
| | |
Packaging Corp. of America |
| | |
| | |
| | |
|
| | |
| | |
| | |
|
| | |
Reliance Steel & Aluminum Co. |
| | |
| | |
|
| | |
| | |
| | |
Rio Tinto Finance USA Ltd. |
| | |
| | |
| | |
Rio Tinto Finance USA PLC |
| | |
| | |
| | |
|
| | |
| | |
|
| | |
| | |
| | |
| | |
| | |
| | |
| | |
| | |
| | |
| | |
|
| | |
| | |
| | |
| | |
| | |
|
| | |
| | |
| | |
| | |
| | |
| | |
|
| | |
| | |
SECURITY RATE, MATURITY DATE | | |
| | |
| | |
Suzano International Finance BV |
| | |
| | |
|
| | |
| | |
| | |
| | |
|
| | |
| | |
| | |
| | |
| | |
|
| | |
| | |
| | |
| | |
| | |
| | |
| | |
|
| | |
|
| | |
| | |
| | |
| | |
| | |
|
| | |
| | |
| | |
| | |
| | |
| | |
|
| | |
| | |
|
|
| | |
| | |
| | |
| | |
| | |
| | |
| | |
| | |
| | |
| | |
| | |
| | |
| | |
|
| | |
| | |
Acuity Brands Lighting, Inc. |
| | |
|
| | |
64Schwab Fixed-Income ETFs | Annual Report
Schwab U.S. Aggregate Bond ETF
Portfolio Holdings as of December 31, 2023 (continued)
SECURITY RATE, MATURITY DATE | | |
Allegion U.S. Holding Co., Inc. |
| | |
|
| | |
| | |
| | |
Amcor Flexibles North America, Inc. |
| | |
| | |
| | |
|
| | |
| | |
| | |
| | |
|
| | |
| | |
| | |
|
| | |
| | |
|
| | |
| | |
| | |
| | |
| | |
| | |
| | |
| | |
| | |
| | |
| | |
| | |
| | |
| | |
| | |
| | |
| | |
| | |
| | |
| | |
| | |
| | |
| | |
| | |
| | |
| | |
| | |
| | |
| | |
| | |
| | |
| | |
| | |
|
| | |
|
| | |
| | |
| | |
| | |
| | |
| | |
| | |
SECURITY RATE, MATURITY DATE | | |
| | |
| | |
Caterpillar Financial Services Corp. |
| | |
| | |
| | |
| | |
| | |
| | |
| | |
| | |
| | |
| | |
| | |
|
| | |
| | |
| | |
| | |
| | |
| | |
| | |
| | |
CNH Industrial Capital LLC |
| | |
| | |
| | |
| | |
|
| | |
|
| | |
| | |
| | |
| | |
| | |
| | |
| | |
|
| | |
| | |
| | |
|
| | |
|
| | |
| | |
| | |
| | |
| | |
| | |
|
| | |
| | |
| | |
| | |
| | |
| | |
| | |
|
| | |
| | |
|
| | |
| | |
Schwab Fixed-Income ETFs | Annual Report65
Schwab U.S. Aggregate Bond ETF
Portfolio Holdings as of December 31, 2023 (continued)
SECURITY RATE, MATURITY DATE | | |
Fortune Brands Innovations, Inc. |
| | |
| | |
| | |
| | |
|
| | |
GE Capital International Funding Co. Unlimited Co. |
| | |
|
| | |
| | |
| | |
| | |
| | |
| | |
| | |
| | |
| | |
| | |
| | |
| | |
|
| | |
| | |
| | |
| | |
|
| | |
| | |
|
| | |
| | |
Honeywell International, Inc. |
| | |
| | |
| | |
| | |
| | |
| | |
| | |
| | |
| | |
| | |
| | |
| | |
| | |
|
| | |
| | |
|
| | |
| | |
| | |
| | |
Huntington Ingalls Industries, Inc. |
| | |
| | |
| | |
| | |
|
| | |
SECURITY RATE, MATURITY DATE | | |
Illinois Tool Works, Inc. |
| | |
| | |
| | |
|
| | |
| | |
|
| | |
| | |
| | |
| | |
| | |
| | |
| | |
| | |
| | |
| | |
| | |
| | |
| | |
| | |
| | |
| | |
| | |
| | |
| | |
| | |
| | |
| | |
| | |
| | |
| | |
Johnson Controls International PLC |
| | |
| | |
| | |
| | |
| | |
Johnson Controls International PLC/Tyco Fire & Security Finance SCA |
| | |
|
| | |
| | |
L3Harris Technologies, Inc. |
| | |
| | |
| | |
| | |
| | |
| | |
| | |
| | |
| | |
| | |
| | |
|
| | |
|
| | |
| | |
| | |
|
| | |
66Schwab Fixed-Income ETFs | Annual Report
Schwab U.S. Aggregate Bond ETF
Portfolio Holdings as of December 31, 2023 (continued)
SECURITY RATE, MATURITY DATE | | |
Lennox International, Inc. |
| | |
| | |
|
| | |
| | |
| | |
| | |
| | |
| | |
| | |
| | |
| | |
| | |
| | |
| | |
| | |
| | |
| | |
| | |
| | |
| | |
| | |
Martin Marietta Materials, Inc. |
| | |
| | |
| | |
| | |
| | |
| | |
|
| | |
| | |
| | |
|
| | |
|
| | |
|
| | |
| | |
| | |
| | |
| | |
| | |
| | |
| | |
| | |
| | |
| | |
| | |
|
| | |
| | |
| | |
|
| | |
| | |
|
| | |
| | |
| | |
| | |
| | |
| | |
SECURITY RATE, MATURITY DATE | | |
|
| | |
| | |
| | |
| | |
| | |
| | |
|
| | |
| | |
| | |
| | |
| | |
| | |
| | |
| | |
|
| | |
Precision Castparts Corp. |
| | |
| | |
| | |
|
| | |
| | |
| | |
| | |
|
| | |
| | |
| | |
| | |
| | |
| | |
| | |
| | |
| | |
| | |
| | |
| | |
| | |
Rockwell Automation, Inc. |
| | |
| | |
| | |
| | |
| | |
|
| | |
| | |
| | |
| | |
| | |
| | |
| | |
| | |
| | |
| | |
| | |
| | |
| | |
| | |
| | |
| | |
| | |
| | |
Schwab Fixed-Income ETFs | Annual Report67
Schwab U.S. Aggregate Bond ETF
Portfolio Holdings as of December 31, 2023 (continued)
SECURITY RATE, MATURITY DATE | | |
| | |
| | |
| | |
| | |
| | |
| | |
| | |
| | |
| | |
| | |
| | |
| | |
| | |
| | |
| | |
|
| | |
| | |
| | |
|
| | |
| | |
| | |
| | |
Stanley Black & Decker, Inc. |
| | |
| | |
| | |
| | |
| | |
| | |
| | |
| | |
| | |
| | |
Teledyne Technologies, Inc. |
| | |
| | |
| | |
|
| | |
| | |
| | |
| | |
| | |
| | |
|
| | |
Trane Technologies Financing Ltd. |
| | |
| | |
| | |
Trane Technologies Global Holding Co. Ltd. |
| | |
| | |
| | |
|
| | |
| | |
|
| | |
| | |
SECURITY RATE, MATURITY DATE | | |
|
| | |
| | |
| | |
|
| | |
| | |
| | |
| | |
| | |
| | |
|
| | |
| | |
| | |
| | |
| | |
| | |
| | |
|
| | |
| | |
| | |
| | |
| | |
| | |
| | |
| | |
| | |
| | |
| | |
| | |
Westinghouse Air Brake Technologies Corp. |
| | |
| | |
| | |
|
| | |
| | |
| | |
|
| | |
| | |
| | |
| | |
| | |
|
|
| | |
| | |
| | |
| | |
| | |
| | |
| | |
|
| | |
| | |
| | |
| | |
| | |
| | |
| | |
| | |
| | |
68Schwab Fixed-Income ETFs | Annual Report
Schwab U.S. Aggregate Bond ETF
Portfolio Holdings as of December 31, 2023 (continued)
SECURITY RATE, MATURITY DATE | | |
| | |
| | |
| | |
| | |
| | |
| | |
| | |
| | |
| | |
| | |
| | |
| | |
| | |
| | |
| | |
| | |
| | |
|
| | |
| | |
| | |
| | |
| | |
| | |
| | |
| | |
| | |
| | |
| | |
| | |
| | |
| | |
| | |
| | |
| | |
| | |
| | |
| | |
| | |
| | |
| | |
| | |
| | |
| | |
| | |
| | |
| | |
| | |
| | |
| | |
| | |
| | |
| | |
| | |
| | |
| | |
| | |
| | |
| | |
| | |
| | |
Bell Telephone Co. of Canada or Bell Canada |
| | |
| | |
| | |
| | |
| | |
SECURITY RATE, MATURITY DATE | | |
British Telecommunications PLC |
| | |
| | |
Charter Communications Operating LLC/Charter Communications Operating Capital |
| | |
| | |
| | |
| | |
| | |
| | |
| | |
| | |
| | |
| | |
| | |
| | |
| | |
| | |
| | |
| | |
| | |
| | |
| | |
| | |
| | |
| | |
| | |
| | |
| | |
| | |
| | |
|
| | |
| | |
| | |
| | |
| | |
| | |
| | |
| | |
| | |
| | |
| | |
| | |
| | |
| | |
| | |
| | |
| | |
| | |
| | |
| | |
| | |
| | |
| | |
| | |
| | |
| | |
| | |
| | |
| | |
| | |
| | |
| | |
| | |
| | |
Schwab Fixed-Income ETFs | Annual Report69
Schwab U.S. Aggregate Bond ETF
Portfolio Holdings as of December 31, 2023 (continued)
SECURITY RATE, MATURITY DATE | | |
| | |
| | |
| | |
| | |
| | |
| | |
| | |
| | |
| | |
| | |
| | |
| | |
| | |
| | |
| | |
|
| | |
| | |
| | |
| | |
| | |
| | |
| | |
| | |
| | |
| | |
| | |
| | |
| | |
| | |
| | |
| | |
| | |
| | |
| | |
| | |
| | |
| | |
Deutsche Telekom International Finance BV |
| | |
| | |
Discovery Communications LLC |
| | |
| | |
| | |
| | |
| | |
| | |
| | |
| | |
| | |
| | |
| | |
| | |
| | |
|
| | |
| | |
| | |
|
| | |
| | |
| | |
| | |
| | |
| | |
SECURITY RATE, MATURITY DATE | | |
|
| | |
| | |
| | |
| | |
| | |
Interpublic Group of Cos., Inc. |
| | |
| | |
| | |
|
| | |
|
| | |
| | |
| | |
| | |
| | |
| | |
| | |
| | |
| | |
|
| | |
| | |
| | |
|
| | |
| | |
| | |
| | |
| | |
|
| | |
| | |
Omnicom Group, Inc./Omnicom Capital, Inc. |
| | |
|
| | |
| | |
| | |
|
| | |
| | |
| | |
| | |
| | |
| | |
| | |
| | |
| | |
| | |
| | |
| | |
| | |
| | |
| | |
| | |
| | |
Rogers Communications, Inc. |
| | |
| | |
| | |
| | |
| | |
| | |
70Schwab Fixed-Income ETFs | Annual Report
Schwab U.S. Aggregate Bond ETF
Portfolio Holdings as of December 31, 2023 (continued)
SECURITY RATE, MATURITY DATE | | |
| | |
| | |
| | |
| | |
| | |
| | |
| | |
| | |
|
| | |
| | |
|
| | |
| | |
Take-Two Interactive Software, Inc. |
| | |
| | |
| | |
| | |
|
| | |
| | |
|
| | |
| | |
| | |
| | |
| | |
|
| | |
|
| | |
| | |
| | |
| | |
| | |
Time Warner Cable Enterprises LLC |
| | |
|
| | |
| | |
| | |
| | |
| | |
| | |
|
| | |
| | |
| | |
| | |
| | |
| | |
| | |
| | |
| | |
| | |
| | |
| | |
| | |
| | |
| | |
| | |
| | |
| | |
| | |
| | |
SECURITY RATE, MATURITY DATE | | |
| | |
| | |
| | |
| | |
| | |
| | |
| | |
| | |
| | |
| | |
| | |
TWDC Enterprises 18 Corp. |
| | |
| | |
| | |
| | |
| | |
| | |
| | |
| | |
| | |
Verizon Communications, Inc. |
| | |
| | |
| | |
| | |
| | |
| | |
| | |
| | |
| | |
| | |
| | |
| | |
| | |
| | |
| | |
| | |
| | |
| | |
| | |
| | |
| | |
| | |
| | |
| | |
| | |
| | |
| | |
| | |
| | |
| | |
| | |
| | |
| | |
| | |
| | |
| | |
| | |
| | |
| | |
| | |
| | |
|
| | |
| | |
| | |
Schwab Fixed-Income ETFs | Annual Report71
Schwab U.S. Aggregate Bond ETF
Portfolio Holdings as of December 31, 2023 (continued)
SECURITY RATE, MATURITY DATE | | |
| | |
| | |
| | |
| | |
| | |
| | |
| | |
| | |
| | |
|
| | |
| | |
| | |
| | |
| | |
| | |
| | |
| | |
| | |
| | |
| | |
| | |
| | |
| | |
| | |
| | |
| | |
| | |
| | |
| | |
| | |
| | |
| | |
| | |
| | |
| | |
Warnermedia Holdings, Inc. |
| | |
| | |
| | |
| | |
| | |
| | |
| | |
| | |
| | |
|
| | |
| | |
|
Alibaba Group Holding Ltd. |
| | |
| | |
| | |
| | |
| | |
| | |
| | |
| | |
| | |
|
| | |
| | |
| | |
| | |
SECURITY RATE, MATURITY DATE | | |
| | |
| | |
| | |
| | |
| | |
| | |
| | |
| | |
| | |
| | |
| | |
| | |
| | |
| | |
| | |
| | |
| | |
| | |
| | |
| | |
| | |
| | |
| | |
| | |
American Honda Finance Corp. |
| | |
| | |
| | |
| | |
| | |
| | |
| | |
| | |
| | |
| | |
| | |
| | |
| | |
| | |
| | |
|
| | |
| | |
| | |
| | |
|
| | |
| | |
| | |
|
| | |
| | |
| | |
| | |
| | |
|
| | |
| | |
| | |
| | |
| | |
| | |
| | |
| | |
| | |
| | |
72Schwab Fixed-Income ETFs | Annual Report
Schwab U.S. Aggregate Bond ETF
Portfolio Holdings as of December 31, 2023 (continued)
SECURITY RATE, MATURITY DATE | | |
|
| | |
| | |
|
| | |
| | |
| | |
|
| | |
| | |
| | |
| | |
|
| | |
| | |
|
| | |
|
| | |
| | |
Choice Hotels International, Inc. |
| | |
| | |
|
| | |
| | |
| | |
|
| | |
| | |
| | |
| | |
|
| | |
| | |
Dick's Sporting Goods, Inc. |
| | |
| | |
|
| | |
| | |
| | |
| | |
| | |
| | |
| | |
| | |
| | |
|
| | |
| | |
| | |
| | |
|
| | |
| | |
|
| | |
| | |
| | |
| | |
| | |
| | |
| | |
SECURITY RATE, MATURITY DATE | | |
| | |
| | |
|
| | |
| | |
| | |
| | |
| | |
|
| | |
| | |
|
| | |
| | |
| | |
| | |
| | |
| | |
| | |
| | |
Ford Motor Credit Co. LLC |
| | |
| | |
| | |
| | |
| | |
| | |
| | |
| | |
| | |
| | |
| | |
| | |
| | |
| | |
| | |
| | |
| | |
| | |
| | |
| | |
| | |
| | |
| | |
| | |
| | |
|
| | |
| | |
| | |
| | |
| | |
| | |
| | |
| | |
| | |
| | |
| | |
| | |
| | |
| | |
| | |
General Motors Financial Co., Inc. |
| | |
| | |
| | |
Schwab Fixed-Income ETFs | Annual Report73
Schwab U.S. Aggregate Bond ETF
Portfolio Holdings as of December 31, 2023 (continued)
SECURITY RATE, MATURITY DATE | | |
| | |
| | |
| | |
| | |
| | |
| | |
| | |
| | |
| | |
| | |
| | |
| | |
| | |
| | |
| | |
| | |
| | |
| | |
| | |
| | |
| | |
| | |
| | |
| | |
| | |
|
| | |
| | |
| | |
GLP Capital LP/GLP Financing II, Inc. |
| | |
| | |
| | |
| | |
| | |
| | |
| | |
|
| | |
| | |
Harman International Industries, Inc. |
| | |
|
| | |
| | |
| | |
| | |
| | |
| | |
| | |
| | |
| | |
| | |
| | |
| | |
| | |
| | |
| | |
| | |
| | |
| | |
| | |
| | |
| | |
| | |
| | |
| | |
SECURITY RATE, MATURITY DATE | | |
| | |
| | |
| | |
| | |
| | |
| | |
| | |
| | |
| | |
|
| | |
| | |
| | |
|
| | |
| | |
| | |
| | |
|
| | |
| | |
| | |
|
| | |
| | |
| | |
| | |
|
| | |
| | |
| | |
| | |
|
| | |
| | |
|
| | |
| | |
| | |
| | |
| | |
| | |
| | |
| | |
| | |
| | |
| | |
| | |
| | |
| | |
| | |
| | |
| | |
| | |
| | |
| | |
| | |
| | |
| | |
| | |
| | |
| | |
| | |
| | |
| | |
74Schwab Fixed-Income ETFs | Annual Report
Schwab U.S. Aggregate Bond ETF
Portfolio Holdings as of December 31, 2023 (continued)
SECURITY RATE, MATURITY DATE | | |
Magna International, Inc. |
| | |
| | |
| | |
Marriott International, Inc. |
| | |
| | |
| | |
| | |
| | |
| | |
| | |
| | |
| | |
|
| | |
| | |
| | |
| | |
| | |
| | |
| | |
| | |
| | |
| | |
| | |
| | |
| | |
| | |
| | |
| | |
| | |
| | |
| | |
| | |
| | |
| | |
| | |
| | |
| | |
| | |
|
| | |
| | |
| | |
| | |
Mercedes-Benz Finance North America LLC |
| | |
|
| | |
| | |
| | |
| | |
| | |
| | |
| | |
| | |
| | |
|
| | |
O'Reilly Automotive, Inc. |
| | |
| | |
| | |
| | |
| | |
SECURITY RATE, MATURITY DATE | | |
|
| | |
| | |
| | |
| | |
| | |
| | |
|
| | |
| | |
| | |
| | |
| | |
|
| | |
|
| | |
| | |
|
| | |
|
| | |
| | |
| | |
|
| | |
| | |
| | |
| | |
| | |
| | |
|
| | |
| | |
| | |
| | |
| | |
| | |
| | |
| | |
| | |
| | |
| | |
| | |
| | |
| | |
| | |
| | |
|
| | |
| | |
| | |
| | |
| | |
| | |
|
| | |
| | |
| | |
| | |
| | |
| | |
| | |
| | |
| | |
| | |
Schwab Fixed-Income ETFs | Annual Report75
Schwab U.S. Aggregate Bond ETF
Portfolio Holdings as of December 31, 2023 (continued)
SECURITY RATE, MATURITY DATE | | |
| | |
| | |
| | |
| | |
|
| | |
| | |
| | |
Toll Brothers Finance Corp. |
| | |
| | |
| | |
|
| | |
| | |
| | |
| | |
Toyota Motor Credit Corp. |
| | |
| | |
| | |
| | |
| | |
| | |
| | |
| | |
| | |
| | |
| | |
| | |
| | |
| | |
| | |
| | |
| | |
| | |
| | |
| | |
| | |
| | |
| | |
| | |
| | |
|
| | |
| | |
|
| | |
| | |
| | |
|
| | |
| | |
| | |
| | |
|
| | |
| | |
| | |
| | |
| | |
| | |
| | |
| | |
| | |
| | |
SECURITY RATE, MATURITY DATE | | |
| | |
| | |
| | |
| | |
| | |
| | |
| | |
| | |
| | |
| | |
| | |
| | |
| | |
| | |
| | |
| | |
| | |
| | |
| | |
| | |
Consumer Non-Cyclical 3.8% |
|
| | |
| | |
| | |
| | |
| | |
| | |
| | |
| | |
| | |
| | |
| | |
|
| | |
| | |
| | |
| | |
| | |
| | |
| | |
| | |
| | |
| | |
| | |
| | |
| | |
| | |
| | |
| | |
| | |
| | |
AdventHealth Obligated Group |
| | |
|
| | |
| | |
Advocate Health & Hospitals Corp. |
| | |
| | |
| | |
| | |
| | |
76Schwab Fixed-Income ETFs | Annual Report
Schwab U.S. Aggregate Bond ETF
Portfolio Holdings as of December 31, 2023 (continued)
SECURITY RATE, MATURITY DATE | | |
Agilent Technologies, Inc. |
| | |
| | |
|
| | |
|
| | |
| | |
|
| | |
| | |
|
| | |
| | |
| | |
| | |
| | |
| | |
| | |
| | |
| | |
| | |
| | |
| | |
| | |
| | |
| | |
| | |
|
| | |
| | |
| | |
| | |
| | |
| | |
| | |
| | |
| | |
| | |
| | |
| | |
| | |
| | |
| | |
| | |
| | |
| | |
| | |
| | |
| | |
| | |
| | |
| | |
| | |
| | |
| | |
| | |
| | |
| | |
| | |
| | |
| | |
| | |
| | |
| | |
| | |
| | |
SECURITY RATE, MATURITY DATE | | |
Anheuser-Busch Cos. LLC/Anheuser-Busch InBev Worldwide, Inc. |
| | |
| | |
| | |
Anheuser-Busch InBev Finance, Inc. |
| | |
| | |
| | |
Anheuser-Busch InBev Worldwide, Inc. |
| | |
| | |
| | |
| | |
| | |
| | |
| | |
| | |
| | |
| | |
| | |
| | |
| | |
| | |
| | |
Archer-Daniels-Midland Co. |
| | |
| | |
| | |
| | |
| | |
| | |
| | |
|
| | |
| | |
| | |
| | |
|
| | |
| | |
| | |
| | |
| | |
|
| | |
| | |
| | |
| | |
| | |
| | |
| | |
| | |
| | |
| | |
| | |
|
| | |
| | |
| | |
| | |
| | |
Baptist Health South Florida Obligated Group |
| | |
Baptist Healthcare System Obligated Group |
Series 20B
3.54%, 08/15/50 (a) | | |
Schwab Fixed-Income ETFs | Annual Report77
Schwab U.S. Aggregate Bond ETF
Portfolio Holdings as of December 31, 2023 (continued)
SECURITY RATE, MATURITY DATE | | |
|
| | |
| | |
| | |
| | |
| | |
| | |
| | |
| | |
| | |
| | |
| | |
| | |
| | |
| | |
| | |
| | |
| | |
| | |
| | |
BAT International Finance PLC |
| | |
| | |
|
| | |
| | |
Baxter International, Inc. |
| | |
| | |
| | |
| | |
| | |
| | |
| | |
| | |
BayCare Health System, Inc. |
Series 2020
3.83%, 11/15/50 (a) | | |
Baylor Scott & White Holdings |
| | |
| | |
| | |
| | |
|
| | |
| | |
| | |
| | |
| | |
| | |
| | |
Beth Israel Lahey Health, Inc. |
| | |
|
| | |
| | |
| | |
| | |
Bio-Rad Laboratories, Inc. |
| | |
| | |
Bon Secours Mercy Health, Inc. |
| | |
| | |
SECURITY RATE, MATURITY DATE | | |
| | |
| | |
|
| | |
| | |
| | |
| | |
| | |
| | |
| | |
|
| | |
| | |
| | |
| | |
| | |
| | |
| | |
| | |
| | |
| | |
| | |
| | |
| | |
| | |
| | |
| | |
| | |
| | |
| | |
| | |
| | |
| | |
| | |
| | |
| | |
| | |
|
| | |
| | |
| | |
|
| | |
| | |
| | |
|
| | |
| | |
| | |
|
| | |
| | |
| | |
| | |
| | |
| | |
|
| | |
| | |
| | |
| | |
| | |
| | |
Catholic Health Services of Long Island Obligated Group |
| | |
78Schwab Fixed-Income ETFs | Annual Report
Schwab U.S. Aggregate Bond ETF
Portfolio Holdings as of December 31, 2023 (continued)
SECURITY RATE, MATURITY DATE | | |
Cedars-Sinai Health System |
| | |
|
| | |
| | |
| | |
| | |
| | |
| | |
Children's Health System of Texas |
| | |
|
| | |
Children's Hospital Corp. |
| | |
| | |
Children's Hospital Medical Center |
| | |
Children's Hospital of Philadelphia |
| | |
|
| | |
Church & Dwight Co., Inc. |
| | |
| | |
| | |
|
| | |
| | |
| | |
| | |
| | |
| | |
| | |
| | |
| | |
| | |
| | |
| | |
| | |
| | |
| | |
| | |
| | |
| | |
|
| | |
Cleveland Clinic Foundation |
| | |
|
| | |
| | |
| | |
| | |
|
| | |
| | |
| | |
| | |
| | |
| | |
| | |
| | |
| | |
| | |
SECURITY RATE, MATURITY DATE | | |
| | |
| | |
| | |
| | |
| | |
Coca-Cola Consolidated, Inc. |
| | |
Coca-Cola Femsa SAB de CV |
| | |
| | |
| | |
|
| | |
| | |
| | |
| | |
| | |
|
| | |
| | |
| | |
| | |
| | |
| | |
| | |
Community Health Network, Inc. |
| | |
|
| | |
| | |
| | |
| | |
| | |
| | |
| | |
Constellation Brands, Inc. |
| | |
| | |
| | |
| | |
| | |
| | |
| | |
| | |
| | |
| | |
| | |
| | |
| | |
| | |
| | |
Corewell Health Obligated Group |
| | |
Cottage Health Obligated Group |
| | |
|
| | |
| | |
| | |
| | |
| | |
| | |
| | |
| | |
| | |
| | |
Schwab Fixed-Income ETFs | Annual Report79
Schwab U.S. Aggregate Bond ETF
Portfolio Holdings as of December 31, 2023 (continued)
SECURITY RATE, MATURITY DATE | | |
| | |
| | |
| | |
| | |
| | |
| | |
| | |
| | |
| | |
| | |
| | |
| | |
| | |
| | |
| | |
| | |
| | |
| | |
| | |
| | |
| | |
|
| | |
| | |
| | |
| | |
Dartmouth-Hitchcock Health |
| | |
|
| | |
DH Europe Finance II SARL |
| | |
| | |
| | |
|
| | |
| | |
| | |
| | |
| | |
| | |
| | |
| | |
| | |
| | |
| | |
|
| | |
| | |
|
| | |
| | |
Duke University Health System, Inc. |
| | |
Edwards Lifesciences Corp. |
| | |
|
| | |
| | |
| | |
| | |
| | |
| | |
| | |
| | |
| | |
SECURITY RATE, MATURITY DATE | | |
| | |
| | |
| | |
| | |
| | |
|
| | |
| | |
| | |
| | |
| | |
| | |
| | |
| | |
| | |
|
| | |
Fomento Economico Mexicano SAB de CV |
| | |
Franciscan Missionaries of Our Lady Health System, Inc. |
| | |
GE HealthCare Technologies, Inc. |
| | |
| | |
| | |
| | |
| | |
|
| | |
| | |
| | |
| | |
| | |
| | |
| | |
| | |
| | |
|
| | |
| | |
| | |
| | |
| | |
| | |
| | |
| | |
| | |
| | |
| | |
| | |
| | |
| | |
| | |
GlaxoSmithKline Capital PLC |
| | |
GlaxoSmithKline Capital, Inc. |
| | |
| | |
| | |
| | |
| | |
Hackensack Meridian Health, Inc. |
| | |
| | |
| | |
80Schwab Fixed-Income ETFs | Annual Report
Schwab U.S. Aggregate Bond ETF
Portfolio Holdings as of December 31, 2023 (continued)
SECURITY RATE, MATURITY DATE | | |
|
| | |
|
| | |
| | |
| | |
| | |
Hartford HealthCare Corp. |
| | |
|
| | |
| | |
| | |
| | |
| | |
|
| | |
| | |
| | |
| | |
| | |
| | |
| | |
| | |
| | |
| | |
| | |
| | |
| | |
| | |
| | |
| | |
| | |
| | |
| | |
| | |
| | |
| | |
| | |
|
| | |
| | |
| | |
| | |
| | |
Hoag Memorial Hospital Presbyterian |
| | |
|
| | |
| | |
| | |
IHC Health Services, Inc. |
| | |
|
| | |
| | |
Indiana University Health, Inc. Obligated Group |
| | |
| | |
|
| | |
| | |
| | |
Inova Health System Foundation |
| | |
SECURITY RATE, MATURITY DATE | | |
Integris Baptist Medical Center, Inc. |
| | |
|
Series 2020
3.67%, 02/15/50 (a) | | |
|
| | |
| | |
|
| | |
| | |
| | |
| | |
| | |
| | |
| | |
| | |
| | |
| | |
JBS USA LUX SA/JBS USA Food Co./JBS Luxembourg SARL |
| | |
| | |
JBS USA LUX SA/JBS USA Food Co./JBS USA Finance, Inc. |
| | |
| | |
| | |
| | |
| | |
| | |
| | |
| | |
| | |
|
| | |
| | |
| | |
| | |
| | |
| | |
| | |
| | |
| | |
| | |
| | |
| | |
| | |
| | |
| | |
| | |
| | |
| | |
| | |
| | |
| | |
| | |
| | |
Kaiser Foundation Hospitals |
| | |
| | |
| | |
| | |
| | |
| | |
|
| | |
| | |
Schwab Fixed-Income ETFs | Annual Report81
Schwab U.S. Aggregate Bond ETF
Portfolio Holdings as of December 31, 2023 (continued)
SECURITY RATE, MATURITY DATE | | |
| | |
| | |
| | |
|
| | |
| | |
| | |
| | |
| | |
| | |
| | |
| | |
|
| | |
| | |
| | |
| | |
| | |
| | |
| | |
| | |
| | |
| | |
| | |
| | |
|
| | |
| | |
| | |
| | |
| | |
| | |
| | |
| | |
| | |
| | |
Koninklijke Ahold Delhaize NV |
| | |
|
| | |
| | |
|
| | |
| | |
| | |
| | |
| | |
| | |
| | |
| | |
| | |
| | |
| | |
| | |
| | |
| | |
| | |
|
| | |
| | |
| | |
| | |
| | |
| | |
| | |
| | |
SECURITY RATE, MATURITY DATE | | |
| | |
| | |
| | |
| | |
| | |
| | |
| | |
Laboratory Corp. of America Holdings |
| | |
| | |
| | |
| | |
| | |
| | |
Mass General Brigham, Inc. |
| | |
| | |
| | |
| | |
|
| | |
|
| | |
| | |
| | |
| | |
|
| | |
| | |
| | |
| | |
|
| | |
| | |
| | |
McLaren Health Care Corp. |
Series A
4.39%, 05/15/48 (a) | | |
Mead Johnson Nutrition Co. |
| | |
| | |
| | |
|
| | |
Medtronic Global Holdings SCA |
| | |
| | |
|
| | |
| | |
|
| | |
Memorial Sloan-Kettering Cancer Center |
| | |
| | |
| | |
| | |
|
| | |
| | |
| | |
| | |
| | |
| | |
| | |
82Schwab Fixed-Income ETFs | Annual Report
Schwab U.S. Aggregate Bond ETF
Portfolio Holdings as of December 31, 2023 (continued)
SECURITY RATE, MATURITY DATE | | |
| | |
| | |
| | |
| | |
| | |
| | |
| | |
| | |
| | |
| | |
| | |
| | |
| | |
| | |
| | |
Merck Sharp & Dohme Corp. |
| | |
| | |
|
| | |
Molson Coors Beverage Co. |
| | |
| | |
| | |
Mondelez International, Inc. |
| | |
| | |
| | |
| | |
| | |
| | |
| | |
Montefiore Obligated Group |
| | |
| | |
Mount Nittany Medical Center Obligated Group |
| | |
|
| | |
| | |
| | |
|
| | |
|
| | |
| | |
| | |
|
| | |
New York & Presbyterian Hospital |
| | |
| | |
| | |
| | |
| | |
Northwell Healthcare, Inc. |
| | |
| | |
| | |
Northwestern Memorial Healthcare Obligated Group |
| | |
|
| | |
| | |
| | |
SECURITY RATE, MATURITY DATE | | |
|
| | |
| | |
| | |
| | |
| | |
| | |
| | |
| | |
| | |
NY Society for Relief of Ruptured & Crippled Maintaining Hosp Special Surgery |
Series 2020
2.67%, 10/01/50 (a) | | |
|
| | |
| | |
| | |
| | |
|
| | |
| | |
| | |
Orlando Health Obligated Group |
| | |
| | |
PeaceHealth Obligated Group |
| | |
| | |
| | |
|
| | |
| | |
| | |
| | |
| | |
| | |
| | |
| | |
| | |
| | |
| | |
| | |
| | |
| | |
| | |
| | |
| | |
| | |
| | |
| | |
| | |
| | |
| | |
| | |
| | |
| | |
| | |
| | |
| | |
| | |
Pfizer Investment Enterprises Pte. Ltd. |
| | |
| | |
| | |
| | |
| | |
Schwab Fixed-Income ETFs | Annual Report83
Schwab U.S. Aggregate Bond ETF
Portfolio Holdings as of December 31, 2023 (continued)
SECURITY RATE, MATURITY DATE | | |
| | |
| | |
| | |
|
| | |
| | |
| | |
| | |
| | |
| | |
| | |
| | |
| | |
| | |
| | |
| | |
| | |
| | |
| | |
| | |
| | |
| | |
| | |
| | |
|
| | |
Philip Morris International, Inc. |
| | |
| | |
| | |
| | |
| | |
| | |
| | |
| | |
| | |
| | |
| | |
| | |
| | |
| | |
| | |
| | |
| | |
| | |
| | |
| | |
| | |
| | |
| | |
| | |
| | |
Piedmont Healthcare, Inc. |
| | |
| | |
|
| | |
| | |
| | |
Presbyterian Healthcare Services |
| | |
|
| | |
| | |
| | |
| | |
SECURITY RATE, MATURITY DATE | | |
| | |
| | |
| | |
| | |
| | |
| | |
| | |
| | |
| | |
| | |
| | |
| | |
| | |
| | |
Providence St Joseph Health Obligated Group |
| | |
| | |
| | |
| | |
|
| | |
|
| | |
| | |
| | |
| | |
| | |
| | |
Rady Children's Hospital-San Diego |
| | |
Regeneron Pharmaceuticals, Inc. |
| | |
| | |
|
| | |
| | |
| | |
| | |
| | |
|
| | |
| | |
| | |
| | |
| | |
|
| | |
| | |
| | |
| | |
| | |
| | |
| | |
|
| | |
RWJ Barnabas Health, Inc. |
| | |
| | |
|
| | |
Seattle Children's Hospital |
| | |
|
| | |
84Schwab Fixed-Income ETFs | Annual Report
Schwab U.S. Aggregate Bond ETF
Portfolio Holdings as of December 31, 2023 (continued)
SECURITY RATE, MATURITY DATE | | |
|
| | |
Shire Acquisitions Investments Ireland DAC |
| | |
|
| | |
|
| | |
| | |
| | |
STERIS Irish FinCo UnLtd Co. |
| | |
| | |
|
| | |
| | |
| | |
| | |
| | |
| | |
| | |
| | |
| | |
|
| | |
|
| | |
| | |
| | |
| | |
| | |
|
| | |
| | |
| | |
| | |
| | |
| | |
| | |
| | |
| | |
| | |
| | |
| | |
| | |
Takeda Pharmaceutical Co. Ltd. |
| | |
| | |
| | |
| | |
| | |
|
| | |
| | |
Thermo Fisher Scientific, Inc. |
| | |
| | |
| | |
| | |
| | |
| | |
| | |
| | |
| | |
| | |
SECURITY RATE, MATURITY DATE | | |
| | |
| | |
| | |
|
| | |
|
| | |
| | |
| | |
|
| | |
| | |
| | |
| | |
| | |
| | |
| | |
|
| | |
| | |
| | |
| | |
| | |
| | |
| | |
| | |
| | |
| | |
Universal Health Services, Inc. |
| | |
| | |
| | |
|
| | |
Utah Acquisition Sub, Inc. |
| | |
| | |
|
| | |
| | |
| | |
| | |
| | |
West Virginia United Health System Obligated Group |
| | |
|
| | |
| | |
| | |
| | |
| | |
Willis-Knighton Medical Center |
| | |
| | |
|
| | |
| | |
| | |
Yale-New Haven Health Services Corp. |
| | |
Zimmer Biomet Holdings, Inc. |
| | |
| | |
| | |
| | |
Schwab Fixed-Income ETFs | Annual Report85
Schwab U.S. Aggregate Bond ETF
Portfolio Holdings as of December 31, 2023 (continued)
SECURITY RATE, MATURITY DATE | | |
|
| | |
| | |
| | |
| | |
| | |
| | |
| | |
| | |
|
|
| | |
| | |
| | |
| | |
| | |
| | |
| | |
Baker Hughes Holdings LLC |
| | |
Baker Hughes Holdings LLC/Baker Hughes Co.-Obligor, Inc. |
| | |
| | |
| | |
| | |
| | |
|
| | |
| | |
| | |
BP Capital Markets America, Inc. |
| | |
| | |
| | |
| | |
| | |
| | |
| | |
| | |
| | |
| | |
| | |
| | |
| | |
| | |
| | |
| | |
| | |
| | |
| | |
|
| | |
| | |
|
| | |
| | |
Canadian Natural Resources Ltd. |
| | |
| | |
| | |
| | |
| | |
| | |
| | |
| | |
SECURITY RATE, MATURITY DATE | | |
| | |
| | |
| | |
|
| | |
| | |
| | |
| | |
| | |
| | |
Cheniere Corpus Christi Holdings LLC |
| | |
| | |
| | |
| | |
Cheniere Energy Partners LP |
| | |
| | |
| | |
| | |
|
| | |
|
| | |
| | |
| | |
| | |
| | |
| | |
|
| | |
| | |
| | |
| | |
| | |
| | |
| | |
Columbia Pipeline Group, Inc. |
| | |
| | |
|
| | |
| | |
| | |
| | |
| | |
| | |
| | |
| | |
| | |
| | |
| | |
| | |
| | |
Continental Resources, Inc. |
| | |
| | |
|
| | |
| | |
DCP Midstream Operating LP |
| | |
| | |
| | |
| | |
86Schwab Fixed-Income ETFs | Annual Report
Schwab U.S. Aggregate Bond ETF
Portfolio Holdings as of December 31, 2023 (continued)
SECURITY RATE, MATURITY DATE | | |
| | |
| | |
|
| | |
| | |
| | |
| | |
| | |
| | |
| | |
| | |
| | |
|
| | |
| | |
| | |
| | |
| | |
| | |
| | |
Eastern Gas Transmission & Storage, Inc. |
| | |
| | |
| | |
Enbridge Energy Partners LP |
| | |
| | |
| | |
| | |
|
| | |
| | |
| | |
| | |
| | |
| | |
| | |
| | |
| | |
| | |
| | |
| | |
| | |
| | |
|
| | |
| | |
| | |
| | |
| | |
| | |
| | |
| | |
| | |
| | |
| | |
| | |
| | |
| | |
| | |
| | |
| | |
| | |
| | |
| | |
| | |
SECURITY RATE, MATURITY DATE | | |
| | |
| | |
| | |
| | |
| | |
| | |
| | |
| | |
| | |
| | |
| | |
| | |
| | |
| | |
| | |
| | |
|
| | |
Enterprise Products Operating LLC |
| | |
| | |
| | |
| | |
| | |
| | |
| | |
| | |
| | |
| | |
| | |
| | |
| | |
| | |
| | |
| | |
| | |
| | |
| | |
| | |
| | |
| | |
| | |
| | |
| | |
| | |
| | |
| | |
| | |
|
| | |
| | |
| | |
| | |
| | |
|
| | |
| | |
| | |
| | |
| | |
|
| | |
| | |
| | |
| | |
| | |
| | |
Schwab Fixed-Income ETFs | Annual Report87
Schwab U.S. Aggregate Bond ETF
Portfolio Holdings as of December 31, 2023 (continued)
SECURITY RATE, MATURITY DATE | | |
| | |
| | |
| | |
| | |
| | |
| | |
| | |
| | |
| | |
|
| | |
| | |
| | |
| | |
| | |
| | |
|
| | |
|
| | |
| | |
| | |
| | |
| | |
| | |
| | |
|
| | |
| | |
Kinder Morgan Energy Partners LP |
| | |
| | |
| | |
| | |
| | |
| | |
| | |
| | |
| | |
| | |
| | |
| | |
| | |
| | |
| | |
| | |
|
| | |
| | |
| | |
| | |
| | |
| | |
| | |
| | |
| | |
| | |
| | |
| | |
| | |
Magellan Midstream Partners LP |
| | |
| | |
| | |
| | |
SECURITY RATE, MATURITY DATE | | |
| | |
| | |
|
| | |
| | |
| | |
| | |
|
| | |
| | |
| | |
| | |
| | |
| | |
| | |
|
| | |
| | |
| | |
| | |
| | |
| | |
| | |
| | |
| | |
| | |
| | |
| | |
| | |
| | |
| | |
| | |
| | |
|
| | |
| | |
| | |
| | |
| | |
|
| | |
|
| | |
| | |
Occidental Petroleum Corp. |
| | |
| | |
| | |
| | |
| | |
| | |
| | |
| | |
| | |
| | |
| | |
| | |
| | |
| | |
|
| | |
| | |
| | |
| | |
| | |
88Schwab Fixed-Income ETFs | Annual Report
Schwab U.S. Aggregate Bond ETF
Portfolio Holdings as of December 31, 2023 (continued)
SECURITY RATE, MATURITY DATE | | |
|
| | |
| | |
| | |
| | |
| | |
| | |
| | |
| | |
| | |
| | |
| | |
| | |
| | |
| | |
| | |
| | |
| | |
|
| | |
| | |
| | |
| | |
| | |
| | |
| | |
| | |
Patterson-UTI Energy, Inc. |
| | |
| | |
|
| | |
| | |
| | |
| | |
| | |
| | |
| | |
| | |
|
| | |
| | |
| | |
| | |
| | |
| | |
Pioneer Natural Resources Co. |
| | |
| | |
| | |
| | |
Plains All American Pipeline LP/PAA Finance Corp. |
| | |
| | |
| | |
| | |
| | |
| | |
| | |
| | |
| | |
Sabine Pass Liquefaction LLC |
| | |
| | |
| | |
| | |
SECURITY RATE, MATURITY DATE | | |
| | |
| | |
Schlumberger Finance Canada Ltd. |
| | |
Schlumberger Investment SA |
| | |
| | |
Shell International Finance BV |
| | |
| | |
| | |
| | |
| | |
| | |
| | |
| | |
| | |
| | |
| | |
| | |
| | |
| | |
| | |
| | |
| | |
| | |
Spectra Energy Partners LP |
| | |
| | |
| | |
| | |
|
| | |
| | |
| | |
| | |
| | |
| | |
|
| | |
| | |
| | |
| | |
| | |
| | |
| | |
| | |
Targa Resources Partners LP/Targa Resources Partners Finance Corp. |
| | |
| | |
| | |
| | |
|
| | |
| | |
Tennessee Gas Pipeline Co. LLC |
| | |
|
| | |
TotalEnergies Capital International SA |
| | |
| | |
| | |
| | |
| | |
Schwab Fixed-Income ETFs | Annual Report89
Schwab U.S. Aggregate Bond ETF
Portfolio Holdings as of December 31, 2023 (continued)
SECURITY RATE, MATURITY DATE | | |
| | |
| | |
|
| | |
TransCanada PipeLines Ltd. |
| | |
| | |
| | |
| | |
| | |
| | |
| | |
| | |
| | |
| | |
| | |
| | |
| | |
| | |
Transcontinental Gas Pipe Line Co. LLC |
| | |
| | |
| | |
| | |
| | |
| | |
|
| | |
| | |
| | |
| | |
| | |
| | |
| | |
| | |
| | |
Valero Energy Partners LP |
| | |
Western Midstream Operating LP |
| | |
| | |
| | |
| | |
| | |
| | |
| | |
| | |
| | |
| | |
|
| | |
| | |
| | |
| | |
| | |
| | |
| | |
| | |
| | |
| | |
| | |
| | |
| | |
| | |
| | |
| | |
SECURITY RATE, MATURITY DATE | | |
| | |
| | |
| | |
| | |
|
|
| | |
California Institute of Technology |
| | |
| | |
| | |
Case Western Reserve University |
| | |
|
| | |
| | |
| | |
|
| | |
| | |
| | |
|
| | |
| | |
George Washington University |
| | |
| | |
| | |
|
| | |
| | |
| | |
|
| | |
Jacobs Engineering Group, Inc. |
| | |
|
| | |
| | |
Leland Stanford Junior University |
| | |
| | |
| | |
Massachusetts Institute of Technology |
| | |
| | |
| | |
| | |
| | |
| | |
| | |
|
| | |
|
| | |
| | |
| | |
President & Fellows of Harvard College |
| | |
| | |
| | |
| | |
| | |
90Schwab Fixed-Income ETFs | Annual Report
Schwab U.S. Aggregate Bond ETF
Portfolio Holdings as of December 31, 2023 (continued)
SECURITY RATE, MATURITY DATE | | |
|
| | |
| | |
| | |
Thomas Jefferson University |
| | |
Trustees of Boston College |
| | |
Trustees of Boston University |
| | |
Trustees of Princeton University |
| | |
| | |
Trustees of the University of Pennsylvania |
| | |
| | |
| | |
|
| | |
| | |
| | |
| | |
University of Notre Dame du Lac |
| | |
| | |
University of Southern California |
| | |
| | |
| | |
| | |
| | |
|
| | |
| | |
William Marsh Rice University |
| | |
| | |
|
| | |
| | |
| | |
|
|
| | |
| | |
| | |
| | |
Advanced Micro Devices, Inc. |
| | |
| | |
|
| | |
| | |
| | |
| | |
| | |
| | |
| | |
|
| | |
|
| | |
| | |
SECURITY RATE, MATURITY DATE | | |
| | |
| | |
| | |
| | |
| | |
|
| | |
| | |
| | |
| | |
| | |
| | |
| | |
| | |
| | |
| | |
| | |
| | |
| | |
| | |
| | |
| | |
| | |
| | |
| | |
| | |
| | |
| | |
| | |
| | |
| | |
| | |
| | |
| | |
| | |
| | |
| | |
| | |
| | |
| | |
| | |
| | |
| | |
| | |
| | |
| | |
| | |
| | |
| | |
| | |
| | |
| | |
| | |
| | |
|
| | |
| | |
| | |
| | |
| | |
| | |
| | |
|
| | |
| | |
| | |
Schwab Fixed-Income ETFs | Annual Report91
Schwab U.S. Aggregate Bond ETF
Portfolio Holdings as of December 31, 2023 (continued)
SECURITY RATE, MATURITY DATE | | |
|
| | |
| | |
| | |
| | |
Automatic Data Processing, Inc. |
| | |
| | |
| | |
|
| | |
| | |
| | |
|
| | |
| | |
| | |
| | |
| | |
| | |
| | |
| | |
Broadcom Corp./Broadcom Cayman Finance Ltd. |
| | |
| | |
| | |
|
| | |
| | |
| | |
| | |
| | |
| | |
| | |
| | |
| | |
| | |
| | |
| | |
| | |
| | |
| | |
| | |
| | |
| | |
| | |
Broadridge Financial Solutions, Inc. |
| | |
| | |
| | |
CDW LLC/CDW Finance Corp. |
| | |
| | |
| | |
| | |
| | |
| | |
|
| | |
| | |
|
| | |
| | |
| | |
| | |
| | |
SECURITY RATE, MATURITY DATE | | |
|
| | |
| | |
| | |
|
| | |
| | |
| | |
| | |
| | |
| | |
| | |
| | |
Dell International LLC/EMC Corp. |
| | |
| | |
| | |
| | |
| | |
| | |
| | |
| | |
| | |
| | |
| | |
| | |
|
| | |
| | |
|
| | |
| | |
|
| | |
| | |
| | |
| | |
| | |
|
| | |
| | |
| | |
| | |
| | |
| | |
| | |
| | |
| | |
| | |
| | |
| | |
FactSet Research Systems, Inc. |
| | |
| | |
Fidelity National Information Services, Inc. |
| | |
| | |
| | |
| | |
| | |
| | |
| | |
| | |
| | |
| | |
92Schwab Fixed-Income ETFs | Annual Report
Schwab U.S. Aggregate Bond ETF
Portfolio Holdings as of December 31, 2023 (continued)
SECURITY RATE, MATURITY DATE | | |
|
| | |
| | |
| | |
| | |
| | |
| | |
| | |
| | |
| | |
| | |
|
| | |
| | |
| | |
| | |
|
| | |
Genpact Luxembourg SARL/Genpact USA, Inc. |
| | |
|
| | |
| | |
| | |
| | |
| | |
| | |
| | |
| | |
| | |
| | |
| | |
Hewlett Packard Enterprise Co. |
| | |
| | |
| | |
| | |
| | |
|
| | |
| | |
| | |
| | |
| | |
| | |
| | |
| | |
| | |
|
| | |
| | |
| | |
| | |
| | |
| | |
| | |
| | |
| | |
| | |
| | |
| | |
| | |
| | |
| | |
| | |
| | |
SECURITY RATE, MATURITY DATE | | |
| | |
| | |
| | |
| | |
| | |
| | |
| | |
| | |
| | |
| | |
| | |
| | |
| | |
| | |
| | |
| | |
| | |
| | |
| | |
International Business Machines Corp. |
| | |
| | |
| | |
| | |
| | |
| | |
| | |
| | |
| | |
| | |
| | |
| | |
| | |
| | |
| | |
| | |
| | |
| | |
| | |
| | |
| | |
| | |
| | |
|
| | |
| | |
| | |
| | |
| | |
| | |
|
| | |
| | |
| | |
|
| | |
| | |
| | |
Keysight Technologies, Inc. |
| | |
| | |
|
| | |
| | |
| | |
| | |
Schwab Fixed-Income ETFs | Annual Report93
Schwab U.S. Aggregate Bond ETF
Portfolio Holdings as of December 31, 2023 (continued)
SECURITY RATE, MATURITY DATE | | |
| | |
| | |
|
| | |
| | |
| | |
| | |
|
| | |
| | |
| | |
| | |
| | |
| | |
| | |
|
| | |
| | |
| | |
|
| | |
| | |
| | |
| | |
| | |
|
| | |
| | |
| | |
| | |
| | |
| | |
| | |
| | |
| | |
| | |
| | |
| | |
| | |
Microchip Technology, Inc. |
| | |
|
| | |
| | |
| | |
| | |
| | |
| | |
| | |
| | |
| | |
| | |
| | |
|
| | |
| | |
| | |
| | |
| | |
| | |
| | |
| | |
| | |
| | |
| | |
| | |
SECURITY RATE, MATURITY DATE | | |
| | |
| | |
| | |
| | |
| | |
| | |
| | |
| | |
| | |
| | |
| | |
| | |
| | |
|
| | |
| | |
| | |
| | |
| | |
| | |
| | |
| | |
| | |
| | |
|
| | |
| | |
| | |
| | |
| | |
| | |
|
| | |
| | |
| | |
|
| | |
| | |
|
| | |
| | |
| | |
| | |
| | |
| | |
| | |
|
| | |
| | |
NXP BV/NXP Funding LLC/NXP USA, Inc. |
| | |
| | |
| | |
| | |
| | |
| | |
| | |
| | |
| | |
| | |
|
| | |
| | |
| | |
| | |
| | |
94Schwab Fixed-Income ETFs | Annual Report
Schwab U.S. Aggregate Bond ETF
Portfolio Holdings as of December 31, 2023 (continued)
SECURITY RATE, MATURITY DATE | | |
| | |
| | |
| | |
| | |
| | |
| | |
| | |
| | |
| | |
| | |
| | |
| | |
| | |
| | |
| | |
| | |
| | |
| | |
| | |
| | |
| | |
| | |
| | |
| | |
| | |
| | |
| | |
| | |
| | |
| | |
|
| | |
| | |
| | |
| | |
| | |
| | |
| | |
| | |
| | |
|
| | |
|
| | |
| | |
| | |
| | |
| | |
| | |
| | |
| | |
| | |
| | |
| | |
| | |
| | |
|
| | |
| | |
| | |
|
| | |
| | |
| | |
| | |
| | |
| | |
SECURITY RATE, MATURITY DATE | | |
| | |
| | |
|
| | |
| | |
| | |
| | |
| | |
| | |
| | |
| | |
| | |
| | |
| | |
| | |
| | |
|
| | |
| | |
| | |
| | |
| | |
| | |
|
| | |
|
| | |
| | |
|
| | |
| | |
| | |
|
| | |
Tencent Music Entertainment Group |
| | |
|
| | |
| | |
| | |
| | |
| | |
| | |
| | |
| | |
| | |
| | |
| | |
|
| | |
| | |
| | |
|
| | |
| | |
|
| | |
| | |
| | |
| | |
| | |
| | |
| | |
| | |
Schwab Fixed-Income ETFs | Annual Report95
Schwab U.S. Aggregate Bond ETF
Portfolio Holdings as of December 31, 2023 (continued)
SECURITY RATE, MATURITY DATE | | |
Tyco Electronics Group SA |
| | |
| | |
| | |
|
| | |
| | |
| | |
|
| | |
| | |
| | |
| | |
|
| | |
| | |
| | |
| | |
| | |
| | |
| | |
| | |
| | |
| | |
| | |
|
| | |
| | |
| | |
| | |
| | |
|
| | |
| | |
|
| | |
| | |
| | |
| | |
|
| | |
| | |
| | |
|
| | |
| | |
|
American Airlines 2012-1 Class AA Pass-Through Trust |
| | |
American Airlines 2015-1 Class A Pass-Through Trust |
| | |
American Airlines 2015-2 Class AA Pass-Through Trust |
| | |
American Airlines 2016-1 Class AA Pass-Through Trust |
| | |
American Airlines 2016-2 Class AA Pass-Through Trust |
| | |
American Airlines 2017-1 Class AA Pass-Through Trust |
| | |
American Airlines 2017-2 Class AA Pass-Through Trust |
| | |
American Airlines 2019-1 Class AA Pass-Through Trust |
| | |
SECURITY RATE, MATURITY DATE | | |
|
| | |
Burlington Northern Santa Fe LLC |
| | |
| | |
| | |
| | |
| | |
| | |
| | |
| | |
| | |
| | |
| | |
| | |
| | |
| | |
| | |
| | |
| | |
| | |
| | |
| | |
| | |
| | |
| | |
| | |
Canadian National Railway Co. |
| | |
| | |
| | |
| | |
| | |
| | |
| | |
| | |
Canadian Pacific Railway Co. |
| | |
| | |
| | |
| | |
| | |
| | |
| | |
| | |
| | |
| | |
| | |
| | |
| | |
| | |
| | |
| | |
| | |
| | |
CH Robinson Worldwide, Inc. |
| | |
|
| | |
| | |
| | |
| | |
| | |
| | |
| | |
| | |
| | |
96Schwab Fixed-Income ETFs | Annual Report
Schwab U.S. Aggregate Bond ETF
Portfolio Holdings as of December 31, 2023 (continued)
SECURITY RATE, MATURITY DATE | | |
| | |
| | |
| | |
| | |
| | |
| | |
| | |
| | |
| | |
| | |
| | |
| | |
| | |
| | |
| | |
| | |
Delta Air Lines 2020-1 Class AA Pass-Through Trust |
| | |
FedEx Corp. 2020-1 Class AA Pass-Through Trust |
| | |
|
| | |
| | |
| | |
| | |
| | |
| | |
| | |
| | |
| | |
| | |
| | |
| | |
| | |
| | |
| | |
| | |
| | |
| | |
|
| | |
| | |
JB Hunt Transport Services, Inc. |
| | |
JetBlue 2019-1 Class AA Pass-Through Trust |
| | |
JetBlue 2020-1 Class A Pass-Through Trust |
| | |
|
| | |
|
| | |
| | |
| | |
| | |
| | |
| | |
| | |
| | |
| | |
| | |
| | |
| | |
| | |
| | |
| | |
SECURITY RATE, MATURITY DATE | | |
| | |
| | |
| | |
| | |
| | |
| | |
| | |
|
| | |
| | |
| | |
| | |
| | |
| | |
| | |
| | |
|
| | |
| | |
| | |
| | |
| | |
Triton Container International Ltd./TAL International Container Corp. |
| | |
|
| | |
| | |
| | |
| | |
| | |
| | |
| | |
| | |
| | |
| | |
| | |
| | |
| | |
| | |
| | |
| | |
| | |
| | |
| | |
| | |
| | |
| | |
| | |
| | |
| | |
| | |
| | |
| | |
| | |
| | |
| | |
| | |
United Airlines 2013-1 Class A Pass-Through Trust |
| | |
United Airlines 2014-1 Class A Pass-Through Trust |
| | |
United Airlines 2014-2 Class A Pass-Through Trust |
| | |
United Airlines 2016-1 Class AA Pass-Through Trust |
| | |
Schwab Fixed-Income ETFs | Annual Report97
Schwab U.S. Aggregate Bond ETF
Portfolio Holdings as of December 31, 2023 (continued)
SECURITY RATE, MATURITY DATE | | |
United Airlines 2016-2 Class AA Pass-Through Trust |
| | |
United Airlines 2018-1 Class AA Pass-Through Trust |
| | |
United Airlines 2019-1 Class AA Pass-Through Trust |
| | |
United Airlines 2019-2 Class AA Pass-Through Trust |
| | |
United Airlines 2020-1 Class A Pass-Through Trust |
| | |
United Airlines 2020-1 Class B Pass-Through Trust |
| | |
United Airlines 2023-1 Class A Pass-Through Trust |
| | |
United Parcel Service, Inc. |
| | |
| | |
| | |
| | |
| | |
| | |
| | |
| | |
| | |
| | |
| | |
| | |
| | |
| | |
| | |
| | |
| | |
| | |
|
|
|
|
| | |
| | |
| | |
| | |
| | |
| | |
| | |
|
| | |
| | |
| | |
| | |
| | |
| | |
|
| | |
| | |
| | |
|
| | |
| | |
| | |
| | |
| | |
| | |
| | |
| | |
SECURITY RATE, MATURITY DATE | | |
| | |
| | |
| | |
| | |
| | |
|
| | |
| | |
| | |
| | |
|
| | |
| | |
| | |
| | |
| | |
| | |
| | |
| | |
American Electric Power Co., Inc. |
| | |
| | |
| | |
| | |
| | |
| | |
| | |
| | |
| | |
|
| | |
| | |
| | |
| | |
| | |
| | |
| | |
| | |
| | |
Arizona Public Service Co. |
| | |
| | |
| | |
| | |
| | |
| | |
| | |
| | |
| | |
| | |
| | |
Atlantic City Electric Co. |
| | |
|
| | |
| | |
|
| | |
| | |
Baltimore Gas & Electric Co. |
| | |
| | |
| | |
| | |
| | |
| | |
98Schwab Fixed-Income ETFs | Annual Report
Schwab U.S. Aggregate Bond ETF
Portfolio Holdings as of December 31, 2023 (continued)
SECURITY RATE, MATURITY DATE | | |
| | |
| | |
| | |
Berkshire Hathaway Energy Co. |
| | |
| | |
| | |
| | |
| | |
| | |
| | |
| | |
| | |
| | |
| | |
| | |
| | |
| | |
|
| | |
| | |
| | |
| | |
| | |
| | |
| | |
CenterPoint Energy Houston Electric LLC |
| | |
| | |
| | |
| | |
| | |
| | |
| | |
| | |
| | |
| | |
|
| | |
| | |
Cleco Corporate Holdings LLC |
| | |
| | |
Cleveland Electric Illuminating Co. |
| | |
|
| | |
| | |
| | |
| | |
|
| | |
| | |
| | |
| | |
| | |
| | |
| | |
| | |
| | |
| | |
| | |
| | |
| | |
| | |
SECURITY RATE, MATURITY DATE | | |
| | |
| | |
Connecticut Light & Power Co. |
| | |
| | |
| | |
| | |
| | |
| | |
Consolidated Edison Co. of New York, Inc. |
| | |
| | |
| | |
| | |
| | |
| | |
| | |
| | |
| | |
| | |
| | |
| | |
| | |
| | |
| | |
| | |
| | |
| | |
| | |
| | |
| | |
| | |
| | |
| | |
| | |
Constellation Energy Generation LLC |
| | |
| | |
| | |
| | |
| | |
| | |
| | |
| | |
|
| | |
| | |
| | |
| | |
| | |
| | |
| | |
| | |
| | |
| | |
|
| | |
Delmarva Power & Light Co. |
| | |
Dominion Energy South Carolina, Inc. |
| | |
| | |
| | |
| | |
| | |
Schwab Fixed-Income ETFs | Annual Report99
Schwab U.S. Aggregate Bond ETF
Portfolio Holdings as of December 31, 2023 (continued)
SECURITY RATE, MATURITY DATE | | |
|
| | |
| | |
| | |
| | |
| | |
| | |
| | |
| | |
| | |
| | |
| | |
| | |
| | |
| | |
| | |
| | |
|
| | |
| | |
| | |
| | |
| | |
| | |
| | |
| | |
| | |
| | |
| | |
| | |
| | |
|
| | |
| | |
| | |
Duke Energy Carolinas LLC |
| | |
| | |
| | |
| | |
| | |
| | |
| | |
| | |
| | |
| | |
| | |
| | |
| | |
| | |
| | |
| | |
| | |
| | |
|
| | |
| | |
| | |
| | |
| | |
| | |
| | |
| | |
| | |
| | |
| | |
| | |
SECURITY RATE, MATURITY DATE | | |
| | |
| | |
| | |
| | |
| | |
|
| | |
| | |
| | |
| | |
| | |
| | |
| | |
| | |
| | |
| | |
| | |
|
| | |
| | |
| | |
| | |
| | |
| | |
| | |
|
| | |
| | |
| | |
| | |
|
| | |
| | |
| | |
| | |
| | |
| | |
| | |
| | |
| | |
| | |
| | |
| | |
|
| | |
| | |
| | |
| | |
|
| | |
| | |
|
| | |
| | |
| | |
|
| | |
|
| | |
|
| | |
| | |
| | |
| | |
| | |
100Schwab Fixed-Income ETFs | Annual Report
Schwab U.S. Aggregate Bond ETF
Portfolio Holdings as of December 31, 2023 (continued)
SECURITY RATE, MATURITY DATE | | |
|
| | |
| | |
| | |
| | |
| | |
|
| | |
| | |
| | |
| | |
| | |
| | |
| | |
| | |
| | |
| | |
|
| | |
|
| | |
| | |
| | |
Evergy Kansas Central, Inc. |
| | |
| | |
| | |
| | |
| | |
| | |
|
| | |
| | |
| | |
| | |
| | |
|
| | |
|
| | |
| | |
| | |
| | |
| | |
| | |
| | |
| | |
| | |
| | |
| | |
| | |
| | |
|
| | |
| | |
| | |
| | |
| | |
| | |
| | |
| | |
| | |
| | |
| | |
| | |
| | |
SECURITY RATE, MATURITY DATE | | |
Florida Power & Light Co. |
| | |
| | |
| | |
| | |
| | |
| | |
| | |
| | |
| | |
| | |
| | |
| | |
| | |
| | |
| | |
| | |
| | |
| | |
| | |
| | |
| | |
| | |
| | |
|
| | |
|
| | |
| | |
| | |
| | |
| | |
| | |
| | |
| | |
| | |
| | |
| | |
| | |
Iberdrola International BV |
| | |
| | |
|
| | |
Indiana Michigan Power Co. |
| | |
| | |
| | |
| | |
Interstate Power & Light Co. |
| | |
| | |
| | |
| | |
| | |
| | |
|
| | |
|
| | |
| | |
| | |
|
| | |
| | |
| | |
Schwab Fixed-Income ETFs | Annual Report101
Schwab U.S. Aggregate Bond ETF
Portfolio Holdings as of December 31, 2023 (continued)
SECURITY RATE, MATURITY DATE | | |
Louisville Gas & Electric Co. |
| | |
| | |
|
| | |
| | |
| | |
| | |
| | |
| | |
| | |
| | |
| | |
| | |
| | |
| | |
|
| | |
| | |
| | |
|
| | |
National Rural Utilities Cooperative Finance Corp. |
| | |
| | |
| | |
| | |
| | |
| | |
| | |
| | |
| | |
| | |
| | |
| | |
| | |
| | |
| | |
| | |
|
| | |
| | |
| | |
| | |
NextEra Energy Capital Holdings, Inc. |
| | |
| | |
| | |
| | |
| | |
| | |
| | |
| | |
| | |
| | |
| | |
| | |
| | |
| | |
| | |
| | |
Northern States Power Co. |
| | |
| | |
| | |
| | |
SECURITY RATE, MATURITY DATE | | |
| | |
| | |
| | |
| | |
| | |
| | |
| | |
|
| | |
|
| | |
| | |
| | |
| | |
| | |
| | |
| | |
|
| | |
| | |
| | |
| | |
| | |
|
| | |
|
| | |
| | |
| | |
| | |
Oklahoma Gas & Electric Co. |
| | |
| | |
| | |
| | |
Oncor Electric Delivery Co. LLC |
| | |
| | |
| | |
| | |
| | |
| | |
| | |
| | |
| | |
| | |
| | |
| | |
| | |
| | |
| | |
| | |
| | |
| | |
Pacific Gas & Electric Co. |
| | |
| | |
| | |
| | |
| | |
| | |
| | |
| | |
| | |
| | |
| | |
102Schwab Fixed-Income ETFs | Annual Report
Schwab U.S. Aggregate Bond ETF
Portfolio Holdings as of December 31, 2023 (continued)
SECURITY RATE, MATURITY DATE | | |
| | |
| | |
| | |
| | |
| | |
| | |
| | |
| | |
| | |
| | |
| | |
| | |
| | |
| | |
| | |
| | |
| | |
| | |
| | |
| | |
|
| | |
| | |
| | |
| | |
| | |
| | |
| | |
| | |
| | |
| | |
| | |
| | |
| | |
|
| | |
| | |
| | |
| | |
| | |
| | |
| | |
| | |
Pinnacle West Capital Corp. |
| | |
Potomac Electric Power Co. |
| | |
PPL Capital Funding, Inc. |
| | |
| | |
PPL Electric Utilities Corp. |
| | |
| | |
| | |
| | |
| | |
| | |
|
| | |
| | |
| | |
Public Service Co. of Colorado |
| | |
| | |
| | |
| | |
SECURITY RATE, MATURITY DATE | | |
| | |
| | |
| | |
| | |
| | |
| | |
| | |
Public Service Co. of New Hampshire |
| | |
Public Service Co. of Oklahoma |
| | |
| | |
| | |
Public Service Electric & Gas Co. |
| | |
| | |
| | |
| | |
| | |
| | |
| | |
| | |
| | |
| | |
| | |
| | |
| | |
| | |
| | |
| | |
| | |
| | |
| | |
| | |
Public Service Enterprise Group, Inc. |
| | |
| | |
| | |
| | |
| | |
|
| | |
| | |
| | |
|
| | |
| | |
| | |
| | |
| | |
| | |
San Diego Gas & Electric Co. |
| | |
| | |
| | |
| | |
| | |
| | |
| | |
| | |
| | |
| | |
|
| | |
Schwab Fixed-Income ETFs | Annual Report103
Schwab U.S. Aggregate Bond ETF
Portfolio Holdings as of December 31, 2023 (continued)
SECURITY RATE, MATURITY DATE | | |
Southern California Edison Co. |
| | |
| | |
| | |
| | |
| | |
| | |
| | |
| | |
| | |
| | |
| | |
| | |
| | |
| | |
| | |
| | |
| | |
| | |
| | |
| | |
| | |
| | |
| | |
| | |
| | |
| | |
| | |
| | |
|
| | |
| | |
| | |
| | |
| | |
| | |
| | |
| | |
| | |
| | |
| | |
|
| | |
| | |
| | |
| | |
Southwestern Electric Power Co. |
| | |
| | |
| | |
| | |
| | |
Southwestern Public Service Co. |
| | |
| | |
| | |
| | |
| | |
| | |
|
| | |
| | |
| | |
| | |
| | |
| | |
| | |
SECURITY RATE, MATURITY DATE | | |
|
| | |
Tucson Electric Power Co. |
| | |
| | |
| | |
| | |
|
| | |
| | |
| | |
| | |
| | |
| | |
| | |
| | |
| | |
| | |
| | |
Virginia Electric & Power Co. |
| | |
| | |
| | |
| | |
| | |
| | |
| | |
| | |
| | |
| | |
| | |
| | |
| | |
| | |
| | |
| | |
| | |
| | |
| | |
|
| | |
| | |
| | |
| | |
| | |
| | |
| | |
Wisconsin Electric Power Co. |
| | |
| | |
Wisconsin Power & Light Co. |
| | |
| | |
| | |
Wisconsin Public Service Corp. |
| | |
| | |
| | |
|
| | |
| | |
| | |
| | |
| | |
| | |
104Schwab Fixed-Income ETFs | Annual Report
Schwab U.S. Aggregate Bond ETF
Portfolio Holdings as of December 31, 2023 (continued)
SECURITY RATE, MATURITY DATE | | |
| | |
| | |
| | |
|
|
| | |
| | |
| | |
| | |
| | |
| | |
| | |
| | |
| | |
| | |
| | |
| | |
CenterPoint Energy Resources Corp. |
| | |
| | |
| | |
| | |
| | |
| | |
|
| | |
|
| | |
| | |
| | |
| | |
| | |
| | |
| | |
| | |
| | |
| | |
| | |
| | |
| | |
|
| | |
| | |
Piedmont Natural Gas Co., Inc. |
| | |
| | |
| | |
| | |
|
| | |
| | |
| | |
| | |
| | |
| | |
| | |
| | |
| | |
Southern California Gas Co. |
| | |
| | |
| | |
| | |
| | |
| | |
SECURITY RATE, MATURITY DATE | | |
| | |
| | |
| | |
| | |
Southern Co. Gas Capital Corp. |
| | |
| | |
| | |
| | |
| | |
| | |
| | |
| | |
|
| | |
| | |
| | |
| | |
| | |
| | |
|
| | |
|
| | |
| | |
| | |
|
American Water Capital Corp. |
| | |
| | |
| | |
| | |
| | |
| | |
| | |
| | |
| | |
| | |
| | |
| | |
| | |
| | |
| | |
Essential Utilities, Inc. |
| | |
| | |
| | |
| | |
| | |
| | |
| | |
| | |
Total Corporates
(Cost $2,033,768,040) | |
|
TREASURIES 41.3% OF NET ASSETS |
|
| | |
| | |
| | |
| | |
| | |
| | |
Schwab Fixed-Income ETFs | Annual Report105
Schwab U.S. Aggregate Bond ETF
Portfolio Holdings as of December 31, 2023 (continued)
SECURITY RATE, MATURITY DATE | | |
| | |
| | |
| | |
| | |
| | |
| | |
| | |
| | |
| | |
| | |
| | |
| | |
| | |
| | |
| | |
| | |
| | |
| | |
| | |
| | |
| | |
| | |
| | |
| | |
| | |
| | |
| | |
| | |
| | |
| | |
| | |
| | |
| | |
| | |
| | |
| | |
| | |
| | |
| | |
| | |
| | |
| | |
| | |
| | |
| | |
| | |
| | |
| | |
| | |
| | |
| | |
| | |
| | |
| | |
| | |
| | |
| | |
| | |
| | |
| | |
| | |
| | |
| | |
| | |
| | |
| | |
| | |
| | |
SECURITY RATE, MATURITY DATE | | |
| | |
| | |
| | |
| | |
| | |
| | |
| | |
| | |
| | |
| | |
| | |
| | |
| | |
| | |
| | |
| | |
| | |
| | |
| | |
| | |
|
| | |
| | |
| | |
| | |
| | |
| | |
| | |
| | |
| | |
| | |
| | |
| | |
| | |
| | |
| | |
| | |
| | |
| | |
| | |
| | |
| | |
| | |
| | |
| | |
| | |
| | |
| | |
| | |
| | |
| | |
| | |
| | |
| | |
| | |
| | |
| | |
| | |
| | |
| | |
| | |
| | |
| | |
| | |
| | |
| | |
| | |
| | |
106Schwab Fixed-Income ETFs | Annual Report
Schwab U.S. Aggregate Bond ETF
Portfolio Holdings as of December 31, 2023 (continued)
SECURITY RATE, MATURITY DATE | | |
| | |
| | |
| | |
| | |
| | |
| | |
| | |
| | |
| | |
| | |
| | |
| | |
| | |
| | |
| | |
| | |
| | |
| | |
| | |
| | |
| | |
| | |
| | |
| | |
| | |
| | |
| | |
| | |
| | |
| | |
| | |
| | |
| | |
| | |
| | |
| | |
| | |
| | |
| | |
| | |
| | |
| | |
| | |
| | |
| | |
| | |
| | |
| | |
| | |
| | |
| | |
| | |
| | |
| | |
| | |
| | |
| | |
| | |
| | |
| | |
| | |
| | |
| | |
| | |
| | |
| | |
| | |
| | |
SECURITY RATE, MATURITY DATE | | |
| | |
| | |
| | |
| | |
| | |
| | |
| | |
| | |
| | |
| | |
| | |
| | |
| | |
| | |
| | |
| | |
| | |
| | |
| | |
| | |
| | |
| | |
| | |
| | |
| | |
| | |
| | |
| | |
| | |
| | |
| | |
| | |
| | |
| | |
| | |
| | |
| | |
| | |
| | |
| | |
| | |
| | |
| | |
| | |
| | |
| | |
| | |
| | |
| | |
| | |
| | |
| | |
| | |
| | |
| | |
| | |
| | |
| | |
| | |
| | |
| | |
| | |
| | |
| | |
| | |
| | |
| | |
| | |
Schwab Fixed-Income ETFs | Annual Report107
Schwab U.S. Aggregate Bond ETF
Portfolio Holdings as of December 31, 2023 (continued)
SECURITY RATE, MATURITY DATE | | |
| | |
| | |
| | |
| | |
| | |
| | |
| | |
Total Treasuries
(Cost $3,174,533,787) | |
|
GOVERNMENT RELATED 4.8% OF NET ASSETS |
|
|
|
|
Oesterreichische Kontrollbank AG |
| | |
| | |
| | |
| | |
| | |
| | |
| | |
|
Export Development Canada |
| | |
| | |
| | |
|
Industrial & Commercial Bank of China Ltd. |
| | |
|
Kreditanstalt fuer Wiederaufbau |
| | |
| | |
| | |
| | |
| | |
| | |
| | |
| | |
| | |
| | |
| | |
| | |
| | |
| | |
| | |
| | |
| | |
| | |
| | |
| | |
Landwirtschaftliche Rentenbank |
| | |
| | |
| | |
| | |
| | |
SECURITY RATE, MATURITY DATE | | |
| | |
| | |
| | |
|
Japan Bank for International Cooperation |
| | |
| | |
| | |
| | |
| | |
| | |
| | |
| | |
| | |
| | |
| | |
| | |
| | |
| | |
| | |
| | |
Japan International Cooperation Agency |
| | |
| | |
| | |
| | |
| | |
| | |
|
|
| | |
| | |
| | |
| | |
| | |
| | |
| | |
| | |
| | |
| | |
| | |
| | |
| | |
| | |
| | |
|
Export-Import Bank of Korea |
| | |
| | |
| | |
| | |
| | |
| | |
| | |
| | |
| | |
| | |
| | |
| | |
| | |
108Schwab Fixed-Income ETFs | Annual Report
Schwab U.S. Aggregate Bond ETF
Portfolio Holdings as of December 31, 2023 (continued)
SECURITY RATE, MATURITY DATE | | |
|
| | |
| | |
| | |
| | |
| | |
| | |
| | |
| | |
| | |
| | |
| | |
|
|
| | |
| | |
| | |
| | |
| | |
| | |
| | |
| | |
| | |
|
Federal Farm Credit Banks Funding Corp. | | |
| | |
| | |
| | |
| | |
| | |
| | |
| | |
| | |
| | |
| | |
| | |
| | |
| | |
| | |
| | |
| | |
| | |
Federal Home Loan Mortgage Corp. | | |
| | |
| | |
| | |
| | |
| | |
| | |
Federal National Mortgage Association | | |
| | |
| | |
| | |
| | |
| | |
| | |
| | |
| | |
| | |
| | |
| | |
SECURITY RATE, MATURITY DATE | | |
Tennessee Valley Authority | | |
| | |
| | |
| | |
| | |
| | |
| | |
|
|
|
|
|
| | |
| | |
| | |
|
| | |
| | |
| | |
Province of British Columbia |
| | |
| | |
| | |
| | |
| | |
| | |
|
| | |
| | |
| | |
Province of New Brunswick |
| | |
|
| | |
| | |
| | |
| | |
| | |
| | |
| | |
| | |
| | |
| | |
| | |
|
| | |
| | |
| | |
| | |
| | |
| | |
| | |
| | |
| | |
| | |
|
Alabama Federal Aid Highway Finance Authority | | |
| | |
| | |
Schwab Fixed-Income ETFs | Annual Report109
Schwab U.S. Aggregate Bond ETF
Portfolio Holdings as of December 31, 2023 (continued)
SECURITY RATE, MATURITY DATE | | |
Alameda County Joint Powers Authority | | |
RB (Build America Bonds) Series 2010 | | |
| | |
American Municipal Power, Inc. | | |
RB (Build America Bonds) Series 2010 | | |
| | |
| | |
RB (Build America Bonds) Series 2009F2 | | |
| | |
RB (Build America Bonds) Series 2010S1 | | |
| | |
RB (Build America Bonds) Series 2010S3 | | |
| | |
| | |
| | |
Broward Cnty Airport System Revenue | | |
| | |
| | |
| | |
GO (Build America Bonds) Series 2009 | | |
| | |
GO (Build America Bonds) Series 2009 | | |
| | |
GO (Build America Bonds) Series 2009 | | |
| | |
GO (Build America Bonds) Series 2009 | | |
| | |
California Health Facilities Financing Authority | | |
| | |
California State University | | |
| | |
| | |
| | |
| | |
| | |
| | |
Central Puget Sound Regional Transit Authority | | |
RB (Build America Bonds) Series 2009-S | | |
| | |
Chicago O'Hare International Airport | | |
RB (Build America Bonds) Series 2010B | | |
| | |
| | |
| | |
| | |
| | |
Chicago Transit Authority Sales & Transfer Tax Receipts Revenue | | |
RB (Pension Funding) Series 2008A | | |
| | |
RB (Pension Funding) Series 2008B | | |
| | |
City of Atlanta GA Water & Wastewater Revenue | | |
| | |
SECURITY RATE, MATURITY DATE | | |
| | |
GO Bonds (Pension Funding) Series 2017 | | |
| | |
| | |
GO Bonds (Build America Bonds) Series C1 | | |
| | |
| | |
| | |
| | |
City of San Antonio TX Electric & Gas Systems Revenue | | |
RB (Build America Bonds) Series 2009 | | |
| | |
| | |
| | |
City of San Francisco CA Public Utilities Commission Water Revenue | | |
RB (Build America Bonds) Series 2010 | | |
| | |
| | |
| | |
| | |
Commonwealth Financing Authority | | |
| | |
| | |
| | |
| | |
| | |
| | |
Commonwealth of Massachusetts | | |
GO (Build America Bonds) Series 2009 | | |
| | |
GO (Build America Bonds) Series 2010D | | |
| | |
| | |
| | |
| | |
| | |
| | |
| | |
| | |
| | |
Commonwealth of Massachusetts Transportation Fund Revenue | | |
RB (Build America Bonds) Series 2010 | | |
| | |
| | |
| | |
| | |
County of Clark Department of Aviation | | |
RB (Build America Bonds) Series 2010C | | |
| | |
| | |
GO (Build America Bonds) Series D | | |
| | |
County of Miami-Dade FL Aviation Revenue | | |
| | |
| | |
110Schwab Fixed-Income ETFs | Annual Report
Schwab U.S. Aggregate Bond ETF
Portfolio Holdings as of December 31, 2023 (continued)
SECURITY RATE, MATURITY DATE | | |
County of Miami-Dade FL Water & Sewer System Revenue | | |
| | |
| | |
Dallas Area Rapid Transit | | |
RB (Build America Bonds) Series 2010 | | |
| | |
| | |
| | |
Dallas Convention Center Hotel Development Corp. | | |
| | |
Dallas County Hospital District | | |
GO (Build America Bonds) Series C | | |
| | |
Dallas Fort Worth International Airport | | |
| | |
| | |
| | |
| | |
| | |
| | |
| | |
| | |
| | |
| | |
| | |
| | |
Dallas Independent School District | | |
GO (Build America Bonds) Series 2010C | | |
| | |
District of Columbia Income Tax Revenue | | |
| | |
| | |
District of Columbia Water & Sewer Authority | | |
| | |
| | |
East Bay Municipal Utility District Water System Revenue | | |
Water System RB (Build America Bonds) Series 2010 | | |
| | |
Foothill-Eastern Transportation Corridor Agency | | |
| | |
| | |
| | |
| | |
Golden State Tobacco Securitization Corp. | | |
| | |
| | |
| | |
| | |
| | |
| | |
Grand Parkway Transportation Corp. | | |
| | |
| | |
| | |
| | |
Great Lakes Water Authority Water Supply System Revenue | | |
| | |
| | |
SECURITY RATE, MATURITY DATE | | |
| | |
GO (Build America Bonds) Series 2010 | | |
| | |
GO (Build America Bonds) Series 2010 | | |
| | |
GO Bonds (Pension Funding) Series 2003 | | |
| | |
Illinois State Toll Highway Authority | | |
RB (Build America Bonds) Series A | | |
| | |
Indiana Finance Authority | | |
| | |
| | |
RB (Build America Bonds) Series B | | |
| | |
| | |
| | |
Kansas Development Finance Authority | | |
| | |
| | |
| | |
| | |
Los Angeles Community College District | | |
GO (Build America Bonds) Series 2010 | | |
| | |
| | |
| | |
| | |
| | |
| | |
| | |
Los Angeles County Metropolitan Transportation Authority Sales Tax Revenue | | |
| | |
Los Angeles Department of Water & Power Power System | | |
| | |
RB (Build America Bonds) Series 2010 | | |
| | |
Los Angeles Unified School District | | |
GO (Build America Bonds) Series 2009 | | |
| | |
GO (Build America Bonds) Series 2009 | | |
| | |
GO (Build America Bonds) Series 2010 | | |
| | |
Louisiana Local Government Environmental Facilities & Community Development Authority | | |
| | |
| | |
| | |
| | |
| | |
| | |
Louisville and Jefferson County Metropolitan Sewer District | | |
| | |
| | |
Maryland Health & Higher Educational Facilities Authority | | |
| | |
| | |
Schwab Fixed-Income ETFs | Annual Report111
Schwab U.S. Aggregate Bond ETF
Portfolio Holdings as of December 31, 2023 (continued)
SECURITY RATE, MATURITY DATE | | |
| | |
| | |
Massachusetts School Building Authority | | |
| | |
| | |
| | |
| | |
| | |
Metropolitan Government Nashville & Davidson County Health & Educational Facs Bd | | |
RB (Vanderbilt Univ Medical Center) Series 2016 B | | |
| | |
Metropolitan Government of Nashville & Davidson County Convention Center Auth | | |
RB (Build America Bonds) Series B | | |
| | |
Metropolitan Transportation Authority | | |
| | |
RB (Build America Bonds) Series C | | |
| | |
RB (Build America Bonds) Series E | | |
| | |
Metropolitan Washington Airports Authority Dulles Toll Road Revenue | | |
RB (Build America Bonds) Series B | | |
| | |
Metropolitan Water Reclamation District of Greater Chicago | | |
| | |
Michigan Finance Authority | | |
| | |
| | |
Michigan State Building Authority | | |
| | |
| | |
Michigan State University | | |
| | |
| | |
Missouri Health & Educational Facilities Authority | | |
| | |
| | |
Municipal Electric Authority of Georgia | | |
RB (Build America Bonds) Series 2010 | | |
| | |
RB (Build America Bonds) Series A | | |
| | |
| | |
| | |
New Jersey Economic Development Authority | | |
| | |
| | |
New Jersey Transportation Trust Fund Authority | | |
RB (Build America Bonds) Series 2010C | | |
| | |
RB (Build America Bonds) Series B | | |
| | |
SECURITY RATE, MATURITY DATE | | |
New Jersey Turnpike Authority | | |
RB (Build America Bonds) Series 2009F | | |
| | |
RB (Build America Bonds) Series 2010A | | |
| | |
New York City Transitional Finance Authority | | |
RB (Build America Bonds) Series 2011A1 | | |
| | |
New York City Water & Sewer System | | |
RB (Build America Bonds) Series GG | | |
| | |
Water System RB (Build America Bonds) | | |
| | |
Water System RB (Build America Bonds) Series 2009 | | |
| | |
Water System RB (Build America Bonds) Series 2011CC | | |
| | |
New York State Dormitory Authority | | |
RB (Build America Bonds) Series 2010 | | |
| | |
| | |
| | |
New York State Thruway Authority | | |
| | |
| | |
| | |
| | |
New York State Urban Development Corp. | | |
RB (Build America Bonds) Series 2009 | | |
| | |
North Texas Tollway Authority | | |
RB (Build America Bonds) Series 2009B | | |
| | |
| | |
RB (Build America Bonds) Series 2010C | | |
| | |
Ohio Turnpike & Infrastructure Commission | | |
| | |
| | |
Oklahoma Development Finance Authority | | |
| | |
| | |
| | |
GO Bonds (Pension Funding) Series 2003 | | |
| | |
Oregon School Boards Association | | |
| | |
| | |
| | |
| | |
Port Authority of New York & New Jersey | | |
| | |
Consolidated Bonds 164th Series | | |
| | |
Consolidated Bonds 165th Series | | |
| | |
112Schwab Fixed-Income ETFs | Annual Report
Schwab U.S. Aggregate Bond ETF
Portfolio Holdings as of December 31, 2023 (continued)
SECURITY RATE, MATURITY DATE | | |
Consolidated Bonds 168th Series | | |
| | |
Consolidated Bonds 174th Series | | |
| | |
Consolidated Bonds 181st Series | | |
| | |
Regents of the University of California Medical Center Pooled Revenue | | |
RB (Build America Bonds) Series F | | |
| | |
RB (Build America Bonds) Series H | | |
| | |
| | |
| | |
Regional Transportation District Sales Tax Revenue | | |
| | |
| | |
Rutgers The State University of New Jersey | | |
RB (Build America Bonds) Series H | | |
| | |
| | |
| | |
| | |
| | |
Sales Tax Securitization Corp. | | |
| | |
| | |
| | |
| | |
| | |
| | |
Salt River Project Agricultural Improvement & Power District | | |
RB (Build America Bonds) Series 2010 | | |
| | |
San Diego County Regional Transportation Commission | | |
RB (Build America Bonds) Series 2010A | | |
| | |
San Diego County Water Authority., Class B | | |
RB (Build America Bonds) Series 2010B | | |
| | |
San Joaquin Hills Transportation Corridor Agency | | |
| | |
| | |
San Jose Redevelopment Agency Successor Agency | | |
| | |
| | |
State Board of Administration Finance Corp. | | |
| | |
| | |
| | |
| | |
| | |
| | |
| | |
| | |
| | |
| | |
| | |
SECURITY RATE, MATURITY DATE | | |
| | |
| | |
| | |
| | |
| | |
| | |
GO (Build America Bonds) Series 2010 | | |
| | |
State of Louisiana Gasoline and Fuels Tax Revenue | | |
| | |
| | |
| | |
GO Bonds (Build America Bonds) Series F | | |
| | |
State of Oregon Department of Transportation | | |
RB (Build America Bonds) Series 2010A | | |
| | |
| | |
| | |
| | |
State Public School Building Auth | | |
| | |
| | |
| | |
GO (Build America Bonds) Series 2010A | | |
| | |
GO Mobility Fund Bonds (Build America Bonds) Series 2009A | | |
| | |
Texas Private Activity Bond Surface Transportation Corp. | | |
| | |
| | |
Texas Transportation Commission | | |
| | |
| | |
RB (Build America Bonds) Series B | | |
| | |
| | |
RB (Build America Bonds) Series 2009 | | |
| | |
| | |
| | |
| | |
| | |
| | |
| | |
| | |
| | |
| | |
| | |
| | |
| | |
| | |
| | |
| | |
| | |
| | |
Schwab Fixed-Income ETFs | Annual Report113
Schwab U.S. Aggregate Bond ETF
Portfolio Holdings as of December 31, 2023 (continued)
SECURITY RATE, MATURITY DATE | | |
University of Pittsburgh-of the Commonwealth System of Higher Education | | |
| | |
| | |
University of Texas System | | |
RB (Build America Bonds) Series C | | |
| | |
| | |
General Revenue Pledge and Refunding Bonds, Series 2020 | | |
| | |
| | |
| | |
| | |
| | |
| | |
GO (Build America Bonds) Series B | | |
| | |
GO (Build America Bonds) Series D | | |
| | |
| | |
| | |
| | |
| | |
| | |
|
|
|
Canada Government International Bonds |
| | |
| | |
| | |
| | |
| | |
|
Chile Government International Bonds |
| | |
| | |
| | |
| | |
| | |
| | |
| | |
| | |
| | |
| | |
| | |
| | |
| | |
| | |
| | |
| | |
| | |
|
Hungary Government International Bonds |
| | |
|
Indonesia Government International Bonds |
| | |
| | |
SECURITY RATE, MATURITY DATE | | |
| | |
| | |
| | |
| | |
| | |
| | |
| | |
| | |
| | |
| | |
| | |
| | |
| | |
| | |
| | |
| | |
| | |
| | |
|
Israel Government International Bonds |
| | |
| | |
| | |
| | |
| | |
| | |
| | |
|
| | |
| | |
| | |
|
Republic of Italy Government International Bonds |
| | |
| | |
| | |
| | |
| | |
| | |
|
Mexico Government International Bonds |
| | |
| | |
| | |
| | |
| | |
| | |
| | |
| | |
| | |
| | |
| | |
| | |
| | |
| | |
| | |
| | |
| | |
| | |
| | |
| | |
| | |
| | |
114Schwab Fixed-Income ETFs | Annual Report
Schwab U.S. Aggregate Bond ETF
Portfolio Holdings as of December 31, 2023 (continued)
SECURITY RATE, MATURITY DATE | | |
| | |
| | |
| | |
| | |
|
Panama Government International Bonds |
| | |
| | |
| | |
| | |
| | |
| | |
| | |
| | |
| | |
| | |
| | |
| | |
| | |
| | |
| | |
| | |
| | |
|
Peru Government International Bonds |
| | |
| | |
| | |
| | |
| | |
| | |
| | |
| | |
| | |
| | |
| | |
| | |
| | |
| | |
| | |
|
Philippines Government International Bonds |
| | |
| | |
| | |
| | |
| | |
| | |
| | |
| | |
| | |
| | |
| | |
| | |
| | |
| | |
| | |
| | |
| | |
| | |
| | |
| | |
| | |
SECURITY RATE, MATURITY DATE | | |
| | |
| | |
| | |
|
Republic of Poland Government International Bonds |
| | |
| | |
| | |
| | |
| | |
|
Korea International Bonds |
| | |
| | |
| | |
| | |
| | |
| | |
| | |
|
Uruguay Government International Bonds |
| | |
| | |
| | |
| | |
| | |
| | |
| | |
| | |
| | |
|
|
|
| | |
| | |
| | |
| | |
| | |
Arab Petroleum Investments Corp. |
| | |
|
| | |
| | |
| | |
| | |
| | |
| | |
| | |
| | |
| | |
| | |
| | |
| | |
| | |
| | |
| | |
| | |
| | |
| | |
| | |
| | |
Schwab Fixed-Income ETFs | Annual Report115
Schwab U.S. Aggregate Bond ETF
Portfolio Holdings as of December 31, 2023 (continued)
SECURITY RATE, MATURITY DATE | | |
| | |
| | |
| | |
| | |
| | |
| | |
Asian Infrastructure Investment Bank |
| | |
| | |
| | |
| | |
|
| | |
| | |
| | |
| | |
Council of Europe Development Bank |
| | |
| | |
| | |
| | |
European Bank for Reconstruction & Development |
| | |
| | |
| | |
| | |
| | |
|
| | |
| | |
| | |
| | |
| | |
| | |
| | |
| | |
| | |
| | |
| | |
| | |
| | |
| | |
| | |
| | |
| | |
| | |
| | |
| | |
| | |
Inter-American Development Bank |
| | |
| | |
| | |
| | |
| | |
| | |
| | |
| | |
| | |
| | |
| | |
| | |
| | |
| | |
| | |
| | |
SECURITY RATE, MATURITY DATE | | |
| | |
| | |
Inter-American Investment Corp. |
| | |
| | |
International Bank for Reconstruction & Development |
| | |
| | |
| | |
| | |
| | |
| | |
| | |
| | |
| | |
| | |
| | |
| | |
| | |
| | |
| | |
| | |
| | |
| | |
| | |
| | |
| | |
| | |
| | |
| | |
| | |
| | |
| | |
| | |
International Finance Corp. |
| | |
| | |
| | |
| | |
| | |
|
| | |
| | |
| | |
| | |
| | |
| | |
Total Government Related
(Cost $391,862,589) | |
|
SECURITIZED 28.6% OF NET ASSETS |
|
Asset-Backed Securities 0.0% |
|
Capital One Multi-Asset Execution Trust |
| | |
| | |
|
PG&E Wildfire Recovery Funding LLC |
| | |
| | |
116Schwab Fixed-Income ETFs | Annual Report
Schwab U.S. Aggregate Bond ETF
Portfolio Holdings as of December 31, 2023 (continued)
SECURITY RATE, MATURITY DATE | | |
| | |
| | |
| | |
|
Duke Energy Florida Project Finance LLC |
| | |
Duke Energy Progress NC Storm Funding LLC |
| | |
PG&E Energy Recovery Funding LLC |
| | |
PG&E Wildfire Recovery Funding LLC |
| | |
| | |
| | |
| | |
|
Commercial Mortgage-Backed Security 2.0% |
|
Series 2017-BNK7, Class A5 | | |
| | |
Series 2017-BNK8, Class A4 | | |
| | |
Series 2017-BNK9, Class A4 | | |
| | |
Series 2019-BN19, Class A3 | | |
| | |
Series 2020-BN26, Class A4 | | |
| | |
|
| | |
| | |
Series 2022-C15, Class A5 | | |
| | |
|
Series 2019-B12, Class A5 | | |
| | |
Series 2019-B13, Class A4 | | |
| | |
| | |
| | |
Series 2020-B16, Class A5 | | |
| | |
Series 2020-B18, Class A5 | | |
| | |
|
Series 2017-CD3, Class A4 | | |
| | |
CFCRE Commercial Mortgage Trust |
| | |
| | |
| | |
| | |
| | |
| | |
Citigroup Commercial Mortgage Trust |
Series 2014-GC23, Class A4 | | |
| | |
Series 2014-GC25, Class A4 | | |
| | |
Series 2016-GC36, Class A5 | | |
| | |
Series 2016-GC37, Class A4 | | |
| | |
SECURITY RATE, MATURITY DATE | | |
| | |
| | |
| | |
| | |
|
Series 2014-CR19, Class ASB | | |
| | |
Series 2014-CR21, Class A3 | | |
| | |
Series 2014-LC15, Class A4 | | |
| | |
Series 2015-CR22, Class A5 | | |
| | |
Series 2015-CR24, Class A5 | | |
| | |
Series 2015-LC23, Class A4 | | |
| | |
Series 2015-PC1, Class A5 | | |
| | |
Series 2016-CR28, Class A4 | | |
| | |
Series 2016-DC2, Class A5 | | |
| | |
CSAIL Commercial Mortgage Trust |
| | |
| | |
Series 2019-C17, Class A5 | | |
| | |
|
Series 2016-NXSR, Class A4 | | |
| | |
Federal Home Loan Mortgage Corp. Multifamily Structured Pass-Through Certificates |
| | |
| | |
| | |
| | |
| | |
| | |
| | |
| | |
| | |
| | |
| | |
| | |
| | |
| | |
| | |
| | |
| | |
| | |
| | |
| | |
| | |
| | |
| | |
| | |
| | |
| | |
| | |
| | |
| | |
| | |
| | |
| | |
| | |
| | |
Schwab Fixed-Income ETFs | Annual Report117
Schwab U.S. Aggregate Bond ETF
Portfolio Holdings as of December 31, 2023 (continued)
SECURITY RATE, MATURITY DATE | | |
| | |
| | |
| | |
| | |
| | |
| | |
| | |
| | |
| | |
| | |
| | |
| | |
| | |
| | |
| | |
| | |
| | |
| | |
| | |
| | |
| | |
| | |
| | |
| | |
| | |
| | |
| | |
| | |
| | |
| | |
| | |
| | |
| | |
| | |
| | |
| | |
| | |
| | |
| | |
| | |
| | |
| | |
| | |
| | |
| | |
| | |
Federal National Mortgage Association-Aces |
Series 2015-M13, Class A2 | | |
| | |
| | |
| | |
| | |
| | |
GS Mortgage Securities Trust |
Series 2016-GS4, Class A4 | | |
| | |
Series 2020-GC45, Class A5 | | |
| | |
JP Morgan Chase Commercial Mortgage Securities Trust |
Series 2014-C20, Class A4A1 | | |
| | |
Series 2015-JP1, Class A4 | | |
| | |
JPMBB Commercial Mortgage Securities Trust |
Series 2015-C28, Class A4 | | |
| | |
SECURITY RATE, MATURITY DATE | | |
Series 2015-C29, Class A4 | | |
| | |
Series 2015-C33, Class A4 | | |
| | |
Morgan Stanley Bank of America Merrill Lynch Trust |
Series 2014-C16, Class A5 | | |
| | |
Series 2015-C24, Class A4 | | |
| | |
Series 2015-C24, Class ASB | | |
| | |
Morgan Stanley Capital I Trust |
Series 2015-UBS8, Class A4 | | |
| | |
| | |
| | |
Series 2017-HR2, Class A4 | | |
| | |
Series 2020-HR8, Class A4 | | |
| | |
UBS Commercial Mortgage Trust |
| | |
| | |
| | |
| | |
| | |
| | |
Series 2019-C18, Class A4 | | |
| | |
Wells Fargo Commercial Mortgage Trust |
Series 2014-LC16 Class A4 | | |
| | |
Series 2015-C28, Class A3 | | |
| | |
Series 2015-C30, Class A4 | | |
| | |
Series 2015-C31, Class A3 | | |
| | |
Series 2015-NXS4, Class A4 | | |
| | |
| | |
| | |
Series 2016-C32, Class A4 | | |
| | |
Series 2016-NXS5, Class A4 | | |
| | |
Series 2016-NXS5, Class A6 | | |
| | |
Series 2016-NXS6, Class A4 | | |
| | |
Series 2017-C40, Class A4 | | |
| | |
Series 2017-C41, Class A4 | | |
| | |
Series 2017-C42, Class A4 | | |
| | |
Series 2018-C44, Class A5 | | |
| | |
Series 2018-C47, Class A3 | | |
| | |
Series 2019-C50, Class A5 | | |
| | |
Series 2019-C53, Class A4 | | |
| | |
Series 2019-C54, Class A4 | | |
| | |
118Schwab Fixed-Income ETFs | Annual Report
Schwab U.S. Aggregate Bond ETF
Portfolio Holdings as of December 31, 2023 (continued)
SECURITY RATE, MATURITY DATE | | |
Series 2020-C55, Class A5 | | |
| | |
Series 2020-C58, Class A4 | | |
| | |
| | |
|
Mortgage-Backed Securities Pass-Through 26.6% |
Federal Home Loan Mortgage Corp. |
| | |
1.50%, 08/01/35 to 08/01/51 (a) | | |
2.00%, 01/01/28 to 03/01/52 (a) | | |
2.50%, 04/01/27 to 05/01/52 (a) | | |
3.00%, 08/01/26 to 08/01/52 (a) | | |
3.50%, 01/01/26 to 02/01/53 (a) | | |
4.00%, 04/01/26 to 10/01/52 (a) | | |
4.50%, 05/01/34 to 09/01/52 (a) | | |
5.00%, 11/01/33 to 06/01/53 (a) | | |
5.50%, 05/01/24 to 07/01/53 (a) | | |
6.00%, 07/01/33 to 12/01/53 (a) | | |
6.50%, 12/01/33 to 11/01/53 (a) | | |
Federal National Mortgage Association |
1.00%, 03/01/36 to 07/01/36 (a) | | |
1.50%, 09/01/35 to 09/01/51 (a) | | |
2.00%, 04/01/28 to 05/01/52 (a) | | |
2.50%, 07/01/27 to 05/01/52 (a) | | |
3.00%, 12/01/25 to 05/01/52 (a) | | |
3.50%, 10/01/25 to 08/01/51 (a) | | |
4.00%, 02/01/26 to 07/01/52 (a) | | |
4.50%, 12/01/24 to 09/01/52 (a) | | |
5.00%, 09/01/33 to 08/01/53 (a) | | |
5.50%, 06/01/24 to 10/01/53 (a) | | |
6.00%, 04/01/35 to 11/01/53 (a) | | |
6.50%, 08/01/34 to 12/01/53 (a) | | |
| | |
Government National Mortgage Association |
1.50%, 03/20/51 to 10/20/51 (a) | | |
2.00%, 04/20/36 to 04/20/52 (a) | | |
2.50%, 03/20/27 to 04/20/52 (a) | | |
3.00%, 01/20/27 to 06/20/52 (a) | | |
3.50%, 09/20/32 to 06/20/51 (a) | | |
4.00%, 06/15/39 to 09/20/52 (a) | | |
4.50%, 01/20/39 to 08/20/53 (a) | | |
5.00%, 03/20/33 to 11/20/53 (a) | | |
5.50%, 10/20/33 to 11/20/53 (a) | | |
6.00%, 10/15/36 to 11/20/53 (a) | | |
6.50%, 04/20/53 to 10/20/53 (a) | | |
7.00%, 01/20/53 to 11/20/53 (a) | | |
Government National Mortgage Association, TBA |
| | |
| | |
| | |
| | |
Uniform Mortgage-Backed Security, TBA |
| | |
4.00%, 01/01/39 to 01/12/53 (a)(k) | | |
4.50%, 01/01/39 to 01/12/53 (a)(k) | | |
5.00%, 01/01/39 to 01/12/53 (a)(k) | | |
5.50%, 01/01/39 to 01/12/53 (a)(k) | | |
| | |
| | |
Total Securitized
(Cost $2,417,742,099) | |
| | |
SHORT-TERM INVESTMENTS 3.2% OF NET ASSETS |
|
|
State Street Institutional U.S. Government Money Market Fund, Premier Class 5.32% (l) | | |
State Street Institutional U.S. Government Money Market Fund, Premier Class 5.32% (l)(m) | | |
| | |
Total Short-Term Investments
(Cost $245,905,315) | |
Total Investments in Securities
(Cost $8,263,811,830) | |
| Supranational bonds represent the debt of international organizations or institutions such as the World Bank, the International Monetary Fund, regional multilateral development banks and others. |
| The effective maturity may be shorter than the final maturity shown because of the possibility of interim principal payments and prepayments or as the result of embedded demand features (puts or calls). |
| Security is in a fixed-rate coupon period. Based on index eligibility requirements and the fund’s investment objective this security will be removed from the index prior to converting to a floating rate security. |
| All or a portion of this security is on loan. Securities on loan were valued at $10,223,476. |
| Securities exempt from registration under Rule 144A of the Securities Act of 1933, as amended. These securities may be resold in transactions exempt from registrations, normally to qualified institutional buyers. At the period end, the value of these amounted to $14,222,294 or 0.2% of net assets. |
| Step up security that pays an initial coupon rate for a set period and increased coupon rates at one or more preset intervals. Rate shown is as of period end. |
| Issuer is affiliated with the fund’s investment adviser. |
| Interest rate is subject to adjustments from time to time if a nationally recognized statistical rating organization downgrades (or subsequently upgrades) the debt rating assigned to the bond. |
| Guaranteed by the Republic of Germany. |
| |
| Fixed rate is determined by a formula set forth in the security’s offering documents and is affected by the current WAC of the underlying loans. |
| Security or a portion of the security purchased on a delayed-delivery or when-issued basis. |
| The rate shown is the annualized 7-day yield. |
| Security purchased with cash collateral received for securities on loan. |
| |
| |
| Real Estate Investment Trust |
| |
| Weighted Average Coupon, which is the weighted average gross interest rate of the securitized asset pool and is determined by the different speeds at which the underlying mortgages are paid down. |
Schwab Fixed-Income ETFs | Annual Report119
Schwab U.S. Aggregate Bond ETF
Portfolio Holdings as of December 31, 2023 (continued)
Below is a summary of the fund’s transactions with affiliated issuers during the period ended December 31, 2023:
SECURITY
RATE, MATURITY DATE | | | | | NET CHANGE IN UNREALIZED APPRECIATION (DEPRECIATION) | ACCRETION OF DISCOUNTS (AMORTIZATION OF PREMIUMS) | | | |
CORPORATES 0.1% OF NET ASSETS |
|
Financial Institutions 0.1% |
Brokerage/Asset Managers/Exchanges 0.1% |
|
| | | | | | | | | |
| | | | | | | | | |
| | | | | | | | | |
| | | | | | | | | |
| | | | | | | | | |
| | | | | | | | | |
| | | | | | | | | |
| | | | | | | | | |
| | | | | | | | | |
| | | | | | | | | |
| | | | | | | | | |
| | | | | | | | | |
| | | | | | | | | |
| | | | | | | | | |
| | | | | | | | | |
| | | | | | | | | |
| | | | | | | | | |
| | | | | | | | | |
| | | | | | | | | |
| | | | | | | | | |
| | | | | | | | | |
| | | | | | | | | |
| | | | | | | | | |
| | | | | | | | | |
| | | | | | | | | |
| | | | | | | | | |
| | | | | | | | | |
| | | | | | | | | |
| | | | | | | | | |
120Schwab Fixed-Income ETFs | Annual Report
Schwab U.S. Aggregate Bond ETF
Portfolio Holdings as of December 31, 2023 (continued)
The following is a summary of the inputs used to value the fund’s investments as of December 31, 2023 (see financial note 2(a) for additional information):
| QUOTED PRICES IN
ACTIVE MARKETS FOR
IDENTICAL ASSETS
(LEVEL 1) | OTHER SIGNIFICANT
OBSERVABLE INPUTS
(LEVEL 2) | SIGNIFICANT
UNOBSERVABLE INPUTS
(LEVEL 3) | |
| | | | |
| | | | |
| | | | |
| | | | |
| | | | |
| | | | |
| | | | |
| As categorized in the Portfolio Holdings. |
Schwab Fixed-Income ETFs | Annual Report121
Schwab U.S. Aggregate Bond ETF
Statement of Assets and Liabilities
|
Investments in securities, at value - affiliated (cost $5,509,519) | | |
Investments in securities, at value - unaffiliated (cost $8,258,302,311) including securities on loan of $10,223,476 | | |
| | |
| | |
| | |
| | |
| | |
Income from securities on loan | | |
| | |
| | |
|
|
Collateral held for securities on loan | | |
| | |
Investments bought - delayed-delivery | | |
| | |
| | |
| | |
| | |
|
|
Capital received from investors | | |
| | |
| | |
122Schwab Fixed-Income ETFs | Annual Report
Schwab U.S. Aggregate Bond ETF
Statement of Operations
For the period January 1, 2023 through December 31, 2023 |
|
Interest received from securities - unaffiliated (net of foreign withholding tax of $208) | | |
Dividends received from securities - unaffiliated | | |
Interest received from securities - affiliated | | |
| | |
| | |
|
|
| | |
| | |
| | |
|
REALIZED AND UNREALIZED GAINS (LOSSES) |
Net realized losses on sales of securities - affiliated | | |
Net realized losses on sales of securities - unaffiliated | | |
Net realized losses on sales of in-kind redemptions - affiliated | | |
Net realized losses on sales of in-kind redemptions - unaffiliated | | |
| | |
Net change in unrealized appreciation (depreciation) on securities - affiliated | | |
Net change in unrealized appreciation (depreciation) on securities - unaffiliated | | |
Net change in unrealized appreciation (depreciation) | | |
Net realized and unrealized gains | | |
Increase in net assets resulting from operations | | |
Schwab Fixed-Income ETFs | Annual Report123
Schwab U.S. Aggregate Bond ETF
Statement of Changes in Net Assets
For the current and prior report periods
|
| | |
| | | |
| | | |
Net change in unrealized appreciation (depreciation) | | | |
Increase (decrease) in net assets resulting from operations | | | |
|
DISTRIBUTIONS TO SHAREHOLDERS |
| | | |
TRANSACTIONS IN FUND SHARES |
| | |
| | | | | |
| | | | | |
| | | | | |
Net transactions in fund shares | | | | | |
|
SHARES OUTSTANDING AND NET ASSETS |
| | |
| | | | | |
| | | | | |
Total increase (decrease) | | | | | |
| | | | | |
124Schwab Fixed-Income ETFs | Annual Report
Schwab 1-5 Year Corporate Bond ETF
Financial Statements
| | | | | | |
|
Net asset value at beginning of period | | | | | | |
Income (loss) from investment operations: | | | | | | |
Net investment income (loss)2 | | | | | | |
Net realized and unrealized gains (losses) | | | | | | |
Total from investment operations | | | | | | |
| | | | | | |
Distributions from net investment income | | | | | | |
Distributions from net realized gains | | | | | | |
| | | | | | |
Net asset value at end of period | | | | | | |
| | | | | | |
|
Ratios to average net assets: | | | | | | |
| | | | | | |
Net investment income (loss) | | | | | | |
| | | | | | |
Net assets, end of period (x 1,000) | | | | | | |
| Commencement of operations. |
| Calculated based on the average shares outstanding during the period. |
| |
| Effective July 1, 2022, the annual operating expense ratio was reduced to 0.03%. The ratio presented for the period ended December 31, 2022 is a blended ratio. |
| Ratio includes less than 0.005% of non-routine proxy expenses. |
| Effective December 20, 2021, the annual operating expense ratio was reduced to 0.04%. The ratio presented for the period ended December 31, 2021 is a blended ratio. |
| |
| Effective December 13, 2019, the annual operating expense ratio was reduced to 0.05%. The ratio presented for the period ended December 31, 2019 is a blended ratio. |
| Portfolio turnover rate excludes securities received or delivered from processing of in-kind creations or redemptions. |
Schwab Fixed-Income ETFs | Annual Report125
Schwab 1-5 Year Corporate Bond ETF
Portfolio Holdings as of December 31, 2023
This section shows all the securities in the fund’s portfolio and their values as of the report date.
The fund files its complete schedule of portfolio holdings with the U.S. Securities and Exchange Commission (SEC) for the first and third quarters of each fiscal year on Form N-PORT Part F. The fund’s Form N-PORT Part F is available on the SEC’s website at www.sec.gov. You can also obtain this information at no cost on the fund’s website at www.schwabassetmanagement.com/schwabetfs_prospectus, by calling 1-866-414-6349, or by sending an email request to orders@mysummaryprospectus.com. The fund also makes available its complete schedule of portfolio holdings on a daily basis on the fund’s website.
All securities are currently in a fixed rate coupon period based on index eligibility requirements and the fund’s investment objective. Generally, for fixed rate securities, the rate shown is the interest rate that was established when the security was issued. In some cases, for securitized products, the fixed interest rate can change but remains index eligible as a fixed rate coupon. Variable rate securities are subject to index requirements and will be removed from the index and fund prior to converting from a fixed rate coupon to a variable rate coupon. The maturity date shown for all the securities is the final legal maturity.
SECURITY RATE, MATURITY DATE | | |
CORPORATES 99.0% OF NET ASSETS |
|
Financial Institutions 44.6% |
|
|
| | |
| | |
| | |
| | |
| | |
| | |
|
| | |
| | |
| | |
| | |
| | |
| | |
| | |
| | |
| | |
| | |
| | |
| | |
American Express Credit Corp. |
| | |
Australia & New Zealand Banking Group Ltd. |
| | |
| | |
Banco Bilbao Vizcaya Argentaria SA |
| | |
| | |
|
| | |
| | |
| | |
| | |
| | |
| | |
| | |
| | |
| | |
| | |
| | |
| | |
| | |
|
| | |
| | |
SECURITY RATE, MATURITY DATE | | |
| | |
| | |
| | |
| | |
| | |
| | |
| | |
| | |
| | |
| | |
| | |
| | |
| | |
| | |
| | |
| | |
| | |
| | |
| | |
| | |
| | |
| | |
| | |
| | |
| | |
| | |
| | |
| | |
| | |
| | |
| | |
|
| | |
| | |
|
| | |
| | |
| | |
| | |
| | |
| | |
| | |
| | |
| | |
| | |
| | |
| | |
Bank of New York Mellon Corp. |
| | |
| | |
| | |
126Schwab Fixed-Income ETFs | Annual Report
Schwab 1-5 Year Corporate Bond ETF
Portfolio Holdings as of December 31, 2023 (continued)
SECURITY RATE, MATURITY DATE | | |
| | |
| | |
| | |
| | |
| | |
| | |
| | |
| | |
| | |
| | |
| | |
| | |
| | |
| | |
|
| | |
| | |
| | |
| | |
| | |
| | |
| | |
| | |
| | |
| | |
| | |
| | |
| | |
| | |
|
| | |
|
| | |
|
| | |
| | |
| | |
| | |
| | |
| | |
| | |
| | |
| | |
| | |
| | |
| | |
| | |
| | |
| | |
|
| | |
Canadian Imperial Bank of Commerce |
| | |
| | |
| | |
| | |
| | |
| | |
| | |
| | |
| | |
Capital One Financial Corp. |
| | |
| | |
| | |
| | |
SECURITY RATE, MATURITY DATE | | |
| | |
| | |
| | |
| | |
| | |
| | |
| | |
| | |
|
| | |
| | |
| | |
|
| | |
| | |
| | |
| | |
| | |
| | |
| | |
| | |
| | |
| | |
| | |
| | |
| | |
| | |
| | |
| | |
| | |
| | |
| | |
| | |
| | |
| | |
| | |
|
| | |
| | |
Citizens Financial Group, Inc. |
| | |
| | |
|
| | |
Commonwealth Bank of Australia |
| | |
| | |
|
| | |
| | |
| | |
| | |
|
| | |
| | |
| | |
| | |
| | |
| | |
|
| | |
| | |
| | |
| | |
| | |
| | |
Schwab Fixed-Income ETFs | Annual Report127
Schwab 1-5 Year Corporate Bond ETF
Portfolio Holdings as of December 31, 2023 (continued)
SECURITY RATE, MATURITY DATE | | |
| | |
| | |
| | |
| | |
| | |
|
| | |
Discover Financial Services |
| | |
| | |
| | |
|
| | |
| | |
| | |
| | |
| | |
|
| | |
| | |
First Citizens BancShares, Inc. |
| | |
|
| | |
|
| | |
Goldman Sachs Group, Inc. |
| | |
| | |
| | |
| | |
| | |
| | |
| | |
| | |
| | |
| | |
| | |
| | |
| | |
| | |
| | |
| | |
| | |
| | |
| | |
| | |
| | |
| | |
|
| | |
| | |
| | |
| | |
| | |
| | |
| | |
| | |
| | |
| | |
| | |
| | |
| | |
| | |
| | |
| | |
SECURITY RATE, MATURITY DATE | | |
| | |
| | |
| | |
| | |
|
| | |
Huntington Bancshares, Inc. |
| | |
| | |
| | |
|
| | |
|
| | |
| | |
| | |
| | |
| | |
|
| | |
| | |
| | |
| | |
| | |
| | |
| | |
| | |
| | |
| | |
| | |
| | |
| | |
| | |
| | |
| | |
| | |
| | |
| | |
| | |
| | |
| | |
| | |
| | |
| | |
| | |
| | |
| | |
| | |
| | |
| | |
| | |
| | |
| | |
|
| | |
|
| | |
| | |
|
| | |
| | |
| | |
|
| | |
| | |
| | |
128Schwab Fixed-Income ETFs | Annual Report
Schwab 1-5 Year Corporate Bond ETF
Portfolio Holdings as of December 31, 2023 (continued)
SECURITY RATE, MATURITY DATE | | |
| | |
| | |
| | |
| | |
| | |
| | |
| | |
| | |
| | |
Manufacturers & Traders Trust Co. |
| | |
| | |
| | |
| | |
Mitsubishi UFJ Financial Group, Inc. |
| | |
| | |
| | |
| | |
| | |
| | |
| | |
| | |
| | |
| | |
| | |
| | |
| | |
| | |
| | |
| | |
| | |
Mizuho Financial Group, Inc. |
| | |
| | |
| | |
| | |
| | |
| | |
| | |
| | |
| | |
| | |
|
| | |
| | |
| | |
| | |
| | |
| | |
| | |
| | |
| | |
| | |
| | |
| | |
| | |
| | |
| | |
| | |
| | |
| | |
| | |
| | |
| | |
| | |
| | |
SECURITY RATE, MATURITY DATE | | |
| | |
| | |
|
| | |
National Australia Bank Ltd. |
| | |
| | |
| | |
| | |
| | |
|
| | |
|
| | |
| | |
| | |
| | |
| | |
| | |
| | |
|
| | |
| | |
| | |
|
| | |
| | |
| | |
| | |
| | |
PNC Financial Services Group, Inc. |
| | |
| | |
| | |
| | |
| | |
| | |
| | |
|
| | |
| | |
|
| | |
| | |
| | |
| | |
| | |
| | |
| | |
| | |
| | |
| | |
| | |
| | |
| | |
| | |
| | |
| | |
Santander Holdings USA, Inc. |
| | |
| | |
| | |
| | |
| | |
| | |
Schwab Fixed-Income ETFs | Annual Report129
Schwab 1-5 Year Corporate Bond ETF
Portfolio Holdings as of December 31, 2023 (continued)
SECURITY RATE, MATURITY DATE | | |
| | |
| | |
Santander U.K. Group Holdings PLC |
| | |
| | |
| | |
| | |
| | |
|
| | |
| | |
| | |
| | |
| | |
| | |
| | |
| | |
| | |
| | |
| | |
Sumitomo Mitsui Financial Group, Inc. |
| | |
| | |
| | |
| | |
| | |
| | |
| | |
| | |
| | |
| | |
| | |
| | |
| | |
| | |
| | |
|
| | |
| | |
| | |
| | |
|
| | |
|
| | |
| | |
| | |
| | |
| | |
| | |
| | |
| | |
| | |
| | |
| | |
| | |
| | |
| | |
| | |
|
| | |
| | |
| | |
| | |
SECURITY RATE, MATURITY DATE | | |
|
| | |
| | |
| | |
| | |
| | |
| | |
| | |
| | |
| | |
| | |
| | |
|
| | |
| | |
| | |
| | |
| | |
| | |
| | |
| | |
| | |
| | |
| | |
|
| | |
| | |
|
| | |
| | |
|
| | |
| | |
|
| | |
|
| | |
| | |
| | |
| | |
| | |
| | |
| | |
| | |
| | |
| | |
| | |
| | |
| | |
| | |
| | |
| | |
| | |
|
| | |
| | |
| | |
|
| | |
| | |
| | |
| | |
| | |
| | |
| | |
| | |
130Schwab Fixed-Income ETFs | Annual Report
Schwab 1-5 Year Corporate Bond ETF
Portfolio Holdings as of December 31, 2023 (continued)
SECURITY RATE, MATURITY DATE | | |
| | |
| | |
| | |
| | |
| | |
| | |
Brokerage/Asset Managers/Exchanges 1.6% |
Affiliated Managers Group, Inc. |
| | |
Ameriprise Financial, Inc. |
| | |
| | |
|
| | |
|
| | |
|
| | |
|
| | |
|
| | |
| | |
Cboe Global Markets, Inc. |
| | |
|
| | |
| | |
| | |
| | |
| | |
| | |
| | |
| | |
| | |
| | |
| | |
| | |
| | |
5.64%, 05/19/29 (a)(b)(e) | | |
6.20%, 11/17/29 (a)(b)(e) | | |
|
| | |
| | |
|
| | |
|
| | |
Intercontinental Exchange, Inc. |
| | |
| | |
| | |
| | |
| | |
|
| | |
Janus Henderson U.S. Holdings, Inc. |
| | |
Jefferies Financial Group, Inc. |
| | |
| | |
SECURITY RATE, MATURITY DATE | | |
|
| | |
| | |
| | |
|
| | |
|
| | |
|
| | |
| | |
|
| | |
| | |
| | |
| | |
| | |
| | |
| | |
| | |
|
AerCap Ireland Capital DAC/AerCap Global Aviation Trust |
| | |
| | |
| | |
| | |
| | |
| | |
| | |
| | |
| | |
| | |
| | |
| | |
|
| | |
| | |
| | |
| | |
| | |
| | |
| | |
| | |
| | |
| | |
| | |
| | |
|
| | |
|
| | |
| | |
| | |
| | |
| | |
| | |
Bain Capital Specialty Finance, Inc. |
| | |
|
| | |
BlackRock TCP Capital Corp. |
| | |
Schwab Fixed-Income ETFs | Annual Report131
Schwab 1-5 Year Corporate Bond ETF
Portfolio Holdings as of December 31, 2023 (continued)
SECURITY RATE, MATURITY DATE | | |
Blackstone Private Credit Fund |
| | |
| | |
| | |
| | |
| | |
Blackstone Secured Lending Fund |
| | |
| | |
| | |
| | |
|
| | |
| | |
| | |
| | |
| | |
Blue Owl Capital Corp. III |
| | |
Blue Owl Credit Income Corp. |
| | |
| | |
| | |
| | |
Blue Owl Technology Finance Corp. |
| | |
|
| | |
| | |
| | |
| | |
| | |
|
| | |
| | |
| | |
|
| | |
| | |
|
| | |
| | |
| | |
|
| | |
| | |
Main Street Capital Corp. |
| | |
Morgan Stanley Direct Lending Fund |
| | |
Oaktree Specialty Lending Corp. |
| | |
| | |
Oaktree Strategic Credit Fund |
| | |
|
| | |
| | |
| | |
Sixth Street Specialty Lending, Inc. |
| | |
| | |
| | |
SECURITY RATE, MATURITY DATE | | |
|
Andrew W Mellon Foundation |
| | |
|
| | |
| | |
| | |
|
|
| | |
|
| | |
| | |
Allied World Assurance Co. Holdings Ltd. |
| | |
|
| | |
| | |
American Equity Investment Life Holding Co. |
| | |
American International Group, Inc. |
| | |
| | |
|
| | |
Aon Corp./Aon Global Holdings PLC |
| | |
|
| | |
|
| | |
Assured Guaranty U.S. Holdings, Inc. |
| | |
|
| | |
Berkshire Hathaway Finance Corp. |
| | |
|
| | |
Brighthouse Financial, Inc. |
| | |
|
| | |
| | |
|
| | |
| | |
Cincinnati Financial Corp. |
| | |
|
| | |
| | |
CNO Financial Group, Inc. |
| | |
Corebridge Financial, Inc. |
| | |
| | |
| | |
|
| | |
| | |
132Schwab Fixed-Income ETFs | Annual Report
Schwab 1-5 Year Corporate Bond ETF
Portfolio Holdings as of December 31, 2023 (continued)
SECURITY RATE, MATURITY DATE | | |
| | |
| | |
|
| | |
| | |
|
| | |
F&G Annuities & Life, Inc. |
| | |
Fairfax Financial Holdings Ltd. |
| | |
Fidelity National Financial, Inc. |
| | |
|
| | |
Hanover Insurance Group, Inc. |
| | |
Horace Mann Educators Corp. |
| | |
|
| | |
| | |
| | |
| | |
| | |
| | |
|
| | |
|
| | |
|
| | |
| | |
|
| | |
|
| | |
| | |
|
| | |
Marsh & McLennan Cos., Inc. |
| | |
| | |
|
| | |
|
| | |
| | |
Old Republic International Corp. |
| | |
Principal Financial Group, Inc. |
| | |
|
| | |
| | |
Prudential Financial, Inc. |
| | |
| | |
| | |
| | |
|
| | |
| | |
SECURITY RATE, MATURITY DATE | | |
Reinsurance Group of America, Inc. |
| | |
RenaissanceRe Finance, Inc. |
| | |
| | |
|
| | |
|
| | |
| | |
| | |
| | |
| | |
| | |
| | |
| | |
| | |
| | |
| | |
| | |
|
| | |
| | |
Willis North America, Inc. |
| | |
| | |
| | |
|
|
| | |
Alexandria Real Estate Equities, Inc. |
| | |
| | |
| | |
| | |
|
| | |
AvalonBay Communities, Inc. |
| | |
| | |
| | |
| | |
| | |
|
| | |
| | |
| | |
| | |
Brixmor Operating Partnership LP |
| | |
| | |
| | |
| | |
|
| | |
Corporate Office Properties LP |
| | |
|
| | |
| | |
| | |
Schwab Fixed-Income ETFs | Annual Report133
Schwab 1-5 Year Corporate Bond ETF
Portfolio Holdings as of December 31, 2023 (continued)
SECURITY RATE, MATURITY DATE | | |
|
| | |
| | |
| | |
|
| | |
| | |
| | |
|
| | |
| | |
| | |
|
| | |
| | |
| | |
|
| | |
| | |
| | |
|
| | |
| | |
Healthcare Realty Holdings LP |
| | |
| | |
|
| | |
| | |
| | |
| | |
|
| | |
| | |
|
| | |
Hudson Pacific Properties LP |
| | |
| | |
Invitation Homes Operating Partnership LP |
| | |
|
| | |
| | |
|
| | |
| | |
| | |
|
| | |
|
| | |
Mid-America Apartments LP |
| | |
| | |
| | |
|
| | |
| | |
| | |
Omega Healthcare Investors, Inc. |
| | |
| | |
SECURITY RATE, MATURITY DATE | | |
| | |
| | |
|
| | |
| | |
Piedmont Operating Partnership LP |
| | |
|
| | |
| | |
| | |
| | |
Public Storage Operating Co. |
| | |
| | |
| | |
| | |
| | |
|
| | |
| | |
| | |
| | |
| | |
| | |
| | |
| | |
| | |
| | |
|
| | |
Retail Opportunity Investments Partnership LP |
| | |
Rexford Industrial Realty LP |
| | |
|
| | |
|
| | |
| | |
| | |
| | |
| | |
| | |
|
| | |
| | |
| | |
|
| | |
| | |
|
| | |
Sun Communities Operating LP |
| | |
|
| | |
| | |
|
| | |
| | |
|
| | |
| | |
134Schwab Fixed-Income ETFs | Annual Report
Schwab 1-5 Year Corporate Bond ETF
Portfolio Holdings as of December 31, 2023 (continued)
SECURITY RATE, MATURITY DATE | | |
| | |
| | |
|
| | |
| | |
| | |
| | |
|
| | |
| | |
| | |
| | |
|
|
|
Air Products & Chemicals, Inc. |
| | |
| | |
|
| | |
AngloGold Ashanti Holdings PLC |
| | |
|
| | |
| | |
BHP Billiton Finance USA Ltd. |
| | |
| | |
| | |
| | |
Celanese U.S. Holdings LLC |
| | |
| | |
| | |
| | |
Celulosa Arauco y Constitucion SA |
| | |
|
| | |
|
| | |
| | |
|
| | |
| | |
|
| | |
| | |
| | |
| | |
|
| | |
|
| | |
|
| | |
International Flavors & Fragrances, Inc. |
| | |
|
| | |
SECURITY RATE, MATURITY DATE | | |
|
| | |
| | |
| | |
LYB International Finance II BV |
| | |
LYB International Finance III LLC |
| | |
|
| | |
| | |
|
| | |
| | |
|
| | |
| | |
| | |
Packaging Corp. of America |
| | |
|
| | |
| | |
Reliance Steel & Aluminum Co. |
| | |
Rio Tinto Finance USA Ltd. |
| | |
|
| | |
|
| | |
| | |
| | |
| | |
|
| | |
|
| | |
| | |
| | |
Suzano International Finance BV |
| | |
| | |
|
| | |
|
| | |
|
| | |
|
| | |
| | |
| | |
| | |
| | |
|
|
| | |
| | |
| | |
| | |
| | |
Schwab Fixed-Income ETFs | Annual Report135
Schwab 1-5 Year Corporate Bond ETF
Portfolio Holdings as of December 31, 2023 (continued)
SECURITY RATE, MATURITY DATE | | |
Allegion U.S. Holding Co., Inc. |
| | |
|
| | |
| | |
|
| | |
|
| | |
|
| | |
| | |
|
| | |
| | |
| | |
| | |
| | |
| | |
| | |
| | |
| | |
| | |
| | |
| | |
|
| | |
|
| | |
| | |
| | |
Caterpillar Financial Services Corp. |
| | |
| | |
| | |
| | |
| | |
| | |
| | |
| | |
| | |
| | |
| | |
| | |
CNH Industrial Capital LLC |
| | |
| | |
| | |
| | |
| | |
|
| | |
|
| | |
|
| | |
|
| | |
| | |
|
| | |
| | |
| | |
SECURITY RATE, MATURITY DATE | | |
|
| | |
Fortune Brands Innovations, Inc. |
| | |
GE Capital International Funding Co. Unlimited Co. |
| | |
|
| | |
| | |
| | |
| | |
| | |
| | |
| | |
|
| | |
|
| | |
| | |
Honeywell International, Inc. |
| | |
| | |
| | |
|
| | |
| | |
|
| | |
| | |
Huntington Ingalls Industries, Inc. |
| | |
| | |
| | |
Illinois Tool Works, Inc. |
| | |
|
| | |
|
| | |
| | |
| | |
| | |
| | |
| | |
| | |
| | |
| | |
| | |
| | |
| | |
| | |
| | |
| | |
| | |
| | |
| | |
| | |
| | |
| | |
| | |
Johnson Controls International PLC |
| | |
|
| | |
136Schwab Fixed-Income ETFs | Annual Report
Schwab 1-5 Year Corporate Bond ETF
Portfolio Holdings as of December 31, 2023 (continued)
SECURITY RATE, MATURITY DATE | | |
L3Harris Technologies, Inc. |
| | |
| | |
| | |
| | |
|
| | |
|
| | |
Lennox International, Inc. |
| | |
| | |
|
| | |
| | |
| | |
Martin Marietta Materials, Inc. |
| | |
|
| | |
| | |
|
| | |
|
| | |
|
| | |
| | |
| | |
|
| | |
|
| | |
|
| | |
| | |
| | |
|
| | |
|
| | |
| | |
Precision Castparts Corp. |
| | |
|
| | |
| | |
|
| | |
| | |
| | |
| | |
Rockwell Automation, Inc. |
| | |
|
| | |
| | |
| | |
| | |
| | |
| | |
| | |
SECURITY RATE, MATURITY DATE | | |
|
| | |
|
| | |
| | |
Stanley Black & Decker, Inc. |
| | |
| | |
| | |
| | |
| | |
Teledyne Technologies, Inc. |
| | |
| | |
|
| | |
| | |
| | |
| | |
|
| | |
Trane Technologies Financing Ltd. |
| | |
Trane Technologies Global Holding Co. Ltd. |
| | |
|
| | |
| | |
|
| | |
| | |
|
| | |
| | |
|
| | |
| | |
| | |
| | |
Westinghouse Air Brake Technologies Corp. |
| | |
| | |
| | |
|
| | |
|
| | |
| | |
| | |
|
|
| | |
| | |
| | |
| | |
| | |
| | |
| | |
| | |
| | |
| | |
| | |
| | |
Schwab Fixed-Income ETFs | Annual Report137
Schwab 1-5 Year Corporate Bond ETF
Portfolio Holdings as of December 31, 2023 (continued)
SECURITY RATE, MATURITY DATE | | |
| | |
| | |
| | |
|
| | |
| | |
| | |
| | |
| | |
| | |
| | |
| | |
| | |
Charter Communications Operating LLC/Charter Communications Operating Capital |
| | |
| | |
| | |
| | |
|
| | |
| | |
| | |
| | |
| | |
| | |
| | |
| | |
| | |
| | |
|
| | |
| | |
| | |
| | |
| | |
| | |
| | |
| | |
| | |
Discovery Communications LLC |
| | |
| | |
| | |
|
| | |
|
| | |
Interpublic Group of Cos., Inc. |
| | |
|
| | |
| | |
|
| | |
| | |
| | |
| | |
Omnicom Group, Inc./Omnicom Capital, Inc. |
| | |
|
| | |
| | |
SECURITY RATE, MATURITY DATE | | |
Rogers Communications, Inc. |
| | |
| | |
| | |
| | |
|
| | |
|
| | |
| | |
Take-Two Interactive Software, Inc. |
| | |
| | |
| | |
|
| | |
| | |
|
| | |
|
| | |
| | |
|
| | |
| | |
| | |
| | |
| | |
| | |
| | |
| | |
| | |
| | |
TWDC Enterprises 18 Corp. |
| | |
| | |
| | |
| | |
Verizon Communications, Inc. |
| | |
| | |
| | |
| | |
| | |
| | |
| | |
| | |
|
| | |
| | |
|
| | |
| | |
| | |
| | |
| | |
| | |
Warnermedia Holdings, Inc. |
| | |
| | |
| | |
| | |
| | |
138Schwab Fixed-Income ETFs | Annual Report
Schwab 1-5 Year Corporate Bond ETF
Portfolio Holdings as of December 31, 2023 (continued)
SECURITY RATE, MATURITY DATE | | |
|
Alibaba Group Holding Ltd. |
| | |
|
| | |
| | |
| | |
| | |
| | |
| | |
| | |
| | |
| | |
| | |
American Honda Finance Corp. |
| | |
| | |
| | |
| | |
| | |
| | |
| | |
| | |
| | |
| | |
| | |
| | |
| | |
| | |
|
| | |
|
| | |
| | |
|
| | |
| | |
| | |
| | |
| | |
| | |
|
| | |
|
| | |
|
| | |
| | |
| | |
|
| | |
|
| | |
|
| | |
| | |
|
| | |
|
| | |
|
| | |
| | |
SECURITY RATE, MATURITY DATE | | |
| | |
| | |
|
| | |
| | |
|
| | |
| | |
| | |
|
| | |
| | |
| | |
| | |
|
| | |
| | |
|
| | |
| | |
Ford Motor Credit Co. LLC |
| | |
| | |
| | |
| | |
| | |
| | |
| | |
| | |
| | |
| | |
| | |
| | |
| | |
| | |
|
| | |
| | |
| | |
| | |
General Motors Financial Co., Inc. |
| | |
| | |
| | |
| | |
| | |
| | |
| | |
| | |
| | |
| | |
| | |
| | |
| | |
| | |
| | |
| | |
| | |
| | |
| | |
| | |
| | |
|
| | |
| | |
Schwab Fixed-Income ETFs | Annual Report139
Schwab 1-5 Year Corporate Bond ETF
Portfolio Holdings as of December 31, 2023 (continued)
SECURITY RATE, MATURITY DATE | | |
GLP Capital LP/GLP Financing II, Inc. |
| | |
| | |
| | |
|
| | |
Harman International Industries, Inc. |
| | |
|
| | |
| | |
| | |
| | |
| | |
| | |
| | |
| | |
| | |
|
| | |
| | |
|
| | |
| | |
| | |
| | |
|
| | |
|
| | |
|
| | |
|
| | |
| | |
| | |
| | |
|
| | |
|
| | |
| | |
| | |
| | |
| | |
| | |
| | |
| | |
Magna International, Inc. |
| | |
| | |
Marriott International, Inc. |
| | |
| | |
| | |
| | |
| | |
| | |
| | |
| | |
|
| | |
| | |
| | |
| | |
SECURITY RATE, MATURITY DATE | | |
| | |
| | |
| | |
| | |
|
| | |
|
| | |
| | |
| | |
O'Reilly Automotive, Inc. |
| | |
| | |
| | |
|
| | |
| | |
| | |
| | |
| | |
| | |
| | |
| | |
|
| | |
| | |
|
| | |
|
| | |
|
| | |
| | |
|
| | |
| | |
| | |
|
| | |
| | |
| | |
| | |
| | |
|
| | |
| | |
| | |
| | |
|
| | |
| | |
| | |
|
| | |
| | |
Toll Brothers Finance Corp. |
| | |
| | |
| | |
|
| | |
Toyota Motor Credit Corp. |
| | |
| | |
140Schwab Fixed-Income ETFs | Annual Report
Schwab 1-5 Year Corporate Bond ETF
Portfolio Holdings as of December 31, 2023 (continued)
SECURITY RATE, MATURITY DATE | | |
| | |
| | |
| | |
| | |
| | |
| | |
| | |
| | |
| | |
| | |
| | |
| | |
| | |
| | |
| | |
| | |
| | |
| | |
| | |
|
| | |
| | |
|
| | |
| | |
|
| | |
| | |
| | |
| | |
| | |
| | |
| | |
| | |
| | |
Consumer Non-Cyclical 11.6% |
|
| | |
| | |
| | |
| | |
|
| | |
| | |
| | |
| | |
| | |
Agilent Technologies, Inc. |
| | |
|
| | |
| | |
| | |
|
| | |
| | |
| | |
| | |
| | |
| | |
| | |
| | |
| | |
SECURITY RATE, MATURITY DATE | | |
Anheuser-Busch Cos. LLC/Anheuser-Busch InBev Worldwide, Inc. |
| | |
Anheuser-Busch InBev Worldwide, Inc. |
| | |
Archer-Daniels-Midland Co. |
| | |
|
| | |
| | |
| | |
|
| | |
| | |
| | |
|
| | |
| | |
| | |
| | |
BAT International Finance PLC |
| | |
| | |
|
| | |
Baxter International, Inc. |
| | |
| | |
| | |
|
| | |
| | |
|
| | |
Bio-Rad Laboratories, Inc. |
| | |
|
| | |
| | |
|
| | |
| | |
| | |
| | |
| | |
|
| | |
|
| | |
| | |
| | |
|
| | |
| | |
| | |
|
| | |
| | |
|
| | |
| | |
|
| | |
| | |
| | |
Schwab Fixed-Income ETFs | Annual Report141
Schwab 1-5 Year Corporate Bond ETF
Portfolio Holdings as of December 31, 2023 (continued)
SECURITY RATE, MATURITY DATE | | |
| | |
| | |
| | |
| | |
| | |
|
| | |
| | |
|
| | |
| | |
| | |
| | |
| | |
|
| | |
| | |
|
| | |
| | |
|
| | |
| | |
| | |
| | |
| | |
|
| | |
Constellation Brands, Inc. |
| | |
| | |
| | |
| | |
| | |
| | |
| | |
|
| | |
| | |
| | |
| | |
| | |
| | |
| | |
| | |
| | |
|
| | |
|
| | |
| | |
| | |
Edwards Lifesciences Corp. |
| | |
|
| | |
| | |
| | |
|
| | |
| | |
|
| | |
SECURITY RATE, MATURITY DATE | | |
GE HealthCare Technologies, Inc. |
| | |
| | |
|
| | |
| | |
| | |
| | |
| | |
|
| | |
| | |
| | |
| | |
GlaxoSmithKline Capital, Inc. |
| | |
| | |
|
| | |
|
| | |
|
| | |
| | |
|
| | |
| | |
| | |
| | |
| | |
| | |
| | |
| | |
| | |
|
| | |
| | |
|
| | |
|
| | |
|
| | |
|
| | |
|
| | |
| | |
| | |
JBS USA LUX SA/JBS USA Food Co./JBS USA Finance, Inc. |
| | |
| | |
|
| | |
| | |
| | |
| | |
| | |
Kaiser Foundation Hospitals |
| | |
|
| | |
| | |
| | |
142Schwab Fixed-Income ETFs | Annual Report
Schwab 1-5 Year Corporate Bond ETF
Portfolio Holdings as of December 31, 2023 (continued)
SECURITY RATE, MATURITY DATE | | |
|
| | |
| | |
| | |
|
| | |
| | |
| | |
| | |
|
| | |
| | |
| | |
|
| | |
| | |
|
| | |
| | |
| | |
Laboratory Corp. of America Holdings |
| | |
| | |
| | |
|
| | |
| | |
|
| | |
| | |
| | |
Mead Johnson Nutrition Co. |
| | |
Medtronic Global Holdings SCA |
| | |
|
| | |
| | |
| | |
| | |
| | |
Molson Coors Beverage Co. |
| | |
Mondelez International, Inc. |
| | |
| | |
| | |
|
| | |
|
| | |
| | |
| | |
| | |
PeaceHealth Obligated Group |
| | |
|
| | |
| | |
| | |
| | |
| | |
| | |
| | |
SECURITY RATE, MATURITY DATE | | |
| | |
| | |
| | |
Pfizer Investment Enterprises Pte. Ltd. |
| | |
| | |
| | |
|
| | |
| | |
| | |
| | |
|
| | |
Philip Morris International, Inc. |
| | |
| | |
| | |
| | |
| | |
| | |
| | |
| | |
| | |
|
| | |
| | |
| | |
| | |
| | |
| | |
| | |
Providence St Joseph Health Obligated Group |
| | |
|
| | |
| | |
|
| | |
|
| | |
| | |
|
| | |
Shire Acquisitions Investments Ireland DAC |
| | |
|
| | |
|
| | |
| | |
| | |
| | |
| | |
|
| | |
|
| | |
| | |
| | |
Takeda Pharmaceutical Co. Ltd. |
| | |
Schwab Fixed-Income ETFs | Annual Report143
Schwab 1-5 Year Corporate Bond ETF
Portfolio Holdings as of December 31, 2023 (continued)
SECURITY RATE, MATURITY DATE | | |
Thermo Fisher Scientific, Inc. |
| | |
| | |
| | |
|
| | |
| | |
|
| | |
| | |
| | |
| | |
| | |
Universal Health Services, Inc. |
| | |
|
| | |
Utah Acquisition Sub, Inc. |
| | |
|
| | |
| | |
|
| | |
Zimmer Biomet Holdings, Inc. |
| | |
| | |
|
| | |
| | |
| | |
| | |
|
Baker Hughes Holdings LLC/Baker Hughes Co.-Obligor, Inc. |
| | |
| | |
|
| | |
| | |
BP Capital Markets America, Inc. |
| | |
| | |
| | |
| | |
| | |
| | |
| | |
| | |
|
| | |
| | |
Canadian Natural Resources Ltd. |
| | |
| | |
| | |
|
| | |
Cheniere Corpus Christi Holdings LLC |
| | |
| | |
|
| | |
SECURITY RATE, MATURITY DATE | | |
|
| | |
| | |
| | |
| | |
|
| | |
| | |
| | |
Columbia Pipeline Group, Inc. |
| | |
|
| | |
Continental Resources, Inc. |
| | |
|
| | |
DCP Midstream Operating LP |
| | |
| | |
|
| | |
| | |
| | |
|
| | |
|
| | |
| | |
| | |
| | |
| | |
| | |
|
| | |
| | |
| | |
| | |
| | |
| | |
| | |
| | |
| | |
| | |
| | |
| | |
| | |
| | |
Enterprise Products Operating LLC |
| | |
| | |
| | |
| | |
| | |
| | |
|
| | |
| | |
|
| | |
| | |
| | |
|
| | |
| | |
144Schwab Fixed-Income ETFs | Annual Report
Schwab 1-5 Year Corporate Bond ETF
Portfolio Holdings as of December 31, 2023 (continued)
SECURITY RATE, MATURITY DATE | | |
| | |
| | |
| | |
|
| | |
|
| | |
|
| | |
| | |
|
| | |
| | |
| | |
Magellan Midstream Partners LP |
| | |
|
| | |
|
| | |
| | |
|
| | |
| | |
| | |
| | |
| | |
| | |
|
| | |
| | |
| | |
|
| | |
Occidental Petroleum Corp. |
| | |
| | |
| | |
| | |
| | |
|
| | |
|
| | |
| | |
| | |
| | |
| | |
|
| | |
| | |
| | |
|
| | |
| | |
| | |
|
| | |
| | |
| | |
| | |
Pioneer Natural Resources Co. |
| | |
| | |
SECURITY RATE, MATURITY DATE | | |
Plains All American Pipeline LP/PAA Finance Corp. |
| | |
| | |
Sabine Pass Liquefaction LLC |
| | |
| | |
| | |
| | |
Schlumberger Finance Canada Ltd. |
| | |
Schlumberger Investment SA |
| | |
Shell International Finance BV |
| | |
| | |
| | |
| | |
Spectra Energy Partners LP |
| | |
| | |
|
| | |
Targa Resources Partners LP/Targa Resources Partners Finance Corp. |
| | |
| | |
|
| | |
| | |
Tennessee Gas Pipeline Co. LLC |
| | |
| | |
TotalEnergies Capital International SA |
| | |
|
| | |
TransCanada PipeLines Ltd. |
| | |
| | |
| | |
Transcontinental Gas Pipe Line Co. LLC |
| | |
| | |
|
| | |
| | |
Valero Energy Partners LP |
| | |
Western Midstream Operating LP |
| | |
| | |
| | |
| | |
|
| | |
| | |
| | |
| | |
| | |
|
|
| | |
Schwab Fixed-Income ETFs | Annual Report145
Schwab 1-5 Year Corporate Bond ETF
Portfolio Holdings as of December 31, 2023 (continued)
SECURITY RATE, MATURITY DATE | | |
Jacobs Engineering Group, Inc. |
| | |
Leland Stanford Junior University |
| | |
|
| | |
| | |
|
|
| | |
| | |
| | |
|
| | |
| | |
|
| | |
| | |
| | |
|
| | |
| | |
| | |
| | |
| | |
| | |
| | |
| | |
| | |
| | |
| | |
| | |
| | |
| | |
| | |
| | |
| | |
| | |
|
| | |
| | |
|
| | |
| | |
|
| | |
| | |
Automatic Data Processing, Inc. |
| | |
| | |
|
| | |
| | |
|
| | |
| | |
| | |
Broadcom Corp./Broadcom Cayman Finance Ltd. |
| | |
| | |
| | |
SECURITY RATE, MATURITY DATE | | |
|
| | |
| | |
| | |
Broadridge Financial Solutions, Inc. |
| | |
CDW LLC/CDW Finance Corp. |
| | |
| | |
| | |
|
| | |
|
| | |
| | |
| | |
|
| | |
| | |
Dell International LLC/EMC Corp. |
| | |
| | |
| | |
| | |
| | |
|
| | |
|
| | |
| | |
|
| | |
| | |
| | |
|
| | |
| | |
| | |
| | |
| | |
| | |
| | |
FactSet Research Systems, Inc. |
| | |
Fidelity National Information Services, Inc. |
| | |
| | |
| | |
| | |
|
| | |
| | |
| | |
| | |
| | |
| | |
|
| | |
| | |
| | |
|
| | |
Genpact Luxembourg SARL/Genpact USA, Inc. |
| | |
146Schwab Fixed-Income ETFs | Annual Report
Schwab 1-5 Year Corporate Bond ETF
Portfolio Holdings as of December 31, 2023 (continued)
SECURITY RATE, MATURITY DATE | | |
|
| | |
| | |
| | |
| | |
| | |
| | |
Hewlett Packard Enterprise Co. |
| | |
| | |
| | |
| | |
|
| | |
| | |
| | |
| | |
|
| | |
| | |
| | |
| | |
| | |
| | |
| | |
| | |
International Business Machines Corp. |
| | |
| | |
| | |
| | |
| | |
| | |
| | |
| | |
| | |
|
| | |
| | |
| | |
|
| | |
| | |
| | |
|
| | |
Keysight Technologies, Inc. |
| | |
|
| | |
| | |
|
| | |
| | |
|
| | |
|
| | |
| | |
| | |
|
| | |
| | |
| | |
SECURITY RATE, MATURITY DATE | | |
| | |
| | |
Microchip Technology, Inc. |
| | |
|
| | |
| | |
| | |
|
| | |
| | |
| | |
| | |
| | |
| | |
|
| | |
| | |
|
| | |
|
| | |
| | |
|
| | |
|
| | |
| | |
|
| | |
| | |
NXP BV/NXP Funding LLC/NXP USA, Inc. |
| | |
| | |
| | |
| | |
|
| | |
| | |
| | |
| | |
| | |
| | |
| | |
| | |
| | |
|
| | |
| | |
| | |
|
| | |
| | |
| | |
|
| | |
| | |
| | |
| | |
| | |
|
| | |
| | |
| | |
Schwab Fixed-Income ETFs | Annual Report147
Schwab 1-5 Year Corporate Bond ETF
Portfolio Holdings as of December 31, 2023 (continued)
SECURITY RATE, MATURITY DATE | | |
|
| | |
| | |
|
| | |
|
| | |
| | |
|
| | |
| | |
| | |
| | |
|
| | |
|
| | |
|
| | |
| | |
Tyco Electronics Group SA |
| | |
| | |
|
| | |
| | |
|
| | |
|
| | |
| | |
| | |
| | |
|
| | |
| | |
| | |
| | |
|
| | |
| | |
|
| | |
| | |
|
American Airlines 2015-1 Class A Pass-Through Trust |
| | |
American Airlines 2016-1 Class AA Pass-Through Trust |
| | |
American Airlines 2016-2 Class AA Pass-Through Trust |
| | |
|
| | |
Burlington Northern Santa Fe LLC |
| | |
| | |
| | |
| | |
Canadian National Railway Co. |
| | |
SECURITY RATE, MATURITY DATE | | |
Canadian Pacific Railway Co. |
| | |
| | |
| | |
CH Robinson Worldwide, Inc. |
| | |
|
| | |
| | |
| | |
| | |
Delta Air Lines 2020-1 Class AA Pass-Through Trust |
| | |
|
| | |
| | |
| | |
|
| | |
JB Hunt Transport Services, Inc. |
| | |
|
| | |
|
| | |
| | |
| | |
|
| | |
| | |
| | |
| | |
| | |
| | |
| | |
|
| | |
| | |
| | |
| | |
|
| | |
| | |
| | |
| | |
| | |
| | |
| | |
| | |
United Airlines 2013-1 Class A Pass-Through Trust |
| | |
United Airlines 2016-1 Class AA Pass-Through Trust |
| | |
United Airlines 2020-1 Class A Pass-Through Trust |
| | |
United Airlines 2020-1 Class B Pass-Through Trust |
| | |
United Parcel Service, Inc. |
| | |
| | |
| | |
| | |
| | |
|
148Schwab Fixed-Income ETFs | Annual Report
Schwab 1-5 Year Corporate Bond ETF
Portfolio Holdings as of December 31, 2023 (continued)
SECURITY RATE, MATURITY DATE | | |
|
|
|
| | |
|
| | |
| | |
|
| | |
|
| | |
| | |
| | |
|
| | |
| | |
American Electric Power Co., Inc. |
| | |
| | |
| | |
| | |
|
| | |
Arizona Public Service Co. |
| | |
|
| | |
Berkshire Hathaway Energy Co. |
| | |
| | |
| | |
|
| | |
| | |
| | |
CenterPoint Energy Houston Electric LLC |
| | |
| | |
|
| | |
| | |
Cleco Corporate Holdings LLC |
| | |
|
| | |
| | |
|
| | |
| | |
| | |
Connecticut Light & Power Co. |
| | |
| | |
Consolidated Edison Co. of New York, Inc. |
| | |
Constellation Energy Generation LLC |
| | |
| | |
|
| | |
| | |
| | |
SECURITY RATE, MATURITY DATE | | |
| | |
| | |
| | |
|
| | |
| | |
|
| | |
| | |
| | |
Duke Energy Carolinas LLC |
| | |
| | |
|
| | |
| | |
| | |
| | |
| | |
| | |
|
| | |
|
| | |
| | |
|
| | |
| | |
| | |
| | |
| | |
|
| | |
|
| | |
|
| | |
|
| | |
| | |
|
| | |
| | |
| | |
|
| | |
| | |
|
| | |
|
| | |
| | |
| | |
| | |
| | |
| | |
| | |
|
| | |
| | |
| | |
| | |
Schwab Fixed-Income ETFs | Annual Report149
Schwab 1-5 Year Corporate Bond ETF
Portfolio Holdings as of December 31, 2023 (continued)
SECURITY RATE, MATURITY DATE | | |
Florida Power & Light Co. |
| | |
| | |
| | |
| | |
| | |
|
| | |
|
| | |
| | |
Iberdrola International BV |
| | |
Indiana Michigan Power Co. |
| | |
Interstate Power & Light Co. |
| | |
|
| | |
| | |
Louisville Gas & Electric Co. |
| | |
|
| | |
|
| | |
|
| | |
National Rural Utilities Cooperative Finance Corp. |
| | |
| | |
| | |
| | |
| | |
| | |
| | |
| | |
| | |
| | |
| | |
NextEra Energy Capital Holdings, Inc. |
| | |
| | |
| | |
| | |
| | |
| | |
| | |
| | |
| | |
| | |
Oklahoma Gas & Electric Co. |
| | |
Oncor Electric Delivery Co. LLC |
| | |
| | |
| | |
Pacific Gas & Electric Co. |
| | |
| | |
| | |
| | |
| | |
| | |
SECURITY RATE, MATURITY DATE | | |
| | |
| | |
| | |
| | |
| | |
| | |
|
| | |
Pinnacle West Capital Corp. |
| | |
PPL Capital Funding, Inc. |
| | |
Public Service Electric & Gas Co. |
| | |
| | |
| | |
Public Service Enterprise Group, Inc. |
| | |
| | |
| | |
|
| | |
| | |
San Diego Gas & Electric Co. |
| | |
|
| | |
Southern California Edison Co. |
| | |
| | |
| | |
| | |
| | |
| | |
|
| | |
| | |
| | |
| | |
| | |
| | |
|
| | |
| | |
Southwestern Electric Power Co. |
| | |
| | |
System Energy Resources, Inc. |
| | |
Tucson Electric Power Co. |
| | |
Virginia Electric & Power Co. |
| | |
| | |
| | |
| | |
| | |
|
| | |
| | |
| | |
| | |
| | |
| | |
150Schwab Fixed-Income ETFs | Annual Report
Schwab 1-5 Year Corporate Bond ETF
Portfolio Holdings as of December 31, 2023 (continued)
SECURITY RATE, MATURITY DATE | | |
Wisconsin Electric Power Co. |
| | |
|
| | |
| | |
| | |
| | |
| | |
|
|
| | |
CenterPoint Energy Resources Corp. |
| | |
|
| | |
| | |
| | |
|
| | |
| | |
| | |
| | |
Southern California Gas Co. |
| | |
| | |
| | |
Southern Co. Gas Capital Corp. |
| | |
|
| | |
| | |
|
American Water Capital Corp. |
| | |
| | |
| | |
|
| | |
| | |
| | |
Total Corporates
(Cost $393,466,053) | |
| | |
SHORT-TERM INVESTMENTS 0.3% OF NET ASSETS |
|
|
State Street Institutional U.S. Government Money Market Fund, Premier Class 5.32% (h) | | |
State Street Institutional U.S. Government Money Market Fund, Premier Class 5.32% (h)(i) | | |
| | |
Total Short-Term Investments
(Cost $1,008,631) | |
Total Investments in Securities
(Cost $394,474,684) | |
| The effective maturity may be shorter than the final maturity shown because of the possibility of interim principal payments and prepayments or as the result of embedded demand features (puts or calls). |
| Security is in a fixed-rate coupon period. Based on index eligibility requirements and the fund’s investment objective this security will be removed from the index prior to converting to a floating rate security. |
| Securities exempt from registration under Rule 144A of the Securities Act of 1933, as amended. These securities may be resold in transactions exempt from registrations, normally to qualified institutional buyers. At the period end, the value of these amounted to $1,972,189 or 0.5% of net assets. |
| Step up security that pays an initial coupon rate for a set period and increased coupon rates at one or more preset intervals. Rate shown is as of period end. |
| Issuer is affiliated with the fund’s investment adviser. |
| Interest rate is subject to adjustments from time to time if a nationally recognized statistical rating organization downgrades (or subsequently upgrades) the debt rating assigned to the bond. |
| All or a portion of this security is on loan. Securities on loan were valued at $206,787. |
| The rate shown is the annualized 7-day yield. |
| Security purchased with cash collateral received for securities on loan. |
| Real Estate Investment Trust |
Below is a summary of the fund’s transactions with affiliated issuers during the period ended December 31, 2023:
SECURITY
RATE, MATURITY DATE | | | | | NET CHANGE IN UNREALIZED APPRECIATION (DEPRECIATION) | ACCRETION OF DISCOUNTS (AMORTIZATION OF PREMIUMS) | | | |
CORPORATES 0.4% OF NET ASSETS |
|
Financial Institutions 0.4% |
Brokerage/Asset Managers/Exchanges 0.4% |
|
| | | | | | | | | |
| | | | | | | | | |
| | | | | | | | | |
| | | | | | | | | |
| | | | | | | | | |
Schwab Fixed-Income ETFs | Annual Report151
Schwab 1-5 Year Corporate Bond ETF
Portfolio Holdings as of December 31, 2023 (continued)
SECURITY RATE, MATURITY DATE | | | | | NET CHANGE IN UNREALIZED APPRECIATION (DEPRECIATION) | ACCRETION OF DISCOUNTS (AMORTIZATION OF PREMIUMS) | | | |
| | | | | | | | | |
| | | | | | | | | |
| | | | | | | | | |
| | | | | | | | | |
| | | | | | | | | |
| | | | | | | | | |
| | | | | | | | | |
| | | | | | | | | |
| | | | | | | | | |
| | | | | | | | | |
| | | | | | | | | |
| | | | | | | | | |
| | | | | | | | | |
| | | | | | | | | |
The following is a summary of the inputs used to value the fund’s investments as of December 31, 2023 (see financial note 2(a) for additional information):
| QUOTED PRICES IN
ACTIVE MARKETS FOR
IDENTICAL ASSETS
(LEVEL 1) | OTHER SIGNIFICANT
OBSERVABLE INPUTS
(LEVEL 2) | SIGNIFICANT
UNOBSERVABLE INPUTS
(LEVEL 3) | |
| | | | |
| | | | |
| | | | |
| | | | |
| As categorized in the Portfolio Holdings. |
152Schwab Fixed-Income ETFs | Annual Report
Schwab 1-5 Year Corporate Bond ETF
Statement of Assets and Liabilities
|
Investments in securities, at value - affiliated (cost $1,627,948) | | |
Investments in securities, at value - unaffiliated (cost $392,846,736) including securities on loan of $206,787 | | |
Deposit with broker for futures contracts | | |
| | |
| | |
| | |
| | |
Income from securities on loan | | |
| | |
|
|
Collateral held for securities on loan | | |
| | |
| | |
| | |
| | |
| | |
|
|
Capital received from investors | | |
| | |
| | |
Schwab Fixed-Income ETFs | Annual Report153
Schwab 1-5 Year Corporate Bond ETF
Statement of Operations
For the period January 1, 2023 through December 31, 2023 |
|
Interest received from securities - unaffiliated | | |
Dividends received from securities - unaffiliated | | |
Interest received from securities - affiliated | | |
| | |
| | |
|
|
| | |
| | |
| | |
|
REALIZED AND UNREALIZED GAINS (LOSSES) |
Net realized losses on sales of securities - affiliated | | |
Net realized losses on sales of securities - unaffiliated | | |
Net realized losses on sales of in-kind redemptions - affiliated | | |
Net realized losses on sales of in-kind redemptions - unaffiliated | | |
Net realized losses on futures contracts | | |
| | |
Net change in unrealized appreciation (depreciation) on securities - affiliated | | |
Net change in unrealized appreciation (depreciation) on securities - unaffiliated | | |
Net change in unrealized appreciation (depreciation) on futures contracts | | |
Net change in unrealized appreciation (depreciation) | | |
Net realized and unrealized gains | | |
Increase in net assets resulting from operations | | |
154Schwab Fixed-Income ETFs | Annual Report
Schwab 1-5 Year Corporate Bond ETF
Statement of Changes in Net Assets
For the current and prior report periods
|
| | |
| | | |
| | | |
Net change in unrealized appreciation (depreciation) | | | |
Increase (decrease) in net assets resulting from operations | | | |
|
DISTRIBUTIONS TO SHAREHOLDERS |
| | | |
TRANSACTIONS IN FUND SHARES |
| | |
| | | | | |
| | | | | |
| | | | | |
Net transactions in fund shares | | | | | |
|
SHARES OUTSTANDING AND NET ASSETS |
| | |
| | | | | |
| | | | | |
Total increase (decrease) | | | | | |
| | | | | |
Schwab Fixed-Income ETFs | Annual Report155
Schwab 5-10 Year Corporate Bond ETF
Financial Statements
| | | | | | |
|
Net asset value at beginning of period | | | | | | |
Income (loss) from investment operations: | | | | | | |
Net investment income (loss)2 | | | | | | |
Net realized and unrealized gains (losses) | | | | | | |
Total from investment operations | | | | | | |
| | | | | | |
Distributions from net investment income | | | | | | |
Net asset value at end of period | | | | | | |
| | | | | | |
|
Ratios to average net assets: | | | | | | |
| | | | | | |
Net investment income (loss) | | | | | | |
| | | | | | |
Net assets, end of period (x 1,000,000) | | | | | | |
| Commencement of operations. |
| Calculated based on the average shares outstanding during the period. |
| |
| Effective July 1, 2022, the annual operating expense ratio was reduced to 0.03%. The ratio presented for the period ended December 31, 2022 is a blended ratio. |
| Ratio includes less than 0.005% of non-routine proxy expenses. |
| Effective December 20, 2021, the annual operating expense ratio was reduced to 0.04%. The ratio presented for the period ended December 31, 2021 is a blended ratio. |
| |
| Effective December 13, 2019, the annual operating expense ratio was reduced to 0.05%. The ratio presented for the period ended December 31, 2019 is a blended ratio. |
| Portfolio turnover rate excludes securities received or delivered from processing of in-kind creations or redemptions. |
156Schwab Fixed-Income ETFs | Annual Report
Schwab 5-10 Year Corporate Bond ETF
Portfolio Holdings as of December 31, 2023
This section shows all the securities in the fund’s portfolio and their values as of the report date.
The fund files its complete schedule of portfolio holdings with the U.S. Securities and Exchange Commission (SEC) for the first and third quarters of each fiscal year on Form N-PORT Part F. The fund’s Form N-PORT Part F is available on the SEC’s website at www.sec.gov. You can also obtain this information at no cost on the fund’s website at www.schwabassetmanagement.com/schwabetfs_prospectus, by calling 1-866-414-6349, or by sending an email request to orders@mysummaryprospectus.com. The fund also makes available its complete schedule of portfolio holdings on a daily basis on the fund’s website.
All securities are currently in a fixed rate coupon period based on index eligibility requirements and the fund’s investment objective. Generally, for fixed rate securities, the rate shown is the interest rate that was established when the security was issued. In some cases, for securitized products, the fixed interest rate can change but remains index eligible as a fixed rate coupon. Variable rate securities are subject to index requirements and will be removed from the index and fund prior to converting from a fixed rate coupon to a variable rate coupon. The maturity date shown for all the securities is the final legal maturity.
SECURITY RATE, MATURITY DATE | | |
CORPORATES 98.9% OF NET ASSETS |
|
Financial Institutions 35.9% |
|
|
| | |
| | |
| | |
|
| | |
| | |
| | |
| | |
| | |
| | |
Banco Bilbao Vizcaya Argentaria SA |
| | |
|
| | |
| | |
| | |
| | |
| | |
| | |
| | |
|
| | |
| | |
| | |
| | |
| | |
| | |
| | |
| | |
| | |
| | |
| | |
| | |
| | |
| | |
| | |
| | |
| | |
| | |
|
| | |
Bank of New York Mellon Corp. |
| | |
| | |
SECURITY RATE, MATURITY DATE | | |
| | |
| | |
| | |
| | |
| | |
| | |
| | |
| | |
| | |
| | |
|
| | |
| | |
| | |
| | |
|
| | |
|
| | |
| | |
| | |
| | |
| | |
| | |
| | |
| | |
| | |
| | |
Canadian Imperial Bank of Commerce |
| | |
| | |
Capital One Financial Corp. |
| | |
| | |
| | |
| | |
| | |
| | |
| | |
| | |
|
| | |
| | |
| | |
| | |
| | |
| | |
| | |
| | |
| | |
Schwab Fixed-Income ETFs | Annual Report157
Schwab 5-10 Year Corporate Bond ETF
Portfolio Holdings as of December 31, 2023 (continued)
SECURITY RATE, MATURITY DATE | | |
| | |
| | |
| | |
| | |
| | |
| | |
Citizens Financial Group, Inc. |
| | |
| | |
| | |
| | |
|
| | |
|
| | |
|
| | |
|
| | |
| | |
| | |
| | |
| | |
| | |
|
| | |
Discover Financial Services |
| | |
| | |
|
| | |
| | |
|
| | |
Goldman Sachs Group, Inc. |
| | |
| | |
| | |
| | |
| | |
| | |
| | |
| | |
| | |
|
| | |
| | |
| | |
| | |
| | |
| | |
| | |
| | |
| | |
| | |
| | |
| | |
Huntington Bancshares, Inc. |
| | |
| | |
| | |
|
| | |
SECURITY RATE, MATURITY DATE | | |
|
| | |
| | |
| | |
| | |
|
| | |
| | |
| | |
| | |
| | |
| | |
| | |
| | |
| | |
| | |
| | |
| | |
| | |
| | |
| | |
| | |
| | |
|
| | |
| | |
| | |
|
| | |
| | |
|
| | |
| | |
|
| | |
Mitsubishi UFJ Financial Group, Inc. |
| | |
| | |
| | |
| | |
| | |
| | |
| | |
| | |
| | |
| | |
| | |
| | |
5.41%, 04/19/34 (a)(b)(c) | | |
Mizuho Financial Group, Inc. |
| | |
| | |
| | |
| | |
| | |
| | |
| | |
| | |
| | |
| | |
| | |
| | |
| | |
|
| | |
| | |
158Schwab Fixed-Income ETFs | Annual Report
Schwab 5-10 Year Corporate Bond ETF
Portfolio Holdings as of December 31, 2023 (continued)
SECURITY RATE, MATURITY DATE | | |
| | |
| | |
| | |
| | |
| | |
| | |
| | |
| | |
| | |
| | |
| | |
| | |
| | |
| | |
| | |
|
| | |
| | |
| | |
| | |
|
| | |
| | |
| | |
|
| | |
PNC Financial Services Group, Inc. |
| | |
| | |
| | |
| | |
| | |
| | |
| | |
| | |
|
| | |
| | |
| | |
| | |
Santander Holdings USA, Inc. |
| | |
Santander U.K. Group Holdings PLC |
| | |
|
| | |
| | |
| | |
| | |
| | |
| | |
| | |
| | |
| | |
| | |
Sumitomo Mitsui Financial Group, Inc. |
| | |
| | |
| | |
| | |
| | |
| | |
| | |
| | |
| | |
| | |
SECURITY RATE, MATURITY DATE | | |
| | |
| | |
| | |
| | |
|
| | |
| | |
|
| | |
| | |
| | |
| | |
|
| | |
|
| | |
| | |
| | |
| | |
| | |
| | |
|
| | |
| | |
| | |
| | |
| | |
| | |
| | |
| | |
|
| | |
|
| | |
| | |
| | |
| | |
| | |
| | |
| | |
| | |
| | |
| | |
|
| | |
| | |
| | |
| | |
| | |
| | |
| | |
|
| | |
|
| | |
| | |
Brokerage/Asset Managers/Exchanges 2.0% |
Affiliated Managers Group, Inc. |
| | |
Ameriprise Financial, Inc. |
| | |
| | |
Schwab Fixed-Income ETFs | Annual Report159
Schwab 5-10 Year Corporate Bond ETF
Portfolio Holdings as of December 31, 2023 (continued)
SECURITY RATE, MATURITY DATE | | |
Apollo Global Management, Inc. |
| | |
|
| | |
| | |
| | |
| | |
| | |
Brookfield Capital Finance LLC |
| | |
Brookfield Finance I U.K. PLC/Brookfield Finance, Inc. |
| | |
|
| | |
| | |
| | |
Cboe Global Markets, Inc. |
| | |
| | |
|
| | |
| | |
| | |
| | |
| | |
| | |
| | |
| | |
5.85%, 05/19/34 (a)(b)(d) | | |
6.14%, 08/24/34 (a)(b)(d) | | |
|
| | |
|
| | |
|
| | |
Intercontinental Exchange, Inc. |
| | |
| | |
| | |
| | |
Jefferies Financial Group, Inc. |
| | |
| | |
| | |
|
| | |
|
| | |
|
| | |
| | |
| | |
| | |
| | |
| | |
| | |
| | |
Raymond James Financial, Inc. |
| | |
|
| | |
| | |
SECURITY RATE, MATURITY DATE | | |
|
AerCap Ireland Capital DAC/AerCap Global Aviation Trust |
| | |
| | |
| | |
|
| | |
| | |
| | |
| | |
|
| | |
Blackstone Private Credit Fund |
| | |
Blue Owl Credit Income Corp. |
| | |
|
| | |
|
| | |
| | |
| | |
| | |
| | |
| | |
Oaktree Specialty Lending Corp. |
| | |
| | |
|
|
| | |
| | |
| | |
| | |
|
|
| | |
|
| | |
|
| | |
|
| | |
| | |
| | |
American Financial Group, Inc. |
| | |
American International Group, Inc. |
| | |
| | |
|
| | |
| | |
Aon Corp./Aon Global Holdings PLC |
| | |
| | |
| | |
| | |
|
| | |
| | |
160Schwab Fixed-Income ETFs | Annual Report
Schwab 5-10 Year Corporate Bond ETF
Portfolio Holdings as of December 31, 2023 (continued)
SECURITY RATE, MATURITY DATE | | |
|
| | |
| | |
Assured Guaranty U.S. Holdings, Inc. |
| | |
|
| | |
| | |
| | |
|
| | |
AXIS Specialty Finance LLC |
| | |
| | |
Berkshire Hathaway Finance Corp. |
| | |
| | |
| | |
Brighthouse Financial, Inc. |
| | |
|
| | |
| | |
| | |
|
| | |
| | |
| | |
| | |
| | |
|
| | |
|
| | |
| | |
| | |
CNO Financial Group, Inc. |
| | |
Corebridge Financial, Inc. |
| | |
| | |
| | |
|
| | |
| | |
| | |
| | |
| | |
| | |
|
| | |
| | |
|
| | |
Fairfax Financial Holdings Ltd. |
| | |
| | |
| | |
| | |
Fidelity National Financial, Inc. |
| | |
| | |
SECURITY RATE, MATURITY DATE | | |
First American Financial Corp. |
| | |
| | |
|
| | |
| | |
Hanover Insurance Group, Inc. |
| | |
Hartford Financial Services Group, Inc. |
| | |
|
| | |
| | |
| | |
| | |
| | |
|
| | |
| | |
|
| | |
| | |
|
| | |
| | |
| | |
|
| | |
|
| | |
|
| | |
Marsh & McLennan Cos., Inc. |
| | |
| | |
| | |
| | |
| | |
| | |
|
| | |
| | |
| | |
|
| | |
| | |
|
| | |
Principal Financial Group, Inc. |
| | |
| | |
| | |
|
| | |
| | |
| | |
| | |
| | |
| | |
Prudential Financial, Inc. |
| | |
| | |
| | |
| | |
Schwab Fixed-Income ETFs | Annual Report161
Schwab 5-10 Year Corporate Bond ETF
Portfolio Holdings as of December 31, 2023 (continued)
SECURITY RATE, MATURITY DATE | | |
| | |
| | |
Prudential Funding Asia PLC |
| | |
| | |
Reinsurance Group of America, Inc. |
| | |
| | |
| | |
RenaissanceRe Holdings Ltd. |
| | |
| | |
Stewart Information Services Corp. |
| | |
Travelers Property Casualty Corp. |
| | |
|
| | |
| | |
| | |
| | |
| | |
| | |
| | |
| | |
| | |
|
| | |
Willis North America, Inc. |
| | |
| | |
| | |
|
|
| | |
| | |
| | |
Alexandria Real Estate Equities, Inc. |
| | |
| | |
| | |
| | |
| | |
| | |
| | |
|
| | |
|
| | |
| | |
| | |
AvalonBay Communities, Inc. |
| | |
| | |
| | |
| | |
| | |
| | |
|
| | |
| | |
| | |
SECURITY RATE, MATURITY DATE | | |
| | |
| | |
Brixmor Operating Partnership LP |
| | |
| | |
| | |
|
| | |
|
| | |
| | |
Corporate Office Properties LP |
| | |
| | |
| | |
|
| | |
| | |
| | |
| | |
|
| | |
|
| | |
| | |
|
| | |
| | |
| | |
|
| | |
|
| | |
| | |
| | |
| | |
| | |
|
| | |
| | |
| | |
| | |
| | |
| | |
| | |
| | |
|
| | |
| | |
Healthcare Realty Holdings LP |
| | |
| | |
|
| | |
| | |
| | |
| | |
|
| | |
| | |
| | |
162Schwab Fixed-Income ETFs | Annual Report
Schwab 5-10 Year Corporate Bond ETF
Portfolio Holdings as of December 31, 2023 (continued)
SECURITY RATE, MATURITY DATE | | |
|
| | |
| | |
| | |
Hudson Pacific Properties LP |
| | |
| | |
Invitation Homes Operating Partnership LP |
| | |
| | |
| | |
| | |
|
| | |
| | |
| | |
| | |
|
| | |
| | |
| | |
| | |
|
| | |
|
| | |
| | |
Mid-America Apartments LP |
| | |
| | |
| | |
National Health Investors, Inc. |
| | |
|
| | |
| | |
Omega Healthcare Investors, Inc. |
| | |
| | |
| | |
Phillips Edison Grocery Center Operating Partnership I LP |
| | |
|
| | |
Piedmont Operating Partnership LP |
| | |
| | |
|
| | |
| | |
| | |
| | |
| | |
| | |
| | |
| | |
| | |
| | |
Public Storage Operating Co. |
| | |
| | |
| | |
| | |
| | |
SECURITY RATE, MATURITY DATE | | |
|
| | |
| | |
| | |
| | |
| | |
| | |
| | |
| | |
|
| | |
| | |
Rexford Industrial Realty LP |
| | |
| | |
|
| | |
| | |
|
| | |
| | |
|
| | |
| | |
| | |
| | |
| | |
| | |
|
| | |
| | |
| | |
| | |
|
| | |
| | |
| | |
Sun Communities Operating LP |
| | |
| | |
| | |
|
| | |
|
| | |
| | |
| | |
| | |
| | |
| | |
|
| | |
| | |
| | |
| | |
|
| | |
| | |
| | |
| | |
| | |
| | |
| | |
Schwab Fixed-Income ETFs | Annual Report163
Schwab 5-10 Year Corporate Bond ETF
Portfolio Holdings as of December 31, 2023 (continued)
SECURITY RATE, MATURITY DATE | | |
|
| | |
| | |
| | |
| | |
| | |
| | |
|
|
|
Air Products & Chemicals, Inc. |
| | |
| | |
|
| | |
AngloGold Ashanti Holdings PLC |
| | |
|
| | |
| | |
BHP Billiton Finance USA Ltd. |
| | |
| | |
| | |
|
| | |
| | |
Celanese U.S. Holdings LLC |
| | |
| | |
| | |
| | |
|
| | |
| | |
| | |
|
| | |
|
| | |
| | |
| | |
|
| | |
| | |
|
| | |
| | |
|
| | |
| | |
| | |
|
| | |
| | |
Huntsman International LLC |
| | |
| | |
|
| | |
|
| | |
SECURITY RATE, MATURITY DATE | | |
LYB International Finance III LLC |
| | |
| | |
|
| | |
|
| | |
|
| | |
| | |
| | |
|
| | |
| | |
|
| | |
| | |
Packaging Corp. of America |
| | |
| | |
|
| | |
| | |
|
| | |
Reliance Steel & Aluminum Co. |
| | |
|
| | |
| | |
Rio Tinto Finance USA PLC |
| | |
|
| | |
|
| | |
| | |
|
| | |
| | |
| | |
|
| | |
| | |
|
| | |
| | |
| | |
| | |
|
| | |
|
| | |
| | |
|
| | |
|
| | |
| | |
|
| | |
| | |
164Schwab Fixed-Income ETFs | Annual Report
Schwab 5-10 Year Corporate Bond ETF
Portfolio Holdings as of December 31, 2023 (continued)
SECURITY RATE, MATURITY DATE | | |
| | |
| | |
|
| | |
| | |
| | |
|
| | |
| | |
|
|
| | |
| | |
| | |
Acuity Brands Lighting, Inc. |
| | |
|
| | |
Allegion U.S. Holding Co., Inc. |
| | |
|
| | |
Amcor Flexibles North America, Inc. |
| | |
| | |
|
| | |
| | |
| | |
|
| | |
|
| | |
| | |
| | |
|
| | |
| | |
| | |
| | |
| | |
|
| | |
| | |
|
| | |
| | |
|
| | |
| | |
| | |
CNH Industrial Capital LLC |
| | |
|
| | |
| | |
| | |
|
| | |
|
| | |
SECURITY RATE, MATURITY DATE | | |
|
| | |
| | |
|
| | |
| | |
|
| | |
| | |
Fortune Brands Innovations, Inc. |
| | |
| | |
| | |
|
| | |
|
| | |
| | |
|
| | |
|
| | |
Honeywell International, Inc. |
| | |
| | |
| | |
| | |
| | |
|
| | |
|
| | |
Huntington Ingalls Industries, Inc. |
| | |
|
| | |
| | |
|
| | |
|
| | |
| | |
| | |
| | |
| | |
| | |
| | |
| | |
| | |
| | |
| | |
Johnson Controls International PLC/Tyco Fire & Security Finance SCA |
| | |
| | |
| | |
|
| | |
L3Harris Technologies, Inc. |
| | |
| | |
| | |
|
| | |
Schwab Fixed-Income ETFs | Annual Report165
Schwab 5-10 Year Corporate Bond ETF
Portfolio Holdings as of December 31, 2023 (continued)
SECURITY RATE, MATURITY DATE | | |
|
| | |
| | |
| | |
Martin Marietta Materials, Inc. |
| | |
| | |
|
| | |
| | |
|
| | |
|
| | |
|
| | |
| | |
|
| | |
| | |
|
| | |
|
| | |
|
| | |
| | |
|
| | |
| | |
|
| | |
| | |
|
| | |
| | |
|
| | |
| | |
| | |
| | |
| | |
| | |
Rockwell Automation, Inc. |
| | |
| | |
|
| | |
| | |
| | |
| | |
| | |
| | |
| | |
|
| | |
| | |
Stanley Black & Decker, Inc. |
| | |
| | |
Teledyne Technologies, Inc. |
| | |
SECURITY RATE, MATURITY DATE | | |
|
| | |
| | |
| | |
| | |
|
| | |
Trane Technologies Financing Ltd. |
| | |
| | |
|
| | |
|
| | |
|
| | |
|
| | |
| | |
| | |
| | |
| | |
|
| | |
| | |
| | |
| | |
| | |
| | |
|
| | |
| | |
|
|
| | |
| | |
| | |
|
| | |
| | |
| | |
| | |
| | |
| | |
| | |
| | |
| | |
| | |
| | |
|
| | |
| | |
| | |
| | |
| | |
Bell Telephone Co. of Canada or Bell Canada |
| | |
| | |
British Telecommunications PLC |
| | |
166Schwab Fixed-Income ETFs | Annual Report
Schwab 5-10 Year Corporate Bond ETF
Portfolio Holdings as of December 31, 2023 (continued)
SECURITY RATE, MATURITY DATE | | |
Charter Communications Operating LLC/Charter Communications Operating Capital |
| | |
| | |
| | |
| | |
| | |
|
| | |
| | |
| | |
| | |
| | |
| | |
| | |
| | |
| | |
| | |
| | |
|
| | |
| | |
| | |
| | |
| | |
| | |
| | |
| | |
Deutsche Telekom International Finance BV |
| | |
| | |
Discovery Communications LLC |
| | |
| | |
|
| | |
|
| | |
| | |
| | |
|
| | |
Interpublic Group of Cos., Inc. |
| | |
| | |
| | |
|
| | |
|
| | |
| | |
| | |
|
| | |
|
| | |
| | |
| | |
|
| | |
|
| | |
| | |
| | |
SECURITY RATE, MATURITY DATE | | |
| | |
| | |
Rogers Communications, Inc. |
| | |
|
| | |
Take-Two Interactive Software, Inc. |
| | |
|
| | |
|
| | |
Time Warner Cable Enterprises LLC |
| | |
|
| | |
| | |
| | |
| | |
| | |
| | |
| | |
| | |
| | |
| | |
| | |
TWDC Enterprises 18 Corp. |
| | |
Verizon Communications, Inc. |
| | |
| | |
| | |
| | |
| | |
| | |
| | |
| | |
| | |
| | |
| | |
| | |
|
| | |
| | |
|
| | |
| | |
| | |
| | |
Warnermedia Holdings, Inc. |
| | |
| | |
|
| | |
| | |
|
Alibaba Group Holding Ltd. |
| | |
|
| | |
| | |
| | |
| | |
Schwab Fixed-Income ETFs | Annual Report167
Schwab 5-10 Year Corporate Bond ETF
Portfolio Holdings as of December 31, 2023 (continued)
SECURITY RATE, MATURITY DATE | | |
| | |
| | |
American Honda Finance Corp. |
| | |
| | |
| | |
| | |
|
| | |
|
| | |
|
| | |
| | |
| | |
|
| | |
| | |
| | |
| | |
| | |
| | |
| | |
|
| | |
|
| | |
|
| | |
|
| | |
Choice Hotels International, Inc. |
| | |
| | |
|
| | |
| | |
|
| | |
|
| | |
Dick's Sporting Goods, Inc. |
| | |
|
| | |
| | |
| | |
|
| | |
|
| | |
| | |
| | |
|
| | |
| | |
|
| | |
| | |
| | |
| | |
SECURITY RATE, MATURITY DATE | | |
Ford Motor Credit Co. LLC |
| | |
| | |
| | |
| | |
| | |
| | |
| | |
|
| | |
| | |
General Motors Financial Co., Inc. |
| | |
| | |
| | |
| | |
| | |
| | |
| | |
| | |
| | |
|
| | |
| | |
| | |
GLP Capital LP/GLP Financing II, Inc. |
| | |
| | |
| | |
| | |
| | |
|
| | |
| | |
| | |
| | |
| | |
| | |
| | |
|
| | |
|
| | |
|
| | |
|
| | |
| | |
| | |
|
| | |
|
| | |
| | |
| | |
| | |
| | |
| | |
| | |
| | |
Magna International, Inc. |
| | |
| | |
168Schwab Fixed-Income ETFs | Annual Report
Schwab 5-10 Year Corporate Bond ETF
Portfolio Holdings as of December 31, 2023 (continued)
SECURITY RATE, MATURITY DATE | | |
Marriott International, Inc. |
| | |
| | |
| | |
| | |
| | |
|
| | |
| | |
| | |
| | |
| | |
|
| | |
| | |
Mercedes-Benz Finance North America LLC |
| | |
|
| | |
|
| | |
O'Reilly Automotive, Inc. |
| | |
| | |
| | |
| | |
|
| | |
| | |
|
| | |
|
| | |
|
| | |
| | |
| | |
|
| | |
| | |
| | |
| | |
| | |
|
| | |
| | |
| | |
|
| | |
| | |
| | |
| | |
| | |
| | |
|
| | |
| | |
Toll Brothers Finance Corp. |
| | |
|
| | |
| | |
| | |
SECURITY RATE, MATURITY DATE | | |
Toyota Motor Credit Corp. |
| | |
| | |
| | |
| | |
| | |
| | |
| | |
| | |
| | |
| | |
|
| | |
| | |
|
| | |
|
| | |
| | |
|
| | |
| | |
| | |
| | |
| | |
| | |
| | |
| | |
Consumer Non-Cyclical 13.7% |
|
| | |
|
| | |
|
| | |
| | |
Advocate Health & Hospitals Corp. |
| | |
Agilent Technologies, Inc. |
| | |
| | |
| | |
|
| | |
|
| | |
| | |
| | |
| | |
|
| | |
| | |
| | |
| | |
| | |
| | |
| | |
| | |
| | |
Anheuser-Busch InBev Worldwide, Inc. |
| | |
| | |
| | |
Schwab Fixed-Income ETFs | Annual Report169
Schwab 5-10 Year Corporate Bond ETF
Portfolio Holdings as of December 31, 2023 (continued)
SECURITY RATE, MATURITY DATE | | |
Archer-Daniels-Midland Co. |
| | |
| | |
| | |
| | |
|
| | |
|
| | |
| | |
| | |
|
| | |
| | |
|
| | |
| | |
|
| | |
| | |
| | |
| | |
| | |
| | |
| | |
BAT International Finance PLC |
| | |
Baxter International, Inc. |
| | |
| | |
| | |
Baylor Scott & White Holdings |
| | |
|
| | |
| | |
| | |
|
| | |
Bio-Rad Laboratories, Inc. |
| | |
Bon Secours Mercy Health, Inc. |
| | |
| | |
|
| | |
|
| | |
| | |
| | |
| | |
| | |
|
| | |
|
| | |
| | |
|
| | |
|
| | |
Cedars-Sinai Health System |
| | |
SECURITY RATE, MATURITY DATE | | |
|
| | |
| | |
Church & Dwight Co., Inc. |
| | |
| | |
|
| | |
| | |
| | |
|
| | |
| | |
| | |
|
| | |
| | |
| | |
| | |
| | |
| | |
Coca-Cola Femsa SAB de CV |
| | |
| | |
|
| | |
| | |
|
| | |
| | |
|
| | |
Constellation Brands, Inc. |
| | |
| | |
| | |
| | |
| | |
|
| | |
| | |
| | |
| | |
| | |
| | |
| | |
| | |
| | |
| | |
|
| | |
DH Europe Finance II SARL |
| | |
|
| | |
| | |
| | |
| | |
| | |
|
| | |
| | |
170Schwab Fixed-Income ETFs | Annual Report
Schwab 5-10 Year Corporate Bond ETF
Portfolio Holdings as of December 31, 2023 (continued)
SECURITY RATE, MATURITY DATE | | |
|
| | |
| | |
| | |
| | |
|
| | |
GE HealthCare Technologies, Inc. |
| | |
| | |
|
| | |
| | |
| | |
|
| | |
| | |
GlaxoSmithKline Capital PLC |
| | |
|
| | |
| | |
|
| | |
|
| | |
| | |
| | |
| | |
| | |
| | |
| | |
|
| | |
| | |
| | |
|
| | |
|
| | |
|
| | |
|
| | |
|
| | |
| | |
| | |
JBS USA LUX SA/JBS USA Food Co./JBS USA Finance, Inc. |
| | |
| | |
| | |
| | |
| | |
| | |
|
| | |
| | |
| | |
| | |
|
| | |
| | |
| | |
SECURITY RATE, MATURITY DATE | | |
|
| | |
| | |
|
| | |
| | |
| | |
| | |
|
| | |
| | |
| | |
| | |
|
| | |
| | |
| | |
| | |
|
| | |
| | |
| | |
| | |
Laboratory Corp. of America Holdings |
| | |
| | |
|
| | |
| | |
| | |
|
| | |
Medtronic Global Holdings SCA |
| | |
|
| | |
| | |
| | |
| | |
| | |
| | |
Mondelez International, Inc. |
| | |
| | |
| | |
| | |
|
| | |
Ochsner LSU Health System of North Louisiana |
| | |
|
| | |
|
| | |
| | |
| | |
| | |
| | |
| | |
| | |
| | |
Pfizer Investment Enterprises Pte. Ltd. |
| | |
| | |
Schwab Fixed-Income ETFs | Annual Report171
Schwab 5-10 Year Corporate Bond ETF
Portfolio Holdings as of December 31, 2023 (continued)
SECURITY RATE, MATURITY DATE | | |
|
| | |
| | |
| | |
| | |
Philip Morris International, Inc. |
| | |
| | |
| | |
| | |
| | |
| | |
| | |
| | |
| | |
Piedmont Healthcare, Inc. |
| | |
|
| | |
| | |
| | |
|
| | |
|
| | |
| | |
| | |
| | |
| | |
Providence St Joseph Health Obligated Group |
| | |
| | |
|
| | |
| | |
| | |
| | |
Regeneron Pharmaceuticals, Inc. |
| | |
|
| | |
| | |
| | |
|
| | |
| | |
|
| | |
|
| | |
|
| | |
STERIS Irish FinCo UnLtd Co. |
| | |
|
| | |
|
| | |
| | |
|
| | |
| | |
| | |
| | |
SECURITY RATE, MATURITY DATE | | |
Takeda Pharmaceutical Co. Ltd. |
| | |
Thermo Fisher Scientific, Inc. |
| | |
| | |
| | |
| | |
| | |
| | |
|
| | |
|
| | |
| | |
| | |
| | |
| | |
Universal Health Services, Inc. |
| | |
| | |
|
| | |
|
| | |
|
| | |
| | |
| | |
| | |
Zimmer Biomet Holdings, Inc. |
| | |
|
| | |
| | |
| | |
|
|
| | |
Baker Hughes Holdings LLC/Baker Hughes Co.-Obligor, Inc. |
| | |
| | |
|
| | |
| | |
| | |
BP Capital Markets America, Inc. |
| | |
| | |
| | |
| | |
| | |
|
| | |
| | |
Canadian Natural Resources Ltd. |
| | |
| | |
| | |
|
| | |
Cheniere Corpus Christi Holdings LLC |
| | |
172Schwab Fixed-Income ETFs | Annual Report
Schwab 5-10 Year Corporate Bond ETF
Portfolio Holdings as of December 31, 2023 (continued)
SECURITY RATE, MATURITY DATE | | |
Cheniere Energy Partners LP |
| | |
| | |
| | |
| | |
|
| | |
|
| | |
|
| | |
|
| | |
| | |
| | |
|
| | |
DCP Midstream Operating LP |
| | |
| | |
| | |
|
| | |
| | |
| | |
|
| | |
| | |
| | |
Eastern Gas Transmission & Storage, Inc. |
| | |
|
| | |
| | |
| | |
| | |
|
| | |
| | |
| | |
| | |
| | |
| | |
Enterprise Products Operating LLC |
| | |
| | |
| | |
| | |
|
| | |
|
| | |
| | |
|
| | |
| | |
| | |
|
| | |
|
| | |
SECURITY RATE, MATURITY DATE | | |
|
| | |
| | |
| | |
|
| | |
Kinder Morgan Energy Partners LP |
| | |
| | |
| | |
|
| | |
| | |
| | |
| | |
| | |
Magellan Midstream Partners LP |
| | |
|
| | |
|
| | |
| | |
| | |
| | |
|
| | |
|
| | |
Occidental Petroleum Corp. |
| | |
| | |
| | |
| | |
| | |
|
| | |
| | |
| | |
| | |
| | |
| | |
| | |
|
| | |
| | |
| | |
| | |
Patterson-UTI Energy, Inc. |
| | |
| | |
|
| | |
|
| | |
| | |
Pioneer Natural Resources Co. |
| | |
| | |
Plains All American Pipeline LP/PAA Finance Corp. |
| | |
| | |
Sabine Pass Liquefaction LLC |
| | |
Schwab Fixed-Income ETFs | Annual Report173
Schwab 5-10 Year Corporate Bond ETF
Portfolio Holdings as of December 31, 2023 (continued)
SECURITY RATE, MATURITY DATE | | |
Schlumberger Investment SA |
| | |
| | |
Shell International Finance BV |
| | |
| | |
|
| | |
|
| | |
| | |
| | |
Targa Resources Partners LP/Targa Resources Partners Finance Corp. |
| | |
| | |
| | |
| | |
Texas Eastern Transmission LP |
| | |
|
| | |
TotalEnergies Capital International SA |
| | |
| | |
TransCanada PipeLines Ltd. |
| | |
| | |
Transcontinental Gas Pipe Line Co. LLC |
| | |
|
| | |
| | |
| | |
Western Midstream Operating LP |
| | |
| | |
| | |
|
| | |
| | |
| | |
| | |
| | |
| | |
| | |
|
Booz Allen Hamilton, Inc. |
| | |
|
| | |
|
| | |
Jacobs Engineering Group, Inc. |
| | |
|
| | |
|
| | |
| | |
|
| | |
| | |
SECURITY RATE, MATURITY DATE | | |
|
|
| | |
Advanced Micro Devices, Inc. |
| | |
|
| | |
|
| | |
|
| | |
|
| | |
| | |
| | |
| | |
| | |
| | |
| | |
| | |
| | |
|
| | |
|
| | |
|
| | |
| | |
Automatic Data Processing, Inc. |
| | |
|
| | |
| | |
|
| | |
| | |
| | |
|
| | |
| | |
| | |
| | |
| | |
| | |
| | |
| | |
| | |
Broadridge Financial Solutions, Inc. |
| | |
| | |
CDW LLC/CDW Finance Corp. |
| | |
| | |
|
| | |
|
| | |
Dell International LLC/EMC Corp. |
| | |
| | |
| | |
174Schwab Fixed-Income ETFs | Annual Report
Schwab 5-10 Year Corporate Bond ETF
Portfolio Holdings as of December 31, 2023 (continued)
SECURITY RATE, MATURITY DATE | | |
|
| | |
| | |
|
| | |
| | |
| | |
| | |
FactSet Research Systems, Inc. |
| | |
Fidelity National Information Services, Inc. |
| | |
| | |
| | |
|
| | |
| | |
| | |
| | |
|
| | |
| | |
|
| | |
|
| | |
| | |
| | |
| | |
| | |
|
| | |
| | |
| | |
| | |
| | |
|
| | |
| | |
| | |
| | |
| | |
| | |
| | |
| | |
International Business Machines Corp. |
| | |
| | |
| | |
| | |
| | |
| | |
|
| | |
| | |
|
| | |
| | |
| | |
|
| | |
| | |
Keysight Technologies, Inc. |
| | |
SECURITY RATE, MATURITY DATE | | |
|
| | |
| | |
|
| | |
|
| | |
| | |
|
| | |
| | |
| | |
|
| | |
| | |
| | |
|
| | |
| | |
| | |
| | |
| | |
|
| | |
| | |
| | |
| | |
| | |
| | |
|
| | |
|
| | |
| | |
| | |
|
| | |
| | |
| | |
| | |
|
| | |
|
| | |
| | |
NXP BV/NXP Funding LLC/NXP USA, Inc. |
| | |
| | |
| | |
| | |
| | |
|
| | |
| | |
| | |
| | |
| | |
| | |
| | |
|
| | |
| | |
| | |
Schwab Fixed-Income ETFs | Annual Report175
Schwab 5-10 Year Corporate Bond ETF
Portfolio Holdings as of December 31, 2023 (continued)
SECURITY RATE, MATURITY DATE | | |
|
| | |
|
| | |
| | |
| | |
| | |
|
| | |
| | |
| | |
|
| | |
| | |
| | |
|
| | |
| | |
| | |
| | |
| | |
| | |
|
| | |
|
| | |
|
| | |
|
| | |
|
| | |
Tencent Music Entertainment Group |
| | |
|
| | |
| | |
| | |
| | |
| | |
|
| | |
|
| | |
| | |
| | |
Tyco Electronics Group SA |
| | |
|
| | |
|
| | |
| | |
|
| | |
| | |
|
| | |
| | |
|
| | |
| | |
SECURITY RATE, MATURITY DATE | | |
|
| | |
|
| | |
| | |
|
| | |
| | |
|
American Airlines 2017-1 Class AA Pass-Through Trust |
| | |
American Airlines 2017-2 Class AA Pass-Through Trust |
| | |
American Airlines 2019-1 Class AA Pass-Through Trust |
| | |
Canadian National Railway Co. |
| | |
| | |
Canadian Pacific Railway Co. |
| | |
| | |
| | |
| | |
|
| | |
| | |
| | |
| | |
|
| | |
| | |
| | |
|
| | |
JetBlue 2019-1 Class AA Pass-Through Trust |
| | |
JetBlue 2020-1 Class A Pass-Through Trust |
| | |
|
| | |
| | |
| | |
| | |
| | |
|
| | |
|
| | |
Triton Container International Ltd./TAL International Container Corp. |
| | |
|
| | |
| | |
| | |
| | |
| | |
| | |
United Airlines 2018-1 Class AA Pass-Through Trust |
| | |
United Airlines 2019-1 Class AA Pass-Through Trust |
| | |
176Schwab Fixed-Income ETFs | Annual Report
Schwab 5-10 Year Corporate Bond ETF
Portfolio Holdings as of December 31, 2023 (continued)
SECURITY RATE, MATURITY DATE | | |
United Airlines 2019-2 Class AA Pass-Through Trust |
| | |
United Parcel Service, Inc. |
| | |
| | |
| | |
| | |
| | |
| | |
|
|
|
|
| | |
| | |
| | |
|
| | |
|
| | |
| | |
| | |
| | |
|
| | |
| | |
|
| | |
| | |
| | |
American Electric Power Co., Inc. |
| | |
| | |
| | |
| | |
|
| | |
| | |
Arizona Public Service Co. |
| | |
| | |
| | |
| | |
Atlantic City Electric Co. |
| | |
|
| | |
Baltimore Gas & Electric Co. |
| | |
Berkshire Hathaway Energy Co. |
| | |
| | |
|
| | |
| | |
| | |
CenterPoint Energy Houston Electric LLC |
| | |
| | |
| | |
| | |
| | |
SECURITY RATE, MATURITY DATE | | |
|
| | |
| | |
|
| | |
| | |
|
| | |
| | |
| | |
Connecticut Light & Power Co. |
| | |
| | |
Consolidated Edison Co. of New York, Inc. |
| | |
| | |
| | |
Constellation Energy Generation LLC |
| | |
|
| | |
| | |
| | |
Dominion Energy South Carolina, Inc. |
| | |
| | |
| | |
|
| | |
| | |
| | |
| | |
| | |
| | |
|
| | |
| | |
| | |
| | |
|
| | |
| | |
Duke Energy Carolinas LLC |
| | |
| | |
| | |
| | |
| | |
| | |
|
| | |
| | |
| | |
| | |
| | |
|
| | |
| | |
| | |
| | |
|
| | |
| | |
| | |
Schwab Fixed-Income ETFs | Annual Report177
Schwab 5-10 Year Corporate Bond ETF
Portfolio Holdings as of December 31, 2023 (continued)
SECURITY RATE, MATURITY DATE | | |
|
| | |
| | |
| | |
| | |
|
| | |
|
| | |
|
| | |
| | |
|
| | |
| | |
|
| | |
| | |
| | |
| | |
|
| | |
|
| | |
| | |
Evergy Kansas Central, Inc. |
| | |
|
| | |
| | |
|
| | |
|
| | |
| | |
| | |
| | |
| | |
| | |
|
| | |
| | |
| | |
Florida Power & Light Co. |
| | |
| | |
| | |
| | |
|
| | |
| | |
| | |
Interstate Power & Light Co. |
| | |
| | |
| | |
|
| | |
|
| | |
Louisville Gas & Electric Co. |
| | |
SECURITY RATE, MATURITY DATE | | |
|
| | |
| | |
|
| | |
National Rural Utilities Cooperative Finance Corp. |
| | |
| | |
| | |
| | |
| | |
| | |
| | |
| | |
| | |
|
| | |
| | |
NextEra Energy Capital Holdings, Inc. |
| | |
| | |
| | |
| | |
| | |
| | |
| | |
| | |
Northern States Power Co. |
| | |
|
| | |
| | |
| | |
|
| | |
| | |
| | |
Oklahoma Gas & Electric Co. |
| | |
| | |
| | |
Oncor Electric Delivery Co. LLC |
| | |
| | |
| | |
| | |
| | |
| | |
| | |
Pacific Gas & Electric Co. |
| | |
| | |
| | |
| | |
| | |
| | |
| | |
| | |
| | |
|
| | |
| | |
| | |
|
| | |
178Schwab Fixed-Income ETFs | Annual Report
Schwab 5-10 Year Corporate Bond ETF
Portfolio Holdings as of December 31, 2023 (continued)
SECURITY RATE, MATURITY DATE | | |
PPL Capital Funding, Inc. |
| | |
PPL Electric Utilities Corp. |
| | |
|
| | |
| | |
Public Service Co. of Colorado |
| | |
| | |
| | |
Public Service Co. of New Hampshire |
| | |
| | |
Public Service Co. of Oklahoma |
| | |
| | |
Public Service Electric & Gas Co. |
| | |
| | |
| | |
| | |
| | |
| | |
| | |
Public Service Enterprise Group, Inc. |
| | |
| | |
| | |
|
| | |
| | |
San Diego Gas & Electric Co. |
| | |
| | |
Southern California Edison Co. |
| | |
| | |
| | |
| | |
| | |
| | |
| | |
|
| | |
| | |
| | |
| | |
Southwestern Electric Power Co. |
| | |
|
| | |
Tucson Electric Power Co. |
| | |
| | |
|
| | |
| | |
| | |
Virginia Electric & Power Co. |
| | |
| | |
| | |
SECURITY RATE, MATURITY DATE | | |
| | |
| | |
|
| | |
Wisconsin Electric Power Co. |
| | |
| | |
Wisconsin Power & Light Co. |
| | |
| | |
| | |
| | |
|
| | |
| | |
| | |
| | |
| | |
| | |
|
|
| | |
| | |
| | |
| | |
CenterPoint Energy Resources Corp. |
| | |
| | |
| | |
|
| | |
| | |
| | |
| | |
|
| | |
| | |
| | |
Piedmont Natural Gas Co., Inc. |
| | |
| | |
| | |
|
| | |
| | |
Southern California Gas Co. |
| | |
| | |
Southern Co. Gas Capital Corp. |
| | |
| | |
| | |
|
| | |
| | |
|
| | |
| | |
|
American Water Capital Corp. |
| | |
| | |
Schwab Fixed-Income ETFs | Annual Report179
Schwab 5-10 Year Corporate Bond ETF
Portfolio Holdings as of December 31, 2023 (continued)
SECURITY RATE, MATURITY DATE | | |
| | |
| | |
Essential Utilities, Inc. |
| | |
| | |
| | |
| | |
| | |
Total Corporates
(Cost $5,594,006,875) | |
| | |
SHORT-TERM INVESTMENTS 1.0% OF NET ASSETS |
|
|
State Street Institutional U.S. Government Money Market Fund, Premier Class 5.32% (g) | | |
State Street Institutional U.S. Government Money Market Fund, Premier Class 5.32% (g)(h) | | |
| | |
Total Short-Term Investments
(Cost $56,722,200) | |
Total Investments in Securities
(Cost $5,650,729,075) | |
| | | CURRENT VALUE/
UNREALIZED
APPRECIATION
(DEPRECIATION)
($) |
|
| | | |
5 Year US Treasury Notes (CBOT), expires 03/28/24 | | | |
| | | |
10 Year US Treasury Notes (CBOT), expires 03/19/24 | | | |
10 Year US Treasury Notes Ultra Futures, expires 03/19/24 | | | |
| |
Total Net Unrealized Appreciation on Futures Contracts | |
| The effective maturity may be shorter than the final maturity shown because of the possibility of interim principal payments and prepayments or as the result of embedded demand features (puts or calls). |
| Security is in a fixed-rate coupon period. Based on index eligibility requirements and the fund’s investment objective this security will be removed from the index prior to converting to a floating rate security. |
| All or a portion of this security is on loan. Securities on loan were valued at $45,357,774. |
| Issuer is affiliated with the fund’s investment adviser. |
| Securities exempt from registration under Rule 144A of the Securities Act of 1933, as amended. These securities may be resold in transactions exempt from registrations, normally to qualified institutional buyers. At the period end, the value of these amounted to $59,115,186 or 1.0% of net assets. |
| Interest rate is subject to adjustments from time to time if a nationally recognized statistical rating organization downgrades (or subsequently upgrades) the debt rating assigned to the bond. |
| The rate shown is the annualized 7-day yield. |
| Security purchased with cash collateral received for securities on loan. |
| |
| Real Estate Investment Trust |
180Schwab Fixed-Income ETFs | Annual Report
Schwab 5-10 Year Corporate Bond ETF
Portfolio Holdings as of December 31, 2023 (continued)
Below is a summary of the fund’s transactions with affiliated issuers during the period ended December 31, 2023:
SECURITY
RATE, MATURITY DATE | | | | | NET CHANGE IN UNREALIZED APPRECIATION (DEPRECIATION) | ACCRETION OF DISCOUNTS (AMORTIZATION OF PREMIUMS) | | | |
CORPORATES 0.4% OF NET ASSETS |
|
Financial Institutions 0.4% |
Brokerage/Asset Managers/Exchanges 0.4% |
|
| | | | | | | | | |
| | | | | | | | | |
| | | | | | | | | |
| | | | | | | | | |
| | | | | | | | | |
| | | | | | | | | |
| | | | | | | | | |
| | | | | | | | | |
| | | | | | | | | |
| | | | | | | | | |
| | | | | | | | | |
| | | | | | | | | |
| | | | | | | | | |
The following is a summary of the inputs used to value the fund’s investments as of December 31, 2023 (see financial note 2(a) for additional information):
| QUOTED PRICES IN
ACTIVE MARKETS FOR
IDENTICAL ASSETS
(LEVEL 1) | OTHER SIGNIFICANT
OBSERVABLE INPUTS
(LEVEL 2) | SIGNIFICANT
UNOBSERVABLE INPUTS
(LEVEL 3) | |
| | | | |
| | | | |
| | | | |
| | | | |
| | | | |
| | | | |
| | | | |
| As categorized in the Portfolio Holdings. |
| Futures contracts are reported at cumulative unrealized appreciation or depreciation. |
Schwab Fixed-Income ETFs | Annual Report181
Schwab 5-10 Year Corporate Bond ETF
Statement of Assets and Liabilities
|
Investments in securities, at value - affiliated (cost $22,978,854) | | |
Investments in securities, at value - unaffiliated (cost $5,627,750,221) including securities on loan of $45,357,774 | | |
Deposit with broker for futures contracts | | |
| | |
| | |
| | |
| | |
Income from securities on loan | | |
| | |
Variation margin on future contracts | | |
| | |
|
|
Collateral held for securities on loan | | |
| | |
| | |
| | |
| | |
| | |
|
|
Capital received from investors | | |
Total distributable earnings | | |
| | |
182Schwab Fixed-Income ETFs | Annual Report
Schwab 5-10 Year Corporate Bond ETF
Statement of Operations
For the period January 1, 2023 through December 31, 2023 |
|
Interest received from securities - unaffiliated | | |
Interest received from securities - affiliated | | |
Dividends received from securities - unaffiliated | | |
| | |
| | |
|
|
| | |
| | |
| | |
|
REALIZED AND UNREALIZED GAINS (LOSSES) |
Net realized losses on sales of securities - affiliated | | |
Net realized losses on sales of securities - unaffiliated | | |
Net realized losses on sales of in-kind redemptions - affiliated | | |
Net realized losses on sales of in-kind redemptions - unaffiliated | | |
Net realized losses on futures contracts | | |
| | |
Net change in unrealized appreciation (depreciation) on securities - affiliated | | |
Net change in unrealized appreciation (depreciation) on securities - unaffiliated | | |
Net change in unrealized appreciation (depreciation) on futures contracts | | |
Net change in unrealized appreciation (depreciation) | | |
Net realized and unrealized gains | | |
Increase in net assets resulting from operations | | |
Schwab Fixed-Income ETFs | Annual Report183
Schwab 5-10 Year Corporate Bond ETF
Statement of Changes in Net Assets
For the current and prior report periods
|
| | |
| | | |
| | | |
Net change in unrealized appreciation (depreciation) | | | |
Increase (decrease) in net assets resulting from operations | | | |
|
DISTRIBUTIONS TO SHAREHOLDERS |
| | | |
TRANSACTIONS IN FUND SHARES |
| | |
| | | | | |
| | | | | |
| | | | | |
Net transactions in fund shares | | | | | |
|
SHARES OUTSTANDING AND NET ASSETS |
| | |
| | | | | |
| | | | | |
Total increase (decrease) | | | | | |
| | | | | |
184Schwab Fixed-Income ETFs | Annual Report
1. Business Structure of the Funds:
Each of the funds in this report is a series of Schwab Strategic Trust (the trust), a no-load, open-end management investment company. The trust is organized as a Delaware statutory trust and is registered under the Investment Company Act of 1940, as amended (the 1940 Act). The list below shows all the operational funds in the trust as of the end of the period, including the funds discussed in this report, which are highlighted:
|
| Schwab High Yield Bond ETF |
Schwab Short-Term U.S. Treasury ETF | Schwab International Dividend Equity ETF |
Schwab Intermediate-Term U.S. Treasury ETF | Schwab International Equity ETF |
Schwab Long-Term U.S. Treasury ETF | Schwab International Small-Cap Equity ETF |
Schwab U.S. Aggregate Bond ETF | Schwab Emerging Markets Equity ETF |
Schwab 1-5 Year Corporate Bond ETF | |
Schwab 5-10 Year Corporate Bond ETF | Schwab Fundamental U.S. Broad Market Index ETF |
Schwab U.S. Broad Market ETF | Schwab Fundamental U.S. Large Company Index ETF |
| Schwab Fundamental U.S. Small Company Index ETF |
Schwab U.S. Large-Cap ETF | Schwab Fundamental International Large Company Index ETF |
Schwab U.S. Large-Cap Growth ETF | Schwab Fundamental International Small Company Index ETF |
Schwab U.S. Large-Cap Value ETF | Schwab Fundamental Emerging Markets Large Company Index ETF |
| |
Schwab U.S. Small-Cap ETF | Schwab Municipal Bond ETF |
Schwab U.S. Dividend Equity ETF | Schwab Crypto Thematic ETF |
The funds issue and redeem shares at their net asset value per share (NAV) only in large blocks of shares (Creation Units). These transactions are usually in exchange for a basket of securities and/or an amount of cash. As a practical matter, only institutional investors who have entered into an authorized participant agreement purchase or redeem Creation Units. Except when aggregated in Creation Units, shares of the funds are not redeemable securities.
Individual shares of the funds trade on national securities exchanges and elsewhere during the trading day and can only be bought and sold at market prices throughout the trading day through a broker-dealer. Because fund shares trade at market prices rather than NAV, shares may trade at a price greater than NAV (premium) or less than NAV (discount). A chart showing the frequency at which each fund’s daily closing market price was at a discount or premium to each fund’s NAV can be found at www.schwabassetmanagement.com.
Each fund maintains its own account for purposes of holding assets and accounting, and is considered a separate entity for tax purposes. Within its account, each fund may also keep certain assets in segregated accounts, as required by securities law. The "Fund Complex" includes The Charles Schwab Family of Funds, Schwab Capital Trust, Schwab Investments, Schwab Annuity Portfolios, Schwab Strategic Trust and Laudus Trust.
2. Significant Accounting Policies:The following is a summary of the significant accounting policies the funds use in their preparation of financial statements. The funds follow the investment company accounting and reporting guidance of the Financial Accounting Standards Board (FASB) Accounting Standard Codification Topic 946 Financial Services — Investment Companies. The accounting policies are in conformity with accounting principles generally accepted in the United States of America (GAAP).
The funds may invest in certain mutual funds which are referred to as "underlying funds". For more information about the underlying funds’ operations and policies, please refer to those funds’ semiannual and annual reports, which are filed with the U.S. Securities and Exchange Commission (SEC) and are available on the SEC’s website at www.sec.gov.
Pursuant to Rule 2a-5 under the 1940 Act, the Board of Trustees (the Board) has designated authority to a Valuation Designee, the funds’ investment adviser, to make fair valuation determinations under adopted procedures, subject to Board oversight. The investment adviser has formed a Pricing Committee to administer the pricing and valuation of portfolio securities and other assets and liabilities as well as to ensure that prices used for internal purposes or provided by third parties reasonably reflect fair value. The Valuation Designee may utilize independent pricing services, quotations from securities and financial instrument dealers and other market sources to determine fair value.
Schwab Fixed-Income ETFs | Annual Report185
Financial Notes (continued)
2. Significant Accounting Policies (continued):
Securities held in the funds’ portfolio are valued every business day. The following valuation policies and procedures are used by the Valuation Designee to value various types of securities:
• Bonds and notes: Fixed income investments are generally valued using an evaluated price at the mid-point of the bid/ask spread provided by an approved, independent pricing service (mid-price). To determine the evaluated mid-price, a pricing service may use a variety of techniques and inputs. Techniques may include, but are not limited to, spread models that calculate an investment-specific price relative to a benchmark or yield curve models that establish a price based on yields of comparable bonds along a range of maturities. Inputs differ by valuation approach and techniques, as appropriate, and examples of inputs may include, but are not limited to, interest rates, market conditions, comparable bonds, market trades, projected cash flows, credit reviews and issuer news.
• Futures contracts: Futures contracts are valued at their settlement prices as of the close of their exchanges.
• Short-term securities (60 days or less to maturity): Securities with remaining maturities of 60 days or less are generally valued at an evaluated price; however, such securities may be valued at their amortized cost if it approximates the security’s fair value.
• Mutual funds: Mutual funds are valued at their respective NAVs.
• Securities for which no quoted value is available: The Valuation Designee has adopted procedures to fair value a fund’s securities when market prices are not “readily available” or are unreliable. For example, a security may be fair valued when it’s de-listed or its trading is halted or suspended; when a security’s primary pricing source is unable or unwilling to provide a price; or when a security’s primary trading market is closed during regular market hours. Fair value determinations are made in good faith in accordance with adopted valuation procedures. The Valuation Designee considers a number of factors, including unobservable market inputs, when arriving at fair value. The Valuation Designee may employ methods such as the review of related or comparable assets or liabilities, related market activities, recent transactions, market multiples, book values, transactional back-testing, disposition analysis and other relevant information. Due to the subjective and variable nature of fair value pricing, there can be no assurance that a fund could obtain the fair value assigned to the security upon the sale of such security.
In accordance with the authoritative guidance on fair value measurements and disclosures under GAAP, the funds disclose the fair value of their investments in a hierarchy that prioritizes the significant inputs to valuation methods used to measure the fair value. The hierarchy gives the highest priority to valuations based upon unadjusted quoted prices in active markets for identical assets or liabilities (Level 1 measurements) and the lowest priority to valuations based upon unobservable inputs that are significant to the valuation (Level 3 measurements). If inputs used to measure the financial instruments fall within different levels of the hierarchy, the categorization is based on the lowest level input that is significant to the valuation. If it is determined that either the volume and/or level of activity for an asset or liability has significantly decreased (from normal conditions for that asset or liability) or price quotations or observable inputs are not associated with orderly transactions, increased analysis and the Valuation Designee’s judgment will be required to estimate fair value.
The three levels of the fair value hierarchy are as follows:
• Level 1 — quoted prices in active markets for identical investments — Investments whose values are based on quoted market prices in active markets. These generally include active listed equities, mutual funds, exchange-traded funds (ETFs) and futures contracts. Mutual funds and ETFs are classified as Level 1 prices, without consideration to the classification level of the underlying securities held which could be Level 1, Level 2 or Level 3 in the fair value hierarchy.
• Level 2 — other significant observable inputs (including quoted prices for similar securities, interest rates, prepayment speeds, credit risk, etc.) — Investments that trade in markets that are not considered to be active, but whose values are based on quoted market prices, dealer quotations or valuations provided by alternative pricing sources supported by observable inputs are classified as Level 2 prices. These generally include U.S. government and sovereign obligations, most government agency securities, investment-grade corporate bonds, certain mortgage products, less liquid listed equities, and state, municipal and provincial obligations.
• Level 3 — significant unobservable inputs (including the Valuation Designee’s own assumptions in determining the fair value of investments) — Investments whose values are classified as Level 3 prices have significant unobservable inputs, as they may trade infrequently or not at all. When observable prices are not readily available for these securities, one or more valuation methods are used for which sufficient and reliable data is available. The inputs used in estimating the value of Level 3 prices may include the original transaction price, quoted prices for similar securities or assets in active markets, completed or pending third-party transactions in the underlying investment or comparable issuers, and changes in financial ratios or cash
186Schwab Fixed-Income ETFs | Annual Report
Financial Notes (continued)
2. Significant Accounting Policies (continued):
flows. Level 3 prices may also be adjusted to reflect illiquidity and/or non-transferability, with the amount of such discount estimated in the absence of market information. Assumptions used due to the lack of observable inputs may significantly impact the resulting fair value and therefore a fund’s results of operations.
The inputs or methodology used for valuing securities are not necessarily an indication of the risk associated with investing in those securities.
The levels associated with valuing the funds’ investments as of December 31, 2023, are disclosed in each fund’s Portfolio Holdings.
(b) Accounting Policies for certain Portfolio Investments (if held):
Futures Contracts: Futures contracts are instruments that represent an agreement between two parties that obligates one party to buy, and the other party to sell, specific instruments at an agreed upon price on a stipulated future date. A fund must give the broker a deposit of cash and/or securities (initial margin) whenever it enters into a futures contract. The amount of the deposit may vary from one contract to another. Subsequent payments (variation margin) are made or received by a fund depending on the daily fluctuations in the value of the futures contract and are accounted for as unrealized appreciation or depreciation until the contract is closed, at which time the gains or losses are realized. Futures contracts are traded publicly on exchanges, and their fair value may change daily.
Inflation-Protected Securities: The Schwab U.S. TIPS ETF invests in U.S. Treasury inflation-protected securities (TIPS). Inflation-protected securities are fixed-income securities whose principal value is periodically adjusted to the rate of inflation. The interest rate on these instruments is generally fixed at issuance at a rate lower than typical bonds or notes. Over the life of an inflation-indexed instrument, interest will be paid based on a principal value, which is adjusted for any inflation or deflation. Any increase or decrease in the principal amount of an inflation-protected security will be included as an addition or reduction to interest income on the Statement of Operations, even though investors do not receive their principal until maturity.
TBA Commitments: The Schwab U.S. Aggregate Bond ETF may enter into “TBA” (to-be-announced) commitments to purchase or sell securities for a fixed price at a future date. Payments or proceeds of TBA commitments are not delivered until the contractual settlement date. Unsettled TBA commitments are valued at the current market value generally according to the procedures described above in the Security Valuation section. The fund’s use of TBA commitments may cause the fund to experience higher portfolio turnover and higher transaction costs.
Agency MBS and TBA Transactions: The Treasury Market Practices Group (TMPG) of the Federal Reserve Bank of New York recommended the margining of certain forward-settling Agency MBS (Mortgage-Backed Securities) transactions, including TBAs, to reduce counterparty credit risk. The TMPG recommended market participants exchange two-way variation margin on a regular basis. The Schwab U.S. Aggregate Bond ETF posts and receives variation margin with certain counterparties in instances where the unrealized gain (loss) on such transactions exceeds certain pre-determined thresholds. The variation margin, if any, is disclosed on the Statement of Assets and Liabilities.
Delayed-Delivery Transactions and When-Issued Securities: During the period, certain funds transacted in securities on a delayed-delivery or when-issued basis. Payment and delivery may take place after the customary settlement period for that security. The price of the underlying securities and the date when the securities will be delivered and paid for are fixed at the time the transaction is negotiated. The securities purchased on a delayed-delivery or when-issued basis are identified as such in the funds’ Portfolio Holdings, if any. The funds may receive compensation for interest forgone in the purchase of a delayed-delivery or when-issued security. Losses may arise due to changes in the value of the underlying securities or if the counterparty does not perform under the contract’s terms, or if the issuer does not issue the securities due to political, economic, or other factors. The funds comply with Rule 18f-4 under the 1940 Act, the funds operate as limited derivatives users, with respect to purchase commitments held within the funds, portfolio securities are no longer required to be segregated as collateral with a value at least equal to the amount of a purchase commitment and the funds’ exposure is monitored under a derivatives risk management program.
Securities Lending: Under the trust’s Securities Lending Program, a fund (lender) may make short-term loans of its securities to another party (borrower) to generate additional revenue for the fund. The borrower pledges collateral in the form of cash, securities issued or fully guaranteed by the U.S. government or foreign governments, or letters of credit issued by a bank. Collateral at the individual loan level is required to be maintained on a daily marked-to-market basis in an amount at least equal to the current value of the securities loaned. The lending agent provides a fund with indemnification against borrower default (the borrower fails to return the security on loan) reducing the risk of loss as a result of default. The cash collateral of securities loaned is currently invested in money market portfolios operating pursuant to Rule 2a-7 under the 1940 Act. Each fund bears the risk of loss with respect to the investment of cash collateral. The terms of the securities lending agreements allow the funds or the lending agent to
Schwab Fixed-Income ETFs | Annual Report187
Financial Notes (continued)
2. Significant Accounting Policies (continued):
terminate any loan at any given time and the securities must be returned within the earlier of the standard trade settlement period or the specified time period under the relevant securities lending agreement. Securities lending income, as disclosed in each fund’s Statement of Operations, if applicable, represents the income earned from the investment of the cash collateral plus any fees paid by borrowers, less the fees paid to the lending agent and broker rebates which are subject to adjustments pursuant to the securities lending agreement. On loans not collateralized by cash, a fee is received from the borrower, and is allocated between a fund and the lending agent. The aggregate market value of securities loaned will not at any time exceed one-third of the total assets of a fund, including collateral received from the loan. Securities lending fees paid to the unaffiliated lending agents start at 9% of gross lending revenue, with subsequent breakpoints to a low of 5%. In this context, the gross lending revenue equals the income received from the investment of cash collateral and fees paid by borrowers less any rebates paid to the borrowers. Any expenses charged by the cash collateral fund are in addition to these fees. All remaining revenue is retained by the fund, as applicable. No portion of lending revenue is paid to or retained by the investment adviser or any of its affiliates.
As of December 31, 2023, only Schwab U.S. Aggregate Bond ETF, Schwab 1-5 Year Corporate Bond ETF and Schwab 5-10 Year Corporate Bond ETF had securities on loan, all of which were classified as corporate and government related bonds. The value of the securities on loan and the related collateral at December 31, 2023, if any, are disclosed in each fund’s Portfolio Holdings and Statement of Assets and Liabilities.
(c) Security Transactions:
Security transactions are recorded as of the date the order to buy or sell the security is executed. Realized gains or losses from security transactions are based on the identified costs of the securities involved. Gains and losses from paydowns on mortgage and asset backed securities are recorded as adjustments to interest income.
Interest income is recorded as it accrues. If a fund buys a debt security at a discount (less than face value) or a premium (more than face value), it amortizes premiums and accretes discounts from the purchase settlement date up to maturity. The fund then increases (in the case of discounts) or reduces (in the case of premiums) the income it records from the security. Certain securities may be callable (meaning that the issuer has the option to pay it off before its maturity date). The fund amortizes the premium and accretes the discount on each callable security to the security’s maturity date, except when the purchase price is higher than the call price at the security’s call date (in which case the premium is amortized to the call date). Any increase or decrease in the principal amount of an inflation-protected security is included as an addition or reduction to interest income on the Statement of Operations; such adjustments may have a significant impact on a fund’s distributions. Dividends and distributions from underlying funds are recorded on the date they are effective (the ex-dividend date). Any distributions from underlying funds are recorded in accordance with the character of the distributions as designated by the underlying funds.
Pursuant to the Amended and Restated Advisory Agreement (Advisory Agreement) between the investment adviser and the trust, the investment adviser will pay the operating expenses of each fund, excluding taxes, any brokerage expenses, and extraordinary or non-routine expenses. Taxes, any brokerage expenses and extraordinary or non-routine expenses that are specific to a fund are charged directly to the fund. The Advisory Agreement excludes paying acquired fund fees and expenses, which are indirect expenses incurred by a fund through its investments in underlying funds.
(f) U.S. Treasury, Agency Debt & Agency MBS Charges:
Due to market conditions or other reasons, delivery of U.S. Treasury securities, agency debt and agency MBS may not occur on a timely basis. In these instances, a fund may fail to receive a security purchased causing the fund to be unable to deliver a security sold. The TMPG recommends voluntary fail charges when securities are not delivered as agreed by the parties. These fail charges are included in net realized gains (losses) in each fund’s Statement of Operations, if any.
(g) Distributions to Shareholders:
The funds make distributions from net investment income, if any, monthly and from net realized capital gains, if any, once a year. To receive a distribution, you must be a registered shareholder on the record date. Distributions are paid to shareholders on the payable date.
188Schwab Fixed-Income ETFs | Annual Report
Financial Notes (continued)
2. Significant Accounting Policies (continued):
(h) Accounting Estimates:
The accounting policies described in this report conform to GAAP. Notwithstanding this, shareholders should understand that in order to follow these principles, fund management has to make estimates and assumptions that affect the information reported in the financial statements. It’s possible that once the results are known, they may turn out to be different from these estimates and these differences may be material.
(i) Federal Income Taxes:
The funds intend to meet federal income and excise tax requirements for regulated investment companies under subchapter M of the Internal Revenue Code, as amended. Accordingly, the funds distribute substantially all of their net investment income and net realized capital gains, if any, to their respective shareholders each year. As long as a fund meets the tax requirements, it is not required to pay federal income tax.
Under the funds’ organizational documents, the officers and trustees are indemnified against certain liabilities arising out of the performance of their duties to the funds. In addition, in the normal course of business the funds enter into contracts with their vendors and others that provide general indemnifications. The funds’ maximum exposure under these arrangements is unknown as this would involve future claims that may be made against the funds. However, based on experience, the funds expect the risk of loss attributable to these arrangements to be remote.
Effective January 24, 2023, the SEC adopted rule and form amendments to require mutual funds and ETFs to transmit concise and visually engaging streamlined annual and semiannual reports to shareholders that highlight key information deemed important for retail investors to assess and monitor their fund investments. Other information, including financial statements, will no longer appear in a streamlined shareholder report but must be available online, delivered free of charge upon request, and filed on a semiannual basis on Form N-CSR. The rule and form amendments have a compliance date of July 24, 2024. At this time, management is evaluating the impact of these rule and form amendment changes on the content of the current shareholder report and the newly created annual and semiannual streamlined shareholder reports.
Investing in the funds may involve certain risks, as discussed in the funds’ prospectus, including, but not limited to, those described below. Any of these risks could cause an investor to lose money.
Market Risk. Financial markets rise and fall in response to a variety of factors, sometimes rapidly and unpredictably. Markets may be impacted by economic, political, regulatory and other conditions, including economic sanctions and other government actions. In addition, the occurrence of global events, such as war, terrorism, environmental disasters, natural disasters and epidemics, may also negatively affect the financial markets. As with any investment whose performance is tied to these markets, the value of an investment in a fund will fluctuate, which means that an investor could lose money over short or long periods.
Investment Style Risk. The funds are index funds. Therefore, the funds follow the securities included in an index during upturns as well as downturns. Because of their indexing strategy, the funds do not take steps to reduce market exposure or to lessen the effects of a declining market. In addition, because of each fund’s expenses, each fund’s performance may be below that of its respective index. Errors relating to an index may occur from time to time and may not be identified by an index provider for a period of time. In addition, market disruptions could cause delays in the index’s rebalancing schedule. Such errors and/or market disruptions may result in losses for a fund.
Interest Rate Risk. Interest rates rise and fall over time. As with any investment whose yield reflects current interest rates, a fund’s yield will change over time. During periods when interest rates are low, a fund’s yield (and total return) also may be low. Changes in interest rates also may affect a fund’s share price: a rise in interest rates generally causes a fund’s share price to fall. The longer a fund’s portfolio duration, the more sensitive to interest rate movements its share price is likely to be. Also, a change in a central bank’s monetary policy or economic conditions, among other things, may result in a change in interest rates, which could have sudden and unpredictable effects on the markets and significantly impact the value of fixed-income securities in which a fund invests. A sudden or unpredictable rise in interest rates may cause volatility and the value of fixed-income securities to decline.
Schwab Fixed-Income ETFs | Annual Report189
Financial Notes (continued)
3. Risk Factors (continued):
Credit Risk. A decline in the credit quality of an issuer, guarantor or liquidity provider of a portfolio investment or a counterparty could cause the funds to lose money or underperform. The funds could lose money if, due to a decline in credit quality, the issuer, guarantor or liquidity provider of a portfolio investment or a counterparty fails to make, or is perceived as being unable or unwilling to make, timely principal or interest payments or otherwise honor its obligations.
Inflation-Protected Security Risk. The value of inflation-protected securities, including TIPS, generally will fluctuate in response to changes in “real” interest rates, generally decreasing when real interest rates rise and increasing when real interest rates fall. Real interest rates represent nominal (or stated) interest rates reduced by the expected impact of inflation. In addition, interest payments on inflation-indexed securities will generally vary up or down along with the rate of inflation.
Sampling Index Tracking Risk. To the extent a fund uses sampling techniques, the fund may not fully replicate the index and may hold securities not included in the index. As a result, a fund is subject to the risk that the investment adviser’s investment management strategy, the implementation of which is subject to a number of constraints, may not produce the intended results. If a fund utilizes a sampling approach, it may not track the return of the index as well as it would if a fund purchased all of the securities in its index.
Tracking Error Risk. As index funds, the funds seek to track the performance of an index, although they may not be successful in doing so. The divergence between the performance of a fund and the index, positive or negative, is called “tracking error.” Tracking error can be caused by many factors and it may be significant.
Liquidity Risk. A fund may be unable to sell certain securities, such as illiquid securities, readily at a favorable time or price, or the fund may have to sell them at a loss.
Securities Lending Risk. Securities lending involves the risk of loss of rights in, or delay in recovery of, the loaned securities if the borrower fails to return the security loaned or becomes insolvent.
Market Trading Risk. Although fund shares are listed on national securities exchanges, there can be no assurance that an active trading market for fund shares will develop or be maintained. If an active market is not maintained, investors may find it difficult to buy or sell fund shares.
Portfolio Turnover Risk. With respect to the Schwab U.S. Aggregate Bond ETF, Schwab Short-Term U.S. Treasury ETF, Schwab Intermediate-Term U.S. Treasury ETF and Schwab Long-Term U.S. Treasury ETF, the fund may engage in frequent trading of its portfolio securities in connection with its tracking of the index, primarily due to the fund rolling over its positions in TBAs as it tracks the portion of the index represented by mortgage-backed securities. A higher portfolio turnover rate may result in increased transaction costs, which may lower the fund’s performance. A higher portfolio turnover rate can also result in an increase in taxable capital gains distributions to the fund’s shareholders.
Prepayment and Extension Risk. With respect to the Schwab U.S. Aggregate Bond ETF, certain of the fund’s fixed-income securities are subject to the risk that the securities may be paid off earlier or later than expected, especially during periods of falling or rising interest rates, respectively. Prepayments of obligations could cause the fund to forgo future interest income on the portion of the security’s principal repaid early and force the fund to reinvest that money at the lower prevailing interest rates. Extensions of obligations could cause the fund to exhibit additional volatility and hold securities paying lower-than-market rates of interest. Either case could hurt the fund’s performance.
Non-U.S. Issuer Risk. Certain funds may invest in U.S.-registered, dollar-denominated bonds of non-U.S. corporations, governments, agencies and supra-national entities. A fund’s investments in bonds of non-U.S. issuers may involve certain risks that are greater than those associated with investments in securities of U.S. issuers. These include risks of adverse changes in foreign economic, political, regulatory and other conditions; the imposition of economic sanctions or other government restrictions; differing accounting, auditing, financial reporting and legal standards and practices; differing securities market structures; and higher transaction costs. These risks may be heightened in connection with bonds issued by non-U.S. corporations and entities in emerging markets.
Derivatives Risk. Certain funds may invest in derivative instruments. The principal types of derivatives used by such funds are futures contracts. A futures contract is an agreement to buy or sell a financial instrument at a specific price on a specific day. A fund’s use of derivative instruments involves risks different from, or possibly greater than, the risks associated with investing directly in securities and other traditional investments. Certain of these risks, such as market risk, credit risk and liquidity risk, are discussed elsewhere in this section. A fund’s use of derivatives is also subject to lack of availability risk, valuation risk, correlation risk and tax risk. Lack of availability risk is the risk that suitable derivative transactions may not be available in all circumstances for risk management or other purposes. Valuation risk is the risk that a particular derivative may be valued incorrectly. Correlation risk is the risk that changes in the value of the derivative may not correlate perfectly with the underlying asset, rate or index. Tax risk is the risk
190Schwab Fixed-Income ETFs | Annual Report
Financial Notes (continued)
3. Risk Factors (continued):
that the use of derivatives may cause a fund to realize higher amounts of short-term capital gains. A fund’s use of derivatives could reduce the fund’s performance, increase the fund’s volatility, and cause the fund to lose more than the initial amount invested. A fund’s use of derivatives also could create a risk of counterparty default under certain transactions, risks that the fund would need to liquidate portfolio positions when it may not be advantageous to do so in order to meet margin and payment obligations, and legal risks relating to insufficient documentation, insufficient capacity or authority of a counterparty, or legality or enforceability of a contract. Furthermore, the use of derivatives subject to regulation by the Commodity Futures Trading Commission (CFTC) could cause a fund to become a commodity pool, which would require the fund to comply with certain CFTC rules.
Mortgage-Backed and Mortgage Pass-Through Securities Risk. Mortgage-backed securities tend to increase in value less than other debt securities when interest rates decline, but are subject to similar or greater risk of decline in market value during periods of rising interest rates. With respect to the Schwab U.S. Aggregate Bond ETF, certain of the mortgage-backed securities in which the fund may invest are issued or guaranteed by agencies or instrumentalities of the U.S. government but are not backed by the full faith and credit of the U.S. government. There can be no assurance that the U.S. government would provide financial support to its agencies or instrumentalities where it was not obligated to do so which can cause the fund to lose money or underperform. The risks of investing in mortgage-backed securities include, among others, interest rate risk, credit risk, prepayment risk and extension risk. Transactions in mortgage pass-through securities often occur through TBA transactions. The fund could lose money or underperform if a TBA counterparty defaults or goes bankrupt.
Concentration Risk. To the extent that a fund’s or an index’s portfolio is concentrated in the securities of issuers in a particular market, industry, group of industries, sector or asset class, the fund may be adversely affected by the performance of those securities, may be subject to increased price volatility and may be more vulnerable to adverse economic, market, political or regulatory occurrences affecting that market, industry, group of industries, sector or asset class.
Shares of the Fund May Trade at Prices Other Than NAV. Fund shares may be bought and sold in the secondary market at market prices. Although it is expected that the market price of the shares of a fund will approximate the fund’s NAV, there may be times when the market price and the NAV vary significantly. An investor may pay more than NAV when buying shares of a fund in the secondary market, and an investor may receive less than NAV when selling those shares in the secondary market. The market price of fund shares may deviate, sometimes significantly, from NAV during periods of market volatility or market disruption.
Please refer to the funds’ prospectus for a more complete description of the principal risks of investing in the funds.
4. Affiliates and Affiliated Transactions:Charles Schwab Investment Management, Inc., dba Schwab Asset Management, a wholly owned subsidiary of The Charles Schwab Corporation, serves as each fund’s investment adviser pursuant to the Advisory Agreement between the investment adviser and the trust.
For its advisory services to the funds, the investment adviser is entitled to receive an annual management fee, payable monthly, based on a percentage of each fund’s average daily net assets as follows:
| SCHWAB SHORT-TERM U.S. TREASURY ETF | SCHWAB INTERMEDIATE-TERM U.S. TREASURY ETF | SCHWAB LONG-TERM U.S. TREASURY ETF | SCHWAB U.S. AGGREGATE BOND ETF | SCHWAB 1-5 YEAR CORPORATE BOND ETF | SCHWAB 5-10 YEAR CORPORATE BOND ETF |
| | | | | | |
* Prior to September 25, 2023, the annual management fee of the Schwab U.S. TIPS ETF was 0.04%.
Schwab Fixed-Income ETFs | Annual Report191
Financial Notes (continued)
4. Affiliates and Affiliated Transactions (continued):
Investment from Affiliates
Certain funds in the Fund Complex may own shares of other funds in the Fund Complex. The table below reflects the percentages of shares of each fund in this report that are owned by other funds in the Fund Complex as of December 31, 2023, as applicable:
| |
| | SCHWAB SHORT-TERM U.S. TREASURY ETF | SCHWAB LONG-TERM U.S. TREASURY ETF | SCHWAB U.S. AGGREGATE BOND ETF | SCHWAB 1-5 YEAR CORPORATE BOND ETF | SCHWAB 5-10 YEAR CORPORATE BOND ETF |
Schwab Monthly Income Fund - Flexible Payout | | | | | | |
Schwab Monthly Income Fund - Income Payout | | | | | | |
Schwab Monthly Income Fund - Target Payout | | | | | | |
Schwab Target 2010 Index Fund | | | | | | |
Schwab Target 2015 Index Fund | | | | | | |
Schwab Target 2020 Index Fund | | | | | | |
Schwab Target 2025 Index Fund | | | | | | |
Schwab Target 2030 Index Fund | | | | | | |
Schwab Target 2035 Index Fund | | | | | | |
Schwab Target 2040 Index Fund | | | | | | |
Schwab Target 2045 Index Fund | | | | | | |
Schwab Target 2050 Index Fund | | | | | | |
Schwab Target 2055 Index Fund | | | | | | |
Schwab Target 2060 Index Fund | | | | | | |
Schwab Target 2065 Index Fund | | | | | | |
Schwab VIT Balanced Portfolio | | | | | | |
Schwab VIT Balanced with Growth Portfolio | | | | | | |
Schwab VIT Growth Portfolio | | | | | | |
Interfund Borrowing and Lending
Pursuant to an exemptive order issued by the SEC, the funds may enter into interfund borrowing and lending transactions with other funds in the Fund Complex. All loans are for temporary or emergency purposes and the interest rate to be charged will be the average of the overnight repurchase agreement rate and the short-term bank loan rate. All loans are subject to numerous conditions designed to ensure fair and equitable treatment of all participating funds. The interfund lending facility is subject to the oversight and periodic review of the Board. The funds had no interfund borrowing or lending activity during the period.
5. Other Service Providers:SEI Investments Distribution Co. is the principal underwriter and distributor of shares of the funds.
State Street Bank and Trust Company (State Street) serves as the funds’ transfer agent. As part of these services, the transfer agent maintains records pertaining to the sale, redemption and transfer of the funds’ shares. The transfer agent is also responsible for the order-taking function for the funds’ shares.
State Street also serves as custodian and accountant for the funds. The custodian is responsible for the daily safekeeping of securities and cash held by the funds. The funds’ accountant maintains all books and records related to the funds’ transactions.
192Schwab Fixed-Income ETFs | Annual Report
Financial Notes (continued)
The Board may include people who are officers and/or directors of the investment adviser or its affiliates. Federal securities law limits the percentage of such “interested persons” who may serve on a trust’s board, and the trust was in compliance with these limitations throughout the report period. The funds did not pay any interested persons or non-interested persons (independent trustees). The independent trustees are paid by the investment adviser. For information regarding the trustees, please refer to the Trustees and Officers table at the end of this report.
During the period, the funds were participants with other funds in the Fund Complex in a joint, syndicated, committed $1 billion line of credit (the Syndicated Credit Facility), which matured on September 28, 2023. On September 28, 2023, the Syndicated Credit Facility was amended to run for a new 364 day period with the line of credit amount remaining unchanged, maturing on September 26, 2024. Under the terms of the Syndicated Credit Facility, in addition to the investment adviser paying the interest charged on any borrowings by a fund, the investment adviser paid a commitment fee of 0.15% per annum on the funds’ proportionate share of the unused portion of the Syndicated Credit Facility.
During the period, the funds were participants with other funds in the Fund Complex in a joint, unsecured, uncommitted $400 million line of credit (the Uncommitted Credit Facility), with State Street, which matured on September 28, 2023. On September 28, 2023, the Uncommitted Credit Facility was amended to run for a new 364 day period with the line of credit amount remaining unchanged, maturing on September 26, 2024. Under the terms of the Uncommitted Credit Facility, the investment adviser pays interest on the amount a fund borrows. There were no borrowings by any of the funds from either line of credit during the period.
The funds also have access to custodian overdraft facilities. A fund may have utilized the overdraft facility and incurred an interest expense, which is paid by the investment adviser. The interest expense is determined based on a negotiated rate above the current Federal Funds Rate.
Certain funds entered into futures contracts during the report period to manage the effects of interest rate changes. Refer to financial note 2(b) for the funds’ accounting policies with respect to futures contracts and financial note 3 for disclosures concerning the risks of investing in futures contracts.
As of December 31, 2023, the Statement of Assets and Liabilities included the following financial derivative instrument fair values, if any held at period end:
| | |
| | |
Schwab 5-10 Year Corporate Bond ETF | | |
| | |
| |
| Includes cumulative unrealized appreciation of futures contracts as reported in the fund’s Portfolio Holdings. Only current day’s variation margin on futures contracts is reported within the Statement of Assets and Liabilities. |
| | |
Schwab 5-10 Year Corporate Bond ETF | | |
| | |
| |
| Includes cumulative unrealized depreciation of futures contracts as reported in the fund’s Portfolio Holdings. Only current day’s variation margin on futures contracts is reported within the Statement of Assets and Liabilities. |
Schwab Fixed-Income ETFs | Annual Report193
Financial Notes (continued)
8. Derivatives (continued):
The effects of the derivative contracts held in the Statement of Operations for the period ended December 31, 2023, if any, were:
| | |
Net Realized Gains (Losses) | | |
Schwab 1-5 Year Corporate Bond ETF | | |
| | |
Schwab 5-10 Year Corporate Bond ETF | | |
| | |
| |
| Statement of Operations location: Net realized gains (losses) on futures contracts. |
Net Change in Unrealized Appreciation (Depreciation) | | |
Schwab 1-5 Year Corporate Bond ETF | | |
| | |
Schwab 5-10 Year Corporate Bond ETF | | |
| | |
| |
| Statement of Operations location: Net change in unrealized appreciation (depreciation) on futures contracts. |
During the period ended December 31, 2023, the month-end average notional amounts of futures contracts held by the funds and the month-end average number of contracts held were as follows:
| | |
| | |
Schwab Short-Term U.S. Treasury ETF | | |
Schwab Intermediate-Term U.S. Treasury ETF | | |
Schwab Long-Term U.S. Treasury ETF | | |
Schwab U.S. Aggregate Bond ETF | | |
Schwab 1-5 Year Corporate Bond ETF | | |
Schwab 5-10 Year Corporate Bond ETF | | |
194Schwab Fixed-Income ETFs | Annual Report
Financial Notes (continued)
9. Purchases and Sales/Maturities of Investment Securities:
For the period ended December 31, 2023, purchases and sales/maturities of securities (excluding in-kind transactions and short-term obligations) were as follows:
| PURCHASES OF LONG-TERM
U.S. GOVERNMENT
SECURITIES* | PURCHASES OF OTHER
LONG-TERM SECURITIES | TOTAL PURCHASES OF
LONG-TERM SECURITIES |
| | | |
Schwab Short-Term U.S. Treasury ETF | | | |
Schwab Intermediate-Term U.S. Treasury ETF | | | |
Schwab Long-Term U.S. Treasury ETF | | | |
Schwab U.S. Aggregate Bond ETF | | | |
Schwab 1-5 Year Corporate Bond ETF | | | |
Schwab 5-10 Year Corporate Bond ETF | | | |
| SALES/MATURITIES OF
LONG-TERM U.S. GOVERNMENT
SECURITIES* | SALES/MATURITIES OF
OTHER LONG-TERM SECURITIES | TOTAL SALES/MATURITIES OF
LONG-TERM SECURITIES |
| | | |
Schwab Short-Term U.S. Treasury ETF | | | |
Schwab Intermediate-Term U.S. Treasury ETF | | | |
Schwab Long-Term U.S. Treasury ETF | | | |
Schwab U.S. Aggregate Bond ETF | | | |
Schwab 1-5 Year Corporate Bond ETF | | | |
Schwab 5-10 Year Corporate Bond ETF | | | |
*
Includes securities guaranteed by U.S. Government Agencies.
10. In-Kind Transactions:The consideration for the purchase of Creation Units of a fund often consists of the in-kind deposit of a designated portfolio of fixed-income securities, which constitutes an optimized representation of the securities involved in the relevant fund’s underlying index, and an amount of cash. Investors purchasing and redeeming Creation Units are subject to a standard creation transaction fee and a standard redemption transaction fee paid to the custodian to offset transfer and other transaction costs associated with the issuance and redemption of Creation Units. Purchasers and redeemers of Creation Units for cash are subject to an additional variable charge paid to the fund that will offset the transaction costs to the fund of buying or selling portfolio securities. Variable charges paid to the fund generally have no effect on net asset value per share. In addition, purchasers and redeemers of shares in Creation Units are responsible for payment of the costs of transferring securities to or out of the fund. From time to time, the investment adviser may cover the cost of any transaction fees when believed to be in the best interests of the fund.
The in-kind transactions for the period ended December 31, 2023, were as follows:
| IN-KIND PURCHASES
OF SECURITIES | IN-KIND SALES
OF SECURITIES |
| | |
Schwab Short-Term U.S. Treasury ETF | | |
Schwab Intermediate-Term U.S. Treasury ETF | | |
Schwab Long-Term U.S. Treasury ETF | | |
Schwab U.S. Aggregate Bond ETF | | |
Schwab 1-5 Year Corporate Bond ETF | | |
Schwab 5-10 Year Corporate Bond ETF | | |
Schwab Fixed-Income ETFs | Annual Report195
Financial Notes (continued)
10. In-Kind Transactions (continued):
For the period ended December 31, 2023, the funds may realize net capital gains or losses resulting from in-kind redemptions of Creation Units. Because such gains or losses are not taxable to the funds and are not distributed to existing fund shareholders, the gains or losses are reclassified from accumulated net realized gains or losses to capital received from investors at the end of the funds’ tax year. These reclassifications have no effect on net assets or net asset values per share. The net realized gains or losses on sales of in-kind redemptions for the period ended December 31, 2023 are disclosed in the funds’ Statements of Operations, if any.
11. Federal Income Taxes:As of December 31, 2023, the tax basis cost of the funds’ investments and gross unrealized appreciation and depreciation were as follows:
| | GROSS UNREALIZED
APPRECIATION | GROSS UNREALIZED
DEPRECIATION | NET UNREALIZED
APPRECIATION
(DEPRECIATION) |
| | | | |
Schwab Short-Term U.S. Treasury ETF | | | | |
Schwab Intermediate-Term U.S. Treasury ETF | | | | |
Schwab Long-Term U.S. Treasury ETF | | | | |
Schwab U.S. Aggregate Bond ETF | | | | |
Schwab 1-5 Year Corporate Bond ETF | | | | |
Schwab 5-10 Year Corporate Bond ETF | | | | |
| | | | |
| | | | |
As of December 31, 2023, the components of distributable earnings on a tax basis were as follows:
| UNDISTRIBUTED
ORDINARY
INCOME | NET UNREALIZED
APPRECIATION
(DEPRECIATION)
ON INVESTMENTS | CAPITAL LOSS
CARRYFORWARDS
AND OTHER LOSSES | |
| | | | |
Schwab Short-Term U.S. Treasury ETF | | | | |
Schwab Intermediate-Term U.S. Treasury ETF | | | | |
Schwab Long-Term U.S. Treasury ETF | | | | |
Schwab U.S. Aggregate Bond ETF | | | | |
Schwab 1-5 Year Corporate Bond ETF | | | | |
Schwab 5-10 Year Corporate Bond ETF | | | | |
The primary difference between book basis and tax basis unrealized appreciation or unrealized depreciation of investments is the tax deferral of losses on wash sales. The tax cost of the funds’ investments, disclosed above, have been adjusted from their book amounts to reflect these unrealized appreciation or depreciation differences, as applicable.
Capital loss carryforwards have no expiration and may be used to offset future realized capital gains for federal income tax purposes. As of December 31, 2023, the funds had capital loss carryforwards as follows:
| |
| |
Schwab Short-Term U.S. Treasury ETF | |
Schwab Intermediate-Term U.S. Treasury ETF | |
Schwab Long-Term U.S. Treasury ETF | |
Schwab U.S. Aggregate Bond ETF | |
Schwab 1-5 Year Corporate Bond ETF | |
Schwab 5-10 Year Corporate Bond ETF | |
196Schwab Fixed-Income ETFs | Annual Report
Financial Notes (continued)
11. Federal Income Taxes (continued):
The tax basis components of distributions paid during the current and prior fiscal years were as follows:
| CURRENT FISCAL YEAR END DISTRIBUTIONS | PRIOR FISCAL YEAR END DISTRIBUTIONS |
| | |
| | |
Schwab Short-Term U.S. Treasury ETF | | |
Schwab Intermediate-Term U.S. Treasury ETF | | |
Schwab Long-Term U.S. Treasury ETF | | |
Schwab U.S. Aggregate Bond ETF | | |
Schwab 1-5 Year Corporate Bond ETF | | |
Schwab 5-10 Year Corporate Bond ETF | | |
Distributions paid to shareholders are based on net investment income and net realized gains determined on a tax basis, which may differ from net investment income and net realized gains for financial reporting purposes. These differences reflect the differing character of certain income items and net realized gains and losses for financial statement and tax purposes, and may result in reclassification among certain capital accounts in the financial statements. The funds may also designate a portion of the amount paid to redeeming shareholders as a distribution for tax purposes.
Permanent book and tax basis differences may result in reclassifications between components of net assets as required. The adjustments have no impact on net assets or the results of operations
As of December 31, 2023, management has reviewed the tax positions for open periods (for federal purposes, three years from the date of filing and for state purposes, four years from the date of filing) as applicable to the funds, and has determined that no provision for income tax is required in the funds’ financial statements. The funds recognize interest and penalties, if any, related to unrecognized tax benefits as income tax expense in the Statement of Operations. During the fiscal year ended December 31, 2023, the funds did not incur any interest or penalties.
Management has determined there are no subsequent events or transactions through the date the financial statements were issued that would have materially impacted the financial statements as presented.
Schwab Fixed-Income ETFs | Annual Report197
Report of Independent Registered Public Accounting Firm
To the Board of Trustees of Schwab Strategic Trust and Shareholders of Schwab U.S. TIPS ETF, Schwab Short-Term U.S. Treasury ETF, Schwab Intermediate-Term U.S. Treasury ETF, Schwab Long-Term U.S. Treasury ETF, Schwab U.S. Aggregate Bond ETF, Schwab 1-5 Year Corporate Bond ETF, and Schwab 5-10 Year Corporate Bond ETF:
Opinion on the Financial Statements and Financial Highlights
We have audited the accompanying statements of assets and liabilities, including the portfolio holdings, of Schwab U.S. TIPS ETF, Schwab Short-Term U.S. Treasury ETF, Schwab Intermediate-Term U.S. Treasury ETF, Schwab Long-Term U.S. Treasury ETF, Schwab U.S. Aggregate Bond ETF, Schwab 1-5 Year Corporate Bond ETF, and Schwab 5-10 Year Corporate Bond ETF (the “Funds”), seven of the funds constituting Schwab Strategic Trust, as of December 31, 2023, the related statements of operations for the year then ended, the statements of changes in net assets for each of the two years in the period then ended, the financial highlights for each of the four years in the period then ended, and the related notes. In our opinion, the financial statements and financial highlights present fairly in all material respects, the financial position of each of the Funds constituting Schwab Strategic Trust as of December 31, 2023, and the results of their operations for the year then ended, the changes in their net assets for each of the two years in the period then ended, and the financial highlights for each of the four years in the period then ended in conformity with accounting principles generally accepted in the United States of America. For each of the Funds, the financial highlights for the year ended December 31, 2019, except for Schwab Long-Term U.S. Treasury ETF, Schwab 1-5 Year Corporate Bond ETF, and Schwab 5-10 Year Corporate Bond ETF, the financial highlights for the period from October 10, 2019 to December 31, 2019, were audited by other auditors, whose report, dated February 18, 2020, expressed an unqualified opinion on such financial highlights.
These financial statements and financial highlights are the responsibility of the Funds’ management. Our responsibility is to express an opinion on the Funds’ financial statements and financial highlights based on our audits. We are a public accounting firm registered with the Public Company Accounting Oversight Board (United States) (PCAOB) and are required to be independent with respect to the Funds in accordance with the U.S. federal securities laws and the applicable rules and regulations of the Securities and Exchange Commission and the PCAOB.
We conducted our audits in accordance with the standards of the PCAOB. Those standards require that we plan and perform the audit to obtain reasonable assurance about whether the financial statements and financial highlights are free of material misstatement, whether due to error or fraud. The Funds are not required to have, nor were we engaged to perform, an audit of their internal control over financial reporting. As part of our audits, we are required to obtain an understanding of internal control over financial reporting but not for the purpose of expressing an opinion on the effectiveness of the Funds’ internal control over financial reporting. Accordingly, we express no such opinion.
Our audits included performing procedures to assess the risks of material misstatement of the financial statements and financial highlights, whether due to error or fraud, and performing procedures that respond to those risks. Such procedures included examining, on a test basis, evidence regarding the amounts and disclosures in the financial statements and financial highlights. Our audits also included evaluating the accounting principles used and significant estimates made by management, as well as evaluating the overall presentation of the financial statements and financial highlights. Our procedures included confirmation of securities owned as of December 31, 2023, by correspondence with the custodian and brokers; when replies were not received from brokers, we performed other auditing procedures. We believe that our audits provide a reasonable basis for our opinion.
Deloitte & Touche LLP
Denver, Colorado
February 16, 2024
We have served as the auditor of one or more investment companies in the Schwab Funds Complex since 2020.
198Schwab Fixed-Income ETFs | Annual Report
Other Federal Tax Information (unaudited)
For the fiscal year ended December 31, 2023, the funds designate the following percentage of income dividends as interest-related dividends eligible for exemption from U.S. withholding tax for nonresident aliens and foreign corporations:
| |
| |
Schwab Short-Term U.S. Treasury ETF | |
Schwab Intermediate-Term U.S. Treasury ETF | |
Schwab Long-Term U.S. Treasury ETF | |
Schwab U.S. Aggregate Bond ETF | |
Schwab 1-5 Year Corporate Bond ETF | |
Schwab 5-10 Year Corporate Bond ETF | |
For the fiscal year ended December 31, 2023, the funds designate the following percentage of dividend income as business interest income under section 163(j) of the Internal Revenue Code:
| |
| |
Schwab Short-Term U.S. Treasury ETF | |
Schwab Intermediate-Term U.S. Treasury ETF | |
Schwab Long-Term U.S. Treasury ETF | |
Schwab U.S. Aggregate Bond ETF | |
Schwab 1-5 Year Corporate Bond ETF | |
Schwab 5-10 Year Corporate Bond ETF | |
Schwab Fixed-Income ETFs | Annual Report199
Liquidity Risk Management Program (unaudited)
The funds have adopted and implemented a liquidity risk management program (the “program”) as required by Rule 22e-4 under the Investment Company Act of 1940, as amended. The funds’ Board of Trustees (the “Board”) has designated the funds’ investment adviser, Charles Schwab Investment Management, Inc., dba Schwab Asset Management, as the administrator of the program. Personnel of the investment adviser or its affiliates conduct the day-to-day operation of the program.
Under the program, the investment adviser manages a fund’s liquidity risk, which is the risk that the fund could not meet shareholder redemption requests without significant dilution of remaining shareholders’ interests in the fund. The program is reasonably designed to assess and manage a fund’s liquidity risk, taking into consideration the fund’s investment strategy and the liquidity of its portfolio investments during normal and reasonably foreseeable stressed conditions; its historical redemption history and shareholder concentrations; and its cash holdings and access to other funding sources, including the custodian overdraft facility and lines of credit. The investment adviser’s process of determining the degree of liquidity of each fund’s investments is supported by third-party liquidity assessment vendors.
The funds’ Board reviewed a report at its meeting held on September 19, 2023 prepared by the investment adviser regarding the operation and effectiveness of the program for the period June 1, 2022, through May 31, 2023, which included individual fund liquidity risk metrics. The report summarized the operation of the program and the information and factors considered by the investment adviser in assessing whether the program has been adequately and effectively implemented with respect to a fund. In addition, the investment adviser provided its assessment that the program had been operating effectively in managing each fund’s liquidity risk.
200Schwab Fixed-Income ETFs | Annual Report
Investment Advisory Agreement Approval
The Investment Company Act of 1940 (the 1940 Act), as amended, requires that a fund’s investment advisory agreement, including any amendments thereto, must be specifically approved (1) by the vote of the trustees or by a vote of the shareholders of the fund, and (2) by the vote of a majority of the trustees who are not parties to the investment advisory agreement or “interested persons” of any party thereto (the Independent Trustees), cast in person at a meeting called for the purpose of voting on such approval. In connection with such approvals, the fund’s trustees must request and evaluate, and the investment adviser is required to furnish, such information as may be reasonably necessary to evaluate the terms of the investment advisory agreement.
At a meeting held on September 20, 2023 (the Meeting), the Board, including a majority of the Independent Trustees, considered information specifically relating to a proposed amendment to the amended and restated investment advisory agreement (the Amended Agreement) between Schwab Strategic Trust (the Trust) and Charles Schwab Investment Management, Inc. (CSIM) with respect to the existing funds in the Trust, including Schwab U.S. TIPS ETF (the Fund), to reflect a reduction to the advisory fee paid by the Fund to
CSIM as compensation for CSIM’s services rendered to the Fund. The Board reviewed materials provided by CSIM relating to these changes, including a representation by CSIM that the changes will not result in any reduction in the nature and level of services provided to the Fund by CSIM. The Board also considered the information that the Board reviewed and the conclusions it reached at its May and June 2023 meetings (the Annual Meetings) in connection with its annual consideration and approval of the continuation of the Fund’s investment advisory agreement.
Based on the Trustees’ deliberation and their evaluation of the information described at the Meeting and the Annual Meetings, the Board, including a majority of the Independent Trustees, approved the amendment to the Amended Agreement with respect to the Fund effective September 25, 2023 and concluded that the compensation payable by the Fund to CSIM under the amendment to the Amended Agreement is fair and reasonable in light of the services CSIM renders to (and the expenses it bears relating to) the Fund and such other matters as the Trustees considered to be relevant in the exercise of their reasonable judgment.
Schwab Fixed-Income ETFs | Annual Report201
Trustees and Officers
The tables below give information about the trustees and officers of Schwab Strategic Trust, which includes the funds covered in this report. The “Fund Complex” includes The Charles Schwab Family of Funds, Schwab Capital Trust, Schwab Investments, Schwab Annuity Portfolios, Schwab Strategic Trust and Laudus Trust. The Fund Complex includes 106 funds.
The address for all trustees and officers is 211 Main Street, San Francisco, CA 94105. You can find more information about the trustees and officers in the Statement of Additional Information, which is available free by calling 1-877-824-5615.
|
Name, Year of Birth, and Position(s) with the trust (Terms of office, and length of Time Served1) | Principal Occupations During the Past Five Years | Number of Portfolios in Fund Complex Overseen by the Trustee | |
Michael J. Beer 1961 Trustee (Trustee of The Charles Schwab Family of Funds, Schwab Investments, Schwab Capital Trust, Schwab Annuity Portfolios, Schwab Strategic Trust and Laudus Trust since 2022) | Retired. Director, President and Chief Executive Officer (Dec. 2016 – Sept. 2019), Principal Funds (investment management). | | Director (2016 – 2019), Principal Funds, Inc. |
Robert W. Burns 1959 Trustee (Trustee of Schwab Strategic Trust since 2009; The Charles Schwab Family of Funds, Schwab Investments, Schwab Capital Trust, Schwab Annuity Portfolios and Laudus Trust since 2016) | Retired/Private Investor. | | |
Nancy F. Heller 1956 Trustee (Trustee of The Charles Schwab Family of Funds, Schwab Investments, Schwab Capital Trust, Schwab Annuity Portfolios, Schwab Strategic Trust and Laudus Trust since 2018) | | | |
David L. Mahoney 1954 Trustee (Trustee of The Charles Schwab Family of Funds, Schwab Investments, Schwab Capital Trust, Schwab Annuity Portfolios and Laudus Trust since 2011; Schwab Strategic Trust since 2016) | | | Director (2004 – present), Corcept Therapeutics Incorporated Director (2009 – 2021), Adamas Pharmaceuticals, Inc. Director (2003 – 2019), Symantec Corporation |
Jane P. Moncreiff 1961 Trustee (Trustee of The Charles Schwab Family of Funds, Schwab Investments, Schwab Capital Trust, Schwab Annuity Portfolios, Schwab Strategic Trust and Laudus Trust since 2019) | Consultant (2018 – present), Fulham Advisers LLC (management consulting); Chief Investment Officer (2009 – 2017), CareGroup Healthcare System, Inc. (healthcare). | | |
202Schwab Fixed-Income ETFs | Annual Report
Independent Trustees (continued) |
Name, Year of Birth, and Position(s) with the trust (Terms of office, and length of Time Served1) | Principal Occupations During the Past Five Years | Number of Portfolios in Fund Complex Overseen by the Trustee | |
Kimberly S. Patmore 1956 Trustee (Trustee of The Charles Schwab Family of Funds, Schwab Investments, Schwab Capital Trust, Schwab Annuity Portfolios, Schwab Strategic Trust and Laudus Trust since 2016) | Consultant (2008 – present), Patmore Management Consulting (management consulting). | | |
J. Derek Penn 1957 Trustee (Trustee of The Charles Schwab Family of Funds, Schwab Investments, Schwab Capital Trust, Schwab Annuity Portfolios, Schwab Strategic Trust and Laudus Trust since 2021) | Head of Equity Sales and Trading (2006 – 2018), BNY Mellon (financial services). | | |
|
Name, Year of Birth, and Position(s) with the trust (Terms of office, and length of Time Served1) | Principal Occupations During the Past Five Years | Number of Portfolios in Fund Complex Overseen by the Trustee | |
Walter W. Bettinger II2 1960 Chairman and Trustee (Trustee of The Charles Schwab Family of Funds, Schwab Investments, Schwab Capital Trust and Schwab Annuity Portfolios since 2008; Schwab Strategic Trust since 2009; Laudus Trust since 2010) | Co-Chairman of the Board (July 2022 – present), Director and Chief Executive Officer (Oct. 2008 – present) and President (Feb. 2007 – Oct. 2021), The Charles Schwab Corporation; President and Chief Executive Officer (Oct. 2008 – Oct. 2021) and Director (May 2008 – Oct. 2021), Charles Schwab & Co., Inc.; Co-Chairman of the Board (July 2022 – present) and Director (Apr. 2006 – present), Charles Schwab Bank, SSB; Co-Chairman of the Board (July 2022 – present) and Director (Nov. 2017 – present), Charles Schwab Premier Bank, SSB; Co-Chairman of the Board (July 2022 – present) and Director (July 2019 – present), Charles Schwab Trust Bank; Director (May 2008 – present), Chief Executive Officer (Aug. 2017 – present) and President (Aug. 2017 – Nov. 2021), Schwab Holdings, Inc.; Manager (Sept. 2023 – present), TD Ameritrade Holding LLC; Director (Oct. 2020 – Aug. 2023), TD Ameritrade Holding Corporation; Director (July 2016 – Oct. 2021), Charles Schwab Investment Management, Inc. | | Director (2008 – present), The Charles Schwab Corporation |
Richard A. Wurster2 1973 Trustee (Trustee of The Charles Schwab Family of Funds, Schwab Investments, Schwab Capital Trust, Schwab Annuity Portfolios, Schwab Strategic Trust and Laudus Trust since 2022) | President (Oct. 2021 – present) and Executive Vice President – Schwab Asset Management Solutions (Apr. 2019 – Oct. 2021), The Charles Schwab Corporation; President, Director (Oct. 2021 – present), Executive Vice President – Schwab Asset Management Solutions (July 2019 – Oct. 2021) and Senior Vice President – Advisory (May 2016 – July 2019), Charles Schwab & Co., Inc.; President (Nov. 2021 – present), Schwab Holdings, Inc.; Director (Oct. 2021 – present) and Chief Executive Officer (Nov. 2019 – Jan. 2022), Charles Schwab Investment Management, Inc.; Director, Chief Executive Officer and President (Mar. 2018 – Oct. 2022), Charles Schwab Investment Advisory, Inc.; Chief Executive Officer (July 2016 – Apr. 2018) and President (Mar. 2017 – Apr. 2018), ThomasPartners, Inc.; Chief Executive Officer (July 2016 – Apr. 2018), Windhaven Investment Management, Inc. | | |
Schwab Fixed-Income ETFs | Annual Report203
|
Name, Year of Birth, and Position(s) with the trust (Terms of office, and length of Time Served3) | Principal Occupations During the Past Five Years |
Omar Aguilar 1970 Chief Executive Officer, President and Chief Investment Officer (Officer of The Charles Schwab Family of Funds, Schwab Investments, Schwab Capital Trust, Schwab Annuity Portfolios, Schwab Strategic Trust and Laudus Trust since 2011) | Chief Executive Officer (Jan. 2022 – present), President (Oct. 2023 – present), (Chief Investment Officer (Apr. 2011 – present) and Senior Vice President (Apr. 2011 – Jan. 2022), Charles Schwab Investment Management, Inc.; Director, Chief Executive Officer and President (Oct. 2022 – present), Charles Schwab Investment Advisory, Inc.; Chief Executive Officer (Sept. 2023 – present), President (Oct. 2023 – present), Chief Investment Officer (June 2011 – present) and Vice President (June 2011 – Sept. 2023), Schwab Funds, Laudus Trust and Schwab ETFs. |
Mark Fischer 1970 Chief Operating Officer (Officer of The Charles Schwab Family of Funds, Schwab Investments, Schwab Capital Trust, Schwab Annuity Portfolios, Schwab Strategic Trust and Laudus Trust since 2013) | Chief Operating Officer (Dec. 2020 – present) and Treasurer and Chief Financial Officer (Jan. 2016 – Dec. 2022), Schwab Funds, Laudus Trust and Schwab ETFs; Chief Financial Officer (Mar. 2020 – present), Chief Operating Officer (Oct. 2023 – present), Managing Director (Mar. 2023 – present) and Vice President (Oct. 2013 – Mar. 2023), Charles Schwab Investment Management, Inc. |
Dana Smith 1965 Treasurer and Chief Financial Officer (Officer of The Charles Schwab Family of Funds, Schwab Investments, Schwab Capital Trust, Schwab Annuity Portfolios, Schwab Strategic Trust and Laudus Trust since 2023) | Treasurer and Chief Financial Officer (Jan. 2023 – present) and Assistant Treasurer (Dec. 2015 – Dec. 2022), Schwab Funds, Laudus Trust and Schwab ETFs; Managing Director (Mar. 2023 – present), Vice President (Mar. 2022 – Mar. 2023) and Director (Oct. 2015 – Mar. 2022), Charles Schwab Investment Management, Inc.; Managing Director (May 2022 – present) and Vice President (Apr. 2022 – May 2022), Charles Schwab & Co., Inc. |
Patrick Cassidy 1964 Vice President and Chief Investment Officer (Officer of The Charles Schwab Family of Funds, Schwab Investments, Schwab Capital Trust, Schwab Annuity Portfolios, Schwab Strategic Trust and Laudus Trust since 2018) | Chief Investment Officer (Oct. 2023 – present) and Vice President (Feb. 2018 – present), Schwab Funds, Laudus Trust and Schwab ETFs; Managing Director (Mar. 2023 – present), Chief Investment Officer (Oct. 2023 – present), and Senior Vice President (Oct. 2012 – Mar. 2023), Charles Schwab Investment Management, Inc. |
William P. McMahon, Jr. 1972 Vice President and Chief Investment Officer (Officer of The Charles Schwab Family of Funds, Schwab Investments, Schwab Capital Trust, Schwab Annuity Portfolios, Schwab Strategic Trust and Laudus Trust since 2021) | Managing Director (Mar. 2023 – present), Senior Vice President (Jan. 2020 – Mar. 2023) and Chief Investment Officer (Jan. 2020 – present) Charles Schwab Investment Management, Inc.; Vice President and Chief Investment Officer (June 2021 – present), Schwab Funds, Laudus Trust and Schwab ETFs; Senior Vice President and Chief Investment Officer – ThomasPartners Strategies (Apr. 2018 – Dec. 2019), Charles Schwab Investment Advisory, Inc.; Senior Vice President and Chief Investment Officer (May 2001 – Apr. 2018), ThomasPartners, Inc. |
Catherine MacGregor 1964 Chief Legal Officer and Secretary, Schwab Funds and Schwab ETFs Chief Legal Officer, Vice President and Clerk, Laudus Trust (Officer of The Charles Schwab Family of Funds, Schwab Investments, Schwab Capital Trust, Schwab Annuity Portfolios and Laudus Trust since 2005; Schwab Strategic Trust since 2009) | Chief Legal Officer (Mar. 2022 – present), Managing Director (Mar. 2023 – present) and Vice President (Sept. 2005 – Mar. 2023), Charles Schwab Investment Management, Inc.; Managing Director (May 2022 – present) and Vice President (Aug. 2005 – May 2022), Charles Schwab & Co., Inc.; Vice President (Dec. 2005 – present) and Chief Legal Officer and Clerk (Mar. 2007 – present), Laudus Trust; Chief Legal Officer and Secretary (Oct. 2021 – present), Vice President (Nov. 2005 – Oct. 2021) and Assistant Secretary (June 2007 – Oct. 2021), Schwab Funds; Chief Legal Officer and Secretary (Oct. 2021 – present), Vice President and Assistant Secretary (Oct. 2009 – Oct. 2021), Schwab ETFs. |
1
Each Trustee shall hold office until the election and qualification of his or her successor, or until he or she dies, resigns or is removed. The retirement policy requires that each independent trustee retire by December 31 of the year in which the Trustee turns 74 or the Trustee’s twentieth year of service as an independent trustee on any trust in the Fund Complex, whichever occurs first.
2
Mr. Bettinger and Mr. Wurster are Interested Trustees. Mr. Bettinger and Mr. Wurster are Interested Trustees because each owns stock of The Charles Schwab Corporation (CSC), the parent company of Charles Schwab Investment Management, Inc., the investment adviser for the trusts in the Fund Complex, and is an employee of Charles Schwab & Co., Inc. (Schwab), the principal underwriter for The Charles Schwab Family of Funds, Schwab Investments, Schwab Capital Trust, Schwab Annuity Portfolios and Laudus Trust.
3
The President, Treasurer and Secretary/Clerk hold office until their respective successors are chosen and qualified or until he or she sooner dies, resigns, is removed or becomes disqualified. Each of the other officers serves at the pleasure of the Board.
204Schwab Fixed-Income ETFs | Annual Report
ask See “offer.”
asset allocation The practice of dividing a portfolio among different asset classes, with each asset class assigned a particular percentage to help offset risks and rewards, based on your goals, time horizon and risk tolerance.
asset-backed securities Bond or other debt securities that represent ownership in a pool of assets such as credit card debt.
asset class A group of securities with similar structure and basic characteristics. Stocks, bonds and cash are the three main examples of asset classes.
authorized participant (AP) A large institutional investor that places orders for creation units with the funds’ distributor.
bid The highest price at which someone is willing to buy a security.
Bloomberg US 1–5 Year Corporate Bond Index An index that measures the performance of U.S. investment grade, taxable corporate bonds with maturities greater than or equal to one year and less than five years that have $300 million or more of outstanding face value. The securities in the index must be denominated in U.S. dollars and must be fixed-rate. The index includes securities publicly issued by U.S. and non-U.S. industrial, utility and financial issuers. The index excludes certain types of securities, including contingent capital securities, inflation-linked bonds, floating-rate issues, taxable and tax-exempt municipal securities, structured notes and pass-through certificates. The index is market capitalization weighted and the securities in the index are updated on the last business day of each month.
Bloomberg US 5–10 Year Corporate Bond Index An index that measures the performance of U.S. investment grade, taxable corporate bonds with maturities greater than or equal to five years and less than ten years that have $300 million or more of outstanding face value. The securities in the index must be denominated in U.S. dollars and must be fixed-rate. The index includes securities publicly issued by U.S. and non-U.S. industrial, utility and financial issuers. The index excludes certain types of securities, including contingent capital securities, inflation-linked bonds, floating-rate bonds, taxable and tax-exempt municipal securities, structured notes and pass-through certificates. The index is market capitalization weighted and the securities in the index are updated on the last business day of each month.
Bloomberg US Aggregate Bond Index An index that is a broad-based benchmark measuring the performance of the U.S. investment grade, taxable bond market, including U.S. Treasuries, government-related and corporate bonds, mortgage pass-through securities, commercial mortgage-backed securities, and asset-backed securities that are publicly available for sale in the United States. To be eligible for inclusion in the index, securities must be fixed rate, non-convertible, U.S. dollar-denominated with at least $300 million or more of outstanding face value and have one or more years remaining to maturity. The index excludes certain types of securities, including tax-exempt state and local government series bonds, structured notes embedded with swaps or other special features, private placements, floating rate securities, inflation-linked bonds and Eurobonds. The index is market capitalization weighted and the securities in the index are updated on the last business day of each month.
Bloomberg US Long Treasury Index An index that includes all publicly issued, U.S. Treasury securities that have a remaining maturity of ten or more years, are rated investment grade, and have $300 million or more of outstanding face value. The securities in the index must be denominated in U.S. dollars and must be fixed-rate and non-convertible. The index excludes U.S. Treasury stripped securities. The index is market capitalization weighted and the securities in the index are updated on the last business day of each month.
Bloomberg US Treasury 1–3 Year Index An index which includes all publicly-issued U.S. Treasury securities that have a remaining maturity of greater than or equal to one year and less than three years, are rated investment grade, and have $300 million or more of outstanding face value. The securities in the index must be denominated in U.S. dollars and must be fixed-rate and non-convertible. The index excludes state and local government series bonds and coupon issues that have been stripped from bonds. The index is market capitalization weighted and the securities in the index are updated on the last business day of each month.
Bloomberg US Treasury 3–10 Year Index An index which includes all publicly-issued U.S. Treasury securities that have a remaining maturity of greater than or equal to three years and less than ten years, are rated investment grade, and have $300 million or more of outstanding face value. The securities in the index must be denominated in U.S. dollars and must be fixed-rate and non-convertible. The index excludes state and local government series bonds and coupon issues that have been stripped from bonds. The index is market capitalization weighted and the securities in the index are updated on the last business day of each month.
Bloomberg US Treasury Inflation-Linked Bond Index (Series-L) An index which includes all publicly-issued U.S. Treasury Inflation-Protected Securities (TIPS) that have at least one year remaining to maturity, are rated investment grade and have $500 million or more of outstanding face value. The TIPS in the index must be denominated in U.S. dollars and must be fixed-rate and non-convertible. The index is market capitalization weighted and the TIPS in the index are updated on the last business day of each month. TIPS are publicly issued, dollar denominated U.S. Government securities issued by the U.S. Treasury that have principal and interest payments linked to an official inflation measure (as measured by the Consumer Price Index, or CPI) and their payments are supported by the full faith and credit of the United States.
bond A security representing a loan from the investor to the issuer. A bond typically pays interest at a fixed rate (the “coupon rate”) until a specified date (the “maturity date”), at which time the issuer returns the money borrowed (“principal” or “face value”) to the bondholder. Because of their structure, bonds are sometimes called “fixed income securities” or “debt securities.”
call An early repayment of a bond’s principal by the issuer, usually done because the issuer is able to refinance its bond debt at a lower rate.
call protection A term used in reference to a bond that cannot be called by the issuer before maturity, or at least for many years from the present date. A bond that offers call protection can more reliably be expected to provide a given yield over a given number of years than a bond that could be called (assuming both bonds are of the same credit quality).
capital gain, capital loss The difference between the amount paid for an investment and its value at a later time. If the investment has been sold, the capital gain or loss is considered a realized gain or loss. If the investment is still held, the gain or loss is still “on paper” and is considered unrealized.
commencement of operations The date that the first NAV was calculated.
coupon, coupon rate The annual rate of interest paid until maturity by the issuer of a debt security.
Schwab Fixed-Income ETFs | Annual Report205
creation unit (C.U.) A basket of securities that is delivered by an authorized participant (AP) to the fund equal to the current holdings of the ETF, plus a designated cash component. In return, the APs receive a large block of ETF shares (typically 50,000 shares), which investors can then buy and sell in the secondary market.
credit quality The capacity of an issuer to make its interest and principal payments; an assessment typically rendered by an independent third-party organization.
credit risk The risk that a bond issuer may be unable to pay interest or principal to its bondholders.
duration A measure of an individual bond’s sensitivity to interest rates, expressed in years. Calculations of duration generally take into account the bond’s yield, interest payments, maturity date and call features.
weighted average duration A measure of the duration of all bonds in a fund’s portfolio, also expressed in years, based on the market value weighted average duration of each bond in the portfolio.
exchange A marketplace, or any organization or group that provides or maintains a marketplace for trading securities, options, futures, or commodities.
expense ratio The amount that is taken from the fund’s assets each year to cover the operating expenses. An expense ratio of 0.50% means that a fund’s expenses amount to half of one percent of its average net assets a year.
face value The value of a bond, note, mortgage or other security as given on the certificate or instrument. Face value is also referred to as par value or nominal value.
inception date The date that the shares began trading in the secondary market.
indicative optimized portfolio value (IOPV) A calculation disseminated by the stock exchange that approximates the fund’s NAV every 15 seconds throughout the trading day.
interest Payments to bondholders (usually made twice a year) as compensation for loaning the bond principal to the issuer.
interest rate risk The risk that a bond’s value will fluctuate if market interest rates change or are expected to change. Bond prices tend to move in the opposite direction of interest rates: when interest rates rise, bond prices tend to fall.
liquidity The ability to convert a security or asset quickly into cash.
market price return The return based on the change in market price per share of the fund over a given time period. Market price returns assume that dividends and capital gain distributions have been reinvested in the fund at market price.
maturity The maturity of a bond will generally be determined using a portfolio security’s final maturity date (date on which the final principal payment of a bond is scheduled to be paid); however, for securitized products, such as mortgage-backed securities and certain other asset-backed securities, maturity will be determined on an average life basis (weighted average time to receipt of all principal payments) by the investment adviser. Because pre-payment rates of individual mortgage pools vary widely, the average life of a particular pool cannot be predicted precisely. For securities with embedded demand features, such as puts or calls, either the demand date or the final maturity date will be used depending on interest rates, yields and other market conditions. The weighted average maturity (WAM) of a fund is dollar-weighted based upon the market value of a fund’s securities at the time of the calculation.
mortgage-backed securities Bond or other debt securities that represent ownership in a pool of mortgage loans.
net asset value (NAV) The value of one share of a fund. NAV is calculated by taking the fund’s total assets, subtracting liabilities, and dividing by the number of shares outstanding.
NAV return The return based on the change in NAV of the fund over a given time period. NAV returns assume that dividends and capital gain distributions have been reinvested in the fund.
offer (ask) The lowest price at which an individual is willing to sell a security.
open The price at which a security opened for trading on a given day.
outstanding shares, shares outstanding When speaking of the fund, indicates all shares currently held by investors.
prepayment risk The risk that a mortgage-backed security may be paid off early, typically because interest rates have fallen and the homeowners who hold the underlying mortgages have refinanced those mortgages at lower rates. In this type of situation, the investor who held the mortgage-backed security will usually have to settle for a lower rate when reinvesting the principal.
primary market The market that deals with the issuance of new securities.
replication If a fund uses a full replication method, the fund will invest substantially all of its assets proportionately in the securities included in the underlying index.
sampling If a fund uses a sampling method, the fund will not fully replicate the underlying index and may hold securities not included in the index. A fund that utilizes a sampling approach may not track the return of the index as closely as a fund that uses a full replication method.
secondary market The market in which investors purchase securities from other investors rather than directly from the issuing companies. Organized exchanges facilitate the trading of securities in the secondary market.
spread The gap between bid and ask prices of a security.
total return The percentage that an investor would have earned or lost on an investment in the fund assuming dividends and distributions were reinvested.
tracking error The difference between the performance of the fund and its benchmark index, positive or negative.
Treasury inflation protected security (TIPS) A United States Treasury bond whose principal increases at the same rate as the Consumer Price Index (CPI).The interest payment is then calculated off that inflated (adjusted) principal and repaid at maturity.
weighted average For mutual funds or ETFs, an average that gives the same weight to each security as the security represents in the fund’s portfolio.
yield The income paid out by an investment, expressed as a percentage of the investment’s market value.
yield to maturity The annualized rate of return a bondholder could expect if the bond were held to maturity. In addition to interest payments, yield to maturity also factors in any difference between a bond’s current price and its principal amount, or face value.
206Schwab Fixed-Income ETFs | Annual Report
Schwab ETFs
Schwab ETFs are designed to serve as simple low-cost core investment products for a diversified portfolio. These ETFs seek to provide consistent, repeatable performance through a variety of investment strategies that span the equity and fixed income spectrum. The list below shows all currently available Schwab ETFs.
Investors should carefully consider information contained in the prospectus, or if available, the summary prospectus, including investment objectives, risks, charges and expenses before investing. Please call 1-877-824-5615 for a prospectus for any Schwab ETF. Please read the prospectus carefully before you invest. This report must be preceded or accompanied by a current prospectus.
Proxy Voting Policies, Procedures and Results
A description of the proxy voting policies and procedures used to determine how to vote proxies on behalf of the funds is available without charge, upon request, by visiting the Schwab ETFs’ website at www.schwabassetmanagement.com/schwabetfs_prospectus, the SEC’s website at www.sec.gov, or by contacting Schwab ETFs at 1-877-824-5615.
Information regarding how a fund voted proxies relating to portfolio securities during the most recent twelve-month period ended June 30 is available, without charge, by visiting the fund’s website at www.schwabassetmanagement.com/schwabetfs_prospectus or the SEC’s website at www.sec.gov.
U.S. ETFs
Schwab U.S. Broad Market ETF
Schwab 1000 Index® ETF
Schwab U.S. Large-Cap ETF
Schwab U.S. Large-Cap Growth ETF
Schwab U.S. Large-Cap Value ETF
Schwab U.S. Mid-Cap ETF
Schwab U.S. Small-Cap ETF
Schwab U.S. Dividend Equity ETF
Schwab U.S. REIT ETF
Schwab International Dividend Equity ETF
Schwab International Equity ETF
Schwab International Small-Cap Equity ETF
Schwab Emerging Markets Equity ETF
Schwab U.S. TIPS ETF
Schwab Short-Term U.S. Treasury ETF
Schwab Intermediate-Term U.S. Treasury ETF
Schwab Long-Term U.S. Treasury ETF
Schwab U.S. Aggregate Bond ETF
Schwab 1-5 Year Corporate Bond ETF
Schwab 5-10 Year Corporate Bond ETF
Schwab Municipal Bond ETF
Schwab High Yield Bond ETF
Fundamental Index* ETFs
Schwab Fundamental U.S. Broad Market Index ETF
Schwab Fundamental U.S. Large Company Index ETF
Schwab Fundamental U.S. Small Company Index ETF
Schwab Fundamental International Large Company Index ETF
Schwab Fundamental International Small Company Index ETF
Schwab Fundamental Emerging Markets Large Company
Index ETF
Active, Semi-Transparent (Also Known As Non-Transparent) ETF
Schwab Ariel ESG ETF
Schwab Crypto Thematic ETF
Charles Schwab Investment Management, Inc., dba Schwab Asset Management
211 Main Street, San Francisco, CA 94105
1-877-824-5615
© 2024 Charles Schwab Investment Management, Inc., dba Schwab Asset Management. All rights reserved.
Printed on recycled paper.
*
FUNDAMENTAL INDEX is a registered trademark of Research Affiliates LLC.
The Schwab Ariel ESG ETF is different from traditional ETFs. Traditional ETFs tell the public what assets they hold each day. This fund will not. This may create additional risks for your investment. For example:
•
You may have to pay more money to trade the fund’s shares. This fund will provide less information to traders, who tend to charge more for trades when they have less information.
•
The price you pay to buy fund shares on an exchange may not match the value of the fund’s portfolio. The same is true when you sell shares. These price differences may be greater for this fund compared to other ETFs because it provides less information to traders.
•
These additional risks may be even greater in bad or uncertain market conditions.
•
The ETF will publish on its website each day a “Proxy Portfolio” designed to help trading in shares of the ETF. While the Proxy Portfolio includes some of the ETF’s holdings, it is not the ETF’s actual portfolio.
The differences between this fund and other ETFs may also have advantages. By keeping certain information about the fund secret, this fund may face less risk that other traders can predict or copy its investment strategy. This may improve the fund’s performance. If other traders are able to copy or predict the fund’s investment strategy, however, this may hurt the fund’s performance.
For additional information regarding the unique attributes and risks of the fund, see Proxy Portfolio Risk, Premium/Discount Risk, Trading Halt Risk, Authorized Participant Concentration Risk, Tracking Error Risk and Shares of the Fund May Trade at Prices Other Than NAV in the Principal Risks and Proxy Portfolio and Proxy Overlap sections of the prospectus and/or the Statement of Additional Information. These risks are discussed on the next page.
Active semi-transparent (also referred to as non-transparent) ETFs operate differently from other exchange-traded funds (ETFs). Unlike other ETFs, an active semi-transparent ETF does not publicly disclose its entire portfolio composition each business day, which may affect the price at which shares of the ETF trade in the secondary market. Active semi-transparent ETFs have limited public trading history. There can be no assurance that an active trading market will develop, be maintained or operate as intended. There is a risk that the market price of an active semi-transparent ETF may vary significantly from the ETF’s net asset value and that its shares may trade at a wider bid/ask spread and, therefore, cost investors more to trade than shares of other ETFs. These risks are heightened during periods of market disruption or volatility.
Proxy Portfolio Risk: Unlike traditional ETFs, this fund does not disclose its portfolio holdings (Actual Portfolio) daily. The fund instead posts a Proxy Portfolio on its website each day. The Proxy Portfolio is designed to reflect the economic exposures and risk characteristics of the fund’s actual holdings on each trading day, but it is not the same as the fund’s Actual Portfolio. Although the Proxy Portfolio is intended to provide investors with enough information to allow for an effective arbitrage mechanism that will keep the market price of the Fund at or close to the underlying NAV per Share of the Fund, there is a risk (which may increase during periods of market disruption or volatility) that market prices will vary significantly from the underlying NAV of the fund. ETF trading on the basis of a published Proxy Portfolio may trade at a wider bid/ask spread than ETFs that publish their portfolios on a daily basis, especially during periods of market disruption or volatility, and therefore may cost investors more to trade. Also, while the Fund seeks to benefit from keeping its portfolio information secret, market participants may attempt to use the Proxy Portfolio to identify a Fund’s trading strategy, which if successful, could result in such market participants engaging in certain predatory trading practices that may have the potential to harm the Fund and its shareholders.
Proxy Portfolio Construction: The Proxy Portfolio is designed to recreate the daily performance of the Actual Portfolio. This is achieved by performing a “Factor Model” analysis of the Actual Portfolio. The Factor Model is comprised of three sets of factors or analytical metrics: market-based factors, fundamental factors, and industry/sector factors. The fund uses a “Model Universe” to generate its Proxy Portfolio. The Model Universe is comprised of securities that the fund can purchase and will be a financial index or stated portfolio of securities from which fund investments will be selected. The results of the Factor Model analysis are then applied to the Model Universe. The Proxy Portfolio is then generated as a result of this Model Universe analysis with the Proxy Portfolio being a small sub-set of the Model Universe. The Factor Model is applied to both the Actual Portfolio and the Model Universe to construct the fund’s Proxy Portfolio that performs in a manner substantially identical to the performance of its Actual Portfolio. The Proxy Portfolio will only include investments the fund is permitted to hold. The fund’s SAI contains more information on the Proxy Portfolio and its construction.
Proxy Portfolio and Proxy Overlap Information regarding the contents of the Proxy Portfolio, and the percentage weight overlap between the holdings of the Proxy Portfolio and the fund’s Actual Portfolio holdings that formed the basis for its calculation of NAV at the end of the prior Business Day (the Portfolio Overlap), is available by visiting the fund’s website www.schwabassetmanagement.com.
Because environmental, social and governance (ESG) strategies exclude some securities, ESG-focused products may not be able to take advantage of the same opportunities or market trends as products that do not use such strategies. Additionally, the criteria used to select companies for investment may result in investing in securities, industries or sectors that underperform the market as a whole.
This page is intentionally left blank.
Annual Report | December 31, 2023
Schwab Municipal Bond ETF
No Action Required – Notice Regarding Shareholder Report Delivery |
Beginning on July 24, 2024, fund shareholder reports will be streamlined to highlight key information deemed important for investors to assess and monitor their fund investments. Other information, including financial statements, will not appear in the streamlined shareholder reports but will available online and delivered free of charge upon request. |
• If you already receive the full shareholder reports, you will receive the streamlined shareholder reports in the same way that you currently receive the full shareholder reports (either in paper or electronically). |
• If you currently receive a notification when a shareholder report is available on a fund’s website, beginning July 24, 2024, you will begin to receive the streamlined shareholder report (in paper). |
This page is intentionally left blank.
Fund investment adviser: Charles Schwab Investment Management, Inc., dba Schwab Asset Management®
Distributor: SEI Investments Distribution Co. (SIDCO)
Schwab Municipal Bond ETF | Annual Report1
Schwab Municipal Bond ETF
The performance data quoted represents past performance. Past performance does not guarantee future results. Investment returns and principal value of an investment will fluctuate so that an investor’s shares, when sold or redeemed, may be worth more or less than the original cost. Current performance may be lower or higher than the performance data quoted. To obtain performance information current to the most recent month end, please visit www.schwabassetmanagement.com/schwabetfs_prospectus.
Total Returns for the 12 Months Ended December 31, 2023 |
Schwab Municipal Bond ETF (Ticker Symbol: SCMB) | |
| |
| |
ICE AMT-Free Core U.S. National Municipal Index | |
ETF Category: Morningstar Muni National Interm2 | |
| |
All total returns on this page assume dividends and distributions were reinvested. Index figures do not include trading and management costs, which would lower performance. Indices are unmanaged and cannot be invested in directly. Performance results less than one year are not annualized.
For index definitions, please see the Glossary.
Performance does not reflect the deduction of taxes that a shareholder would pay on fund distributions or on the redemption or sale of fund shares.
Shares are bought and sold at market price, which may be higher or lower than the net asset value (NAV). Brokerage commissions will reduce returns.
Fixed-income securities are subject to increased loss of principal during periods of rising interest rates. An investment in the fund is not insured or guaranteed by the Federal Deposit Insurance Corporation (FDIC) or any other government agency.
“ICE®” is a registered trademark of ICE Data Indices, LLC or its affiliates. This trademark has been licensed, along with the ICE AMT-Free Core U.S. National Municipal Index (“Index”) for use by Charles Schwab Investment Management, Inc., dba Schwab Asset Management, in connection with the Schwab Municipal Bond ETF. The Schwab Municipal Bond ETF is not sponsored, endorsed, sold or promoted by ICE Data Indices, LLC, its affiliates or its Third Party Suppliers (“ICE Data and its Suppliers”). ICE Data and its Suppliers make no representations or warranties regarding the advisability of investing in the Schwab Municipal Bond ETF.
1
ETF performance must be shown based on both a Market Price and a NAV basis. The fund’s per share NAV is the value of one share of the fund. NAV is calculated by taking the fund’s total assets (including the fair value of securities owned), subtracting liabilities, and dividing by the number of shares outstanding. The NAV Return is based on the NAV of the fund, and the Market Price Return is based on the market price per share of the fund. The price used to calculate market return (Market Price) is determined using the Official Closing Price of the primary stock exchange (generally, 4:00 p.m. Eastern time) and may not represent the returns you would receive if shares were traded at other times. Market Price and NAV returns assume that dividends and capital gain distributions have been reinvested in the fund at Market Price and NAV, respectively.
2
Source for category information: Morningstar, Inc. The Morningstar Category return represents all passively- and actively-managed ETFs and mutual funds within the category as of the report date.
2Schwab Municipal Bond ETF | Annual Report
Schwab Municipal Bond ETF
The Investment Environment
For the 12-month reporting period ended December 31, 2023, U.S. fixed-income markets rebounded from their losses in 2022. Inflation remained elevated, the U.S. Federal Reserve (Fed) continued to raise interest rates, and the failure of three U.S. regional banks between early March and early May raised concerns about the stability of the banking sector. As the year wore on, inflation began to ease, as did the likelihood of further rate increases. Outside the United States, the ongoing war between Russia and Ukraine and the Israel-Hamas war that broke out following Hamas’ attack on Israel in early October weighed on the global economy. U.S. Treasury yields soared during the period, peaking in October before falling sharply over the final two months of the year. For the reporting period, the ICE AMT-Free Core U.S. National Municipal Index returned 6.20%. The Bloomberg Municipal Bond Index, which measures the performance of the broader U.S. municipal bond market, returned 6.40%. For comparison to taxable bonds, the Bloomberg US Aggregate Bond Index, representing the broad U.S. bond market, returned 5.53%.
Municipal (muni) bond market returns were volatile over much of the reporting period. The supply of new issue muni bonds was the lowest in five years, as higher rates led to jumps in short-term financing costs. Demand remained tepid over much of the reporting period, particularly as the 10-year U.S. Treasury yield neared 5% in October, driving prices to reporting-period lows. (Bond yields and bond prices typically move in opposite directions.) Over the last two months of the year, as the likelihood of further rate hikes waned and U.S. Treasury yields retreated, demand rose, driving prices sharply higher.
The U.S. economy continued to show unexpected resiliency over the reporting period. Surprisingly robust job growth and strong consumer spending helped propel U.S. gross domestic product (GDP) to a 4.9% annualized growth rate for the third quarter of 2023, up from roughly 2% for the prior three quarters. Inflation remained above the Fed’s historical 2% target over the reporting period but declined in the first half of the year, as rents and wage growth eased, profit margins declined, and monetary policy remained restrictive, before ticking up slightly in July through September, declining again in October through November, and then ticking up again in December. The unemployment rate remained low throughout the reporting period.
Yields of U.S. Treasury Securities: Effective Yields of Three-Month, Two-Year and 10-Year Treasuries
Index figures assume dividends and distributions were reinvested. Index figures do not include trading and management costs, which would lower performance. Indices are unmanaged and cannot be invested in directly. Performance results less than one year are not annualized. Past performance is not an indication of future results.
For index definitions, please see the Glossary.
Data source: Bloomberg L.P.
Nothing in this report represents a recommendation of a security by the investment adviser.
Management views may have changed since the report date.
Schwab Municipal Bond ETF | Annual Report3
Schwab Municipal Bond ETF
The Investment Environment (continued)
In its efforts to lower inflation, the Fed raised interest rates four times between January and July, increasing the federal funds rate from a range of 4.25% to 4.50% to a range of 5.25% to 5.50%. At its meetings in June, September, October, and December, the Fed maintained the then current rates citing robust economic activity, strong—though moderating—job gains, and low unemployment while acknowledging tighter financial and credit conditions for households and businesses. The Fed also maintained its program to reduce the assets held on its balance sheet, though its balance sheet temporarily spiked in March when the Fed supported banks after the failure of two U.S. regional banks (a third U.S. regional bank failed in early May). Despite that spike, the Fed’s balance sheet assets declined over the reporting period.
4Schwab Municipal Bond ETF | Annual Report
Schwab Municipal Bond ETF
| Jason D. Diefenthaler, Managing Director and Head of Tax-Exempt Strategies for Schwab Asset Management, is responsible for the day-to-day co-management of the fund and for developing, managing, and implementing Schwab Asset Management’s tax-exempt fixed income investment strategies, including separately managed accounts, actively managed mutual funds, and exchange-traded funds (ETFs).Mr. Diefenthaler also leads the portfolio management team for the Wasmer SchroederTM Municipal Bond Strategies and is responsible for the day-to-day co-management of several tax-free Schwab Funds. Previously, Mr. Diefenthaler was the director of tax-exempt portfolio management at Wasmer Schroeder & Company, LLC (Schwab Asset Management became the investment adviser for Wasmer Schroeder Strategies in 2020). He oversaw all tax-exempt strategies and management of the Wasmer Schroeder High Yield Municipal Fund, which subsequently reorganized into the Schwab Opportunistic Municipal Bond Fund. Mr. Diefenthaler began his career with Wasmer Schroeder in 2000. He was a credit analyst before becoming a portfolio manager. |
| Matthew Hastings, CFA, Managing Director and Head of Bond Strategies for Schwab Asset Management, is responsible for the day-to-day co-management of the fund. Mr. Hastings leads the portfolio management team for the Schwab Taxable Bond Funds and Schwab Fixed-Income ETFs. He also has overall responsibility for all aspects of the management of the funds. Prior to joining Schwab in 1999, Mr. Hastings was in fixed-income sales and trading at Lehman Brothers. He has worked in the fixed-income securities industry since 1996. |
| Steven Hung, Senior Portfolio Manager for Schwab Asset Management, is responsible for the day-to-day co-management of the fund. He is primarily responsible for the management and oversight of corporate bonds, within the taxable bond strategies, with additional responsibility for managing municipal bond index strategies. Mr. Hung has been a portfolio manager with Schwab Asset Management since 2005 and prior to that, served in various roles as an associate portfolio manager and trader since 1999. In 1998, he joined Charles Schwab & Co.’s management training program and worked as a clerk on the options trading floor of the Pacific Coast Stock Exchange. |
| John Khodarahmi, Senior Portfolio Manager for Schwab Asset Management, is responsible for the day-to-day co-management of the fund. He is a member of the team responsible for management of the Schwab Tax-Free Bond Funds. Prior to joining Schwab in 2015, Mr. Khodarahmi was a vice president and senior municipal trader at Eaton Vance Management for the firm’s tax-free bond funds. Previous to Eaton Vance, he was a vice president and portfolio manager at both Banc of America Montgomery Securities and Thomas Weisel Partners, managing corporate cash and high net worth portfolios. Prior to those roles, Mr. Khodarahmi was a municipal trader and underwriter for Fleet Securities, Inc. (now part of Bank of America). |
Schwab Municipal Bond ETF | Annual Report5
Schwab Municipal Bond ETF
The Schwab Municipal Bond ETF’s (the fund) goal is to track as closely as possible, before fees and expenses, the total return of an index that measures the performance of the U.S. AMT-free municipal bond market. To pursue its goal, the fund generally invests in securities that are included in the ICE AMT-Free Core U.S. National Municipal Index (the index). For more information about the fund’s investment objective, strategy, and risks, please see the fund’s prospectus.
Market Highlights. For the 12-month reporting period ended December 31, 2023, U.S. fixed-income markets rebounded from their losses in 2022. Inflation remained elevated, the U.S. Federal Reserve (Fed) continued to raise interest rates, and the failure of three U.S. regional banks between early March and early May raised concerns about the stability of the banking sector. As the year wore on, inflation began to ease, as did the likelihood of further rate increases. In its efforts to lower inflation, the U.S. Federal Reserve (Fed) raised interest rates four times between January and July, increasing the federal funds rate from a range of 4.25% to 4.50% to a range of 5.25% to 5.50%. At its meetings in June, September, October, and December, the Fed maintained the then current rates citing robust economic activity, strong—though moderating—job gains, and low unemployment while acknowledging tighter financial and credit conditions for households and businesses. The Fed also maintained its program to reduce the assets held on its balance sheet, though its balance sheet temporarily spiked in March when the Fed supported banks after the failure of two U.S. regional banks (a third U.S. regional bank failed in early May). Despite that spike, the Fed’s balance sheet assets declined over the reporting period.
Municipal bond market returns were volatile over much of the reporting period. The supply of new issue municipal bonds was the lowest in five years, as higher rates led to jumps in short-term financing costs. Demand remained tepid over much of the reporting period, particularly as U.S. Treasury yields peaked in October, with the 10-year U.S. Treasury yield nearing 5%, driving prices to reporting-period lows. (Bond yields and bond prices typically move in opposite directions.) Over the last two months of the year, as the likelihood of further rate hikes waned and U.S. Treasury yields retreated, demand rose, driving prices sharply higher. Lower-rated investment grade municipal bonds tended to outperform AAA and AA rated municipal bonds.
Performance. Over the 12-month reporting period, the fund generally tracked the performance of the index. For the 12 months ended December 31, 2023, the fund’s market price return was 5.86% and its NAV return was 5.87% (for an explanation of market price and NAV returns, please refer to footnote 2 on the following page). The index returned 6.20% for the same period. Differences between the return of the fund and the return of the index may be attributable to, among other things, operational and transactional costs incurred by the fund and not the index. Both positive price returns and coupon income generated by the fund’s holdings contributed to fund performance.
Portfolio Composition % of Investments1
By Security Type
Weighted Average Maturity2 | |
Weighted Average Duration2 | |
Management views and portfolio holdings may have changed since the report date.
An index is a statistical composite of a specified financial market or sector. Unlike the fund, an index does not actually hold a portfolio of securities and its return is not inclusive of operational and transaction costs incurred by the fund.
Fixed-income securities are subject to increased loss of principal during periods of rising interest rates. An investment in the fund is not insured or guaranteed by the Federal Deposit Insurance Corporation (FDIC) or any other government agency.
1
The percentage may differ from the Portfolio Holdings because the above calculation is based on a percentage of total investments, whereas the calculation in the Portfolio Holdings is based on a percentage of net assets.
2
See Glossary for definitions of maturity and duration.
6Schwab Municipal Bond ETF | Annual Report
Schwab Municipal Bond ETF
Performance and Fund Facts as of December 31, 2023
The performance data quoted represents past performance. Past performance does not guarantee future results. Investment returns and principal value of an investment will fluctuate so that an investor’s shares, when sold or redeemed, may be worth more or less than the original cost. Current performance may be lower or higher than the performance data quoted. To obtain performance information current to the most recent month end, please visit www.schwabassetmanagement.com/schwabetfs_prospectus.
Performance of Hypothetical $10,000 Investment (October 12, 2022 – December 31, 2023)1
Average Annual Total Returns1
| | |
Fund: Schwab Municipal Bond ETF (10/12/22) | | |
| | |
| | |
ICE AMT-Free Core U.S. National Municipal Index | | |
ETF Category: Morningstar Muni National Interm3 | | |
Fund Expense Ratio4: 0.03% |
All total returns on this page assume dividends and distributions were reinvested. Index figures do not include trading and management costs, which would lower performance. Indices are unmanaged and cannot be invested in directly. Performance results less than one year are not annualized.
For index definitions, please see the Glossary.
Shares are bought and sold at market price, which may be higher or lower than the net asset value (NAV). Brokerage commissions will reduce returns.
“ICE®” is a registered trademark of ICE Data Indices, LLC or its affiliates. This trademark has been licensed, along with the ICE AMT-Free Core U.S. National Municipal Index (“Index”) for use by Charles Schwab Investment Management, Inc., dba Schwab Asset Management, in connection with the Schwab Municipal Bond ETF. The Schwab Municipal Bond ETF is not sponsored, endorsed, sold or promoted by ICE Data Indices, LLC, its affiliates or its Third Party Suppliers (“ICE Data and its Suppliers”). ICE Data and its Suppliers make no representations or warranties regarding the advisability of investing in the Schwab Municipal Bond ETF.
*
Inception (10/12/22) represents the date that the shares began trading in the secondary market.
1
Performance does not reflect the deduction of taxes that a shareholder would pay on fund distributions or on the redemption or sale of fund shares.
2
ETF performance must be shown based on both a Market Price and a NAV basis. The fund’s per share NAV is the value of one share of the fund. NAV is calculated by taking the fund’s total assets (including the fair value of securities owned), subtracting liabilities, and dividing by the number of shares outstanding. The NAV Return is based on the NAV of the fund, and the Market Price Return is based on the market price per share of the fund. The price used to calculate market return (Market Price) is determined using the Official Closing Price of the primary stock exchange (generally, 4:00 p.m. Eastern time) and may not represent the returns you would receive if shares were traded at other times. NAV is used as a proxy for purposes of calculating Market Price Return on inception date. Market Price and NAV returns assume that dividends and capital gain distributions have been reinvested in the fund at Market Price and NAV, respectively.
3
Source for category information: Morningstar, Inc. The Morningstar Category return represents all passively- and actively-managed ETFs and mutual funds within the category as of the report date.
4
As stated in the prospectus.
Schwab Municipal Bond ETF | Annual Report7
Schwab Municipal Bond ETF
Fund Expenses (Unaudited)
Examples for a $1,000 Investment
As a fund shareholder, you may incur two types of costs: (1) transaction costs, including brokerage commissions on purchases and sales of fund shares; and, (2) ongoing costs, including management fees.
The expense examples below are intended to help you understand your ongoing cost (in dollars) of investing in the fund and to compare this cost with the ongoing cost of investing in other mutual funds. These examples are based on an investment of $1,000 invested for six months beginning July 1, 2023 and held through December 31, 2023.
The Actual Return line in the table below provides information about actual account values and actual expenses. You may use this information, together with the amount you invested, to estimate the expenses that you paid over the period. To do so, simply divide your account value by $1,000 (for example, an $8,600 account value ÷ $1,000 = 8.6), then multiply the result by the number given for the fund under the heading entitled “Expenses Paid During Period.”
The Hypothetical Return line in the table below provides information about hypothetical account values and hypothetical expenses based on the fund’s actual expense ratio and an assumed return of 5% per year before expenses. Because the return used is not an actual return, it may not be used to estimate the actual ending account value or expenses you paid for the period.
You may use this information to compare the ongoing costs of investing in the fund and other funds. To do so, compare this 5% hypothetical example with the 5% hypothetical examples that appear in the shareholder reports of the other funds.
Please note that the expenses shown in the table are meant to highlight your ongoing costs only and do not reflect any transactional costs, including any brokerage commissions you may pay when purchasing or selling shares of a fund. Therefore, the hypothetical return line of the table is useful in comparing ongoing costs only and will not help you determine the relative total costs of owning different funds. In addition, if these transactional costs were included, your costs would have been higher.
| | BEGINNING
ACCOUNT VALUE
AT 7/1/23 | ENDING
ACCOUNT VALUE
(NET OF EXPENSES)
AT 12/31/23 | EXPENSES PAID
DURING PERIOD
|
Schwab Municipal Bond ETF | | | | |
| | | | |
| | | | |
| Based on the most recent six-month expense ratio. |
| Expenses for the fund are equal to its annualized expense ratio, multiplied by the average account value over the period, multiplied by 184 days in the period, and divided by 365 days in the fiscal year. |
8Schwab Municipal Bond ETF | Annual Report
Schwab Municipal Bond ETF
Financial Statements
| | | | | | |
|
Net asset value at beginning of period | | | | | | |
Income (loss) from investment operations: | | | | | | |
Net investment income (loss)2 | | | | | | |
Net realized and unrealized gains (losses) | | | | | | |
Total from investment operations | | | | | | |
| | | | | | |
Distributions from net investment income | | | | | | |
| | | | | | |
Net asset value at end of period | | | | | | |
| | | | | | |
|
Ratios to average net assets: | | | | | | |
| | | | | | |
Net investment income (loss) | | | | | | |
| | | | | | |
Net assets, end of period (x 1,000) | | | | | | |
| Commencement of operations. |
| Calculated based on the average shares outstanding during the period. |
| |
| |
| Portfolio turnover rate excludes securities received or delivered from processing of in-kind creations or redemptions. |
Schwab Municipal Bond ETF | Annual Report9
Schwab Municipal Bond ETF
Portfolio Holdings as of December 31, 2023
This section shows all the securities in the fund’s portfolio and their values as of the report date.
The fund files its complete schedule of portfolio holdings with the U.S. Securities and Exchange Commission (SEC) for the first and third quarters of each fiscal year on Form N-PORT Part F. The fund’s Form N-PORT Part F is available on the SEC’s website at www.sec.gov. You can also obtain this information at no cost on the fund’s website at www.schwabassetmanagement.com/schwabetfs_prospectus, by calling 1-866-414-6349, or by sending an email request to orders@mysummaryprospectus.com. The fund also makes available its complete schedule of portfolio holdings 15 to 20 days after the end of the month on the fund’s website.
Based on index eligibility requirements, securities must have a fixed coupon schedule (including zero coupon bonds), the rate shown is the interest rate. The index excludes certain types of securities, including, among others, step coupon securities, taxable municipal securities, floating rate notes and variable rate demand obligations or notes. The maturity date shown for all the securities is the final legal maturity.
ISSUER TYPE OF SECURITY, SERIES | | | | |
MUNICIPAL SECURITIES 98.9% OF NET ASSETS |
|
Alabama Federal Aid Highway Finance Auth |
Special Obligation RB Series 2017A | | | | |
Special Obligation Refunding RB Series 2017B | | | | |
Alabama Public School & College Auth |
Refunding RB Series 2020A | | | | |
Refunding RB Series 2020A | | | | |
Refunding RB Series 2020A | | | | |
Alabama State Corrections Institution Finance Auth |
| | | | |
Birmingham Water Works Board |
Water Refunding RB Series 2015A | | | | |
Tuscaloosa City Board of Education Capital Outlay Warrants |
School Tax Warrants Series 2016 | | | | |
| | | | |
|
|
Solid Waste Refunding RB Series 2022A | | | | |
|
|
Refunding COP Series 20019A | | | | |
Arizona Health Facilities Auth |
RB (Banner Health) Series 2014A | | | | |
Glendale Municipal Property Corp |
Sub Excise Tax Refunding RB Series 2012C | | | | |
|
| | | | |
|
Utility Systems RB Series 2019A | | | | |
Phoenix Civic Improvement Corp |
Jr Lien Airport RB Series 2019A | | | | |
Phoenix Civic Improvement Corp Wastewater Sub |
Jr Lien Wastewater System RB Series 2023 | | | | |
|
| | | | |
10Schwab Municipal Bond ETF | Annual Report
Schwab Municipal Bond ETF
Portfolio Holdings as of December 31, 2023 (continued)
ISSUER TYPE OF SECURITY, SERIES | | | | |
Salt River Project Agricultural Improvement & Power District |
Electric System RB Series 2017A | | | | |
Electric System RB Series 2019A | | | | |
Electric System RB Series 2019A | | | | |
Electric System RB Series 2021A | | | | |
Electric System RB Series 2023A | | | | |
Electric System Refunding RB Series 2016A | | | | |
| | | | |
|
|
GO Refunding & Construction Bonds | | | | |
|
Facilities RB Series 2021A | | | | |
| | | | |
|
Alameda Cnty Transportation Commission |
Sr Sales Tax RB Series 2022 | | | | |
Alameda Corridor Transportation Auth |
2nd Sub Lien Refunding RB Series 2016B | | | | |
2nd Sub Lien Refunding RB Series 2022C | | | | |
Sub Lien Refunding RB Series 2004A | | | | |
Anaheim Public Financing Auth |
Sub Lease RB Series 1997C | | | | |
|
Sub Toll Bridge RB Series 2014S6 | | | | |
Sub Toll Bridge RB Series 2017S7 | | | | |
Sub Toll Bridge RB Series 2017S7 | | | | |
Sub Toll Bridge RB Series 2017S7 | | | | |
Sub Toll Bridge RB Series 2017S7 | | | | |
|
| | | | |
|
| | | | |
| | | | |
| | | | |
| | | | |
| | | | |
| | | | |
| | | | |
| | | | |
| | | | |
| | | | |
| | | | |
| | | | |
| | | | |
| | | | |
| | | | |
| | | | |
Schwab Municipal Bond ETF | Annual Report11
Schwab Municipal Bond ETF
Portfolio Holdings as of December 31, 2023 (continued)
ISSUER TYPE OF SECURITY, SERIES | | | | |
| | | | |
| | | | |
| | | | |
| | | | |
| | | | |
| | | | |
| | | | |
| | | | |
| | | | |
| | | | |
| | | | |
| | | | |
| | | | |
| | | | |
| | | | |
| | | | |
| | | | |
| | | | |
| | | | |
| | | | |
| | | | |
| | | | |
| | | | |
| | | | |
| | | | |
| | | | |
| | | | |
| | | | |
| | | | |
| | | | |
| | | | |
| | | | |
| | | | |
| | | | |
| | | | |
| | | | |
| | | | |
| | | | |
| | | | |
| | | | |
| | | | |
| | | | |
| | | | |
| | | | |
| | | | |
| | | | |
| | | | |
| | | | |
| | | | |
| | | | |
12Schwab Municipal Bond ETF | Annual Report
Schwab Municipal Bond ETF
Portfolio Holdings as of December 31, 2023 (continued)
ISSUER TYPE OF SECURITY, SERIES | | | | |
| | | | |
| | | | |
| | | | |
| | | | |
| | | | |
| | | | |
| | | | |
| | | | |
| | | | |
| | | | |
| | | | |
| | | | |
| | | | |
| | | | |
| | | | |
| | | | |
California Dept of Water Resources |
Water System RB Series AS | | | | |
Water System RB Series BB | | | | |
Water System RB Series BF | | | | |
Water System RB Series BF | | | | |
California Educational Facilities Auth |
RB (Loma Linda Univ) Series 2017A | | | | |
RB (Santa Clara Univ) Series 2015 | | | | |
RB (Stanford Univ) Series U7 | | | | |
RB (Stanford Univ) Series V1 | | | | |
RB (Stanford Univ) Series V2 | | | | |
RB (Stanford Univ) Series V3 | | | | |
California Infrastructure & Economic Development Bank |
Clean Water & Drinking Water RB Series 2023 | | | | |
Clean Water State Revolving Funds RB Series 2018 | | | | |
RB (UCSF 2130 3rd St) Series 2017 | | | | |
RB (UCSF 2130 3rd St) Series 2017 | | | | |
California Public Works Board |
Lease RB (Dept of Corrections & Rehabilitation) Series 2014A | | | | |
| | | | |
| | | | |
| | | | |
Lease Refunding RB Series 2021A | | | | |
Lease Refunding RB Series 2022A | | | | |
California School Finance Auth |
GO RB (Azusa USD) Series 2009A | | | | |
|
| | | | |
| | | | |
| | | | |
| | | | |
| | | | |
| | | | |
| | | | |
Schwab Municipal Bond ETF | Annual Report13
Schwab Municipal Bond ETF
Portfolio Holdings as of December 31, 2023 (continued)
ISSUER TYPE OF SECURITY, SERIES | | | | |
Cerritos California Community College District |
| | | | |
|
| | | | |
| | | | |
GO Refunding Bonds Series 2015 | | | | |
|
| | | | |
|
| | | | |
East Bay Municipal Utility District |
Water System Refunding RB Series 2014B | | | | |
Foothill Eastern Transportation Corridor Agency |
| | | | |
Sr Lien Refunding RB Series 2021A | | | | |
| | | | |
Toll Road Refunding RB Series 2013B2 | | | | |
Golden State Tobacco Securitization Corp |
| | | | |
Grossmont Healthcare District |
GO Refunding Bonds Series 2015D | | | | |
|
| | | | |
|
| | | | |
| | | | |
|
Sub Refunding RB Series 2018B | | | | |
|
| | | | |
| | | | |
| | | | |
GO Refunding Bonds Series 2015A | | | | |
GO Refunding Bonds Series 2015C | | | | |
GO Refunding Bonds Series 2016 | | | | |
Los Angeles Cnty Metropolitan Transportation Auth |
1st Tier Sr Sales Tax RB Series 2017A | | | | |
Jr Sub Sales Tax Refunding RB Series 2020A1 | | | | |
Jr Sub Sales Tax Refunding RB Series 2020A3 | | | | |
Jr Sub Sales Tax Refunding RB Series 2020A3 | | | | |
Sales Tax Sr RB Series 2017A | | | | |
Sr Sales Tax RB Series 2021A | | | | |
Los Angeles Cnty Public Works Financing Auth |
| | | | |
Los Angeles Dept of Airports |
| | | | |
Sr Refunding RB Series 2020A | | | | |
| | | | |
Sub Refunding RB Series 2021B | | | | |
Sub Refunding RB Series 2021B | | | | |
14Schwab Municipal Bond ETF | Annual Report
Schwab Municipal Bond ETF
Portfolio Holdings as of December 31, 2023 (continued)
ISSUER TYPE OF SECURITY, SERIES | | | | |
Los Angeles Dept of Water & Power |
Power System RB Series 2015A | | | | |
Power System RB Series 2017A | | | | |
Power System RB Series 2019D | | | | |
Power System RB Series 2020A | | | | |
Power System RB Series 2020A | | | | |
Power System RB Series 2020B | | | | |
Power System RB Series 2021B | | | | |
Power System RB Series 2021B | | | | |
Power System RB Series 2021C | | | | |
Power System RB Series 2022A | | | | |
Power System RB Series 2022C | | | | |
Power System RB Series 2022E | | | | |
Water System RB Series 2018A | | | | |
Water System RB Series 2020A | | | | |
Water System RB Series 2022B | | | | |
Water System RB Series 2023A | | | | |
Water System RB Series 2023A | | | | |
Water System Refunding RB Series 2022C | | | | |
Los Angeles Municipal Improvement Corp |
Lease Refunding RB Series 2016B | | | | |
Lease Refunding RB Series 2016B | | | | |
|
| | | | |
| | | | |
| | | | |
| | | | |
| | | | |
| | | | |
| | | | |
| | | | |
GO Refunding Bonds Series 2014C | | | | |
GO Refunding Bonds Series 2014C | | | | |
GO Refunding Bonds Series 2016B | | | | |
GO Refunding Bonds Series 2017A | | | | |
GO Refunding Bonds Series 2019A | | | | |
Marin Healthcare District |
| | | | |
|
| | | | |
|
| | | | |
Orange Cnty Transportation Auth |
| | | | |
|
| | | | |
Peninsula Corridor Joint Powers Board |
Sales Tax RB Series 2022A | | | | |
|
GO Bonds (San Diego County) Series B | | | | |
Schwab Municipal Bond ETF | Annual Report15
Schwab Municipal Bond ETF
Portfolio Holdings as of December 31, 2023 (continued)
ISSUER TYPE OF SECURITY, SERIES | | | | |
|
| | | | |
Riverside Cnty Public Finance Auth |
| | | | |
Riverside Cnty Transportation Commission |
Toll Sr Lien Refunding RB Series 2021B1 | | | | |
|
| | | | |
|
Sr TOT RB (Convention Center Complex) Series 2018A | | | | |
|
Airport System Sub Refunding RB Series 2016B | | | | |
Sacramento Cnty Sanitation District Financing Auth |
| | | | |
Sacramento Municipal Utility District |
| | | | |
| | | | |
|
| | | | |
San Diego Assoc of Governments |
Capital Grant Receipts RB (Mid Coast Corridor Transit) Series 2019A | | | | |
|
| | | | |
GO Refunding Bonds Series 2016 | | | | |
San Diego Cnty Regional Airport Auth |
Sub Airport RB Series 2021A | | | | |
Sub Airport Refunding RB Series 2019A | | | | |
San Diego Cnty Regional Transportation Commission |
Sales Tax RB Series 2016A | | | | |
Sales Tax RB Series 2023A | | | | |
San Diego Cnty Water Auth |
Water Refunding RB Series 2021B | | | | |
Water Refunding RB Series 2021B | | | | |
San Diego Public Facilities Financing Auth |
| | | | |
Sub Sewer RB Series 2022A | | | | |
Water Sub RB Series 2018A | | | | |
|
| | | | |
| | | | |
| | | | |
| | | | |
| | | | |
GO Refunding Bonds Series 2012R1 | | | | |
GO Refunding Bonds Series 2016SR1 | | | | |
Go Refunding Bonds Series R5 | | | | |
|
Wastewater RB Series 2021A | | | | |
16Schwab Municipal Bond ETF | Annual Report
Schwab Municipal Bond ETF
Portfolio Holdings as of December 31, 2023 (continued)
ISSUER TYPE OF SECURITY, SERIES | | | | |
San Francisco Airport Commission |
| | | | |
| | | | |
| | | | |
Refunding RB 2nd Series 2019D | | | | |
San Francisco Bay Area Rapid Transit District |
| | | | |
| | | | |
San Francisco Municipal Transportation Agency |
| | | | |
San Francisco Public Utilities Commission |
Wastewater RB Series 2018A | | | | |
| | | | |
Water Refunding RB Series 2016A | | | | |
Water Refunding RB Series 2023C | | | | |
San Joaquin Hills Transportation Corridor Agency Toll |
| | | | |
Toll Road Refunding RB Series 1997A | | | | |
|
Airport Refunding RB Series 2017B | | | | |
Wastewater RB Series 2022B | | | | |
San Jose Redevelopment Agency Successor |
Tax Refunding Bonds Series 2017A | | | | |
|
| | | | |
| | | | |
San Mateo Cnty Jt Powers Financing Auth |
| | | | |
|
ULT GO Bonds Series 2020B | | | | |
|
GO Refunding Bonds Series 2017C | | | | |
Santa Clara Valley Transportation Auth |
Sales Tax Refunding RB Series 2023A | | | | |
|
| | | | |
Southern California Metropolitan Water District |
| | | | |
Sub Water Refunding RB Series 2017A | | | | |
Sub Water Refunding RB Series 2017A | | | | |
Southern California Public Power Auth |
Sub Refunding RB Series 2015C | | | | |
|
| | | | |
|
| | | | |
|
| | | | |
Schwab Municipal Bond ETF | Annual Report17
Schwab Municipal Bond ETF
Portfolio Holdings as of December 31, 2023 (continued)
ISSUER TYPE OF SECURITY, SERIES | | | | |
|
| | | | |
| | | | |
| | | | |
| | | | |
| | | | |
| | | | |
| | | | |
| | | | |
| | | | |
| | | | |
| | | | |
Limited Project RB Series 2017M | | | | |
Limited Project RB Series 2018O | | | | |
Limited Project RB Series 2021Q | | | | |
| | | | |
| | | | |
| | | | |
|
GO Refunding Bonds Series 2015 | | | | |
Washington Township Health Care District |
| | | | |
| | | | |
|
|
1st Lien Water Refunding RB Series 2016 | | | | |
|
| | | | |
| | | | |
| | | | |
| | | | |
Colorado High Performance Transportation Enterprise |
| | | | |
Colorado Regional Transportation District |
| | | | |
Sales Tax RB Series 2016A | | | | |
Sales Tax Refunding RB Series 2021B | | | | |
|
Utilities System Refunding RB Series 2022A | | | | |
Colorado State Building Excellent Schools Today |
| | | | |
|
Airport System RB Series 2022C | | | | |
Dedicated Tax Refunding RB Series 2016A | | | | |
GO Refunding Bonds Series 2020B | | | | |
| | | | |
|
| | | | |
18Schwab Municipal Bond ETF | Annual Report
Schwab Municipal Bond ETF
Portfolio Holdings as of December 31, 2023 (continued)
ISSUER TYPE OF SECURITY, SERIES | | | | |
E-470 Public Highway Auth |
| | | | |
| | | | |
| | | | |
|
| | | | |
|
| | | | |
|
| | | | |
|
| | | | |
| | | | |
|
|
| | | | |
| | | | |
| | | | |
| | | | |
| | | | |
| | | | |
| | | | |
| | | | |
| | | | |
| | | | |
| | | | |
| | | | |
| | | | |
GO Refunding Bonds Series 2022D | | | | |
GO Refunding Bonds Series 2022D | | | | |
GO Refunding Bonds Series 2022G | | | | |
Special Tax Obligation Bonds Series 2015A | | | | |
Special Tax Obligation Bonds Series 2016A | | | | |
Special Tax Obligation Bonds Series 2018A | | | | |
Special Tax Obligation Bonds Series 2018A | | | | |
Special Tax Obligation Bonds Series 2020A | | | | |
Special Tax Obligation Bonds Series 2020A | | | | |
Special Tax Obligation Bonds Series 2020A | | | | |
Special Tax Obligation Bonds Series 2021A | | | | |
Special Tax Obligation Bonds Series 2021D | | | | |
Special Tax Obligation Bonds Series 2022A | | | | |
Transportation RB Series 2016A | | | | |
Transportation RB Series 2020A | | | | |
Transportation Special Tax Obligation Bonds Series 2018B | | | | |
Connecticut Health & Educational Facilities Auth |
RB (Sacred Heart Univ) Series I1 | | | | |
| | | | |
Schwab Municipal Bond ETF | Annual Report19
Schwab Municipal Bond ETF
Portfolio Holdings as of December 31, 2023 (continued)
ISSUER TYPE OF SECURITY, SERIES | | | | |
|
Delaware Transportation Auth |
| | | | |
DISTRICT OF COLUMBIA 1.6% |
|
| | | | |
| | | | |
| | | | |
| | | | |
GO Refunding Bonds Series 2017A | | | | |
GO Refunding Bonds Series 2023B | | | | |
Income Tax Secured RB Series 2019A | | | | |
Income Tax Secured RB Series 2019A | | | | |
Income Tax Secured RB Series 2022A | | | | |
Income Tax Secured RB Series 2022A | | | | |
Income Tax Secured Refunding RB Series 2022C | | | | |
Refunding RB (Georgetown Univ) Series 2017 | | | | |
Refunding RB Series 2020B | | | | |
District of Columbia Water & Sewer Auth Sub Board |
Public Utility Sub Lien RB Series 2019A | | | | |
Metropolitan Washington Airports Auth |
2nd Sr Lien RB Series 2009C | | | | |
Sub Lien Refunding RB Series 2019B | | | | |
Toll Road 2nd Sr Lien Refunding RB Series 2022A | | | | |
Washington Metropolitan Transit Auth |
| | | | |
| | | | |
| | | | |
| | | | |
| | | | |
|
|
Airport System RB Series 2012Q1 | | | | |
Water & Sewer Utility RB Series 2019A | | | | |
|
| | | | |
Central Florida Expressway Auth |
Sr Lien Refunding RB Series 2016B | | | | |
Sr Lien Refunding RB Series 2016B | | | | |
Sr Lien Refunding RB Series 2016B | | | | |
Sr Lien Refunding RB Series 2017 | | | | |
Sr Lien Refunding RB Series 2021 | | | | |
|
| | | | |
Florida Insurance Assistance Interlocal Agency |
Insurance Assessment RB Series 2023A1 | | | | |
Florida Municipal Power Agency |
Power Supply Refunding RB Series 2016A | | | | |
20Schwab Municipal Bond ETF | Annual Report
Schwab Municipal Bond ETF
Portfolio Holdings as of December 31, 2023 (continued)
ISSUER TYPE OF SECURITY, SERIES | | | | |
Florida State Board of Education |
Lottery Refunding RB Series 2017A | | | | |
Public Education Capital Outlay Refunding Bonds Series 2021A | | | | |
Public Education Capital Outlay Refunding Bonds Series 2021B | | | | |
Public Education Capital Outlay Refunding Bonds Series 2022C | | | | |
Public Education Refunding Bonds Series 2022C | | | | |
Florida State Turnpike Auth |
| | | | |
|
Utility System Refunding RB Series 2019A | | | | |
Fort Pierce Utilities Authority |
Utilities Refunding RB Series 2022A | | | | |
|
Utilities System RB Series 2019A | | | | |
|
| | | | |
Hillsborough Cnty Aviation Auth |
| | | | |
|
Electric System Sub RB Series 2017B | | | | |
|
| | | | |
|
Water & Sewer Refunding RB Series 2017 | | | | |
|
Facilities Tax RB Series 2009C | | | | |
GO Refunding Bonds Series 2015B | | | | |
| | | | |
| | | | |
Refunding RB Series 2009A | | | | |
Water & Sewer System RB Series 2019B | | | | |
Water & Sewer System RB Series 2021 | | | | |
Water & Sewer System RB Series 2021 | | | | |
Water & Sewer System Refunding RB Series 2015 | | | | |
Water & Sewer System Refunding RB Series 2015 | | | | |
Miami-Dade Cnty Educational Facilities Auth |
Refunding RB (Univ of Miami) Series 2015A | | | | |
Miami-Dade Cnty Expressway Auth |
Toll System RB Series 2014A | | | | |
Toll System RB Series 2014A | | | | |
Miami-Dade Cnty Transit System |
Transit System Sales Surtax Refunding RB Series 2017 | | | | |
|
| | | | |
|
| | | | |
|
| | | | |
Schwab Municipal Bond ETF | Annual Report21
Schwab Municipal Bond ETF
Portfolio Holdings as of December 31, 2023 (continued)
ISSUER TYPE OF SECURITY, SERIES | | | | |
Orlando Utilities Commission |
Utility System Refunding RB Series 2013A | | | | |
Utility System Refunding RB Series 2013A | | | | |
Palm Beach Cnty School Board |
| | | | |
| | | | |
South Florida Water Management District COP |
Refunding COP Series 2015 | | | | |
|
Tax Bonds ( H. Lee Moffitt Cancer Center) Series 2020A | | | | |
Water & Wastewater RB Series 2022A | | | | |
|
Utility System RB Series 2022 | | | | |
| | | | |
|
|
Water & Wastewater Refunding RB Series 2015 | | | | |
Water & Wastewater Refunding RB Series 2018B | | | | |
Water & Wastewater Refunding RB Series 2018B | | | | |
|
Airport Facility Sub Lien RB Series 2019C | | | | |
|
Water & Sewer 2nd Resolution RB Series 2022 | | | | |
Water & Sewerage RB Series 2022 | | | | |
|
Water & Sewerage RB Series 2020A | | | | |
Water & Sewerage RB Series 2020A | | | | |
Gainesville & Hall Cnty Hospital Auth |
| | | | |
|
| | | | |
| | | | |
| | | | |
| | | | |
| | | | |
| | | | |
| | | | |
| | | | |
| | | | |
GO Refunding Bonds Series 2016C | | | | |
GO Refunding Bonds Series 2016E | | | | |
Georgia Municipal Electric Auth |
Plant Vogtle Units 3 & 4 Project J Bonds Series 2023A | | | | |
| | | | |
| | | | |
|
| | | | |
| | | | |
| | | | |
22Schwab Municipal Bond ETF | Annual Report
Schwab Municipal Bond ETF
Portfolio Holdings as of December 31, 2023 (continued)
ISSUER TYPE OF SECURITY, SERIES | | | | |
Georgia State Road & Tollway Auth |
| | | | |
|
Sales Tax GO Bonds Series 2022B | | | | |
Metropolitan Atlanta Rapid Transit Auth |
Sales Tax Refunding RB Series 2016B | | | | |
Sales Tax Refunding RB Series 2017C | | | | |
|
Water & Sewerage Improvement Refunding RB Series 2016 | | | | |
Private Colleges & Universities Auth |
RB (Emory Univ) Series 2020B | | | | |
RB (Emory Univ) Series 2020B | | | | |
Sandy Springs Public Facilities Auth |
| | | | |
| | | | |
|
|
| | | | |
| | | | |
GO Refunding Bonds Series 2016FE | | | | |
GO Refunding Bonds Series 2016FH | | | | |
|
| | | | |
| | | | |
Wastewater System Sr RB Series 2022A | | | | |
Honolulu City & Cnty Wastewater System |
Sr Wastewater System RB Series 2015A | | | | |
| | | | |
|
|
2nd Lien Water RB Series 2014 | | | | |
2nd Lien Water Refunding RB Series 2023B | | | | |
2nd Lien Water Refunding RB Series 2023B | | | | |
| | | | |
| | | | |
| | | | |
| | | | |
| | | | |
GO Refunding Bonds Series 2017A | | | | |
GO Refunding Bonds Series 2020A | | | | |
Chicago Board of Education |
Dedicated Tax Bonds Series 2016 | | | | |
Dedicated Tax Bonds Series 2023 | | | | |
Chicago O’Hare International Airport |
Airport Sr Lien Refunding RB Series 2020A | | | | |
General Airport Sr Lien RB Series 2018B | | | | |
General Airport Sr Lien Refunding RB Series 2015B | | | | |
General Airport Sr Lien Refunding RB Series 2015B | | | | |
Schwab Municipal Bond ETF | Annual Report23
Schwab Municipal Bond ETF
Portfolio Holdings as of December 31, 2023 (continued)
ISSUER TYPE OF SECURITY, SERIES | | | | |
OHare General Airport Sr Lien Refunding RB Series 2015B | | | | |
OHare General Airport Sr Lien Refunding RB Series 2015B | | | | |
OHare General Airport Sr Lien Refunding RB Series 2016C | | | | |
OHare General Airport Sr Lien Refunding RB Series 2020A | | | | |
OHare General Airport Sr Lien Refunding RB Series 2020A | | | | |
| | | | |
Sr Lien Refunding RB Series 2015B | | | | |
Chicago Transit Auth Sales Tax |
2nd Lien Sales Tax RB Series 2017 | | | | |
2nd Lien Sales Tax RB Series 2020A | | | | |
|
GO Refunding Bonds Series 2022A | | | | |
Sales Tax RB Series 2021A | | | | |
Cook Cnty Sales Tax Revenue |
Sales Tax RB Series 2021A | | | | |
|
| | | | |
| | | | |
| | | | |
| | | | |
| | | | |
| | | | |
| | | | |
| | | | |
| | | | |
| | | | |
| | | | |
| | | | |
| | | | |
| | | | |
| | | | |
| | | | |
| | | | |
GO Refunding Bonds Series 2016 | | | | |
GO Refunding Bonds Series 2016 | | | | |
GO Refunding Bonds Series 2016 | | | | |
GO Refunding Bonds Series 2022B | | | | |
GO Refunding Bonds Series 2023D | | | | |
|
RB (Univ of Chicago) Series 2015A | | | | |
RB (Univ of Chicago) Series 2023A | | | | |
| | | | |
Illinois Municipal Electric Agency |
Power System Refunding RB Series 2015A | | | | |
Illinois Toll Highway Auth |
Refunding RB Series 2018A | | | | |
Toll Highway Sr RB Series 2014B | | | | |
Toll Highway Sr RB Series 2014C | | | | |
Toll Highway Sr RB Series 2016B | | | | |
Toll Highway Sr RB Series 2017A | | | | |
24Schwab Municipal Bond ETF | Annual Report
Schwab Municipal Bond ETF
Portfolio Holdings as of December 31, 2023 (continued)
ISSUER TYPE OF SECURITY, SERIES | | | | |
Toll Highway Sr RB Series 2020A | | | | |
Toll Highway Sr RB Series 2021A | | | | |
Toll Highway Sr RB Series 2021A | | | | |
Toll Highway Sr RB Series 2021A | | | | |
Toll Highway Sr RB Series 2023A | | | | |
Toll Highway Sr Refunding RB Series 2019C | | | | |
Toll Highway Sr Refunding RB Series 2024A | | | | |
Metropolitan Pier & Exposition Auth |
Dedicated State Tax RB Series 2002A | | | | |
Dedicated State Tax RB Series 2002A | | | | |
| | | | |
| | | | |
| | | | |
Refunding Bonds (McCormick Place Expansion) Series 2010B1 | | | | |
Refunding Bonds (McCormick Place Expansion) Series 2017B | | | | |
Refunding Bonds (McCormick Place Expansion) Series 2020A | | | | |
Refunding Bonds (McCormick Place Expansion) Series 2020A | | | | |
Refunding Bonds Series 2010B-1 | | | | |
Metropolitan Water Reclamation District of Greater Chicago |
ULT GO Bonds Series 2016C | | | | |
ULT GO Refunding Bonds Series 2016A | | | | |
Railsplitter Tobacco Settlement Auth |
Tobacco Settlement RB Series 2017 | | | | |
|
| | | | |
Sales Tax Securitization Corp |
2nd Lien Sales Tax RB Series 2020A | | | | |
2nd Lien Sales Tax Securitization Bonds Series 2020A | | | | |
Sales Tax Securitization Bonds Series 2018C | | | | |
|
GO Refunding Bonds Series 2013A | | | | |
|
Sr Lien Electric Refunding RB Series 2015 | | | | |
|
Auxiliary Facilities RB Series 2018A | | | | |
| | | | |
|
|
Highway Refunding RB Series 2016C | | | | |
Lease Appropriation Refunding Bonds Series 2022A | | | | |
State Revolving Fund RB Series 2019A | | | | |
State Revolving Fund Refunding Bonds Series 2015B | | | | |
Indianapolis Local Public Improvement Bond Bank |
| | | | |
| | | | |
Schwab Municipal Bond ETF | Annual Report25
Schwab Municipal Bond ETF
Portfolio Holdings as of December 31, 2023 (continued)
ISSUER TYPE OF SECURITY, SERIES | | | | |
|
|
Special Obligation Refunding RB Series 2016A | | | | |
Special Obligation Refunding RB Series 2019A | | | | |
Iowa Higher Education Loan Auth |
RB (Grinnell College) Series 2017 | | | | |
| | | | |
|
Kansas Department of Transportation |
| | | | |
|
Kentucky Municipal Power Agency |
Power System Refunding RB Series 2015A | | | | |
Kentucky State Property & Buildings Commission |
| | | | |
| | | | |
|
Economic Development Road Refunding RB Series 2017B | | | | |
Louisville & Jefferson Cnty Metro Sewer District |
Sewer & Drainage System RB Series 2013B | | | | |
| | | | |
|
|
GO Refunding Bonds Series 2016B | | | | |
GO Refunding Bonds Series 2016B | | | | |
Refunding RB Bonds Series 2015A | | | | |
Louisiana Local Government Environmental Facilities & Community Development Auth |
Insurance Assessment RB Series 2022B | | | | |
Louisiana Public Facilities Auth |
Refunding RB (Tulane Univ) Series 2020A | | | | |
Louisiana Stadium & Exposition District |
| | | | |
|
Water Refunding RB Series 2014 | | | | |
| | | | |
|
|
Wastewater RB Series 2019A | | | | |
Wastewater Sub RB Series 2017A | | | | |
|
| | | | |
|
GO Bonds 1st Series 2020A | | | | |
GO Bonds 1st Series 2022A | | | | |
GO Bonds 1st Series 2022A | | | | |
26Schwab Municipal Bond ETF | Annual Report
Schwab Municipal Bond ETF
Portfolio Holdings as of December 31, 2023 (continued)
ISSUER TYPE OF SECURITY, SERIES | | | | |
| | | | |
GO Bonds 2nd Series 2017A | | | | |
GO Bonds 2nd Series 2019A | | | | |
GO Bonds 2nd Series 2019A | | | | |
GO Bonds 2nd Series 2020A | | | | |
GO Refunding Bonds 1st Series 2020C | | | | |
GO Refunding Bonds 2nd Series B | | | | |
GO Refunding Bonds Series 2017B | | | | |
| | | | |
Refunding Bonds 2nd Series 2020B | | | | |
Refunding Bonds 2nd Series 2021D | | | | |
| | | | |
ULT GO Bonds Series 2017B | | | | |
Maryland Dept of Transportation |
Consolidated Bonds Series 2021A | | | | |
Consolidated Transportation Bonds Series 2019 | | | | |
| | | | |
Transportation Bonds Series 2018 | | | | |
Transportation Bonds Series 2019 | | | | |
Maryland Health & Higher Educational Facilities Auth |
RB (Anne Arundel Health System) Series 2014 | | | | |
Maryland Transportation Auth |
Transportation Facilities RB Series 2020 | | | | |
|
| | | | |
| | | | |
|
|
Commonwealth Transportation Fund RB Series 2023A | | | | |
| | | | |
| | | | |
| | | | |
| | | | |
| | | | |
| | | | |
| | | | |
| | | | |
| | | | |
| | | | |
| | | | |
| | | | |
| | | | |
| | | | |
| | | | |
| | | | |
| | | | |
| | | | |
| | | | |
| | | | |
Schwab Municipal Bond ETF | Annual Report27
Schwab Municipal Bond ETF
Portfolio Holdings as of December 31, 2023 (continued)
ISSUER TYPE OF SECURITY, SERIES | | | | |
| | | | |
| | | | |
| | | | |
| | | | |
GO Refunding Bonds Series 2006B | | | | |
GO Refunding Bonds Series 2016C | | | | |
GO Refunding Bonds Series 2017C | | | | |
GO Refunding Bonds Series 2017E | | | | |
GO Refunding Bonds Series 2017E | | | | |
GO Refunding Bonds Series 2018B | | | | |
GO Refunding Bonds Series 2020D | | | | |
GO Refunding Bonds Series 2022A | | | | |
Highway Notes Series 2014A | | | | |
Special Obligation Refunding RB Series 2005 | | | | |
Special Obligation Refunding RB Series 2005 | | | | |
Massachusetts Bay Transportation Auth |
Assessment Bonds Series 2016A | | | | |
Assessment Bonds Series 2022A1 | | | | |
Assessment Bonds Series 2022A2 | | | | |
Sr Sales Tax Bonds Series 2005A | | | | |
Sr Sales Tax Bonds Series 2005A | | | | |
Sub Sales Tax BAN RB Series 2021 | | | | |
Massachusetts Development Finance Agency |
RB (Boston College) Series 2021V | | | | |
RB (Emerson College) Series 2016A | | | | |
RB (Harvard Univ) Series 2016A | | | | |
RB (Harvard Univ) Series 2016A | | | | |
RB (Harvard Univ) Series 2016A | | | | |
RB (Northeastern Univ) Series 2022 | | | | |
Massachusetts School Building Auth |
Sr Dedicated Sales Tax Refunding Bonds Series 2016C | | | | |
Sr Sales Tax Refunding Bonds Series 2015C | | | | |
Sub Sales Tax Bonds Series 2018A | | | | |
Sub Sales Tax Bonds Series 2018B | | | | |
Massachusetts Transportation Fund |
| | | | |
Refunding RB Series 2016A | | | | |
Refunding RB Series 2016A | | | | |
Refunding RB Series 2021A | | | | |
Massachusetts Turnpike Auth |
| | | | |
Massachusetts Water Resources Auth |
General Refunding RB Series 2007B | | | | |
General Refunding RB Series 2007B | | | | |
General Refunding RB Series 2016C | | | | |
Refunding RB Series 2016C | | | | |
Refunding RB Series 2017C | | | | |
Univ of Massachusetts Building Auth |
Project RB Sr Series 2020-1 | | | | |
| | | | |
28Schwab Municipal Bond ETF | Annual Report
Schwab Municipal Bond ETF
Portfolio Holdings as of December 31, 2023 (continued)
ISSUER TYPE OF SECURITY, SERIES | | | | |
|
|
Sewage Disposal System Sr Lien Refunding RB Series 2016B | | | | |
Water Supply System 2nd Lien Refunding RB Series 2016B | | | | |
|
Utility System RB Series 2019A | | | | |
|
| | | | |
State Trunk Line Bonds Series 2021A | | | | |
Trunk Line Fund Bonds Series 2020B | | | | |
|
| | | | |
Refunding RB Series 2015I | | | | |
Refunding RB Series 2015I | | | | |
Refunding RB Series 2016I | | | | |
Refunding RB Series 2016I | | | | |
|
Clean Water Revolving Fund Refunding RB Series 2016B | | | | |
RB (Detroit Water & Sewage 2nd Lien) Series 2014C6 | | | | |
RB (Detroit Water & Sewage 2nd Lien) Series 2015C | | | | |
RB (Public Lighting Auth) Series 2014B | | | | |
Water Supply System Refunding RB 2nd Lien Series 2014D4 | | | | |
Water Supply System Refunding RB 2nd Lien Series 2014D6 | | | | |
|
| | | | |
|
State Trunk Line Bonds Series 2021A | | | | |
State Trunk Line Bonds Series 2021A | | | | |
|
| | | | |
|
| | | | |
| | | | |
|
Minneapolis Metropolitan Council |
| | | | |
Minneapolis- St. Paul Metropolitan Airports Commission |
Sr Airport Refunding RB Series 2016A | | | | |
|
| | | | |
GO Refunding Bonds Series 2023D | | | | |
GO State Highway Refunding Bonds Series 2023E | | | | |
State General Refunding RB Series 2022A | | | | |
| | | | |
Schwab Municipal Bond ETF | Annual Report29
Schwab Municipal Bond ETF
Portfolio Holdings as of December 31, 2023 (continued)
ISSUER TYPE OF SECURITY, SERIES | | | | |
|
|
| | | | |
GO Refunding Bonds Series 2017A | | | | |
West Ranking Utility Auth |
| | | | |
| | | | |
|
|
Special Obligation Bonds Series 2023A | | | | |
Metropolitan St Louis Sewer District |
Water System Improvement & Refunding RB Series 2017A | | | | |
Missouri Health & Educational Facilities Auth |
Educational Facilities RB (St Louis Univ) Series 2019A | | | | |
Missouri Highways & Transportation Commission |
1st Lien Refunding Bonds Series 2014A | | | | |
Missouri Jt Municipal Electric Utility Commission |
Power Refunding RB (Prairie State) Series 2016A | | | | |
Univ of Missouri Curators |
System Facilities RB Series 2020B | | | | |
| | | | |
|
Omaha Public Power District |
Electric System RB Series 2017A | | | | |
Electric System RB Series 2019A | | | | |
Electric System RB Series 2021A | | | | |
| | | | |
|
|
Airport System Sub Refunding RB Series 2019D | | | | |
| | | | |
|
GO Refunding Bonds Series 2017A | | | | |
Las Vegas Convention & Visitors Auth |
| | | | |
Las Vegas Valley Water District |
Refunding GO Bonds Series 2015 | | | | |
Water Improvement GO Bonds Series 2022A | | | | |
Water Improvement GO Refunding Bonds Series 2016A | | | | |
|
Highway Improvement RB (Motor Vehicle Fuel Tax) Series 2017 | | | | |
Limited Tax GO Refunding Bonds Series 2015D | | | | |
| | | | |
30Schwab Municipal Bond ETF | Annual Report
Schwab Municipal Bond ETF
Portfolio Holdings as of December 31, 2023 (continued)
ISSUER TYPE OF SECURITY, SERIES | | | | |
|
Hudson Cnty Improvement Auth |
Lease RB (Hudson Cnty Courthouse) Series 2020 | | | | |
|
| | | | |
| | | | |
| | | | |
| | | | |
| | | | |
| | | | |
New Jersey Economic Development Auth |
Motor Vehicle Surcharge Sub Refunding RB Series 2017A | | | | |
| | | | |
Refunding Bonds Series 2005N1 | | | | |
Refunding RB Series 2016 BBB | | | | |
School Facilities Construction Refunding Bonds Series 2015XX | | | | |
School Facilities Construction Refunding Bonds Series 2023RRR | | | | |
State Lease RB Series 2018A | | | | |
Transportation Bonds Series 2022A | | | | |
Transportation Refunding RB Series 2017B | | | | |
New Jersey Educational Facilities Auth |
RB (Princeton Univ) Series 2014A | | | | |
New Jersey Transportation Trust Fund Auth |
Federal Highway Reimbursement Revenue Notes Series 2016A-1 | | | | |
| | | | |
| | | | |
| | | | |
| | | | |
Transportation Bonds Series 2019BB | | | | |
Transportation Bonds Series 2019BB | | | | |
Transportation Bonds Series 2019BB | | | | |
Transportation Bonds Series 2020AA | | | | |
Transportation Program Bonds Series 2014AA | | | | |
Transportation Program Bonds Series 2015AA | | | | |
Transportation Program Bonds Series 2020AA | | | | |
Transportation Program Bonds Series 2020AA | | | | |
Transportation Program Bonds Series 2022CC | | | | |
Transportation Program Notes Series 2014BB1 | | | | |
Transportation Program RB Series 2014AA | | | | |
Transportation RB Series 2019BB | | | | |
Transportation RB Series 2020AA | | | | |
Transportation RB Series 2020AA | | | | |
Transportation RB Series 2023AA | | | | |
Transportation System Bonds Series 2006C | | | | |
Transportation System Bonds Series 2008A | | | | |
Transportation System Bonds Series 2008A | | | | |
Transportation System Bonds Series 2009A | | | | |
Transportation System Bonds Series 2009C | | | | |
Transportation System Bonds Series 2010A | | | | |
Transportation System Bonds Series 2018A | | | | |
Schwab Municipal Bond ETF | Annual Report31
Schwab Municipal Bond ETF
Portfolio Holdings as of December 31, 2023 (continued)
ISSUER TYPE OF SECURITY, SERIES | | | | |
Transportation System Bonds Series 2021A | | | | |
Transportation System Bonds Series 2021A | | | | |
Transportation System Bonds Series 2023A | | | | |
Transportation System RB Series 2006C | | | | |
Transportation System RB Series 2006C | | | | |
Transportation System RB Series 2009A | | | | |
Transportation System RB Series 2010A | | | | |
Transportation System RB Series 2010A | | | | |
Transportation System RB Series 2021A | | | | |
Transportation System RB Series 2021A | | | | |
|
| | | | |
| | | | |
| | | | |
| | | | |
Refunding RB Series 2005D3 | | | | |
Turnpike RB Series 2004C2 | | | | |
| | | | |
| | | | |
| | | | |
| | | | |
| | | | |
| | | | |
| | | | |
| | | | |
| | | | |
|
|
Severance Tax Bonds Series 2021A | | | | |
|
| | | | |
| | | | |
|
Hudson Yards Infrastructure |
2nd Indenture RB Fiscal 2017 Series A | | | | |
2nd Indenture RB Fiscal 2017 Series A | | | | |
2nd Indenture RB Fiscal 2017 Series A | | | | |
2nd Indenture RB Fiscal 2017 Series A | | | | |
|
Electric System RB Series 2014A | | | | |
Electric System RB Series 2016B | | | | |
Electric System RB Series 2016B | | | | |
Electric System RB Series 2018 | | | | |
Electric System RB Series 2018 | | | | |
Electric System RB Series 2018 | | | | |
Metropolitan Transportation Auth |
Dedicated Tax Fund Bonds Series 2017A | | | | |
Dedicated Tax Fund Refunding Bonds Series 2012A | | | | |
32Schwab Municipal Bond ETF | Annual Report
Schwab Municipal Bond ETF
Portfolio Holdings as of December 31, 2023 (continued)
ISSUER TYPE OF SECURITY, SERIES | | | | |
| | | | |
| | | | |
| | | | |
| | | | |
Refunding RB Series 2017B | | | | |
Refunding RB Series 2017C2 | | | | |
Transportation RB Series 2012C | | | | |
Transportation RB Series 2012E | | | | |
Transportation RB Series 2012E | | | | |
Transportation RB Series 2012H | | | | |
Transportation RB Series 2012H | | | | |
Transportation RB Series 2013A | | | | |
Transportation RB Series 2013C | | | | |
Transportation RB Series 2013C | | | | |
Transportation RB Series 2013D | | | | |
Transportation RB Series 2013E | | | | |
Transportation RB Series 2014D1 | | | | |
Transportation RB Series 2015A1 | | | | |
Transportation RB Series 2016A1 | | | | |
Transportation RB Series 2019C | | | | |
Transportation RB Series 2020C1 | | | | |
Transportation RB Series 2020C1 | | | | |
Transportation Refunding RB Series 2016D | | | | |
Transportation Refunding RB Series 2017C | | | | |
Transportation Refunding RB Series 2017C1 | | | | |
Transportation Refunding RB Series 2017C2 | | | | |
Transportation Refunding RB Series 2017C2 | | | | |
|
RB (Univ of Rochester) Series 2017C | | | | |
|
| | | | |
|
GO Refunding Bonds Series 2017C | | | | |
Nassau Cnty Interim Finance Auth |
Sales Tax RB Series 2021A | | | | |
Sales Tax Secured Bonds Series 2021A | | | | |
|
GO Bonds Fiscal 2016 Series C | | | | |
GO Bonds Fiscal 2016 Series C | | | | |
GO Bonds Fiscal 2017 Series A1 | | | | |
GO Bonds Fiscal 2017 Series B | | | | |
GO Bonds Fiscal 2018 Series B1 | | | | |
GO Bonds Fiscal 2018 Series B1 | | | | |
GO Bonds Fiscal 2018 Series B1 | | | | |
GO Bonds Fiscal 2018 Series B4 | | | | |
GO Bonds Fiscal 2018 Series C | | | | |
GO Bonds Fiscal 2018 Series E1 | | | | |
GO Bonds Fiscal 2018 Series F1 | | | | |
GO Bonds Fiscal 2018 Series F1 | | | | |
GO Bonds Fiscal 2018 Series F1 | | | | |
Schwab Municipal Bond ETF | Annual Report33
Schwab Municipal Bond ETF
Portfolio Holdings as of December 31, 2023 (continued)
ISSUER TYPE OF SECURITY, SERIES | | | | |
GO Bonds Fiscal 2019 Series A | | | | |
GO Bonds Fiscal 2019 Series D1 | | | | |
GO Bonds Fiscal 2019 Series E | | | | |
GO Bonds Fiscal 2020 Series A1 | | | | |
GO Bonds Fiscal 2020 Series A1 | | | | |
GO Bonds Fiscal 2020 Series A1 | | | | |
GO Bonds Fiscal 2020 Series B1 | | | | |
GO Bonds Fiscal 2020 Series C1 | | | | |
GO Bonds Fiscal 2020 Series C1 | | | | |
GO Bonds Fiscal 2020 Series C1 | | | | |
GO Bonds Fiscal 2020 Series D1 | | | | |
GO Bonds Fiscal 2021 Series C | | | | |
GO Bonds Fiscal 2021 Series F | | | | |
GO Bonds Fiscal 2021 Series F1 | | | | |
GO Bonds Fiscal 2021 Series F1 | | | | |
GO Bonds Fiscal 2022 Series A1 | | | | |
GO Bonds Fiscal 2022 Series A1 | | | | |
GO Bonds Fiscal 2022 Series B1 | | | | |
GO Bonds Fiscal 2023 Series A1 | | | | |
GO Bonds Fiscal 2023 Series A1 | | | | |
GO Bonds Fiscal 2023 Series A1 | | | | |
GO Bonds Fiscal 2023 Series A4 | | | | |
GO Bonds Fiscal 2023 Series C | | | | |
GO Bonds Fiscal 2023 Series E | | | | |
GO Bonds Fiscal 2024 Series A | | | | |
GO Bonds Fiscal 2024 Series A | | | | |
GO Bonds Fiscal 2024 Series A | | | | |
| | | | |
| | | | |
| | | | |
New York City Municipal Water Finance Auth |
Water & Sewer System 2nd Resolution RB Fiscal 2013 Series CC | | | | |
Water & Sewer System 2nd Resolution RB Fiscal 2015 Series AA | | | | |
Water & Sewer System 2nd Resolution RB Fiscal 2015 Series CC | | | | |
Water & Sewer System 2nd Resolution RB Fiscal 2015 Series FF | | | | |
Water & Sewer System 2nd Resolution RB Fiscal 2015 Series HH | | | | |
Water & Sewer System 2nd Resolution RB Fiscal 2017 Series AA | | | | |
Water & Sewer System 2nd Resolution RB Fiscal 2017 Series CC1 | | | | |
Water & Sewer System 2nd Resolution RB Fiscal 2017 Series DD | | | | |
Water & Sewer System 2nd Resolution RB Fiscal 2018 Series CC1 | | | | |
Water & Sewer System 2nd Resolution RB Fiscal 2018 Series DD2 | | | | |
Water & Sewer System 2nd Resolution RB Fiscal 2018 Series EE | | | | |
Water & Sewer System 2nd Resolution RB Fiscal 2018 Series FF | | | | |
Water & Sewer System 2nd Resolution RB Fiscal 2019 Series EE2 | | | | |
Water & Sewer System 2nd Resolution RB Fiscal 2019 Series FF2 | | | | |
Water & Sewer System 2nd Resolution RB Fiscal 2019 Series FF2 | | | | |
Water & Sewer System 2nd Resolution RB Fiscal 2020 Series AA | | | | |
Water & Sewer System 2nd Resolution RB Fiscal 2020 Series AA | | | | |
Water & Sewer System 2nd Resolution RB Fiscal 2020 Series DD1 | | | | |
Water & Sewer System 2nd Resolution RB Fiscal 2020 Series EE | | | | |
34Schwab Municipal Bond ETF | Annual Report
Schwab Municipal Bond ETF
Portfolio Holdings as of December 31, 2023 (continued)
ISSUER TYPE OF SECURITY, SERIES | | | | |
Water & Sewer System 2nd Resolution RB Fiscal 2020 Series FF | | | | |
Water & Sewer System 2nd Resolution RB Fiscal 2021 Series AA1 | | | | |
Water & Sewer System 2nd Resolution RB Fiscal 2021 Series AA1 | | | | |
Water & Sewer System 2nd Resolution RB Fiscal 2021 Series AA2 | | | | |
Water & Sewer System 2nd Resolution RB Fiscal 2021 Series AA2 | | | | |
Water & Sewer System 2nd Resolution RB Fiscal 2021 Series BB1 | | | | |
Water & Sewer System 2nd Resolution RB Fiscal 2021 Series CC2 | | | | |
Water & Sewer System 2nd Resolution RB Fiscal 2021 Series DD | | | | |
Water & Sewer System 2nd Resolution RB Fiscal 2021 Series DD | | | | |
Water & Sewer System 2nd Resolution RB Fiscal 2022 Series AA1 | | | | |
Water & Sewer System 2nd Resolution RB Fiscal 2022 Series AA1 | | | | |
Water & Sewer System 2nd Resolution RB Fiscal 2022 Series AA1 | | | | |
Water & Sewer System 2nd Resolution RB Fiscal 2022 Series BB1 | | | | |
Water & Sewer System 2nd Resolution RB Fiscal 2023 Series AA1 | | | | |
Water & Sewer System 2nd Resolution RB Fiscal 2023 Series DD | | | | |
Water & Sewer System 2nd Resolution RB Series 2020GG1 | | | | |
New York City Transitional Finance Auth |
Building Aid RB Fiscal 2015 Series S1 | | | | |
Building Aid RB Fiscal 2015 Series S2 | | | | |
Building Aid RB Fiscal 2016 Series S1 | | | | |
Building Aid RB Fiscal 2018 Series S4A | | | | |
Building Aid RB Fiscal 2019 Series S1 | | | | |
Building Aid RB Fiscal 2019 Series S3A | | | | |
Building Aid RB Fiscal 2019 Series S3A | | | | |
Building Aid RB Fiscal 2022 Series S1 | | | | |
Building Aid RB Fiscal 2022 Series S1A | | | | |
Future Tax Secured Sub Bonds Fiscal 2015 Series B1 | | | | |
Future Tax Secured Sub Bonds Fiscal 2015 Series B1 | | | | |
Future Tax Secured Sub Bonds Fiscal 2015 Series C | | | | |
Future Tax Secured Sub Bonds Fiscal 2015 Series E1 | | | | |
Future Tax Secured Sub Bonds Fiscal 2016 Series E1 | | | | |
Future Tax Secured Sub Bonds Fiscal 2016 Series E1 | | | | |
Future Tax Secured Sub Bonds Fiscal 2016 Series F3 | | | | |
Future Tax Secured Sub Bonds Fiscal 2016 Series F3 | | | | |
Future Tax Secured Sub Bonds Fiscal 2016 Series F3 | | | | |
Future Tax Secured Sub Bonds Fiscal 2017 Series A1 | | | | |
Future Tax Secured Sub Bonds Fiscal 2017 Series A1 | | | | |
Future Tax Secured Sub Bonds Fiscal 2017 Series A1 | | | | |
Future Tax Secured Sub Bonds Fiscal 2017 Series C | | | | |
Future Tax Secured Sub Bonds Fiscal 2017 Series F1 | | | | |
Future Tax Secured Sub Bonds Fiscal 2017 Series F1 | | | | |
Future Tax Secured Sub Bonds Fiscal 2018 Series A2 | | | | |
Future Tax Secured Sub Bonds Fiscal 2018 Series B1 | | | | |
Future Tax Secured Sub Bonds Fiscal 2019 Series B1 | | | | |
Future Tax Secured Sub Bonds Fiscal 2019 Series B1 | | | | |
Future Tax Secured Sub Bonds Fiscal 2019 Series C1 | | | | |
Future Tax Secured Sub Bonds Fiscal 2020 Series A2 | | | | |
Future Tax Secured Sub Bonds Fiscal 2020 Series A3 | | | | |
Future Tax Secured Sub Bonds Fiscal 2020 Series A3 | | | | |
Future Tax Secured Sub Bonds Fiscal 2020 Series A3 | | | | |
Schwab Municipal Bond ETF | Annual Report35
Schwab Municipal Bond ETF
Portfolio Holdings as of December 31, 2023 (continued)
ISSUER TYPE OF SECURITY, SERIES | | | | |
Future Tax Secured Sub Bonds Fiscal 2020 Series B1 | | | | |
Future Tax Secured Sub Bonds Fiscal 2020 Series B1 | | | | |
Future Tax Secured Sub Bonds Fiscal 2020 Series C1 | | | | |
Future Tax Secured Sub Bonds Fiscal 2021 Series A | | | | |
Future Tax Secured Sub Bonds Fiscal 2021 Series A | | | | |
Future Tax Secured Sub Bonds Fiscal 2021 Series C1 | | | | |
Future Tax Secured Sub Bonds Fiscal 2021 Series E1 | | | | |
Future Tax Secured Sub Bonds Fiscal 2021 Series E1 | | | | |
Future Tax Secured Sub Bonds Fiscal 2021 Series F1 | | | | |
Future Tax Secured Sub Bonds Fiscal 2021 Series F1 | | | | |
Future Tax Secured Sub Bonds Fiscal 2021 Series F1 | | | | |
Future Tax Secured Sub Bonds Fiscal 2021 Series F1 | | | | |
Future Tax Secured Sub Bonds Fiscal 2021 Series F1 | | | | |
Future Tax Secured Sub Bonds Fiscal 2022 Series A1 | | | | |
Future Tax Secured Sub Bonds Fiscal 2022 Series A1 | | | | |
Future Tax Secured Sub Bonds Fiscal 2022 Series B | | | | |
Future Tax Secured Sub Bonds Fiscal 2022 Series B1 | | | | |
Future Tax Secured Sub Bonds Fiscal 2022 Series B1 | | | | |
Future Tax Secured Sub Bonds Fiscal 2022 Series B1 | | | | |
Future Tax Secured Sub Bonds Fiscal 2022 Series B1 | | | | |
Future Tax Secured Sub Bonds Fiscal 2022 Series C1 | | | | |
Future Tax Secured Sub Bonds Fiscal 2022 Series C1 | | | | |
Future Tax Secured Sub Bonds Fiscal 2022 Series F1 | | | | |
Future Tax Secured Sub Bonds Fiscal 2022 Series F1 | | | | |
Future Tax Secured Sub Bonds Fiscal 2022 Series F1 | | | | |
Future Tax Secured Sub Bonds Fiscal 2023 Series B1 | | | | |
Future Tax Secured Sub Bonds Fiscal 2023 Series B1 | | | | |
Future Tax Secured Sub Bonds Fiscal 2023 Series D1 | | | | |
Future Tax Secured Sub Bonds Fiscal 2023 Series E1 | | | | |
Future Tax Secured Sub Bonds Fiscal 2023 Series E1 | | | | |
Future Tax Secured Sub Bonds Fiscal 2023 Series E1 | | | | |
Future Tax Secured Sub Bonds Fiscal 2023 Series F1 | | | | |
Future Tax Secured Sub Bonds Fiscal 2024 Series A1 | | | | |
Future Tax Secured Sub Bonds Fiscal 2024 Series C | | | | |
| | | | |
RB Fiscal 2019 Series S2A | | | | |
| | | | |
Water & Sewer System 2nd Resolution RB Fiscal 2019 Series C1 | | | | |
New York Convention Center Development |
| | | | |
|
| | | | |
| | | | |
| | | | |
|
| | | | |
New York State Dormitory Auth |
Dormitory Facilities RB Series 2017A | | | | |
Financing RB Series 2019A | | | | |
RB (Columbia Univ) Series 2017A | | | | |
36Schwab Municipal Bond ETF | Annual Report
Schwab Municipal Bond ETF
Portfolio Holdings as of December 31, 2023 (continued)
ISSUER TYPE OF SECURITY, SERIES | | | | |
RB (Columbia Univ) Series 2020A | | | | |
RB (Fordham Univ) Series 2020 | | | | |
RB (New School Univ) Series 2016A | | | | |
RB (New York Univ) Series 2016A | | | | |
RB (New York Univ) Series 2019A | | | | |
RB (New York Univ) Series 2021 | | | | |
RB (Rockefeller Univ) Series 2019C | | | | |
| | | | |
| | | | |
| | | | |
| | | | |
| | | | |
| | | | |
Refunding RB (Cornell Univ) Series 2020A | | | | |
Sales Tax RB Series 2015B | | | | |
Sales Tax RB Series 2018A | | | | |
Sales Tax RB Series 2018E | | | | |
State Personal Income Tax RB Series 2014C | | | | |
State Personal Income Tax RB Series 2014C | | | | |
State Personal Income Tax RB Series 2014E | | | | |
State Personal Income Tax RB Series 2015A | | | | |
State Personal Income Tax RB Series 2015A | | | | |
State Personal Income Tax RB Series 2015B | | | | |
State Personal Income Tax RB Series 2015B | | | | |
State Personal Income Tax RB Series 2015B | | | | |
State Personal Income Tax RB Series 2015E | | | | |
State Personal Income Tax RB Series 2015E | | | | |
State Personal Income Tax RB Series 2016A | | | | |
State Personal Income Tax RB Series 2016A | | | | |
State Personal Income Tax RB Series 2016D | | | | |
State Personal Income Tax RB Series 2017A | | | | |
State Personal Income Tax RB Series 2017A | | | | |
State Personal Income Tax RB Series 2017A | | | | |
State Personal Income Tax RB Series 2017B | | | | |
State Personal Income Tax RB Series 2017B | | | | |
State Personal Income Tax RB Series 2017B | | | | |
State Personal Income Tax RB Series 2018A | | | | |
State Personal Income Tax RB Series 2019A | | | | |
State Personal Income Tax RB Series 2019A | | | | |
State Personal Income Tax RB Series 2019A | | | | |
State Personal Income Tax RB Series 2019D | | | | |
State Personal Income Tax RB Series 2019D | | | | |
State Personal Income Tax RB Series 2019D | | | | |
State Personal Income Tax RB Series 2019D | | | | |
State Personal Income Tax RB Series 2019D | | | | |
State Personal Income Tax RB Series 2020A | | | | |
State Personal Income Tax RB Series 2020A | | | | |
State Personal Income Tax RB Series 2021A | | | | |
State Personal Income Tax RB Series 2021A | | | | |
State Personal Income Tax RB Series 2021A | | | | |
Schwab Municipal Bond ETF | Annual Report37
Schwab Municipal Bond ETF
Portfolio Holdings as of December 31, 2023 (continued)
ISSUER TYPE OF SECURITY, SERIES | | | | |
State Personal Income Tax RB Series 2021A | | | | |
State Personal Income Tax RB Series 2021A | | | | |
State Personal Income Tax RB Series 2021E | | | | |
State Personal Income Tax RB Series 2021E | | | | |
State Personal Income Tax RB Series 2021E | | | | |
State Personal Income Tax RB Series 2022A | | | | |
State Personal Income Tax RB Series 2022A | | | | |
State Personal Income Tax RB Series 2022A | | | | |
State Personal Income Tax RB Series 2022A | | | | |
State Personal Income Tax Refunding RB Series 2016D | | | | |
State Sales Tax RB Series 2014A | | | | |
State Sales Tax RB Series 2015B | | | | |
State Sales Tax RB Series 2016A | | | | |
State Sales Tax RB Series 2016A | | | | |
State Sales Tax RB Series 2016A | | | | |
State Sales Tax RB Series 2017A | | | | |
State Sales Tax RB Series 2018A | | | | |
State Sales Tax RB Series 2018A | | | | |
State Sales Tax RB Series 2018A | | | | |
State Sales Tax RB Series 2018C | | | | |
State Sales Tax RB Series 2018E | | | | |
State Sales Tax RB Series 2018E | | | | |
New York State Environmental Facilities Corp |
State Clean Water & Drinking Water Revolving Funds RB Series 2020A | | | | |
State Clean Water & Drinking Water Revolving Funds RB Series 2022A | | | | |
New York State Thruway Auth |
| | | | |
| | | | |
General Refunding RB Series L | | | | |
General Revenue Jr Obligations Series 2019B | | | | |
General Revenue Jr Obligations Series 2019B | | | | |
| | | | |
Jr Obligation RB Series 2019B | | | | |
| | | | |
State Personal Income Tax RB Series 2021A1 | | | | |
State Personal Income Tax RB Series 2021A1 | | | | |
State Personal Income Tax RB Series 2021A1 | | | | |
State Personal Income Tax RB Series 2021A1 | | | | |
State Personal Income Tax RB Series 2022A | | | | |
State Personal Income Tax RB Series 2022A | | | | |
State Personal Income Tax RB Series 2022A | | | | |
New York State Urban Development Corp |
Sales Tax RB Series 2021A | | | | |
State Personal Income Tax RB Series 2016A | | | | |
State Personal Income Tax RB Series 2016A | | | | |
State Personal Income Tax RB Series 2017A | | | | |
State Personal Income Tax RB Series 2017A | | | | |
State Personal Income Tax RB Series 2017C | | | | |
State Personal Income Tax RB Series 2017C | | | | |
State Personal Income Tax RB Series 2019A | | | | |
38Schwab Municipal Bond ETF | Annual Report
Schwab Municipal Bond ETF
Portfolio Holdings as of December 31, 2023 (continued)
ISSUER TYPE OF SECURITY, SERIES | | | | |
State Personal Income Tax RB Series 2019A | | | | |
State Personal Income Tax RB Series 2020A | | | | |
State Personal Income Tax RB Series 2020A | | | | |
State Personal Income Tax RB Series 2020C | | | | |
State Personal Income Tax RB Series 2020C | | | | |
State Personal Income Tax RB Series 2020E | | | | |
State Personal Income Tax RB Series 2020E | | | | |
State Sales Tax RB Series 2019A | | | | |
State Sales Tax RB Series 2019A | | | | |
State Sales Tax RB Series 2021A | | | | |
State Sales Tax RB Series 2021A | | | | |
State Sales Tax RB Series 2021A | | | | |
|
RB (Syracuse Univ) Series 2019 | | | | |
Port Auth of New York & New Jersey |
Consolidated Bonds 175th Series | | | | |
Consolidated Bonds 184th Series | | | | |
Consolidated Bonds 194th Series | | | | |
Consolidated Bonds 194th Series | | | | |
Consolidated Bonds 200th Series | | | | |
Consolidated Bonds 205th Series | | | | |
Consolidated Bonds 209th Series | | | | |
Consolidated Bonds 211th Series | | | | |
Consolidated Bonds 212th Series | | | | |
Consolidated Bonds 212th Series | | | | |
Consolidated Bonds 213th Series | | | | |
Consolidated Bonds 217th Series | | | | |
Consolidated Bonds 217th Series | | | | |
Consolidated Bonds 240th Series | | | | |
Consolidated Bonds S205th Series | | | | |
Sales Tax Asset Receivable Corp |
| | | | |
|
Water System Refunding RB Series 2015 | | | | |
Water System Refunding RB Series 2015 | | | | |
Triborough Bridge & Tunnel Auth |
2nd Sub Revenue BAN Series 2021A | | | | |
| | | | |
| | | | |
| | | | |
| | | | |
| | | | |
General Refunding RB Series 2017B | | | | |
General Refunding RB Series 2017C1 | | | | |
General Refunding RB Series 2018B | | | | |
General Refunding RB Series 2018C | | | | |
General Refunding RB Series 2023A | | | | |
Payroll Mobility Tax Sr Lien Bonds Series 2021C1A | | | | |
Payroll Mobility Tax Sr Lien Bonds Series 2021C3 | | | | |
Payroll Mobility Tax Sr Lien Bonds Series 2022A | | | | |
Schwab Municipal Bond ETF | Annual Report39
Schwab Municipal Bond ETF
Portfolio Holdings as of December 31, 2023 (continued)
ISSUER TYPE OF SECURITY, SERIES | | | | |
Payroll Mobility Tax Sr Lien Bonds Series 2022C | | | | |
Payroll Mobility Tax Sr Lien Bonds Series 2022C | | | | |
Payroll Mobility Tax Sr Lien Bonds Series 2022D2 | | | | |
Payroll Mobility Tax Sr Lien RB Series 2022A | | | | |
Payroll Mobility Tax Sr Lien Refunding Bonds Series 2022B | | | | |
Payroll Mobility Tax Sr Lien Refunding Bonds Series 2022B | | | | |
Payroll Mobility Tax Sr Lien Refunding Bonds Series 2022E-2B | | | | |
Payroll Mobility Tax Sr Lien Refunding Bonds Series 2023A | | | | |
Payroll Mobility Tax Sr Lien Refunding RB Series 2023A | | | | |
Sales Tax RB Series 2022A | | | | |
Sales Tax RB Series 2022A | | | | |
Sales Tax RB Series 2023A | | | | |
Sales Tax RB Series 2023A | | | | |
| | | | |
| | | | |
| | | | |
| | | | |
Sub Refunding RB Series 2013A | | | | |
Utility Debt Securitization Auth |
| | | | |
| | | | |
| | | | |
Restructuring Bonds Series 2015 | | | | |
Restructuring Bonds Series 2015 | | | | |
Restructuring RB Series 2022TE1 | | | | |
Restructuring RB Series 2022TE1 | | | | |
| | | | |
|
|
| | | | |
|
| | | | |
GO Refunding Bonds Series 2016A | | | | |
Limited Obligation Bonds Series 2020B | | | | |
Limited Obligation RB Series 2020B | | | | |
Limited Obligation Refunding Bonds Series 2017B | | | | |
Refunding RB Series 2014B | | | | |
| | | | |
North Carolina Capital Facilities Finance Agency |
RB (Duke Univ) Series 2015B | | | | |
Refunding RB (Duke Univ) Series 2016B | | | | |
North Carolina Municipal Power Agency No 1 |
Electric Refunding RB Series 2015A | | | | |
North Carolina Turnpike Auth |
| | | | |
| | | | |
| | | | |
| | | | |
Toll RB (Monroe Expressway) Series 2016A | | | | |
40Schwab Municipal Bond ETF | Annual Report
Schwab Municipal Bond ETF
Portfolio Holdings as of December 31, 2023 (continued)
ISSUER TYPE OF SECURITY, SERIES | | | | |
|
Enterprise System Refunding RB Series 2023 | | | | |
| | | | |
|
American Municipal Power Ohio |
RB (Greenup Hydroelectric) Series 2016A | | | | |
|
Sales Tax Refunding Bonds Series 2016A | | | | |
Northeast Ohio Regional Sewer District |
| | | | |
Wastewater Refunding RB Series 2019 | | | | |
|
GO Refunding Bonds Series 2015A | | | | |
GO Refunding Bonds Series 2015A | | | | |
GO Refunding Bonds Series 2020B | | | | |
Ohio Higher Educational Facility Commission |
Education Facility RB (John Carroll Univ 2022) | | | | |
Refunding RB (Case Western Reserve Univ) Series 2016 | | | | |
|
| | | | |
|
| | | | |
Jr Lien Refunding RB Series 2022A | | | | |
Turnpike Jr Lien RB Series 2018A | | | | |
Turnpike Jr RB Series 2013A2 | | | | |
| | | | |
Ohio Water Development Auth |
| | | | |
| | | | |
|
Canadian Cnty Educational Facilities Auth |
Lease RB (Mustang Public Schools) Series 2017 | | | | |
Oklahoma Grand River Dam Auth |
Refunding RB Series 2016A | | | | |
|
| | | | |
| | | | |
2nd Sr Refunding RB Series 2017D | | | | |
Turnpike System 2nd Sr Refunding RB Series 2017D | | | | |
|
| | | | |
Oklahoma Water Resources Board |
Revolving Fund RB Series 2023A | | | | |
Tulsa Public Facilities Auth |
| | | | |
| | | | |
Schwab Municipal Bond ETF | Annual Report41
Schwab Municipal Bond ETF
Portfolio Holdings as of December 31, 2023 (continued)
ISSUER TYPE OF SECURITY, SERIES | | | | |
|
|
| | | | |
| | | | |
| | | | |
|
| | | | |
|
| | | | |
|
| | | | |
| | | | |
Oregon Dept of Transportation |
Highway Sub Lien Refunding RB Series 2019A | | | | |
Highway Tax Sub Lien RB Series 2020A | | | | |
|
2nd Lien Sewer System Refunding RB Series 2023A | | | | |
Tri-Cnty Metropolitan Transportation District |
Sr Lien Payroll Tax RB Series 2018A | | | | |
| | | | |
|
Allegheny Cnty Sanitary Auth |
| | | | |
| | | | |
|
| | | | |
| | | | |
Delaware Valley Regional Finance Auth |
Local Government RB Series 2002 | | | | |
| | | | |
|
Water & Sewer RB Series 2013A | | | | |
Northampton Cnty General Purpose Auth |
College Refunding RB (Lafayette College) Series 2017 | | | | |
|
GO Bonds 1st Refunding Series 2023 | | | | |
| | | | |
| | | | |
| | | | |
| | | | |
| | | | |
| | | | |
| | | | |
| | | | |
| | | | |
| | | | |
| | | | |
| | | | |
| | | | |
42Schwab Municipal Bond ETF | Annual Report
Schwab Municipal Bond ETF
Portfolio Holdings as of December 31, 2023 (continued)
ISSUER TYPE OF SECURITY, SERIES | | | | |
| | | | |
GO Refunding Bonds 1st Series 2016 | | | | |
GO Refunding Bonds 2nd Series 2016 | | | | |
GO Refunding Bonds Series 2017 | | | | |
GO Refunding Bonds Series 2017 | | | | |
Pennsylvania Higher Educational Facilities Auth |
RB (Thomas Jefferson Univ) Series 2015A | | | | |
RB (Univ of Pennsylvania) Series 2018A | | | | |
State System Higher Education Series AT1 | | | | |
Pennsylvania Public School Building Auth |
GO Refunding RB Series 2016A | | | | |
Pennsylvania State Turnpike Commission |
| | | | |
| | | | |
| | | | |
| | | | |
| | | | |
| | | | |
| | | | |
| | | | |
| | | | |
Sub Refunding RB 3rd Series 2016A | | | | |
Sub Refunding RB 3rd Series 2016A | | | | |
Sub Turnpike Refunding RB 3rd Series 2017 | | | | |
| | | | |
| | | | |
Turnpike Refunding RB Series 2019 | | | | |
Turnpike Sr RB Series 2015B | | | | |
Turnpike Sub RB Series 2021A | | | | |
Turnpike Sub Refunding RB 2nd Series 2017 | | | | |
|
| | | | |
| | | | |
Water & Wastewater RB Series 2015A | | | | |
Water & Wastewater RB Series 2019B | | | | |
Water & Wastewater Refunding RB Series 2017B | | | | |
Water & Wastewater Refunding RB Series 2017B | | | | |
|
RB (Thomas Jefferson Univ) Series 2017A | | | | |
|
| | | | |
GO Refunding Bonds Series 2016F | | | | |
Pittsburgh PA Water & Sewer Auth Sub |
Water & Sewer System Sub Refunding RB Series 2019B | | | | |
Pittsburgh Water & Sewer Auth |
Water & Sewer System Sub Refunding RB Series 2019B | | | | |
|
| | | | |
| | | | |
Schwab Municipal Bond ETF | Annual Report43
Schwab Municipal Bond ETF
Portfolio Holdings as of December 31, 2023 (continued)
ISSUER TYPE OF SECURITY, SERIES | | | | |
|
|
Grant Anticipation Bonds Series 2016B | | | | |
Rhode Island Health & Educational Building Corp |
Education Facility RB (Providence College) Series 2023 | | | | |
| | | | |
|
Charleston Educational Excellence Financing Corp |
| | | | |
Piedmont Municipal Power Agency |
Electric Refunding RB Series 2021C | | | | |
South Carolina Public Service Auth |
| | | | |
| | | | |
Refunding RB Series 2016A | | | | |
Refunding RB Series 2016A | | | | |
Refunding RB Series 2016B | | | | |
Refunding RB Series 2022A | | | | |
Revenue & Refunding Bonds Series 2020A | | | | |
South Carolina Transportation Infrastructure Bank |
Refunding RB Series 2021B | | | | |
Refunding RB Series 2021B | | | | |
| | | | |
|
Metro Government of Nashville & Davidson Cnty |
| | | | |
| | | | |
| | | | |
GO Improvement Bonds Series 2018 | | | | |
| | | | |
|
|
Maintenance Tax Notes Series 2022 | | | | |
|
| | | | |
|
Airport System RB Series 2017A | | | | |
Electric Utility System Refunding RB Series 2020A | | | | |
Water & Wastewater System Refunding RB Series 2022 | | | | |
|
| | | | |
|
LT Refunding Bonds Series 2017 | | | | |
Tax Refunding Bonds Series 2017 | | | | |
|
| | | | |
44Schwab Municipal Bond ETF | Annual Report
Schwab Municipal Bond ETF
Portfolio Holdings as of December 31, 2023 (continued)
ISSUER TYPE OF SECURITY, SERIES | | | | |
Central Texas Regional Mobility Auth |
Sub Lien BAN Series 2021C | | | | |
|
| | | | |
|
ULT GO Bonds Series 2022A | | | | |
|
| | | | |
|
ULT GO Refunding Bonds Series 2016 | | | | |
|
GO Refunding Bonds Series 2017 | | | | |
GO Refunding Bonds Series 2017 | | | | |
Waterworks & Sewer System Refunding RB Series 2023A | | | | |
Dallas Area Rapid Transit |
Sr Lien Sales Tax Refunding RB Series 2007 | | | | |
Sr Lien Sales Tax Refunding RB Series 2016A | | | | |
Sr Lien Sales Tax Refunding RB Series 2021B | | | | |
|
ULT GO Bonds Series 2016A | | | | |
Dallas-Fort Worth International Airport |
Jt Refunding RB Series 2020A | | | | |
Jt Refunding RB Series 2021B | | | | |
Refunding RB Series 2020A | | | | |
Refunding RB Series 2021A | | | | |
|
| | | | |
| | | | |
|
| | | | |
Water & Sewer Refunding RB Series 2022 | | | | |
Water & Sewer Refunding RB Series 2022A | | | | |
|
| | | | |
|
| | | | |
Grand Parkway Transportation Corp |
1st Tier Toll Refunding RB Series 2020C | | | | |
1st Tier Toll Refunding RB Series 2020C | | | | |
Sub Tier Toll RB Series 2018A | | | | |
Greater Texoma Utility Auth |
| | | | |
|
Refunding Bonds Series 2022A | | | | |
Refunding GO Bonds Series 2023A | | | | |
Toll Road Sr Lien Refunding RB Series 2016A | | | | |
Toll Road Sr Lien Refunding RB Series 2018A | | | | |
|
Sr Lien Refunding RB 2014A | | | | |
Schwab Municipal Bond ETF | Annual Report45
Schwab Municipal Bond ETF
Portfolio Holdings as of December 31, 2023 (continued)
ISSUER TYPE OF SECURITY, SERIES | | | | |
|
| | | | |
|
1st Lien Refunding RB Series 2016B | | | | |
Airport System Sub Lien Refunding RB Series 2018D | | | | |
Airport System Sub Lien Refunding RB Series 2018D | | | | |
Utility System 1st Lien Refunding RB Series 2014C | | | | |
Utility System 1st Lien Refunding RB Series 2019B | | | | |
Utility System 1st Lien Refunding RB Series 2021A | | | | |
|
LT Refunding Bonds Series 2016A | | | | |
|
| | | | |
|
| | | | |
|
| | | | |
| | | | |
ULT GO Bonds Series 2023A | | | | |
|
ULT GO Refunding Bonds Series 2016A | | | | |
Lower Colorado River Auth |
Refunding RB (LCRA Transmission Services) Series 2020A | | | | |
Refunding RB (LCRA Transmission Services) Series 2021A | | | | |
Refunding RB (LCRA Transmission Services) Series 2023 | | | | |
|
| | | | |
|
ULT GO Refunding Bonds Series 2023 | | | | |
|
1st Tier Refunding RB Series 2008D | | | | |
1st Tier Refunding RB Series 2008D | | | | |
1st Tier Refunding RB Series 2016A | | | | |
1st Tier Refunding RB Series 2016A | | | | |
1st Tier Refunding RB Series 2017A | | | | |
1st Tier Refunding RB Series 2017A | | | | |
1st Tier Refunding RB Series 2020A | | | | |
1st Tier System Refunding RB Series 2008D | | | | |
1st Tier System Refunding RB Series 2017A | | | | |
1st Tier System Refunding RB Series 2017A | | | | |
1st Tier System Refunding RB Series 2020A | | | | |
1st Tier System Refunding Rb Series 2022A | | | | |
1st Tier System Refunding RB Series 2023A | | | | |
2nd Tier System Refunding RB Series 2015A | | | | |
2nd Tier System Refunding RB Series 2019B | | | | |
Refunding RB Series 2008I | | | | |
Refunding RB Series 2014B | | | | |
Refunding RB Series 2015A | | | | |
46Schwab Municipal Bond ETF | Annual Report
Schwab Municipal Bond ETF
Portfolio Holdings as of December 31, 2023 (continued)
ISSUER TYPE OF SECURITY, SERIES | | | | |
|
ULT GO Bonds Series 2022A | | | | |
| | | | |
|
| | | | |
|
| | | | |
| | | | |
|
| | | | |
|
| | | | |
| | | | |
|
ULT GO Bonds Series 2022A | | | | |
|
Electric & Gas Systems Jr Lien Refunding RB Series 2021A | | | | |
Electric & Gas Systems Refunding RB Series 2012 | | | | |
Electric & Gas Systems Refunding RB Series 2016 | | | | |
Electric & Gas Systems Refunding RB Series 2020 | | | | |
| | | | |
|
| | | | |
| | | | |
San Antonio Public Facilities Corp |
Lease Refunding RB Series 2012 | | | | |
|
| | | | |
Tarrant Cnty Hospital District |
Limited Tax GO Bonds Series 2023 | | | | |
|
| | | | |
| | | | |
GO Mobility Refunding Bonds Series 2014A | | | | |
GO Refunding Bonds Series 2014 | | | | |
GO Refunding Bonds Series 2014 | | | | |
GO Refunding Bonds Series 2014A | | | | |
GO Refunding Bonds Series 2017A | | | | |
GO Refunding Bonds Series 2017A | | | | |
GO Refunding Bonds Series 2017B | | | | |
|
| | | | |
|
Refunding RB Series 2017A | | | | |
Texas Transportation Commission |
1st Tier Refunding RB Series 2015B | | | | |
2nd Tier Refunding RB Series 2015C | | | | |
State Highway Fund 1st Tier RB Series 2016A | | | | |
State Highway Fund 1st Tier Refunding RB Series 2015 | | | | |
Schwab Municipal Bond ETF | Annual Report47
Schwab Municipal Bond ETF
Portfolio Holdings as of December 31, 2023 (continued)
ISSUER TYPE OF SECURITY, SERIES | | | | |
Texas Transportation Corp |
Sr Lien Refunding RB (NTE Mobility Partners) Series 2019A | | | | |
|
| | | | |
| | | | |
|
State Water Implementation Fund RB Series 2017A | | | | |
State Water Implementation Fund RB Series 2017A | | | | |
State Water Implementation Fund RB Series 2018A | | | | |
State Water Implementation Fund RB Series 2019A | | | | |
State Water Implementation Fund RB Series 2019A | | | | |
State Water Implementation Fund RB Series 2019A | | | | |
State Water Implementation Fund RB Series 2022 | | | | |
State Water Implementation Fund RB Series 2022 | | | | |
State Water Implementation Fund RB Series 2022 | | | | |
State Water Implementation Fund RB Series 2023A | | | | |
State Water RB Series 2022 | | | | |
|
| | | | |
|
Financing System RB Series 2019B | | | | |
Financing System RB Series 2020A | | | | |
Financing System RB Series 2021A | | | | |
| | | | |
Univ Fund Bonds Series 2023A | | | | |
Univ Fund Bonds Series 2023A | | | | |
Univ Fund Bonds Series 2023A | | | | |
Univ of Texas Permanent Univ Fund |
| | | | |
|
| | | | |
|
| | | | |
|
| | | | |
| | | | |
|
Intermountain Power Agency |
Power Supply RB Series 2022A | | | | |
Power Supply RB Series 2022A | | | | |
Power Supply RB Series 2022A | | | | |
Power Supply RB Series 2023A | | | | |
|
GO Refunding Bonds Series 2015 | | | | |
|
General RB (Univ of Utah) Series 2022A | | | | |
|
Sales Tax Refunding RB Series 2015A | | | | |
Sales Tax Refunding RB Series 2015A | | | | |
48Schwab Municipal Bond ETF | Annual Report
Schwab Municipal Bond ETF
Portfolio Holdings as of December 31, 2023 (continued)
ISSUER TYPE OF SECURITY, SERIES | | | | |
Sales Tax Refunding RB Series 2015A | | | | |
Sub Sales Tax Refunding RB Series 2018 | | | | |
| | | | |
|
Chesapeake Bay Bridge & Tunnel District |
| | | | |
|
| | | | |
General Refunding RB Series 2017A | | | | |
Virginia College Building Auth |
Educational Facilities RB Series 2015A | | | | |
Educational Facilities RB Series 2021A | | | | |
Educational Facilities RB Series 2023A | | | | |
Educational Facilities Refunding RB Series 2017E | | | | |
Educational Facilities Refunding RB Series 2017E | | | | |
Educational Facilities Refunding RB Series 2017E | | | | |
Educational Facilities Refunding RB Series 2017E | | | | |
Educational Facilities Refunding RB Series 2023B | | | | |
Virginia Public Building Auth |
Public Facilities RB Series 2021A2 | | | | |
Public Facilities RB Series 2021A2 | | | | |
Public Facilities Refunding RB Series 2016B | | | | |
Virginia Transportation Board |
Transportation Grant Anticipation Refunding RB Series 2017 | | | | |
Transportation Refunding RB Series 2017A | | | | |
Transportation Refunding RB Series 2022 | | | | |
| | | | |
|
Central Puget Sound Regional Transit Auth |
Sales & Motor Vehicle Tax RB Series 2021S1 | | | | |
Sales & Motor Vehicle Tax Refunding Bonds Series 2021S1 | | | | |
Sales & Motor Vehicle Tax Refunding Bonds Series 2021S1 | | | | |
Sales & Motor Vehicle Tax Refunding Bonds Series 2021S1 | | | | |
Sales Tax Refunding RB Bonds Series 2015S1 | | | | |
Sales Tax Refunding RB Bonds Series 2015S1 | | | | |
|
Electric Refunding RB Series 2015C | | | | |
Electric Refunding RB Series 2018A | | | | |
Electric Refunding RB Series 2018C | | | | |
Electric Refunding RB Series 2018C | | | | |
Electric Refunding RB Series 2019A | | | | |
Electric Refunding RB Series 2021A | | | | |
Electric Refunding RB Series 2023A | | | | |
Electric Refunding RB Series 2023A | | | | |
|
| | | | |
Schwab Municipal Bond ETF | Annual Report49
Schwab Municipal Bond ETF
Portfolio Holdings as of December 31, 2023 (continued)
ISSUER TYPE OF SECURITY, SERIES | | | | |
|
LT GO Refunding Bonds Series 2021A | | | | |
Refunding RB Series 2016B | | | | |
King Cnty Public Hospital District #2 |
Limited Tax GO Bonds Series 2020A | | | | |
|
ULT GO Refunding Bonds Series 2020 | | | | |
|
| | | | |
ULT GO Refunding Bonds Series 2022 | | | | |
|
Light & Power RB Series 2015A | | | | |
| | | | |
|
| | | | |
|
ULT GO Bonds Series 2020B | | | | |
|
| | | | |
| | | | |
| | | | |
| | | | |
| | | | |
| | | | |
| | | | |
| | | | |
| | | | |
| | | | |
GO Refunding Bonds Series R2015C | | | | |
GO Refunding Bonds Series R2016B | | | | |
GO Refunding Bonds Series R2017A | | | | |
GO Refunding Bonds Series R2018C | | | | |
GO Refunding Bonds Series R2018C | | | | |
GO Refunding Bonds Series R2018C | | | | |
GO Refunding Bonds Series R2020C | | | | |
GO Refunding Bonds Series R2023A | | | | |
Motor Vehicle Fuel Tax GO Refunding Bonds Series R2022D | | | | |
Motor Vehicle Fuel Tax GO Refunding Bonds Series R2023B | | | | |
Washington Convention Center Public Facilities District |
Lodging Tax Bonds Series 2018 | | | | |
Sub Lodging Tax Bonds Series 2018 | | | | |
| | | | |
|
West Virginia Parkways Auth |
| | | | |
Sr Lien Turnpike Toll RB Series 2018 | | | | |
| | | | |
50Schwab Municipal Bond ETF | Annual Report
Schwab Municipal Bond ETF
Portfolio Holdings as of December 31, 2023 (continued)
ISSUER TYPE OF SECURITY, SERIES | | | | |
|
|
GO Refunding Bonds Series 2 | | | | |
GO Refunding Bonds Series 20173 | | | | |
GO Refunding Bonds Series 2023-2 | | | | |
GO Refunding Bonds Series 2023-2 | | | | |
Refunding Bonds Series 2019A | | | | |
Transportation RB Series 2017-1 | | | | |
Wisconsin Center District |
| | | | |
| | | | |
|
Campbell Solid Waste Facilities |
| | | | |
Total Municipal Securities
(Cost $236,589,761) | |
Total Investments in Securities
(Cost $236,589,761) | |
| |
| The effective maturity may be shorter than the final maturity shown because the security is subject to a put, demand or call feature. |
| Credit-enhanced or liquidity-enhanced. |
| |
| Security or a portion of the security purchased on a delayed-delivery or when-issued basis. |
| VRDN is a municipal security which allows holders to sell their security through a put or tender feature, at par value plus accrued interest. The interest rate resets on a periodic basis, the majority of which are weekly but may be daily or monthly. Unless a reference rate and spread is shown parenthetically, the Remarketing Agent, generally a dealer, determines the interest rate for the security at each interest rate reset date. The rate is typically based on the SIFMA Municipal Swap Index. |
| |
| Community college district |
| Certificate of participation |
| |
| Industrial development agency/authority |
| Independent school district |
| |
| Revenue anticipation note |
| |
| |
| Union high school district |
| |
| |
| Variable rate demand note |
Schwab Municipal Bond ETF | Annual Report51
Schwab Municipal Bond ETF
Portfolio Holdings as of December 31, 2023 (continued)
The following is a summary of the inputs used to value the fund’s investments as of December 31, 2023 (see financial note 2(a) for additional information):
| QUOTED PRICES IN
ACTIVE MARKETS FOR
IDENTICAL ASSETS
(LEVEL 1) | OTHER SIGNIFICANT
OBSERVABLE INPUTS
(LEVEL 2) | SIGNIFICANT
UNOBSERVABLE INPUTS
(LEVEL 3) | |
| | | | |
| | | | |
| | | | |
| As categorized in the Portfolio Holdings. |
52Schwab Municipal Bond ETF | Annual Report
Schwab Municipal Bond ETF
Statement of Assets and Liabilities
|
Investments in securities, at value - unaffiliated (cost $236,589,761) | | |
| | |
| | |
| | |
| | |
| | |
| | |
|
|
| | |
| | |
Investments bought - delayed-delivery | | |
| | |
| | |
| | |
|
|
Capital received from investors | | |
Total distributable earnings | | |
| | |
Schwab Municipal Bond ETF | Annual Report53
Schwab Municipal Bond ETF
Statement of Operations
For the period January 1, 2023 through December 31, 2023 |
|
Interest received from securities - unaffiliated | | |
|
|
| | |
| | |
| | |
|
REALIZED AND UNREALIZED GAINS (LOSSES) |
Net realized losses on sales of securities - unaffiliated | | |
Net change in unrealized appreciation (depreciation) on securities - unaffiliated | | |
Net realized and unrealized gains | | |
Increase in net assets resulting from operations | | |
54Schwab Municipal Bond ETF | Annual Report
Schwab Municipal Bond ETF
Statement of Changes in Net Assets
For the current and prior report periods
|
| | |
| | | |
| | | |
Net change in unrealized appreciation (depreciation) | | | |
Increase in net assets resulting from operations | | | |
|
DISTRIBUTIONS TO SHAREHOLDERS |
| | | |
TRANSACTIONS IN FUND SHARES |
| | |
| | | | | |
| | | | | |
| | | | | |
Net transactions in fund shares | | | | | |
|
SHARES OUTSTANDING AND NET ASSETS |
| | |
| | | | | |
| | | | | |
| | | | | |
| | | | | |
| Commencement of operations. |
Schwab Municipal Bond ETF | Annual Report55
Schwab Municipal Bond ETF
1. Business Structure of the Fund:
Schwab Municipal Bond ETF is a series of Schwab Strategic Trust (the trust), a no-load, open-end management investment company. The trust is organized as a Delaware statutory trust and is registered under the Investment Company Act of 1940, as amended (the 1940 Act). The list below shows all the operational funds in the trust as of the end of the period, including the fund discussed in this report, which is highlighted:
|
Schwab Municipal Bond ETF | |
Schwab U.S. Broad Market ETF | Schwab Short-Term U.S. Treasury ETF |
| Schwab Intermediate-Term U.S. Treasury ETF |
Schwab U.S. Large-Cap ETF | Schwab Long-Term U.S. Treasury ETF |
Schwab U.S. Large-Cap Growth ETF | Schwab U.S. Aggregate Bond ETF |
Schwab U.S. Large-Cap Value ETF | Schwab 1-5 Year Corporate Bond ETF |
| Schwab 5-10 Year Corporate Bond ETF |
Schwab U.S. Small-Cap ETF | Schwab Fundamental U.S. Broad Market Index ETF |
Schwab U.S. Dividend Equity ETF | Schwab Fundamental U.S. Large Company Index ETF |
Schwab High Yield Bond ETF | Schwab Fundamental U.S. Small Company Index ETF |
Schwab International Dividend Equity ETF | Schwab Fundamental International Large Company Index ETF |
Schwab International Equity ETF | Schwab Fundamental International Small Company Index ETF |
Schwab International Small-Cap Equity ETF | Schwab Fundamental Emerging Markets Large Company Index ETF |
Schwab Emerging Markets Equity ETF | |
| Schwab Crypto Thematic ETF |
The fund issues and redeems shares at its net asset value per share (NAV) only in large blocks of shares (Creation Units). These transactions are usually in exchange for a basket of securities and/or an amount of cash. As a practical matter, only institutional investors who have entered into an authorized participant agreement purchase or redeem Creation Units. Except when aggregated in Creation Units, shares of the fund are not redeemable securities.
Individual shares of the fund trade on national securities exchanges and elsewhere during the trading day and can only be bought and sold at market prices throughout the trading day through a broker-dealer. Because fund shares trade at market prices rather than NAV, shares may trade at a price greater than NAV (premium) or less than NAV (discount). A chart showing the frequency at which the fund’s daily closing market price was at a discount or premium to the fund’s NAV can be found at www.schwabassetmanagement.com.
The fund maintains its own account for purposes of holding assets and accounting, and is considered a separate entity for tax purposes. Within its account, the fund may also keep certain assets in segregated accounts, as required by securities law. The "Fund Complex" includes The Charles Schwab Family of Funds, Schwab Capital Trust, Schwab Investments, Schwab Annuity Portfolios, Schwab Strategic Trust and Laudus Trust.
2. Significant Accounting Policies:The following is a summary of the significant accounting policies the fund uses in its preparation of financial statements. The fund follows the investment company accounting and reporting guidance of the Financial Accounting Standards Board (FASB) Accounting Standard Codification Topic 946 Financial Services — Investment Companies. The accounting policies are in conformity with accounting principles generally accepted in the United States of America (GAAP).
Pursuant to Rule 2a-5 under the 1940 Act, the Board of Trustees (the Board) has designated authority to a Valuation Designee, the fund’s investment adviser, to make fair valuation determinations under adopted procedures, subject to Board oversight. The investment adviser has formed a Pricing Committee to administer the pricing and valuation of portfolio securities and other assets and liabilities as well as to ensure that prices used for internal purposes or provided by third parties reasonably reflect fair value. The Valuation Designee may utilize independent pricing services, quotations from securities and financial instrument dealers and other market sources to determine fair value.
Securities held in the fund’s portfolio are valued every business day. The following valuation policies and procedures are used by the Valuation Designee to value various types of securities:
56Schwab Municipal Bond ETF | Annual Report
Schwab Municipal Bond ETF
Financial Notes (continued)
2. Significant Accounting Policies (continued):
• Bonds and notes: Fixed income investments are generally valued using an evaluated price at the mid-point of the bid/ask spread provided by an approved, independent pricing service (mid-price). To determine the evaluated mid-price, a pricing service may use a variety of techniques and inputs. Techniques may include, but are not limited to, spread models that calculate an investment-specific price relative to a benchmark or yield curve models that establish a price based on yields of comparable bonds along a range of maturities. Inputs differ by valuation approach and techniques, as appropriate, and examples of inputs may include, but are not limited to, interest rates, market conditions, comparable bonds, market trades, projected cash flows, credit reviews and issuer news.
• Short-term securities (60 days or less to maturity): Securities with remaining maturities of 60 days or less are generally valued at an evaluated price; however, such securities may be valued at their amortized cost if it approximates the security’s fair value.
• Securities for which no quoted value is available: The Valuation Designee has adopted procedures to fair value the fund’s securities when market prices are not “readily available” or are unreliable. For example, a security may be fair valued when it’s de-listed or its trading is halted or suspended; when a security’s primary pricing source is unable or unwilling to provide a price; or when a security’s primary trading market is closed during regular market hours. Fair value determinations are made in good faith in accordance with adopted valuation procedures. The Valuation Designee considers a number of factors, including unobservable market inputs, when arriving at fair value. The Valuation Designee may employ methods such as the review of related or comparable assets or liabilities, related market activities, recent transactions, market multiples, book values, transactional back-testing, disposition analysis and other relevant information. Due to the subjective and variable nature of fair value pricing, there can be no assurance that the fund could obtain the fair value assigned to the security upon the sale of such security.
In accordance with the authoritative guidance on fair value measurements and disclosures under GAAP, the fund discloses the fair value of its investments in a hierarchy that prioritizes the significant inputs to valuation methods used to measure the fair value. The hierarchy gives the highest priority to valuations based upon unadjusted quoted prices in active markets for identical assets or liabilities (Level 1 measurements) and the lowest priority to valuations based upon unobservable inputs that are significant to the valuation (Level 3 measurements). If inputs used to measure the financial instruments fall within different levels of the hierarchy, the categorization is based on the lowest level input that is significant to the valuation. If it is determined that either the volume and/or level of activity for an asset or liability has significantly decreased (from normal conditions for that asset or liability) or price quotations or observable inputs are not associated with orderly transactions, increased analysis and Valuation Designee’s judgment will be required to estimate fair value.
The three levels of the fair value hierarchy are as follows:
• Level 1 — quoted prices in active markets for identical investments — Investments whose values are based on quoted market prices in active markets. These generally include active listed equities, mutual funds, exchange-traded funds (ETFs) and futures contracts. Mutual funds and ETFs are classified as Level 1 prices, without consideration to the classification level of the underlying securities held which could be Level 1, Level 2 or Level 3 in the fair value hierarchy.
• Level 2 — other significant observable inputs (including quoted prices for similar securities, interest rates, prepayment speeds, credit risk, etc.) — Investments that trade in markets that are not considered to be active, but whose values are based on quoted market prices, dealer quotations or valuations provided by alternative pricing sources supported by observable inputs are classified as Level 2 prices. These generally include U.S. government and sovereign obligations, most government agency securities, investment-grade corporate bonds, certain mortgage products, less liquid listed equities, and state, municipal and provincial obligations.
• Level 3 — significant unobservable inputs (including the Valuation Designee’s assumptions in determining the fair value of investments) — Investments whose values are classified as Level 3 prices have significant unobservable inputs, as they may trade infrequently or not at all. When observable prices are not readily available for these securities, one or more valuation methods are used for which sufficient and reliable data is available. The inputs used in estimating the value of Level 3 prices may include the original transaction price, quoted prices for similar securities or assets in active markets, completed or pending third-party transactions in the underlying investment or comparable issuers, and changes in financial ratios or cash flows. Level 3 prices may also be adjusted to reflect illiquidity and/or non-transferability, with the amount of such discount estimated in the absence of market information. Assumptions used due to the lack of observable inputs may significantly impact the resulting fair value and therefore a fund’s results of operations.
The inputs or methodology used for valuing securities are not necessarily an indication of the risk associated with investing in those securities.
Schwab Municipal Bond ETF | Annual Report57
Schwab Municipal Bond ETF
Financial Notes (continued)
2. Significant Accounting Policies (continued):
The levels associated with valuing the fund’s investments as of December 31, 2023, are disclosed in the fund’s Portfolio Holdings.
(b) Accounting Policies for certain Portfolio Investments (if held):
Delayed-Delivery Transactions and When-Issued Securities: The fund may transact in securities on a delayed-delivery or when-issued basis. Payment and delivery may take place after the customary settlement period for that security. The price of the underlying securities and the date when the securities will be delivered and paid for are fixed at the time the transaction is negotiated. The securities purchased on a delayed-delivery or when-issued basis are identified as such in the fund’s Portfolio Holdings, if any. The fund may receive compensation for interest forgone in the purchase of a delayed-delivery or when-issued security. Losses may arise due to changes in the value of the underlying securities or if the counterparty does not perform under the contract’s terms, or if the issuer does not issue the securities due to political, economic, or other factors. The fund complies with Rule 18f-4 under the 1940 Act, the fund operates as a limited derivatives user, with respect to purchase commitments held within the fund, portfolio securities are no longer required to be segregated as collateral with a value at least equal to the amount of a purchase commitment and the fund’s exposure is monitored under a derivatives risk management program.
(c) Security Transactions:
Security transactions are recorded as of the date the order to buy or sell the security is executed. Realized gains and losses from security transactions are based on the identified costs of the securities involved.
Interest income is recorded as it accrues. If the fund buys a debt security at a discount (less than face value) or a premium (more than face value), it amortizes premiums and accretes discounts from the purchase settlement date up to maturity. The fund then increases (in the case of discounts) or reduces (in the case of premiums) the income it records from the security. Certain securities may be callable (meaning that the issuer has the option to pay it off before its maturity date). The fund amortizes the premium and accretes the discount on each callable security to the security’s maturity date, except when the purchase price is higher than the call price at the security’s call date (in which case the premium is amortized to the call date).
Pursuant to the Amended and Restated Advisory Agreement (Advisory Agreement) between the investment adviser and the trust, the investment adviser will pay the operating expenses of the fund, excluding taxes, any brokerage expenses, and extraordinary or non-routine expenses. Taxes, any brokerage expenses and extraordinary or non-routine expenses that are specific to the fund are charged directly to the fund. The Advisory Agreement excludes paying acquired fund fees and expenses, which are indirect expenses incurred by a fund through its investments in underlying funds.
(f) Distributions to Shareholders:
The fund makes distributions from net investment income, if any, monthly and from net realized capital gains, if any, once a year. To receive a distribution, you must be a registered shareholder on the record date. Distributions are paid to shareholders on the payable date.
(g) Accounting Estimates:
The accounting policies described in this report conform to GAAP. Notwithstanding this, shareholders should understand that in order to follow these principles, fund management has to make estimates and assumptions that affect the information reported in the financial statements. It’s possible that once the results are known, they may turn out to be different from these estimates and these differences may be material.
(h) Federal Income Taxes:
The fund intends to meet federal income and excise tax requirements for regulated investment companies under subchapter M of the Internal Revenue Code, as amended. Accordingly, the fund distributes substantially all of its net investment income and net realized capital gains, if any, to its respective shareholders each year. As long as the fund meets the tax requirements, it is not required to pay federal income tax.
58Schwab Municipal Bond ETF | Annual Report
Schwab Municipal Bond ETF
Financial Notes (continued)
2. Significant Accounting Policies (continued):
(i) Indemnification:
Under the fund’s organizational documents, the officers and trustees are indemnified against certain liabilities arising out of the performance of their duties to the fund. In addition, in the normal course of business the fund enters into contracts with its vendors and others that provide general indemnifications. The fund’s maximum exposure under these arrangements is unknown as this would involve future claims that may be made against the fund. However, based on experience, the fund expects the risk of loss attributable to these arrangements to be remote.
Effective January 24, 2023, the U.S. Securities and Exchange Commission (SEC) adopted rule and form amendments to require mutual funds and ETFs to transmit concise and visually engaging streamlined annual and semiannual reports to shareholders that highlight key information deemed important for retail investors to assess and monitor their fund investments. Other information, including financial statements, will no longer appear in a streamlined shareholder report but must be available online, delivered free of charge upon request, and filed on a semiannual basis on Form N-CSR. The rule and form amendments have a compliance date of July 24, 2024. At this time, management is evaluating the impact of these rule and form amendment changes on the content of the current shareholder report and the newly created annual and semiannual streamlined shareholder reports.
Investing in the fund may involve certain risks, as discussed in the fund’s prospectus, including, but not limited to, those described below. Any of these risks could cause an investor to lose money.
Market Risk. Financial markets rise and fall in response to a variety of factors, sometimes rapidly and unpredictably. Markets may be impacted by economic, political, regulatory and other conditions, including economic sanctions and other government actions. In addition, the occurrence of global events, such as war, terrorism, environmental disasters, natural disasters and epidemics, may also negatively affect the financial markets. As with any investment whose performance is tied to these markets, the value of an investment in the fund will fluctuate, which means that an investor could lose money over short or long periods.
Investment Style Risk. The fund is an index fund. Therefore, the fund follows the securities included in the index during upturns as well as downturns. Because of its indexing strategy, the fund does not take steps to reduce market exposure or to lessen the effects of a declining market. In addition, because of the fund’s expenses, the fund’s performance may be below that of the index. Errors relating to the index may occur from time to time and may not be identified by the index provider for a period of time. In addition, market disruptions could cause delays in the index’s rebalancing schedule. Such errors and/or market disruptions may result in losses for the fund.
Municipal Securities Risk. The fund primarily invests in municipal securities whose interest, in the opinion of the issuers’ counsel, is exempt from federal income tax and from the AMT. Neither the investment adviser nor the fund guarantees that this opinion is correct, and there is no assurance that the Internal Revenue Service (IRS) will agree with such counsel’s opinion. If certain types of investments the fund buys as tax-exempt are later ruled to be taxable, a portion of the fund’s income could be taxable. To the extent that the fund invests in municipal securities from a given state or geographic region, its share price and performance could be affected by local, state and regional factors, including erosion of the tax base and changes in the economic climate. In addition, many municipal securities are issued to finance specific projects (especially those relating to education, health care, transportation and utilities) and conditions in those sectors can affect the overall municipal market. National governmental actions, such as the elimination of tax-exempt status or the reduction of financial support to municipalities, also could affect performance. Municipalities continue to experience difficulties in the current economic and political environment.
Interest Rate Risk. Interest rates rise and fall over time. As with any investment whose yield reflects current interest rates, the fund’s yield will change over time. During periods when interest rates are low, the fund’s yield (and total return) also may be low. Changes in interest rates also may affect the fund’s share price: a rise in interest rates generally causes the fund’s share price to fall. The longer the fund’s portfolio duration, the more sensitive to interest rate movements its share price is likely to be. Also, a change in a central bank’s monetary policy or economic conditions, among other things, may result in a change in interest rates, which could have sudden and unpredictable effects on the markets and significantly impact the value of fixed-income securities in which the fund invests. A sudden or unpredictable rise in interest rates may cause volatility and the value of fixed-income securities to decline.
Schwab Municipal Bond ETF | Annual Report59
Schwab Municipal Bond ETF
Financial Notes (continued)
3. Risk Factors (continued):
Credit Risk. A decline in the credit quality of an issuer, guarantor or liquidity provider of a portfolio investment or a counterparty could cause the fund to lose money or underperform. The fund could lose money if, due to a decline in credit quality, the issuer, guarantor or liquidity provider of a portfolio investment or a counterparty fails to make, or is perceived as being unable or unwilling to make, timely principal or interest payments or otherwise honor its obligations.
Sampling Index Tracking Risk. The fund may not fully replicate the index and may hold securities not included in the index. As a result, the fund is subject to the risk that the investment adviser’s investment management strategy, the implementation of which is subject to a number of constraints, may not produce the intended results. Because the fund utilizes a sampling approach it may not track the return of the index as well as it would if the fund purchased all of the securities in the index.
Tracking Error Risk. As an index fund, the fund seeks to track the performance of the index, although it may not be successful in doing so. The divergence between the performance of the fund and the index, positive or negative, is called “tracking error.” Tracking error can be caused by many factors and it may be significant.
Portfolio Turnover Risk. The fund may engage in frequent trading of its portfolio securities in connection with its tracking of the index or in response to market conditions. A higher portfolio turnover rate may result in increased transaction costs, which may lower the fund’s performance. A higher portfolio turnover rate can also result in an increase in taxable capital gains distributions to the fund’s shareholders.
Prepayment and Extension Risk. Certain fixed-income securities are subject to the risk that the securities may be paid off earlier or later than expected, especially during periods of falling or rising interest rates, respectively. Prepayments of obligations could cause the fund to forgo future interest income on the portion of the security’s principal repaid early and force the fund to reinvest that money at the lower prevailing interest rates. Extensions of obligations could cause the fund to exhibit additional volatility and hold securities paying lower-than-market rates of interest. Either case could hurt the fund’s performance.
Derivatives Risk. The fund may invest in derivative instruments. The principal types of derivatives used by the fund are futures contracts. A futures contract is an agreement to buy or sell a financial instrument at a specific price on a specific day. The fund’s use of derivative instruments involves risks different from, or possibly greater than, the risks associated with investing directly in securities and other traditional investments. Certain of these risks, such as market risk, credit risk and liquidity risk, are discussed elsewhere in this section. The fund’s use of derivatives is also subject to lack of availability risk, valuation risk, correlation risk and tax risk. Lack of availability risk is the risk that suitable derivative transactions may not be available in all circumstances for risk management or other purposes. Valuation risk is the risk that a particular derivative may be valued incorrectly. Correlation risk is the risk that changes in the value of the derivative may not correlate perfectly with the underlying asset, rate or index. Tax risk is the risk that the use of derivatives may cause the fund to realize higher amounts of short-term capital gains. The fund’s use of derivatives could reduce the fund’s performance, increase the fund’s volatility, and cause the fund to lose more than the initial amount invested. The fund’s use of derivatives also could create a risk of counterparty default under certain transactions, risks that the fund would need to liquidate portfolio positions when it may not be advantageous to do so in order to meet margin and payment obligations, and legal risks relating to insufficient documentation, insufficient capacity or authority of a counterparty, or legality or enforceability of a contract. Furthermore, the use of derivatives subject to regulation by the Commodity Futures Trading Commission (CFTC) could cause the fund to become a commodity pool, which would require the fund to comply with certain CFTC rules.
Liquidity Risk. The fund may be unable to sell certain securities, such as illiquid securities, readily at a favorable time or price, or the fund may have to sell them at a loss.
Securities Lending Risk. Securities lending involves the risk of loss of rights in, or delay in recovery of, the loaned securities if the borrower fails to return the security loaned or becomes insolvent.
Concentration Risk. To the extent that the fund’s or the index’s portfolio is concentrated in the securities of issuers in a particular market, industry, group of industries, sector or asset class, the fund may be adversely affected by the performance of those securities, may be subject to increased price volatility and may be more vulnerable to adverse economic, market, political or regulatory occurrences affecting that market, industry, group of industries, sector or asset class.
Taxable Investments Risk. The fund may invest a portion of its assets in securities that generate income that is not exempt from federal income tax and in securities whose interest is subject to the AMT. These investments could generate taxable income for shareholders.
Market Trading Risk. Although fund shares are listed on national securities exchanges, there can be no assurance that an active trading market for fund shares will develop or be maintained. If an active market is not maintained, investors may find it difficult to buy or sell fund shares.
60Schwab Municipal Bond ETF | Annual Report
Schwab Municipal Bond ETF
Financial Notes (continued)
3. Risk Factors (continued):
Shares of the Fund May Trade at Prices Other Than NAV. Fund shares may be bought and sold in the secondary market at market prices. Although it is expected that the market price of the shares of the fund will approximate the fund’s NAV, there may be times when the market price and the NAV vary significantly. An investor may pay more than NAV when buying shares of the fund in the secondary market, and an investor may receive less than NAV when selling those shares in the secondary market. The market price of fund shares may deviate, sometimes significantly, from NAV during periods of market volatility or market disruption.
Please refer to the fund’s prospectus for a more complete description of the principal risks of investing in the fund.
4. Affiliates and Affiliated Transactions:Charles Schwab Investment Management, Inc., dba Schwab Asset Management, a wholly owned subsidiary of The Charles Schwab Corporation, serves as the fund’s investment adviser pursuant to the Advisory Agreement between the investment adviser and the trust.
For its advisory services to the fund, the investment adviser is entitled to receive an annual management fee, payable monthly, equal to 0.03% of the fund’s average daily net assets.
Interfund Borrowing and Lending
Pursuant to an exemptive order issued by the SEC, the fund may enter into interfund borrowing and lending transactions with other funds in the Fund Complex. All loans are for temporary or emergency purposes and the interest rate to be charged will be the average of the overnight repurchase agreement rate and the short-term bank loan rate. All loans are subject to numerous conditions designed to ensure fair and equitable treatment of all participating funds. The interfund lending facility is subject to the oversight and periodic review of the Board. The fund had no interfund borrowing or lending activity during the period.
5. Other Service Providers:SEI Investments Distribution Co. is the principal underwriter and distributor of shares of the fund.
State Street Bank and Trust Company (State Street) serves as the fund’s transfer agent. As part of these services, the transfer agent maintains records pertaining to the sale, redemption and transfer of the fund’s shares. The transfer agent is also responsible for the order-taking function for the fund’s shares.
State Street also serves as custodian and accountant for the fund. The custodian is responsible for the daily safekeeping of securities and cash held by the fund. The fund’s accountant maintains all books and records related to the fund’s transactions.
The Board may include people who are officers and/or directors of the investment adviser or its affiliates. Federal securities law limits the percentage of such “interested persons” who may serve on a trust’s board, and the trust was in compliance with these limitations throughout the report period. The fund did not pay any interested persons or non-interested persons (independent trustees). The independent trustees are paid by the investment adviser. For information regarding the trustees, please refer to the Trustees and Officers table at the end of this report.
During the period, the fund was a participant with other funds in the Fund Complex in a joint, syndicated, committed $1 billion line of credit (the Syndicated Credit Facility), which matured on September 28, 2023. On September 28, 2023, the Syndicated Credit Facility was amended to run for a new 364 day period with the line of credit amount remaining unchanged, maturing on September 26, 2024. Under the terms of the Syndicated Credit Facility, in addition to the investment adviser paying the interest charged on any borrowings by the fund, the investment adviser paid a commitment fee of 0.15% per annum on the fund’s proportionate share of the unused portion of the Syndicated Credit Facility.
Schwab Municipal Bond ETF | Annual Report61
Schwab Municipal Bond ETF
Financial Notes (continued)
7. Borrowing from Banks (continued):
During the period, the fund was a participant with other funds in the Fund Complex, in a joint, unsecured, uncommitted $400 million line of credit (the Uncommitted Credit Facility), with State Street, which matured on September 28, 2023. On September 28, 2023, the Uncommitted Credit Facility was amended to run for a new 364 day period with the line of credit amount remaining unchanged, maturing on September 26, 2024. Under the terms of the Uncommitted Credit Facility, the investment adviser pays interest on the amount the fund borrows. There were no borrowings by the fund from either line of credit during the period.
The fund also has access to custodian overdraft facilities. The fund may have utilized the overdraft facility and incurred an interest expense, which is paid by the investment adviser. The interest expense is determined based on a negotiated rate above the current Federal Funds Rate.
8. Purchases and Sales/Maturities of Investment Securities:For the period ended December 31, 2023, purchases and sales/maturities of securities (excluding in-kind transactions and short-term obligations) were as follows:
The consideration for the purchase of Creation Units of the fund often consists of the in-kind deposit of a designated portfolio of fixed-income securities, which constitutes an optimized representation of the securities involved in a relevant fund’s underlying index, and an amount of cash. Investors purchasing and redeeming Creation Units are subject to a standard creation transaction fee and a standard redemption transaction fee paid to the custodian to offset transfer and other transaction costs associated with the issuance and redemption of Creation Units. Purchasers and redeemers of Creation Units for cash are subject to an additional variable charge paid to the fund that will offset the transaction costs to the fund of buying or selling portfolio securities. Such variable charges are included in Other Capital on the Financial Highlights and on the Statement of Changes in Net Assets. In addition, purchasers and redeemers of shares in Creation Units are responsible for payment of the costs of transferring securities to or out of the fund. From time to time, the investment adviser may cover the cost of any transaction fees when believed to be in the best interests of the fund.
The in-kind transactions for the period ended December 31, 2023, were as follows:
IN-KIND PURCHASES
OF SECURITIES | IN-KIND SALES
OF SECURITIES |
| |
For the period ended December 31, 2023, the fund may realize net capital gains or losses resulting from in-kind redemptions of Creation Units. Because such gains or losses are not taxable to the fund and are not distributed to existing fund shareholders, the gains or losses are reclassified from accumulated net realized gains or losses to capital received from investors at the end of the fund’s tax year. These reclassifications have no effect on net assets or net asset value per share. The net realized gains or losses on sales of in-kind redemptions for the period ended December 31, 2023, are disclosed in the fund’s Statement of Operations, if any.
10. Federal Income Taxes:As of December 31, 2023, the tax basis cost of the fund’s investments and gross unrealized appreciation and depreciation were as follows:
| | GROSS UNREALIZED
APPRECIATION | GROSS UNREALIZED
DEPRECIATION | NET UNREALIZED
APPRECIATION
(DEPRECIATION) |
| | | | |
| | | | |
| | | | |
62Schwab Municipal Bond ETF | Annual Report
Schwab Municipal Bond ETF
Financial Notes (continued)
10. Federal Income Taxes (continued):
As of December 31, 2023, the components of distributable earnings on a tax basis were as follows:
UNDISTRIBUTED
TAX-EXEMPT
INCOME | NET UNREALIZED
APPRECIATION
(DEPRECIATION)
ON INVESTMENTS | CAPITAL LOSS
CARRYFORWARDS AND OTHER LOSSES | |
| | | |
The primary difference between book basis and tax basis unrealized appreciation or unrealized depreciation of investments is the differing treatment of amortization of bond discounts and premiums. The tax cost of the fund’s investments, disclosed above, have been adjusted from their book amounts to reflect these unrealized appreciation or depreciation differences, as applicable.
Capital loss carryforwards have no expiration and may be used to offset future realized capital gains for federal income tax purposes. As of December 31, 2023, the fund had capital loss carryforwards of $440,748.
The tax basis components of distributions paid during the current and prior fiscal years were as follows:
| CURRENT FISCAL YEAR END DISTRIBUTIONS | PRIOR FISCAL YEAR END DISTRIBUTIONS |
| | | | |
| | | | |
Distributions paid to shareholders are based on net investment income and net realized gains determined on a tax basis, which may differ from net investment income and net realized gains for financial reporting purposes. These differences reflect the differing character of certain income items and net realized gains and losses for financial statement and tax purposes, and may result in reclassification among certain capital accounts in the financial statements. The fund may also designate a portion of the amount paid to redeeming shareholders as a distribution for tax purposes.
Permanent book and tax basis differences may result in reclassifications between components of net assets as required. The adjustments have no impact on net assets or the results of operations.
As of December 31, 2023, management has reviewed the tax positions for open periods (for federal purposes, three years from the date of filing and for state purposes, four years from the date of filing) as applicable to the fund, and has determined that no provision for income tax is required in the fund’s financial statements. The fund recognizes interest and penalties, if any, related to unrecognized tax benefits as income tax expense in the fund’s Statement of Operations. During the period ended December 31, 2023, the fund did not incur any interest or penalties.
Management has determined there are no subsequent events or transactions through the date the financial statements were issued that would have materially impacted the financial statements as presented.
Schwab Municipal Bond ETF | Annual Report63
Schwab Municipal Bond ETF
Report of Independent Registered Public Accounting Firm
To the Board of Trustees of Schwab Strategic Trust and Shareholders of Schwab Municipal Bond ETF:
Opinion on the Financial Statements and Financial Highlights
We have audited the accompanying statement of assets and liabilities, including the portfolio holdings, of Schwab Municipal Bond ETF (the “Fund”), one of the funds constituting Schwab Strategic Trust, as of December 31, 2023, the related statement of operations for the year then ended, the statements of changes in net assets and the financial highlights for the year then ended and for the period from October 12, 2022 (commencement of operations) through December 31, 2022, and the related notes. In our opinion, the financial statements and financial highlights present fairly, in all material respects, the financial position of the Fund as of December 31, 2023, and the results of its operations for the year then ended, the changes in its net assets and the financial highlights for the year then ended and for the period from October 12, 2022 (commencement of operations) through December 31, 2022 in conformity with accounting principles generally accepted in the United States of America.
These financial statements and financial highlights are the responsibility of the Fund’s management. Our responsibility is to express an opinion on the Fund’s financial statements and financial highlights based on our audits. We are a public accounting firm registered with the Public Company Accounting Oversight Board (United States) (PCAOB) and are required to be independent with respect to the Fund in accordance with the U.S. federal securities laws and the applicable rules and regulations of the Securities and Exchange Commission and the PCAOB.
We conducted our audits in accordance with the standards of the PCAOB. Those standards require that we plan and perform the audit to obtain reasonable assurance about whether the financial statements and financial highlights are free of material misstatement, whether due to error or fraud. The Fund is not required to have, nor were we engaged to perform, an audit of its internal control over financial reporting. As part of our audits, we are required to obtain an understanding of internal control over financial reporting but not for the purpose of expressing an opinion on the effectiveness of the Fund’s internal control over financial reporting. Accordingly, we express no such opinion.
Our audits included performing procedures to assess the risks of material misstatement of the financial statements and financial highlights, whether due to error or fraud, and performing procedures that respond to those risks. Such procedures included examining, on a test basis, evidence regarding the amounts and disclosures in the financial statements and financial highlights. Our audit also included evaluating the accounting principles used and significant estimates made by management, as well as evaluating the overall presentation of the financial statements and financial highlights. Our procedures included confirmation of securities owned as of December 31, 2023, by correspondence with the custodian and brokers. We believe that our audit provides a reasonable basis for our opinion.
Deloitte & Touche LLP
Denver, Colorado
February 16, 2024
We have served as the auditor of one or more investment companies in the Schwab Funds Complex since 2020.
64Schwab Municipal Bond ETF | Annual Report
Schwab Municipal Bond ETF
Other Federal Tax Information (unaudited)
Under section 852(b)(5) of the Internal Revenue Code, the fund designates 99.96% of the distributions paid from net investment income as exempt interest dividends for the period ended December 31, 2023.
Schwab Municipal Bond ETF | Annual Report65
Schwab Municipal Bond ETF
Liquidity Risk Management Program (unaudited)
The fund has adopted and implemented a liquidity risk management program (the “program”) as required by Rule 22e-4 under the Investment Company Act of 1940, as amended. The fund’s Board of Trustees (the “Board”) has designated the fund’s investment adviser, Charles Schwab Investment Management, Inc., dba Schwab Asset Management, as the administrator of the program. Personnel of the investment adviser or its affiliates conduct the day-to-day operation of the program.
Under the program, the investment adviser manages a fund’s liquidity risk, which is the risk that the fund could not meet shareholder redemption requests without significant dilution of remaining shareholders’ interests in the fund. The program is reasonably designed to assess and manage a fund’s liquidity risk, taking into consideration the fund’s investment strategy and the liquidity of its portfolio investments during normal and reasonably foreseeable stressed conditions; its historical redemption history and shareholder concentrations; and its cash holdings and access to other funding sources, including the custodian overdraft facility and lines of credit. The investment adviser’s process of determining the degree of liquidity of each fund’s investments is supported by third-party liquidity assessment vendors.
The fund’s Board reviewed a report at its meeting held on September 19, 2023 prepared by the investment adviser regarding the operation and effectiveness of the program for the period June 1, 2022, through May 31, 2023, which included individual fund liquidity metrics. The report summarized the operation of the program and the information and factors considered by the investment adviser in assessing whether the program has been adequately and effectively implemented with respect to a fund. In addition, the investment adviser provided its assessment that the program had been operating effectively in managing the fund’s liquidity risk.
66Schwab Municipal Bond ETF | Annual Report
Schwab Municipal Bond ETF
Trustees and Officers
The tables below give information about the trustees and officers of Schwab Strategic Trust, which includes the fund covered in this report. The “Fund Complex” includes The Charles Schwab Family of Funds, Schwab Capital Trust, Schwab Investments, Schwab Annuity Portfolios, Schwab Strategic Trust and Laudus Trust. The Fund Complex includes 106 funds.
The address for all trustees and officers is 211 Main Street, San Francisco, CA 94105. You can find more information about the trustees and officers in the Statement of Additional Information, which is available free by calling 1-877-824-5615.
|
Name, Year of Birth, and Position(s) with the trust (Terms of office, and length of Time Served1) | Principal Occupations During the Past Five Years | Number of Portfolios in Fund Complex Overseen by the Trustee | |
Michael J. Beer 1961 Trustee (Trustee of The Charles Schwab Family of Funds, Schwab Investments, Schwab Capital Trust, Schwab Annuity Portfolios, Schwab Strategic Trust and Laudus Trust since 2022) | Retired. Director, President and Chief Executive Officer (Dec. 2016 – Sept. 2019), Principal Funds (investment management). | | Director (2016 – 2019), Principal Funds, Inc. |
Robert W. Burns 1959 Trustee (Trustee of Schwab Strategic Trust since 2009; The Charles Schwab Family of Funds, Schwab Investments, Schwab Capital Trust, Schwab Annuity Portfolios and Laudus Trust since 2016) | Retired/Private Investor. | | |
Nancy F. Heller 1956 Trustee (Trustee of The Charles Schwab Family of Funds, Schwab Investments, Schwab Capital Trust, Schwab Annuity Portfolios, Schwab Strategic Trust and Laudus Trust since 2018) | | | |
David L. Mahoney 1954 Trustee (Trustee of The Charles Schwab Family of Funds, Schwab Investments, Schwab Capital Trust, Schwab Annuity Portfolios and Laudus Trust since 2011; Schwab Strategic Trust since 2016) | | | Director (2004 – present), Corcept Therapeutics Incorporated Director (2009 – 2021), Adamas Pharmaceuticals, Inc. Director (2003 – 2019), Symantec Corporation |
Jane P. Moncreiff 1961 Trustee (Trustee of The Charles Schwab Family of Funds, Schwab Investments, Schwab Capital Trust, Schwab Annuity Portfolios, Schwab Strategic Trust and Laudus Trust since 2019) | Consultant (2018 – present), Fulham Advisers LLC (management consulting); Chief Investment Officer (2009 – 2017), CareGroup Healthcare System, Inc. (healthcare). | | |
Schwab Municipal Bond ETF | Annual Report67
Schwab Municipal Bond ETF
Independent Trustees (continued) |
Name, Year of Birth, and Position(s) with the trust (Terms of office, and length of Time Served1) | Principal Occupations During the Past Five Years | Number of Portfolios in Fund Complex Overseen by the Trustee | |
Kimberly S. Patmore 1956 Trustee (Trustee of The Charles Schwab Family of Funds, Schwab Investments, Schwab Capital Trust, Schwab Annuity Portfolios, Schwab Strategic Trust and Laudus Trust since 2016) | Consultant (2008 – present), Patmore Management Consulting (management consulting). | | |
J. Derek Penn 1957 Trustee (Trustee of The Charles Schwab Family of Funds, Schwab Investments, Schwab Capital Trust, Schwab Annuity Portfolios, Schwab Strategic Trust and Laudus Trust since 2021) | Head of Equity Sales and Trading (2006 – 2018), BNY Mellon (financial services). | | |
|
Name, Year of Birth, and Position(s) with the trust (Terms of office, and length of Time Served1) | Principal Occupations During the Past Five Years | Number of Portfolios in Fund Complex Overseen by the Trustee | |
Walter W. Bettinger II2 1960 Chairman and Trustee (Trustee of The Charles Schwab Family of Funds, Schwab Investments, Schwab Capital Trust and Schwab Annuity Portfolios since 2008; Schwab Strategic Trust since 2009; Laudus Trust since 2010) | Co-Chairman of the Board (July 2022 – present), Director and Chief Executive Officer (Oct. 2008 – present) and President (Feb. 2007 – Oct. 2021), The Charles Schwab Corporation; President and Chief Executive Officer (Oct. 2008 – Oct. 2021) and Director (May 2008 – Oct. 2021), Charles Schwab & Co., Inc.; Co-Chairman of the Board (July 2022 – present) and Director (Apr. 2006 – present), Charles Schwab Bank, SSB; Co-Chairman of the Board (July 2022 – present) and Director (Nov. 2017 – present), Charles Schwab Premier Bank, SSB; Co-Chairman of the Board (July 2022 – present) and Director (July 2019 – present), Charles Schwab Trust Bank; Director (May 2008 – present), Chief Executive Officer (Aug. 2017 – present) and President (Aug. 2017 – Nov. 2021), Schwab Holdings, Inc.; Manager (Sept. 2023 – present), TD Ameritrade Holding LLC; Director (Oct. 2020 – Aug. 2023), TD Ameritrade Holding Corporation; Director (July 2016 – Oct. 2021), Charles Schwab Investment Management, Inc. | | Director (2008 – present), The Charles Schwab Corporation |
Richard A. Wurster2 1973 Trustee (Trustee of The Charles Schwab Family of Funds, Schwab Investments, Schwab Capital Trust, Schwab Annuity Portfolios, Schwab Strategic Trust and Laudus Trust since 2022) | President (Oct. 2021 – present) and Executive Vice President – Schwab Asset Management Solutions (Apr. 2019 – Oct. 2021), The Charles Schwab Corporation; President, Director (Oct. 2021 – present), Executive Vice President – Schwab Asset Management Solutions (July 2019 – Oct. 2021) and Senior Vice President – Advisory (May 2016 – July 2019), Charles Schwab & Co., Inc.; President (Nov. 2021 – present), Schwab Holdings, Inc.; Director (Oct. 2021 – present) and Chief Executive Officer (Nov. 2019 – Jan. 2022), Charles Schwab Investment Management, Inc.; Director, Chief Executive Officer and President (Mar. 2018 – Oct. 2022), Charles Schwab Investment Advisory, Inc.; Chief Executive Officer (July 2016 – Apr. 2018) and President (Mar. 2017 – Apr. 2018), ThomasPartners, Inc.; Chief Executive Officer (July 2016 – Apr. 2018), Windhaven Investment Management, Inc. | | |
68Schwab Municipal Bond ETF | Annual Report
Schwab Municipal Bond ETF
|
Name, Year of Birth, and Position(s) with the trust (Terms of office, and length of Time Served3) | Principal Occupations During the Past Five Years |
Omar Aguilar 1970 Chief Executive Officer, President and Chief Investment Officer (Officer of The Charles Schwab Family of Funds, Schwab Investments, Schwab Capital Trust, Schwab Annuity Portfolios, Schwab Strategic Trust and Laudus Trust since 2011) | Chief Executive Officer (Jan. 2022 – present), President (Oct. 2023 – present), (Chief Investment Officer (Apr. 2011 – present) and Senior Vice President (Apr. 2011 – Jan. 2022), Charles Schwab Investment Management, Inc.; Director, Chief Executive Officer and President (Oct. 2022 – present), Charles Schwab Investment Advisory, Inc.; Chief Executive Officer (Sept. 2023 – present), President (Oct. 2023 – present), Chief Investment Officer (June 2011 – present) and Vice President (June 2011 – Sept. 2023), Schwab Funds, Laudus Trust and Schwab ETFs. |
Mark Fischer 1970 Chief Operating Officer (Officer of The Charles Schwab Family of Funds, Schwab Investments, Schwab Capital Trust, Schwab Annuity Portfolios, Schwab Strategic Trust and Laudus Trust since 2013) | Chief Operating Officer (Dec. 2020 – present) and Treasurer and Chief Financial Officer (Jan. 2016 – Dec. 2022), Schwab Funds, Laudus Trust and Schwab ETFs; Chief Financial Officer (Mar. 2020 – present), Chief Operating Officer (Oct. 2023 – present), Managing Director (Mar. 2023 – present) and Vice President (Oct. 2013 – Mar. 2023), Charles Schwab Investment Management, Inc. |
Dana Smith 1965 Treasurer and Chief Financial Officer (Officer of The Charles Schwab Family of Funds, Schwab Investments, Schwab Capital Trust, Schwab Annuity Portfolios, Schwab Strategic Trust and Laudus Trust since 2023) | Treasurer and Chief Financial Officer (Jan. 2023 – present) and Assistant Treasurer (Dec. 2015 – Dec. 2022), Schwab Funds, Laudus Trust and Schwab ETFs; Managing Director (Mar. 2023 – present), Vice President (Mar. 2022 – Mar. 2023) and Director (Oct. 2015 – Mar. 2022), Charles Schwab Investment Management, Inc.; Managing Director (May 2022 – present) and Vice President (Apr. 2022 – May 2022), Charles Schwab & Co., Inc. |
Patrick Cassidy 1964 Vice President and Chief Investment Officer (Officer of The Charles Schwab Family of Funds, Schwab Investments, Schwab Capital Trust, Schwab Annuity Portfolios, Schwab Strategic Trust and Laudus Trust since 2018) | Chief Investment Officer (Oct. 2023 – present) and Vice President (Feb. 2018 – present), Schwab Funds, Laudus Trust and Schwab ETFs; Managing Director (Mar. 2023 – present), Chief Investment Officer (Oct. 2023 – present), and Senior Vice President (Oct. 2012 – Mar. 2023), Charles Schwab Investment Management, Inc. |
William P. McMahon, Jr. 1972 Vice President and Chief Investment Officer (Officer of The Charles Schwab Family of Funds, Schwab Investments, Schwab Capital Trust, Schwab Annuity Portfolios, Schwab Strategic Trust and Laudus Trust since 2021) | Managing Director (Mar. 2023 – present), Senior Vice President (Jan. 2020 – Mar. 2023) and Chief Investment Officer (Jan. 2020 – present) Charles Schwab Investment Management, Inc.; Vice President and Chief Investment Officer (June 2021 – present), Schwab Funds, Laudus Trust and Schwab ETFs; Senior Vice President and Chief Investment Officer – ThomasPartners Strategies (Apr. 2018 – Dec. 2019), Charles Schwab Investment Advisory, Inc.; Senior Vice President and Chief Investment Officer (May 2001 – Apr. 2018), ThomasPartners, Inc. |
Catherine MacGregor 1964 Chief Legal Officer and Secretary, Schwab Funds and Schwab ETFs Chief Legal Officer, Vice President and Clerk, Laudus Trust (Officer of The Charles Schwab Family of Funds, Schwab Investments, Schwab Capital Trust, Schwab Annuity Portfolios and Laudus Trust since 2005; Schwab Strategic Trust since 2009) | Chief Legal Officer (Mar. 2022 – present), Managing Director (Mar. 2023 – present) and Vice President (Sept. 2005 – Mar. 2023), Charles Schwab Investment Management, Inc.; Managing Director (May 2022 – present) and Vice President (Aug. 2005 – May 2022), Charles Schwab & Co., Inc.; Vice President (Dec. 2005 – present) and Chief Legal Officer and Clerk (Mar. 2007 – present), Laudus Trust; Chief Legal Officer and Secretary (Oct. 2021 – present), Vice President (Nov. 2005 – Oct. 2021) and Assistant Secretary (June 2007 – Oct. 2021), Schwab Funds; Chief Legal Officer and Secretary (Oct. 2021 – present), Vice President and Assistant Secretary (Oct. 2009 – Oct. 2021), Schwab ETFs. |
1
Each Trustee shall hold office until the election and qualification of his or her successor, or until he or she dies, resigns or is removed. The retirement policy requires that each independent trustee retire by December 31 of the year in which the Trustee turns 74 or the Trustee’s twentieth year of service as an independent trustee on any trust in the Fund Complex, whichever occurs first.
2
Mr. Bettinger and Mr. Wurster are Interested Trustees. Mr. Bettinger and Mr. Wurster are Interested Trustees because each owns stock of The Charles Schwab Corporation (CSC), the parent company of Charles Schwab Investment Management, Inc., the investment adviser for the trusts in the Fund Complex, and is an employee of Charles Schwab & Co., Inc. (Schwab), the principal underwriter for The Charles Schwab Family of Funds, Schwab Investments, Schwab Capital Trust, Schwab Annuity Portfolios and Laudus Trust.
3
The President, Treasurer and Secretary/Clerk hold office until their respective successors are chosen and qualified or until he or she sooner dies, resigns, is removed or becomes disqualified. Each of the other officers serves at the pleasure of the Board.
Schwab Municipal Bond ETF | Annual Report69
Schwab Municipal Bond ETF
Alternative Minimum Tax (AMT) A federal income tax designed to limit the extent to which high-income taxpayers (including individuals, estates, trusts and corporations) can benefit from certain deductions and exemptions. For example, some types of income that are exempt from regular federal income tax are not exempt from the AMT.
asset allocation The practice of dividing a portfolio among different asset classes, with each asset class assigned a particular percentage to help offset risks and rewards, based on your goals, time horizon and risk tolerance.
asset-backed securities Bond or other debt securities that represent ownership in a pool of assets such as credit card debt.
asset class A group of securities with similar structure and basic characteristics. Stocks, bonds and cash are the three main examples of asset classes.
authorized participant (AP) A large institutional investor that places orders for creation units with the funds’ distributor.
bid The highest price at which someone is willing to buy a security.
Bloomberg US Aggregate Bond Index An index that is a broad-based benchmark measuring the performance of the U.S. investment grade, taxable bond market, including U.S. Treasuries, government-related and corporate bonds, mortgage pass-through securities, commercial mortgage-backed securities, and asset-backed securities that are publicly available for sale in the United States. To be eligible for inclusion in the index, securities must be fixed rate, non-convertible, U.S. dollar-denominated with at least $300 million or more of outstanding face value and have one or more years remaining to maturity. The index excludes certain types of securities, including tax-exempt state and local government series bonds, structured notes embedded with swaps or other special features, private placements, floating rate securities, inflation-linked bonds and Eurobonds. The index is market capitalization weighted and the securities in the index are updated on the last business day of each month.
bond A security representing a loan from the investor to the issuer. A bond typically pays interest at a fixed rate (the “coupon rate”) until a specified date (the “maturity date”), at which time the issuer returns the money borrowed (“principal” or “face value”) to the bondholder. Because of their structure, bonds are sometimes called “fixed income securities” or “debt securities.”
call An early repayment of a bond’s principal by the issuer, usually done because the issuer is able to refinance its bond debt at a lower rate.
call protection A term used in reference to a bond that cannot be called by the issuer before maturity, or at least for many years from the present date. A bond that offers call protection can more reliably be expected to provide a given yield over a given number of years than a bond that could be called (assuming both bonds are of the same credit quality).
capital gain, capital loss The difference between the amount paid for an investment and its value at a later time. If the investment has been sold, the capital gain or loss is considered a realized gain or loss. If the investment is still held, the gain or loss is still “on paper” and is considered unrealized.
commencement of operations The date that the first NAV was calculated.
coupon, coupon rate The annual rate of interest paid until maturity by the issuer of a debt security.
creation unit (C.U.) A basket of securities that is delivered by an authorized participant (AP) to the fund equal to the current holdings of the ETF, plus a designated cash component. In return, the APs receive a large block of ETF shares (typically 50,000 shares), which investors can then buy and sell in the secondary market.
credit-enhanced securities Securities that are backed by the credit of an entity other than the issuer (such as a financial institution). Credit enhancements, which can equal up to 100% of the security’s value, are designed to help lower the risk of default on a security and may also make the security more liquid.
credit quality The capacity of an issuer to make its interest and principal payments; an assessment typically rendered by an independent third-party organization.
credit risk The risk that a bond issuer may be unable to pay interest or principal to its bondholders.
duration A measure of an individual bond’s sensitivity to interest rates, expressed in years. Calculations of duration generally take into account the bond’s yield, interest payments, maturity date and call features.
weighted average duration A measure of the duration of all bonds in a fund’s portfolio, also expressed in years, based on the market value weighted average duration of each bond in the portfolio.
exchange A marketplace, or any organization or group that provides or maintains a marketplace for trading securities, options, futures, or commodities.
expense ratio The amount that is taken from the fund’s assets each year to cover the operating expenses. An expense ratio of 0.50% means that a fund’s expenses amount to half of one percent of its average net assets a year.
face value The value of a bond, note, mortgage or other security as given on the certificate or instrument. Face value is also referred to as par value or nominal value.
general obligation bonds Municipal bonds that are secured by the issuer’s full faith and credit, which typically is backed by the power of the issuer to levy taxes.
ICE AMT-Free Core U.S. National Municipal Index An index that tracks the performance of U.S. dollar denominated investment grade tax-exempt debt publicly issued in the U.S. domestic market by U.S. states and territories as well as their political subdivisions. Qualifying securities must be exempt from Federal taxes and must not be subject to alternative minimum tax. In addition, qualifying securities must have at least one day remaining term to final maturity, a fixed coupon schedule (including zero coupon bonds) and an investment grade rating (based on the middle rating of Moody’s, S&P and Fitch). If rated by all three agencies, two of the three ratings must be Baa3/BBB- or higher; if rated by two agencies, the lowest rating must be Baa3/BBB- or higher; and if rated by a single agency the security must be rated Baa3/BBB- or higher. Qualifying securities must have at least $25 million currently outstanding face value and must be part of a deal with an original offering size of at least $100 million. Limited offering securities qualify for inclusion. The index excludes certain types of securities, including, among others, floating rate debt, step-coupon bonds, private placements, and securities in legal default. Index constituents are market capitalization weighted. Accrued interest is
70Schwab Municipal Bond ETF | Annual Report
Schwab Municipal Bond ETF
calculated assuming next-day settlement. Cash flows from bond payments that are received during the month are retained in the index until the end of the month and then are removed as part of the rebalancing. Cash does not earn any reinvestment income while it is held in the index. All inclusion rules and constraints are imposed monthly as part of the index rebalancing. The index is rebalanced on the last calendar day of the month.
inception date The date that the shares began trading in the secondary market.
indicative optimized portfolio value (IOPV) A calculation disseminated by the stock exchange that approximates the fund’s NAV every 15 seconds throughout the trading day.
interest Payments to bondholders (usually made twice a year) as compensation for loaning the bond principal to the issuer.
interest rate risk The risk that a bond’s value will fluctuate if market interest rates change or are expected to change. Bond prices tend to move in the opposite direction of interest rates: when interest rates rise, bond prices tend to fall.
liquidity The ability to convert a security or asset quickly into cash.
liquidity-enhanced security A security that when tendered is paid from funds advanced by an entity other than the issuer (such as a large financial institution). Liquidity enhancements are often used on variable-rate securities where the portfolio manager has an option to tender the securities prior to their final maturity.
market price return The return based on the change in market price per share of the fund over a given time period. Market price returns assume that dividends and capital gain distributions have been reinvested in the fund at market price.
market risk Those elements of risk that are common to all securities in an asset class, and therefore cannot be significantly reduced by diversification within the asset class. Also known as “systemic risk.”
maturity The maturity of a bond will generally be determined using a portfolio security’s final maturity date (date on which the final principal payment of a bond is scheduled to be paid); however, for securitized products, such as mortgage-backed securities and certain other asset-backed securities, maturity will be determined on an average life basis (weighted average time to receipt of all principal payments) by the investment adviser. Because pre-payment rates of individual mortgage pools vary widely, the average life of a particular pool cannot be predicted precisely. For securities with embedded demand features, such as puts or calls, either the demand date or the final maturity date will be used depending on interest rates, yields and other market conditions. The weighted average maturity (WAM) of a fund is dollar-weighted based upon the market value of a fund’s securities at the time of the calculation.
mortgage-backed securities Bond or other debt securities that represent ownership in a pool of mortgage loans.
muni, municipal bonds, municipal securities Debt securities issued by a state, its counties, municipalities, authorities and other subdivisions, or the territories and possessions of the United States and the District of Columbia, including their subdivisions, agencies and instrumentalities and corporations. These securities may be issued to obtain money for various public purposes, including the construction of a wide range of public facilities such as airports, bridges, highways, housing, hospitals, mass transportation, public utilities, schools, streets, and water and sewer works.
net asset value (NAV) The value of one share of a fund. NAV is calculated by taking the fund’s total assets, subtracting liabilities, and dividing by the number of shares outstanding.
NAV return The return based on the change in NAV of the fund over a given time period. NAV returns assume that dividends and capital gain distributions have been reinvested in the fund.
offer (ask) The lowest price at which an individual is willing to sell a security.
open The price at which a security opened for trading on a given day.
outstanding shares, shares outstanding When speaking of the fund, indicates all shares currently held by investors.
prepayment risk The risk that a mortgage-backed security may be paid off early, typically because interest rates have fallen and the homeowners who hold the underlying mortgages have refinanced those mortgages at lower rates. In this type of situation, the investor who held the mortgage-backed security will usually have to settle for a lower rate when reinvesting the principal.
primary market The market that deals with the issuance of new securities.
refunded bond A bond for which the principal and interest payments are secured or guaranteed by cash or U.S. government securities held in an escrow account.
replication If a fund uses a full replication method, the fund will invest substantially all of its assets proportionately in the securities included in the underlying index.
revenue bonds Municipal bonds that are issued to finance public works projects and are secured by revenue generated by the project (such as water and sewer fees) rather than the full faith and credit of the issuer.
S&P 500 Index An index that is designed to measure the performance of 500 leading publicly traded companies from a broad range of industries.
sampling If a fund uses a sampling method, the fund will not fully replicate the underlying index and may hold securities not included in the index. A fund that utilizes a sampling approach may not track the return of the index as closely as a fund that uses a full replication method.
secondary market The market in which investors purchase securities from other investors rather than directly from the issuing companies. Organized exchanges facilitate the trading of securities in the secondary market.
spread The gap between bid and ask prices of a security.
total return The percentage that an investor would have earned or lost on an investment in the fund assuming dividends and distributions were reinvested.
tracking error The difference between the performance of the fund and its benchmark index, positive or negative.
Treasury inflation protected security (TIPS) A United States Treasury bond whose principal increases at the same rate as the Consumer Price Index (CPI).The interest payment is then calculated off that inflated (adjusted) principal and repaid at maturity.
weighted average For mutual funds or ETFs, an average that gives the same weight to each security as the security represents in the fund’s portfolio.
yield The income paid out by an investment, expressed as a percentage of the investment’s market value.
Schwab Municipal Bond ETF | Annual Report71
Schwab Municipal Bond ETF
yield to maturity The annualized rate of return a bondholder could expect if the bond were held to maturity. In addition to interest payments, yield to maturity also factors in any difference between a bond’s current price and its principal amount, or face value.
72Schwab Municipal Bond ETF | Annual Report
Schwab Municipal Bond ETF
Schwab ETFs
Schwab ETFs are designed to serve as simple low-cost core investment products for a diversified portfolio. These ETFs seek to provide consistent, repeatable performance through a variety of investment strategies that span the equity and fixed income spectrum. The list below shows all currently available Schwab ETFs.
Investors should carefully consider information contained in the prospectus, or if available, the summary prospectus, including investment objectives, risks, charges and expenses before investing. Please call 1-877-824-5615 for a prospectus for any Schwab ETF. Please read the prospectus carefully before you invest. This report must be preceded or accompanied by a current prospectus.
Proxy Voting Policies, Procedures and Results
A description of the proxy voting policies and procedures used to determine how to vote proxies on behalf of the funds is available without charge, upon request, by visiting the Schwab ETFs’ website at www.schwabassetmanagement.com/schwabetfs_prospectus, the SEC’s website at www.sec.gov, or by contacting Schwab ETFs at 1-877-824-5615.
Information regarding how a fund voted proxies relating to portfolio securities during the most recent twelve-month period ended June 30 is available, without charge, by visiting the fund’s website at www.schwabassetmanagement.com/schwabetfs_prospectus or the SEC’s website at www.sec.gov.
U.S. ETFs
Schwab U.S. Broad Market ETF
Schwab 1000 Index® ETF
Schwab U.S. Large-Cap ETF
Schwab U.S. Large-Cap Growth ETF
Schwab U.S. Large-Cap Value ETF
Schwab U.S. Mid-Cap ETF
Schwab U.S. Small-Cap ETF
Schwab U.S. Dividend Equity ETF
Schwab U.S. REIT ETF
Schwab International Dividend Equity ETF
Schwab International Equity ETF
Schwab International Small-Cap Equity ETF
Schwab Emerging Markets Equity ETF
Schwab U.S. TIPS ETF
Schwab Short-Term U.S. Treasury ETF
Schwab Intermediate-Term U.S. Treasury ETF
Schwab Long-Term U.S. Treasury ETF
Schwab U.S. Aggregate Bond ETF
Schwab 1-5 Year Corporate Bond ETF
Schwab 5-10 Year Corporate Bond ETF
Schwab Municipal Bond ETF
Schwab High Yield Bond ETF
Fundamental Index* ETFs
Schwab Fundamental U.S. Broad Market Index ETF
Schwab Fundamental U.S. Large Company Index ETF
Schwab Fundamental U.S. Small Company Index ETF
Schwab Fundamental International Large Company Index ETF
Schwab Fundamental International Small Company Index ETF
Schwab Fundamental Emerging Markets Large Company
Index ETF
Active, Semi-Transparent (Also Known As Non-Transparent) ETF
Schwab Ariel ESG ETF
Schwab Crypto Thematic ETF
Charles Schwab Investment Management, Inc., dba Schwab Asset Management
211 Main Street, San Francisco, CA 94105
1-877-824-5615
© 2024 Charles Schwab Investment Management, Inc., dba Schwab Asset Management. All rights reserved.
Printed on recycled paper.
*
FUNDAMENTAL INDEX is a registered trademark of Research Affiliates LLC.
The Schwab Ariel ESG ETF is different from traditional ETFs. Traditional ETFs tell the public what assets they hold each day. This fund will not. This may create additional risks for your investment. For example:
•
You may have to pay more money to trade the fund’s shares. This fund will provide less information to traders, who tend to charge more for trades when they have less information.
•
The price you pay to buy fund shares on an exchange may not match the value of the fund’s portfolio. The same is true when you sell shares. These price differences may be greater for this fund compared to other ETFs because it provides less information to traders.
•
These additional risks may be even greater in bad or uncertain market conditions.
•
The ETF will publish on its website each day a “Proxy Portfolio” designed to help trading in shares of the ETF. While the Proxy Portfolio includes some of the ETF’s holdings, it is not the ETF’s actual portfolio.
The differences between this fund and other ETFs may also have advantages. By keeping certain information about the fund secret, this fund may face less risk that other traders can predict or copy its investment strategy. This may improve the fund’s performance. If other traders are able to copy or predict the fund’s investment strategy, however, this may hurt the fund’s performance.
For additional information regarding the unique attributes and risks of the fund, see Proxy Portfolio Risk, Premium/Discount Risk, Trading Halt Risk, Authorized Participant Concentration Risk, Tracking Error Risk and Shares of the Fund May Trade at Prices Other Than NAV in the Principal Risks and Proxy Portfolio and Proxy Overlap sections of the prospectus and/or the Statement of Additional Information. These risks are discussed on the next page.
Schwab Municipal Bond ETF
Active semi-transparent (also referred to as non-transparent) ETFs operate differently from other exchange-traded funds (ETFs). Unlike other ETFs, an active semi-transparent ETF does not publicly disclose its entire portfolio composition each business day, which may affect the price at which shares of the ETF trade in the secondary market. Active semi-transparent ETFs have limited public trading history. There can be no assurance that an active trading market will develop, be maintained or operate as intended. There is a risk that the market price of an active semi-transparent ETF may vary significantly from the ETF’s net asset value and that its shares may trade at a wider bid/ask spread and, therefore, cost investors more to trade than shares of other ETFs. These risks are heightened during periods of market disruption or volatility.
Proxy Portfolio Risk: Unlike traditional ETFs, this fund does not disclose its portfolio holdings (Actual Portfolio) daily. The fund instead posts a Proxy Portfolio on its website each day. The Proxy Portfolio is designed to reflect the economic exposures and risk characteristics of the fund’s actual holdings on each trading day, but it is not the same as the fund’s Actual Portfolio. Although the Proxy Portfolio is intended to provide investors with enough information to allow for an effective arbitrage mechanism that will keep the market price of the Fund at or close to the underlying NAV per Share of the Fund, there is a risk (which may increase during periods of market disruption or volatility) that market prices will vary significantly from the underlying NAV of the fund. ETF trading on the basis of a published Proxy Portfolio may trade at a wider bid/ask spread than ETFs that publish their portfolios on a daily basis, especially during periods of market disruption or volatility, and therefore may cost investors more to trade. Also, while the Fund seeks to benefit from keeping its portfolio information secret, market participants may attempt to use the Proxy Portfolio to identify a Fund’s trading strategy, which if successful, could result in such market participants engaging in certain predatory trading practices that may have the potential to harm the Fund and its shareholders.
Proxy Portfolio Construction: The Proxy Portfolio is designed to recreate the daily performance of the Actual Portfolio. This is achieved by performing a “Factor Model” analysis of the Actual Portfolio. The Factor Model is comprised of three sets of factors or analytical metrics: market-based factors, fundamental factors, and industry/sector factors. The fund uses a “Model Universe” to generate its Proxy Portfolio. The Model Universe is comprised of securities that the fund can purchase and will be a financial index or stated portfolio of securities from which fund investments will be selected. The results of the Factor Model analysis are then applied to the Model Universe. The Proxy Portfolio is then generated as a result of this Model Universe analysis with the Proxy Portfolio being a small sub-set of the Model Universe. The Factor Model is applied to both the Actual Portfolio and the Model Universe to construct the fund’s Proxy Portfolio that performs in a manner substantially identical to the performance of its Actual Portfolio. The Proxy Portfolio will only include investments the fund is permitted to hold. The fund’s SAI contains more information on the Proxy Portfolio and its construction.
Proxy Portfolio and Proxy Overlap Information regarding the contents of the Proxy Portfolio, and the percentage weight overlap between the holdings of the Proxy Portfolio and the fund’s Actual Portfolio holdings that formed the basis for its calculation of NAV at the end of the prior Business Day (the Portfolio Overlap), is available by visiting the fund’s website www.schwabassetmanagement.com.
Because environmental, social and governance (ESG) strategies exclude some securities, ESG-focused products may not be able to take advantage of the same opportunities or market trends as products that do not use such strategies. Additionally, the criteria used to select companies for investment may result in investing in securities, industries or sectors that underperform the market as a whole.
This page is intentionally left blank.
Item 2: Code of Ethics.
| (a) | Registrant has adopted a code of ethics that applies to its principal executive officer, principal financial officer, and any other persons who perform a similar function, regardless of whether these individuals are employed by Registrant or a third party. |
| (c) | During the period covered by the report, no amendments were made to the provisions of this code of ethics. |
| (d) | During the period covered by the report, Registrant did not grant any waivers, including implicit waivers, from the provisions of this code of ethics. |
| (f)(1) | Registrant has filed this code of ethics as an exhibit pursuant to Item 19(a)(1) of Form N-CSR. |
Item 3: Audit Committee Financial Expert.
Registrant’s Board of Trustees has determined that Kimberly S. Patmore, Michael J. Beer and J. Derek Penn, each currently serving on its audit, compliance and valuation committee, are each an “audit committee financial expert,” as such term is defined in Item 3 of Form N-CSR. Each member of Registrant’s audit, compliance and valuation committee is “independent” under the standards set forth in Item 3 of Form N-CSR.
The designation of each of Ms. Patmore, Mr. Beer and Mr. Penn as an “audit committee financial expert” pursuant to Item 3 of Form N-CSR does not (i) impose upon such individual any duties, obligations, or liability that are greater than the duties, obligations and liability imposed upon such individual as a member of Registrant’s audit, compliance and valuation committee or Board of Trustees in the absence of such designation; and (ii) affect the duties, obligations or liability of any other member of Registrant’s audit, compliance and valuation committee or Board of Trustees.
Item 4: Principal Accountant Fees and Services.
Registrant is composed of thirty operational series. Eight series have a fiscal year-end of December 31, whose annual financial statements are reported in Item 1, seven series have a fiscal year-end of the last day of February, two series have a fiscal year end of March 31, and thirteen series have a fiscal year-end of August 31. Principal accountant fees disclosed in Items 4(a)-(d) and 4(g) include fees billed for services rendered to each of the thirty operational series during 2023/2024 and the twenty-nine operational series during 2022/2023, based on their respective 2023/2024 and 2022/2023 fiscal years, as applicable.
The following table presents fees billed by the principal accountant in each of the last two fiscal years for the services rendered to the funds:
| | | | | | | | | | | | | | | | | | | | | | | | | | | | | | |
| (a)Audit Fees1 | | | (b)Audit-Related Fees | | | (c) Tax Fees2 | | | (d) All Other Fees | |
Fiscal Year
2023/2024 | | | Fiscal Year
2022/2023 | | | Fiscal Year
2023/2024 | | | Fiscal Year
2022/2023 | | | Fiscal Year
2023/2024 | | | Fiscal Year
2022/2023 | | | Fiscal Year
2023/2024 | | | Fiscal Year
2022/2023 | |
| $ | 558,674 | | | $ | 505,650 | | | $ | 0 | | | $ | 0 | | | $ | 98,550 | | | $ | 89,900 | | | $ | 0 | | | $ | 0 | |
| 1 | The nature of the services includes audit of the registrant’s annual financial statements and normally provided services in connection with regulatory filings for those fiscal years. |
| 2 | The nature of the services includes tax compliance, tax advice and tax planning. |
| (e) (1) | Registrant’s audit, compliance and valuation committee does not have pre-approval policies and procedures as described in paragraph (c)(7) of Rule 2-01 of Regulation S-X. |
| (2) | There were no services described in each of paragraphs (b) through (d) above that were approved by Registrant’s audit, compliance and valuation committee pursuant to paragraph (c)(7)(i)(C) of Rule 2-01 of Regulation S-X. |
(f) Not applicable.
(g) Below are the aggregate non-audit fees billed in each of the last two fiscal years by Registrant’s principal accountant for services rendered to Registrant, to Registrant’s investment adviser, and to any entity controlling, controlled by, or under common control with Registrant’s investment adviser that provides ongoing services to Registrant.
| | | | |
| | | 2023: $3,940,154 | | 2022: $3,031,117 |
(h) During the past fiscal year, all non-audit services provided by Registrant’s principal accountant to either Registrant’s investment adviser or to any entity controlling, controlled by, or under common control with Registrant’s investment adviser that provides ongoing services to Registrant were pre-approved. Included in the audit, compliance and valuation committee’s pre-approval was the review and consideration as to whether the provision of these non-audit services is compatible with maintaining the principal accountant’s independence.
(i) Not applicable.
(j) Not applicable.
Item 5: Audit Committee of Listed Registrants.
The Registrant is a listed issuer as defined in Rule 10A-3 under the Exchange Act and has separately-designated standing audit, compliance and valuation committee established in accordance with Section 3(a)(58)(A) of the Exchange Act. The Registrant’s audit, compliance and valuation committee members are Kimberly S. Patmore, Michael J. Beer and J. Derek Penn.
Item 6: Investments.
The schedules of investments are included as part of the report to shareholders filed under Item 1 of this Form.
Item 7: Financial Statements and Financial Highlights for Open-End Management Investment Companies.
The financial statements and financial highlights are included as part of the report to shareholders filed under Item 1 of this Form.
Item 8: Changes in and Disagreements with Accountants for Open-End Management Investment Companies.
Not applicable.
Item 9: Proxy Disclosures for Open-End Management Investment Companies.
Not applicable.
Item 10: Remuneration Paid to Directors, Officers, and Others of Open-End Management Investment Companies.
The remuneration paid to directors, officers and others are included as part of the report to shareholders filed under Item 1 of this Form.
Item 11: Statement Regarding Basis for Approval of Investment Advisory Contract.
The statement regarding basis for approval of investment advisory contract is included as part of the report to shareholders filed under Item 1 of this Form.
Item 12: Disclosure of Proxy Voting Policies and Procedures for Closed-End Management Investment Companies.
Not applicable.
Item 13: Portfolio Managers of Closed-End Management Investment Companies.
Not applicable.
Item 14: Purchases of Equity Securities by Closed-End Management Investment Company and Affiliated Purchasers.
Not applicable.
Item 15: Submission of Matters to a Vote of Security Holders.
Not applicable.
Item 16: Controls and Procedures.
| (a) | Based on their evaluation of Registrant’s disclosure controls and procedures, as of a date within 90 days of the filing date, Registrant’s Chief Executive Officer, Omar Aguilar and Registrant’s Chief Financial Officer, Dana Smith, have concluded that Registrant’s disclosure controls and procedures are: (i) reasonably designed to ensure that information required to be disclosed in this report is appropriately communicated to Registrant’s officers to allow timely decisions regarding disclosures required in this report; (ii) reasonably designed to ensure that information required to be disclosed in this report is recorded, processed, summarized and reported in a timely manner; and (iii) are effective in achieving the goals described in (i) and (ii) above. |
| (b) | During the period covered by this report, there have been no changes in Registrant’s internal control over financial reporting that the above officers believe to have materially affected, or to be reasonably likely to materially affect, Registrant’s internal control over financial reporting. |
Item 17: Disclosure of Securities Lending Activities for Closed-End Management Investment Companies.
Not applicable.
Item 18: Recovery of Erroneously Awarded Compensation.
(a) Not applicable.
(b) Not applicable.
Item 19: Exhibits.
Pursuant to the requirements of the Securities Exchange Act of 1934 and the Investment Company Act of 1940, the registrant has duly caused this report to be signed on its behalf by the undersigned, thereunto duly authorized.
(Registrant) Schwab Strategic Trust – Schwab Fixed-Income ETFs and Schwab Municipal Bond ETF
| | |
By: | | /s/ Omar Aguilar |
| | Omar Aguilar Chief Executive Officer |
| |
Date: | | February 16, 2024 |
Pursuant to the requirements of the Securities Exchange Act of 1934 and the Investment Company Act of 1940, this report has been signed below by the following persons on behalf of the registrant and in the capacities and on the dates indicated.
| | |
By: | | /s/ Omar Aguilar |
| | Omar Aguilar Chief Executive Officer |
| |
Date: | | February 16, 2024 |
| |
By: | | /s/ Dana Smith |
| | Dana Smith Chief Financial Officer |
| |
Date: | | February 16, 2024 |