UNITED STATES
SECURITIES AND EXCHANGE COMMISSION
Washington, D.C. 20549
FORM N-CSR
CERTIFIED SHAREHOLDER REPORT OF REGISTERED
MANAGEMENT INVESTMENT COMPANIES
Investment Company Act file number: 811-22311
Schwab Strategic Trust – Schwab U.S. Equity ETFs, Schwab International Equity ETFs and Schwab High Yield Bond ETF
(Exact name of registrant as specified in charter)
211 Main Street, San Francisco, California 94105
(Address of principal executive offices) (Zip code)
Omar Aguilar
Schwab Strategic Trust – Schwab U.S. Equity ETFs, Schwab International Equity ETFs and Schwab High Yield Bond ETF
211 Main Street, San Francisco, California 94105
(Name and address of agent for service)
Registrant’s telephone number, including area code: (415) 636-7000
Date of fiscal year end: August 31
Date of reporting period: August 31, 2023
Item 1: Report(s) to Shareholders.
Annual Report | August 31, 2023
Schwab International Equity ETFs
Schwab International Dividend Equity ETF | |
Schwab International Equity ETF | |
Schwab International Small-Cap Equity ETF | |
Schwab Emerging Markets Equity ETF | |
This page is intentionally left blank.
Fund investment adviser: Charles Schwab Investment Management, Inc., dba Schwab Asset ManagementTM
Distributor: SEI Investments Distribution Co. (SIDCO)
The Sector/Industry classifications in this report use the Global Industry Classification Standard (GICS) which was developed by and is the exclusive property of MSCI Inc. (MSCI) and Standard & Poor’s (S&P). GICS is a service mark of MSCI and S&P and has been licensed for use by Charles Schwab & Co, Inc.
Schwab International Equity ETFs | Annual Report1
Schwab International Equity ETFs
The performance data quoted represents past performance. Past performance does not guarantee future results. Investment returns and principal value of an investment will fluctuate so that an investor’s shares, when sold or redeemed, may be worth more or less than the original cost. Current performance may be lower or higher than the performance data quoted. To obtain performance information current to the most recent month end, please visit www.schwabassetmanagement.com/schwabetfs_prospectus.
Total Returns for the 12 Months Ended August 31, 2023 |
Schwab International Dividend Equity ETF (Ticker Symbol: SCHY) | |
| |
| |
Dow Jones International Dividend 100 Index (Net)2 | |
ETF Category: Morningstar Foreign Large Value3 | |
| |
| |
Schwab International Equity ETF (Ticker Symbol: SCHF) | |
| |
| |
FTSE Developed ex US Index (Net)2 | |
ETF Category: Morningstar Foreign Large Blend3 | |
| |
| |
Schwab International Small-Cap Equity ETF (Ticker Symbol: SCHC) | |
| |
| |
FTSE Developed Small Cap ex US Liquid Index (Net)2 | |
ETF Category: Morningstar Foreign Small/Mid Blend3 | |
| |
| |
Schwab Emerging Markets Equity ETF (Ticker Symbol: SCHE) | |
| |
| |
FTSE Emerging Index (Net)2 | |
ETF Category: Morningstar Diversified Emerging Markets3 | |
| |
All total returns on this page assume dividends and distributions were reinvested. Index figures do not include trading and management costs, which would lower performance. Indices are unmanaged and cannot be invested in directly. Performance results less than one year are not annualized.
For index definitions, please see the Glossary.
Performance does not reflect the deduction of taxes that a shareholder would pay on fund distributions or on the redemption or sale of fund shares.
Shares are bought and sold at market price, which may be higher or lower than the net asset value (NAV). Brokerage commissions will reduce returns.
Index ownership — Dow Jones® is a registered trademark of Dow Jones Trademark Holdings LLC (Dow Jones). The Dow Jones International Dividend 100 Index is a product of S&P Dow Jones Indices LLC and/or its affiliates, and has been licensed for use by Charles Schwab Investment Management, Inc., dba Schwab Asset Management. The Schwab International Dividend Equity ETF is not sponsored, endorsed, sold or promoted by S&P Dow Jones Indices LLC, Dow Jones, or any of their respective affiliates and neither S&P Dow Jones Indices LLC, Dow Jones, nor any of their respective affiliates make any representation regarding the advisability of investing in such product.
Index ownership — FTSE is a trademark of the London Stock Exchange Group companies (LSEG) and is used by the Schwab International Equity ETF, Schwab International Small-Cap Equity ETF, and Schwab Emerging Markets Equity ETF under license. The Schwab International Equity ETF, Schwab International Small-Cap Equity ETF, and Schwab Emerging Markets Equity ETF are not sponsored, endorsed, sold or promoted by FTSE nor LSEG and neither FTSE nor LSEG makes any representation regarding the advisability of investing in shares of the funds. Fees payable under the license are paid by the investment adviser.
1
ETF performance must be shown based on both a market price and NAV basis. The fund’s per share NAV is the value of one share of the fund. NAV is calculated by taking the fund’s total assets (including the fair value of securities owned), subtracting liabilities, and dividing by the number of shares outstanding. The NAV Return is based on the NAV of the fund, and the Market Price Return is based on the market price per share of the fund. The price used to calculate market return (Market Price) is determined using the Official Closing Price on the primary stock exchange (generally, 4:00 p.m. Eastern time) and may not represent the returns you would receive if shares were traded at other times. Market Price and NAV returns assume that dividends and capital gain distributions have been reinvested in the fund at Market Price and NAV, respectively.
2
The net version of the index reflects reinvested dividends net of withholding taxes but reflects no deductions for expenses or other taxes.
3
Source for category information: Morningstar, Inc. The Morningstar Category return represents all passively- and actively-managed ETFs and mutual funds within the category as of the report date.
4
Total return for the report period presented in the table differs from the return in the Financial Highlights. The total return presented in the above table is calculated based on the NAV at which shareholder transactions were processed. The total return presented in the Financial Highlights section of the report is calculated in the same manner, but also takes into account certain adjustments that are necessary under generally accepted accounting principles required in the annual and semiannual reports.
2Schwab International Equity ETFs | Annual Report
Schwab International Equity ETFs
The Investment Environment
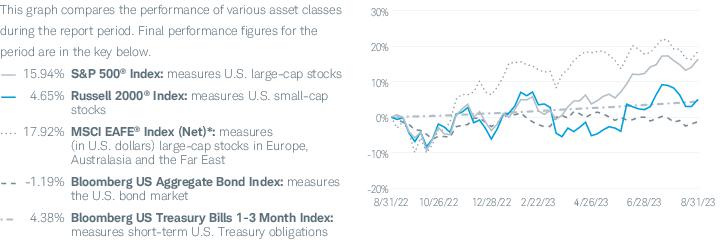
For the 12-month reporting period ended August 31, 2023, global stocks generally rose. U.S. stocks were volatile for the first half of the year as inflation remained elevated and the U.S. Federal Reserve (Fed) continued to raise interest rates. Despite these headwinds, as inflation began to ease, U.S. stocks staged a relatively steady upswing through the end of the reporting period. The ongoing war between Russia and Ukraine weighed on the global economy. After hitting a 20-year high in late September, the U.S. dollar, as measured against a basket of international currencies, weakened over the reporting period, generally increasing the returns on overseas investments in U.S. dollar terms. For the reporting period, the MSCI EAFE® Index (Net)*, a broad measure of developed international equity performance, returned 17.92%, while the MSCI Emerging Markets Index (Net)* returned 1.25%. For comparison, the S&P 500® Index, a bellwether for the overall U.S. stock market, returned 15.94% for the same period.
Economies around the world grew out of sync as they wrestled with record levels of government debt, rising geopolitical tensions, and weak productivity gains that stifled economic growth. Certain economies demonstrated resilience as the reporting period progressed. U.S. gross domestic product (GDP) growth was positive for the third and fourth quarters of 2022 and the first and second quarters of 2023. The unemployment rate remained low throughout the period despite inflationary pressures and an unexpected jump in August largely as a result of an increase in the labor force participation rate (the proportion of working-age Americans who have a job or are looking for one). Oil prices, although volatile over the period, ended the reporting period roughly where they began it. Eurozone GDP expanded slightly in the third quarter of 2022, contracted slightly in the fourth quarter of 2022, was flat for the first quarter of 2023, and expanded slightly for the second quarter of 2023, bolstered by a moderation in inflationary pressures. GDP in the United Kingdom contracted slightly in the third quarter of 2022 but expanded slightly in the fourth quarter of 2022 and the first and second quarters of 2023, with household consumption expenditures and manufacturing output being the key growth drivers. In Japan, following GDP contraction in the third quarter of 2022 and flat GDP growth in the fourth quarter of 2022, GDP rose for the first two quarters of 2023 at an accelerating pace, primarily on rebounding exports. Among emerging markets, China’s GDP grew for the third and fourth quarters of 2022 and the first and second quarters of 2023, though the growth rate fell short of estimates due to declining exports and
Asset Class Performance Comparison % returns during the 12 months ended August 31, 2023
Index figures assume dividends and distributions were reinvested. Index figures do not include trading and management costs, which would lower performance. Indices are unmanaged and cannot be invested in directly. Performance results less than one year are not annualized. Past performance is not a guarantee of future results.
For index definitions, please see the Glossary.
Data source: Index provider websites and Schwab Asset Management
Nothing in this report represents a recommendation of a security by the investment adviser.
Management views may have changed since the report date.
*
The net version of the index reflects reinvested dividends net of withholding taxes but reflects no deductions for expenses or other taxes.
Schwab International Equity ETFs | Annual Report3
Schwab International Equity ETFs
The Investment Environment (continued)
geopolitical factors affecting foreign demand. India’s GDP also grew for the third and fourth quarters of 2022 and the first and second quarter of 2023, driven primarily by robust performance of the services sector along with strong consumer demand and increased government spending.
In its efforts to lower inflation, the Fed raised interest rates seven times over the reporting period, with the federal funds rate ending in a range of 5.25% to 5.50%. However, the likelihood of further increases began to temper, as evidenced by the Fed’s pause on rate hikes at its June meeting before a 0.25% increase in July supported by consumer spending and a tight labor market. The Fed’s efforts to reduce the assets held on its balance sheet were effective over the reporting period, though its balance sheet spiked in early March when the Fed supported banks after the failure of three U.S. regional banks. Central banks outside the United States also battled with persistently high inflation. The European Central Bank raised its interest rates seven times during the reporting period, matching its previous high in 2000. The Bank of England raised its rate eight times during the reporting period, bringing borrowing costs to a 15-year high. In contrast, the Bank of Japan continued to uphold its short-term interest rate target of -0.1%, unchanged since 2016, despite inflationary pressures. Central banks in India, Indonesia, Mexico, Pakistan, and Russia all raised their rates multiple times over the reporting period. In contrast, Brazil cut its key rate once and China cut its interest rate twice during the reporting period.
4Schwab International Equity ETFs | Annual Report
Schwab International Equity ETFs
| Christopher Bliss, CFA, Managing Director and Head of Passive Equity Strategies for Schwab Asset Management, is responsible for overseeing the investment process and portfolio management of investment strategies for passive equity Schwab Funds and Schwab ETFs, and Schwab Personalized Indexing™ separately managed accounts. Before joining Schwab in 2016, Mr. Bliss spent 12 years at BlackRock (formerly Barclays Global Investors) managing and leading institutional index teams, most recently as a managing director and the head of the Americas institutional index team. In this role, Mr. Bliss was responsible for overseeing a team of portfolio managers managing domestic, developed international and emerging markets index strategies. Prior to BlackRock, he worked as an equity analyst and portfolio manager for Harris Bretall and before that, as a research analyst for JP Morgan. |
| David Rios, Portfolio Manager for Schwab Asset Management, is responsible for the day-to-day co-management of the funds. Prior to this role, Mr. Rios was an associate portfolio manager on the equity index strategies team for four years. His first role with Schwab Asset Management was as a trade operations specialist. Prior to joining Schwab in 2008, Mr. Rios was a senior fund accountant at Investors Bank & Trust (subsequently acquired by State Street Corporation). |
Schwab International Equity ETFs | Annual Report5
Schwab International Dividend Equity ETF as of August 31, 2023
The Schwab International Dividend Equity ETF’s (the fund) goal is to track as closely as possible, before fees and expenses, the total return of an index composed of high dividend yielding stocks issued by companies outside of the United States. To purse its goal, the fund generally invests in stocks that are included in the Dow Jones International Dividend 100 Index. The 100-component index is derived from constituents of the Dow Jones Global ex-U.S. Large-Cap Index and Dow Jones Global ex-U.S. Mid-Cap Index (excluding real estate investment trusts (REITs)). It is modified market capitalization weighted. The fund invests in a representative sample of securities included in the index which, when taken together, are expected to perform similarly to the index as a whole. Due to the use of representative sampling, the fund may not hold all of the securities included in the index.
Market Highlights. For the 12-month reporting period ended August 31, 2023, global stocks generally rose. U.S. stocks were volatile for the first half of the year as inflation remained elevated and the U.S. Federal Reserve (Fed) continued to raise interest rates. Despite these headwinds, as inflation began to ease, U.S. stocks staged a relatively steady upswing through the end of the reporting period. The ongoing war between Russia and Ukraine weighed on the global economy. After hitting a 20-year high in late September, the U.S. dollar, as measured against a basket of international currencies, weakened over the reporting period, generally increasing the returns on overseas investments in U.S. dollar terms.
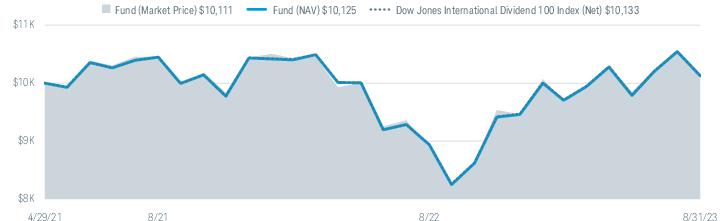
Performance. During the 12-month reporting period ended August 31, 2023, the fund generally tracked the index. The fund’s market price return was 13.83% and its NAV return was 13.31% (for an explanation of the market price and NAV returns, please refer to footnote 2 on the following page). The index returned 13.33%1 during the same period.
Contributors and Detractors. Stocks from Germany contributed the most to the total return of the fund. German stocks represented an average weight of approximately 9% of the fund’s investments and returned approximately 41% in U.S. dollar terms for the reporting period. One example from this market is E.ON SE, one of Europe’s largest operators of energy networks and energy infrastructure. The fund’s holdings of E.ON SE represented an average weight of approximately 3% of the fund’s investments and returned approximately 51% in U.S. dollar terms for the reporting period.
Stocks from the United Kingdom also contributed to the total return of the fund, representing an average weight of approximately 19% of the fund’s investments and returning approximately 13% in U.S. dollar terms for the reporting period.
Stocks from China detracted the most from the total return of the fund. Chinese stocks represented an average weight of approximately 4% of the fund’s investments and returned approximately -3% in U.S. dollar terms for the reporting period. One example from this market is China Construction Bank Corp., which provides banking services. The fund’s Class H holdings of China Construction Bank Corp. represented an average weight of approximately 2% of the fund’s investments and returned approximately -5% in U.S. dollar terms for the reporting period.
Stocks from Saudi Arabia also detracted from the total return of the fund, representing an average weight of approximately 2% of the fund’s investments and returning approximately -6% in U.S. dollar terms for the reporting period.
Management views and portfolio holdings may have changed since the report date.
1
The net version of the index reflects reinvested dividends net of withholding taxes but reflects no deductions for expenses or other taxes.
6Schwab International Equity ETFs | Annual Report
Schwab International Dividend Equity ETF
Performance and Fund Facts as of August 31, 2023
The performance data quoted represents past performance. Past performance does not guarantee future results. Investment returns and principal value of an investment will fluctuate so that an investor’s shares, when sold or redeemed, may be worth more or less than the original cost. Current performance may be lower or higher than the performance data quoted. To obtain performance information current to the most recent month end, please visit www.schwabassetmanagement.com/schwabetfs_prospectus.
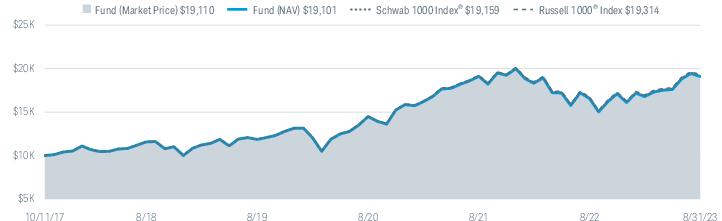
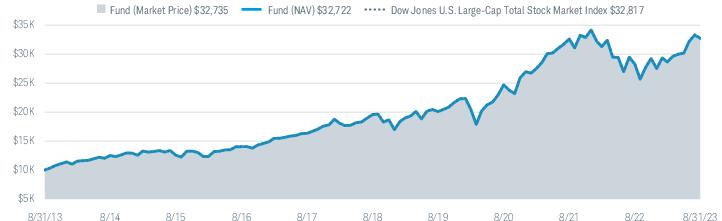
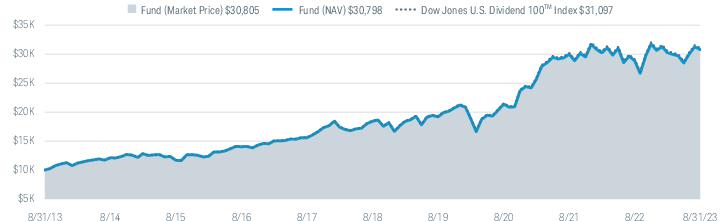
Performance of Hypothetical $10,000 Investment (April 29, 2021 – August 31, 2023)1
Average Annual Total Returns1
| | |
Fund: Schwab International Dividend Equity ETF (4/29/21) | | |
| | |
| | |
Dow Jones International Dividend 100 Index (Net)3 | | |
ETF Category: Morningstar Foreign Large Value4 | | |
Fund Expense Ratio5: 0.14% |
All total returns on this page assume dividends and distributions were reinvested. Index figures do not include trading and management costs, which would lower performance. Indices are unmanaged and cannot be invested in directly. Performance results less than one year are not annualized.
For index definitions, please see the Glossary.
Shares are bought and sold at market price, which may be higher or lower than the net asset value (NAV). Brokerage commissions will reduce returns.
International investing may involve risk of capital loss from unfavorable fluctuations in currency values, from differences in generally accepted accounting principles, or from economic or political instability in other nations.
Emerging markets involve heightened risks related to the same factors as international investing, as well as increased volatility and lower trading volume.
The fund may underperform other funds that do not limit their investment to dividend paying stocks. Stocks held by the fund may reduce or stop paying dividends, affecting the fund’s ability to generate income. Diversification strategies do not ensure a profit and do not protect against losses in declining markets.
Index ownership — Dow Jones® is a registered trademark of Dow Jones Trademark Holdings LLC (Dow Jones). The Dow Jones International Dividend 100 Index is a product of S&P Dow Jones Indices LLC and/or its affiliates, and has been licensed for use by Charles Schwab Investment Management, Inc., dba Schwab Asset Management. The Schwab International Dividend Equity ETF is not sponsored, endorsed, sold or promoted by S&P Dow Jones Indices LLC, Dow Jones, or any of their respective affiliates and neither S&P Dow Jones Indices LLC, Dow Jones, nor any of their respective affiliates make any representation regarding the advisability of investing in such product.
*
Inception (4/29/21) represents the date that the shares began trading in the secondary market.
1
Performance does not reflect the deduction of taxes that a shareholder would pay on fund distributions or on the redemption or sale of fund shares.
2
ETF performance must be shown based on both a market price and NAV basis. The fund’s per share NAV is the value of one share of the fund. NAV is calculated by taking the fund’s total assets (including the fair value of securities owned), subtracting liabilities, and dividing by the number of shares outstanding. The NAV Return is based on the NAV of the fund, and the Market Price Return is based on the market price per share of the fund. The price used to calculate market return (Market Price) is determined using the Official Closing Price on the primary stock exchange (generally, 4:00 p.m. Eastern time) and may not represent the returns you would receive if shares were traded at other times. NAV is used as a proxy for purposes of calculating Market Price Return on inception date. Market Price and NAV returns assume that dividends and capital gain distributions have been reinvested in the fund at Market Price and NAV, respectively.
3
The net version of the index reflects reinvested dividends net of withholding taxes but reflects no deductions for expenses or other taxes.
4
Source for category information: Morningstar, Inc. The Morningstar Category return represents all passively- and actively-managed ETFs and mutual funds within the category as of the report date.
5
As stated in the prospectus.
Schwab International Equity ETFs | Annual Report7
Schwab International Dividend Equity ETF
Performance and Fund Facts as of August 31, 2023 (continued)
| |
Weighted Average Market Cap (millions) | |
Price/Earnings Ratio (P/E) | |
| |
| |
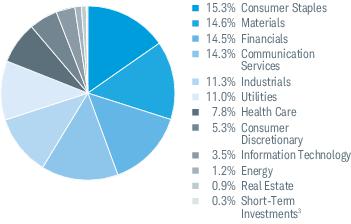
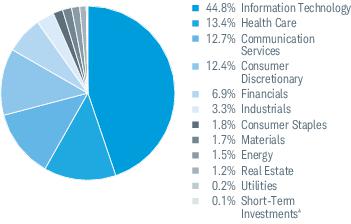
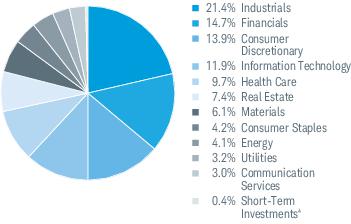
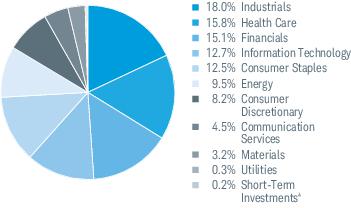
Sector Weightings % of Investments1
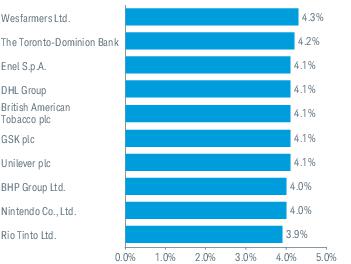
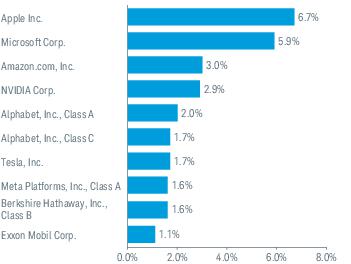
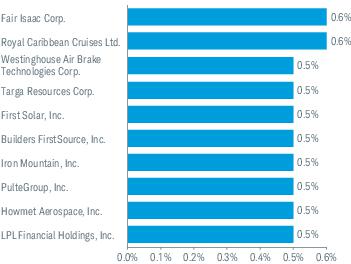
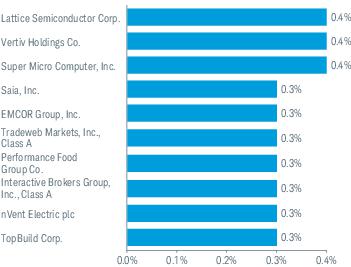
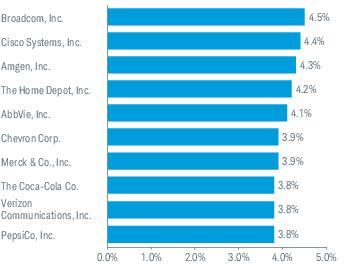
Top Equity Holdings % of Net Assets4
Country Weightings % of Investments5
Portfolio holdings may have changed since the report date.
An index is a statistical composite of a specified financial market or sector. Unlike the fund, an index does not actually hold a portfolio of securities and its return is not inclusive of trading and management costs incurred by the fund.
Source of Sector Classification: S&P and MSCI.
2
Portfolio turnover rate excludes securities received or delivered from processing of in-kind creations or redemptions.
3
Includes the fund’s position(s) in money market mutual funds registered under the Investment Company Act of 1940, as amended.
4
This list is not a recommendation of any security by the investment adviser.
5
The percentage may differ from the Portfolio Holdings because the above calculation is based on a percentage of total investments, excluding derivatives, whereas the calculation in the Portfolio Holdings is based on a percentage of net assets.
8Schwab International Equity ETFs | Annual Report
Schwab International Equity ETF as of August 31, 2023
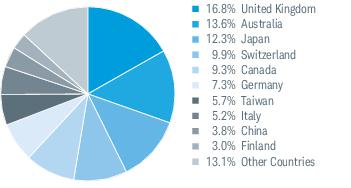
The Schwab International Equity ETF’s (the fund) goal is to track as closely as possible, before fees and expenses, the total return of the FTSE Developed ex US Index (the index). The index is comprised of large- and mid-capitalization companies in developed countries outside the United States, as defined by the index provider. The index defines the large- and mid-capitalization universe as approximately the top 90% of the eligible universe. The fund invests in a representative sample of securities included in the index which, when taken together, are expected to perform similarly to the index as a whole. Due to the use of representative sampling, the fund may not hold all of the securities included in the index.
Market Highlights. For the 12-month reporting period ended August 31, 2023, global stocks generally rose. U.S. stocks were volatile for the first half of the year as inflation remained elevated and the U.S. Federal Reserve (Fed) continued to raise interest rates. Despite these headwinds, as inflation began to ease, U.S. stocks staged a relatively steady upswing through the end of the reporting period. The ongoing war between Russia and Ukraine weighed on the global economy. After hitting a 20-year high in late September, the U.S. dollar, as measured against a basket of international currencies, weakened over the reporting period, generally increasing the returns on overseas investments in U.S. dollar terms.
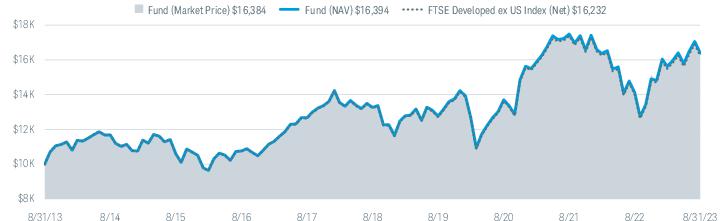
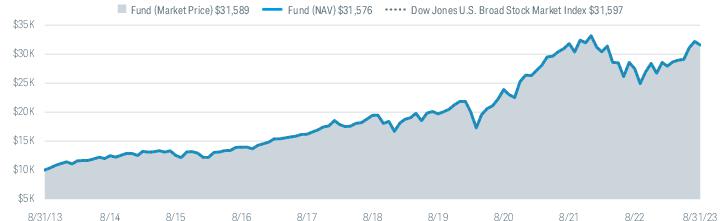
Performance. During the 12-month reporting period ended August 31, 2023, the fund generally tracked the index. The fund’s market price return was 16.75% and its NAV return was 16.12%1 (for an explanation of the market price and NAV returns, please refer to footnote 2 on the following page). The index returned 15.87%2 during the same period.
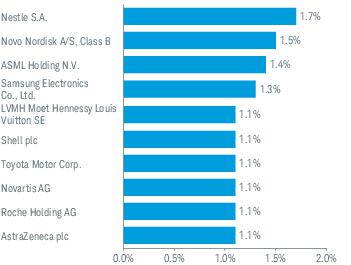
Contributors and Detractors. Stocks from France contributed the most to the total return of the fund. French stocks represented an average weight of approximately 10% of the fund’s investments and returned approximately 31% in U.S. dollar terms for the reporting period. One example from this market is LVMH Moet Hennessy Louis Vuitton SE, a diversified luxury goods group. The fund’s holdings of LVMH Moet Hennessy Louis Vuitton SE represented an average weight of approximately 1% of the fund’s investments and returned approximately 32% in U.S. dollar terms for the reporting period.
Stocks from Japan also contributed to the total return of the fund, representing an average weight of approximately 21% of the fund’s investments and returning approximately 16% in U.S. dollar terms for the reporting period.
Stocks from Hong Kong detracted the most from the total return of the fund. Stocks from Hong Kong represented an average weight of approximately 3% of the fund’s investments and returned approximately -6% in U.S. dollar terms for the reporting period. One example from this market is AIA Group Ltd., an insurance company. The fund’s holdings of AIA Group Ltd. represented an average weight of less than 1% of the fund’s investments and returned approximately -4% in U.S. dollar terms for the reporting period.
Stocks from Israel also detracted from the total return of the fund, representing an average weight of less than 1% of the fund’s investments and returning approximately -19% in U.S. dollar terms for the reporting period.
Management views and portfolio holdings may have changed since the report date.
1
Total return for the report period above differs from the return in the Financial Highlights. The total return presented above is calculated based on the net asset value (NAV) at which shareholder transactions were processed. The total return presented in the Financial Highlights section of the report is calculated in the same manner, but also takes into account certain adjustments that are necessary under generally accepted accounting principles required in the annual and semiannual reports.
2
The net version of the index reflects reinvested dividends net of withholding taxes but reflects no deductions for expenses or other taxes.
Schwab International Equity ETFs | Annual Report9
Schwab International Equity ETF
Performance and Fund Facts as of August 31, 2023
The performance data quoted represents past performance. Past performance does not guarantee future results. Investment returns and principal value of an investment will fluctuate so that an investor’s shares, when sold or redeemed, may be worth more or less than the original cost. Current performance may be lower or higher than the performance data quoted. To obtain performance information current to the most recent month end, please visit www.schwabassetmanagement.com/schwabetfs_prospectus.
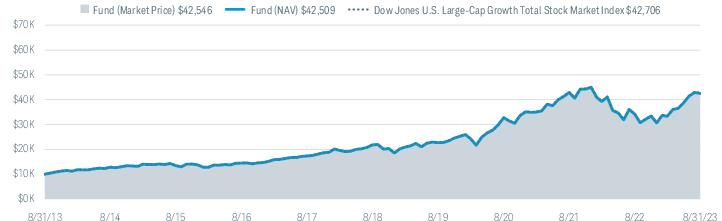
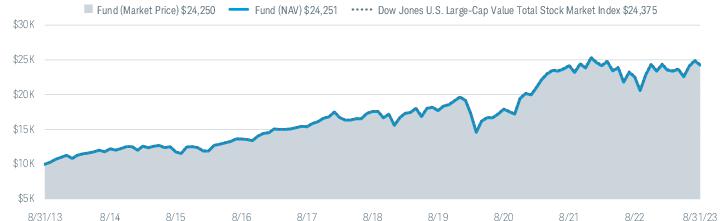
Performance of Hypothetical $10,000 Investment (August 31, 2013 – August 31, 2023)1
Average Annual Total Returns1
| | | |
Fund: Schwab International Equity ETF (11/3/09) | | | |
| | | |
| | | |
FTSE Developed ex US Index (Net)4 | | | |
ETF Category: Morningstar Foreign Large Blend5 | | | |
Fund Expense Ratio6: 0.06% |
All total returns on this page assume dividends and distributions were reinvested. Index figures do not include trading and management costs, which would lower performance. Indices are unmanaged and cannot be invested in directly. Performance results less than one year are not annualized.
For index definitions, please see the Glossary.
Shares are bought and sold at market price, which may be higher or lower than the net asset value (NAV). Brokerage commissions will reduce returns.
International investing may involve risk of capital loss from unfavorable fluctuations in currency values, from differences in generally accepted accounting principles, or from economic or political instability in other nations.
Index ownership — FTSE is a trademark of the London Stock Exchange Group companies (LSEG) and is used by the fund under license. The Schwab International Equity ETF is not sponsored, endorsed, sold or promoted by FTSE nor LSEG and neither FTSE nor LSEG makes any representation regarding the advisability of investing in shares of the fund. Fees payable under the license are paid by the investment adviser.
1
Performance does not reflect the deduction of taxes that a shareholder would pay on fund distributions or on the redemption or sale of fund shares.
2
ETF performance must be shown based on both a market price and NAV basis. The fund’s per share NAV is the value of one share of the fund. NAV is calculated by taking the fund’s total assets (including the fair value of securities owned), subtracting liabilities, and dividing by the number of shares outstanding. The NAV Return is based on the NAV of the fund, and the Market Price Return is based on the market price per share of the fund. The price used to calculate market return (Market Price) is determined using the Official Closing Price on the primary stock exchange (generally, 4:00 p.m. Eastern time) and may not represent the returns you would receive if shares were traded at other times. NAV is used as a proxy for purposes of calculating Market Price Return on inception date. Market Price and NAV returns assume that dividends and capital gain distributions have been reinvested in the fund at Market Price and NAV, respectively.
3
Total return for the report period presented in the table differs from the return in the Financial Highlights. The total return presented in the above table is calculated based on the NAV at which shareholder transactions were processed. The total return presented in the Financial Highlights section of the report is calculated in the same manner, but also takes into account certain adjustments that are necessary under generally accepted accounting principles required in the annual and semiannual reports.
4
The net version of the index reflects reinvested dividends net of withholding taxes but reflects no deductions for expenses or other taxes.
5
Source for category information: Morningstar, Inc. The Morningstar Category return represents all passively- and actively-managed ETFs and mutual funds within the category as of the report date.
6
As stated in the prospectus.
10Schwab International Equity ETFs | Annual Report
Schwab International Equity ETF
Performance and Fund Facts as of August 31, 2023 (continued)
| |
Weighted Average Market Cap (millions) | |
Price/Earnings Ratio (P/E) | |
| |
| |
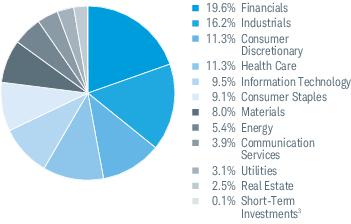
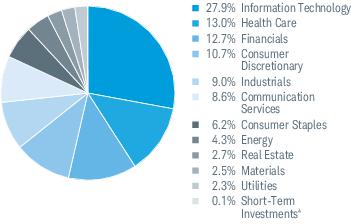
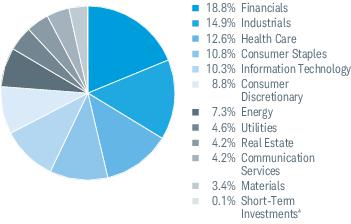
Sector Weightings % of Investments1
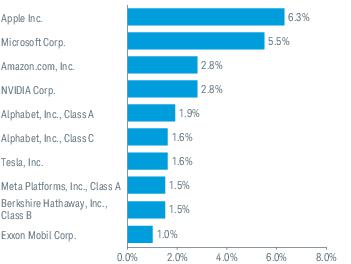
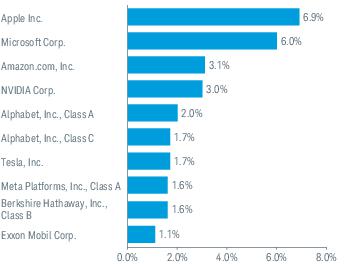
Top Equity Holdings % of Net Assets4
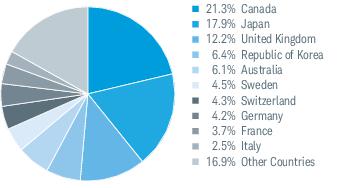
Country Weightings % of Investments5
Portfolio holdings may have changed since the report date.
An index is a statistical composite of a specified financial market or sector. Unlike the fund, an index does not actually hold a portfolio of securities and its return is not inclusive of trading and management costs incurred by the fund.
Source of Sector Classification: S&P and MSCI.
2
Portfolio turnover rate excludes securities received or delivered from processing of in-kind creations or redemptions.
3
Includes the fund’s position(s) in money market mutual funds registered under the Investment Company Act of 1940, as amended.
4
This list is not a recommendation of any security by the investment adviser.
5
The percentage may differ from the Portfolio Holdings because the above calculation is based on a percentage of total investments, excluding derivatives, whereas the calculation in the Portfolio Holdings is based on a percentage of net assets.
Schwab International Equity ETFs | Annual Report11
Schwab International Small-Cap Equity ETF as of August 31, 2023
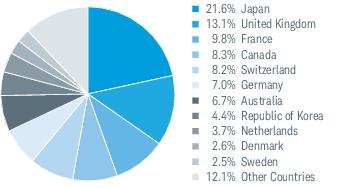
The Schwab International Small-Cap Equity ETF’s (the fund) goal is to track as closely as possible, before fees and expenses, the total return of the FTSE Developed Small Cap ex US Liquid Index (the index). The index is comprised of small-capitalization companies in developed countries outside the United States, as defined by the index provider. The index defines the small-capitalization universe as approximately the bottom 10% of the eligible universe with a minimum free float capitalization of $150 million. The fund invests in a representative sample of securities included in the index which, when taken together, are expected to perform similarly to the index as a whole. Due to the use of representative sampling, the fund may not hold all of the securities included in the index.
Market Highlights. For the 12-month reporting period ended August 31, 2023, global stocks generally rose. U.S. stocks were volatile for the first half of the year as inflation remained elevated and the U.S. Federal Reserve (Fed) continued to raise interest rates. Despite these headwinds, as inflation began to ease, U.S. stocks staged a relatively steady upswing through the end of the reporting period. The ongoing war between Russia and Ukraine weighed on the global economy. After hitting a 20-year high in late September, the U.S. dollar, as measured against a basket of international currencies, weakened over the reporting period, generally increasing the returns on overseas investments in U.S. dollar terms.
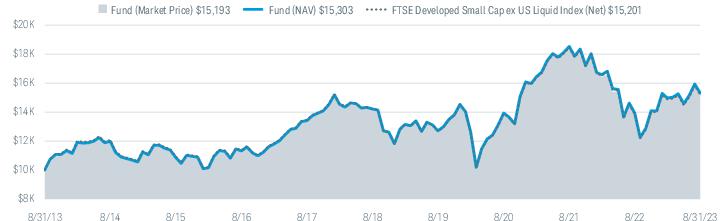
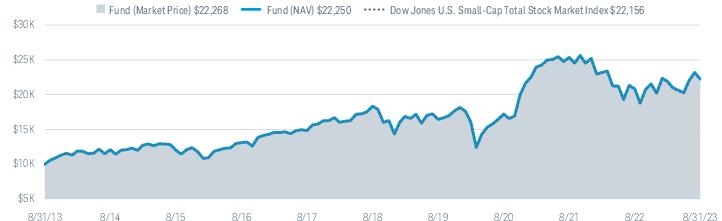
Performance. During the 12-month reporting period ended August 31, 2023, the fund generally tracked the index. The fund’s market price return was 10.67% and its NAV return was 9.87% (for an explanation of the market price and NAV returns, please refer to footnote 2 on the following page). The index returned 9.69%1 during the same period.
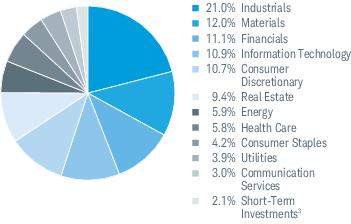
Contributors and Detractors. Stocks from Japan contributed the most to the total return of the fund. Japanese stocks represented an average weight of 18% of the fund’s investments and returned approximately 14% in U.S. dollar terms for the reporting period. One example from this market is Macnica Holdings, Inc., which imports, exports, and distributes electronic components such as semiconductor devices and integrated circuits. The fund’s holdings of Macnica Holdings, Inc. represented an average weight of less than 1% of the fund’s investments and returned approximately 126% in U.S. dollar terms for the reporting period.
Stocks from Canada also contributed to the total return of the fund, representing an average weight of approximately 22% of the fund’s investments and returning approximately 9% in U.S. dollar terms for the reporting period.
Stocks from Australia detracted the most from the total return of the fund. Australian stocks represented an average weight of approximately 7% of the fund’s investments and returned approximately -6% in U.S. dollar terms for the reporting period. One example from this market is Core Lithium Ltd., which operates as a mineral exploration company. The fund’s holdings of Core Lithium Ltd. represented an average weight of less than 1% of the fund’s investments and returned approximately -73% in U.S. dollar terms for the reporting period.
Stocks from Hong Kong also detracted from the total return of the fund, representing an average weight of less than 1% of the fund’s investments and returning approximately -19% in U.S. dollar terms for the reporting period.
Management views and portfolio holdings may have changed since the report date.
1
The net version of the index reflects reinvested dividends net of withholding taxes but reflects no deductions for expenses or other taxes.
12Schwab International Equity ETFs | Annual Report
Schwab International Small-Cap Equity ETF
Performance and Fund Facts as of August 31, 2023
The performance data quoted represents past performance. Past performance does not guarantee future results. Investment returns and principal value of an investment will fluctuate so that an investor’s shares, when sold or redeemed, may be worth more or less than the original cost. Current performance may be lower or higher than the performance data quoted. To obtain performance information current to the most recent month end, please visit www.schwabassetmanagement.com/schwabetfs_prospectus.
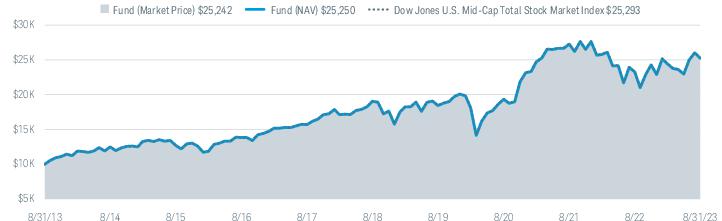
Performance of Hypothetical $10,000 Investment (August 31, 2013 – August 31, 2023)1
Average Annual Total Returns1
| | | |
Fund: Schwab International Small-Cap Equity ETF (1/14/10) | | | |
| | | |
| | | |
FTSE Developed Small Cap ex US Liquid Index (Net)3 | | | |
ETF Category: Morningstar Foreign Small/Mid Blend4 | | | |
Fund Expense Ratio5: 0.11% |
All total returns on this page assume dividends and distributions were reinvested. Index figures do not include trading and management costs, which would lower performance. Indices are unmanaged and cannot be invested in directly. Performance results less than one year are not annualized.
For index definitions, please see the Glossary.
Shares are bought and sold at market price, which may be higher or lower than the net asset value (NAV). Brokerage commissions will reduce returns.
International investing may involve risk of capital loss from unfavorable fluctuations in currency values, from differences in generally accepted accounting principles, or from economic or political instability in other nations.
Small-company stocks may be subject to greater volatility than many other asset classes.
Index ownership — FTSE is a trademark of the London Stock Exchange Group companies (LSEG) and is used by the fund under license. The Schwab International Small-Cap Equity ETF is not sponsored, endorsed, sold or promoted by FTSE nor LSEG and neither FTSE nor LSEG makes any representation regarding the advisability of investing in shares of the fund. Fees payable under the license are paid by the investment adviser.
1
Performance does not reflect the deduction of taxes that a shareholder would pay on fund distributions or on the redemption or sale of fund shares.
2
ETF performance must be shown based on both a market price and NAV basis. The fund’s per share NAV is the value of one share of the fund. NAV is calculated by taking the fund’s total assets (including the fair value of securities owned), subtracting liabilities, and dividing by the number of shares outstanding. The NAV Return is based on the NAV of the fund, and the Market Price Return is based on the market price per share of the fund. The price used to calculate market return (Market Price) is determined using the Official Closing Price on the primary stock exchange (generally, 4:00 p.m. Eastern time) and may not represent the returns you would receive if shares were traded at other times. NAV is used as a proxy for purposes of calculating Market Price Return on inception date. Market Price and NAV returns assume that dividends and capital gain distributions have been reinvested in the fund at Market Price and NAV, respectively.
3
The net version of the index reflects reinvested dividends net of withholding taxes but reflects no deductions for expenses or other taxes.
4
Source for category information: Morningstar, Inc. The Morningstar Category return represents all passively- and actively-managed ETFs and mutual funds within the category as of the report date.
5
As stated in the prospectus.
Schwab International Equity ETFs | Annual Report13
Schwab International Small-Cap Equity ETF
Performance and Fund Facts as of August 31, 2023 (continued)
| |
Weighted Average Market Cap (millions) | |
Price/Earnings Ratio (P/E) | |
| |
| |
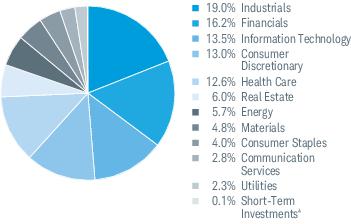
Sector Weightings % of Investments1
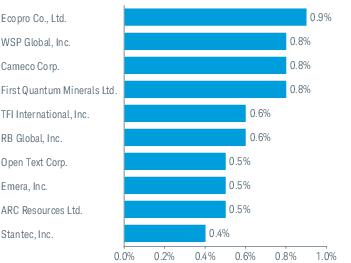
Top Equity Holdings % of Net Assets4
Country Weightings % of Investments5
Portfolio holdings may have changed since the report date.
An index is a statistical composite of a specified financial market or sector. Unlike the fund, an index does not actually hold a portfolio of securities and its return is not inclusive of trading and management costs incurred by the fund.
Source of Sector Classification: S&P and MSCI.
2
Portfolio turnover rate excludes securities received or delivered from processing of in-kind creations or redemptions.
3
Includes the fund’s position(s) in money market mutual funds registered under the Investment Company Act of 1940, as amended.
4
This list is not a recommendation of any security by the investment adviser.
5
The percentage may differ from the Portfolio Holdings because the above calculation is based on a percentage of total investments, excluding derivatives, whereas the calculation in the Portfolio Holdings is based on a percentage of net assets.
14Schwab International Equity ETFs | Annual Report
Schwab Emerging Markets Equity ETF as of August 31, 2023
The Schwab Emerging Markets Equity ETF’s (the fund) goal is to track as closely as possible, before fees and expenses, the total return of the FTSE Emerging Index (the index). The index is comprised of large- and mid-capitalization companies in emerging market countries, as defined by the index provider. The index defines the large- and mid-capitalization universe as approximately the top 90% of the eligible universe. The fund invests in a representative sample of securities included in the index which, when taken together, are expected to perform similarly to the index as a whole. Due to the use of representative sampling, the fund may not hold all of the securities included in the index.
Market Highlights. For the 12-month reporting period ended August 31, 2023, global stocks generally rose. U.S. stocks were volatile for the first half of the year as inflation remained elevated and the U.S. Federal Reserve (Fed) continued to raise interest rates. Despite these headwinds, as inflation began to ease, U.S. stocks staged a relatively steady upswing through the end of the reporting period. The ongoing war between Russia and Ukraine weighed on the global economy. After hitting a 20-year high in late September, the U.S. dollar, as measured against a basket of international currencies, weakened over the reporting period, generally increasing the returns on overseas investments in U.S. dollar terms.
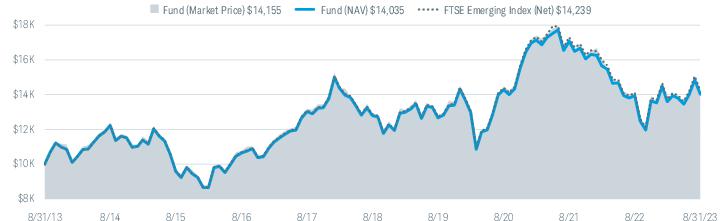
Performance. During the 12-month reporting period ended August 31, 2023, the fund generally tracked the index. The fund’s market price return was 1.28% and its NAV return was 0.61% (for an explanation of the market price and NAV returns, please refer to footnote 2 on the following page). The index returned 0.86%1 during the same period.
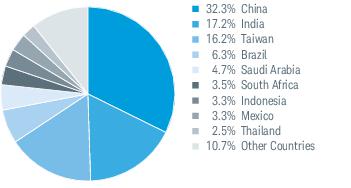
Contributors and Detractors. Stocks from Mexico contributed the most to the total return of the fund. Mexican stocks represented an average weight of approximately 3% of the fund’s investments and returned approximately 44% in U.S. dollar terms for the reporting period. One example from this market is Grupo Financiero Banorte S.A.B. de C.V., a financial institution that offers banking services, premium banking, wholesale banking, leasing and factoring, warehousing, insurance, pensions and retirement savings. The fund’s Class O holdings of Grupo Financiero Banorte S.A.B. de C.V. represented an average weight of less than 1% of the fund’s investments and returned approximately 59% in U.S. dollar terms for the reporting period.
Stocks from Taiwan also contributed to the total return of the fund, representing an average weight of approximately 16% of the fund’s investments and returning approximately 7% in U.S. dollar terms for the reporting period.
Stocks from China detracted the most from the total return of the fund. Chinese stocks represented an average weight of approximately 16% of the fund’s investments and returned approximately -8% in U.S. dollar terms for the reporting period. One example from this market is Meituan, a web-based shopping platform for locally found consumer products and retail services. The fund’s Class B holdings of Meituan represented an average weight of approximately 1% of the fund’s investments and returned approximately -32% in U.S. dollar terms for the reporting period.
Stocks from Saudi Arabia also detracted from the total return of the fund, representing an average weight of approximately 5% of the fund’s investments and returning approximately -7% in U.S. dollar terms for the reporting period.
Management views and portfolio holdings may have changed since the report date.
1
The net version of the index reflects reinvested dividends net of withholding taxes but reflects no deductions for expenses or other taxes.
Schwab International Equity ETFs | Annual Report15
Schwab Emerging Markets Equity ETF
Performance and Fund Facts as of August 31, 2023
The performance data quoted represents past performance. Past performance does not guarantee future results. Investment returns and principal value of an investment will fluctuate so that an investor’s shares, when sold or redeemed, may be worth more or less than the original cost. Current performance may be lower or higher than the performance data quoted. To obtain performance information current to the most recent month end, please visit www.schwabassetmanagement.com/schwabetfs_prospectus.
Performance of Hypothetical $10,000 Investment (August 31, 2013 – August 31, 2023)1
Average Annual Total Returns1
| | | |
Fund: Schwab Emerging Markets Equity ETF (1/14/10) | | | |
| | | |
| | | |
FTSE Emerging Index (Net)3 | | | |
ETF Category: Morningstar Diversified Emerging Markets4 | | | |
Fund Expense Ratio5: 0.11% |
All total returns on this page assume dividends and distributions were reinvested. Index figures do not include trading and management costs, which would lower performance. Indices are unmanaged and cannot be invested in directly. Performance results less than one year are not annualized.
For index definitions, please see the Glossary.
Shares are bought and sold at market price, which may be higher or lower than the net asset value (NAV). Brokerage commissions will reduce returns.
International investing may involve risk of capital loss from unfavorable fluctuations in currency values, from differences in generally accepted accounting principles, or from economic or political instability in other nations.
Emerging markets involve heightened risks related to the same factors as international investing, as well as increased volatility and lower trading volume.
Index ownership — FTSE is a trademark of the London Stock Exchange Group companies (LSEG) and is used by the fund under license. The Schwab Emerging Markets Equity ETF is not sponsored, endorsed, sold or promoted by FTSE nor LSEG and neither FTSE nor LSEG makes any representation regarding the advisability of investing in shares of the fund. Fees payable under the license are paid by the investment adviser.
1
Performance does not reflect the deduction of taxes that a shareholder would pay on fund distributions or on the redemption or sale of fund shares.
2
ETF performance must be shown based on both a market price and NAV basis. The fund’s per share NAV is the value of one share of the fund. NAV is calculated by taking the fund’s total assets (including the fair value of securities owned), subtracting liabilities, and dividing by the number of shares outstanding. The NAV Return is based on the NAV of the fund, and the Market Price Return is based on the market price per share of the fund. The price used to calculate market return (Market Price) is determined using the Official Closing Price on the primary stock exchange (generally, 4:00 p.m. Eastern time) and may not represent the returns you would receive if shares were traded at other times. NAV is used as a proxy for purposes of calculating Market Price Return on inception date. Market Price and NAV returns assume that dividends and capital gain distributions have been reinvested in the fund at Market Price and NAV, respectively.
3
The net version of the index reflects reinvested dividends net of withholding taxes but reflects no deductions for expenses or other taxes.
4
Source for category information: Morningstar, Inc. The Morningstar Category return represents all passively- and actively-managed ETFs and mutual funds within the category as of the report date.
5
As stated in the prospectus.
16Schwab International Equity ETFs | Annual Report
Schwab Emerging Markets Equity ETF
Performance and Fund Facts as of August 31, 2023 (continued)
| |
Weighted Average Market Cap (millions) | |
Price/Earnings Ratio (P/E) | |
| |
| |
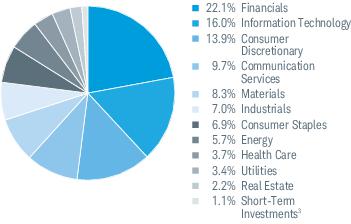
Sector Weightings % of Investments1
Top Equity Holdings % of Net Assets4
Country Weightings % of Investments5
Portfolio holdings may have changed since the report date.
An index is a statistical composite of a specified financial market or sector. Unlike the fund, an index does not actually hold a portfolio of securities and its return is not inclusive of trading and management costs incurred by the fund.
Source of Sector Classification: S&P and MSCI.
2
Portfolio turnover rate excludes securities received or delivered from processing of in-kind creations or redemptions.
3
Includes the fund’s position(s) in money market mutual funds registered under the Investment Company Act of 1940, as amended.
4
This list is not a recommendation of any security by the investment adviser.
5
The percentage may differ from the Portfolio Holdings because the above calculation is based on a percentage of total investments, excluding derivatives, whereas the calculation in the Portfolio Holdings is based on a percentage of net assets.
Schwab International Equity ETFs | Annual Report17
Schwab International Equity ETFs
Fund Expenses (Unaudited)
Examples for a $1,000 Investment
As a fund shareholder, you may incur two types of costs: (1) transaction costs, including brokerage commissions on purchases and sales of fund shares; and, (2) ongoing costs, including management fees.
The expense examples below are intended to help you understand your ongoing cost (in dollars) of investing in a fund and to compare this cost with the ongoing cost of investing in other mutual funds. These examples are based on an investment of $1,000 invested for six months beginning March 1, 2023 and held through August 31, 2023.
Actual Return lines in the table below provide information about actual account values and actual expenses. You may use this information, together with the amount you invested, to estimate the expenses that you paid over the period. To do so, simply divide your account value by $1,000 (for example, an $8,600 account value ÷ $1,000 = 8.6), then multiply the result by the number given for your fund under the heading entitled “Expenses Paid During Period.”
Hypothetical Return lines in the table below provide information about hypothetical account values and hypothetical expenses based on a fund’s actual expense ratio and an assumed return of 5% per year before expenses. Because the return used is not an actual return, it may not be used to estimate the actual ending account value or expenses you paid for the period.
You may use this information to compare the ongoing costs of investing in a fund and other funds. To do so, compare this 5% hypothetical example with the 5% hypothetical examples that appear in the shareholder reports of the other funds.
Please note that the expenses shown in the table are meant to highlight your ongoing costs only and do not reflect any transactional costs, including any brokerage commissions you may pay when purchasing or selling shares of a fund. Therefore, the hypothetical return lines of the table are useful in comparing ongoing costs only and will not help you determine the relative total costs of owning different funds. In addition, if these transactional costs were included, your costs would have been higher.
| | BEGINNING
ACCOUNT VALUE
AT 3/1/23 | ENDING
ACCOUNT VALUE
(NET OF EXPENSES)
AT 8/31/23 | EXPENSES PAID
DURING PERIOD
|
Schwab International Dividend Equity ETF | | | | |
| | | | |
| | | | |
Schwab International Equity ETF | | | | |
| | | | |
| | | | |
Schwab International Small-Cap Equity ETF | | | | |
| | | | |
| | | | |
Schwab Emerging Markets Equity ETF | | | | |
| | | | |
| | | | |
| Based on the most recent six-month expense ratio. |
| Expenses for each fund are equal to its annualized expense ratio, multiplied by the average account value over the period, multiplied by 184 days in the period, and divided by 365 days in the fiscal year. |
18Schwab International Equity ETFs | Annual Report
Schwab International Dividend Equity ETF
Financial Statements
| | | | | | |
|
Net asset value at beginning of period | | | | | | |
Income (loss) from investment operations: | | | | | | |
Net investment income (loss)2 | | | | | | |
Net realized and unrealized gains (losses) | | | | | | |
Total from investment operations | | | | | | |
| | | | | | |
Distributions from net investment income | | | | | | |
Net asset value at end of period | | | | | | |
| | | | | | |
|
Ratios to average net assets: | | | | | | |
| | | | | | |
Net investment income (loss) | | | | | | |
| | | | | | |
Net assets, end of period (x 1,000,000) | | | | | | |
| Commencement of operations. |
| Calculated based on the average shares outstanding during the period. |
| |
| Ratio includes less than 0.005% of non-routine proxy expenses. |
| |
| Portfolio turnover rate excludes securities received or delivered from processing of in-kind creations or redemptions. |
Schwab International Equity ETFs | Annual Report19
Schwab International Dividend Equity ETF
Portfolio Holdings as of August 31, 2023
This section shows all the securities in the fund’s portfolio and their values as of the report date.
The fund files its complete schedule of portfolio holdings with the U.S. Securities and Exchange Commission (SEC) for the first and third quarters of each fiscal year on Form N-PORT Part F. The fund’s Form N-PORT Part F is available on the SEC’s website at www.sec.gov. You can also obtain this information at no cost on the fund’s website at www.schwabassetmanagement.com/schwabetfs_prospectus, by calling 1-866-414-6349, or by sending an email request to orders@mysummaryprospectus.com. The fund also makes available its complete schedule of portfolio holdings on a daily basis on the fund’s website.
| | |
COMMON STOCKS 99.1% OF NET ASSETS |
|
|
| | |
| | |
| | |
Harvey Norman Holdings Ltd. | | |
| | |
| | |
| | |
|
|
| | |
|
|
| | |
| | |
| | |
| | |
| | |
The Toronto-Dominion Bank | | |
| | |
|
|
Anhui Conch Cement Co., Ltd., H Shares | | |
China Construction Bank Corp., H Shares | | |
China Life Insurance Co., Ltd., H Shares | | |
China Shenhua Energy Co., Ltd., H Shares | | |
PICC Property & Casualty Co., Ltd., H Shares | | |
The People's Insurance Co. Group of China Ltd., H Shares | | |
Tingyi Cayman Islands Holding Corp. | | |
Want Want China Holdings Ltd. | | |
| | |
|
|
| | |
| | |
| | |
| | |
|
|
| | |
| | |
| | |
|
|
Colgate-Palmolive (India) Ltd. | | |
| | |
| | |
| | |
| | |
| | |
Power Grid Corp. of India Ltd. | | |
| | |
|
|
The First International Bank of Israel Ltd. | | |
|
|
Assicurazioni Generali S.p.A. | | |
| | |
| | |
|
|
Daito Trust Construction Co., Ltd. | | |
| | |
| | |
| | |
| | |
| | |
| | |
| | |
| | |
|
|
Kuala Lumpur Kepong Berhad | | |
Petronas Chemicals Group Berhad | | |
| | |
|
|
Arca Continental S.A.B. de C.V. | | |
Coca-Cola Femsa S.A.B. de C.V. | | |
Kimberly-Clark de Mexico S.A.B. de C.V., A Shares | | |
| | |
|
|
Koninklijke Ahold Delhaize N.V. | | |
|
|
| | |
|
|
Gjensidige Forsikring A.S.A. | | |
| | |
Yara International A.S.A. | | |
| | |
|
20Schwab International Equity ETFs | Annual Report
Schwab International Dividend Equity ETF
Portfolio Holdings as of August 31, 2023 (continued)
| | |
|
| | |
|
|
| | |
| | |
| | |
|
|
| | |
|
|
| | |
| | |
| | |
| | |
|
|
| | |
Singapore Technologies Engineering Ltd. | | |
| | |
|
|
| | |
|
|
| | |
|
|
| | |
|
|
| | |
Kuehne & Nagel International AG | | |
| | |
| | |
| | |
| | |
|
|
| | |
| | |
| | |
Chicony Electronics Co., Ltd. | | |
Chunghwa Telecom Co., Ltd. | | |
| | |
| | |
Fubon Financial Holding Co., Ltd. | | |
King Slide Works Co., Ltd. | | |
King Yuan Electronics Co., Ltd. | | |
Lite-On Technology Corp., ADR | | |
| | |
| | |
Radiant Opto-Electronics Corp. | | |
Simplo Technology Co., Ltd. | | |
Synnex Technology International Corp. | | |
| | |
| | |
| | |
| | |
|
|
Bangkok Chain Hospital PCL, NVDR | | |
Intouch Holdings PCL NVDR | | |
| | |
Tisco Financial Group PCL NVDR | | |
| | |
|
United Arab Emirates 0.2% |
Abu Dhabi Islamic Bank PJSC | | |
|
|
| | |
British American Tobacco plc | | |
| | |
| | |
| | |
| | |
| | |
| | |
| | |
Total Common Stocks
(Cost $743,032,293) | |
|
PREFERRED STOCKS 0.0% OF NET ASSETS |
|
|
Sberbank of Russia PJSC *(a)(b) | | |
Total Preferred Stocks
(Cost $260,897) | |
| | |
SHORT-TERM INVESTMENTS 0.2% OF NET ASSETS |
|
|
State Street Institutional U.S. Government Money Market Fund, Premier Class 5.28% (c) | | |
Total Short-Term Investments
(Cost $1,959,266) | |
Total Investments in Securities
(Cost $745,252,456) | |
Schwab International Equity ETFs | Annual Report21
Schwab International Dividend Equity ETF
Portfolio Holdings as of August 31, 2023 (continued)
| | | CURRENT VALUE/
UNREALIZED
DEPRECIATION
($) |
|
| | | |
MSCI EAFE Index, expires 09/15/23 | | | |
MSCI Emerging Markets Index, expires 09/15/23 | | | |
| | | |
| Non-income producing security. |
| Fair valued using significant unobservable inputs (see financial note 2(a), Securities for which no quoted value is available, for additional information). |
| Trading in Russian securities listed on the Moscow Exchange, Russian ADRs, and Russian GDRs are subject to trade restrictions; and therefore, the ability of the fund to buy these securities is currently not permitted, and the ability of the fund to sell these securities is uncertain. |
| The rate shown is the annualized 7-day yield. |
| American Depositary Receipt |
| Global Depositary Receipt |
| Non-Voting Depositary Receipt |
The following is a summary of the inputs used to value the fund’s investments as of August 31, 2023 (see financial note 2(a) for additional information):
| QUOTED PRICES IN
ACTIVE MARKETS FOR
IDENTICAL ASSETS
(LEVEL 1) | OTHER SIGNIFICANT
OBSERVABLE INPUTS
(LEVEL 2) | SIGNIFICANT
UNOBSERVABLE INPUTS
(LEVEL 3) | |
| | | | |
| | | | |
| | | | |
| | | | |
| | | | |
| | | | |
| | | | |
| | | | |
| | | | |
| Level 3 amount shown includes securities determined to have no value at August 31, 2023. |
| As categorized in the Portfolio Holdings. |
| Futures contracts are reported at cumulative unrealized appreciation or depreciation. |
Fund investments in mutual funds are classified as Level 1, without consideration to the classification level of the underlying
securities held by the mutual funds, which could be Level 1, Level 2 or Level 3.
22Schwab International Equity ETFs | Annual Report
Schwab International Dividend Equity ETF
Statement of Assets and Liabilities
As of August 31, 2023
|
Investments in securities, at value - unaffiliated (cost $745,252,456) | | |
Foreign currency, at value (cost $1,051,366) | | |
Deposit with broker for futures contracts | | |
| | |
| | |
| | |
| | |
|
|
| | |
Foreign capital gains tax | | |
| | |
Variation margin on futures contracts | | |
| | |
| | |
|
|
Capital received from investors | | |
| | |
| | |
Schwab International Equity ETFs | Annual Report23
Schwab International Dividend Equity ETF
Statement of Operations
For the period September 1, 2022 through August 31, 2023 |
|
Dividends received from securities - unaffiliated (net of foreign withholding tax of $3,321,237) | | |
| | |
| | |
|
|
| | |
| | |
| | |
| | |
|
REALIZED AND UNREALIZED GAINS (LOSSES) |
Net realized losses on sales of securities - unaffiliated (net of foreign capital gains tax paid of $43,644) | | |
Net realized gains on sales of in-kind redemptions - unaffiliated | | |
Net realized gains on futures contracts | | |
Net realized losses on foreign currency transactions | | |
| | |
Net change in unrealized appreciation (depreciation) on securities - unaffiliated (net of change in foreign capital gains tax of ($316,914)) | | |
Net change in unrealized appreciation (depreciation) on futures contracts | | |
Net change in unrealized appreciation (depreciation) on foreign currency translations | | |
Net change in unrealized appreciation (depreciation) | | |
Net realized and unrealized gains | | |
Increase in net assets resulting from operations | | |
| Proxy fees are non-routine expenses (see financial note 2(e) for additional information). |
24Schwab International Equity ETFs | Annual Report
Schwab International Dividend Equity ETF
Statement of Changes in Net Assets
For the current and prior report periods
|
| | |
| | | |
| | | |
Net change in unrealized appreciation (depreciation) | | | |
Increase (decrease) in net assets resulting from operations | | | |
|
DISTRIBUTIONS TO SHAREHOLDERS |
| | | |
TRANSACTIONS IN FUND SHARES |
| | |
| | | | | |
| | | | | |
| | | | | |
Net transactions in fund shares | | | | | |
|
SHARES OUTSTANDING AND NET ASSETS |
| | |
| | | | | |
| | | | | |
| | | | | |
| | | | | |
Schwab International Equity ETFs | Annual Report25
Schwab International Equity ETF
Financial Statements
| | | | | | |
|
Net asset value at beginning of period | | | | | | |
Income (loss) from investment operations: | | | | | | |
Net investment income (loss)1 | | | | | | |
Net realized and unrealized gains (losses) | | | | | | |
Total from investment operations | | | | | | |
| | | | | | |
Distributions from net investment income | | | | | | |
Net asset value at end of period | | | | | | |
| | | | | | |
|
Ratios to average net assets: | | | | | | |
| | | | | | |
Net investment income (loss) | | | | | | |
| | | | | | |
Net assets, end of period (x 1,000,000) | | | | | | |
| Calculated based on the average shares outstanding during the period. |
| Ratio includes less than 0.005% of non-routine proxy expenses. |
| Portfolio turnover rate excludes securities received or delivered from processing of in-kind creations or redemptions. |
26Schwab International Equity ETFs | Annual Report
Schwab International Equity ETF
Portfolio Holdings as of August 31, 2023
This section shows all the securities in the fund’s portfolio and their values as of the report date.
The fund files its complete schedule of portfolio holdings with the U.S. Securities and Exchange Commission (SEC) for the first and third quarters of each fiscal year on Form N-PORT Part F. The fund’s Form N-PORT Part F is available on the SEC’s website at www.sec.gov. You can also obtain this information at no cost on the fund’s website at www.schwabassetmanagement.com/schwabetfs_prospectus, by calling 1-866-414-6349, or by sending an email request to orders@mysummaryprospectus.com. The fund also makes available its complete schedule of portfolio holdings on a daily basis on the fund’s website.
| | |
COMMON STOCKS 99.0% OF NET ASSETS |
|
|
| | |
| | |
| | |
| | |
| | |
| | |
| | |
| | |
| | |
| | |
| | |
| | |
| | |
| | |
| | |
| | |
| | |
| | |
Bendigo & Adelaide Bank Ltd. | | |
| | |
| | |
| | |
| | |
| | |
| | |
| | |
Cleanaway Waste Management Ltd. | | |
| | |
| | |
Commonwealth Bank of Australia | | |
| | |
| | |
| | |
| | |
| | |
Domain Holdings Australia Ltd. | | |
Domino's Pizza Enterprises Ltd. | | |
| | |
| | |
| | |
Flight Centre Travel Group Ltd. *(a) | | |
Fortescue Metals Group Ltd. | | |
| | |
Harvey Norman Holdings Ltd. (a) | | |
| | |
| | |
| | |
| | |
| | |
Insurance Australia Group Ltd. | | |
James Hardie Industries plc * | | |
| | |
| | |
| | |
| | |
| | |
Magellan Financial Group Ltd. | | |
| | |
| | |
| | |
| | |
National Australia Bank Ltd. | | |
| | |
| | |
| | |
Northern Star Resources Ltd. | | |
| | |
| | |
| | |
| | |
| | |
| | |
Platinum Asset Management Ltd. | | |
| | |
| | |
| | |
| | |
| | |
| | |
| | |
| | |
| | |
| | |
| | |
| | |
Seven Group Holdings Ltd. | | |
| | |
| | |
| | |
| | |
| | |
| | |
| | |
| | |
| | |
| | |
The Star Entertainment Grp Ltd. * | | |
| | |
| | |
Treasury Wine Estates Ltd. | | |
| | |
Washington H Soul Pattinson & Co., Ltd. | | |
| | |
| | |
| | |
| | |
Woodside Energy Group Ltd. | | |
| | |
| | |
| | |
Schwab International Equity ETFs | Annual Report27
Schwab International Equity ETF
Portfolio Holdings as of August 31, 2023 (continued)
| | |
Yancoal Australia Ltd. (a) | | |
| | |
|
|
| | |
| | |
| | |
Raiffeisen Bank International AG * | | |
| | |
| | |
| | |
| | |
|
|
Ackermans & van Haaren N.V. | | |
| | |
Anheuser-Busch InBev S.A./N.V. | | |
| | |
| | |
| | |
Groupe Bruxelles Lambert N.V. | | |
| | |
| | |
| | |
| | |
| | |
| | |
| | |
| | |
| | |
|
|
| | |
Alimentation Couche-Tard, Inc. | | |
| | |
| | |
| | |
Brookfield Asset Management Ltd., Class A | | |
| | |
Canadian Imperial Bank of Commerce | | |
Canadian National Railway Co. | | |
Canadian Natural Resources Ltd. | | |
Canadian Pacific Kansas City Ltd. | | |
Canadian Tire Corp., Ltd., Class A | | |
| | |
| | |
Constellation Software, Inc. | | |
| | |
| | |
Fairfax Financial Holdings Ltd. | | |
| | |
| | |
| | |
| | |
| | |
| | |
| | |
| | |
| | |
Magna International, Inc. | | |
| | |
| | |
| | |
| | |
| | |
| | |
| | |
Restaurant Brands International, Inc. | | |
| | |
| | |
| | |
| | |
| | |
| | |
Teck Resources Ltd., Class B | | |
| | |
| | |
The Toronto-Dominion Bank | | |
| | |
| | |
| | |
Wheaton Precious Metals Corp. | | |
| | |
|
|
Want Want China Holdings Ltd. | | |
|
|
AP Moller - Maersk A/S, Class A | | |
AP Moller - Maersk A/S, Class B | | |
| | |
| | |
| | |
| | |
| | |
| | |
| | |
| | |
Novo Nordisk A/S, Class B | | |
| | |
| | |
| | |
| | |
| | |
| | |
Vestas Wind Systems A/S * | | |
| | |
|
|
| | |
| | |
| | |
| | |
| | |
| | |
| | |
| | |
| | |
| | |
| | |
| | |
| | |
| | |
| | |
| | |
| | |
|
28Schwab International Equity ETFs | Annual Report
Schwab International Equity ETF
Portfolio Holdings as of August 31, 2023 (continued)
| | |
|
| | |
| | |
| | |
| | |
| | |
| | |
| | |
| | |
| | |
| | |
| | |
| | |
| | |
| | |
| | |
| | |
| | |
| | |
Cie Generale des Etablissements Michelin S.C.A. | | |
| | |
| | |
| | |
| | |
| | |
| | |
| | |
| | |
| | |
| | |
| | |
| | |
| | |
| | |
| | |
| | |
| | |
| | |
| | |
| | |
La Francaise des Jeux SAEM | | |
| | |
| | |
LVMH Moet Hennessy Louis Vuitton SE | | |
| | |
| | |
| | |
| | |
| | |
| | |
| | |
| | |
| | |
| | |
| | |
| | |
| | |
| | |
| | |
| | |
| | |
| | |
| | |
| | |
UbiSoft Entertainment S.A. * | | |
| | |
Unibail-Rodamco-Westfield * | | |
| | |
Veolia Environnement S.A. | | |
| | |
| | |
| | |
| | |
| | |
|
|
| | |
| | |
| | |
| | |
Bayerische Motoren Werke AG | | |
| | |
| | |
| | |
Carl Zeiss Meditec AG, Bearer Shares | | |
| | |
| | |
| | |
| | |
CTS Eventim AG & Co., KGaA | | |
| | |
| | |
| | |
| | |
| | |
| | |
| | |
| | |
DWS Group GmbH & Co. KGaA | | |
| | |
| | |
| | |
Fraport AG Frankfurt Airport Services Worldwide * | | |
Fresenius Medical Care AG & Co. KGaA | | |
| | |
| | |
| | |
| | |
| | |
| | |
| | |
| | |
| | |
| | |
| | |
| | |
| | |
| | |
| | |
| | |
| | |
| | |
Muenchener Rueckversicherungs-Gesellschaft AG in Muenchen | | |
| | |
| | |
| | |
| | |
| | |
| | |
Schwab International Equity ETFs | Annual Report29
Schwab International Equity ETF
Portfolio Holdings as of August 31, 2023 (continued)
| | |
| | |
| | |
| | |
| | |
| | |
| | |
| | |
| | |
| | |
| | |
| | |
Telefonica Deutschland Holding AG | | |
| | |
| | |
| | |
| | |
| | |
| | |
| | |
| | |
|
|
AAC Technologies Holdings, Inc. | | |
| | |
| | |
| | |
BOC Hong Kong Holdings Ltd. | | |
Brightoil Petroleum Holdings Ltd. *(b) | | |
Budweiser Brewing Co. APAC Ltd. | | |
Cafe de Coral Holdings Ltd. | | |
Cathay Pacific Airways Ltd. *(a) | | |
| | |
China Travel International Investment Hong Kong Ltd. * | | |
Chow Tai Fook Jewellery Group Ltd. | | |
| | |
CK Hutchison Holdings Ltd. | | |
CK Infrastructure Holdings Ltd. | | |
| | |
Dah Sing Banking Group Ltd. | | |
Dah Sing Financial Holdings Ltd. | | |
DFI Retail Group Holdings Ltd. | | |
| | |
| | |
| | |
Galaxy Entertainment Group Ltd. * | | |
Guotai Junan International Holdings Ltd. | | |
Haitong International Securities Group Ltd. * | | |
| | |
Hang Lung Properties Ltd. | | |
| | |
Henderson Land Development Co., Ltd. | | |
Hong Kong & China Gas Co., Ltd. | | |
Hong Kong Exchanges & Clearing Ltd. | | |
Hongkong Land Holdings Ltd. | | |
Huabao International Holdings Ltd. (a) | | |
Hutchison Telecommunications Hong Kong Holdings Ltd. | | |
| | |
Hysan Development Co., Ltd. | | |
Jardine Matheson Holdings Ltd. | | |
Johnson Electric Holdings Ltd. | | |
JS Global Lifestyle Co., Ltd. * | | |
| | |
Kerry Logistics Network Ltd. | | |
| | |
| | |
| | |
L'Occitane International S.A. | | |
| | |
Melco International Development Ltd. * | | |
MGM China Holdings Ltd. * | | |
| | |
| | |
| | |
New World Development Co., Ltd. | | |
Nexteer Automotive Group Ltd. | | |
| | |
Orient Overseas International Ltd. | | |
| | |
Power Assets Holdings Ltd. | | |
| | |
Samsonite International S.A. * | | |
| | |
| | |
| | |
SITC International Holdings Co., Ltd. | | |
| | |
Sun Hung Kai Properties Ltd. | | |
Super Hi International Holding Ltd. * | | |
Swire Pacific Ltd., A Shares | | |
Swire Pacific Ltd., B Shares | | |
| | |
Techtronic Industries Co., Ltd. | | |
The Bank of East Asia Ltd. | | |
| | |
| | |
Vitasoy International Holdings Ltd. | | |
| | |
| | |
Wharf Real Estate Investment Co., Ltd. | | |
| | |
Xinyi Glass Holdings Ltd. | | |
Yue Yuen Industrial Holdings Ltd. | | |
| | |
|
|
| | |
Bank of Ireland Group plc | | |
| | |
| | |
| | |
| | |
|
|
| | |
Alony Hetz Properties & Investments Ltd. | | |
| | |
| | |
| | |
| | |
Bank Leumi Le-Israel B.M. | | |
Bezeq The Israeli Telecommunication Corp., Ltd. | | |
Big Shopping Centers Ltd. * | | |
| | |
| | |
30Schwab International Equity ETFs | Annual Report
Schwab International Equity ETF
Portfolio Holdings as of August 31, 2023 (continued)
| | |
| | |
| | |
Energix-Renewable Energies Ltd. | | |
Enlight Renewable Energy Ltd. * | | |
Fattal Holdings 1998 Ltd. * | | |
Gav-Yam Lands Corp., Ltd. | | |
Harel Insurance Investments & Financial Services Ltd. | | |
| | |
| | |
Israel Discount Bank Ltd., A Shares | | |
| | |
| | |
Mivne Real Estate KD Ltd. | | |
Mizrahi Tefahot Bank Ltd. | | |
| | |
| | |
| | |
Shapir Engineering and Industry Ltd. | | |
| | |
| | |
| | |
Teva Pharmaceutical Industries Ltd. * | | |
The First International Bank of Israel Ltd. | | |
The Phoenix Holdings Ltd. | | |
Tower Semiconductor Ltd. * | | |
| | |
|
|
| | |
| | |
Assicurazioni Generali S.p.A. | | |
| | |
| | |
| | |
| | |
Davide Campari-Milano N.V. | | |
| | |
| | |
| | |
| | |
| | |
FinecoBank Banca Fineco S.p.A. | | |
| | |
Infrastrutture Wireless Italiane S.p.A. | | |
| | |
| | |
| | |
| | |
Mediobanca Banca di Credito Finanziario S.p.A. | | |
| | |
| | |
| | |
| | |
| | |
Recordati Industria Chimica e Farmaceutica S.p.A. | | |
| | |
| | |
| | |
| | |
| | |
Terna - Rete Elettrica Nazionale | | |
| | |
| | |
UnipolSai Assicurazioni S.p.A. | | |
| | |
|
|
| | |
| | |
| | |
Advance Residence Investment Corp. | | |
| | |
| | |
AEON Financial Service Co., Ltd. | | |
| | |
AEON REIT Investment Corp. | | |
| | |
| | |
| | |
| | |
| | |
| | |
| | |
| | |
| | |
| | |
| | |
| | |
| | |
| | |
| | |
| | |
Asahi Group Holdings Ltd. | | |
| | |
| | |
| | |
| | |
| | |
| | |
AZ-Com Maruwa Holdings, Inc. | | |
Bandai Namco Holdings, Inc. | | |
BayCurrent Consulting, Inc. | | |
| | |
| | |
| | |
| | |
| | |
| | |
| | |
Canon Marketing Japan, Inc. | | |
| | |
| | |
| | |
Central Japan Railway Co. | | |
Chubu Electric Power Co., Inc. | | |
Chugai Pharmaceutical Co., Ltd. | | |
Chugin Financial Group, Inc. | | |
Coca-Cola Bottlers Japan Holdings, Inc. | | |
| | |
Concordia Financial Group Ltd. | | |
Cosmo Energy Holdings Co., Ltd. | | |
Cosmos Pharmaceutical Corp. | | |
| | |
| | |
Dai Nippon Printing Co., Ltd. | | |
| | |
| | |
| | |
Dai-ichi Life Holdings, Inc. | | |
Schwab International Equity ETFs | Annual Report31
Schwab International Equity ETF
Portfolio Holdings as of August 31, 2023 (continued)
| | |
| | |
| | |
| | |
| | |
Daito Trust Construction Co., Ltd. | | |
Daiwa House Industry Co., Ltd. | | |
Daiwa House REIT Investment Corp. | | |
Daiwa Office Investment Corp. | | |
Daiwa Securities Group, Inc. | | |
Daiwa Securities Living Investments Corp. | | |
| | |
| | |
| | |
| | |
| | |
| | |
| | |
| | |
| | |
| | |
| | |
| | |
Electric Power Development Co., Ltd. | | |
| | |
| | |
| | |
| | |
| | |
| | |
| | |
| | |
Frontier Real Estate Investment Corp. | | |
| | |
| | |
Fuji Media Holdings, Inc. | | |
| | |
| | |
| | |
| | |
| | |
Fukuoka Financial Group, Inc. | | |
Furukawa Electric Co., Ltd. | | |
Fuyo General Lease Co., Ltd. | | |
| | |
| | |
GMO Payment Gateway, Inc. | | |
| | |
| | |
GungHo Online Entertainment, Inc. | | |
H.U. Group Holdings, Inc. | | |
Hakuhodo DY Holdings, Inc. | | |
| | |
Hankyu Hanshin Holdings, Inc. | | |
Harmonic Drive Systems, Inc. | | |
| | |
| | |
| | |
| | |
| | |
Hirose Electric Co., Ltd. | | |
Hisamitsu Pharmaceutical Co., Inc. | | |
Hitachi Construction Machinery Co., Ltd. | | |
| | |
| | |
| | |
| | |
| | |
| | |
| | |
| | |
| | |
| | |
| | |
Iida Group Holdings Co., Ltd. | | |
Industrial & Infrastructure Fund Investment Corp. | | |
Information Services International-Dentsu Ltd. | | |
| | |
| | |
Internet Initiative Japan, Inc. | | |
Invincible Investment Corp. | | |
Isetan Mitsukoshi Holdings Ltd. | | |
| | |
| | |
| | |
Itochu Techno-Solutions Corp. | | |
Itoham Yonekyu Holdings, Inc. | | |
| | |
| | |
| | |
J. Front Retailing Co., Ltd. | | |
| | |
Japan Airport Terminal Co., Ltd. | | |
Japan Aviation Electronics Industry Ltd. | | |
Japan Exchange Group, Inc. | | |
Japan Hotel REIT Investment Corp. | | |
Japan Logistics Fund, Inc. | | |
Japan Metropolitan Fund Invest | | |
Japan Post Bank Co., Ltd. | | |
Japan Post Holdings Co., Ltd. | | |
Japan Post Insurance Co., Ltd. | | |
Japan Prime Realty Investment Corp. | | |
Japan Real Estate Investment Corp. | | |
| | |
JCR Pharmaceuticals Co., Ltd. | | |
| | |
| | |
| | |
| | |
| | |
| | |
| | |
| | |
| | |
| | |
| | |
Kaken Pharmaceutical Co., Ltd. | | |
| | |
| | |
| | |
| | |
| | |
| | |
Kawasaki Heavy Industries Ltd. | | |
Kawasaki Kisen Kaisha Ltd. | | |
| | |
Keihan Holdings Co., Ltd. | | |
| | |
| | |
Keisei Electric Railway Co., Ltd. | | |
Kenedix Office Investment Corp. | | |
| | |
| | |
32Schwab International Equity ETFs | Annual Report
Schwab International Equity ETF
Portfolio Holdings as of August 31, 2023 (continued)
| | |
| | |
| | |
Kintetsu Group Holdings Co., Ltd. | | |
| | |
Kobayashi Pharmaceutical Co., Ltd. | | |
| | |
| | |
Koei Tecmo Holdings Co., Ltd. | | |
Koito Manufacturing Co., Ltd. | | |
| | |
| | |
| | |
| | |
| | |
Kotobuki Spirits Co., Ltd. | | |
| | |
| | |
| | |
Kurita Water Industries Ltd. | | |
Kusuri no Aoki Holdings Co., Ltd. | | |
| | |
| | |
| | |
Kyushu Electric Power Co., Inc. * | | |
Kyushu Financial Group, Inc. | | |
| | |
| | |
| | |
| | |
| | |
| | |
| | |
| | |
| | |
| | |
| | |
| | |
| | |
| | |
Matsui Securities Co., Ltd. | | |
| | |
| | |
McDonald's Holdings Co., Japan Ltd. | | |
Mebuki Financial Group, Inc. | | |
| | |
| | |
| | |
| | |
| | |
| | |
Mitsubishi Chemical Group Corp. | | |
| | |
Mitsubishi Electric Corp. | | |
Mitsubishi Estate Co., Ltd. | | |
Mitsubishi Gas Chemical Co., Inc. | | |
Mitsubishi HC Capital, Inc. | | |
Mitsubishi Heavy Industries Ltd. | | |
Mitsubishi Logistics Corp. | | |
Mitsubishi Materials Corp. | | |
| | |
Mitsubishi UFJ Financial Group, Inc. | | |
| | |
| | |
| | |
Mitsui Fudosan Logistics Park, Inc. | | |
| | |
Mitsui Mining & Smelting Co., Ltd. | | |
| | |
| | |
| | |
Mizuho Financial Group, Inc. | | |
| | |
| | |
Mori Hills Reit Investment Corp. | | |
| | |
Morinaga Milk Industry Co., Ltd. | | |
MS&AD Insurance Group Holdings, Inc. | | |
Murata Manufacturing Co., Ltd. | | |
| | |
| | |
Nagoya Railroad Co., Ltd. | | |
Nankai Electric Railway Co., Ltd. | | |
| | |
NEC Networks & System Integration Corp. | | |
NET One Systems Co., Ltd. | | |
| | |
| | |
| | |
| | |
| | |
| | |
| | |
| | |
Nihon M&A Center Holdings, Inc. | | |
| | |
| | |
Nippon Accommodations Fund, Inc. | | |
Nippon Building Fund, Inc. | | |
Nippon Electric Glass Co., Ltd. | | |
Nippon Express Holdings, Inc. | | |
| | |
Nippon Paint Holdings Co., Ltd. | | |
Nippon Prologis REIT, Inc. | | |
Nippon Sanso Holdings Corp. | | |
Nippon Shinyaku Co., Ltd. | | |
Nippon Shokubai Co., Ltd. | | |
| | |
Nippon Telegraph & Telephone Corp. | | |
| | |
| | |
Nishi-Nippon Railroad Co., Ltd. | | |
| | |
| | |
Nisshin Seifun Group, Inc. | | |
Nissin Foods Holdings Co., Ltd. | | |
| | |
Nitori Holdings Co., Ltd. | | |
| | |
Noevir Holdings Co., Ltd. | | |
| | |
| | |
| | |
Nomura Real Estate Holdings, Inc. | | |
Nomura Real Estate Master Fund, Inc. | | |
Nomura Research Institute Ltd. | | |
| | |
| | |
| | |
| | |
OBIC Business Consultants Co., Ltd. | | |
| | |
Odakyu Electric Railway Co., Ltd. | | |
| | |
| | |
Schwab International Equity ETFs | Annual Report33
Schwab International Equity ETF
Portfolio Holdings as of August 31, 2023 (continued)
| | |
| | |
| | |
Ono Pharmaceutical Co., Ltd. | | |
Open House Group Co., Ltd. | | |
| | |
| | |
| | |
| | |
| | |
| | |
| | |
| | |
Otsuka Holdings Co., Ltd. | | |
| | |
Pan Pacific International Holdings Corp. | | |
| | |
| | |
Penta-Ocean Construction Co., Ltd. | | |
| | |
Persol Holdings Co., Ltd. | | |
| | |
Pola Orbis Holdings, Inc. | | |
| | |
| | |
Recruit Holdings Co., Ltd. | | |
| | |
Renesas Electronics Corp. * | | |
| | |
| | |
| | |
| | |
| | |
| | |
| | |
| | |
Rohto Pharmaceutical Co., Ltd. | | |
| | |
| | |
| | |
| | |
Santen Pharmaceutical Co., Ltd. | | |
| | |
| | |
Sawai Group Holdings Co., Ltd. | | |
| | |
| | |
SCREEN Holdings Co., Ltd. | | |
| | |
| | |
Sega Sammy Holdings, Inc. | | |
| | |
| | |
| | |
Sekisui Chemical Co., Ltd. | | |
| | |
| | |
Seven & i Holdings Co., Ltd. | | |
| | |
| | |
| | |
| | |
Shikoku Electric Power Co., Inc. * | | |
| | |
| | |
| | |
| | |
Shin-Etsu Chemical Co., Ltd. | | |
| | |
Shinko Electric Industries Co., Ltd. | | |
| | |
Ship Healthcare Holdings, Inc. | | |
| | |
Shizuoka Financial Group, Inc. | | |
SHO-BOND Holdings Co., Ltd. | | |
| | |
Skylark Holdings Co., Ltd. * | | |
| | |
| | |
| | |
| | |
| | |
Sohgo Security Services Co., Ltd. | | |
| | |
| | |
| | |
| | |
Square Enix Holdings Co., Ltd. | | |
Stanley Electric Co., Ltd. | | |
| | |
| | |
| | |
Sumitomo Bakelite Co., Ltd. | | |
Sumitomo Chemical Co., Ltd. | | |
| | |
Sumitomo Electric Industries Ltd. | | |
Sumitomo Forestry Co., Ltd. | | |
Sumitomo Heavy Industries Ltd. | | |
Sumitomo Metal Mining Co., Ltd. | | |
Sumitomo Mitsui Financial Group, Inc. | | |
Sumitomo Mitsui Trust Holdings, Inc. | | |
Sumitomo Pharma Co., Ltd. | | |
Sumitomo Realty & Development Co., Ltd. | | |
Sumitomo Rubber Industries Ltd. | | |
| | |
Suntory Beverage & Food Ltd. | | |
| | |
| | |
| | |
| | |
| | |
| | |
Taisho Pharmaceutical Holdings Co., Ltd. | | |
| | |
| | |
| | |
| | |
Takeda Pharmaceutical Co., Ltd. | | |
| | |
| | |
| | |
| | |
| | |
| | |
| | |
The Chugoku Electric Power Co., Inc. * | | |
| | |
The Japan Steel Works Ltd. | | |
The Kansai Electric Power Co., Inc. | | |
The Yokohama Rubber Co., Ltd. | | |
| | |
| | |
| | |
| | |
34Schwab International Equity ETFs | Annual Report
Schwab International Equity ETF
Portfolio Holdings as of August 31, 2023 (continued)
| | |
Toei Animation Co., Ltd. (a) | | |
| | |
| | |
Tohoku Electric Power Co., Inc. * | | |
| | |
Tokio Marine Holdings, Inc. | | |
| | |
Tokyo Electric Power Co. Holdings, Inc. * | | |
| | |
| | |
Tokyo Ohka Kogyo Co., Ltd. | | |
| | |
| | |
Tokyu Fudosan Holdings Corp. | | |
| | |
| | |
| | |
| | |
| | |
| | |
Toyo Seikan Group Holdings Ltd. | | |
| | |
| | |
| | |
| | |
| | |
| | |
| | |
| | |
| | |
| | |
| | |
| | |
| | |
| | |
United Urban Investment Corp. | | |
| | |
| | |
Welcia Holdings Co., Ltd. | | |
| | |
| | |
| | |
Yamada Holdings Co., Ltd. | | |
Yamaguchi Financial Group, Inc. | | |
| | |
| | |
Yamato Holdings Co., Ltd. | | |
| | |
Yamazaki Baking Co., Ltd. | | |
| | |
| | |
| | |
| | |
| | |
Zensho Holdings Co., Ltd. | | |
| | |
| | |
| | |
|
|
| | |
| | |
| | |
| | |
| | |
| | |
| | |
| | |
| | |
| | |
| | |
BE Semiconductor Industries N.V. | | |
| | |
| | |
| | |
| | |
| | |
| | |
| | |
| | |
| | |
Just Eat Takeaway.com N.V. * | | |
Koninklijke Ahold Delhaize N.V. | | |
| | |
| | |
| | |
| | |
| | |
| | |
| | |
| | |
Universal Music Group N.V. | | |
| | |
| | |
|
|
| | |
Auckland International Airport Ltd. * | | |
| | |
| | |
Fisher & Paykel Healthcare Corp., Ltd. | | |
| | |
| | |
| | |
| | |
| | |
| | |
| | |
SKYCITY Entertainment Group Ltd. | | |
| | |
| | |
| | |
|
|
| | |
| | |
| | |
AutoStore Holdings Ltd. * | | |
| | |
| | |
Gjensidige Forsikring A.S.A. | | |
| | |
Leroy Seafood Group A.S.A. | | |
| | |
Nordic Semiconductor A.S.A. * | | |
| | |
| | |
| | |
Schibsted A.S.A., A Shares | | |
Schibsted A.S.A., B Shares | | |
| | |
| | |
| | |
Schwab International Equity ETFs | Annual Report35
Schwab International Equity ETF
Portfolio Holdings as of August 31, 2023 (continued)
| | |
Yara International A.S.A. | | |
| | |
|
|
| | |
Bank Polska Kasa Opieki S.A. | | |
| | |
| | |
| | |
| | |
| | |
Powszechna Kasa Oszczednosci Bank Polski S.A. * | | |
Powszechny Zaklad Ubezpieczen S.A. | | |
Santander Bank Polska S.A. * | | |
| | |
|
|
EDP - Energias de Portugal S.A. | | |
| | |
| | |
Jeronimo Martins, SGPS, S.A. | | |
| | |
|
|
| | |
| | |
| | |
| | |
BNK Financial Group, Inc. | | |
Celltrion Healthcare Co., Ltd. | | |
| | |
| | |
| | |
| | |
| | |
| | |
| | |
| | |
Daewoo Engineering & Construction Co., Ltd. * | | |
| | |
DGB Financial Group, Inc. | | |
| | |
| | |
| | |
| | |
Doosan Enerbility Co., Ltd. * | | |
| | |
| | |
| | |
| | |
| | |
GS Engineering & Construction Corp. | | |
| | |
| | |
Hana Financial Group, Inc. | | |
| | |
Hankook Tire & Technology Co., Ltd. | | |
| | |
| | |
| | |
Hanwha Aerospace Co., Ltd. | | |
| | |
Hanwha Galleria Co. Ltd. * | | |
| | |
Hanwha Life Insurance Co., Ltd. * | | |
| | |
| | |
| | |
HD Hyundai Heavy Industries Co., Ltd. * | | |
HD Hyundai Infracore Co., Ltd. | | |
HD Korea Shipbuilding & Offshore Engineering Co., Ltd. * | | |
| | |
| | |
| | |
| | |
| | |
| | |
Hyundai Department Store Co., Ltd. | | |
Hyundai Engineering & Construction Co., Ltd. | | |
| | |
Hyundai Marine & Fire Insurance Co., Ltd. | | |
Hyundai Mipo Dockyard Co., Ltd. * | | |
| | |
| | |
| | |
| | |
| | |
| | |
| | |
| | |
| | |
| | |
| | |
| | |
KEPCO Plant Service & Engineering Co., Ltd. | | |
| | |
Korea Aerospace Industries Ltd. | | |
Korea Electric Power Corp. * | | |
| | |
Korea Investment Holdings Co., Ltd. | | |
| | |
Korean Air Lines Co., Ltd. | | |
| | |
| | |
Kumho Petrochemical Co., Ltd. | | |
| | |
| | |
| | |
| | |
| | |
LG Energy Solution Ltd. * | | |
| | |
| | |
| | |
| | |
Lotte Chilsung Beverage Co., Ltd. | | |
| | |
Lotte Energy Materials Corp. | | |
LOTTE Fine Chemical Co., Ltd. | | |
| | |
| | |
Meritz Financial Group, Inc. * | | |
Mirae Asset Securities Co., Ltd. | | |
| | |
| | |
| | |
36Schwab International Equity ETFs | Annual Report
Schwab International Equity ETF
Portfolio Holdings as of August 31, 2023 (continued)
| | |
NH Investment & Securities Co., Ltd. | | |
| | |
| | |
| | |
| | |
| | |
| | |
| | |
| | |
| | |
| | |
| | |
Posco International Corp. | | |
| | |
Samsung Biologics Co., Ltd. * | | |
| | |
| | |
Samsung Electro-Mechanics Co., Ltd. | | |
Samsung Electronics Co., Ltd. | | |
Samsung Engineering Co., Ltd. * | | |
Samsung Fire & Marine Insurance Co., Ltd. | | |
Samsung Heavy Industries Co., Ltd. * | | |
Samsung Life Insurance Co., Ltd. | | |
| | |
| | |
Samsung Securities Co., Ltd. | | |
| | |
| | |
Shin Poong Pharmaceutical Co., Ltd. * | | |
Shinhan Financial Group Co., Ltd. | | |
| | |
SK Biopharmaceuticals Co., Ltd. * | | |
SK Bioscience Co., Ltd. * | | |
| | |
| | |
SK IE Technology Co., Ltd. * | | |
SK Innovation Co., Ltd. * | | |
| | |
| | |
| | |
| | |
| | |
Solus Advanced Materials Co., Ltd. | | |
| | |
| | |
Woori Financial Group, Inc. | | |
| | |
| | |
|
|
| | |
| | |
CapitaLand Integrated Commercial Trust | | |
CapitaLand Investment Ltd. | | |
| | |
ComfortDelGro Corp., Ltd. | | |
| | |
Frasers Logistics & Commercial Trust | | |
| | |
Hutchison Port Holdings Trust, Class U | | |
Jardine Cycle & Carriage Ltd. | | |
| | |
| | |
| | |
| | |
Mapletree Industrial Trust | | |
Mapletree Logistics Trust | | |
Mapletree Pan Asia Commercial Trust | | |
| | |
| | |
Oversea-Chinese Banking Corp., Ltd. | | |
| | |
| | |
| | |
SIA Engineering Co., Ltd. | | |
| | |
| | |
| | |
Singapore Technologies Engineering Ltd. | | |
Singapore Telecommunications Ltd. | | |
| | |
Suntec Real Estate Investment Trust | | |
United Overseas Bank Ltd. | | |
| | |
| | |
Wilmar International Ltd. | | |
| | |
|
|
| | |
ACS, Actividades de Construccion y Servicios S.A. | | |
| | |
| | |
Banco Bilbao Vizcaya Argentaria S.A. | | |
| | |
| | |
| | |
| | |
Corp. ACCIONA Energias Renovables S.A. | | |
| | |
| | |
| | |
| | |
| | |
Industria de Diseno Textil S.A. | | |
Inmobiliaria Colonial Socimi S.A. | | |
| | |
Merlin Properties Socimi S.A. | | |
Naturgy Energy Group S.A. | | |
| | |
| | |
| | |
| | |
|
|
| | |
| | |
| | |
| | |
| | |
| | |
| | |
| | |
| | |
| | |
| | |
| | |
| | |
Schwab International Equity ETFs | Annual Report37
Schwab International Equity ETF
Portfolio Holdings as of August 31, 2023 (continued)
| | |
| | |
Fastighets AB Balder, B Shares * | | |
| | |
H & M Hennes & Mauritz AB, B Shares | | |
| | |
| | |
| | |
Industrivarden AB, A Shares | | |
Industrivarden AB, C Shares | | |
| | |
Investment AB Latour, B Shares | | |
| | |
| | |
| | |
L E Lundbergfortagen AB, B Shares | | |
| | |
Nibe Industrier AB, B Shares | | |
| | |
| | |
| | |
| | |
Skandinaviska Enskilda Banken AB, A Shares | | |
| | |
| | |
| | |
| | |
Svenska Cellulosa AB, S.C.A., B Shares | | |
Svenska Handelsbanken AB, A Shares | | |
| | |
| | |
Swedish Orphan Biovitrum AB * | | |
| | |
Telefonaktiebolaget LM Ericsson, B Shares | | |
| | |
| | |
| | |
| | |
| | |
| | |
|
|
| | |
| | |
| | |
| | |
| | |
Banque Cantonale Vaudoise | | |
| | |
| | |
| | |
Chocoladefabriken Lindt & Spruengli AG | | |
Chocoladefabriken Lindt & Spruengli AG, Participation Certificates | | |
Cie Financiere Richemont S.A., Class A | | |
| | |
| | |
| | |
| | |
| | |
| | |
| | |
| | |
| | |
| | |
| | |
| | |
Kuehne & Nagel International AG | | |
Logitech International S.A. | | |
| | |
| | |
| | |
Partners Group Holding AG | | |
| | |
| | |
Roche Holding AG, Bearer Shares | | |
| | |
Schindler Holding AG, Participation Certificates | | |
| | |
| | |
| | |
| | |
| | |
| | |
| | |
| | |
| | |
| | |
| | |
| | |
The Swatch Group AG, Bearer Shares | | |
| | |
| | |
Zurich Insurance Group AG | | |
| | |
|
|
| | |
| | |
| | |
| | |
| | |
| | |
| | |
Associated British Foods plc | | |
| | |
| | |
| | |
B&M European Value Retail S.A. | | |
| | |
| | |
| | |
| | |
Berkeley Group Holdings plc | | |
| | |
British American Tobacco plc | | |
| | |
| | |
| | |
| | |
| | |
| | |
| | |
| | |
| | |
| | |
Dechra Pharmaceuticals plc | | |
38Schwab International Equity ETFs | Annual Report
Schwab International Equity ETF
Portfolio Holdings as of August 31, 2023 (continued)
| | |
| | |
| | |
Direct Line Insurance Group plc * | | |
| | |
| | |
| | |
| | |
| | |
| | |
Flutter Entertainment plc * | | |
| | |
| | |
| | |
| | |
| | |
| | |
Hikma Pharmaceuticals plc | | |
| | |
| | |
| | |
| | |
| | |
| | |
InterContinental Hotels Group plc | | |
Intermediate Capital Group plc | | |
International Consolidated Airlines Group S.A. * | | |
| | |
| | |
| | |
| | |
| | |
| | |
Land Securities Group plc | | |
Legal & General Group plc | | |
| | |
London Stock Exchange Group plc | | |
| | |
| | |
| | |
| | |
| | |
| | |
| | |
| | |
| | |
| | |
Phoenix Group Holdings plc | | |
| | |
Reckitt Benckiser Group plc | | |
| | |
| | |
| | |
| | |
| | |
Rolls-Royce Holdings plc * | | |
| | |
| | |
| | |
| | |
| | |
| | |
| | |
| | |
Spirax-Sarco Engineering plc | | |
| | |
| | |
| | |
| | |
| | |
| | |
| | |
The British Land Co., plc | | |
| | |
| | |
| | |
| | |
United Utilities Group plc | | |
| | |
| | |
| | |
| | |
| | |
Total Common Stocks
(Cost $27,263,941,630) | |
|
PREFERRED STOCKS 0.5% OF NET ASSETS |
|
|
Bayerische Motoren Werke AG | | |
| | |
| | |
| | |
| | |
| | |
| | |
|
|
Telecom Italia S.p.A. - RSP * | | |
|
|
| | |
Hyundai Motor Co., Ltd. 2nd | | |
| | |
| | |
| | |
Samsung Electronics Co., Ltd. | | |
| | |
| | |
|
|
| | |
Total Preferred Stocks
(Cost $169,925,156) | |
|
RIGHTS 0.0% OF NET ASSETS |
|
|
Constellation Software, Inc. |
expires 09/29/23, strike CAD 1.33 * | | |
|
|
Swedish Orphan Biovitrum AB |
expires 09/14/23, strike SEK 142.00 * | | |
Total Rights
(Cost $14,084) | |
|
Schwab International Equity ETFs | Annual Report39
Schwab International Equity ETF
Portfolio Holdings as of August 31, 2023 (continued)
| | |
WARRANTS 0.0% OF NET ASSETS |
|
|
Constellation Software, Inc. |
| | |
| |
| | |
SHORT-TERM INVESTMENTS 0.1% OF NET ASSETS |
|
|
State Street Institutional U.S. Government Money Market Fund, Premier Class 5.28% (c) | | |
State Street Institutional U.S. Government Money Market Fund, Premier Class 5.28% (c)(d) | | |
| | |
Total Short-Term Investments
(Cost $26,762,830) | |
Total Investments in Securities
(Cost $27,460,643,700) | |
| | | CURRENT VALUE/
UNREALIZED
DEPRECIATION
($) |
|
| | | |
MSCI EAFE Index, expires 09/15/23 | | | |
| Non-income producing security. |
| All or a portion of this security is on loan. Securities on loan were valued at $13,962,850. |
| Fair valued using significant unobservable inputs (see financial note 2(a), Securities for which no quoted value is available, for additional information). |
| The rate shown is the annualized 7-day yield. |
| Security purchased with cash collateral received for securities on loan. |
| |
| Global Depositary Receipt |
| Real Estate Investment Trust |
| Risparmio (Savings Shares) |
| |
| |
The following is a summary of the inputs used to value the fund’s investments as of August 31, 2023 (see financial note 2(a) for additional information):
| QUOTED PRICES IN
ACTIVE MARKETS FOR
IDENTICAL ASSETS
(LEVEL 1) | OTHER SIGNIFICANT
OBSERVABLE INPUTS
(LEVEL 2) | SIGNIFICANT
UNOBSERVABLE INPUTS
(LEVEL 3) | |
| | | | |
| | | | |
| | | | |
| | | | |
| | | | |
| | | | |
| | | | |
| | | | |
| | | | |
| | | | |
| | | | |
| | | | |
| | | | |
| Level 3 amount shown includes securities determined to have no value at August 31, 2023. |
| As categorized in the Portfolio Holdings. |
| Futures contracts are reported at cumulative unrealized appreciation or depreciation. |
Fund investments in mutual funds are classified as Level 1, without consideration to the classification level of the underlying
securities held by the mutual funds, which could be Level 1, Level 2 or Level 3.
40Schwab International Equity ETFs | Annual Report
Schwab International Equity ETF
Statement of Assets and Liabilities
As of August 31, 2023
|
Investments in securities, at value - unaffiliated (cost $27,460,643,700) including securities on loan of $13,962,850 | | |
Foreign currency, at value (cost $24,252,863) | | |
Deposit with broker for futures contracts | | |
| | |
| | |
| | |
| | |
Income from securities on loan | | |
| | |
|
|
Collateral held for securities on loan | | |
| | |
| | |
| | |
Variation margin on futures contracts | | |
| | |
| | |
|
|
Capital received from investors | | |
Total distributable earnings | | |
| | |
Schwab International Equity ETFs | Annual Report41
Schwab International Equity ETF
Statement of Operations
For the period September 1, 2022 through August 31, 2023 |
|
Dividends received from securities - unaffiliated (net of foreign withholding tax of $86,524,980) | | |
| | |
| | |
|
|
| | |
| | |
| | |
| | |
| | |
| | |
| | |
|
REALIZED AND UNREALIZED GAINS (LOSSES) |
Net realized losses on sales of securities - unaffiliated | | |
Net realized gains on sales of in-kind redemptions - unaffiliated | | |
Net realized gains on futures contracts | | |
Net realized losses on foreign currency transactions | | |
| | |
Net change in unrealized appreciation (depreciation) on securities - unaffiliated | | |
Net change in unrealized appreciation (depreciation) on futures contracts | | |
Net change in unrealized appreciation (depreciation) on foreign currency translations | | |
Net change in unrealized appreciation (depreciation) | | |
Net realized and unrealized gains | | |
Increase in net assets resulting from operations | | |
| Proxy fees are non-routine expenses (see financial note 2(e) for additional information). |
| Professional fees associated with the filing of tax claims in the European Union deemed to be non-contingent and non-routine expenses of the fund (see financial notes 2(d) and 4 for additional information). |
42Schwab International Equity ETFs | Annual Report
Schwab International Equity ETF
Statement of Changes in Net Assets
For the current and prior report periods
|
| | |
| | | |
| | | |
Net change in unrealized appreciation (depreciation) | | | |
Increase (decrease) in net assets resulting from operations | | | |
|
DISTRIBUTIONS TO SHAREHOLDERS |
| | | |
TRANSACTIONS IN FUND SHARES |
| | |
| | | | | |
| | | | | |
| | | | | |
Net transactions in fund shares | | | | | |
|
SHARES OUTSTANDING AND NET ASSETS |
| | |
| | | | | |
| | | | | |
Total increase (decrease) | | | | | |
| | | | | |
Schwab International Equity ETFs | Annual Report43
Schwab International Small-Cap Equity ETF
Financial Statements
| | | | | | |
|
Net asset value at beginning of period | | | | | | |
Income (loss) from investment operations: | | | | | | |
Net investment income (loss)1 | | | | | | |
Net realized and unrealized gains (losses) | | | | | | |
Total from investment operations | | | | | | |
| | | | | | |
Distributions from net investment income | | | | | | |
Net asset value at end of period | | | | | | |
| | | | | | |
|
Ratios to average net assets: | | | | | | |
| | | | | | |
Net investment income (loss) | | | | | | |
| | | | | | |
Net assets, end of period (x 1,000,000) | | | | | | |
| Calculated based on the average shares outstanding during the period. |
| Ratio includes less than 0.005% of non-routine proxy expenses. |
| Effective February 25, 2020, the annual operating expense ratio was reduced to 0.11%. The ratio presented for the period ended August 31, 2020 is a blended ratio. |
| Portfolio turnover rate excludes securities received or delivered from processing of in-kind creations or redemptions. |
44Schwab International Equity ETFs | Annual Report
Schwab International Small-Cap Equity ETF
Portfolio Holdings as of August 31, 2023
This section shows all the securities in the fund’s portfolio and their values as of the report date.
The fund files its complete schedule of portfolio holdings with the U.S. Securities and Exchange Commission (SEC) for the first and third quarters of each fiscal year on Form N-PORT Part F. The fund’s Form N-PORT Part F is available on the SEC’s website at www.sec.gov. You can also obtain this information at no cost on the fund’s website at www.schwabassetmanagement.com/schwabetfs_prospectus, by calling 1-866-414-6349, or by sending an email request to orders@mysummaryprospectus.com. The fund also makes available its complete schedule of portfolio holdings on a daily basis on the fund’s website.
| | |
COMMON STOCKS 99.5% OF NET ASSETS |
|
|
| | |
| | |
| | |
| | |
APM Human Services International Ltd. | | |
| | |
Arafura Rare Earths Ltd. * | | |
| | |
| | |
| | |
| | |
| | |
| | |
| | |
Australian Agricultural Co., Ltd. * | | |
Australian Clinical Labs Ltd. (a) | | |
Australian Ethical Investment Ltd. | | |
Australian Finance Group Ltd. | | |
| | |
Baby Bunting Group Ltd. (a) | | |
| | |
| | |
| | |
| | |
BrainChip Holdings Ltd. *(a) | | |
| | |
| | |
| | |
| | |
| | |
| | |
Cedar Woods Properties Ltd. | | |
| | |
| | |
| | |
| | |
| | |
Charter Hall Long Wale REIT | | |
| | |
Charter Hall Social Infrastructure REIT | | |
Clinuvel Pharmaceuticals Ltd. | | |
| | |
| | |
| | |
| | |
Coronado Global Resources, Inc. | | |
Corporate Travel Management Ltd. | | |
Costa Group Holdings Ltd. | | |
| | |
| | |
| | |
| | |
| | |
| | |
| | |
| | |
| | |
| | |
| | |
Event Hospitality & Entertainment Ltd. | | |
| | |
FleetPartners Group Ltd. * | | |
| | |
| | |
GDI Property Group Partnership | | |
| | |
Goulamina Holdings Pty Ltd. *(b) | | |
| | |
| | |
Growthpoint Properties Australia Ltd. | | |
| | |
| | |
| | |
| | |
| | |
| | |
Hotel Property Investments | | |
| | |
| | |
| | |
| | |
Ingenia Communities Group | | |
| | |
Integral Diagnostics Ltd. | | |
| | |
| | |
| | |
| | |
| | |
Judo Capital Holdings Ltd. * | | |
| | |
| | |
| | |
| | |
| | |
| | |
Lifestyle Communities Ltd. | | |
Link Administration Holdings Ltd. | | |
Liontown Resources Ltd. * | | |
| | |
Macquarie Technology Group Ltd. * | | |
| | |
McMillan Shakespeare Ltd. | | |
| | |
| | |
| | |
| | |
| | |
| | |
| | |
| | |
Schwab International Equity ETFs | Annual Report45
Schwab International Small-Cap Equity ETF
Portfolio Holdings as of August 31, 2023 (continued)
| | |
| | |
| | |
Neuren Pharmaceuticals Ltd. * | | |
| | |
| | |
| | |
Nine Entertainment Co. Holdings Ltd. | | |
| | |
| | |
| | |
| | |
| | |
| | |
| | |
Paradigm Biopharmaceuticals Ltd. * | | |
| | |
| | |
| | |
Pinnacle Investment Management Group Ltd. | | |
PointsBet Holdings Ltd. *(a) | | |
| | |
PPK Mining Equipment Group *(b) | | |
| | |
| | |
| | |
| | |
| | |
| | |
Reliance Worldwide Corp., Ltd. | | |
| | |
| | |
Sandfire Resources Ltd. * | | |
| | |
| | |
| | |
| | |
| | |
| | |
Silver Lake Resources Ltd. * | | |
| | |
| | |
| | |
| | |
Stanmore Resources Ltd. * | | |
| | |
| | |
| | |
| | |
| | |
Telix Pharmaceuticals Ltd. * | | |
Temple & Webster Group Ltd. * | | |
| | |
| | |
| | |
Ventia Services Group Pty Ltd. | | |
Virgin Australia Holdings Pty. Ltd. *(b) | | |
| | |
Vulcan Energy Resources Ltd. * | | |
| | |
| | |
| | |
| | |
West African Resources Ltd. * | | |
Westgold Resources Ltd. * | | |
| | |
| | |
|
| | |
|
| | |
AT&S Austria Technologie & Systemtechnik AG | | |
| | |
| | |
| | |
| | |
| | |
| | |
| | |
Mayr Melnhof Karton AG (a) | | |
Oesterreichische Post AG (a) | | |
| | |
| | |
Schoeller-Bleckmann Oilfield Equipment AG | | |
| | |
| | |
Vienna Insurance Group AG Wiener Versicherung Gruppe | | |
| | |
| | |
|
|
| | |
| | |
| | |
| | |
| | |
| | |
| | |
| | |
Etablissements Franz Colruyt N.V. | | |
| | |
| | |
| | |
| | |
| | |
| | |
| | |
| | |
| | |
Shurgard Self Storage Ltd. | | |
| | |
| | |
| | |
Xior Student Housing N.V. | | |
| | |
|
|
| | |
Alamos Gold, Inc., Class A | | |
Algonquin Power & Utilities Corp. | | |
Allied Properties Real Estate Investment Trust | | |
| | |
| | |
| | |
Artis Real Estate Investment Trust | | |
| | |
| | |
| | |
Ballard Power Systems, Inc. * | | |
Bausch Health Cos., Inc. * | | |
46Schwab International Equity ETFs | Annual Report
Schwab International Small-Cap Equity ETF
Portfolio Holdings as of August 31, 2023 (continued)
| | |
| | |
| | |
Boardwalk Real Estate Investment Trust | | |
Bombardier, Inc., Class B * | | |
| | |
Boyd Group Services, Inc. | | |
Brookfield Infrastructure Corp., Class A | | |
Brookfield Renewable Corp., Class A | | |
| | |
| | |
| | |
Canada Goose Holdings, Inc. *(a) | | |
Canadian Apartment Properties REIT | | |
| | |
| | |
| | |
| | |
| | |
| | |
| | |
| | |
| | |
Chartwell Retirement Residences | | |
Choice Properties Real Estate Investment Trust | | |
| | |
Cogeco Communications, Inc. | | |
Colliers International Group, Inc. | | |
Crescent Point Energy Corp. | | |
| | |
| | |
Dream Industrial Real Estate Investment Trust | | |
| | |
| | |
Element Fleet Management Corp. | | |
| | |
| | |
| | |
| | |
Finning International, Inc. | | |
First Capital Real Estate Investment Trust | | |
First Majestic Silver Corp. | | |
First National Financial Corp. | | |
First Quantum Minerals Ltd. | | |
| | |
| | |
| | |
| | |
Granite Real Estate Investment Trust | | |
H&R Real Estate Investment Trust | | |
| | |
| | |
| | |
| | |
Innergex Renewable Energy, Inc. | | |
Ivanhoe Mines Ltd., Class A * | | |
| | |
| | |
| | |
Laurentian Bank of Canada | | |
Lightspeed Commerce, Inc. * | | |
| | |
Lithium Americas Corp. *(a) | | |
| | |
| | |
| | |
| | |
| | |
| | |
| | |
| | |
NorthWest Healthcare Properties Real Estate Investment Trust | | |
Novagold Resources, Inc. * | | |
| | |
| | |
| | |
| | |
Osisko Gold Royalties Ltd. | | |
Pan American Silver Corp. | | |
Paramount Resources Ltd., Class A | | |
| | |
| | |
| | |
Premium Brands Holdings Corp. | | |
Primaris Real Estate Investment Trust | | |
| | |
| | |
| | |
RioCan Real Estate Investment Trust | | |
| | |
SmartCentres Real Estate Investment Trust | | |
| | |
| | |
| | |
| | |
| | |
| | |
| | |
The Descartes Systems Group, Inc. * | | |
| | |
| | |
| | |
Torex Gold Resources, Inc. * | | |
| | |
| | |
TransAlta Renewables, Inc. | | |
Transcontinental, Inc., Class A | | |
| | |
| | |
West Fraser Timber Co., Ltd. | | |
Westshore Terminals Investment Corp. | | |
| | |
| | |
| | |
| | |
|
|
| | |
| | |
| | |
| | |
| | |
| | |
| | |
| | |
| | |
| | |
| | |
| | |
| | |
NTG Nordic Transport Group A/S, Class A * | | |
Schwab International Equity ETFs | Annual Report47
Schwab International Small-Cap Equity ETF
Portfolio Holdings as of August 31, 2023 (continued)
| | |
Ringkjoebing Landbobank A/S | | |
Scandinavian Tobacco Group A/S, A Shares | | |
| | |
| | |
| | |
| | |
| | |
| | |
| | |
| | |
|
|
| | |
| | |
| | |
| | |
| | |
| | |
Metsa Board Oyj, B Shares | | |
| | |
| | |
| | |
| | |
| | |
| | |
| | |
| | |
| | |
| | |
| | |
| | |
| | |
|
|
| | |
| | |
| | |
Antin Infrastructure Partners S.A. | | |
| | |
| | |
| | |
| | |
| | |
| | |
Casino Guichard Perrachon S.A. *(a) | | |
| | |
| | |
| | |
| | |
| | |
| | |
| | |
| | |
| | |
Etablissements Maurel et Prom S.A. | | |
| | |
Eutelsat Communications S.A. (a) | | |
| | |
| | |
Gaztransport Et Technigaz S.A. | | |
| | |
| | |
| | |
| | |
| | |
| | |
| | |
| | |
| | |
| | |
| | |
| | |
| | |
Metropole Television S.A. | | |
| | |
| | |
| | |
| | |
| | |
| | |
| | |
| | |
| | |
| | |
| | |
| | |
| | |
| | |
| | |
| | |
| | |
| | |
| | |
| | |
| | |
| | |
| | |
X-Fab Silicon Foundries SE * | | |
| | |
|
|
| | |
About You Holding SE *(a) | | |
| | |
| | |
| | |
| | |
| | |
| | |
| | |
| | |
| | |
| | |
| | |
| | |
| | |
| | |
CompuGroup Medical SE & Co. KgaA | | |
| | |
| | |
| | |
| | |
Deutsche Pfandbriefbank AG (a) | | |
| | |
| | |
| | |
Eckert & Ziegler Strahlen- und Medizintechnik AG | | |
| | |
| | |
| | |
| | |
| | |
48Schwab International Equity ETFs | Annual Report
Schwab International Small-Cap Equity ETF
Portfolio Holdings as of August 31, 2023 (continued)
| | |
| | |
| | |
| | |
Grand City Properties S.A. * | | |
| | |
Hamburger Hafen und Logistik AG | | |
| | |
Hornbach Holding AG & Co. KGaA | | |
| | |
| | |
| | |
Instone Real Estate Group AG | | |
| | |
| | |
| | |
| | |
| | |
| | |
| | |
| | |
| | |
| | |
| | |
| | |
| | |
ProSiebenSat.1 Media SE (a) | | |
| | |
| | |
Secunet Security Networks AG | | |
| | |
| | |
SMA Solar Technology AG * | | |
| | |
| | |
| | |
| | |
| | |
| | |
| | |
| | |
| | |
| | |
VERBIO Vereinigte BioEnergie AG | | |
Vitesco Technologies Group AG, Class A * | | |
| | |
| | |
Wuestenrot & Wuerttembergische AG | | |
| | |
|
|
Asia Cement China Holdings Corp. | | |
Beijing Tong Ren Tang Chinese Medicine Co., Ltd. | | |
China Animal Healthcare Ltd. *(b) | | |
Chow Sang Sang Holdings International Ltd. | | |
CITIC Telecom International Holdings Ltd. | | |
C-Mer Eye Care Holdings Ltd. * | | |
Cowell e Holdings, Inc. *(a) | | |
| | |
| | |
Everest Medicines Ltd. *(a) | | |
Far East Consortium International Ltd. | | |
Fortune Real Estate Investment Trust | | |
| | |
| | |
Frontage Holdings Corp. * | | |
Giordano International Ltd. | | |
| | |
Hong Kong Technology Venture Co., Ltd. | | |
| | |
| | |
Jacobio Pharmaceuticals Group Co., Ltd. * | | |
Jinchuan Group International Resources Co., Ltd. | | |
K Wah International Holdings Ltd. | | |
LK Technology Holdings Ltd. | | |
Luk Fook Holdings International Ltd. | | |
| | |
Pacific Basin Shipping Ltd. | | |
Powerlong Real Estate Holdings Ltd. * | | |
| | |
Realord Group Holdings Ltd. *(a) | | |
Sa Sa International Holdings Ltd. * | | |
| | |
| | |
SmarTone Telecommunications Holdings Ltd. | | |
Stella International Holdings Ltd. | | |
| | |
| | |
Sunlight Real Estate Investment Trust | | |
Superb Summit International Group Ltd. *(b) | | |
Television Broadcasts Ltd. * | | |
Texhong Textile Group Ltd. | | |
The United Laboratories International Holdings Ltd. | | |
Theme International Holdings Ltd. * | | |
Truly International Holdings Ltd. | | |
Value Partners Group Ltd. | | |
| | |
| | |
| | |
| | |
|
|
| | |
|
|
| | |
| | |
| | |
| | |
Clal Insurance Enterprises Holdings Ltd. * | | |
| | |
Delek Automotive Systems Ltd. | | |
Delta Galil Industries Ltd. | | |
| | |
| | |
Formula Systems 1985 Ltd. | | |
| | |
| | |
| | |
| | |
| | |
| | |
| | |
| | |
| | |
Schwab International Equity ETFs | Annual Report49
Schwab International Small-Cap Equity ETF
Portfolio Holdings as of August 31, 2023 (continued)
| | |
| | |
Menora Mivtachim Holdings Ltd. | | |
Migdal Insurance & Financial Holding Ltd. | | |
| | |
One Software Technologies Ltd. | | |
Partner Communications Co., Ltd. * | | |
Paz Ashdod Refinery Ltd. * | | |
| | |
| | |
Rami Levy Chain Stores Hashikma Marketing 2006 Ltd. | | |
| | |
Sapiens International Corp. N.V. | | |
Sella Capital Real Estate Ltd. | | |
Summit Real Estate Holdings Ltd. | | |
| | |
|
|
| | |
Alerion Cleanpower S.p.A. | | |
| | |
Arnoldo Mondadori Editore S.p.A. | | |
| | |
| | |
| | |
Banca Monte dei Paschi di Siena S.p.A. * | | |
Banca Popolare di Sondrio S.p.A. | | |
| | |
| | |
| | |
| | |
Brunello Cucinelli S.p.A. | | |
| | |
| | |
| | |
Danieli & C Officine Meccaniche S.p.A. (a) | | |
| | |
| | |
| | |
| | |
| | |
Gruppo MutuiOnline S.p.A. | | |
| | |
Immobiliare Grande Distribuzione SIIQ S.p.A. | | |
| | |
| | |
| | |
Juventus Football Club S.p.A. *(a) | | |
| | |
| | |
MFE-MediaForEurope N.V., Class A | | |
MFE-MediaForEurope N.V., Class B | | |
| | |
| | |
| | |
| | |
Salvatore Ferragamo S.p.A. | | |
| | |
| | |
| | |
| | |
Tamburi Investment Partners S.p.A. | | |
| | |
| | |
| | |
| | |
| | |
| | |
| | |
| | |
|
|
| | |
| | |
| | |
Aeon Fantasy Co., Ltd. (a) | | |
| | |
| | |
Aichi Financial Group, Inc. | | |
| | |
| | |
| | |
| | |
| | |
| | |
| | |
| | |
| | |
| | |
| | |
| | |
| | |
| | |
| | |
Arcland Sakamoto Co., Ltd. | | |
Arcland Service Holdings Co., Ltd. *(b) | | |
| | |
| | |
| | |
Arisawa Manufacturing Co., Ltd. | | |
Asahi Diamond Industrial Co., Ltd. | | |
| | |
| | |
ASKA Pharmaceutical Holdings Co., Ltd. | | |
| | |
| | |
| | |
| | |
| | |
Bando Chemical Industries Ltd. | | |
| | |
| | |
| | |
Bell System24 Holdings, Inc. | | |
| | |
BeNext-Yumeshin Group Co. | | |
| | |
| | |
| | |
| | |
| | |
| | |
| | |
| | |
| | |
| | |
Chilled & Frozen Logistics Holdings Co., Ltd. | | |
| | |
Chiyoda Integre Co., Ltd. | | |
Chofu Seisakusho Co., Ltd. | | |
| | |
50Schwab International Equity ETFs | Annual Report
Schwab International Small-Cap Equity ETF
Portfolio Holdings as of August 31, 2023 (continued)
| | |
| | |
| | |
Chugoku Marine Paints Ltd. | | |
| | |
| | |
| | |
| | |
| | |
Comforia Residential REIT, Inc. | | |
Computer Engineering & Consulting Ltd. | | |
| | |
| | |
CRE Logistics REIT, Inc. * | | |
Create Restaurants Holdings, Inc. | | |
Create SD Holdings Co., Ltd. | | |
CTI Engineering Co., Ltd. | | |
Curves Holdings Co., Ltd. | | |
| | |
Dai Nippon Toryo Co., Ltd. | | |
| | |
| | |
| | |
| | |
| | |
Daiichi Jitsugyo Co., Ltd. | | |
| | |
Daiki Aluminium Industry Co., Ltd. | | |
Daikokutenbussan Co., Ltd. | | |
| | |
Dainichiseika Color & Chemicals Manufacturing Co., Ltd. | | |
| | |
Daishi Hokuetsu Financial Group, Inc. | | |
Daito Pharmaceutical Co., Ltd. | | |
| | |
Daiwabo Holdings Co., Ltd. | | |
| | |
| | |
| | |
| | |
| | |
| | |
| | |
Direct Marketing MiX, Inc. | | |
| | |
| | |
Doutor Nichires Holdings Co., Ltd. | | |
| | |
| | |
DyDo Group Holdings, Inc. | | |
| | |
| | |
| | |
| | |
| | |
| | |
| | |
| | |
| | |
| | |
| | |
| | |
| | |
| | |
ESCON Japan Reit Investment Corp. | | |
| | |
| | |
| | |
| | |
| | |
| | |
| | |
Financial Products Group Co., Ltd. | | |
| | |
France Bed Holdings Co., Ltd. | | |
| | |
| | |
| | |
Fuji Seal International, Inc. | | |
| | |
| | |
| | |
| | |
| | |
Fujio Food Group., Inc. * | | |
| | |
| | |
| | |
| | |
| | |
Fukushima Galilei Co., Ltd. | | |
Fukuyama Transporting Co., Ltd. | | |
FULLCAST Holdings Co., Ltd. | | |
Funai Soken Holdings, Inc. | | |
| | |
Furuno Electric Co., Ltd. | | |
| | |
| | |
Futaba Industrial Co., Ltd. | | |
| | |
| | |
Gakken Holdings Co., Ltd. | | |
Genky DrugStores Co., Ltd. | | |
| | |
| | |
| | |
Global One Real Estate Investment Corp. | | |
| | |
| | |
| | |
| | |
| | |
| | |
| | |
| | |
| | |
| | |
| | |
| | |
| | |
Hankyu Hanshin REIT, Inc. | | |
| | |
| | |
| | |
Health Care & Medical Investment Corp. | | |
Heiwa Real Estate Co., Ltd. | | |
Heiwa Real Estate REIT, Inc. | | |
| | |
| | |
| | |
| | |
| | |
| | |
| | |
| | |
| | |
Hokkaido Electric Power Co., Inc. * | | |
Schwab International Equity ETFs | Annual Report51
Schwab International Small-Cap Equity ETF
Portfolio Holdings as of August 31, 2023 (continued)
| | |
| | |
Hokkoku Financial Holdings, Inc. | | |
| | |
Hokuhoku Financial Group, Inc. | | |
Hokuriku Electric Power Co. * | | |
| | |
| | |
Hoosiers Holdings Co., Ltd. | | |
Hoshino Resorts REIT, Inc. | | |
| | |
| | |
| | |
| | |
Ichigo Office REIT Investment Corp. | | |
| | |
| | |
| | |
| | |
| | |
| | |
| | |
Inaba Denki Sangyo Co., Ltd. | | |
| | |
| | |
| | |
| | |
| | |
| | |
| | |
Integrated Design & Engineering Holdings Co., Ltd. | | |
Iriso Electronics Co., Ltd. | | |
Ishihara Sangyo Kaisha Ltd. | | |
| | |
Itochu Advance Logistics Investment Corp. | | |
| | |
Itochu-Shokuhin Co., Ltd. | | |
| | |
JAC Recruitment Co., Ltd. | | |
| | |
| | |
| | |
Japan Elevator Service Holdings Co., Ltd. | | |
| | |
| | |
| | |
Japan Petroleum Exploration Co., Ltd. | | |
Japan Pulp & Paper Co., Ltd. | | |
Japan Securities Finance Co., Ltd. | | |
| | |
| | |
| | |
| | |
| | |
| | |
| | |
| | |
Juroku Financial Group, Inc. | | |
| | |
| | |
Kaga Electronics Co., Ltd. | | |
| | |
| | |
| | |
| | |
| | |
| | |
Kanto Denka Kogyo Co., Ltd. | | |
| | |
Katakura Industries Co., Ltd. | | |
| | |
KeePer Technical Laboratory Co., Ltd. | | |
Keihanshin Building Co., Ltd. | | |
| | |
Kenedix Residential Next Investment Corp. | | |
Kenedix Retail REIT Corp. | | |
| | |
| | |
| | |
Kintetsu Department Store Co., Ltd. | | |
| | |
Kissei Pharmaceutical Co., Ltd. | | |
Ki-Star Real Estate Co., Ltd. | | |
| | |
| | |
| | |
Kokusai Pulp & Paper Co., Ltd. | | |
KOMEDA Holdings Co., Ltd. | | |
| | |
| | |
| | |
Konoike Transport Co., Ltd. | | |
Kosaido Holdings Co., Ltd. | | |
Koshidaka Holdings Co., Ltd. | | |
| | |
| | |
Kumiai Chemical Industry Co., Ltd. | | |
| | |
| | |
| | |
| | |
| | |
| | |
Kyokuto Kaihatsu Kogyo Co., Ltd. | | |
| | |
Kyorin Pharmaceutical Co., Ltd. | | |
Kyoritsu Maintenance Co., Ltd. | | |
| | |
| | |
| | |
M&A Capital Partners Co., Ltd. * | | |
| | |
| | |
| | |
Makino Milling Machine Co., Ltd. | | |
Management Solutions Co., Ltd. | | |
| | |
Mars Group Holdings Corp. | | |
| | |
| | |
| | |
Marusan Securities Co., Ltd. | | |
| | |
Maruzen Showa Unyu Co., Ltd. | | |
| | |
| | |
| | |
Matsuyafoods Holdings Co., Ltd. | | |
| | |
| | |
| | |
| | |
| | |
Megmilk Snow Brand Co., Ltd. | | |
52Schwab International Equity ETFs | Annual Report
Schwab International Small-Cap Equity ETF
Portfolio Holdings as of August 31, 2023 (continued)
| | |
| | |
Meiko Electronics Co., Ltd. | | |
Meisei Industrial Co., Ltd. | | |
| | |
| | |
Micronics Japan Co., Ltd. | | |
| | |
Mie Kotsu Group Holdings, Inc. | | |
| | |
Mimasu Semiconductor Industry Co., Ltd. | | |
| | |
| | |
| | |
Miroku Jyoho Service Co., Ltd. | | |
| | |
| | |
Mitsubishi Estate Logistics REIT Investment Corp. | | |
Mitsubishi Logisnext Co., Ltd. | | |
Mitsubishi Pencil Co., Ltd. | | |
Mitsubishi Research Institute, Inc. | | |
Mitsubishi Shokuhin Co., Ltd. | | |
| | |
Mitsui DM Sugar Holdings Co., Ltd. | | |
| | |
Mitsui-Soko Holdings Co., Ltd. | | |
Mitsuuroko Group Holdings Co., Ltd. | | |
| | |
| | |
| | |
Mochida Pharmaceutical Co., Ltd. | | |
| | |
| | |
| | |
| | |
| | |
| | |
| | |
Musashi Seimitsu Industry Co., Ltd. | | |
| | |
| | |
| | |
Nagatanien Holdings Co., Ltd. | | |
| | |
| | |
| | |
| | |
| | |
| | |
| | |
| | |
| | |
| | |
| | |
Nihon Parkerizing Co., Ltd. | | |
| | |
Nikkon Holdings Co., Ltd. | | |
| | |
| | |
| | |
| | |
| | |
Nippon Densetsu Kogyo Co., Ltd. | | |
Nippon Fine Chemical Co., Ltd. | | |
| | |
Nippon Kanzai Holdings Co., Ltd. | | |
Nippon Light Metal Holdings Co., Ltd. | | |
| | |
Nippon Paper Industries Co., Ltd. * | | |
Nippon Parking Development Co., Ltd., Class C | | |
Nippon Pillar Packing Co., Ltd. | | |
NIPPON REIT Investment Corp. | | |
| | |
Nippon Sheet Glass Co., Ltd. * | | |
| | |
| | |
Nippon Thompson Co., Ltd. | | |
Nippon Yakin Kogyo Co., Ltd. | | |
Nishimatsu Construction Co., Ltd. | | |
Nishimatsuya Chain Co., Ltd. | | |
Nishi-Nippon Financial Holdings, Inc. | | |
Nishio Holdings Co., Ltd. | | |
| | |
Nissei ASB Machine Co., Ltd. | | |
| | |
| | |
| | |
| | |
| | |
| | |
Nittetsu Mining Co., Ltd. | | |
| | |
| | |
| | |
| | |
| | |
| | |
| | |
| | |
| | |
| | |
NS United Kaiun Kaisha Ltd. | | |
| | |
| | |
NTT UD REIT Investment Corp. | | |
| | |
| | |
| | |
Oisix ra daichi, Inc. *(a) | | |
| | |
| | |
| | |
Okasan Securities Group, Inc. | | |
Oki Electric Industry Co., Ltd. | | |
Okinawa Cellular Telephone Co. | | |
Okinawa Financial Group, Inc. | | |
| | |
| | |
| | |
| | |
Onward Holdings Co., Ltd. | | |
| | |
| | |
| | |
| | |
Osaka Organic Chemical Industry Ltd. | | |
| | |
OSAKA Titanium Technologies Co. Ltd (a) | | |
| | |
| | |
| | |
Pacific Industrial Co., Ltd. | | |
Pacific Metals Co., Ltd. * | | |
PAL GROUP Holdings Co., Ltd. | | |
Paramount Bed Holdings Co., Ltd. | | |
Schwab International Equity ETFs | Annual Report53
Schwab International Small-Cap Equity ETF
Portfolio Holdings as of August 31, 2023 (continued)
| | |
| | |
Pharma Foods International Co., Ltd. | | |
| | |
| | |
| | |
| | |
| | |
Pole To Win Holdings, Inc. | | |
| | |
| | |
| | |
Prestige International, Inc. | | |
| | |
| | |
| | |
| | |
| | |
| | |
| | |
| | |
| | |
Retail Partners Co., Ltd. | | |
Rheon Automatic Machinery Co., Ltd. | | |
| | |
| | |
| | |
| | |
| | |
| | |
| | |
| | |
| | |
| | |
| | |
| | |
| | |
| | |
RS Technologies Co., Ltd. | | |
| | |
| | |
| | |
| | |
| | |
| | |
Saibu Gas Holdings Co., Ltd. | | |
| | |
Sakai Chemical Industry Co., Ltd. | | |
Sakai Moving Service Co., Ltd. | | |
| | |
| | |
| | |
| | |
Samty Residential Investment Corp. | | |
San ju San Financial Group, Inc. | | |
| | |
| | |
| | |
| | |
Sanken Electric Co., Ltd. | | |
Sanki Engineering Co., Ltd. | | |
| | |
Sanyo Chemical Industries Ltd. | | |
| | |
Sanyo Electric Railway Co., Ltd. | | |
Sanyo Special Steel Co., Ltd. | | |
| | |
| | |
| | |
| | |
| | |
| | |
| | |
| | |
Senko Group Holdings Co., Ltd. | | |
Senshu Electric Co., Ltd. | | |
Senshu Ikeda Holdings, Inc. | | |
Septeni Holdings Co., Ltd. | | |
| | |
Shibaura Machine Co., Ltd. | | |
Shibaura Mechatronics Corp. (a) | | |
| | |
| | |
Shima Seiki Manufacturing Ltd. | | |
Shin Nippon Air Technologies Co., Ltd. | | |
Shin Nippon Biomedical Laboratories Ltd. | | |
Shindengen Electric Manufacturing Co., Ltd. | | |
Shin-Etsu Polymer Co., Ltd. | | |
| | |
Shinmaywa Industries Ltd. | | |
| | |
| | |
| | |
| | |
| | |
| | |
| | |
| | |
Sinanen Holdings Co., Ltd. | | |
Sinfonia Technology Co., Ltd. | | |
| | |
| | |
SKY Perfect JSAT Holdings, Inc. | | |
| | |
| | |
Softcreate Holdings Corp. | | |
| | |
SOSiLA Logistics REIT, Inc. | | |
| | |
| | |
| | |
| | |
St Marc Holdings Co., Ltd. | | |
Star Asia Investment Corp. | | |
| | |
| | |
Starts Proceed Investment Corp. | | |
| | |
| | |
| | |
| | |
Sumitomo Densetsu Co., Ltd. | | |
Sumitomo Mitsui Construction Co., Ltd. | | |
Sumitomo Osaka Cement Co., Ltd. | | |
| | |
Sumitomo Seika Chemicals Co., Ltd. | | |
| | |
Sun Frontier Fudousan Co., Ltd. | | |
| | |
| | |
| | |
| | |
Tachibana Eletech Co., Ltd. | | |
| | |
| | |
Taihei Dengyo Kaisha Ltd. | | |
54Schwab International Equity ETFs | Annual Report
Schwab International Small-Cap Equity ETF
Portfolio Holdings as of August 31, 2023 (continued)
| | |
| | |
| | |
Takamatsu Construction Group Co., Ltd. | | |
Takara Leben Real Estate Investment Corp. | | |
Takara Standard Co., Ltd. | | |
Takasago International Corp. | | |
Takasago Thermal Engineering Co., Ltd. | | |
| | |
Takeuchi Manufacturing Co., Ltd. | | |
| | |
| | |
| | |
| | |
| | |
Tatsuta Electric Wire & Cable Co., Ltd. * | | |
| | |
| | |
Teikoku Electric Manufacturing Co., Ltd. | | |
| | |
| | |
| | |
| | |
| | |
| | |
| | |
| | |
| | |
| | |
| | |
| | |
| | |
| | |
The Japan Wool Textile Co., Ltd. | | |
| | |
| | |
| | |
| | |
| | |
The Nippon Road Co., Ltd. | | |
The Nisshin Oillio Group Ltd. | | |
The Ogaki Kyoritsu Bank Ltd. | | |
| | |
The Okinawa Electric Power Co., Inc. * | | |
| | |
The San-in Godo Bank Ltd. | | |
The Shibusawa Warehouse Co., Ltd. | | |
| | |
| | |
The Sumitomo Warehouse Co., Ltd. | | |
| | |
| | |
| | |
The Yamanashi Chuo Bank Ltd. | | |
| | |
| | |
| | |
| | |
| | |
| | |
| | |
| | |
Toho Titanium Co., Ltd. (a) | | |
| | |
| | |
| | |
| | |
Tokai Tokyo Financial Holdings, Inc. | | |
| | |
| | |
Tokushu Tokai Paper Co., Ltd. | | |
| | |
Tokyo Electron Device Ltd. | | |
Tokyo Kiraboshi Financial Group, Inc. | | |
| | |
Tokyo Steel Manufacturing Co., Ltd. | | |
| | |
Tokyu Construction Co., Ltd. | | |
| | |
| | |
| | |
Tonami Holdings Co., Ltd. | | |
| | |
| | |
| | |
| | |
Torii Pharmaceutical Co., Ltd. | | |
Torishima Pump Manufacturing Co., Ltd. | | |
| | |
Tosei REIT Investment Corp. | | |
| | |
| | |
| | |
Towa Pharmaceutical Co., Ltd. | | |
Toyo Construction Co., Ltd. | | |
| | |
| | |
Toyo Ink SC Holdings Co., Ltd. | | |
| | |
| | |
| | |
| | |
| | |
| | |
| | |
Tri Chemical Laboratories, Inc. | | |
| | |
| | |
Tsubaki Nakashima Co., Ltd. | | |
| | |
Tsuburaya Fields Holdings, Inc. | | |
| | |
Tsukishima Holdings Co., Ltd. | | |
Tsurumi Manufacturing Co., Ltd. | | |
| | |
| | |
| | |
| | |
| | |
| | |
United Super Markets Holdings, Inc. | | |
Universal Entertainment Corp. | | |
Usen-Next Holdings Co., Ltd. | | |
| | |
| | |
| | |
| | |
| | |
| | |
Vision, Inc./Tokyo Japan * | | |
| | |
| | |
| | |
| | |
| | |
Warabeya Nichiyo Holdings Co., Ltd. | | |
| | |
Schwab International Equity ETFs | Annual Report55
Schwab International Small-Cap Equity ETF
Portfolio Holdings as of August 31, 2023 (continued)
| | |
| | |
| | |
| | |
| | |
| | |
| | |
Yahagi Construction Co., Ltd. | | |
YAKUODO Holdings Co., Ltd. | | |
| | |
| | |
| | |
| | |
Yodogawa Steel Works Ltd. | | |
Yokogawa Bridge Holdings Corp. | | |
| | |
| | |
| | |
| | |
Yoshinoya Holdings Co., Ltd. | | |
| | |
| | |
| | |
ZERIA Pharmaceutical Co., Ltd. | | |
| | |
| | |
| | |
| | |
|
|
| | |
AMG Critical Materials N.V. | | |
| | |
| | |
| | |
Brunel International N.V. | | |
| | |
Eurocommercial Properties N.V. | | |
| | |
| | |
| | |
Koninklijke BAM Groep N.V. | | |
Majorel Group Luxembourg S.A. | | |
| | |
| | |
| | |
| | |
| | |
| | |
| | |
| | |
| | |
|
|
| | |
| | |
| | |
| | |
| | |
Heartland Group Holdings Ltd. | | |
| | |
| | |
| | |
Precinct Properties New Zealand Ltd. | | |
| | |
| | |
SKY Network Television Ltd. | | |
| | |
| | |
Summerset Group Holdings Ltd. | | |
| | |
Vital Healthcare Property Trust | | |
| | |
|
|
Aker Carbon Capture A.S.A. * | | |
Aker Horizons Holding A/S * | | |
| | |
Arendals Fossekompani A/S (a) | | |
| | |
| | |
| | |
| | |
| | |
| | |
| | |
| | |
| | |
Crayon Group Holding A.S.A. * | | |
| | |
| | |
| | |
| | |
| | |
| | |
| | |
Hexagon Composites A.S.A. * | | |
| | |
| | |
| | |
MPC Container Ships A.S.A | | |
| | |
| | |
| | |
| | |
SpareBank 1 SR-Bank A.S.A. | | |
| | |
| | |
| | |
| | |
| | |
Wallenius Wilhelmsen A.S.A. | | |
Wilh Wilhelmsen Holding A.S.A., Class A | | |
| | |
|
|
| | |
| | |
| | |
Bank Handlowy w Warszawie S.A. | | |
| | |
| | |
| | |
| | |
| | |
| | |
| | |
Jastrzebska Spolka Weglowa S.A. * | | |
| | |
| | |
| | |
PGE Polska Grupa Energetyczna S.A. * | | |
Tauron Polska Energia S.A. * | | |
56Schwab International Equity ETFs | Annual Report
Schwab International Small-Cap Equity ETF
Portfolio Holdings as of August 31, 2023 (continued)
| | |
| | |
| | |
|
|
| | |
Banco Comercial Portugues S.A., Class R * | | |
Corticeira Amorim SGPS S.A. | | |
CTT-Correios de Portugal S.A. | | |
Greenvolt-Energias Renovaveis S.A. *(a) | | |
| | |
REN - Redes Energeticas Nacionais, SGPS, S.A. | | |
Semapa-Sociedade de Investimento e Gestao | | |
| | |
| | |
| | |
|
|
| | |
| | |
Advanced Nano Products Co., Ltd. | | |
Advanced Process Systems Corp. | | |
| | |
| | |
| | |
| | |
| | |
| | |
| | |
| | |
| | |
| | |
Bukwang Pharmaceutical Co., Ltd. * | | |
Cellivery Therapeutics, Inc. *(b) | | |
| | |
Chong Kun Dang Pharmaceutical Corp. | | |
| | |
| | |
CMG Pharmaceutical Co., Ltd. * | | |
| | |
| | |
| | |
| | |
Cosmochemical Co., Ltd. * | | |
Creative & Innovative System * | | |
CrystalGenomics Invites Co., Ltd. * | | |
| | |
Daeduck Electronics Co., Ltd. / New | | |
Daejoo Electronic Materials Co., Ltd. | | |
| | |
| | |
Daewoong Pharmaceutical Co., Ltd. | | |
Daishin Securities Co., Ltd. | | |
| | |
| | |
| | |
| | |
| | |
| | |
Dong-A Socio Holdings Co., Ltd. | | |
| | |
Dongjin Semichem Co., Ltd. | | |
DongKook Pharmaceutical Co., Ltd. | | |
Dongkuk Steel Mill Co., Ltd. * | | |
| | |
Dongwon Industries Co., Ltd. | | |
| | |
Doosan Fuel Cell Co., Ltd. * | | |
| | |
| | |
Duk San Neolux Co., Ltd. * | | |
| | |
| | |
| | |
| | |
| | |
| | |
| | |
ESR Kendall Square REIT Co., Ltd. | | |
| | |
Eugene Investment & Securities Co., Ltd. | | |
Eugene Technology Co., Ltd. | | |
| | |
GemVax & Kael Co., Ltd. * | | |
GeneOne Life Science, Inc. * | | |
| | |
| | |
Grand Korea Leisure Co., Ltd. * | | |
Green Cross Holdings Corp. | | |
Green Cross LabCell Corp. | | |
| | |
| | |
| | |
| | |
Hana Tour Service, Inc. * | | |
Hanall Biopharma Co., Ltd. * | | |
| | |
| | |
| | |
Hanjin Transportation Co., Ltd. | | |
| | |
Hanmi Semiconductor Co., Ltd. | | |
| | |
Hansol Chemical Co., Ltd. | | |
| | |
Hanwha General Insurance Co., Ltd. * | | |
Hanwha Investment & Securities Co., Ltd. * | | |
| | |
| | |
HD Hyundai Construction Equipment Co. Ltd. | | |
HD Hyundai Electric Co. Ltd. | | |
| | |
HDC Hyundai Development Co-Engineering & Construction, Class E | | |
| | |
| | |
| | |
HLB Life Science Co., Ltd. * | | |
HLB Therapeutics Co., Ltd. * | | |
| | |
| | |
| | |
Hyosung Advanced Materials Corp. | | |
| | |
| | |
Hyosung Heavy Industries Corp. * | | |
| | |
| | |
Hyundai Bioscience Co., Ltd. * | | |
Hyundai Elevator Co., Ltd. | | |
Schwab International Equity ETFs | Annual Report57
Schwab International Small-Cap Equity ETF
Portfolio Holdings as of August 31, 2023 (continued)
| | |
| | |
| | |
Hyundai Home Shopping Network Corp. | | |
Hyundai Rotem Co., Ltd. * | | |
Il Dong Pharmaceutical Co., Ltd. * | | |
Ilyang Pharmaceutical Co., Ltd. | | |
| | |
| | |
| | |
Innox Advanced Materials Co., Ltd. | | |
| | |
Intellian Technologies, Inc. | | |
| | |
| | |
| | |
JB Financial Group Co., Ltd. | | |
| | |
| | |
Jusung Engineering Co., Ltd. | | |
| | |
| | |
| | |
KEPCO Engineering & Construction Co., Inc. | | |
| | |
KIWOOM Securities Co., Ltd. | | |
| | |
Koh Young Technology, Inc. | | |
| | |
| | |
Komipharm International Co., Ltd. * | | |
Korea Electric Terminal Co., Ltd. | | |
| | |
Korea Petrochemical Ind Co., Ltd. | | |
Korea Real Estate Investment & Trust Co., Ltd. | | |
| | |
| | |
Kuk-il Paper Manufacturing Co., Ltd. *(b) | | |
| | |
| | |
Kwang Dong Pharmaceutical Co., Ltd. | | |
| | |
| | |
LegoChem Biosciences, Inc. * | | |
| | |
| | |
| | |
| | |
| | |
Lotte Tour Development Co., Ltd. * | | |
| | |
| | |
| | |
| | |
| | |
| | |
| | |
| | |
| | |
| | |
Mezzion Pharma Co., Ltd. * | | |
| | |
Myoung Shin Industrial Co., Ltd. * | | |
Namsun Aluminum Co., Ltd. * | | |
Namyang Dairy Products Co., Ltd. | | |
| | |
| | |
| | |
| | |
| | |
| | |
| | |
NICE Information Service Co., Ltd. | | |
| | |
| | |
| | |
| | |
| | |
People & Technology, Inc. | | |
| | |
| | |
PI Advanced Materials Co., Ltd. | | |
| | |
| | |
| | |
| | |
Sam Chun Dang Pharm Co., Ltd. * | | |
| | |
Sambu Engineering & Construction Co., Ltd. * | | |
| | |
Samsung Pharmaceutical Co., Ltd. * | | |
Samwha Capacitor Co., Ltd. | | |
| | |
| | |
Seah Besteel Holdings Corp. | | |
Sebang Global Battery Co., Ltd. | | |
Seojin System Co., Ltd. * | | |
Seoul Semiconductor Co., Ltd. | | |
| | |
| | |
Shinhan Alpha REIT Co., Ltd. | | |
Shinsegae International, Inc. | | |
| | |
| | |
| | |
| | |
| | |
| | |
| | |
SM Entertainment Co., Ltd. | | |
| | |
| | |
| | |
Songwon Industrial Co., Ltd. | | |
| | |
| | |
| | |
| | |
Sung Kwang Bend Co., Ltd. | | |
Sungeel Hitech Co., Ltd. * | | |
| | |
Taekwang Industrial Co., Ltd. | | |
Taihan Electric Wire Co., Ltd. * | | |
| | |
The Nature Holdings Co., Ltd.. | | |
| | |
| | |
Tokai Carbon Korea Co., Ltd. | | |
| | |
| | |
Vaxcell-Bio Therapeutics Co., Ltd. * | | |
| | |
| | |
| | |
W-Scope Chungju Plant Co., Ltd. * | | |
58Schwab International Equity ETFs | Annual Report
Schwab International Small-Cap Equity ETF
Portfolio Holdings as of August 31, 2023 (continued)
| | |
Wysiwyg Studios Co., Ltd. * | | |
| | |
Youlchon Chemical Co., Ltd. | | |
| | |
| | |
Youngone Holdings Co., Ltd. | | |
Yuanta Securities Korea Co., Ltd. | | |
Yungjin Pharmaceutical Co., Ltd. * | | |
| | |
| | |
|
|
| | |
| | |
| | |
| | |
| | |
Cromwell European Real Estate Investment Trust | | |
Digital Core REIT Management Pte Ltd. | | |
Eagle Hospitality Trust *(b) | | |
| | |
Far East Hospitality Trust | | |
First Real Estate Investment Trust | | |
| | |
Frasers Centrepoint Trust | | |
| | |
Keppel Infrastructure Trust | | |
Keppel Pacific Oak US REIT | | |
Lendlease Global Commercial REIT | | |
Manulife US Real Estate Investment Trust | | |
Nanofilm Technologies International Ltd. | | |
OUE Commercial Real Estate Investment Trust | | |
Parkway Life Real Estate Investment Trust | | |
Raffles Medical Group Ltd. | | |
| | |
| | |
| | |
| | |
| | |
| | |
| | |
| | |
|
|
| | |
| | |
| | |
Atresmedia Corp de Medios de Comunicaion S.A. | | |
| | |
Cia de Distribucion Integral Logista Holdings S.A. | | |
| | |
Construcciones y Auxiliar de Ferrocarriles S.A. | | |
Distribuidora Internacional de Alimentacion S.A. * | | |
| | |
Ence Energia y Celulosa S.A. (a) | | |
| | |
| | |
| | |
Fomento de Construcciones y Contratas S.A. | | |
| | |
Global Dominion Access S.A. | | |
| | |
Laboratorios Farmaceuticos Rovi S.A. | | |
Lar Espana Real Estate Socimi S.A. | | |
| | |
Linea Directa Aseguradora S.A. Cia de Seguros y Reaseguros | | |
Melia Hotels International S.A. * | | |
| | |
| | |
| | |
Prosegur Cia de Seguridad S.A. | | |
| | |
Solaria Energia y Medio Ambiente S.A. * | | |
Tecnicas Reunidas S.A. *(a) | | |
| | |
| | |
| | |
| | |
|
|
| | |
| | |
| | |
| | |
| | |
| | |
| | |
Atrium Ljungberg AB, B Shares | | |
| | |
| | |
| | |
| | |
| | |
| | |
| | |
| | |
| | |
| | |
| | |
| | |
| | |
| | |
| | |
Cibus Nordic Real Estate AB | | |
| | |
| | |
| | |
| | |
| | |
Corem Property Group AB, B Shares | | |
| | |
| | |
Electrolux Professional AB, B Shares | | |
| | |
| | |
| | |
| | |
| | |
| | |
| | |
| | |
| | |
Hufvudstaden AB, A Shares | | |
Schwab International Equity ETFs | Annual Report59
Schwab International Small-Cap Equity ETF
Portfolio Holdings as of August 31, 2023 (continued)
| | |
| | |
| | |
| | |
| | |
| | |
Lagercrantz Group AB, B Shares | | |
| | |
| | |
| | |
| | |
| | |
Modern Times Group MTG AB, B Shares * | | |
| | |
| | |
| | |
| | |
| | |
| | |
| | |
| | |
| | |
| | |
| | |
Platzer Fastigheter Holding AB, B Shares | | |
| | |
| | |
Samhallsbyggnadsbolaget i Norden AB (a) | | |
Scandic Hotels Group AB *(a) | | |
| | |
| | |
| | |
| | |
| | |
Storskogen Group AB, B Shares | | |
| | |
| | |
| | |
Truecaller AB, B Shares * | | |
Viaplay Group AB, B Shares *(a) | | |
Vitec Software Group AB, B Shares | | |
| | |
| | |
| | |
| | |
| | |
|
|
| | |
| | |
| | |
| | |
| | |
| | |
| | |
| | |
Basilea Pharmaceutica AG * | | |
| | |
Bossard Holding AG, Class A | | |
| | |
Burckhardt Compression Holding AG | | |
| | |
| | |
| | |
COSMO Pharmaceuticals N.V. | | |
| | |
| | |
| | |
| | |
| | |
| | |
| | |
| | |
| | |
Hiag Immobilien Holding AG | | |
| | |
| | |
| | |
| | |
| | |
| | |
| | |
| | |
| | |
| | |
| | |
| | |
| | |
| | |
Meyer Burger Technology AG *(a) | | |
| | |
| | |
| | |
| | |
| | |
| | |
Schweiter Technologies AG | | |
| | |
| | |
| | |
| | |
| | |
St. Galler Kantonalbank AG | | |
| | |
| | |
Swissquote Group Holding S.A. | | |
| | |
| | |
| | |
| | |
| | |
| | |
| | |
| | |
| | |
| | |
|
|
| | |
| | |
| | |
| | |
| | |
| | |
| | |
| | |
| | |
| | |
Aston Martin Lagonda Global Holdings plc *(a) | | |
Auction Technology Group plc * | | |
| | |
Babcock International Group plc * | | |
60Schwab International Equity ETFs | Annual Report
Schwab International Small-Cap Equity ETF
Portfolio Holdings as of August 31, 2023 (continued)
| | |
| | |
Balanced Commercial Property Trust Ltd. | | |
| | |
Bank of Georgia Group plc | | |
| | |
| | |
| | |
| | |
| | |
Bytes Technology Group plc | | |
| | |
| | |
| | |
| | |
| | |
| | |
| | |
| | |
| | |
| | |
| | |
| | |
| | |
Crest Nicholson Holdings plc | | |
| | |
| | |
| | |
| | |
Diversified Energy Co., plc | | |
| | |
| | |
| | |
| | |
| | |
| | |
| | |
| | |
| | |
| | |
| | |
| | |
| | |
| | |
| | |
| | |
| | |
| | |
| | |
Great Portland Estates plc | | |
| | |
| | |
| | |
| | |
| | |
| | |
| | |
| | |
| | |
| | |
| | |
| | |
| | |
| | |
| | |
| | |
| | |
International Distributions Services plc * | | |
| | |
| | |
| | |
| | |
| | |
| | |
| | |
| | |
Jupiter Fund Management plc | | |
| | |
| | |
| | |
| | |
Liontrust Asset Management plc | | |
LondonMetric Property plc | | |
| | |
| | |
Marks & Spencer Group plc * | | |
| | |
Mitchells & Butlers plc * | | |
| | |
| | |
| | |
Moneysupermarket.com Group plc | | |
| | |
Morgan Advanced Materials plc | | |
| | |
| | |
Network International Holdings plc * | | |
| | |
| | |
| | |
| | |
Oxford Nanopore Technologies plc * | | |
| | |
Paragon Banking Group plc | | |
| | |
| | |
| | |
| | |
Picton Property Income Ltd. | | |
| | |
| | |
| | |
Primary Health Properties plc | | |
| | |
| | |
| | |
| | |
| | |
| | |
| | |
| | |
| | |
| | |
| | |
| | |
| | |
| | |
| | |
| | |
| | |
| | |
| | |
| | |
Spire Healthcare Group plc | | |
Spirent Communications plc | | |
| | |
Supermarket Income REIT plc | | |
Schwab International Equity ETFs | Annual Report61
Schwab International Small-Cap Equity ETF
Portfolio Holdings as of August 31, 2023 (continued)
| | |
| | |
| | |
| | |
| | |
| | |
| | |
| | |
| | |
| | |
| | |
| | |
| | |
UK Commercial Property REIT Ltd. | | |
Vanquis Banking Group plc | | |
| | |
| | |
| | |
| | |
| | |
Watches of Switzerland Group plc * | | |
| | |
| | |
| | |
| | |
| | |
Total Common Stocks
(Cost $3,721,545,475) | |
|
PREFERRED STOCKS 0.1% OF NET ASSETS |
|
|
Draegerwerk AG & Co. KGaA | | |
|
|
Danieli & C Officine Meccaniche S.p.A. - RSP | | |
|
|
Daishin Securities Co., Ltd. | | |
|
|
| | |
Total Preferred Stocks
(Cost $3,031,322) | |
|
RIGHTS 0.0% OF NET ASSETS |
|
|
|
expires 09/07/23, strike KRW 5,560.00 *(b) | | |
|
expires 09/22/23, strike KRW 4,260.00 *(b) | | |
| | |
Total Rights
(Cost $290,341) | |
| | |
WARRANTS 0.0% OF NET ASSETS |
|
|
|
| | |
|
|
|
| | |
| |
| | |
SHORT-TERM INVESTMENTS 2.2% OF NET ASSETS |
|
|
State Street Institutional U.S. Government Money Market Fund, Premier Class 5.28% (c) | | |
State Street Institutional U.S. Government Money Market Fund, Premier Class 5.28% (c)(d) | | |
| | |
Total Short-Term Investments
(Cost $80,459,474) | |
Total Investments in Securities
(Cost $3,805,326,612) | |
| | | CURRENT VALUE/
UNREALIZED
DEPRECIATION
($) |
|
| | | |
MSCI EAFE Index, expires 09/15/23 | | | |
| Non-income producing security. |
| All or a portion of this security is on loan. Securities on loan were valued at $74,679,811. |
| Fair valued using significant unobservable inputs (see financial note 2(a), Securities for which no quoted value is available, for additional information). |
| The rate shown is the annualized 7-day yield. |
| Security purchased with cash collateral received for securities on loan. |
| |
| Real Estate Investment Trust |
| Risparmio (Savings Shares) |
| |
62Schwab International Equity ETFs | Annual Report
Schwab International Small-Cap Equity ETF
Portfolio Holdings as of August 31, 2023 (continued)
The following is a summary of the inputs used to value the fund’s investments as of August 31, 2023 (see financial note 2(a) for additional information):
| QUOTED PRICES IN
ACTIVE MARKETS FOR
IDENTICAL ASSETS
(LEVEL 1) | OTHER SIGNIFICANT
OBSERVABLE INPUTS
(LEVEL 2) | SIGNIFICANT
UNOBSERVABLE INPUTS
(LEVEL 3) | |
| | | | |
| | | | |
| | | | |
| | | | |
| | | | |
| | | | |
| | | | |
| | | | |
| | | | |
| | | | |
| | | | |
| | | | |
| | | | |
| | | | |
| | | | |
| | | | |
| | | | |
| | | | |
| | | | |
| Level 3 amount shown includes securities determined to have no value at August 31, 2023. |
| As categorized in the Portfolio Holdings. |
| Futures contracts are reported at cumulative unrealized appreciation or depreciation. |
Fund investments in mutual funds are classified as Level 1, without consideration to the classification level of the underlying
securities held by the mutual funds, which could be Level 1, Level 2 or Level 3.
Schwab International Equity ETFs | Annual Report63
Schwab International Small-Cap Equity ETF
Statement of Assets and Liabilities
As of August 31, 2023
|
Investments in securities, at value - unaffiliated (cost $3,805,326,612) including securities on loan of $74,679,811 | | |
Foreign currency, at value (cost $2,062,236) | | |
Deposit with broker for futures contracts | | |
| | |
| | |
| | |
Income from securities on loan | | |
| | |
| | |
|
|
Collateral held for securities on loan | | |
| | |
| | |
| | |
Variation margin on futures contracts | | |
Foreign capital gains tax | | |
| | |
| | |
|
|
Capital received from investors | | |
| | |
| | |
64Schwab International Equity ETFs | Annual Report
Schwab International Small-Cap Equity ETF
Statement of Operations
For the period September 1, 2022 through August 31, 2023 |
|
Dividends received from securities - unaffiliated (net of foreign withholding tax of $12,283,583) | | |
| | |
| | |
|
|
| | |
| | |
| | |
| | |
| | |
| | |
|
REALIZED AND UNREALIZED GAINS (LOSSES) |
Net realized losses on sales of securities - unaffiliated (net of foreign capital gains tax paid of $932) | | |
Net realized gains on sales of in-kind redemptions - unaffiliated | | |
Net realized gains on futures contracts | | |
Net realized losses on foreign currency transactions | | |
| | |
Net change in unrealized appreciation (depreciation) on securities - unaffiliated (net of change in foreign capital gains tax of $148,243) | | |
Net change in unrealized appreciation (depreciation) on futures contracts | | |
Net change in unrealized appreciation (depreciation) on foreign currency translations | | |
Net change in unrealized appreciation (depreciation) | | |
Net realized and unrealized gains | | |
Increase in net assets resulting from operations | | |
| Professional fees associated with the filing of tax claims in the European Union deemed to be non-contingent and non-routine expenses of the fund (see financial notes 2(d) and 4 for additional information). |
Schwab International Equity ETFs | Annual Report65
Schwab International Small-Cap Equity ETF
Statement of Changes in Net Assets
For the current and prior report periods
|
| | |
| | | |
Net realized gains (losses) | | | |
Net change in unrealized appreciation (depreciation) | | | |
Increase (decrease) in net assets resulting from operations | | | |
|
DISTRIBUTIONS TO SHAREHOLDERS |
| | | |
TRANSACTIONS IN FUND SHARES |
| | |
| | | | | |
| | | | | |
| | | | | |
Net transactions in fund shares | | | | | |
|
SHARES OUTSTANDING AND NET ASSETS |
| | |
| | | | | |
| | | | | |
Total increase (decrease) | | | | | |
| | | | | |
66Schwab International Equity ETFs | Annual Report
Schwab Emerging Markets Equity ETF
Financial Statements
| | | | | | |
|
Net asset value at beginning of period | | | | | | |
Income (loss) from investment operations: | | | | | | |
Net investment income (loss)1 | | | | | | |
Net realized and unrealized gains (losses) | | | | | | |
Total from investment operations | | | | | | |
| | | | | | |
Distributions from net investment income | | | | | | |
Net asset value at end of period | | | | | | |
| | | | | | |
|
Ratios to average net assets: | | | | | | |
| | | | | | |
Net investment income (loss) | | | | | | |
| | | | | | |
Net assets, end of period (x 1,000,000) | | | | | | |
| Calculated based on the average shares outstanding during the period. |
| Ratio includes less than 0.005% of non-routine proxy expenses. |
| Effective February 25, 2020, the annual operating expense ratio was reduced to 0.11%. The ratio presented for the period ended August 31, 2020 is a blended ratio. |
| Portfolio turnover rate excludes securities received or delivered from processing of in-kind creations or redemptions. |
Schwab International Equity ETFs | Annual Report67
Schwab Emerging Markets Equity ETF
Portfolio Holdings as of August 31, 2023
This section shows all the securities in the fund’s portfolio and their values as of the report date.
The fund files its complete schedule of portfolio holdings with the U.S. Securities and Exchange Commission (SEC) for the first and third quarters of each fiscal year on Form N-PORT Part F. The fund’s Form N-PORT Part F is available on the SEC’s website at www.sec.gov. You can also obtain this information at no cost on the fund’s website at www.schwabassetmanagement.com/schwabetfs_prospectus, by calling 1-866-414-6349, or by sending an email request to orders@mysummaryprospectus.com. The fund also makes available its complete schedule of portfolio holdings on a daily basis on the fund’s website.
| | |
COMMON STOCKS 97.8% OF NET ASSETS |
|
|
| | |
| | |
| | |
B3 S.A. - Brasil Bolsa Balcao | | |
| | |
| | |
| | |
Banco Santander Brasil S.A. | | |
BB Seguridade Participacoes S.A. | | |
| | |
Caixa Seguridade Participacoes S.A. | | |
| | |
Centrais Eletricas Brasileiras S.A. | | |
Cia de Saneamento Basico do Estado de Sao Paulo SABESP | | |
Cia Energetica de Minas Gerais | | |
Cia Paranaense de Energia | | |
| | |
Companhia Siderurgica Nacional S.A. | | |
| | |
| | |
| | |
| | |
Diagnosticos da America S.A. | | |
| | |
| | |
| | |
Engie Brasil Energia S.A. | | |
| | |
GPS Participacoes e Empreendimentos S.A. | | |
| | |
| | |
Hapvida Participacoes e Investimentos S.A. * | | |
| | |
Intelbras S.A. Industria de Telecomunicacao Eletronica Brasileira | | |
Itau Unibanco Holding S.A. | | |
| | |
| | |
| | |
| | |
| | |
| | |
| | |
Multiplan Empreendimentos Imobiliarios S.A. | | |
Natura & Co. Holding S.A. * | | |
| | |
| | |
| | |
| | |
| | |
| | |
| | |
| | |
| | |
| | |
Sendas Distribuidora S.A. | | |
| | |
Smartfit Escola de Ginastica e Danca S.A. * | | |
| | |
| | |
| | |
| | |
Transmissora Alianca de Energia Eletrica S.A. | | |
Ultrapar Participacoes S.A. | | |
Usinas Siderurgicas de Minas Gerais S.A. Usiminas | | |
| | |
Vamos Locacao de Caminhoes Maquinas e Equipamentos S.A. | | |
| | |
| | |
| | |
|
|
| | |
Banco de Credito e Inversiones S.A. | | |
| | |
| | |
| | |
| | |
| | |
Cia Cervecerias Unidas S.A. | | |
Cia Sud Americana de Vapores S.A. | | |
| | |
| | |
| | |
| | |
| | |
| | |
| | |
| | |
| | |
|
|
360 Security Technology, Inc., A Shares * | | |
37 Interactive Entertainment Network Technology Group Co., Ltd., A Shares | | |
| | |
| | |
Addsino Co., Ltd., A Shares | | |
68Schwab International Equity ETFs | Annual Report
Schwab Emerging Markets Equity ETF
Portfolio Holdings as of August 31, 2023 (continued)
| | |
Advanced Micro-Fabrication Equipment, Inc. China, A Shares * | | |
AECC Aero-Engine Control Co., Ltd., A Shares | | |
AECC Aviation Power Co., Ltd., A Shares | | |
Agile Group Holdings Ltd. *(a) | | |
Agricultural Bank of China Ltd., A Shares | | |
Agricultural Bank of China Ltd., H Shares | | |
Aier Eye Hospital Group Co., Ltd., A Shares | | |
Air China Ltd., A Shares * | | |
Air China Ltd., H Shares * | | |
| | |
Alibaba Group Holding Ltd. * | | |
Alibaba Health Information Technology Ltd. * | | |
Alibaba Pictures Group Ltd. * | | |
A-Living Smart City Services Co., Ltd. * | | |
All Winner Technology Co., Ltd., A Shares | | |
| | |
Aluminum Corp. of China Ltd., A Shares | | |
Aluminum Corp. of China Ltd., H Shares | | |
Amlogic Shanghai Co., Ltd., A Shares * | | |
An Hui Wenergy Co., Ltd., A Shares | | |
Angang Steel Co., Ltd., H Shares | | |
Angel Yeast Co., Ltd., A Shares | | |
Angelalign Technology, Inc. | | |
Anhui Anke Biotechnology Group Co., Ltd., A Shares | | |
Anhui Conch Cement Co., Ltd., A Shares | | |
Anhui Conch Cement Co., Ltd., H Shares | | |
Anhui Expressway Co., Ltd., H Shares | | |
Anhui Gujing Distillery Co., Ltd., A Shares | | |
Anhui Yingjia Distillery Co., Ltd., A Shares | | |
Anhui Zhongding Sealing Parts Co., Ltd., A Shares | | |
Anjoy Foods Group Co., Ltd., A Shares | | |
ANTA Sports Products Ltd. | | |
Apeloa Pharmaceutical Co., Ltd., A Shares | | |
Asymchem Laboratories Tianjin Co., Ltd., A Shares | | |
| | |
Avary Holding Shenzhen Co., Ltd., A Shares | | |
AVIC Industry-Finance Holdings Co., Ltd., A Shares | | |
AviChina Industry & Technology Co., Ltd., H Shares | | |
| | |
BAIC Motor Corp., Ltd., H Shares | | |
| | |
Bank of Beijing Co., Ltd., A Shares | | |
Bank of Changsha Co., Ltd., A Shares | | |
Bank of Chengdu Co., Ltd., A Shares | | |
Bank of China Ltd., A Shares | | |
Bank of China Ltd., H Shares | | |
| | |
Bank of Communications Co., Ltd., A Shares | | |
Bank of Communications Co., Ltd., H Shares | | |
Bank of Guiyang Co., Ltd., A Shares | | |
Bank of Hangzhou Co., Ltd., A Shares | | |
Bank of Jiangsu Co., Ltd., A Shares | | |
Bank of Nanjing Co., Ltd., A Shares | | |
Bank of Ningbo Co., Ltd., A Shares | | |
Bank of Shanghai Co., Ltd., A Shares | | |
Bank of Zhengzhou Co., Ltd., A Shares * | | |
Baoshan Iron & Steel Co., Ltd., A Shares | | |
| | |
| | |
Beijing Capital Eco-Environment Protection Group Co., Ltd., A Shares | | |
Beijing Capital International Airport Co., Ltd., H Shares * | | |
Beijing Dabeinong Technology Group Co., Ltd., A Shares | | |
Beijing Easpring Material Technology Co., Ltd., A Shares | | |
Beijing E-Hualu Information Technology Co., Ltd., A Shares * | | |
Beijing Enlight Media Co., Ltd., A Shares | | |
Beijing Enterprises Holdings Ltd. | | |
Beijing Enterprises Water Group Ltd. | | |
Beijing Jetsen Technology Co., Ltd., A Shares * | | |
Beijing Jingneng Clean Energy Co., Ltd., H Shares | | |
Beijing Kingsoft Office Software, Inc., A Shares | | |
Beijing New Building Materials plc, A Shares | | |
Beijing Orient National Communication Science & Technology Co., Ltd., A Shares * | | |
Beijing Originwater Technology Co., Ltd., A Shares | | |
Beijing Shiji Information Technology Co., Ltd., A Shares * | | |
Beijing Shougang Co., Ltd., A Shares | | |
Beijing Shunxin Agriculture Co., Ltd., A Shares * | | |
Beijing Sinnet Technology Co., Ltd., A Shares * | | |
Beijing Tongrentang Co., Ltd., A Shares | | |
Beijing Ultrapower Software Co., Ltd., A Shares | | |
Beijing United Information Technology Co., Ltd., A Shares | | |
Beijing Wantai Biological Pharmacy Enterprise Co., Ltd., A Shares | | |
Beijing Yanjing Brewery Co., Ltd., A Shares | | |
Beijing Zhong Ke San Huan High-Tech Co., Ltd., A Shares | | |
Bethel Automotive Safety Systems Co., Ltd., A Shares | | |
Bilibili, Inc., Z Shares * | | |
Schwab International Equity ETFs | Annual Report69
Schwab Emerging Markets Equity ETF
Portfolio Holdings as of August 31, 2023 (continued)
| | |
Bloomage Biotechnology Corp., Ltd., A Shares | | |
Blue Moon Group Holdings Ltd. | | |
Bluefocus Intelligent Communications Group Co., Ltd., A Shares * | | |
BOE Technology Group Co., Ltd., A Shares | | |
BOE Technology Group Co., Ltd., B Shares | | |
Bosideng International Holdings Ltd. | | |
Bright Dairy & Food Co., Ltd., A Shares | | |
BTG Hotels Group Co., Ltd., A Shares * | | |
| | |
| | |
BYD Electronic International Co., Ltd. | | |
By-health Co., Ltd., A Shares | | |
C&D International Investment Group Ltd. | | |
C&S Paper Co., Ltd., A Shares | | |
Caitong Securities Co., Ltd., A Shares | | |
Canmax Technologies Co., Ltd., A Shares | | |
CanSino Biologics, Inc., H Shares *(a) | | |
CECEP Solar Energy Co., Ltd., A Shares | | |
CECEP Wind-Power Corp., A Shares | | |
Central China Securities Co., Ltd., A Shares | | |
CGN Power Co., Ltd., H Shares | | |
Changchun High & New Technology Industry Group, Inc., A Shares | | |
Changjiang Securities Co., Ltd., A Shares | | |
Changzhou Xingyu Automotive Lighting Systems Co., Ltd., A Shares | | |
Chaozhou Three-Circle Group Co., Ltd., A Shares | | |
Chengdu Xingrong Environment Co., Ltd., A Shares | | |
Chengxin Lithium Group Co., Ltd., A Shares | | |
China Baoan Group Co., Ltd., A Shares | | |
China Bohai Bank Co., Ltd., Class H * | | |
China Cinda Asset Management Co., Ltd., H Shares | | |
China CITIC Bank Corp., Ltd., A Shares | | |
China CITIC Bank Corp., Ltd., H Shares | | |
China Coal Energy Co., Ltd., A Shares | | |
China Coal Energy Co., Ltd., H Shares | | |
China Communications Services Corp., Ltd., H Shares | | |
China Conch Venture Holdings Ltd. | | |
China Construction Bank Corp., A Shares | | |
China Construction Bank Corp., H Shares | | |
China CSSC Holdings Ltd., A Shares | | |
China East Education Holdings Ltd. | | |
China Eastern Airlines Corp., Ltd., A Shares * | | |
China Eastern Airlines Corp., Ltd., H Shares * | | |
China Energy Engineering Corp., Ltd. | | |
China Energy Engineering Corp., Ltd., H Shares | | |
China Everbright Bank Co., Ltd., A Shares | | |
| | |
China Everbright Bank Co., Ltd., H Shares | | |
China Everbright Environment Group Ltd. | | |
| | |
| | |
China Galaxy Securities Co., Ltd., H Shares | | |
| | |
China Great Wall Securities Co., Ltd., A Shares | | |
China Greatwall Technology Group Co., Ltd., A Shares | | |
China Hongqiao Group Ltd. | | |
China Huarong Asset Management Co., Ltd., H Shares * | | |
China International Capital Corp., Ltd., A Shares | | |
China International Capital Corp., Ltd., H Shares | | |
China International Marine Containers Group Co., Ltd., H Shares | | |
China Jinmao Holdings Group Ltd. | | |
China Jushi Co., Ltd., A Shares | | |
China Lesso Group Holdings Ltd. | | |
China Life Insurance Co., Ltd., H Shares | | |
| | |
China Longyuan Power Group Corp., Ltd., H Shares | | |
China Medical System Holdings Ltd. | | |
China Meheco Co., Ltd., A Shares | | |
China Meidong Auto Holdings Ltd. | | |
China Mengniu Dairy Co., Ltd. | | |
China Merchants Bank Co., Ltd., A Shares | | |
China Merchants Bank Co., Ltd., H Shares | | |
China Merchants Energy Shipping Co., Ltd., A Shares | | |
China Merchants Expressway Network & Technology Holdings Co. Ltd, A Shares | | |
China Merchants Port Holdings Co., Ltd. | | |
China Merchants Securities Co., Ltd., A Shares | | |
China Merchants Securities Co., Ltd., H Shares | | |
China Merchants Shekou Industrial Zone Holdings Co., Ltd., A Shares | | |
China Minmetals Rare Earth Co., Ltd., A Shares | | |
China Minsheng Banking Corp., Ltd., A Shares | | |
China Minsheng Banking Corp., Ltd., H Shares | | |
China National Accord Medicines Corp., Ltd., B Shares | | |
China National Building Material Co., Ltd., H Shares | | |
China National Chemical Engineering Co., Ltd., A Shares | | |
China National Nuclear Power Co., Ltd., A Shares | | |
70Schwab International Equity ETFs | Annual Report
Schwab Emerging Markets Equity ETF
Portfolio Holdings as of August 31, 2023 (continued)
| | |
China National Software & Service Co., Ltd., A Shares | | |
China Northern Rare Earth Group High-Tech Co., Ltd., A Shares | | |
China Oilfield Services Ltd., A Shares | | |
China Oilfield Services Ltd., H Shares | | |
China Overseas Land & Investment Ltd. | | |
China Pacific Insurance Group Co., Ltd., A Shares | | |
China Pacific Insurance Group Co., Ltd., H Shares | | |
China Petroleum & Chemical Corp., A Shares | | |
China Petroleum & Chemical Corp., H Shares | | |
China Power International Development Ltd. | | |
China Railway Group Ltd., A Shares | | |
China Railway Group Ltd., H Shares | | |
China Railway Signal & Communication Corp., Ltd., A Shares | | |
China Railway Signal & Communication Corp., Ltd., H Shares | | |
China Reinsurance Group Corp., H Shares | | |
China Resources Beer Holdings Co., Ltd. | | |
China Resources Boya Bio-pharmaceutical Group Co., Ltd., A Shares | | |
China Resources Cement Holdings Ltd. | | |
China Resources Double Crane Pharmaceutical Co., Ltd., A Shares | | |
China Resources Gas Group Ltd. | | |
China Resources Land Ltd. | | |
China Resources Microelectronics Ltd., A Shares | | |
China Resources Mixc Lifestyle Services Ltd. | | |
China Resources Pharmaceutical Group Ltd. | | |
China Resources Power Holdings Co., Ltd. | | |
China Resources Sanjiu Medical & Pharmaceutical Co., Ltd., A Shares | | |
China Ruyi Holdings Ltd. *(a) | | |
China Shenhua Energy Co., Ltd., A Shares | | |
China Shenhua Energy Co., Ltd., H Shares | | |
China South Publishing & Media Group Co., Ltd., A Shares | | |
China Southern Airlines Co., Ltd., A Shares * | | |
China Southern Airlines Co., Ltd., H Shares * | | |
China Southern Power Grid Energy Efficiency&Clean Energy Co., Ltd., A Shares | | |
China State Construction Engineering Corp., Ltd., A Shares | | |
China State Construction International Holdings Ltd. | | |
| | |
China Suntien Green Energy Corp., Ltd., H Shares | | |
China Taiping Insurance Holdings Co., Ltd. | | |
China Three Gorges Renewables Group Co., Ltd., A Shares | | |
China Tourism Group Duty Free Corp., Ltd., A Shares | | |
China Tourism Group Duty Free Corp., Ltd., Class H | | |
China Tower Corp., Ltd., H Shares | | |
China Traditional Chinese Medicine Holdings Co., Ltd. | | |
China TransInfo Technology Co., Ltd., A Shares * | | |
China United Network Communications Ltd., A Shares | | |
China Vanke Co., Ltd., A Shares | | |
China Vanke Co., Ltd., H Shares | | |
China World Trade Center Co., Ltd., A Shares | | |
China Yangtze Power Co., Ltd., A Shares | | |
China Zhenhua Group Science & Technology Co., Ltd., A Shares | | |
China Zheshang Bank Co., Ltd., A Shares | | |
Chinese Universe Publishing and Media Group Co., Ltd., A Shares | | |
Chongqing Brewery Co., Ltd., A Shares | | |
Chongqing Changan Automobile Co., Ltd., A Shares | | |
Chongqing Changan Automobile Co., Ltd., B Shares | | |
Chongqing Fuling Zhacai Group Co., Ltd., A Shares | | |
Chongqing Rural Commercial Bank Co., Ltd., H Shares | | |
Chongqing Zhifei Biological Products Co., Ltd., A Shares | | |
CIFI Holdings Group Co., Ltd. *(b) | | |
| | |
Citic Pacific Special Steel Group Co., Ltd., A Shares | | |
CITIC Securities Co., Ltd., A Shares | | |
CITIC Securities Co., Ltd., H Shares | | |
CMOC Group Ltd., A Shares | | |
CMOC Group Ltd., H Shares | | |
CNGR Advanced Material Co., Ltd., A Shares | | |
CNOOC Energy Technology & Services Ltd., A Shares | | |
CNPC Capital Co., Ltd., A Shares | | |
Contemporary Amperex Technology Co., Ltd., A Shares | | |
COSCO Shipping Development Co., Ltd., A Shares | | |
COSCO Shipping Development Co., Ltd., H Shares | | |
COSCO Shipping Energy Transportation Co., Ltd., H Shares | | |
COSCO SHIPPING Energy Transportation Co., Ltd., A Shares | | |
COSCO Shipping Holdings Co., Ltd., A Shares | | |
Schwab International Equity ETFs | Annual Report71
Schwab Emerging Markets Equity ETF
Portfolio Holdings as of August 31, 2023 (continued)
| | |
COSCO SHIPPING Holdings Co., Ltd., H Shares | | |
COSCO Shipping Ports Ltd. | | |
Country Garden Holdings Co., Ltd. *(a) | | |
Country Garden Services Holdings Co., Ltd. (a) | | |
CRRC Corp., Ltd., A Shares | | |
CRRC Corp., Ltd., H Shares | | |
CSC Financial Co., Ltd., A Shares | | |
CSC Financial Co., Ltd., H Shares | | |
CSG Holding Co., Ltd., A Shares | | |
CSG Holding Co., Ltd., B Shares | | |
CSPC Pharmaceutical Group Ltd. | | |
Daan Gene Co., Ltd., A Shares | | |
| | |
Daqin Railway Co., Ltd., A Shares | | |
Daqo New Energy Corp., ADR * | | |
Datang International Power Generation Co., Ltd., H Shares | | |
DHC Software Co., Ltd., A Shares | | |
Dian Diagnostics Group Co., Ltd., A Shares | | |
Do-Fluoride New Materials Co., Ltd., A Shares | | |
Dong-E-E-Jiao Co., Ltd., A Shares | | |
Dongfang Electric Corp., Ltd., A Shares | | |
Dongfang Electric Corp., Ltd., H Shares | | |
Dongfeng Motor Group Co., Ltd., H Shares | | |
Dongguan Yiheda Automation Co., Ltd., Class A | | |
Dongxing Securities Co., Ltd., A Shares | | |
East Buy Holding Ltd. *(a) | | |
East Group Co., Ltd., A Shares | | |
East Money Information Co., Ltd., A Shares | | |
Eastern Air Logistics Co., Ltd., A Shares | | |
Eastroc Beverage Group Co., Ltd., A Shares | | |
Ecovacs Robotics Co., Ltd., A Shares | | |
ENN Ecological Holdings Co., Ltd., A Shares | | |
| | |
Eve Energy Co., Ltd., A Shares | | |
Everbright Securities Co., Ltd., A Shares | | |
Fangda Carbon New Material Co., Ltd., A Shares * | | |
| | |
FAW Jiefang Group Co., Ltd., A Shares * | | |
Fiberhome Telecommunication Technologies Co., Ltd., A Shares | | |
Financial Street Holdings Co., Ltd., A Shares | | |
First Capital Securities Co., Ltd., A Shares | | |
Flat Glass Group Co., Ltd., A Shares | | |
Flat Glass Group Co., Ltd., H Shares | | |
Focus Media Information Technology Co., Ltd., A Shares | | |
Foshan Haitian Flavouring & Food Co., Ltd., A Shares | | |
| | |
| | |
Foxconn Industrial Internet Co., Ltd., A Shares | | |
Fujian Funeng Co., Ltd., A Shares | | |
Fujian Sunner Development Co., Ltd., A Shares | | |
Full Truck Alliance Co., Ltd., ADR * | | |
Fuyao Glass Industry Group Co., Ltd., A Shares | | |
Fuyao Glass Industry Group Co., Ltd., H Shares | | |
Ganfeng Lithium Co., Ltd., A Shares | | |
Ganfeng Lithium Co., Ltd., H Shares | | |
G-bits Network Technology Xiamen Co., Ltd., A Shares | | |
GCL System Integration Technology Co., Ltd., A Shares * | | |
GCL-Poly Energy Holdings Ltd | | |
GD Power Development Co., Ltd., A Shares | | |
GDS Holdings Ltd., A shares * | | |
Geely Automobile Holdings Ltd. | | |
| | |
| | |
Genscript Biotech Corp. * | | |
GF Securities Co., Ltd., A Shares | | |
GF Securities Co., Ltd., H Shares | | |
Gigadevice Semiconductor Beijing, Inc., A Shares | | |
Ginlong Technologies Co., Ltd., A Shares | | |
Glarun Technology Co., Ltd., A Shares | | |
| | |
Goke Microelectronics Co., Ltd., A Shares | | |
Goldwind Science & Technology Co., Ltd., A Shares | | |
Goldwind Science & Technology Co., Ltd., H Shares | | |
GoodWe Technologies Co., Ltd., A Shares | | |
Gotion High-tech Co., Ltd., A Shares * | | |
Grandjoy Holdings Group Co., Ltd., A Shares * | | |
Great Wall Motor Co., Ltd., A Shares | | |
Great Wall Motor Co., Ltd., H Shares | | |
Gree Electric Appliances, Inc. of Zhuhai, Class A | | |
Greentown China Holdings Ltd. | | |
GRG Banking Equipment Co., Ltd., A Shares | | |
Guangdong Baolihua New Energy Stock Co., Ltd., A Shares | | |
Guangdong Electric Power Development Co., Ltd., B Shares * | | |
Guangdong Haid Group Co., Ltd., A Shares | | |
Guangdong HEC Technology Holding Co., Ltd., A Shares | | |
Guangdong Investment Ltd. | | |
Guangdong Kinlong Hardware Products Co., Ltd., A Shares | | |
Guangdong Xinbao Electrical Appliances Holdings Co., Ltd., A Shares | | |
Guanghui Energy Co., Ltd., A Shares | | |
72Schwab International Equity ETFs | Annual Report
Schwab Emerging Markets Equity ETF
Portfolio Holdings as of August 31, 2023 (continued)
| | |
Guangshen Railway Co., Ltd., H Shares * | | |
Guangxi Guiguan Electric Power Co., Ltd., A Shares | | |
Guangxi Liugong Machinery Co., Ltd., A Shares | | |
Guangzhou Automobile Group Co., Ltd., A Shares | | |
Guangzhou Automobile Group Co., Ltd., H Shares | | |
Guangzhou Baiyunshan Pharmaceutical Holdings Co., Ltd., A Shares | | |
Guangzhou Baiyunshan Pharmaceutical Holdings Co., Ltd., H Shares | | |
Guangzhou Great Power Energy & Technology Co., Ltd., Class A * | | |
Guangzhou Haige Communications Group, Inc. Co., A Shares | | |
Guangzhou Kingmed Diagnostics Group Co., Ltd., A Shares | | |
Guangzhou Shiyuan Electronic Technology Co., Ltd., A Shares | | |
Guangzhou Tinci Materials Technology Co., Ltd., A Shares | | |
Guangzhou Yuexiu Financial Holdings Group Co., Ltd., A Shares | | |
Guangzhou Zhujiang Brewery Co., Ltd., A Shares | | |
Guizhou Panjiang Refined Coal Co., Ltd., A Shares | | |
Guolian Securities Co., Ltd., A Shares * | | |
Guosen Securities Co., Ltd., A Shares | | |
Guosheng Financial Holding, Inc., A Shares * | | |
Guotai Junan Securities Co., Ltd., A Shares | | |
Guotai Junan Securities Co., Ltd., H Shares | | |
Guoyuan Securities Co., Ltd., A Shares | | |
H World Group Ltd., ADR * | | |
Haidilao International Holding Ltd. | | |
Haier Smart Home Co., Ltd., A Shares | | |
Haier Smart Home Co., Ltd., H Shares | | |
Haisco Pharmaceutical Group Co., Ltd., A Shares * | | |
Haitian International Holdings Ltd. | | |
Haitong Securities Co., Ltd., A Shares | | |
Haitong Securities Co., Ltd., H Shares | | |
Hang Zhou Great Star Industrial Co., Ltd., A Shares | | |
Hangzhou Binjiang Real Estate Group Co., Ltd., A Shares | | |
Hangzhou Chang Chuan Technology Co., Ltd., A Shares | | |
Hangzhou First Applied Material Co., Ltd., A Shares | | |
Hangzhou Lion Electronics Co., Ltd., A Shares | | |
Hangzhou Oxygen Plant Group Co., Ltd., A Shares | | |
Hangzhou Robam Appliances Co., Ltd., A Shares | | |
Hangzhou Silan Microelectronics Co., Ltd., A Shares | | |
| | |
Hangzhou Tigermed Consulting Co., Ltd., A Shares | | |
Hangzhou Tigermed Consulting Co., Ltd., H Shares (a) | | |
Han's Laser Technology Industry Group Co., Ltd., A Shares | | |
Hansoh Pharmaceutical Group Co., Ltd. | | |
Haohua Chemical Science & Technology Co., Ltd., A Shares | | |
Harbin Boshi Automation Co., Ltd., A Shares | | |
Hefei Meiya Optoelectronic Technology, Inc., A Shares | | |
Heilongjiang Agriculture Co., Ltd., A Shares | | |
Henan Shenhuo Coal & Power Co., Ltd., Class A | | |
Henan Shuanghui Investment & Development Co., Ltd., A Shares | | |
Hengan International Group Co., Ltd. | | |
Hengdian Group DMEGC Magnetics Co., Ltd., A Shares | | |
Hengli Petrochemical Co., Ltd., A Shares * | | |
Hengtong Optic-electric Co. Ltd, A Shares | | |
Hengyi Petrochemical Co., Ltd.., A Shares * | | |
Hesteel Co., Ltd., A Shares | | |
Hithink RoyalFlush Information Network Co., Ltd., A Shares | | |
Hongfa Technology Co., Ltd., A Shares | | |
Hopson Development Holdings Ltd. * | | |
Hoshine Silicon Industry Co., Ltd., A Shares | | |
Hoyuan Green Energy Co., Ltd., A Shares | | |
Hua Hong Semiconductor Ltd. * | | |
Huadian Power International Corp., Ltd., A Shares | | |
Huadian Power International Corp., Ltd., H Shares | | |
Huadong Medicine Co., Ltd., A Shares | | |
Huafon Chemical Co., Ltd., A Shares | | |
Huagong Tech Co., Ltd., A Shares | | |
Huaibei Mining Holdings Co., Ltd., A Shares | | |
Hualan Biological Engineering, Inc., A Shares | | |
Huaneng Lancang River Hydropower, Inc., A Shares | | |
Huaneng Power International, Inc., A Shares * | | |
Huaneng Power International, Inc., H Shares * | | |
Huatai Securities Co., Ltd., A Shares | | |
Huatai Securities Co., Ltd., H Shares | | |
Huaxi Securities Co., Ltd., A Shares | | |
Huaxia Bank Co., Ltd., A Shares | | |
Huaxin Cement Co., Ltd., A Shares | | |
Huaxin Cement Co., Ltd., H Shares | | |
Huayu Automotive Systems Co., Ltd., A Shares | | |
Hubei Energy Group Co., Ltd., A Shares | | |
Schwab International Equity ETFs | Annual Report73
Schwab Emerging Markets Equity ETF
Portfolio Holdings as of August 31, 2023 (continued)
| | |
Hubei Xingfa Chemicals Group Co., Ltd., A Shares | | |
Huizhou Desay Sv Automotive Co., Ltd., A Shares | | |
Humanwell Healthcare Group Co., Ltd., A Shares | | |
Hunan Changyuan Lico Co., Ltd., Class A | | |
Hunan Gold Corp., Ltd., A Shares | | |
Hunan Valin Steel Co., Ltd., A Shares | | |
Hundsun Technologies, Inc., A Shares | | |
Hygeia Healthcare Holdings Co., Ltd., Class C | | |
Iflytek Co., Ltd., A Shares | | |
Imeik Technology Development Co., Ltd., A Shares | | |
Industrial & Commercial Bank of China Ltd., A Shares | | |
Industrial & Commercial Bank of China Ltd., H Shares | | |
Industrial Bank Co., Ltd., A Shares | | |
Industrial Securities Co., Ltd., A Shares | | |
Ingenic Semiconductor Co., Ltd., A Shares | | |
Inner Mongolia BaoTou Steel Union Co., Ltd., A Shares * | | |
Inner Mongolia Dian Tou Energy Corp., Ltd., A Shares | | |
Inner Mongolia ERDOS Resources Co., Ltd., B Shares | | |
Inner Mongolia Junzheng Energy & Chemical Industry Group Co., Ltd., A Shares | | |
Inner Mongolia Yili Industrial Group Co., Ltd., A Shares | | |
Inner Mongolia Yuan Xing Energy Co., Ltd., A Shares | | |
Innovent Biologics, Inc. * | | |
Inspur Electronic Information Industry Co., Ltd., A Shares | | |
Intco Medical Technology Co., Ltd., A Shares | | |
| | |
iRay Technology Co., Ltd., A Shares | | |
JA Solar Technology Co., Ltd., A Shares | | |
Jafron Biomedical Co., Ltd., A Shares | | |
Jason Furniture Hangzhou Co., Ltd., A Shares | | |
JCET Group Co., Ltd., A Shares | | |
JD Health International, Inc. * | | |
| | |
| | |
Jiangsu Eastern Shenghong Co., Ltd., A Shares | | |
Jiangsu Expressway Co., Ltd., A Shares | | |
Jiangsu Expressway Co., Ltd., H Shares | | |
Jiangsu Hengli Hydraulic Co., Ltd., A Shares | | |
Jiangsu Hengrui Medicine Co., Ltd., A Shares | | |
Jiangsu King's Luck Brewery JSC Ltd., A Shares | | |
| | |
Jiangsu Linyang Energy Co., Ltd., A Shares | | |
Jiangsu Pacific Quartz Co., Ltd., Class A | | |
Jiangsu Phoenix Publishing & Media Corp., Ltd., Class A | | |
Jiangsu Yanghe Brewery Joint-Stock Co., Ltd., A Shares | | |
Jiangsu Yangnong Chemical Co., Ltd., A Shares | | |
Jiangsu Yoke Technology Co., Ltd., A Shares | | |
Jiangsu Yuyue Medical Equipment & Supply Co., Ltd., A Shares | | |
Jiangsu Zhongtian Technology Co., Ltd., A Shares | | |
Jiangxi Copper Co., Ltd., A Shares | | |
Jiangxi Copper Co., Ltd., H Shares | | |
Jiangxi Special Electric Motor Co., Ltd., A Shares * | | |
Jilin Aodong Pharmaceutical Group Co., Ltd., A Shares | | |
Jinke Smart Services Group Co., Ltd., H Shares * | | |
Jinxin Fertility Group Ltd. * | | |
JiuGui Liquor Co., Ltd., A Shares | | |
Jiumaojiu International Holdings Ltd. | | |
Jizhong Energy Resources Co., Ltd., A Shares | | |
Joincare Pharmaceutical Group Industry Co., Ltd., A Shares | | |
Joinn Laboratories China Co., Ltd., A Shares | | |
Joinn Laboratories China Co., Ltd., H Shares (a) | | |
Jointown Pharmaceutical Group Co., Ltd., A Shares | | |
Jonjee Hi-Tech Industrial & Commercial Holding Co., Ltd., A Shares * | | |
| | |
Juneyao Airlines Co., Ltd., A Shares * | | |
| | |
| | |
Keda Industrial Group Co., Ltd. | | |
| | |
Kingboard Laminates Holdings Ltd. | | |
Kingdee International Software Group Co., Ltd. * | | |
Kingsoft Cloud Holdings Ltd., ADR *(a) | | |
| | |
| | |
Kuang-Chi Technologies Co., Ltd., A Shares | | |
| | |
Kunlun Tech Co., Ltd., A Shares * | | |
Kweichow Moutai Co., Ltd., A Shares | | |
Lao Feng Xiang Co., Ltd., A Shares | | |
Laobaixing Pharmacy Chain JSC, A Shares | | |
LB Group Co., Ltd., A Shares | | |
Lee & Man Paper Manufacturing Ltd. | | |
Legend Holdings Corp., H Shares | | |
Lens Technology Co., Ltd., A Shares | | |
Leo Group Co., Ltd, A shares * | | |
Lepu Medical Technology Beijing Co., Ltd., A Shares | | |
74Schwab International Equity ETFs | Annual Report
Schwab Emerging Markets Equity ETF
Portfolio Holdings as of August 31, 2023 (continued)
| | |
Levima Advanced Materials Corp., A Shares | | |
Leyard Optoelectronic Co., Ltd., A Shares | | |
| | |
| | |
Liaoning Port Co., Ltd., A Shares | | |
Lingyi iTech Guangdong Co., A Shares | | |
Livzon Pharmaceutical Group, Inc., A Shares | | |
Livzon Pharmaceutical Group, Inc., H Shares | | |
Longfor Group Holdings Ltd. | | |
LONGi Green Energy Technology Co., Ltd., A Shares | | |
Longshine Technology Group Co., Ltd., A Shares | | |
| | |
Luxi Chemical Group Co., Ltd., A Shares | | |
Luxshare Precision Industry Co., Ltd., A Shares | | |
| | |
Luzhou Laojiao Co., Ltd., A Shares | | |
Maanshan Iron & Steel Co., Ltd., A Shares | | |
Mango Excellent Media Co., Ltd., A Shares | | |
Maxscend Microelectronics Co., Ltd., A Shares | | |
Meihua Holdings Group Co., Ltd., Class A | | |
Meinian Onehealth Healthcare Holdings Co., Ltd., A Shares * | | |
| | |
Metallurgical Corp. of China Ltd., A Shares | | |
Metallurgical Corp. of China Ltd., H Shares | | |
Microport Scientific Corp. * | | |
Ming Yang Smart Energy Group Ltd., A Shares | | |
Ming Yuan Cloud Group Holdings Ltd. * | | |
MINISO Group Holding Ltd., ADR * | | |
| | |
Montage Technology Co., Ltd., A Shares | | |
Muyuan Foods Co., Ltd., A Shares | | |
Nanjing Iron & Steel Co., Ltd., A Shares | | |
NARI Technology Co., Ltd., A Shares | | |
NAURA Technology Group Co., Ltd., A Shares | | |
NavInfo Co., Ltd., A Shares * | | |
| | |
New China Life Insurance Co., Ltd., A Shares | | |
New China Life Insurance Co., Ltd., H Shares | | |
New Hope Liuhe Co., Ltd., A Shares * | | |
New Oriental Education & Technology Group, Inc. * | | |
Newland Digital Technology Co., Ltd., A Shares * | | |
Nine Dragons Paper Holdings Ltd. * | | |
| | |
| | |
Ningbo Deye Technology Co., Ltd., A Shares | | |
Ningbo Joyson Electronic Corp., A Shares | | |
Ningbo Orient Wires & Cables Co., Ltd., A Shares | | |
Ningbo Ronbay New Energy Technology Co., Ltd., A Shares | | |
Ningbo Sanxing Medical Electric Co., Ltd., A Shares | | |
Ningbo Shanshan Co., Ltd., A Shares | | |
Ningbo Tuopu Group Co., Ltd., A Shares | | |
Ningbo Zhoushan Port Co., Ltd., A Shares | | |
Ningxia Baofeng Energy Group Co., Ltd., A Shares | | |
| | |
Nongfu Spring Co., Ltd., H Shares | | |
North Industries Group Red Arrow Co., Ltd., A Shares | | |
Northeast Securities Co., Ltd., A Shares | | |
Offshore Oil Engineering Co., Ltd., A Shares | | |
OFILM Group Co., Ltd., A Shares * | | |
Oppein Home Group, Inc., A Shares | | |
ORG Technology Co., Ltd., A Shares | | |
Orient Securities Co., Ltd., A Shares | | |
Orient Securities Co., Ltd., H Shares | | |
Oriental Energy Co., Ltd., A Shares * | | |
Ourpalm Co., Ltd., A shares * | | |
Ovctek China, Inc., A Shares | | |
Pangang Group Vanadium Titanium & Resources Co., Ltd., A Shares * | | |
People.cn Co., Ltd., A Shares | | |
Perfect World Co., Ltd., A Shares | | |
PetroChina Co., Ltd., A Shares | | |
PetroChina Co., Ltd., H Shares | | |
Pharmaron Beijing Co., Ltd., A Shares | | |
Pharmaron Beijing Co., Ltd., H Shares (a) | | |
PICC Property & Casualty Co., Ltd., H Shares | | |
| | |
Ping An Bank Co., Ltd., A Shares | | |
Ping An Healthcare & Technology Co., Ltd. *(a) | | |
Ping An Insurance Group Co. of China Ltd., A Shares | | |
Ping An Insurance Group Co. of China Ltd., H Shares | | |
Pingdingshan Tianan Coal Mining Co., Ltd., A Shares | | |
Poly Developments and Holdings Group Co., Ltd., A Shares | | |
Poly Property Services Co., Ltd., H Shares | | |
Pop Mart International Group Ltd. (a) | | |
Porton Pharma Solutions Ltd., A Shares | | |
Postal Savings Bank of China Co., Ltd., A Shares | | |
Postal Savings Bank of China Co., Ltd., H Shares | | |
Schwab International Equity ETFs | Annual Report75
Schwab Emerging Markets Equity ETF
Portfolio Holdings as of August 31, 2023 (continued)
| | |
Power Construction Corp. of China Ltd., A Shares | | |
Pylon Technologies Co., Ltd., A Shares | | |
Qifu Technology, Inc., ADR | | |
Qingdao TGOOD Electric Co., Ltd., A Shares | | |
Qinghai Salt Lake Industry Co., Ltd., A Shares * | | |
Raytron Technology Co., Ltd., A Shares | | |
Red Star Macalline Group Corp., Ltd., H Shares | | |
Remegen Co., Ltd., H Shares * | | |
RLX Technology, Inc., ADR * | | |
Rongsheng Petrochemical Co., Ltd., A Shares | | |
SAIC Motor Corp., Ltd., A Shares | | |
Sailun Group Co., Ltd., A Shares | | |
Sangfor Technologies, Inc., A Shares * | | |
Sany Heavy Industry Co., Ltd., A Shares | | |
Satellite Chemical Co., Ltd., A Shares | | |
SDIC Capital Co., Ltd., A Shares | | |
Sealand Securities Co., Ltd., A Shares | | |
| | |
Seazen Holdings Co., Ltd., A Shares * | | |
SenseTime Group, Inc., Class B *(a) | | |
SF Holding Co., Ltd., A Shares | | |
| | |
Shaanxi Coal Industry Co., Ltd., A Shares | | |
Shaanxi International Trust Co., Ltd., A Shares | | |
Shandong Chenming Paper Holdings Ltd., H Shares * | | |
Shandong Gold Mining Co., Ltd., A Shares | | |
Shandong Gold Mining Co., Ltd., H Shares | | |
Shandong Himile Mechanical Science & Technology Co., Ltd., A Shares | | |
Shandong Hi-speed Co., Ltd., A Shares | | |
Shandong Hualu Hengsheng Chemical Co., Ltd., A Shares | | |
Shandong Linglong Tyre Co., Ltd., A Shares | | |
Shandong Nanshan Aluminum Co., Ltd., A Shares | | |
Shandong Pharmaceutical Glass Co., Ltd., A Shares | | |
Shandong Sun Paper Industry JSC Ltd., A Shares | | |
Shandong Weigao Group Medical Polymer Co., Ltd., H Shares | | |
Shanghai Aiko Solar Energy Co., Ltd., Class A | | |
Shanghai Bairun Investment Holding Group Co., Ltd., A Shares | | |
Shanghai Baosight Software Co., Ltd., A Shares | | |
Shanghai Construction Group Co., Ltd., A Shares | | |
Shanghai Electric Group Co., Ltd., A Shares * | | |
| | |
Shanghai Electric Group Co., Ltd., H Shares * | | |
Shanghai Electric Power Co., Ltd., A Shares | | |
Shanghai Fosun Pharmaceutical Group Co., Ltd., A Shares | | |
Shanghai Fosun Pharmaceutical Group Co., Ltd., H Shares | | |
Shanghai Friendess Electronic Technology Corp., Ltd., A Shares | | |
Shanghai Fudan Microelectronics Group Co., Ltd., A Shares | | |
Shanghai Fudan Microelectronics Group Co., Ltd., H Shares (a) | | |
Shanghai Industrial Holdings Ltd. | | |
Shanghai International Airport Co., Ltd., A Shares * | | |
Shanghai International Port Group Co., Ltd., A Shares | | |
Shanghai Jinjiang International Hotels Co. Ltd, A Shares | | |
Shanghai Jinjiang International Hotels Co., Ltd., B Shares | | |
Shanghai Jinqiao Export Processing Zone Development Co., Ltd., A Shares | | |
Shanghai Junshi Biosciences Co., Ltd., A Shares * | | |
Shanghai Junshi Biosciences Co., Ltd., H Shares *(a) | | |
Shanghai Lingang Holdings Corp., Ltd., A Shares | | |
Shanghai Lujiazui Finance & Trade Zone Development Co., Ltd., A Shares | | |
Shanghai Lujiazui Finance & Trade Zone Development Co., Ltd., B Shares | | |
Shanghai M&G Stationery, Inc., A Shares | | |
Shanghai Mechanical and Electrical Industry Co., Ltd., B shares | | |
Shanghai Pharmaceuticals Holding Co., Ltd., A Shares | | |
Shanghai Pharmaceuticals Holding Co., Ltd., H Shares | | |
Shanghai Pudong Development Bank Co., Ltd., A Shares | | |
Shanghai Putailai New Energy Technology Co., Ltd., A Shares | | |
Shanghai RAAS Blood Products Co., Ltd., A Shares | | |
Shanghai Rural Commercial Bank Co., Ltd., A Shares | | |
Shanghai Tunnel Engineering Co., Ltd., A Shares | | |
Shanghai Waigaoqiao Free Trade Zone Group Co., Ltd., A Shares | | |
Shanghai Yuyuan Tourist Mart Group Co., Ltd., A Shares | | |
Shanghai Zhangjiang High-Tech Park Development Co., Ltd., A Shares | | |
Shanghai Zhenhua Heavy Industries Co., Ltd., B Shares * | | |
Shanxi Lu'an Environmental Energy Development Co., Ltd., A Shares | | |
76Schwab International Equity ETFs | Annual Report
Schwab Emerging Markets Equity ETF
Portfolio Holdings as of August 31, 2023 (continued)
| | |
Shanxi Meijin Energy Co., Ltd., A Shares * | | |
Shanxi Securities Co., Ltd., A Shares | | |
Shanxi Taigang Stainless Steel Co., Ltd., A Shares | | |
Shanxi Xinghuacun Fen Wine Factory Co., Ltd., A Shares | | |
Shanxi Xishan Coal & Electricity Power Co., Ltd., A Shares | | |
Shenghe Resources Holding Co., Ltd., A Shares | | |
Shengyi Technology Co., Ltd., A Shares | | |
Shennan Circuits Co., Ltd., A Shares | | |
Shenwan Hongyuan Group Co., Ltd., A Shares | | |
Shenwan Hongyuan Group Co., Ltd., H Shares | | |
Shenzhen Airport Co., Ltd., A Shares * | | |
Shenzhen Capchem Technology Co., Ltd., A Shares | | |
Shenzhen Dynanonic Co., Ltd., A Shares | | |
Shenzhen Energy Group Co., Ltd., A Shares | | |
Shenzhen Expressway Corp., Ltd., H Shares | | |
Shenzhen Hepalink Pharmaceutical Group Co., Ltd., H Shares | | |
Shenzhen Inovance Technology Co., Ltd., A Shares | | |
Shenzhen International Holdings Ltd. | | |
| | |
Shenzhen Kaifa Technology Co., Ltd., A Shares | | |
Shenzhen Kangtai Biological Products Co., Ltd., A Shares * | | |
Shenzhen Kedali Industry Co., Ltd., A Shares | | |
Shenzhen Kingdom Sci-Tech Co., Ltd., A Shares | | |
Shenzhen Kstar Science And Technology Co., Ltd., Class A | | |
Shenzhen Mindray Bio-Medical Electronics Co., Ltd., A Shares | | |
Shenzhen MTC Co., Ltd., A Shares | | |
Shenzhen New Industries Biomedical Engineering Co., Ltd., A Shares | | |
Shenzhen Overseas Chinese Town Co., Ltd., A Shares * | | |
Shenzhen Salubris Pharmaceuticals Co., Ltd., A Shares | | |
Shenzhen SC New Energy Technology Corp., A Shares | | |
Shenzhen Senior Technology Material Co., Ltd., A Shares | | |
Shenzhen Sunway Communication Co., Ltd., A Shares | | |
Shenzhen Transsion Holdings Co., Ltd., A Shares | | |
Shenzhen YUTO Packaging Technology Co., Ltd., A Shares | | |
Shenzhen Zhongjin Lingnan Nonfemet Co., Ltd., A Shares | | |
Shenzhou International Group Holdings Ltd. | | |
| | |
Shijiazhuang Changshan BeiMing Technology Co., Ltd., A Shares * | | |
Shijiazhuang Yiling Pharmaceutical Co., Ltd., A Shares | | |
Shimao Services Holdings Ltd. * | | |
Shougang Fushan Resources Group Ltd. | | |
| | |
Siasun Robot & Automation Co., Ltd., A Shares * | | |
Sichuan Chuantou Energy Co., Ltd., A Shares | | |
Sichuan Hebang Biotechnology Co., Ltd., A Shares | | |
Sichuan Kelun Pharmaceutical Co., Ltd., A Shares | | |
Sichuan New Energy Power Co., Ltd. * | | |
Sichuan Road & Bridge Co., Ltd., A Shares | | |
Sichuan Swellfun Co., Ltd., A Shares | | |
Sichuan Yahua Industrial Group Co., Ltd., A Shares | | |
Sieyuan Electric Co., Ltd., A Shares | | |
Sino Biopharmaceutical Ltd. | | |
Sinoma International Engineering Co., A Shares | | |
Sinoma Science & Technology Co., Ltd., A Shares | | |
Sinomine Resource Group Co., Ltd., A Shares | | |
Sino-Ocean Group Holding Ltd. * | | |
Sinopec Engineering Group Co., Ltd., H Shares | | |
Sinopec Oilfield Service Corp., H Shares * | | |
Sinopec Shanghai Petrochemical Co., Ltd., A Shares * | | |
Sinopec Shanghai Petrochemical Co., Ltd., H Shares * | | |
Sinopharm Group Co., Ltd., H Shares | | |
| | |
| | |
Skshu Paint Co., Ltd., A Shares * | | |
Smoore International Holdings Ltd. | | |
Songcheng Performance Development Co., Ltd., A Shares | | |
SooChow Securities Co., Ltd., A Shares | | |
Southwest Securities Co., Ltd., A Shares | | |
StarPower Semiconductor Ltd., A Shares | | |
STO Express Co. Ltd, A Shares * | | |
Sun Art Retail Group Ltd. | | |
Sunac Services Holdings Ltd. | | |
Sungrow Power Supply Co., Ltd., A Shares | | |
Sunny Optical Technology Group Co., Ltd. | | |
Sunwoda Electronic Co., Ltd., A Shares | | |
Suzhou Dongshan Precision Manufacturing Co., Ltd., A Shares | | |
Suzhou Maxwell Technologies Co., Ltd., A Shares | | |
Schwab International Equity ETFs | Annual Report77
Schwab Emerging Markets Equity ETF
Portfolio Holdings as of August 31, 2023 (continued)
| | |
Suzhou Nanomicro Technology Co., Ltd., Class A | | |
Taiji Computer Corp., Ltd., A Shares | | |
TAL Education Group, ADR * | | |
Tangshan Jidong Cement Co., Ltd., A Shares | | |
TangShan Port Group Co., Ltd., A Shares | | |
| | |
TCL Technology Group Corp., A Shares * | | |
| | |
Tencent Music Entertainment Group, ADR * | | |
The People's Insurance Co. Group of China Ltd., A Shares | | |
The People's Insurance Co. Group of China Ltd., H Shares | | |
Thunder Software Technology Co., Ltd., A Shares | | |
Tian Di Science & Technology Co., Ltd., A Shares | | |
Tianjin Chase Sun Pharmaceutical Co. Ltd, A Shares | | |
Tianjin Guangyu Development Co., Ltd., A Shares | | |
Tianjin Zhonghuan Semiconductor Co., Ltd., A Shares | | |
Tianma Microelectronics Co., Ltd., A Shares * | | |
Tianqi Lithium Corp., A Shares | | |
Tianqi Lithium Corp., Class H | | |
Tianshui Huatian Technology Co., Ltd., A Shares | | |
Tingyi Cayman Islands Holding Corp. | | |
Titan Wind Energy Suzhou Co., Ltd., A Shares * | | |
Tongcheng Travel Holdings Ltd. * | | |
TongFu Microelectronics Co., Ltd., A Shares | | |
Tongkun Group Co., Ltd., A Shares * | | |
Tongling Nonferrous Metals Group Co., Ltd., A Shares | | |
Tongwei Co., Ltd., A Shares | | |
Topchoice Medical Corp., A Shares * | | |
Topsec Technologies Group, Inc., A Shares * | | |
Topsports International Holdings Ltd. | | |
Towngas Smart Energy Co., Ltd. | | |
TravelSky Technology Ltd., H Shares | | |
Trina Solar Co., Ltd., A Shares | | |
| | |
Tsingtao Brewery Co., Ltd., A Shares | | |
Tsingtao Brewery Co., Ltd., H Shares | | |
| | |
Unigroup Guoxin Microelectronics Co., Ltd., A Shares * | | |
Uni-President China Holdings Ltd. | | |
Unisplendour Corp., Ltd., A Shares * | | |
Valiant Co., Ltd., A Shares | | |
Vinda International Holdings Ltd. | | |
Vipshop Holdings Ltd., ADR * | | |
Walvax Biotechnology Co., Ltd., A Shares | | |
Wanda Film Holding Co., Ltd., A Shares * | | |
| | |
Wangsu Science & Technology Co., Ltd., A Shares | | |
Wanhua Chemical Group Co., Ltd., A Shares | | |
Wanxiang Qianchao Co., Ltd., A Shares | | |
| | |
Weichai Power Co., Ltd., A Shares | | |
Weichai Power Co., Ltd., H Shares | | |
Weifu High-Technology Group Co., Ltd., A Shares | | |
Weihai Guangwei Composites Co., Ltd., A Shares | | |
Wens Foodstuffs Group Co., Ltd., A Shares | | |
Western Mining Co., Ltd., A Shares | | |
Western Securities Co., Ltd., A Shares | | |
Western Superconducting Technologies Co., Ltd., A Shares | | |
Westone Information Industry, Inc., A Shares | | |
Will Semiconductor Co., Ltd ., A Shares | | |
Wingtech Technology Co., Ltd., A Shares * | | |
Winning Health Technology Group Co., Ltd., A Shares | | |
Wolong Electric Group Co., Ltd., A Shares | | |
Wonders Information Co. Ltd, Class A * | | |
Wuchan Zhongda Group Co., Ltd., A Shares | | |
Wuhan Guide Infrared Co., Ltd., A Shares | | |
Wuliangye Yibin Co., Ltd., A Shares | | |
WUS Printed Circuit Kunshan Co., Ltd., A Shares | | |
WuXi AppTec Co., Ltd., A Shares | | |
WuXi AppTec Co., Ltd., H Shares | | |
Wuxi Autowell Technology Co., Ltd., Class A | | |
Wuxi Biologics Cayman, Inc. * | | |
XCMG Construction Machinery Co., Ltd., A Shares | | |
Xiamen C & D, Inc., A Shares | | |
Xiamen Faratronic Co., Ltd., A Shares | | |
Xiamen ITG Group Corp., Ltd., A Shares | | |
Xiamen Tungsten Co., Ltd., A Shares | | |
| | |
Xinhua Winshare Publishing and Media Co., Ltd., H Shares | | |
Xinjiang Daqo New Energy Co., Ltd., Class A | | |
Xinjiang Tianshan Cement Co., Ltd., A Shares | | |
Xinjiang Zhongtai Chemical Co., Ltd., A Shares | | |
Xinxing Ductile Iron Pipes Co., Ltd., A Shares | | |
Xinyi Solar Holdings Ltd. | | |
| | |
Xtep International Holdings Ltd. | | |
Xuji Electric Co., Ltd., A Shares | | |
Yadea Group Holdings Ltd. | | |
78Schwab International Equity ETFs | Annual Report
Schwab Emerging Markets Equity ETF
Portfolio Holdings as of August 31, 2023 (continued)
| | |
Yang Quan Coal Industry Group Co., Ltd., A Shares | | |
Yangling Metron New Material, Inc., A Shares | | |
Yangtze Optical Fibre and Cable Joint Stock Ltd., Co., A Shares | | |
Yangzhou Yangjie Electronic Technology Co., Ltd., A Shares | | |
Yangzijiang Financial Holding Ltd. | | |
Yangzijiang Shipbuilding Holdings Ltd. | | |
Yankuang Energy Group Co., Ltd., A Shares | | |
Yankuang Energy Group Co., Ltd., H Shares | | |
Yanlord Land Group Ltd. * | | |
Yantai Changyu Pioneer Wine Co., Ltd., A Shares | | |
Yantai Eddie Precision Machinery Co., Ltd., A Shares | | |
Yantai Jereh Oilfield Services Group Co., Ltd., A Shares | | |
Yatsen Holding Ltd., ADR * | | |
Yealink Network Technology Corp., Ltd., A Shares | | |
Yifan Pharmaceutical Co., Ltd., A Shares * | | |
Yifeng Pharmacy Chain Co., Ltd., A Shares | | |
Yihai International Holding Ltd. | | |
Yihai Kerry Arawana Holdings Co., Ltd., A Shares | | |
Yintai Gold Co., Ltd., A Shares | | |
Yixintang Pharmaceutical Group Co., Ltd., A Shares | | |
YongXing Special Materials Technology Co., Ltd., A Shares | | |
Yonyou Network Technology Co., Ltd., A Shares | | |
Youngor Group Co., Ltd., A Shares | | |
Youngy Co., Ltd., A Shares | | |
YTO Express Group Co., Ltd., A Shares | | |
Yuan Longping High-tech Agriculture Co., Ltd., A Shares * | | |
Yuexiu Property Co., Ltd. | | |
| | |
Yunnan Aluminium Co., Ltd., A Shares | | |
Yunnan Baiyao Group Co., Ltd., A Shares | | |
Yunnan Botanee Bio-Technology Group Co., Ltd., A Shares | | |
Yunnan Copper Co., Ltd., A Shares | | |
Yunnan Energy New Material Co., Ltd., A Shares | | |
Yunnan Tin Co., Ltd., A Shares | | |
Yunnan Yuntianhua Co., Ltd., A Shares | | |
| | |
Zangge Mining Co., Ltd., A Shares | | |
Zhangzhou Pientzehuang Pharmaceutical Co., Ltd., A Shares | | |
Zhaojin Mining Industry Co., Ltd., H Shares | | |
Zhefu Holding Group Co., Ltd., A Shares | | |
Zhejiang Century Huatong Group Co., Ltd., A Shares * | | |
| | |
Zhejiang China Commodities City Group Co., Ltd., A Shares | | |
Zhejiang Chint Electrics Co., Ltd., A Shares | | |
Zhejiang Crystal-Optech Co., Ltd., A Shares | | |
Zhejiang Dahua Technology Co., Ltd., A Shares | | |
Zhejiang Dingli Machinery Co., Ltd., A Shares | | |
Zhejiang Expressway Co., Ltd., H Shares | | |
Zhejiang Hailiang Co., Ltd., A Shares | | |
Zhejiang HangKe Technology, Inc. Co., A Shares | | |
Zhejiang Hisoar Pharmaceutical Co., Ltd., A Shares | | |
Zhejiang Huace Film & Television Co., Ltd., A Shares | | |
Zhejiang Huahai Pharmaceutical Co., Ltd., A Shares | | |
Zhejiang Huayou Cobalt Co., Ltd., A Shares | | |
Zhejiang Jingsheng Mechanical & Electrical Co., Ltd., A Shares | | |
Zhejiang Jiuzhou Pharmaceutical Co., Ltd., A Shares | | |
Zhejiang Juhua Co., Ltd., A Shares | | |
Zhejiang NHU Co., Ltd., A Shares | | |
Zhejiang Sanhua Intelligent Controls Co., Ltd., A Shares | | |
Zhejiang Supcon Technology Co., Ltd., A Shares | | |
Zhejiang Supor Co., Ltd., A Shares | | |
Zhejiang Wanfeng Auto Wheel Co., Ltd., A Shares | | |
Zhejiang Weixing New Building Materials Co., Ltd., A Shares | | |
Zhejiang Wolwo Bio-Pharmaceutical Co., Ltd., A Shares | | |
Zhengzhou Coal Mining Machinery Group Co., Ltd., A Shares | | |
Zheshang Securities Co., Ltd., A Shares | | |
ZhongAn Online P&C Insurance Co., Ltd., H Shares * | | |
Zhongji Innolight Co., Ltd., A Shares | | |
Zhongsheng Group Holdings Ltd. | | |
Zhongtai Securities Co., Ltd., A Shares | | |
Zhuhai Huafa Properties Co., Ltd., A Shares | | |
Zhuzhou CRRC Times Electric Co., Ltd. | | |
Zhuzhou CRRC Times Electric Co., Ltd., A Shares | | |
Zhuzhou Hongda Electronics Corp., Ltd., A Shares | | |
Zhuzhou Kibing Group Co., Ltd., A Shares | | |
Zijin Mining Group Co., Ltd., A Shares | | |
Zijin Mining Group Co., Ltd., H Shares | | |
Zoomlion Heavy Industry Science and Technology Co. Ltd, A Shares | | |
Zoomlion Heavy Industry Science and Technology Co. Ltd, H Shares | | |
| | |
| | |
Schwab International Equity ETFs | Annual Report79
Schwab Emerging Markets Equity ETF
Portfolio Holdings as of August 31, 2023 (continued)
| | |
| | |
| | |
|
|
| | |
| | |
| | |
Interconexion Electrica S.A. ESP | | |
| | |
|
|
| | |
| | |
| | |
| | |
| | |
| | |
|
|
Commercial International Bank Egypt S.A.E., GDR | | |
|
|
| | |
Alpha Services and Holdings S.A. * | | |
Athens Water Supply & Sewage Co. S.A. | | |
Autohellas Tourist and Trading S.A. | | |
| | |
Eurobank Ergasias Services & Holdings S.A., A Shares * | | |
| | |
GEK Terna Holding Real Estate Construction S.A. * | | |
Hellenic Petroleum Holdings S.A. | | |
Hellenic Telecommunications Organization S.A. | | |
Holding Co. ADMIE IPTO S.A. * | | |
| | |
| | |
Motor Oil Hellas Corinth Refineries S.A. | | |
| | |
National Bank of Greece S.A. * | | |
| | |
Piraeus Financial Holdings S.A. * | | |
Public Power Corp. S.A. * | | |
| | |
| | |
| | |
Titan Cement International S.A. | | |
| | |
| | |
|
|
China Huishan Dairy Holdings Co., Ltd. *(b) | | |
|
|
Magyar Telekom Telecommunications plc | | |
MOL Hungarian Oil & Gas plc | | |
| | |
| | |
| | |
| | |
|
|
| | |
| | |
| | |
| | |
| | |
| | |
| | |
| | |
| | |
| | |
|
|
| | |
| | |
| | |
| | |
Adani Energy Solutions Ltd. * | | |
| | |
Adani Green Energy Ltd. * | | |
Adani Ports & Special Economic Zone Ltd. | | |
| | |
| | |
| | |
Aditya Birla Capital Ltd. * | | |
| | |
| | |
| | |
Apollo Hospitals Enterprise Ltd. | | |
| | |
| | |
| | |
AU Small Finance Bank Ltd. | | |
| | |
| | |
| | |
| | |
| | |
| | |
Bajaj Holdings & Investment Ltd. | | |
Balkrishna Industries Ltd. | | |
| | |
| | |
| | |
| | |
| | |
| | |
| | |
| | |
Bharat Heavy Electricals Ltd. | | |
Bharat Petroleum Corp., Ltd. | | |
| | |
| | |
| | |
| | |
Britannia Industries Ltd. | | |
| | |
| | |
CG Power & Industrial Solutions Ltd. | | |
Cholamandalam Investment & Finance Co., Ltd. | | |
80Schwab International Equity ETFs | Annual Report
Schwab Emerging Markets Equity ETF
Portfolio Holdings as of August 31, 2023 (continued)
| | |
| | |
| | |
| | |
Colgate-Palmolive (India) Ltd. | | |
Container Corp. Of India Ltd. | | |
Coromandel International Ltd. | | |
| | |
| | |
| | |
| | |
| | |
Dixon Technologies India Ltd. * | | |
| | |
| | |
Dr. Reddy's Laboratories Ltd. | | |
| | |
| | |
Embassy Office Parks REIT | | |
| | |
| | |
FSN E-Commerce Ventures Ltd. * | | |
| | |
General Insurance Corp. of India * | | |
GlaxoSmithKline Pharmaceuticals Ltd. | | |
Glenmark Pharmaceuticals Ltd. | | |
GMR Infrastructure Ltd. * | | |
Godrej Consumer Products Ltd. * | | |
| | |
| | |
| | |
Gujarat Fluorochemicals Ltd. | | |
| | |
| | |
| | |
HDFC Asset Management Co., Ltd. | | |
HDFC Life Insurance Co., Ltd. | | |
| | |
| | |
Hindustan Aeronautics Ltd. | | |
Hindustan Petroleum Corp., Ltd. * | | |
| | |
| | |
Honeywell Automation India Ltd. | | |
| | |
ICICI Lombard General Insurance Co., Ltd. | | |
ICICI Prudential Life Insurance Co., Ltd. | | |
| | |
| | |
| | |
| | |
| | |
Indian Railway Catering & Tourism Corp., Ltd. | | |
Indian Railway Finance Corp., Ltd. | | |
| | |
| | |
| | |
| | |
InterGlobe Aviation Ltd. * | | |
| | |
| | |
Jindal Steel & Power Ltd. | | |
Jio Financial Services Ltd. * | | |
| | |
| | |
| | |
| | |
Kansai Nerolac Paints Ltd. | | |
| | |
L&T Finance Holdings Ltd. | | |
L&T Technology Services Ltd. | | |
Larsen & Toubro Infotech Ltd. | | |
| | |
| | |
| | |
| | |
| | |
Macrotech Developers Ltd. * | | |
Mahindra & Mahindra Financial Services Ltd. | | |
| | |
Mangalore Refinery & Petrochemicals Ltd. * | | |
| | |
| | |
Max Financial Services Ltd. * | | |
Max Healthcare Institute Ltd. * | | |
| | |
| | |
| | |
| | |
| | |
Nippon Life India Asset Management Ltd. | | |
| | |
| | |
| | |
Oil & Natural Gas Corp., Ltd. | | |
| | |
One 97 Communications Ltd. * | | |
Oracle Financial Services Software Ltd. | | |
| | |
| | |
| | |
| | |
| | |
| | |
| | |
| | |
| | |
Power Finance Corp., Ltd. | | |
Power Grid Corp. of India Ltd. | | |
| | |
| | |
| | |
| | |
| | |
| | |
Samvardhana Motherson International Ltd. | | |
SBI Cards & Payment Services Ltd. | | |
SBI Life Insurance Co., Ltd. | | |
| | |
| | |
Shriram Transport Finance Co., Ltd. | | |
| | |
Solar Industries India Ltd. | | |
Sona Blw Precision Forgings Ltd. | | |
| | |
Star Health & Allied Insurance Co., Ltd. * | | |
| | |
Steel Authority of India Ltd. | | |
Sun Pharmaceutical Industries Ltd. | | |
Schwab International Equity ETFs | Annual Report81
Schwab Emerging Markets Equity ETF
Portfolio Holdings as of August 31, 2023 (continued)
| | |
| | |
| | |
| | |
Tata Consultancy Services Ltd. | | |
Tata Consumer Products Ltd. | | |
| | |
| | |
Tata Motors Ltd., A Shares, DVR | | |
| | |
Tata Teleservices Maharashtra Ltd. * | | |
| | |
| | |
| | |
Torrent Pharmaceuticals Ltd. | | |
| | |
| | |
Tube Investments of India Ltd. | | |
| | |
| | |
| | |
| | |
| | |
| | |
| | |
| | |
| | |
| | |
| | |
| | |
| | |
| | |
Zee Entertainment Enterprises Ltd. | | |
| | |
| | |
| | |
|
|
Astra Agro Lestari Tbk PT | | |
| | |
Bank Syariah Indonesia Tbk PT | | |
Dayamitra Telekomunikasi PT | | |
Elang Mahkota Teknologi Tbk PT | | |
GoTo Gojek Tokopedia Tbk PT * | | |
| | |
| | |
| | |
Merdeka Copper Gold Tbk PT * | | |
MNC Digital Entertainment Tbk PT * | | |
PT Adaro Energy Indonesia Tbk | | |
PT Astra International Tbk | | |
| | |
PT Bank Mandiri (Persero) Tbk | | |
PT Bank Negara Indonesia (Persero) Tbk | | |
PT Bank Rakyat Indonesia (Persero) Tbk | | |
| | |
| | |
PT Bumi Serpong Damai Tbk * | | |
PT Charoen Pokphand Indonesia Tbk * | | |
| | |
PT Hanjaya Mandala Sampoerna Tbk | | |
PT Indah Kiat Pulp & Paper Corp. Tbk | | |
PT Indocement Tunggal Prakarsa Tbk | | |
PT Indofood CBP Sukses Makmur Tbk | | |
PT Indofood Sukses Makmur Tbk | | |
PT Jasa Marga Persero Tbk | | |
| | |
| | |
PT Media Nusantara Citra Tbk | | |
PT Perusahaan Gas Negara Tbk | | |
PT Sarana Menara Nusantara Tbk | | |
PT Semen Indonesia (Persero) Tbk | | |
| | |
PT Telkom Indonesia (Persero) Tbk | | |
PT Tower Bersama Infrastructure Tbk | | |
PT Unilever Indonesia Tbk | | |
| | |
| | |
| | |
Smartfren Telecom Tbk PT * | | |
Sumber Alfaria Trijaya Tbk PT | | |
| | |
| | |
|
|
Agility Public Warehousing Co. KSC * | | |
| | |
Boubyan Petrochemicals Co. KSCP | | |
| | |
| | |
Humansoft Holding Co. KSC | | |
Kuwait Finance House KSCP | | |
| | |
Mobile Telecommunications Co. KSCP | | |
National Bank of Kuwait SAKP | | |
| | |
|
|
Alliance Bank Malaysia Berhad | | |
| | |
Astro Malaysia Holdings Berhad | | |
| | |
British American Tobacco Malaysia Berhad | | |
| | |
CIMB Group Holdings Berhad | | |
| | |
Fraser & Neave Holdings Berhad | | |
| | |
| | |
| | |
Hartalega Holdings Berhad | | |
| | |
Hong Leong Financial Group Berhad | | |
| | |
| | |
| | |
Kuala Lumpur Kepong Berhad | | |
| | |
Malaysia Airports Holdings Berhad | | |
| | |
| | |
| | |
| | |
Petronas Chemicals Group Berhad | | |
| | |
| | |
| | |
Press Metal Aluminium Holdings Berhad | | |
| | |
| | |
| | |
82Schwab International Equity ETFs | Annual Report
Schwab Emerging Markets Equity ETF
Portfolio Holdings as of August 31, 2023 (continued)
| | |
| | |
Sime Darby Plantation Berhad | | |
| | |
| | |
| | |
Westports Holdings Berhad | | |
| | |
| | |
|
|
Alfa S.A.B. de C.V., A Shares | | |
| | |
America Movil S.A.B. de C.V. | | |
Arca Continental S.A.B. de C.V. | | |
| | |
| | |
Cemex S.A.B. de C.V., Series CPO * | | |
Coca-Cola Femsa S.A.B. de C.V. | | |
Concentradora Fibra Danhos S.A. de C.V. | | |
El Puerto de Liverpool S.A.B. de C.V., Series C1 | | |
Fibra Uno Administracion S.A. de C.V. | | |
Fomento Economico Mexicano S.A.B. de C.V. | | |
| | |
Gruma S.A.B. de C.V., B Shares | | |
Grupo Aeroportuario del Centro Norte S.A.B. de C.V. | | |
Grupo Aeroportuario del Pacifico S.A.B. de C.V., B Shares | | |
Grupo Aeroportuario del Sureste S.A.B. de C.V., B Shares | | |
Grupo Bimbo S.A.B. de C.V., Series A | | |
Grupo Carso S.A.B. de C.V., Series A1 | | |
Grupo Comercial Chedraui SA de CV | | |
Grupo Elektra S.A.B. de C.V. | | |
Grupo Financiero Banorte S.A.B. de C.V., O Shares | | |
Grupo Financiero Inbursa S.A.B. de C.V., O Shares * | | |
Grupo Mexico S.A.B. de C.V., Series B | | |
Grupo Televisa S.A.B., Series CPO | | |
Industrias Penoles S.A.B. de C.V. * | | |
Kimberly-Clark de Mexico S.A.B. de C.V., A Shares | | |
Megacable Holdings S.A.B. de C.V., Series CPO | | |
Operadora de Sites Mexicanos S.A. de C.V. | | |
Orbia Advance Corp. S.A.B. de C.V. | | |
Prologis Property Mexico SA de CV | | |
Promotora y Operadora de Infraestructura S.A.B. de C.V. | | |
Qualitas Controladora S.A.B. de C.V. | | |
| | |
Sitios Latinoamerica S.A.B. de C.V. * | | |
Wal-Mart de Mexico S.A.B. de C.V. | | |
| | |
|
|
| | |
| | |
Alliance Global Group, Inc. | | |
| | |
| | |
| | |
Bank of the Philippine Islands | | |
| | |
Bloomberry Resorts Corp. * | | |
Converge Information and Communications Technology Solutions, Inc. * | | |
| | |
| | |
| | |
GT Capital Holdings, Inc. | | |
International Container Terminal Services, Inc. | | |
| | |
| | |
| | |
| | |
| | |
Metro Pacific Investments Corp. | | |
Metropolitan Bank & Trust Co. | | |
| | |
| | |
Puregold Price Club, Inc. | | |
| | |
Semirara Mining & Power Corp. | | |
| | |
| | |
| | |
|
|
| | |
| | |
Ezdan Holding Group QSC * | | |
| | |
| | |
Mesaieed Petrochemical Holding Co. | | |
| | |
Qatar Aluminum Manufacturing Co. | | |
Qatar Electricity & Water Co. QSC | | |
| | |
Qatar Gas Transport Co., Ltd. | | |
Qatar International Islamic Bank QSC | | |
| | |
| | |
| | |
| | |
| | |
| | |
|
|
| | |
Sberbank of Russia PJSC *(b)(c) | | |
| | |
|
|
Abdullah Al Othaim Markets Co. | | |
| | |
Advanced Petrochemical Co. | | |
| | |
| | |
| | |
| | |
Arabian Centers Co., Ltd. | | |
| | |
Schwab International Equity ETFs | Annual Report83
Schwab Emerging Markets Equity ETF
Portfolio Holdings as of August 31, 2023 (continued)
| | |
Arabian Internet & Communications Services Co. | | |
| | |
| | |
| | |
| | |
Bupa Arabia for Cooperative Insurance Co. | | |
| | |
Dar Al Arkan Real Estate Development Co. * | | |
Dr Sulaiman Al Habib Medical Services Group Co. | | |
| | |
| | |
| | |
| | |
Mobile Telecommunications Co. | | |
Mouwasat Medical Services Co. | | |
| | |
National Industrialization Co., Class C * | | |
Power & Water Utility Co. for Jubail & Yanbu | | |
Rabigh Refining & Petrochemical Co. * | | |
| | |
| | |
Sahara International Petrochemical Co. | | |
Saudi Airlines Catering Co. | | |
Saudi Arabian Mining Co. * | | |
| | |
Saudi Aramco Base Oil Co. | | |
| | |
Saudi Basic Industries Corp. | | |
| | |
| | |
Saudi Industrial Investment Group | | |
Saudi Kayan Petrochemical Co. * | | |
Saudi Research & Media Group * | | |
Saudi Tadawul Group Holding Co. | | |
| | |
Saudia Dairy & Foodstuff Co. | | |
| | |
Southern Province Cement Co. | | |
The Co. for Cooperative Insurance | | |
| | |
The Saudi Investment Bank | | |
| | |
| | |
| | |
| | |
| | |
Yanbu National Petrochemical Co. | | |
| | |
|
|
| | |
African Rainbow Minerals Ltd. | | |
Anglo American Platinum Ltd. (a) | | |
| | |
Aspen Pharmacare Holdings Ltd. | | |
| | |
| | |
Capitec Bank Holdings Ltd. | | |
| | |
| | |
| | |
| | |
| | |
| | |
| | |
Growthpoint Properties Ltd. | | |
Harmony Gold Mining Co., Ltd. | | |
Impala Platinum Holdings Ltd. | | |
| | |
| | |
Life Healthcare Group Holdings Ltd. | | |
Momentum Metropolitan Holdings | | |
| | |
| | |
| | |
| | |
| | |
| | |
| | |
Northam Platinum Holdings Ltd. * | | |
| | |
| | |
| | |
| | |
| | |
| | |
| | |
| | |
| | |
| | |
| | |
| | |
| | |
| | |
| | |
| | |
| | |
| | |
| | |
| | |
| | |
|
|
Huaxia Eye Hospital Group Co., Ltd., A Shares | | |
|
|
| | |
| | |
Advanced Energy Solution Holding Co., Ltd. | | |
| | |
Airtac International Group | | |
ASE Technology Holding Co., Ltd. | | |
| | |
| | |
| | |
| | |
| | |
| | |
Catcher Technology Co., Ltd. | | |
Cathay Financial Holding Co., Ltd. | | |
Chailease Holding Co., Ltd. | | |
Chang Hwa Commercial Bank Ltd. | | |
Cheng Shin Rubber Industry Co., Ltd. | | |
Chicony Electronics Co., Ltd. | | |
| | |
84Schwab International Equity ETFs | Annual Report
Schwab Emerging Markets Equity ETF
Portfolio Holdings as of August 31, 2023 (continued)
| | |
China Development Financial Holding Corp. * | | |
| | |
| | |
Chunghwa Telecom Co., Ltd. | | |
| | |
CTBC Financial Holding Co., Ltd. | | |
| | |
| | |
E.Sun Financial Holding Co., Ltd. | | |
| | |
| | |
| | |
Eternal Materials Co., Ltd. | | |
| | |
Evergreen Marine Corp., Ltd. | | |
Far Eastern International Bank | | |
Far Eastern New Century Corp. | | |
Far EasTone Telecommunications Co., Ltd. | | |
Feng TAY Enterprise Co., Ltd. | | |
First Financial Holding Co., Ltd. | | |
Formosa Chemicals & Fibre Corp. | | |
Formosa Petrochemical Corp. | | |
| | |
Formosa Sumco Technology Corp. | | |
Formosa Taffeta Co., Ltd. | | |
Foxconn Technology Co., Ltd. | | |
Fubon Financial Holding Co., Ltd. | | |
Genius Electronic Optical Co., Ltd. | | |
Giant Manufacturing Co., Ltd. | | |
| | |
| | |
Hon Hai Precision Industry Co., Ltd. | | |
| | |
| | |
Hua Nan Financial Holdings Co., Ltd., Class C | | |
| | |
| | |
Largan Precision Co., Ltd. | | |
Lite-On Technology Corp., ADR | | |
| | |
Mega Financial Holding Co., Ltd. | | |
Micro-Star International Co., Ltd. | | |
| | |
| | |
Nan Ya Printed Circuit Board Corp. | | |
| | |
Nien Made Enterprise Co., Ltd. | | |
Novatek Microelectronics Corp. | | |
Oneness Biotech Co., Ltd. | | |
| | |
| | |
| | |
Powerchip Semiconductor Manufacturing Corp. | | |
Powertech Technology, Inc. | | |
President Chain Store Corp. | | |
| | |
Realtek Semiconductor Corp. | | |
Ruentex Development Co., Ltd. | | |
Shin Kong Financial Holding Co., Ltd. * | | |
| | |
Sino-American Silicon Products, Inc. | | |
SinoPac Financial Holdings Co., Ltd. | | |
Synnex Technology International Corp. | | |
Taishin Financial Holding Co., Ltd. | | |
| | |
| | |
| | |
Taiwan Cooperative Financial Holding Co., Ltd. | | |
Taiwan Fertilizer Co., Ltd. | | |
Taiwan Glass Industry Corp. * | | |
Taiwan High Speed Rail Corp. | | |
| | |
| | |
Taiwan Semiconductor Manufacturing Co., Ltd. | | |
Teco Electric & Machinery Co., Ltd. | | |
The Shanghai Commercial & Savings Bank Ltd. | | |
Transcend Information, Inc. | | |
U-Ming Marine Transport Corp. | | |
Unimicron Technology Corp. | | |
Uni-President Enterprises Corp. | | |
United Microelectronics Corp. | | |
Vanguard International Semiconductor Corp. | | |
Voltronic Power Technology Corp. | | |
| | |
| | |
| | |
| | |
Winbond Electronics Corp. * | | |
| | |
| | |
| | |
Yang Ming Marine Transport Corp. | | |
Yuanta Financial Holding Co., Ltd. | | |
| | |
Yulon Nissan Motor Co., Ltd. | | |
Zhen Ding Technology Holding Ltd. | | |
| | |
|
|
Advanced Info Service PCL NVDR | | |
Airports of Thailand PCL NVDR * | | |
Asset World Corp. PCL NVDR | | |
| | |
| | |
Bangkok Dusit Medical Services PCL NVDR | | |
Bangkok Expressway & Metro PCL NVDR | | |
Bangkok Life Assurance PCL NVDR | | |
| | |
| | |
BTS Group Holdings PCL NVDR | | |
Bumrungrad Hospital PCL NVDR | | |
| | |
| | |
Central Retail Corp. PCL NVDR | | |
Charoen Pokphand Foods PCL NVDR | | |
| | |
| | |
Delta Electronics Thailand PCL NVDR | | |
Digital Telecommunications Infrastructure Fund, Class F | | |
Electricity Generating PCL NVDR | | |
| | |
Global Power Synergy PCL NVDR | | |
Gulf Energy Development PCL NVDR | | |
Home Product Center PCL NVDR | | |
Schwab International Equity ETFs | Annual Report85
Schwab Emerging Markets Equity ETF
Portfolio Holdings as of August 31, 2023 (continued)
| | |
Indorama Ventures PCL NVDR | | |
Intouch Holdings PCL NVDR | | |
| | |
| | |
| | |
| | |
| | |
Minor International PCL NVDR | | |
Muangthai Capital PCL NVDR | | |
| | |
PTT Exploration & Production PCL NVDR | | |
PTT Global Chemical PCL NVDR | | |
PTT Oil & Retail Business PCL NVDR | | |
| | |
| | |
| | |
| | |
Siam City Cement PCL NVDR | | |
Sri Trang Gloves Thailand PCL NVDR | | |
| | |
Thai Life Insurance PCL NVDR | | |
| | |
Thai Union Group PCL NVDR | | |
| | |
TMBThanachart Bank PCL NVDR | | |
| | |
| | |
|
|
AG Anadolu Grubu Holding A/S | | |
Ahlatci Dogal Gaz Dagitim Enerji VE Yatirim A/S * | | |
| | |
| | |
Aksa Akrilik Kimya Sanayii A/S | | |
| | |
| | |
Alfa Solar Enerji Sanayi VE Ticaret A/S | | |
Anadolu Efes Biracilik Ve Malt Sanayii A/S | | |
Anadolu Isuzu Otomotiv Sanayi Ve Ticaret A/S, Class C | | |
| | |
Aselsan Elektronik Sanayi Ve Ticaret A/S | | |
Astor Transformator Enerji Turizm Insaat Ve Petrol Sanayi Ticaret A/S | | |
| | |
| | |
BIM Birlesik Magazalar A/S | | |
Borusan Mannesmann Boru Sanayi ve Ticaret A/S * | | |
Borusan Yatirim ve Pazarlama A/S | | |
| | |
Cimsa Cimento Sanayi VE Ticaret A/S | | |
| | |
Dogan Sirketler Grubu Holding A/S | | |
Dogus Otomotiv Servis ve Ticaret A/S | | |
EGE Endustri VE Ticaret A/S | | |
EIS Eczacibasi Ilac ve Sinai ve Finansal Yatirimlar Sanayi ve Ticaret A/S | | |
Emlak Konut Gayrimenkul Yatirim Ortakligi AS | | |
| | |
Enka Insaat ve Sanayi A/S | | |
| | |
Eregli Demir ve Celik Fabrikalari T.A.S. * | | |
Europen Endustri Insaat Sanayi VE Ticaret A/S * | | |
| | |
GEN Ilac VE Saglik Urunleri Sanayi VE Ticaret A/S | | |
Girisim Elektrik Taahhut Ticaret Ve Sanayi A/S * | | |
| | |
Haci Omer Sabanci Holding A/S | | |
| | |
| | |
Is Gayrimenkul Yatirim Ortakligi A/S * | | |
Is Yatirim Menkul Degerler A/S, Class A | | |
Iskenderun Demir ve Celik A/S * | | |
Kardemir Karabuk Demir Celik Sanayi ve Ticaret A/S, Class D | | |
Karsan Otomotiv Sanayii Ve Ticaret A/S * | | |
| | |
Kimteks Poliuretan Sanayi VE Ticaret A/S | | |
| | |
Kontrolmatik Enerji Ve Muhendislik A/S | | |
Konya Cimento Sanayii A/S * | | |
Kordsa Teknik Tekstil A/S | | |
Koza Altin Isletmeleri A/S | | |
Koza Anadolu Metal Madencilik Isletmeleri A/S * | | |
Margun Enerji Uretim Sanayi VE Ticaret A/S | | |
Mavi Giyim Sanayi Ve Ticaret A/S, Class B | | |
| | |
MLP Saglik Hizmetleri A/S * | | |
| | |
ODAS Elektrik Uretim ve Sanayi Ticaret A/S * | | |
Otokar Otomotiv Ve Savunma Sanayi A.S. * | | |
Oyak Cimento Fabrikalari A/S * | | |
Oyak Yatirim Menkul Degerler A/S * | | |
Pegasus Hava Tasimaciligi A/S * | | |
Penta Teknoloji Urunleri Dagitim Ticaret A/S * | | |
Petkim Petrokimya Holding A/S * | | |
| | |
Sarkuysan Elektrolitik Bakir Sanayi ve Ticaret A/S | | |
| | |
Selcuk Ecza Deposu Ticaret Ve Sanayi A/S | | |
Smart Gunes Enerjisi Teknolojileri ArGE Uretim Sanayi ve Ticaret A/S * | | |
Sok Marketler Ticaret A/S | | |
TAV Havalimanlari Holding AS * | | |
| | |
Tofas Turk Otomobil Fabrikasi A/S | | |
Tukas Gida Sanayi ve Ticaret A/S * | | |
| | |
Turk Telekomunikasyon A/S * | | |
Turk Traktor ve Ziraat Makineleri A/S | | |
Turkcell Iletisim Hizmetleri A/S * | | |
Turkiye Garanti Bankasi A/S | | |
Turkiye Halk Bankasi A/S * | | |
86Schwab International Equity ETFs | Annual Report
Schwab Emerging Markets Equity ETF
Portfolio Holdings as of August 31, 2023 (continued)
| | |
Turkiye Is Bankasi A/S, Class C | | |
Turkiye Petrol Rafinerileri A/S | | |
Turkiye Sinai Kalkinma Bankasi A/S * | | |
Turkiye Sise ve Cam Fabrikalari A/S | | |
Turkiye Vakiflar Bankasi T.A.O., Class D * | | |
Ulker Biskuvi Sanayi A/S * | | |
Vestel Beyaz Esya Sanayi ve Ticaret A/S | | |
Vestel Elektronik Sanayi ve Ticaret A/S * | | |
Yapi ve Kredi Bankasi A/S | | |
Ziraat Gayrimenkul Yatirim Ortakligi A/S * | | |
Zorlu Enerji Elektrik Uretim A/S * | | |
| | |
|
United Arab Emirates 1.8% |
Abu Dhabi Commercial Bank PJSC | | |
Abu Dhabi Islamic Bank PJSC | | |
Abu Dhabi National Oil Co. for Distribution PJSC | | |
Abu Dhabi Ports Co. PJSC * | | |
| | |
| | |
AL Seer Marine Supplies & Equipment Co. LLC * | | |
| | |
Alpha Dhabi Holding PJSC * | | |
Americana Restaurants International plc | | |
Apex Investment Co. PSC * | | |
| | |
| | |
| | |
Dubai Electricity & Water Authority PJSC | | |
Dubai Financial Market PJSC | | |
| | |
| | |
| | |
| | |
Emirates Central Cooling Systems Corp. | | |
Emirates Telecommunications Group Co. PJSC | | |
| | |
First Abu Dhabi Bank PJSC | | |
| | |
| | |
National Marine Dredging Co. * | | |
| | |
| | |
| | |
Total Common Stocks
(Cost $7,138,524,653) | |
|
PREFERRED STOCKS 1.9% OF NET ASSETS |
|
|
| | |
| | |
| | |
| | |
| | |
Centrais Eletricas Brasileiras S.A., B Shares | | |
Cia Energetica de Minas Gerais | | |
Cia Paranaense de Energia, B Shares | | |
CTEEP-Cia de Transmissao de Energia Eletrica Paulista | | |
| | |
Itau Unibanco Holding S.A. | | |
| | |
| | |
| | |
Unipar Carbocloro S.A., B Shares | | |
Usinas Siderurgicas de Minas Gerais S.A. Usiminas, A Shares | | |
| | |
|
|
Embotelladora Andina S.A., B Shares | | |
Sociedad Quimica y Minera de Chile S.A., B Shares | | |
| | |
|
|
Grupo Aval Acciones y Valores S.A. | | |
Grupo de Inversiones Suramericana S.A. | | |
| | |
Total Preferred Stocks
(Cost $152,110,897) | |
|
RIGHTS 0.0% OF NET ASSETS |
|
|
|
expires 09/22/23, strike BRL 6.50 * | | |
| |
| | |
SHORT-TERM INVESTMENTS 1.1% OF NET ASSETS |
|
|
State Street Institutional U.S. Government Money Market Fund, Premier Class 5.28% (d) | | |
State Street Institutional U.S. Government Money Market Fund, Premier Class 5.28% (d)(e) | | |
| | |
Total Short-Term Investments
(Cost $96,381,064) | |
Total Investments in Securities
(Cost $7,387,016,614) | |
Schwab International Equity ETFs | Annual Report87
Schwab Emerging Markets Equity ETF
Portfolio Holdings as of August 31, 2023 (continued)
| | | CURRENT VALUE/
UNREALIZED
DEPRECIATION
($) |
|
| | | |
MSCI Emerging Markets Index, expires 09/15/23 | | | |
| Non-income producing security. |
| All or a portion of this security is on loan. Securities on loan were valued at $33,692,009. |
| Fair valued using significant unobservable inputs (see financial note 2(a), Securities for which no quoted value is available, for additional information). |
| Trading in Russian securities listed on the Moscow Exchange, Russian ADRs, and Russian GDRs are subject to trade restrictions; and therefore, the ability of the fund to buy these securities is currently not permitted, and the ability of the fund to sell these securities is uncertain. |
| The rate shown is the annualized 7-day yield. |
| Security purchased with cash collateral received for securities on loan. |
| American Depositary Receipt |
| Differential Voting Rights |
| Global Depositary Receipt |
| Non-Voting Depositary Receipt |
| Real Estate Investment Trust |
| |
The following is a summary of the inputs used to value the fund’s investments as of August 31, 2023 (see financial note 2(a) for additional information):
| QUOTED PRICES IN
ACTIVE MARKETS FOR
IDENTICAL ASSETS
(LEVEL 1) | OTHER SIGNIFICANT
OBSERVABLE INPUTS
(LEVEL 2) | SIGNIFICANT
UNOBSERVABLE INPUTS
(LEVEL 3) | |
| | | | |
| | | | |
| | | | |
| | | | |
| | | | |
| | | | |
| | | | |
| | | | |
| | | | |
| | | | |
| | | | |
| | | | |
| Level 3 amount shown includes securities determined to have no value at August 31, 2023. |
| As categorized in the Portfolio Holdings. |
| Futures contracts are reported at cumulative unrealized appreciation or depreciation. |
Fund investments in mutual funds are classified as Level 1, without consideration to the classification level of the underlying
securities held by the mutual funds, which could be Level 1, Level 2 or Level 3.
88Schwab International Equity ETFs | Annual Report
Schwab Emerging Markets Equity ETF
Statement of Assets and Liabilities
As of August 31, 2023
|
Investments in securities, at value - unaffiliated (cost $7,387,016,614) including securities on loan of $33,692,009 | | |
| | |
Foreign currency, at value (cost $17,892,553) | | |
Deposit with broker for futures contracts | | |
| | |
| | |
| | |
Income from securities on loan | | |
| | |
| | |
|
|
Collateral held for securities on loan | | |
| | |
Foreign capital gains tax | | |
| | |
Variation margin on futures contracts | | |
| | |
| | |
|
|
Capital received from investors | | |
| | |
| | |
Schwab International Equity ETFs | Annual Report89
Schwab Emerging Markets Equity ETF
Statement of Operations
For the period September 1, 2022 through August 31, 2023 |
|
Dividends received from securities - unaffiliated (net of foreign withholding tax of $31,801,120) | | |
| | |
| | |
|
|
| | |
| | |
| | |
| | |
|
REALIZED AND UNREALIZED GAINS (LOSSES) |
Net realized losses on sales of securities - unaffiliated (net of foreign capital gains tax paid of $5,556,668) | | |
Net realized gains on sales of in-kind redemptions - unaffiliated | | |
Net realized losses on futures contracts | | |
Net realized losses on foreign currency transactions | | |
| | |
Net change in unrealized appreciation (depreciation) on securities - unaffiliated (net of change in foreign capital gains tax of ($6,789,011)) | | |
Net change in unrealized appreciation (depreciation) on futures contracts | | |
Net change in unrealized appreciation (depreciation) on foreign currency translations | | |
Net change in unrealized appreciation (depreciation) | | |
Net realized and unrealized losses | | |
Increase in net assets resulting from operations | | |
| Proxy fees are non-routine expenses (see financial note 2(e) for additional information). |
90Schwab International Equity ETFs | Annual Report
Schwab Emerging Markets Equity ETF
Statement of Changes in Net Assets
For the current and prior report periods
|
| | |
| | | |
| | | |
Net change in unrealized appreciation (depreciation) | | | |
Increase (decrease) in net assets resulting from operations | | | |
|
DISTRIBUTIONS TO SHAREHOLDERS |
| | | |
TRANSACTIONS IN FUND SHARES |
| | |
| | | | | |
| | | | | |
| | | | | |
Net transactions in fund shares | | | | | |
|
SHARES OUTSTANDING AND NET ASSETS |
| | |
| | | | | |
| | | | | |
Total increase (decrease) | | | | | |
| | | | | |
Schwab International Equity ETFs | Annual Report91
Schwab International Equity ETFs
1. Business Structure of the Funds:
Each of the funds in this report is a series of Schwab Strategic Trust (the trust), a no-load, open-end management investment company. The trust is organized as a Delaware statutory trust and is registered under the Investment Company Act of 1940, as amended (the 1940 Act). The list below shows all the operational funds in the trust as of the end of the period, including the funds discussed in this report, which are highlighted:
SCHWAB STRATEGIC TRUST (ORGANIZED JANUARY 27, 2009) |
Schwab International Dividend Equity ETF | Schwab Intermediate-Term U.S. Treasury ETF |
Schwab International Equity ETF | Schwab Long-Term U.S. Treasury ETF |
Schwab International Small-Cap Equity ETF | Schwab U.S. Aggregate Bond ETF |
Schwab Emerging Markets Equity ETF | Schwab 1-5 Year Corporate Bond ETF |
Schwab U.S. Broad Market ETF | Schwab 5-10 Year Corporate Bond ETF |
| Schwab Fundamental U.S. Broad Market Index ETF |
Schwab U.S. Large-Cap ETF | Schwab Fundamental U.S. Large Company Index ETF |
Schwab U.S. Large-Cap Growth ETF | Schwab Fundamental U.S. Small Company Index ETF |
Schwab U.S. Large-Cap Value ETF | Schwab Fundamental International Large Company Index ETF |
| Schwab Fundamental International Small Company Index ETF |
Schwab U.S. Small-Cap ETF | Schwab Fundamental Emerging Markets Large Company Index ETF |
Schwab U.S. Dividend Equity ETF | |
| Schwab Crypto Thematic ETF |
| Schwab Municipal Bond ETF |
Schwab Short-Term U.S. Treasury ETF | Schwab High Yield Bond ETF |
The funds issue and redeem shares at their net asset value per share (NAV) only in large blocks of shares (Creation Units). These transactions are usually in exchange for a basket of securities and/or an amount of cash. As a practical matter, only institutional investors who have entered into an authorized participant agreement purchase or redeem Creation Units. Except when aggregated in Creation Units, shares of the funds are not redeemable securities.
Individual shares of the funds trade on national securities exchanges and elsewhere during the trading day and can only be bought and sold at market prices throughout the trading day through a broker-dealer. Because fund shares trade at market prices rather than NAV, shares may trade at a price greater than NAV (premium) or less than NAV (discount). A chart showing the frequency at which each fund’s daily closing market price was at a discount or premium to each fund’s NAV can be found at www.schwabassetmanagement.com
Each fund maintains its own account for purposes of holding assets and accounting, and is considered a separate entity for tax purposes. Within its account, each fund may also keep certain assets in segregated accounts, as required by securities law. The "Fund Complex" includes The Charles Schwab Family of Funds, Schwab Capital Trust, Schwab Investments, Schwab Annuity Portfolios, Schwab Strategic Trust and Laudus Trust.
2. Significant Accounting Policies:The following is a summary of the significant accounting policies the funds use in their preparation of financial statements. The funds follow the investment company accounting and reporting guidance of the Financial Accounting Standards Board (FASB) Accounting Standard Codification Topic 946 Financial Services — Investment Companies. The accounting policies are in conformity with accounting principles generally accepted in the United States of America (GAAP).
The funds may invest in certain mutual funds and exchange-traded funds (ETFs), which are referred to as "underlying funds". For more information about the underlying funds’ operations and policies, please refer to those funds’ semiannual and annual reports, which are filed with the U.S. Securities and Exchange Commission (SEC) and are available on the SEC’s website at www.sec.gov.
(a) Security Valuation:
Pursuant to Rule 2a-5 under the 1940 Act, the Board of Trustees (the Board) has designated authority to a Valuation Designee, the funds’ investment adviser, to make fair valuation determinations under adopted procedures, subject to Board oversight. The investment adviser has formed a Pricing Committee to administer the pricing and valuation of portfolio securities and other assets and liabilities as well as to ensure that prices used for internal purposes or provided by third parties reasonably reflect fair value. The Valuation Designee may utilize independent pricing services, quotations from securities and financial instrument dealers and other market sources to determine fair value.
92Schwab International Equity ETFs | Annual Report
Schwab International Equity ETFs
Financial Notes (continued)
2. Significant Accounting Policies (continued):
Securities held in the funds’ portfolio are valued every business day. The following valuation policies and procedures are used by the Valuation Designee to value various types of securities:
• Securities traded on an exchange or over-the-counter: Traded securities are valued at the closing value for the day, or, on days when no closing value has been reported, at the mean of the most recent bid and ask quotes. Securities that are primarily traded on foreign exchanges are valued at the official closing price or the last sales price on the exchange where the securities are principally traded with these values then translated into U.S. dollars at the current exchange rate, unless these securities are fair valued as discussed below.
• Futures contracts: Futures contracts are valued at their settlement prices as of the close of their exchanges.
• Mutual funds: Mutual funds are valued at their respective NAVs.
• Securities for which no quoted value is available: The Valuation Designee has adopted procedures to fair value a fund’s securities when market prices are not “readily available” or are unreliable. For example, a security may be fair valued when it’s de-listed or its trading is halted or suspended; when a security’s primary pricing source is unable or unwilling to provide a price; or when a security’s primary trading market is closed during regular market hours. Fair value determinations are made in good faith in accordance with adopted valuation procedures. The Valuation Designee considers a number of factors, including unobservable market inputs, when arriving at fair value. The Valuation Designee may employ methods such as the review of related or comparable assets or liabilities, related market activities, recent transactions, market multiples, book values, transactional back-testing, disposition analysis and other relevant information. Due to the subjective and variable nature of fair value pricing, there can be no assurance that a fund could obtain the fair value assigned to the security upon the sale of such security.
In accordance with the authoritative guidance on fair value measurements and disclosures under GAAP, the funds disclose the fair value of their investments in a hierarchy that prioritizes the significant inputs to valuation methods used to measure the fair value. The hierarchy gives the highest priority to valuations based upon unadjusted quoted prices in active markets for identical assets or liabilities (Level 1 measurements) and the lowest priority to valuations based upon unobservable inputs that are significant to the valuation (Level 3 measurements). If inputs used to measure the financial instruments fall within different levels of the hierarchy, the categorization is based on the lowest level input that is significant to the valuation. If it is determined that either the volume and/or level of activity for an asset or liability has significantly decreased (from normal conditions for that asset or liability) or price quotations or observable inputs are not associated with orderly transactions, increased analysis and the Valuation Designee’s judgment will be required to estimate fair value.
The three levels of the fair value hierarchy are as follows:
• Level 1 — quoted prices in active markets for identical investments — Investments whose values are based on quoted market prices in active markets. These generally include active listed equities, mutual funds, ETFs and futures contracts. Mutual funds and ETFs are classified as Level 1 prices, without consideration to the classification level of the underlying securities held.
• Level 2 — other significant observable inputs (including quoted prices for similar securities, interest rates, prepayment speeds, credit risk, etc.) — Investments that trade in markets that are not considered to be active, but whose values are based on quoted market prices, dealer quotations or valuations provided by alternative pricing sources supported by observable inputs are classified as Level 2 prices. These generally include U.S. government and sovereign obligations, most government agency securities, investment-grade corporate bonds, certain mortgage products, less liquid listed equities, and state, municipal and provincial obligations.
• Level 3 — significant unobservable inputs (including the Valuation Designee’s assumptions in determining the fair value of investments) — Investments whose values are classified as Level 3 prices have significant unobservable inputs, as they may trade infrequently or not at all. When observable prices are not readily available for these securities, one or more valuation methods are used for which sufficient and reliable data is available. The inputs used in estimating the value of Level 3 prices may include the original transaction price, quoted prices for similar securities or assets in active markets, completed or pending third-party transactions in the underlying investment or comparable issuers, and changes in financial ratios or cash flows. Level 3 prices may also be adjusted to reflect illiquidity and/or non-transferability, with the amount of such discount estimated in the absence of market information. Assumptions used due to the lack of observable inputs may significantly impact the resulting fair value and therefore a fund’s results of operations.
The inputs or methodology used for valuing securities are not necessarily an indication of the risk associated with investing in those securities.
Schwab International Equity ETFs | Annual Report93
Schwab International Equity ETFs
Financial Notes (continued)
2. Significant Accounting Policies (continued):
The levels associated with valuing the funds’ investments as of August 31, 2023, are disclosed in each fund’s Portfolio Holdings.
(b) Accounting Policies for certain Portfolio Investments (if held):
Futures Contracts: Futures contracts are instruments that represent an agreement between two parties that obligates one party to buy, and the other party to sell, specific instruments at an agreed upon price on a stipulated future date. A fund must give the broker a deposit of cash and/or securities (initial margin) whenever it enters into a futures contract. The amount of the deposit may vary from one contract to another. Subsequent payments (variation margin) are made or received by a fund depending on the daily fluctuations in the value of the futures contract and are accounted for as unrealized appreciation or depreciation until the contract is closed, at which time the gains or losses are realized. Futures contracts are traded publicly on exchanges, and their value may change daily.
Securities Lending: Under the trust’s Securities Lending Program, a fund (lender) may make short-term loans of its securities to another party (borrower) to generate additional revenue for the fund. The borrower pledges collateral in the form of cash, securities issued or fully guaranteed by the U.S. government or foreign governments, or letters of credit issued by a bank. Collateral at the individual loan level is required to be maintained on a daily marked-to-market basis in an amount at least equal to the current value of the securities loaned. The lending agent provides a fund with indemnification against borrower default (the borrower fails to return the security on loan) reducing the risk of loss as a result of default. The cash collateral of securities loaned is currently invested in money market portfolios operating pursuant to Rule 2a-7 under the 1940 Act. Each fund bears the risk of loss with respect to the investment of cash collateral. The terms of the securities lending agreement allow the funds or the lending agent to terminate any loan at any given time and the securities must be returned within the earlier of the standard trade settlement period or the specified time period under the relevant securities lending agreement. Securities lending income, as disclosed in each fund’s Statement of Operations, if applicable, represents the income earned from the investment of the cash collateral plus any fees paid by borrowers, less the fees paid to the lending agent and broker rebates which are subject to adjustments pursuant to the securities lending agreement. On loans not collateralized by cash, a fee is received from the borrower, and is allocated between a fund and the lending agent. The aggregate fair value of securities loaned will not at any time exceed one-third of the total assets of a fund, including collateral received from the loan. Securities lending fees paid to the unaffiliated lending agent start at 9% of gross lending revenue, with subsequent breakpoints to a low of 5%. In this context, the gross lending revenue equals the income received from the investment of cash collateral and fees paid by borrowers less any rebates paid to the borrowers. Any expenses charged by the cash collateral fund are in addition to these fees. All remaining revenue is retained by the fund, as applicable. No portion of lending revenue is paid to or retained by the investment adviser or any of its affiliates.
As of August 31, 2023, Schwab International Equity ETF, Schwab International Small-Cap Equity ETF and Schwab Emerging Markets Equity ETF had securities on loan, all of which were classified as common stocks and warrants. The value of the securities on loan and the related collateral as of August 31, 2023, are disclosed in each fund’s Portfolio Holdings and Statement of Assets and Liabilities.
Passive Foreign Investment Companies: Certain funds may own shares in certain foreign corporations that meet the Internal Revenue Code, as amended, definition of a Passive Foreign Investment Company (PFIC). The funds may elect for tax purposes to mark-to-market annually the shares of each PFIC lot held and would be required to distribute as ordinary income to shareholders any such marked to- market gains (as well as any gains realized on sale).
Central Securities Depositories Regulation: The Central Securities Depositories Regulation (CSDR) introduced measures for the authorization and supervision of European Union Central Security Depositories and created a common set of prudential, organizational, and conduct of business standards at a European level. CSDR is designed to support securities settlement and operational aspects of securities settlement, including the provision of shorter settlement periods; mandatory buy-ins; and cash penalties, to prevent and address settlement fails. CSDR measures are aimed to prevent settlement fails by ensuring that all transaction details are provided to facilitate settlement, as well as further incentivizing timely settlement by imposing cash penalty fines and buy-ins. The funds may be subject to pay cash penalties and may also receive cash penalties with certain counterparties in instances where there are settlement fails. These cash penalties are included in net realized gains (losses) on sales of securities in each fund’s Statement of Operations, if any.
(c) Security Transactions:
Security transactions are recorded as of the date the order to buy or sell the security is executed. Realized gains and losses from security transactions are based on the identified costs of the securities involved.
94Schwab International Equity ETFs | Annual Report
Schwab International Equity ETFs
Financial Notes (continued)
2. Significant Accounting Policies (continued):
Assets and liabilities denominated in foreign currencies are reported in U.S. dollars. For assets and liabilities held on a given date, the dollar value is based on market exchange rates in effect on that date. Transactions involving foreign currencies, including purchases, sales, income receipts and expense payments, are calculated using exchange rates in effect on the transaction date. Realized foreign exchange gains or losses arise from sales of foreign currencies, currency gains or losses realized between the trade and settlement dates on securities transactions and the difference between the recorded amounts of dividends, interest, and foreign withholding taxes and the U.S. dollar equivalent of the amounts actually received or paid. Net unrealized foreign exchange appreciation or depreciation arises from changes in foreign exchange rates on foreign denominated assets and liabilities other than investments in securities held at the end of the reporting period. These realized and unrealized foreign exchange gains or losses are reported in foreign currency transactions or translations in each fund’s Statement of Operations, if any. The funds do not isolate the portion of the fluctuations on investments resulting from changes in foreign currency exchange rates from the fluctuations in market prices of investments held. Such fluctuations are included with the net realized and unrealized gain or loss from investments, if any.
Gains realized by the funds on the sale of securities in certain foreign countries may be subject to non-U.S. taxes. In those instances, the funds record a liability based on unrealized gains to provide for potential non-U.S. taxes payable upon the sale of these securities.
When a fund closes out a futures contract position, it calculates the difference between the value of the position at the beginning and at the end of the contract, and records a realized gain or loss accordingly.
(d) Investment Income:
Interest income is recorded as it accrues. Dividends, in the form of cash or non-cash income such as in the form of additional securities, and distributions from portfolio securities and underlying funds are recorded on the date they are effective (the ex-dividend date), although the funds record certain foreign security dividends on the date the ex-dividend is confirmed. Any distributions from underlying funds are recorded in accordance with the character of the distributions as designated by the underlying funds.
Income received from foreign sources may result in withholding tax. Withholding taxes are accrued at the same time as the related income if the tax rate is fixed and known, unless a tax withheld is reclaimable from the local tax authorities in which case it is recorded as receivable. If the tax rate is not known or estimable, such expense or reclaim receivable is recorded when the net proceeds are received.
Schwab International Equity ETF and Schwab International Small-Cap Equity ETF filed claims to recover taxes previously withheld in certain European Union countries on the basis that those countries had purportedly violated certain provisions in the Treaty on the Functioning of the European Union. These filings are subject to various administrative and judicial proceedings within these countries, and all professional fees associated with these filings have been paid by the investment adviser. The professional fees are non-contingent and non-routine fees which are subject to repayment to the investment adviser (see financial note 4 for additional information).
For U.S. income tax purposes, European Union reclaims received reduce the amounts of foreign taxes that the fund passes through to its shareholders. If European Union reclaims received exceed foreign withholding taxes paid, the Schwab International Equity ETF and Schwab International Small-Cap Equity ETF will seek to enter into a closing agreement with the Internal Revenue Service (IRS) to address any prior years’ U.S. income tax liabilities attributable to fund shareholders resulting from the recovery of foreign taxes. The closing agreement would result in the fund paying a compliance fee to the IRS, on behalf of its shareholders, representing the estimated tax savings generated from foreign tax credits claimed by fund shareholders on their tax returns in prior years. During the period ended August 31, 2023, the Schwab International Equity ETF and Schwab International Small-Cap Equity ETF did not incur any compliance fees.
(e) Expenses:
Pursuant to the Amended and Restated Advisory Agreement (Advisory Agreement) between the investment adviser and the trust, the investment adviser will pay the operating expenses of the funds, excluding taxes, any brokerage expenses, and extraordinary or non-routine expenses. Taxes, any brokerage expenses and extraordinary or non-routine expenses that are specific to a fund are charged directly to the fund. The Advisory Agreement excludes paying acquired fund fees and expenses, which are indirect expenses incurred by a fund through its investments in underlying funds.
Schwab International Equity ETFs | Annual Report95
Schwab International Equity ETFs
Financial Notes (continued)
2. Significant Accounting Policies (continued):
(f) Distributions to Shareholders:
The funds make distributions from net investment income, if any, semiannually, and from net realized capital gains, if any, once a year. To receive a distribution, you must be a registered shareholder on the record date. Distributions are paid to shareholders on the payable date.
(g) Accounting Estimates:
The accounting policies described in this report conform to GAAP. Notwithstanding this, shareholders should understand that in order to follow these principles, fund management has to make estimates and assumptions that affect the information reported in the financial statements. It’s possible that once the results are known, they may turn out to be different from these estimates and these differences may be material.
(h) Federal Income Taxes:
The funds intend to meet federal income and excise tax requirements for regulated investment companies under subchapter M of the Internal Revenue Code, as amended. Accordingly, the funds distribute substantially all of their net investment income and net realized capital gains, if any, to their respective shareholders each year. As long as a fund meets the tax requirements, it is not required to pay federal income tax.
(i) Foreign Taxes:
The funds may be subject to foreign taxes (a portion of which may be reclaimable) on income, corporate events, foreign currency exchanges and capital gains on investments. All foreign taxes are recorded in accordance with the applicable foreign tax regulations and rates that exist in foreign markets in which the funds invest. These foreign taxes, if any, are paid by the funds and are disclosed in each fund’s Statement of Operations. Foreign taxes accrued as of August 31, 2023, if any, are reflected in each fund’s Statement of Assets and Liabilities.
(j) Indemnification:
Under the funds’ organizational documents, the officers and trustees are indemnified against certain liabilities arising out of the performance of their duties to the funds. In addition, in the normal course of business the funds enter into contracts with their vendors and others that provide general indemnifications. The funds’ maximum exposure under these arrangements is unknown as this would involve future claims that may be made against the funds. However, based on experience, the funds expect the risk of loss attributable to these arrangements to be remote.
(k) Regulatory Update:
Effective January 24, 2023, the SEC adopted rule and form amendments to require mutual funds and ETFs to transmit concise and visually engaging streamlined annual and semiannual reports to shareholders that highlight key information deemed important for retail investors to assess and monitor their fund investments. Other information, including financial statements, will no longer appear in a streamlined shareholder report but must be available online, delivered free of charge upon request, and filed on a semiannual basis on Form N-CSR. The rule and form amendments have a compliance date of July 24, 2024. At this time, management is evaluating the impact of these rule and form amendment changes on the content of the current shareholder report and the newly created annual and semiannual streamlined shareholder reports.
3. Risk Factors:Investing in the funds may involve certain risks, as discussed in the funds’ prospectus, including, but not limited to, those described below. Any of these risks could cause an investor to lose money.
Market Risk. Financial markets rise and fall in response to a variety of factors, sometimes rapidly and unpredictably. Markets may be impacted by economic, political, regulatory and other conditions, including economic sanctions and other government actions. In addition, the occurrence of global events, such as war, terrorism, environmental disasters, natural disasters and epidemics, may also negatively affect the financial markets. As with any investment whose performance is tied to these markets, the value of an investment in the fund will fluctuate, which means that an investor could lose money over short or long periods.
96Schwab International Equity ETFs | Annual Report
Schwab International Equity ETFs
Financial Notes (continued)
3. Risk Factors (continued):
Investment Style Risk. The funds are index funds. Therefore, each fund follows the securities included in its respective index during upturns as well as downturns. Because of their indexing strategies, the funds do not take steps to reduce market exposure or to lessen the effects of a declining market. In addition, because of the funds’ expenses, the funds’ performance may be below that of the index. Errors relating to the index may occur from time to time and may not be identified by the index provider for a period of time. In addition, market disruptions could cause delays in the index’s rebalancing schedule. Such errors and/or market disruptions may result in losses for the fund.
Equity Risk. The prices of equity securities rise and fall daily. These price movements may result from factors affecting individual companies, industries or the securities market as a whole. In addition, equity markets tend to move in cycles, which may cause stock prices to fall over short or extended periods of time.
Market Capitalization Risk. Securities issued by companies of different market capitalizations tend to go in and out of favor based on market and economic conditions. During a period when securities of a particular market capitalization fall behind other types of investments, a fund’s performance could be impacted.
Large-Cap Company Risk. Certain funds invest in large-cap company stocks. Large-cap companies are generally more mature and the securities issued by these companies may not be able to reach the same levels of growth as the securities issued by small- or mid-cap companies.
Mid-Cap Company Risk. Certain funds invest in mid-cap company stocks. Mid-cap companies may be more vulnerable to adverse business or economic events than larger, more established companies and the value of securities issued by these companies may move sharply.
Small-Cap Company Risk. Certain funds invest in small-cap company stocks. Securities issued by small-cap companies may be riskier than those issued by larger companies, and their prices may move sharply, especially during market upturns and downturns.
Foreign Investment Risk. A fund’s investments in securities of foreign issuers involve certain risks that may be greater than those associated with investments in securities of U.S. issuers. These include risks of adverse changes in foreign economic, political, regulatory and other conditions; changes in currency exchange rates or exchange control regulations (including limitations on currency movements and exchanges); the imposition of economic sanctions or other government restrictions; differing accounting, auditing, financial reporting and legal standards and practices; differing securities market structures; and higher transaction costs. These risks may negatively impact the value or liquidity of a fund’s investments and could impair the fund’s ability to meet its investment objective or invest in accordance with its investment strategy. There is a risk that investments in securities denominated in, and/or receiving revenues in, foreign currencies will decline in value relative to the U.S. dollar. Foreign securities also include American Depositary Receipts (ADRs), Global Depositary Receipts (GDRs), and European Depositary Receipts (EDRs), which are receipts issued by U.S. and foreign banks that represent shares of foreign-based corporations. Investment in ADRs, GDRs and EDRs may be less liquid than the underlying shares in their primary trading market, and GDRs, in particular, many of which are issued by companies in emerging markets, may be more volatile. Foreign securities may also include investments in variable interest entities (VIEs) structures, which are created by China-based operating companies in jurisdictions outside of China to obtain indirect financing due to Chinese regulations that prohibit non-Chinese ownership of those companies. To the extent a fund’s investments in a single country or a limited number of countries represent a large percentage of the fund’s assets, the fund’s performance may be adversely affected by the economic, political, regulatory and social conditions in those countries and the fund’s price may be more volatile than the price of a fund that is geographically diversified.
Emerging Markets Risk. Emerging market countries may be more likely to experience political turmoil or rapid changes in market or economic conditions than more developed countries. Emerging market countries often have less uniformity in accounting, auditing, financial reporting and recordkeeping requirements and greater risk associated with the custody of securities. In addition, the financial stability of issuers (including governments) in emerging market countries may be more precarious than in developed countries. As a result, there may be an increased risk of illiquidity and price volatility associated with a fund’s investments in emerging market countries, which may be magnified by currency fluctuations relative to the U.S. dollar, and, at times, it may be difficult to value such investments.
Sampling Index Tracking Risk. Each fund uses statistical sampling techniques, and as a result, a fund may not fully replicate its respective index and may hold securities not included in the index. As a result, a fund is subject to the risk that the investment adviser’s investment management strategy, the implementation of which is subject to a number of constraints, may not produce the intended results. Because a fund utilizes a sampling approach, it may not track the return of its respective index as well as it would if a fund purchased all of the securities in its index.
Schwab International Equity ETFs | Annual Report97
Schwab International Equity ETFs
Financial Notes (continued)
3. Risk Factors (continued):
Tracking Error Risk. As index funds, each fund seeks to track the performance of its respective index, although it may not be successful in doing so. The divergence between the performance of a fund and the index, positive or negative, is called “tracking error.” Tracking error can be caused by many factors and it may be significant.
Derivatives Risk. Each fund may invest in derivative instruments. The principal types of derivatives a fund may use are futures contracts. A futures contract is an agreement to buy or sell a financial instrument at a specific price on a specific day. A fund’s use of derivative instruments involves risks different from, or possibly greater than, the risks associated with investing directly in securities and other traditional investments. Certain of these risks, such as market risk, liquidity risk and leverage risk, are discussed elsewhere in this section. A fund’s use of derivatives is also subject to counterparty risk, lack of availability risk, valuation risk, correlation risk and tax risk. Counterparty risk is the risk that the counterparty to a derivative transaction may not fulfill its contractual obligations either because the financial condition of the counterparty declines, or because the counterparty is otherwise unable or unwilling to perform under the contract. Lack of availability risk is the risk that suitable derivative transactions may not be available in all circumstances for risk management or other purposes. Valuation risk is the risk that a particular derivative may be valued incorrectly. Correlation risk is the risk that changes in the value of the derivative may not correlate perfectly with the underlying asset, rate or index. Tax risk is the risk that the use of derivatives may cause a fund to realize higher amounts of short-term capital gains. A fund’s use of derivatives could reduce the fund’s performance, increase its volatility, and cause the fund to lose more than the initial amount invested. A fund’s use of derivatives also could create a risk of counterparty default under certain transactions, risks that a fund would need to liquidate portfolio positions when it may not be advantageous to do so in order to meet margin and payment obligations, and legal risks relating to insufficient documentation, insufficient capacity or authority of a counterparty, or legality or enforceability of a contract. Furthermore, the use of derivatives subject to regulation by the Commodity Futures Trading Commission (CFTC) could cause the fund to become a commodity pool, which would require the fund to comply with certain CFTC rules.
Liquidity Risk. A fund may be unable to sell certain securities, such as illiquid securities, readily at a favorable time or price, or the fund may have to sell them at a loss.
Leverage Risk. Certain fund transactions, such as derivatives transactions, may give rise to a form of leverage and may expose a fund to greater risk. Leverage tends to magnify the effect of any decrease or increase in the value of a fund’s portfolio securities which means even a small amount of leverage can have a disproportionately large impact on the fund. The use of leverage may cause a fund to liquidate portfolio positions when it would not be advantageous to do so in order to satisfy its obligations.
Securities Lending Risk. Securities lending involves the risk of loss of rights in, or delay in recovery of, the loaned securities if the borrower fails to return the security loaned or becomes insolvent.
Concentration Risk. To the extent that a fund’s or an index’s portfolio is concentrated in the securities of issuers in a particular market, industry, group of industries, sector, country or asset class, the fund may be adversely affected by the performance of those securities, may be subject to increased price volatility and may be more vulnerable to adverse economic, market, political or regulatory occurrences affecting that market, industry, group of industries, sector, country or asset class.
Market Trading Risk. Although fund shares are listed on national securities exchanges, there can be no assurance that an active trading market for fund shares will develop or be maintained. If an active market is not maintained, investors may find it difficult to buy or sell fund shares.
Shares of the Fund May Trade at Prices Other Than NAV. Fund shares may be bought and sold in the secondary market at market prices. Although it is expected that the market price of the shares of a fund will approximate the fund’s NAV, there may be times when the market price and the NAV vary significantly. An investor may pay more than NAV when buying shares of a fund in the secondary market, and an investor may receive less than NAV when selling those shares in the secondary market. The market price of fund shares may deviate, sometimes significantly, from NAV during periods of market volatility or market disruption, or as a result of other factors impacting foreign securities, including liquidity, irregular trading activity and timing differences between foreign markets where securities trade and the secondary market where fund shares are sold.
Please refer to the funds’ prospectus for a more complete description of the principal risks of investing in the funds.
98Schwab International Equity ETFs | Annual Report
Schwab International Equity ETFs
Financial Notes (continued)
4. Affiliates and Affiliated Transactions:
Investment Adviser
Charles Schwab Investment Management, Inc., dba Schwab Asset Management, a wholly owned subsidiary of The Charles Schwab Corporation, serves as each fund’s investment adviser pursuant to the Advisory Agreement between the investment adviser and the trust.
For its advisory services to the funds, the investment adviser is entitled to receive an annual management fee, payable monthly, based on a percentage of each fund’s average daily net assets as follows:
SCHWAB INTERNATIONAL DIVIDEND EQUITY ETF | SCHWAB INTERNATIONAL EQUITY ETF | SCHWAB INTERNATIONAL SMALL-CAP EQUITY ETF | SCHWAB EMERGING MARKETS EQUITY ETF |
| | | |
Investment from Affiliates
Certain funds in the Fund Complex may own shares of other funds in the Fund Complex. The table below reflects the percentages of shares of each fund in this report that are owned by other funds in the Fund Complex as of August 31, 2023, as applicable:
| |
| SCHWAB INTERNATIONAL DIVIDEND EQUITY ETF | SCHWAB INTERNATIONAL EQUITY ETF | SCHWAB INTERNATIONAL SMALL-CAP EQUITY ETF | SCHWAB EMERGING MARKETS EQUITY ETF |
Schwab International Opportunities Fund | | | | |
Schwab Monthly Income Fund - Flexible Payout | | | | |
Schwab Monthly Income Fund - Income Payout | | | | |
Schwab Monthly Income Fund - Target Payout | | | | |
Schwab Target 2010 Index Fund | | | | |
Schwab Target 2015 Index Fund | | | | |
Schwab Target 2020 Index Fund | | | | |
Schwab Target 2025 Index Fund | | | | |
Schwab Target 2030 Index Fund | | | | |
Schwab Target 2035 Index Fund | | | | |
Schwab Target 2040 Index Fund | | | | |
Schwab Target 2045 Index Fund | | | | |
Schwab Target 2050 Index Fund | | | | |
Schwab Target 2055 Index Fund | | | | |
Schwab Target 2060 Index Fund | | | | |
Schwab Target 2065 Index Fund | | | | |
Schwab VIT Balanced Portfolio | | | | |
Schwab VIT Balanced with Growth Portfolio | | | | |
Schwab VIT Growth Portfolio | | | | |
Other Affiliated Transactions
The professional fees related to foreign withholding tax claims discussed in financial note 2(d) are non-contingent and non-routine fees. The investment adviser agreed to pay these professional fees, on behalf of the funds, subject to reimbursement by the funds to the extent the funds are able to successfully recover taxes withheld in the future.
Schwab International Equity ETFs | Annual Report99
Schwab International Equity ETFs
Financial Notes (continued)
4. Affiliates and Affiliated Transactions (continued):
For the period ended August 31, 2023, the professional fees incurred by the Schwab International Equity ETF and Schwab International Small-Cap Equity ETF and paid by the investment adviser were $117,319 and $2,773, respectively, as shown as Professional fees in each fund’s Statement of Operations.
During the period ended August 31, 2023, Schwab International Equity ETF and Schwab International Small-Cap Equity ETF recovered previously withheld foreign taxes from Sweden. The payments received by Schwab International Equity ETF and Schwab International Small-Cap Equity ETF amounted to $5,956,981 and $1,207,193, respectively, and are recorded as Dividends received from securities — unaffiliated in the fund’s Statement of Operations. The investment adviser had paid upfront professional fees associated with recovering these foreign taxes in the amount of $25,647 and $10,892, respectively, and are recorded as Dividends received from securities — unaffiliated for Schwab International Equity ETF and Schwab International Small-Cap Equity ETF. Those amounts have been reimbursed to the investment adviser. During the period ended August 31, 2023, Schwab Emerging Markets Equity ETF did not recover any previously withheld foreign taxes and made no reimbursements to the investment adviser.
As of August 31, 2023, the balance of professional fees related to foreign withholding tax subject to future reimbursement by the Schwab International Equity ETF and Schwab International Small-Cap Equity ETF to the investment adviser was $97,915 and $2,773 respectively. Schwab International Dividend Equity ETF and Schwab Emerging Markets ETF had no balance of professional fees related to foreign withholding tax subject to future reimbursement by the funds to the investment adviser.
No other amounts for additional tax reclaims are reflected in the financial statements due to the uncertainty surrounding the ultimate resolution of proceedings, the likelihood of receipt of these claims, and the potential timing of payment.
Interfund Transactions
The funds may engage in direct transactions with certain other funds in the Fund Complex in accordance with procedures adopted by the Board pursuant to Rule 17a-7 under the 1940 Act. When one fund is seeking to sell a security that another is seeking to buy, an interfund transaction can allow both funds to benefit by reducing transaction costs. This practice is limited to funds that share the same investment adviser, trustees and/or officers. For the period ended August 31, 2023, each fund’s total purchases and sales of securities with other funds in the Fund Complex as well as any realized gains (losses) were as follows:
| | | |
Schwab International Dividend Equity ETF | | | |
Schwab International Equity ETF | | | |
Schwab International Small-Cap Equity ETF | | | |
Schwab Emerging Markets Equity ETF | | | |
| | | |
Interfund Borrowing and Lending
Pursuant to an exemptive order issued by the SEC, the funds may enter into interfund borrowing and lending transactions with other funds in the Fund Complex. All loans are for temporary or emergency purposes and the interest rate to be charged will be the average of the overnight repurchase agreement rate and the short-term bank loan rate. All loans are subject to numerous conditions designed to ensure fair and equitable treatment of all participating funds. The interfund lending facility is subject to the oversight and periodic review of the Board. The funds had no interfund borrowing or lending activity during the period.
5. Other Service Providers:SEI Investments Distribution Co. is the principal underwriter and distributor of shares of the funds.
State Street Bank and Trust Company (State Street) serves as the funds’ transfer agent. As part of these services, the transfer agent maintains records pertaining to the sale, redemption and transfer of the funds’ shares. The transfer agent is also responsible for the order-taking function for the funds’ shares.
State Street also serves as custodian and accountant for the funds. The custodian is responsible for the daily safekeeping of securities and cash held by the funds. The funds’ accountant maintains all books and records related to the funds’ transactions.
100Schwab International Equity ETFs | Annual Report
Schwab International Equity ETFs
Financial Notes (continued)
The Board may include people who are officers and/or directors of the investment adviser or its affiliates. Federal securities law limits the percentage of such “interested persons” who may serve on a trust’s board, and the trust was in compliance with these limitations throughout the report period. The funds did not pay any interested trustees or non-interested trustees (independent trustees). The independent trustees are paid by the investment adviser. For information regarding the trustees, please refer to the Trustees and Officers table at the end of this report.
7. Borrowing from Banks:During the period, the funds were participants with other funds in the Fund Complex in a joint, syndicated, committed $850 million line of credit (the Syndicated Credit Facility), which matured on September 29, 2022. On September 29, 2022, the Syndicated Credit Facility was amended to run for a new 364 day period with the line of credit amount increasing to $1 billion, maturing on September 28, 2023. Under the terms of the Syndicated Credit Facility, in addition to the investment adviser paying the interest charged on any borrowings by a fund, the investment adviser paid a commitment fee of 0.15% per annum on the funds’ proportionate share of the unused portion of the Syndicated Credit Facility.
During the period, the funds were participants with other funds in the Fund Complex in a joint, unsecured, uncommitted $400 million line of credit (the Uncommitted Credit Facility), with State Street, which matured on September 29, 2022. On September 29, 2022, the Uncommitted Credit Facility was amended to run for a new 364 day period with the line of credit amount remaining unchanged, maturing on September 28, 2023. Under the terms of the Uncommitted Credit Facility, the investment adviser pays interest on the amount a fund borrows. There were no borrowings by any of the funds from either line of credit during the period.
The funds also have access to custodian overdraft facilities. A fund may have utilized the overdraft facility and incurred an interest expense, which is paid by the investment adviser. The interest expense is determined based on a negotiated rate above the current Federal Funds Rate.
8. Derivatives:Certain funds entered into equity index futures contracts during the report period. The funds invested in futures contracts to equitize available cash. The value and variation margin for futures contracts held at August 31, 2023 are presented in each fund’s Portfolio Holdings and Statement of Assets and Liabilities, respectively. The net realized gains (losses) and net change in unrealized appreciation (depreciation) on futures contracts are presented in each fund’s Statement of Operations, if any. Refer to financial note 2(b) for the funds’ accounting policies with respect to futures contracts and financial note 3 for disclosures concerning the risks of investing in futures contracts. During the period ended August 31, 2023, the month-end average notional amounts of futures contracts held by the funds and the month-end average number of contracts held were as follows:
| | |
Schwab International Dividend Equity ETF | | |
Schwab International Equity ETF | | |
Schwab International Small-Cap Equity ETF | | |
Schwab Emerging Markets Equity ETF | | |
9. Purchases and Sales of Investment Securities:For the period ended August 31, 2023, purchases and sales of securities (excluding in-kind transactions and short-term obligations) were as follows:
| | |
Schwab International Dividend Equity ETF | | |
Schwab International Equity ETF | | |
Schwab International Small-Cap Equity ETF | | |
Schwab Emerging Markets Equity ETF | | |
Schwab International Equity ETFs | Annual Report101
Schwab International Equity ETFs
Financial Notes (continued)
10. In-Kind Transactions:
The consideration for the purchase of Creation Units of a fund often consists of the in-kind deposit of a designated portfolio of equity securities, which constitutes an optimized representation of the securities involved in a relevant fund’s underlying index, and an amount of cash. Investors purchasing and redeeming Creation Units are subject to a standard creation transaction fee and a standard redemption transaction fee paid to the custodian to offset transfer and other transaction costs associated with the issuance and redemption of Creation Units. Purchasers and redeemers of Creation Units for cash are subject to an additional variable charge paid to the fund that will offset the transaction costs to the fund of buying or selling portfolio securities. Variable charges paid to the fund generally have no effect on net asset value per share. In addition, purchasers and redeemers of shares in Creation Units are responsible for payment of the costs of transferring securities to or out of the fund. From time to time, the investment adviser may cover the cost of any transaction fees when believed to be in the best interests of a fund.
The in-kind transactions for the period ended August 31, 2023, were as follows:
| IN-KIND PURCHASES
OF SECURITIES | IN-KIND SALES
OF SECURITIES |
Schwab International Dividend Equity ETF | | |
Schwab International Equity ETF | | |
Schwab International Small-Cap Equity ETF | | |
Schwab Emerging Markets Equity ETF | | |
For the period ended August 31, 2023, the funds may realize net capital gains or losses resulting from in-kind redemptions of Creation Units. Because such gains or losses are not taxable to the funds and are not distributed to existing fund shareholders, the gains or losses are reclassified from accumulated net realized gains or losses to capital received from investors at the end of the funds’ tax year. These reclassifications have no effect on net assets or net asset values per share. The net realized gains or losses on sales of in-kind redemptions for the period ended August 31, 2023 are disclosed in the funds’ Statements of Operations, if any.
11. Federal Income Taxes:As of August 31, 2023, the tax basis cost of the funds’ investments and gross unrealized appreciation and depreciation were as follows:
| | GROSS UNREALIZED
APPRECIATION | GROSS UNREALIZED
DEPRECIATION | NET UNREALIZED
APPRECIATION
(DEPRECIATION) |
Schwab International Dividend Equity ETF | | | | |
Schwab International Equity ETF | | | | |
Schwab International Small-Cap Equity ETF | | | | |
Schwab Emerging Markets Equity ETF | | | | |
| | | | |
| | | | |
As of August 31, 2023, the components of distributable earnings on a tax basis were as follows:
| UNDISTRIBUTED
ORDINARY
INCOME | NET UNREALIZED
APPRECIATION
(DEPRECIATION)
ON INVESTMENTS | NET OTHER UNREALIZED
APPRECIATION
(DEPRECIATION) | CAPITAL LOSS
CARRYFORWARDS
AND OTHER LOSSES | |
Schwab International Dividend Equity ETF | | | | | |
Schwab International Equity ETF | | | | | |
Schwab International Small-Cap Equity ETF | | | | | |
Schwab Emerging Markets Equity ETF | | | | | |
The primary difference between book basis and tax basis unrealized appreciation or unrealized depreciation of investments is the tax deferral of losses on wash sales, the realization for tax purposes of unrealized appreciation or depreciation on futures contracts, the realization for tax purposes of unrealized appreciation on investments in PFICs and partnership investments. The tax cost of the funds’ investments, disclosed above, have been adjusted from its book amounts to reflect these unrealized appreciation or depreciation differences, as applicable.
102Schwab International Equity ETFs | Annual Report
Schwab International Equity ETFs
Financial Notes (continued)
11. Federal Income Taxes (continued):
Capital loss carryforwards have no expiration and may be used to offset future realized capital gains for federal income tax purposes. As of August 31, 2023, the funds had capital loss carryforwards available as follows:
| |
Schwab International Dividend Equity ETF | |
Schwab International Equity ETF | |
Schwab International Small-Cap Equity ETF | |
Schwab Emerging Markets Equity ETF | |
The tax basis components of distributions paid during the current and prior fiscal years were as follows:
| CURRENT FISCAL YEAR END DISTRIBUTIONS | PRIOR FISCAL YEAR END DISTRIBUTIONS |
| | |
Schwab International Dividend Equity ETF | | |
Schwab International Equity ETF | | |
Schwab International Small-Cap Equity ETF | | |
Schwab Emerging Markets Equity ETF | | |
Distributions paid to shareholders are based on net investment income and net realized gains determined on a tax basis, which may differ from net investment income and net realized gains for financial reporting purposes. These differences reflect the differing character of certain income items and net realized gains and losses for financial statement and tax purposes, and may result in reclassification among certain capital accounts in the financial statements. The funds may also designate a portion of the amount paid to redeeming shareholders as a distribution for tax purposes.
Permanent book and tax basis differences may result in reclassifications between components of net assets as required. The adjustments have no impact on net assets or the results of operations.
As of August 31, 2023, management has reviewed the tax positions for open periods (for federal purposes, three years from the date of filing and for state purposes, four years from the date of filing) as applicable to the funds, and has determined that no provision for income tax is required in the funds’ financial statements. The funds recognize interest and penalties, if any, related to unrecognized tax benefits as income tax expense in each fund’s Statement of Operations. During the fiscal year ended August 31, 2023, the funds did not incur any interest or penalties.
12. Subsequent Events:Management has determined there are no subsequent events or transactions through the date the financial statements were issued that would have materially impacted the financial statements as presented.
Schwab International Equity ETFs | Annual Report103
Schwab International Equity ETFs
Report of Independent Registered Public Accounting Firm
To the Board of Trustees of Schwab Strategic Trust and Shareholders of Schwab International Equity ETF, Schwab International Small-Cap Equity ETF, Schwab International Dividend Equity ETF, and Schwab Emerging Markets Equity ETF:
Opinion on the Financial Statements and Financial Highlights
We have audited the accompanying statements of assets and liabilities, including the portfolio holdings, of Schwab International Equity ETF, Schwab International Small-Cap Equity ETF, Schwab International Dividend Equity ETF, and Schwab Emerging Markets Equity ETF, (the “Funds”) four of the funds constituting Schwab Strategic Trust, as of August 31, 2023, the related statements of operations for the year then ended, the statements of changes in net assets for each of the two years in the period then ended, the financial highlights for each of the four years in the period then ended except for Schwab International Dividend Equity ETF, the financial highlights for the years ended August 31, 2023 and August 31, 2022 and for the period from April 29, 2021 (commencement of operations) through August 31, 2021; and the related notes. In our opinion, the financial statements and financial highlights present fairly, in all material respects, the financial position of each of the Funds as of August 31, 2023, and the results of their operations for the year then ended, the changes in their net assets for each of the two years in the period then ended, and the financial highlights for the four years in the period then ended (excluding Schwab International Dividend Equity ETF) in conformity with accounting principles generally accepted in the United States of America. Also, in our opinion, the financial statements and financial highlights present fairly, in all material respects, the financial position of Schwab International Dividend Equity ETF as of August 31, 2023, and the results of its operations for the year then ended, the statements of changes in net assets for each of the two years in the period then ended, and financial highlights for each of the two years in the period then ended and for the period from April 29, 2021 (commencement of operations) through August 31, 2021 in conformity with accounting principles generally accepted in the United States of America. For each of the Funds (excluding Schwab International Dividend Equity ETF), the financial highlights for the year in the period ended August 31, 2019 were audited by other auditors, whose report, dated October 17, 2019, expressed an unqualified opinion on such financial highlights.
Basis for Opinion
These financial statements and financial highlights are the responsibility of the Funds’ management. Our responsibility is to express an opinion on the Funds’ financial statements and financial highlights based on our audits. We are a public accounting firm registered with the Public Company Accounting Oversight Board (United States) (PCAOB) and are required to be independent with respect to the Funds in accordance with the U.S. federal securities laws and the applicable rules and regulations of the Securities and Exchange Commission and the PCAOB.
We conducted our audits in accordance with the standards of the PCAOB. Those standards require that we plan and perform the audit to obtain reasonable assurance about whether the financial statements and financial highlights are free of material misstatement, whether due to error or fraud. The Funds are not required to have, nor were we engaged to perform, an audit of their internal control over financial reporting. As part of our audits, we are required to obtain an understanding of internal control over financial reporting but not for the purpose of expressing an opinion on the effectiveness of the Funds’ internal control over financial reporting. Accordingly, we express no such opinion.
Our audits included performing procedures to assess the risks of material misstatement of the financial statements and financial highlights, whether due to error or fraud, and performing procedures that respond to those risks. Such procedures included examining, on a test basis, evidence regarding the amounts and disclosures in the financial statements and financial highlights. Our audits also included evaluating the accounting principles used and significant estimates made by management, as well as evaluating the overall presentation of the financial statements and financial highlights. Our procedures included confirmation of securities owned as of August 31, 2023, by correspondence with the custodian and brokers; when replies were not received from brokers, we performed other auditing procedures. We believe that our audits provide a reasonable basis for our opinion.
Deloitte & Touche LLP
Denver, Colorado
October 17, 2023
We have served as the auditor of one or more investment companies in the Schwab Funds Complex since 2020.
104Schwab International Equity ETFs | Annual Report
Schwab International Equity ETFs
Other Federal Tax Information (unaudited)
The funds may elect to pass on the benefits of the foreign tax credit to their shareholders for the fiscal year ended August 31, 2023. The foreign tax credit and the foreign source income amounts are as follows:
| | |
Schwab International Dividend Equity ETF | | |
Schwab International Equity ETF | | |
Schwab International Small-Cap Equity ETF | | |
Schwab Emerging Markets Equity ETF | | |
For the fiscal year ended August 31, 2023, the funds designate the following amounts of the dividend distributions as qualified dividends for the purpose of the maximum rate under section 1(h)(11) of the Internal Revenue Code. Shareholders will be notified in January 2024 via IRS Form 1099 of the amounts for use in preparing their 2023 income tax return.
Schwab International Dividend Equity ETF | |
Schwab International Equity ETF | |
Schwab International Small-Cap Equity ETF | |
Schwab Emerging Markets Equity ETF | |
Schwab International Equity ETFs | Annual Report105
Schwab International Equity ETFs
Investment Advisory Agreement Approval
The Investment Company Act of 1940, as amended (the 1940 Act), requires that the continuation of a fund’s investment advisory agreement must be specifically approved (1) by the vote of the trustees or by a vote of the shareholders of the fund, and (2) by the vote of a majority of the trustees who are not parties to the investment advisory agreement or “interested persons” of any party thereto (the Independent Trustees), cast in person at a meeting called for the purpose of voting on such approval. In connection with such approvals, the fund’s trustees must request and evaluate, and the investment adviser is required to furnish, such information as may be reasonably necessary to evaluate the terms of the investment advisory agreement.
The Board of Trustees (the Board or the Trustees, as appropriate) calls and holds one or more meetings each year that are dedicated, in whole or in part, to considering whether to renew the investment advisory agreement (the Agreement) between Schwab Strategic Trust (the Trust) and Charles Schwab Investment Management, Inc. (CSIM) (dba Schwab Asset Management) (the investment adviser) with respect to the existing funds in the Trust, including Schwab International Equity ETF, Schwab International Small-Cap Equity ETF, Schwab Emerging Markets Equity ETF and Schwab International Dividend Equity ETF (the Funds), and to review certain other agreements pursuant to which the investment adviser provides investment advisory services to certain other registered investment companies. In preparation for the meeting(s), the Board requests and reviews a wide variety of materials provided by the investment adviser, including information about the investment adviser’s affiliates, personnel, business goals and priorities, profitability, third-party oversight, corporate structure and operations. As part of the renewal process, the Independent Trustees’ legal counsel, on behalf of the Independent Trustees, sends an information request letter to the investment adviser seeking certain relevant information. The responses by the investment adviser are provided to the Trustees in the Board materials for their review prior to their meeting, and the Trustees are provided with the opportunity to request any additional materials. The Board also receives data provided by an independent provider of investment company data. This information is in addition to the detailed information about the Funds that the Board reviews during the course of each year, including information that relates to the Funds’ operations and performance, legal and compliance matters, risk management, portfolio turnover, and sales and marketing activity. In considering the renewal, the Independent Trustees receive advice from Independent Trustees’ legal counsel, including a memorandum regarding the responsibilities of trustees for the approval of investment advisory agreements. In addition, the Independent Trustees participate in question and answer sessions with representatives of the investment adviser and meet in executive session outside the presence of Fund management.
The Board, including a majority of the Independent Trustees, considered information specifically relating to the continuance of the Agreement with respect to the Funds at meetings held on April 27, 2023 and June 6, 2023, and approved the renewal of the Agreement with respect to the Funds for an additional one-year term at the meeting on June 6, 2023 called for the purpose of voting on such approval.
The Board’s approval of the continuance of the Agreement with respect to the Funds was based on consideration and evaluation of a variety of specific factors discussed at these meetings and at prior meetings, including:
1.
the nature, extent and quality of the services provided to each Fund under the Agreement, including the resources of the investment adviser and its affiliates dedicated to the Funds;
2.
each Fund’s investment performance and how it compared to that of certain other comparable exchange-traded funds and benchmark data;
3.
each Fund’s expenses and how those expenses compared to those of certain other similar exchange-traded funds;
4.
the profitability of the investment adviser and its affiliates, including Charles Schwab & Co., Inc. (Schwab), with respect to each Fund, including both direct and indirect benefits accruing to the investment adviser and its affiliates; and
5.
the extent to which economies of scale would be realized as each Fund grows and whether fee levels in the Agreement reflect those economies of scale for the benefit of Fund investors.
Nature, Extent and Quality of Services. The Board considered the nature, extent and quality of the services provided by the investment adviser to the Funds and the resources of the investment adviser and its affiliates dedicated to the Funds. In this regard, the Trustees evaluated, among other things, the investment adviser’s experience, track record, compliance program, resources dedicated to hiring and retaining skilled personnel and specialized talent, and information security resources. The Trustees also considered information provided by the investment adviser relating to services and support provided with respect to the Funds’ portfolio management team, portfolio strategy, and internal investment guidelines, as well as trading infrastructure, liquidity management, product design and analysis, shareholder communications, securities valuation, and vendor and risk oversight. The Trustees also considered investments the investment adviser has made in its infrastructure, including modernizing the investment adviser’s technology and use of data, increasing expertise in key areas (including portfolio management and trade operations), and improving business continuity, cybersecurity, due diligence, risk management processes, and information security programs, which are designed to provide enhanced services to the Funds
106Schwab International Equity ETFs | Annual Report
Schwab International Equity ETFs
and their shareholders. The Trustees considered Schwab’s overall financial condition and reputation as a full service brokerage firm, as well as the wide range of products, services and account features that benefit Fund shareholders who are brokerage clients of Schwab. Following such evaluation, the Board concluded, within the context of its full deliberations, that the nature, extent and quality of services provided by the investment adviser to the Funds and the resources of the investment adviser and its affiliates dedicated to the Funds supported renewal of the Agreement with respect to the Funds.
Fund Performance. The Board considered each Fund’s performance in determining whether to renew the Agreement with respect to such Fund. Specifically, the Trustees considered each Fund’s performance relative to a peer category of other exchange-traded funds and applicable indices/benchmarks, in light of total return and the market environment, as well as in consideration of each Fund’s investment style and strategy. As part of this review, the Trustees considered the composition of the peer category, selection criteria and the reputation of the independent provider of investment company data who prepared the peer category analysis. In evaluating the performance of each Fund, the Trustees considered the risk profile for such Fund and such Fund’s demonstrated performance in tracking its benchmark index. The Trustees further considered the level of Fund performance in the context of their review of Fund expenses and the investment adviser’s profitability discussed below and also noted that the Board and a designated committee of the Board review performance throughout the year. Following such evaluation, the Board concluded, within the context of its full deliberations, that the performance of each Fund supported renewal of the Agreement with respect to such Fund.
Fund Expenses. With respect to each Fund’s expenses, the Trustees considered the rate of compensation called for by the Agreement and each Fund’s operating expense ratio, in each case in comparison to those of other similar exchange-traded funds, such peer groups and comparisons having been selected and calculated by an independent provider of investment company data. The investment adviser reported to the Board, and the Board took into account, the risk assumed by the investment adviser in the development of the Funds and provision of services as well as the competitive marketplace for financial products. The Trustees also considered fees charged by the investment adviser to other exchange-traded funds and mutual funds that it manages. The Board evaluated the Funds’ unitary fee through review of comparative information with respect to fees paid by other similar exchange-traded funds tracking international equity indices. Following such evaluation, the Board concluded, within the context of its full deliberations, that the expenses of each Fund are reasonable and supported renewal of the Agreement with respect to such Fund.
Profitability. The Trustees considered the compensation flowing to the investment adviser and its affiliates, directly or indirectly and reviewed profitability on a pre-tax basis, without regard to distribution expenses. The Trustees reviewed
profitability of the investment adviser relating to the Schwab fund complex as a whole, noting the benefits to Fund shareholders of being part of the Schwab fund complex, including the allocations of certain costs across the Funds and other funds in the complex. The Trustees also considered any other benefits derived by the investment adviser from its relationship with the Funds, such as whether, by virtue of its management of the Funds, the investment adviser obtains investment information or other research resources that aid it in providing advisory services to other clients. The Trustees considered whether the compensation and profitability with respect to the Funds under the Agreement and other service agreements were reasonable in light of the quality of all services rendered to the Funds by the investment adviser and its affiliates. The Trustees noted that the investment adviser continues to invest substantial sums in its business in order to provide enhanced research capabilities, services and systems to benefit the Funds. Based on this evaluation, the Board concluded, within the context of its full deliberations, that the profitability of the investment adviser with respect to each Fund is reasonable and supported renewal of the Agreement with respect to such Fund.
Economies of Scale. Although the Trustees recognized the difficulty of determining economies of scale with precision, and although the Funds do not have breakpoints in their advisory fees, the Trustees considered the potential existence of any economies of scale by way of the relatively low advisory fee and unitary fee structure of the Funds and whether those are passed along to a Fund’s shareholders through (i) the enhancement of services provided to the Funds in return for fees paid, including through investments by the investment adviser in its infrastructure, including modernizing the investment adviser’s technology and use of data, increasing expertise and capabilities in key areas (including portfolio and trade operations), and improving business continuity, cybersecurity, due diligence and information security programs, which are designed to provide enhanced services to the Funds and their shareholders; and (ii) pricing a fund to scale and keeping overall expenses down as the fund grows. The Trustees acknowledged that the investment adviser has invested in its infrastructure, as discussed above, over time and that the investment adviser’s internal costs of providing investment management, technology, administrative, legal and compliance services to the Funds continue to increase as a result of regulatory or other developments. Based on this evaluation, the Board concluded, within the context of its full deliberations, that each Fund obtains reasonable benefits from economies of scale.
* * * * * * * * * * * * * * * * * * * * * * * * * * * * * * * * * * * * * * * *
In the course of their deliberations, the Trustees may have accorded different weights to various factors and did not identify any particular information or factor that was all important or controlling. Based on the Trustees’ deliberation and their evaluation of the information described above, the Board, including all of the Independent Trustees, approved the continuation of the Agreement with respect to the Funds and concluded that the compensation under the Agreement with
Schwab International Equity ETFs | Annual Report107
Schwab International Equity ETFs
respect to the Funds is fair and reasonable in light of the services provided and the related expenses borne by the investment adviser and its affiliates and such other matters as
the Trustees considered to be relevant in the exercise of their reasonable judgment.
108Schwab International Equity ETFs | Annual Report
Schwab International Equity ETFs
Trustees and Officers
The tables below give information about the trustees and officers of Schwab Strategic Trust, which includes the funds covered in this report. The “Fund Complex” includes The Charles Schwab Family of Funds, Schwab Capital Trust, Schwab Investments, Schwab Annuity Portfolios, Schwab Strategic Trust and Laudus Trust. The Fund Complex includes 106 funds.
The address for all trustees and officers is 211 Main Street, San Francisco, CA 94105. You can find more information about the trustees and officers in the Statement of Additional Information, which is available free by calling 1-877-824-5615.
|
Name, Year of Birth, and Position(s) with the trust (Terms of office, and length of Time Served1) | Principal Occupations During the Past Five Years | Number of Portfolios in Fund Complex Overseen by the Trustee | |
Michael J. Beer 1961 Trustee (Trustee of The Charles Schwab Family of Funds, Schwab Investments, Schwab Capital Trust, Schwab Annuity Portfolios, Schwab Strategic Trust and Laudus Trust since 2022) | Retired. Director, President and Chief Executive Officer (Dec. 2016 – Sept. 2019), Principal Funds (investment management). | | Director (2016 – 2019), Principal Funds, Inc. |
Robert W. Burns 1959 Trustee (Trustee of Schwab Strategic Trust since 2009; The Charles Schwab Family of Funds, Schwab Investments, Schwab Capital Trust, Schwab Annuity Portfolios and Laudus Trust since 2016) | Retired/Private Investor. | | |
Nancy F. Heller 1956 Trustee (Trustee of The Charles Schwab Family of Funds, Schwab Investments, Schwab Capital Trust, Schwab Annuity Portfolios, Schwab Strategic Trust and Laudus Trust since 2018) | | | |
David L. Mahoney 1954 Trustee (Trustee of The Charles Schwab Family of Funds, Schwab Investments, Schwab Capital Trust, Schwab Annuity Portfolios and Laudus Trust since 2011; Schwab Strategic Trust since 2016) | | | Director (2004 – present), Corcept Therapeutics Incorporated Director (2009 – 2021), Adamas Pharmaceuticals, Inc. Director (2003 – 2019), Symantec Corporation |
Jane P. Moncreiff 1961 Trustee (Trustee of The Charles Schwab Family of Funds, Schwab Investments, Schwab Capital Trust, Schwab Annuity Portfolios, Schwab Strategic Trust and Laudus Trust since 2019) | Consultant (2018 – present), Fulham Advisers LLC (management consulting); Chief Investment Officer (2009 – 2017), CareGroup Healthcare System, Inc. (healthcare). | | |
Schwab International Equity ETFs | Annual Report109
Schwab International Equity ETFs
Independent Trustees (continued) |
Name, Year of Birth, and Position(s) with the trust (Terms of office, and length of Time Served1) | Principal Occupations During the Past Five Years | Number of Portfolios in Fund Complex Overseen by the Trustee | |
Kimberly S. Patmore 1956 Trustee (Trustee of The Charles Schwab Family of Funds, Schwab Investments, Schwab Capital Trust, Schwab Annuity Portfolios, Schwab Strategic Trust and Laudus Trust since 2016) | Consultant (2008 – present), Patmore Management Consulting (management consulting). | | |
J. Derek Penn 1957 Trustee (Trustee of The Charles Schwab Family of Funds, Schwab Investments, Schwab Capital Trust, Schwab Annuity Portfolios, Schwab Strategic Trust and Laudus Trust since 2021) | Head of Equity Sales and Trading (2006 – 2018), BNY Mellon (financial services). | | |
110Schwab International Equity ETFs | Annual Report
Schwab International Equity ETFs
|
Name, Year of Birth, and Position(s) with the trust (Terms of office, and length of Time Served1) | Principal Occupations During the Past Five Years | Number of Portfolios in Fund Complex Overseen by the Trustee | |
Walter W. Bettinger II2 1960 Chairman and Trustee (Trustee of The Charles Schwab Family of Funds, Schwab Investments, Schwab Capital Trust and Schwab Annuity Portfolios since 2008; Schwab Strategic Trust since 2009; Laudus Trust since 2010) | Co-Chairman of the Board (July 2022 – present), Director and Chief Executive Officer (Oct. 2008 – present) and President (Feb. 2007 – Oct. 2021), The Charles Schwab Corporation; President and Chief Executive Officer (Oct. 2008 – Oct. 2021) and Director (May 2008 – Oct. 2021), Charles Schwab & Co., Inc.; Director (Apr. 2006 – present), Charles Schwab Bank, SSB; Director (Nov. 2017 – present), Charles Schwab Premier Bank, SSB; Director (July 2019 – present), Charles Schwab Trust Bank; Director (May 2008 – present), Chief Executive Officer (Aug. 2017 – present) and President (Aug. 2017 – Nov. 2021), Schwab Holdings, Inc.; Director (Oct. 2020 – present), TD Ameritrade Holding Corporation; Director (July 2016 – Oct. 2021), Charles Schwab Investment Management, Inc. | | Director (2008 – present), The Charles Schwab Corporation |
Richard A. Wurster2 1973 Trustee (Trustee of The Charles Schwab Family of Funds, Schwab Investments, Schwab Capital Trust, Schwab Annuity Portfolios, Schwab Strategic Trust and Laudus Trust since 2022) | President (Oct. 2021 – present) and Executive Vice President – Schwab Asset Management Solutions (Apr. 2019 – Oct. 2021), The Charles Schwab Corporation; President, Director (Oct. 2021 – present), Executive Vice President – Schwab Asset Management Solutions (July 2019 – Oct. 2021) and Senior Vice President – Advisory (May 2016 – July 2019), Charles Schwab & Co., Inc.; President (Nov. 2021 – present), Schwab Holdings, Inc.; Director (Oct. 2021 – present) and Chief Executive Officer (Nov. 2019 – Jan. 2022), Charles Schwab Investment Management, Inc.; Director, Chief Executive Officer and President (Mar. 2018 – Oct. 2022), Charles Schwab Investment Advisory, Inc.; Chief Executive Officer (July 2016 – Apr. 2018) and President (Mar. 2017 – Apr. 2018), ThomasPartners, Inc.; Chief Executive Officer (July 2016 – Apr. 2018), Windhaven Investment Management, Inc. | | |
|
Name, Year of Birth, and Position(s) with the trust (Terms of office, and length of Time Served3) | Principal Occupations During the Past Five Years |
Omar Aguilar 1970 Chief Executive Officer and Chief Investment Officer (Officer of The Charles Schwab Family of Funds, Schwab Investments, Schwab Capital Trust, Schwab Annuity Portfolios, Schwab Strategic Trust and Laudus Trust since 2011) | Chief Executive Officer (Jan. 2022 – present), Chief Investment Officer (Apr. 2011 – present) and Senior Vice President (Apr. 2011 – Dec. 2021), Charles Schwab Investment Management, Inc.; Director, Chief Executive Officer and President (Oct. 2022 – present), Charles Schwab Investment Advisory, Inc.; Chief Executive Officer (Sept. 2023 – present), Chief Investment Officer (June 2011 – present) and Vice President (June 2011 – Sept. 2023), Schwab Funds, Laudus Trust and Schwab ETFs. |
Jonathan de St. Paer 1973 President (Officer of The Charles Schwab Family of Funds, Schwab Investments, Schwab Capital Trust, Schwab Annuity Portfolios, Schwab Strategic Trust and Laudus Trust since 2018) | Director (Apr. 2019 – present), President (Oct. 2018 – present), Chief Operating Officer (Jan. 2021 – present), and Chief Executive Officer (Apr. 2019 – Nov. 2019), Charles Schwab Investment Management, Inc.; Senior Vice President (June 2020 – Mar. 2022) and Chief Operating Officer (Jan. 2021 – Mar. 2022), Charles Schwab Investment Advisory, Inc.; President (Nov. 2018 – present), Chief Executive Officer (Apr. 2019 – Sept. 2023) and Trustee (Apr. 2019 – Dec. 2020), Schwab Funds, Laudus Trust and Schwab ETFs; Managing Director (May 2022 – present), Senior Vice President (Apr. 2019 – May 2022) and Senior Vice President – Strategy and Product Development (CSIM) (Jan. 2014 – Mar. 2019), Charles Schwab & Co., Inc. |
Mark Fischer 1970 Chief Operating Officer (Officer of The Charles Schwab Family of Funds, Schwab Investments, Schwab Capital Trust, Schwab Annuity Portfolios, Schwab Strategic Trust and Laudus Trust since 2013) | Chief Operating Officer (Dec. 2020 – present) and Treasurer and Chief Financial Officer (Jan. 2016 – Dec. 2022), Schwab Funds, Laudus Trust and Schwab ETFs; Managing Director (Mar. 2023 – present), Chief Financial Officer (Mar. 2020 – present) and Vice President (Oct. 2013 – Mar. 2023), Charles Schwab Investment Management, Inc. |
Schwab International Equity ETFs | Annual Report111
Schwab International Equity ETFs
Officers of the Trust (continued) |
Name, Year of Birth, and Position(s) with the trust (Terms of office, and length of Time Served3) | Principal Occupations During the Past Five Years |
Dana Smith 1965 Treasurer and Chief Financial Officer (Officer of The Charles Schwab Family of Funds, Schwab Investments, Schwab Capital Trust, Schwab Annuity Portfolios, Schwab Strategic Trust and Laudus Trust since 2023) | Treasurer and Chief Financial Officer (Jan. 2023 – present) and Assistant Treasurer (Dec. 2015 – Dec. 2022), Schwab Funds, Laudus Trust and Schwab ETFs; Managing Director (Mar. 2023 – present), Vice President (Mar. 2022 – Mar. 2023) and Director (Oct. 2015 – Mar. 2022), Charles Schwab Investment Management, Inc. |
Brett Wander 1961 Vice President and Chief Investment Officer (Officer of The Charles Schwab Family of Funds, Schwab Investments, Schwab Capital Trust, Schwab Annuity Portfolios, Schwab Strategic Trust and Laudus Trust since 2011) | Managing Director (Mar. 2023 – present), Chief Investment Officer (Apr. 2011 – present) and Senior Vice President (Apr. 2011 – Mar. 2023) Charles Schwab Investment Management, Inc.; Vice President and Chief Investment Officer (June 2011 – present), Schwab Funds, Laudus Trust and Schwab ETFs. |
William P. McMahon, Jr. 1972 Vice President and Chief Investment Officer (Officer of The Charles Schwab Family of Funds, Schwab Investments, Schwab Capital Trust, Schwab Annuity Portfolios, Schwab Strategic Trust and Laudus Trust since 2021) | Managing Director (Mar. 2023 – present), Chief Investment Officer (Jan. 2020 – present) and Senior Vice President (Jan. 2020 – Mar. 2023) Charles Schwab Investment Management, Inc.; Vice President and Chief Investment Officer (June 2021 – present), Schwab Funds, Laudus Trust and Schwab ETFs; Senior Vice President and Chief Investment Officer – ThomasPartners Strategies (Apr. 2018 – Dec. 2019), Charles Schwab Investment Advisory, Inc.; Senior Vice President and Chief Investment Officer (May 2001 – Apr. 2018), ThomasPartners, Inc. |
Catherine MacGregor 1964 Chief Legal Officer and Secretary, Schwab Funds and Schwab ETFs Chief Legal Officer, Vice President and Clerk, Laudus Trust (Officer of The Charles Schwab Family of Funds, Schwab Investments, Schwab Capital Trust, Schwab Annuity Portfolios and Laudus Trust since 2005; Schwab Strategic Trust since 2009) | Managing Director (Mar. 2023 – present), Chief Legal Officer (Mar. 2022 – present) and Vice President (Sept. 2005 – Mar. 2023), Charles Schwab Investment Management, Inc.; Managing Director (May 2022 – present) and Vice President (July 2005 – May 2022), Charles Schwab & Co., Inc.; Vice President (Dec. 2005 – present) and Chief Legal Officer and Clerk (Mar. 2007 – present), Laudus Trust; Chief Legal Officer and Secretary (Oct. 2021 – present), Vice President (Nov. 2005 – Oct. 2021) and Assistant Secretary (June 2007 – Oct. 2021), Schwab Funds; Chief Legal Officer and Secretary (Oct. 2021 – present), Vice President and Assistant Secretary (Oct. 2009 – Oct. 2021), Schwab ETFs. |
1
Each Trustee shall hold office until the election and qualification of his or her successor, or until he or she dies, resigns or is removed. The retirement policy requires that each independent trustee retire by December 31 of the year in which the Trustee turns 74 or the Trustee’s twentieth year of service as an independent trustee on any trust in the Fund Complex, whichever occurs first.
2
Mr. Bettinger and Mr. Wurster are Interested Trustees. Mr. Bettinger and Mr. Wurster are Interested Trustees because each owns stock of The Charles Schwab Corporation (CSC), the parent company of Charles Schwab Investment Management, Inc., the investment adviser for the trusts in the Fund Complex, and is an employee of Charles Schwab & Co., Inc. (Schwab), the principal underwriter for The Charles Schwab Family of Funds, Schwab Investments, Schwab Capital Trust, Schwab Annuity Portfolios and Laudus Trust.
3
The President, Treasurer and Secretary/Clerk hold office until their respective successors are chosen and qualified or until he or she sooner dies, resigns, is removed or becomes disqualified. Each of the other officers serves at the pleasure of the Board.
112Schwab International Equity ETFs | Annual Report
Schwab International Equity ETFs
144A securities These securities may be sold only to qualified institutional buyers under Securities Act Rule 144A.
American Depositary Receipt (ADR) U.S. dollar-denominated receipts issued by U.S. banks or trust companies that represent shares of foreign-based corporations.
ask See “offer.”
asset allocation The practice of dividing a portfolio among different asset classes, with each asset class assigned a particular percentage to help offset risks and rewards, based on your goals, time horizon and risk tolerance.
asset class A group of securities with similar structure and basic characteristics. Stocks, bonds and cash are the three main examples of asset classes.
authorized participant (AP) A large institutional investor that places orders for creation units with the funds’ distributor.
beta A historical measure of an investment’s volatility relative to a market index (usually the S&P 500®). The index is defined as having a beta of 1.00. Investments with a beta higher than 1.00 have been more volatile than the index; those with a beta of less than 1.00 have been less volatile.
bid The highest price at which someone is willing to buy a security.
Bloomberg US Aggregate Bond Index An index that is a broad-based benchmark measuring the performance of the U.S. investment grade, taxable bond market, including U.S. Treasuries, government-related and corporate bonds, mortgage pass-through securities, commercial mortgage-backed securities, and asset-backed securities that are publicly available for sale in the United States. To be eligible for inclusion in the index, securities must be fixed rate, non-convertible, U.S. dollar-denominated with at least $300 million or more of outstanding face value and have one or more years remaining to maturity. The index excludes certain types of securities, including tax-exempt state and local government series bonds, structured notes embedded with swaps or other special features, private placements, floating rate securities, inflation-linked bonds and Eurobonds. The index is market capitalization weighted and the securities in the index are updated on the last business day of each month.
Bloomberg US Treasury Bills 1–3 Month Index An index that includes all publicly issued zero-coupon U.S. Treasury Bills that have a remaining maturity of less than 3 months but more than 1 month, are rated investment grade and have $300 million or more of outstanding face value. It excludes zero-coupon STRIPS.
cap, capitalization See “market cap.”
capital gain, capital loss The difference between the amount paid for an investment and its value at a later time. If the investment has been sold, the capital gain or loss is considered a realized gain or loss. If the investment is still held, the gain or loss is still “on paper” and is considered unrealized.
commencement of operations The date that the first NAV was calculated.
creation unit (C.U.) A basket of securities that is delivered by an authorized participant (AP) to the fund equal to the current holdings of the ETF, plus a designated cash component. In return, the APs receive a large block of ETF shares (typically 50,000 shares), which investors can then buy and sell in the secondary market.
Dow Jones International Dividend 100 Index (Net) An index that is designed to measure the performance of high dividend yielding stocks issued by companies in developed and emerging countries outside of the United States that have a record of consistently paying dividends, selected for fundamental strength based on financial ratios and lower volatility. The 100-component index is derived from the constituents of the Dow Jones Global ex-U.S. Large-Cap Index and the Dow Jones Global ex-U.S. Mid-Cap Index, and excludes real estate investment trusts (REITs). It is modified market capitalization weighted. The Net version of the index reflects reinvested dividends net of withholding taxes, but reflects no deductions for expenses or other taxes.
European Depositary Receipt (EDR) A negotiable security (receipt) that is issued by a European bank, and that represents shares of foreign-based corporations.
exchange A marketplace, or any organization or group that provides or maintains a marketplace for trading securities, options, futures, or commodities.
expense ratio The amount that is taken from the fund’s assets each year to cover the operating expenses. An expense ratio of 0.50% means that a fund’s expenses amount to half of one percent of its average net assets a year.
FTSE Developed ex US Index (Net) An index that is comprised of large- and mid-capitalization companies in developed countries outside the United States, as defined by the index provider. The index defines the large- and mid-capitalization universe as approximately the top 90% of the eligible universe. The Net version of the index reflects reinvested dividends net of withholding taxes, but reflects no deductions for expenses or other taxes.
FTSE Developed Small Cap ex US Liquid Index (Net) An index comprised of small-capitalization companies in developed countries outside the United States, as defined by the index provider. The index defines the small-capitalization universe as approximately the bottom 10% of the eligible universe with a minimum free float capitalization of $150 million. The Net version of the index reflects reinvested dividends net of withholding taxes, but reflects no deductions for expenses or other taxes.
FTSE Emerging Index (Net) An index that is comprised of large- and mid-capitalization companies in emerging market countries, as defined by the index provider. The index defines the large- and mid-capitalization universe as approximately the top 90% of the eligible universe. The Net version of the index reflects reinvested dividends net of withholding taxes, but reflects no deductions for expenses or other taxes.
Global Depositary Receipt (GDR) A negotiable security (receipt) that is issued by a foreign bank, and that represents shares of foreign-based corporations.
gross domestic product (GDP) The output of goods and services produced by labor and property located in the United States.
inception date The date that the shares began trading in the secondary market.
indicative optimized portfolio value (IOPV) A calculation disseminated by the stock exchange that approximates the fund’s NAV every 15 seconds throughout the trading day.
liquidity The ability to convert a security or asset quickly into cash.
Schwab International Equity ETFs | Annual Report113
Schwab International Equity ETFs
market cap, market capitalization The value of a company as determined by the total value of all shares of its stock outstanding. Free-float market capitalization is a variation of market capitalization that only includes shares generally available to the public, and excludes shares of a company held by entities such as the government. Modified market capitalization weighting represents a mix between conventional market capitalization weighting and equal weighting.
market price return The return based on the change in market price per share of the fund over a given time period. Market price returns assume that dividends and capital gain distributions have been reinvested in the fund at market price.
median market cap The midpoint of the range of market caps of the stocks held by a fund. There are different ways of calculating median market cap. With a simple median, half of the stocks in the fund’s portfolio would be larger than the median, and half would be smaller. With a weighted median (the type that is calculated for these funds), half of the fund’s assets are invested in stocks that are larger than the median market cap, and half in stocks that are smaller.
MSCI EAFE Index (Net) A free float-adjusted market capitalization index that is designed to measure the equity market performance of developed markets in Europe, Australasia, and the Far East. The Net version of the index reflects reinvested dividends net of withholding taxes, but reflects no deductions for expenses or other taxes; returns are calculated applying dividend withholding rates applicable to non-resident persons who do not benefit from double taxation treaties.
MSCI Emerging Markets Index (Net) A free float-adjusted market capitalization weighted index that is designed to measure equity market performance in the global emerging markets. This series approximates the minimum possible dividend reinvestment. The returns are calculated applying dividend withholding rates applicable to non-resident persons who do not benefit from double taxation treaties.
net asset value (NAV) The value of one share of a fund. NAV is calculated by taking the fund’s total assets, subtracting liabilities, and dividing by the number of shares outstanding.
NAV return The return based on the change in NAV of the fund over a given time period. NAV returns assume that dividends and capital gain distributions have been reinvested in the fund.
offer (ask) The lowest price at which an individual is willing to sell a security.
open The price at which a security opened for trading on a given day.
outstanding shares, shares outstanding When speaking of the fund, indicates all shares currently held by investors.
price-to-book ratio (P/B) The market price of a company’s stock compared with its “book value.” A mutual fund’s P/B is the weighted average of the P/B of all stocks in the fund’s portfolio.
price-to-earnings ratio (P/E) The market price of a company’s stock compared with earnings over the past year. A mutual fund’s P/E is the weighted average of the P/E of all stocks in the fund’s portfolio.
primary market The market that deals with the issuance of new securities.
rights and warrants Rights and warrants are types of securities that entitle the holder to purchase a proportionate amount of common stock at a specified price for a specific period of time. Rights allow a shareholder to buy more shares directly from the company, usually at a price somewhat lower than the current market price of the outstanding shares. Warrants are usually issued with bonds and preferred stock. Rights and warrants can trade on the market separately from the company’s stock. The prices of rights and warrants do not necessarily move parallel to the prices of the underlying common stock. Rights usually expire within a few weeks of issuance, while warrants may not expire for several years. If a right or warrant is not exercised within the specified time period, it will become worthless and a fund will lose the purchase price it paid for the right or warrant and the right to purchase the underlying security.
Russell 2000 Index An index that measures the performance of the 2,000 smallest companies in the Russell 3000 Index. The Russell 3000 Index measures the performance of the largest 3,000 U.S. companies representing approximately 98% of the investable U.S. equity market.
S&P 500 Index An index that is designed to measure the performance of 500 leading publicly traded companies from a broad range of industries.
sampling If a fund uses a sampling method, the fund will not fully replicate the benchmark index and may hold securities not included in the index. A fund that utilizes a sampling approach may not track the return of the index.
secondary market The market in which investors purchase securities from other investors rather than directly from the issuing companies. Organized exchanges facilitate the trading of securities in the secondary market.
spread The gap between bid and ask prices of a security.
stock A share of ownership, or equity, in the issuing company.
total return The percentage that an investor would have earned or lost on an investment in the fund assuming dividends and distributions were reinvested.
tracking error The difference between the performance of the fund and its benchmark index, positive or negative.
114Schwab International Equity ETFs | Annual Report
Schwab International Equity ETFs
Schwab ETFs
Schwab ETFs are designed to serve as simple low-cost core investment products for a diversified portfolio. These ETFs seek to provide consistent, repeatable performance through a variety of investment strategies that span the equity and fixed income spectrum. The list below shows all currently available Schwab ETFs.
Investors should carefully consider information contained in the prospectus, or if available, the summary prospectus, including investment objectives, risks, charges and expenses before investing. Please call 1-877-824-5615 for a prospectus for any Schwab ETF. Please read the prospectus carefully before you invest. This report must be preceded or accompanied by a current prospectus.
Proxy Voting Policies, Procedures and Results
A description of the proxy voting policies and procedures used to determine how to vote proxies on behalf of the funds is available without charge, upon request, by visiting the Schwab ETFs’ website at www.schwabassetmanagement.com/schwabetfs_prospectus, the SEC’s website at www.sec.gov, or by contacting Schwab ETFs at 1-877-824-5615.
Information regarding how a fund voted proxies relating to portfolio securities during the most recent twelve-month period ended June 30 is available, without charge, by visiting the fund’s website at www.schwabassetmanagement.com/schwabetfs_prospectus or the SEC’s website at www.sec.gov.
Schwab ETFs
U.S. ETFs
Schwab U.S. Broad Market ETF
Schwab 1000 Index® ETF
Schwab U.S. Large-Cap ETF
Schwab U.S. Large-Cap Growth ETF
Schwab U.S. Large-Cap Value ETF
Schwab U.S. Mid-Cap ETF
Schwab U.S. Small-Cap ETF
Schwab U.S. Dividend Equity ETF
Schwab U.S. REIT ETF
International ETFs
Schwab International Dividend Equity ETF
Schwab International Equity ETF
Schwab International Small-Cap Equity ETF
Schwab Emerging Markets Equity ETF
Fixed-Income ETFs
Schwab U.S. TIPS ETF
Schwab Short-Term U.S. Treasury ETF
Schwab Intermediate-Term U.S. Treasury ETF
Schwab Long-Term U.S. Treasury ETF
Schwab U.S. Aggregate Bond ETF
Schwab 1-5 Year Corporate Bond ETF
Schwab 5-10 Year Corporate Bond ETF
Schwab Municipal Bond ETF
Schwab High Yield Bond ETF
Fundamental Index* ETFs
Schwab Fundamental U.S. Broad Market Index ETF
Schwab Fundamental U.S. Large Company Index ETF
Schwab Fundamental U.S. Small Company Index ETF
Schwab Fundamental International Large Company Index ETF
Schwab Fundamental International Small Company Index ETF
Schwab Fundamental Emerging Markets Large Company
Index ETF
Active, Semi-Transparent (Also Known As Non-Transparent) ETF
Schwab Ariel ESG ETF
Thematic ETFs
Schwab Crypto Thematic ETF
Investment Adviser
Charles Schwab Investment Management, Inc., dba Schwab Asset Management
211 Main Street, San Francisco, CA 94105
Schwab ETFs
1-877-824-5615
© 2023 Charles Schwab Investment Management, Inc., dba Schwab Asset Management. All rights reserved.
Printed on recycled paper.
*
FUNDAMENTAL INDEX is a registered trademark of Research Affiliates LLC.
The Schwab Ariel ESG ETF is different from traditional ETFs. Traditional ETFs tell the public what assets they hold each day. This fund will not. This may create additional risks for your investment. For example:
•
You may have to pay more money to trade the fund’s shares. This fund will provide less information to traders, who tend to charge more for trades when they have less information.
•
The price you pay to buy fund shares on an exchange may not match the value of the fund’s portfolio. The same is true when you sell shares. These price differences may be greater for this fund compared to other ETFs because it provides less information to traders.
•
These additional risks may be even greater in bad or uncertain market conditions.
•
The ETF will publish on its website each day a “Proxy Portfolio” designed to help trading in shares of the ETF. While the Proxy Portfolio includes some of the ETF’s holdings, it is not the ETF’s actual portfolio.
The differences between this fund and other ETFs may also have advantages. By keeping certain information about the fund secret, this fund may face less risk that other traders can predict or copy its investment strategy. This may improve the fund’s performance. If other traders are able to copy or predict the fund’s investment strategy, however, this may hurt the fund’s performance.
For additional information regarding the unique attributes and risks of the fund, see Proxy Portfolio Risk, Premium/Discount Risk, Trading Halt Risk, Authorized Participant Concentration Risk, Tracking Error Risk and Shares of the Fund May Trade at Prices Other Than NAV in the Principal Risks and Proxy Portfolio and Proxy Overlap sections of the prospectus and/or the Statement of Additional Information. These risks are discussed on the next page.
Schwab International Equity ETFs
Active semi-transparent (also referred to as non-transparent) ETFs operate differently from other exchange-traded funds (ETFs). Unlike other ETFs, an active semi-transparent ETF does not publicly disclose its entire portfolio composition each business day, which may affect the price at which shares of the ETF trade in the secondary market. Active semi-transparent ETFs have limited public trading history. There can be no assurance that an active trading market will develop, be maintained or operate as intended. There is a risk that the market price of an active semi-transparent ETF may vary significantly from the ETF’s net asset value and that its shares may trade at a wider bid/ask spread and, therefore, cost investors more to trade than shares of other ETFs. These risks are heightened during periods of market disruption or volatility.
Proxy Portfolio Risk: Unlike traditional ETFs, this fund does not disclose its portfolio holdings (Actual Portfolio) daily. The fund instead posts a Proxy Portfolio on its website each day. The Proxy Portfolio is designed to reflect the economic exposures and risk characteristics of the fund’s actual holdings on each trading day, but it is not the same as the fund’s Actual Portfolio. Although the Proxy Portfolio is intended to provide investors with enough information to allow for an effective arbitrage mechanism that will keep the market price of the Fund at or close to the underlying NAV per Share of the Fund, there is a risk (which may increase during periods of market disruption or volatility) that market prices will vary significantly from the underlying NAV of the fund. ETF trading on the basis of a published Proxy Portfolio may trade at a wider bid/ask spread than ETFs that publish their portfolios on a daily basis, especially during periods of market disruption or volatility, and therefore may cost investors more to trade. Also, while the Fund seeks to benefit from keeping its portfolio information secret, market participants may attempt to use the Proxy Portfolio to identify a Fund’s trading strategy, which if successful, could result in such market participants engaging in certain predatory trading practices that may have the potential to harm the Fund and its shareholders.
Proxy Portfolio Construction: The Proxy Portfolio is designed to recreate the daily performance of the Actual Portfolio. This is achieved by performing a “Factor Model” analysis of the Actual Portfolio. The Factor Model is comprised of three sets of factors or analytical metrics: market-based factors, fundamental factors, and industry/sector factors. The fund uses a “Model Universe” to generate its Proxy Portfolio. The Model Universe is comprised of securities that the fund can purchase and will be a financial index or stated portfolio of securities from which fund investments will be selected. The results of the Factor Model analysis are then applied to the Model Universe. The Proxy Portfolio is then generated as a result of this Model Universe analysis with the Proxy Portfolio being a small sub-set of the Model Universe. The Factor Model is applied to both the Actual Portfolio and the Model Universe to construct the fund’s Proxy Portfolio that performs in a manner substantially identical to the performance of its Actual Portfolio. The Proxy Portfolio will only include investments the fund is permitted to hold. The fund’s SAI contains more information on the Proxy Portfolio and its construction.
Proxy Portfolio and Proxy Overlap Information regarding the contents of the Proxy Portfolio, and the percentage weight overlap between the holdings of the Proxy Portfolio and the fund’s Actual Portfolio holdings that formed the basis for its calculation of NAV at the end of the prior Business Day (the Portfolio Overlap), is available by visiting the fund’s website www.schwabassetmanagement.com.
Because environmental, social and governance (ESG) strategies exclude some securities, ESG-focused products may not be able to take advantage of the same opportunities or market trends as products that do not use such strategies. Additionally, the criteria used to select companies for investment may result in investing in securities, industries or sectors that underperform the market as a whole.
This page is intentionally left blank.
Annual Report | August 31, 2023
Schwab U.S. Equity ETFs
Schwab U.S. Broad Market ETF | |
| |
Schwab U.S. Large-Cap ETF | |
Schwab U.S. Large-Cap Growth ETF | |
Schwab U.S. Large-Cap Value ETF | |
| |
Schwab U.S. Small-Cap ETF | |
Schwab U.S. Dividend Equity ETF | |
This page is intentionally left blank.
Fund investment adviser: Charles Schwab Investment Management, Inc., dba Schwab Asset ManagementTM
Distributor: SEI Investments Distribution Co. (SIDCO)
The Sector/Industry classifications in this report use the Global Industry Classification Standard (GICS) which was developed by and is the exclusive property of MSCI Inc. (MSCI) and Standard & Poor’s (S&P). GICS is a service mark of MSCI and S&P and has been licensed for use by Charles Schwab & Co., Inc. The Industry classifications used in the Portfolio Holdings are sub-categories of Sector classifications.
Schwab U.S. Equity ETFs | Annual Report1
The performance data quoted represents past performance. Past performance does not guarantee future results. Investment returns and principal value of an investment will fluctuate so that an investor’s shares, when sold or redeemed, may be worth more or less than the original cost. Current performance may be lower or higher than the performance data quoted. To obtain performance information current to the most recent month end, please visit www.schwabassetmanagement.com/schwabetfs_prospectus.
Total Returns for the 12 Months Ended August 31, 2023 |
Schwab U.S. Broad Market ETF (Ticker Symbol: SCHB) | |
| |
| |
Dow Jones U.S. Broad Stock Market Index | |
ETF Category: Morningstar Large Blend2 | |
| |
| |
Schwab 1000 Index ETF (Ticker Symbol: SCHK) | |
| |
| |
| |
| |
ETF Category: Morningstar Large Blend2 | |
| |
| |
Schwab U.S. Large-Cap ETF (Ticker Symbol: SCHX) | |
| |
| |
Dow Jones U.S. Large-Cap Total Stock Market Index | |
ETF Category: Morningstar Large Blend2 | |
| |
| |
Schwab U.S. Large-Cap Growth ETF (Ticker Symbol: SCHG) | |
| |
| |
Dow Jones U.S. Large-Cap Growth Total Stock Market Index | |
ETF Category: Morningstar Large Growth2 | |
| |
Total Returns for the 12 Months Ended August 31, 2023 |
Schwab U.S. Large-Cap Value ETF (Ticker Symbol: SCHV) | |
| |
| |
Dow Jones U.S. Large-Cap Value Total Stock Market Index | |
ETF Category: Morningstar Large Value2 | |
| |
| |
Schwab U.S. Mid-Cap ETF (Ticker Symbol: SCHM) | |
| |
| |
Dow Jones U.S. Mid-Cap Total Stock Market Index | |
ETF Category: Morningstar Mid-Cap Blend2 | |
| |
| |
Schwab U.S. Small-Cap ETF (Ticker Symbol: SCHA) | |
| |
| |
Dow Jones U.S. Small-Cap Total Stock Market Index | |
ETF Category: Morningstar Small Blend2 | |
| |
| |
Schwab U.S. Dividend Equity ETF (Ticker Symbol: SCHD) | |
| |
| |
Dow Jones U.S. Dividend 100TM Index | |
ETF Category: Morningstar Large Value2 | |
| |
All total returns on this page assume dividends and distributions were reinvested. Index figures do not include trading and management costs, which would lower performance. Indices are unmanaged and cannot be invested in directly. Performance results less than one year are not annualized.
For index definitions, please see the Glossary.
Performance does not reflect the deduction of taxes that a shareholder would pay on fund distributions or on the redemption or sale of fund shares.
Shares are bought and sold at market price, which may be higher or lower than the net asset value (NAV). Brokerage commissions will reduce returns.
Index ownership — Dow Jones® is a registered trademark of Dow Jones Trademark Holdings LLC (Dow Jones). The Dow Jones Indices are products of S&P Dow Jones Indices LLC and/or its affiliates, and have been licensed for use by Charles Schwab Investment Management, Inc., dba Schwab Asset Management. The Schwab U.S. Equity ETFs, based on their respective Dow Jones Indices, are not sponsored, endorsed, sold or promoted by S&P Dow Jones Indices LLC, Dow Jones, or any of their respective affiliates and neither S&P Dow Jones Indices LLC, Dow Jones, nor any of their respective affiliates make any representation regarding the advisability of investing in such products.
1
ETF performance must be shown based on both a market price and NAV basis. The fund’s per share NAV is the value of one share of the fund. NAV is calculated by taking the fund’s total assets (including the fair value of securities owned), subtracting liabilities, and dividing by the number of shares outstanding. The NAV Return is based on the NAV of the fund, and the Market Price Return is based on the market price per share of the fund. The price used to calculate market return (Market Price) is determined using the Official Closing Price on the primary stock exchange (generally, 4:00 p.m. Eastern time) and may not represent the returns you would receive if shares were traded at other times. Market Price and NAV returns assume that dividends and capital gain distributions have been reinvested in the fund at Market Price and NAV, respectively.
2
Source for category information: Morningstar, Inc. The Morningstar Category return represents all passively- and actively-managed ETFs and mutual funds within the category as of the report date.
2Schwab U.S. Equity ETFs | Annual Report
The Investment Environment
For the 12-month reporting period ended August 31, 2023, U.S. stocks rose. U.S. stocks were volatile for the first half of the year as inflation remained elevated and the U.S. Federal Reserve (Fed) continued to raise interest rates. Despite these headwinds, as inflation began to ease, U.S. stocks staged a relatively steady upswing through the end of the reporting period. The ongoing war between Russia and Ukraine weighed on the global economy. For the reporting period, the S&P 500® Index, a bellwether for the overall U.S. stock market, returned 15.94%. Among U.S. stocks, small-cap and mid-cap stocks were weaker, with the Russell 2000® Index and the Dow Jones U.S. Mid-Cap Total Stock Market Index returning 4.65% and 8.41%, respectively. U.S. growth stocks outperformed U.S. value stocks.
The U.S. economy continued to show unexpected resiliency. U.S. gross domestic product (GDP) growth was positive for the third and fourth quarters of 2022 and the first and second quarters of 2023. Inflation generally declined throughout the reporting period, though it remained above the Fed’s historical 2% target and rose slightly in July and August. Consumer spending has remained strong as consumers continue to spend down the significant savings they accumulated during the COVID-19 pandemic. The unemployment rate remained low throughout the period despite inflationary pressures. However, unemployment unexpectedly jumped in August largely as a result of an increase in the labor force participation rate (the proportion of working-age Americans who have a job or are looking for one) which rose to its highest level since February 2020, just prior to the COVID-19 pandemic declaration.
In its efforts to lower inflation, the Fed raised interest rates seven times over the reporting period, with the federal funds rate ending in a range of 5.25% to 5.50%. However, the likelihood of further increases began to temper, as evidenced by the Fed’s pause on rate hikes at its June meeting before a 0.25% increase in July supported by consumer spending and a tight labor market. The Fed’s efforts to reduce the assets held on its balance sheet were effective over the reporting period, though its balance sheet spiked in early March when the Fed supported banks after the failure of three U.S. regional banks.
Asset Class Performance Comparison % returns during the 12 months ended August 31, 2023
Index figures assume dividends and distributions were reinvested. Index figures do not include trading and management costs, which would lower performance. Indices are unmanaged and cannot be invested in directly. Performance results less than one year are not annualized. Past performance is not a guarantee of future results.
For index definitions, please see the Glossary.
Data source: Index provider websites and Schwab Asset Management.
Nothing in this report represents a recommendation of a security by the investment adviser.
Management views may have changed since the report date.
*
The net version of the index reflects reinvested dividends net of withholding taxes but reflects no deductions for expenses or other taxes.
Schwab U.S. Equity ETFs | Annual Report3
The Investment Environment (continued)
Among the 11 sectors in the Dow Jones U.S. Broad Market Index, all but two posted gains for the reporting period. The strongest sector was the information technology sector, led by a handful of big names including NVIDIA Corp., Microsoft Corp., and Apple Inc. Much of the sector’s strength was driven by strong demand for accelerated computing and artificial intelligence (AI) platforms and services. The communication services sector was also a notably strong performer for the reporting period. The two sectors that lost ground for the period were the utilities and real estate sectors, both hampered by high interest rates and inflation, as rising bond yields provided investors with lower-risk investment options.
4Schwab U.S. Equity ETFs | Annual Report
| Christopher Bliss, CFA, Managing Director and Head of Passive Equity Strategies for Schwab Asset Management, is responsible for overseeing the investment process and portfolio management of investment strategies for passive equity Schwab Funds and Schwab ETFs, and Schwab Personalized Indexing™ separately managed accounts. Before joining Schwab in 2016, Mr. Bliss spent 12 years at BlackRock (formerly Barclays Global Investors) managing and leading institutional index teams, most recently as a managing director and the head of the Americas institutional index team. In this role, Mr. Bliss was responsible for overseeing a team of portfolio managers managing domestic, developed international and emerging markets index strategies. Prior to BlackRock, he worked as an equity analyst and portfolio manager for Harris Bretall and before that, as a research analyst for JP Morgan. |
| Jeremy Brown, CFA, Senior Portfolio Manager for Schwab Asset Management, is responsible for the day-to-day co-management of the funds. Prior to joining Schwab in 2017, Mr. Brown spent six years with ALPS Advisors, Inc. in Denver, most recently as a senior analyst on the ETF portfolio management and research team where he performed portfolio management, trading, and analytics/research functions for ALPS ETFs and passive funds. Additionally, Mr. Brown led a number of investment research, commentary, industry trend analysis, and sales and marketing support initiatives. |
| Ferian Juwono, CFA, Senior Portfolio Manager for Schwab Asset Management, is responsible for the oversight and day-to-day co-management of the funds. Prior to joining Schwab in 2010, Mr. Juwono worked at BlackRock (formerly Barclays Global Investors) where he spent more than three years as a portfolio manager, managing equity index funds for institutional clients, and two years as a senior business analyst. Prior to that, Mr. Juwono worked for more than four years as a senior financial analyst with Union Bank of California. |
| Agnes Zau, CFA, Portfolio Manager for Schwab Asset Management, is responsible for the day-to-day co-management of the funds. Prior to joining Schwab in 2018, Ms. Zau was at BlackRock for three years, most recently as a multi-asset portfolio investment consultant where she advised institutional clients on asset allocation and strategy, constructed risk decomposition and portfolio optimization, and conducted scenario analyses for the core multi-asset target risk strategies. She spent the preceding three years as a derivatives specialist at Mellon Capital. |
Schwab U.S. Equity ETFs | Annual Report5
Schwab U.S. Broad Market ETF as of August 31, 2023
The Schwab U.S. Broad Market ETF’s (the fund) goal is to track as closely as possible, before fees and expenses, the total return of the Dow Jones U.S. Broad Stock Market Index (the index). The index includes the largest 2,500 publicly traded U.S. companies for which pricing information is readily available. The index is a float-adjusted market capitalization weighted index that reflects the shares of securities actually available to investors in the marketplace. The fund invests in a representative sample of securities included in the index that, when taken together, are expected to perform similarly to the index as a whole. Due to the use of representative sampling, the fund may not hold all of the securities in the index.
Market Highlights. For the 12-month reporting period ended August 31, 2023, U.S. stocks rose. U.S. stocks were volatile for the first half of the year as inflation remained elevated and the U.S. Federal Reserve (Fed) continued to raise interest rates. Despite these headwinds, as inflation began to ease, U.S. stocks staged a relatively steady upswing through the end of the reporting period. The ongoing war between Russia and Ukraine weighed on the global economy. Among U.S. stocks, small-cap and mid-cap stocks were weaker than large-cap stocks and growth stocks outperformed value stocks. Within the index, stocks in the information technology and communication services sectors were the top performers, while the utilities and real estate sectors underperformed.
Performance. During the 12-month reporting period ended August 31, 2023, the fund closely tracked the index. The fund’s market price return was 14.92% and its NAV return was 14.88% (for an explanation of the market price and NAV returns, please refer to footnote 2 on the following page). The index returned 14.86% during the same period.
Contributors and Detractors. The information technology sector contributed the most to the total return of the fund. Information technology stocks represented an average weight of approximately 27% of the fund’s investments and returned approximately 30% for the reporting period. One example from this sector is NVIDIA Corp., which designs, develops, and markets three-dimensional (3D) graphics processors and related software. The fund’s holdings of NVIDIA Corp. represented an average weight of approximately 2% of the fund’s investments and returned approximately 227% for the reporting period.
The industrials sector also contributed to the total return of the fund, representing an average weight of approximately 9% of the fund’s investments and returning approximately 20% for the reporting period.
The utilities sector detracted the most from the total return of the fund. Utilities stocks represented an average weight of approximately 3% of the fund’s investments and returned approximately -13% for the reporting period. One example from this sector is NextEra Energy, Inc., which provides sustainable energy generation and distribution services. The fund’s holdings of NextEra Energy, Inc. represented an average weight of less than 1% of the fund’s investments and returned approximately -20% for the reporting period.
The real estate sector also detracted from the total return of the fund, representing an average weight of approximately 3% of the fund’s investments and returning approximately -7% for the reporting period.
Management views and portfolio holdings may have changed since the report date.
6Schwab U.S. Equity ETFs | Annual Report
Schwab U.S. Broad Market ETF
Performance and Fund Facts as of August 31, 2023
The performance data quoted represents past performance. Past performance does not guarantee future results. Investment returns and principal value of an investment will fluctuate so that an investor’s shares, when sold or redeemed, may be worth more or less than the original cost. Current performance may be lower or higher than the performance data quoted. To obtain performance information current to the most recent month end, please visit www.schwabassetmanagement.com/schwabetfs_prospectus.
Performance of Hypothetical $10,000 Investment (August 31, 2013 – August 31, 2023)1
Average Annual Total Returns1
| | | |
Fund: Schwab U.S. Broad Market ETF (11/3/09) | | | |
| | | |
| | | |
Dow Jones U.S. Broad Stock Market Index | | | |
ETF Category: Morningstar Large Blend3 | | | |
Fund Expense Ratio4: 0.03% |
All total returns on this page assume dividends and distributions were reinvested. Index figures do not include trading and management costs, which would lower performance. Indices are unmanaged and cannot be invested in directly. Performance results less than one year are not annualized.
For index definitions, please see the Glossary.
Shares are bought and sold at market price, which may be higher or lower than the net asset value (NAV). Brokerage commissions will reduce returns.
Index ownership — Dow Jones® is a registered trademark of Dow Jones Trademark Holdings LLC (Dow Jones). The Dow Jones U.S. Broad Stock Market Index is a product of S&P Dow Jones Indices LLC and/or its affiliates, and has been licensed for use by Charles Schwab Investment Management, Inc., dba Schwab Asset Management. The Schwab U.S. Broad Market ETF is not sponsored, endorsed, sold or promoted by S&P Dow Jones Indices LLC, Dow Jones, or any of their respective affiliates and neither S&P Dow Jones Indices LLC, Dow Jones, nor any of their respective affiliates make any representation regarding the advisability of investing in such product.
1
Performance does not reflect the deduction of taxes that a shareholder would pay on fund distributions or on the redemption or sale of fund shares.
2
ETF performance must be shown based on both a market price and NAV basis. The fund’s per share NAV is the value of one share of the fund. NAV is calculated by taking the fund’s total assets (including the fair value of securities owned), subtracting liabilities, and dividing by the number of shares outstanding. The NAV Return is based on the NAV of the fund, and the Market Price Return is based on the market price per share of the fund. The price used to calculate market return (Market Price) is determined using the Official Closing Price on the primary stock exchange (generally, 4:00 p.m. Eastern time) and may not represent the returns you would receive if shares were traded at other times. NAV is used as a proxy for purposes of calculating Market Price Return on inception date. Market Price and NAV returns assume that dividends and capital gain distributions have been reinvested in the fund at Market Price and NAV, respectively.
3
Source for category information: Morningstar, Inc. The Morningstar Category return represents all passively- and actively-managed ETFs and mutual funds within the category as of the report date.
4
As stated in the prospectus.
Schwab U.S. Equity ETFs | Annual Report7
Schwab U.S. Broad Market ETF
Performance and Fund Facts as of August 31, 2023 (continued)
| |
Weighted Average Market Cap (millions) | |
Price/Earnings Ratio (P/E) | |
| |
| |
Sector Weightings % of Investments3
Top Equity Holdings % of Net Assets5
Portfolio holdings may have changed since the report date.
An index is a statistical composite of a specified financial market or sector. Unlike the fund, an index does not actually hold a portfolio of securities and its return is not inclusive of trading and management costs incurred by the fund.
Source of Sector Classification: S&P and MSCI.
2
Portfolio turnover rate excludes securities received or delivered from processing of in-kind creations or redemptions.
3
The percentage may differ from the Portfolio Holdings because the above calculation is based on a percentage of total investments, excluding derivatives, whereas the calculation in the Portfolio Holdings is based on a percentage of net assets.
4
Includes the fund’s position(s) in money market mutual funds registered under the Investment Company Act of 1940, as amended.
5
This list is not a recommendation of any security by the investment adviser.
8Schwab U.S. Equity ETFs | Annual Report
Schwab 1000 Index ETF as of August 31, 2023
The Schwab 1000 Index ETF’s (the fund) goal is to track as closely as possible, before fees and expenses, the total return of the Schwab 1000 Index® (the index). The index is a float-adjusted market capitalization weighted index that includes the 1,000 largest stocks of publicly traded companies in the United States, with size being determined by market capitalization (total market value of all shares outstanding). The fund generally will seek to replicate the performance of the index by giving the same weight to a given stock as the index does.
Market Highlights. For the 12-month reporting period ended August 31, 2023, U.S. stocks rose. U.S. stocks were volatile for the first half of the year as inflation remained elevated and the U.S. Federal Reserve (Fed) continued to raise interest rates. Despite these headwinds, as inflation began to ease, U.S. stocks staged a relatively steady upswing through the end of the reporting period. The ongoing war between Russia and Ukraine weighed on the global economy. Among U.S. stocks, small-cap and mid-cap stocks were weaker than large-cap stocks and growth stocks outperformed value stocks. Within the index, stocks in the information technology and communication services sectors were the top performers, while the utilities and real estate sectors underperformed.
Performance. During the 12-month reporting period ended August 31, 2023, the fund closely tracked the index. The fund’s market price and NAV returns were 15.31% (for an explanation of the market price and NAV returns, please refer to footnote 2 on the following page). The index returned 15.36% during the same period. Differences between the return of the fund and the return of the index may be attributable to, among other things, the operational and transactional costs incurred by the fund and not the index.
Contributors and Detractors. The utilities sector detracted the most from the total return of the fund. Utilities stocks represented an average weight of approximately 3% of the fund’s investments and returned approximately -13% for the reporting period. One example from this sector is NextEra Energy, Inc., which provides sustainable energy generation and distribution services. The fund’s holdings of NextEra Energy, Inc. represented an average weight of less than 1% of the fund’s investments and returned approximately -20% for the reporting period.
The real estate sector also detracted from the total return of the fund, representing an average weight of approximately 3% of the fund’s investments and returning approximately -7% for the reporting period.
The information technology sector contributed the most to the total return of the fund. Information technology stocks represented an average weight of approximately 28% of the fund’s investments and returned approximately 30% for the reporting period. One example from this sector is NVIDIA Corp., which designs, develops, and markets three-dimensional (3D) graphics processors and related software. The fund’s holdings of NVIDIA Corp. represented an average weight of approximately 2% of the fund’s investments and returned approximately 227% for the reporting period.
The industrials sector also contributed to the total return of the fund, representing an average weight of approximately 9% of the fund’s investments and returning approximately 20% for the reporting period.
Management views and portfolio holdings may have changed since the report date.
Schwab U.S. Equity ETFs | Annual Report9
Performance and Fund Facts as of August 31, 2023
The performance data quoted represents past performance. Past performance does not guarantee future results. Investment returns and principal value of an investment will fluctuate so that an investor’s shares, when sold or redeemed, may be worth more or less than the original cost. Current performance may be lower or higher than the performance data quoted. To obtain performance information current to the most recent month end, please visit www.schwabassetmanagement.com/schwabetfs_prospectus.
Performance of Hypothetical $10,000 Investment (October 11, 2017 – August 31, 2023)1
| | | |
Fund: Schwab 1000 Index ETF (10/11/17) | | | |
| | | |
| | | |
| | | |
| | | |
ETF Category: Morningstar Large Blend3 | | | |
Fund Expense Ratio4: 0.05% |
All total returns on this page assume dividends and distributions were reinvested. Index figures do not include trading and management costs, which would lower performance. Indices are unmanaged and cannot be invested in directly. Performance results less than one year are not annualized.
For index definitions, please see the Glossary.
Shares are bought and sold at market price, which may be higher or lower than the net asset value (NAV). Brokerage commissions will reduce returns.
*
Inception (10/11/17) represents the date that the shares began trading in the secondary market.
1
Performance does not reflect the deduction of taxes that a shareholder would pay on fund distributions or on the redemption or sale of fund shares.
2
ETF performance must be shown based on both a market price and NAV basis. The fund’s per share NAV is the value of one share of the fund. NAV is calculated by taking the fund’s total assets (including the fair value of securities owned), subtracting liabilities, and dividing by the number of shares outstanding. The NAV Return is based on the NAV of the fund, and the Market Price Return is based on the market price per share of the fund. The price used to calculate market return (Market Price) is determined using the Official Closing Price on the primary stock exchange (generally, 4:00 p.m. Eastern time) and may not represent the returns you would receive if shares were traded at other times. NAV is used as a proxy for purposes of calculating Market Price Return on inception date. Market Price and NAV returns assume that dividends and capital gain distributions have been reinvested in the fund at Market Price and NAV, respectively.
3
Source for category information: Morningstar, Inc. The Morningstar Category return represents all passively- and actively-managed ETFs and mutual funds within the category as of the report date.
4
As stated in the prospectus.
10Schwab U.S. Equity ETFs | Annual Report
Performance and Fund Facts as of August 31, 2023 (continued)
| |
Weighted Average Market Cap (millions) | |
Price/Earnings Ratio (P/E) | |
| |
| |
Sector Weightings % of Investments4
Top Equity Holdings % of Net Assets6
Portfolio holdings may have changed since the report date.
An index is a statistical composite of a specified financial market or sector. Unlike the fund, an index does not actually hold a portfolio of securities and its return is not inclusive of trading and management costs incurred by the fund.
Source of Sector Classification: S&P and MSCI.
2
As a result of the Schwab 1000 Index®’s once per year reconstitution and the effects of certain corporate actions, the fund may hold more or less than 1,000 securities.
3
Portfolio turnover rate excludes securities received or delivered from processing of in-kind creations or redemptions.
4
The percentage may differ from the Portfolio Holdings because the above calculation is based on a percentage of total investments, excluding derivatives, whereas the calculation in the Portfolio Holdings is based on a percentage of net assets.
5
Includes the fund’s position(s) in money market mutual funds registered under the Investment Company Act of 1940, as amended.
6
This list is not a recommendation of any security by the investment adviser.
Schwab U.S. Equity ETFs | Annual Report11
Schwab U.S. Large-Cap ETF as of August 31, 2023
The Schwab U.S. Large-Cap ETF’s (the fund) goal is to track as closely as possible, before fees and expenses, the total return of the Dow Jones U.S. Large-Cap Total Stock Market Index (the index). The index includes the large-cap portion of the Dow Jones U.S. Total Stock Market Index actually available to investors in the marketplace. The index includes the components ranked 1-750 by full market capitalization. The index is a float-adjusted market capitalization weighted index. The fund generally will seek to replicate the performance of the index by giving the same weight to a given stock as the index does.
Market Highlights. For the 12-month reporting period ended August 31, 2023, U.S. stocks rose. U.S. stocks were volatile for the first half of the year as inflation remained elevated and the U.S. Federal Reserve (Fed) continued to raise interest rates. Despite these headwinds, as inflation began to ease, U.S. stocks staged a relatively steady upswing through the end of the reporting period. The ongoing war between Russia and Ukraine weighed on the global economy. Among U.S. stocks, small-cap and mid-cap stocks were weaker than large-cap stocks and growth stocks outperformed value stocks. Within the index, the information technology and communication services sectors were the top performers, while the utilities and real estate sectors underperformed.
Performance. During the 12-month reporting period ended August 31, 2023, the fund closely tracked the index. The fund’s market price return was 15.58% and its NAV return was 15.61% (for an explanation of the market price and NAV returns, please refer to footnote 2 on the following page). The index returned 15.62% during the same period. Differences between the return of the fund and the return of the index may be attributable to, among other things, the operational and transactional costs incurred by the fund and not the index.
Contributors and Detractors. The utilities sector detracted the most from the total return of the fund. Utilities stocks represented an average weight of approximately 3% of the fund’s investments and returned approximately -12% for the reporting period. One example from this sector is NextEra Energy, Inc., which provides sustainable energy generation and distribution services. The fund’s holdings of NextEra Energy, Inc. represented an average weight of less than 1% of the fund’s investments and returned approximately -20% for the reporting period.
The real estate sector also detracted from the total return of the fund, representing an average weight of approximately 3% of the fund’s investments and returning approximately -7% for the reporting period.
The information technology sector contributed the most to the total return of the fund. Information technology stocks represented an average weight of approximately 28% of the fund’s investments and returned approximately 31% for the reporting period. One example from this sector is NVIDIA Corp., which designs, develops, and markets three-dimensional (3D) graphics processors and related software. The fund’s holdings of NVIDIA Corp. represented an average weight of approximately 2% of the fund’s investments and returned approximately 227% for the reporting period.
The communication services sector also contributed to the total return of the fund, representing an average weight of approximately 8% of the fund’s investments and returning approximately 24% for the reporting period.
Management views and portfolio holdings may have changed since the report date.
12Schwab U.S. Equity ETFs | Annual Report
Schwab U.S. Large-Cap ETF
Performance and Fund Facts as of August 31, 2023
The performance data quoted represents past performance. Past performance does not guarantee future results. Investment returns and principal value of an investment will fluctuate so that an investor’s shares, when sold or redeemed, may be worth more or less than the original cost. Current performance may be lower or higher than the performance data quoted. To obtain performance information current to the most recent month end, please visit www.schwabassetmanagement.com/schwabetfs_prospectus.
Performance of Hypothetical $10,000 Investment (August 31, 2013 – August 31, 2023)1
Average Annual Total Returns1
| | | |
Fund: Schwab U.S. Large-Cap ETF (11/3/09) | | | |
| | | |
| | | |
Dow Jones U.S. Large-Cap Total Stock Market Index | | | |
ETF Category: Morningstar Large Blend3 | | | |
Fund Expense Ratio4: 0.03% |
All total returns on this page assume dividends and distributions were reinvested. Index figures do not include trading and management costs, which would lower performance. Indices are unmanaged and cannot be invested in directly. Performance results less than one year are not annualized.
For index definitions, please see the Glossary.
Shares are bought and sold at market price, which may be higher or lower than the net asset value (NAV). Brokerage commissions will reduce returns.
Index ownership — Dow Jones® is a registered trademark of Dow Jones Trademark Holdings LLC (Dow Jones). The Dow Jones U.S. Large-Cap Total Stock Market Index is a product of S&P Dow Jones Indices LLC and/or its affiliates, and has been licensed for use by Charles Schwab Investment Management, Inc., dba Schwab Asset Management. The Schwab U.S. Large-Cap ETF is not sponsored, endorsed, sold or promoted by S&P Dow Jones Indices LLC, Dow Jones, or any of their respective affiliates and neither S&P Dow Jones Indices LLC, Dow Jones, nor any of their respective affiliates make any representation regarding the advisability of investing in such product.
1
Performance does not reflect the deduction of taxes that a shareholder would pay on fund distributions or on the redemption or sale of fund shares.
2
ETF performance must be shown based on both a market price and NAV basis. The fund’s per share NAV is the value of one share of the fund. NAV is calculated by taking the fund’s total assets (including the fair value of securities owned), subtracting liabilities, and dividing by the number of shares outstanding. The NAV Return is based on the NAV of the fund, and the Market Price Return is based on the market price per share of the fund. The price used to calculate market return (Market Price) is determined using the Official Closing Price on the primary stock exchange (generally, 4:00 p.m. Eastern time) and may not represent the returns you would receive if shares were traded at other times. NAV is used as a proxy for purposes of calculating Market Price Return on inception date. Market Price and NAV returns assume that dividends and capital gain distributions have been reinvested in the fund at Market Price and NAV, respectively.
3
Source for category information: Morningstar, Inc. The Morningstar Category return represents all passively- and actively-managed ETFs and mutual funds within the category as of the report date.
4
As stated in the prospectus.
Schwab U.S. Equity ETFs | Annual Report13
Schwab U.S. Large-Cap ETF
Performance and Fund Facts as of August 31, 2023 (continued)
| |
Weighted Average Market Cap (millions) | |
Price/Earnings Ratio (P/E) | |
| |
| |
Sector Weightings % of Investments3
Top Equity Holdings % of Net Assets5
Portfolio holdings may have changed since the report date.
An index is a statistical composite of a specified financial market or sector. Unlike the fund, an index does not actually hold a portfolio of securities and its return is not inclusive of trading and management costs incurred by the fund.
Source of Sector Classification: S&P and MSCI.
2
Portfolio turnover rate excludes securities received or delivered from processing of in-kind creations or redemptions.
3
The percentage may differ from the Portfolio Holdings because the above calculation is based on a percentage of total investments, excluding derivatives, whereas the calculation in the Portfolio Holdings is based on a percentage of net assets.
4
Includes the fund’s position(s) in money market mutual funds registered under the Investment Company Act of 1940, as amended.
5
This list is not a recommendation of any security by the investment adviser.
14Schwab U.S. Equity ETFs | Annual Report
Schwab U.S. Large-Cap Growth ETF as of August 31, 2023
The Schwab U.S. Large-Cap Growth ETF’s (the fund) goal is to track as closely as possible, before fees and expenses, the total return of the Dow Jones U.S. Large-Cap Growth Total Stock Market Index (the index). The index includes the large-cap growth portion of the Dow Jones U.S. Total Stock Market Index actually available to investors in the marketplace. The index includes the components ranked 1-750 by full market capitalization and that are classified as “growth” based on a number of factors. The index is a float-adjusted market capitalization weighted index. The fund generally will seek to replicate the performance of the index by giving the same weight to a given stock as the index does.
Market Highlights. For the 12-month reporting period ended August 31, 2023, U.S. stocks rose. U.S. stocks were volatile for the first half of the year as inflation remained elevated and the U.S. Federal Reserve (Fed) continued to raise interest rates. Despite these headwinds, as inflation began to ease, U.S. stocks staged a relatively steady upswing through the end of the reporting period. The ongoing war between Russia and Ukraine weighed on the global economy. Among U.S. stocks, small-cap and mid-cap stocks were weaker than large-cap stocks and growth stocks outperformed value stocks. Within the index, the communication services and industrials sectors were the top performers, while the real estate and consumer staples sectors underperformed by comparison.
Performance. During the 12-month reporting period ended August 31, 2023, the fund closely tracked the index. The fund’s market price return was 24.42% and its NAV return was 24.41% (for an explanation of the market price and NAV returns, please refer to footnote 2 on the following page). The index returned 24.45% during the same period. Differences between the return of the fund and the return of the index may be attributable to, among other things, the operational and transactional costs incurred by the fund and not the index.
Contributors and Detractors. The consumer discretionary sector detracted the most from the total return of the fund. Consumer discretionary stocks represented an average weight of approximately 12% of the fund’s investments and returned approximately 8% for the reporting period. One example from this sector is Tesla, Inc., a multinational automotive and clean energy company. The fund’s holdings of Tesla, Inc. represented an average weight of approximately 3% of the fund’s investments and returned approximately -6% for the reporting period.
The real estate sector also detracted from the total return of the fund, representing an average weight of approximately 1% of the fund’s investments and returning approximately -11% for the reporting period.
The information technology sector contributed the most to the total return of the fund. Information technology stocks represented an average weight of approximately 48% of the fund’s investments and returned approximately 34% for the reporting period. One example from this sector is NVIDIA Corp, which designs, develops, and markets three-dimensional (3D) graphics processors and related software. The fund’s holdings of NVIDIA Corp. represented an average weight of approximately 4% of the fund’s investments and returned approximately 227% for the reporting period.
The communication services sector also contributed to the total return of the fund, representing an average weight of approximately 12% of the fund’s investments and returning approximately 37% for the reporting period.
Management views and portfolio holdings may have changed since the report date.
Schwab U.S. Equity ETFs | Annual Report15
Schwab U.S. Large-Cap Growth ETF
Performance and Fund Facts as of August 31, 2023
The performance data quoted represents past performance. Past performance does not guarantee future results. Investment returns and principal value of an investment will fluctuate so that an investor’s shares, when sold or redeemed, may be worth more or less than the original cost. Current performance may be lower or higher than the performance data quoted. To obtain performance information current to the most recent month end, please visit www.schwabassetmanagement.com/schwabetfs_prospectus.
Performance of Hypothetical $10,000 Investment (August 31, 2013 – August 31, 2023)1
Average Annual Total Returns1
| | | |
Fund: Schwab U.S. Large-Cap Growth ETF (12/11/09) | | | |
| | | |
| | | |
Dow Jones U.S. Large-Cap Growth Total Stock Market Index | | | |
ETF Category: Morningstar Large Growth3 | | | |
Fund Expense Ratio4: 0.04% |
All total returns on this page assume dividends and distributions were reinvested. Index figures do not include trading and management costs, which would lower performance. Indices are unmanaged and cannot be invested in directly. Performance results less than one year are not annualized.
For index definitions, please see the Glossary.
Shares are bought and sold at market price, which may be higher or lower than the net asset value (NAV). Brokerage commissions will reduce returns.
Index ownership — Dow Jones® is a registered trademark of Dow Jones Trademark Holdings LLC (Dow Jones). The Dow Jones U.S. Large-Cap Growth Total Stock Market Index is a product of S&P Dow Jones Indices LLC and/or its affiliates, and has been licensed for use by Charles Schwab Investment Management, Inc., dba Schwab Asset Management. The Schwab U.S. Large-Cap Growth ETF is not sponsored, endorsed, sold or promoted by S&P Dow Jones Indices LLC, Dow Jones, or any of their respective affiliates and neither S&P Dow Jones Indices LLC, Dow Jones, nor any of their respective affiliates make any representation regarding the advisability of investing in such product.
1
Performance does not reflect the deduction of taxes that a shareholder would pay on fund distributions or on the redemption or sale of fund shares.
2
ETF performance must be shown based on both a market price and NAV basis. The fund’s per share NAV is the value of one share of the fund. NAV is calculated by taking the fund’s total assets (including the fair value of securities owned), subtracting liabilities, and dividing by the number of shares outstanding. The NAV Return is based on the NAV of the fund, and the Market Price Return is based on the market price per share of the fund. The price used to calculate market return (Market Price) is determined using the Official Closing Price on the primary stock exchange (generally, 4:00 p.m. Eastern time) and may not represent the returns you would receive if shares were traded at other times. NAV is used as a proxy for purposes of calculating Market Price Return on inception date. Market Price and NAV returns assume that dividends and capital gain distributions have been reinvested in the fund at Market Price and NAV, respectively.
3
Source for category information: Morningstar, Inc. The Morningstar Category return represents all passively- and actively-managed ETFs and mutual funds within the category as of the report date.
4
As stated in the prospectus.
16Schwab U.S. Equity ETFs | Annual Report
Schwab U.S. Large-Cap Growth ETF
Performance and Fund Facts as of August 31, 2023 (continued)
| |
Weighted Average Market Cap (millions) | |
Price/Earnings Ratio (P/E) | |
| |
| |
Sector Weightings % of Investments3
Top Equity Holdings % of Net Assets5
Portfolio holdings may have changed since the report date.
An index is a statistical composite of a specified financial market or sector. Unlike the fund, an index does not actually hold a portfolio of securities and its return is not inclusive of trading and management costs incurred by the fund.
Source of Sector Classification: S&P and MSCI.
2
Portfolio turnover rate excludes securities received or delivered from processing of in-kind creations or redemptions.
3
The percentage may differ from the Portfolio Holdings because the above calculation is based on a percentage of total investments, excluding derivatives, whereas the calculation in the Portfolio Holdings is based on a percentage of net assets.
4
Includes the fund’s position(s) in money market mutual funds registered under the Investment Company Act of 1940, as amended.
5
This list is not a recommendation of any security by the investment adviser.
Schwab U.S. Equity ETFs | Annual Report17
Schwab U.S. Large-Cap Value ETF as of August 31, 2023
The Schwab U.S. Large-Cap Value ETF’s (the fund) goal is to track as closely as possible, before fees and expenses, the total return of the Dow Jones U.S. Large-Cap Value Total Stock Market Index (the index). The index includes the large-cap value portion of the Dow Jones U.S. Total Stock Market Index actually available to investors in the marketplace. The index includes the components ranked 1-750 by full market capitalization and that are classified as “value” based on a number of factors. The index is a float-adjusted market capitalization weighted index. The fund generally will seek to replicate the performance of the index by giving the same weight to a given stock as the index does.
Market Highlights. For the 12-month reporting period ended August 31, 2023, U.S. stocks rose. U.S. stocks were volatile for the first half of the year as inflation remained elevated and the U.S. Federal Reserve (Fed) continued to raise interest rates. Despite these headwinds, as inflation began to ease, U.S. stocks staged a relatively steady upswing through the end of the reporting period. The ongoing war between Russia and Ukraine weighed on the global economy. Among U.S. stocks, small-cap and mid-cap stocks were weaker than large-cap stocks and growth stocks outperformed value stocks. Within the index, the industrials and information technology sectors were the top performers, while the utilities and real estate sectors underperformed.
Performance. During the 12-month reporting period ended August 31, 2023, the fund closely tracked the index. The fund’s market price return was 7.58% and its NAV return was 7.60% (for an explanation of the market price and NAV returns, please refer to footnote 2 on the following page). The index returned 7.62% during the same period. Differences between the return of the fund and the return of the index may be attributable to, among other things, the operational and transactional costs incurred by the fund and not the index.
Contributors and Detractors. The utilities sector detracted the most from the total return of the fund. Utilities stocks represented an average weight of approximately 5% of the fund’s investments and returned approximately -13% for the reporting period. One example from this sector is NextEra Energy, Inc., which provides sustainable energy generation and distribution services. The fund’s holdings of NextEra Energy, Inc. represented an average weight of less than 1% of the fund’s investments and returned approximately -20% for the reporting period.
The real estate sector also detracted from the total return of the fund, representing an average weight of approximately 4% of the fund’s investments and returning approximately -6% for the reporting period.
The industrials sector contributed the most to the total return of the fund. Industrials stocks represented an average weight of approximately 13% of the fund’s investments and returned approximately 17% for the reporting period. One example from this sector is Caterpillar, Inc., which designs, manufactures, and markets construction, mining, and forestry machinery. The fund’s holdings of Caterpillar, Inc. represented an average weight of less than 1% of the fund’s investments and returned approximately 56% for the reporting period.
The information technology sector also contributed to the total return of the fund, representing an average weight of approximately 11% of the fund’s investments and returning approximately 17% for the reporting period.
Management views and portfolio holdings may have changed since the report date.
18Schwab U.S. Equity ETFs | Annual Report
Schwab U.S. Large-Cap Value ETF
Performance and Fund Facts as of August 31, 2023
The performance data quoted represents past performance. Past performance does not guarantee future results. Investment returns and principal value of an investment will fluctuate so that an investor’s shares, when sold or redeemed, may be worth more or less than the original cost. Current performance may be lower or higher than the performance data quoted. To obtain performance information current to the most recent month end, please visit www.schwabassetmanagement.com/schwabetfs_prospectus.
Performance of Hypothetical $10,000 Investment (August 31, 2013 – August 31, 2023)1
Average Annual Total Returns1
| | | |
Fund: Schwab U.S. Large-Cap Value ETF (12/11/09) | | | |
| | | |
| | | |
Dow Jones U.S. Large-Cap Value Total Stock Market Index | | | |
ETF Category: Morningstar Large Value3 | | | |
Fund Expense Ratio4: 0.04% |
All total returns on this page assume dividends and distributions were reinvested. Index figures do not include trading and management costs, which would lower performance. Indices are unmanaged and cannot be invested in directly. Performance results less than one year are not annualized.
For index definitions, please see the Glossary.
Shares are bought and sold at market price, which may be higher or lower than the net asset value (NAV). Brokerage commissions will reduce returns.
Index ownership — Dow Jones® is a registered trademark of Dow Jones Trademark Holdings LLC (Dow Jones). The Dow Jones U.S. Large-Cap Value Total Stock Market Index is a product of S&P Dow Jones Indices LLC and/or its affiliates, and has been licensed for use by Charles Schwab Investment Management, Inc., dba Schwab Asset Management. The Schwab U.S. Large-Cap Value ETF is not sponsored, endorsed, sold or promoted by S&P Dow Jones Indices LLC, Dow Jones, or any of their respective affiliates and neither S&P Dow Jones Indices LLC, Dow Jones, nor any of their respective affiliates make any representation regarding the advisability of investing in such product.
1
Performance does not reflect the deduction of taxes that a shareholder would pay on fund distributions or on the redemption or sale of fund shares.
2
ETF performance must be shown based on both a market price and NAV basis. The fund’s per share NAV is the value of one share of the fund. NAV is calculated by taking the fund’s total assets (including the fair value of securities owned), subtracting liabilities, and dividing by the number of shares outstanding. The NAV Return is based on the NAV of the fund, and the Market Price Return is based on the market price per share of the fund. The price used to calculate market return (Market Price) is determined using the Official Closing Price on the primary stock exchange (generally, 4:00 p.m. Eastern time) and may not represent the returns you would receive if shares were traded at other times. NAV is used as a proxy for purposes of calculating Market Price Return on inception date. Market Price and NAV returns assume that dividends and capital gain distributions have been reinvested in the fund at Market Price and NAV, respectively.
3
Source for category information: Morningstar, Inc. The Morningstar Category return represents all passively- and actively-managed ETFs and mutual funds within the category as of the report date.
4
As stated in the prospectus.
Schwab U.S. Equity ETFs | Annual Report19
Schwab U.S. Large-Cap Value ETF
Performance and Fund Facts as of August 31, 2023 (continued)
| |
Weighted Average Market Cap (millions) | |
Price/Earnings Ratio (P/E) | |
| |
| |
Sector Weightings % of Investments3
Top Equity Holdings % of Net Assets5
Portfolio holdings may have changed since the report date.
An index is a statistical composite of a specified financial market or sector. Unlike the fund, an index does not actually hold a portfolio of securities and its return is not inclusive of trading and management costs incurred by the fund.
Source of Sector Classification: S&P and MSCI.
2
Portfolio turnover rate excludes securities received or delivered from processing of in-kind creations or redemptions.
3
The percentage may differ from the Portfolio Holdings because the above calculation is based on a percentage of total investments, excluding derivatives, whereas the calculation in the Portfolio Holdings is based on a percentage of net assets.
4
Includes the fund’s position(s) in money market mutual funds registered under the Investment Company Act of 1940, as amended.
5
This list is not a recommendation of any security by the investment adviser.
20Schwab U.S. Equity ETFs | Annual Report
Schwab U.S. Mid-Cap ETF as of August 31, 2023
The Schwab U.S. Mid-Cap ETF’s (the fund) goal is to track as closely as possible, before fees and expenses, the total return of the Dow Jones U.S. Mid-Cap Total Stock Market Index (the index). The index includes the mid-cap portion of the Dow Jones U.S. Total Stock Market Index actually available to investors in the marketplace. The index includes the components ranked 501-1,000 by full market capitalization. The index is a float-adjusted market capitalization weighted index. The fund generally will seek to replicate the performance of the index by giving the same weight to a given stock as the index does.
Market Highlights. For the 12-month reporting period ended August 31, 2023, U.S. stocks rose. U.S. stocks were volatile for the first half of the year as inflation remained elevated and the U.S. Federal Reserve (Fed) continued to raise interest rates. Despite these headwinds, as inflation began to ease, U.S. stocks staged a relatively steady upswing through the end of the reporting period. The ongoing war between Russia and Ukraine weighed on the global economy. Among U.S. stocks, small-cap and mid-cap stocks were weaker than large-cap stocks and growth stocks outperformed value stocks. Within the index, the industrials and consumer discretionary sectors were the top performers, while the utilities and communication services sectors underperformed.
Performance. During the 12-month reporting period ended August 31, 2023, the fund closely tracked the index. The fund’s market price return was 8.39% and its NAV return was 8.45% (for an explanation of the market price and NAV returns, please refer to footnote 2 on the following page). The index returned 8.41% during the same period.
Contributors and Detractors. The industrials sector contributed the most to the total return of the fund. Industrials stocks represented an average weight of approximately 19% of the fund’s investments and returned approximately 23% for the reporting period. One example from this sector is Builders FirstSource, Inc., which manufactures and distributes building products to professional homebuilders. The fund’s holdings of Builders FirstSource, Inc. represented an average weight of less than 1% of the fund’s investments and returned approximately 147% for the reporting period.
The consumer discretionary sector also contributed to the total return of the fund, representing an average weight of approximately 13% of the fund’s investments and returning approximately 18% for the reporting period.
The utilities sector detracted the most from the total return of the fund. Utilities stocks represented an average weight of approximately 4% of the fund’s investments and returned approximately -12% for the reporting period. One example from this sector is The AES Corp., which acquires, develops, owns, and operates renewable energy power plants. The fund’s holdings of The AES Corp. represented an average weight of less than 1% of the fund’s investments and returned approximately -28% for the reporting period.
The communication services sector also detracted from the total return of the fund, representing an average weight of approximately 3% of the fund’s investments and returning approximately -10% for the reporting period.
Management views and portfolio holdings may have changed since the report date.
Schwab U.S. Equity ETFs | Annual Report21
Performance and Fund Facts as of August 31, 2023
The performance data quoted represents past performance. Past performance does not guarantee future results. Investment returns and principal value of an investment will fluctuate so that an investor’s shares, when sold or redeemed, may be worth more or less than the original cost. Current performance may be lower or higher than the performance data quoted. To obtain performance information current to the most recent month end, please visit www.schwabassetmanagement.com/schwabetfs_prospectus.
Performance of Hypothetical $10,000 Investment (August 31, 2013 – August 31, 2023)1
Average Annual Total Returns1
| | | |
Fund: Schwab U.S. Mid-Cap ETF (1/13/11) | | | |
| | | |
| | | |
Dow Jones U.S. Mid-Cap Total Stock Market Index | | | |
ETF Category: Morningstar Mid-Cap Blend3 | | | |
Fund Expense Ratio4: 0.04% |
All total returns on this page assume dividends and distributions were reinvested. Index figures do not include trading and management costs, which would lower performance. Indices are unmanaged and cannot be invested in directly. Performance results less than one year are not annualized.
For index definitions, please see the Glossary.
Shares are bought and sold at market price, which may be higher or lower than the net asset value (NAV). Brokerage commissions will reduce returns.
Index ownership — Dow Jones® is a registered trademark of Dow Jones Trademark Holdings LLC (Dow Jones). The Dow Jones U.S. Mid-Cap Total Stock Market Index is a product of S&P Dow Jones Indices LLC and/or its affiliates, and has been licensed for use by Charles Schwab Investment Management, Inc., dba Schwab Asset Management. The Schwab U.S. Mid-Cap ETF is not sponsored, endorsed, sold or promoted by S&P Dow Jones Indices LLC, Dow Jones, or any of their respective affiliates and neither S&P Dow Jones Indices LLC, Dow Jones, nor any of their respective affiliates make any representation regarding the advisability of investing in such product.
1
Performance does not reflect the deduction of taxes that a shareholder would pay on fund distributions or on the redemption or sale of fund shares.
2
ETF performance must be shown based on both a market price and NAV basis. The fund’s per share NAV is the value of one share of the fund. NAV is calculated by taking the fund’s total assets (including the fair value of securities owned), subtracting liabilities, and dividing by the number of shares outstanding. The NAV Return is based on the NAV of the fund, and the Market Price Return is based on the market price per share of the fund. The price used to calculate market return (Market Price) is determined using the Official Closing Price on the primary stock exchange (generally, 4:00 p.m. Eastern time) and may not represent the returns you would receive if shares were traded at other times. NAV is used as a proxy for purposes of calculating Market Price Return on inception date. Market Price and NAV returns assume that dividends and capital gain distributions have been reinvested in the fund at Market Price and NAV, respectively.
3
Source for category information: Morningstar, Inc. The Morningstar Category return represents all passively- and actively-managed ETFs and mutual funds within the category as of the report date.
4
As stated in the prospectus.
22Schwab U.S. Equity ETFs | Annual Report
Performance and Fund Facts as of August 31, 2023 (continued)
| |
Weighted Average Market Cap (millions) | |
Price/Earnings Ratio (P/E) | |
| |
| |
Sector Weightings % of Investments3
Top Equity Holdings % of Net Assets5
Portfolio holdings may have changed since the report date.
An index is a statistical composite of a specified financial market or sector. Unlike the fund, an index does not actually hold a portfolio of securities and its return is not inclusive of trading and management costs incurred by the fund.
Source of Sector Classification: S&P and MSCI.
2
Portfolio turnover rate excludes securities received or delivered from processing of in-kind creations or redemptions.
3
The percentage may differ from the Portfolio Holdings because the above calculation is based on a percentage of total investments, excluding derivatives, whereas the calculation in the Portfolio Holdings is based on a percentage of net assets.
4
Includes the fund’s position(s) in money market mutual funds registered under the Investment Company Act of 1940, as amended.
5
This list is not a recommendation of any security by the investment adviser.
Schwab U.S. Equity ETFs | Annual Report23
Schwab U.S. Small-Cap ETF as of August 31, 2023
The Schwab U.S. Small-Cap ETF’s (the fund) goal is to track as closely as possible, before fees and expenses, the total return of the Dow Jones U.S. Small-Cap Total Stock Market Index (the index). The index includes the small-cap portion of the Dow Jones U.S. Total Stock Market Index actually available to investors in the marketplace. The index includes the components ranked 751-2,500 by full market capitalization. The index is a float-adjusted market capitalization weighted index. The fund generally will seek to replicate the performance of the index by giving the same weight to a given stock as the index does.
Market Highlights. For the 12-month reporting period ended August 31, 2023, U.S. stocks rose. U.S. stocks were volatile for the first half of the year as inflation remained elevated and the U.S. Federal Reserve (Fed) continued to raise interest rates. Despite these headwinds, as inflation began to ease, U.S. stocks staged a relatively steady upswing through the end of the reporting period. The ongoing war between Russia and Ukraine weighed on the global economy. Among U.S. stocks, small-cap and mid-cap stocks were weaker than large-cap stocks and growth stocks outperformed value stocks. Within the index, the industrials and energy sectors were the top performers, while the utilities and health care sectors underperformed.
Performance. During the 12-month reporting period ended August 31, 2023, the fund closely tracked the index. The fund’s market price return was 6.64% and its NAV return was 6.69% (for an explanation of the market price and NAV returns, please refer to footnote 2 on the following page). The index returned 6.57% during the same period.
Contributors and Detractors. The industrials sector contributed the most to the total return of the fund. Industrials stocks represented an average weight of approximately 18% of the fund’s investments and returned approximately 22% for the reporting period. One example from this sector is Vertiv Holdings Co., which, through is subsidiaries, provides power systems, heat rejection, power transfer switches, monitoring equipment, power control, and holistic data center cooling solutions. The fund’s holdings of Vertiv Holdings Co. represented an average weight of less than 1% of the fund’s investments and returned approximately 242% for the reporting period.
The information technology sector also contributed to the total return of the fund, representing an average weight of approximately 14% of the fund’s investments and returning approximately 16% for the reporting period.
The health care sector detracted the most from the total return of the fund. Health care stocks represented an average weight of approximately 14% of the fund’s investments and returned approximately -8% for the reporting period. One example from this sector is STAAR Surgical Co., which develops, manufactures, and markets high margin visual implants. The fund’s holdings of STAAR Surgical Co. represented an average weight of less than 1% of the fund’s investments and returned approximately -54% for the reporting period.
The financials sector also detracted from the total return of the fund, representing an average weight of approximately 16% of the fund’s investments and returning approximately -2% for the reporting period.
Management views and portfolio holdings may have changed since the report date.
24Schwab U.S. Equity ETFs | Annual Report
Schwab U.S. Small-Cap ETF
Performance and Fund Facts as of August 31, 2023
The performance data quoted represents past performance. Past performance does not guarantee future results. Investment returns and principal value of an investment will fluctuate so that an investor’s shares, when sold or redeemed, may be worth more or less than the original cost. Current performance may be lower or higher than the performance data quoted. To obtain performance information current to the most recent month end, please visit www.schwabassetmanagement.com/schwabetfs_prospectus.
Performance of Hypothetical $10,000 Investment (August 31, 2013 – August 31, 2023)1
Average Annual Total Returns1
| | | |
Fund: Schwab U.S. Small-Cap ETF (11/3/09) | | | |
| | | |
| | | |
Dow Jones U.S. Small-Cap Total Stock Market Index | | | |
ETF Category: Morningstar Small Blend3 | | | |
Fund Expense Ratio4: 0.04% |
All total returns on this page assume dividends and distributions were reinvested. Index figures do not include trading and management costs, which would lower performance. Indices are unmanaged and cannot be invested in directly. Performance results less than one year are not annualized.
For index definitions, please see the Glossary.
Shares are bought and sold at market price, which may be higher or lower than the net asset value (NAV). Brokerage commissions will reduce returns.
Small-company stocks may be subject to greater volatility than many other asset classes.
Index ownership — Dow Jones® is a registered trademark of Dow Jones Trademark Holdings LLC (Dow Jones). The Dow Jones U.S. Small-Cap Total Stock Market Index is a product of S&P Dow Jones Indices LLC and/or its affiliates, and has been licensed for use by Charles Schwab Investment Management, Inc., dba Schwab Asset Management. The Schwab U.S. Small-Cap ETF is not sponsored, endorsed, sold or promoted by S&P Dow Jones Indices LLC, Dow Jones, or any of their respective affiliates and neither S&P Dow Jones Indices LLC, Dow Jones, nor any of their respective affiliates make any representation regarding the advisability of investing in such product.
1
Performance does not reflect the deduction of taxes that a shareholder would pay on fund distributions or on the redemption or sale of fund shares.
2
ETF performance must be shown based on both a market price and NAV basis. The fund’s per share NAV is the value of one share of the fund. NAV is calculated by taking the fund’s total assets (including the fair value of securities owned), subtracting liabilities, and dividing by the number of shares outstanding. The NAV Return is based on the NAV of the fund, and the Market Price Return is based on the market price per share of the fund. The price used to calculate market return (Market Price) is determined using the Official Closing Price on the primary stock exchange (generally, 4:00 p.m. Eastern time) and may not represent the returns you would receive if shares were traded at other times. NAV is used as a proxy for purposes of calculating Market Price Return on inception date. Market Price and NAV returns assume that dividends and capital gain distributions have been reinvested in the fund at Market Price and NAV, respectively.
3
Source for category information: Morningstar, Inc. The Morningstar Category return represents all passively- and actively-managed ETFs and mutual funds within the category as of the report date.
4
As stated in the prospectus.
Schwab U.S. Equity ETFs | Annual Report25
Schwab U.S. Small-Cap ETF
Performance and Fund Facts as of August 31, 2023 (continued)
| |
Weighted Average Market Cap (millions) | |
Price/Earnings Ratio (P/E) | |
| |
| |
Sector Weightings % of Investments3
Top Equity Holdings % of Net Assets5
Portfolio holdings may have changed since the report date.
An index is a statistical composite of a specified financial market or sector. Unlike the fund, an index does not actually hold a portfolio of securities and its return is not inclusive of trading and management costs incurred by the fund.
Source of Sector Classification: S&P and MSCI.
2
Portfolio turnover rate excludes securities received or delivered from processing of in-kind creations or redemptions.
3
The percentage may differ from the Portfolio Holdings because the above calculation is based on a percentage of total investments, excluding derivatives, whereas the calculation in the Portfolio Holdings is based on a percentage of net assets.
4
Includes the fund’s position(s) in money market mutual funds registered under the Investment Company Act of 1940, as amended.
5
This list is not a recommendation of any security by the investment adviser.
26Schwab U.S. Equity ETFs | Annual Report
Schwab U.S. Dividend Equity ETF as of August 31, 2023
The Schwab U.S. Dividend Equity ETF’s (the fund) goal is to track as closely as possible, before fees and expenses, the total return of the Dow Jones U.S. Dividend 100TM Index (the index). The 100-component index is a subset of the Dow Jones U.S. Broad Market Index, excluding real estate investment trusts (REITs), master limited partnerships, preferred stocks, and convertibles. The index is modified market capitalization weighted. The fund generally will seek to replicate the performance of the index by giving the same weight to a given stock as the index does.
Market Highlights. For the 12-month reporting period ended August 31, 2023, U.S. stocks rose. U.S. stocks were volatile for the first half of the year as inflation remained elevated and the U.S. Federal Reserve (Fed) continued to raise interest rates. Despite these headwinds, as inflation began to ease, U.S. stocks staged a relatively steady upswing through the end of the reporting period. The ongoing war between Russia and Ukraine weighed on the global economy. Among U.S. stocks, small-cap and mid-cap stocks were weaker than large-cap stocks and growth stocks outperformed value stocks. Within the index, the information technology and energy sectors were the top performers, while the utilities and communication services sectors underperformed.
Performance. During the 12-month reporting period ended August 31, 2023, the fund closely tracked the index. The fund’s market price return was 6.72% and its NAV return was 6.75% (for an explanation of the market price and NAV returns, please refer to footnote 2 on the following page). The index returned 6.82% during the same period. Differences between the return of the fund and the return of the index may be attributable to, among other things, the operational and transactional costs incurred by the fund and not the index.
Contributors and Detractors. The financials sector detracted the most from the total return of the fund. Financials stocks represented an average weight of approximately 18% of the fund’s investments and returned approximately -3% for the reporting period. One example from this sector is U.S. Bancorp, a diversified financial services company. The fund’s holdings of U.S. Bancorp represented approximately 2% of the fund’s investments and returned approximately -16% for the reporting period.
The communication services sector also detracted from the total return of the fund, representing an average weight of approximately 5% of the fund’s investments and returning approximately -7% for the reporting period.
The information technology sector contributed the most to the total return of the fund. Information technology stocks represented an average weight of approximately 19% of the fund’s investments and returned approximately 28% for the reporting period. One example from this sector is Broadcom, Inc., which provides semiconductors products. The fund’s holdings of Broadcom, Inc. represented an average weight of approximately 4% of the fund’s investments and returned approximately 90% for the reporting period.
The energy sector also contributed to the total return of the fund, representing an average weight of approximately 7% of the fund’s investments and returning approximately 10% for the reporting period.
Management views and portfolio holdings may have changed since the report date.
Schwab U.S. Equity ETFs | Annual Report27
Schwab U.S. Dividend Equity ETF
Performance and Fund Facts as of August 31, 2023
The performance data quoted represents past performance. Past performance does not guarantee future results. Investment returns and principal value of an investment will fluctuate so that an investor’s shares, when sold or redeemed, may be worth more or less than the original cost. Current performance may be lower or higher than the performance data quoted. To obtain performance information current to the most recent month end, please visit www.schwabassetmanagement.com/schwabetfs_prospectus.
Performance of Hypothetical $10,000 Investment (August 31, 2013 – August 31, 2023)1
Average Annual Total Returns1
| | | |
Fund: Schwab U.S. Dividend Equity ETF (10/20/11) | | | |
| | | |
| | | |
Dow Jones U.S. Dividend 100TM Index | | | |
ETF Category: Morningstar Large Value3 | | | |
Fund Expense Ratio4: 0.06% |
All total returns on this page assume dividends and distributions were reinvested. Index figures do not include trading and management costs, which would lower performance. Indices are unmanaged and cannot be invested in directly. Performance results less than one year are not annualized.
For index definitions, please see the Glossary.
Shares are bought and sold at market price, which may be higher or lower than the net asset value (NAV). Brokerage commissions will reduce returns.
The fund may underperform other funds that do not limit their investment to dividend paying stocks. Stocks held by the fund may reduce or stop paying dividends, affecting the fund’s ability to generate income. Diversification strategies do not ensure a profit and do not protect against losses in declining markets.
Index ownership — Dow Jones® is a registered trademark of Dow Jones Trademark Holdings LLC (Dow Jones). The Dow Jones U.S. Dividend 100TM Index is a product of S&P Dow Jones Indices LLC and/or its affiliates, and has been licensed for use by Charles Schwab Investment Management, Inc., dba Schwab Asset Management. The Schwab U.S. Dividend Equity ETF is not sponsored, endorsed, sold or promoted by S&P Dow Jones Indices LLC, Dow Jones, or any of their respective affiliates and neither S&P Dow Jones Indices LLC, Dow Jones, nor any of their respective affiliates make any representation regarding the advisability of investing in such product.
1
Performance does not reflect the deduction of taxes that a shareholder would pay on fund distributions or on the redemption or sale of fund shares.
2
ETF performance must be shown based on both a market price and NAV basis. The fund’s per share NAV is the value of one share of the fund. NAV is calculated by taking the fund’s total assets (including the fair value of securities owned), subtracting liabilities, and dividing by the number of shares outstanding. The NAV Return is based on the NAV of the fund, and the Market Price Return is based on the market price per share of the fund. The price used to calculate market return (Market Price) is determined using the Official Closing Price on the primary stock exchange (generally, 4:00 p.m. Eastern time) and may not represent the returns you would receive if shares were traded at other times. NAV is used as a proxy for purposes of calculating Market Price Return on inception date. Market Price and NAV returns assume that dividends and capital gain distributions have been reinvested in the fund at Market Price and NAV, respectively.
3
Source for category information: Morningstar, Inc. The Morningstar Category return represents all passively- and actively-managed ETFs and mutual funds within the category as of the report date.
4
As stated in the prospectus.
28Schwab U.S. Equity ETFs | Annual Report
Schwab U.S. Dividend Equity ETF
Performance and Fund Facts as of August 31, 2023 (continued)
| |
Weighted Average Market Cap (millions) | |
Price/Earnings Ratio (P/E) | |
| |
| |
Sector Weightings % of Investments3
Top Equity Holdings % of Net Assets5
Portfolio holdings may have changed since the report date.
An index is a statistical composite of a specified financial market or sector. Unlike the fund, an index does not actually hold a portfolio of securities and its return is not inclusive of trading and management costs incurred by the fund.
Source of Sector Classification: S&P and MSCI.
2
Portfolio turnover rate excludes securities received or delivered from processing of in-kind creations or redemptions.
3
The percentage may differ from the Portfolio Holdings because the above calculation is based on a percentage of total investments, excluding derivatives, whereas the calculation in the Portfolio Holdings is based on a percentage of net assets.
4
Includes the fund’s position(s) in money market mutual funds registered under the Investment Company Act of 1940, as amended.
5
This list is not a recommendation of any security by the investment adviser.
Schwab U.S. Equity ETFs | Annual Report29
Fund Expenses (Unaudited)
Examples for a $1,000 Investment
As a fund shareholder, you may incur two types of costs: (1) transaction costs, including brokerage commissions on purchases and sales of fund shares; and, (2) ongoing costs, including management fees.
The expense examples below are intended to help you understand your ongoing cost (in dollars) of investing in a fund and to compare this cost with the ongoing cost of investing in other mutual funds. These examples are based on an investment of $1,000 invested for six months beginning March 1, 2023 and held through August 31, 2023.
Actual Return lines in the table below provide information about actual account values and actual expenses. You may use this information, together with the amount you invested, to estimate the expenses that you paid over the period. To do so, simply divide your account value by $1,000 (for example, an $8,600 account value ÷ $1,000 = 8.6), then multiply the result by the number given for your fund under the heading entitled “Expenses Paid During Period.”
Hypothetical Return lines in the table below provide information about hypothetical account values and hypothetical expenses based on a fund’s actual expense ratio and an assumed return of 5% per year before expenses. Because the return used is not an actual return, it may not be used to estimate the actual ending account value or expenses you paid for the period.
You may use this information to compare the ongoing costs of investing in a fund and other funds. To do so, compare this 5% hypothetical example with the 5% hypothetical examples that appear in the shareholder reports of the other funds.
Please note that the expenses shown in the table are meant to highlight your ongoing costs only and do not reflect any transactional costs, including any brokerage commissions you may pay when purchasing or selling shares of a fund. Therefore, the hypothetical return lines of the table are useful in comparing ongoing costs only and will not help you determine the relative total costs of owning different funds. In addition, if these transactional costs were included, your costs would have been higher.
| | BEGINNING
ACCOUNT VALUE
AT 3/1/23 | ENDING
ACCOUNT VALUE
(NET OF EXPENSES)
AT 8/31/23 | EXPENSES PAID
DURING PERIOD
|
Schwab U.S. Broad Market ETF | | | | |
| | | | |
| | | | |
| | | | |
| | | | |
| | | | |
Schwab U.S. Large-Cap ETF | | | | |
| | | | |
| | | | |
Schwab U.S. Large-Cap Growth ETF | | | | |
| | | | |
| | | | |
Schwab U.S. Large-Cap Value ETF | | | | |
| | | | |
| | | | |
| | | | |
| | | | |
| | | | |
Schwab U.S. Small-Cap ETF | | | | |
| | | | |
| | | | |
Schwab U.S. Dividend Equity ETF | | | | |
| | | | |
| | | | |
| Based on the most recent six-month expense ratio. |
| Expenses for each fund are equal to its annualized expense ratio, multiplied by the average account value over the period, multiplied by 184 days in the period, and divided by 365 days in the fiscal year. |
30Schwab U.S. Equity ETFs | Annual Report
Schwab U.S. Broad Market ETF
Financial Statements
| | | | | | |
|
Net asset value at beginning of period | | | | | | |
Income (loss) from investment operations: | | | | | | |
Net investment income (loss)2 | | | | | | |
Net realized and unrealized gains (losses) | | | | | | |
Total from investment operations | | | | | | |
| | | | | | |
Distributions from net investment income | | | | | | |
Net asset value at end of period | | | | | | |
| | | | | | |
|
Ratios to average net assets: | | | | | | |
| | | | | | |
Net investment income (loss) | | | | | | |
| | | | | | |
Net assets, end of period (x 1,000,000) | | | | | | |
| Per-Share Data has been retroactively adjusted to reflect a 2-for-1 share split effective after market close on March 10, 2022 (see financial note 12 for additional information). |
| Calculated based on the average shares outstanding during the period. |
| Ratio includes less than 0.005% of non-routine proxy expenses. |
| Portfolio turnover rate excludes securities received or delivered from processing of in-kind creations or redemptions. |
Schwab U.S. Equity ETFs | Annual Report31
Schwab U.S. Broad Market ETF
Portfolio Holdings as of August 31, 2023
This section shows all the securities in the fund’s portfolio and their values as of the report date.
The fund files its complete schedule of portfolio holdings with the U.S. Securities and Exchange Commission (SEC) for the first and third quarters of each fiscal year on Form N-PORT Part F. The fund’s Form N-PORT Part F is available on the SEC’s website at www.sec.gov. You can also obtain this information at no cost on the fund’s website at www.schwabassetmanagement.com/schwabetfs_prospectus, by calling 1-866-414-6349, or by sending an email request to orders@mysummaryprospectus.com. The fund also makes available its complete schedule of portfolio holdings on a daily basis on the fund’s website.
| | |
COMMON STOCKS 99.8% OF NET ASSETS |
|
Automobiles & Components 2.1% |
| | |
American Axle & Manufacturing Holdings, Inc. * | | |
| | |
| | |
| | |
| | |
| | |
| | |
Faraday Future Intelligent Electric, Inc. *(a) | | |
| | |
| | |
Fox Factory Holding Corp. * | | |
| | |
| | |
| | |
| | |
| | |
| | |
| | |
| | |
Luminar Technologies, Inc. *(a) | | |
Mobileye Global, Inc., Class A * | | |
Modine Manufacturing Co. * | | |
| | |
| | |
| | |
Rivian Automotive, Inc., Class A * | | |
| | |
Standard Motor Products, Inc. | | |
| | |
| | |
The Goodyear Tire & Rubber Co. * | | |
| | |
| | |
Winnebago Industries, Inc. | | |
| | |
| | |
|
|
| | |
| | |
| | |
| | |
Atlantic Union Bankshares Corp. | | |
| | |
| | |
| | |
| | |
| | |
| | |
| | |
| | |
| | |
| | |
Berkshire Hills Bancorp, Inc. | | |
| | |
| | |
| | |
| | |
| | |
Capitol Federal Financial, Inc. | | |
| | |
Central Pacific Financial Corp. | | |
| | |
Citizens Financial Group, Inc. | | |
Citizens Financial Services, Inc. (a) | | |
| | |
Columbia Banking System, Inc. | | |
Columbia Financial, Inc. * | | |
| | |
Commerce Bancshares, Inc. | | |
Community Bank System, Inc. | | |
Community Trust Bancorp, Inc. | | |
| | |
CrossFirst Bankshares, Inc. * | | |
Cullen/Frost Bankers, Inc. | | |
Customers Bancorp, Inc. * | | |
| | |
Dime Community Bancshares, Inc. | | |
| | |
| | |
| | |
Enterprise Financial Services Corp. | | |
| | |
| | |
| | |
Financial Institutions, Inc. | | |
| | |
First Bancorp/Southern Pines NC | | |
| | |
First Citizens BancShares, Inc., Class A | | |
First Commonwealth Financial Corp. | | |
First Community Bankshares, Inc. | | |
| | |
First Financial Bankshares, Inc. | | |
| | |
| | |
| | |
| | |
First Interstate BancSystem, Inc., Class A | | |
| | |
First Mid Bancshares, Inc. | | |
| | |
| | |
German American Bancorp, Inc. | | |
| | |
32Schwab U.S. Equity ETFs | Annual Report
Schwab U.S. Broad Market ETF
Portfolio Holdings as of August 31, 2023 (continued)
| | |
Great Southern Bancorp, Inc. | | |
| | |
| | |
| | |
Heartland Financial USA, Inc. | | |
| | |
| | |
| | |
| | |
| | |
| | |
| | |
Huntington Bancshares, Inc. | | |
| | |
Independent Bank Group, Inc. | | |
International Bancshares Corp. | | |
| | |
| | |
| | |
| | |
| | |
| | |
Live Oak Bancshares, Inc. | | |
| | |
| | |
| | |
Metrocity Bankshares, Inc. | | |
Midland States Bancorp, Inc. | | |
National Bank Holdings Corp., Class A | | |
| | |
New York Community Bancorp, Inc. | | |
| | |
| | |
Northwest Bancshares, Inc. | | |
OceanFirst Financial Corp. | | |
| | |
| | |
| | |
Pacific Premier Bancorp, Inc. | | |
| | |
| | |
| | |
Peapack-Gladstone Financial Corp. | | |
| | |
Pinnacle Financial Partners, Inc. | | |
| | |
| | |
| | |
Prosperity Bancshares, Inc. | | |
Provident Financial Services, Inc. | | |
| | |
| | |
| | |
Republic Bancorp, Inc., Class A | | |
| | |
Sandy Spring Bancorp, Inc. | | |
Seacoast Banking Corp. of Florida | | |
ServisFirst Bancshares, Inc. | | |
Simmons First National Corp., Class A | | |
Southside Bancshares, Inc. | | |
| | |
| | |
Stock Yards Bancorp, Inc. | | |
| | |
Texas Capital Bancshares, Inc. * | | |
| | |
| | |
The First Bancshares, Inc. | | |
The First of Long Island Corp. | | |
The PNC Financial Services Group, Inc. | | |
| | |
| | |
| | |
| | |
| | |
| | |
| | |
| | |
| | |
| | |
United Community Banks, Inc. | | |
| | |
| | |
| | |
| | |
Washington Trust Bancorp, Inc. | | |
| | |
| | |
| | |
| | |
| | |
| | |
| | |
| | |
| | |
|
|
| | |
| | |
| | |
| | |
| | |
| | |
| | |
Advanced Drainage Systems, Inc. | | |
| | |
| | |
| | |
| | |
| | |
Albany International Corp., Class A | | |
| | |
Allison Transmission Holdings, Inc. | | |
Ameresco, Inc., Class A * | | |
American Woodmark Corp. * | | |
| | |
Amprius Technologies, Inc. *(a) | | |
| | |
| | |
Applied Industrial Technologies, Inc. | | |
Archer Aviation, Inc., Class A *(a) | | |
| | |
| | |
Armstrong World Industries, Inc. | | |
Array Technologies, Inc. * | | |
| | |
| | |
| | |
| | |
| | |
Babcock & Wilcox Enterprises, Inc. * | | |
| | |
Beacon Roofing Supply, Inc. * | | |
Schwab U.S. Equity ETFs | Annual Report33
Schwab U.S. Broad Market ETF
Portfolio Holdings as of August 31, 2023 (continued)
| | |
| | |
Bloom Energy Corp., Class A * | | |
| | |
Builders FirstSource, Inc. * | | |
| | |
| | |
| | |
| | |
ChargePoint Holdings, Inc. *(a) | | |
| | |
CIRCOR International, Inc. * | | |
| | |
Comfort Systems USA, Inc. | | |
Construction Partners, Inc., Class A * | | |
Core & Main, Inc., Class A * | | |
| | |
| | |
| | |
| | |
Custom Truck One Source, Inc. * | | |
| | |
Desktop Metal, Inc., Class A *(a) | | |
| | |
| | |
| | |
| | |
| | |
| | |
| | |
| | |
| | |
| | |
Energy Vault Holdings, Inc. * | | |
| | |
| | |
| | |
| | |
| | |
| | |
| | |
| | |
| | |
| | |
| | |
| | |
| | |
| | |
Fortune Brands Innovations, Inc. | | |
Franklin Electric Co., Inc. | | |
| | |
| | |
| | |
Gates Industrial Corp. plc * | | |
| | |
| | |
| | |
| | |
Gibraltar Industries, Inc. * | | |
| | |
| | |
| | |
GrafTech International Ltd. | | |
Granite Construction, Inc. | | |
Great Lakes Dredge & Dock Corp. * | | |
| | |
H&E Equipment Services, Inc. | | |
| | |
| | |
| | |
Helios Technologies, Inc. | | |
| | |
| | |
| | |
Hillman Solutions Corp. * | | |
Honeywell International, Inc. | | |
| | |
| | |
Huntington Ingalls Industries, Inc. | | |
| | |
Hyster-Yale Materials Handling, Inc. | | |
| | |
| | |
| | |
Illinois Tool Works, Inc. | | |
| | |
| | |
Intuitive Machines, Inc. *(a) | | |
| | |
Janus International Group, Inc. * | | |
| | |
John Bean Technologies Corp. | | |
Johnson Controls International plc | | |
| | |
| | |
| | |
Kratos Defense & Security Solutions, Inc. * | | |
L3Harris Technologies, Inc. | | |
Lennox International, Inc. | | |
| | |
Lincoln Electric Holdings, Inc. | | |
| | |
| | |
Markforged Holding Corp. * | | |
| | |
Masonite International Corp. * | | |
| | |
| | |
| | |
MDU Resources Group, Inc. | | |
| | |
Microvast Holdings, Inc. * | | |
| | |
| | |
MSC Industrial Direct Co., Inc., Class A | | |
| | |
Mueller Water Products, Inc., Class A | | |
| | |
National Presto Industries, Inc. | | |
Nauticus Robotics, Inc. * | | |
NEXTracker, Inc., Class A * | | |
| | |
| | |
| | |
| | |
| | |
| | |
| | |
| | |
| | |
| | |
| | |
| | |
| | |
| | |
| | |
34Schwab U.S. Equity ETFs | Annual Report
Schwab U.S. Broad Market ETF
Portfolio Holdings as of August 31, 2023 (continued)
| | |
| | |
| | |
Quanex Building Products Corp. | | |
| | |
| | |
| | |
Resideo Technologies, Inc. * | | |
| | |
| | |
Rockwell Automation, Inc. | | |
| | |
Rush Enterprises, Inc., Class A | | |
Rush Enterprises, Inc., Class B | | |
Sarcos Technology & Robotics Corp. * | | |
Sensata Technologies Holding plc | | |
| | |
Shoals Technologies Group, Inc., Class A * | | |
Simpson Manufacturing Co., Inc. | | |
SiteOne Landscape Supply, Inc. * | | |
| | |
Southland Holdings, Inc. *(a) | | |
Spirit AeroSystems Holdings, Inc., Class A | | |
| | |
Standex International Corp. | | |
Stanley Black & Decker, Inc. | | |
| | |
| | |
| | |
| | |
| | |
| | |
| | |
| | |
| | |
| | |
| | |
| | |
The Greenbrier Cos., Inc. | | |
The Manitowoc Co., Inc. * | | |
| | |
| | |
| | |
| | |
Thermon Group Holdings, Inc. * | | |
Titan International, Inc. * | | |
| | |
| | |
| | |
| | |
| | |
| | |
Triton International Ltd. | | |
| | |
| | |
| | |
| | |
| | |
| | |
| | |
| | |
| | |
| | |
Virgin Galactic Holdings, Inc. *(a) | | |
| | |
| | |
| | |
| | |
Watts Water Technologies, Inc., Class A | | |
WESCO International, Inc. | | |
Westinghouse Air Brake Technologies Corp. | | |
WillScot Mobile Mini Holdings Corp. * | | |
| | |
| | |
| | |
Zurn Elkay Water Solutions Corp., Class C | | |
| | |
|
Commercial & Professional Services 1.6% |
| | |
| | |
| | |
| | |
Automatic Data Processing, Inc. | | |
Barrett Business Services, Inc. | | |
BlackSky Technology, Inc. * | | |
Booz Allen Hamilton Holding Corp., Class A | | |
| | |
BrightView Holdings, Inc. * | | |
Broadridge Financial Solutions, Inc. | | |
CACI International, Inc., Class A * | | |
Casella Waste Systems, Inc., Class A * | | |
| | |
Ceridian HCM Holding, Inc. * | | |
| | |
| | |
| | |
| | |
| | |
| | |
| | |
| | |
CSG Systems International, Inc. | | |
| | |
Driven Brands Holdings, Inc. * | | |
Dun & Bradstreet Holdings, Inc. | | |
| | |
| | |
| | |
ExlService Holdings, Inc. * | | |
| | |
| | |
FiscalNote Holdings, Inc. *(a) | | |
Forrester Research, Inc. * | | |
| | |
| | |
| | |
Healthcare Services Group, Inc. | | |
Heidrick & Struggles International, Inc. | | |
Heritage-Crystal Clean, Inc. * | | |
HireRight Holdings Corp. * | | |
| | |
Huron Consulting Group, Inc. * | | |
| | |
| | |
| | |
| | |
| | |
Kelly Services, Inc., Class A | | |
Schwab U.S. Equity ETFs | Annual Report35
Schwab U.S. Broad Market ETF
Portfolio Holdings as of August 31, 2023 (continued)
| | |
| | |
| | |
LanzaTech Global, Inc. *(a) | | |
| | |
| | |
Liquidity Services, Inc. * | | |
| | |
Matthews International Corp., Class A | | |
| | |
| | |
Montrose Environmental Group, Inc. * | | |
| | |
| | |
| | |
| | |
| | |
| | |
Paylocity Holding Corp. * | | |
| | |
| | |
| | |
| | |
Resources Connection, Inc. | | |
Robert Half International, Inc. | | |
| | |
Science Applications International Corp. | | |
| | |
SS&C Technologies Holdings, Inc. | | |
| | |
| | |
| | |
| | |
| | |
| | |
| | |
| | |
| | |
| | |
| | |
| | |
| | |
| | |
| | |
| | |
| | |
| | |
|
Consumer Discretionary Distribution & Retail 5.2% |
1-800-Flowers.com, Inc., Class A * | | |
Abercrombie & Fitch Co., Class A * | | |
Academy Sports & Outdoors, Inc. | | |
| | |
| | |
American Eagle Outfitters, Inc. | | |
America's Car-Mart, Inc. * | | |
| | |
Asbury Automotive Group, Inc. * | | |
| | |
| | |
| | |
| | |
| | |
| | |
Boot Barn Holdings, Inc. * | | |
Burlington Stores, Inc. * | | |
| | |
| | |
Camping World Holdings, Inc., Class A | | |
| | |
| | |
| | |
| | |
| | |
ContextLogic, Inc., Class A *(a) | | |
Designer Brands, Inc., Class A (a) | | |
Dick's Sporting Goods, Inc. | | |
| | |
| | |
| | |
| | |
Floor & Decor Holdings, Inc., Class A * | | |
| | |
GameStop Corp., Class A *(a) | | |
| | |
| | |
| | |
| | |
| | |
| | |
Haverty Furniture Cos., Inc. | | |
| | |
| | |
| | |
| | |
| | |
| | |
LL Flooring Holdings, Inc. * | | |
| | |
| | |
| | |
| | |
| | |
National Vision Holdings, Inc. * | | |
| | |
Ollie's Bargain Outlet Holdings, Inc. * | | |
O'Reilly Automotive, Inc. * | | |
| | |
Penske Automotive Group, Inc. | | |
Petco Health & Wellness Co., Inc. * | | |
| | |
| | |
| | |
Rent the Runway, Inc., Class A * | | |
| | |
| | |
| | |
Sally Beauty Holdings, Inc. * | | |
| | |
| | |
| | |
Sonic Automotive, Inc., Class A | | |
Sportsman's Warehouse Holdings, Inc. * | | |
Stitch Fix, Inc., Class A * | | |
| | |
| | |
The Children's Place, Inc. * | | |
The Container Store Group, Inc. * | | |
| | |
| | |
| | |
| | |
| | |
| | |
36Schwab U.S. Equity ETFs | Annual Report
Schwab U.S. Broad Market ETF
Portfolio Holdings as of August 31, 2023 (continued)
| | |
| | |
| | |
| | |
Victoria's Secret & Co. * | | |
Warby Parker, Inc., Class A * | | |
| | |
| | |
| | |
| | |
| | |
|
Consumer Durables & Apparel 1.2% |
| | |
| | |
| | |
| | |
| | |
| | |
| | |
Century Communities, Inc. | | |
| | |
| | |
| | |
| | |
Dream Finders Homes, Inc., Class A * | | |
Ethan Allen Interiors, Inc. | | |
| | |
| | |
| | |
| | |
G-III Apparel Group Ltd. * | | |
| | |
Green Brick Partners, Inc. * | | |
| | |
| | |
| | |
Installed Building Products, Inc. | | |
| | |
Johnson Outdoors, Inc., Class A | | |
| | |
| | |
| | |
| | |
| | |
| | |
Levi Strauss & Co., Class A | | |
| | |
Lululemon Athletica, Inc. * | | |
| | |
| | |
Malibu Boats, Inc., Class A * | | |
| | |
| | |
Mohawk Industries, Inc. * | | |
| | |
| | |
| | |
| | |
| | |
Peloton Interactive, Inc., Class A * | | |
| | |
| | |
| | |
| | |
| | |
Skechers U.S.A., Inc., Class A * | | |
| | |
| | |
Smith & Wesson Brands, Inc. | | |
Snap One Holdings Corp. * | | |
Solo Brands, Inc., Class A * | | |
| | |
| | |
| | |
| | |
Taylor Morrison Home Corp. * | | |
Tempur Sealy International, Inc. | | |
| | |
| | |
Topgolf Callaway Brands Corp. * | | |
| | |
| | |
Tupperware Brands Corp. * | | |
Under Armour, Inc., Class A * | | |
United Homes Group, Inc. * | | |
Universal Electronics, Inc. * | | |
| | |
| | |
Vizio Holding Corp., Class A * | | |
| | |
Wolverine World Wide, Inc. | | |
| | |
| | |
|
|
| | |
Accel Entertainment, Inc. * | | |
| | |
Adtalem Global Education, Inc. * | | |
| | |
| | |
| | |
| | |
| | |
| | |
| | |
| | |
Bright Horizons Family Solutions, Inc. * | | |
Brinker International, Inc. * | | |
Caesars Entertainment, Inc. * | | |
| | |
| | |
| | |
Chipotle Mexican Grill, Inc. * | | |
Choice Hotels International, Inc. | | |
| | |
| | |
| | |
Cracker Barrel Old Country Store, Inc. | | |
| | |
Dave & Buster's Entertainment, Inc. * | | |
| | |
| | |
| | |
DoorDash, Inc., Class A * | | |
DraftKings, Inc., Class A * | | |
| | |
Dutch Bros, Inc., Class A * | | |
El Pollo Loco Holdings, Inc. | | |
| | |
| | |
First Watch Restaurant Group, Inc. * | | |
| | |
Golden Entertainment, Inc. | | |
Schwab U.S. Equity ETFs | Annual Report37
Schwab U.S. Broad Market ETF
Portfolio Holdings as of August 31, 2023 (continued)
| | |
Graham Holdings Co., Class B | | |
Grand Canyon Education, Inc. * | | |
| | |
Hilton Grand Vacations, Inc. * | | |
Hilton Worldwide Holdings, Inc. | | |
Hyatt Hotels Corp., Class A | | |
| | |
| | |
| | |
| | |
Life Time Group Holdings, Inc. * | | |
| | |
Lindblad Expeditions Holdings, Inc. * | | |
Marriott International, Inc., Class A | | |
Marriott Vacations Worldwide Corp. | | |
| | |
MGM Resorts International | | |
| | |
Monarch Casino & Resort, Inc. | | |
Norwegian Cruise Line Holdings Ltd. * | | |
OneSpaWorld Holdings Ltd. * | | |
Papa John's International, Inc. | | |
Penn Entertainment, Inc. * | | |
| | |
Planet Fitness, Inc., Class A * | | |
Playa Hotels & Resorts N.V. * | | |
Portillo's, Inc., Class A * | | |
Red Rock Resorts, Inc., Class A | | |
| | |
Royal Caribbean Cruises Ltd. * | | |
Rush Street Interactive, Inc. * | | |
| | |
SeaWorld Entertainment, Inc. * | | |
Service Corp. International | | |
Shake Shack, Inc., Class A * | | |
Six Flags Entertainment Corp. * | | |
| | |
| | |
Strategic Education, Inc. | | |
| | |
Sweetgreen, Inc., Class A * | | |
Target Hospitality Corp. * | | |
| | |
The Cheesecake Factory, Inc. | | |
| | |
| | |
| | |
| | |
| | |
| | |
| | |
Wyndham Hotels & Resorts, Inc. | | |
| | |
| | |
| | |
|
Consumer Staples Distribution & Retail 1.7% |
Albertsons Cos., Inc., Class A | | |
BJ's Wholesale Club Holdings, Inc. * | | |
Casey's General Stores, Inc. | | |
| | |
| | |
| | |
Grocery Outlet Holding Corp. * | | |
Ingles Markets, Inc., Class A | | |
Performance Food Group Co. * | | |
| | |
| | |
| | |
| | |
Sprouts Farmers Market, Inc. * | | |
| | |
| | |
| | |
The Chefs' Warehouse, Inc. * | | |
| | |
United Natural Foods, Inc. * | | |
| | |
Walgreens Boots Alliance, Inc. | | |
| | |
| | |
| | |
|
|
| | |
| | |
| | |
| | |
Atlas Energy Solutions, Inc., Class A (a) | | |
| | |
| | |
| | |
California Resources Corp. | | |
| | |
| | |
| | |
| | |
| | |
| | |
| | |
Clean Energy Fuels Corp. * | | |
| | |
| | |
| | |
| | |
| | |
| | |
| | |
| | |
| | |
| | |
Diamond Offshore Drilling, Inc. * | | |
| | |
| | |
| | |
| | |
Earthstone Energy, Inc., Class A * | | |
| | |
| | |
| | |
Equitrans Midstream Corp. | | |
Excelerate Energy, Inc., Class A | | |
Expro Group Holdings N.V. * | | |
| | |
Granite Ridge Resources, Inc. | | |
| | |
| | |
| | |
Helix Energy Solutions Group, Inc. * | | |
| | |
| | |
| | |
HighPeak Energy, Inc. (a) | | |
International Seaways, Inc. | | |
38Schwab U.S. Equity ETFs | Annual Report
Schwab U.S. Broad Market ETF
Portfolio Holdings as of August 31, 2023 (continued)
| | |
| | |
| | |
| | |
| | |
Magnolia Oil & Gas Corp., Class A | | |
| | |
| | |
| | |
| | |
| | |
New Fortress Energy, Inc. | | |
NexTier Oilfield Solutions, Inc. * | | |
| | |
Northern Oil and Gas, Inc. | | |
| | |
Occidental Petroleum Corp. | | |
Oceaneering International, Inc. * | | |
| | |
| | |
Par Pacific Holdings, Inc. * | | |
Patterson-UTI Energy, Inc. | | |
PBF Energy, Inc., Class A | | |
| | |
| | |
| | |
Pioneer Natural Resources Co. | | |
ProFrac Holding Corp., Class A * | | |
| | |
| | |
| | |
| | |
| | |
Southwestern Energy Co. * | | |
| | |
| | |
| | |
| | |
| | |
| | |
| | |
| | |
US Silica Holdings, Inc. * | | |
| | |
| | |
| | |
| | |
Weatherford International plc * | | |
World Fuel Services Corp. | | |
| | |
|
Equity Real Estate Investment Trusts (REITs) 2.7% |
| | |
| | |
Alexander & Baldwin, Inc. | | |
| | |
Alexandria Real Estate Equities, Inc. | | |
American Assets Trust, Inc. | | |
American Homes 4 Rent, Class A | | |
| | |
Americold Realty Trust, Inc. | | |
Apartment Income REIT Corp. | | |
Apartment Investment & Management Co., Class A | | |
Apple Hospitality REIT, Inc. | | |
Armada Hoffler Properties, Inc. | | |
AvalonBay Communities, Inc. | | |
| | |
| | |
| | |
Brixmor Property Group, Inc. | | |
Broadstone Net Lease, Inc. | | |
| | |
| | |
| | |
| | |
| | |
Community Healthcare Trust, Inc. | | |
Corporate Office Properties Trust | | |
| | |
| | |
| | |
DiamondRock Hospitality Co. | | |
Digital Realty Trust, Inc. | | |
Diversified Healthcare Trust | | |
| | |
Easterly Government Properties, Inc. | | |
EastGroup Properties, Inc. | | |
| | |
Empire State Realty Trust, Inc., Class A | | |
| | |
| | |
| | |
Equity LifeStyle Properties, Inc. | | |
| | |
Essential Properties Realty Trust, Inc. | | |
Essex Property Trust, Inc. | | |
Extra Space Storage, Inc. | | |
Federal Realty Investment Trust | | |
First Industrial Realty Trust, Inc. | | |
Four Corners Property Trust, Inc. | | |
Franklin Street Properties Corp. | | |
Gaming & Leisure Properties, Inc. | | |
| | |
Gladstone Commercial Corp. | | |
Global Medical REIT, Inc. | | |
| | |
Healthcare Realty Trust, Inc. | | |
Healthpeak Properties, Inc. | | |
Highwoods Properties, Inc. | | |
Host Hotels & Resorts, Inc. | | |
Hudson Pacific Properties, Inc. | | |
Independence Realty Trust, Inc. | | |
Industrial Logistics Properties Trust | | |
Innovative Industrial Properties, Inc. | | |
InvenTrust Properties Corp. | | |
| | |
| | |
| | |
| | |
| | |
| | |
Lamar Advertising Co., Class A | | |
| | |
| | |
Medical Properties Trust, Inc. | | |
Mid-America Apartment Communities, Inc. | | |
National Health Investors, Inc. | | |
National Storage Affiliates Trust | | |
NexPoint Diversified Real Estate Trust | | |
NexPoint Residential Trust, Inc. | | |
| | |
Office Properties Income Trust | | |
Omega Healthcare Investors, Inc. | | |
One Liberty Properties, Inc. | | |
Schwab U.S. Equity ETFs | Annual Report39
Schwab U.S. Broad Market ETF
Portfolio Holdings as of August 31, 2023 (continued)
| | |
| | |
| | |
| | |
Park Hotels & Resorts, Inc. | | |
| | |
| | |
Phillips Edison & Co., Inc. | | |
| | |
Piedmont Office Realty Trust, Inc., Class A | | |
| | |
| | |
| | |
| | |
| | |
| | |
Retail Opportunity Investments Corp. | | |
Rexford Industrial Realty, Inc. | | |
| | |
| | |
Ryman Hospitality Properties, Inc. | | |
Sabra Health Care REIT, Inc. | | |
| | |
| | |
| | |
| | |
Simon Property Group, Inc. | | |
| | |
SL Green Realty Corp. (a) | | |
Spirit Realty Capital, Inc. | | |
| | |
| | |
Summit Hotel Properties, Inc. | | |
| | |
Sunstone Hotel Investors, Inc. | | |
Tanger Factory Outlet Centers, Inc. | | |
| | |
| | |
The Necessity Retail REIT, Inc. | | |
| | |
| | |
| | |
Universal Health Realty Income Trust | | |
| | |
| | |
Veris Residential, Inc. * | | |
| | |
| | |
| | |
| | |
| | |
Xenia Hotels & Resorts, Inc. | | |
| | |
|
|
Affiliated Managers Group, Inc. | | |
| | |
| | |
| | |
| | |
| | |
| | |
Ameriprise Financial, Inc. | | |
Annaly Capital Management, Inc. | | |
Apollo Commercial Real Estate Finance, Inc. | | |
Apollo Global Management, Inc. | | |
| | |
| | |
Ares Management Corp., Class A | | |
ARMOUR Residential REIT, Inc. | | |
Artisan Partners Asset Management, Inc., Class A | | |
Assetmark Financial Holdings, Inc. * | | |
| | |
AvidXchange Holdings, Inc. * | | |
B. Riley Financial, Inc. (a) | | |
Berkshire Hathaway, Inc., Class B * | | |
| | |
| | |
Blackstone Mortgage Trust, Inc., Class A | | |
| | |
| | |
| | |
Bread Financial Holdings, Inc. | | |
Brightsphere Investment Group, Inc. | | |
BrightSpire Capital, Inc. | | |
| | |
| | |
Capital One Financial Corp. | | |
Cass Information Systems, Inc. | | |
Cboe Global Markets, Inc. | | |
| | |
Claros Mortgage Trust, Inc. | | |
| | |
| | |
Coinbase Global, Inc., Class A * | | |
Corebridge Financial, Inc. | | |
Credit Acceptance Corp. * | | |
Curo Group Holdings Corp. * | | |
Diamond Hill Investment Group, Inc. | | |
Discover Financial Services | | |
Donnelley Financial Solutions, Inc. * | | |
| | |
Ellington Financial, Inc. | | |
| | |
Encore Capital Group, Inc. * | | |
Enova International, Inc. * | | |
| | |
| | |
Euronet Worldwide, Inc. * | | |
| | |
| | |
FactSet Research Systems, Inc. | | |
Federal Agricultural Mortgage Corp., Class C | | |
| | |
Fidelity National Information Services, Inc. | | |
| | |
| | |
FleetCor Technologies, Inc. * | | |
| | |
Focus Financial Partners, Inc., Class A *(c) | | |
Forge Global Holdings, Inc. *(a) | | |
Franklin BSP Realty Trust, Inc. | | |
| | |
| | |
Granite Point Mortgage Trust, Inc. | | |
Green Dot Corp., Class A * | | |
Hamilton Lane, Inc., Class A | | |
Hannon Armstrong Sustainable Infrastructure Capital, Inc. | | |
40Schwab U.S. Equity ETFs | Annual Report
Schwab U.S. Broad Market ETF
Portfolio Holdings as of August 31, 2023 (continued)
| | |
| | |
Interactive Brokers Group, Inc., Class A | | |
Intercontinental Exchange, Inc. | | |
International Money Express, Inc. * | | |
| | |
Invesco Mortgage Capital, Inc. | | |
Jack Henry & Associates, Inc. | | |
Jackson Financial, Inc., Class A | | |
Janus Henderson Group plc | | |
Jefferies Financial Group, Inc. | | |
| | |
KKR Real Estate Finance Trust, Inc. | | |
| | |
| | |
| | |
| | |
LPL Financial Holdings, Inc. | | |
MarketAxess Holdings, Inc. | | |
| | |
Mastercard, Inc., Class A | | |
| | |
| | |
| | |
| | |
| | |
| | |
| | |
| | |
| | |
| | |
| | |
| | |
| | |
NerdWallet, Inc., Class A * | | |
New York Mortgage Trust, Inc. | | |
| | |
NMI Holdings, Inc., Class A * | | |
| | |
| | |
Open Lending Corp., Class A * | | |
| | |
| | |
PennyMac Financial Services, Inc. | | |
PennyMac Mortgage Investment Trust | | |
| | |
PJT Partners, Inc., Class A | | |
| | |
| | |
| | |
Raymond James Financial, Inc. | | |
| | |
| | |
| | |
| | |
| | |
Robinhood Markets, Inc., Class A * | | |
Rocket Cos., Inc., Class A *(a) | | |
| | |
| | |
Shift4 Payments, Inc., Class A * | | |
| | |
SoFi Technologies, Inc. * | | |
Starwood Property Trust, Inc. | | |
| | |
StepStone Group, Inc., Class A | | |
| | |
| | |
| | |
| | |
T. Rowe Price Group, Inc. | | |
| | |
The Bank of New York Mellon Corp. | | |
| | |
The Charles Schwab Corp. (d) | | |
The Goldman Sachs Group, Inc. | | |
| | |
| | |
TPG RE Finance Trust, Inc. | | |
| | |
Tradeweb Markets, Inc., Class A | | |
Two Harbors Investment Corp. | | |
Upstart Holdings, Inc. *(a) | | |
| | |
Victory Capital Holdings, Inc., Class A | | |
Virtu Financial, Inc., Class A | | |
Virtus Investment Partners, Inc. | | |
| | |
| | |
| | |
Waterstone Financial, Inc. | | |
| | |
| | |
| | |
| | |
|
Food, Beverage & Tobacco 3.0% |
| | |
Archer-Daniels-Midland Co. | | |
| | |
| | |
| | |
Brown-Forman Corp., Class B | | |
| | |
| | |
| | |
| | |
| | |
Coca-Cola Consolidated, Inc. | | |
| | |
Constellation Brands, Inc., Class A | | |
Darling Ingredients, Inc. * | | |
| | |
Fresh Del Monte Produce, Inc. | | |
| | |
| | |
| | |
| | |
| | |
| | |
John B Sanfilippo & Son, Inc. | | |
| | |
| | |
Lamb Weston Holdings, Inc. | | |
| | |
McCormick & Co., Inc. Non Voting Shares | | |
| | |
| | |
Molson Coors Beverage Co., Class B | | |
Mondelez International, Inc., Class A | | |
| | |
National Beverage Corp. * | | |
| | |
Philip Morris International, Inc. | | |
| | |
Schwab U.S. Equity ETFs | Annual Report41
Schwab U.S. Broad Market ETF
Portfolio Holdings as of August 31, 2023 (continued)
| | |
| | |
| | |
| | |
The Boston Beer Co., Inc., Class A * | | |
| | |
The Duckhorn Portfolio, Inc. * | | |
The Hain Celestial Group, Inc. * | | |
| | |
| | |
| | |
The Simply Good Foods Co. * | | |
The Vita Coco Co., Inc. * | | |
Tootsie Roll Industries, Inc. | | |
| | |
Turning Point Brands, Inc. | | |
Tyson Foods, Inc., Class A | | |
| | |
| | |
| | |
| | |
| | |
| | |
|
Health Care Equipment & Services 5.3% |
23andMe Holding Co., Class A * | | |
| | |
Acadia Healthcare Co., Inc. * | | |
| | |
| | |
| | |
| | |
| | |
AirSculpt Technologies, Inc. *(a) | | |
| | |
| | |
Alignment Healthcare, Inc. * | | |
| | |
American Well Corp., Class A * | | |
AMN Healthcare Services, Inc. * | | |
| | |
Apollo Medical Holdings, Inc. * | | |
| | |
| | |
| | |
| | |
Aveanna Healthcare Holdings, Inc. * | | |
| | |
| | |
Baxter International, Inc. | | |
| | |
Bioventus, Inc., Class A * | | |
Boston Scientific Corp. * | | |
Brookdale Senior Living, Inc. * | | |
Butterfly Network, Inc. *(a) | | |
| | |
| | |
Castle Biosciences, Inc. * | | |
| | |
| | |
| | |
| | |
| | |
Clover Health Investments Corp. * | | |
Community Health Systems, Inc. * | | |
Computer Programs & Systems, Inc. * | | |
| | |
| | |
| | |
| | |
| | |
Definitive Healthcare Corp., Class A * | | |
| | |
| | |
| | |
Doximity, Inc., Class A * | | |
Edwards Lifesciences Corp. * | | |
| | |
| | |
| | |
| | |
| | |
Evolent Health, Inc., Class A * | | |
| | |
| | |
| | |
| | |
Globus Medical, Inc., Class A * | | |
GoodRx Holdings, Inc., Class A * | | |
| | |
| | |
| | |
| | |
| | |
| | |
| | |
Hims & Hers Health, Inc. * | | |
| | |
| | |
| | |
IDEXX Laboratories, Inc. * | | |
| | |
Innovage Holding Corp. *(a) | | |
| | |
Inspire Medical Systems, Inc. * | | |
| | |
| | |
Integra LifeSciences Holdings Corp. * | | |
Intuitive Surgical, Inc. * | | |
| | |
iRhythm Technologies, Inc. * | | |
Laboratory Corp. of America Holdings | | |
Lantheus Holdings, Inc. * | | |
| | |
LifeStance Health Group, Inc. * | | |
| | |
| | |
| | |
| | |
Merit Medical Systems, Inc. * | | |
| | |
Molina Healthcare, Inc. * | | |
| | |
National HealthCare Corp. | | |
| | |
| | |
| | |
| | |
NextGen Healthcare, Inc. * | | |
| | |
| | |
OmniAb, Inc., Class A *(c) | | |
OmniAb, Inc., Class B *(c) | | |
| | |
| | |
Option Care Health, Inc. * | | |
OraSure Technologies, Inc. * | | |
42Schwab U.S. Equity ETFs | Annual Report
Schwab U.S. Broad Market ETF
Portfolio Holdings as of August 31, 2023 (continued)
| | |
Orchestra BioMed Holdings, Inc. * | | |
| | |
| | |
| | |
| | |
| | |
| | |
Pediatrix Medical Group, Inc. * | | |
| | |
| | |
| | |
| | |
Privia Health Group, Inc. * | | |
PROCEPT BioRobotics Corp. * | | |
| | |
| | |
| | |
| | |
| | |
| | |
| | |
| | |
Select Medical Holdings Corp. | | |
Semler Scientific, Inc. * | | |
Senseonics Holdings, Inc. *(a) | | |
| | |
Shockwave Medical, Inc. * | | |
| | |
| | |
Silk Road Medical, Inc. * | | |
| | |
| | |
| | |
| | |
| | |
| | |
Tandem Diabetes Care, Inc. * | | |
| | |
| | |
| | |
| | |
| | |
| | |
| | |
The Pennant Group, Inc. * | | |
TransMedics Group, Inc. * | | |
Treace Medical Concepts, Inc. * | | |
| | |
Universal Health Services, Inc., Class B | | |
US Physical Therapy, Inc. | | |
| | |
Veeva Systems, Inc., Class A * | | |
| | |
Vicarious Surgical, Inc. * | | |
Zimmer Biomet Holdings, Inc. | | |
| | |
| | |
|
Household & Personal Products 1.4% |
| | |
Central Garden & Pet Co. * | | |
Central Garden & Pet Co., Class A * | | |
Church & Dwight Co., Inc. | | |
| | |
| | |
Edgewell Personal Care Co. | | |
| | |
| | |
| | |
| | |
| | |
| | |
| | |
| | |
Nu Skin Enterprises, Inc., Class A | | |
| | |
Reynolds Consumer Products, Inc. | | |
Spectrum Brands Holdings, Inc. | | |
| | |
| | |
The Estee Lauder Cos., Inc., Class A | | |
| | |
| | |
USANA Health Sciences, Inc. * | | |
| | |
| | |
| | |
|
|
| | |
Ambac Financial Group, Inc. * | | |
American Equity Investment Life Holding Co. | | |
American Financial Group, Inc. | | |
American International Group, Inc. | | |
| | |
| | |
Arch Capital Group Ltd. * | | |
Argo Group International Holdings Ltd. | | |
Arthur J. Gallagher & Co. | | |
| | |
| | |
Axis Capital Holdings Ltd. | | |
Bright Health Group, Inc. * | | |
Brighthouse Financial, Inc. * | | |
| | |
BRP Group, Inc., Class A * | | |
| | |
Cincinnati Financial Corp. | | |
| | |
CNO Financial Group, Inc. | | |
| | |
| | |
Erie Indemnity Co., Class A | | |
| | |
F&G Annuities & Life, Inc. | | |
Fidelity National Financial, Inc. | | |
First American Financial Corp. | | |
Genworth Financial, Inc., Class A * | | |
| | |
Goosehead Insurance, Inc., Class A * | | |
| | |
| | |
Horace Mann Educators Corp. | | |
James River Group Holdings Ltd. | | |
| | |
Kinsale Capital Group, Inc. | | |
| | |
| | |
| | |
| | |
Marsh & McLennan Cos., Inc. | | |
| | |
Schwab U.S. Equity ETFs | Annual Report43
Schwab U.S. Broad Market ETF
Portfolio Holdings as of August 31, 2023 (continued)
| | |
| | |
| | |
National Western Life Group, Inc., Class A | | |
Old Republic International Corp. | | |
Oscar Health, Inc., Class A * | | |
| | |
| | |
Principal Financial Group, Inc. | | |
| | |
Prudential Financial, Inc. | | |
Reinsurance Group of America, Inc. | | |
RenaissanceRe Holdings Ltd. | | |
| | |
Ryan Specialty Holdings, Inc., Class A * | | |
Safety Insurance Group, Inc. | | |
Selective Insurance Group, Inc. | | |
| | |
| | |
Skyward Specialty Insurance Group, Inc. * | | |
Stewart Information Services Corp. | | |
| | |
The Hanover Insurance Group, Inc. | | |
The Hartford Financial Services Group, Inc. | | |
| | |
| | |
| | |
| | |
| | |
| | |
White Mountains Insurance Group Ltd. | | |
| | |
| | |
|
|
| | |
Air Products and Chemicals, Inc. | | |
| | |
| | |
Alpha Metallurgical Resources, Inc. | | |
| | |
| | |
| | |
| | |
| | |
| | |
| | |
Axalta Coating Systems Ltd. * | | |
| | |
| | |
| | |
| | |
Carpenter Technology Corp. | | |
| | |
| | |
CF Industries Holdings, Inc. | | |
| | |
| | |
| | |
| | |
| | |
Compass Minerals International, Inc. | | |
| | |
| | |
| | |
Danimer Scientific, Inc. *(a) | | |
| | |
| | |
| | |
| | |
| | |
| | |
| | |
| | |
| | |
Ginkgo Bioworks Holdings, Inc. *(a) | | |
Graphic Packaging Holding Co. | | |
| | |
| | |
| | |
| | |
| | |
| | |
| | |
International Flavors & Fragrances, Inc. | | |
| | |
| | |
| | |
| | |
| | |
| | |
| | |
| | |
| | |
LyondellBasell Industries N.V., Class A | | |
Martin Marietta Materials, Inc. | | |
| | |
| | |
Mercer International, Inc. | | |
Minerals Technologies, Inc. | | |
| | |
| | |
| | |
| | |
| | |
| | |
| | |
| | |
Packaging Corp. of America | | |
| | |
Perimeter Solutions S.A. * | | |
| | |
| | |
PureCycle Technologies, Inc. *(a) | | |
| | |
| | |
Reliance Steel & Aluminum Co. | | |
| | |
| | |
Schnitzer Steel Industries, Inc., Class A | | |
| | |
Sensient Technologies Corp. | | |
| | |
| | |
| | |
| | |
Summit Materials, Inc., Class A * | | |
| | |
44Schwab U.S. Equity ETFs | Annual Report
Schwab U.S. Broad Market ETF
Portfolio Holdings as of August 31, 2023 (continued)
| | |
| | |
| | |
| | |
The Scotts Miracle-Gro Co. | | |
| | |
| | |
| | |
| | |
| | |
United States Lime & Minerals, Inc. | | |
United States Steel Corp. | | |
| | |
| | |
| | |
| | |
| | |
Worthington Industries, Inc. | | |
| | |
|
Media & Entertainment 7.3% |
Activision Blizzard, Inc. | | |
Advantage Solutions, Inc. * | | |
Alphabet, Inc., Class A * | | |
Alphabet, Inc., Class C * | | |
Altice USA, Inc., Class A * | | |
AMC Entertainment Holdings, Inc., Class A *(a) | | |
AMC Networks, Inc., Class A * | | |
| | |
Atlanta Braves Holdings, Inc., Class C * | | |
| | |
| | |
| | |
| | |
| | |
Charter Communications, Inc., Class A * | | |
Cinemark Holdings, Inc. * | | |
Clear Channel Outdoor Holdings, Inc. * | | |
| | |
DISH Network Corp., Class A * | | |
| | |
Endeavor Group Holdings, Inc., Class A * | | |
Eventbrite, Inc., Class A * | | |
| | |
| | |
| | |
| | |
| | |
| | |
iHeartMedia, Inc., Class A * | | |
Integral Ad Science Holding Corp. * | | |
John Wiley & Sons, Inc., Class A | | |
Liberty Broadband Corp., Class C * | | |
Liberty Media Corp.-Liberty Formula One, Class C * | | |
Liberty Media Corp.-Liberty Live, Class C * | | |
Liberty Media Corp.-Liberty SiriusXM, Class C * | | |
Lions Gate Entertainment Corp., Class A * | | |
Live Nation Entertainment, Inc. * | | |
| | |
| | |
Madison Square Garden Entertainment Corp. * | | |
Madison Square Garden Sports Corp. | | |
| | |
| | |
MediaAlpha, Inc., Class A * | | |
Meta Platforms, Inc., Class A * | | |
| | |
| | |
Nexstar Media Group, Inc., Class A | | |
Nextdoor Holdings, Inc. * | | |
| | |
Paramount Global, Class B (a) | | |
Pinterest, Inc., Class A * | | |
| | |
| | |
| | |
| | |
| | |
| | |
| | |
| | |
Sirius XM Holdings, Inc. (a) | | |
| | |
| | |
Sphere Entertainment Co. * | | |
| | |
Take-Two Interactive Software, Inc. * | | |
| | |
| | |
The E.W. Scripps Co., Class A * | | |
The Interpublic Group of Cos., Inc. | | |
The New York Times Co., Class A | | |
The Trade Desk, Inc., Class A * | | |
| | |
| | |
| | |
Vivid Seats, Inc., Class A * | | |
Warner Bros Discovery, Inc. * | | |
Warner Music Group Corp., Class A | | |
| | |
World Wrestling Entertainment, Inc., Class A | | |
| | |
| | |
ZipRecruiter, Inc., Class A * | | |
ZoomInfo Technologies, Inc. * | | |
| | |
|
Pharmaceuticals, Biotechnology & Life Sciences 7.7% |
10X Genomics, Inc., Class A * | | |
| | |
4D Molecular Therapeutics, Inc. * | | |
| | |
| | |
ACADIA Pharmaceuticals, Inc. * | | |
| | |
Aclaris Therapeutics, Inc. * | | |
Acrivon Therapeutics, Inc. * | | |
Adaptive Biotechnologies Corp. * | | |
| | |
Agilent Technologies, Inc. | | |
Agios Pharmaceuticals, Inc. * | | |
Akero Therapeutics, Inc. * | | |
Akoya Biosciences, Inc. * | | |
| | |
Schwab U.S. Equity ETFs | Annual Report45
Schwab U.S. Broad Market ETF
Portfolio Holdings as of August 31, 2023 (continued)
| | |
| | |
Allogene Therapeutics, Inc. * | | |
| | |
Alnylam Pharmaceuticals, Inc. * | | |
ALX Oncology Holdings, Inc. * | | |
| | |
Amicus Therapeutics, Inc. * | | |
Amneal Pharmaceuticals, Inc. * | | |
Amphastar Pharmaceuticals, Inc. * | | |
Amylyx Pharmaceuticals, Inc. * | | |
| | |
Anavex Life Sciences Corp. * | | |
Anika Therapeutics, Inc. * | | |
Apellis Pharmaceuticals, Inc. * | | |
| | |
Arcturus Therapeutics Holdings, Inc. * | | |
Arcus Biosciences, Inc. * | | |
Arcutis Biotherapeutics, Inc. * | | |
Arrowhead Pharmaceuticals, Inc. * | | |
| | |
Atara Biotherapeutics, Inc. * | | |
Atea Pharmaceuticals, Inc. * | | |
| | |
| | |
Avidity Biosciences, Inc. * | | |
Axsome Therapeutics, Inc. * | | |
| | |
Beam Therapeutics, Inc. * | | |
BioCryst Pharmaceuticals, Inc. * | | |
| | |
| | |
BioLife Solutions, Inc. * | | |
BioMarin Pharmaceutical, Inc. * | | |
Bio-Rad Laboratories, Inc., Class A * | | |
| | |
Bioxcel Therapeutics, Inc. * | | |
Blueprint Medicines Corp. * | | |
| | |
| | |
| | |
| | |
Cara Therapeutics, Inc. * | | |
| | |
Caribou Biosciences, Inc. * | | |
Cassava Sciences, Inc. *(a) | | |
| | |
Catalyst Pharmaceuticals, Inc. * | | |
Celldex Therapeutics, Inc. * | | |
Century Therapeutics, Inc. * | | |
Cerevel Therapeutics Holdings, Inc. * | | |
Charles River Laboratories International, Inc. * | | |
| | |
Coherus Biosciences, Inc. * | | |
Collegium Pharmaceutical, Inc. * | | |
Corcept Therapeutics, Inc. * | | |
Crinetics Pharmaceuticals, Inc. * | | |
| | |
| | |
Cullinan Oncology, Inc. * | | |
Cytek Biosciences, Inc. * | | |
| | |
| | |
Day One Biopharmaceuticals, Inc. * | | |
Deciphera Pharmaceuticals, Inc. * | | |
Denali Therapeutics, Inc. * | | |
Design Therapeutics, Inc. * | | |
Dynavax Technologies Corp. * | | |
| | |
Dyne Therapeutics, Inc. * | | |
Eagle Pharmaceuticals, Inc. * | | |
Edgewise Therapeutics, Inc. * | | |
| | |
Elanco Animal Health, Inc. * | | |
| | |
Emergent BioSolutions, Inc. * | | |
Enanta Pharmaceuticals, Inc. * | | |
Entrada Therapeutics, Inc. * | | |
| | |
| | |
| | |
| | |
Fate Therapeutics, Inc. * | | |
| | |
| | |
| | |
| | |
| | |
| | |
| | |
Halozyme Therapeutics, Inc. * | | |
Harmony Biosciences Holdings, Inc. * | | |
Heron Therapeutics, Inc. * | | |
| | |
Horizon Therapeutics plc * | | |
| | |
| | |
| | |
| | |
| | |
| | |
| | |
| | |
| | |
Inovio Pharmaceuticals, Inc. * | | |
| | |
| | |
Intellia Therapeutics, Inc. * | | |
Intra-Cellular Therapies, Inc. * | | |
| | |
Ionis Pharmaceuticals, Inc. * | | |
Iovance Biotherapeutics, Inc. * | | |
| | |
Ironwood Pharmaceuticals, Inc. * | | |
iTeos Therapeutics, Inc. * | | |
Jazz Pharmaceuticals plc * | | |
| | |
Karuna Therapeutics, Inc. * | | |
Keros Therapeutics, Inc. * | | |
Kinnate Biopharma, Inc. * | | |
| | |
| | |
| | |
| | |
Kymera Therapeutics, Inc. * | | |
Lexicon Pharmaceuticals, Inc. * | | |
Ligand Pharmaceuticals, Inc. * | | |
Lyell Immunopharma, Inc. * | | |
| | |
Madrigal Pharmaceuticals, Inc. * | | |
| | |
Maravai LifeSciences Holdings, Inc., Class A * | | |
| | |
| | |
Mersana Therapeutics, Inc. * | | |
| | |
46Schwab U.S. Equity ETFs | Annual Report
Schwab U.S. Broad Market ETF
Portfolio Holdings as of August 31, 2023 (continued)
| | |
Mettler-Toledo International, Inc. * | | |
| | |
Mind Medicine MindMed, Inc. * | | |
Mineralys Therapeutics, Inc. * | | |
Mirati Therapeutics, Inc. * | | |
| | |
Monte Rosa Therapeutics, Inc. * | | |
| | |
| | |
NanoString Technologies, Inc. * | | |
| | |
| | |
Neurocrine Biosciences, Inc. * | | |
| | |
| | |
Nurix Therapeutics, Inc. * | | |
| | |
Ocean Biomedical, Inc. *(a) | | |
| | |
| | |
| | |
Organogenesis Holdings, Inc. * | | |
| | |
Pacific Biosciences of California, Inc. * | | |
Pacira BioSciences, Inc. * | | |
| | |
| | |
Phathom Pharmaceuticals, Inc. * | | |
Phibro Animal Health Corp., Class A | | |
Pliant Therapeutics, Inc. * | | |
PMV Pharmaceuticals, Inc. * | | |
Poseida Therapeutics, Inc. * | | |
| | |
Prelude Therapeutics, Inc. * | | |
Prestige Consumer Healthcare, Inc. * | | |
| | |
Protagonist Therapeutics, Inc. * | | |
| | |
| | |
| | |
RAPT Therapeutics, Inc. * | | |
Reata Pharmaceuticals, Inc., Class A * | | |
Recursion Pharmaceuticals, Inc., Class A * | | |
Regeneron Pharmaceuticals, Inc. * | | |
| | |
Relay Therapeutics, Inc. * | | |
| | |
| | |
Revance Therapeutics, Inc. * | | |
REVOLUTION Medicines, Inc. * | | |
| | |
Rhythm Pharmaceuticals, Inc. * | | |
Rocket Pharmaceuticals, Inc. * | | |
| | |
Royalty Pharma plc, Class A | | |
Sage Therapeutics, Inc. * | | |
Sana Biotechnology, Inc. * | | |
Sarepta Therapeutics, Inc. * | | |
Scholar Rock Holding Corp. * | | |
| | |
| | |
| | |
Seres Therapeutics, Inc. * | | |
| | |
| | |
| | |
SpringWorks Therapeutics, Inc. * | | |
| | |
Stoke Therapeutics, Inc. * | | |
Supernus Pharmaceuticals, Inc. * | | |
Syndax Pharmaceuticals, Inc. * | | |
| | |
Tarsus Pharmaceuticals, Inc. * | | |
| | |
| | |
Theravance Biopharma, Inc. * | | |
Thermo Fisher Scientific, Inc. | | |
Third Harmonic Bio, Inc. * | | |
Travere Therapeutics, Inc. * | | |
| | |
| | |
Ultragenyx Pharmaceutical, Inc. * | | |
| | |
United Therapeutics Corp. * | | |
Vanda Pharmaceuticals, Inc. * | | |
| | |
| | |
Ventyx Biosciences, Inc. * | | |
| | |
| | |
Vertex Pharmaceuticals, Inc. * | | |
Verve Therapeutics, Inc. * | | |
| | |
Vir Biotechnology, Inc. * | | |
| | |
West Pharmaceutical Services, Inc. | | |
| | |
Y-mAbs Therapeutics, Inc. * | | |
Zentalis Pharmaceuticals, Inc. * | | |
| | |
| | |
| | |
|
Real Estate Management & Development 0.2% |
Anywhere Real Estate, Inc. * | | |
CBRE Group, Inc., Class A * | | |
| | |
| | |
Cushman & Wakefield plc * | | |
DigitalBridge Group, Inc. | | |
| | |
| | |
| | |
| | |
Howard Hughes Holdings, Inc. * | | |
Jones Lang LaSalle, Inc. * | | |
Kennedy-Wilson Holdings, Inc. | | |
| | |
Newmark Group, Inc., Class A | | |
Offerpad Solutions, Inc. * | | |
Opendoor Technologies, Inc. * | | |
RE/MAX Holdings, Inc., Class A | | |
| | |
Seritage Growth Properties, Class A * | | |
| | |
The RMR Group, Inc., Class A | | |
| | |
| | |
Zillow Group, Inc., Class C * | | |
| | |
|
Semiconductors & Semiconductor Equipment 7.0% |
ACM Research, Inc., Class A * | | |
Advanced Micro Devices, Inc. * | | |
Schwab U.S. Equity ETFs | Annual Report47
Schwab U.S. Broad Market ETF
Portfolio Holdings as of August 31, 2023 (continued)
| | |
Allegro MicroSystems, Inc. * | | |
Alpha & Omega Semiconductor Ltd. * | | |
| | |
| | |
| | |
| | |
Axcelis Technologies, Inc. * | | |
| | |
| | |
| | |
| | |
Credo Technology Group Holding Ltd. * | | |
| | |
| | |
| | |
| | |
| | |
| | |
| | |
| | |
| | |
Kulicke & Soffa Industries, Inc. | | |
| | |
Lattice Semiconductor Corp. * | | |
MACOM Technology Solutions Holdings, Inc. * | | |
| | |
| | |
Microchip Technology, Inc. | | |
| | |
| | |
Monolithic Power Systems, Inc. | | |
Navitas Semiconductor Corp. * | | |
| | |
| | |
| | |
| | |
| | |
| | |
| | |
| | |
| | |
| | |
Rigetti Computing, Inc. * | | |
| | |
Silicon Laboratories, Inc. * | | |
| | |
SkyWater Technology, Inc. * | | |
| | |
SMART Global Holdings, Inc. * | | |
SolarEdge Technologies, Inc. * | | |
| | |
| | |
| | |
Ultra Clean Holdings, Inc. * | | |
| | |
Veeco Instruments, Inc. * | | |
| | |
| | |
|
Software & Services 11.4% |
| | |
| | |
| | |
| | |
| | |
| | |
| | |
| | |
Akamai Technologies, Inc. * | | |
Alarm.com Holdings, Inc. * | | |
Alkami Technology, Inc. * | | |
Altair Engineering, Inc., Class A * | | |
| | |
Amplitude, Inc., Class A * | | |
| | |
Appfolio, Inc., Class A * | | |
| | |
AppLovin Corp., Class A * | | |
| | |
| | |
Atlassian Corp., Class A * | | |
Aurora Innovation, Inc. * | | |
| | |
| | |
Bentley Systems, Inc., Class B | | |
BigCommerce Holdings, Inc. * | | |
| | |
| | |
| | |
| | |
Blend Labs, Inc., Class A *(a) | | |
| | |
| | |
C3.ai, Inc., Class A *(a) | | |
Cadence Design Systems, Inc. * | | |
CCC Intelligent Solutions Holdings, Inc. * | | |
| | |
| | |
Clear Secure, Inc., Class A | | |
Clearwater Analytics Holdings, Inc., Class A * | | |
Cloudflare, Inc., Class A * | | |
Cognizant Technology Solutions Corp., Class A | | |
CommVault Systems, Inc. * | | |
Confluent, Inc., Class A * | | |
Consensus Cloud Solutions, Inc. * | | |
| | |
Crowdstrike Holdings, Inc., Class A * | | |
| | |
| | |
| | |
DigitalOcean Holdings, Inc. * | | |
| | |
Dolby Laboratories, Inc., Class A | | |
| | |
DoubleVerify Holdings, Inc. * | | |
| | |
D-Wave Quantum, Inc. *(a) | | |
| | |
| | |
E2open Parent Holdings, Inc. * | | |
| | |
| | |
Enfusion, Inc., Class A * | | |
| | |
| | |
| | |
| | |
| | |
Expensify, Inc., Class A * | | |
| | |
| | |
48Schwab U.S. Equity ETFs | Annual Report
Schwab U.S. Broad Market ETF
Portfolio Holdings as of August 31, 2023 (continued)
| | |
| | |
| | |
Freshworks, Inc., Class A * | | |
| | |
| | |
| | |
| | |
Grid Dynamics Holdings, Inc. * | | |
Guidewire Software, Inc. * | | |
HashiCorp, Inc., Class A * | | |
| | |
Informatica, Inc., Class A * | | |
Instructure Holdings, Inc. * | | |
| | |
| | |
International Business Machines Corp. | | |
| | |
| | |
| | |
| | |
| | |
LiveRamp Holdings, Inc. * | | |
Manhattan Associates, Inc. * | | |
Marathon Digital Holdings, Inc. *(a) | | |
| | |
| | |
| | |
| | |
MicroStrategy, Inc., Class A * | | |
| | |
| | |
| | |
| | |
| | |
| | |
| | |
| | |
| | |
| | |
| | |
| | |
| | |
Palantir Technologies, Inc., Class A * | | |
Palo Alto Networks, Inc. * | | |
| | |
| | |
| | |
PowerSchool Holdings, Inc., Class A * | | |
Procore Technologies, Inc. * | | |
| | |
| | |
| | |
| | |
| | |
Rackspace Technology, Inc. * | | |
| | |
RingCentral, Inc., Class A * | | |
| | |
| | |
| | |
| | |
SentinelOne, Inc., Class A * | | |
| | |
Smartsheet, Inc., Class A * | | |
Snowflake, Inc., Class A * | | |
| | |
SoundHound AI, Inc., Class A *(a) | | |
| | |
| | |
Sprinklr, Inc., Class A * | | |
Sprout Social, Inc., Class A * | | |
| | |
Squarespace, Inc., Class A * | | |
| | |
| | |
| | |
| | |
Thoughtworks Holding, Inc. * | | |
| | |
| | |
Tyler Technologies, Inc. * | | |
| | |
| | |
| | |
| | |
| | |
| | |
| | |
| | |
| | |
| | |
| | |
| | |
Zeta Global Holdings Corp., Class A * | | |
Zoom Video Communications, Inc., Class A * | | |
| | |
| | |
| | |
|
Technology Hardware & Equipment 8.3% |
| | |
| | |
Advanced Energy Industries, Inc. | | |
Aeva Technologies, Inc. * | | |
| | |
| | |
| | |
| | |
Arrow Electronics, Inc. * | | |
| | |
| | |
| | |
| | |
Benchmark Electronics, Inc. | | |
| | |
| | |
| | |
| | |
| | |
| | |
| | |
| | |
CommScope Holding Co., Inc. * | | |
Comtech Telecommunications Corp. | | |
| | |
| | |
| | |
| | |
Dell Technologies, Inc., Class C | | |
Digi International, Inc. * | | |
| | |
Evolv Technologies Holdings, Inc. * | | |
| | |
| | |
Schwab U.S. Equity ETFs | Annual Report49
Schwab U.S. Broad Market ETF
Portfolio Holdings as of August 31, 2023 (continued)
| | |
| | |
FARO Technologies, Inc. * | | |
| | |
Hewlett Packard Enterprise Co. | | |
| | |
| | |
| | |
Insight Enterprises, Inc. * | | |
| | |
| | |
| | |
| | |
| | |
Keysight Technologies, Inc. * | | |
Kimball Electronics, Inc. * | | |
| | |
Lightwave Logic, Inc. *(a) | | |
| | |
Lumentum Holdings, Inc. * | | |
Methode Electronics, Inc. | | |
| | |
Mirion Technologies, Inc. * | | |
| | |
| | |
Napco Security Technologies, Inc. | | |
National Instruments Corp. | | |
| | |
| | |
| | |
| | |
| | |
| | |
| | |
| | |
| | |
| | |
Presto Automation, Inc. * | | |
Pure Storage, Inc., Class A * | | |
Ribbon Communications, Inc. * | | |
| | |
| | |
| | |
Seagate Technology Holdings plc | | |
| | |
Super Micro Computer, Inc. * | | |
| | |
| | |
Teledyne Technologies, Inc. * | | |
| | |
| | |
| | |
| | |
| | |
Vishay Intertechnology, Inc. | | |
| | |
| | |
| | |
Zebra Technologies Corp., Class A * | | |
| | |
|
Telecommunication Services 0.8% |
| | |
| | |
| | |
Bandwidth, Inc., Class A * | | |
Cogent Communications Holdings, Inc. | | |
| | |
Consolidated Communications Holdings, Inc. * | | |
EchoStar Corp., Class A * | | |
Frontier Communications Parent, Inc. * | | |
| | |
| | |
| | |
| | |
Iridium Communications, Inc. | | |
Liberty Global plc, Class C * | | |
Liberty Latin America Ltd., Class A * | | |
Liberty Latin America Ltd., Class C * | | |
Lumen Technologies, Inc. * | | |
Radius Global Infrastructure, Inc., Class A * | | |
Shenandoah Telecommunications Co. | | |
Telephone and Data Systems, Inc. | | |
| | |
United States Cellular Corp. * | | |
Verizon Communications, Inc. | | |
| | |
|
|
Air Transport Services Group, Inc. * | | |
| | |
| | |
American Airlines Group, Inc. * | | |
| | |
Avis Budget Group, Inc. * | | |
C.H. Robinson Worldwide, Inc. | | |
| | |
| | |
| | |
Expeditors International of Washington, Inc. | | |
| | |
| | |
Frontier Group Holdings, Inc. * | | |
| | |
Hawaiian Holdings, Inc. * | | |
| | |
Hertz Global Holdings, Inc. * | | |
Hub Group, Inc., Class A * | | |
J.B. Hunt Transport Services, Inc. | | |
| | |
| | |
| | |
Knight-Swift Transportation Holdings, Inc. | | |
| | |
| | |
| | |
| | |
| | |
Old Dominion Freight Line, Inc. | | |
| | |
| | |
| | |
Schneider National, Inc., Class B | | |
| | |
| | |
| | |
Sun Country Airlines Holdings, Inc. * | | |
TuSimple Holdings, Inc., Class A * | | |
Uber Technologies, Inc. * | | |
50Schwab U.S. Equity ETFs | Annual Report
Schwab U.S. Broad Market ETF
Portfolio Holdings as of August 31, 2023 (continued)
| | |
| | |
| | |
United Airlines Holdings, Inc. * | | |
United Parcel Service, Inc., Class B | | |
Universal Logistics Holdings, Inc. | | |
| | |
| | |
| | |
|
|
| | |
| | |
| | |
| | |
American Electric Power Co., Inc. | | |
American States Water Co. | | |
American Water Works Co., Inc. | | |
| | |
| | |
| | |
| | |
California Water Service Group | | |
| | |
Chesapeake Utilities Corp. | | |
Clearway Energy, Inc., Class C | | |
| | |
Consolidated Edison, Inc. | | |
Constellation Energy Corp. | | |
| | |
| | |
| | |
| | |
| | |
Essential Utilities, Inc. | | |
| | |
| | |
| | |
| | |
Hawaiian Electric Industries, Inc. (a) | | |
| | |
| | |
| | |
Montauk Renewables, Inc. * | | |
| | |
New Jersey Resources Corp. | | |
| | |
| | |
Northwest Natural Holding Co. | | |
| | |
| | |
| | |
| | |
| | |
| | |
| | |
Pinnacle West Capital Corp. | | |
| | |
Portland General Electric Co. | | |
| | |
| | |
Public Service Enterprise Group, Inc. | | |
| | |
| | |
Southwest Gas Holdings, Inc. | | |
| | |
Sunnova Energy International, Inc. *(a) | | |
| | |
| | |
| | |
| | |
| | |
| | |
| | |
| | |
| | |
Total Common Stocks
(Cost $14,900,983,954) | |
| | |
SHORT-TERM INVESTMENTS 0.2% OF NET ASSETS |
|
|
State Street Institutional U.S. Government Money Market Fund, Premier Class 5.28% (e) | | |
State Street Institutional U.S. Government Money Market Fund, Premier Class 5.28% (e)(f) | | |
| | |
Total Short-Term Investments
(Cost $44,272,795) | |
Total Investments in Securities
(Cost $14,945,256,749) | |
| | | CURRENT VALUE/
UNREALIZED
APPRECIATION
($) |
|
| | | |
S&P 500 Index, e-mini, expires 09/15/23 | | | |
| Non-income producing security. |
| All or a portion of this security is on loan. Securities on loan were valued at $27,852,027. |
| On October 15, 2023, the issuer filed for bankruptcy. |
| Fair valued using significant unobservable inputs (see financial note 2(a), Securities for which no quoted value is available, for additional information). |
| Issuer is affiliated with the fund’s investment adviser. |
| The rate shown is the annualized 7-day yield. |
| Security purchased with cash collateral received for securities on loan. |
| Real Estate Investment Trust |
Schwab U.S. Equity ETFs | Annual Report51
Schwab U.S. Broad Market ETF
Portfolio Holdings as of August 31, 2023 (continued)
Below is a summary of the fund’s transactions with affiliated issuers during the period ended August 31, 2023:
| | | | | NET CHANGE IN UNREALIZED APPRECIATION (DEPRECIATION) | | BALANCE OF SHARES HELD AT 8/31/23 | |
COMMON STOCKS 0.2% OF NET ASSETS |
|
|
| | | | | | | | |
The following is a summary of the inputs used to value the fund’s investments as of August 31, 2023 (see financial note 2(a) for additional information):
| QUOTED PRICES IN
ACTIVE MARKETS FOR
IDENTICAL ASSETS
(LEVEL 1) | OTHER SIGNIFICANT
OBSERVABLE INPUTS
(LEVEL 2) | SIGNIFICANT
UNOBSERVABLE INPUTS
(LEVEL 3) | |
| | | | |
| | | | |
| | | | |
Health Care Equipment & Services | | | | |
Pharmaceuticals, Biotechnology & Life Sciences | | | | |
Telecommunication Services | | | | |
| | | | |
| | | | |
| | | | |
| Level 3 amount shown includes securities determined to have no value at August 31, 2023. |
| As categorized in the Portfolio Holdings. |
| Futures contracts are reported at cumulative unrealized appreciation or depreciation. |
Fund investments in mutual funds are classified as Level 1, without consideration to the classification level of the underlying
securities held by the mutual funds, which could be Level 1, Level 2 or Level 3.
52Schwab U.S. Equity ETFs | Annual Report
Schwab U.S. Broad Market ETF
Statement of Assets and Liabilities
As of August 31, 2023
|
Investments in securities, at value - affiliated (cost $35,699,975) | | |
Investments in securities, at value - unaffiliated (cost $14,909,556,774) including securities on loan of $27,852,027 | | |
| | |
Deposit with broker for futures contracts | | |
| | |
| | |
| | |
Income from securities on loan | | |
| | |
|
|
Collateral held for securities on loan | | |
| | |
| | |
| | |
Variation margin on futures contracts | | |
| | |
| | |
|
|
Capital received from investors | | |
Total distributable earnings | | |
| | |
Schwab U.S. Equity ETFs | Annual Report53
Schwab U.S. Broad Market ETF
Statement of Operations
For the period September 1, 2022 through August 31, 2023 |
|
Dividends received from securities - unaffiliated (net of foreign withholding tax of $96,964) | | |
Dividends received from securities - affiliated | | |
| | |
| | |
|
|
| | |
| | |
| | |
| | |
|
REALIZED AND UNREALIZED GAINS (LOSSES) |
Net realized losses on sales of securities - affiliated | | |
Net realized losses on sales of securities - unaffiliated | | |
Net realized gains on sales of in-kind redemptions - affiliated | | |
Net realized gains on sales of in-kind redemptions - unaffiliated | | |
Net realized gains on futures contracts | | |
| | |
Net change in unrealized appreciation (depreciation) on securities - affiliated | | |
Net change in unrealized appreciation (depreciation) on securities - unaffiliated | | |
Net change in unrealized appreciation (depreciation) on futures contracts | | |
Net change in unrealized appreciation (depreciation) | | |
Net realized and unrealized gains | | |
Increase in net assets resulting from operations | | |
| Proxy fees are non-routine expenses (see financial note 2(e) for additional information). |
54Schwab U.S. Equity ETFs | Annual Report
Schwab U.S. Broad Market ETF
Statement of Changes in Net Assets
For the current and prior report periods
|
| | |
| | | |
| | | |
Net change in unrealized appreciation (depreciation) | | | |
Increase (decrease) in net assets resulting from operations | | | |
|
DISTRIBUTIONS TO SHAREHOLDERS |
| | | |
TRANSACTIONS IN FUND SHARES1 |
| | |
| | | | | |
| | | | | |
| | | | | |
Net transactions in fund shares | | | | | |
|
SHARES OUTSTANDING AND NET ASSETS1 |
| | |
| | | | | |
| | | | | |
Total increase (decrease) | | | | | |
| | | | | |
| For the period ended August 31, 2022, transactions in fund shares have been retroactively adjusted to reflect a 2-for-1 share split effective after market close on March 10, 2022. The retroactive adjustment of the share split does not change the transaction in fund share values (see financial note 12 for additional information). |
Schwab U.S. Equity ETFs | Annual Report55
Financial Statements
| | | | | | |
|
Net asset value at beginning of period | | | | | | |
Income (loss) from investment operations: | | | | | | |
Net investment income (loss)1 | | | | | | |
Net realized and unrealized gains (losses) | | | | | | |
Total from investment operations | | | | | | |
| | | | | | |
Distributions from net investment income | | | | | | |
Net asset value at end of period | | | | | | |
| | | | | | |
|
Ratios to average net assets: | | | | | | |
| | | | | | |
Net investment income (loss) | | | | | | |
| | | | | | |
Net assets, end of period (x 1,000,000) | | | | | | |
| Calculated based on the average shares outstanding during the period. |
| Ratio includes less than 0.005% of non-routine proxy expenses. |
| Portfolio turnover rate excludes securities received or delivered from processing of in-kind creations or redemptions. |
56Schwab U.S. Equity ETFs | Annual Report
Portfolio Holdings as of August 31, 2023
This section shows all the securities in the fund’s portfolio and their values as of the report date.
The fund files its complete schedule of portfolio holdings with the U.S. Securities and Exchange Commission (SEC) for the first and third quarters of each fiscal year on Form N-PORT Part F. The fund’s Form N-PORT Part F is available on the SEC’s website at www.sec.gov. You can also obtain this information at no cost on the fund’s website at www.schwabassetmanagement.com/schwabetfs_prospectus, by calling 1-866-414-6349, or by sending an email request to orders@mysummaryprospectus.com. The fund also makes available its complete schedule of portfolio holdings on a daily basis on the fund’s website.
| | |
COMMON STOCKS 99.8% OF NET ASSETS |
|
Automobiles & Components 2.1% |
| | |
| | |
| | |
| | |
| | |
| | |
| | |
| | |
| | |
| | |
Rivian Automotive, Inc., Class A * | | |
| | |
| | |
| | |
|
|
| | |
| | |
| | |
| | |
| | |
Citizens Financial Group, Inc. | | |
| | |
Commerce Bancshares, Inc. | | |
Cullen/Frost Bankers, Inc. | | |
| | |
| | |
| | |
First Citizens BancShares, Inc., Class A | | |
First Financial Bankshares, Inc. | | |
| | |
First Interstate BancSystem, Inc., Class A | | |
| | |
| | |
Huntington Bancshares, Inc. | | |
| | |
| | |
| | |
New York Community Bancorp, Inc. | | |
| | |
Pinnacle Financial Partners, Inc. | | |
| | |
Prosperity Bancshares, Inc. | | |
| | |
ServisFirst Bancshares, Inc. | | |
| | |
| | |
The PNC Financial Services Group, Inc. | | |
| | |
| | |
| | |
| | |
| | |
| | |
| | |
| | |
| | |
| | |
| | |
| | |
|
|
| | |
| | |
| | |
Advanced Drainage Systems, Inc. | | |
| | |
| | |
| | |
| | |
| | |
Bloom Energy Corp., Class A * | | |
Builders FirstSource, Inc. * | | |
| | |
| | |
| | |
| | |
ChargePoint Holdings, Inc. *(a) | | |
| | |
| | |
| | |
| | |
| | |
| | |
| | |
| | |
| | |
| | |
| | |
| | |
Fortune Brands Innovations, Inc. | | |
| | |
| | |
| | |
| | |
| | |
| | |
Honeywell International, Inc. | | |
| | |
| | |
Huntington Ingalls Industries, Inc. | | |
| | |
Illinois Tool Works, Inc. | | |
| | |
| | |
Johnson Controls International plc | | |
L3Harris Technologies, Inc. | | |
Lennox International, Inc. | | |
Schwab U.S. Equity ETFs | Annual Report57
Portfolio Holdings as of August 31, 2023 (continued)
| | |
Lincoln Electric Holdings, Inc. | | |
| | |
| | |
| | |
| | |
MDU Resources Group, Inc. | | |
| | |
| | |
| | |
| | |
| | |
| | |
| | |
| | |
| | |
| | |
| | |
| | |
| | |
| | |
Rockwell Automation, Inc. | | |
| | |
Sensata Technologies Holding plc | | |
SiteOne Landscape Supply, Inc. * | | |
| | |
Stanley Black & Decker, Inc. | | |
| | |
| | |
| | |
| | |
| | |
| | |
| | |
| | |
| | |
| | |
| | |
| | |
| | |
| | |
| | |
WESCO International, Inc. | | |
Westinghouse Air Brake Technologies Corp. | | |
WillScot Mobile Mini Holdings Corp. * | | |
| | |
| | |
Zurn Elkay Water Solutions Corp., Class C | | |
| | |
|
Commercial & Professional Services 1.5% |
| | |
Automatic Data Processing, Inc. | | |
Booz Allen Hamilton Holding Corp., Class A | | |
Broadridge Financial Solutions, Inc. | | |
CACI International, Inc., Class A * | | |
Casella Waste Systems, Inc., Class A * | | |
Ceridian HCM Holding, Inc. * | | |
| | |
| | |
| | |
| | |
| | |
Driven Brands Holdings, Inc. * | | |
Dun & Bradstreet Holdings, Inc. | | |
| | |
| | |
ExlService Holdings, Inc. * | | |
| | |
| | |
| | |
| | |
| | |
| | |
| | |
| | |
| | |
| | |
| | |
Paylocity Holding Corp. * | | |
| | |
Robert Half International, Inc. | | |
| | |
Science Applications International Corp. | | |
SS&C Technologies Holdings, Inc. | | |
| | |
| | |
| | |
| | |
| | |
| | |
| | |
|
Consumer Discretionary Distribution & Retail 5.3% |
| | |
| | |
| | |
| | |
| | |
| | |
Burlington Stores, Inc. * | | |
| | |
Dick's Sporting Goods, Inc. | | |
| | |
| | |
| | |
Floor & Decor Holdings, Inc., Class A * | | |
GameStop Corp., Class A *(a) | | |
| | |
| | |
| | |
| | |
| | |
| | |
O'Reilly Automotive, Inc. * | | |
Penske Automotive Group, Inc. | | |
| | |
| | |
| | |
| | |
| | |
| | |
| | |
| | |
| | |
| | |
|
Consumer Durables & Apparel 1.0% |
| | |
| | |
| | |
| | |
58Schwab U.S. Equity ETFs | Annual Report
Portfolio Holdings as of August 31, 2023 (continued)
| | |
| | |
| | |
| | |
| | |
| | |
| | |
Lululemon Athletica, Inc. * | | |
| | |
Mohawk Industries, Inc. * | | |
| | |
| | |
| | |
| | |
| | |
Skechers U.S.A., Inc., Class A * | | |
| | |
Tempur Sealy International, Inc. | | |
| | |
| | |
| | |
| | |
| | |
|
|
| | |
| | |
| | |
| | |
| | |
Caesars Entertainment, Inc. * | | |
| | |
Chipotle Mexican Grill, Inc. * | | |
Choice Hotels International, Inc. | | |
| | |
| | |
| | |
DoorDash, Inc., Class A * | | |
DraftKings, Inc., Class A * | | |
| | |
| | |
Hilton Grand Vacations, Inc. * | | |
Hilton Worldwide Holdings, Inc. | | |
Hyatt Hotels Corp., Class A | | |
| | |
| | |
Marriott International, Inc., Class A | | |
Marriott Vacations Worldwide Corp. | | |
| | |
MGM Resorts International | | |
Norwegian Cruise Line Holdings Ltd. * | | |
Penn Entertainment, Inc. * | | |
Planet Fitness, Inc., Class A * | | |
Royal Caribbean Cruises Ltd. * | | |
Service Corp. International | | |
| | |
| | |
| | |
| | |
Wyndham Hotels & Resorts, Inc. | | |
| | |
| | |
| | |
|
Consumer Staples Distribution & Retail 1.7% |
Albertsons Cos., Inc., Class A | | |
BJ's Wholesale Club Holdings, Inc. * | | |
| | |
Casey's General Stores, Inc. | | |
| | |
| | |
| | |
Performance Food Group Co. * | | |
| | |
| | |
| | |
| | |
Walgreens Boots Alliance, Inc. | | |
| | |
| | |
|
|
| | |
| | |
| | |
| | |
| | |
| | |
| | |
| | |
| | |
| | |
| | |
| | |
| | |
| | |
| | |
| | |
| | |
| | |
| | |
| | |
| | |
| | |
| | |
| | |
Magnolia Oil & Gas Corp., Class A | | |
| | |
| | |
| | |
| | |
New Fortress Energy, Inc. | | |
| | |
Occidental Petroleum Corp. | | |
| | |
| | |
PBF Energy, Inc., Class A | | |
| | |
Pioneer Natural Resources Co. | | |
| | |
| | |
| | |
Southwestern Energy Co. * | | |
| | |
| | |
| | |
| | |
| | |
| | |
|
Equity Real Estate Investment Trusts (REITs) 2.5% |
| | |
Alexandria Real Estate Equities, Inc. | | |
American Homes 4 Rent, Class A | | |
Schwab U.S. Equity ETFs | Annual Report59
Portfolio Holdings as of August 31, 2023 (continued)
| | |
| | |
Americold Realty Trust, Inc. | | |
Apartment Income REIT Corp. | | |
AvalonBay Communities, Inc. | | |
| | |
Brixmor Property Group, Inc. | | |
| | |
| | |
| | |
Digital Realty Trust, Inc. | | |
EastGroup Properties, Inc. | | |
| | |
Equity LifeStyle Properties, Inc. | | |
| | |
Essex Property Trust, Inc. | | |
Extra Space Storage, Inc. | | |
Federal Realty Investment Trust | | |
First Industrial Realty Trust, Inc. | | |
Gaming & Leisure Properties, Inc. | | |
Healthcare Realty Trust, Inc. | | |
Healthpeak Properties, Inc. | | |
Host Hotels & Resorts, Inc. | | |
Independence Realty Trust, Inc. | | |
| | |
| | |
| | |
| | |
| | |
Lamar Advertising Co., Class A | | |
Medical Properties Trust, Inc. | | |
Mid-America Apartment Communities, Inc. | | |
National Storage Affiliates Trust | | |
| | |
Omega Healthcare Investors, Inc. | | |
| | |
| | |
| | |
| | |
| | |
Rexford Industrial Realty, Inc. | | |
Ryman Hospitality Properties, Inc. | | |
| | |
Simon Property Group, Inc. | | |
Spirit Realty Capital, Inc. | | |
| | |
| | |
| | |
| | |
| | |
| | |
| | |
| | |
| | |
| | |
| | |
|
|
Affiliated Managers Group, Inc. | | |
| | |
| | |
| | |
| | |
Ameriprise Financial, Inc. | | |
Annaly Capital Management, Inc. | | |
Apollo Global Management, Inc. | | |
Ares Management Corp., Class A | | |
| | |
Berkshire Hathaway, Inc., Class B * | | |
| | |
Blackstone Mortgage Trust, Inc., Class A | | |
| | |
| | |
| | |
Capital One Financial Corp. | | |
Cboe Global Markets, Inc. | | |
| | |
Coinbase Global, Inc., Class A * | | |
Credit Acceptance Corp. * | | |
Discover Financial Services | | |
| | |
| | |
Euronet Worldwide, Inc. * | | |
FactSet Research Systems, Inc. | | |
Fidelity National Information Services, Inc. | | |
| | |
FleetCor Technologies, Inc. * | | |
| | |
| | |
Interactive Brokers Group, Inc., Class A | | |
Intercontinental Exchange, Inc. | | |
| | |
Jack Henry & Associates, Inc. | | |
Jefferies Financial Group, Inc. | | |
| | |
LPL Financial Holdings, Inc. | | |
MarketAxess Holdings, Inc. | | |
Mastercard, Inc., Class A | | |
| | |
| | |
| | |
| | |
| | |
| | |
| | |
| | |
| | |
Raymond James Financial, Inc. | | |
| | |
Robinhood Markets, Inc., Class A * | | |
| | |
| | |
SoFi Technologies, Inc. * | | |
Starwood Property Trust, Inc. | | |
| | |
| | |
| | |
T. Rowe Price Group, Inc. | | |
The Bank of New York Mellon Corp. | | |
| | |
The Charles Schwab Corp. (b) | | |
The Goldman Sachs Group, Inc. | | |
| | |
| | |
Tradeweb Markets, Inc., Class A | | |
| | |
| | |
| | |
| | |
|
Food, Beverage & Tobacco 3.0% |
| | |
Archer-Daniels-Midland Co. | | |
Brown-Forman Corp., Class B | | |
60Schwab U.S. Equity ETFs | Annual Report
Portfolio Holdings as of August 31, 2023 (continued)
| | |
| | |
| | |
| | |
| | |
Constellation Brands, Inc., Class A | | |
Darling Ingredients, Inc. * | | |
| | |
| | |
| | |
| | |
| | |
| | |
Lamb Weston Holdings, Inc. | | |
| | |
McCormick & Co., Inc. Non Voting Shares | | |
Molson Coors Beverage Co., Class B | | |
Mondelez International, Inc., Class A | | |
| | |
National Beverage Corp. * | | |
| | |
Philip Morris International, Inc. | | |
| | |
| | |
| | |
| | |
| | |
| | |
| | |
Tyson Foods, Inc., Class A | | |
| | |
|
Health Care Equipment & Services 5.3% |
| | |
Acadia Healthcare Co., Inc. * | | |
| | |
| | |
AMN Healthcare Services, Inc. * | | |
Baxter International, Inc. | | |
| | |
Boston Scientific Corp. * | | |
| | |
| | |
| | |
| | |
| | |
| | |
| | |
| | |
Edwards Lifesciences Corp. * | | |
| | |
| | |
| | |
| | |
Globus Medical, Inc., Class A * | | |
| | |
| | |
| | |
| | |
| | |
| | |
IDEXX Laboratories, Inc. * | | |
Inspire Medical Systems, Inc. * | | |
| | |
Intuitive Surgical, Inc. * | | |
iRhythm Technologies, Inc. * | | |
Laboratory Corp. of America Holdings | | |
| | |
Lantheus Holdings, Inc. * | | |
| | |
| | |
| | |
Molina Healthcare, Inc. * | | |
| | |
| | |
Option Care Health, Inc. * | | |
| | |
| | |
Privia Health Group, Inc. * | | |
| | |
| | |
| | |
| | |
Shockwave Medical, Inc. * | | |
| | |
| | |
| | |
| | |
| | |
| | |
| | |
| | |
| | |
| | |
Universal Health Services, Inc., Class B | | |
Veeva Systems, Inc., Class A * | | |
Zimmer Biomet Holdings, Inc. | | |
| | |
|
Household & Personal Products 1.4% |
Church & Dwight Co., Inc. | | |
| | |
| | |
| | |
| | |
| | |
Reynolds Consumer Products, Inc. | | |
| | |
The Estee Lauder Cos., Inc., Class A | | |
| | |
| | |
|
|
| | |
American Financial Group, Inc. | | |
American International Group, Inc. | | |
| | |
Arch Capital Group Ltd. * | | |
Arthur J. Gallagher & Co. | | |
| | |
Axis Capital Holdings Ltd. | | |
| | |
| | |
Cincinnati Financial Corp. | | |
| | |
Erie Indemnity Co., Class A | | |
| | |
F&G Annuities & Life, Inc. | | |
Fidelity National Financial, Inc. | | |
First American Financial Corp. | | |
| | |
Kinsale Capital Group, Inc. | | |
| | |
| | |
Schwab U.S. Equity ETFs | Annual Report61
Portfolio Holdings as of August 31, 2023 (continued)
| | |
| | |
Marsh & McLennan Cos., Inc. | | |
| | |
Old Republic International Corp. | | |
| | |
Principal Financial Group, Inc. | | |
Prudential Financial, Inc. | | |
Reinsurance Group of America, Inc. | | |
RenaissanceRe Holdings Ltd. | | |
| | |
Ryan Specialty Holdings, Inc., Class A * | | |
Selective Insurance Group, Inc. | | |
| | |
The Hanover Insurance Group, Inc. | | |
The Hartford Financial Services Group, Inc. | | |
| | |
| | |
| | |
| | |
| | |
| | |
|
|
Air Products and Chemicals, Inc. | | |
| | |
| | |
| | |
| | |
| | |
| | |
Axalta Coating Systems Ltd. * | | |
| | |
| | |
| | |
| | |
CF Industries Holdings, Inc. | | |
| | |
| | |
| | |
| | |
| | |
| | |
| | |
| | |
| | |
| | |
| | |
| | |
Graphic Packaging Holding Co. | | |
| | |
International Flavors & Fragrances, Inc. | | |
| | |
| | |
| | |
| | |
LyondellBasell Industries N.V., Class A | | |
Martin Marietta Materials, Inc. | | |
| | |
| | |
| | |
| | |
Packaging Corp. of America | | |
| | |
Reliance Steel & Aluminum Co. | | |
| | |
| | |
| | |
| | |
| | |
| | |
| | |
| | |
| | |
| | |
United States Steel Corp. | | |
| | |
| | |
| | |
| | |
|
Media & Entertainment 7.5% |
Activision Blizzard, Inc. | | |
Alphabet, Inc., Class A * | | |
Alphabet, Inc., Class C * | | |
AMC Entertainment Holdings, Inc., Class A * | | |
Atlanta Braves Holdings, Inc., Class C * | | |
| | |
Charter Communications, Inc., Class A * | | |
| | |
DISH Network Corp., Class A * | | |
| | |
Endeavor Group Holdings, Inc., Class A * | | |
| | |
Getty Images Holdings, Inc. * | | |
| | |
Liberty Broadband Corp., Class C * | | |
Liberty Media Corp.-Liberty Formula One, Class C * | | |
Liberty Media Corp.-Liberty Live, Class C * | | |
Liberty Media Corp.-Liberty SiriusXM, Class C * | | |
Live Nation Entertainment, Inc. * | | |
| | |
Meta Platforms, Inc., Class A * | | |
| | |
| | |
Nexstar Media Group, Inc., Class A | | |
| | |
Paramount Global, Class B | | |
Pinterest, Inc., Class A * | | |
| | |
| | |
| | |
Sirius XM Holdings, Inc. (a) | | |
| | |
Take-Two Interactive Software, Inc. * | | |
| | |
The Interpublic Group of Cos., Inc. | | |
The New York Times Co., Class A | | |
The Trade Desk, Inc., Class A * | | |
| | |
Warner Bros Discovery, Inc. * | | |
ZoomInfo Technologies, Inc. * | | |
| | |
|
Pharmaceuticals, Biotechnology & Life Sciences 7.7% |
| | |
Agilent Technologies, Inc. | | |
Alnylam Pharmaceuticals, Inc. * | | |
| | |
Apellis Pharmaceuticals, Inc. * | | |
62Schwab U.S. Equity ETFs | Annual Report
Portfolio Holdings as of August 31, 2023 (continued)
| | |
Arrowhead Pharmaceuticals, Inc. * | | |
| | |
| | |
| | |
BioMarin Pharmaceutical, Inc. * | | |
Bio-Rad Laboratories, Inc., Class A * | | |
| | |
Blueprint Medicines Corp. * | | |
| | |
| | |
| | |
Cerevel Therapeutics Holdings, Inc. * | | |
Charles River Laboratories International, Inc. * | | |
| | |
| | |
| | |
Elanco Animal Health, Inc. * | | |
| | |
| | |
| | |
| | |
| | |
Halozyme Therapeutics, Inc. * | | |
Horizon Therapeutics plc * | | |
| | |
| | |
Intellia Therapeutics, Inc. * | | |
Intra-Cellular Therapies, Inc. * | | |
Ionis Pharmaceuticals, Inc. * | | |
| | |
Jazz Pharmaceuticals plc * | | |
| | |
Karuna Therapeutics, Inc. * | | |
| | |
| | |
Mettler-Toledo International, Inc. * | | |
Mirati Therapeutics, Inc. * | | |
| | |
| | |
Neurocrine Biosciences, Inc. * | | |
| | |
| | |
| | |
Regeneron Pharmaceuticals, Inc. * | | |
| | |
| | |
Royalty Pharma plc, Class A | | |
Sarepta Therapeutics, Inc. * | | |
| | |
| | |
| | |
Thermo Fisher Scientific, Inc. | | |
United Therapeutics Corp. * | | |
Vertex Pharmaceuticals, Inc. * | | |
| | |
| | |
West Pharmaceutical Services, Inc. | | |
| | |
| | |
|
Real Estate Management & Development 0.2% |
CBRE Group, Inc., Class A * | | |
| | |
Jones Lang LaSalle, Inc. * | | |
| | |
Zillow Group, Inc., Class C * | | |
| | |
|
Semiconductors & Semiconductor Equipment 7.3% |
Advanced Micro Devices, Inc. * | | |
Allegro MicroSystems, Inc. * | | |
| | |
| | |
| | |
| | |
| | |
| | |
| | |
| | |
GLOBALFOUNDRIES, Inc. *(a) | | |
| | |
| | |
| | |
Lattice Semiconductor Corp. * | | |
| | |
Microchip Technology, Inc. | | |
| | |
| | |
Monolithic Power Systems, Inc. | | |
| | |
| | |
| | |
| | |
| | |
| | |
SolarEdge Technologies, Inc. * | | |
| | |
| | |
| | |
| | |
| | |
| | |
|
Software & Services 11.6% |
| | |
| | |
Akamai Technologies, Inc. * | | |
| | |
| | |
AppLovin Corp., Class A * | | |
| | |
| | |
Bentley Systems, Inc., Class B | | |
| | |
| | |
Cadence Design Systems, Inc. * | | |
CCC Intelligent Solutions Holdings, Inc. * | | |
Cloudflare, Inc., Class A * | | |
Cognizant Technology Solutions Corp., Class A | | |
Crowdstrike Holdings, Inc., Class A * | | |
| | |
| | |
Dolby Laboratories, Inc., Class A | | |
DoubleVerify Holdings, Inc. * | | |
| | |
| | |
| | |
| | |
| | |
| | |
Schwab U.S. Equity ETFs | Annual Report63
Portfolio Holdings as of August 31, 2023 (continued)
| | |
| | |
| | |
| | |
| | |
| | |
Guidewire Software, Inc. * | | |
| | |
Informatica, Inc., Class A * | | |
International Business Machines Corp. | | |
| | |
Manhattan Associates, Inc. * | | |
| | |
| | |
| | |
| | |
| | |
| | |
Palantir Technologies, Inc., Class A * | | |
Palo Alto Networks, Inc. * | | |
Procore Technologies, Inc. * | | |
| | |
| | |
| | |
| | |
SentinelOne, Inc., Class A * | | |
| | |
Smartsheet, Inc., Class A * | | |
Snowflake, Inc., Class A * | | |
| | |
| | |
| | |
| | |
| | |
Tyler Technologies, Inc. * | | |
| | |
| | |
| | |
| | |
| | |
Zoom Video Communications, Inc., Class A * | | |
| | |
| | |
|
Technology Hardware & Equipment 8.5% |
| | |
| | |
| | |
Arrow Electronics, Inc. * | | |
| | |
| | |
| | |
| | |
| | |
| | |
| | |
Dell Technologies, Inc., Class C | | |
| | |
Hewlett Packard Enterprise Co. | | |
| | |
| | |
| | |
| | |
Keysight Technologies, Inc. * | | |
| | |
Lumentum Holdings, Inc. * | | |
| | |
| | |
National Instruments Corp. | | |
| | |
| | |
Pure Storage, Inc., Class A * | | |
| | |
Seagate Technology Holdings plc | | |
| | |
| | |
Teledyne Technologies, Inc. * | | |
| | |
| | |
| | |
Zebra Technologies Corp., Class A * | | |
| | |
|
Telecommunication Services 0.8% |
| | |
Frontier Communications Parent, Inc. * | | |
| | |
Iridium Communications, Inc. | | |
Liberty Global plc, Class C * | | |
Lumen Technologies, Inc. * | | |
| | |
Verizon Communications, Inc. | | |
| | |
|
|
| | |
American Airlines Group, Inc. * | | |
Avis Budget Group, Inc. * | | |
C.H. Robinson Worldwide, Inc. | | |
| | |
| | |
Expeditors International of Washington, Inc. | | |
| | |
| | |
Hertz Global Holdings, Inc. * | | |
J.B. Hunt Transport Services, Inc. | | |
Knight-Swift Transportation Holdings, Inc. | | |
| | |
| | |
| | |
Old Dominion Freight Line, Inc. | | |
| | |
| | |
| | |
Uber Technologies, Inc. * | | |
| | |
U-Haul Holding Co.,Non Voting | | |
| | |
United Airlines Holdings, Inc. * | | |
United Parcel Service, Inc., Class B | | |
| | |
| | |
|
|
| | |
| | |
American Electric Power Co., Inc. | | |
American Water Works Co., Inc. | | |
| | |
| | |
| | |
64Schwab U.S. Equity ETFs | Annual Report
Portfolio Holdings as of August 31, 2023 (continued)
| | |
| | |
| | |
Consolidated Edison, Inc. | | |
Constellation Energy Corp. | | |
| | |
| | |
| | |
| | |
| | |
Essential Utilities, Inc. | | |
| | |
| | |
| | |
| | |
Hawaiian Electric Industries, Inc. | | |
| | |
| | |
New Jersey Resources Corp. | | |
| | |
| | |
| | |
| | |
| | |
| | |
| | |
Pinnacle West Capital Corp. | | |
| | |
Portland General Electric Co. | | |
| | |
Public Service Enterprise Group, Inc. | | |
| | |
Southwest Gas Holdings, Inc. | | |
| | |
| | |
| | |
| | |
| | |
| | |
| | |
Total Common Stocks
(Cost $2,262,521,186) | |
| | |
SHORT-TERM INVESTMENTS 0.1% OF NET ASSETS |
|
|
State Street Institutional U.S. Government Money Market Fund, Premier Class 5.28% (d) | | |
State Street Institutional U.S. Government Money Market Fund, Premier Class 5.28% (d)(e) | | |
| | |
Total Short-Term Investments
(Cost $2,290,736) | |
Total Investments in Securities
(Cost $2,264,811,922) | |
| | | CURRENT VALUE/
UNREALIZED
APPRECIATION
($) |
|
| | | |
S&P 500 Index, e-mini, expires 09/15/23 | | | |
| Non-income producing security. |
| All or a portion of this security is on loan. Securities on loan were valued at $1,074,020. |
| Issuer is affiliated with the fund’s investment adviser. |
| Fair valued using significant unobservable inputs (see financial note 2(a), Securities for which no quoted value is available, for additional information). |
| The rate shown is the annualized 7-day yield. |
| Security purchased with cash collateral received for securities on loan. |
| Real Estate Investment Trust |
Below is a summary of the fund’s transactions with affiliated issuers during the period ended August 31, 2023:
| | | | | NET CHANGE IN UNREALIZED APPRECIATION (DEPRECIATION) | | BALANCE OF SHARES HELD AT 8/31/23 | |
COMMON STOCKS 0.2% OF NET ASSETS |
|
|
| | | | | | | | |
Schwab U.S. Equity ETFs | Annual Report65
Portfolio Holdings as of August 31, 2023 (continued)
The following is a summary of the inputs used to value the fund’s investments as of August 31, 2023 (see financial note 2(a) for additional information):
| QUOTED PRICES IN
ACTIVE MARKETS FOR
IDENTICAL ASSETS
(LEVEL 1) | OTHER SIGNIFICANT
OBSERVABLE INPUTS
(LEVEL 2) | SIGNIFICANT
UNOBSERVABLE INPUTS
(LEVEL 3) | |
| | | | |
| | | | |
Telecommunication Services | | | | |
| | | | |
| | | | |
| | | | |
| As categorized in the Portfolio Holdings. |
| Futures contracts are reported at cumulative unrealized appreciation or depreciation. |
Fund investments in mutual funds are classified as Level 1, without consideration to the classification level of the underlying
securities held by the mutual funds, which could be Level 1, Level 2 or Level 3.
66Schwab U.S. Equity ETFs | Annual Report
Statement of Assets and Liabilities
As of August 31, 2023
|
Investments in securities, at value - affiliated (cost $5,970,303) | | |
Investments in securities, at value - unaffiliated (cost $2,258,841,619) including securities on loan of $1,074,020 | | |
| | |
Deposit with broker for futures contracts | | |
| | |
| | |
| | |
Income from securities on loan | | |
| | |
| | |
|
|
Collateral held for securities on loan | | |
| | |
| | |
| | |
Variation margin on futures contracts | | |
| | |
| | |
|
|
Capital received from investors | | |
Total distributable earnings | | |
| | |
Schwab U.S. Equity ETFs | Annual Report67
Statement of Operations
For the period September 1, 2022 through August 31, 2023 |
|
Dividends received from securities - unaffiliated (net of foreign withholding tax of $10,619) | | |
Dividends received from securities - affiliated | | |
| | |
| | |
|
|
| | |
| | |
| | |
|
REALIZED AND UNREALIZED GAINS (LOSSES) |
Net realized losses on sales of securities - affiliated | | |
Net realized losses on sales of securities - unaffiliated | | |
Net realized gains on sales of in-kind redemptions - affiliated | | |
Net realized gains on sales of in-kind redemptions - unaffiliated | | |
Net realized gains on futures contracts | | |
| | |
Net change in unrealized appreciation (depreciation) on securities - affiliated | | |
Net change in unrealized appreciation (depreciation) on securities - unaffiliated | | |
Net change in unrealized appreciation (depreciation) on futures contracts | | |
Net change in unrealized appreciation (depreciation) | | |
Net realized and unrealized gains | | |
Increase in net assets resulting from operations | | |
68Schwab U.S. Equity ETFs | Annual Report
Statement of Changes in Net Assets
For the current and prior report periods
|
| | |
| | | |
Net realized gains (losses) | | | |
Net change in unrealized appreciation (depreciation) | | | |
Increase (decrease) in net assets resulting from operations | | | |
|
DISTRIBUTIONS TO SHAREHOLDERS |
| | | |
TRANSACTIONS IN FUND SHARES |
| | |
| | | | | |
| | | | | |
| | | | | |
Net transactions in fund shares | | | | | |
|
SHARES OUTSTANDING AND NET ASSETS |
| | |
| | | | | |
| | | | | |
| | | | | |
| | | | | |
Schwab U.S. Equity ETFs | Annual Report69
Schwab U.S. Large-Cap ETF
Financial Statements
| | | | | | |
|
Net asset value at beginning of period | | | | | | |
Income (loss) from investment operations: | | | | | | |
Net investment income (loss)2 | | | | | | |
Net realized and unrealized gains (losses) | | | | | | |
Total from investment operations | | | | | | |
| | | | | | |
Distributions from net investment income | | | | | | |
Net asset value at end of period | | | | | | |
| | | | | | |
|
Ratios to average net assets: | | | | | | |
| | | | | | |
Net investment income (loss) | | | | | | |
| | | | | | |
Net assets, end of period (x 1,000,000) | | | | | | |
| Per-Share Data has been retroactively adjusted to reflect a 2-for-1 share split effective after market close on March 10, 2022 (see financial note 12 for additional information). |
| Calculated based on the average shares outstanding during the period. |
| Ratio includes less than 0.005% of non-routine proxy expenses. |
| Portfolio turnover rate excludes securities received or delivered from processing of in-kind creations or redemptions. |
70Schwab U.S. Equity ETFs | Annual Report
Schwab U.S. Large-Cap ETF
Portfolio Holdings as of August 31, 2023
This section shows all the securities in the fund’s portfolio and their values as of the report date.
The fund files its complete schedule of portfolio holdings with the U.S. Securities and Exchange Commission (SEC) for the first and third quarters of each fiscal year on Form N-PORT Part F. The fund’s Form N-PORT Part F is available on the SEC’s website at www.sec.gov. You can also obtain this information at no cost on the fund’s website at www.schwabassetmanagement.com/schwabetfs_prospectus, by calling 1-866-414-6349, or by sending an email request to orders@mysummaryprospectus.com. The fund also makes available its complete schedule of portfolio holdings on a daily basis on the fund’s website.
| | |
COMMON STOCKS 99.8% OF NET ASSETS |
|
Automobiles & Components 2.2% |
| | |
| | |
| | |
| | |
| | |
| | |
| | |
| | |
| | |
| | |
Rivian Automotive, Inc., Class A * | | |
| | |
| | |
|
|
| | |
| | |
| | |
Citizens Financial Group, Inc. | | |
| | |
Commerce Bancshares, Inc. | | |
Cullen/Frost Bankers, Inc. | | |
| | |
| | |
First Citizens BancShares, Inc., Class A | | |
| | |
Huntington Bancshares, Inc. | | |
| | |
| | |
| | |
| | |
The PNC Financial Services Group, Inc. | | |
| | |
| | |
| | |
| | |
| | |
| | |
| | |
|
|
| | |
| | |
| | |
Advanced Drainage Systems, Inc. | | |
| | |
| | |
| | |
| | |
| | |
| | |
Builders FirstSource, Inc. * | | |
| | |
| | |
| | |
| | |
| | |
| | |
| | |
| | |
| | |
| | |
| | |
| | |
Fortune Brands Innovations, Inc. | | |
| | |
| | |
| | |
| | |
| | |
Honeywell International, Inc. | | |
| | |
| | |
Huntington Ingalls Industries, Inc. | | |
| | |
Illinois Tool Works, Inc. | | |
| | |
Johnson Controls International plc | | |
L3Harris Technologies, Inc. | | |
Lennox International, Inc. | | |
Lincoln Electric Holdings, Inc. | | |
| | |
| | |
| | |
| | |
| | |
| | |
| | |
| | |
| | |
| | |
| | |
| | |
| | |
Rockwell Automation, Inc. | | |
| | |
Sensata Technologies Holding plc | | |
| | |
Stanley Black & Decker, Inc. | | |
| | |
| | |
| | |
| | |
| | |
| | |
| | |
| | |
Schwab U.S. Equity ETFs | Annual Report71
Schwab U.S. Large-Cap ETF
Portfolio Holdings as of August 31, 2023 (continued)
| | |
| | |
| | |
Westinghouse Air Brake Technologies Corp. | | |
WillScot Mobile Mini Holdings Corp. * | | |
| | |
| | |
| | |
|
Commercial & Professional Services 1.4% |
Automatic Data Processing, Inc. | | |
Booz Allen Hamilton Holding Corp., Class A | | |
Broadridge Financial Solutions, Inc. | | |
Ceridian HCM Holding, Inc. * | | |
| | |
| | |
| | |
| | |
Dun & Bradstreet Holdings, Inc. | | |
| | |
| | |
| | |
| | |
| | |
| | |
Paylocity Holding Corp. * | | |
| | |
| | |
Robert Half International, Inc. | | |
| | |
SS&C Technologies Holdings, Inc. | | |
| | |
| | |
| | |
| | |
|
Consumer Discretionary Distribution & Retail 5.4% |
| | |
| | |
| | |
| | |
| | |
Burlington Stores, Inc. * | | |
| | |
| | |
| | |
| | |
| | |
Floor & Decor Holdings, Inc., Class A * | | |
GameStop Corp., Class A *(a) | | |
| | |
| | |
| | |
O'Reilly Automotive, Inc. * | | |
Penske Automotive Group, Inc. | | |
| | |
| | |
| | |
| | |
| | |
| | |
| | |
| | |
| | |
| | |
| | |
|
Consumer Durables & Apparel 0.9% |
| | |
| | |
| | |
| | |
| | |
| | |
Lululemon Athletica, Inc. * | | |
Mohawk Industries, Inc. * | | |
| | |
| | |
| | |
| | |
| | |
| | |
| | |
| | |
| | |
| | |
|
|
| | |
| | |
| | |
| | |
Caesars Entertainment, Inc. * | | |
| | |
Chipotle Mexican Grill, Inc. * | | |
| | |
| | |
DoorDash, Inc., Class A * | | |
DraftKings, Inc., Class A * | | |
| | |
Hilton Worldwide Holdings, Inc. | | |
| | |
Marriott International, Inc., Class A | | |
| | |
MGM Resorts International | | |
Norwegian Cruise Line Holdings Ltd. * | | |
Royal Caribbean Cruises Ltd. * | | |
Service Corp. International | | |
| | |
| | |
Wyndham Hotels & Resorts, Inc. | | |
| | |
| | |
| | |
|
Consumer Staples Distribution & Retail 1.7% |
Albertsons Cos., Inc., Class A | | |
BJ's Wholesale Club Holdings, Inc. * | | |
| | |
| | |
| | |
| | |
| | |
| | |
| | |
Walgreens Boots Alliance, Inc. | | |
| | |
| | |
|
72Schwab U.S. Equity ETFs | Annual Report
Schwab U.S. Large-Cap ETF
Portfolio Holdings as of August 31, 2023 (continued)
| | |
|
| | |
| | |
| | |
| | |
| | |
| | |
| | |
| | |
| | |
| | |
| | |
| | |
| | |
| | |
| | |
| | |
| | |
| | |
| | |
New Fortress Energy, Inc. | | |
Occidental Petroleum Corp. | | |
| | |
| | |
| | |
Pioneer Natural Resources Co. | | |
| | |
| | |
| | |
| | |
| | |
| | |
| | |
|
Equity Real Estate Investment Trusts (REITs) 2.5% |
Alexandria Real Estate Equities, Inc. | | |
American Homes 4 Rent, Class A | | |
| | |
Americold Realty Trust, Inc. | | |
Apartment Income REIT Corp. | | |
AvalonBay Communities, Inc. | | |
| | |
| | |
| | |
| | |
Digital Realty Trust, Inc. | | |
| | |
Equity LifeStyle Properties, Inc. | | |
| | |
Essex Property Trust, Inc. | | |
Extra Space Storage, Inc. | | |
Federal Realty Investment Trust | | |
Gaming & Leisure Properties, Inc. | | |
Healthcare Realty Trust, Inc. | | |
Healthpeak Properties, Inc. | | |
Host Hotels & Resorts, Inc. | | |
| | |
| | |
| | |
| | |
Lamar Advertising Co., Class A | | |
Medical Properties Trust, Inc. | | |
Mid-America Apartment Communities, Inc. | | |
| | |
Omega Healthcare Investors, Inc. | | |
| | |
| | |
| | |
| | |
| | |
Rexford Industrial Realty, Inc. | | |
| | |
Simon Property Group, Inc. | | |
| | |
| | |
| | |
| | |
| | |
| | |
| | |
| | |
| | |
|
|
| | |
| | |
| | |
| | |
Ameriprise Financial, Inc. | | |
Annaly Capital Management, Inc. | | |
Apollo Global Management, Inc. | | |
Ares Management Corp., Class A | | |
Berkshire Hathaway, Inc., Class B * | | |
| | |
| | |
| | |
Capital One Financial Corp. | | |
Cboe Global Markets, Inc. | | |
| | |
Coinbase Global, Inc., Class A * | | |
Corebridge Financial, Inc. | | |
Credit Acceptance Corp. * | | |
Discover Financial Services | | |
| | |
FactSet Research Systems, Inc. | | |
Fidelity National Information Services, Inc. | | |
| | |
FleetCor Technologies, Inc. * | | |
| | |
| | |
Intercontinental Exchange, Inc. | | |
| | |
Jack Henry & Associates, Inc. | | |
Jefferies Financial Group, Inc. | | |
| | |
LPL Financial Holdings, Inc. | | |
MarketAxess Holdings, Inc. | | |
Mastercard, Inc., Class A | | |
| | |
| | |
| | |
| | |
| | |
| | |
| | |
Raymond James Financial, Inc. | | |
| | |
| | |
SoFi Technologies, Inc. * | | |
Starwood Property Trust, Inc. | | |
| | |
| | |
Schwab U.S. Equity ETFs | Annual Report73
Schwab U.S. Large-Cap ETF
Portfolio Holdings as of August 31, 2023 (continued)
| | |
T. Rowe Price Group, Inc. | | |
The Bank of New York Mellon Corp. | | |
| | |
The Charles Schwab Corp. (b) | | |
The Goldman Sachs Group, Inc. | | |
| | |
| | |
| | |
| | |
| | |
|
Food, Beverage & Tobacco 3.0% |
| | |
Archer-Daniels-Midland Co. | | |
Brown-Forman Corp., Class B | | |
| | |
| | |
| | |
Constellation Brands, Inc., Class A | | |
Darling Ingredients, Inc. * | | |
| | |
| | |
| | |
| | |
Lamb Weston Holdings, Inc. | | |
McCormick & Co., Inc. Non Voting Shares | | |
Molson Coors Beverage Co., Class B | | |
Mondelez International, Inc., Class A | | |
| | |
| | |
Philip Morris International, Inc. | | |
| | |
| | |
| | |
| | |
| | |
Tyson Foods, Inc., Class A | | |
| | |
|
Health Care Equipment & Services 5.2% |
| | |
| | |
| | |
Baxter International, Inc. | | |
| | |
Boston Scientific Corp. * | | |
| | |
| | |
| | |
| | |
| | |
| | |
| | |
| | |
Edwards Lifesciences Corp. * | | |
| | |
| | |
| | |
| | |
| | |
| | |
| | |
| | |
IDEXX Laboratories, Inc. * | | |
| | |
| | |
Intuitive Surgical, Inc. * | | |
Laboratory Corp. of America Holdings | | |
| | |
| | |
| | |
Molina Healthcare, Inc. * | | |
| | |
| | |
| | |
| | |
| | |
Shockwave Medical, Inc. * | | |
| | |
| | |
| | |
| | |
| | |
| | |
| | |
Universal Health Services, Inc., Class B | | |
Veeva Systems, Inc., Class A * | | |
Zimmer Biomet Holdings, Inc. | | |
| | |
|
Household & Personal Products 1.5% |
Church & Dwight Co., Inc. | | |
| | |
| | |
| | |
| | |
Reynolds Consumer Products, Inc. | | |
| | |
The Estee Lauder Cos., Inc., Class A | | |
| | |
| | |
|
|
| | |
American Financial Group, Inc. | | |
American International Group, Inc. | | |
| | |
Arch Capital Group Ltd. * | | |
Arthur J. Gallagher & Co. | | |
| | |
| | |
| | |
Cincinnati Financial Corp. | | |
| | |
Erie Indemnity Co., Class A | | |
| | |
F&G Annuities & Life, Inc. | | |
Fidelity National Financial, Inc. | | |
| | |
| | |
| | |
| | |
Marsh & McLennan Cos., Inc. | | |
| | |
Old Republic International Corp. | | |
Principal Financial Group, Inc. | | |
Prudential Financial, Inc. | | |
Reinsurance Group of America, Inc. | | |
RenaissanceRe Holdings Ltd. | | |
| | |
74Schwab U.S. Equity ETFs | Annual Report
Schwab U.S. Large-Cap ETF
Portfolio Holdings as of August 31, 2023 (continued)
| | |
The Hartford Financial Services Group, Inc. | | |
| | |
| | |
| | |
| | |
| | |
|
|
Air Products and Chemicals, Inc. | | |
| | |
| | |
| | |
| | |
| | |
Axalta Coating Systems Ltd. * | | |
| | |
| | |
| | |
CF Industries Holdings, Inc. | | |
| | |
| | |
| | |
| | |
| | |
| | |
| | |
| | |
| | |
International Flavors & Fragrances, Inc. | | |
| | |
| | |
LyondellBasell Industries N.V., Class A | | |
Martin Marietta Materials, Inc. | | |
| | |
| | |
Packaging Corp. of America | | |
| | |
Reliance Steel & Aluminum Co. | | |
| | |
| | |
| | |
| | |
| | |
| | |
| | |
| | |
| | |
| | |
| | |
|
Media & Entertainment 7.7% |
Activision Blizzard, Inc. | | |
Alphabet, Inc., Class A * | | |
Alphabet, Inc., Class C * | | |
AMC Entertainment Holdings, Inc., Class A *(a) | | |
| | |
Charter Communications, Inc., Class A * | | |
| | |
DISH Network Corp., Class A * | | |
| | |
| | |
| | |
| | |
Liberty Broadband Corp., Class C * | | |
Liberty Media Corp.-Liberty Formula One, Class C * | | |
Liberty Media Corp.-Liberty Live, Class C * | | |
Liberty Media Corp.-Liberty SiriusXM, Class C * | | |
Live Nation Entertainment, Inc. * | | |
| | |
Meta Platforms, Inc., Class A * | | |
| | |
| | |
| | |
Paramount Global, Class B | | |
Pinterest, Inc., Class A * | | |
| | |
| | |
Sirius XM Holdings, Inc. (a) | | |
| | |
Take-Two Interactive Software, Inc. * | | |
The Interpublic Group of Cos., Inc. | | |
The Trade Desk, Inc., Class A * | | |
| | |
Warner Bros Discovery, Inc. * | | |
ZoomInfo Technologies, Inc. * | | |
| | |
|
Pharmaceuticals, Biotechnology & Life Sciences 7.7% |
| | |
Agilent Technologies, Inc. | | |
Alnylam Pharmaceuticals, Inc. * | | |
| | |
| | |
| | |
| | |
BioMarin Pharmaceutical, Inc. * | | |
Bio-Rad Laboratories, Inc., Class A * | | |
| | |
| | |
| | |
| | |
Charles River Laboratories International, Inc. * | | |
| | |
Elanco Animal Health, Inc. * | | |
| | |
| | |
| | |
| | |
Horizon Therapeutics plc * | | |
| | |
| | |
| | |
Jazz Pharmaceuticals plc * | | |
| | |
Karuna Therapeutics, Inc. * | | |
| | |
Mettler-Toledo International, Inc. * | | |
| | |
Neurocrine Biosciences, Inc. * | | |
| | |
| | |
Regeneron Pharmaceuticals, Inc. * | | |
| | |
| | |
Schwab U.S. Equity ETFs | Annual Report75
Schwab U.S. Large-Cap ETF
Portfolio Holdings as of August 31, 2023 (continued)
| | |
Royalty Pharma plc, Class A | | |
Sarepta Therapeutics, Inc. * | | |
| | |
| | |
Thermo Fisher Scientific, Inc. | | |
United Therapeutics Corp. * | | |
Vertex Pharmaceuticals, Inc. * | | |
| | |
| | |
West Pharmaceutical Services, Inc. | | |
| | |
| | |
|
Real Estate Management & Development 0.2% |
CBRE Group, Inc., Class A * | | |
| | |
Jones Lang LaSalle, Inc. * | | |
Zillow Group, Inc., Class C * | | |
| | |
|
Semiconductors & Semiconductor Equipment 7.4% |
Advanced Micro Devices, Inc. * | | |
| | |
| | |
| | |
| | |
| | |
| | |
| | |
| | |
| | |
| | |
Microchip Technology, Inc. | | |
| | |
Monolithic Power Systems, Inc. | | |
| | |
| | |
| | |
| | |
| | |
| | |
SolarEdge Technologies, Inc. * | | |
| | |
| | |
| | |
| | |
| | |
|
Software & Services 11.8% |
| | |
| | |
Akamai Technologies, Inc. * | | |
| | |
AppLovin Corp., Class A * | | |
| | |
Atlassian Corp., Class A * | | |
| | |
Bentley Systems, Inc., Class B | | |
| | |
| | |
Cadence Design Systems, Inc. * | | |
Cloudflare, Inc., Class A * | | |
Cognizant Technology Solutions Corp., Class A | | |
Crowdstrike Holdings, Inc., Class A * | | |
| | |
| | |
| | |
| | |
| | |
| | |
| | |
| | |
| | |
| | |
| | |
| | |
| | |
Guidewire Software, Inc. * | | |
| | |
International Business Machines Corp. | | |
| | |
Manhattan Associates, Inc. * | | |
| | |
| | |
| | |
| | |
Palantir Technologies, Inc., Class A * | | |
Palo Alto Networks, Inc. * | | |
| | |
| | |
| | |
| | |
Snowflake, Inc., Class A * | | |
| | |
| | |
| | |
Tyler Technologies, Inc. * | | |
| | |
| | |
| | |
| | |
| | |
Zoom Video Communications, Inc., Class A * | | |
| | |
| | |
|
Technology Hardware & Equipment 8.7% |
| | |
| | |
| | |
Arrow Electronics, Inc. * | | |
| | |
| | |
| | |
| | |
| | |
Dell Technologies, Inc., Class C | | |
| | |
Hewlett Packard Enterprise Co. | | |
| | |
| | |
| | |
Keysight Technologies, Inc. * | | |
| | |
| | |
Pure Storage, Inc., Class A * | | |
Seagate Technology Holdings plc | | |
| | |
| | |
Teledyne Technologies, Inc. * | | |
76Schwab U.S. Equity ETFs | Annual Report
Schwab U.S. Large-Cap ETF
Portfolio Holdings as of August 31, 2023 (continued)
| | |
| | |
| | |
| | |
Zebra Technologies Corp., Class A * | | |
| | |
|
Telecommunication Services 0.8% |
| | |
| | |
Liberty Global plc, Class C * | | |
Lumen Technologies, Inc. * | | |
| | |
Verizon Communications, Inc. | | |
| | |
|
|
| | |
American Airlines Group, Inc. * | | |
Avis Budget Group, Inc. * | | |
C.H. Robinson Worldwide, Inc. | | |
| | |
| | |
Expeditors International of Washington, Inc. | | |
| | |
Hertz Global Holdings, Inc. * | | |
J.B. Hunt Transport Services, Inc. | | |
Knight-Swift Transportation Holdings, Inc. | | |
| | |
| | |
Old Dominion Freight Line, Inc. | | |
| | |
| | |
Uber Technologies, Inc. * | | |
| | |
| | |
United Airlines Holdings, Inc. * | | |
United Parcel Service, Inc., Class B | | |
| | |
| | |
|
|
| | |
| | |
American Electric Power Co., Inc. | | |
American Water Works Co., Inc. | | |
| | |
| | |
| | |
| | |
Consolidated Edison, Inc. | | |
Constellation Energy Corp. | | |
| | |
| | |
| | |
| | |
| | |
Essential Utilities, Inc. | | |
| | |
| | |
| | |
| | |
| | |
| | |
| | |
| | |
| | |
| | |
Pinnacle West Capital Corp. | | |
| | |
Public Service Enterprise Group, Inc. | | |
| | |
| | |
| | |
| | |
| | |
| | |
| | |
| | |
Total Common Stocks
(Cost $22,830,879,086) | |
| | |
SHORT-TERM INVESTMENTS 0.1% OF NET ASSETS |
|
|
State Street Institutional U.S. Government Money Market Fund, Premier Class 5.28% (d) | | |
State Street Institutional U.S. Government Money Market Fund, Premier Class 5.28% (d)(e) | | |
| | |
Total Short-Term Investments
(Cost $38,165,287) | |
Total Investments in Securities
(Cost $22,869,044,373) | |
| | | CURRENT VALUE/
UNREALIZED
APPRECIATION
($) |
|
| | | |
S&P 500 Index, e-mini, expires 09/15/23 | | | |
| Non-income producing security. |
| All or a portion of this security is on loan. Securities on loan were valued at $16,307,417. |
| Issuer is affiliated with the fund’s investment adviser. |
| Fair valued using significant unobservable inputs (see financial note 2(a), Securities for which no quoted value is available, for additional information). |
| The rate shown is the annualized 7-day yield. |
| Security purchased with cash collateral received for securities on loan. |
| Real Estate Investment Trust |
Schwab U.S. Equity ETFs | Annual Report77
Schwab U.S. Large-Cap ETF
Portfolio Holdings as of August 31, 2023 (continued)
Below is a summary of the fund’s transactions with affiliated issuers during the period ended August 31, 2023:
| | | | | NET CHANGE IN UNREALIZED APPRECIATION (DEPRECIATION) | | BALANCE OF SHARES HELD AT 8/31/23 | |
COMMON STOCKS 0.2% OF NET ASSETS |
|
|
| | | | | | | | |
The following is a summary of the inputs used to value the fund’s investments as of August 31, 2023 (see financial note 2(a) for additional information):
| QUOTED PRICES IN
ACTIVE MARKETS FOR
IDENTICAL ASSETS
(LEVEL 1) | OTHER SIGNIFICANT
OBSERVABLE INPUTS
(LEVEL 2) | SIGNIFICANT
UNOBSERVABLE INPUTS
(LEVEL 3) | |
| | | | |
| | | | |
Telecommunication Services | | | | |
| | | | |
| | | | |
| | | | |
| As categorized in the Portfolio Holdings. |
| Futures contracts are reported at cumulative unrealized appreciation or depreciation. |
Fund investments in mutual funds are classified as Level 1, without consideration to the classification level of the underlying
securities held by the mutual funds, which could be Level 1, Level 2 or Level 3.
78Schwab U.S. Equity ETFs | Annual Report
Schwab U.S. Large-Cap ETF
Statement of Assets and Liabilities
As of August 31, 2023
|
Investments in securities, at value - affiliated (cost $60,391,797) | | |
Investments in securities, at value - unaffiliated (cost $22,808,652,576) including securities on loan of $16,307,417 | | |
Deposit with broker for futures contracts | | |
| | |
| | |
| | |
| | |
Income from securities on loan | | |
| | |
|
|
Collateral held for securities on loan | | |
| | |
| | |
| | |
| | |
Variation margin on futures contracts | | |
| | |
| | |
|
|
Capital received from investors | | |
Total distributable earnings | | |
| | |
Schwab U.S. Equity ETFs | Annual Report79
Schwab U.S. Large-Cap ETF
Statement of Operations
For the period September 1, 2022 through August 31, 2023 |
|
Dividends received from securities - unaffiliated (net of foreign withholding tax of $127,261) | | |
Dividends received from securities - affiliated | | |
| | |
| | |
|
|
| | |
| | |
| | |
| | |
|
REALIZED AND UNREALIZED GAINS (LOSSES) |
Net realized losses on sales of securities - affiliated | | |
Net realized losses on sales of securities - unaffiliated | | |
Net realized gains on sales of in-kind redemptions - affiliated | | |
Net realized gains on sales of in-kind redemptions - unaffiliated | | |
Net realized gains on futures contracts | | |
| | |
Net change in unrealized appreciation (depreciation) on securities - affiliated | | |
Net change in unrealized appreciation (depreciation) on securities - unaffiliated | | |
Net change in unrealized appreciation (depreciation) on futures contracts | | |
Net change in unrealized appreciation (depreciation) | | |
Net realized and unrealized gains | | |
Increase in net assets resulting from operations | | |
| Proxy fees are non-routine expenses (see financial note 2(e) for additional information). |
80Schwab U.S. Equity ETFs | Annual Report
Schwab U.S. Large-Cap ETF
Statement of Changes in Net Assets
For the current and prior report periods
|
| | |
| | | |
| | | |
Net change in unrealized appreciation (depreciation) | | | |
Increase (decrease) in net assets resulting from operations | | | |
|
DISTRIBUTIONS TO SHAREHOLDERS |
| | | |
TRANSACTIONS IN FUND SHARES1 |
| | |
| | | | | |
| | | | | |
| | | | | |
Net transactions in fund shares | | | | | |
|
SHARES OUTSTANDING AND NET ASSETS1 |
| | |
| | | | | |
| | | | | |
Total increase (decrease) | | | | | |
| | | | | |
| For the period ended August 31, 2022, transactions in fund shares have been retroactively adjusted to reflect a 2-for-1 share split effective after market close on March 10, 2022. The retroactive adjustment of the share split does not change the transaction in fund share values (see financial note 12 for additional information). |
Schwab U.S. Equity ETFs | Annual Report81
Schwab U.S. Large-Cap Growth ETF
Financial Statements
| | | | | | |
|
Net asset value at beginning of period | | | | | | |
Income (loss) from investment operations: | | | | | | |
Net investment income (loss)2 | | | | | | |
Net realized and unrealized gains (losses) | | | | | | |
Total from investment operations | | | | | | |
| | | | | | |
Distributions from net investment income | | | | | | |
Net asset value at end of period | | | | | | |
| | | | | | |
|
Ratios to average net assets: | | | | | | |
| | | | | | |
Net investment income (loss) | | | | | | |
| | | | | | |
Net assets, end of period (x 1,000,000) | | | | | | |
| Per-Share Data has been retroactively adjusted to reflect a 2-for-1 share split effective after market close on March 10, 2022 (see financial note 12 for additional information). |
| Calculated based on the average shares outstanding during the period. |
| Ratio includes less than 0.005% of non-routine proxy expenses. |
| Portfolio turnover rate excludes securities received or delivered from processing of in-kind creations or redemptions. |
82Schwab U.S. Equity ETFs | Annual Report
Schwab U.S. Large-Cap Growth ETF
Portfolio Holdings as of August 31, 2023
This section shows all the securities in the fund’s portfolio and their values as of the report date.
The fund files its complete schedule of portfolio holdings with the U.S. Securities and Exchange Commission (SEC) for the first and third quarters of each fiscal year on Form N-PORT Part F. The fund’s Form N-PORT Part F is available on the SEC’s website at www.sec.gov. You can also obtain this information at no cost on the fund’s website at www.schwabassetmanagement.com/schwabetfs_prospectus, by calling 1-866-414-6349, or by sending an email request to orders@mysummaryprospectus.com. The fund also makes available its complete schedule of portfolio holdings on a daily basis on the fund’s website.
| | |
COMMON STOCKS 99.9% OF NET ASSETS |
|
Automobiles & Components 3.4% |
| | |
|
|
First Citizens BancShares, Inc., Class A | | |
|
|
| | |
Builders FirstSource, Inc. * | | |
| | |
| | |
| | |
| | |
Huntington Ingalls Industries, Inc. | | |
L3Harris Technologies, Inc. | | |
| | |
| | |
| | |
| | |
| | |
| | |
WillScot Mobile Mini Holdings Corp. * | | |
| | |
|
Commercial & Professional Services 0.8% |
Ceridian HCM Holding, Inc. * | | |
| | |
| | |
| | |
| | |
Paylocity Holding Corp. * | | |
| | |
| | |
|
Consumer Discretionary Distribution & Retail 6.9% |
| | |
| | |
| | |
| | |
| | |
Floor & Decor Holdings, Inc., Class A * | | |
O'Reilly Automotive, Inc. * | | |
| | |
| | |
| | |
| | |
| | |
|
| | |
Consumer Durables & Apparel 0.6% |
| | |
| | |
Lululemon Athletica, Inc. * | | |
| | |
| | |
|
|
| | |
| | |
Caesars Entertainment, Inc. * | | |
Chipotle Mexican Grill, Inc. * | | |
| | |
DoorDash, Inc., Class A * | | |
DraftKings, Inc., Class A * | | |
| | |
Hilton Worldwide Holdings, Inc. | | |
| | |
|
Consumer Staples Distribution & Retail 1.3% |
| | |
| | |
| | |
|
|
| | |
| | |
| | |
| | |
| | |
| | |
| | |
New Fortress Energy, Inc. | | |
| | |
| | |
| | |
|
Equity Real Estate Investment Trusts (REITs) 0.9% |
| | |
| | |
Rexford Industrial Realty, Inc. | | |
| | |
| | |
|
|
| | |
| | |
| | |
Coinbase Global, Inc., Class A * | | |
Corebridge Financial, Inc. | | |
Credit Acceptance Corp. * | | |
Schwab U.S. Equity ETFs | Annual Report83
Schwab U.S. Large-Cap Growth ETF
Portfolio Holdings as of August 31, 2023 (continued)
| | |
FactSet Research Systems, Inc. | | |
| | |
FleetCor Technologies, Inc. * | | |
| | |
LPL Financial Holdings, Inc. | | |
MarketAxess Holdings, Inc. | | |
Mastercard, Inc., Class A | | |
| | |
| | |
| | |
| | |
| | |
| | |
| | |
|
Food, Beverage & Tobacco 0.2% |
| | |
| | |
| | |
|
Health Care Equipment & Services 6.0% |
| | |
| | |
| | |
| | |
| | |
Edwards Lifesciences Corp. * | | |
| | |
| | |
| | |
| | |
IDEXX Laboratories, Inc. * | | |
| | |
Intuitive Surgical, Inc. * | | |
| | |
| | |
Molina Healthcare, Inc. * | | |
| | |
| | |
| | |
| | |
Shockwave Medical, Inc. * | | |
| | |
| | |
| | |
| | |
| | |
Veeva Systems, Inc., Class A * | | |
| | |
|
Household & Personal Products 0.2% |
| | |
The Estee Lauder Cos., Inc., Class A | | |
| | |
|
|
| | |
RenaissanceRe Holdings Ltd. | | |
| | |
|
|
| | |
| | |
| | |
| | |
| | |
Martin Marietta Materials, Inc. | | |
| | |
| | |
| | |
|
Media & Entertainment 12.3% |
Alphabet, Inc., Class A * | | |
Alphabet, Inc., Class C * | | |
| | |
Charter Communications, Inc., Class A * | | |
Liberty Broadband Corp., Class C * | | |
Live Nation Entertainment, Inc. * | | |
Meta Platforms, Inc., Class A * | | |
| | |
Pinterest, Inc., Class A * | | |
| | |
| | |
| | |
Take-Two Interactive Software, Inc. * | | |
The Trade Desk, Inc., Class A * | | |
ZoomInfo Technologies, Inc. * | | |
| | |
|
Pharmaceuticals, Biotechnology & Life Sciences 7.4% |
Alnylam Pharmaceuticals, Inc. * | | |
| | |
| | |
BioMarin Pharmaceutical, Inc. * | | |
Bio-Rad Laboratories, Inc., Class A * | | |
| | |
| | |
Charles River Laboratories International, Inc. * | | |
| | |
| | |
| | |
Horizon Therapeutics plc * | | |
| | |
| | |
| | |
Jazz Pharmaceuticals plc * | | |
Karuna Therapeutics, Inc. * | | |
Mettler-Toledo International, Inc. * | | |
| | |
Neurocrine Biosciences, Inc. * | | |
Regeneron Pharmaceuticals, Inc. * | | |
| | |
| | |
Sarepta Therapeutics, Inc. * | | |
| | |
| | |
Thermo Fisher Scientific, Inc. | | |
United Therapeutics Corp. * | | |
Vertex Pharmaceuticals, Inc. * | | |
| | |
West Pharmaceutical Services, Inc. | | |
| | |
| | |
|
84Schwab U.S. Equity ETFs | Annual Report
Schwab U.S. Large-Cap Growth ETF
Portfolio Holdings as of August 31, 2023 (continued)
| | |
Real Estate Management & Development 0.2% |
| | |
Zillow Group, Inc., Class C * | | |
| | |
|
Semiconductors & Semiconductor Equipment 9.9% |
Advanced Micro Devices, Inc. * | | |
| | |
| | |
| | |
| | |
Monolithic Power Systems, Inc. | | |
| | |
| | |
| | |
SolarEdge Technologies, Inc. * | | |
| | |
| | |
|
Software & Services 20.9% |
| | |
| | |
| | |
AppLovin Corp., Class A * | | |
Atlassian Corp., Class A * | | |
| | |
| | |
Cadence Design Systems, Inc. * | | |
Cloudflare, Inc., Class A * | | |
Crowdstrike Holdings, Inc., Class A * | | |
| | |
| | |
| | |
| | |
| | |
| | |
| | |
| | |
| | |
| | |
| | |
| | |
| | |
| | |
| | |
Palo Alto Networks, Inc. * | | |
| | |
| | |
| | |
| | |
Snowflake, Inc., Class A * | | |
| | |
| | |
| | |
Tyler Technologies, Inc. * | | |
| | |
| | |
| | |
| | |
Zoom Video Communications, Inc., Class A * | | |
| | |
| | |
|
| | |
Technology Hardware & Equipment 14.0% |
| | |
| | |
| | |
Dell Technologies, Inc., Class C | | |
Pure Storage, Inc., Class A * | | |
Teledyne Technologies, Inc. * | | |
| | |
Zebra Technologies Corp., Class A * | | |
| | |
|
Telecommunication Services 0.4% |
| | |
|
|
Hertz Global Holdings, Inc. * | | |
Knight-Swift Transportation Holdings, Inc. | | |
| | |
Old Dominion Freight Line, Inc. | | |
| | |
| | |
|
|
Constellation Energy Corp. | | |
Total Common Stocks
(Cost $12,210,045,805) | |
| | |
SHORT-TERM INVESTMENTS 0.1% OF NET ASSETS |
|
|
State Street Institutional U.S. Government Money Market Fund, Premier Class 5.28% (b) | | |
State Street Institutional U.S. Government Money Market Fund, Premier Class 5.28% (b)(c) | | |
| | |
Total Short-Term Investments
(Cost $23,646,121) | |
Total Investments in Securities
(Cost $12,233,691,926) | |
Schwab U.S. Equity ETFs | Annual Report85
Schwab U.S. Large-Cap Growth ETF
Portfolio Holdings as of August 31, 2023 (continued)
| | | CURRENT VALUE/
UNREALIZED
APPRECIATION
($) |
|
| | | |
Russell 1000 Growth Index, e-mini, expires 09/15/23 | | | |
S&P 500 Index, e-mini, expires 09/15/23 | | | |
| | | |
| Non-income producing security. |
| All or a portion of this security is on loan. Securities on loan were valued at $7,833,498. |
| The rate shown is the annualized 7-day yield. |
| Security purchased with cash collateral received for securities on loan. |
The following is a summary of the inputs used to value the fund’s investments as of August 31, 2023 (see financial note 2(a) for additional information):
| QUOTED PRICES IN
ACTIVE MARKETS FOR
IDENTICAL ASSETS
(LEVEL 1) | OTHER SIGNIFICANT
OBSERVABLE INPUTS
(LEVEL 2) | SIGNIFICANT
UNOBSERVABLE INPUTS
(LEVEL 3) | |
| | | | |
| | | | |
| | | | |
| | | | |
| | | | |
| As categorized in the Portfolio Holdings. |
| Futures contracts are reported at cumulative unrealized appreciation or depreciation. |
Fund investments in mutual funds are classified as Level 1, without consideration to the classification level of the underlying
securities held by the mutual funds, which could be Level 1, Level 2 or Level 3.
86Schwab U.S. Equity ETFs | Annual Report
Schwab U.S. Large-Cap Growth ETF
Statement of Assets and Liabilities
As of August 31, 2023
|
Investments in securities, at value - unaffiliated (cost $12,233,691,926) including securities on loan of $7,833,498 | | |
Deposit with broker for futures contracts | | |
| | |
| | |
| | |
| | |
Variation margin on future contracts | | |
Income from securities on loan | | |
| | |
|
|
Collateral held for securities on loan | | |
| | |
| | |
| | |
| | |
| | |
| | |
|
|
Capital received from investors | | |
Total distributable earnings | | |
| | |
Schwab U.S. Equity ETFs | Annual Report87
Schwab U.S. Large-Cap Growth ETF
Statement of Operations
For the period September 1, 2022 through August 31, 2023 |
|
Dividends received from securities - unaffiliated (net of foreign withholding tax of $30,448) | | |
| | |
| | |
|
|
| | |
| | |
| | |
| | |
|
REALIZED AND UNREALIZED GAINS (LOSSES) |
Net realized losses on sales of securities - unaffiliated | | |
Net realized gains on sales of in-kind redemptions - unaffiliated | | |
Net realized gains on futures contracts | | |
| | |
Net change in unrealized appreciation (depreciation) on securities - unaffiliated | | |
Net change in unrealized appreciation (depreciation) on futures contracts | | |
Net change in unrealized appreciation (depreciation) | | |
Net realized and unrealized gains | | |
Increase in net assets resulting from operations | | |
| Proxy fees are non-routine expenses (see financial note 2(e) for additional information). |
88Schwab U.S. Equity ETFs | Annual Report
Schwab U.S. Large-Cap Growth ETF
Statement of Changes in Net Assets
For the current and prior report periods
|
| | |
| | | |
| | | |
Net change in unrealized appreciation (depreciation) | | | |
Increase (decrease) in net assets resulting from operations | | | |
|
DISTRIBUTIONS TO SHAREHOLDERS |
| | | |
TRANSACTIONS IN FUND SHARES1 |
| | |
| | | | | |
| | | | | |
| | | | | |
Net transactions in fund shares | | | | | |
|
SHARES OUTSTANDING AND NET ASSETS1 |
| | |
| | | | | |
| | | | | |
Total increase (decrease) | | | | | |
| | | | | |
| For the period ended August 31, 2022, transactions in fund shares have been retroactively adjusted to reflect a 2-for-1 share split effective after market close on March 10, 2022. The retroactive adjustment of the share split does not change the transaction in fund share values (see financial note 12 for additional information). |
Schwab U.S. Equity ETFs | Annual Report89
Schwab U.S. Large-Cap Value ETF
Financial Statements
| | | | | | |
|
Net asset value at beginning of period | | | | | | |
Income (loss) from investment operations: | | | | | | |
Net investment income (loss)1 | | | | | | |
Net realized and unrealized gains (losses) | | | | | | |
Total from investment operations | | | | | | |
| | | | | | |
Distributions from net investment income | | | | | | |
Net asset value at end of period | | | | | | |
| | | | | | |
|
Ratios to average net assets: | | | | | | |
| | | | | | |
Net investment income (loss) | | | | | | |
| | | | | | |
Net assets, end of period (x 1,000,000) | | | | | | |
| Calculated based on the average shares outstanding during the period. |
| Ratio includes less than 0.005% of non-routine proxy expenses. |
| Portfolio turnover rate excludes securities received or delivered from processing of in-kind creations or redemptions. |
90Schwab U.S. Equity ETFs | Annual Report
Schwab U.S. Large-Cap Value ETF
Portfolio Holdings as of August 31, 2023
This section shows all the securities in the fund’s portfolio and their values as of the report date.
The fund files its complete schedule of portfolio holdings with the U.S. Securities and Exchange Commission (SEC) for the first and third quarters of each fiscal year on Form N-PORT Part F. The fund’s Form N-PORT Part F is available on the SEC’s website at www.sec.gov. You can also obtain this information at no cost on the fund’s website at www.schwabassetmanagement.com/schwabetfs_prospectus, by calling 1-866-414-6349, or by sending an email request to orders@mysummaryprospectus.com. The fund also makes available its complete schedule of portfolio holdings on a daily basis on the fund’s website.
| | |
COMMON STOCKS 99.7% OF NET ASSETS |
|
Automobiles & Components 0.9% |
| | |
| | |
| | |
| | |
| | |
| | |
| | |
| | |
| | |
| | |
Rivian Automotive, Inc., Class A * | | |
| | |
|
|
| | |
| | |
| | |
Citizens Financial Group, Inc. | | |
| | |
Commerce Bancshares, Inc. | | |
Cullen/Frost Bankers, Inc. | | |
| | |
| | |
| | |
Huntington Bancshares, Inc. | | |
| | |
| | |
| | |
| | |
The PNC Financial Services Group, Inc. | | |
| | |
| | |
| | |
| | |
| | |
| | |
| | |
|
|
| | |
| | |
| | |
Advanced Drainage Systems, Inc. | | |
| | |
| | |
| | |
| | |
| | |
| | |
| | |
| | |
| | |
| | |
| | |
| | |
| | |
| | |
| | |
Fortune Brands Innovations, Inc. | | |
| | |
| | |
| | |
Honeywell International, Inc. | | |
| | |
| | |
| | |
Illinois Tool Works, Inc. | | |
| | |
Johnson Controls International plc | | |
Lennox International, Inc. | | |
Lincoln Electric Holdings, Inc. | | |
| | |
| | |
| | |
| | |
| | |
| | |
| | |
| | |
| | |
| | |
| | |
Rockwell Automation, Inc. | | |
| | |
Sensata Technologies Holding plc | | |
| | |
Stanley Black & Decker, Inc. | | |
| | |
| | |
| | |
| | |
| | |
| | |
Westinghouse Air Brake Technologies Corp. | | |
| | |
| | |
| | |
|
Commercial & Professional Services 2.0% |
Automatic Data Processing, Inc. | | |
Booz Allen Hamilton Holding Corp., Class A | | |
Broadridge Financial Solutions, Inc. | | |
| | |
Dun & Bradstreet Holdings, Inc. | | |
| | |
| | |
Schwab U.S. Equity ETFs | Annual Report91
Schwab U.S. Large-Cap Value ETF
Portfolio Holdings as of August 31, 2023 (continued)
| | |
| | |
| | |
| | |
| | |
| | |
Robert Half International, Inc. | | |
| | |
SS&C Technologies Holdings, Inc. | | |
| | |
| | |
| | |
|
Consumer Discretionary Distribution & Retail 3.9% |
| | |
| | |
| | |
Burlington Stores, Inc. * | | |
| | |
| | |
GameStop Corp., Class A *(a) | | |
| | |
| | |
| | |
Penske Automotive Group, Inc. | | |
| | |
| | |
| | |
| | |
| | |
| | |
|
Consumer Durables & Apparel 1.3% |
| | |
| | |
| | |
| | |
Mohawk Industries, Inc. * | | |
| | |
| | |
| | |
| | |
| | |
| | |
| | |
| | |
| | |
|
|
| | |
| | |
| | |
| | |
| | |
Marriott International, Inc., Class A | | |
| | |
MGM Resorts International | | |
Norwegian Cruise Line Holdings Ltd. * | | |
Royal Caribbean Cruises Ltd. * | | |
Service Corp. International | | |
| | |
| | |
Wyndham Hotels & Resorts, Inc. | | |
| | |
| | |
| | |
| | |
|
Consumer Staples Distribution & Retail 2.1% |
Albertsons Cos., Inc., Class A | | |
BJ's Wholesale Club Holdings, Inc. * | | |
| | |
| | |
| | |
| | |
| | |
Walgreens Boots Alliance, Inc. | | |
| | |
| | |
|
|
| | |
| | |
| | |
| | |
| | |
| | |
| | |
| | |
| | |
| | |
| | |
| | |
Occidental Petroleum Corp. | | |
| | |
| | |
| | |
Pioneer Natural Resources Co. | | |
| | |
| | |
| | |
| | |
| | |
|
Equity Real Estate Investment Trusts (REITs) 4.0% |
Alexandria Real Estate Equities, Inc. | | |
American Homes 4 Rent, Class A | | |
Americold Realty Trust, Inc. | | |
Apartment Income REIT Corp. | | |
AvalonBay Communities, Inc. | | |
| | |
| | |
| | |
| | |
Digital Realty Trust, Inc. | | |
Equity LifeStyle Properties, Inc. | | |
| | |
Essex Property Trust, Inc. | | |
Extra Space Storage, Inc. | | |
Federal Realty Investment Trust | | |
Gaming & Leisure Properties, Inc. | | |
Healthcare Realty Trust, Inc. | | |
Healthpeak Properties, Inc. | | |
Host Hotels & Resorts, Inc. | | |
| | |
| | |
| | |
| | |
Lamar Advertising Co., Class A | | |
Medical Properties Trust, Inc. | | |
92Schwab U.S. Equity ETFs | Annual Report
Schwab U.S. Large-Cap Value ETF
Portfolio Holdings as of August 31, 2023 (continued)
| | |
Mid-America Apartment Communities, Inc. | | |
| | |
Omega Healthcare Investors, Inc. | | |
| | |
| | |
| | |
| | |
Simon Property Group, Inc. | | |
| | |
| | |
| | |
| | |
| | |
| | |
| | |
| | |
| | |
|
|
| | |
| | |
| | |
Ameriprise Financial, Inc. | | |
Annaly Capital Management, Inc. | | |
Apollo Global Management, Inc. | | |
Ares Management Corp., Class A | | |
Berkshire Hathaway, Inc., Class B * | | |
| | |
Capital One Financial Corp. | | |
Cboe Global Markets, Inc. | | |
| | |
Discover Financial Services | | |
| | |
Fidelity National Information Services, Inc. | | |
| | |
| | |
Intercontinental Exchange, Inc. | | |
| | |
Jack Henry & Associates, Inc. | | |
Jefferies Financial Group, Inc. | | |
| | |
| | |
| | |
| | |
Raymond James Financial, Inc. | | |
| | |
SoFi Technologies, Inc. * | | |
Starwood Property Trust, Inc. | | |
| | |
| | |
T. Rowe Price Group, Inc. | | |
The Bank of New York Mellon Corp. | | |
| | |
The Charles Schwab Corp. (b) | | |
The Goldman Sachs Group, Inc. | | |
| | |
| | |
| | |
|
Food, Beverage & Tobacco 5.9% |
| | |
Archer-Daniels-Midland Co. | | |
Brown-Forman Corp., Class B | | |
| | |
| | |
| | |
| | |
Constellation Brands, Inc., Class A | | |
Darling Ingredients, Inc. * | | |
| | |
| | |
| | |
| | |
Lamb Weston Holdings, Inc. | | |
McCormick & Co., Inc. Non Voting Shares | | |
Molson Coors Beverage Co., Class B | | |
Mondelez International, Inc., Class A | | |
| | |
Philip Morris International, Inc. | | |
| | |
| | |
| | |
| | |
Tyson Foods, Inc., Class A | | |
| | |
|
Health Care Equipment & Services 4.5% |
| | |
Baxter International, Inc. | | |
| | |
Boston Scientific Corp. * | | |
| | |
| | |
| | |
| | |
| | |
| | |
| | |
| | |
| | |
Laboratory Corp. of America Holdings | | |
| | |
| | |
| | |
| | |
Universal Health Services, Inc., Class B | | |
Zimmer Biomet Holdings, Inc. | | |
| | |
|
Household & Personal Products 2.8% |
Church & Dwight Co., Inc. | | |
| | |
| | |
| | |
Reynolds Consumer Products, Inc. | | |
| | |
| | |
| | |
|
|
| | |
American Financial Group, Inc. | | |
American International Group, Inc. | | |
| | |
Arch Capital Group Ltd. * | | |
Arthur J. Gallagher & Co. | | |
| | |
| | |
| | |
Schwab U.S. Equity ETFs | Annual Report93
Schwab U.S. Large-Cap Value ETF
Portfolio Holdings as of August 31, 2023 (continued)
| | |
Cincinnati Financial Corp. | | |
| | |
Erie Indemnity Co., Class A | | |
| | |
F&G Annuities & Life, Inc. | | |
Fidelity National Financial, Inc. | | |
| | |
| | |
| | |
Marsh & McLennan Cos., Inc. | | |
| | |
Old Republic International Corp. | | |
Principal Financial Group, Inc. | | |
Prudential Financial, Inc. | | |
Reinsurance Group of America, Inc. | | |
| | |
The Hartford Financial Services Group, Inc. | | |
| | |
| | |
| | |
| | |
| | |
|
|
Air Products and Chemicals, Inc. | | |
| | |
| | |
| | |
| | |
Axalta Coating Systems Ltd. * | | |
| | |
| | |
| | |
CF Industries Holdings, Inc. | | |
| | |
| | |
| | |
| | |
| | |
| | |
| | |
International Flavors & Fragrances, Inc. | | |
| | |
LyondellBasell Industries N.V., Class A | | |
| | |
| | |
Packaging Corp. of America | | |
| | |
Reliance Steel & Aluminum Co. | | |
| | |
| | |
| | |
| | |
| | |
| | |
| | |
| | |
| | |
|
Media & Entertainment 2.9% |
Activision Blizzard, Inc. | | |
AMC Entertainment Holdings, Inc., Class A *(a) | | |
| | |
DISH Network Corp., Class A * | | |
| | |
| | |
| | |
| | |
Liberty Media Corp.-Liberty Formula One, Class C * | | |
Liberty Media Corp.-Liberty Live, Class C * | | |
Liberty Media Corp.-Liberty SiriusXM, Class C * | | |
| | |
| | |
| | |
Paramount Global, Class B | | |
Sirius XM Holdings, Inc. (a) | | |
The Interpublic Group of Cos., Inc. | | |
| | |
Warner Bros Discovery, Inc. * | | |
| | |
|
Pharmaceuticals, Biotechnology & Life Sciences 8.1% |
| | |
Agilent Technologies, Inc. | | |
| | |
| | |
| | |
| | |
Elanco Animal Health, Inc. * | | |
| | |
| | |
| | |
| | |
| | |
| | |
Royalty Pharma plc, Class A | | |
| | |
| | |
|
Real Estate Management & Development 0.2% |
CBRE Group, Inc., Class A * | | |
Jones Lang LaSalle, Inc. * | | |
| | |
|
Semiconductors & Semiconductor Equipment 4.7% |
| | |
| | |
| | |
| | |
| | |
| | |
Microchip Technology, Inc. | | |
| | |
| | |
| | |
| | |
| | |
| | |
| | |
| | |
|
|
Akamai Technologies, Inc. * | | |
| | |
Bentley Systems, Inc., Class B | | |
| | |
94Schwab U.S. Equity ETFs | Annual Report
Schwab U.S. Large-Cap Value ETF
Portfolio Holdings as of August 31, 2023 (continued)
| | |
Cognizant Technology Solutions Corp., Class A | | |
| | |
| | |
Guidewire Software, Inc. * | | |
International Business Machines Corp. | | |
Manhattan Associates, Inc. * | | |
| | |
Palantir Technologies, Inc., Class A * | | |
| | |
| | |
|
Technology Hardware & Equipment 3.1% |
| | |
Arrow Electronics, Inc. * | | |
| | |
| | |
| | |
| | |
| | |
Hewlett Packard Enterprise Co. | | |
| | |
| | |
| | |
Keysight Technologies, Inc. * | | |
| | |
| | |
Seagate Technology Holdings plc | | |
| | |
| | |
| | |
| | |
| | |
|
Telecommunication Services 1.3% |
| | |
| | |
Liberty Global plc, Class C * | | |
Lumen Technologies, Inc. * | | |
Verizon Communications, Inc. | | |
| | |
|
|
| | |
American Airlines Group, Inc. * | | |
Avis Budget Group, Inc. * | | |
C.H. Robinson Worldwide, Inc. | | |
| | |
| | |
Expeditors International of Washington, Inc. | | |
| | |
J.B. Hunt Transport Services, Inc. | | |
| | |
| | |
| | |
Uber Technologies, Inc. * | | |
| | |
United Airlines Holdings, Inc. * | | |
United Parcel Service, Inc., Class B | | |
| | |
| | |
|
| | |
|
| | |
| | |
American Electric Power Co., Inc. | | |
American Water Works Co., Inc. | | |
| | |
| | |
| | |
| | |
Consolidated Edison, Inc. | | |
| | |
| | |
| | |
| | |
| | |
Essential Utilities, Inc. | | |
| | |
| | |
| | |
| | |
| | |
| | |
| | |
| | |
| | |
Pinnacle West Capital Corp. | | |
| | |
Public Service Enterprise Group, Inc. | | |
| | |
| | |
| | |
| | |
| | |
| | |
| | |
| | |
Total Common Stocks
(Cost $8,232,635,064) | |
| | |
SHORT-TERM INVESTMENTS 0.1% OF NET ASSETS |
|
|
State Street Institutional U.S. Government Money Market Fund, Premier Class 5.28% (d) | | |
State Street Institutional U.S. Government Money Market Fund, Premier Class 5.28% (d)(e) | | |
| | |
Total Short-Term Investments
(Cost $8,698,683) | |
Total Investments in Securities
(Cost $8,241,333,747) | |
Schwab U.S. Equity ETFs | Annual Report95
Schwab U.S. Large-Cap Value ETF
Portfolio Holdings as of August 31, 2023 (continued)
| | | CURRENT VALUE/
UNREALIZED
APPRECIATION
(DEPRECIATION)
($) |
|
| | | |
Russell 1000 Value Index, e-mini, expires 09/15/23 | | | |
S&P 500 Index, e-mini, expires 09/15/23 | | | |
| | | |
| Non-income producing security. |
| All or a portion of this security is on loan. Securities on loan were valued at $4,424,844. |
| Issuer is affiliated with the fund’s investment adviser. |
| Fair valued using significant unobservable inputs (see financial note 2(a), Securities for which no quoted value is available, for additional information). |
| The rate shown is the annualized 7-day yield. |
| Security purchased with cash collateral received for securities on loan. |
| Real Estate Investment Trust |
Below is a summary of the fund’s transactions with affiliated issuers during the period ended August 31, 2023:
| | | | | NET CHANGE IN UNREALIZED APPRECIATION (DEPRECIATION) | | BALANCE OF SHARES HELD AT 8/31/23 | |
COMMON STOCKS 0.4% OF NET ASSETS |
|
|
| | | | | | | | |
The following is a summary of the inputs used to value the fund’s investments as of August 31, 2023 (see financial note 2(a) for additional information):
| QUOTED PRICES IN
ACTIVE MARKETS FOR
IDENTICAL ASSETS
(LEVEL 1) | OTHER SIGNIFICANT
OBSERVABLE INPUTS
(LEVEL 2) | SIGNIFICANT
UNOBSERVABLE INPUTS
(LEVEL 3) | |
| | | | |
| | | | |
Telecommunication Services | | | | |
| | | | |
| | | | |
| | | | |
| | | | |
| | | | |
| As categorized in the Portfolio Holdings. |
| Futures contracts are reported at cumulative unrealized appreciation or depreciation. |
Fund investments in mutual funds are classified as Level 1, without consideration to the classification level of the underlying
securities held by the mutual funds, which could be Level 1, Level 2 or Level 3.
96Schwab U.S. Equity ETFs | Annual Report
Schwab U.S. Large-Cap Value ETF
Statement of Assets and Liabilities
As of August 31, 2023
|
Investments in securities, at value - affiliated (cost $37,285,680) | | |
Investments in securities, at value - unaffiliated (cost $8,204,048,067) including securities on loan of $4,424,844 | | |
Deposit with broker for futures contracts | | |
| | |
| | |
| | |
| | |
Income from securities on loan | | |
| | |
| | |
|
|
Collateral held for securities on loan | | |
| | |
| | |
| | |
| | |
Variation margin on futures contracts | | |
| | |
| | |
|
|
Capital received from investors | | |
Total distributable earnings | | |
| | |
Schwab U.S. Equity ETFs | Annual Report97
Schwab U.S. Large-Cap Value ETF
Statement of Operations
For the period September 1, 2022 through August 31, 2023 |
|
Dividends received from securities - unaffiliated (net of foreign withholding tax of $59,677) | | |
Dividends received from securities - affiliated | | |
| | |
| | |
|
|
| | |
| | |
| | |
| | |
|
REALIZED AND UNREALIZED GAINS (LOSSES) |
Net realized losses on sales of securities - affiliated | | |
Net realized losses on sales of securities - unaffiliated | | |
Net realized gains on sales of in-kind redemptions - affiliated | | |
Net realized gains on sales of in-kind redemptions - unaffiliated | | |
Net realized losses on futures contracts | | |
| | |
Net change in unrealized appreciation (depreciation) on securities - affiliated | | |
Net change in unrealized appreciation (depreciation) on securities - unaffiliated | | |
Net change in unrealized appreciation (depreciation) on futures contracts | | |
Net change in unrealized appreciation (depreciation) | | |
Net realized and unrealized gains | | |
Increase in net assets resulting from operations | | |
| Proxy fees are non-routine expenses (see financial note 2(e) for additional information). |
98Schwab U.S. Equity ETFs | Annual Report
Schwab U.S. Large-Cap Value ETF
Statement of Changes in Net Assets
For the current and prior report periods
|
| | |
| | | |
| | | |
Net change in unrealized appreciation (depreciation) | | | |
Increase (decrease) in net assets resulting from operations | | | |
|
DISTRIBUTIONS TO SHAREHOLDERS |
| | | |
TRANSACTIONS IN FUND SHARES |
| | |
| | | | | |
| | | | | |
| | | | | |
Net transactions in fund shares | | | | | |
|
SHARES OUTSTANDING AND NET ASSETS |
| | |
| | | | | |
| | | | | |
Total increase (decrease) | | | | | |
| | | | | |
Schwab U.S. Equity ETFs | Annual Report99
Financial Statements
| | | | | | |
|
Net asset value at beginning of period | | | | | | |
Income (loss) from investment operations: | | | | | | |
Net investment income (loss)1 | | | | | | |
Net realized and unrealized gains (losses) | | | | | | |
Total from investment operations | | | | | | |
| | | | | | |
Distributions from net investment income | | | | | | |
Net asset value at end of period | | | | | | |
| | | | | | |
|
Ratios to average net assets: | | | | | | |
| | | | | | |
Net investment income (loss) | | | | | | |
| | | | | | |
Net assets, end of period (x 1,000,000) | | | | | | |
| Calculated based on the average shares outstanding during the period. |
| Ratio includes less than 0.005% of non-routine proxy expenses. |
| Effective March 11, 2019, the annual operating expense ratio was reduced. The ratio presented for the period ended August 31, 2019 is a blended ratio. |
| Portfolio turnover rate excludes securities received or delivered from processing of in-kind creations or redemptions. |
100Schwab U.S. Equity ETFs | Annual Report
Portfolio Holdings as of August 31, 2023
This section shows all the securities in the fund’s portfolio and their values as of the report date.
The fund files its complete schedule of portfolio holdings with the U.S. Securities and Exchange Commission (SEC) for the first and third quarters of each fiscal year on Form N-PORT Part F. The fund’s Form N-PORT Part F is available on the SEC’s website at www.sec.gov. You can also obtain this information at no cost on the fund’s website at www.schwabassetmanagement.com/schwabetfs_prospectus, by calling 1-866-414-6349, or by sending an email request to orders@mysummaryprospectus.com. The fund also makes available its complete schedule of portfolio holdings on a daily basis on the fund’s website.
| | |
COMMON STOCKS 99.9% OF NET ASSETS |
|
Automobiles & Components 1.2% |
| | |
| | |
| | |
| | |
| | |
| | |
| | |
| | |
| | |
|
|
| | |
| | |
| | |
Commerce Bancshares, Inc. | | |
Cullen/Frost Bankers, Inc. | | |
| | |
First Citizens BancShares, Inc., Class A | | |
First Financial Bankshares, Inc. | | |
| | |
| | |
New York Community Bancorp, Inc. | | |
Pinnacle Financial Partners, Inc. | | |
| | |
Prosperity Bancshares, Inc. | | |
| | |
| | |
| | |
| | |
| | |
| | |
| | |
|
|
| | |
| | |
Advanced Drainage Systems, Inc. | | |
| | |
| | |
| | |
| | |
Armstrong World Industries, Inc. | | |
| | |
Builders FirstSource, Inc. * | | |
| | |
| | |
ChargePoint Holdings, Inc. *(a) | | |
| | |
| | |
| | |
| | |
| | |
| | |
| | |
Fortune Brands Innovations, Inc. | | |
| | |
| | |
| | |
| | |
Huntington Ingalls Industries, Inc. | | |
| | |
| | |
Lennox International, Inc. | | |
| | |
Lincoln Electric Holdings, Inc. | | |
| | |
| | |
| | |
MDU Resources Group, Inc. | | |
| | |
| | |
| | |
| | |
| | |
| | |
| | |
| | |
Sensata Technologies Holding plc | | |
SiteOne Landscape Supply, Inc. * | | |
| | |
| | |
| | |
| | |
| | |
| | |
| | |
| | |
| | |
| | |
WESCO International, Inc. | | |
Westinghouse Air Brake Technologies Corp. | | |
WillScot Mobile Mini Holdings Corp. * | | |
| | |
Zurn Elkay Water Solutions Corp., Class C | | |
| | |
|
Commercial & Professional Services 4.6% |
| | |
Booz Allen Hamilton Holding Corp., Class A | | |
CACI International, Inc., Class A * | | |
Ceridian HCM Holding, Inc. * | | |
| | |
| | |
| | |
Driven Brands Holdings, Inc. * | | |
Schwab U.S. Equity ETFs | Annual Report101
Portfolio Holdings as of August 31, 2023 (continued)
| | |
Dun & Bradstreet Holdings, Inc. | | |
ExlService Holdings, Inc. * | | |
| | |
| | |
| | |
| | |
| | |
| | |
| | |
Paylocity Holding Corp. * | | |
| | |
Robert Half International, Inc. | | |
Science Applications International Corp. | | |
| | |
| | |
| | |
| | |
|
Consumer Discretionary Distribution & Retail 3.7% |
| | |
| | |
| | |
Burlington Stores, Inc. * | | |
| | |
Dick's Sporting Goods, Inc. | | |
| | |
Floor & Decor Holdings, Inc., Class A * | | |
GameStop Corp., Class A *(a) | | |
| | |
| | |
| | |
| | |
Ollie's Bargain Outlet Holdings, Inc. * | | |
Penske Automotive Group, Inc. | | |
| | |
| | |
| | |
| | |
| | |
| | |
|
Consumer Durables & Apparel 4.1% |
| | |
| | |
| | |
| | |
| | |
| | |
| | |
| | |
Mohawk Industries, Inc. * | | |
| | |
| | |
| | |
| | |
| | |
Skechers U.S.A., Inc., Class A * | | |
| | |
Tempur Sealy International, Inc. | | |
| | |
| | |
Under Armour, Inc., Class A * | | |
| | |
| | |
| | |
| | |
|
|
| | |
| | |
| | |
Bright Horizons Family Solutions, Inc. * | | |
Caesars Entertainment, Inc. * | | |
| | |
Choice Hotels International, Inc. | | |
| | |
DraftKings, Inc., Class A * | | |
| | |
Marriott Vacations Worldwide Corp. | | |
MGM Resorts International | | |
Norwegian Cruise Line Holdings Ltd. * | | |
Penn Entertainment, Inc. * | | |
Planet Fitness, Inc., Class A * | | |
Royal Caribbean Cruises Ltd. * | | |
Service Corp. International | | |
| | |
| | |
| | |
| | |
Wyndham Hotels & Resorts, Inc. | | |
| | |
| | |
|
Consumer Staples Distribution & Retail 1.1% |
Albertsons Cos., Inc., Class A | | |
BJ's Wholesale Club Holdings, Inc. * | | |
Casey's General Stores, Inc. | | |
Performance Food Group Co. * | | |
| | |
| | |
|
|
| | |
| | |
| | |
| | |
| | |
| | |
| | |
| | |
| | |
New Fortress Energy, Inc. | | |
| | |
| | |
| | |
Southwestern Energy Co. * | | |
| | |
| | |
| | |
| | |
|
Equity Real Estate Investment Trusts (REITs) 6.8% |
| | |
American Homes 4 Rent, Class A | | |
Americold Realty Trust, Inc. | | |
Apartment Income REIT Corp. | | |
Brixmor Property Group, Inc. | | |
| | |
102Schwab U.S. Equity ETFs | Annual Report
Portfolio Holdings as of August 31, 2023 (continued)
| | |
| | |
| | |
| | |
EastGroup Properties, Inc. | | |
Equity LifeStyle Properties, Inc. | | |
Federal Realty Investment Trust | | |
First Industrial Realty Trust, Inc. | | |
Gaming & Leisure Properties, Inc. | | |
Healthcare Realty Trust, Inc. | | |
Host Hotels & Resorts, Inc. | | |
| | |
| | |
| | |
Lamar Advertising Co., Class A | | |
Medical Properties Trust, Inc. | | |
| | |
Omega Healthcare Investors, Inc. | | |
| | |
| | |
Rexford Industrial Realty, Inc. | | |
Spirit Realty Capital, Inc. | | |
| | |
| | |
| | |
| | |
| | |
|
|
Affiliated Managers Group, Inc. | | |
| | |
| | |
| | |
Annaly Capital Management, Inc. | | |
Ares Management Corp., Class A | | |
Blackstone Mortgage Trust, Inc., Class A | | |
Cboe Global Markets, Inc. | | |
Credit Acceptance Corp. * | | |
| | |
| | |
Euronet Worldwide, Inc. * | | |
FactSet Research Systems, Inc. | | |
Interactive Brokers Group, Inc., Class A | | |
| | |
Jack Henry & Associates, Inc. | | |
Janus Henderson Group plc | | |
Jefferies Financial Group, Inc. | | |
| | |
LPL Financial Holdings, Inc. | | |
MarketAxess Holdings, Inc. | | |
| | |
| | |
| | |
| | |
Robinhood Markets, Inc., Class A * | | |
| | |
SoFi Technologies, Inc. * | | |
Starwood Property Trust, Inc. | | |
| | |
| | |
| | |
| | |
| | |
Tradeweb Markets, Inc., Class A | | |
| | |
| | |
| | |
| | |
|
Food, Beverage & Tobacco 2.9% |
| | |
| | |
| | |
Darling Ingredients, Inc. * | | |
| | |
| | |
Lamb Weston Holdings, Inc. | | |
| | |
Molson Coors Beverage Co., Class B | | |
| | |
| | |
| | |
The Boston Beer Co., Inc., Class A * | | |
| | |
| | |
|
Health Care Equipment & Services 4.0% |
Acadia Healthcare Co., Inc. * | | |
| | |
| | |
| | |
| | |
| | |
| | |
| | |
| | |
| | |
| | |
Inspire Medical Systems, Inc. * | | |
Integra LifeSciences Holdings Corp. * | | |
Lantheus Holdings, Inc. * | | |
| | |
| | |
Option Care Health, Inc. * | | |
| | |
| | |
| | |
Shockwave Medical, Inc. * | | |
| | |
| | |
| | |
Universal Health Services, Inc., Class B | | |
| | |
|
Household & Personal Products 0.2% |
| | |
| | |
Reynolds Consumer Products, Inc. | | |
| | |
|
|
American Financial Group, Inc. | | |
| | |
Axis Capital Holdings Ltd. | | |
| | |
Erie Indemnity Co., Class A | | |
| | |
F&G Annuities & Life, Inc. | | |
Fidelity National Financial, Inc. | | |
First American Financial Corp. | | |
Schwab U.S. Equity ETFs | Annual Report103
Portfolio Holdings as of August 31, 2023 (continued)
| | |
| | |
Kinsale Capital Group, Inc. | | |
| | |
| | |
Old Republic International Corp. | | |
| | |
Reinsurance Group of America, Inc. | | |
RenaissanceRe Holdings Ltd. | | |
Selective Insurance Group, Inc. | | |
The Hanover Insurance Group, Inc. | | |
| | |
| | |
| | |
|
|
| | |
| | |
| | |
| | |
Axalta Coating Systems Ltd. * | | |
| | |
| | |
| | |
| | |
| | |
| | |
| | |
Graphic Packaging Holding Co. | | |
| | |
| | |
| | |
| | |
Packaging Corp. of America | | |
Reliance Steel & Aluminum Co. | | |
| | |
| | |
| | |
| | |
| | |
The Scotts Miracle-Gro Co. | | |
United States Steel Corp. | | |
| | |
| | |
| | |
|
Media & Entertainment 2.5% |
AMC Entertainment Holdings, Inc., Class A *(a) | | |
| | |
| | |
DISH Network Corp., Class A * | | |
Endeavor Group Holdings, Inc., Class A * | | |
| | |
Liberty Media Corp.-Liberty Formula One, Class C * | | |
| | |
Nexstar Media Group, Inc., Class A | | |
Pinterest, Inc., Class A * | | |
| | |
| | |
The Interpublic Group of Cos., Inc. | | |
The New York Times Co., Class A | | |
| | |
|
| | |
Pharmaceuticals, Biotechnology & Life Sciences 5.7% |
10X Genomics, Inc., Class A * | | |
| | |
Apellis Pharmaceuticals, Inc. * | | |
Arrowhead Pharmaceuticals, Inc. * | | |
| | |
BioMarin Pharmaceutical, Inc. * | | |
Bio-Rad Laboratories, Inc., Class A * | | |
| | |
| | |
Charles River Laboratories International, Inc. * | | |
| | |
Elanco Animal Health, Inc. * | | |
| | |
| | |
Halozyme Therapeutics, Inc. * | | |
Intellia Therapeutics, Inc. * | | |
Ionis Pharmaceuticals, Inc. * | | |
Jazz Pharmaceuticals plc * | | |
Karuna Therapeutics, Inc. * | | |
Mirati Therapeutics, Inc. * | | |
| | |
Neurocrine Biosciences, Inc. * | | |
| | |
| | |
| | |
Sarepta Therapeutics, Inc. * | | |
| | |
| | |
United Therapeutics Corp. * | | |
| | |
| | |
|
Real Estate Management & Development 0.6% |
Jones Lang LaSalle, Inc. * | | |
Opendoor Technologies, Inc. * | | |
| | |
Zillow Group, Inc., Class C * | | |
| | |
|
Semiconductors & Semiconductor Equipment 2.7% |
Allegro MicroSystems, Inc. * | | |
| | |
| | |
Lattice Semiconductor Corp. * | | |
| | |
| | |
| | |
Silicon Laboratories, Inc. * | | |
SolarEdge Technologies, Inc. * | | |
| | |
| | |
| | |
| | |
|
|
AppLovin Corp., Class A * | | |
| | |
Bentley Systems, Inc., Class B | | |
| | |
| | |
CCC Intelligent Solutions Holdings, Inc. * | | |
104Schwab U.S. Equity ETFs | Annual Report
Portfolio Holdings as of August 31, 2023 (continued)
| | |
Dolby Laboratories, Inc., Class A | | |
| | |
| | |
| | |
| | |
| | |
| | |
| | |
Guidewire Software, Inc. * | | |
Informatica, Inc., Class A * | | |
Manhattan Associates, Inc. * | | |
| | |
| | |
Procore Technologies, Inc. * | | |
| | |
| | |
Smartsheet, Inc., Class A * | | |
Thoughtworks Holding, Inc. * | | |
Tyler Technologies, Inc. * | | |
| | |
| | |
|
Technology Hardware & Equipment 3.9% |
Arrow Electronics, Inc. * | | |
| | |
| | |
| | |
| | |
Dell Technologies, Inc., Class C | | |
| | |
| | |
| | |
| | |
| | |
Lumentum Holdings, Inc. * | | |
National Instruments Corp. | | |
| | |
Pure Storage, Inc., Class A * | | |
| | |
| | |
| | |
|
Telecommunication Services 0.5% |
Frontier Communications Parent, Inc. * | | |
| | |
Iridium Communications, Inc. | | |
Liberty Global plc, Class C * | | |
Lumen Technologies, Inc. * | | |
| | |
|
|
| | |
American Airlines Group, Inc. * | | |
Avis Budget Group, Inc. * | | |
C.H. Robinson Worldwide, Inc. | | |
| | |
Hertz Global Holdings, Inc. * | | |
Knight-Swift Transportation Holdings, Inc. | | |
| | |
| | |
| | |
| | |
| | |
| | |
United Airlines Holdings, Inc. * | | |
| | |
| | |
|
|
| | |
| | |
| | |
Essential Utilities, Inc. | | |
Hawaiian Electric Industries, Inc. (a) | | |
| | |
| | |
| | |
| | |
| | |
Pinnacle West Capital Corp. | | |
Portland General Electric Co. | | |
| | |
| | |
| | |
| | |
Total Common Stocks
(Cost $8,623,164,140) | |
| | |
SHORT-TERM INVESTMENTS 0.4% OF NET ASSETS |
|
|
State Street Institutional U.S. Government Money Market Fund, Premier Class 5.28% (c) | | |
State Street Institutional U.S. Government Money Market Fund, Premier Class 5.28% (c)(d) | | |
| | |
Total Short-Term Investments
(Cost $36,394,844) | |
Total Investments in Securities
(Cost $8,659,558,984) | |
| | | CURRENT VALUE/
UNREALIZED
APPRECIATION
($) |
|
| | | |
S&P 400 Mid-Cap Index, e-mini, expires 09/15/23 | | | |
| Non-income producing security. |
| All or a portion of this security is on loan. Securities on loan were valued at $27,895,253. |
| Fair valued using significant unobservable inputs (see financial note 2(a), Securities for which no quoted value is available, for additional information). |
| The rate shown is the annualized 7-day yield. |
| Security purchased with cash collateral received for securities on loan. |
| Real Estate Investment Trust |
Schwab U.S. Equity ETFs | Annual Report105
Portfolio Holdings as of August 31, 2023 (continued)
The following is a summary of the inputs used to value the fund’s investments as of August 31, 2023 (see financial note 2(a) for additional information):
| QUOTED PRICES IN
ACTIVE MARKETS FOR
IDENTICAL ASSETS
(LEVEL 1) | OTHER SIGNIFICANT
OBSERVABLE INPUTS
(LEVEL 2) | SIGNIFICANT
UNOBSERVABLE INPUTS
(LEVEL 3) | |
| | | | |
| | | | |
Telecommunication Services | | | | |
| | | | |
| | | | |
| | | | |
| As categorized in the Portfolio Holdings. |
| Futures contracts are reported at cumulative unrealized appreciation or depreciation. |
Fund investments in mutual funds are classified as Level 1, without consideration to the classification level of the underlying
securities held by the mutual funds, which could be Level 1, Level 2 or Level 3.
106Schwab U.S. Equity ETFs | Annual Report
Statement of Assets and Liabilities
As of August 31, 2023
|
Investments in securities, at value - unaffiliated (cost $8,659,558,984) including securities on loan of $27,895,253 | | |
| | |
Deposit with broker for futures contracts | | |
| | |
| | |
| | |
| | |
Income from securities on loan | | |
| | |
|
|
Collateral held for securities on loan | | |
| | |
| | |
| | |
| | |
Variation margin on futures contracts | | |
| | |
| | |
|
|
Capital received from investors | | |
Total distributable earnings | | |
| | |
Schwab U.S. Equity ETFs | Annual Report107
Statement of Operations
For the period September 1, 2022 through August 31, 2023 |
|
Dividends received from securities - unaffiliated (net of foreign withholding tax of $61,778) | | |
| | |
| | |
|
|
| | |
| | |
| | |
| | |
|
REALIZED AND UNREALIZED GAINS (LOSSES) |
Net realized losses on sales of securities - unaffiliated | | |
Net realized gains on sales of in-kind redemptions - unaffiliated | | |
Net realized gains on futures contracts | | |
| | |
Net change in unrealized appreciation (depreciation) on securities - unaffiliated | | |
Net change in unrealized appreciation (depreciation) on futures contracts | | |
Net change in unrealized appreciation (depreciation) | | |
Net realized and unrealized gains | | |
Increase in net assets resulting from operations | | |
| Proxy fees are non-routine expenses (see financial note 2(e) for additional information). |
108Schwab U.S. Equity ETFs | Annual Report
Statement of Changes in Net Assets
For the current and prior report periods
|
| | |
| | | |
| | | |
Net change in unrealized appreciation (depreciation) | | | |
Increase (decrease) in net assets resulting from operations | | | |
|
DISTRIBUTIONS TO SHAREHOLDERS |
| | | |
TRANSACTIONS IN FUND SHARES |
| | |
| | | | | |
| | | | | |
| | | | | |
Net transactions in fund shares | | | | | |
|
SHARES OUTSTANDING AND NET ASSETS |
| | |
| | | | | |
| | | | | |
Total increase (decrease) | | | | | |
| | | | | |
Schwab U.S. Equity ETFs | Annual Report109
Schwab U.S. Small-Cap ETF
Financial Statements
| | | | | | |
|
Net asset value at beginning of period | | | | | | |
Income (loss) from investment operations: | | | | | | |
Net investment income (loss)2 | | | | | | |
Net realized and unrealized gains (losses) | | | | | | |
Total from investment operations | | | | | | |
| | | | | | |
Distributions from net investment income | | | | | | |
Net asset value at end of period | | | | | | |
| | | | | | |
|
Ratios to average net assets: | | | | | | |
| | | | | | |
Net investment income (loss) | | | | | | |
| | | | | | |
Net assets, end of period (x 1,000,000) | | | | | | |
| Per-Share Data has been retroactively adjusted to reflect a 2-for-1 share split effective after market close on March 10, 2022 (see financial note 12 for additional information). |
| Calculated based on the average shares outstanding during the period. |
| Ratio includes less than 0.005% of non-routine proxy expenses. |
| Effective March 11, 2019, the annual operating expense ratio was reduced. The ratio presented for the period ended August 31, 2019 is a blended ratio. |
| Portfolio turnover rate excludes securities received or delivered from processing of in-kind creations or redemptions. |
110Schwab U.S. Equity ETFs | Annual Report
Schwab U.S. Small-Cap ETF
Portfolio Holdings as of August 31, 2023
This section shows all the securities in the fund’s portfolio and their values as of the report date.
The fund files its complete schedule of portfolio holdings with the U.S. Securities and Exchange Commission (SEC) for the first and third quarters of each fiscal year on Form N-PORT Part F. The fund’s Form N-PORT Part F is available on the SEC’s website at www.sec.gov. You can also obtain this information at no cost on the fund’s website at www.schwabassetmanagement.com/schwabetfs_prospectus, by calling 1-866-414-6349, or by sending an email request to orders@mysummaryprospectus.com. The fund also makes available its complete schedule of portfolio holdings on a daily basis on the fund’s website.
| | |
COMMON STOCKS 99.8% OF NET ASSETS |
|
Automobiles & Components 1.5% |
| | |
American Axle & Manufacturing Holdings, Inc. * | | |
| | |
| | |
| | |
Faraday Future Intelligent Electric, Inc. *(a) | | |
| | |
Fox Factory Holding Corp. * | | |
| | |
| | |
| | |
Luminar Technologies, Inc. *(a) | | |
Mobileye Global, Inc., Class A * | | |
Modine Manufacturing Co. * | | |
| | |
| | |
| | |
Standard Motor Products, Inc. | | |
| | |
The Goodyear Tire & Rubber Co. * | | |
| | |
| | |
Winnebago Industries, Inc. | | |
Workhorse Group, Inc. *(a) | | |
| | |
| | |
|
|
| | |
| | |
| | |
| | |
Atlantic Union Bankshares Corp. | | |
| | |
| | |
| | |
| | |
| | |
| | |
| | |
| | |
Berkshire Hills Bancorp, Inc. | | |
| | |
| | |
| | |
| | |
Capitol Federal Financial, Inc. | | |
| | |
Central Pacific Financial Corp. | | |
Citizens Financial Services, Inc. (a) | | |
| | |
| | |
Columbia Banking System, Inc. | | |
Columbia Financial, Inc. * | | |
Community Bank System, Inc. | | |
Community Trust Bancorp, Inc. | | |
| | |
CrossFirst Bankshares, Inc. * | | |
Customers Bancorp, Inc. * | | |
| | |
Dime Community Bancshares, Inc. | | |
| | |
| | |
Enterprise Financial Services Corp. | | |
| | |
| | |
Financial Institutions, Inc. | | |
| | |
First Bancorp/Southern Pines NC | | |
| | |
First Commonwealth Financial Corp. | | |
First Community Bankshares, Inc. | | |
| | |
First Financial Bankshares, Inc. | | |
| | |
| | |
| | |
First Interstate BancSystem, Inc., Class A | | |
| | |
First Mid Bancshares, Inc. | | |
| | |
| | |
German American Bancorp, Inc. | | |
| | |
Great Southern Bancorp, Inc. | | |
| | |
| | |
| | |
Heartland Financial USA, Inc. | | |
| | |
| | |
| | |
| | |
| | |
| | |
| | |
| | |
Independent Bank Group, Inc. | | |
International Bancshares Corp. | | |
| | |
| | |
| | |
| | |
Live Oak Bancshares, Inc. | | |
| | |
| | |
Metrocity Bankshares, Inc. | | |
Schwab U.S. Equity ETFs | Annual Report111
Schwab U.S. Small-Cap ETF
Portfolio Holdings as of August 31, 2023 (continued)
| | |
Midland States Bancorp, Inc. | | |
National Bank Holdings Corp., Class A | | |
| | |
New York Community Bancorp, Inc. | | |
| | |
| | |
Northwest Bancshares, Inc. | | |
OceanFirst Financial Corp. | | |
| | |
| | |
| | |
Pacific Premier Bancorp, Inc. | | |
| | |
| | |
| | |
Peapack-Gladstone Financial Corp. | | |
| | |
Pinnacle Financial Partners, Inc. | | |
| | |
| | |
| | |
Prosperity Bancshares, Inc. | | |
Provident Financial Services, Inc. | | |
| | |
| | |
Republic Bancorp, Inc., Class A | | |
| | |
Sandy Spring Bancorp, Inc. | | |
Seacoast Banking Corp. of Florida | | |
ServisFirst Bancshares, Inc. | | |
Simmons First National Corp., Class A | | |
Southside Bancshares, Inc. | | |
| | |
| | |
Stock Yards Bancorp, Inc. | | |
| | |
Texas Capital Bancshares, Inc. * | | |
| | |
The First Bancshares, Inc. | | |
The First of Long Island Corp. | | |
| | |
| | |
| | |
| | |
| | |
| | |
| | |
| | |
United Community Banks, Inc. | | |
| | |
| | |
| | |
| | |
Washington Trust Bancorp, Inc. | | |
| | |
| | |
| | |
| | |
| | |
|
|
| | |
| | |
| | |
| | |
| | |
| | |
| | |
| | |
Albany International Corp., Class A | | |
Allison Transmission Holdings, Inc. | | |
Ameresco, Inc., Class A * | | |
American Woodmark Corp. * | | |
Amprius Technologies, Inc. *(a) | | |
| | |
| | |
Applied Industrial Technologies, Inc. | | |
Archer Aviation, Inc., Class A *(a) | | |
| | |
| | |
Armstrong World Industries, Inc. | | |
Array Technologies, Inc. * | | |
| | |
| | |
| | |
| | |
Babcock & Wilcox Enterprises, Inc. * | | |
| | |
Beacon Roofing Supply, Inc. * | | |
| | |
Bloom Energy Corp., Class A * | | |
| | |
| | |
ChargePoint Holdings, Inc. *(a) | | |
| | |
CIRCOR International, Inc. * | | |
| | |
Comfort Systems USA, Inc. | | |
Construction Partners, Inc., Class A * | | |
Core & Main, Inc., Class A * | | |
| | |
| | |
| | |
Custom Truck One Source, Inc. * | | |
Desktop Metal, Inc., Class A *(a) | | |
| | |
Dragonfly Energy Holdings Corp. * | | |
| | |
| | |
| | |
| | |
| | |
Energy Vault Holdings, Inc. *(a) | | |
| | |
| | |
| | |
| | |
| | |
| | |
| | |
| | |
| | |
| | |
| | |
Franklin Electric Co., Inc. | | |
| | |
| | |
FuelCell Energy, Inc. *(a) | | |
Gates Industrial Corp. plc * | | |
| | |
Gibraltar Industries, Inc. * | | |
| | |
| | |
GrafTech International Ltd. | | |
112Schwab U.S. Equity ETFs | Annual Report
Schwab U.S. Small-Cap ETF
Portfolio Holdings as of August 31, 2023 (continued)
| | |
Granite Construction, Inc. | | |
Great Lakes Dredge & Dock Corp. * | | |
| | |
H&E Equipment Services, Inc. | | |
| | |
| | |
Helios Technologies, Inc. | | |
| | |
| | |
| | |
Hillman Solutions Corp. * | | |
| | |
Hyster-Yale Materials Handling, Inc. | | |
| | |
| | |
| | |
Intuitive Machines, Inc. *(a) | | |
| | |
Janus International Group, Inc. * | | |
| | |
John Bean Technologies Corp. | | |
| | |
| | |
| | |
Kratos Defense & Security Solutions, Inc. * | | |
| | |
| | |
Markforged Holding Corp. * | | |
Masonite International Corp. * | | |
| | |
| | |
MDU Resources Group, Inc. | | |
| | |
Microvast Holdings, Inc. * | | |
| | |
| | |
MSC Industrial Direct Co., Inc., Class A | | |
| | |
Mueller Water Products, Inc., Class A | | |
| | |
National Presto Industries, Inc. | | |
Nauticus Robotics, Inc. * | | |
NEXTracker, Inc., Class A * | | |
| | |
| | |
| | |
| | |
| | |
| | |
| | |
| | |
| | |
| | |
| | |
Quanex Building Products Corp. | | |
| | |
Resideo Technologies, Inc. * | | |
| | |
| | |
Rush Enterprises, Inc., Class A | | |
Rush Enterprises, Inc., Class B | | |
Sarcos Technology & Robotics Corp. * | | |
| | |
Shoals Technologies Group, Inc., Class A * | | |
Simpson Manufacturing Co., Inc. | | |
| | |
SiteOne Landscape Supply, Inc. * | | |
Southland Holdings, Inc. *(a) | | |
Spirit AeroSystems Holdings, Inc., Class A | | |
| | |
Standex International Corp. | | |
| | |
| | |
| | |
| | |
| | |
| | |
| | |
| | |
| | |
| | |
The Greenbrier Cos., Inc. | | |
The Manitowoc Co., Inc. * | | |
| | |
| | |
Thermon Group Holdings, Inc. * | | |
Titan International, Inc. * | | |
| | |
| | |
| | |
Triton International Ltd. | | |
| | |
| | |
| | |
| | |
| | |
| | |
| | |
| | |
| | |
| | |
Virgin Galactic Holdings, Inc. *(a) | | |
| | |
Watts Water Technologies, Inc., Class A | | |
WESCO International, Inc. | | |
| | |
Zurn Elkay Water Solutions Corp., Class C | | |
| | |
|
Commercial & Professional Services 4.5% |
| | |
| | |
| | |
| | |
Barrett Business Services, Inc. | | |
BlackSky Technology, Inc. *(a) | | |
| | |
BrightView Holdings, Inc. * | | |
CACI International, Inc., Class A * | | |
Casella Waste Systems, Inc., Class A * | | |
| | |
| | |
| | |
| | |
| | |
CSG Systems International, Inc. | | |
| | |
Driven Brands Holdings, Inc. * | | |
| | |
| | |
Schwab U.S. Equity ETFs | Annual Report113
Schwab U.S. Small-Cap ETF
Portfolio Holdings as of August 31, 2023 (continued)
| | |
ExlService Holdings, Inc. * | | |
| | |
| | |
FiscalNote Holdings, Inc. *(a) | | |
Forrester Research, Inc. * | | |
| | |
| | |
Healthcare Services Group, Inc. | | |
Heidrick & Struggles International, Inc. | | |
Heritage-Crystal Clean, Inc. * | | |
HireRight Holdings Corp. * | | |
| | |
Huron Consulting Group, Inc. * | | |
| | |
| | |
| | |
| | |
Kelly Services, Inc., Class A | | |
| | |
| | |
LanzaTech Global, Inc. *(a) | | |
| | |
Liquidity Services, Inc. * | | |
| | |
Matthews International Corp., Class A | | |
| | |
| | |
Montrose Environmental Group, Inc. * | | |
| | |
| | |
| | |
| | |
| | |
| | |
Resources Connection, Inc. | | |
Science Applications International Corp. | | |
| | |
| | |
| | |
| | |
| | |
| | |
| | |
| | |
| | |
| | |
| | |
| | |
| | |
| | |
| | |
| | |
|
Consumer Discretionary Distribution & Retail 3.1% |
1-800-Flowers.com, Inc., Class A * | | |
Abercrombie & Fitch Co., Class A * | | |
Academy Sports & Outdoors, Inc. | | |
American Eagle Outfitters, Inc. | | |
America's Car-Mart, Inc. * | | |
| | |
Asbury Automotive Group, Inc. * | | |
| | |
| | |
| | |
Boot Barn Holdings, Inc. * | | |
| | |
| | |
Camping World Holdings, Inc., Class A | | |
| | |
| | |
| | |
ContextLogic, Inc., Class A *(a) | | |
Designer Brands, Inc., Class A (a) | | |
Dick's Sporting Goods, Inc. | | |
| | |
| | |
| | |
| | |
| | |
| | |
| | |
Haverty Furniture Cos., Inc. | | |
| | |
| | |
| | |
| | |
| | |
LL Flooring Holdings, Inc. * | | |
| | |
| | |
| | |
| | |
National Vision Holdings, Inc. * | | |
| | |
Ollie's Bargain Outlet Holdings, Inc. * | | |
| | |
Petco Health & Wellness Co., Inc. * | | |
| | |
| | |
Rent the Runway, Inc., Class A *(a) | | |
| | |
Sally Beauty Holdings, Inc. * | | |
| | |
| | |
| | |
Sonic Automotive, Inc., Class A | | |
Sportsman's Warehouse Holdings, Inc. * | | |
Stitch Fix, Inc., Class A * | | |
| | |
| | |
The Children's Place, Inc. * | | |
The Container Store Group, Inc. * | | |
| | |
| | |
Torrid Holdings, Inc. *(a) | | |
| | |
| | |
| | |
Victoria's Secret & Co. * | | |
Warby Parker, Inc., Class A * | | |
| | |
| | |
| | |
|
Consumer Durables & Apparel 4.3% |
| | |
| | |
| | |
| | |
| | |
| | |
114Schwab U.S. Equity ETFs | Annual Report
Schwab U.S. Small-Cap ETF
Portfolio Holdings as of August 31, 2023 (continued)
| | |
| | |
Century Communities, Inc. | | |
| | |
| | |
Dream Finders Homes, Inc., Class A * | | |
Ethan Allen Interiors, Inc. | | |
| | |
| | |
| | |
G-III Apparel Group Ltd. * | | |
| | |
Green Brick Partners, Inc. * | | |
| | |
| | |
Installed Building Products, Inc. | | |
| | |
Johnson Outdoors, Inc., Class A | | |
| | |
| | |
| | |
| | |
Levi Strauss & Co., Class A | | |
| | |
| | |
| | |
Malibu Boats, Inc., Class A * | | |
| | |
| | |
| | |
| | |
Peloton Interactive, Inc., Class A * | | |
Purple Innovation, Inc. (a) | | |
| | |
| | |
Skechers U.S.A., Inc., Class A * | | |
| | |
Smith & Wesson Brands, Inc. | | |
Snap One Holdings Corp. * | | |
Solo Brands, Inc., Class A * | | |
| | |
| | |
| | |
Taylor Morrison Home Corp. * | | |
Tempur Sealy International, Inc. | | |
| | |
Topgolf Callaway Brands Corp. * | | |
| | |
| | |
Tupperware Brands Corp. * | | |
Under Armour, Inc., Class A * | | |
United Homes Group, Inc. *(a) | | |
Universal Electronics, Inc. * | | |
| | |
Vizio Holding Corp., Class A * | | |
Wolverine World Wide, Inc. | | |
| | |
| | |
|
|
| | |
Accel Entertainment, Inc. * | | |
Adtalem Global Education, Inc. * | | |
| | |
| | |
| | |
| | |
| | |
| | |
Bright Horizons Family Solutions, Inc. * | | |
Brinker International, Inc. * | | |
| | |
| | |
Choice Hotels International, Inc. | | |
| | |
| | |
| | |
Cracker Barrel Old Country Store, Inc. | | |
Dave & Buster's Entertainment, Inc. * | | |
| | |
| | |
| | |
Dutch Bros, Inc., Class A *(a) | | |
El Pollo Loco Holdings, Inc. | | |
| | |
First Watch Restaurant Group, Inc. * | | |
| | |
Golden Entertainment, Inc. | | |
Graham Holdings Co., Class B | | |
Grand Canyon Education, Inc. * | | |
| | |
Hilton Grand Vacations, Inc. * | | |
Hyatt Hotels Corp., Class A | | |
| | |
| | |
| | |
Life Time Group Holdings, Inc. * | | |
| | |
Lindblad Expeditions Holdings, Inc. * | | |
Marriott Vacations Worldwide Corp. | | |
| | |
Monarch Casino & Resort, Inc. | | |
OneSpaWorld Holdings Ltd. * | | |
Papa John's International, Inc. | | |
Penn Entertainment, Inc. * | | |
| | |
Planet Fitness, Inc., Class A * | | |
Playa Hotels & Resorts N.V. * | | |
Portillo's, Inc., Class A * | | |
Red Rock Resorts, Inc., Class A | | |
| | |
Rush Street Interactive, Inc. * | | |
| | |
SeaWorld Entertainment, Inc. * | | |
Shake Shack, Inc., Class A * | | |
Six Flags Entertainment Corp. * | | |
| | |
Strategic Education, Inc. | | |
| | |
Sweetgreen, Inc., Class A * | | |
Target Hospitality Corp. * | | |
| | |
The Cheesecake Factory, Inc. | | |
| | |
| | |
| | |
| | |
| | |
| | |
| | |
|
Consumer Staples Distribution & Retail 1.0% |
Casey's General Stores, Inc. | | |
Grocery Outlet Holding Corp. * | | |
Ingles Markets, Inc., Class A | | |
Schwab U.S. Equity ETFs | Annual Report115
Schwab U.S. Small-Cap ETF
Portfolio Holdings as of August 31, 2023 (continued)
| | |
Performance Food Group Co. * | | |
| | |
| | |
| | |
Sprouts Farmers Market, Inc. * | | |
| | |
The Chefs' Warehouse, Inc. * | | |
United Natural Foods, Inc. * | | |
| | |
| | |
|
|
| | |
| | |
Atlas Energy Solutions, Inc., Class A (a) | | |
| | |
| | |
California Resources Corp. | | |
| | |
| | |
| | |
| | |
Clean Energy Fuels Corp. * | | |
Clean Energy Technologies, Inc. * | | |
| | |
| | |
| | |
| | |
| | |
| | |
| | |
Diamond Offshore Drilling, Inc. * | | |
| | |
| | |
| | |
Earthstone Energy, Inc., Class A * | | |
| | |
Equitrans Midstream Corp. | | |
Excelerate Energy, Inc., Class A | | |
Expro Group Holdings N.V. * | | |
Granite Ridge Resources, Inc. (a) | | |
| | |
| | |
Helix Energy Solutions Group, Inc. * | | |
| | |
HighPeak Energy, Inc. (a) | | |
International Seaways, Inc. | | |
| | |
| | |
| | |
Magnolia Oil & Gas Corp., Class A | | |
| | |
| | |
| | |
NexTier Oilfield Solutions, Inc. * | | |
| | |
Northern Oil and Gas, Inc. | | |
| | |
Oceaneering International, Inc. * | | |
Par Pacific Holdings, Inc. * | | |
Patterson-UTI Energy, Inc. | | |
PBF Energy, Inc., Class A | | |
| | |
| | |
ProFrac Holding Corp., Class A *(a) | | |
| | |
| | |
| | |
| | |
| | |
Southwestern Energy Co. * | | |
| | |
| | |
| | |
| | |
| | |
US Silica Holdings, Inc. * | | |
| | |
Verde Clean Fuels, Inc. *(a) | | |
| | |
Weatherford International plc * | | |
World Fuel Services Corp. | | |
| | |
|
Equity Real Estate Investment Trusts (REITs) 5.3% |
| | |
| | |
Alexander & Baldwin, Inc. | | |
| | |
American Assets Trust, Inc. | | |
Apartment Investment & Management Co., Class A | | |
Apple Hospitality REIT, Inc. | | |
Armada Hoffler Properties, Inc. | | |
| | |
Brixmor Property Group, Inc. | | |
Broadstone Net Lease, Inc. | | |
| | |
| | |
| | |
| | |
Community Healthcare Trust, Inc. | | |
Corporate Office Properties Trust | | |
| | |
DiamondRock Hospitality Co. | | |
Diversified Healthcare Trust | | |
| | |
Easterly Government Properties, Inc. | | |
EastGroup Properties, Inc. | | |
| | |
Empire State Realty Trust, Inc., Class A | | |
| | |
| | |
Essential Properties Realty Trust, Inc. | | |
First Industrial Realty Trust, Inc. | | |
Four Corners Property Trust, Inc. | | |
Franklin Street Properties Corp. | | |
| | |
Gladstone Commercial Corp. | | |
Global Medical REIT, Inc. | | |
| | |
Highwoods Properties, Inc. | | |
Hudson Pacific Properties, Inc. | | |
Independence Realty Trust, Inc. | | |
Industrial Logistics Properties Trust | | |
Innovative Industrial Properties, Inc. | | |
InvenTrust Properties Corp. | | |
| | |
| | |
| | |
| | |
National Health Investors, Inc. | | |
National Storage Affiliates Trust | | |
116Schwab U.S. Equity ETFs | Annual Report
Schwab U.S. Small-Cap ETF
Portfolio Holdings as of August 31, 2023 (continued)
| | |
NexPoint Diversified Real Estate Trust | | |
NexPoint Residential Trust, Inc. | | |
Office Properties Income Trust | | |
One Liberty Properties, Inc. | | |
| | |
| | |
| | |
Park Hotels & Resorts, Inc. | | |
Peakstone Realty Trust (a) | | |
| | |
Phillips Edison & Co., Inc. | | |
| | |
Piedmont Office Realty Trust, Inc., Class A | | |
| | |
| | |
Retail Opportunity Investments Corp. | | |
| | |
| | |
Ryman Hospitality Properties, Inc. | | |
Sabra Health Care REIT, Inc. | | |
| | |
| | |
| | |
| | |
SL Green Realty Corp. (a) | | |
Spirit Realty Capital, Inc. | | |
| | |
| | |
Strawberry Fields REIT, Inc. (a) | | |
Summit Hotel Properties, Inc. | | |
Sunstone Hotel Investors, Inc. | | |
Tanger Factory Outlet Centers, Inc. | | |
| | |
| | |
The Necessity Retail REIT, Inc. | | |
| | |
| | |
Universal Health Realty Income Trust | | |
| | |
Veris Residential, Inc. * | | |
Xenia Hotels & Resorts, Inc. | | |
| | |
|
|
Affiliated Managers Group, Inc. | | |
| | |
| | |
Apollo Commercial Real Estate Finance, Inc. | | |
Arbor Realty Trust, Inc. (a) | | |
ARMOUR Residential REIT, Inc. | | |
Artisan Partners Asset Management, Inc., Class A | | |
Assetmark Financial Holdings, Inc. * | | |
| | |
AvidXchange Holdings, Inc. * | | |
B. Riley Financial, Inc. (a) | | |
| | |
Blackstone Mortgage Trust, Inc., Class A | | |
| | |
Bread Financial Holdings, Inc. | | |
Brightsphere Investment Group, Inc. | | |
BrightSpire Capital, Inc. | | |
| | |
| | |
| | |
Cass Information Systems, Inc. | | |
| | |
Claros Mortgage Trust, Inc. | | |
| | |
Curo Group Holdings Corp. * | | |
Diamond Hill Investment Group, Inc. | | |
Donnelley Financial Solutions, Inc. * | | |
| | |
Ellington Financial, Inc. | | |
| | |
Encore Capital Group, Inc. * | | |
Enova International, Inc. * | | |
| | |
Euronet Worldwide, Inc. * | | |
| | |
| | |
Federal Agricultural Mortgage Corp., Class C | | |
| | |
| | |
| | |
Focus Financial Partners, Inc., Class A *(c) | | |
Forge Global Holdings, Inc. *(a) | | |
Franklin BSP Realty Trust, Inc. | | |
Granite Point Mortgage Trust, Inc. | | |
Green Dot Corp., Class A * | | |
Hamilton Lane, Inc., Class A | | |
Hannon Armstrong Sustainable Infrastructure Capital, Inc. | | |
| | |
Interactive Brokers Group, Inc., Class A | | |
International Money Express, Inc. * | | |
Invesco Mortgage Capital, Inc. | | |
Jackson Financial, Inc., Class A | | |
Janus Henderson Group plc | | |
KKR Real Estate Finance Trust, Inc. | | |
| | |
| | |
| | |
| | |
| | |
| | |
| | |
| | |
| | |
| | |
| | |
| | |
| | |
NerdWallet, Inc., Class A * | | |
New York Mortgage Trust, Inc. | | |
| | |
NMI Holdings, Inc., Class A * | | |
| | |
Open Lending Corp., Class A * | | |
| | |
PennyMac Financial Services, Inc. | | |
PennyMac Mortgage Investment Trust | | |
| | |
PJT Partners, Inc., Class A | | |
| | |
| | |
| | |
| | |
| | |
| | |
Schwab U.S. Equity ETFs | Annual Report117
Schwab U.S. Small-Cap ETF
Portfolio Holdings as of August 31, 2023 (continued)
| | |
| | |
| | |
Robinhood Markets, Inc., Class A * | | |
Rocket Cos., Inc., Class A *(a) | | |
| | |
Shift4 Payments, Inc., Class A * | | |
| | |
StepStone Group, Inc., Class A | | |
| | |
| | |
| | |
| | |
TPG RE Finance Trust, Inc. | | |
| | |
Tradeweb Markets, Inc., Class A | | |
Two Harbors Investment Corp. | | |
Upstart Holdings, Inc. *(a) | | |
| | |
Victory Capital Holdings, Inc., Class A | | |
Virtu Financial, Inc., Class A | | |
Virtus Investment Partners, Inc. | | |
| | |
Waterstone Financial, Inc. | | |
| | |
| | |
| | |
|
Food, Beverage & Tobacco 1.9% |
| | |
| | |
| | |
| | |
| | |
| | |
| | |
Coca-Cola Consolidated, Inc. | | |
| | |
Fresh Del Monte Produce, Inc. | | |
| | |
| | |
| | |
| | |
John B Sanfilippo & Son, Inc. | | |
| | |
| | |
| | |
National Beverage Corp. * | | |
| | |
| | |
| | |
The Boston Beer Co., Inc., Class A * | | |
The Duckhorn Portfolio, Inc. * | | |
The Hain Celestial Group, Inc. * | | |
The Simply Good Foods Co. * | | |
The Vita Coco Co., Inc. * | | |
Tootsie Roll Industries, Inc. | | |
| | |
Turning Point Brands, Inc. | | |
| | |
| | |
| | |
| | |
| | |
| | |
|
| | |
Health Care Equipment & Services 5.7% |
23andMe Holding Co., Class A * | | |
Acadia Healthcare Co., Inc. * | | |
| | |
| | |
| | |
| | |
AirSculpt Technologies, Inc. *(a) | | |
| | |
Alignment Healthcare, Inc. * | | |
| | |
American Well Corp., Class A * | | |
AMN Healthcare Services, Inc. * | | |
| | |
Apollo Medical Holdings, Inc. * | | |
| | |
| | |
| | |
| | |
Aveanna Healthcare Holdings, Inc. * | | |
| | |
| | |
Bioventus, Inc., Class A *(a) | | |
Brookdale Senior Living, Inc. * | | |
Bullfrog AI Holdings, Inc. *(a) | | |
Butterfly Network, Inc. *(a) | | |
| | |
Castle Biosciences, Inc. * | | |
| | |
| | |
Clover Health Investments Corp. * | | |
Community Health Systems, Inc. * | | |
Computer Programs & Systems, Inc. * | | |
| | |
| | |
Definitive Healthcare Corp., Class A * | | |
| | |
Doximity, Inc., Class A * | | |
| | |
| | |
| | |
Evolent Health, Inc., Class A * | | |
| | |
| | |
| | |
Globus Medical, Inc., Class A * | | |
GoodRx Holdings, Inc., Class A * | | |
| | |
| | |
| | |
| | |
Hims & Hers Health, Inc. * | | |
| | |
| | |
| | |
| | |
Inspire Medical Systems, Inc. * | | |
| | |
Integra LifeSciences Holdings Corp. * | | |
| | |
iRhythm Technologies, Inc. * | | |
Lantheus Holdings, Inc. * | | |
| | |
LifeStance Health Group, Inc. * | | |
| | |
Merit Medical Systems, Inc. * | | |
| | |
118Schwab U.S. Equity ETFs | Annual Report
Schwab U.S. Small-Cap ETF
Portfolio Holdings as of August 31, 2023 (continued)
| | |
| | |
National HealthCare Corp. | | |
| | |
| | |
| | |
| | |
NextGen Healthcare, Inc. * | | |
| | |
OmniAb, Inc., Class A *(c) | | |
OmniAb, Inc., Class B *(c) | | |
| | |
| | |
Option Care Health, Inc. * | | |
OraSure Technologies, Inc. * | | |
Orchestra BioMed Holdings, Inc. *(a) | | |
| | |
| | |
| | |
| | |
| | |
| | |
Pediatrix Medical Group, Inc. * | | |
| | |
| | |
| | |
Privia Health Group, Inc. * | | |
PROCEPT BioRobotics Corp. * | | |
| | |
| | |
| | |
| | |
| | |
| | |
Select Medical Holdings Corp. | | |
Semler Scientific, Inc. * | | |
Senseonics Holdings, Inc. *(a) | | |
| | |
| | |
| | |
Silk Road Medical, Inc. * | | |
| | |
| | |
| | |
| | |
Tandem Diabetes Care, Inc. * | | |
| | |
| | |
| | |
The Pennant Group, Inc. * | | |
TransMedics Group, Inc. * | | |
Treace Medical Concepts, Inc. * | | |
US Physical Therapy, Inc. | | |
| | |
| | |
Vicarious Surgical, Inc. * | | |
| | |
| | |
|
Household & Personal Products 1.1% |
| | |
Central Garden & Pet Co. * | | |
Central Garden & Pet Co., Class A * | | |
| | |
Edgewell Personal Care Co. | | |
| | |
| | |
| | |
| | |
| | |
| | |
Nu Skin Enterprises, Inc., Class A | | |
Spectrum Brands Holdings, Inc. | | |
| | |
| | |
USANA Health Sciences, Inc. * | | |
| | |
| | |
| | |
|
|
Ambac Financial Group, Inc. * | | |
American Equity Investment Life Holding Co. | | |
| | |
Argo Group International Holdings Ltd. | | |
| | |
Axis Capital Holdings Ltd. | | |
Bright Health Group, Inc. * | | |
Brighthouse Financial, Inc. * | | |
BRP Group, Inc., Class A * | | |
CNO Financial Group, Inc. | | |
| | |
| | |
First American Financial Corp. | | |
Genworth Financial, Inc., Class A * | | |
Goosehead Insurance, Inc., Class A * | | |
Hagerty, Inc., Class A *(a) | | |
| | |
Horace Mann Educators Corp. | | |
James River Group Holdings Ltd. | | |
| | |
Kinsale Capital Group, Inc. | | |
| | |
| | |
| | |
National Western Life Group, Inc., Class A | | |
Oscar Health, Inc., Class A * | | |
| | |
| | |
| | |
| | |
Ryan Specialty Holdings, Inc., Class A * | | |
Safety Insurance Group, Inc. | | |
Selective Insurance Group, Inc. | | |
| | |
| | |
Skyward Specialty Insurance Group, Inc. * | | |
Stewart Information Services Corp. | | |
The Hanover Insurance Group, Inc. | | |
| | |
| | |
| | |
White Mountains Insurance Group Ltd. | | |
| | |
|
|
5E Advanced Materials, Inc. *(a) | | |
| | |
Schwab U.S. Equity ETFs | Annual Report119
Schwab U.S. Small-Cap ETF
Portfolio Holdings as of August 31, 2023 (continued)
| | |
Alpha Metallurgical Resources, Inc. | | |
| | |
| | |
| | |
| | |
| | |
| | |
Carpenter Technology Corp. | | |
| | |
| | |
| | |
| | |
| | |
Compass Minerals International, Inc. | | |
Danimer Scientific, Inc. *(a) | | |
| | |
| | |
| | |
Ginkgo Bioworks Holdings, Inc. *(a) | | |
Graphic Packaging Holding Co. | | |
| | |
| | |
| | |
| | |
| | |
| | |
| | |
| | |
| | |
| | |
| | |
| | |
| | |
| | |
| | |
| | |
Mercer International, Inc. | | |
Minerals Technologies, Inc. | | |
| | |
| | |
| | |
| | |
| | |
| | |
| | |
Perimeter Solutions S.A. * | | |
| | |
PureCycle Technologies, Inc. *(a) | | |
| | |
| | |
Schnitzer Steel Industries, Inc., Class A | | |
Sensient Technologies Corp. | | |
| | |
| | |
Summit Materials, Inc., Class A * | | |
| | |
| | |
| | |
The Scotts Miracle-Gro Co. | | |
| | |
| | |
| | |
| | |
| | |
United States Lime & Minerals, Inc. | | |
United States Steel Corp. | | |
| | |
| | |
| | |
Worthington Industries, Inc. | | |
| | |
|
Media & Entertainment 2.1% |
Advantage Solutions, Inc. * | | |
Altice USA, Inc., Class A * | | |
AMC Networks, Inc., Class A * | | |
| | |
Atlanta Braves Holdings, Inc., Class C * | | |
| | |
| | |
| | |
| | |
Cinemark Holdings, Inc. * | | |
Clear Channel Outdoor Holdings, Inc. * | | |
Endeavor Group Holdings, Inc., Class A * | | |
Eventbrite, Inc., Class A * | | |
| | |
| | |
| | |
| | |
iHeartMedia, Inc., Class A * | | |
Integral Ad Science Holding Corp. * | | |
John Wiley & Sons, Inc., Class A | | |
Lions Gate Entertainment Corp., Class A * | | |
| | |
Madison Square Garden Entertainment Corp. * | | |
Madison Square Garden Sports Corp. | | |
| | |
MediaAlpha, Inc., Class A * | | |
Nexstar Media Group, Inc., Class A | | |
Nextdoor Holdings, Inc. * | | |
| | |
| | |
| | |
| | |
| | |
| | |
| | |
Sphere Entertainment Co. * | | |
| | |
| | |
| | |
The E.W. Scripps Co., Class A * | | |
The New York Times Co., Class A | | |
| | |
| | |
Vivid Seats, Inc., Class A * | | |
Warner Music Group Corp., Class A | | |
| | |
World Wrestling Entertainment, Inc., Class A | | |
| | |
| | |
ZipRecruiter, Inc., Class A * | | |
| | |
|
120Schwab U.S. Equity ETFs | Annual Report
Schwab U.S. Small-Cap ETF
Portfolio Holdings as of August 31, 2023 (continued)
| | |
Pharmaceuticals, Biotechnology & Life Sciences 6.9% |
10X Genomics, Inc., Class A * | | |
| | |
4D Molecular Therapeutics, Inc. * | | |
| | |
ACADIA Pharmaceuticals, Inc. * | | |
| | |
Aclaris Therapeutics, Inc. * | | |
Acrivon Therapeutics, Inc. * | | |
Adaptive Biotechnologies Corp. * | | |
| | |
Agios Pharmaceuticals, Inc. * | | |
Akero Therapeutics, Inc. * | | |
Akoya Biosciences, Inc. * | | |
| | |
| | |
Allogene Therapeutics, Inc. * | | |
| | |
ALX Oncology Holdings, Inc. * | | |
Amicus Therapeutics, Inc. * | | |
Amneal Pharmaceuticals, Inc. * | | |
Amphastar Pharmaceuticals, Inc. * | | |
Amylyx Pharmaceuticals, Inc. * | | |
| | |
Anavex Life Sciences Corp. *(a) | | |
Anika Therapeutics, Inc. * | | |
Apellis Pharmaceuticals, Inc. * | | |
| | |
Arcturus Therapeutics Holdings, Inc. * | | |
Arcus Biosciences, Inc. * | | |
Arcutis Biotherapeutics, Inc. * | | |
Arrowhead Pharmaceuticals, Inc. * | | |
| | |
Atara Biotherapeutics, Inc. * | | |
Atea Pharmaceuticals, Inc. * | | |
| | |
Avidity Biosciences, Inc. * | | |
Axsome Therapeutics, Inc. * | | |
| | |
Beam Therapeutics, Inc. * | | |
BioCryst Pharmaceuticals, Inc. * | | |
BioLife Solutions, Inc. * | | |
Bionano Genomics, Inc. *(a) | | |
Bioxcel Therapeutics, Inc. *(a) | | |
Blueprint Medicines Corp. * | | |
| | |
| | |
Cara Therapeutics, Inc. * | | |
| | |
Caribou Biosciences, Inc. * | | |
Cassava Sciences, Inc. *(a) | | |
Catalyst Pharmaceuticals, Inc. * | | |
Celldex Therapeutics, Inc. * | | |
Century Therapeutics, Inc. * | | |
Cerevel Therapeutics Holdings, Inc. * | | |
| | |
Coherus Biosciences, Inc. * | | |
Collegium Pharmaceutical, Inc. * | | |
Corcept Therapeutics, Inc. * | | |
Crinetics Pharmaceuticals, Inc. * | | |
| | |
| | |
Cullinan Oncology, Inc. * | | |
Cytek Biosciences, Inc. * | | |
| | |
Day One Biopharmaceuticals, Inc. * | | |
Deciphera Pharmaceuticals, Inc. * | | |
| | |
Denali Therapeutics, Inc. * | | |
Design Therapeutics, Inc. * | | |
Dynavax Technologies Corp. * | | |
Dyne Therapeutics, Inc. * | | |
Eagle Pharmaceuticals, Inc. * | | |
Edgewise Therapeutics, Inc. * | | |
| | |
Emergent BioSolutions, Inc. * | | |
Enanta Pharmaceuticals, Inc. * | | |
Entrada Therapeutics, Inc. * | | |
| | |
| | |
| | |
Fate Therapeutics, Inc. * | | |
| | |
| | |
| | |
| | |
| | |
Halozyme Therapeutics, Inc. * | | |
Harmony Biosciences Holdings, Inc. * | | |
Heron Therapeutics, Inc. * | | |
| | |
| | |
| | |
| | |
| | |
| | |
| | |
| | |
Inovio Pharmaceuticals, Inc. * | | |
| | |
| | |
Intellia Therapeutics, Inc. * | | |
Intra-Cellular Therapies, Inc. * | | |
| | |
Ionis Pharmaceuticals, Inc. * | | |
Iovance Biotherapeutics, Inc. * | | |
Ironwood Pharmaceuticals, Inc. * | | |
iTeos Therapeutics, Inc. * | | |
Keros Therapeutics, Inc. * | | |
Kinnate Biopharma, Inc. * | | |
| | |
| | |
| | |
| | |
Kymera Therapeutics, Inc. * | | |
Lexicon Pharmaceuticals, Inc. * | | |
Ligand Pharmaceuticals, Inc. * | | |
Lyell Immunopharma, Inc. * | | |
| | |
Madrigal Pharmaceuticals, Inc. * | | |
| | |
Maravai LifeSciences Holdings, Inc., Class A * | | |
| | |
Mersana Therapeutics, Inc. * | | |
| | |
| | |
Mind Medicine MindMed, Inc. *(a) | | |
Mineralys Therapeutics, Inc. * | | |
Mirati Therapeutics, Inc. * | | |
Monte Rosa Therapeutics, Inc. *(a) | | |
| | |
| | |
NanoString Technologies, Inc. * | | |
| | |
| | |
Schwab U.S. Equity ETFs | Annual Report121
Schwab U.S. Small-Cap ETF
Portfolio Holdings as of August 31, 2023 (continued)
| | |
NGM Biopharmaceuticals, Inc. * | | |
| | |
| | |
Nurix Therapeutics, Inc. * | | |
| | |
Ocean Biomedical, Inc. *(a) | | |
| | |
| | |
| | |
Organogenesis Holdings, Inc. * | | |
Pacific Biosciences of California, Inc. * | | |
Pacira BioSciences, Inc. * | | |
| | |
Phathom Pharmaceuticals, Inc. *(a) | | |
| | |
Phibro Animal Health Corp., Class A | | |
Pliant Therapeutics, Inc. * | | |
PMV Pharmaceuticals, Inc. * | | |
Poseida Therapeutics, Inc. * | | |
| | |
Prelude Therapeutics, Inc. * | | |
Prestige Consumer Healthcare, Inc. * | | |
Prime Medicine, Inc. *(a) | | |
Protagonist Therapeutics, Inc. * | | |
| | |
| | |
| | |
RAPT Therapeutics, Inc. * | | |
Reata Pharmaceuticals, Inc., Class A * | | |
Recursion Pharmaceuticals, Inc., Class A * | | |
| | |
Relay Therapeutics, Inc. * | | |
| | |
Revance Therapeutics, Inc. * | | |
REVOLUTION Medicines, Inc. * | | |
Rhythm Pharmaceuticals, Inc. * | | |
Rocket Pharmaceuticals, Inc. * | | |
| | |
Sage Therapeutics, Inc. * | | |
Sana Biotechnology, Inc. * | | |
Sangamo Therapeutics, Inc. * | | |
Scholar Rock Holding Corp. * | | |
Scilex Holding Co. *(a)(c) | | |
| | |
Seres Therapeutics, Inc. * | | |
| | |
| | |
| | |
SpringWorks Therapeutics, Inc. * | | |
Stoke Therapeutics, Inc. * | | |
Supernus Pharmaceuticals, Inc. * | | |
Syndax Pharmaceuticals, Inc. * | | |
Tarsus Pharmaceuticals, Inc. * | | |
| | |
| | |
Theravance Biopharma, Inc. * | | |
Third Harmonic Bio, Inc. * | | |
Travere Therapeutics, Inc. * | | |
| | |
Tyra Biosciences, Inc. *(a) | | |
Ultragenyx Pharmaceutical, Inc. * | | |
| | |
Vanda Pharmaceuticals, Inc. * | | |
| | |
| | |
| | |
Ventyx Biosciences, Inc. * | | |
| | |
| | |
| | |
Verve Therapeutics, Inc. * | | |
Vir Biotechnology, Inc. * | | |
| | |
Y-mAbs Therapeutics, Inc. * | | |
Zentalis Pharmaceuticals, Inc. * | | |
| | |
| | |
|
Real Estate Management & Development 0.6% |
Anywhere Real Estate, Inc. * | | |
Appreciate Holdings, Inc. * | | |
| | |
Cushman & Wakefield plc * | | |
DigitalBridge Group, Inc. | | |
| | |
| | |
| | |
| | |
Howard Hughes Holdings, Inc. * | | |
Kennedy-Wilson Holdings, Inc. | | |
| | |
Newmark Group, Inc., Class A | | |
Offerpad Solutions, Inc. * | | |
Opendoor Technologies, Inc. *(a) | | |
RE/MAX Holdings, Inc., Class A | | |
| | |
Seritage Growth Properties, Class A * | | |
| | |
The RMR Group, Inc., Class A | | |
| | |
| | |
| | |
|
Semiconductors & Semiconductor Equipment 2.9% |
ACM Research, Inc., Class A * | | |
Allegro MicroSystems, Inc. * | | |
Alpha & Omega Semiconductor Ltd. * | | |
| | |
| | |
Ascent Solar Technologies, Inc. * | | |
Axcelis Technologies, Inc. * | | |
| | |
| | |
| | |
Credo Technology Group Holding Ltd. * | | |
| | |
| | |
| | |
| | |
Kulicke & Soffa Industries, Inc. | | |
Lattice Semiconductor Corp. * | | |
MACOM Technology Solutions Holdings, Inc. * | | |
| | |
| | |
Navitas Semiconductor Corp. * | | |
| | |
| | |
| | |
| | |
| | |
Rigetti Computing, Inc. *(a) | | |
| | |
122Schwab U.S. Equity ETFs | Annual Report
Schwab U.S. Small-Cap ETF
Portfolio Holdings as of August 31, 2023 (continued)
| | |
Silicon Laboratories, Inc. * | | |
| | |
SkyWater Technology, Inc. *(a) | | |
SMART Global Holdings, Inc. * | | |
| | |
Ultra Clean Holdings, Inc. * | | |
Veeco Instruments, Inc. * | | |
| | |
|
|
| | |
| | |
| | |
| | |
| | |
Alarm.com Holdings, Inc. * | | |
Alkami Technology, Inc. * | | |
Altair Engineering, Inc., Class A * | | |
| | |
Amplitude, Inc., Class A * | | |
Appfolio, Inc., Class A * | | |
| | |
| | |
Aurora Innovation, Inc. * | | |
| | |
BigCommerce Holdings, Inc. * | | |
| | |
| | |
Blend Labs, Inc., Class A *(a) | | |
| | |
| | |
C3.ai, Inc., Class A *(a) | | |
CCC Intelligent Solutions Holdings, Inc. * | | |
| | |
| | |
Clear Secure, Inc., Class A | | |
Clearwater Analytics Holdings, Inc., Class A * | | |
CommVault Systems, Inc. * | | |
Confluent, Inc., Class A * | | |
Consensus Cloud Solutions, Inc. * | | |
| | |
| | |
| | |
| | |
DigitalOcean Holdings, Inc. * | | |
Dolby Laboratories, Inc., Class A | | |
| | |
DoubleVerify Holdings, Inc. * | | |
| | |
D-Wave Quantum, Inc. *(a) | | |
E2open Parent Holdings, Inc. * | | |
| | |
Enfusion, Inc., Class A * | | |
| | |
| | |
| | |
| | |
Expensify, Inc., Class A * | | |
| | |
Freshworks, Inc., Class A * | | |
| | |
Grid Dynamics Holdings, Inc. * | | |
HashiCorp, Inc., Class A * | | |
Informatica, Inc., Class A * | | |
Instructure Holdings, Inc. * | | |
| | |
| | |
| | |
| | |
| | |
| | |
| | |
LiveRamp Holdings, Inc. * | | |
Marathon Digital Holdings, Inc. *(a) | | |
| | |
| | |
| | |
MicroStrategy, Inc., Class A * | | |
| | |
| | |
| | |
| | |
Near Intelligence, Inc. *(a) | | |
| | |
| | |
| | |
| | |
| | |
| | |
| | |
| | |
| | |
PowerSchool Holdings, Inc., Class A * | | |
Procore Technologies, Inc. * | | |
| | |
| | |
| | |
| | |
Rackspace Technology, Inc. * | | |
| | |
RingCentral, Inc., Class A * | | |
| | |
Rubicon Technologies, Inc. * | | |
| | |
SentinelOne, Inc., Class A * | | |
Smartsheet, Inc., Class A * | | |
| | |
SoundHound AI, Inc., Class A *(a) | | |
Sprinklr, Inc., Class A * | | |
Sprout Social, Inc., Class A * | | |
| | |
Squarespace, Inc., Class A * | | |
| | |
| | |
| | |
Thoughtworks Holding, Inc. * | | |
Tucows, Inc., Class A *(a) | | |
| | |
| | |
| | |
| | |
| | |
| | |
| | |
Zeta Global Holdings Corp., Class A * | | |
| | |
| | |
|
Technology Hardware & Equipment 4.2% |
| | |
| | |
Advanced Energy Industries, Inc. | | |
Aeva Technologies, Inc. * | | |
Schwab U.S. Equity ETFs | Annual Report123
Schwab U.S. Small-Cap ETF
Portfolio Holdings as of August 31, 2023 (continued)
| | |
| | |
| | |
| | |
| | |
| | |
Benchmark Electronics, Inc. | | |
| | |
| | |
| | |
| | |
CommScope Holding Co., Inc. * | | |
Comtech Telecommunications Corp. | | |
| | |
| | |
| | |
Digi International, Inc. * | | |
| | |
Evolv Technologies Holdings, Inc. * | | |
| | |
| | |
FARO Technologies, Inc. * | | |
| | |
| | |
| | |
Insight Enterprises, Inc. * | | |
| | |
| | |
| | |
Kimball Electronics, Inc. * | | |
| | |
Lightwave Logic, Inc. *(a) | | |
| | |
Lumentum Holdings, Inc. * | | |
Methode Electronics, Inc. | | |
| | |
Mirion Technologies, Inc. * | | |
| | |
Napco Security Technologies, Inc. | | |
National Instruments Corp. | | |
| | |
| | |
| | |
| | |
| | |
| | |
| | |
| | |
| | |
Presto Automation, Inc. * | | |
Ribbon Communications, Inc. * | | |
| | |
| | |
| | |
| | |
Super Micro Computer, Inc. * | | |
| | |
| | |
| | |
Vishay Intertechnology, Inc. | | |
| | |
| | |
| | |
|
Telecommunication Services 0.7% |
| | |
| | |
Bandwidth, Inc., Class A * | | |
| | |
Charge Enterprises, Inc. * | | |
Cogent Communications Holdings, Inc. | | |
Consolidated Communications Holdings, Inc. * | | |
EchoStar Corp., Class A * | | |
Frontier Communications Parent, Inc. * | | |
| | |
| | |
| | |
Iridium Communications, Inc. | | |
Liberty Latin America Ltd., Class A * | | |
Liberty Latin America Ltd., Class C * | | |
Radius Global Infrastructure, Inc., Class A * | | |
Shenandoah Telecommunications Co. | | |
Telephone and Data Systems, Inc. | | |
United States Cellular Corp. * | | |
| | |
|
|
Air Transport Services Group, Inc. * | | |
| | |
| | |
| | |
| | |
Frontier Group Holdings, Inc. * | | |
| | |
| | |
Hawaiian Holdings, Inc. * | | |
| | |
Hub Group, Inc., Class A * | | |
| | |
| | |
| | |
| | |
| | |
| | |
| | |
| | |
Schneider National, Inc., Class B | | |
| | |
| | |
Sun Country Airlines Holdings, Inc. * | | |
TuSimple Holdings, Inc., Class A * | | |
Universal Logistics Holdings, Inc. | | |
| | |
Wheels Up Experience, Inc. *(a) | | |
| | |
|
|
| | |
| | |
American States Water Co. | | |
| | |
| | |
California Water Service Group | | |
Chesapeake Utilities Corp. | | |
Clearway Energy, Inc., Class C | | |
Hawaiian Electric Industries, Inc. (a) | | |
| | |
| | |
| | |
Montauk Renewables, Inc. * | | |
| | |
124Schwab U.S. Equity ETFs | Annual Report
Schwab U.S. Small-Cap ETF
Portfolio Holdings as of August 31, 2023 (continued)
| | |
New Jersey Resources Corp. | | |
Northwest Natural Holding Co. | | |
| | |
| | |
| | |
| | |
| | |
Portland General Electric Co. | | |
| | |
Southwest Gas Holdings, Inc. | | |
| | |
Sunnova Energy International, Inc. *(a) | | |
| | |
| | |
| | |
Total Common Stocks
(Cost $14,008,379,495) | |
| | |
SHORT-TERM INVESTMENTS 1.2% OF NET ASSETS |
|
|
State Street Institutional U.S. Government Money Market Fund, Premier Class 5.28% (d) | | |
State Street Institutional U.S. Government Money Market Fund, Premier Class 5.28% (d)(e) | | |
| | |
Total Short-Term Investments
(Cost $179,517,156) | |
Total Investments in Securities
(Cost $14,187,896,651) | |
| | | CURRENT VALUE/
UNREALIZED
APPRECIATION
($) |
|
| | | |
Russell 2000 Index, e-mini, expires 09/15/23 | | | |
| Non-income producing security. |
| All or a portion of this security is on loan. Securities on loan were valued at $159,482,809. |
| On October 15, 2023, the issuer filed for bankruptcy. |
| Fair valued using significant unobservable inputs (see financial note 2(a), Securities for which no quoted value is available, for additional information). |
| The rate shown is the annualized 7-day yield. |
| Security purchased with cash collateral received for securities on loan. |
| Real Estate Investment Trust |
The following is a summary of the inputs used to value the fund’s investments as of August 31, 2023 (see financial note 2(a) for additional information):
| QUOTED PRICES IN
ACTIVE MARKETS FOR
IDENTICAL ASSETS
(LEVEL 1) | OTHER SIGNIFICANT
OBSERVABLE INPUTS
(LEVEL 2) | SIGNIFICANT
UNOBSERVABLE INPUTS
(LEVEL 3) | |
| | | | |
| | | | |
| | | | |
Health Care Equipment & Services | | | | |
Pharmaceuticals, Biotechnology & Life Sciences | | | | |
| | | | |
| | | | |
| | | | |
| Level 3 amount shown includes securities determined to have no value at August 31, 2023. |
| As categorized in the Portfolio Holdings. |
| Futures contracts are reported at cumulative unrealized appreciation or depreciation. |
Fund investments in mutual funds are classified as Level 1, without consideration to the classification level of the underlying
securities held by the mutual funds, which could be Level 1, Level 2 or Level 3.
Schwab U.S. Equity ETFs | Annual Report125
Schwab U.S. Small-Cap ETF
Statement of Assets and Liabilities
As of August 31, 2023
|
Investments in securities, at value - unaffiliated (cost $14,187,896,651) including securities on loan of $159,482,809 | | |
| | |
Deposit with broker for futures contracts | | |
| | |
| | |
| | |
Income from securities on loan | | |
| | |
|
|
Collateral held for securities on loan | | |
| | |
| | |
| | |
Variation margin on futures contracts | | |
| | |
| | |
|
|
Capital received from investors | | |
| | |
| | |
126Schwab U.S. Equity ETFs | Annual Report
Schwab U.S. Small-Cap ETF
Statement of Operations
For the period September 1, 2022 through August 31, 2023 |
|
Dividends received from securities - unaffiliated (net of foreign withholding tax of $129,870) | | |
| | |
| | |
|
|
| | |
| | |
| | |
| | |
|
REALIZED AND UNREALIZED GAINS (LOSSES) |
Net realized losses on sales of securities - unaffiliated | | |
Net realized gains on sales of in-kind redemptions - unaffiliated | | |
Net realized losses on futures contracts | | |
| | |
Net change in unrealized appreciation (depreciation) on securities - unaffiliated | | |
Net change in unrealized appreciation (depreciation) on futures contracts | | |
Net change in unrealized appreciation (depreciation) | | |
Net realized and unrealized gains | | |
Increase in net assets resulting from operations | | |
| Proxy fees are non-routine expenses (see financial note 2(e) for additional information). |
Schwab U.S. Equity ETFs | Annual Report127
Schwab U.S. Small-Cap ETF
Statement of Changes in Net Assets
For the current and prior report periods
|
| | |
| | | |
| | | |
Net change in unrealized appreciation (depreciation) | | | |
Increase (decrease) in net assets resulting from operations | | | |
|
DISTRIBUTIONS TO SHAREHOLDERS |
| | | |
TRANSACTIONS IN FUND SHARES1 |
| | |
| | | | | |
| | | | | |
| | | | | |
Net transactions in fund shares | | | | | |
|
SHARES OUTSTANDING AND NET ASSETS1 |
| | |
| | | | | |
| | | | | |
Total increase (decrease) | | | | | |
| | | | | |
| For the period ended August 31, 2022, transactions in fund shares have been retroactively adjusted to reflect a 2-for-1 share split effective after market close on March 10, 2022. The retroactive adjustment of the share split does not change the transaction in fund share values (see financial note 12 for additional information). |
128Schwab U.S. Equity ETFs | Annual Report
Schwab U.S. Dividend Equity ETF
Financial Statements
| | | | | | |
|
Net asset value at beginning of period | | | | | | |
Income (loss) from investment operations: | | | | | | |
Net investment income (loss)1 | | | | | | |
Net realized and unrealized gains (losses) | | | | | | |
Total from investment operations | | | | | | |
| | | | | | |
Distributions from net investment income | | | | | | |
Net asset value at end of period | | | | | | |
| | | | | | |
|
Ratios to average net assets: | | | | | | |
| | | | | | |
Net investment income (loss) | | | | | | |
| | | | | | |
Net assets, end of period (x 1,000,000) | | | | | | |
| Calculated based on the average shares outstanding during the period. |
| Ratio includes less than 0.005% of non-routine proxy expenses. |
| Effective March 11, 2019, the annual operating expense ratio was reduced. The ratio presented for the period ended August 31, 2019 is a blended ratio. |
| Portfolio turnover rate excludes securities received or delivered from processing of in-kind creations or redemptions. |
Schwab U.S. Equity ETFs | Annual Report129
Schwab U.S. Dividend Equity ETF
Portfolio Holdings as of August 31, 2023
This section shows all the securities in the fund’s portfolio and their values as of the report date.
The fund files its complete schedule of portfolio holdings with the U.S. Securities and Exchange Commission (SEC) for the first and third quarters of each fiscal year on Form N-PORT Part F. The fund’s Form N-PORT Part F is available on the SEC’s website at www.sec.gov. You can also obtain this information at no cost on the fund’s website at www.schwabassetmanagement.com/schwabetfs_prospectus, by calling 1-866-414-6349, or by sending an email request to orders@mysummaryprospectus.com. The fund also makes available its complete schedule of portfolio holdings on a daily basis on the fund’s website.
| | |
COMMON STOCKS 99.7% OF NET ASSETS |
|
Automobiles & Components 1.5% |
| | |
|
|
| | |
| | |
| | |
| | |
| | |
Central Pacific Financial Corp. | | |
| | |
| | |
| | |
| | |
First Commonwealth Financial Corp. | | |
| | |
| | |
Huntington Bancshares, Inc. | | |
International Bancshares Corp. | | |
| | |
| | |
Northwest Bancshares, Inc. | | |
| | |
| | |
| | |
| | |
| | |
| | |
| | |
| | |
|
|
| | |
| | |
Illinois Tool Works, Inc. | | |
| | |
MSC Industrial Direct Co., Inc., Class A | | |
| | |
| | |
| | |
|
Commercial & Professional Services 4.9% |
Automatic Data Processing, Inc. | | |
| | |
| | |
| | |
Robert Half International, Inc. | | |
| | |
|
| | |
Consumer Discretionary Distribution & Retail 5.2% |
| | |
| | |
| | |
| | |
| | |
| | |
| | |
|
Consumer Durables & Apparel 0.6% |
| | |
Ethan Allen Interiors, Inc. | | |
| | |
| | |
| | |
| | |
| | |
|
|
Cracker Barrel Old Country Store, Inc. | | |
| | |
| | |
| | |
| | |
|
|
| | |
| | |
| | |
| | |
| | |
| | |
|
|
Artisan Partners Asset Management, Inc., Class A | | |
| | |
| | |
| | |
Federal Agricultural Mortgage Corp., Class C | | |
Janus Henderson Group plc | | |
| | |
| | |
| | |
T. Rowe Price Group, Inc. | | |
| | |
| | |
|
130Schwab U.S. Equity ETFs | Annual Report
Schwab U.S. Dividend Equity ETF
Portfolio Holdings as of August 31, 2023 (continued)
| | |
Food, Beverage & Tobacco 11.1% |
| | |
| | |
| | |
| | |
Tyson Foods, Inc., Class A | | |
| | |
|
Household & Personal Products 1.4% |
| | |
|
|
Fidelity National Financial, Inc. | | |
First American Financial Corp. | | |
Stewart Information Services Corp. | | |
| | |
| | |
| | |
|
|
| | |
| | |
| | |
LyondellBasell Industries N.V., Class A | | |
| | |
Packaging Corp. of America | | |
| | |
|
Media & Entertainment 0.6% |
Paramount Global, Class B | | |
The Interpublic Group of Cos., Inc. | | |
| | |
|
Pharmaceuticals, Biotechnology & Life Sciences 15.8% |
| | |
| | |
| | |
| | |
| | |
|
Semiconductors & Semiconductor Equipment 8.2% |
| | |
| | |
| | |
|
Technology Hardware & Equipment 4.4% |
| | |
|
| | |
Telecommunication Services 3.8% |
Verizon Communications, Inc. | | |
|
|
United Parcel Service, Inc., Class B | | |
|
|
Clearway Energy, Inc., Class A | | |
| | |
| | |
Total Common Stocks
(Cost $46,883,235,136) | |
| | |
SHORT-TERM INVESTMENTS 0.2% OF NET ASSETS |
|
|
State Street Institutional U.S. Government Money Market Fund, Premier Class 5.28% (b) | | |
State Street Institutional U.S. Government Money Market Fund, Premier Class 5.28% (b)(c) | | |
| | |
Total Short-Term Investments
(Cost $78,758,660) | |
Total Investments in Securities
(Cost $46,961,993,796) | |
| | | CURRENT VALUE/
UNREALIZED
DEPRECIATION
($) |
|
| | | |
DJIA CBOT, e-mini, expires 09/15/23 | | | |
S&P 400 Mid-Cap Index, e-mini, expires 09/15/23 | | | |
| | | |
| All or a portion of this security is on loan. Securities on loan were valued at $28,611,176. |
| The rate shown is the annualized 7-day yield. |
| Security purchased with cash collateral received for securities on loan. |
Schwab U.S. Equity ETFs | Annual Report131
Schwab U.S. Dividend Equity ETF
Portfolio Holdings as of August 31, 2023 (continued)
The following is a summary of the inputs used to value the fund’s investments as of August 31, 2023 (see financial note 2(a) for additional information):
| QUOTED PRICES IN
ACTIVE MARKETS FOR
IDENTICAL ASSETS
(LEVEL 1) | OTHER SIGNIFICANT
OBSERVABLE INPUTS
(LEVEL 2) | SIGNIFICANT
UNOBSERVABLE INPUTS
(LEVEL 3) | |
| | | | |
| | | | |
| | | | |
| | | | |
| | | | |
| | | | |
| As categorized in the Portfolio Holdings. |
| Futures contracts are reported at cumulative unrealized appreciation or depreciation. |
Fund investments in mutual funds are classified as Level 1, without consideration to the classification level of the underlying
securities held by the mutual funds, which could be Level 1, Level 2 or Level 3.
132Schwab U.S. Equity ETFs | Annual Report
Schwab U.S. Dividend Equity ETF
Statement of Assets and Liabilities
As of August 31, 2023
|
Investments in securities, at value - unaffiliated (cost $46,961,993,796) including securities on loan of $28,611,176 | | |
Deposit with broker for futures contracts | | |
| | |
| | |
| | |
Income from securities on loan | | |
| | |
|
|
Collateral held for securities on loan | | |
| | |
| | |
| | |
Variation margin on futures contracts | | |
| | |
| | |
|
|
Capital received from investors | | |
Total distributable earnings | | |
| | |
Schwab U.S. Equity ETFs | Annual Report133
Schwab U.S. Dividend Equity ETF
Statement of Operations
For the period September 1, 2022 through August 31, 2023 |
|
Dividends received from securities - unaffiliated (net of foreign withholding tax of $31,308) | | |
| | |
| | |
|
|
| | |
| | |
| | |
| | |
|
REALIZED AND UNREALIZED GAINS (LOSSES) |
Net realized losses on sales of securities - unaffiliated | | |
Net realized gains on sales of in-kind redemptions - unaffiliated | | |
Net realized losses on futures contracts | | |
| | |
Net change in unrealized appreciation (depreciation) on securities - unaffiliated | | |
Net change in unrealized appreciation (depreciation) on futures contracts | | |
Net change in unrealized appreciation (depreciation) | | |
Net realized and unrealized gains | | |
Increase in net assets resulting from operations | | |
| Proxy fees are non-routine expenses (see financial note 2(e) for additional information). |
134Schwab U.S. Equity ETFs | Annual Report
Schwab U.S. Dividend Equity ETF
Statement of Changes in Net Assets
For the current and prior report periods
|
| | |
| | | |
Net realized gains (losses) | | | |
Net change in unrealized appreciation (depreciation) | | | |
Increase (decrease) in net assets resulting from operations | | | |
|
DISTRIBUTIONS TO SHAREHOLDERS |
| | | |
TRANSACTIONS IN FUND SHARES |
| | |
| | | | | |
| | | | | |
| | | | | |
Net transactions in fund shares | | | | | |
|
SHARES OUTSTANDING AND NET ASSETS |
| | |
| | | | | |
| | | | | |
| | | | | |
| | | | | |
Schwab U.S. Equity ETFs | Annual Report135
1. Business Structure of the Funds:
Each of the funds in this report is a series of Schwab Strategic Trust (the trust), a no-load, open-end management investment company. The trust is organized as a Delaware statutory trust and is registered under the Investment Company Act of 1940, as amended (the 1940 Act). The list below shows all the operational funds in the trust as of the end of the period, including the funds discussed in this report, which are highlighted:
SCHWAB STRATEGIC TRUST (ORGANIZED JANUARY 27, 2009) |
Schwab U.S. Broad Market ETF | Schwab Short-Term U.S. Treasury ETF |
| Schwab Intermediate-Term U.S. Treasury ETF |
Schwab U.S. Large-Cap ETF | Schwab Long-Term U.S. Treasury ETF |
Schwab U.S. Large-Cap Growth ETF | Schwab U.S. Aggregate Bond ETF |
Schwab U.S. Large-Cap Value ETF | Schwab 1-5 Year Corporate Bond ETF |
| Schwab 5-10 Year Corporate Bond ETF |
Schwab U.S. Small-Cap ETF | Schwab Fundamental U.S. Broad Market Index ETF |
Schwab U.S. Dividend Equity ETF | Schwab Fundamental U.S. Large Company Index ETF |
| Schwab Fundamental U.S. Small Company Index ETF |
Schwab International Dividend Equity ETF | Schwab Fundamental International Large Company Index ETF |
Schwab International Equity ETF | Schwab Fundamental International Small Company Index ETF |
Schwab International Small-Cap Equity ETF | Schwab Fundamental Emerging Markets Large Company Index ETF |
Schwab Emerging Markets Equity ETF | |
| Schwab Crypto Thematic ETF |
Schwab Municipal Bond ETF | Schwab High Yield Bond ETF |
The funds issue and redeem shares at their net asset value per share (NAV) only in large blocks of shares (Creation Units). These transactions are usually in exchange for a basket of securities and/or an amount of cash. As a practical matter, only institutional investors who have entered into an authorized participant agreement purchase or redeem Creation Units. Except when aggregated in Creation Units, shares of the funds are not redeemable securities.
Individual shares of the funds trade on national securities exchanges and elsewhere during the trading day and can only be bought and sold at market prices throughout the trading day through a broker-dealer. Because fund shares trade at market prices rather than NAV, shares may trade at a price greater than NAV (premium) or less than NAV (discount). A chart showing the frequency at which each fund’s daily closing market price was at a discount or premium to each fund’s NAV can be found at www.schwabassetmanagement.com.
Each fund maintains its own account for purposes of holding assets and accounting, and is considered a separate entity for tax purposes. Within its account, each fund may also keep certain assets in segregated accounts, as required by securities law. The "Fund Complex" includes The Charles Schwab Family of Funds, Schwab Capital Trust, Schwab Investments, Schwab Annuity Portfolios, Schwab Strategic Trust and Laudus Trust.
2. Significant Accounting Policies:The following is a summary of the significant accounting policies the funds use in their preparation of financial statements. The funds follow the investment company accounting and reporting guidance of the Financial Accounting Standards Board (FASB) Accounting Standard Codification Topic 946 Financial Services — Investment Companies. The accounting policies are in conformity with accounting principles generally accepted in the United States of America (GAAP).
The funds may invest in certain mutual funds and exchange-traded funds (ETFs) which are referred to as “underlying funds”. For more information about the underlying funds’ operations and policies, please refer to those funds’ semiannual and annual reports, which are filed with the U.S. Securities and Exchange Commission (SEC) and available on the SEC’s website at www.sec.gov.
(a) Security Valuation:
Pursuant to Rule 2a-5 under the 1940 Act, the Board of Trustees (the Board) has designated authority to a Valuation Designee, the funds’ investment adviser, to make fair valuation determinations under adopted procedures, subject to Board oversight. The investment adviser has formed a Pricing Committee to administer the pricing and valuation of portfolio securities and other assets and liabilities as well as to ensure that prices used for internal purposes or provided by third parties reasonably reflect fair value. The Valuation Designee may utilize independent pricing services, quotations from securities and financial instrument dealers and other market sources to determine fair value.
136Schwab U.S. Equity ETFs | Annual Report
Financial Notes (continued)
2. Significant Accounting Policies (continued):
Securities held in the funds’ portfolio are valued every business day. The following valuation policies and procedures are used by the Valuation Designee to value various types of securities:
• Securities traded on an exchange or over-the-counter: Traded securities are valued at the closing value for the day, or, on days when no closing value has been reported, at the mean of the most recent bid and ask quotes. Securities that are primarily traded on foreign exchanges are valued at the official closing price or the last sales price on the exchange where the securities are principally traded with these values then translated into U.S. dollars at the current exchange rate, unless these securities are fair valued as discussed below.
• Futures contracts: Futures contracts are valued at their settlement prices as of the close of their exchanges.
• Mutual funds: Mutual funds are valued at their respective NAVs.
• Securities for which no quoted value is available: The Valuation Designee has adopted procedures to fair value a fund’s securities when market prices are not “readily available” or are unreliable. For example, a security may be fair valued when it’s de-listed or its trading is halted or suspended; when a security’s primary pricing source is unable or unwilling to provide a price; or when a security’s primary trading market is closed during regular market hours. Fair value determinations are made in good faith in accordance with adopted valuation procedures. The Valuation Designee considers a number of factors, including unobservable market inputs, when arriving at fair value. The Valuation Designee may employ methods such as the review of related or comparable assets or liabilities, related market activities, recent transactions, market multiples, book values, transactional back-testing, disposition analysis and other relevant information. Due to the subjective and variable nature of fair value pricing, there can be no assurance that a fund could obtain the fair value assigned to the security upon the sale of such security.
In accordance with the authoritative guidance on fair value measurements and disclosures under GAAP, the funds disclose the fair value of their investments in a hierarchy that prioritizes the significant inputs to valuation methods used to measure the fair value. The hierarchy gives the highest priority to valuations based upon unadjusted quoted prices in active markets for identical assets or liabilities (Level 1 measurements) and the lowest priority to valuations based upon unobservable inputs that are significant to the valuation (Level 3 measurements). If inputs used to measure the financial instruments fall within different levels of the hierarchy, the categorization is based on the lowest level input that is significant to the valuation. If it is determined that either the volume and/or level of activity for an asset or liability has significantly decreased (from normal conditions for that asset or liability) or price quotations or observable inputs are not associated with orderly transactions, increased analysis and the Valuation Designee’s judgment will be required to estimate fair value.
The three levels of the fair value hierarchy are as follows:
• Level 1 — quoted prices in active markets for identical investments — Investments whose values are based on quoted market prices in active markets. These generally include active listed equities, mutual funds, ETFs and futures contracts. Mutual funds and ETFs are classified as Level 1 prices, without consideration to the classification level of the underlying securities held.
• Level 2 — other significant observable inputs (including quoted prices for similar securities, interest rates, prepayment speeds, credit risk, etc.) — Investments that trade in markets that are not considered to be active, but whose values are based on quoted market prices, dealer quotations or valuations provided by alternative pricing sources supported by observable inputs are classified as Level 2 prices. These generally include U.S. government and sovereign obligations, most government agency securities, investment-grade corporate bonds, certain mortgage products, less liquid listed equities, and state, municipal and provincial obligations.
• Level 3 — significant unobservable inputs (including the Valuation Designee’s assumptions in determining the fair value of investments) — Investments whose values are classified as Level 3 prices have significant unobservable inputs, as they may trade infrequently or not at all. When observable prices are not readily available for these securities, one or more valuation methods are used for which sufficient and reliable data is available. The inputs used in estimating the value of Level 3 prices may include the original transaction price, quoted prices for similar securities or assets in active markets, completed or pending third-party transactions in the underlying investment or comparable issuers, and changes in financial ratios or cash flows. Level 3 prices may also be adjusted to reflect illiquidity and/or non-transferability, with the amount of such discount estimated in the absence of market information. Assumptions used due to the lack of observable inputs may significantly impact the resulting fair value and therefore a fund’s results of operations.
The inputs or methodology used for valuing securities are not necessarily an indication of the risk associated with investing in those securities.
Schwab U.S. Equity ETFs | Annual Report137
Financial Notes (continued)
2. Significant Accounting Policies (continued):
The levels associated with valuing the funds’ investments as of August 31, 2023, are disclosed in each fund’s Portfolio Holdings.
(b) Accounting Policies for certain Portfolio Investments (if held):
Futures Contracts: Futures contracts are instruments that represent an agreement between two parties that obligates one party to buy, and the other party to sell, specific instruments at an agreed upon price on a stipulated future date. A fund must give the broker a deposit of cash and/or securities (initial margin) whenever it enters into a futures contract. The amount of the deposit may vary from one contract to another. Subsequent payments (variation margin) are made or received by a fund depending on the daily fluctuations in the value of the futures contract and are accounted for as unrealized appreciation or depreciation until the contract is closed, at which time the gains or losses are realized. Futures contracts are traded publicly on exchanges, and their value may change daily.
Securities Lending: Under the trust’s Securities Lending Program, a fund (lender) may make short-term loans of its securities to another party (borrower) to generate additional revenue for the fund. The borrower pledges collateral in the form of cash, securities issued or fully guaranteed by the U.S. government or foreign governments, or letters of credit issued by a bank. Collateral at the individual loan level is required to be maintained on a daily marked-to-market basis in an amount at least equal to the current value of the securities loaned. The lending agent provides a fund with indemnification against borrower default (the borrower fails to return the security on loan) reducing the risk of loss as a result of default. The cash collateral of securities loaned is currently invested in money market portfolios operating pursuant to Rule 2a-7 under the 1940 Act. Each fund bears the risk of loss with respect to the investment of cash collateral. The terms of the securities lending agreement allow the funds or the lending agent to terminate any loan at any given time and the securities must be returned within the earlier of the standard trade settlement period or the specified time period under the relevant securities lending agreement. Securities lending income, as disclosed in each fund’s Statement of Operations, if applicable, represents the income earned from the investment of the cash collateral plus any fees paid by borrowers, less the fees paid to the lending agent and broker rebates which are subject to adjustments pursuant to the securities lending agreement. On loans not collateralized by cash, a fee is received from the borrower, and is allocated between a fund and the lending agent. The aggregate fair value of securities loaned will not at any time exceed one-third of the total assets of a fund, including collateral received from the loan. Securities lending fees paid to the unaffiliated lending agent start at 9% of gross lending revenue, with subsequent breakpoints to a low of 5%. In this context, the gross lending revenue equals the income received from the investment of cash collateral and fees paid by borrowers less any rebates paid to the borrowers. Any expenses charged by the cash collateral fund are in addition to these fees. All remaining revenue is retained by the fund, as applicable. No portion of lending revenue is paid to or retained by the investment adviser or any of its affiliates.
As of August 31, 2023, Schwab U.S. Broad Market ETF, Schwab 1000 Index ETF, Schwab U.S. Large-Cap ETF, Schwab U.S. Large-Cap Growth ETF, Schwab U.S. Large-Cap Value ETF, Schwab U.S. Mid-Cap ETF, Schwab U.S. Small-Cap ETF and Schwab U.S. Dividend Equity ETF had securities on loan, all of which were classified as common stocks. The value of the securities on loan and the related collateral as of August 31, 2023 are disclosed in each fund’s Portfolio Holdings and Statement of Assets and Liabilities.
(c) Security Transactions:
Security transactions are recorded as of the date the order to buy or sell the security is executed. Realized gains and losses from security transactions are based on the identified costs of the securities involved.
When a fund closes out a futures contract position, it calculates the difference between the value of the position at the beginning and at the end of the contract, and records a realized gain or loss accordingly.
(d) Investment Income:
Interest income is recorded as it accrues. Dividends, in the form of cash or non-cash income such as in the form of additional securities, and distributions from portfolio securities and underlying funds are recorded on the date they are effective (the ex-dividend date), although the funds record certain foreign security dividends on the date the ex-dividend date is confirmed. Any distributions from underlying funds are recorded in accordance with the character of the distributions as designated by the underlying funds.
138Schwab U.S. Equity ETFs | Annual Report
Financial Notes (continued)
2. Significant Accounting Policies (continued):
(e) Expenses:
Pursuant to the Amended and Restated Advisory Agreement (Advisory Agreement) between the investment adviser and the trust, the investment adviser will pay the operating expenses of each fund, excluding taxes, any brokerage expenses, and extraordinary or non-routine expenses. Taxes, any brokerage expenses and extraordinary or non-routine expenses that are specific to a fund are charged directly to the fund. The Advisory Agreement excludes paying acquired fund fees and expenses, which are indirect expenses incurred by a fund through its investments in underlying funds.
(f) Distributions to Shareholders:
The funds make distributions from net investment income, if any, quarterly and from net realized capital gains, if any, once a year. To receive a distribution, you must be a registered shareholder on the record date. Distributions are paid to shareholders on the payable date.
(g) Accounting Estimates:
The accounting policies described in this report conform to GAAP. Notwithstanding this, shareholders should understand that in order to follow these principles, fund management has to make estimates and assumptions that affect the information reported in the financial statements. It’s possible that once the results are known, they may turn out to be different from these estimates and these differences may be material.
(h) Federal Income Taxes:
The funds intend to meet federal income and excise tax requirements for regulated investment companies under subchapter M of the Internal Revenue Code, as amended. Accordingly, the funds distribute substantially all of their net investment income and net realized capital gains, if any, to their respective shareholders each year. As long as a fund meets the tax requirements, it is not required to pay federal income tax.
(i) Indemnification:
Under the funds’ organizational documents, the officers and trustees are indemnified against certain liabilities arising out of the performance of their duties to the funds. In addition, in the normal course of business the funds enter into contracts with their vendors and others that provide general indemnifications. The funds’ maximum exposure under these arrangements is unknown as this would involve future claims that may be made against the funds. However, based on experience, the funds expect the risk of loss attributable to these arrangements to be remote.
(j) Regulatory Update:
Effective January 24, 2023, the SEC adopted rule and form amendments to require mutual funds and ETFs to transmit concise and visually engaging streamlined annual and semiannual reports to shareholders that highlight key information deemed important for retail investors to assess and monitor their fund investments. Other information, including financial statements, will no longer appear in a streamlined shareholder report but must be available online, delivered free of charge upon request, and filed on a semiannual basis on Form N-CSR. The rule and form amendments have a compliance date of July 24, 2024. At this time, management is evaluating the impact of these rule and form amendment changes on the content of the current shareholder report and the newly created annual and semiannual streamlined shareholder reports.
3. Risk Factors:Investing in the funds may involve certain risks, as discussed in the funds’ prospectus, including, but not limited to, those described below. Any of these risks could cause an investor to lose money.
Market Risk. Financial markets rise and fall in response to a variety of factors, sometimes rapidly and unpredictably. Markets may be impacted by economic, political, regulatory and other conditions, including economic sanctions and other government actions. In addition, the occurrence of global events, such as war, terrorism, environmental disasters, natural disasters and epidemics, may also negatively affect the financial markets. As with any investment whose performance is tied to these markets, the value of an investment in a fund will fluctuate, which means that an investor could lose money over short or long periods.
Schwab U.S. Equity ETFs | Annual Report139
Financial Notes (continued)
3. Risk Factors (continued):
Investment Style Risk. The funds are index funds. Therefore, each fund follows the securities included in its respective index during upturns as well as downturns. Because of their indexing strategies, the funds do not take steps to reduce market exposure or to lessen the effects of a declining market. In addition, because of the funds’ expenses, the funds’ performance may be below that of their respective index. Errors relating to an index may occur from time to time and may not be identified by the index provided for a period of time. In addition, market disruptions could cause delays in an index’s rebalancing schedule. Such errors and/or market disruptions may result in losses for a fund.
Schwab U.S. Dividend Equity ETF primarily invests in dividend paying stocks. As a result, fund performance will correlate with the performance of the dividend paying stock segment of the stock market, and the fund may underperform funds that do not limit their investments to dividend paying stocks. If stocks held by the fund reduce or stop paying dividends, the fund’s ability to generate income may be affected.
Equity Risk. The prices of equity securities rise and fall daily. These price movements may result from factors affecting individual companies, industries or the securities market as a whole. In addition, equity markets tend to move in cycles, which may cause stock prices to fall over short or extended periods of time.
Market Capitalization Risk. Securities issued by companies of different market capitalizations tend to go in and out of favor based on market and economic conditions. During a period when securities of a particular market capitalization fall behind other types of investments, a fund’s performance could be impacted.
Large-Cap Company Risk. Certain funds invest in large-cap company stocks. Large-cap companies are generally more mature and the securities issued by these companies may not be able to reach the same levels of growth as the securities issued by small- or mid-cap companies.
Mid-Cap Company Risk. Certain funds invest in mid-cap company stocks. Mid-cap companies may be more vulnerable to adverse business or economic events than larger, more established companies and the value of securities issued by these companies may move sharply.
Small-Cap Company Risk. Certain funds invest in small-cap company stocks. Securities issued by small-cap companies may be riskier than those issued by larger companies, and their prices may move sharply, especially during market upturns and downturns.
Growth Investing Risk. Certain funds invest in growth stocks. Growth stocks can be volatile. Growth companies usually invest a high portion of earnings in their businesses and may lack the dividends of value stocks that can cushion stock prices in a falling market. The prices of growth stocks are based largely on projections of the issuer’s future earnings and revenues. If a company’s earnings or revenues fall short of expectations, its stock price may fall dramatically. Growth stocks may also be more expensive relative to their earnings or assets compared to value or other stocks
Value Investing Risk. Certain funds emphasize a “value” style of investing, which targets undervalued companies with characteristics for improved valuations. This style of investing is subject to the risk that the valuations never improve or that the returns on “value” securities may not move in tandem with the returns on other styles of investing or the stock market in general.
Sampling Index Tracking Risk. Certain funds may not fully replicate the index and may hold securities not included in the index. As a result, a fund is subject to the risk that the investment adviser’s investment management strategy, the implementation of which is subject to a number of constraints, may not produce the intended results. Because certain funds utilize a sampling approach they may not track the return of their respective index as well as they would if the funds purchased all of the securities in their respective index.
Tracking Error Risk. As index funds, each fund seeks to track the performance of its respective index, although it may not be successful in doing so. The divergence between the performance of a fund and the index, positive or negative, is called “tracking error.” Tracking error can be caused by many factors and it may be significant.
Derivatives Risk. Each fund may invest in derivative instruments. The principal types of derivatives a fund may use are futures contracts. A futures contract is an agreement to buy or sell a financial instrument at a specific price on a specific day. A fund’s use of derivative instruments involves risks different from, or possibly greater than, the risks associated with investing directly in securities and other traditional investments. Certain of these risks, market risk, liquidity risk and leverage risk are discussed elsewhere in this section. A fund’s use of derivatives is also subject to leverage risk, credit risk, lack of availability risk, valuation risk, correlation risk and tax risk. Leverage risk is the risk that use of derivatives may magnify the effect of any decrease or increase in the value of the fund’s portfolio securities. Credit risk is the risk that the counterparty to a derivative transaction may not fulfill its contractual obligations. Lack of availability risk is the risk that suitable derivative transactions may not be available in all circumstances for risk management or other purposes. Valuation risk is the risk that a particular derivative may be valued
140Schwab U.S. Equity ETFs | Annual Report
Financial Notes (continued)
3. Risk Factors (continued):
incorrectly. Correlation risk is the risk that changes in the value of the derivative may not correlate perfectly with the underlying asset, rate or index. Tax risk is the risk that the use of derivatives may cause a fund to realize higher amounts of short-term capital gains. A fund’s use of derivatives could reduce the fund’s performance, increase its volatility and cause the fund to lose more than the initial amount invested. A fund’s use of derivatives also could create a risk of counterparty default under certain transactions, risks that a fund would need to liquidate portfolio positions when it may not be advantageous to do so in order to meet margin and payment obligations, and legal risks relating to insufficient documentation, insufficient capacity or authority of a counterparty, or legality or enforceability of a contract. Furthermore, the use of derivatives subject to regulation by the Commodity Futures Trading Commission (CFTC) could cause the fund to become a commodity pool, which would require the fund to comply with certain CFTC rules.
Liquidity Risk. A fund may be unable to sell certain securities, such as illiquid securities, readily at a favorable time or price, or the fund may have to sell them at a loss.
Leverage Risk. Certain fund transactions, such as derivatives transactions, may give rise to a form of leverage and may expose a fund to greater risk. Leverage tends to magnify the effect of any decrease or increase in the value of a fund’s portfolio securities which means even a small amount of leverage can have a disproportionately large impact on a fund. The use of leverage may cause a fund to liquidate portfolio positions when it would not be advantageous to do so in order to satisfy its obligations.
Securities Lending Risk. Securities lending involves the risk of loss of rights in, or delay in recovery of, the loaned securities if the borrower fails to return the security loaned or becomes insolvent.
Concentration Risk. To the extent that a fund’s or an index’s portfolio is concentrated in the securities of issuers in a particular market, industry, group of industries, sector or asset class, the fund may be adversely affected by the performance of those securities, may be subject to increased price volatility and may be more vulnerable to adverse economic, market, political or regulatory occurrences affecting that market, industry, group of industries, sector or asset class.
Market Trading Risk. Although fund shares are listed on national securities exchanges, there can be no assurance that an active trading market for fund shares will develop or be maintained. If an active market is not maintained, investors may find it difficult to buy or sell fund shares.
Shares of the Fund May Trade at Prices Other Than NAV. Fund shares may be bought and sold in the secondary market at market prices. Although it is expected that the market price of the shares of a fund will approximate the fund’s NAV, there may be times when the market price and the NAV vary significantly. An investor may pay more than NAV when buying shares of a fund in the secondary market, and an investor may receive less than NAV when selling those shares in the secondary market. The market price of fund shares may deviate, sometimes significantly, from NAV during periods of market volatility or market disruption.
Please refer to the funds’ prospectus for a more complete description of the principal risks of investing in the funds.
4. Affiliates and Affiliated Transactions:Investment Adviser
Charles Schwab Investment Management, Inc., dba Schwab Asset Management, a wholly owned subsidiary of The Charles Schwab Corporation, serves as each fund’s investment adviser pursuant to the Advisory Agreement between the investment adviser and the trust.
For its advisory services to the funds, the investment adviser is entitled to receive an annual management fee, payable monthly, based on a percentage of each fund’s average daily net assets as follows:
SCHWAB U.S. BROAD MARKET ETF | | | SCHWAB U.S. LARGE-CAP GROWTH ETF | SCHWAB U.S. LARGE-CAP VALUE ETF | | | SCHWAB U.S. DIVIDEND EQUITY ETF |
| | | | | | | |
Schwab U.S. Equity ETFs | Annual Report141
Financial Notes (continued)
4. Affiliates and Affiliated Transactions (continued):
Investment from Affiliates
Certain funds in the Fund Complex may own shares of other funds in the Fund Complex. The table below reflects the percentages of shares of each fund in this report that are owned by other funds in the Fund Complex as of August 31, 2023, as applicable:
| |
| | | SCHWAB U.S. DIVIDEND EQUITY ETF |
Schwab Monthly Income Fund - Flexible Payout | | | |
Schwab Monthly Income Fund - Income Payout | | | |
Schwab Monthly Income Fund - Target Payout | | | |
Schwab Target 2010 Index Fund | | | |
Schwab Target 2015 Index Fund | | | |
Schwab Target 2020 Index Fund | | | |
Schwab Target 2025 Index Fund | | | |
Schwab Target 2030 Index Fund | | | |
Schwab Target 2035 Index Fund | | | |
Schwab Target 2040 Index Fund | | | |
Schwab Target 2045 Index Fund | | | |
Schwab Target 2050 Index Fund | | | |
Schwab Target 2055 Index Fund | | | |
Schwab Target 2060 Index Fund | | | |
Schwab Target 2065 Index Fund | | | |
Schwab VIT Balanced Portfolio | | | |
Schwab VIT Balanced with Growth Portfolio | | | |
Schwab VIT Growth Portfolio | | | |
Interfund Transactions
The funds may engage in direct transactions with certain other funds in the Fund Complex in accordance with procedures adopted by the Board pursuant to Rule 17a-7 under the 1940 Act. When one fund is seeking to sell a security that another is seeking to buy, an interfund transaction can allow both funds to benefit by reducing transaction costs. This practice is limited to funds that share the same investment adviser, trustees and/or officers. For the period ended August 31, 2023, each fund’s purchases and sales of securities with other funds in the Fund Complex as well as any realized gains (losses) were as follows:
| | | |
Schwab U.S. Broad Market ETF | | | |
| | | |
Schwab U.S. Large-Cap ETF | | | |
Schwab U.S. Large-Cap Growth ETF | | | |
Schwab U.S. Large-Cap Value ETF | | | |
| | | |
Schwab U.S. Small-Cap ETF | | | |
Schwab U.S. Dividend Equity ETF | | | |
| | | |
142Schwab U.S. Equity ETFs | Annual Report
Financial Notes (continued)
4. Affiliates and Affiliated Transactions (continued):
Interfund Borrowing and Lending
Pursuant to an exemptive order issued by the SEC, the funds may enter into interfund borrowing and lending transactions with other funds in the Fund Complex. All loans are for temporary or emergency purposes and the interest rate to be charged will be the average of the overnight repurchase agreement rate and the short-term bank loan rate. All loans are subject to numerous conditions designed to ensure fair and equitable treatment of all participating funds. The interfund lending facility is subject to the oversight and periodic review by the Board. The funds had no interfund borrowing or lending activity during the period.
5. Other Service Providers:SEI Investments Distribution Co. is the principal underwriter and distributor of shares of the funds.
State Street Bank and Trust Company (State Street) serves as the funds’ transfer agent. As part of these services, the transfer agent maintains records pertaining to the sale, redemption and transfer of the funds’ shares. The transfer agent is also responsible for the order-taking function for the funds’ shares.
State Street also serves as custodian and accountant for the funds. The custodian is responsible for the daily safekeeping of securities and cash held by the funds. The funds’ accountant maintains all books and records related to the funds’ transactions.
6. Board of Trustees:The Board may include people who are officers and/or directors of the investment adviser or its affiliates. Federal securities law limits the percentage of such “interested persons” who may serve on a trust’s board, and the trust was in compliance with these limitations throughout the report period. The funds did not pay any interested trustees or non-interested trustees (independent trustees). The independent trustees are paid by the investment adviser. For information regarding the trustees, please refer to the Trustees and Officers table at the end of this report.
7. Borrowing from Banks:During the period, the funds were participants with other funds in the Fund Complex in a joint, syndicated, committed $850 million line of credit (the Syndicated Credit Facility), which matured on September 29, 2022. On September 29, 2022, the Syndicated Credit Facility was amended to run for a new 364 day period with the line of credit amount increasing to $1 billion, maturing on September 28, 2023. Under the terms of the Syndicated Credit Facility, in addition to the investment adviser paying the interest charged on any borrowings by a fund, the investment adviser paid a commitment fee of 0.15% per annum on the funds’ proportionate share of the unused portion of the Syndicated Credit Facility.
During the period, the funds were participants with other funds in the Fund Complex in a joint, unsecured, uncommitted $400 million line of credit (the Uncommitted Credit Facility), with State Street, which matured on September 29, 2022. On September 29, 2022, the Uncommitted Credit Facility was amended to run for a new 364 day period with the line of credit amount remaining unchanged, maturing on September 28, 2023. Under the terms of the Uncommitted Credit Facility, the investment adviser pays interest on the amount a fund borrows. There were no borrowings by any of the funds from either line of credit during the period.
The funds also have access to custodian overdraft facilities. A fund may have utilized the overdraft facility and incurred an interest expense, which is paid by the investment adviser. The interest expense is determined based on a negotiated rate above the current Federal Funds Rate.
8. Derivatives:Certain funds entered into equity index futures contracts during the report period. The funds invested in futures contracts to equitize available cash. The value and variation margin for futures contracts held at August 31, 2023 are presented in each fund’s Portfolio Holdings and Statement of Assets and Liabilities, respectively. The net realized gains (losses) and net change in unrealized appreciation (depreciation) on futures contracts are presented in each fund’s Statement of Operations, if any. Refer to financial
Schwab U.S. Equity ETFs | Annual Report143
Financial Notes (continued)
8. Derivatives (continued):
note 2(b) for the funds’ accounting policies with respect to futures contracts and financial note 3 for disclosures concerning the risks of investing in futures contracts. During the period ended August 31, 2023, the month-end average notional amounts of futures contracts held by the funds and the month-end average number of contracts held were as follows:
| | |
Schwab U.S. Broad Market ETF | | |
| | |
Schwab U.S. Large-Cap ETF | | |
Schwab U.S. Large-Cap Growth ETF | | |
Schwab U.S. Large-Cap Value ETF | | |
| | |
Schwab U.S. Small-Cap ETF | | |
Schwab U.S. Dividend Equity ETF | | |
9. Purchases and Sales of Investment Securities:For the period ended August 31, 2023, purchases and sales of securities (excluding in-kind transactions and short-term obligations) were as follows:
| | |
Schwab U.S. Broad Market ETF | | |
| | |
Schwab U.S. Large-Cap ETF | | |
Schwab U.S. Large-Cap Growth ETF | | |
Schwab U.S. Large-Cap Value ETF | | |
| | |
Schwab U.S. Small-Cap ETF | | |
Schwab U.S. Dividend Equity ETF | | |
10. In-Kind Transactions:The consideration for the purchase of Creation Units of a fund often consists of the in-kind deposit of a designated portfolio of equity securities, which constitutes an optimized representation of the securities involved in a relevant fund’s underlying index, and an amount of cash. Investors purchasing and redeeming Creation Units are subject to a standard creation transaction fee and a standard redemption transaction fee paid to the custodian to offset transfer and other transaction costs associated with the issuance and redemption of Creation Units. Purchasers and redeemers of Creation Units for cash are subject to an additional variable charge paid to the fund that will offset the transaction costs to the fund of buying or selling portfolio securities. Variable charges paid to the fund generally have no effect on net asset value per share. In addition, purchasers and redeemers of shares in Creation Units are responsible for payment of the costs of transferring securities to or out of the fund. From time to time, the investment adviser may cover the cost of any transaction fees when believed to be in the best interests of a fund.
144Schwab U.S. Equity ETFs | Annual Report
Financial Notes (continued)
10. In-Kind Transactions (continued):
The in-kind transactions for the period ended August 31, 2023, were as follows:
| IN-KIND PURCHASES
OF SECURITIES | IN-KIND SALES
OF SECURITIES |
Schwab U.S. Broad Market ETF | | |
| | |
Schwab U.S. Large-Cap ETF | | |
Schwab U.S. Large-Cap Growth ETF | | |
Schwab U.S. Large-Cap Value ETF | | |
| | |
Schwab U.S. Small-Cap ETF | | |
Schwab U.S. Dividend Equity ETF | | |
For the period ended August 31, 2023, the funds may realize net capital gains or losses resulting from in-kind redemptions of Creation Units. Because such gains or losses are not taxable to the funds and are not distributed to existing fund shareholders, the gains or losses are reclassified from accumulated net realized gains or losses to capital received from investors at the end of the funds’ tax year. These reclassifications have no effect on net assets or net asset values per share. The net realized gains or losses on sales of in-kind redemptions for the period ended August 31, 2023 are disclosed in the funds’ Statements of Operations, if any.
11. Federal Income Taxes:As of August 31, 2023, the tax basis cost of the funds’ investments and gross unrealized appreciation and depreciation were as follows:
| | GROSS UNREALIZED
APPRECIATION | GROSS UNREALIZED
DEPRECIATION | NET UNREALIZED
APPRECIATION
(DEPRECIATION) |
Schwab U.S. Broad Market ETF | | | | |
| | | | |
Schwab U.S. Large-Cap ETF | | | | |
Schwab U.S. Large-Cap Growth ETF | | | | |
Schwab U.S. Large-Cap Value ETF | | | | |
| | | | |
Schwab U.S. Small-Cap ETF | | | | |
Schwab U.S. Dividend Equity ETF | | | | |
| | | | |
| | | | |
As of August 31, 2023, the components of distributable earnings on a tax basis were as follows:
| UNDISTRIBUTED
ORDINARY
INCOME | NET UNREALIZED
APPRECIATION
(DEPRECIATION)
ON INVESTMENTS | CAPITAL LOSS
CARRYFORWARDS
AND OTHER LOSSES | |
Schwab U.S. Broad Market ETF | | | | |
| | | | |
Schwab U.S. Large-Cap ETF | | | | |
Schwab U.S. Large-Cap Growth ETF | | | | |
Schwab U.S. Large-Cap Value ETF | | | | |
| | | | |
Schwab U.S. Small-Cap ETF | | | | |
Schwab U.S. Dividend Equity ETF | | | | |
Schwab U.S. Equity ETFs | Annual Report145
Financial Notes (continued)
11. Federal Income Taxes (continued):
The primary difference between book basis and tax basis unrealized appreciation or unrealized depreciation of investments is the tax deferral of losses on wash sales, the realization for tax purposes of unrealized appreciation or depreciation on futures contracts and partnership investments. The tax cost of the funds’ investments, disclosed above, have been adjusted from its book amounts to reflect these unrealized appreciation or depreciation differences, as applicable.
Capital loss carryforwards have no expiration and may be used to offset future realized capital gains for federal income tax purposes. As of August 31, 2023, the funds had capital loss carryforwards available as follows:
| |
Schwab U.S. Broad Market ETF | |
| |
Schwab U.S. Large-Cap ETF | |
Schwab U.S. Large-Cap Growth ETF | |
Schwab U.S. Large-Cap Value ETF | |
| |
Schwab U.S. Small-Cap ETF | |
Schwab U.S. Dividend Equity ETF | |
The tax basis components of distributions paid during the current and prior fiscal years were as follows:
| CURRENT FISCAL YEAR END DISTRIBUTIONS | PRIOR FISCAL YEAR END DISTRIBUTIONS |
| | |
Schwab U.S. Broad Market ETF | | |
| | |
Schwab U.S. Large-Cap ETF | | |
Schwab U.S. Large-Cap Growth ETF | | |
Schwab U.S. Large-Cap Value ETF | | |
| | |
Schwab U.S. Small-Cap ETF | | |
Schwab U.S. Dividend Equity ETF | | |
Distributions paid to shareholders are based on net investment income and net realized gains determined on a tax basis, which may differ from net investment income and net realized gains for financial reporting purposes. These differences reflect the differing character of certain income items and net realized gains and losses for financial statement and tax purposes, and may result in reclassification among certain capital accounts in the financial statements. The funds may also designate a portion of the amount paid to redeeming shareholders as a distribution for tax purposes.
Permanent book and tax basis differences may result in reclassifications between components of net assets as required. The adjustments have no impact on net assets or the results of operations.
As of August 31, 2023, management has reviewed the tax positions for open periods (for federal purposes, three years from the date of filing and for state purposes, four years from the date of filing) as applicable to the funds, and has determined that no provision for income tax is required in the funds’ financial statements. The funds recognize interest and penalties, if any, related to unrecognized tax benefits as income tax expense in each fund’s Statement of Operations. During the fiscal year ended August 31, 2023, the funds did not incur any interest or penalties.
12. Share Splits:The Board authorized a 2-for-1 share split for the Schwab U.S. Broad Market ETF, Schwab U.S. Large-Cap ETF, Schwab U.S. Large-Cap Growth ETF and Schwab U.S. Small-Cap ETF which applied to shareholders of record as of the close of markets on March 8, 2022, and paid after the close of markets on March 10, 2022. Shares began trading at their post-split price on March 11, 2022. The share split increased the number of shares outstanding and decreased the NAV per share. The share split did not change
146Schwab U.S. Equity ETFs | Annual Report
Financial Notes (continued)
12. Share Splits (continued):
the total value of a shareholder’s investment. The Financial Highlights and Statement of Changes in Net Assets for Schwab U.S. Broad Market ETF, Schwab U.S. Large-Cap ETF, Schwab U.S. Large-Cap Growth ETF and Schwab U.S. Small-Cap ETF have been retroactively adjusted for the period ended August 31, 2022 to reflect the above share split.
13. Subsequent Events:Management has determined there are no subsequent events or transactions through the date the financial statements were issued that would have materially impacted the financial statements as presented.
Schwab U.S. Equity ETFs | Annual Report147
Report of Independent Registered Public Accounting Firm
To the Board of Trustees of Schwab Strategic Trust and Shareholders of Schwab U.S. Broad Market ETF, Schwab 1000 Index ETF, Schwab U.S. Large-Cap ETF, Schwab U.S. Large-Cap Growth ETF, Schwab U.S. Large-Cap Value ETF, Schwab U.S. Mid-Cap ETF, Schwab U.S. Small-Cap ETF, and Schwab U.S. Dividend Equity ETF:
Opinion on the Financial Statements and Financial Highlights
We have audited the accompanying statements of assets and liabilities, including the portfolio holdings, of Schwab U.S. Broad Market ETF, Schwab 1000 Index ETF, Schwab U.S. Large-Cap ETF, Schwab U.S. Large-Cap Growth ETF, Schwab U.S. Large-Cap Value ETF, Schwab U.S. Mid-Cap ETF, Schwab U.S. Small-Cap ETF, and Schwab U.S. Dividend Equity ETF, (the “Funds”) eight of the funds constituting Schwab Strategic Trust, as of August 31, 2023, the related statements of operations for the year then ended, the statements of changes in net assets for each of the two years in the period then ended, the financial highlights for each of the four years in the period then ended, and the related notes. In our opinion, the financial statements and financial highlights present fairly, in all material respects, the financial position of each of the Funds as of August 31, 2023, and the results of their operations for the year then ended, the changes in their net assets for each of the two years in the period then ended, and the financial highlights for each of the four years in the period then ended in conformity with accounting principles generally accepted in the United States of America. The financial highlights for the year in the period ended August 31, 2019 were audited by other auditors, whose report, dated October 17, 2019, expressed an unqualified opinion on such financial highlights.
Basis for Opinion
These financial statements and financial highlights are the responsibility of the Funds’ management. Our responsibility is to express an opinion on the Funds’ financial statements and financial highlights based on our audits. We are a public accounting firm registered with the Public Company Accounting Oversight Board (United States) (PCAOB) and are required to be independent with respect to the Funds in accordance with the U.S. federal securities laws and the applicable rules and regulations of the Securities and Exchange Commission and the PCAOB.
We conducted our audits in accordance with the standards of the PCAOB. Those standards require that we plan and perform the audit to obtain reasonable assurance about whether the financial statements and financial highlights are free of material misstatement, whether due to error or fraud. The Funds are not required to have, nor were we engaged to perform, an audit of their internal control over financial reporting. As part of our audits, we are required to obtain an understanding of internal control over financial reporting but not for the purpose of expressing an opinion on the effectiveness of the Funds’ internal control over financial reporting. Accordingly, we express no such opinion.
Our audits included performing procedures to assess the risks of material misstatement of the financial statements and financial highlights, whether due to error or fraud, and performing procedures that respond to those risks. Such procedures included examining, on a test basis, evidence regarding the amounts and disclosures in the financial statements and financial highlights. Our audits also included evaluating the accounting principles used and significant estimates made by management, as well as evaluating the overall presentation of the financial statements and financial highlights. Our procedures included confirmation of securities owned as of August 31, 2023, by correspondence with the custodian and brokers; when replies were not received from brokers, we performed other auditing procedures. We believe that our audits provide a reasonable basis for our opinion.
Deloitte & Touche LLP
Denver, Colorado
October 17, 2023
We have served as the auditor of one or more investment companies in the Schwab Funds Complex since 2020.
148Schwab U.S. Equity ETFs | Annual Report
Other Federal Tax Information (unaudited)
For corporate shareholders, the following percentage of the funds’ dividend distributions paid during the fiscal year ended August 31, 2023, qualify for the corporate dividends received deduction:
| |
Schwab U.S. Broad Market ETF | |
| |
Schwab U.S. Large-Cap ETF | |
Schwab U.S. Large-Cap Growth ETF | |
Schwab U.S. Large-Cap Value ETF | |
| |
Schwab U.S. Small-Cap ETF | |
Schwab U.S. Dividend Equity ETF | |
For the fiscal year ended August 31, 2023, the funds designate the following amounts of the dividend distributions as qualified dividends for the purpose of the maximum rate under section 1(h)(11) of the Internal Revenue Code. Shareholders will be notified in January 2024 via IRS Form 1099 of the amount for use in preparing their 2023 income tax return.
Schwab U.S. Broad Market ETF | |
| |
Schwab U.S. Large-Cap ETF | |
Schwab U.S. Large-Cap Growth ETF | |
Schwab U.S. Large-Cap Value ETF | |
| |
Schwab U.S. Small-Cap ETF | |
Schwab U.S. Dividend Equity ETF | |
For the fiscal year ended August 31, 2023, the funds designate the following amounts as dividends eligible for the 20% qualified business income deduction under section 199A of the Internal Revenue Code. Shareholders will be notified in January 2024 via IRS Form 1099 of the amounts for use in preparing their 2023 income tax return.
Schwab U.S. Broad Market ETF | |
| |
Schwab U.S. Large-Cap ETF | |
Schwab U.S. Large-Cap Growth ETF | |
Schwab U.S. Large-Cap Value ETF | |
| |
Schwab U.S. Small-Cap ETF | |
Schwab U.S. Dividend Equity ETF | |
Schwab U.S. Equity ETFs | Annual Report149
Investment Advisory Agreement Approval
The Investment Company Act of 1940, as amended (the 1940 Act), requires that the continuation of a fund’s investment advisory agreement must be specifically approved (1) by the vote of the trustees or by a vote of the shareholders of the fund, and (2) by the vote of a majority of the trustees who are not parties to the investment advisory agreement or “interested persons” of any party thereto (the Independent Trustees), cast in person at a meeting called for the purpose of voting on such approval. In connection with such approvals, the fund’s trustees must request and evaluate, and the investment adviser is required to furnish, such information as may be reasonably necessary to evaluate the terms of the investment advisory agreement.
The Board of Trustees (the Board or the Trustees, as appropriate) calls and holds one or more meetings each year that are dedicated, in whole or in part, to considering whether to renew the investment advisory agreement (the Agreement) between Schwab Strategic Trust (the Trust) and Charles Schwab Investment Management, Inc. (CSIM) (dba Schwab Asset Management) (the investment adviser) with respect to the existing funds in the Trust, including Schwab U.S. Broad Market ETF, Schwab U.S. Large-Cap ETF, Schwab U.S. Large-Cap Growth ETF, Schwab U.S. Large-Cap Value ETF, Schwab U.S. Mid-Cap ETF, Schwab U.S. Small-Cap ETF, Schwab U.S. Dividend Equity ETF and Schwab 1000 Index ETF (the Funds), and to review certain other agreements pursuant to which the investment adviser provides investment advisory services to certain other registered investment companies. In preparation for the meeting(s), the Board requests and reviews a wide variety of materials provided by the investment adviser, including information about the investment adviser’s affiliates, personnel, business goals and priorities, profitability, third-party oversight, corporate structure and operations. As part of the renewal process, the Independent Trustees’ legal counsel, on behalf of the Independent Trustees, sends an information request letter to the investment adviser seeking certain relevant information. The responses by the investment adviser are provided to the Trustees in the Board materials for their review prior to their meeting, and the Trustees are provided with the opportunity to request any additional materials. The Board also receives data provided by an independent provider of investment company data. This information is in addition to the detailed information about the Funds that the Board reviews during the course of each year, including information that relates to the Funds’ operations and performance, legal and compliance matters, risk management, portfolio turnover, and sales and marketing activity. In considering the renewal, the Independent Trustees receive advice from Independent Trustees’ legal counsel, including a memorandum regarding the responsibilities of trustees for the approval of investment advisory agreements. In addition, the Independent Trustees participate in question and answer
sessions with representatives of the investment adviser and meet in executive session outside the presence of Fund management.
The Board, including a majority of the Independent Trustees, considered information specifically relating to the continuance of the Agreement with respect to the Funds at meetings held on April 27, 2023 and June 6, 2023, and approved the renewal of the Agreement with respect to the Funds for an additional one-year term at the meeting on June 6, 2023 called for the purpose of voting on such approval.
The Board’s approval of the continuance of the Agreement with respect to the Funds was based on consideration and evaluation of a variety of specific factors discussed at these meetings and at prior meetings, including:
1.
the nature, extent and quality of the services provided to each Fund under the Agreement, including the resources of the investment adviser and its affiliates dedicated to the Funds;
2.
each Fund’s investment performance and how it compared to that of certain other comparable exchange-traded funds and benchmark data;
3.
each Fund’s expenses and how those expenses compared to those of certain other similar exchange-traded funds;
4.
the profitability of the investment adviser and its affiliates, including Charles Schwab & Co., Inc. (Schwab), with respect to each Fund, including both direct and indirect benefits accruing to the investment adviser and its affiliates; and
5.
the extent to which economies of scale would be realized as each Fund grows and whether fee levels in the Agreement reflect those economies of scale for the benefit of Fund investors.
Nature, Extent and Quality of Services. The Board considered the nature, extent and quality of the services provided by the investment adviser to the Funds and the resources of the investment adviser and its affiliates dedicated to the Funds. In this regard, the Trustees evaluated, among other things, the investment adviser’s experience, track record, compliance program, resources dedicated to hiring and retaining skilled personnel and specialized talent, and information security resources. The Trustees also considered information provided by the investment adviser relating to services and support provided with respect to the Funds’ portfolio management team, portfolio strategy, and internal investment guidelines, as well as trading infrastructure, liquidity management, product design and analysis, shareholder communications, securities valuation, and vendor and risk oversight. The Trustees also considered investments the investment adviser has made in its infrastructure, including modernizing the investment adviser’s
150Schwab U.S. Equity ETFs | Annual Report
technology and use of data, increasing expertise in key areas (including portfolio management and trade operations), and improving business continuity, cybersecurity, due diligence, risk management processes, and information security programs, which are designed to provide enhanced services to the Funds and their shareholders. The Trustees considered Schwab’s overall financial condition and reputation as a full service brokerage firm, as well as the wide range of products, services and account features that benefit Fund shareholders who are brokerage clients of Schwab. Following such evaluation, the Board concluded, within the context of its full deliberations, that the nature, extent and quality of services provided by the investment adviser to the Funds and the resources of the investment adviser and its affiliates dedicated to the Funds supported renewal of the Agreement with respect to the Funds.
Fund Performance. The Board considered each Fund’s performance in determining whether to renew the Agreement with respect to such Fund. Specifically, the Trustees considered each Fund’s performance relative to a peer category of other exchange-traded funds and applicable indices/benchmarks, in light of total return and the market environment, as well as in consideration of each Fund’s investment style and strategy. As part of this review, the Trustees considered the composition of the peer category, selection criteria and the reputation of the independent provider of investment company data who prepared the peer category analysis. In evaluating the performance of each Fund, the Trustees considered the risk profile for such Fund and such Fund’s demonstrated performance in tracking its benchmark index. The Trustees further considered the level of Fund performance in the context of their review of Fund expenses and the investment adviser’s profitability discussed below and also noted that the Board and a designated committee of the Board review performance throughout the year. Although the Schwab U.S. Small-Cap ETF and Schwab U.S. Mid-Cap ETF had performance that ranked in the fourth quartile of a relevant peer group for more than one performance period considered, the Board concluded that other factors relevant to performance supported renewal of the Agreement with respect to the Funds, the underperformance was attributable, to a significant extent, to investment decisions by the investment adviser that were reasonable and consistent with the Fund’s investment objective and policies and that it had taken steps designed to help improve performance. Following such evaluation, the Board concluded, within the context of its full deliberations, that the performance of each Fund, supported renewal of the Agreement with respect to such Fund.
Fund Expenses. With respect to each Fund’s expenses, the Trustees considered the rate of compensation called for by the Agreement and each Fund’s operating expense ratio, in each case in comparison to those of other similar exchange-traded funds, such peer groups and comparisons having been selected and calculated by an independent provider of investment company data. The investment adviser reported to
the Board, and the Board took into account, the risk assumed by the investment adviser in the development of the Funds and provision of services as well as the competitive marketplace for financial products. The Trustees also considered fees charged by the investment adviser to mutual funds and other exchange-traded funds that it manages. The Board evaluated the Funds’ unitary fee through review of comparative information with respect to fees paid by other similar exchange-traded funds tracking U.S. equity indices. Following such evaluation, the Board concluded, within the context of its full deliberations, that the expenses of each Fund are reasonable and supported renewal of the Agreement with respect to such Fund.
Profitability. The Trustees considered the compensation flowing to the investment adviser and its affiliates, directly or indirectly and reviewed profitability on a pre-tax basis, without regard to distribution expenses. The Trustees reviewed profitability of the investment adviser relating to the Schwab fund complex as a whole, noting the benefits to Fund shareholders of being part of the Schwab fund complex, including the allocations of certain costs across the Funds and other funds in the complex. The Trustees also considered any other benefits derived by the investment adviser from its relationship with the Funds, such as whether, by virtue of its management of the Funds, the investment adviser obtains investment information or other research resources that aid it in providing advisory services to other clients. The Trustees considered whether the compensation and profitability with respect to the Funds under the Agreement and other service agreements were reasonable in light of the quality of all services rendered to the Funds by the investment adviser and its affiliates. The Trustees noted that the investment adviser continues to invest substantial sums in its business in order to provide enhanced research capabilities, services and systems to benefit the Funds. Based on this evaluation, the Board concluded, within the context of its full deliberations, that the profitability of the investment adviser with respect to each Fund is reasonable and supported renewal of the Agreement with respect to such Fund.
Economies of Scale. Although the Trustees recognized the difficulty of determining economies of scale with precision, and although the Funds do not have breakpoints in their advisory fees, the Trustees considered the potential existence of any economies of scale by way of the relatively low advisory fee and unitary fee structure of the Funds and whether those are passed along to a Fund’s shareholders through (i) the enhancement of services provided to the Funds in return for fees paid, including through investments by the investment adviser in its infrastructure, including modernizing the investment adviser’s technology and use of data, increasing expertise and capabilities in key areas (including portfolio and trade operations), and improving business continuity, cybersecurity, due diligence and information security programs, which are designed to provide enhanced services to the Funds and their shareholders; and (ii) pricing a fund to
Schwab U.S. Equity ETFs | Annual Report151
scale and keeping overall expenses down as the fund grows. The Trustees acknowledged that the investment adviser has invested in its infrastructure, as discussed above, over time and that the investment adviser’s internal costs of providing investment management, technology, administrative, legal and compliance services to the Funds continue to increase as a result of regulatory or other developments. Based on this evaluation, the Board concluded, within the context of its full deliberations, that each Fund obtains reasonable benefits from economies of scale.
* * * * * * * * * * * * * * * * * * * * * * * * * * * * * * * * * * * * * * * *
In the course of their deliberations, the Trustees may have accorded different weights to various factors and did not
identify any particular information or factor that was all important or controlling. Based on the Trustees’ deliberation and their evaluation of the information described above, the Board, including all of the Independent Trustees, approved the continuation of the Agreement with respect to the Funds and concluded that the compensation under the Agreement with respect to the Funds is fair and reasonable in light of the services provided and the related expenses borne by the investment adviser and its affiliates and such other matters as the Trustees considered to be relevant in the exercise of their reasonable judgment.
152Schwab U.S. Equity ETFs | Annual Report
Trustees and Officers
The tables below give information about the trustees and officers of Schwab Strategic Trust, which includes the funds covered in this report. The “Fund Complex” includes The Charles Schwab Family of Funds, Schwab Capital Trust, Schwab Investments, Schwab Annuity Portfolios, Schwab Strategic Trust and Laudus Trust. The Fund Complex includes 106 funds.
The address for all trustees and officers is 211 Main Street, San Francisco, CA 94105. You can find more information about the trustees and officers in the Statement of Additional Information, which is available free by calling 1-877-824-5615.
|
Name, Year of Birth, and Position(s) with the trust (Terms of office, and length of Time Served1) | Principal Occupations During the Past Five Years | Number of Portfolios in Fund Complex Overseen by the Trustee | |
Michael J. Beer 1961 Trustee (Trustee of The Charles Schwab Family of Funds, Schwab Investments, Schwab Capital Trust, Schwab Annuity Portfolios, Schwab Strategic Trust and Laudus Trust since 2022) | Retired. Director, President and Chief Executive Officer (Dec. 2016 – Sept. 2019), Principal Funds (investment management). | | Director (2016 – 2019), Principal Funds, Inc. |
Robert W. Burns 1959 Trustee (Trustee of Schwab Strategic Trust since 2009; The Charles Schwab Family of Funds, Schwab Investments, Schwab Capital Trust, Schwab Annuity Portfolios and Laudus Trust since 2016) | Retired/Private Investor. | | |
Nancy F. Heller 1956 Trustee (Trustee of The Charles Schwab Family of Funds, Schwab Investments, Schwab Capital Trust, Schwab Annuity Portfolios, Schwab Strategic Trust and Laudus Trust since 2018) | | | |
David L. Mahoney 1954 Trustee (Trustee of The Charles Schwab Family of Funds, Schwab Investments, Schwab Capital Trust, Schwab Annuity Portfolios and Laudus Trust since 2011; Schwab Strategic Trust since 2016) | | | Director (2004 – present), Corcept Therapeutics Incorporated Director (2009 – 2021), Adamas Pharmaceuticals, Inc. Director (2003 – 2019), Symantec Corporation |
Jane P. Moncreiff 1961 Trustee (Trustee of The Charles Schwab Family of Funds, Schwab Investments, Schwab Capital Trust, Schwab Annuity Portfolios, Schwab Strategic Trust and Laudus Trust since 2019) | Consultant (2018 – present), Fulham Advisers LLC (management consulting); Chief Investment Officer (2009 – 2017), CareGroup Healthcare System, Inc. (healthcare). | | |
Schwab U.S. Equity ETFs | Annual Report153
Independent Trustees (continued) |
Name, Year of Birth, and Position(s) with the trust (Terms of office, and length of Time Served1) | Principal Occupations During the Past Five Years | Number of Portfolios in Fund Complex Overseen by the Trustee | |
Kimberly S. Patmore 1956 Trustee (Trustee of The Charles Schwab Family of Funds, Schwab Investments, Schwab Capital Trust, Schwab Annuity Portfolios, Schwab Strategic Trust and Laudus Trust since 2016) | Consultant (2008 – present), Patmore Management Consulting (management consulting). | | |
J. Derek Penn 1957 Trustee (Trustee of The Charles Schwab Family of Funds, Schwab Investments, Schwab Capital Trust, Schwab Annuity Portfolios, Schwab Strategic Trust and Laudus Trust since 2021) | Head of Equity Sales and Trading (2006 – 2018), BNY Mellon (financial services). | | |
154Schwab U.S. Equity ETFs | Annual Report
|
Name, Year of Birth, and Position(s) with the trust (Terms of office, and length of Time Served1) | Principal Occupations During the Past Five Years | Number of Portfolios in Fund Complex Overseen by the Trustee | |
Walter W. Bettinger II2 1960 Chairman and Trustee (Trustee of The Charles Schwab Family of Funds, Schwab Investments, Schwab Capital Trust and Schwab Annuity Portfolios since 2008; Schwab Strategic Trust since 2009; Laudus Trust since 2010) | Co-Chairman of the Board (July 2022 – present), Director and Chief Executive Officer (Oct. 2008 – present) and President (Feb. 2007 – Oct. 2021), The Charles Schwab Corporation; President and Chief Executive Officer (Oct. 2008 – Oct. 2021) and Director (May 2008 – Oct. 2021), Charles Schwab & Co., Inc.; Director (Apr. 2006 – present), Charles Schwab Bank, SSB; Director (Nov. 2017 – present), Charles Schwab Premier Bank, SSB; Director (July 2019 – present), Charles Schwab Trust Bank; Director (May 2008 – present), Chief Executive Officer (Aug. 2017 – present) and President (Aug. 2017 – Nov. 2021), Schwab Holdings, Inc.; Director (Oct. 2020 – present), TD Ameritrade Holding Corporation; Director (July 2016 – Oct. 2021), Charles Schwab Investment Management, Inc. | | Director (2008 – present), The Charles Schwab Corporation |
Richard A. Wurster2 1973 Trustee (Trustee of The Charles Schwab Family of Funds, Schwab Investments, Schwab Capital Trust, Schwab Annuity Portfolios, Schwab Strategic Trust and Laudus Trust since 2022) | President (Oct. 2021 – present) and Executive Vice President – Schwab Asset Management Solutions (Apr. 2019 – Oct. 2021), The Charles Schwab Corporation; President, Director (Oct. 2021 – present), Executive Vice President – Schwab Asset Management Solutions (July 2019 – Oct. 2021) and Senior Vice President – Advisory (May 2016 – July 2019), Charles Schwab & Co., Inc.; President (Nov. 2021 – present), Schwab Holdings, Inc.; Director (Oct. 2021 – present) and Chief Executive Officer (Nov. 2019 – Jan. 2022), Charles Schwab Investment Management, Inc.; Director, Chief Executive Officer and President (Mar. 2018 – Oct. 2022), Charles Schwab Investment Advisory, Inc.; Chief Executive Officer (July 2016 – Apr. 2018) and President (Mar. 2017 – Apr. 2018), ThomasPartners, Inc.; Chief Executive Officer (July 2016 – Apr. 2018), Windhaven Investment Management, Inc. | | |
|
Name, Year of Birth, and Position(s) with the trust (Terms of office, and length of Time Served3) | Principal Occupations During the Past Five Years |
Omar Aguilar 1970 Chief Executive Officer and Chief Investment Officer (Officer of The Charles Schwab Family of Funds, Schwab Investments, Schwab Capital Trust, Schwab Annuity Portfolios, Schwab Strategic Trust and Laudus Trust since 2011) | Chief Executive Officer (Jan. 2022 – present), Chief Investment Officer (Apr. 2011 – present) and Senior Vice President (Apr. 2011 – Dec. 2021), Charles Schwab Investment Management, Inc.; Director, Chief Executive Officer and President (Oct. 2022 – present), Charles Schwab Investment Advisory, Inc.; Chief Executive Officer (Sept. 2023 – present), Chief Investment Officer (June 2011 – present) and Vice President (June 2011 – Sept. 2023), Schwab Funds, Laudus Trust and Schwab ETFs. |
Jonathan de St. Paer 1973 President (Officer of The Charles Schwab Family of Funds, Schwab Investments, Schwab Capital Trust, Schwab Annuity Portfolios, Schwab Strategic Trust and Laudus Trust since 2018) | Director (Apr. 2019 – present), President (Oct. 2018 – present), Chief Operating Officer (Jan. 2021 – present), and Chief Executive Officer (Apr. 2019 – Nov. 2019), Charles Schwab Investment Management, Inc.; Senior Vice President (June 2020 – Mar. 2022) and Chief Operating Officer (Jan. 2021 – Mar. 2022), Charles Schwab Investment Advisory, Inc.; President (Nov. 2018 – present), Chief Executive Officer (Apr. 2019 – Sept. 2023) and Trustee (Apr. 2019 – Dec. 2020), Schwab Funds, Laudus Trust and Schwab ETFs; Managing Director (May 2022 – present), Senior Vice President (Apr. 2019 – May 2022) and Senior Vice President – Strategy and Product Development (CSIM) (Jan. 2014 – Mar. 2019), Charles Schwab & Co., Inc. |
Mark Fischer 1970 Chief Operating Officer (Officer of The Charles Schwab Family of Funds, Schwab Investments, Schwab Capital Trust, Schwab Annuity Portfolios, Schwab Strategic Trust and Laudus Trust since 2013) | Chief Operating Officer (Dec. 2020 – present) and Treasurer and Chief Financial Officer (Jan. 2016 – Dec. 2022), Schwab Funds, Laudus Trust and Schwab ETFs; Managing Director (Mar. 2023 – present), Chief Financial Officer (Mar. 2020 – present) and Vice President (Oct. 2013 – Mar. 2023), Charles Schwab Investment Management, Inc. |
Schwab U.S. Equity ETFs | Annual Report155
Officers of the Trust (continued) |
Name, Year of Birth, and Position(s) with the trust (Terms of office, and length of Time Served3) | Principal Occupations During the Past Five Years |
Dana Smith 1965 Treasurer and Chief Financial Officer (Officer of The Charles Schwab Family of Funds, Schwab Investments, Schwab Capital Trust, Schwab Annuity Portfolios, Schwab Strategic Trust and Laudus Trust since 2023) | Treasurer and Chief Financial Officer (Jan. 2023 – present) and Assistant Treasurer (Dec. 2015 – Dec. 2022), Schwab Funds, Laudus Trust and Schwab ETFs; Managing Director (Mar. 2023 – present), Vice President (Mar. 2022 – Mar. 2023) and Director (Oct. 2015 – Mar. 2022), Charles Schwab Investment Management, Inc. |
Brett Wander 1961 Vice President and Chief Investment Officer (Officer of The Charles Schwab Family of Funds, Schwab Investments, Schwab Capital Trust, Schwab Annuity Portfolios, Schwab Strategic Trust and Laudus Trust since 2011) | Managing Director (Mar. 2023 – present), Chief Investment Officer (Apr. 2011 – present) and Senior Vice President (Apr. 2011 – Mar. 2023) Charles Schwab Investment Management, Inc.; Vice President and Chief Investment Officer (June 2011 – present), Schwab Funds, Laudus Trust and Schwab ETFs. |
William P. McMahon, Jr. 1972 Vice President and Chief Investment Officer (Officer of The Charles Schwab Family of Funds, Schwab Investments, Schwab Capital Trust, Schwab Annuity Portfolios, Schwab Strategic Trust and Laudus Trust since 2021) | Managing Director (Mar. 2023 – present), Chief Investment Officer (Jan. 2020 – present) and Senior Vice President (Jan. 2020 – Mar. 2023) Charles Schwab Investment Management, Inc.; Vice President and Chief Investment Officer (June 2021 – present), Schwab Funds, Laudus Trust and Schwab ETFs; Senior Vice President and Chief Investment Officer – ThomasPartners Strategies (Apr. 2018 – Dec. 2019), Charles Schwab Investment Advisory, Inc.; Senior Vice President and Chief Investment Officer (May 2001 – Apr. 2018), ThomasPartners, Inc. |
Catherine MacGregor 1964 Chief Legal Officer and Secretary, Schwab Funds and Schwab ETFs Chief Legal Officer, Vice President and Clerk, Laudus Trust (Officer of The Charles Schwab Family of Funds, Schwab Investments, Schwab Capital Trust, Schwab Annuity Portfolios and Laudus Trust since 2005; Schwab Strategic Trust since 2009) | Managing Director (Mar. 2023 – present), Chief Legal Officer (Mar. 2022 – present) and Vice President (Sept. 2005 – Mar. 2023), Charles Schwab Investment Management, Inc.; Managing Director (May 2022 – present) and Vice President (July 2005 – May 2022), Charles Schwab & Co., Inc.; Vice President (Dec. 2005 – present) and Chief Legal Officer and Clerk (Mar. 2007 – present), Laudus Trust; Chief Legal Officer and Secretary (Oct. 2021 – present), Vice President (Nov. 2005 – Oct. 2021) and Assistant Secretary (June 2007 – Oct. 2021), Schwab Funds; Chief Legal Officer and Secretary (Oct. 2021 – present), Vice President and Assistant Secretary (Oct. 2009 – Oct. 2021), Schwab ETFs. |
1
Each Trustee shall hold office until the election and qualification of his or her successor, or until he or she dies, resigns or is removed. The retirement policy requires that each independent trustee retire by December 31 of the year in which the Trustee turns 74 or the Trustee’s twentieth year of service as an independent trustee on any trust in the Fund Complex, whichever occurs first.
2
Mr. Bettinger and Mr. Wurster are Interested Trustees. Mr. Bettinger and Mr. Wurster are Interested Trustees because each owns stock of The Charles Schwab Corporation (CSC), the parent company of Charles Schwab Investment Management, Inc., the investment adviser for the trusts in the Fund Complex, and is an employee of Charles Schwab & Co., Inc. (Schwab), the principal underwriter for The Charles Schwab Family of Funds, Schwab Investments, Schwab Capital Trust, Schwab Annuity Portfolios and Laudus Trust.
3
The President, Treasurer and Secretary/Clerk hold office until their respective successors are chosen and qualified or until he or she sooner dies, resigns, is removed or becomes disqualified. Each of the other officers serves at the pleasure of the Board.
156Schwab U.S. Equity ETFs | Annual Report
ask See “offer.”
asset allocation The practice of dividing a portfolio among different asset classes, with each asset class assigned a particular percentage to help offset risks and rewards, based on your goals, time horizon and risk tolerance.
asset class A group of securities with similar structure and basic characteristics. Stocks, bonds and cash are the three main examples of asset classes.
authorized participant (AP) A large institutional investor that places orders for creation units with the funds’ distributor.
beta A historical measure of an investment’s volatility relative to a market index (usually the S&P 500®). The index is defined as having a beta of 1.00. Investments with a beta higher than 1.00 have been more volatile than the index; those with a beta of less than 1.00 have been less volatile.
bid The highest price at which someone is willing to buy a security.
Bloomberg US Aggregate Bond Index An index that is a broad-based benchmark measuring the performance of the U.S. investment grade, taxable bond market, including U.S. Treasuries, government-related and corporate bonds, mortgage pass-through securities, commercial mortgage-backed securities, and asset-backed securities that are publicly available for sale in the United States. To be eligible for inclusion in the index, securities must be fixed rate, non-convertible, U.S. dollar-denominated with at least $300 million or more of outstanding face value and have one or more years remaining to maturity. The index excludes certain types of securities, including tax-exempt state and local government series bonds, structured notes embedded with swaps or other special features, private placements, floating rate securities, inflation-linked bonds and Eurobonds. The index is market capitalization weighted and the securities in the index are updated on the last business day of each month.
Bloomberg US Treasury Bills 1–3 Month Index An index that includes all publicly issued zero-coupon U.S. Treasury Bills that have a remaining maturity of less than 3 months but more than 1 month, are rated investment grade and have $300 million or more of outstanding face value. It excludes zero-coupon STRIPS.
cap, capitalization See “market cap.”
capital gain, capital loss The difference between the amount paid for an investment and its value at a later time. If the investment has been sold, the capital gain or loss is considered a realized gain or loss. If the investment is still held, the gain or loss is still “on paper” and is considered unrealized.
commencement of operations The date that the first NAV was calculated.
creation unit (C.U.) A basket of securities that is delivered by an authorized participant (AP) to the fund equal to the current holdings of the ETF, plus a designated cash component. In return, the APs receive a large block of ETF shares (typically 50,000 shares), which investors can then buy and sell in the secondary market.
dividend yield A stock’s indicated annual dividend divided by current price. At the portfolio level, it is the value-weighted average of the dividend yield of the securities in the portfolio.
Dow Jones U.S. Broad Stock Market Index An index that is a subset of the Dow Jones U.S. Total Stock Market Index, which includes the largest 2,500 publicly traded U.S. companies and is designed to measure the performance of large- and small-cap U.S. equity securities. The index is a float-adjusted market capitalization weighted index that reflects the shares of securities actually available to investors in the marketplace.
Dow Jones U.S. Dividend 100 Index An index that is designed to measure the performance of high dividend yielding stocks issued by U.S. companies that have a record of consistently paying dividends, selected for fundamental strength relative to their peers, based on financial ratios. The 100-component index is a subset of the Dow Jones U.S. Broad Market Index, which includes the 2,500 largest U.S. stocks based on full market capitalization and excludes real estate investment trusts (REITs). It is modified market capitalization weighted.
Dow Jones U.S. Large-Cap Growth Total Stock Market Index An index, which is a subset of the Dow Jones U.S. Total Stock Market Index, that is designed to measure the performance of large-cap U.S. equity securities that are classified as “growth” based on a multi-factor analysis. The index is a float-adjusted market capitalization weighted index.
Dow Jones U.S. Large-Cap Total Stock Market Index An index that is a subset of the Dow Jones U.S. Total Stock Market Index, and is designed to measure the performance of large-cap U.S. equity securities. The index is a float-adjusted market capitalization weighted index.
Dow Jones U.S. Large-Cap Value Total Stock Market Index An index that is a subset of the Dow Jones U.S. Total Stock Market Index, and is designed to measure the performance of large-cap U.S. equity securities that are classified as “value” based on a multi-factor analysis. The index is a float-adjusted market capitalization weighted index.
Dow Jones U.S. Mid-Cap Total Stock Market Index An index that is a subset of the Dow Jones U.S. Total Stock Market Index, and is designed to measure the performance of mid-cap U.S. equity securities. The index is a float-adjusted market capitalization weighted index.
Dow Jones U.S. Small-Cap Total Stock Market Index An index that is a subset of the Dow Jones U.S. Total Stock Market Index, and is designed to measure the performance of small-cap U.S. equity securities. The index is a float-adjusted market capitalization weighted index.
Dow Jones U.S. Total Stock Market Index An index which includes all U.S. equity issues with readily available prices. The index is a float-adjusted market capitalization weighted index that reflects the shares of securities actually available to investors in the marketplace.
exchange A marketplace, or any organization or group that provides or maintains a marketplace for trading securities, options, futures, or commodities.
expense ratio The amount that is taken from the fund’s assets each year to cover the operating expenses. An expense ratio of 0.50% means that a fund’s expenses amount to half of one percent of its average net assets a year.
gross domestic product (GDP) The output of goods and services produced by labor and property located in the United States.
inception date The date that the shares began trading in the secondary market.
Schwab U.S. Equity ETFs | Annual Report157
indicative optimized portfolio value (IOPV) A calculation disseminated by the stock exchange that approximates the fund’s NAV every 15 seconds throughout the trading day.
liquidity The ability to convert a security or asset quickly into cash.
market cap, market capitalization The value of a company as determined by the total value of all shares of its stock outstanding. Free-float market capitalization is a variation of market capitalization that only includes shares generally available to the public, and excludes shares of a company held by entities such as the government. Modified market capitalization weighting represents a mix between conventional market capitalization weighting and equal weighting.
market price return The return based on the change in market price per share of the fund over a given time period. Market price returns assume that dividends and capital gain distributions have been reinvested in the fund at market price.
median market cap The midpoint of the range of market caps of the stocks held by a fund. There are different ways of calculating median market cap. With a simple median, half of the stocks in the fund’s portfolio would be larger than the median, and half would be smaller. With a weighted median (the type that is calculated for these funds), half of the fund’s assets are invested in stocks that are larger than the median market cap, and half in stocks that are smaller.
MSCI EAFE Index (Net) A free float-adjusted market capitalization index that is designed to measure the equity market performance of developed markets in Europe, Australasia, and the Far East. The Net version of the index reflects reinvested dividends net of withholding taxes, but reflects no deductions for expenses or other taxes; returns are calculated applying dividend withholding rates applicable to non-resident persons who do not benefit from double taxation treaties.
net asset value (NAV) The value of one share of a fund. NAV is calculated by taking the fund’s total assets, subtracting liabilities, and dividing by the number of shares outstanding.
NAV return The return based on the change in NAV of the fund over a given time period. NAV returns assume that dividends and capital gain distributions have been reinvested in the fund.
offer (ask) The lowest price at which an individual is willing to sell a security.
open The price at which a security opened for trading on a given day.
outstanding shares, shares outstanding When speaking of the fund, indicates all shares currently held by investors.
price-to-book ratio (P/B) The market price of a company’s stock compared with its “book value.” A mutual fund’s P/B is the weighted average of the P/B of all stocks in the fund’s portfolio.
price-to-earnings ratio (P/E) The market price of a company’s stock compared with earnings over the past year. A mutual fund’s P/E is the weighted average of the P/E of all stocks in the fund’s portfolio.
primary market The market that deals with the issuance of new securities.
rights and warrants Rights and warrants are types of securities that entitle the holder to purchase a proportionate amount of common stock at a specified price for a specific period of time. Rights allow a shareholder to buy more shares directly from the company, usually at a
price somewhat lower than the current market price of the outstanding shares. Warrants are usually issued with bonds and preferred stock. Rights and warrants can trade on the market separately from the company’s stock. The prices of rights and warrants do not necessarily move parallel to the prices of the underlying common stock. Rights usually expire within a few weeks of issuance, while warrants may not expire for several years. If a right or warrant is not exercised within the specified time period, it will become worthless and a fund will lose the purchase price it paid for the right or warrant and the right to purchase the underlying security.
Russell 1000 Index An index that measures the performance of the 1,000 largest companies in the Russell 3000 Index, and represents approximately 92% of the total market capitalization of the Russell 3000 Index. The Russell 3000 Index measures the performance of the largest 3,000 U.S. companies representing approximately 98% of the investable U.S. equity market.
Russell 2000 Index An index that measures the performance of the 2,000 smallest companies in the Russell 3000 Index. The Russell 3000 Index measures the performance of the largest 3,000 U.S. companies representing approximately 98% of the investable U.S. equity market.
S&P 500 Index An index that is designed to measure the performance of 500 leading publicly traded companies from a broad range of industries.
Schwab 1000 Index A float-adjusted market capitalization weighted index developed by Charles Schwab & Co., Inc. that represents the performance of the largest 1,000 publicly traded companies in the United States. As a result of corporate actions, the index may be comprised of more or less than 1,000 securities.
SEC yield A standard yield calculation developed by the Securities and Exchange Commission (SEC) that allows for fairer comparisons of bond funds. It is based on the most recent 30-day period covered by the fund’s filings with the SEC. The yield figure reflects the dividends and interest earned during the period, after the deduction of the fund’s expenses. This is also referred to as the “standardized yield.”
sampling If a fund uses a sampling method, the fund will not fully replicate the benchmark index and may hold securities not included in the index. A fund that utilizes a sampling approach may not track the return of the index.
secondary market The market in which investors purchase securities from other investors rather than directly from the issuing companies. Organized exchanges facilitate the trading of securities in the secondary market.
spread The gap between bid and ask prices of a security.
stock A share of ownership, or equity, in the issuing company.
total return The percentage that an investor would have earned or lost on an investment in the fund assuming dividends and distributions were reinvested.
tracking error The difference between the performance of the fund and its benchmark index, positive or negative.
158Schwab U.S. Equity ETFs | Annual Report
Schwab ETFs
Schwab ETFs are designed to serve as simple low-cost core investment products for a diversified portfolio. These ETFs seek to provide consistent, repeatable performance through a variety of investment strategies that span the equity and fixed income spectrum. The list below shows all currently available Schwab ETFs.
Investors should carefully consider information contained in the prospectus, or if available, the summary prospectus, including investment objectives, risks, charges and expenses before investing. Please call 1-877-824-5615 for a prospectus for any Schwab ETF. Please read the prospectus carefully before you invest. This report must be preceded or accompanied by a current prospectus.
Proxy Voting Policies, Procedures and Results
A description of the proxy voting policies and procedures used to determine how to vote proxies on behalf of the funds is available without charge, upon request, by visiting the Schwab ETFs’ website at www.schwabassetmanagement.com/schwabetfs_prospectus, the SEC’s website at www.sec.gov, or by contacting Schwab ETFs at 1-877-824-5615.
Information regarding how a fund voted proxies relating to portfolio securities during the most recent twelve-month period ended June 30 is available, without charge, by visiting the fund’s website at www.schwabassetmanagement.com/schwabetfs_prospectus or the SEC’s website at www.sec.gov.
Schwab ETFs
U.S. ETFs
Schwab U.S. Broad Market ETF
Schwab 1000 Index® ETF
Schwab U.S. Large-Cap ETF
Schwab U.S. Large-Cap Growth ETF
Schwab U.S. Large-Cap Value ETF
Schwab U.S. Mid-Cap ETF
Schwab U.S. Small-Cap ETF
Schwab U.S. Dividend Equity ETF
Schwab U.S. REIT ETF
International ETFs
Schwab International Dividend Equity ETF
Schwab International Equity ETF
Schwab International Small-Cap Equity ETF
Schwab Emerging Markets Equity ETF
Fixed-Income ETFs
Schwab U.S. TIPS ETF
Schwab Short-Term U.S. Treasury ETF
Schwab Intermediate-Term U.S. Treasury ETF
Schwab Long-Term U.S. Treasury ETF
Schwab U.S. Aggregate Bond ETF
Schwab 1-5 Year Corporate Bond ETF
Schwab 5-10 Year Corporate Bond ETF
Schwab Municipal Bond ETF
Schwab High Yield Bond ETF
Fundamental Index* ETFs
Schwab Fundamental U.S. Broad Market Index ETF
Schwab Fundamental U.S. Large Company Index ETF
Schwab Fundamental U.S. Small Company Index ETF
Schwab Fundamental International Large Company Index ETF
Schwab Fundamental International Small Company Index ETF
Schwab Fundamental Emerging Markets Large Company
Index ETF
Active, Semi-Transparent (Also Known As Non-Transparent) ETF
Schwab Ariel ESG ETF
Thematic ETFs
Schwab Crypto Thematic ETF
Investment Adviser
Charles Schwab Investment Management, Inc., dba Schwab Asset Management
211 Main Street, San Francisco, CA 94105
Schwab ETFs
1-877-824-5615
© 2023 Charles Schwab Investment Management, Inc., dba Schwab Asset Management. All rights reserved.
Printed on recycled paper.
*
FUNDAMENTAL INDEX is a registered trademark of Research Affiliates LLC.
The Schwab Ariel ESG ETF is different from traditional ETFs. Traditional ETFs tell the public what assets they hold each day. This fund will not. This may create additional risks for your investment. For example:
•
You may have to pay more money to trade the fund’s shares. This fund will provide less information to traders, who tend to charge more for trades when they have less information.
•
The price you pay to buy fund shares on an exchange may not match the value of the fund’s portfolio. The same is true when you sell shares. These price differences may be greater for this fund compared to other ETFs because it provides less information to traders.
•
These additional risks may be even greater in bad or uncertain market conditions.
•
The ETF will publish on its website each day a “Proxy Portfolio” designed to help trading in shares of the ETF. While the Proxy Portfolio includes some of the ETF’s holdings, it is not the ETF’s actual portfolio.
The differences between this fund and other ETFs may also have advantages. By keeping certain information about the fund secret, this fund may face less risk that other traders can predict or copy its investment strategy. This may improve the fund’s performance. If other traders are able to copy or predict the fund’s investment strategy, however, this may hurt the fund’s performance.
For additional information regarding the unique attributes and risks of the fund, see Proxy Portfolio Risk, Premium/Discount Risk, Trading Halt Risk, Authorized Participant Concentration Risk, Tracking Error Risk and Shares of the Fund May Trade at Prices Other Than NAV in the Principal Risks and Proxy Portfolio and Proxy Overlap sections of the prospectus and/or the Statement of Additional Information. These risks are discussed on the next page.
Active semi-transparent (also referred to as non-transparent) ETFs operate differently from other exchange-traded funds (ETFs). Unlike other ETFs, an active semi-transparent ETF does not publicly disclose its entire portfolio composition each business day, which may affect the price at which shares of the ETF trade in the secondary market. Active semi-transparent ETFs have limited public trading history. There can be no assurance that an active trading market will develop, be maintained or operate as intended. There is a risk that the market price of an active semi-transparent ETF may vary significantly from the ETF’s net asset value and that its shares may trade at a wider bid/ask spread and, therefore, cost investors more to trade than shares of other ETFs. These risks are heightened during periods of market disruption or volatility.
Proxy Portfolio Risk: Unlike traditional ETFs, this fund does not disclose its portfolio holdings (Actual Portfolio) daily. The fund instead posts a Proxy Portfolio on its website each day. The Proxy Portfolio is designed to reflect the economic exposures and risk characteristics of the fund’s actual holdings on each trading day, but it is not the same as the fund’s Actual Portfolio. Although the Proxy Portfolio is intended to provide investors with enough information to allow for an effective arbitrage mechanism that will keep the market price of the Fund at or close to the underlying NAV per Share of the Fund, there is a risk (which may increase during periods of market disruption or volatility) that market prices will vary significantly from the underlying NAV of the fund. ETF trading on the basis of a published Proxy Portfolio may trade at a wider bid/ask spread than ETFs that publish their portfolios on a daily basis, especially during periods of market disruption or volatility, and therefore may cost investors more to trade. Also, while the Fund seeks to benefit from keeping its portfolio information secret, market participants may attempt to use the Proxy Portfolio to identify a Fund’s trading strategy, which if successful, could result in such market participants engaging in certain predatory trading practices that may have the potential to harm the Fund and its shareholders.
Proxy Portfolio Construction: The Proxy Portfolio is designed to recreate the daily performance of the Actual Portfolio. This is achieved by performing a “Factor Model” analysis of the Actual Portfolio. The Factor Model is comprised of three sets of factors or analytical metrics: market-based factors, fundamental factors, and industry/sector factors. The fund uses a “Model Universe” to generate its Proxy Portfolio. The Model Universe is comprised of securities that the fund can purchase and will be a financial index or stated portfolio of securities from which fund investments will be selected. The results of the Factor Model analysis are then applied to the Model Universe. The Proxy Portfolio is then generated as a result of this Model Universe analysis with the Proxy Portfolio being a small sub-set of the Model Universe. The Factor Model is applied to both the Actual Portfolio and the Model Universe to construct the fund’s Proxy Portfolio that performs in a manner substantially identical to the performance of its Actual Portfolio. The Proxy Portfolio will only include investments the fund is permitted to hold. The fund’s SAI contains more information on the Proxy Portfolio and its construction.
Proxy Portfolio and Proxy Overlap Information regarding the contents of the Proxy Portfolio, and the percentage weight overlap between the holdings of the Proxy Portfolio and the fund’s Actual Portfolio holdings that formed the basis for its calculation of NAV at the end of the prior Business Day (the Portfolio Overlap), is available by visiting the fund’s website www.schwabassetmanagement.com.
Because environmental, social and governance (ESG) strategies exclude some securities, ESG-focused products may not be able to take advantage of the same opportunities or market trends as products that do not use such strategies. Additionally, the criteria used to select companies for investment may result in investing in securities, industries or sectors that underperform the market as a whole.
This page is intentionally left blank.
Annual Report | August 31, 2023
Schwab High Yield Bond ETF
Ticker Symbol SCYB
This page is intentionally left blank.
Fund investment adviser: Charles Schwab Investment Management, Inc., dba Schwab Asset ManagementTM
Distributor: SEI Investments Distribution Co. (SIDCO)
Schwab High Yield Bond ETF | Annual Report1
Schwab High Yield Bond ETF
The performance data quoted represents past performance. Past performance does not guarantee future results. Investment returns and principal value of an investment will fluctuate so that an investor’s shares, when sold or redeemed, may be worth more or less than the original cost. Current performance may be lower or higher than the performance data quoted. To obtain performance information current to the most recent month end, please visit www.schwabassetmanagement.com/schwabetfs_prospectus.
Total Returns for the 12 Months Ended August 31, 2023 |
Schwab High Yield Bond ETF (Ticker Symbol: SCYB) | |
| |
| |
ICE BofA US Cash Pay High Yield Constrained Index | |
ETF Category: Morningstar High Yield Bond2 | |
| |
All total returns on this page assume dividends and distributions were reinvested. Index figures do not include trading and management costs, which would lower performance. Indices are unmanaged and cannot be invested in directly. Performance results less than one year are not annualized.
For index definitions, please see the Glossary.
Performance does not reflect the deduction of taxes that a shareholder would pay on fund distributions or on the redemption or sale of fund shares.
Shares are bought and sold at market price, which may be higher or lower than the net asset value (NAV). Brokerage commissions will reduce returns.
Fixed-income securities are subject to increased loss of principal during periods of rising interest rates. An investment in the fund(s) is not insured or guaranteed by the Federal Deposit Insurance Corporation (FDIC) or any other government agency.
High-yield securities and unrated securities of similar credit quality (junk bonds) are subject to greater levels of credit and liquidity risks and may be more volatile than higher-rated securities. High-yield securities are considered predominately speculative with respect to the issuer’s continuing ability to make principal and interest payments.
“ICE®” is a registered trademark of ICE Data Indices, LLC or its affiliates and “BofA®” is a registered trademark of Bank of America Corporation licensed by Bank of America Corporation and its affiliates (“BofA”) and may not be used without BofA’s prior written approval. These trademarks have been licensed, along with the ICE BofA US Cash Pay High Yield Constrained Index (“Index”) for use by Charles Schwab Investment Management, Inc., dba Schwab Asset Management, in connection with the Schwab High Yield Bond ETF. The Schwab High Yield Bond ETF is not sponsored, endorsed, sold or promoted by ICE Data Indices, LLC, its affiliates or its Third Party Suppliers (“ICE Data and its Suppliers”). ICE Data and its Suppliers make no representations or warranties regarding the advisability of investing in the Schwab High Yield Bond ETF.
*
Total returns shown are since the fund’s inception date of July 11, 2023.
1
ETF performance must be shown based on both a Market Price and a NAV basis. The fund’s per share NAV is the value of one share of the fund. NAV is calculated by taking the fund’s total assets (including the fair value of securities owned), subtracting liabilities, and dividing by the number of shares outstanding. The NAV Return is based on the NAV of the fund, and the Market Price Return is based on the market price per share of the fund. The price used to calculate market return (Market Price) is determined using the Official Closing Price of the primary stock exchange (generally, 4:00 p.m. Eastern time) and may not represent the returns you would receive if shares were traded at other times. Market Price and NAV returns assume that dividends and capital gain distributions have been reinvested in the fund at Market Price and NAV, respectively.
2
Source for category information: Morningstar, Inc. The Morningstar Category return represents all passively- and actively-managed ETFs and mutual funds within the category as of the report date.
2Schwab High Yield Bond ETF | Annual Report
Schwab High Yield Bond ETF
The Investment Environment
For the reporting period of July 11, 2023* through August 31, 2023, the ongoing war between Russia and Ukraine weighed on the global economy, but the U.S. economy continued to show unexpected resiliency. Inflation remained elevated—although down significantly from recent highs—and the U.S. Federal Reserve (Fed) continued to raise interest rates, driving yields on taxable bonds up and resulting in negative returns for most U.S. fixed-income markets. (Bond yields and bond prices typically move in opposite directions.) For the reporting period, the ICE BofA US Cash Pay High Yield Constrained Index, which tracks the performance of publicly issued U.S. dollar–denominated below-investment grade corporate debt, returned 2.15%
There were a few short-lived yet market-moving events in the first eight months of 2023. The failure of three U.S. regional banks in early March raised concerns about the stability of the banking sector. In addition, debt ceiling negotiations during the second quarter of 2023 created fear that the federal government could default on its obligations and on August 1, 2023, Fitch Ratings downgraded long-term U.S. debt from AAA to AA+ after indicating earlier in the year that a country refusing to pay its debts in a timely way was not entitled to a AAA rating. Among fixed-income markets, high-yield bonds were among the strongest performers. Lower-quality bonds—particularly distressed bonds—outperformed higher-quality bonds. Credit spreads on high-yield bonds generally tightened during the reporting period.
The U.S. economy continued to show unexpected resilience. U.S. gross domestic product (GDP) remained positive for first and second quarters of 2023. Inflation generally declined throughout 2023, though it remained above the Fed’s historical 2% target and rose slightly in July and August. Consumer spending remained strong as consumers continued to spend down the significant savings they accumulated during the COVID-19 pandemic. The unemployment rate remained low despite inflationary pressures. However, unemployment unexpectedly jumped in August largely as a result of an increase in the labor force participation rate (the proportion of working-age Americans who have a job or are looking for one) which rose to its highest level since February 2020, just prior to the COVID-19 pandemic declaration.
Yields of U.S. Treasury Securities: Effective Yields of Three-Month, Two-Year and 10-Year Treasuries
Index figures assume dividends and distributions were reinvested. Index figures do not include trading and management costs, which would lower performance. Indices are unmanaged and cannot be invested in directly. Performance results less than one year are not annualized. Past performance is not an indication of future results.
For index definitions, please see the Glossary.
Data source: Bloomberg L.P.
Nothing in this report represents a recommendation of a security by the investment adviser.
Management views may have changed since the report date.
*
The fund’s inception date. Inception represents the date that the shares began trading in the secondary market.
Schwab High Yield Bond ETF | Annual Report3
Schwab High Yield Bond ETF
The Investment Environment (continued)
In its efforts to lower inflation, the Fed raised interest rates by 0.25% in July supported by consumer spending and a tight labor market, its eleventh upward move since it began raising rates in March of 2022. The federal funds rate ended the reporting period in a range of 5.25% to 5.50%. The Fed also maintained its program to reduce the assets held on its balance sheet. Central banks outside the United States also continued to battle with persistently high inflation. After eight interest rate hikes since July 2022, the European Central Bank raised its interest rate once during the period, matching its previous high in 2000. Similarly, the Bank of England raised its rate once during the period, also following numerous previous rate hikes, bringing borrowing costs to a 15-year high. In contrast, the Bank of Japan continued to uphold its short-term interest rate target of -0.1%, unchanged since 2016, despite inflationary pressures.
4Schwab High Yield Bond ETF | Annual Report
Schwab High Yield Bond ETF
| Matthew Hastings, CFA, Managing Director and Head of Taxable Bond Strategies for Schwab Asset Management, is responsible for the day-to-day co-management of the fund. Mr. Hastings leads the portfolio management team for the Schwab Taxable Bond Funds and Schwab Fixed-Income ETFs. He also has overall responsibility for all aspects of the management of the funds. Prior to joining Schwab in 1999, Mr. Hastings was in fixed-income sales and trading at Lehman Brothers. He has worked in the fixed-income securities industry since 1996. |
| Ryan Hook, CFA, Senior Portfolio Manager for Schwab Asset Management, is responsible for the day-to-day co-management of the fund. Prior to joining Schwab in 2022, Mr. Hook spent nearly two years as a Portfolio Strategist at Capital Group, where he was responsible for managing high yield institutional mandates. Prior to that, he spent 14 years at Goldman Sachs working mainly in high yield portfolio construction and trading, as well as product management. |
| Steven Hung, Senior Portfolio Manager for Schwab Asset Management, is responsible for the day-to-day co-management of the fund. He is primarily responsible for the management and oversight of corporate bonds within the taxable bond strategies, with additional responsibility for managing municipal bond index strategies. Mr. Hung has been a portfolio manager with Schwab Asset Management since 2005 and prior to that, served in various roles as an associate portfolio manager and trader since 1999. In 1998, he joined Schwab’s management training program and worked as a clerk on the options trading floor of the Pacific Coast Stock Exchange. |
Schwab High Yield Bond ETF | Annual Report5
Schwab High Yield Bond ETF
The Schwab High Yield Bond ETF’s (the fund) goal is to track as closely as possible, before fees and expenses, the total return of an index that measures the performance of U.S. dollar denominated below investment grade corporate debt. To pursue its goal, the fund generally invests in securities that are included in the ICE BofA US Cash Pay High Yield Constrained Index. ICE BofA US Cash Pay High Yield Constrained Index tracks the performance of U.S. dollar denominated below investment grade corporate debt (junk bonds), currently in a coupon paying period, that is publicly issued in the U.S. domestic market. For more information about the fund’s investment objective, strategy, and risks, please see the fund’s prospectus.
Market Highlights. For the reporting period of July 11, 2023* through August 31, 2023, the ongoing war between Russia and Ukraine weighed on the global economy, but the U.S. economy continued to show unexpected resiliency. Inflation remained elevated—although down significantly from recent highs—and the U.S. Federal Reserve (Fed) continued to raise interest rates, driving yields on taxable bonds up and resulting in negative returns for most U.S. fixed-income markets. (Bond yields and bond prices typically move in opposite directions.) In its efforts to lower inflation, the Fed raised interest rates by 0.25% in July, its eleventh upward move since it began raising rates in March of 2022. The federal funds rate ended the reporting period in a range of 5.25% to 5.50%.
There were a few short-lived yet market-moving events in the first eight months of 2023. The failure of three U.S. regional banks in early March raised concerns about the stability of the banking sector. In addition, debt ceiling negotiations during the second quarter of 2023 created fear that the federal government could default on its obligations and on August 1, 2023, Fitch Ratings downgraded long-term U.S. debt from AAA to AA+ after indicating earlier in the year that a country refusing to pay its debts in a timely way was not entitled to a AAA rating. Among fixed-income markets, high-yield bonds were among the strongest performers. Lower-quality bonds—particularly distressed bonds—outperformed higher-quality bonds. Credit spreads on high-yield bonds generally tightened during the reporting period.
Performance. During the reporting period of July 11, 2023 (the fund’s inception date*), through August 31, 2023, the fund generally tracked the performance of the index. For the reporting period, the fund’s market price and NAV returns were 2.04% (for an explanation of market price and NAV returns, please refer to footnote 2 on the following page). The index returned 2.15% during the same period. Of the fund’s return, slightly more than half came from price appreciation, with the remainder coming from income. Differences between the return of the fund and the return of the index may be attributable to, among other things, the operational and transactional costs incurred by the fund and not the index.
*
Inception represents the date that the shares began trading in the secondary market.
Portfolio Composition % of Investments1
By Security Type
Weighted Average Maturity3 | |
Weighted Average Duration3 | |
Management views and portfolio holdings may have changed since the report date.
An index is a statistical composite of a specified financial market or sector. Unlike the fund, an index does not actually hold a portfolio of securities and its return is not inclusive of operational and transaction costs incurred by the fund.
Fixed-income securities are subject to increased loss of principal during periods of rising interest rates. An investment in the fund is not insured or guaranteed by the Federal Deposit Insurance Corporation (FDIC) or any other government agency.
High-yield securities and unrated securities of similar credit quality (junk bonds) are subject to greater levels of credit and liquidity risks and may be more volatile than higher-rated securities. High-yield securities are considered predominately speculative with respect to the issuer’s continuing ability to make principal and interest payments.
1
The percentage may differ from the Portfolio Holdings because the above calculation is based on a percentage of total investments, whereas the calculation in the Portfolio Holdings is based on a percentage of net assets.
2
Includes the fund’s position(s) in money market mutual funds registered under the Investment Company Act of 1940, as amended.
3
See Glossary for definitions of maturity and duration.
6Schwab High Yield Bond ETF | Annual Report
Schwab High Yield Bond ETF
Performance and Fund Facts as of August 31, 2023
The performance data quoted represents past performance. Past performance does not guarantee future results. Investment returns and principal value of an investment will fluctuate so that an investor’s shares, when sold or redeemed, may be worth more or less than the original cost. Current performance may be lower or higher than the performance data quoted. To obtain performance information current to the most recent month end, please visit www.schwabassetmanagement.com/schwabetfs_prospectus.
Performance of Hypothetical $10,000 Investment (July 11, 2023 – August 31, 2023)1
Average Annual Total Returns1
| |
Fund: Schwab High Yield Bond ETF (7/11/23) | |
| |
| |
ICE BofA US Cash Pay High Yield Constrained Index | |
ETF Category: Morningstar High Yield Bond3 | |
Fund Expense Ratio4: 0.03% |
All total returns on this page assume dividends and distributions were reinvested. Index figures do not include trading and management costs, which would lower performance. Indices are unmanaged and cannot be invested in directly. Performance results less than one year are not annualized.
For index definitions, please see the Glossary.
Shares are bought and sold at market price, which may be higher or lower than the net asset value (NAV). Brokerage commissions will reduce returns.
“ICE®” is a registered trademark of ICE Data Indices, LLC or its affiliates and “BofA®” is a registered trademark of Bank of America Corporation licensed by Bank of America Corporation and its affiliates (“BofA”) and may not be used without BofA’s prior written approval. These trademarks have been licensed, along with the ICE BofA US Cash Pay High Yield Constrained Index (“Index”) for use by Charles Schwab Investment Management, Inc., dba Schwab Asset Management, in connection with the Schwab High Yield Bond ETF. The Schwab High Yield Bond ETF is not sponsored, endorsed, sold or promoted by ICE Data Indices, LLC, its affiliates or its Third Party Suppliers (“ICE Data and its Suppliers”). ICE Data and its Suppliers make no representations or warranties regarding the advisability of investing in the Schwab High Yield Bond ETF.
*
Inception (7/11/23) represents the date that the shares began trading in the secondary market.
1
Performance does not reflect the deduction of taxes that a shareholder would pay on fund distributions or on the redemption or sale of fund shares.
2
ETF performance must be shown based on both a Market Price and a NAV basis. The fund’s per share NAV is the value of one share of the fund. NAV is calculated by taking the fund’s total assets (including the fair value of securities owned), subtracting liabilities, and dividing by the number of shares outstanding. The NAV Return is based on the NAV of the fund, and the Market Price Return is based on the market price per share of the fund. The price used to calculate market return (Market Price) is determined using the Official Closing Price of the primary stock exchange (generally, 4:00 p.m. Eastern time) and may not represent the returns you would receive if shares were traded at other times. NAV is used as a proxy for purposes of calculating Market Price Return on inception date. Market Price and NAV returns assume that dividends and capital gain distributions have been reinvested in the fund at Market Price and NAV, respectively.
3
Source for category information: Morningstar, Inc. The Morningstar Category return represents all passively- and actively-managed ETFs and mutual funds within the category as of the report date.
4
As stated in the prospectus. Effective September 25, 2023, the management fee was reduced from 0.10% to 0.03%. For more information, see financial note 4 or refer to the prospectus.
Schwab High Yield Bond ETF | Annual Report7
Schwab High Yield Bond ETF
Fund Expenses (Unaudited)
Examples for a $1,000 Investment
As a fund shareholder, you may incur two types of costs: (1) transaction costs, including brokerage commissions on purchases and sales of fund shares; and, (2) ongoing costs, including management fees.
The expense examples below are intended to help you understand your ongoing cost (in dollars) of investing in the fund and to compare this cost with the ongoing cost of investing in other mutual funds. These examples are based on an investment of $1,000 invested for six months beginning March 1, 2023 and held through August 31, 2023.
The Actual Return line in the table below provides information about actual account values and actual expenses. You may use this information, together with the amount you invested, to estimate the expenses that you paid over the period. To do so, simply divide your account value by $1,000 (for example, an $8,600 account value ÷ $1,000 = 8.6), then multiply the result by the number given for the fund under the heading entitled “Expenses Paid During Period.”
The Hypothetical Return line in the table below provides information about hypothetical account values and hypothetical expenses based on the fund’s actual expense ratio and an assumed return of 5% per year before expenses. Because the return used is not an actual return, it may not be used to estimate the actual ending account value or expenses you paid for the period.
You may use this information to compare the ongoing costs of investing in the fund and other funds. To do so, compare this 5% hypothetical example with the 5% hypothetical examples that appear in the shareholder reports of the other funds.
Please note that the expenses shown in the table are meant to highlight your ongoing costs only and do not reflect any transactional costs, including any brokerage commissions you may pay when purchasing or selling shares of a fund. Therefore, the hypothetical return line of the table is useful in comparing ongoing costs only and will not help you determine the relative total costs of owning different funds. In addition, if these transactional costs were included, your costs would have been higher.
| | BEGINNING
ACCOUNT VALUE
AT 3/1/23 | ENDING
ACCOUNT VALUE
(NET OF EXPENSES)
| EXPENSES PAID
DURING PERIOD
|
Schwab High Yield Bond ETF | | | | |
| | | | |
| | | | |
| The expense ratio provided for the fund is for the period from 7/11/23 (commencement of operations) through 8/31/23 (see financial note 4 for additional information). |
| Actual expenses for the fund are equal to its annualized expense ratio, multiplied by the average account value over the period, multiplied by 52 days in the period from commencement of operations on 7/11/23 through 8/31/23, and divided by 365 days in the fiscal year. Hypothetical expenses for the fund are equal to its annualized expense ratio, multiplied by the average account value over the period, multiplied by 184 days in the period, and divided by 365 days in the fiscal year. |
8Schwab High Yield Bond ETF | Annual Report
Schwab High Yield Bond ETF
Financial Statements
| | | | | | |
|
Net asset value at beginning of period | | | | | | |
Income (loss) from investment operations: | | | | | | |
Net investment income (loss)2 | | | | | | |
Net realized and unrealized gains (losses) | | | | | | |
Total from investment operations | | | | | | |
Net asset value at end of period | | | | | | |
| | | | | | |
|
Ratios to average net assets: | | | | | | |
| | | | | | |
Net investment income (loss) | | | | | | |
| | | | | | |
Net assets, end of period (x 1,000) | | | | | | |
| Commencement of operations. |
| Calculated based on the average shares outstanding during the period. |
| |
| |
| Portfolio turnover rate excludes securities received or delivered from processing of in-kind creations or redemptions. |
Schwab High Yield Bond ETF | Annual Report9
Schwab High Yield Bond ETF
Portfolio Holdings as of August 31, 2023
This section shows all the securities in the fund’s portfolio and their values as of the report date.
The fund files its complete schedule of portfolio holdings with the U.S. Securities and Exchange Commission (SEC) for the first and third quarters of each fiscal year on Form N-PORT Part F. The fund’s Form N-PORT Part F is available on the SEC’s website at www.sec.gov. You can also obtain this information at no cost on the fund’s website at www.schwabassetmanagement.com/schwabetfs_prospectus, by calling 1-866-414-6349, or by sending an email request to orders@mysummaryprospectus.com. The fund also makes available its complete schedule of portfolio holdings on a daily basis on the fund’s website.
All securities are currently in a fixed rate coupon period based on index eligibility requirements and the fund’s investment objective. Generally, for fixed rate securities, the rate shown is the interest rate that was established when the security was issued. Variable rate securities are subject to index requirements and will be removed from the index and fund prior to converting from a fixed rate coupon to a variable rate coupon. The maturity date shown for all the securities is the final legal maturity.
SECURITY RATE, MATURITY DATE | | |
CORPORATES 95.9% OF NET ASSETS |
|
Financial Institutions 9.6% |
|
|
| | |
|
| | |
|
| | |
|
| | |
|
| | |
| | |
Brokerage/Asset Managers/Exchanges 0.7% |
AG TTMT Escrow Issuer LLC |
| | |
|
| | |
Compass Group Diversified Holdings LLC |
| | |
|
| | |
|
| | |
| | |
|
Curo Group Holdings Corp. |
| | |
|
| | |
Fortress Transportation & Infrastructure Investors LLC |
| | |
| | |
|
| | |
|
| | |
|
| | |
|
| | |
Macquarie Airfinance Holdings Ltd. |
| | |
SECURITY RATE, MATURITY DATE | | |
|
| | |
| | |
| | |
| | |
|
| | |
| | |
| | |
| | |
PennyMac Financial Services, Inc. |
| | |
| | |
|
| | |
Rocket Mortgage LLC/Rocket Mortgage Co-Issuer, Inc. |
| | |
|
| | |
United Wholesale Mortgage LLC |
| | |
| | |
|
Burford Capital Global Finance LLC |
| | |
|
| | |
Five Point Operating Co. LP/Five Point Capital Corp. |
| | |
Icahn Enterprises LP/Icahn Enterprises Finance Corp. |
| | |
| | |
| | |
|
| | |
Nationstar Mortgage Holdings, Inc. |
| | |
| | |
| | |
|
| | |
|
| | |
| | |
|
| | |
| | |
10Schwab High Yield Bond ETF | Annual Report
Schwab High Yield Bond ETF
Portfolio Holdings as of August 31, 2023 (continued)
SECURITY RATE, MATURITY DATE | | |
|
Acrisure LLC/Acrisure Finance, Inc. |
| | |
| | |
Alliant Holdings Intermediate LLC/Alliant Holdings Co-Issuer |
| | |
| | |
| | |
|
| | |
|
| | |
BroadStreet Partners, Inc. |
| | |
|
| | |
|
| | |
| | |
Jones Deslauriers Insurance Management, Inc. |
| | |
Liberty Mutual Group, Inc. |
| | |
|
| | |
|
| | |
|
| | |
|
| | |
| | |
|
Apollo Commercial Real Estate Finance, Inc. |
| | |
Blackstone Mortgage Trust, Inc. |
| | |
Brookfield Property REIT, Inc./BPR Cumulus LLC/BPR Nimbus LLC/GGSI Sellco LL |
| | |
| | |
Diversified Healthcare Trust |
| | |
| | |
HAT Holdings I LLC/HAT Holdings II LLC |
| | |
Ladder Capital Finance Holdings LLLP/Ladder Capital Finance Corp. |
| | |
| | |
MPT Operating Partnership LP/MPT Finance Corp. |
| | |
| | |
| | |
Office Properties Income Trust |
| | |
Park Intermediate Holdings LLC/PK Domestic Property LLC/PK Finance Co-Issuer |
| | |
| | |
RHP Hotel Properties LP/RHP Finance Corp. |
| | |
| | |
SECURITY RATE, MATURITY DATE | | |
|
| | |
|
| | |
|
| | |
| | |
| | |
Starwood Property Trust, Inc. |
| | |
| | |
The Necessity Retail REIT Inc/American Finance Operating Partner LP |
| | |
|
| | |
| | |
| | |
|
|
|
Alliance Resource Operating Partners LP/Alliance Resource Finance Corp. |
| | |
|
| | |
ASP Unifrax Holdings, Inc. |
| | |
| | |
|
| | |
| | |
|
| | |
| | |
Axalta Coating Systems LLC/Axalta Coating Systems Dutch Holding B BV |
| | |
Baffinland Iron Mines Corp./Baffinland Iron Mines LP |
| | |
Big River Steel LLC/BRS Finance Corp. |
| | |
|
| | |
| | |
|
| | |
CVR Partners LP/CVR Nitrogen Finance Corp. |
| | |
|
| | |
|
| | |
|
| | |
FMG Resources August 2006 Pty Ltd. |
| | |
| | |
| | |
| | |
|
| | |
Schwab High Yield Bond ETF | Annual Report11
Schwab High Yield Bond ETF
Portfolio Holdings as of August 31, 2023 (continued)
SECURITY RATE, MATURITY DATE | | |
Graphic Packaging International LLC |
| | |
| | |
| | |
|
| | |
|
| | |
|
| | |
|
| | |
|
| | |
Mercer International, Inc. |
| | |
|
| | |
|
| | |
| | |
Minerals Technologies, Inc. |
| | |
|
| | |
|
| | |
Nufarm Australia Ltd./Nufarm Americas, Inc. |
| | |
|
| | |
| | |
Olympus Water U.S. Holding Corp. |
| | |
|
| | |
SK Invictus Intermediate II Sarl |
| | |
|
| | |
|
| | |
| | |
| | |
Trinseo Materials Operating SCA/Trinseo Materials Finance, Inc. |
| | |
|
| | |
United States Steel Corp. |
| | |
|
| | |
| | |
|
Advanced Drainage Systems, Inc. |
| | |
Alta Equipment Group, Inc. |
| | |
American Builders & Contractors Supply Co., Inc. |
| | |
SECURITY RATE, MATURITY DATE | | |
|
| | |
Ardagh Metal Packaging Finance USA LLC/Ardagh Metal Packaging Finance plc |
| | |
Ardagh Packaging Finance plc/Ardagh Holdings USA, Inc. |
| | |
|
| | |
|
| | |
| | |
| | |
| | |
| | |
Beacon Roofing Supply, Inc. |
| | |
| | |
|
| | |
|
| | |
| | |
| | |
| | |
| | |
Builders FirstSource, Inc. |
| | |
|
| | |
|
| | |
| | |
|
| | |
| | |
Clydesdale Acquisition Holdings, Inc. |
| | |
Cornerstone Building Brands, Inc. |
| | |
|
| | |
|
| | |
Crown Americas LLC/Crown Americas Capital Corp. V |
| | |
Crown Americas LLC/Crown Americas Capital Corp. VI |
| | |
Crown Cork & Seal Co., Inc. |
| | |
Eco Material Technologies, Inc. |
| | |
Emerald Debt Merger Sub LLC |
| | |
|
| | |
|
| | |
|
| | |
Gates Global LLC/Gates Corp. |
| | |
12Schwab High Yield Bond ETF | Annual Report
Schwab High Yield Bond ETF
Portfolio Holdings as of August 31, 2023 (continued)
SECURITY RATE, MATURITY DATE | | |
|
| | |
| | |
| | |
|
| | |
H&E Equipment Services, Inc. |
| | |
|
| | |
|
| | |
|
| | |
|
| | |
| | |
|
| | |
|
| | |
| | |
Masonite International Corp. |
| | |
Mauser Packaging Solutions Holding Co. |
| | |
| | |
MIWD Holdco II LLC/MIWD Finance Corp. |
| | |
|
| | |
Mueller Water Products, Inc. |
| | |
|
| | |
|
| | |
Oscar AcquisitionCo LLC/Oscar Finance, Inc. |
| | |
|
| | |
Owens-Brockway Glass Container, Inc. |
| | |
| | |
Pactiv Evergreen Group Issuer, Inc./Pactiv Evergreen Group Issuer LLC |
| | |
Park River Holdings, Inc. |
| | |
|
| | |
PECF USS Intermediate Holding III Corp. |
| | |
|
| | |
Ritchie Bros Holdings, Inc. |
| | |
| | |
Roller Bearing Co. of America, Inc. |
| | |
|
| | |
| | |
SECURITY RATE, MATURITY DATE | | |
Smyrna Ready Mix Concrete LLC |
| | |
Specialty Building Products Holdings LLC/SBP Finance Corp. |
| | |
|
| | |
|
| | |
|
| | |
Standard Industries, Inc. |
| | |
| | |
| | |
|
| | |
Summit Materials LLC/Summit Materials Finance Corp. |
| | |
|
| | |
Titan Acquisition Ltd./Titan Co-Borrower LLC |
| | |
Titan International, Inc. |
| | |
|
| | |
| | |
| | |
| | |
| | |
Trident TPI Holdings, Inc. |
| | |
|
| | |
|
| | |
| | |
United Rentals North America, Inc. |
| | |
| | |
| | |
| | |
|
| | |
|
| | |
|
| | |
| | |
|
| | |
| | |
|
Advantage Sales & Marketing, Inc. |
| | |
Allen Media LLC/Allen Media Co-Issuer, Inc. |
| | |
|
| | |
|
| | |
Schwab High Yield Bond ETF | Annual Report13
Schwab High Yield Bond ETF
Portfolio Holdings as of August 31, 2023 (continued)
SECURITY RATE, MATURITY DATE | | |
|
| | |
| | |
Block Communications, Inc. |
| | |
|
| | |
CCO Holdings LLC/CCO Holdings Capital Corp. |
| | |
| | |
| | |
| | |
| | |
Clear Channel Outdoor Holdings, Inc. |
| | |
| | |
|
| | |
Cogent Communications Group, Inc. |
| | |
Consolidated Communications, Inc. |
| | |
|
| | |
| | |
Directv Financing LLC/Directv Financing Co-Obligor, Inc. |
| | |
|
| | |
| | |
| | |
| | |
| | |
| | |
|
| | |
|
| | |
Frontier Communications Holdings LLC |
| | |
| | |
| | |
| | |
| | |
|
| | |
|
| | |
|
| | |
|
| | |
|
| | |
| | |
Hughes Satellite Systems Corp. |
| | |
iHeartCommunications, Inc. |
| | |
| | |
| | |
|
| | |
SECURITY RATE, MATURITY DATE | | |
|
| | |
Intelsat Jackson Holdings S.A. |
| | |
|
| | |
|
| | |
| | |
| | |
|
| | |
| | |
Lions Gate Capital Holdings LLC |
| | |
|
| | |
| | |
| | |
McGraw-Hill Education, Inc. |
| | |
| | |
|
| | |
|
| | |
|
| | |
Northwest Fiber LLC/Northwest Fiber Finance Sub, Inc. |
| | |
Outfront Media Capital LLC/Outfront Media Capital Corp. |
| | |
| | |
|
| | |
| | |
|
| | |
Radiate Holdco LLC/Radiate Finance, Inc. |
| | |
| | |
|
| | |
Rogers Communications, Inc. |
| | |
|
| | |
| | |
|
| | |
Sinclair Television Group, Inc. |
| | |
| | |
|
| | |
| | |
| | |
| | |
| | |
| | |
|
| | |
14Schwab High Yield Bond ETF | Annual Report
Schwab High Yield Bond ETF
Portfolio Holdings as of August 31, 2023 (continued)
SECURITY RATE, MATURITY DATE | | |
|
| | |
| | |
| | |
Telecom Italia Capital S.A. |
| | |
| | |
| | |
Telesat Canada/Telesat LLC |
| | |
| | |
| | |
|
| | |
United States Cellular Corp. |
| | |
Uniti Group LP/Uniti Fiber Holdings, Inc./CSL Capital LLC |
| | |
Uniti Group LP/Uniti Group Finance, Inc./CSL Capital LLC |
| | |
| | |
| | |
Univision Communications, Inc. |
| | |
| | |
| | |
| | |
|
| | |
|
| | |
|
| | |
|
| | |
Virgin Media Secured Finance plc |
| | |
Vmed O2 UK Financing I plc |
| | |
|
| | |
| | |
| | |
| | |
Windstream Escrow LLC/Windstream Escrow Finance Corp. |
| | |
|
| | |
Zayo Group Holdings, Inc. |
| | |
| | |
|
| | |
| | |
|
1011778 BC ULC/New Red Finance, Inc. |
| | |
| | |
|
| | |
SECURITY RATE, MATURITY DATE | | |
Adient Global Holdings Ltd. |
| | |
| | |
|
| | |
Allied Universal Holdco LLC/Allied Universal Finance Corp. |
| | |
| | |
Allied Universal Holdco LLC/Allied Universal Finance Corp./Atlas Luxco 4 Sarl |
| | |
Allison Transmission, Inc. |
| | |
AMC Entertainment Holdings, Inc. |
| | |
American Axle & Manufacturing, Inc. |
| | |
|
| | |
|
| | |
| | |
Asbury Automotive Group, Inc. |
| | |
| | |
Ashton Woods USA LLC/Ashton Woods Finance Co. |
| | |
Aston Martin Capital Holdings Ltd. |
| | |
|
| | |
| | |
| | |
| | |
|
| | |
|
| | |
|
| | |
Brookfield Residential Properties, Inc./Brookfield Residential US LLC |
| | |
| | |
Caesars Entertainment, Inc. |
| | |
| | |
| | |
Caesars Resort Collection LLC/CRC Finco, Inc. |
| | |
|
| | |
| | |
| | |
| | |
| | |
|
| | |
Carrols Restaurant Group, Inc. |
| | |
|
| | |
|
| | |
| | |
Schwab High Yield Bond ETF | Annual Report15
Schwab High Yield Bond ETF
Portfolio Holdings as of August 31, 2023 (continued)
SECURITY RATE, MATURITY DATE | | |
|
| | |
|
| | |
|
| | |
|
| | |
Cedar Fair LP/Canada's Wonderland Co./Magnum Management Corp./Millennium Op |
| | |
Century Communities, Inc. |
| | |
| | |
|
| | |
| | |
|
| | |
| | |
|
| | |
Clarios Global LP/Clarios U.S. Finance Co. |
| | |
| | |
| | |
|
| | |
Cushman & Wakefield US Borrower LLC |
| | |
|
| | |
|
| | |
|
| | |
|
| | |
Evergreen Acqco 1 LP/TVI, Inc. |
| | |
Fertitta Entertainment LLC/Fertitta Entertainment Finance Co., Inc. |
| | |
| | |
|
| | |
|
| | |
| | |
| | |
| | |
| | |
| | |
| | |
Ford Motor Credit Co. LLC |
| | |
|
| | |
| | |
|
| | |
Garda World Security Corp. |
| | |
SECURITY RATE, MATURITY DATE | | |
Go Daddy Operating Co. LLC/GD Finance Co., Inc. |
| | |
|
| | |
|
| | |
|
| | |
|
| | |
| | |
Hilton Domestic Operating Co., Inc. |
| | |
| | |
Hilton Grand Vacations Borrower Escrow LLC/Hilton Grand Vacations Borrower Esc |
| | |
Hilton Worldwide Finance LLC/Hilton Worldwide Finance Corp. |
| | |
International Game Technology plc |
| | |
|
| | |
Jacobs Entertainment, Inc. |
| | |
|
| | |
|
| | |
|
| | |
| | |
LCM Investments Holdings II LLC |
| | |
|
| | |
| | |
Light & Wonder International, Inc. |
| | |
Lindblad Expeditions Holdings, Inc. |
| | |
|
| | |
Live Nation Entertainment, Inc. |
| | |
| | |
LSF9 Atlantis Holdings LLC/Victra Finance Corp. |
| | |
|
| | |
Macy's Retail Holdings LLC |
| | |
Marriott Ownership Resorts, Inc. |
| | |
Match Group Holdings II LLC |
| | |
|
| | |
Matthews International Corp. |
| | |
|
| | |
16Schwab High Yield Bond ETF | Annual Report
Schwab High Yield Bond ETF
Portfolio Holdings as of August 31, 2023 (continued)
SECURITY RATE, MATURITY DATE | | |
|
| | |
MGM Resorts International |
| | |
Midwest Gaming Borrower LLC/Midwest Gaming Finance Corp. |
| | |
Mohegan Tribal Gaming Authority |
| | |
|
| | |
|
| | |
| | |
| | |
| | |
| | |
|
| | |
NMG Holding Co., Inc./Neiman Marcus Group LLC |
| | |
|
| | |
| | |
| | |
| | |
| | |
|
| | |
Penske Automotive Group, Inc. |
| | |
| | |
|
| | |
Premier Entertainment Sub LLC/Premier Entertainment Finance Corp. |
| | |
Prime Security Services Borrower LLC/Prime Finance, Inc. |
| | |
| | |
| | |
|
| | |
| | |
| | |
| | |
|
| | |
Real Hero Merger Sub 2, Inc. |
| | |
Realogy Group LLC/Realogy Co-Issuer Corp. |
| | |
| | |
|
8.00%, 11/15/26 (a)(b)(e)(f) | | |
Royal Caribbean Cruises Ltd. |
| | |
| | |
| | |
| | |
Sally Holdings LLC/Sally Capital, Inc. |
| | |
Scientific Games Holdings LP/Scientific Games US FinCo, Inc. |
| | |
SECURITY RATE, MATURITY DATE | | |
SeaWorld Parks & Entertainment, Inc. |
| | |
Service Corp. International |
| | |
| | |
Shea Homes LP/Shea Homes Funding Corp. |
| | |
Six Flags Entertainment Corp. |
| | |
| | |
|
| | |
|
| | |
|
| | |
| | |
|
| | |
|
| | |
Taylor Morrison Communities, Inc. |
| | |
|
| | |
| | |
|
| | |
|
| | |
| | |
The Goodyear Tire & Rubber Co. |
| | |
| | |
| | |
|
| | |
|
| | |
|
| | |
|
| | |
|
| | |
| | |
|
| | |
|
| | |
|
| | |
|
| | |
| | |
|
| | |
WASH Multifamily Acquisition, Inc. |
| | |
Wolverine World Wide, Inc. |
| | |
Schwab High Yield Bond ETF | Annual Report17
Schwab High Yield Bond ETF
Portfolio Holdings as of August 31, 2023 (continued)
SECURITY RATE, MATURITY DATE | | |
|
| | |
Wyndham Hotels & Resorts, Inc. |
| | |
Wynn Las Vegas LLC/Wynn Las Vegas Capital Corp. |
| | |
| | |
Wynn Resorts Finance LLC/Wynn Resorts Capital Corp. |
| | |
| | |
|
| | |
| | |
ZF North America Capital, Inc. |
| | |
|
| | |
| | |
Consumer Non-Cyclical 11.4% |
Acadia Healthcare Co., Inc. |
| | |
|
| | |
|
| | |
|
| | |
Albertsons Cos., Inc./Safeway, Inc./New Albertsons LP/Albertsons LLC |
| | |
| | |
| | |
|
| | |
| | |
|
| | |
| | |
|
| | |
|
| | |
Bausch Health Americas, Inc. |
| | |
| | |
|
| | |
| | |
| | |
| | |
| | |
| | |
|
| | |
|
| | |
Catalent Pharma Solutions, Inc. |
| | |
| | |
|
| | |
SECURITY RATE, MATURITY DATE | | |
Charles River Laboratories International, Inc. |
| | |
Chobani LLC/Chobani Finance Corp., Inc. |
| | |
CHS/Community Health Systems, Inc. |
| | |
| | |
| | |
| | |
| | |
| | |
Coty Inc/HFC Prestige Products, Inc./HFC Prestige International US LLC |
| | |
|
| | |
Darling Ingredients, Inc. |
| | |
| | |
|
| | |
Edgewell Personal Care Co. |
| | |
| | |
Elanco Animal Health, Inc. |
| | |
|
| | |
Emergent BioSolutions, Inc. |
| | |
|
| | |
| | |
|
| | |
| | |
|
| | |
|
| | |
Global Medical Response, Inc. |
| | |
|
| | |
Heartland Dental LLC/Heartland Dental Finance Corp. |
| | |
Herbalife Nutrition Ltd./HLF Financing, Inc. |
| | |
H-Food Holdings LLC/Hearthside Finance Co., Inc. |
| | |
HLF Financing Sarl LLC/Herbalife International, Inc. |
| | |
|
| | |
|
| | |
|
| | |
Kronos Acquisition Holdings, Inc./KIK Custom Products, Inc. |
| | |
| | |
Lamb Weston Holdings, Inc. |
| | |
18Schwab High Yield Bond ETF | Annual Report
Schwab High Yield Bond ETF
Portfolio Holdings as of August 31, 2023 (continued)
SECURITY RATE, MATURITY DATE | | |
|
| | |
| | |
ModivCare Escrow Issuer, Inc. |
| | |
|
| | |
MPH Acquisition Holdings LLC |
| | |
| | |
|
| | |
| | |
Organon & Co./Organon Foreign Debt Co.-Issuer BV |
| | |
|
| | |
P&L Development LLC/PLD Finance Corp. |
| | |
Performance Food Group, Inc. |
| | |
| | |
| | |
|
| | |
| | |
| | |
|
| | |
| | |
| | |
|
| | |
Prime Healthcare Services, Inc. |
| | |
|
| | |
RegionalCare Hospital Partners Holdings, Inc./LifePoint Health, Inc. |
| | |
|
| | |
|
| | |
|
| | |
Simmons Foods, Inc./Simmons Prepared Foods, Inc./Simmons Pet Food, Inc./Simmons Feed |
| | |
|
| | |
Surgery Center Holdings, Inc. |
| | |
|
| | |
|
| | |
| | |
Tempur Sealy International, Inc. |
| | |
|
| | |
| | |
SECURITY RATE, MATURITY DATE | | |
| | |
| | |
| | |
| | |
| | |
| | |
| | |
The Scotts Miracle-Gro Co. |
| | |
| | |
| | |
|
| | |
| | |
Triton Water Holdings, Inc. |
| | |
United Natural Foods, Inc. |
| | |
US Acute Care Solutions LLC |
| | |
|
| | |
| | |
|
| | |
|
| | |
|
| | |
|
| | |
| | |
|
Aethon United BR LP/Aethon United Finance Corp. |
| | |
AmeriGas Partners LP/AmeriGas Finance Corp. |
| | |
| | |
Antero Midstream Partners LP/Antero Midstream Finance Corp. |
| | |
| | |
|
| | |
Archrock Partners LP/Archrock Partners Finance Corp. |
| | |
Ascent Resources Utica Holdings LLC/ARU Finance Corp. |
| | |
|
| | |
| | |
Blue Racer Midstream LLC/Blue Racer Finance Corp. |
| | |
|
| | |
|
| | |
| | |
| | |
| | |
California Resources Corp. |
| | |
Schwab High Yield Bond ETF | Annual Report19
Schwab High Yield Bond ETF
Portfolio Holdings as of August 31, 2023 (continued)
SECURITY RATE, MATURITY DATE | | |
|
| | |
| | |
Calumet Specialty Products Partners LP/Calumet Finance Corp. |
| | |
| | |
|
| | |
|
| | |
|
| | |
|
| | |
|
| | |
| | |
|
| | |
|
| | |
Crescent Energy Finance LLC |
| | |
Crestwood Midstream Partners LP/Crestwood Midstream Finance Corp. |
| | |
| | |
CrownRock LP/CrownRock Finance, Inc. |
| | |
|
| | |
|
| | |
| | |
Earthstone Energy Holdings LLC |
| | |
Encino Acquisition Partners Holdings LLC |
| | |
Endeavor Energy Resources LP/EER Finance, Inc. |
| | |
|
| | |
| | |
EnLink Midstream Partners LP |
| | |
| | |
| | |
EQM Midstream Partners LP |
| | |
| | |
| | |
| | |
Ferrellgas LP/Ferrellgas Finance Corp. |
| | |
Genesis Energy LP/Genesis Energy Finance Corp. |
| | |
| | |
|
| | |
Global Partners LP/GLP Finance Corp. |
| | |
|
| | |
SECURITY RATE, MATURITY DATE | | |
Hess Midstream Operations LP |
| | |
| | |
| | |
Hilcorp Energy I LP/Hilcorp Finance Co. |
| | |
| | |
Holly Energy Partners LP/Holly Energy Finance Corp. |
| | |
Howard Midstream Energy Partners LLC |
| | |
|
| | |
|
| | |
|
| | |
|
| | |
Moss Creek Resources Holdings, Inc. |
| | |
| | |
|
| | |
|
| | |
New Fortress Energy, Inc. |
| | |
| | |
NGL Energy Operating LLC/NGL Energy Finance Corp. |
| | |
NGL Energy Partners LP/NGL Energy Finance Corp. |
| | |
Nine Energy Service, Inc. |
| | |
|
| | |
|
| | |
Northriver Midstream Finance LP |
| | |
|
| | |
| | |
Oceaneering International, Inc. |
| | |
| | |
|
| | |
Patterson-UTI Energy, Inc. |
| | |
| | |
PBF Holding Co. LLC/PBF Finance Corp. |
| | |
| | |
|
| | |
Permian Resources Operating LLC |
| | |
|
| | |
20Schwab High Yield Bond ETF | Annual Report
Schwab High Yield Bond ETF
Portfolio Holdings as of August 31, 2023 (continued)
SECURITY RATE, MATURITY DATE | | |
|
| | |
| | |
|
| | |
Rockies Express Pipeline LLC |
| | |
| | |
| | |
|
| | |
| | |
|
| | |
Suburban Propane Partners LP/Suburban Energy Finance Corp. |
| | |
Summit Midstream Holdings LLC/Summit Midstream Finance Corp. |
9.00%, 10/15/26 (a)(b)(d) | | |
Sunoco LP/Sunoco Finance Corp. |
| | |
| | |
| | |
Tallgrass Energy Partners LP/Tallgrass Energy Finance Corp. |
| | |
| | |
| | |
| | |
|
| | |
|
| | |
|
| | |
| | |
| | |
| | |
USA Compression Partners LP/USA Compression Finance Corp. |
| | |
| | |
|
| | |
Venture Global Calcasieu Pass LLC |
| | |
| | |
| | |
|
| | |
| | |
|
| | |
|
| | |
| | |
|
| | |
Weatherford International Ltd. |
| | |
| | |
|
|
| | |
SECURITY RATE, MATURITY DATE | | |
|
| | |
|
| | |
Brand Industrial Services, Inc. |
| | |
Brundage-Bone Concrete Pumping Holdings, Inc. |
| | |
|
| | |
Global Infrastructure Solutions, Inc. |
| | |
|
| | |
Great Lakes Dredge & Dock Corp. |
| | |
|
| | |
|
| | |
|
| | |
|
| | |
| | |
Williams Scotsman International, Inc. |
| | |
| | |
|
|
| | |
|
| | |
|
| | |
| | |
|
| | |
|
| | |
|
| | |
Central Parent, Inc./CDK Global, Inc. |
| | |
Clarivate Science Holdings Corp. |
| | |
Cloud Software Group, Inc. |
| | |
| | |
|
| | |
CommScope Technologies LLC |
| | |
| | |
|
| | |
Conduent Business Services LLC/Conduent State & Local Solutions, Inc. |
| | |
Consensus Cloud Solutions, Inc. |
| | |
Schwab High Yield Bond ETF | Annual Report21
Schwab High Yield Bond ETF
Portfolio Holdings as of August 31, 2023 (continued)
SECURITY RATE, MATURITY DATE | | |
|
| | |
Crowdstrike Holdings, Inc. |
| | |
|
| | |
| | |
|
| | |
| | |
|
| | |
|
| | |
|
| | |
| | |
|
| | |
|
| | |
|
| | |
Iron Mountain Information Management Services, Inc. |
| | |
|
| | |
| | |
|
| | |
|
| | |
|
| | |
|
| | |
|
| | |
|
| | |
|
| | |
Paysafe Finance plc/Paysafe Holdings US Corp. |
| | |
|
| | |
|
| | |
|
| | |
Rackspace Technology Global, Inc. |
| | |
| | |
|
| | |
|
| | |
|
| | |
| | |
SECURITY RATE, MATURITY DATE | | |
|
| | |
| | |
Sensata Technologies, Inc. |
| | |
|
| | |
The Dun & Bradstreet Corp. |
| | |
|
| | |
Veritas US, Inc./Veritas Bermuda Ltd. |
| | |
|
| | |
|
| | |
|
| | |
| | |
|
| | |
|
| | |
ZoomInfo Technologies LLC/ZoomInfo Finance Corp. |
| | |
| | |
|
|
| | |
|
| | |
American Airlines Group, Inc. |
| | |
|
| | |
| | |
American Airlines, Inc./AAdvantage Loyalty IP Ltd. |
| | |
| | |
Avis Budget Car Rental LLC/Avis Budget Finance, Inc. |
| | |
|
| | |
| | |
| | |
First Student Bidco, Inc./First Transit Parent, Inc. |
| | |
Hawaiian Brand Intellectual Property Ltd./HawaiianMiles Loyalty Ltd. |
| | |
|
| | |
Spirit Loyalty Cayman Ltd./Spirit IP Cayman Ltd. |
| | |
|
| | |
| | |
|
| | |
| | |
22Schwab High Yield Bond ETF | Annual Report
Schwab High Yield Bond ETF
Portfolio Holdings as of August 31, 2023 (continued)
SECURITY RATE, MATURITY DATE | | |
VistaJet Malta Finance plc/Vista Management Holding, Inc. |
| | |
| | |
Watco Cos. LLC/Watco Finance Corp. |
| | |
|
| | |
|
| | |
| | |
| | |
|
|
|
Algonquin Power & Utilities Corp. |
| | |
|
| | |
| | |
| | |
Clearway Energy Operating LLC |
| | |
|
| | |
|
| | |
|
| | |
|
| | |
| | |
| | |
NextEra Energy Operating Partners LP |
| | |
|
| | |
| | |
|
| | |
| | |
Pattern Energy Operations LP/Pattern Energy Operations, Inc. |
| | |
|
| | |
|
| | |
SECURITY RATE, MATURITY DATE | | |
|
| | |
Terraform Global Operating LP |
| | |
TerraForm Power Operating LLC |
| | |
|
| | |
|
| | |
Vistra Operations Co. LLC |
| | |
| | |
| | |
Total Corporates
(Cost $43,857,795) | |
| | |
SHORT-TERM INVESTMENTS 2.0% OF NET ASSETS |
|
|
State Street Institutional U.S. Government Money Market Fund, Premier Class 5.28% (g) | | |
Total Short-Term Investments
(Cost $934,921) | |
Total Investments in Securities
(Cost $44,792,716) | |
| The effective maturity may be shorter than the final maturity shown because of the possibility of interim principal payments and prepayments or as the result of embedded demand features (puts or calls). |
| Securities exempt from registration under Rule 144A of the Securities Act of 1933, as amended. These securities may be resold in transactions exempt from registrations, normally to qualified institutional buyers. At the period end, the value of these amounted to $34,557,731 or 75.3% of net assets. |
| Security is in a fixed-rate coupon period. Based on index eligibility requirements and the fund’s investment objective this security will be removed from the index prior to converting to a floating rate security. |
| Step up security that pays an initial coupon rate for a set period and increased coupon rates at one or more preset intervals. Rate shown is as of period end. |
| On October 15, 2023, the issuer filed for bankruptcy. The security was subsequently sold. |
| Security is in default on interest payments. |
| The rate shown is the annualized 7-day yield. |
Schwab High Yield Bond ETF | Annual Report23
Schwab High Yield Bond ETF
Portfolio Holdings as of August 31, 2023 (continued)
The following is a summary of the inputs used to value the fund’s investments as of August 31, 2023 (see financial note 2(a) for additional information):
| QUOTED PRICES IN
ACTIVE MARKETS FOR
IDENTICAL ASSETS
(LEVEL 1) | OTHER SIGNIFICANT
OBSERVABLE INPUTS
(LEVEL 2) | SIGNIFICANT
UNOBSERVABLE INPUTS
(LEVEL 3) | |
| | | | |
| | | | |
| | | | |
| | | | |
| As categorized in the Portfolio Holdings. |
Fund investments in mutual funds are classified as Level 1, without consideration to the classification level of the underlying
securities held by the mutual funds, which could be Level 1, Level 2 or Level 3.
24Schwab High Yield Bond ETF | Annual Report
Schwab High Yield Bond ETF
Statement of Assets and Liabilities
As of August 31, 2023
|
Investments in securities, at value - unaffiliated (cost $44,792,716) | | |
| | |
| | |
| | |
| | |
| | |
|
|
| | |
| | |
| | |
| | |
|
|
Capital received from investors | | |
Total distributable earnings | | |
| | |
Schwab High Yield Bond ETF | Annual Report25
Schwab High Yield Bond ETF
Statement of Operations
For the period July 11, 2023* through August 31, 2023 |
|
Interest received from securities - unaffiliated | | |
Dividends received from securities - unaffiliated | | |
| | |
|
|
| | |
| | |
| | |
|
REALIZED AND UNREALIZED GAINS (LOSSES) |
Net realized losses on sales of securities - unaffiliated | | |
Net change in unrealized appreciation (depreciation) on securities - unaffiliated | | |
Net realized and unrealized gains | | |
Increase in net assets resulting from operations | | |
| Commencement of operations. |
26Schwab High Yield Bond ETF | Annual Report
Schwab High Yield Bond ETF
Statement of Changes in Net Assets
For the current period only
|
| |
| | |
| | |
Net change in unrealized appreciation (depreciation) | | |
Increase in net assets resulting from operations | | |
TRANSACTIONS IN FUND SHARES |
| |
| | | |
| | | |
Net transactions in fund shares | | | |
|
SHARES OUTSTANDING AND NET ASSETS |
| |
| | | |
| | | |
| | | |
| | | |
| Commencement of operations. |
Schwab High Yield Bond ETF | Annual Report27
Schwab High Yield Bond ETF
1. Business Structure of the Fund:
Schwab High Yield Bond ETF is a series of Schwab Strategic Trust (the trust), a no-load, open-end management investment company. The trust is organized as a Delaware statutory trust and is registered under the Investment Company Act of 1940, as amended (the 1940 Act). The list below shows all the operational funds in the trust as of the end of the period, including the fund discussed in this report, which is highlighted:
SCHWAB STRATEGIC TRUST (ORGANIZED JANUARY 27, 2009) |
Schwab High Yield Bond ETF | |
Schwab Municipal Bond ETF | Schwab Short-Term U.S. Treasury ETF |
Schwab U.S. Broad Market ETF | Schwab Intermediate-Term U.S. Treasury ETF |
| Schwab Long-Term U.S. Treasury ETF |
Schwab U.S. Large-Cap ETF | Schwab U.S. Aggregate Bond ETF |
Schwab U.S. Large-Cap Growth ETF | Schwab 1-5 Year Corporate Bond ETF |
Schwab U.S. Large-Cap Value ETF | Schwab 5-10 Year Corporate Bond ETF |
| Schwab Fundamental U.S. Broad Market Index ETF |
Schwab U.S. Small-Cap ETF | Schwab Fundamental U.S. Large Company Index ETF |
Schwab U.S. Dividend Equity ETF | Schwab Fundamental U.S. Small Company Index ETF |
Schwab International Dividend Equity ETF | Schwab Fundamental International Large Company Index ETF |
Schwab International Equity ETF | Schwab Fundamental International Small Company Index ETF |
Schwab International Small-Cap Equity ETF | Schwab Fundamental Emerging Markets Large Company Index ETF |
Schwab Emerging Markets Equity ETF | |
| Schwab Crypto Thematic ETF |
The fund issues and redeems shares at its net asset value per share (NAV) only in large blocks of shares (Creation Units). These transactions are usually in exchange for a basket of securities and/or an amount of cash. As a practical matter, only institutional investors who have entered into an authorized participant agreement purchase or redeem Creation Units. Except when aggregated in Creation Units, shares of the fund are not redeemable securities.
Individual shares of the fund trade on national securities exchanges and elsewhere during the trading day and can only be bought and sold at market prices throughout the trading day through a broker-dealer. Because fund shares trade at market prices rather than NAV, shares may trade at a price greater than NAV (premium) or less than NAV (discount). A chart showing the frequency at which the fund’s daily closing market price was at a discount or premium to the fund’s NAV can be found at www.schwabassetmanagement.com.
Schwab High Yield Bond ETF commenced operations on July 11, 2023.
The fund maintains its own account for purposes of holding assets and accounting, and is considered a separate entity for tax purposes. Within its account, the fund may also keep certain assets in segregated accounts, as required by securities law. The "Fund Complex" includes The Charles Schwab Family of Funds, Schwab Capital Trust, Schwab Investments, Schwab Annuity Portfolios, Schwab Strategic Trust and Laudus Trust.
2. Significant Accounting Policies:The following is a summary of the significant accounting policies the fund uses in its preparation of financial statements. The fund follows the investment company accounting and reporting guidance of the Financial Accounting Standards Board (FASB) Accounting Standard Codification Topic 946 Financial Services — Investment Companies. The accounting policies are in conformity with accounting principles generally accepted in the United States of America (GAAP).
The fund may invest in certain mutual funds, which are referred to as "underlying funds". For more information about the underlying funds’ operations and policies, please refer to those funds’ semiannual and annual reports, which are filed with the U.S. Securities and Exchange Commission (SEC) and are available on the SEC’s website at www.sec.gov.
(a) Security Valuation
Pursuant to Rule 2a-5 under the 1940 Act, the Board of Trustees (the Board) has designated authority to a Valuation Designee, the fund’s investment adviser, to make fair valuation determinations under adopted procedures, subject to Board oversight. The investment adviser has formed a Pricing Committee to administer the pricing and valuation of portfolio securities and other assets and liabilities as well as to ensure that prices used for internal purposes or provided by third parties reasonably reflect fair value. The Valuation Designee may utilize independent pricing services, quotations from securities and financial instrument dealers and other market sources to determine fair value.
28Schwab High Yield Bond ETF | Annual Report
Schwab High Yield Bond ETF
Financial Notes (continued)
2. Significant Accounting Policies (continued):
Securities held in the fund’s portfolio are valued every business day. The following valuation policies and procedures are used by the Valuation Designee to value various types of securities:
• Bonds and notes: Fixed income investments are generally valued using an evaluated price at the mid-point of the bid/ask spread provided by an approved, independent pricing service (mid-price). To determine the evaluated mid-price, a pricing service may use a variety of techniques and inputs. Techniques may include, but are not limited to, spread models that calculate an investment-specific price relative to a benchmark or yield curve models that establish a price based on yields of comparable bonds along a range of maturities. Inputs differ by valuation approach and technique, as appropriate, and examples of inputs may include, but are not limited to, interest rates, market conditions, comparable bonds, market trades, projected cash flows, credit reviews and issuer news.
• Short-term securities (60 days or less to maturity): Securities with remaining maturities of 60 days or less are generally valued at an evaluated price; however, such securities may be valued at their amortized cost if it approximates the security’s fair value.
• Mutual funds: Mutual funds are valued at their respective NAVs.
• Securities for which no quoted value is available: The Valuation Designee has adopted procedures to fair value the fund’s securities when market prices are not “readily available” or are unreliable. For example, a security may be fair valued when it’s de-listed or its trading is halted or suspended; when a security’s primary pricing source is unable or unwilling to provide a price; or when a security’s primary trading market is closed during regular market hours. Fair value determinations are made in good faith in accordance with adopted valuation procedures. The Valuation Designee considers a number of factors, including unobservable market inputs, when arriving at fair value. The Valuation Designee may employ methods such as the review of related or comparable assets or liabilities, related market activities, recent transactions, market multiples, book values, transactional back-testing, disposition analysis and other relevant information. Due to the subjective and variable nature of fair value pricing, there can be no assurance that the fund could obtain the fair value assigned to the security upon the sale of such security.
In accordance with the authoritative guidance on fair value measurements and disclosures under GAAP, the fund discloses the fair value of its investments in a hierarchy that prioritizes the significant inputs to valuation methods used to measure the fair value. The hierarchy gives the highest priority to valuations based upon unadjusted quoted prices in active markets for identical assets or liabilities (Level 1 measurements) and the lowest priority to valuations based upon unobservable inputs that are significant to the valuation (Level 3 measurements). If inputs used to measure the financial instruments fall within different levels of the hierarchy, the categorization is based on the lowest level input that is significant to the valuation. If it is determined that either the volume and/or level of activity for an asset or liability has significantly decreased (from normal conditions for that asset or liability) or price quotations or observable inputs are not associated with orderly transactions, increased analysis and Valuation Designee’s judgment will be required to estimate fair value.
The three levels of the fair value hierarchy are as follows:
• Level 1 — quoted prices in active markets for identical investments — Investments whose values are based on quoted market prices in active markets. These generally include active listed equities, mutual funds, exchange-traded funds (ETFs) and futures contracts. Mutual funds and ETFs are classified as Level 1 prices, without consideration to the classification level of the underlying securities held.
• Level 2 — other significant observable inputs (including quoted prices for similar securities, interest rates, prepayment speeds, credit risk, etc.) — Investments that trade in markets that are not considered to be active, but whose values are based on quoted market prices, dealer quotations or valuations provided by alternative pricing sources supported by observable inputs are classified as Level 2 prices. These generally include U.S. government and sovereign obligations, most government agency securities, investment-grade corporate bonds, certain mortgage products, less liquid listed equities, and state, municipal and provincial obligations.
• Level 3 — significant unobservable inputs (including the Valuation Designee’s assumptions in determining the fair value of investments) — Investments whose values are classified as Level 3 prices have significant unobservable inputs, as they may trade infrequently or not at all. When observable prices are not readily available for these securities, one or more valuation methods are used for which sufficient and reliable data is available. The inputs used in estimating the value of Level 3 prices may include the original transaction price, quoted prices for similar securities or assets in active markets, completed or pending third-party transactions in the underlying investment or comparable issuers, and changes in financial ratios or cash
Schwab High Yield Bond ETF | Annual Report29
Schwab High Yield Bond ETF
Financial Notes (continued)
2. Significant Accounting Policies (continued):
flows. Level 3 prices may also be adjusted to reflect illiquidity and/or non-transferability, with the amount of such discount estimated in the absence of market information. Assumptions used due to the lack of observable inputs may significantly impact the resulting fair value and therefore a fund’s results of operations.
The inputs or methodology used for valuing securities are not necessarily an indication of the risk associated with investing in those securities.
The levels associated with valuing the fund’s investments as of August 31, 2023, are disclosed in the fund’s Portfolio Holdings.
(b) Accounting Policies for certain Portfolio Investments (if held):
Delayed-Delivery Transactions and When-Issued Securities: The fund may transact in securities on a delayed-delivery or when-issued basis. Payment and delivery may take place after the customary settlement period for that security. The price of the underlying securities and the date when the securities will be delivered and paid for are fixed at the time the transaction is negotiated. The securities purchased on a delayed-delivery or when-issued basis are identified as such in the fund’s Portfolio Holdings, if any. The fund may receive compensation for interest forgone in the purchase of a delayed-delivery or when-issued security. Losses may arise due to changes in the value of the underlying securities or if the counterparty does not perform under the contract’s terms, or if the issuer does not issue the securities due to political, economic, or other factors. The fund complies with Rule 18f-4 under the 1940 Act, the fund operates as a limited derivatives user, with respect to purchase commitments held within the fund, portfolio securities are no longer required to be segregated as collateral with a value at least equal to the amount of a purchase commitment and the fund’s exposure is monitored under a derivatives risk management program.
(c) Security Transactions:
Security transactions are recorded as of the date the order to buy or sell the security is executed. Realized gains and losses from security transactions are based on the identified costs of the securities involved.
(d) Investment Income:
Interest income is recorded as it accrues. If the fund buys a debt security at a discount (less than face value) or a premium (more than face value), it amortizes premiums and accretes discounts from the purchase settlement date up to maturity. The fund then increases (in the case of discounts) or reduces (in the case of premiums) the income it records from the security. Certain securities may be callable (meaning that the issuer has the option to pay it off before its maturity date). The fund amortizes the premium and accretes the discount on each callable security to the security’s maturity date, except when the purchase price is higher than the call price at the security’s call date (in which case the premium is amortized to the call date). Debt securities may be placed on non-accrual status and set to accrue at a rate of interest less than the contractual coupon or have the interest receivable written off when the collection of all or a portion of interest has become doubtful.
(e) Expenses:
Pursuant to the Amended and Restated Advisory Agreement (Advisory Agreement) between the investment adviser and the trust, the investment adviser will pay the operating expenses of the fund, excluding taxes, any brokerage expenses, and extraordinary or non-routine expenses. Taxes, any brokerage expenses and extraordinary or non-routine expenses that are specific to the fund are charged directly to the fund. The Advisory Agreement excludes paying acquired fund fees and expenses, which are indirect expenses incurred by a fund through its investments in underlying funds.
(f) Distributions to Shareholders:
The fund makes distributions from net investment income, if any, monthly and from net realized capital gains, if any, once a year. To receive a distribution, you must be a registered shareholder on the record date. Distributions are paid to shareholders on the payable date.
(g) Accounting Estimates:
The accounting policies described in this report conform to GAAP. Notwithstanding this, shareholders should understand that in order to follow these principles, fund management has to make estimates and assumptions that affect the information reported in the financial statements. It’s possible that once the results are known, they may turn out to be different from these estimates and these differences may be material.
30Schwab High Yield Bond ETF | Annual Report
Schwab High Yield Bond ETF
Financial Notes (continued)
2. Significant Accounting Policies (continued):
(h) Federal Income Taxes:
The fund intends to meet federal income and excise tax requirements for regulated investment companies under subchapter M of the Internal Revenue Code, as amended. Accordingly, the fund distributes substantially all of its net investment income and net realized capital gains, if any, to its shareholders each year. As long as the fund meets the tax requirements, it is not required to pay federal income tax.
(i) Indemnification:
Under the fund’s organizational documents, the officers and trustees are indemnified against certain liabilities arising out of the performance of their duties to the fund. In addition, in the normal course of business the fund enters into contracts with its vendors and others that provide general indemnifications. The fund’s maximum exposure under these arrangements is unknown as this would involve future claims that may be made against the fund. However, based on experience, the fund expects the risk of loss attributable to these arrangements to be remote.
(j) Regulatory Update:
Effective January 24, 2023, the SEC adopted rule and form amendments to require mutual funds and ETFs to transmit concise and visually engaging streamlined annual and semiannual reports to shareholders that highlight key information deemed important for retail investors to assess and monitor their fund investments. Other information, including financial statements, will no longer appear in a streamlined shareholder report but must be available online, delivered free of charge upon request, and filed on a semiannual basis on Form N-CSR. The rule and form amendments have a compliance date of July 24, 2024. At this time, management is evaluating the impact of these rule and form amendment changes on the content of the current shareholder report and the newly created annual and semiannual streamlined shareholder reports.
3. Risk Factors:Investing in the fund may involve certain risks, as discussed in the fund’s prospectus, including, but not limited to, those described below. Any of these risks could cause an investor to lose money.
Market Risk. Financial markets rise and fall in response to a variety of factors, sometimes rapidly and unpredictably. Markets may be impacted by economic, political, regulatory and other conditions, including economic sanctions and other government actions. In addition, the occurrence of global events, such as war, terrorism, environmental disasters, natural disasters and epidemics, may also negatively affect the financial markets. As with any investment whose performance is tied to these markets, the value of an investment in the fund will fluctuate, which means that an investor could lose money over short or long periods.
Investment Style Risk. The fund is an index fund. Therefore, the fund follows the securities included in the index during upturns as well as downturns. Because of its indexing strategy, the fund does not take steps to reduce market exposure or to lessen the effects of a declining market. In addition, because of the fund’s expenses, the fund’s performance may be below that of the index. Errors relating to the index may occur from time to time and may not be identified by the index provider for a period of time. In addition, market disruptions could cause delays in the index’s rebalancing schedule. Such errors and/or market disruptions may result in losses for the fund.
Interest Rate Risk. Interest rates rise and fall over time. As with any investment whose yield reflects current interest rates, the fund’s yield will change over time. During periods when interest rates are low, the fund’s yield (and total return) also may be low. Changes in interest rates also may affect the fund’s share price: a rise in interest rates generally causes the fund’s share price to fall. The longer the fund’s portfolio duration, the more sensitive to interest rate movements its share price is likely to be. Also, a change in a central bank’s monetary policy or economic conditions, among other things, may result in a change in interest rates, which could have sudden and unpredictable effects on the markets and significantly impact the value of fixed-income securities in which the fund invests. A sudden or unpredictable rise in interest rates may cause volatility and the value of fixed-income securities to decline.
Credit Risk. A decline in the credit quality of an issuer, guarantor or liquidity provider of a portfolio investment or a counterparty could cause the fund to lose money or underperform. The fund could lose money if, due to a decline in credit quality, the issuer, guarantor or liquidity provider of a portfolio investment or a counterparty fails to make, or is perceived as being unable or unwilling to make, timely principal or interest payments or otherwise honor its obligations.
Schwab High Yield Bond ETF | Annual Report31
Schwab High Yield Bond ETF
Financial Notes (continued)
3. Risk Factors (continued):
High-Yield Risk. High-yield securities and unrated securities of similar credit quality (junk bonds) are subject to greater levels of credit and liquidity risks, and may be more volatile than higher-rated securities. High-yield securities are considered predominately speculative with respect to the issuer’s continuing ability to make principal and interest payments.
Sampling Index Tracking Risk. The fund may not fully replicate the index and may hold securities not included in the index. As a result, the fund is subject to the risk that the investment adviser’s investment management strategy, the implementation of which is subject to a number of constraints, may not produce the intended results. Because the fund utilizes a sampling approach it may not track the return of the index as well as it would if the fund purchased all of the securities in the index.
Tracking Error Risk. As an index fund, the fund seeks to track the performance of the index, although it may not be successful in doing so. The divergence between the performance of the fund and the index, positive or negative, is called “tracking error.” Tracking error can be caused by many factors and it may be significant.
Non-U.S. Issuer Risk. The fund may invest in U.S.-registered, dollar-denominated bonds of non-U.S. corporations. The fund’s investments in bonds of non-U.S. issuers may involve certain risks that are greater than those associated with investments in securities of U.S. issuers. These include risks of adverse changes in foreign economic, political, regulatory and other conditions; the imposition of economic sanctions or other government restrictions; differing accounting, auditing, financial reporting and legal standards and practices; differing securities market structures; and higher transaction costs. These risks may be heightened in connection with bonds issued by non-U.S. corporations and entities in emerging markets.
Privately Issued Securities Risk. Privately issued securities, including those purchased pursuant to Rule 144A under the Securities Act of 1933, as amended (the 1933 Act), are generally not traded on established markets. Privately issued securities carry the risk that the liquidity of these securities may become impaired, making it more difficult for the fund to sell these bonds. Delay or difficulty in selling such securities may result in a loss to the fund.
Portfolio Turnover Risk. The fund may engage in frequent trading of its portfolio securities in connection with its tracking of the index or in response to market conditions. A higher portfolio turnover rate may result in increased transaction costs, which may lower the fund’s performance. A higher portfolio turnover rate can also result in an increase in taxable capital gains distributions to the fund’s shareholders.
Prepayment and Extension Risk. Certain fixed-income securities are subject to the risk that the securities may be paid off earlier or later than expected, especially during periods of falling or rising interest rates, respectively. Prepayments of obligations could cause the fund to forgo future interest income on the portion of the security’s principal repaid early and force the fund to reinvest that money at the lower prevailing interest rates. Extensions of obligations could cause the fund to exhibit additional volatility and hold securities paying lower-than-market rates of interest. Either case could hurt the fund’s performance.
Derivatives Risk. The fund may invest in derivative instruments. The principal types of derivatives used by the fund are futures contracts. A futures contract is an agreement to buy or sell a financial instrument at a specific price on a specific day. The fund’s use of derivative instruments involves risks different from, or possibly greater than, the risks associated with investing directly in securities and other traditional investments. Certain of these risks, such as market risk, credit risk and liquidity risk, are discussed elsewhere in this section. The fund’s use of derivatives is also subject to lack of availability risk, valuation risk, correlation risk and tax risk. Lack of availability risk is the risk that suitable derivative transactions may not be available in all circumstances for risk management or other purposes. Valuation risk is the risk that a particular derivative may be valued incorrectly. Correlation risk is the risk that changes in the value of the derivative may not correlate perfectly with the underlying asset, rate or index. Tax risk is the risk that the use of derivatives may cause the fund to realize higher amounts of short-term capital gains. The fund’s use of derivatives could reduce the fund’s performance, increase the fund’s volatility, and cause the fund to lose more than the initial amount invested. The fund’s use of derivatives also could create a risk of counterparty default under certain transactions, risks that the fund would need to liquidate portfolio positions when it may not be advantageous to do so in order to meet margin and payment obligations, and legal risks relating to insufficient documentation, insufficient capacity or authority of a counterparty, or legality or enforceability of a contract. Furthermore, the use of derivatives subject to regulation by the Commodity Futures Trading Commission (CFTC) could cause the fund to become a commodity pool, which would require the fund to comply with certain CFTC rules.
Liquidity Risk. The fund may be unable to sell certain securities, such as illiquid securities, readily at a favorable time or price, or the fund may have to sell them at a loss.
Securities Lending Risk. Securities lending involves the risk of loss of rights in, or delay in recovery of, the loaned securities if the borrower fails to return the security loaned or becomes insolvent.
32Schwab High Yield Bond ETF | Annual Report
Schwab High Yield Bond ETF
Financial Notes (continued)
3. Risk Factors (continued):
Concentration Risk. To the extent that the fund’s or the index’s portfolio is concentrated in the securities of issuers in a particular market, industry, group of industries, sector or asset class, the fund may be adversely affected by the performance of those securities, may be subject to increased price volatility and may be more vulnerable to adverse economic, market, political or regulatory occurrences affecting that market, industry, group of industries, sector or asset class.
Market Trading Risk. Although fund shares are listed on national securities exchanges, there can be no assurance that an active trading market for fund shares will develop or be maintained. If an active market is not maintained, investors may find it difficult to buy or sell fund shares.
Shares of the Fund May Trade at Prices Other Than NAV. Fund shares may be bought and sold in the secondary market at market prices. Although it is expected that the market price of the shares of the fund will approximate the fund’s net asset value (NAV), there may be times when the market price and the NAV vary significantly. An investor may pay more than NAV when buying shares of the fund in the secondary market, and an investor may receive less than NAV when selling those shares in the secondary market. The market price of fund shares may deviate, sometimes significantly, from NAV during periods of market volatility or market disruption.
Please refer to the fund’s prospectus for a more complete description of the principal risks of investing in the fund.
4. Affiliates and Affiliated Transactions:Investment Adviser
Charles Schwab Investment Management, Inc., dba Schwab Asset Management, a wholly owned subsidiary of The Charles Schwab Corporation, serves as the fund’s investment adviser pursuant to the Advisory Agreement between the investment adviser and the trust.
For its advisory services to the fund, the investment adviser is entitled to receive an annual management fee, payable monthly, equal to 0.10% of the fund’s average daily net assets. Subsequent to the reporting period ended August 31, 2023 the management fee for the fund was reduced from 0.10% to 0.03% effective September 25, 2023.
Interfund Borrowing and Lending
Pursuant to an exemptive order issued by the SEC, the fund may enter into interfund borrowing and lending transactions with other funds in the Fund Complex. All loans are for temporary or emergency purposes and the interest rate to be charged will be the average of the overnight repurchase agreement rate and the short-term bank loan rate. All loans are subject to numerous conditions designed to ensure fair and equitable treatment of all participating funds. The interfund lending facility is subject to the oversight and periodic review of the Board. The fund had no interfund borrowing or lending activity during the period.
Shareholder Concentration
Certain accounts or CSIM affiliates may from time to time own (beneficially or of record) or control a significant percentage of a fund’s shares. Redemptions by these accounts of their holdings in a fund may impact the fund’s liquidity and NAV. These redemptions may also force the fund to sell securities, which may negatively impact the fund’s brokerage costs. Please refer to note 3 for more information on liquidity risk. As of August 31, 2023, one institution held 42% of the outstanding shares of the fund.
5. Other Service Providers:SEI Investments Distribution Co. is the principal underwriter and distributor of shares of the fund.
State Street Bank and Trust Company (State Street) serves as the fund’s transfer agent. As part of these services, the transfer agent maintains records pertaining to the sale, redemption and transfer of the fund’s shares. The transfer agent is also responsible for the order-taking function for the fund’s shares.
State Street also serves as custodian and accountant for the fund. The custodian is responsible for the daily safekeeping of securities and cash held by the fund. The fund’s accountant maintains all books and records related to the fund’s transactions.
Schwab High Yield Bond ETF | Annual Report33
Schwab High Yield Bond ETF
Financial Notes (continued)
The Board may include people who are officers and/or directors of the investment adviser or its affiliates. Federal securities law limits the percentage of such “interested persons” who may serve on a trust’s board, and the trust was in compliance with these limitations throughout the report period. The fund did not pay any interested trustees or non-interested trustees (independent trustees). The independent trustees are paid by the investment adviser. For information regarding the trustees, please refer to the Trustees and Officers table at the end of this report.
7. Borrowing from Banks:During the period, the fund was a participant with other funds in the Fund Complex in a joint, syndicated, committed $1 billion line of credit (the Syndicated Credit Facility), maturing on September 28, 2023. Under the terms of the Syndicated Credit Facility, in addition to the investment adviser paying the interest charged on any borrowings by the fund, the investment adviser paid a commitment fee of 0.15% per annum on the fund’s proportionate share of the unused portion of the Syndicated Credit Facility.
During the period, the fund was a participant with other funds in the Fund Complex, in a joint, unsecured, uncommitted $400 million line of credit (the Uncommitted Credit Facility), with State Street, maturing on September 28, 2023. Under the terms of the Uncommitted Credit Facility, the investment adviser pays interest on the amount the fund borrows. There were no borrowings by the fund from either line of credit during the period.
The fund also has access to custodian overdraft facilities. The fund may have utilized the overdraft facility and incurred an interest expense, which is paid by the investment adviser. The interest expense is determined based on a negotiated rate above the current Federal Funds Rate.
8. Purchases and Sales/Maturities of Investment Securities:For the period ended August 31, 2023, purchases and sales/maturities of securities (excluding in-kind transactions and short-term obligations) were as follows:
| SALES/MATURITIES
OF SECURITIES |
| |
9. In-Kind Transactions:The consideration for the purchase of Creation Units of the fund often consists of the in-kind deposit of a designated portfolio of fixed-income securities, which constitutes an optimized representation of the securities involved in a relevant fund’s underlying index, and an amount of cash. Investors purchasing and redeeming Creation Units are subject to a standard creation transaction fee and a standard redemption transaction fee paid to the custodian to offset transfer and other transaction costs associated with the issuance and redemption of Creation Units. Purchasers and redeemers of Creation Units for cash are subject to an additional variable charge paid to the fund that will offset the transaction costs to the fund of buying or selling portfolio securities. Variable charges paid to the fund generally have no effect on net asset value per share. In addition, purchasers and redeemers of shares in Creation Units are responsible for payment of the costs of transferring securities to or out of the fund. From time to time, the investment adviser may cover the cost of any transaction fees when believed to be in the best interests of the fund.
The in-kind transactions for the period ended August 31, 2023, were as follows:
IN-KIND PURCHASES
OF SECURITIES | IN-KIND SALES
OF SECURITIES |
| |
For the period ended August 31, 2023, the fund may realize net capital gains or losses resulting from in-kind redemptions of Creation Units. Because such gains or losses are not taxable to the fund and are not distributed to existing fund shareholders, the gains or losses are reclassified from accumulated net realized gains or losses to capital received from investors at the end of the fund’s tax year. These reclassifications have no effect on net assets or net asset value per share. The net realized gains or losses on sales of in-kind redemptions for the period ended August 31, 2023, are disclosed in the fund’s Statement of Operations, if any.
34Schwab High Yield Bond ETF | Annual Report
Schwab High Yield Bond ETF
Financial Notes (continued)
10. Federal Income Taxes:
As of August 31, 2023, the tax basis cost of the fund’s investments and gross unrealized appreciation and depreciation were as follows:
| | GROSS UNREALIZED
APPRECIATION | GROSS UNREALIZED
DEPRECIATION | NET UNREALIZED
APPRECIATION
(DEPRECIATION) |
| | | | |
| | | | |
| | | | |
As of August 31, 2023, the components of distributable earnings on a tax basis were as follows:
UNDISTRIBUTED
ORDINARY
INCOME | NET UNREALIZED
APPRECIATION
(DEPRECIATION)
ON INVESTMENTS | CAPITAL LOSS
CARRYFORWARDS AND OTHER LOSSES | |
| | | |
Capital loss carryforwards have no expiration and may be used to offset future realized capital gains for federal income tax purposes. As of August 31, 2023, the fund had capital loss carryforwards of $16,014.
Distributions paid to shareholders are based on net investment income and net realized gains determined on a tax basis, which may differ from net investment income and net realized gains for financial reporting purposes. These differences reflect the differing character of certain income items and net realized gains and losses for financial statement and tax purposes, and may result in reclassification among certain capital accounts in the financial statements. The fund may also designate a portion of the amount paid to redeeming shareholders as a distribution for tax purposes. There were no distributions paid during the period ended August 31, 2023.
Permanent book and tax basis differences may result in reclassifications between components of net assets as required. The adjustments have no impact on net assets or the results of operations.
As of August 31, 2023, management has reviewed the tax positions for open periods (for federal purposes, three years from the date of filing and for state purposes, four years from the date of filing) as applicable to the fund, and has determined that no provision for income tax is required in the fund’s financial statements. The fund recognizes interest and penalties, if any, related to unrecognized tax benefits as income tax expense in the fund’s Statement of Operations. During the period ended August 31, 2023, the fund did not incur any interest or penalties.
11. Subsequent Events:Management has determined there are no subsequent events or transactions through the date the financial statements were issued that would have materially impacted the financial statements as presented.
Schwab High Yield Bond ETF | Annual Report35
Schwab High Yield Bond ETF
Report of Independent Registered Public Accounting Firm
To the Board of Trustees of Schwab Strategic Trust and Shareholders of Schwab High Yield Bond ETF:
Opinion on the Financial Statements and Financial Highlights
We have audited the accompanying statement of assets and liabilities, including the portfolio holdings, of Schwab High Yield Bond ETF, (the “Fund”) one of the funds constituting Schwab Strategic Trust, as of August 31, 2023, the related statement of operations, the statement of changes in net assets and the financial highlights for the period from July 11, 2023 (commencement of operations) through August 31, 2023, and the related notes. In our opinion, the financial statements and financial highlights present fairly, in all material respects, the financial position of the Fund as of August 31, 2023, and the results of its operations, the changes in its net assets and the financial highlights for the period from July 11, 2023 (commencement of operations) through August 31, 2023 in conformity with accounting principles generally accepted in the United States of America.
Basis for Opinion
These financial statements and financial highlights are the responsibility of the Fund’s management. Our responsibility is to express an opinion on the Fund’s financial statements and financial highlights based on our audit. We are a public accounting firm registered with the Public Company Accounting Oversight Board (United States) (PCAOB) and are required to be independent with respect to the Fund in accordance with the U.S. federal securities laws and the applicable rules and regulations of the Securities and Exchange Commission and the PCAOB.
We conducted our audit in accordance with the standards of the PCAOB. Those standards require that we plan and perform the audit to obtain reasonable assurance about whether the financial statements and financial highlights are free of material misstatement, whether due to error or fraud. The Fund is not required to have, nor were we engaged to perform, an audit of its internal control over financial reporting. As part of our audit, we are required to obtain an understanding of internal control over financial reporting but not for the purpose of expressing an opinion on the effectiveness of the Fund’s internal control over financial reporting. Accordingly, we express no such opinion.
Our audit included performing procedures to assess the risks of material misstatement of the financial statements and financial highlights, whether due to error or fraud, and performing procedures that respond to those risks. Such procedures included examining, on a test basis, evidence regarding the amounts and disclosures in the financial statements and financial highlights. Our audit also included evaluating the accounting principles used and significant estimates made by management, as well as evaluating the overall presentation of the financial statements and financial highlights. Our procedures included confirmation of securities owned as of August 31, 2023, by correspondence with the custodian and brokers; when replies were not received from brokers, we performed other auditing procedures. We believe that our audit provides a reasonable basis for our opinion.
Deloitte & Touche LLP
Denver, Colorado
October 17, 2023
We have served as the auditor of one or more investment companies in the Schwab Funds Complex since 2020.
36Schwab High Yield Bond ETF | Annual Report
Schwab High Yield Bond ETF
Investment Advisory Agreement Approval
Initial Approval of Investment Advisory Agreement
The Investment Company Act of 1940, as amended (the 1940 Act), requires that the approval of a fund’s investment advisory agreement must be specifically approved (1) by the vote of the trustees or by a vote of the shareholders of the fund, and (2) by the vote of a majority of the trustees who are not parties to the investment advisory agreements or “interested persons” of any party thereto (the Independent Trustees), cast in person at a meeting called for the purpose of voting on such approval. In connection with such approvals, the fund’s trustees must request and evaluate, and the investment adviser is required to furnish, such information as may be reasonably necessary to evaluate the terms of the investment advisory agreement.
The Board of Trustees (the Board or the Trustees, as appropriate) called and held a meeting on December 14, 2022, in part, for the purpose of considering whether to appoint Charles Schwab Investment Management, Inc. (dba Schwab Asset Management) (the investment adviser), as investment adviser to the Schwab High Yield Bond ETF (the Fund) under the investment advisory agreement between Schwab Strategic Trust (the Trust) and the investment adviser (the Agreement). In preparation for the meeting, the Board requested and reviewed a wide variety of materials provided by the investment adviser and considered information that the Board receives from the investment adviser throughout the year, including information about the investment adviser’s affiliates, personnel, business goals and priorities, profitability, third-party oversight, corporate structure and operations. The Board also received data provided by an independent provider of investment company data. In recognition of the fact that the Fund had not yet commenced operations, the Board also considered information provided by the investment adviser in connection with the Board’s consideration of approval of the investment advisory agreement with respect to the other funds within the Trust. The Board also took into account the detailed information about other funds within the Trust that the Board reviews during the course of each year, including information that relates to those funds’ operations and performance, legal and compliance matters, risk management, portfolio turnover, and sales and marketing activity. The Independent Trustees received advice from Independent Trustees’ legal counsel, including with respect to the responsibilities of trustees for the approval of investment advisory agreements. In addition, the Independent Trustees participated in question and answer sessions with representatives of the investment adviser and met in executive session outside the presence of Fund management.
The Board, including a majority of the Independent Trustees approved the Agreement with respect to the Fund. In addition, the Board, including a majority of the Independent Trustees, considered information specifically relating to the continuance
of the Agreement with respect to the Fund at meetings held on April 27, 2023 and June 6, 2023, and approved the renewal of the Agreement with respect to the Fund for an additional one-year term at the meeting on June 6, 2023 called for the purpose of voting on such approval. The Board’s initial approval of the Agreement and the approval of the continuance of the Agreement was based on consideration and evaluation of a variety of specific factors discussed at these meetings, including:
1.
the nature, extent and quality of the services to be provided to the Fund under the Agreement, including the resources of the investment adviser and its affiliates to be dedicated to the Fund;
2.
the investment adviser’s investment performance in managing other index-based exchange-traded funds;
3.
the Fund’s estimated expenses and how those expenses compared to those of certain other similar exchange-traded funds;
4.
the expected profitability of the investment adviser and its affiliates, including Charles Schwab & Co., Inc. (Schwab), with respect to management of the Fund, including both direct and indirect benefits accruing to the investment adviser and its affiliates; and
5.
the extent to which economies of scale would be realized as the Fund grows and whether fee levels in the Agreement reflect those economies of scale for the benefit of Fund investors.
Nature, Extent and Quality of Services. The Board considered the nature, extent and quality of the services to be provided by the investment adviser to the Fund and the resources that the investment adviser and its affiliates will dedicate to the Fund. In this regard, the Trustees evaluated, among other things, the investment adviser’s experience, track record, compliance program, resources dedicated to hiring and retaining skilled personnel and specialized talent, and information security resources. The Trustees also considered information provided by the investment adviser relating to services and support to be provided with respect to the Fund’s portfolio management team, portfolio strategy, and internal investment guidelines, as well as trading infrastructure, liquidity management, product design and analysis, shareholder communications, securities valuation, and vendor and risk oversight. The Trustees also considered investments the investment adviser has made in its infrastructure, including modernizing the investment adviser’s technology and use of data, increasing expertise in key areas (including portfolio management and trade operations), and improving business continuity, cybersecurity, due diligence, risk management processes, and information security programs, which are designed to provide enhanced services to the Fund and its shareholders. The Trustees also considered Schwab’s
Schwab High Yield Bond ETF | Annual Report37
Schwab High Yield Bond ETF
overall financial condition and reputation as a full service brokerage firm as well as the wide range of products, services, and account features that benefit Fund shareholders who are brokerage clients of Schwab. Following such evaluation, the Board concluded, within the context of its full deliberations, that the nature, extent and quality of services to be provided by the investment adviser to the Fund and the resources of the investment adviser and its affiliates dedicated to the Fund supported initial approval and renewal of the Agreement with respect to the Fund.
Fund Performance. Since the Fund had not commenced operations and therefore did not have any performance of its own, the Board considered the Fund’s expected index tracking error and the characteristics of the Fund’s proposed index relative to other market indices in determining whether to approve the Agreement. Following such evaluation, the Board concluded, within the context of its full deliberations, that the expected performance of the Fund supported initial approval and renewal of the Agreement with respect to the Fund.
Fund Expenses. With respect to the Fund’s expenses, the Trustees considered the proposed rate of compensation called for by the Agreement and the Fund’s estimated operating expense ratio, in each case, in comparison to those of other similar exchange-traded funds, such peer groups and comparisons having been selected and calculated by an independent provider of investment company data. The investment adviser reported to the Board, and the Board took into account, the risk assumed by the investment adviser in the development of the Fund and the services to be provided as well as the competitive marketplace for financial products. The Trustees also considered fees charged by the investment adviser to mutual funds and other exchange-traded funds that it manages. The Board evaluated the Fund’s unitary fee through review of comparative information with respect to fees paid by other similar exchange-traded funds tracking high yield bond indices. Following such evaluation, the Board concluded, within the context of its full deliberations, that the expenses of the Fund are reasonable and supported initial approval and renewal of the Agreement with respect to the Fund.
Profitability. With regard to profitability, the Trustees considered the expected compensation to be flowing to the investment adviser and its affiliates, directly or indirectly. In this connection, the Trustees reviewed management’s profitability analysis of the investment adviser relating to the Fund, noting the benefits to Fund shareholders of being part of the Schwab fund complex, including the allocations of certain fixed costs across the Fund and other funds in the complex. The Trustees considered any other potential benefits to be derived by the investment adviser from its relationship with the Fund, such as whether, by virtue of its management of the Fund, the investment adviser obtains investment information or other research resources that aid it in providing advisory
services to other clients. The Trustees considered whether the expected compensation and profitability with respect to the Fund under the Agreement and other service agreements were reasonable in light of the quality of all services to be rendered to the Fund by the investment adviser and its affiliates. The Trustees noted that the investment adviser continues to invest substantial sums in its business in order to provide enhanced research capabilities, services, and systems that would benefit the Fund. Based on this evaluation, the Board concluded, within the context of its full deliberations, that the expected profitability of the investment adviser, albeit uncertain, is reasonable and supported initial approval and renewal of the Agreement with respect to the Fund.
Economies of Scale. Recognizing that the Fund had not yet commenced operations and had no assets, the Trustees considered the potential existence of any economies of scale and whether those could be expected to be passed along to the Fund’s shareholders by way of the relatively low advisory fee and unitary fee structure of the Fund through (i) the enhancement of services provided to the Fund in return for fees paid, including through investments by the investment adviser in the investment adviser’s infrastructure, including modernizing its technology and use of data, increasing expertise and capabilities in key areas (including portfolio and trade operations), and improving business continuity, cybersecurity, due diligence and information security programs, which are designed to provide enhanced services to the Fund and its shareholders; and (ii) pricing the Fund to scale and keeping overall expenses down as the Fund grows. The Trustees acknowledged that the investment adviser’s internal costs of providing investment management, technology, administrative, legal and compliance services to the Fund may increase as a result of regulatory or other developments. Based on this evaluation, the Board concluded, within the context of its full deliberations, that the Fund may be expected to obtain reasonable benefits from economies of scale if such economies develop.
* * * * * * * * * * * * * * * * * * * * * * * * * * * * * * * * * * * * * * * *
In the course of their deliberations, the Trustees may have accorded different weights to various factors and did not identify any particular information or factor that was all important or controlling. Based on the Trustees’ deliberation and their evaluation of the information described above, the Board, including all of the Independent Trustees, initially approved the Agreement and approved the continuance of the Agreement with respect to the Fund and concluded that the compensation under the Agreement with respect to the Fund is fair and reasonable in light of the services to be provided and the related expenses to be borne by the investment adviser and its affiliates and such other matters as the Trustees considered to be relevant in the exercise of their reasonable judgment.
38Schwab High Yield Bond ETF | Annual Report
Schwab High Yield Bond ETF
Trustees and Officers
The tables below give information about the trustees and officers of Schwab Strategic Trust, which includes the fund covered in this report. The “Fund Complex” includes The Charles Schwab Family of Funds, Schwab Capital Trust, Schwab Investments, Schwab Annuity Portfolios, Schwab Strategic Trust and Laudus Trust. The Fund Complex includes 106 funds.
The address for all trustees and officers is 211 Main Street, San Francisco, CA 94105. You can find more information about the trustees and officers in the Statement of Additional Information, which is available free by calling 1-877-824-5615.
|
Name, Year of Birth, and Position(s) with the trust (Terms of office, and length of Time Served1) | Principal Occupations During the Past Five Years | Number of Portfolios in Fund Complex Overseen by the Trustee | |
Michael J. Beer 1961 Trustee (Trustee of The Charles Schwab Family of Funds, Schwab Investments, Schwab Capital Trust, Schwab Annuity Portfolios, Schwab Strategic Trust and Laudus Trust since 2022) | Retired. Director, President and Chief Executive Officer (Dec. 2016 – Sept. 2019), Principal Funds (investment management). | | Director (2016 – 2019), Principal Funds, Inc. |
Robert W. Burns 1959 Trustee (Trustee of Schwab Strategic Trust since 2009; The Charles Schwab Family of Funds, Schwab Investments, Schwab Capital Trust, Schwab Annuity Portfolios and Laudus Trust since 2016) | Retired/Private Investor. | | |
Nancy F. Heller 1956 Trustee (Trustee of The Charles Schwab Family of Funds, Schwab Investments, Schwab Capital Trust, Schwab Annuity Portfolios, Schwab Strategic Trust and Laudus Trust since 2018) | | | |
David L. Mahoney 1954 Trustee (Trustee of The Charles Schwab Family of Funds, Schwab Investments, Schwab Capital Trust, Schwab Annuity Portfolios and Laudus Trust since 2011; Schwab Strategic Trust since 2016) | | | Director (2004 – present), Corcept Therapeutics Incorporated Director (2009 – 2021), Adamas Pharmaceuticals, Inc. Director (2003 – 2019), Symantec Corporation |
Jane P. Moncreiff 1961 Trustee (Trustee of The Charles Schwab Family of Funds, Schwab Investments, Schwab Capital Trust, Schwab Annuity Portfolios, Schwab Strategic Trust and Laudus Trust since 2019) | Consultant (2018 – present), Fulham Advisers LLC (management consulting); Chief Investment Officer (2009 – 2017), CareGroup Healthcare System, Inc. (healthcare). | | |
Schwab High Yield Bond ETF | Annual Report39
Schwab High Yield Bond ETF
Independent Trustees (continued) |
Name, Year of Birth, and Position(s) with the trust (Terms of office, and length of Time Served1) | Principal Occupations During the Past Five Years | Number of Portfolios in Fund Complex Overseen by the Trustee | |
Kimberly S. Patmore 1956 Trustee (Trustee of The Charles Schwab Family of Funds, Schwab Investments, Schwab Capital Trust, Schwab Annuity Portfolios, Schwab Strategic Trust and Laudus Trust since 2016) | Consultant (2008 – present), Patmore Management Consulting (management consulting). | | |
J. Derek Penn 1957 Trustee (Trustee of The Charles Schwab Family of Funds, Schwab Investments, Schwab Capital Trust, Schwab Annuity Portfolios, Schwab Strategic Trust and Laudus Trust since 2021) | Head of Equity Sales and Trading (2006 – 2018), BNY Mellon (financial services). | | |
40Schwab High Yield Bond ETF | Annual Report
Schwab High Yield Bond ETF
|
Name, Year of Birth, and Position(s) with the trust (Terms of office, and length of Time Served1) | Principal Occupations During the Past Five Years | Number of Portfolios in Fund Complex Overseen by the Trustee | |
Walter W. Bettinger II2 1960 Chairman and Trustee (Trustee of The Charles Schwab Family of Funds, Schwab Investments, Schwab Capital Trust and Schwab Annuity Portfolios since 2008; Schwab Strategic Trust since 2009; Laudus Trust since 2010) | Co-Chairman of the Board (July 2022 – present), Director and Chief Executive Officer (Oct. 2008 – present) and President (Feb. 2007 – Oct. 2021), The Charles Schwab Corporation; President and Chief Executive Officer (Oct. 2008 – Oct. 2021) and Director (May 2008 – Oct. 2021), Charles Schwab & Co., Inc.; Director (Apr. 2006 – present), Charles Schwab Bank, SSB; Director (Nov. 2017 – present), Charles Schwab Premier Bank, SSB; Director (July 2019 – present), Charles Schwab Trust Bank; Director (May 2008 – present), Chief Executive Officer (Aug. 2017 – present) and President (Aug. 2017 – Nov. 2021), Schwab Holdings, Inc.; Director (Oct. 2020 – present), TD Ameritrade Holding Corporation; Director (July 2016 – Oct. 2021), Charles Schwab Investment Management, Inc. | | Director (2008 – present), The Charles Schwab Corporation |
Richard A. Wurster2 1973 Trustee (Trustee of The Charles Schwab Family of Funds, Schwab Investments, Schwab Capital Trust, Schwab Annuity Portfolios, Schwab Strategic Trust and Laudus Trust since 2022) | President (Oct. 2021 – present) and Executive Vice President – Schwab Asset Management Solutions (Apr. 2019 – Oct. 2021), The Charles Schwab Corporation; President, Director (Oct. 2021 – present), Executive Vice President – Schwab Asset Management Solutions (July 2019 – Oct. 2021) and Senior Vice President – Advisory (May 2016 – July 2019), Charles Schwab & Co., Inc.; President (Nov. 2021 – present), Schwab Holdings, Inc.; Director (Oct. 2021 – present) and Chief Executive Officer (Nov. 2019 – Jan. 2022), Charles Schwab Investment Management, Inc.; Director, Chief Executive Officer and President (Mar. 2018 – Oct. 2022), Charles Schwab Investment Advisory, Inc.; Chief Executive Officer (July 2016 – Apr. 2018) and President (Mar. 2017 – Apr. 2018), ThomasPartners, Inc.; Chief Executive Officer (July 2016 – Apr. 2018), Windhaven Investment Management, Inc. | | |
|
Name, Year of Birth, and Position(s) with the trust (Terms of office, and length of Time Served3) | Principal Occupations During the Past Five Years |
Omar Aguilar 1970 Chief Executive Officer and Chief Investment Officer (Officer of The Charles Schwab Family of Funds, Schwab Investments, Schwab Capital Trust, Schwab Annuity Portfolios, Schwab Strategic Trust and Laudus Trust since 2011) | Chief Executive Officer (Jan. 2022 – present), Chief Investment Officer (Apr. 2011 – present) and Senior Vice President (Apr. 2011 – Dec. 2021), Charles Schwab Investment Management, Inc.; Director, Chief Executive Officer and President (Oct. 2022 – present), Charles Schwab Investment Advisory, Inc.; Chief Executive Officer (Sept. 2023 – present), Chief Investment Officer (June 2011 – present) and Vice President (June 2011 – Sept. 2023), Schwab Funds, Laudus Trust and Schwab ETFs. |
Jonathan de St. Paer 1973 President (Officer of The Charles Schwab Family of Funds, Schwab Investments, Schwab Capital Trust, Schwab Annuity Portfolios, Schwab Strategic Trust and Laudus Trust since 2018) | Director (Apr. 2019 – present), President (Oct. 2018 – present), Chief Operating Officer (Jan. 2021 – present), and Chief Executive Officer (Apr. 2019 – Nov. 2019), Charles Schwab Investment Management, Inc.; Senior Vice President (June 2020 – Mar. 2022) and Chief Operating Officer (Jan. 2021 – Mar. 2022), Charles Schwab Investment Advisory, Inc.; President (Nov. 2018 – present), Chief Executive Officer (Apr. 2019 – Sept. 2023) and Trustee (Apr. 2019 – Dec. 2020), Schwab Funds, Laudus Trust and Schwab ETFs; Managing Director (May 2022 – present), Senior Vice President (Apr. 2019 – May 2022) and Senior Vice President – Strategy and Product Development (CSIM) (Jan. 2014 – Mar. 2019), Charles Schwab & Co., Inc. |
Mark Fischer 1970 Chief Operating Officer (Officer of The Charles Schwab Family of Funds, Schwab Investments, Schwab Capital Trust, Schwab Annuity Portfolios, Schwab Strategic Trust and Laudus Trust since 2013) | Chief Operating Officer (Dec. 2020 – present) and Treasurer and Chief Financial Officer (Jan. 2016 – Dec. 2022), Schwab Funds, Laudus Trust and Schwab ETFs; Managing Director (Mar. 2023 – present), Chief Financial Officer (Mar. 2020 – present) and Vice President (Oct. 2013 – Mar. 2023), Charles Schwab Investment Management, Inc. |
Schwab High Yield Bond ETF | Annual Report41
Schwab High Yield Bond ETF
Officers of the Trust (continued) |
Name, Year of Birth, and Position(s) with the trust (Terms of office, and length of Time Served3) | Principal Occupations During the Past Five Years |
Dana Smith 1965 Treasurer and Chief Financial Officer (Officer of The Charles Schwab Family of Funds, Schwab Investments, Schwab Capital Trust, Schwab Annuity Portfolios, Schwab Strategic Trust and Laudus Trust since 2023) | Treasurer and Chief Financial Officer (Jan. 2023 – present) and Assistant Treasurer (Dec. 2015 – Dec. 2022), Schwab Funds, Laudus Trust and Schwab ETFs; Managing Director (Mar. 2023 – present), Vice President (Mar. 2022 – Mar. 2023) and Director (Oct. 2015 – Mar. 2022), Charles Schwab Investment Management, Inc. |
Brett Wander 1961 Vice President and Chief Investment Officer (Officer of The Charles Schwab Family of Funds, Schwab Investments, Schwab Capital Trust, Schwab Annuity Portfolios, Schwab Strategic Trust and Laudus Trust since 2011) | Managing Director (Mar. 2023 – present), Chief Investment Officer (Apr. 2011 – present) and Senior Vice President (Apr. 2011 – Mar. 2023) Charles Schwab Investment Management, Inc.; Vice President and Chief Investment Officer (June 2011 – present), Schwab Funds, Laudus Trust and Schwab ETFs. |
William P. McMahon, Jr. 1972 Vice President and Chief Investment Officer (Officer of The Charles Schwab Family of Funds, Schwab Investments, Schwab Capital Trust, Schwab Annuity Portfolios, Schwab Strategic Trust and Laudus Trust since 2021) | Managing Director (Mar. 2023 – present), Chief Investment Officer (Jan. 2020 – present) and Senior Vice President (Jan. 2020 – Mar. 2023) Charles Schwab Investment Management, Inc.; Vice President and Chief Investment Officer (June 2021 – present), Schwab Funds, Laudus Trust and Schwab ETFs; Senior Vice President and Chief Investment Officer – ThomasPartners Strategies (Apr. 2018 – Dec. 2019), Charles Schwab Investment Advisory, Inc.; Senior Vice President and Chief Investment Officer (May 2001 – Apr. 2018), ThomasPartners, Inc. |
Catherine MacGregor 1964 Chief Legal Officer and Secretary, Schwab Funds and Schwab ETFs Chief Legal Officer, Vice President and Clerk, Laudus Trust (Officer of The Charles Schwab Family of Funds, Schwab Investments, Schwab Capital Trust, Schwab Annuity Portfolios and Laudus Trust since 2005; Schwab Strategic Trust since 2009) | Managing Director (Mar. 2023 – present), Chief Legal Officer (Mar. 2022 – present) and Vice President (Sept. 2005 – Mar. 2023), Charles Schwab Investment Management, Inc.; Managing Director (May 2022 – present) and Vice President (July 2005 – May 2022), Charles Schwab & Co., Inc.; Vice President (Dec. 2005 – present) and Chief Legal Officer and Clerk (Mar. 2007 – present), Laudus Trust; Chief Legal Officer and Secretary (Oct. 2021 – present), Vice President (Nov. 2005 – Oct. 2021) and Assistant Secretary (June 2007 – Oct. 2021), Schwab Funds; Chief Legal Officer and Secretary (Oct. 2021 – present), Vice President and Assistant Secretary (Oct. 2009 – Oct. 2021), Schwab ETFs. |
1
Each Trustee shall hold office until the election and qualification of his or her successor, or until he or she dies, resigns or is removed. The retirement policy requires that each independent trustee retire by December 31 of the year in which the Trustee turns 74 or the Trustee’s twentieth year of service as an independent trustee on any trust in the Fund Complex, whichever occurs first.
2
Mr. Bettinger and Mr. Wurster are Interested Trustees. Mr. Bettinger and Mr. Wurster are Interested Trustees because each owns stock of The Charles Schwab Corporation (CSC), the parent company of Charles Schwab Investment Management, Inc., the investment adviser for the trusts in the Fund Complex, and is an employee of Charles Schwab & Co., Inc. (Schwab), the principal underwriter for The Charles Schwab Family of Funds, Schwab Investments, Schwab Capital Trust, Schwab Annuity Portfolios and Laudus Trust.
3
The President, Treasurer and Secretary/Clerk hold office until their respective successors are chosen and qualified or until he or she sooner dies, resigns, is removed or becomes disqualified. Each of the other officers serves at the pleasure of the Board.
42Schwab High Yield Bond ETF | Annual Report
Schwab High Yield Bond ETF
ask See “offer.”
asset allocation The practice of dividing a portfolio among different asset classes, with each asset class assigned a particular percentage to help offset risks and rewards, based on your goals, time horizon and risk tolerance.
asset-backed securities Bond or other debt securities that represent ownership in a pool of assets such as credit card debt.
asset class A group of securities with similar structure and basic characteristics. Stocks, bonds and cash are the three main examples of asset classes.
authorized participant (AP) A large institutional investor that places orders for creation units with the funds’ distributor.
bid The highest price at which someone is willing to buy a security.
bond A security representing a loan from the investor to the issuer. A bond typically pays interest at a fixed rate (the “coupon rate”) until a specified date (the “maturity date”), at which time the issuer returns the money borrowed (“principal” or “face value”) to the bondholder. Because of their structure, bonds are sometimes called “fixed income securities” or “debt securities.”
call An early repayment of a bond’s principal by the issuer, usually done because the issuer is able to refinance its bond debt at a lower rate.
call protection A term used in reference to a bond that cannot be called by the issuer before maturity, or at least for many years from the present date. A bond that offers call protection can more reliably be expected to provide a given yield over a given number of years than a bond that could be called (assuming both bonds are of the same credit quality).
capital gain, capital loss The difference between the amount paid for an investment and its value at a later time. If the investment has been sold, the capital gain or loss is considered a realized gain or loss. If the investment is still held, the gain or loss is still “on paper” and is considered unrealized.
commencement of operations The date that the first NAV was calculated.
coupon, coupon rate The annual rate of interest paid until maturity by the issuer of a debt security.
creation unit (C.U.) A basket of securities that is delivered by an authorized participant (AP) to the fund equal to the current holdings of the ETF, plus a designated cash component. In return, the APs receive a large block of ETF shares (typically 50,000 shares), which investors can then buy and sell in the secondary market.
credit quality The capacity of an issuer to make its interest and principal payments; an assessment typically rendered by an independent third-party organization.
credit risk The risk that a bond issuer may be unable to pay interest or principal to its bondholders.
duration A measure of an individual bond’s sensitivity to interest rates, expressed in years. Calculations of duration generally take into account the bond’s yield, interest payments, maturity date and call features.
weighted average duration A measure of the duration of all bonds in a fund’s portfolio, also expressed in years, based on the market value weighted average duration of each bond in the portfolio.
exchange A marketplace, or any organization or group that provides or maintains a marketplace for trading securities, options, futures, or commodities.
expense ratio The amount that is taken from the fund’s assets each year to cover the operating expenses. An expense ratio of 0.50% means that a fund’s expenses amount to half of one percent of its average net assets a year.
face value The value of a bond, note, mortgage or other security as given on the certificate or instrument. Face value is also referred to as par value or nominal value.
ICE BofA US Cash Pay High Yield Constrained Index An index that contains all securities in the ICE BofA US Cash Pay High Yield Index but caps issuer exposure at 2%. Index constituents are capitalization-weighted, based on their current amount outstanding, provided the total allocation to an individual issuer does not exceed 2%. Issuers that exceed the limit are reduced to 2% and the face value of each of their bonds is adjusted on a pro-rata basis. Similarly, the face values of bonds of all other issuers that fall below the 2% cap are increased on a pro-rata basis. In the event there are fewer than 50 issuers in the Index, each is equally weighted and the face values of their respective bonds are increased or decreased on a prorate basis.
inception date The date that the shares began trading in the secondary market.
indicative optimized portfolio value (IOPV) A calculation disseminated by the stock exchange that approximates the fund’s NAV every 15 seconds throughout the trading day.
interest Payments to bondholders (usually made twice a year) as compensation for loaning the bond principal to the issuer.
interest rate risk The risk that a bond’s value will fluctuate if market interest rates change or are expected to change. Bond prices tend to move in the opposite direction of interest rates: when interest rates rise, bond prices tend to fall.
liquidity The ability to convert a security or asset quickly into cash.
market price return The return based on the change in market price per share of the fund over a given time period. Market price returns assume that dividends and capital gain distributions have been reinvested in the fund at market price.
maturity The maturity of a bond will generally be determined using a portfolio security’s final maturity date (date on which the final principal payment of a bond is scheduled to be paid); however, for securitized products, such as mortgage-backed securities and certain other asset-backed securities, maturity will be determined on an average life basis (weighted average time to receipt of all principal payments) by the investment adviser. Because pre-payment rates of individual mortgage pools vary widely, the average life of a particular pool cannot be predicted precisely. For securities with embedded demand features,
Schwab High Yield Bond ETF | Annual Report43
Schwab High Yield Bond ETF
such as puts or calls, either the demand date or the final maturity date will be used depending on interest rates, yields and other market conditions. The weighted average maturity (WAM) of a fund is dollar-weighted based upon the market value of a fund’s securities at the time of the calculation.
mortgage-backed securities Bond or other debt securities that represent ownership in a pool of mortgage loans.
net asset value (NAV) The value of one share of a fund. NAV is calculated by taking the fund’s total assets, subtracting liabilities, and dividing by the number of shares outstanding.
NAV return The return based on the change in NAV of the fund over a given time period. NAV returns assume that dividends and capital gain distributions have been reinvested in the fund.
offer (ask) The lowest price at which an individual is willing to sell a security.
open The price at which a security opened for trading on a given day.
outstanding shares, shares outstanding When speaking of the fund, indicates all shares currently held by investors.
prepayment risk The risk that a mortgage-backed security may be paid off early, typically because interest rates have fallen and the homeowners who hold the underlying mortgages have refinanced those mortgages at lower rates. In this type of situation, the investor who held the mortgage-backed security will usually have to settle for a lower rate when reinvesting the principal.
primary market The market that deals with the issuance of new securities.
replication If a fund uses a full replication method, the fund will invest substantially all of its assets proportionately in the securities included in the underlying index.
sampling If a fund uses a sampling method, the fund will not fully replicate the underlying index and may hold securities not included in the index. A fund that utilizes a sampling approach may not track the return of the index as closely as a fund that uses a full replication method.
secondary market The market in which investors purchase securities from other investors rather than directly from the issuing companies. Organized exchanges facilitate the trading of securities in the secondary market.
spread The gap between bid and ask prices of a security.
total return The percentage that an investor would have earned or lost on an investment in the fund assuming dividends and distributions were reinvested.
tracking error The difference between the performance of the fund and its benchmark index, positive or negative.
weighted average For mutual funds or ETFs, an average that gives the same weight to each security as the security represents in the fund’s portfolio.
yield The income paid out by an investment, expressed as a percentage of the investment’s market value.
yield to maturity The annualized rate of return a bondholder could expect if the bond were held to maturity. In addition to interest payments, yield to maturity also factors in any difference between a bond’s current price and its principal amount, or face value.
44Schwab High Yield Bond ETF | Annual Report
Schwab High Yield Bond ETF
Schwab ETFs
Schwab ETFs are designed to serve as simple low-cost core investment products for a diversified portfolio. These ETFs seek to provide consistent, repeatable performance through a variety of investment strategies that span the equity and fixed income spectrum. The list below shows all currently available Schwab ETFs.
Investors should carefully consider information contained in the prospectus, or if available, the summary prospectus, including investment objectives, risks, charges and expenses before investing. Please call 1-877-824-5615 for a prospectus for any Schwab ETF. Please read the prospectus carefully before you invest. This report must be preceded or accompanied by a current prospectus.
Proxy Voting Policies, Procedures and Results
A description of the proxy voting policies and procedures used to determine how to vote proxies on behalf of the funds is available without charge, upon request, by visiting the Schwab ETFs’ website at www.schwabassetmanagement.com/schwabetfs_prospectus, the SEC’s website at www.sec.gov, or by contacting Schwab ETFs at 1-877-824-5615.
Information regarding how a fund voted proxies relating to portfolio securities during the most recent twelve-month period ended June 30 is available, without charge, by visiting the fund’s website at www.schwabassetmanagement.com/schwabetfs_prospectus or the SEC’s website at www.sec.gov.
Schwab ETFs
U.S. ETFs
Schwab U.S. Broad Market ETF
Schwab 1000 Index® ETF
Schwab U.S. Large-Cap ETF
Schwab U.S. Large-Cap Growth ETF
Schwab U.S. Large-Cap Value ETF
Schwab U.S. Mid-Cap ETF
Schwab U.S. Small-Cap ETF
Schwab U.S. Dividend Equity ETF
Schwab U.S. REIT ETF
International ETFs
Schwab International Dividend Equity ETF
Schwab International Equity ETF
Schwab International Small-Cap Equity ETF
Schwab Emerging Markets Equity ETF
Fixed-Income ETFs
Schwab U.S. TIPS ETF
Schwab Short-Term U.S. Treasury ETF
Schwab Intermediate-Term U.S. Treasury ETF
Schwab Long-Term U.S. Treasury ETF
Schwab U.S. Aggregate Bond ETF
Schwab 1-5 Year Corporate Bond ETF
Schwab 5-10 Year Corporate Bond ETF
Schwab Municipal Bond ETF
Schwab High Yield Bond ETF
Fundamental Index* ETFs
Schwab Fundamental U.S. Broad Market Index ETF
Schwab Fundamental U.S. Large Company Index ETF
Schwab Fundamental U.S. Small Company Index ETF
Schwab Fundamental International Large Company Index ETF
Schwab Fundamental International Small Company Index ETF
Schwab Fundamental Emerging Markets Large Company
Index ETF
Active, Semi-Transparent (Also Known As Non-Transparent) ETF
Schwab Ariel ESG ETF
Thematic ETFs
Schwab Crypto Thematic ETF
Investment Adviser
Charles Schwab Investment Management, Inc., dba Schwab Asset Management
211 Main Street, San Francisco, CA 94105
Schwab ETFs
1-877-824-5615
© 2023 Charles Schwab Investment Management, Inc., dba Schwab Asset Management. All rights reserved.
Printed on recycled paper.
*
FUNDAMENTAL INDEX is a registered trademark of Research Affiliates LLC.
The Schwab Ariel ESG ETF is different from traditional ETFs. Traditional ETFs tell the public what assets they hold each day. This fund will not. This may create additional risks for your investment. For example:
•
You may have to pay more money to trade the fund’s shares. This fund will provide less information to traders, who tend to charge more for trades when they have less information.
•
The price you pay to buy fund shares on an exchange may not match the value of the fund’s portfolio. The same is true when you sell shares. These price differences may be greater for this fund compared to other ETFs because it provides less information to traders.
•
These additional risks may be even greater in bad or uncertain market conditions.
•
The ETF will publish on its website each day a “Proxy Portfolio” designed to help trading in shares of the ETF. While the Proxy Portfolio includes some of the ETF’s holdings, it is not the ETF’s actual portfolio.
The differences between this fund and other ETFs may also have advantages. By keeping certain information about the fund secret, this fund may face less risk that other traders can predict or copy its investment strategy. This may improve the fund’s performance. If other traders are able to copy or predict the fund’s investment strategy, however, this may hurt the fund’s performance.
For additional information regarding the unique attributes and risks of the fund, see Proxy Portfolio Risk, Premium/Discount Risk, Trading Halt Risk, Authorized Participant Concentration Risk, Tracking Error Risk and Shares of the Fund May Trade at Prices Other Than NAV in the Principal Risks and Proxy Portfolio and Proxy Overlap sections of the prospectus and/or the Statement of Additional Information. These risks are discussed on the next page.
Schwab High Yield Bond ETF
Active semi-transparent (also referred to as non-transparent) ETFs operate differently from other exchange-traded funds (ETFs). Unlike other ETFs, an active semi-transparent ETF does not publicly disclose its entire portfolio composition each business day, which may affect the price at which shares of the ETF trade in the secondary market. Active semi-transparent ETFs have limited public trading history. There can be no assurance that an active trading market will develop, be maintained or operate as intended. There is a risk that the market price of an active semi-transparent ETF may vary significantly from the ETF’s net asset value and that its shares may trade at a wider bid/ask spread and, therefore, cost investors more to trade than shares of other ETFs. These risks are heightened during periods of market disruption or volatility.
Proxy Portfolio Risk: Unlike traditional ETFs, this fund does not disclose its portfolio holdings (Actual Portfolio) daily. The fund instead posts a Proxy Portfolio on its website each day. The Proxy Portfolio is designed to reflect the economic exposures and risk characteristics of the fund’s actual holdings on each trading day, but it is not the same as the fund’s Actual Portfolio. Although the Proxy Portfolio is intended to provide investors with enough information to allow for an effective arbitrage mechanism that will keep the market price of the Fund at or close to the underlying NAV per Share of the Fund, there is a risk (which may increase during periods of market disruption or volatility) that market prices will vary significantly from the underlying NAV of the fund. ETF trading on the basis of a published Proxy Portfolio may trade at a wider bid/ask spread than ETFs that publish their portfolios on a daily basis, especially during periods of market disruption or volatility, and therefore may cost investors more to trade. Also, while the Fund seeks to benefit from keeping its portfolio information secret, market participants may attempt to use the Proxy Portfolio to identify a Fund’s trading strategy, which if successful, could result in such market participants engaging in certain predatory trading practices that may have the potential to harm the Fund and its shareholders.
Proxy Portfolio Construction: The Proxy Portfolio is designed to recreate the daily performance of the Actual Portfolio. This is achieved by performing a “Factor Model” analysis of the Actual Portfolio. The Factor Model is comprised of three sets of factors or analytical metrics: market-based factors, fundamental factors, and industry/sector factors. The fund uses a “Model Universe” to generate its Proxy Portfolio. The Model Universe is comprised of securities that the fund can purchase and will be a financial index or stated portfolio of securities from which fund investments will be selected. The results of the Factor Model analysis are then applied to the Model Universe. The Proxy Portfolio is then generated as a result of this Model Universe analysis with the Proxy Portfolio being a small sub-set of the Model Universe. The Factor Model is applied to both the Actual Portfolio and the Model Universe to construct the fund’s Proxy Portfolio that performs in a manner substantially identical to the performance of its Actual Portfolio. The Proxy Portfolio will only include investments the fund is permitted to hold. The fund’s SAI contains more information on the Proxy Portfolio and its construction.
Proxy Portfolio and Proxy Overlap Information regarding the contents of the Proxy Portfolio, and the percentage weight overlap between the holdings of the Proxy Portfolio and the fund’s Actual Portfolio holdings that formed the basis for its calculation of NAV at the end of the prior Business Day (the Portfolio Overlap), is available by visiting the fund’s website www.schwabassetmanagement.com.
Because environmental, social and governance (ESG) strategies exclude some securities, ESG-focused products may not be able to take advantage of the same opportunities or market trends as products that do not use such strategies. Additionally, the criteria used to select companies for investment may result in investing in securities, industries or sectors that underperform the market as a whole.
This page is intentionally left blank.
| (a) | Registrant has adopted a code of ethics that applies to its principal executive officer, principal financial officer, and any other persons who perform a similar function, regardless of whether these individuals are employed by Registrant or a third party. |
| (c) | During the period covered by the report, no amendments were made to the provisions of this code of ethics. |
| (d) | During the period covered by the report, Registrant did not grant any waivers, including implicit waivers, from the provisions of this code of ethics. |
(f)(1) Registrant has filed this code of ethics as an exhibit pursuant to Item 13(a)(1) of Form N-CSR.
| Item 3: | Audit Committee Financial Expert. |
Registrant’s Board of Trustees has determined that Kimberly S. Patmore, Michael J. Beer and J. Derek Penn, each currently serving on its audit, compliance and valuation committee, are each an “audit committee financial expert,” as such term is defined in Item 3 of Form N-CSR. Each member of Registrant’s audit, compliance and valuation committee is “independent” under the standards set forth in Item 3 of Form N-CSR.
The designation of each of Ms. Patmore, Mr. Beer and Mr. Penn as an “audit committee financial expert” pursuant to Item 3 of Form N-CSR does not (i) impose upon such individual any duties, obligations, or liability that are greater than the duties, obligations and liability imposed upon such individual as a member of Registrant’s audit, compliance and valuation committee or Board of Trustees in the absence of such designation; and (ii) affect the duties, obligations or liability of any other member of Registrant’s audit, compliance and valuation committee or Board of Trustees.
| Item 4: | Principal Accountant Fees and Services. |
Registrant is composed of thirty operational series. Thirteen series have a fiscal year-end of August 31, whose annual financial statements are reported in Item 1, seven series have a fiscal year-end of the last day of February, two series have a fiscal year end of March 31, and eight series have a fiscal year-end of December 31. Principal accountant fees disclosed in Items 4(a)-(d) and 4(g) include fees billed for services rendered to each of the twenty-eight operational series during 2023/2024 and the twenty-seven operational series during 2022/2023, based on their respective 2023/2024 and 2022/2023 fiscal years, as applicable.
The following table presents fees billed by the principal accountant in each of the last two fiscal years for the services rendered to the Funds:
| | | | | | | | | | | | | | |
(a) Audit Fees1 | | (b) Audit-Related Fees | | (c) Tax Fees2 | | (d) All Other Fees |
Fiscal Year 2023/2024 | | Fiscal Year
2022/2023 | | Fiscal Year
2023/2024 | | Fiscal Year
2022/2023 | | Fiscal Year
2023/2024 | | Fiscal Year
2022/2023 | | Fiscal Year
2023/2024 | | Fiscal Year
2022/2023 |
$558,674 | | $494,150 | | $0 | | $0 | | $98,550 | | $86,800 | | $0 | | $0 |
| 1 | The nature of the services includes audit of the registrant’s annual financial statements and normally provided services in connection with regulatory filings for those fiscal years. |
| 2 | The nature of the services includes tax compliance, tax advice and tax planning. |
(e)(1) Registrant’s audit, compliance and valuation committee does not have pre-approval policies and procedures as described in paragraph (c)(7) of Rule 2-01 of Regulation S-X.
(2) There were no services described in each of paragraphs (b) through (d) above (including services required to be approved by Registrant’s audit, compliance and valuation committee pursuant to paragraph (c)(7)(ii) of Rule 2-01 of Regulation S-X) that were approved by Registrant’s audit, compliance and valuation committee pursuant to paragraph (c)(7)(i)(C) of Rule 2-01 of Regulation S-X.
(f) Not applicable.
(g) Below are the aggregate non-audit fees billed in each of the last two fiscal years by Registrant’s principal accountant for services rendered to Registrant, to Registrant’s investment adviser, and to any entity controlling, controlled by, or under common control with Registrant’s investment adviser that provides ongoing services to Registrant.
| | | | |
2023/2024: $3,399,066 | | 2022/2023: $ | 5,163,701 | |
(h) During the past fiscal year, all non-audit services provided by Registrant’s principal accountant to either Registrant’s investment adviser or to any entity controlling, controlled by, or under common control with Registrant’s investment adviser that provides ongoing services to Registrant were pre-approved. Included in the audit, compliance and valuation committee’s pre-approval was the review and consideration as to whether the provision of these non-audit services is compatible with maintaining the principal accountant’s independence.
(i) Not applicable.
(j) Not applicable.
| Item 5: | Audit Committee of Listed Registrants. |
The Registrant is a listed issuer as defined in Rule 10A-3 under the Exchange Act and has separately-designated standing audit, compliance and valuation committee established in accordance with Section 3(a)58(A) of the Exchange Act. The Registrant’s audit, compliance and valuation committee members are Kimberly S. Patmore, Michael J. Beer and J. Derek Penn.
| Item 6: | Schedule of Investments. |
The schedules of investments are included as part of the report to shareholders filed under Item 1 of this Form.
| Item 7: | Disclosure of Proxy Voting Policies and Procedures for Closed-End Management Investment Companies. |
Not applicable.
| Item 8: | Portfolio Managers of Closed-End Management Investment Companies. |
Not applicable.
| Item 9: | Purchases of Equity Securities by Closed-End Management Investment Company and Affiliated Purchasers. |
Not applicable.
| Item 10: | Submission of Matters to a Vote of Security Holders. |
Not applicable.
| Item 11: | Controls and Procedures. |
| (a) | Based on their evaluation of Registrant’s disclosure controls and procedures, as of a date within 90 days of the filing date, Registrant’s Chief Executive Officer, Omar Aguilar and Registrant’s Chief Financial Officer, Dana Smith, have concluded that Registrant’s disclosure controls and procedures are: (i) reasonably designed to ensure that information required to be disclosed in this report is appropriately communicated to Registrant’s officers to allow timely decisions regarding disclosures required in this report; (ii) reasonably designed to ensure that information required to be disclosed in this report is recorded, processed, summarized and reported in a timely manner; and (iii) are effective in achieving the goals described in (i) and (ii) above. |
| | (b) | During the period covered by this report, there have been no changes in Registrant’s internal control over financial reporting that the above officers believe to have materially affected, or to be reasonably likely to materially affect, Registrant’s internal control over financial reporting. |
| Item 12: | Disclosure of Securities Lending Activities for Closed-End Management Investment Companies. |
Not applicable.
Item 13: Exhibits.
(a) (1) Registrant’s code of ethics (that is the subject of the disclosure required by Item 2(a)) is attached.
Pursuant to the requirements of the Securities Exchange Act of 1934 and the Investment Company Act of 1940, the registrant has duly caused this report to be signed on its behalf by the undersigned, thereunto duly authorized.
(Registrant) Schwab Strategic Trust – Schwab U.S. Equity ETFs, Schwab International Equity ETFs and Schwab High Yield Bond ETF
| | |
| By: | | /s/ Omar Aguilar |
| | Omar Aguilar Chief Executive Officer |
| |
| Date: | | October 17, 2023 |
Pursuant to the requirements of the Securities Exchange Act of 1934 and the Investment Company Act of 1940, this report has been signed below by the following persons on behalf of the registrant and in the capacities and on the dates indicated.
| | |
| By: | | /s/ Omar Aguilar |
| | Omar Aguilar Chief Executive Officer |
| |
| Date: | | October 17, 2023 |
| |
| By: | | /s/ Dana Smith |
| | Dana Smith Chief Financial Officer |
| |
| Date: | | October 17, 2023 |