Washington, D.C. 20549
Gifford R. Zimmerman
Form N-CSR is to be used by management investment companies to file reports with the Commission not later than 10 days after the transmission to stockholders of any report that is required to be transmitted to stockholders under Rule 30e-1 under the Investment Company Act of 1940 (17 CFR 270.30e-1). The Commission may use the information provided on Form N-CSR in its regulatory, disclosure review, inspection, and policymaking roles.
A registrant is required to disclose the information specified by Form N-CSR, and the Commission will make this information public. A registrant is not required to respond to the collection of information contained in Form N-CSR unless the Form displays a currently valid Office of Management and Budget (“OMB”) control number. Please direct comments concerning the accuracy of the information collection burden estimate and any suggestions for reducing the burden to Secretary, Securities and Exchange Commission, 450 Fifth Street, NW, Washington, DC 20549-0609. The OMB has reviewed this collection of information under the clearance requirements of 44 U.S.C. ss. 3507.
ITEM 1. REPORTS TO STOCKHOLDERS.
Life is Complex.
Nuveen makes things e-simple.
It only takes a minute to sign up for e-Reports. Once enrolled, you’ll receive an e-mail as soon as your Nuveen Fund information is ready—no more waiting for delivery by regular mail. Just click on the link within the e-mail to see the report and save it on your computer if you wish.
Free e-Reports
right to your e-mail!
www.investordelivery.com
If you receive your Nuveen Fund
dividends and statements from your
financial advisor or brokerage account.
or
www.nuveen.com/client-access
If you receive your Nuveen Fund
dividends and statements directly from
Nuveen.
NOT FDIC INSURED MAY LOSE
VALUE NO BANK GUARANTEE
Table of Contents
| | |
| Chairman’s Letter to Shareholders | 4 |
| | |
| Portfolio Manager’s Comments | 5 |
| | |
| Fund Leverage | 10 |
| | |
| Common Share Information | 12 |
| | |
| Risk Considerations | 14 |
| | |
| Performance Overview and Holding Summaries | 15 |
| | |
| Shareholder Meeting Report | 23 |
| | |
| Report of Independent Registered Public Accounting Firm | 24 |
| | |
| Portfolios of Investments | 25 |
| | |
| Statement of Assets and Liabilities | 64 |
| | |
| Statement of Operations | 65 |
| | |
| Statement of Changes in Net Assets | 66 |
| | |
| Statement of Cash Flows | 68 |
| | |
| Financial Highlights | 70 |
| | |
| Notes to Financial Statements | 75 |
| | |
| Additional Fund Information | 90 |
| | |
| Glossary of Terms Used in this Report | 91 |
| | |
| Reinvest Automatically, Easily and Conveniently | 93�� |
| | |
| Board Members & Officers | 94 |
3
Chairman’s Letter to Shareholders
Dear Shareholders,
Financial markets rallied in the early months of 2019, in sharp contrast to the downturn at the end of 2018, leaving investors to wonder whether such bullishness is warranted or sustainable. By the close of 2018, economic softness in China, Europe and Japan had proven more persistent than expected. The temporary boost to the U.S. economy from tax law changes appeared to be fading. Corporate earnings and profits were slowing, and some corporate managements, especially at high-profile technology companies, were downgrading their outlooks. Politics remained unpredictable, most notably with the Brexit and U.S.-China trade talks ongoing. The European Central Bank (ECB) ended its crisis-era monetary stimulus program with pledges to keep interest rates low for an extended period, while the U.S. Federal Reserve (Fed) planned to continue raising interest rates into 2019.
As the new year began, economic data have remained a mixed bag, and investors will be closely watching the first quarter 2019 corporate earnings reports. However, market sentiment shifted significantly after both the Fed and ECB turned remarkably more dovish in their interest rate projections and lowered their growth forecasts. The U.S. and China appear to be making progress on trade talks, such that President Trump did not increase tariffs as initially planned in March 2019. While these events did reduce some of the markets’ uncertainty, downside risks still appear to be rising.
Nevertheless, we believe the likelihood of a near-term recession remains low. Global growth is indeed slowing, but it’s still positive. The U.S. economy remains strong, even in the face of late-cycle pressures. Low unemployment and firming wages should continue to support consumer spending, and the November mid-term elections resulted in change, but no major surprises. In China, the government remains committed to using fiscal stimulus to offset softening exports. Europe also remains vulnerable to trade policy as well as Brexit uncertainty, but underlying strengths in European economies, including low unemployment that drives domestic demand, remain supportive of a mild expansion. In a slower growth environment, there are opportunities for investors who seek them more selectively.
We expect volatility and challenging conditions to persist in 2019 but also think there is potential for upside. You can prepare your investment portfolio by working with your financial advisor to review your goals, timeline and risk tolerance. On behalf of the other members of the Nuveen Fund Board, we look forward to continuing to earn your trust in the months and years ahead.
Sincerely,
Terence J. Toth
Chairman of the Board
April 23, 2019
4
Portfolio Manager’s Comments
Nuveen New Jersey Quality Municipal Income Fund (NXJ)
Nuveen New Jersey Municipal Value Fund (NJV)
Nuveen Pennsylvania Quality Municipal Income Fund (NQP)
Nuveen Pennsylvania Municipal Value Fund (NPN)
These Funds feature portfolio management by Nuveen Asset Management, LLC (NAM), an affiliate of Nuveen, LLC. Portfolio manager Paul L. Brennan, CFA, reviews U.S. economic and municipal market conditions at the national and state levels, key investment strategies and the twelve-month performance of the Nuveen New Jersey and Pennsylvania Funds. Paul assumed portfolio management responsibility for these four Funds in 2011.
What factors affected the U.S. economy and the national municipal bond market during the twelve-month reporting period ended February 28, 2019?
The U.S. economy continued to grow at a solid pace during the reporting period. Gross domestic product (GDP), which measures the value of goods and services produced by the nation’s economy less the value of the goods and services used up in production, adjusted for price changes, grew at an annualized rate of 2.2% in the fourth quarter of 2018, according to the Bureau of Economic Analysis “third” estimate. Consumer and business spending supported growth in the final months of 2018, while a weaker housing market and a larger trade deficit subtracted from GDP. For the full year 2018, U.S. GDP growth came in at 2.9%, as economic activity cooled over the second half of 2018 after peaking at 4.2% (annualized) in the second quarter of 2018.
Consumer spending, the largest driver of the economy, remained well supported by low unemployment, wage gains and tax cuts. As reported by the Bureau of Labor Statistics, the unemployment rate fell to 3.8% in February 2019 from 4.1% in February 2018 and job gains averaged around 209,000 per month for the past twelve months. As the jobs market has tightened, average hourly earnings grew at an annualized rate of 3.4% in February 2019. However, falling energy prices led to a slower rate of inflation over the past twelve months. The Consumer Price Index (CPI) increased 1.5% over the twelve-month reporting period ended February 28, 2019 before seasonal adjustment, as reported by the Bureau of Labor Statistics.
Low mortgage rates and low inventory drove home prices higher during this recovery cycle. But the pace of price increases has slowed as mortgage rates drifted higher and homes have become less affordable. The S&P CoreLogic Case-Shiller U.S. National Home Price Index, which covers all nine U.S. census divisions, was up 4.3% year-over-year in January 2019 (most recent data available at the time this report was prepared). The 10-City and 20-City Composites reported year-over-year increases of 3.2% and 3.6%, respectively.
This material is not intended to be a recommendation or investment advice, does not constitute a solicitation to buy, sell or hold a security or an investment strategy and is not provided in a fiduciary capacity. The information provided does not take into account the specific objectives or circumstances of any particular investor, or suggest any specific course of action. Investment decisions should be made based on an investor’s objectives and circumstances and in consultation with his or her advisors.Certain statements in this report are forward-looking statements. Discussions of specific investments are for illustration only and are not intended as recommendations of individual investments. The forward-looking statements and other views expressed herein are those of the portfolio manager as of the date of this report. Actual future results or occurrences may differ significantly from those anticipated in any forward-looking statements, and the views expressed herein are subject to change at any time, due to numerous market and other factors. The Funds disclaim any obligation to update publicly or revise any forward-looking statements or views expressed herein.
For financial reporting purposes, the ratings disclosed are the highest rating given by one of the following national rating agencies: Standard & Poor’s Group (S&P), Moody’s Investors Service, Inc. (Moody’s) or Fitch, Inc. (Fitch). This treatment of split-rated securities may differ from that used for other purposes, such as for Fund investment policies. Credit ratings are subject to change. AAA, AA, A and BBB are investment grade ratings, while BB, B, CCC, CC, C and D are below investment grade ratings. Holdings designated N/R are not rated by these national rating agencies.
Bond insurance guarantees only the payment of principal and interest on the bond when due, and not the value of the bonds themselves, which will fluctuate with the bond market and the financial success of the issuer and the insurer. Insurance relates specifically to the bonds in the portfolio and not to the share prices of a Fund. No representation is made as to the insurers’ ability to meet their commitments.
Refer to the Glossary of Terms Used in this Report for further definition of the terms used within this section.
5
Portfolio Manager’s Comments (continued)
As some data began pointing to slower momentum in the overall economy, the Federal Reserve (Fed) notably shifted its stance. From December 2015 through December 2018, the Fed had gradually lifted its main policy interest rate to prevent the economy from overheating. In its final meeting of 2018, the Fed indicated that two more rate hikes might be forthcoming in 2019, roiling the markets, which had expected a more dovish tone. However, as more recent data revealed a mixed picture of the economy, the Fed said it would adopt a more “patient” approach, signaling the possibility of no rate hikes in 2019. As expected, the Fed held rates steady at its January 2019 committee meeting. Subsequent to the end of the reporting period, at its March 2019 meeting, the Fed again kept rates unchanged and further clarified that it will discontinued rolling assets off its balance sheet in September 2019, sooner than many observers expected.
During the twelve-month reporting period, geopolitical news remained a prominent market driver. The U.S. moved forward with tariffs on imported goods from China, as well as on steel and aluminum from Canada, Mexico and Europe. These countries announced retaliatory measures in kind, intensifying concerns about a trade war, although there have been some positive developments. In July 2018, the U.S. and the European Union announced they would refrain from further tariffs while they negotiate trade terms, and in October 2018, the U.S., Mexico and Canada agreed to a new trade deal to replace the North American Free Trade Agreement. At the November 2018 G-20 summit, the U.S. and China settled on a 90-day trade truce, and after the countries resumed trade talks in early 2019, President Trump said he would not increase the tariffs in March 2019 as planned. Brexit negotiations continued to be uncertain, and Prime Minister Theresa May faced significant difficulty getting a plan approved in Parliament. (Subsequent to the end of the reporting period, the European Union approved a conditional delay, allowing the U.K. more time to approve a plan.) Europe also contended with Italy’s new euroskeptic coalition government, the “yellow vest” protests in France, immigration policy concerns and political risk in Turkey. The U.S. Treasury issued additional sanctions on Russia in April 2018 and re-imposed sanctions on Iran following the U.S. withdrawal from the 2015 nuclear agreement. Bearish crude oil supply news, along with heightened tensions between the U.S. and Saudi Arabia after the disappearance of a Saudi journalist, drove oil price volatility. On the Korean peninsula, the leaders of South Korea and North Korea met during April 2018 and jointly announced a commitment toward peace, while the U.S. and North Korea held a denuclearization summit in June 2018 and a second summit in February 2019 without securing an agreement. In late December 2018, the U.S. government entered a 35-day partial shutdown due to an impasse on border security funding. Concerns about a second shutdown were alleviated after the government passed a funding bill in February 2019.
Municipal bonds delivered positive performance in this reporting period. Interest rates were increasing through much of the reporting period, as a strong economic backdrop kept the Fed on its course of monetary tightening. The 10-year U.S. Treasury yield peaked at 3.24% in November 2018. However, in December 2018, market volatility spiked as uncertain trade policy, Brexit negotiations, and weak macro data in Europe and China weighed on the U.S. growth outlook. Equities and riskier segments of the bond market sold off sharply in the fourth quarter of 2018. Following the Fed’s December meeting, investor expectations for a pause in rate increases drove repricing in the markets, driving long-term interest meaningfully lower through the end of the reporting period. While the U.S. Treasury yield curve flattened over this reporting period, the municipal yield curve “twisted” by flattening at the short end and steepening at the long end of the curve. For the twelve-month period overall, municipal bond yields were marginally lower, belying larger intra-period swings.
Supply and demand conditions in the municipal bond market were favorable to performance in this reporting period, particularly in the latter three months. Issuance has been subdued since the passage of the Tax Cuts and Jobs Act of 2017. Because new issue advance refunding bonds are no longer tax exempt under the new tax law, the total supply of municipal bonds has decreased, boosting the scarcity value of existing municipal bonds. Municipal bond issuance nationwide totaled $347.3 billion in this reporting period, a 19.0% decrease from the issuance for the twelve-month reporting period ended February 28, 2018. Nevertheless, the overall low level of interest rates encouraged issuers to continue to actively refund their outstanding debt. In these transactions the issuers are issuing new bonds and taking the bond proceeds and redeeming (calling) old bonds. These refunding transactions have ranged from 40% to 60% of total issuance over the past few years. Thus, the net issuance (all bonds issued less bonds redeemed) is actually much lower than the gross issuance. So, while gross issuance volume has been strong, the net has not, and this was an overall positive technical factor on municipal bond investment performance in recent years. Although the pace of refundings is slowing, net negative issuance is expected to continue.
6
Low global interest rates have continued to drive investors toward higher after-tax yielding assets, including U.S. municipal bonds. The Fed’s pivot to a more dovish stance in early 2019 also brought investors back to fixed income markets, including municipal bonds, driving large inflows into the asset class in the early months of 2019. Additionally, as tax payers have begun to assess the impact of the 2017 tax law, which caps the state and local tax (SALT) deduction for individuals, demand for tax-exempt municipal bonds, especially in states with high income and/or property taxes, is expected to increase.
How were the economic and market environments in New Jersey and Pennsylvania during the twelve-month reporting period ended February 28, 2019?
New Jersey’s economic recovery from the recession continues to be slow. The state has several characteristics that position it to do quite well, such as its proximity to New York City’s extensive job market, a shoreline along the Atlantic coast that benefits from a strong tourism industry and two large transportation hubs in the Port of New York and New Jersey and Newark airport. However, for years following the recession, the state’s recovery fell short of many of its peers. New Jersey had the slowest job growth rate in the Northeast until the middle of 2015. In 2017, the construction, information and professional and business services sectors lost jobs, while a number of industries including health care, transportation, leisure and hospitality, and manufacturing reported job gains. As of February 2019, the state’s unemployment rate registered 4.0%, higher than the national rate of 3.8%. Maintaining and upgrading infrastructure is key to economic growth. To address the dire need to finance infrastructure projects, the New Jersey legislature voted to raise the per-gallon tax on gas and diesel effective November 1, 2016. Prior to this, all revenues coming into the transportation trust fund were needed to cover debt service. While resources dedicated to transportation funding are set to increase, the state reduced its sales tax rate and phased out the estate tax, so general operating revenues are projected to decline. However, Governor Murphy’s proposed Fiscal Year 2019 budget restores the sales tax rate, institutes a millionaire’s tax, and counts on legalizing marijuana and closing loopholes in the corporate tax model to generate new revenues. The sluggishness of the state’s recovery exacerbated fiscal pressures caused by growing pension, health care and debt service payments. In the proposed Fiscal Year 2019 budget, expenditures on these three line items constitute 25% of expenses. The $3.2 billion pension payment in the Fiscal Year 2019 budget proposed by Governor Murphy funds only 60% of the actuarially recommended contribution. The state has been downgraded several times in recent years and now carries an A- rating by S&P, A3 by Moody’s and A by Fitch, all with stable outlooks. For the twelve months ending February 28, 2019, the state issued $12.5 billion in tax exempt debt, a gross issuance year-over-year increase of 6.3%.
The Pennsylvania economy fared well in 2018. Job growth of 1.3% was the strongest since 2000, although it still trailed the national average of 1.6%. The pickup in hiring pushed the Commonwealth’s unemployment rate down to 4.0%, the lowest level since before the 2008-2009 recession. Pennsylvania’s economy is a fairly stable one, which tends to track the national economy but with less volatility. During periods of national economic contraction, Pennsylvania tends to outperform the U.S. in areas such as growth in real personal income and employment. However, during periods of economic expansion, Pennsylvania has often lagged the rate of growth of the national economy. The education and health care sectors represent an outsized 21.2% of total employment in the Commonwealth. Approximately two-fifths of the net new jobs in the state in 2018 were in health care. An aging population is driving the demand. The Marcellus Shale natural gas deposits continues to benefit many of the state’s local economies with employment and infrastructure investment. Unlike all other major natural-resource producing states, Pennsylvania currently does not tax gas production directly. The Commonwealth also has a history of late budget passage and structural deficits. The state has relied heavily on one-time revenue sources and borrowing to fund its increased spending. In 2018, the state issued almost $1.7 billion of deficit financing to plug part of its Fiscal Year 2017 budgetary gap of $3.2 billion. The state closed Fiscal Year 2018 with a modest operating surplus, enabling it to deposit $22 million into its rainy day fund. This was the first deposit to the rainy day fund since the recession. On a budgetary basis, Pennsylvania’s 2018 year-end General Fund balance, including its rainy day fund, was a very limited 0.2% of that year’s spending. Fiscal Year 2019 year-to-date revenue collection is strong, reflecting the improving economy. Through February 2019, overall tax revenue is $1.1 billion, or 5.7%, more than was collected in the same period of the last fiscal year. As of February 2019, Pennsylvania’s general obligation (GO) debt was rated Aa3 by Moody’s and A+ by S&P. For the twelve months ended February 2019, $20.1 billion in new municipal bonds were issued in the Commonwealth, a gross issuance decrease of 41.9% from the previous twelve months.
7
Portfolio Manager’s Comments (continued)
What key strategies were used to manage these Funds during the twelve-month reporting period ended February 28, 2019?
Municipal bonds performed well during the reporting period amid positive fundamental credit conditions and a favorable technical supply-demand balance. Both New Jersey’s and Pennsylvania’s municipal bond markets outperformed the national municipal market over this reporting period.
We also note that New Jersey is among the states with the highest personal income and property taxes, which will be more meaningfully affected by the new limits on state and local tax, or SALT, deductions. In early 2019, as individuals were beginning to file their tax returns under the new caps, some were likely to see higher-than-expected tax liabilities, especially in New Jersey and other high income tax states. As a result, demand for in-state municipal bonds, which offer both state and federal tax advantages, is expected to grow.
Our trading activity continued to focus on pursuing the Funds’ investment objectives. We continued to seek bonds in areas of the market that we expected to perform well as the economy continued to improve. In this reporting period, we opportunistically bought bonds offering better relative value and long-term total return potential. The New Jersey Funds added to housing bonds (including single-family and multi-family housing), which offered attractive yields and reduced exposure to the state of New Jersey’s ongoing fiscal challenges because the bonds are backed by the underlying mortgage portfolios. NXJ and NJV also bought student loan housing bonds, health care (hospitals) and toll road bonds issued for the Delaware River Port Authority. After the state of New Jersey refunded its tobacco settlement bonds in this reporting period, we reinvested some of the proceeds from the called tobacco bonds, which were rated below investment grade, back into the new issues, which were issued with investment grade ratings. Although we have generally sought to limit the Funds’ exposure to state-supported obligations, state-backed issuance was elevated during this reporting period. We tactically bought some of these deals using the bonds as potential short-term placeholders when a more attractive long-term opportunity arises.
The Pennsylvania Funds also opportunistically bought housing, health care and higher education credits. Like New Jersey, the Pennsylvania housing bonds we invested in offered attractive yields, and these bonds are also backed by the underlying mortgage portfolios rather than relying on the state to service the debt.
To fund these purchases, we reinvested the proceeds primarily from called and maturing bonds. We also selectively sold positions with short maturities such as pre-refunded bonds, bonds nearing their call dates and some higher quality positions that had appreciated due to strong demand, which could be swapped for more attractive relative long-term opportunities.
NJV and NPN hold meaningful exposure to bonds with 2019 call dates. As we sought to diversify call risk in the two Funds, we sold some of these bonds. The Funds also experienced an elevated level of refundings in its portfolio in this reporting period. The two Funds were launched in 2009 when interest rates were higher and refundings of bonds callable in 2019 is likely to remain elevated in the current environment of still-low interest rates. However, we should note these trades have had a negative impact on the two Funds’ earnings in the short term. To keep the Funds fully invested, the older bonds, which were issued when prevailing interest rates were higher, are being replaced with the lower-yielding bonds available in the current market.
In NQP, we sought to reduce the cost of leverage by adding tender option bonds (TOBs) and using the proceeds to redeem some of the preferred shares leverage. (For more information, see the Fund Leverage commentary following this portfolio manager's commentary.)
As of February 28, 2019, all of these Funds continued to use inverse floating rate securities. We employ inverse floaters for a variety of reasons, including duration management, income enhancement and total return enhancement. As part of our duration management strategies, NJV, NQP and NPN used U.S. Treasury futures as part of an overall portfolio construction strategy to manage portfolio duration and yield curve exposure. NXJ, NJV and NQP also used forward interest rate swaps to help reduce price volatility risk to movements in U.S. interest rates relative to the Funds’ benchmark. The forward interest rate swap positions were eliminated from NJV and NQP prior to the end of the reporting period. The hedging strategies performed as expected given the direction of interest rates during the reporting period.
8
How did the Funds perform during the twelve-month reporting period ended February 28, 2019?
The tables in each Fund's Performance Overview and Holding Summaries section of this report provide the Funds’ total returns for the one-year, five-year, ten-year and since inception periods ended February 28, 2019. Each Fund’s total returns at common share net asset value (NAV) are compared with the performance of corresponding market indexes.
For the twelve-month reporting period ended February 28, 2019, the total returns on common share NAV for NXJ and NQP outperformed that of the national S&P Municipal Bond Index and their respective state’s S&P Municipal Bond Index, and NJV and NPN underperformed both the national index and their respective state’s S&P Municipal Bond Index.
Duration and yield curve positioning contributed positively to the Funds’ relative performance in the reporting period. The Funds’ longer overall durations were beneficial in an environment of falling interest rates. As bonds maturing in five years and longer outperformed shorter dated bonds, the Funds’ overweight allocations to intermediate and longer bonds and underweight allocations to shorter dated credits were advantageous to performance.
Individual credit selection was also an important performance driver for the four Funds in this reporting period. Stabilization in the state of New Jersey’s credit conditions lifted the performance of NXJ’s and NJV’s holdings in state-supported bonds. The New Jersey Funds also benefited from selections in transportation (especially toll road) bonds, which have performed well as the strong economy has translated to increased road and air travel, and health care (especially hospital) credits, which continued to benefit from a consolidation trend in New Jersey hospitals. NXJ’s and NJV’s tobacco holdings, however, fared less well during the reporting period. Although our holdings had positive returns, the group as a whole lagged the broad market on concerns that proposed regulatory changes could hurt smoking rates and cigarette sales in the future. The two New Jersey Funds’ pre-refunded bonds also underperformed, as short-dated, high quality bonds trailed the broad market in this reporting period.
In NQP and NPN, holdings in FirstEnergy Solutions were notable positive contributors to performance. The energy supplier had performed poorly earlier in 2017 amid credit concerns relating to its parent company’s plan to exit the power generation business. However, valuations recovered from those lows following progress on negotiations with bondholders (as explained in “An Update on FirstEnergy Solutions Corp.” at the end of this commentary). Our security selection was also favorable in health care, transportation, tax-supported (including local school district GO bonds and selected state-backed bonds) and housing credits. The Pennsylvania Funds’ pre-refunded bonds also underperformed in this reporting period.
Credit rating and sector allocations had a relatively neutral impact on performance during this reporting period.
As mentioned previously, NJV, NQP and NPN employed U.S. Treasury futures, while NXJ, NJV and NQP employed forward interest rate swaps. The futures contracts had a negligible impact on the total return performance of NJV, NQP and NPN. The forward interest rate swaps had a slightly negative impact on the total return performance of NJV and a negligible impact for NXJ and NQP.
In addition, the use of regulatory leverage was a factor affecting the performance of NXJ and NQP. NJV and NPN do not use regulatory leverage. Leverage is discussed in more detail later in the Fund Leverage section of this report.
An Update on FirstEnergy Solutions Corp.
FirstEnergy Solutions Corp. and all of its subsidiaries filed for protection under Chapter 11 of the U.S. Bankruptcy Code on April 1, 2018. FirstEnergy Solutions and its subsidiaries specialize in coal and nuclear energy production. It is one of the main energy producers in the state of Ohio and a major energy provider in Pennsylvania. Because of the challenging market environment for nuclear and coal power in the face of inexpensive natural gas, FirstEnergy Corp., FirstEnergy Solution’s parent announced in late 2016 that it would begin a strategic review of its generation assets. FirstEnergy Solutions is a unique corporate issuer in that the majority of its debt was issued in the municipal market to finance pollution control and waste disposal for its coal and nuclear plants. A substantial amount of bondholders, of which Nuveen Funds are included, entered into an “Agreement in Principal” with FirstEnergy Corp., to resolve potential claims that bondholders may have against FirstEnergy Corp. The agreement is subject to the approval of the FirstEnergy Corp. board of directors, FirstEnergy Solutions and the bankruptcy court.
In terms of FirstEnergy holdings, shareholders should note that NQP had 2.13% and NPN had 1.91% exposure, which was a mix of unsecured and secured holdings. NXJ and NJV had no exposure to FirstEnergy.
9
Fund Leverage
IMPACT OF THE FUNDS’ LEVERAGE STRATEGIES ON PERFORMANCE
One important factor impacting the returns of the Funds’ common shares relative to their comparative benchmarks was the Funds’ use of leverage through their issuance of preferred shares and/or investments in inverse floating rate securities, which represent leveraged investments in underlying bonds. NJV and NPN do not use regulatory leverage. The Funds use leverage because our research has shown that, over time, leveraging provides opportunities for additional income, particularly in the recent market environment where short-term market rates are at or near historical lows, meaning that the short-term rates the Fund has been paying on its leveraging instruments in recent years have been much lower than the interest the Fund has been earning on its portfolio of long-term bonds that it has bought with the proceeds of that leverage.
However, use of leverage can expose Fund common shares to additional price volatility. When a Fund uses leverage, the Fund common shares will experience a greater increase in their net asset value if the municipal bonds acquired through the use of leverage increase in value, but will also experience a correspondingly larger decline in their net asset value if the bonds acquired through leverage decline in value, which will make the shares’ net asset value more volatile, and total return performance more variable, over time.
In addition, common share income in levered funds will typically decrease in comparison to unlevered funds when short-term interest rates increase and increase when short-term interest rates decrease. Over the last few quarters, short-term interest rates have indeed increased from their extended lows after the 2007-09 financial crisis. This increase has reduced common share net income, and also reduced potential for long-term total returns. Nevertheless, the ability to effectively borrow at current short-term rates is still resulting in enhanced common share income, and management believes that the advantages of continuation of leverage outweigh the associated increase in risk and volatility described above.
Leverage from issuance of preferred shares had a positive impact on the performance of NXJ and NQP over the reporting period. The use of leverage through inverse floating rate securities had a positive impact on the performance of the Funds over the reporting period.
As of February 28, 2019, the Funds’ percentages of leverage are as shown in the accompanying table.
| | | | | | | | | | | | | |
| | | NXJ | | | NJV | | | NQP | | | NPN | |
| Effective Leverage* | | | 39.58 | % | | | 7.10 | % | | | 40.18 | % | | | 4.51 | % |
| Regulatory Leverage* | | | 32.81 | % | | | 0.00 | % | | | 27.96 | % | | | 0.00 | % |
| * | Effective Leverage is a Fund’s effective economic leverage, and includes both regulatory leverage and the leverage effects of certain derivative and other investments in a Fund’s portfolio that increase the Fund’s investment exposure. Currently, the leverage effects of Tender Option Bond (TOB) inverse floater holdings are included in effective leverage values, in addition to any regulatory leverage. Regulatory leverage consists of preferred shares issued or borrowings of a Fund. Both of these are part of a Fund’s capital structure. A Fund, however, may from time to time borrow on a typically transient basis in connection with its day-to-day operations, primarily in connection with the need to settle portfolio trades. Such incidental borrowings are excluded from the calculation of a Fund’s effective leverage ratio. Regulatory leverage is subject to asset coverage limits set forth in the Investment Company Act of 1940. |
10
THE FUNDS’ REGULATORY LEVERAGE
As of February 28, 2019, the following Funds have issued and outstanding preferred shares as shown in the accompanying table. As mentioned previously, NJV and NPN do not use regulatory leverage.
| | | | | | | | | | |
| | | Variable Rate Preferred* | | | Variable Rate Remarketed Preferred** | | | | |
| | | Shares Issued at Liquidation Preference | | | Shares Issued at Liquidation Preference | | | Total | |
| NXJ | | $ | 313,900,000 | | | $ | — | | | $ | 313,900,000 | |
| NQP | | $ | 217,500,000 | | | $ | — | | | $ | 217,500,000 | |
| * | Preferred shares of the Fund featuring a floating rate dividend based on a predetermined formula or spread to an index rate. Includes the following preferred shares AMTP, iMTP, VMTP, MFP- VRM and VRDP in Special Rate Mode, where applicable. See Notes to Financial Statements, Note 4 – Fund Shares, Preferred Shares for further details. |
| ** | Preferred shares of the Fund featuring floating rate dividends set by a remarketing agent via a regular remarketing. Includes the following preferred shares VRDP not in Special Rate Mode, MFP- VRRM and MFP-VRDM, where applicable. See Notes to Financial Statements, Note 4 – Fund Shares, Preferred Shares for further details. |
Refer to Notes to Financial Statements, Note – 4 Fund Shares, Preferred Shares for further details on preferred shares and each Fund’s respective transactions.
11
Common Share Information
COMMON SHARE DISTRIBUTION INFORMATION
The following information regarding the Funds’ distributions is current as of February 28, 2019. Each Fund’s distribution levels may vary over time based on each Fund’s investment activity and portfolio investment value changes.
During the current reporting period, each Fund’s distributions to common shareholders were as shown in the accompanying table.
| | | | | | | | | | | | | |
| | | Per Common Share Amounts | |
| Monthly Distributions (Ex-Dividend Date) | | NXJ | | | NJV | | | NQP | | | NPN | |
| March 2018 | | $ | 0.0580 | | | $ | 0.0475 | | | $ | 0.0535 | | | $ | 0.0430 | |
| April | | | 0.0580 | | | | 0.0475 | | | | 0.0535 | | | | 0.0430 | |
| May | | | 0.0580 | | | | 0.0475 | | | | 0.0535 | | | | 0.0430 | |
| June | | | 0.0545 | | | | 0.0450 | | | | 0.0505 | | | | 0.0430 | |
| July | | | 0.0545 | | | | 0.0450 | | | | 0.0505 | | | | 0.0430 | |
| August | | | 0.0545 | | | | 0.0450 | | | | 0.0505 | | | | 0.0430 | |
| September | | | 0.0545 | | | | 0.0450 | | | | 0.0470 | | | | 0.0405 | |
| October | | | 0.0545 | | | | 0.0450 | | | | 0.0470 | | | | 0.0405 | |
| November | | | 0.0545 | | | | 0.0450 | | | | 0.0470 | | | | 0.0405 | |
| December | | | 0.0545 | | | | 0.0450 | | | | 0.0470 | | | | 0.0405 | |
| January | | | 0.0545 | | | | 0.0450 | | | | 0.0470 | | | | 0.0405 | |
| February 2019 | | | 0.0545 | | | | 0.0450 | | | | 0.0470 | | | | 0.0405 | |
| Total Distributions from Net Investment Income | | $ | 0.6645 | | | $ | 0.5475 | | | $ | 0.5940 | | | $ | 0.5010 | |
| Total Distributions from Long-Term Capital Gains* | | $ | 0.0778 | | | $ | 0.3390 | | | $ | 0.0442 | | | $ | 0.1044 | |
| Total Distributions | | $ | 0.7423 | | | $ | 0.8865 | | | $ | 0.6382 | | | $ | 0.6054 | |
| | |
| Yields | | | | | | | | | | | | | | | | |
| Market Yield** | | | 4.86 | % | | | 4.13 | % | | | 4.33 | % | | | 3.68 | % |
| Taxable-Equivalent Yield** | | | 6.92 | % | | | 5.81 | % | | | 5.93 | % | | | 5.03 | % |
| * | Distribution paid December 2018. |
| ** | Market Yield is based on the Fund’s current annualized monthly dividend divided by the Fund’s current market price as of the end of the reporting period. Taxable-Equivalent Yield represents the yield that must be earned on a fully taxable investment in order to equal the yield of the Fund on an after-tax basis. It is based on a combined federal and state income tax rate of 29.8%, 29.0%, 26.9% and 25.7% for NXJ, NJV, NQP and NPN, respectively. Your actual combined federal and state income tax rate may differ from the assumed rate. The Taxable-Equivalent Yield also takes into account the percentage of the Fund’s income generated and paid by the Fund (based on payments made during the previous calendar year) that was either exempt from federal income tax but not from state income tax (e.g., income from an out-of-state municipal bond), or was exempt from neither federal nor state income tax. Separately, if the comparison were instead to investments that generate qualified dividend income, which is taxable at a rate lower than an individual’s ordinary graduated tax rate, the fund’s Taxable-Equivalent Yield would be lower. |
Each Fund seeks to pay regular monthly dividends out of its net investment income at a rate that reflects its past and projected net income performance. To permit each Fund to maintain a more stable monthly dividend, the Fund may pay dividends at a rate that may be more or less than the amount of net income actually earned by the Fund during the period. Distributions to shareholders are determined on a tax basis, which may differ from amounts recorded in the accounting records. In instances where the monthly dividend exceeds the earned net investment income, the Fund would report a negative undistributed net ordinary income. Refer to Note 6 – Income Tax Information for additional information regarding the amounts of undistributed net ordinary income and undistributed net long-term capital gains and the character of the actual distributions paid by the Fund during the period.
12
All monthly dividends paid by each Fund during the current reporting period were paid from net investment income. If a portion of the Fund’s monthly distributions is sourced or comprised of elements other than net investment income, including capital gains and/or a return of capital, shareholders will be notified of those sources. For financial reporting purposes, the per share amounts of each Fund’s distributions for the reporting period are presented in this report’s Financial Highlights. For income tax purposes, distribution information for each Fund as of its most recent tax year end is presented in Note 6 – Income Tax Information within the Notes to Financial Statements of this report.
COMMON SHARE REPURCHASES
During August 2018, the Funds’ Board of Trustees reauthorized an open-market share repurchase program, allowing each Fund to repurchase an aggregate of up to approximately 10% of its outstanding shares.
As of February 28, 2019, and since the inception of the Funds’ repurchase programs, the Funds have cumulatively repurchased and retired their outstanding common shares as shown in the accompanying table.
| | | | | | | | | | | | | |
| | | NXJ | | | NJV | | | NQP | | | NPN | |
| Common shares cumulatively repurchased and retired | | | 1,685,000 | | | | 35,501 | | | | 734,900 | | | | 3,500 | |
| Common shares authorized for repurchase | | | 4,215,000 | | | | 155,000 | | | | 3,760,000 | | | | 120,000 | |
During the current reporting period, the Funds repurchased and retired their common shares at a weighted average price per common share and a weighted average discount per common share as shown in the accompanying table.
| | | | | | | | | | | | | |
| | | NXJ | | | NJV | | | NQP | | | NPN | |
| Common shares repurchased and retired | | | 1,026,800 | | | | 20,501 | | | | 356,000 | | | | 3,500 | |
| Weighted average price per common share repurchased and retired | | $ | 12.87 | | | $ | 12.65 | | | $ | 12.34 | | | $ | 12.26 | |
| Weighted average discount per common share repurchased and retired | | | 15.84 | % | | | 15.16 | % | | | 15.54 | % | | | 15.59 | % |
OTHER COMMON SHARE INFORMATION
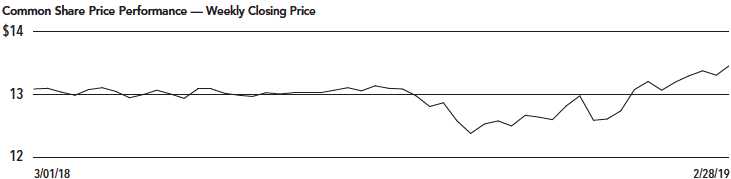
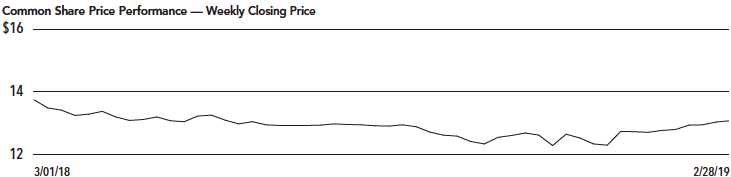
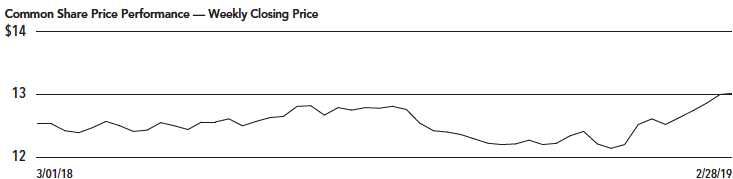
As of February 28, 2019, and during the current reporting period, the Funds’ common share prices were trading at a premium/ (discount) to their common share NAVs as shown in the accompanying table.
| | | | | | | | | | | | | |
| | | NXJ | | | NJV | | | NQP | | | NPN | |
| Common share NAV | | $ | 15.49 | | | $ | 14.81 | | | $ | 14.99 | | | $ | 14.75 | |
| Common share Price | | $ | 13.47 | | | $ | 13.08 | | | $ | 13.02 | | | $ | 13.19 | |
| Premium/(Discount) to NAV | | | (13.04 | )% | | | (11.68 | )% | | | (13.14 | )% | | | (10.58 | )% |
| 12-month average premium/(discount) to NAV | | | (15.38 | )% | | | (13.93 | )% | | | (14.95 | )% | | | (8.71 | )% |
13
Risk Considerations
Fund shares are not guaranteed or endorsed by any bank or other insured depository institution, and are not federally insured by the Federal Deposit Insurance Corporation.
Nuveen New Jersey Quality Municipal Income Fund (NXJ)
Investing in closed-end funds involves risk; principal loss is possible. There is no guarantee the Fund’s investment objectives will be achieved. Closed-end fund shares may frequently trade at a discount or premium to their net asset value. Debt or fixed income securities such as those held by the Fund, are subject to market risk, credit risk, interest rate risk, derivatives risk, liquidity risk, and income risk. As interest rates rise, bond prices fall. Leverage increases return volatility and magnifies the Fund’s potential return and its risks; there is no guarantee a fund’s leverage strategy will be successful. State concentration makes the Fund more susceptible to local adverse economic, political, or regulatory changes affecting municipal bond issuers. These and other risk considerations such as inverse floater risk and tax risk are described in more detail on the Fund’s web page at www.nuveen.com/NXJ.
Nuveen New Jersey Municipal Value Fund (NJV)
Investing in closed-end funds involves risk; principal loss is possible. There is no guarantee the Fund’s investment objectives will be achieved. Closed-end fund shares may frequently trade at a discount or premium to their net asset value. Debt or fixed income securities such as those held by the Fund, are subject to market risk, credit risk, interest rate risk, derivatives risk, liquidity risk, and income risk. As interest rates rise, bond prices fall. State concentration makes the Fund more susceptible to local adverse economic, political, or regulatory changes affecting municipal bond issuers. These and other risk considerations such as tax risk are described in more detail on the Fund’s web page at www.nuveen.com/NJV.
Nuveen Pennsylvania Quality Municipal Income Fund (NQP)
Investing in closed-end funds involves risk; principal loss is possible. There is no guarantee the Fund’s investment objectives will be achieved. Closed-end fund shares may frequently trade at a discount or premium to their net asset value. Debt or fixed income securities such as those held by the Fund, are subject to market risk, credit risk, interest rate risk, derivatives risk, liquidity risk, and income risk. As interest rates rise, bond prices fall. Leverage increases return volatility and magnifies the Fund’s potential return and its risks; there is no guarantee a fund’s leverage strategy will be successful. State concentration makes the Fund more susceptible to local adverse economic, political, or regulatory changes affecting municipal bond issuers. These and other risk considerations such as inverse floater risk and tax risk are described in more detail on the Fund’s web page at www.nuveen.com/NQP.
Nuveen Pennsylvania Municipal Value Fund (NPN)
Investing in closed-end funds involves risk; principal loss is possible. There is no guarantee the Fund’s investment objectives will be achieved. Closed-end fund shares may frequently trade at a discount or premium to their net asset value. Debt or fixed income securities such as those held by the Fund, are subject to market risk, credit risk, interest rate risk, derivatives risk, liquidity risk, and income risk. As interest rates rise, bond prices fall. State concentration makes the Fund more susceptible to local adverse economic, political, or regulatory changes affecting municipal bond issuers. These and other risk considerations such as tax risk are described in more detail on the Fund’s web page at www.nuveen.com/NPN.
14
| | |
| NXJ | Nuveen New Jersey Quality Municipal Income Fund Performance Overview and Holding Summaries as of February 28, 2019 |
| | | | | | | | | | |
Refer to Glossary of Terms Used in this Report for further definition of the terms used within this section. | |
Average Annual Total Returns as of February 28, 2019 | |
| | |
| | | Average Annual | |
| | | 1-Year | | | 5-Year | | | 10-Year | |
| NXJ at Common Share NAV | | | 5.77 | % | | | 5.65 | % | | | 7.46 | % |
| NXJ at Common Share Price | | | 8.86 | % | | | 6.17 | % | | | 8.28 | % |
| S&P Municipal Bond New Jersey Index | | | 4.70 | % | | | 3.98 | % | | | 5.11 | % |
| S&P Municipal Bond Index | | | 4.03 | % | | | 3.45 | % | | | 4.77 | % |
Past performance is not predictive of future results. Current performance may be higher or lower than the data shown. Returns do not reflect the deduction of taxes that shareholders may have to pay on Fund distributions or upon the sale of Fund shares. Returns at NAV are net of Fund expenses, and assume reinvestment of distributions. Comparative index return information is provided for the Fund’s shares at NAV only. Indexes are not available for direct investment.
15
| | |
| NXJ | Nuveen New Jersey Quality Municipal Income Fund Performance Overview and Holding Summaries as of February 28, 2019 (continued) |
This data relates to the securities held in the Fund’s portfolio of investments as of the end of the reporting period. It should not be construed as a measure of performance for the Fund itself. Holdings are subject to change.
For financial reporting purposes, the ratings disclosed are the highest rating given by one of the following national rating agencies: Standard & Poor’s Group, Moody’s Investors Service, Inc. or Fitch, Inc. This treatment of split-rated securities may differ from that used for other purposes, such as for Fund investment policies. Credit ratings are subject to change. AAA, AA, A and BBB are investment grade ratings; BB, B, CCC, CC, C and D are below-investment grade ratings. Holdings designated N/R are not rated by these national rating agencies.
| | |
Fund Allocation | |
(% of net assets) | |
| Long-Term Municipal Bonds | 150.6% |
| Short-Term Municipal Bonds | 0.2% |
| Other Assets Less Liabilities | 0.9% |
Net Assets Plus Floating Rate | |
Obligations & VRDP Shares, | |
net of deferred offering costs | 151.7% |
| Floating Rate Obligations | (3.1)% |
| VRDP Shares, net of deferred offering costs | (48.6)% |
Net Assets | 100% |
| |
Portfolio Composition | |
(% of total investments) | |
| Tax Obligation/Limited | 23.0% |
| Transportation | 17.7% |
| Education and Civic Organizations | 13.9% |
| Health Care | 13.3% |
| U.S. Guaranteed | 7.6% |
| Tax Obligation/General | 5.0% |
| Other | 19.5% |
Total | 100% |
| | |
Portfolio Credit Quality | |
(% of total investment exposure) | |
| U.S. Guaranteed | 7.6% |
| AAA | 13.1% |
| AA | 30.5% |
| A | 27.2% |
| BBB | 14.8% |
| BB or Lower | 5.9% |
| N/R (not rated) | 0.9% |
Total | 100% |
States and Territories | |
(% of total investments) | |
| New Jersey | 89.1% |
| Pennsylvania | 5.0% |
| New York | 3.1% |
| Delaware | 1.9% |
| Guam | 0.9% |
Total | 100% |
16
| | |
| NJV | Nuveen New Jersey Municipal Value Fund Performance Overview and Holding Summaries as of February 28, 2019 |
| | | | | | | | | | |
Refer to Glossary of Terms Used in this Report for further definition of the terms used within this section. | |
Average Annual Total Returns as of February 28, 2019 | |
| | |
| | | Average Annual | |
| | | 1-Year | | | 5-Year | | | Since Inception | |
| NJV at Common Share NAV | | | 3.73 | % | | | 3.93 | % | | | 5.69 | % |
| NJV at Common Share Price | | | 3.39 | % | | | 4.59 | % | | | 4.29 | % |
| S&P Municipal Bond New Jersey Index | | | 4.70 | % | | | 3.98 | % | | | 4.98 | % |
| S&P Municipal Bond Index | | | 4.03 | % | | | 3.45 | % | | | 4.60 | % |
Since inception returns are from 4/28/09. Past performance is not predictive of future results. Current performance may be higher or lower than the data shown. Returns do not reflect the deduction of taxes that shareholders may have to pay on Fund distributions or upon the sale of Fund shares. Returns at NAV are net of Fund expenses, and assume reinvestment of distributions. Comparative index return information is provided for the Fund’s shares at NAV only. Indexes are not available for direct investment.
17
| | |
| NJV | Nuveen New Jersey Municipal Value Fund Performance Overview and Holding Summaries as of February 28, 2019 (continued) |
This data relates to the securities held in the Fund’s portfolio of investments as of the end of the reporting period. It should not be construed as a measure of performance for the Fund itself. Holdings are subject to change.
For financial reporting purposes, the ratings disclosed are the highest rating given by one of the following national rating agencies: Standard & Poor’s Group, Moody’s Investors Service, Inc. or Fitch, Inc. This treatment of split-rated securities may differ from that used for other purposes, such as for Fund investment policies. Credit ratings are subject to change. AAA, AA, A and BBB are investment grade ratings; BB, B, CCC, CC, C and D are below-investment grade ratings. Holdings designated N/R are not rated by these national rating agencies.
| | |
Fund Allocation | |
(% of net assets) | |
| Long-Term Municipal Bonds | 102.7% |
| Short-Term Municipal Bonds | 0.7% |
| Other Assets Less Liabilities | 0.3% |
Net Assets Plus Floating | |
Rate Obligations | 103.7% |
| Floating Rate Obligations | (3.7)% |
Net Assets | 100% |
| | |
Portfolio Composition | |
(% of total investments) | |
| Education and Civic Organizations | 17.9% |
| Tax Obligation/Limited | 15.1% |
| Health Care | 13.4% |
| Transportation | 13.0% |
| U.S. Guaranteed | 9.6% |
| Housing/Multifamily | 9.2% |
| Tax Obligation/General | 7.4% |
| Housing/Single Family | 5.3% |
| Other | 9.1% |
Total | 100% |
| | |
Portfolio Credit Quality | |
(% of total investment exposure) | |
| U.S. Guaranteed | 9.3% |
| AAA | 8.7% |
| AA | 34.7% |
| A | 25.6% |
| BBB | 14.9% |
| BB or Lower | 5.4% |
| N/R (not rated) | 1.4% |
Total | 100% |
States and Territories | |
(% of total investments) | |
| New Jersey | 89.9% |
| Pennsylvania | 4.9% |
| Guam | 2.1% |
| Delaware | 1.6% |
| New York | 1.5% |
Total | 100% |
18
(Missing Graphic Reference)
| | |
| NQP | Nuveen Pennsylvania Quality Municipal Income Fund Performance Overview and Holding Summaries as of February 28, 2019 |
| | | | | | | | | | |
Refer to Glossary of Terms Used in this Report for further definition of the terms used within this section. | |
Average Annual Total Returns as of February 28, 2019 | |
| | |
| | | Average Annual | |
| | | 1-Year | | | 5-Year | | | 10-Year | |
| NQP at Common Share NAV | | | 6.40 | % | | | 5.26 | % | | | 6.93 | % |
| NQP at Common Share Price | | | 9.41 | % | | | 5.87 | % | | | 7.91 | % |
| S&P Municipal Bond Pennsylvania Index | | | 4.30 | % | | | 3.74 | % | | | 4.88 | % |
| S&P Municipal Bond Index | | | 4.03 | % | | | 3.45 | % | | | 4.77 | % |
Past performance is not predictive of future results. Current performance may be higher or lower than the data shown. Returns do not reflect the deduction of taxes that shareholders may have to pay on Fund distributions or upon the sale of Fund shares. Returns at NAV are net of Fund expenses, and assume reinvestment of distributions. Comparative index return information is provided for the Fund’s shares at NAV only. Indexes are not available for direct investment.
19
| | |
| NQP | Nuveen Pennsylvania Quality Municipal Income Fund Performance Overview and Holding Summaries as of February 28, 2019 (continued) |
This data relates to the securities held in the Fund’s portfolio of investments as of the end of the reporting period. It should not be construed as a measure of performance for the Fund itself. Holdings are subject to change.
For financial reporting purposes, the ratings disclosed are the highest rating given by one of the following national rating agencies: Standard & Poor’s Group, Moody’s Investors Service, Inc. or Fitch, Inc. This treatment of split-rated securities may differ from that used for other purposes, such as for Fund investment policies. Credit ratings are subject to change. AAA, AA, A and BBB are investment grade ratings; BB, B, CCC, CC, C and D are below-investment grade ratings. Holdings designated N/R are not rated by these national rating agencies.
| | |
Fund Allocation | |
(% of net assets) | |
| Long-Term Municipal Bonds | 160.9% |
| Other Assets Less Liabilities | 2.0% |
Net Assets Plus Floating Rate Obligations | |
& VRDP Shares, net of deferred offering | |
costs | 162.9% |
| Floating Rate Obligations | (24.2)% |
| VRDP Shares, net of deferred offering costs | (38.7)% |
Net Assets | 100% |
| | |
Portfolio Composition | |
(% of total investments) | |
| Health Care | 21.4% |
| Tax Obligation/General | 15.2% |
| Education and Civic Organizations | 11.5% |
| U.S. Guaranteed | 10.7% |
| Housing/Single Family | 10.3% |
| Water and Sewer | 7.0% |
| Transportation | 6.2% |
| Tax Obligation/Limited | 6.1% |
| Utilities | 5.7% |
| Other | 5.9% |
Total | 100% |
| | |
Portfolio Credit Quality | |
(% of total investment exposure) | |
| U.S. Guaranteed | 13.1% |
| AA | 38.5% |
| A | 29.5% |
| BBB | 10.5% |
| BB or Lower | 4.6% |
| N/R (not rated) | 3.8% |
Total | 100% |
States and Territories | |
(% of total investments) | |
| Pennsylvania | 99.0% |
| Puerto Rico | 0.7% |
| Guam | 0.3% |
Total | 100% |
20
| | |
| NPN | Nuveen Pennsylvania Municipal Value Fund Performance Overview and Holding Summaries as of February 28, 2019 |
| | | | | | | | | | |
Refer to Glossary of Terms Used in this Report for further definition of the terms used within this section. | |
Average Annual Total Returns as of February 28, 2019 | |
| | |
| | | Average Annual | |
| | | 1-Year | | | 5-Year | | | Since Inception | |
| NPN at Common Share NAV | | | 3.99 | % | | | 3.71 | % | | | 5.36 | % |
| NPN at Common Share Price | | | (8.87 | )% | | | 3.64 | % | | | 3.87 | % |
| S&P Municipal Bond Pennsylvania Index | | | 4.30 | % | | | 3.74 | % | | | 4.69 | % |
| S&P Municipal Bond Index | | | 4.03 | % | | | 3.45 | % | | | 4.60 | % |
Since inception returns are from 4/28/09. Past performance is not predictive of future results. Current performance may be higher or lower than the data shown. Returns do not reflect the deduction of taxes that shareholders may have to pay on Fund distributions or upon the sale of Fund shares. Returns at NAV are net of Fund expenses, and assume reinvestment of distributions. Comparative index return information is provided for the Fund’s shares at NAV only. Indexes are not available for direct investment.
21
| | |
| NPN | Nuveen Pennsylvania Municipal Value Fund Performance Overview and Holding Summaries as of February 28, 2019 (continued) |
This data relates to the securities held in the Fund’s portfolio of investments as of the end of the reporting period. It should not be construed as a measure of performance for the Fund itself. Holdings are subject to change.
For financial reporting purposes, the ratings disclosed are the highest rating given by one of the following national rating agencies: Standard & Poor’s Group, Moody’s Investors Service, Inc. or Fitch, Inc. This treatment of split-rated securities may differ from that used for other purposes, such as for Fund investment policies. Credit ratings are subject to change. AAA, AA, A and BBB are investment grade ratings; BB, B, CCC, CC, C and D are below-investment grade ratings. Holdings designated N/R are not rated by these national rating agencies.
| | |
Fund Allocation | |
(% of net assets) | |
| Long-Term Municipal Bonds | 101.1% |
| Other Assets Less Liabilities | 1.4% |
Net Assets Plus Floating | |
Rate Obligations | 102.5% |
| Floating Rate Obligations | (2.5)% |
Net Assets | 100% |
| | |
Portfolio Composition | |
(% of total investments) | |
| Health Care | 17.9% |
| U.S. Guaranteed | 18.8% |
| Housing/Single Family | 11.2% |
| Transportation | 8.3% |
| Tax Obligation/General | 8.0% |
| Housing/Multifamily | 7.2% |
| Education and Civic Organizations | 7.0% |
| Tax Obligation/Limited | 5.4% |
| Utilities | 5.4% |
| Other | 10.8% |
Total | 100% |
| | |
Portfolio Credit Quality | |
(% of total investment exposure) | |
| U.S. Guaranteed | 20.2% |
| AA | 33.0% |
| A | 24.2% |
| BBB | 14.0% |
| BB or Lower | 5.0% |
| N/R (not rated) | 3.6% |
Total | 100% |
States and Territories | |
(% of total investments) | |
| Pennsylvania | 93.3% |
| Guam | 3.8% |
| District of Colombia | 2.9% |
Total | 100% |
22
Shareholder Meeting Report
The annual meeting of shareholders was held in the offices of Nuveen on November 13, 2018 for NXJ, NJV, NQP and NPN; at this meeting the shareholders were asked to elect Board Members.
| | | | | | | | | |
| | | NXJ | | NJV | | NQP | | NPN |
| | Common and | | | | Common and | | | |
| | Preferred | | | | Preferred | | | |
| | shares voting | | | | shares voting | | | |
| | together | | Preferred | Common | together | | Preferred | Common |
| | as a class | | Shares | Shares | as a class | | Shares | Shares |
Approval of the Board Members was reached as follows: | | | | | |
| Margo L. Cook | | | | | | | | |
| For | 37,340,803 | | — | 1,254,818 | 31,583,569 | | — | 1,040,300 |
| Withhold | 1,098,541 | | — | 104,439 | 1,253,096 | | — | 81,740 |
| Total | 38,439,344 | | — | 1,359,257 | 32,836,665 | | — | 1,122,040 |
| Jack B. Evans | | | | | | | | |
| For | 37,107,669 | | — | 1,250,958 | 31,072,168 | | — | 1,039,898 |
| Withhold | 1,331,675 | | — | 108,299 | 1,764,497 | | — | 82,142 |
| Total | 38,439,344 | | — | 1,359,257 | 32,836,665 | | — | 1,122,040 |
| Albin F. Moschner | | | | | | | | |
| For | 37,355,041 | | — | 1,256,180 | 31,352,917 | | — | 1,040,300 |
| Withhold | 1,084,303 | | — | 103,077 | 1,483,748 | | — | 81,740 |
| Total | 38,439,344 | | — | 1,359,257 | 32,836,665 | | — | 1,122,040 |
| William C. Hunter | | | | | | | | |
| For | — | | 3,139 | — | — | | 3,045 | — |
| Withhold | — | | — | — | — | | — | — |
| Total | — | | 3,139 | — | — | | 3,045 | — |
| William J. Schneider | | | | | | | | |
| For | — | | 3,139 | 1,250,958 | — | | 3,045 | 1,028,551 |
| Withhold | — | | — | 108,299 | — | | — | 93,489 |
| Total | — | | 3,139 | 1,359,257 | — | | 3,045 | 1,122,040 |
23
Report of Independent Registered Public Accounting Firm
To the Shareholders and Board of Trustees of
Nuveen New Jersey Quality Municipal Income Fund
Nuveen New Jersey Municipal Value Fund
Nuveen Pennsylvania Quality Municipal Income Fund
Nuveen Pennsylvania Municipal Value Fund:
Opinion on the Financial Statements
We have audited the accompanying statements of assets and liabilities of Nuveen New Jersey Quality Municipal Income Fund, Nuveen New Jersey Municipal Value Fund, Nuveen Pennsylvania Quality Municipal Income Fund, and Nuveen Pennsylvania Municipal Value Fund (the “Funds”), including the portfolios of investments, as of February 28, 2019, the related statements of operations for the year then ended, the statements of changes in net assets for each of the years in the two year period then ended, the statements of cash flows (Nuveen New Jersey Quality Municipal Income Fund and Nuveen Pennsylvania Quality Municipal Income Fund) for the year then ended, and the related notes (collectively, the “financial statements”) and the financial highlights for each of the years in the two year period then ended, the ten-month period from May 1, 2016 through February 28, 2017, and each of the years in the two-year period ended April 30, 2016. In our opinion, the financial statements and financial highlights present fairly, in all material respects, the financial position of the Funds as of February 28, 2019, the results of their operations and their cash flows (where applicable) for the year then ended, the changes in their net assets for each of the years in the two year period then ended, and the financial highlights for each of the years in the two year period then ended, the ten-month period from May 1, 2016 through February 28, 2017, and each of the years in the two-year period ended April 30, 2016, in conformity with U.S. generally accepted accounting principles. The financial highlights for the year ended April 30, 2014 were audited by other independent registered public accountants whose report dated June 25, 2014, expressed an unqualified opinion on those financial highlights.
Basis for Opinion
These financial statements and financial highlights are the responsibility of the Funds’ management. Our responsibility is to express an opinion on these financial statements and financial highlights based on our audits. We are a public accounting firm registered with the Public Company Accounting Oversight Board (United States) (PCAOB) and are required to be independent with respect to the Funds in accordance with the U.S. federal securities laws and the applicable rules and regulations of the Securities and Exchange Commission and the PCAOB.
We conducted our audits in accordance with the standards of the PCAOB. Those standards require that we plan and perform the audit to obtain reasonable assurance about whether the financial statements and financial highlights are free of material misstatement, whether due to error or fraud. Our audits included performing procedures to assess the risks of material misstatement of the financial statements and financial highlights, whether due to error or fraud, and performing procedures that respond to those risks. Such procedures included examining, on a test basis, evidence regarding the amounts and disclosures in the financial statements and financial highlights. Such procedures also included confirmation of securities owned as of February 28, 2019, by correspondence with custodians and brokers or other appropriate auditing procedures. Our audits also included evaluating the accounting principles used and significant estimates made by management, as well as evaluating the overall presentation of the financial statements and financial highlights. We believe that our audits provide a reasonable basis for our opinion.
/s/ KPMG LLP
We have served as the auditor of one or more Nuveen investment companies since 2014.
Chicago, IL
April 26, 2019
24
| | |
| NXJ | Nuveen New Jersey Quality Municipal Income Fund Portfolio of Investments
February 28, 2019 |
| | | | | | |
Principal | | | Optional Call | | |
Amount (000) | | Description (1) | Provisions (2) | Ratings (3) | Value |
| | | LONG-TERM INVESTMENTS – 150.6% (99.9% of Total Investments) | | | |
| | | MUNICIPAL BONDS – 150.6% (99.9% of Total Investments) | | | |
| | | Consumer Discretionary – 0.5% (0.3% of Total Investments) | | | |
| | | Middlesex County Improvement Authority, New Jersey, Senior Revenue Bonds, Heldrich | | | |
| | | Center Hotel/Conference Center Project, Series 2005A: | | | |
| $ 2,460 | | 5.000%, 1/01/32 | 3/19 at 100.00 | Caa2 | $ 1,854,422 |
| 1,485 | | 5.125%, 1/01/37 | 3/19 at 100.00 | Caa2 | 1,046,851 |
| 3,945 | | Total Consumer Discretionary | | | 2,901,273 |
| | | Consumer Staples – 4.5% (3.0% of Total Investments) | | | |
| | | Tobacco Settlement Financing Corporation, New Jersey, Tobacco Settlement Asset-Backed | | | |
| | | Bonds, Series 2018A: | | | |
| 8,505 | | 4.000%, 6/01/37 | 6/28 at 100.00 | A– | 8,483,823 |
| 965 | | 5.000%, 6/01/46 | 6/28 at 100.00 | BBB+ | 1,019,252 |
| 11,680 | | 5.250%, 6/01/46 | 6/28 at 100.00 | BBB+ | 12,622,693 |
| 6,930 | | Tobacco Settlement Financing Corporation, New Jersey, Tobacco Settlement Asset-Backed | 6/28 at 100.00 | BBB | 7,026,812 |
| | | Bonds, Series 2018B, 5.000%, 6/01/46 | | | |
| 28,080 | | Total Consumer Staples | | | 29,152,580 |
| | | Education and Civic Organizations – 20.9% (13.9% of Total Investments) | | | |
| 1,760 | | Camden County Improvement Authority, New Jersey, Lease Revenue Bonds, Rowan University | 12/23 at 100.00 | A | 1,942,565 |
| | | School of Osteopathic Medicine Project, Refunding Series 2013A, 5.000%, 12/01/32 | | | |
| 1,000 | | New Jersey Economic Development Authority, Charter School Revenue Bonds, Foundation | 1/28 at 100.00 | BBB– | 1,048,650 |
| | | Academy Charter School, Series 2018A, 5.000%, 7/01/50 | | | |
| 175 | | New Jersey Economic Development Authority, Charter School Revenue Bonds, Teaneck | 9/27 at 100.00 | BB | 172,382 |
| | | Community Charter School, Series 2017A, 5.125%, 9/01/52, 144A | | | |
| 2,025 | | New Jersey Economic Development Authority, Revenue Bonds, The Seeing Eye Inc., Refunding | No Opt. Call | A | 2,356,695 |
| | | Series 2015, 5.000%, 3/01/25 | | | |
| | | New Jersey Economic Development Authority, Revenue Bonds, The Seeing Eye Inc., Refunding | | | |
| | | Series 2017: | | | |
| 500 | | 5.000%, 6/01/32 | 12/27 at 100.00 | A | 584,575 |
| 820 | | 3.000%, 6/01/32 | 12/27 at 100.00 | A | 803,764 |
| 2,455 | | New Jersey Economic Development Authority, Rutgers University General Obligation Lease | 6/23 at 100.00 | Aa3 | 3,508,833 |
| | | Revenue Bonds, Tender Option Bond Trust 2016-XF2357, 14.803%, 6/15/46, 144A (IF) (4) | | | |
| | | New Jersey Education Facilities Authority Revenue Bonds, The College of New Jersey | | | |
| | | Issue, Series 2013A: | | | |
| 2,475 | | 5.000%, 7/01/38 | 7/23 at 100.00 | AA– | 2,724,752 |
| 3,250 | | 5.000%, 7/01/43 | 7/23 at 100.00 | AA– | 3,568,175 |
| 1,100 | | New Jersey Educational Facilities Authority, Revenue Bonds, Kean University, Refunding | 7/25 at 100.00 | AA | 1,143,692 |
| | | Series 2015H, 4.000%, 7/01/39 – AGM Insured | | | |
| 5,950 | | New Jersey Educational Facilities Authority, Revenue Bonds, Montclair State University, | 7/24 at 100.00 | AA– | 6,564,218 |
| | | Series 2014A, 5.000%, 7/01/44 | | | |
| | | New Jersey Educational Facilities Authority, Revenue Bonds, Montclair State University, | | | |
| | | Series 2015D: | | | |
| 2,395 | | 5.000%, 7/01/31 | 7/25 at 100.00 | AA– | 2,734,539 |
| 1,600 | | 5.000%, 7/01/33 | 7/25 at 100.00 | AA– | 1,817,824 |
| 1,000 | | 5.000%, 7/01/34 | 7/25 at 100.00 | AA– | 1,133,650 |
| | | New Jersey Educational Facilities Authority, Revenue Bonds, Passaic County Community | | | |
| | | College, Series 2010C: | | | |
| 1,500 | | 5.250%, 7/01/32 | 7/20 at 100.00 | A3 | 1,562,685 |
| 1,000 | | 5.375%, 7/01/41 | 7/20 at 100.00 | A3 | 1,042,350 |
25
| | | | | | |
NXJ | | Nuveen New Jersey Quality Municipal Income Fund | |
| | | Portfolio of Investments (continued) | | | |
| | | February 28, 2019 | | | |
| |
| |
| |
| |
Principal | | | Optional Call | | |
Amount (000) | | Description (1) | Provisions (2) | Ratings (3) | Value |
| | | Education and Civic Organizations (continued) | | | |
| $ 4,335 | | New Jersey Educational Facilities Authority, Revenue Bonds, Princeton University, Tender | 7/21 at 100.00 | AAA | $ 5,260,306 |
| | | Option Bond Trust 2015-XF0099, 11.332%, 7/01/39, 144A (IF) | | | |
| 4,000 | | New Jersey Educational Facilities Authority, Revenue Bonds, Princeton University, Tender | 7/24 at 100.00 | AAA | 5,606,040 |
| | | Option Bond Trust 2015-XF0149, 11.480%, 7/01/44, 144A (IF) (4) | | | |
| | | New Jersey Educational Facilities Authority, Revenue Bonds, Ramapo College, Refunding | | | |
| | | Series 2012B: | | | |
| 550 | | 5.000%, 7/01/37 | 7/22 at 100.00 | A | 595,617 |
| 1,050 | | 5.000%, 7/01/42 | 7/22 at 100.00 | A | 1,134,997 |
| | | New Jersey Educational Facilities Authority, Revenue Bonds, Rider University, Series 2012A: | | | |
| 1,150 | | 5.000%, 7/01/32 | 7/21 at 100.00 | Baa2 | 1,190,503 |
| 740 | | 5.000%, 7/01/37 | 7/21 at 100.00 | Baa2 | 760,143 |
| | | New Jersey Educational Facilities Authority, Revenue Bonds, Rider University, Series 2017F: | | | |
| 330 | | 3.750%, 7/01/37 | 7/27 at 100.00 | Baa2 | 308,969 |
| 3,830 | | 4.000%, 7/01/42 | 7/27 at 100.00 | Baa2 | 3,634,976 |
| 4,205 | | 5.000%, 7/01/47 | 7/27 at 100.00 | Baa2 | 4,471,092 |
| 1,200 | | New Jersey Educational Facilities Authority, Revenue Bonds, Seton Hall University, | 7/25 at 100.00 | A– | 1,352,196 |
| | | Refunding Series 2015C, 5.000%, 7/01/35 | | | |
| 775 | | New Jersey Educational Facilities Authority, Revenue Bonds, Seton Hall University, | 7/27 at 100.00 | A– | 756,989 |
| | | Refunding Series 2017D, 3.500%, 7/01/44 | | | |
| | | New Jersey Educational Facilities Authority, Revenue Bonds, Seton Hall University, | | | |
| | | Series 2013D: | | | |
| 685 | | 5.000%, 7/01/38 | 7/23 at 100.00 | A– | 757,384 |
| 1,935 | | 5.000%, 7/01/43 | 7/23 at 100.00 | A– | 2,129,429 |
| 1,970 | | New Jersey Educational Facilities Authority, Revenue Bonds, Seton Hall University, | 7/26 at 100.00 | A– | 1,720,401 |
| | | Series 2016C, 3.000%, 7/01/46 | | | |
| | | New Jersey Educational Facilities Authority, Revenue Bonds, Stevens Institute of | | | |
| | | Technology, Series 2017A: | | | |
| 1,060 | | 5.000%, 7/01/37 | 7/27 at 100.00 | A– | 1,198,107 |
| 2,500 | | 5.000%, 7/01/42 | 7/27 at 100.00 | A– | 2,786,025 |
| 3,160 | | 5.000%, 7/01/47 | 7/27 at 100.00 | A– | 3,510,602 |
| 1,050 | | 4.000%, 7/01/47 | 7/27 at 100.00 | A– | 1,071,263 |
| 975 | | New Jersey Educational Facilities Authority, Revenue Bonds, The College of Saint | 7/26 at 100.00 | BB | 953,609 |
| | | Elizabeth, Series 2016D, 5.000%, 7/01/46 | | | |
| 4,560 | | New Jersey Educational Facilities Authority, Revenue Bonds, William Paterson University, | 7/25 at 100.00 | A2 | 5,104,692 |
| | | Series 2015C, 5.000%, 7/01/40 | | | |
| | | New Jersey Educational Facilities Authority, Revenue Bonds, William Paterson University, | | | |
| | | Series 2017B: | | | |
| 2,000 | | 5.000%, 7/01/42 – AGM Insured | 7/27 at 100.00 | AA | 2,231,880 |
| 2,420 | | 5.000%, 7/01/47 – AGM Insured | 7/27 at 100.00 | AA | 2,694,041 |
| | | New Jersey Higher Education Assistance Authority, Senior Student Loan Revenue Bonds, | | | |
| | | Refunding Series 2018A: | | | |
| 2,500 | | 3.750%, 12/01/30 (AMT) | 6/28 at 100.00 | Aaa | 2,563,325 |
| 2,560 | | 4.000%, 12/01/32 (AMT) | 6/28 at 100.00 | Aaa | 2,663,501 |
| 2,000 | | 4.000%, 12/01/33 (AMT) | 6/28 at 100.00 | Aaa | 2,077,460 |
| 2,135 | | 4.000%, 12/01/35 (AMT) | 6/28 at 100.00 | Aaa | 2,196,659 |
| | | New Jersey Higher Education Assistance Authority, Student Loan Revenue Bonds, Senior | | | |
| | | Lien Series 2016-1A: | | | |
| 6,180 | | 3.500%, 12/01/32 (AMT) | 12/25 at 100.00 | Aaa | 6,185,624 |
| 1,430 | | 4.000%, 12/01/39 (AMT) | 12/25 at 100.00 | Aaa | 1,441,983 |
| 720 | | New Jersey Higher Education Assistance Authority, Student Loan Revenue Bonds, Series | 12/19 at 100.00 | Aaa | 735,581 |
| | | 2010-1A, 5.000%, 12/01/25 | | | |
| 960 | | New Jersey Higher Education Assistance Authority, Student Loan Revenue Bonds, Series | 12/20 at 100.00 | Aaa | 1,004,515 |
| | | 2010-2, 5.000%, 12/01/30 | | | |
26
| | | | | | |
Principal | | | Optional Call | | |
Amount (000) | | Description (1) | Provisions (2) | Ratings (3) | Value |
| | | Education and Civic Organizations (continued) | | | |
| $ 785 | | New Jersey Higher Education Assistance Authority, Student Loan Revenue Bonds, Series | 12/21 at 100.00 | Aaa | $ 838,992 |
| | | 2011-1, 5.750%, 12/01/27 (AMT) | | | |
| | | New Jersey Higher Education Assistance Authority, Student Loan Revenue Bonds, | | | |
| | | Series 2012-1A: | | | |
| 2,535 | | 4.250%, 12/01/25 (AMT) | 12/22 at 100.00 | Aaa | 2,664,488 |
| 835 | | 4.375%, 12/01/26 (AMT) | 12/22 at 100.00 | Aaa | 876,399 |
| 500 | | New Jersey Higher Education Assistance Authority, Student Loan Revenue Bonds, Series | 12/22 at 100.00 | Aaa | 543,735 |
| | | 2012-1B, 5.750%, 12/01/39 (AMT) | | | |
| 845 | | New Jersey Higher Education Assistance Authority, Student Loan Revenue Bonds, Series | 12/22 at 100.00 | Aaa | 871,356 |
| | | 2013-1A, 3.750%, 12/01/26 (AMT) | | | |
| | | New Jersey Higher Education Assistance Authority, Student Loan Revenue Bonds, | | | |
| | | Series 2015-1A: | | | |
| 5,000 | | 4.000%, 12/01/28 (AMT) | 12/24 at 100.00 | Aaa | 5,296,450 |
| 2,575 | | 4.000%, 12/01/30 (AMT) | 12/24 at 100.00 | Aaa | 2,678,412 |
| 6,855 | | New Jersey Higher Education Assistance Authority, Student Loan Revenue Bonds, | 12/26 at 100.00 | Aaa | 6,972,563 |
| | | Subordinate Series 2017-C, 4.250%, 12/01/47 (Alternative Minimum Tax) | | | |
| | | New Jersey Higher Education Assistance Authority, Student Loan Revenue Bonds, Tender | | | |
| | | Option Bond Trust 2015-XF0151: | | | |
| 796 | | 8.622%, 12/01/23 (AMT), 144A (IF) (4) | 12/22 at 100.00 | Aaa | 911,038 |
| 710 | | 8.644%, 12/01/24 (AMT), 144A (IF) (4) | 12/22 at 100.00 | Aaa | 803,408 |
| 485 | | 9.123%, 12/01/25 (AMT), 144A (IF) (4) | 12/22 at 100.00 | Aaa | 549,204 |
| 145 | | 9.599%, 12/01/26 (AMT), 144A (IF) (4) | 12/22 at 100.00 | Aaa | 162,776 |
| 1,980 | | 10.649%, 12/01/27 (AMT), 144A (IF) | 12/23 at 100.00 | Aaa | 2,394,691 |
| 2,000 | | New Jersey Higher Education Assistance Authority, Student Loan Revenue Bonds, Tender | 6/19 at 100.00 | AAA | 2,074,100 |
| | | Option Bond Trust 2016-XG0001, 16.384%, 6/01/30, 144A (IF) (4) | | | |
| 400 | | New Jersey Institute of Technology, New Jersey, General Obligation Bonds, Series 2012A, | 7/22 at 100.00 | A1 | 431,848 |
| | | 5.000%, 7/01/42 | | | |
| 2,300 | | New Jersey Institute of Technology, New Jersey, General Obligation Bonds, Series 2015A, | 7/25 at 100.00 | A1 | 2,603,117 |
| | | 5.000%, 7/01/45 | | | |
| 2,170 | | Rutgers State University, New Jersey, Revenue Bonds, Tender Option Bond Trust 2016-XF2356, | 5/23 at 100.00 | Aa3 | 3,116,272 |
| | | 14.818%, 5/01/43, 144A (IF) (4) | | | |
| 122,886 | | Total Education and Civic Organizations | | | 134,596,107 |
| | | Financials – 1.1% (0.7% of Total Investments) | | | |
| | | New Jersey Economic Development Authority, Revenue Refunding Bonds, Kapkowski Road | | | |
| | | Landfill Project, Series 2002: | | | |
| 5,225 | | 5.750%, 10/01/21 | No Opt. Call | Ba2 | 5,446,174 |
| 1,500 | | 6.500%, 4/01/28 | No Opt. Call | Ba2 | 1,725,660 |
| 6,725 | | Total Financials | | | 7,171,834 |
| | | Health Care – 20.0% (13.3% of Total Investments) | | | |
| | | Camden County Improvement Authority, New Jersey, Health Care Redevelopment Revenue | | | |
| | | Bonds, Cooper Health System Obligated Group Issue, Refunding Series 2014A: | | | |
| 175 | | 5.000%, 2/15/25 | 2/24 at 100.00 | BBB+ | 196,749 |
| 220 | | 5.000%, 2/15/26 | 2/24 at 100.00 | BBB+ | 246,272 |
| 1,320 | | 5.000%, 2/15/27 | 2/24 at 100.00 | BBB+ | 1,468,830 |
| 1,385 | | 5.000%, 2/15/28 | 2/24 at 100.00 | BBB+ | 1,533,777 |
| 1,385 | | 5.000%, 2/15/29 | 2/24 at 100.00 | BBB+ | 1,527,212 |
| 2,500 | | 5.000%, 2/15/32 | 2/24 at 100.00 | BBB+ | 2,707,150 |
| 3,040 | | 5.000%, 2/15/33 | 2/24 at 100.00 | BBB+ | 3,280,282 |
| 1,000 | | 5.000%, 2/15/34 | 2/24 at 100.00 | BBB+ | 1,075,660 |
| 1,950 | | 5.000%, 2/15/35 | 2/24 at 100.00 | BBB+ | 2,092,506 |
| 6,100 | | Camden County Improvement Authority, New Jersey, Health Care Redevelopment Revenue | 2/23 at 100.00 | BBB+ | 6,583,425 |
| | | Bonds, Cooper Health System Obligated Group Issue, Series 2013A, 5.750%, 2/15/42 | | | |
27
| | | | | | | |
NXJ | | Nuveen New Jersey Quality Municipal Income Fund | |
| | | Portfolio of Investments (continued) | | | | |
| | | February 28, 2019 | | | | |
| |
| |
| |
| |
Principal | | | Optional Call | | |
Amount (000) | | Description (1) | Provisions (2) | Ratings (3) | Value |
| | | Health Care (continued) | | | |
| $ 225 | | New Jersey Health Care Facilities Finance Authority, Revenue Bonds, AHS Hospital | 3/19 at 100.00 | AA– | $ 225,612 |
| | | Corporation, Series 2008A, 5.000%, 7/01/27 | | | |
| | | New Jersey Health Care Facilities Financing Authority, New Jersey, Revenue Bonds, Saint | | | |
| | | Peters University Hospital, Refunding Series 2011: | | | |
| 2,000 | | 6.000%, 7/01/26 | 7/21 at 100.00 | BB+ | 2,134,360 |
| 3,425 | | 6.250%, 7/01/35 | 7/21 at 100.00 | BB+ | 3,639,302 |
| 3,550 | | New Jersey Health Care Facilities Financing Authority, New Jersey, Revenue Bonds, Saint | 3/19 at 100.00 | BB+ | 3,558,626 |
| | | Peters University Hospital, Series 2007, 5.750%, 7/01/37 | | | |
| 1,145 | | New Jersey Health Care Facilities Financing Authority, Revenue and Refunding Bonds, | 7/22 at 100.00 | AA– | 1,259,626 |
| | | Barnabas Health, Series 2012A, 5.000%, 7/01/24 | | | |
| 2,525 | | New Jersey Health Care Facilities Financing Authority, Revenue Bonds, AHS Hospital | 1/27 at 100.00 | AA– | 2,570,854 |
| | | Corporation, Refunding Series 2016, 4.000%, 7/01/41 | | | |
| 10,000 | | New Jersey Health Care Facilities Financing Authority, Revenue Bonds, Barnabas Health, | 7/24 at 100.00 | AA– | 10,843,300 |
| | | Refunding Series 2014A, 5.000%, 7/01/44 | | | |
| | | New Jersey Health Care Facilities Financing Authority, Revenue Bonds, Hackensack | | | |
| | | Meridian Health Obligated Group, Refunding Series 2017A: | | | |
| 2,200 | | 5.000%, 7/01/28 | 7/27 at 100.00 | AA– | 2,648,228 |
| 4,140 | | 5.000%, 7/01/57 | 7/27 at 100.00 | AA– | 4,588,693 |
| | | New Jersey Health Care Facilities Financing Authority, Revenue Bonds, Hunterdon Medical | | | |
| | | Center, Refunding Series 2014A: | | | |
| 2,055 | | 5.000%, 7/01/45 | 7/24 at 100.00 | A+ | 2,206,865 |
| 1,310 | | 4.000%, 7/01/45 | 7/24 at 100.00 | A+ | 1,320,126 |
| 12,010 | | New Jersey Health Care Facilities Financing Authority, Revenue Bonds, Inspira Health | 7/27 at 100.00 | A2 | 13,374,816 |
| | | Obligated Group Issue, Series 2017A, 5.000%, 7/01/42 (UB) (4) | | | |
| | | New Jersey Health Care Facilities Financing Authority, Revenue Bonds, Meridian Health | | | |
| | | System Obligated Group, Refunding Series 2011: | | | |
| 3,000 | | 5.000%, 7/01/25 | 7/22 at 100.00 | AA– | 3,305,430 |
| 3,000 | | 5.000%, 7/01/26 | 7/22 at 100.00 | AA– | 3,300,330 |
| 2,500 | | 5.000%, 7/01/27 | 7/22 at 100.00 | AA– | 2,746,050 |
| 1,450 | | New Jersey Health Care Facilities Financing Authority, Revenue Bonds, Meridian Health | 7/23 at 100.00 | AA– | 1,605,266 |
| | | System Obligated Group, Refunding Series 2013A, 5.000%, 7/01/32 | | | |
| | | New Jersey Health Care Facilities Financing Authority, Revenue Bonds, Princeton | | | |
| | | HealthCare System, Series 2016A: | | | |
| 830 | | 5.000%, 7/01/32 | 7/26 at 100.00 | AA | 959,115 |
| 1,055 | | 5.000%, 7/01/33 | 7/26 at 100.00 | AA | 1,214,527 |
| 1,370 | | 5.000%, 7/01/34 | 7/26 at 100.00 | AA | 1,571,376 |
| | | New Jersey Health Care Facilities Financing Authority, Revenue Bonds, Robert Wood | | | |
| | | Johnson University Hospital Issue, Series 2014A: | | | |
| 4,235 | | 5.000%, 7/01/39 | 7/24 at 100.00 | AA– | 4,666,674 |
| 5,955 | | 5.000%, 7/01/43 | 7/24 at 100.00 | AA– | 6,495,833 |
| 3,945 | | New Jersey Health Care Facilities Financing Authority, Revenue Bonds, Robert Wood | 7/23 at 100.00 | AA– | 4,380,291 |
| | | Johnson University Hospital, Series 2013A, 5.500%, 7/01/43 | | | |
| 780 | | New Jersey Health Care Facilities Financing Authority, Revenue Bonds, RWJ Barnabas | 7/26 at 100.00 | AA– | 875,113 |
| | | Health Obligated Group, Refunding Series 2016A, 5.000%, 7/01/43 | | | |
| | | New Jersey Health Care Facilities Financing Authority, Revenue Bonds, Saint Joseph’s | | | |
| | | Healthcare System Obligated Group Issue, Refunding Series 2016: | | | |
| 1,600 | | 3.000%, 7/01/32 | 7/26 at 100.00 | BBB– | 1,429,120 |
| 1,135 | | 4.000%, 7/01/34 | 7/26 at 100.00 | BBB– | 1,155,998 |
| 1,600 | | 5.000%, 7/01/35 | 7/26 at 100.00 | BBB– | 1,741,472 |
| 2,700 | | 5.000%, 7/01/36 | 7/26 at 100.00 | BBB– | 2,924,208 |
| 3,095 | | 5.000%, 7/01/41 | 7/26 at 100.00 | BBB– | 3,299,858 |
| 5,600 | | 4.000%, 7/01/48 | 7/26 at 100.00 | BBB– | 5,387,872 |
| 2,345 | | New Jersey Health Care Facilities Financing Authority, Revenue Bonds, Saint Luke’s | 8/23 at 100.00 | A– | 2,384,161 |
| | | Warren Hospital Obligated Group, Series 2013, 4.000%, 8/15/37 | | | |
28
| | | | | | |
Principal | | | Optional Call | | |
Amount (000) | | Description (1) | Provisions (2) | Ratings (3) | Value |
| | | Health Care (continued) | | | |
| | | New Jersey Health Care Facilities Financing Authority, Revenue Bonds, University | | | |
| | | Hospital Issue, Refunding Series 2015A: | | | |
| $ 5,055 | | 4.125%, 7/01/38 – AGM Insured | 7/25 at 100.00 | AA | $ 5,148,467 |
| 3,910 | | 5.000%, 7/01/46 – AGM Insured | 7/25 at 100.00 | AA | 4,221,158 |
| 1,000 | | New Jersey Health Care Facilities Financing Authority, Revenue Bonds, Virtua Health, | 7/19 at 100.00 | AA | 1,011,400 |
| | | Series 2009A, 5.500%, 7/01/38 – AGC Insured | | | |
| 119,820 | | Total Health Care | | | 128,905,990 |
| | | Housing/Multifamily – 3.5% (2.3% of Total Investments) | | | |
| 1,845 | | New Jersey Economic Development Authority, Revenue Bonds, Provident Group – Kean | 1/27 at 100.00 | BBB– | 1,955,091 |
| | | Properties LLC – Kean University Student Housing Project, Series 2017A, 5.000%, 7/01/47 | | | |
| 1,900 | | New Jersey Economic Development Authority, Revenue Bonds, Provident Group – Rowan | 1/25 at 100.00 | BBB– | 1,983,695 |
| | | Properties LLC – Rowan University Student Housing Project, Series 2015A, 5.000%, 1/01/48 | | | |
| 6,075 | | New Jersey Economic Development Authority, Revenue Bonds, West Campus Housing LLC – New | 7/25 at 100.00 | BBB– | 6,199,963 |
| | | Jersey City University Student Housing Project, Series 2015, 5.000%, 7/01/47 | | | |
| | | New Jersey Housing and Mortgage Finance Agency, Multifamily Housing Revenue Bonds, | | | |
| | | Series 2013-2: | | | |
| 2,165 | | 4.350%, 11/01/33 (AMT) | 11/22 at 100.00 | AA | 2,238,870 |
| 1,235 | | 4.600%, 11/01/38 (AMT) | 11/22 at 100.00 | AA | 1,273,149 |
| 1,235 | | 4.750%, 11/01/46 (AMT) | 11/22 at 100.00 | AA | 1,270,148 |
| 4,320 | | New Jersey Housing and Mortgage Finance Agency, Multifamily Revenue Bonds, Series 2015A, | 11/24 at 100.00 | AA– | 4,356,331 |
| | | 4.000%, 11/01/45 | | | |
| | | New Jersey Housing and Mortgage Finance Agency, Multifamily Revenue Bonds, Series 2017D: | | | |
| 1,125 | | 3.900%, 11/01/32 (AMT) | 5/26 at 100.00 | AA– | 1,157,614 |
| 1,750 | | 4.250%, 11/01/37 (AMT) | 5/26 at 100.00 | AA– | 1,795,500 |
| 21,650 | | Total Housing/Multifamily | | | 22,230,361 |
| | | Housing/Single Family – 7.3% (4.8% of Total Investments) | | | |
| | | New Jersey Housing & Mortgage Finance Agency, Single Family Home Mortgage Revenue Bonds, | | | |
| | | Series 2011A: | | | |
| 8,330 | | 4.450%, 10/01/25 | 4/21 at 100.00 | Aa2 | 8,699,019 |
| 8,340 | | 4.650%, 10/01/29 | 4/21 at 100.00 | Aa2 | 8,646,745 |
| | | New Jersey Housing and Mortgage Finance Agency, Single Family Housing Revenue Bonds, | | | |
| | | Series 2018A: | | | |
| 6,915 | | 3.600%, 4/01/33 | 10/27 at 100.00 | AA | 7,019,970 |
| 3,700 | | 3.750%, 10/01/35 | 10/27 at 100.00 | AA | 3,743,549 |
| 3,695 | | New Jersey Housing and Mortgage Finance Agency, Single Family Housing Revenue Bonds, | 10/27 at 100.00 | AA | 3,750,647 |
| | | Series 2018B, 3.800%, 10/01/32 (AMT) | | | |
| | | New Jersey Housing and Mortgage Finance Agency, Single Family Housing Revenue Bonds, | | | |
| | | Series 2019C: | | | |
| 5,500 | | 3.500%, 10/01/34 (UB) (WI/DD, settling 3/21/19) | 4/28 at 100.00 | AA | 5,520,185 |
| 5,500 | | 3.850%, 10/01/39 (UB) (WI/DD, settling 3/21/19) | 4/28 at 100.00 | AA | 5,529,370 |
| 3,750 | | 3.950%, 10/01/44 (UB) (WI/DD, settling 3/21/19) | 4/28 at 100.00 | AA | 3,774,038 |
| 45,730 | | Total Housing/Single Family | | | 46,683,523 |
| | | Long-Term Care – 2.5% (1.7% of Total Investments) | | | |
| 7,835 | | Burlington County Bridge Commission, New Jersey, Economic Development Revenue Bonds, The | 3/19 at 100.00 | N/R | 7,514,000 |
| | | Evergreens Project, Series 2007, 5.625%, 1/01/38 | | | |
| 510 | | New Jersey Economic Development Authority, Fixed Rate Revenue Bonds, Lions Gate Project, | 1/24 at 100.00 | N/R | 511,902 |
| | | Series 2014, 5.250%, 1/01/44 | | | |
| 5,000 | | New Jersey Economic Development Authority, Revenue Bonds, United Methodist Homes of New | 7/23 at 100.00 | BBB– | 5,146,450 |
| | | Jersey Obligated Group Issue, Refunding Series 2013, 5.000%, 7/01/34 | | | |
| 1,410 | | New Jersey Economic Development Authority, Revenue Bonds, United Methodist Homes of New | 7/24 at 100.00 | BBB– | 1,481,092 |
| | | Jersey Obligated Group Issue, Refunding Series 2014A, 5.000%, 7/01/29 | | | |
29
| | | | | | | |
NXJ | | Nuveen New Jersey Quality Municipal Income Fund | |
| | | Portfolio of Investments (continued) | | | | |
| | | February 28, 2019 | | | | |
| |
| |
| |
| |
Principal | | | Optional Call | | |
Amount (000) | | Description (1) | Provisions (2) | Ratings (3) | Value |
| | | Long-Term Care (continued) | | | |
| $ 1,450 | | New Jersey Health Care Facilities Financing Authority, Revenue Bonds, Village Drive | 10/26 at 102.00 | N/R | $ 1,429,831 |
| | | Healthcare Urban Renewal LLC, Series 2018, 5.750%, 10/01/38, 144A | | | |
| 16,205 | | Total Long-Term Care | | | 16,083,275 |
| | | Tax Obligation/General – 7.5% (5.0% of Total Investments) | | | |
| 2,225 | | Cumberland County Improvement Authority, New Jersey, County General Obligation Revenue | 9/24 at 100.00 | AA | 2,508,198 |
| | | Bonds, Technical High School Project, Series 2014, 5.000%, 9/01/39 – AGM Insured | | | |
| | | Cumberland County Improvement Authority, New Jersey, County General Obligation Revenue | | | |
| | | Bonds, Technical High School Project, Series 2018: | | | |
| 440 | | 3.125%, 1/15/32 – BAM Insured | 1/28 at 100.00 | AA | 441,157 |
| 700 | | 3.125%, 1/15/33 – BAM Insured | 1/28 at 100.00 | AA | 694,806 |
| 2,920 | | Cumberland County Improvement Authority, New Jersey, Guaranteed Lease Revenue Bonds, | 10/28 at 100.00 | AA | 2,990,401 |
| | | County Correctional Facility Project, Series 2018, 4.000%, 10/01/43 – BAM Insured | | | |
| 680 | | Hamilton Township, Mercer County Board of Education, New Jersey, General Obligation | 12/27 at 100.00 | AA | 660,212 |
| | | Bonds, Series 2017, 3.250%, 12/15/38 | | | |
| | | Harrison, New Jersey, General Obligation Bonds, Parking Utility Series 2018: | | | |
| 1,340 | | 3.125%, 3/01/31 – BAM Insured | 3/28 at 100.00 | AA | 1,348,831 |
| 1,110 | | 3.250%, 3/01/32 – BAM Insured | 3/28 at 100.00 | AA | 1,119,568 |
| 1,255 | | 3.500%, 3/01/36 – BAM Insured | 3/28 at 100.00 | AA | 1,264,312 |
| | | Hudson County Improvement Authority, New Jersey, County Guaranteed Governmental Loan | | | |
| | | Revenue Bonds, Guttenberg General Obligation Bond Project, Series 2018: | | | |
| 375 | | 3.250%, 8/01/34 | 8/25 at 100.00 | AA | 375,570 |
| 1,040 | | 5.000%, 8/01/42 | 8/25 at 100.00 | AA | 1,157,104 |
| | | Jersey City, New Jersey, General Obligation Bonds, Refunding General Improvement | | | |
| | | Series 2017A: | | | |
| 1,000 | | 5.000%, 11/01/29 | 11/27 at 100.00 | AA– | 1,191,740 |
| 515 | | 5.000%, 11/01/31 | 11/27 at 100.00 | AA– | 604,311 |
| 440 | | 5.000%, 11/01/33 | 11/27 at 100.00 | AA– | 511,381 |
| 1,100 | | Linden, New Jersey, General Obligation Bonds, Refunding Series 2011, 4.000%, 5/01/23 | 5/21 at 100.00 | AA– | 1,153,086 |
| 1,975 | | Middletown Township Board of Education, Monmouth County, New Jersey, Refunding Series | 8/20 at 100.00 | AA– | 2,062,868 |
| | | 2010, 5.000%, 8/01/27 | | | |
| 2,280 | | Monroe Township Board of Education, Middlesex County, New Jersey, General Obligation | 3/25 at 100.00 | AA– | 2,575,260 |
| | | Bonds, Refunding Series 2015, 5.000%, 3/01/38 | | | |
| 760 | | Montclair Township, Essex County, New Jersey, General Obligation Bonds, Refunding | 1/24 at 100.00 | AAA | 861,688 |
| | | Parking Utility Series 2014A, 5.000%, 1/01/37 | | | |
| | | New Brunswick Parking Authority, Middlesex County, New Jersey, Guaranteed Parking | | | |
| | | Revenue Bonds, Refunding Series 2012: | | | |
| 465 | | 5.000%, 9/01/28 | 9/22 at 100.00 | A+ | 508,817 |
| 610 | | 5.000%, 9/01/29 | 9/22 at 100.00 | A+ | 667,267 |
| 300 | | 5.000%, 9/01/31 | 9/22 at 100.00 | A+ | 327,636 |
| 250 | | 3.625%, 9/01/34 | 9/22 at 100.00 | A+ | 253,338 |
| 2,190 | | New Brunswick, New Jersey, General Obligation Bonds, Cultural Center Project, Series | 9/27 at 100.00 | AA | 2,279,242 |
| | | 2017, 4.000%, 9/15/44 – AGM Insured | | | |
| | | Sparta Township Board of Education, Sussex County, New Jersey, General Obligation Bonds, | | | |
| | | Refunding Series 2015: | | | |
| 1,000 | | 5.000%, 2/15/34 | 2/25 at 100.00 | AA– | 1,139,970 |
| 1,395 | | 5.000%, 2/15/35 | 2/25 at 100.00 | AA– | 1,586,129 |
| 3,975 | | Union County Improvement Authority, New Jersey, General Obligation Lease Revenue Bonds, | No Opt. Call | AA+ | 7,380,541 |
| | | Tender Option Bond Trust 2016-XG0057, 14.646%, 3/01/34, 144A (IF) (4) | | | |
| 5,165 | | Union County Utilities Authority, New Jersey, Resource Recovery Facility Lease Revenue | 12/21 at 100.00 | AA+ | 5,603,199 |
| | | Bonds, Covantan Union Inc. Lessee, Refunding Series 2011B, 5.250%, 12/01/31 (AMT) | | | |
| 2,515 | | Union County Utilities Authority, New Jersey, Solid Waste System County Deficiency | 6/21 at 100.00 | Aaa | 2,679,607 |
| | | Revenue Bonds, Series 2011A, 5.000%, 6/15/41 | | | |
30
| | | | | | |
Principal | | | Optional Call | | |
Amount (000) | | Description (1) | Provisions (2) | Ratings (3) | Value |
| | | Tax Obligation/General (continued) | | | |
| $ 2,170 | | Union County, New Jersey, General Obligation Bonds, Refunding Series 2017, | 9/25 at 100.00 | Aaa | $ 2,266,022 |
| | | 3.000%, 3/01/27 | | | |
| 1,515 | | Washington Township Board of Education, Mercer County, New Jersey, General Obligation | 7/19 at 100.00 | Aa3 | 1,863,314 |
| | | Bonds, Series 2005, 5.250%, 1/01/27 – AGM Insured | | | |
| 100 | | Woodbridge Township, Middlesex County, New Jersey, General Obligation Bonds, Refunding | No Opt. Call | AA+ | 101,248 |
| | | Series 2010, 5.000%, 7/15/19 | | | |
| 41,805 | | Total Tax Obligation/General | | | 48,176,823 |
| | | Tax Obligation/Limited – 34.8% (23.0% of Total Investments) | | | |
| 3,775 | | Bergen County Improvement Authority, New Jersey, Guaranteed Lease Revenue Bonds, County | 7/19 at 100.00 | Aaa | 4,615,466 |
| | | Administration Complex Project, Series 2005, 5.000%, 11/15/26 | | | |
| 4,150 | | Essex County Improvement Authority, New Jersey, Project Consolidation Revenue Bonds, | 7/22 at 100.00 | Aaa | 4,694,023 |
| | | Refunding Series 2007, 5.250%, 12/15/22 – AMBAC Insured | | | |
| 3,000 | | Garden State Preservation Trust, New Jersey, Open Space and Farmland Preservation Bonds, | 7/22 at 100.00 | AA | 2,554,920 |
| | | Series 2003B, 0.000%, 11/01/25 – AGM Insured | | | |
| 2,870 | | Garden State Preservation Trust, New Jersey, Open Space and Farmland Preservation Bonds, | 7/22 at 100.00 | AA | 3,488,428 |
| | | Series 2005A, 5.750%, 11/01/28 – AGM Insured | | | |
| | | Government of Guam, Business Privilege Tax Bonds, Series 2011A: | | | |
| 5,005 | | 5.250%, 1/01/36 | 8/22 at 101.00 | BB | 5,226,922 |
| 3,020 | | 5.125%, 1/01/42 | 7/22 at 100.00 | BB | 3,102,023 |
| 500 | | Government of Guam, Business Privilege Tax Bonds, Series 2012B-1, 5.000%, 1/01/29 | 9/21 at 100.00 | BB | 521,615 |
| | | Hudson County Improvement Authority, New Jersey, County Secured Lease Revenue Bonds, | | | |
| | | Hudson County Vocational Technical Schools Project, Series 2016: | | | |
| 10,310 | | 5.000%, 5/01/46 | 7/22 at 100.00 | AA | 11,495,650 |
| 3,700 | | 5.250%, 5/01/51 | 7/23 at 100.00 | AA | 4,171,824 |
| | | New Jersey Economic Development Authority, Cigarette Tax Revenue Refunding Bonds, | | | |
| | | Series 2012: | | | |
| 310 | | 5.000%, 6/15/21 | 7/19 at 100.00 | BBB+ | 328,436 |
| 6,400 | | 5.000%, 6/15/25 | 7/23 at 100.00 | BBB+ | 6,876,608 |
| 3,480 | | 5.000%, 6/15/26 | 7/22 at 100.00 | BBB+ | 3,730,630 |
| 7,945 | | 5.000%, 6/15/28 | 9/21 at 100.00 | BBB+ | 8,459,995 |
| 415 | | 5.000%, 6/15/29 | 6/22 at 100.00 | BBB+ | 440,859 |
| 5,265 | | New Jersey Economic Development Authority, Lease Revenue Bonds, State House Project, | 12/28 at 100.00 | A– | 5,311,542 |
| | | Series 2017B, 4.500%, 6/15/40 | | | |
| 5,570 | | New Jersey Economic Development Authority, Revenue Bonds, Motor Vehicle Surcharge, | 7/27 at 100.00 | BBB+ | 5,531,901 |
| | | Refunding Series 2017A, 3.375%, 7/01/30 | | | |
| 6,385 | | New Jersey Economic Development Authority, School Facilities Construction Bonds, Series | 6/24 at 100.00 | A– | 6,953,329 |
| | | 2014UU, 5.000%, 6/15/27 | | | |
| 12,000 | | New Jersey Economic Development Authority, School Facilities Construction Bonds, Series | 6/25 at 100.00 | A– | 12,758,520 |
| | | 2015WW, 5.250%, 6/15/40 | | | |
| 5,000 | | New Jersey Economic Development Authority, School Facilities Construction Financing | 6/24 at 100.00 | A– | 5,489,800 |
| | | Program Bonds, Refunding Series 2014PP, 5.000%, 6/15/26 | | | |
| 6,000 | | New Jersey Economic Development Authority, Sublease Revenue Bonds, New Jersey Transit | No Opt. Call | A– | 6,790,080 |
| | | Corporation Projects, Refunding Series 2017B, 5.000%, 11/01/25 | | | |
| | | New Jersey Transportation Trust Fund Authority, Federal Highway Reimbursement Revenue | | | |
| | | Notes, Series 2016A-1: | | | |
| 1,130 | | 5.000%, 6/15/29 | 6/26 at 100.00 | A+ | 1,271,250 |
| 655 | | 5.000%, 6/15/30 | 6/26 at 100.00 | A+ | 731,714 |
| 32,965 | | New Jersey Transportation Trust Fund Authority, Transportation System Bonds, Capital | No Opt. Call | A– | 20,719,162 |
| | | Appreciation Series 2010A, 0.000%, 12/15/30 | | | |
| 8,100 | | New Jersey Transportation Trust Fund Authority, Transportation System Bonds, Refunding | No Opt. Call | A– | 8,999,586 |
| | | Series 2006A, 5.500%, 12/15/22 | | | |
31
| | | | | | |
NXJ | | Nuveen New Jersey Quality Municipal Income Fund | |
| | | Portfolio of Investments (continued) | | | |
| | | February 28, 2019 | | | |
| |
| |
| |
| |
Principal | | | Optional Call | | |
Amount (000) | | Description (1) | Provisions (2) | Ratings (3) | Value |
| | | Tax Obligation/Limited (continued) | | | |
| | | New Jersey Transportation Trust Fund Authority, Transportation System Bonds, Refunding | | | |
| | | Series 2006C: | | | |
| $ 37,565 | | 0.000%, 12/15/32 – AGM Insured | No Opt. Call | AA | $ 22,341,408 |
| 39,090 | | 0.000%, 12/15/33 – AGM Insured | No Opt. Call | AA | 22,255,110 |
| 5,160 | | 0.000%, 12/15/34 – AGM Insured | No Opt. Call | AA | 2,790,528 |
| 7,000 | | New Jersey Transportation Trust Fund Authority, Transportation System Bonds, Series | No Opt. Call | A– | 7,854,350 |
| | | 2010D, 5.000%, 12/15/24 | | | |
| | | New Jersey Transportation Trust Fund Authority, Transportation System Bonds, Series 2011A: | | | |
| 145 | | 6.000%, 6/15/35 | 6/21 at 100.00 | A– | 154,935 |
| 1,510 | | 5.500%, 6/15/41 | 6/21 at 100.00 | A– | 1,569,887 |
| | | New Jersey Transportation Trust Fund Authority, Transportation System Bonds, Series 2011B: | | | |
| 285 | | 5.500%, 6/15/31 | 6/21 at 100.00 | A– | 299,737 |
| 4,420 | | 5.250%, 6/15/36 | 6/21 at 100.00 | A– | 4,593,573 |
| 325 | | 5.000%, 6/15/37 | 6/21 at 100.00 | A– | 335,566 |
| 2,660 | | 5.000%, 6/15/42 | 6/21 at 100.00 | A– | 2,734,932 |
| | | New Jersey Transportation Trust Fund Authority, Transportation System Bonds, Series 2018A: | | | |
| 1,150 | | 5.000%, 12/15/35 | 12/28 at 100.00 | A– | 1,248,934 |
| 440 | | 5.000%, 12/15/36 | 12/28 at 100.00 | A– | 476,265 |
| 4,690 | | 4.250%, 12/15/38 | 12/28 at 100.00 | A– | 4,637,706 |
| 4,290 | | New Jersey Transportation Trust Fund Authority, Transportation System Bonds, Series | 12/28 at 100.00 | A– | 4,248,816 |
| | | 2019AA, 4.500%, 6/15/49 | | | |
| 3,860 | | Passaic County Improvement Authority, New Jersey, Lease Revenue Bonds, Preakness | 5/25 at 100.00 | AA | 3,950,710 |
| | | Healthcare Center Expansion Project, Refunding Series 2015, 3.750%, 5/01/36 | | | |
| 4,005 | | Passaic County Improvement Authority, New Jersey, Lease Revenue Bonds, Preakness | 5/22 at 100.00 | Aa2 | 4,032,955 |
| | | Healthcare Center Expansion Project, Series 2012, 3.500%, 5/01/35 | | | |
| | | Union County Improvement Authority, New Jersey, General Obligation Lease Bonds, Juvenile | | | |
| | | Detention Center Facility Project, Tender Option Bond Trust 2015-XF1019: | | | |
| 285 | | 18.253%, 5/01/28, 144A (IF) (4) | No Opt. Call | Aaa | 651,752 |
| 285 | | 20.410%, 5/01/29, 144A (IF) (4) | No Opt. Call | Aaa | 669,776 |
| 200 | | 20.410%, 5/01/30, 144A (IF) (4) | No Opt. Call | Aaa | 479,014 |
| 370 | | 20.208%, 5/01/31, 144A (IF) (4) | No Opt. Call | Aaa | 897,520 |
| 385 | | 20.313%, 5/01/32, 144A (IF) (4) | No Opt. Call | Aaa | 960,802 |
| 400 | | 20.317%, 5/01/33, 144A (IF) (4) | No Opt. Call | Aaa | 1,016,400 |
| 415 | | 20.410%, 5/01/34, 144A (IF) (4) | No Opt. Call | Aaa | 1,079,000 |
| 256,885 | | Total Tax Obligation/Limited | | | 223,543,959 |
| | | Transportation – 26.7% (17.7% of Total Investments) | | | |
| 5,550 | | Casino Reinvestment Development Authority, New Jersey, Parking Revenue Bonds, Series | 3/19 at 100.00 | Baa2 | 5,566,539 |
| | | 2005A, 5.250%, 6/01/20 – NPFG Insured | | | |
| 2,400 | | Delaware River and Bay Authority, Delaware and New Jersey, Revenue Bonds, Series 2012A, | 1/23 at 100.00 | A1 | 2,610,312 |
| | | 5.000%, 1/01/42 | | | |
| | | Delaware River and Bay Authority, Delaware and New Jersey, Revenue Bonds, Series 2014A: | | | |
| 1,285 | | 5.000%, 1/01/34 | 1/24 at 100.00 | A1 | 1,439,354 |
| 5,890 | | 4.125%, 1/01/39 | 1/24 at 100.00 | A1 | 6,045,025 |
| 7,800 | | 5.000%, 1/01/44 | 1/24 at 100.00 | A1 | 8,661,744 |
| | | Delaware River Joint Toll Bridge Commission, New Jersey and Pennsylvania, Bridge System | | | |
| | | Revenue Bonds, Refunding Series 2015: | | | |
| 1,000 | | 4.000%, 7/01/34 – BAM Insured | 7/25 at 100.00 | AA | 1,059,050 |
| 2,820 | | 4.000%, 7/01/35 – BAM Insured | 7/25 at 100.00 | AA | 2,978,879 |
| | | Delaware River Joint Toll Bridge Commission, New Jersey and Pennsylvania, Bridge System | | | |
| | | Revenue Bonds, Series 2017: | | | |
| 2,820 | | 5.000%, 7/01/42 | 7/27 at 100.00 | A1 | 3,199,459 |
| 10,210 | | 5.000%, 7/01/47 | 7/27 at 100.00 | A1 | 11,523,925 |
32
| | | | | | |
Principal | | | Optional Call | | |
Amount (000) | | Description (1) | Provisions (2) | Ratings (3) | Value |
| | | Transportation (continued) | | | |
| | | Delaware River Joint Toll Bridge Commission, Pennsylvania, Bridge System Revenue Bonds, | | | |
| | | Refunding Series 2012A: | | | |
| $ 2,150 | | 5.000%, 7/01/24 | 7/22 at 100.00 | A1 | $ 2,370,354 |
| 650 | | 4.000%, 7/01/26 | 7/22 at 100.00 | A1 | 686,114 |
| 625 | | 4.000%, 7/01/27 | 7/22 at 100.00 | A1 | 658,006 |
| 7,035 | | Delaware River Port Authority, New Jersey and Pennsylvania, Revenue Bonds, Series 2013, | 1/24 at 100.00 | A+ | 7,738,359 |
| | | 5.000%, 1/01/40 | | | |
| 2,325 | | Delaware River Port Authority, New Jersey and Pennsylvania, Revenue Bonds, Series 2018A, | 1/29 at 100.00 | A+ | 2,725,249 |
| | | 5.000%, 1/01/37 | | | |
| | | Delaware River Port Authority, Pennsylvania and New Jersey, Revenue Refunding Bonds, | | | |
| | | Port District Project, Series 2012: | | | |
| 1,800 | | 5.000%, 1/01/24 | 1/23 at 100.00 | A | 1,985,184 |
| 1,635 | | 5.000%, 1/01/25 | 1/23 at 100.00 | A | 1,800,299 |
| 1,875 | | 5.000%, 1/01/26 | 1/23 at 100.00 | A | 2,058,844 |
| 3,525 | | 5.000%, 1/01/27 | 1/23 at 100.00 | A | 3,854,693 |
| 5,555 | | New Jersey Economic Development Authority, Private Activity Bonds, The Goethals Bridge | 1/24 at 100.00 | BBB | 6,095,279 |
| | | Replacement Project, Series 2013, 5.625%, 1/01/52 (AMT) | | | |
| | | New Jersey Economic Development Authority, Special Facilities Revenue Bonds, Continental | | | |
| | | Airlines Inc., Series 1999: | | | |
| 1,000 | | 5.125%, 9/15/23 (AMT) | 8/22 at 101.00 | BB | 1,079,750 |
| 1,800 | | 5.250%, 9/15/29 (AMT) | 8/22 at 101.00 | BB | 1,955,412 |
| 2,250 | | New Jersey Economic Development Authority, Special Facilities Revenue Bonds, Continental | 3/24 at 101.00 | BB | 2,541,487 |
| | | Airlines Inc., Series 2000A & 2000B, 5.625%, 11/15/30 (AMT) | | | |
| | | New Jersey Economic Development Authority, Special Facility Revenue Bonds, Port Newark | | | |
| | | Container Terminal LLC Project, Refunding Series 2017: | | | |
| 5,660 | | 5.000%, 10/01/37 (AMT) | 10/27 at 100.00 | Ba1 | 6,064,577 |
| 7,440 | | 5.000%, 10/01/47 (AMT) | 10/27 at 100.00 | Ba1 | 7,860,509 |
| | | New Jersey Transit Corporation, Grant Anticipation Notes, Federal Transit Administration | | | |
| | | Section 5307 Urbanized Area Formula Funds, Series 2014A: | | | |
| 6,000 | | 5.000%, 9/15/20 | No Opt. Call | A | 6,272,760 |
| 5,750 | | 5.000%, 9/15/21 | No Opt. Call | A | 6,151,695 |
| 6,570 | | New Jersey Turnpike Authority, Revenue Bonds, Refunding Series 2015E, 5.000%, 1/01/45 | 1/25 at 100.00 | A+ | 7,242,374 |
| 3,065 | | New Jersey Turnpike Authority, Revenue Bonds, Series 2005A, 5.250%, 1/01/29 – | No Opt. Call | AA | 3,858,804 |
| | | AGM Insured | | | |
| 7,620 | | New Jersey Turnpike Authority, Revenue Bonds, Series 2012B, 5.000%, 1/01/28 | 1/23 at 100.00 | A+ | 8,472,830 |
| 1,365 | | New Jersey Turnpike Authority, Revenue Bonds, Tender Option Bond Trust 2016-XF1057, | | | |
| | | 13.614%, 1/01/43, 144A (IF) (4) | 7/22 at 100.00 | A+ | 1,909,731 |
| 2,750 | | Passaic County Improvement Authority, New Jersey, Revenue Bonds, Paterson Parking Deck | 3/19 at 100.00 | A2 | 2,756,737 |
| | | Facility, Series 2005, 5.000%, 4/15/35 – AGM Insured | | | |
| 7,235 | | Port Authority of New York and New Jersey, Consolidated Revenue Bonds, One Hundred | 12/23 at 100.00 | AA– | 8,101,898 |
| | | Seventy Ninth Series 2013, 5.000%, 12/01/43 | | | |
| 5,000 | | Port Authority of New York and New Jersey, Consolidated Revenue Bonds, One Hundred | 1/23 at 100.00 | AA– | 5,057,900 |
| | | Seventy Seventh Series 2013, 4.000%, 1/15/43 (AMT) | | | |
| | | Port Authority of New York and New Jersey, Special Project Bonds, JFK International Air | | | |
| | | Terminal LLC, Sixth Series 1997: | | | |
| 16,150 | | 5.750%, 12/01/22 – NPFG Insured (AMT) | 3/19 at 100.00 | BBB+ | 16,757,724 |
| 12,130 | | 5.750%, 12/01/25 – NPFG Insured (AMT) | 3/19 at 100.00 | BBB+ | 12,587,180 |
| 158,735 | | Total Transportation | | | 171,728,036 |
| | | U.S. Guaranteed – 11.4% (7.6% of Total Investments) (5) | | | |
| | | Delaware River Port Authority, New Jersey and Pennsylvania, Revenue Bonds, Series 2010E: | | | |
| 5,005 | | 5.000%, 1/01/40 (Pre-refunded 1/01/20) | 1/20 at 100.00 | A+ | 5,145,891 |
| 1,000 | | 5.000%, 1/01/40 (Pre-refunded 1/01/20) – AGM Insured | 1/20 at 100.00 | AA | 1,028,150 |
| 25 | | Essex County Improvement Authority, New Jersey, Project Consolidation Revenue Bonds, | No Opt. Call | Aaa | 28,314 |
| | | Refunding Series 2007, 5.250%, 12/15/22 – AMBAC Insured (ETM) | | | |
33
| | | | | | | |
NXJ | | Nuveen New Jersey Quality Municipal Income Fund | |
| | | Portfolio of Investments (continued) | | | | |
| | | February 28, 2019 | | | | |
| |
| |
| |
| |
Principal | | | Optional Call | | |
Amount (000) | | Description (1) | Provisions (2) | Ratings (3) | Value |
| | | U.S. Guaranteed (continued) | | | |
| | | New Jersey Economic Development Authority, Student Housing Revenue Bonds, Provident | | | |
| | | Group-Montclair Properties LLC, Montclair State University Student Housing Project, Series 2010A: | | | |
| $ 3,870 | | 5.750%, 6/01/31 (Pre-refunded 6/01/20) | 6/20 at 100.00 | N/R | $ 4,068,028 |
| 2,100 | | 5.875%, 6/01/42 (Pre-refunded 6/01/20) | 6/20 at 100.00 | N/R | 2,210,670 |
| | | New Jersey Educational Facilities Authority, Revenue Bonds, University of Medicine and | | | |
| | | Dentistry of New Jersey, Refunding Series 2009B: | | | |
| 25 | | 6.500%, 12/01/19 (Pre-refunded 6/01/19) | 6/19 at 100.00 | N/R | 25,300 |
| 100 | | 6.500%, 12/01/20 (Pre-refunded 6/01/19) | 6/19 at 100.00 | N/R | 101,198 |
| 5 | | 7.125%, 12/01/23 (Pre-refunded 6/01/19) | 6/19 at 100.00 | N/R | 5,067 |
| 30 | | New Jersey Environmental Infrastructure Trust, Environmental Infrastructure Bonds, | 9/21 at 100.00 | N/R | 31,100 |
| | | Series 2012A, 3.250%, 9/01/31 (Pre-refunded 9/01/21) | | | |
| | | New Jersey Health Care Facilities Financing Authority, Revenue Bonds, Kennedy Health | | | |
| | | System Obligated Group Issue, Refunding Series 2012: | | | |
| 4,165 | | 3.750%, 7/01/27 (ETM) | No Opt. Call | N/R | 4,632,521 |
| 3,375 | | 5.000%, 7/01/31 (Pre-refunded 7/01/22) | 7/22 at 100.00 | N/R | 3,732,345 |
| 1,500 | | 5.000%, 7/01/37 (Pre-refunded 7/01/22) | 7/22 at 100.00 | N/R | 1,658,820 |
| | | New Jersey Health Care Facilities Financing Authority, Revenue Bonds, Palisades Medical | | | |
| | | Center Obligated Group Issue, Refunding Series 2013: | | | |
| 555 | | 5.250%, 7/01/31 (Pre-refunded 7/01/23) | 7/23 at 100.00 | N/R | 633,816 |
| 2,570 | | 5.250%, 7/01/31 (Pre-refunded 7/01/23) | 7/23 at 100.00 | N/R | 2,940,722 |
| 275 | | 5.500%, 7/01/43 (Pre-refunded 7/01/23) | 7/23 at 100.00 | N/R | 316,899 |
| 1,285 | | 5.500%, 7/01/43 (Pre-refunded 7/01/23) | 7/23 at 100.00 | N/R | 1,483,687 |
| 7,670 | | New Jersey Health Care Facilities Financing Authority, Revenue Bonds, Saint Barnabas | 7/21 at 100.00 | N/R | 8,355,084 |
| | | Health Care System, Refunding Series 2011A, 5.625%, 7/01/37 (Pre-refunded 7/01/21) | | | |
| 3,805 | | New Jersey Health Care Facilities Financing Authority, Revenue Bonds, St. Clare’s | 3/19 at 100.00 | AA | 3,985,243 |
| | | Hospital, Series 2004A, 5.250%, 7/01/20 – RAAI Insured (ETM) | | | |
| 175 | | New Jersey Institute of Technology, New Jersey, General Obligation Bonds, Series 2012A, | 7/22 at 100.00 | N/R | 194,128 |
| | | 5.000%, 7/01/42 (Pre-refunded 7/01/22) | | | |
| 1,555 | | New Jersey Sports and Exposition Authority, Convention Center Luxury Tax Bonds, Series | No Opt. Call | Baa2 | 1,727,605 |
| | | 2004, 5.500%, 3/01/22 – NPFG Insured (ETM) | | | |
| 7,500 | | New Jersey Turnpike Authority, Revenue Bonds, Series 2009I, 5.000%, 1/01/35 | 1/20 at 100.00 | A+ | 7,711,125 |
| | | (Pre-refunded 1/01/20) | | | |
| 2,260 | | New Jersey Turnpike Authority, Revenue Bonds, Tender Option Bond Trust 2016-XF1057, | | | |
| | | 13.614%, 1/01/43 (Pre-refunded 7/01/22), 144A (IF) (4) | 7/22 at 100.00 | N/R | 3,161,898 |
| 1,650 | | Newark Housing Authority, New Jersey, City-Secured Police Facility Revenue Bonds, South | 12/19 at 100.00 | A3 | 1,712,848 |
| | | Ward Police Facility, Series 2009A, 6.750%, 12/01/38 (Pre-refunded 12/01/19) – AGC Insured | | | |
| | | North Hudson Sewerage Authority, New Jersey, Gross Revenue Lease Certificates, Senior Lien | | | |
| | | Series 2012A: | | | |
| 1,455 | | 5.000%, 6/01/27 (Pre-refunded 6/01/22) | 6/22 at 100.00 | N/R | 1,605,287 |
| 225 | | 5.000%, 6/01/42 (Pre-refunded 6/01/22) | 6/22 at 100.00 | N/R | 248,240 |
| 15,840 | | North Hudson Sewerage Authority, New Jersey, Sewerage Revenue Refunding Bonds, Series | No Opt. Call | Baa2 | 14,522,270 |
| | | 2001A, 0.000%, 8/01/23 – NPFG Insured (ETM) | | | |
| 2,100 | | Passaic County Improvement Authority, New Jersey, County Guaranteed Parking Revenue | 5/20 at 100.00 | Aa2 | 2,182,320 |
| | | Bonds, 200 Hospital Plaza Project, Series 2010, 5.000%, 5/01/42 (Pre-refunded 5/01/20) | | | |
| 70,120 | | Total U.S. Guaranteed | | | 73,448,576 |
| | | Utilities – 4.8% (3.2% of Total Investments) | | | |
| 13,500 | | Essex County Improvement Authority, New Jersey, Solid Waste Disposal Revenue Bonds, | 7/20 at 100.00 | BB– | 13,558,995 |
| | | Covanta Project, Series 2015, 5.250%, 7/01/45 (AMT), 144A | | | |
| 1,510 | | Industrial Pollution Control Financing Authority of Cape May County (New Jersey), | No Opt. Call | A | 1,633,548 |
| | | Pollution Control Revenue Refunding Bonds, 1991 Series A (Atlantic City Electric Company | | | |
| | | Project), 6.800%, 3/01/21 – NPFG Insured | | | |
| | | New Jersey Economic Development Authority, Energy Facilities Revenue Bonds, UMM Energy | | | |
| | | Partners, LLC Project, Series 2012A: | | | |
| 1,000 | | 4.750%, 6/15/32 (AMT) | 6/22 at 100.00 | Baa2 | 1,029,920 |
| 1,225 | | 5.125%, 6/15/43 (AMT) | 6/22 at 100.00 | Baa2 | 1,264,617 |
34
| | | | | | |
Principal | | | Optional Call | | |
Amount (000) | | Description (1) | Provisions (2) | Ratings (3) | Value |
| | | Utilities (continued) | | | |
| $ 5,100 | | New Jersey Economic Development Authority, Water Facilities Revenue Bonds, New | 5/20 at 100.00 | A+ | $ 5,282,019 |
| | | Jersey-American Water Company Inc. Project, Refunding Series 2010B, 5.600%, | | | |
| | | 11/01/34 (AMT) | | | |
| 2,040 | | New Jersey Economic Development Authority, Water Facilities Revenue Bonds, New | 11/20 at 100.00 | A+ | 2,117,500 |
| | | Jersey-American Water Company Inc. Project, Refunding Series 2010D, 4.875%, | | | |
| | | 11/01/29 (AMT) | | | |
| 2,700 | | Passaic County Utilities Authority, New Jersey, Solid Waste Disposal Revenue Bonds, | No Opt. Call | AA | 3,341,007 |
| | | Refunding Series 2018, 5.000%, 3/01/37 | | | |
| 2,530 | | Salem County Pollution Control Financing Authority, New Jersey, Pollution Control | No Opt. Call | BBB– | 2,680,737 |
| | | Revenue Bonds, Chambers Project, Refunding Series 2014A, 5.000%, 12/01/23 (AMT) | | | |
| 29,605 | | Total Utilities | | | 30,908,343 |
| | | Water and Sewer – 5.1% (3.4% of Total Investments) | | | |
| | | New Jersey Economic Development Authority, Water Facilities Revenue Bonds, Middlesex | | | |
| | | Water Company, Series 2012C: | | | |
| 1,460 | | 5.000%, 10/01/23 | No Opt. Call | A+ | 1,653,537 |
| 15,670 | | 4.250%, 10/01/47 (AMT) | 10/22 at 100.00 | A+ | 15,899,409 |
| 1,650 | | New Jersey Environmental Infrastructure Trust, Environmental Infrastructure Bonds, | 9/21 at 100.00 | AAA | 1,664,371 |
| | | Series 2012A, 3.250%, 9/01/31 | | | |
| 6,270 | | New Jersey Environmental Infrastructure Trust, Environmental Infrastructure Bonds, | No Opt. Call | AAA | 7,003,026 |
| | | Tender Option Bond Trust 2016-XF0395, 6.225%, 9/01/21, 144A (IF) (4) | | | |
| | | North Hudson Sewerage Authority, New Jersey, Gross Revenue Lease Certificates, Senior Lien | | | |
| | | Series 2012A: | | | |
| 2,365 | | 5.000%, 6/01/27 | 6/22 at 100.00 | A+ | 2,575,083 |
| 3,775 | | 5.000%, 6/01/42 | 6/22 at 100.00 | A+ | 4,059,937 |
| 31,190 | | Total Water and Sewer | | | 32,855,363 |
| $ 953,381 | | Total Long-Term Investments (cost $919,559,816) | | | 968,386,043 |
| |
Principal | | | Optional Call | | |
Amount (000) | | Description (1) | Provisions (2) | Ratings (3) | Value |
| | | SHORT-TERM INVESTMENTS – 0.2% (0.1% of Total Investments) | | | |
| | | MUNICIPAL BONDS – 0.2% (0.1% of Total Investments) | | | |
| | | Housing/Single Family – 0.2% (0.1% of Total Investments) | | | |
| $ 1,350 | | New Jersey Housing and Mortgage Finance Agency, Single Family Housing Revenue Bonds, | 3/19 at 100.00 | A-1 | $ 1,350,000 |
| | | Variable Rate Demand Obligations, Series 2005O, 1.600%, 10/01/26 (AMT) (6) | | | |
| $ 1,350 | | Total Short-Term Investments (cost $1,350,000) | | | 1,350,000 |
| | | Total Investments (cost $920,909,816) – 150.8% | | | 969,736,043 |
| | | Floating Rate Obligations – (3.1)% | | | (20,065,000) |
| | | Variable Rate Demand Preferred Shares, net of deferred offering costs – (48.6)% (7) | | | (312,440,063) |
| | | Other Assets Less Liabilities – 0.9% (8) | | | 5,730,350 |
| | | Net Asset Applicable to Common Shares – 100% | | | $ 642,961,330 |
35
| | |
| NXJ | Nuveen New Jersey Quality Municipal Income Fund Portfolio of Investments (continued)
February 28, 2019 |
| | |
Investments in Derivatives |
Interest Rate Swaps - OTC Cleared |
Notional Amount | Fund Pay/Receive Floating Rate | Floating Rate Index | Fixed Rate (Annualized) | Fixed Rate Payment Frequency | Effective Date (9) | Maturity Date | Value | Premiums Paid (Received) | Unrealized Appreciation (Depreciation) | Variation Margin Receivable/ (Payable) |
| $9,500,000 | Receive | 3-Month LIBOR | 3.050% | Semi-Annually | 6/04/19 | 6/04/29 | $(259,279) | $479 | $(259,758) | $21,077 |
| | |
| (1) | All percentages shown in the Portfolio of Investments are based on net assets applicable to common shares unless otherwise noted. |
| (2) | Optional Call Provisions: Dates (month and year) and prices of the earliest optional call or redemption. There may be other call provisions at varying prices at later dates. Certain mortgage-backed securities may be subject to periodic principal paydowns. Optional Call Provisions are not covered by the report of independent registered public accounting firm. |
| (3) | For financial reporting purposes, the ratings disclosed are the highest of Standard & Poor’s Group (“Standard & Poor’s”), Moody’s Investors Service, Inc. (“Moody’s”) or Fitch, Inc. (“Fitch”) rating. This treatment of split-rated securities may differ from that used for other purposes, such as for Fund investment policies. Ratings below BBB by Standard & Poor’s, Baa by Moody’s or BBB by Fitch are considered to be below investment grade. Holdings designated N/R are not rated by any of these national rating agencies. Ratings are not covered by the report of independent registered public accounting firm. |
| (4) | Investment, or portion of investment, has been pledged to collateralize the net payment obligations for investments in inverse floating rate transactions. |
| (5) | Backed by an escrow or trust containing sufficient U.S. Government or U.S. Government agency securities, which ensure the timely payment of principal and interest. |
| (6) | Investment has maturity of greater than one year, but has variable rate and/or demand features which qualify it as a short-term investment. The rate disclosed, as well as the reference rate and spread, where applicable, is that in effect as of the end of the reporting period. This rate changes periodically based on market conditions or a specified market index. |
| (7) | Variable Rate Demand Preferred Shares, net of deferred offering costs as a percentage of Total Investments is 32.2%. |
| (8) | Other assets less liabilities includes the unrealized appreciation (depreciation) of certain over-the-counter (“OTC”) derivatives as presented on the Statement of Assets and Liabilities, when applicable. The unrealized appreciation (depreciation) of OTC cleared and exchange-traded derivatives is recognized as part of cash collateral at brokers and/or the receivable or payable for variation margin as presented on the Statement of Assets and Liabilities, when applicable. |
| (9) | Effective date represents the date on which both the Fund and counterparty commence interest payment accruals on each contract. |
| 144A | Investment is exempt from registration under Rule 144A of the Securities Act of 1933, as amended. These investments may only be resold in transactions exempt from registration, which are normally those transactions with qualified institutional buyers. |
| AMT | Alternative Minimum Tax |
| ETM | Escrowed to maturity |
| IF | Inverse floating rate security issued by a tender option bond (“TOB”) trust, the interest rate on which varies inversely with the Securities Industry Financial Markets Association (SIFMA) short-term rate, which resets weekly, or a similar short-term rate, and is reduced by the expenses related to the TOB trust. |
| LIBOR | London Inter-Bank Offered Rate |
| UB | Underlying bond of an inverse floating rate trust reflected as a financing transaction. See Notes to Financial Statements, Note 3 – Portfolio Securities and Investments in Derivatives. Inverse Floating Rate Securities for more information. |
| WI/DD | Investment, or portion of investment, purchased on a when-issued or delayed delivery basis. |
| | See accompanying notes to financial statements. |
36
| | |
| NJV | Nuveen New Jersey Municipal Value Fund Portfolio of Investments February 28, 2019 |
| | | | | | |
Principal | | | Optional Call | | |
Amount (000) | | Description (1) | Provisions (2) | Ratings (3) | Value |
| | | LONG-TERM INVESTMENTS – 102.7% (99.4% of Total Investments) | | | |
| | | MUNICIPAL BONDS – 102.7% (99.4% of Total Investments) | | | |
| | | Consumer Discretionary – 0.3% (0.3% of Total Investments) | | | |
| $ 100 | | Middlesex County Improvement Authority, New Jersey, Senior Revenue Bonds, Heldrich | 3/19 at 100.00 | Caa2 | $ 75,383 |
| | | Center Hotel/Conference Center Project, Series 2005A, 5.000%, 1/01/32 | | | |
| | | Consumer Staples – 2.9% (2.9% of Total Investments) | | | |
| | | Tobacco Settlement Financing Corporation, New Jersey, Tobacco Settlement Asset-Backed | | | |
| | | Bonds, Series 2018A: | | | |
| 215 | | 4.000%, 6/01/37 | 6/28 at 100.00 | A– | 214,465 |
| 305 | | 5.250%, 6/01/46 | 6/28 at 100.00 | BBB+ | 329,617 |
| 120 | | Tobacco Settlement Financing Corporation, New Jersey, Tobacco Settlement Asset-Backed | 6/28 at 100.00 | BBB | 121,676 |
| | | Bonds, Series 2018B, 5.000%, 6/01/46 | | | |
| 640 | | Total Consumer Staples | | | 665,758 |
| | | Education and Civic Organizations – 18.5% (17.9% of Total Investments) | | | |
| 110 | | Camden County Improvement Authority, New Jersey, Lease Revenue Bonds, Rowan University | 12/23 at 100.00 | A | 121,410 |
| | | School of Osteopathic Medicine Project, Refunding Series 2013A, 5.000%, 12/01/32 | | | |
| 25 | | New Jersey Economic Development Authority, Charter School Revenue Bonds, Foundation | 1/28 at 100.00 | BBB– | 26,442 |
| | | Academy Charter School, Series 2018A, 5.000%, 7/01/38 | | | |
| | | New Jersey Economic Development Authority, Charter School Revenue Bonds, North Star | | | |
| | | Academy Charter School of Newark, Series 2017: | | | |
| 220 | | 4.000%, 7/15/37 | 7/27 at 100.00 | BBB– | 210,320 |
| 25 | | 5.000%, 7/15/47 | 7/27 at 100.00 | BBB– | 26,415 |
| 100 | | New Jersey Economic Development Authority, Charter School Revenue Bonds, Teaneck | 9/27 at 100.00 | BB | 98,504 |
| | | Community Charter School, Series 2017A, 5.125%, 9/01/52, 144A | | | |
| 115 | | New Jersey Economic Development Authority, Revenue Bonds, The Seeing Eye Inc., Refunding | No Opt. Call | A | 133,837 |
| | | Series 2015, 5.000%, 3/01/25 | | | |
| | | New Jersey Economic Development Authority, Revenue Bonds, The Seeing Eye Inc., Refunding | | | |
| | | Series 2017: | | | |
| 15 | | 5.000%, 6/01/32 | 12/27 at 100.00 | A | 17,537 |
| 20 | | 3.000%, 6/01/32 | 12/27 at 100.00 | A | 19,604 |
| 45 | | New Jersey Economic Development Authority, Rutgers University General Obligation Lease | 6/23 at 100.00 | Aa3 | 64,317 |
| | | Revenue Bonds, Tender Option Bond Trust 2016-XF2357, 14.803%, 6/15/46, 144A (IF) (4) | | | |
| 185 | | New Jersey Educational Facilities Authority, Revenue Bonds, College of New Jersey, | 7/26 at 100.00 | AA– | 165,384 |
| | | Refunding Series 2016F, 3.000%, 7/01/40 | | | |
| 100 | | New Jersey Educational Facilities Authority, Revenue Bonds, Kean University, Refunding | 7/25 at 100.00 | AA | 103,972 |
| | | Series 2015H, 4.000%, 7/01/39 – AGM Insured | | | |
| 50 | | New Jersey Educational Facilities Authority, Revenue Bonds, Montclair State University, | 7/24 at 100.00 | AA– | 55,162 |
| | | Series 2014A, 5.000%, 7/01/44 | | | |
| | | New Jersey Educational Facilities Authority, Revenue Bonds, Rider University, Series 2012A: | | | |
| 100 | | 5.000%, 7/01/32 | 7/21 at 100.00 | Baa2 | 103,522 |
| 30 | | 5.000%, 7/01/37 | 7/21 at 100.00 | Baa2 | 30,817 |
| | | New Jersey Educational Facilities Authority, Revenue Bonds, Rider University, Series 2017F: | | | |
| 5 | | 3.750%, 7/01/37 | 7/27 at 100.00 | Baa2 | 4,681 |
| 100 | | 4.000%, 7/01/42 | 7/27 at 100.00 | Baa2 | 94,908 |
| 100 | | 5.000%, 7/01/47 | 7/27 at 100.00 | Baa2 | 106,328 |
| 75 | | New Jersey Educational Facilities Authority, Revenue Bonds, Seton Hall University, | 7/23 at 100.00 | A– | 82,925 |
| | | Series 2013D, 5.000%, 7/01/38 | | | |
37
| | | | | | |
NJV | | Nuveen New Jersey Municipal Value Fund | | |
| | | Portfolio of Investments (continued) | | | |
| |
| | | February 28, 2019 | | | |
| |
| |
| |
| |
Principal | | | Optional Call | | |
Amount (000) | | Description (1) | Provisions (2) | Ratings (3) | Value |
| | | Education and Civic Organizations (continued) | | | |
| | | New Jersey Educational Facilities Authority, Revenue Bonds, Seton Hall University, | | | |
| | | Series 2016C: | | | |
| $ 435 | | 3.000%, 7/01/41 | 7/26 at 100.00 | A– | $ 388,394 |
| 50 | | 3.000%, 7/01/46 | 7/26 at 100.00 | A– | 43,665 |
| 25 | | 4.000%, 7/01/46 | 7/26 at 100.00 | A– | 25,538 |
| | | New Jersey Educational Facilities Authority, Revenue Bonds, Stevens Institute of | | | |
| | | Technology, Series 2017A: | | | |
| 30 | | 5.000%, 7/01/47 | 7/27 at 100.00 | A– | 33,329 |
| 200 | | 4.000%, 7/01/47 | 7/27 at 100.00 | A– | 204,050 |
| 25 | | New Jersey Educational Facilities Authority, Revenue Bonds, The College of Saint | 7/26 at 100.00 | BB | 24,452 |
| | | Elizabeth, Series 2016D, 5.000%, 7/01/46 | | | |
| 265 | | New Jersey Higher Education Assistance Authority, Senior Student Loan Revenue Bonds, | 6/28 at 100.00 | Aaa | 272,653 |
| | | Refunding Series 2018A, 4.000%, 12/01/35 (AMT) | | | |
| 200 | | New Jersey Higher Education Assistance Authority, Student Loan Revenue Bonds, Senior | 12/26 at 100.00 | Aaa | 201,560 |
| | | Lien Series 2017-1A, 4.000%, 12/01/40 (AMT) | | | |
| 805 | | New Jersey Higher Education Assistance Authority, Student Loan Revenue Bonds, Series | 6/19 at 100.00 | AA | 812,454 |
| | | 2009A, 5.625%, 6/01/30 | | | |
| 30 | | New Jersey Higher Education Assistance Authority, Student Loan Revenue Bonds, Series | 12/20 at 100.00 | Aaa | 31,391 |
| | | 2010-2, 5.000%, 12/01/30 | | | |
| 100 | | New Jersey Higher Education Assistance Authority, Student Loan Revenue Bonds, Series | 12/22 at 100.00 | Aaa | 108,747 |
| | | 2012-1B, 5.750%, 12/01/39 (AMT) | | | |
| 195 | | New Jersey Higher Education Assistance Authority, Student Loan Revenue Bonds, Series | 12/24 at 100.00 | Aaa | 202,831 |
| | | 2015-1A, 4.000%, 12/01/30 (AMT) | | | |
| 59 | | New Jersey Higher Education Assistance Authority, Student Loan Revenue Bonds, Tender | 12/22 at 100.00 | AA | 67,527 |
| | | Option Bond Trust 2015-XF0151, 8.622%, 12/01/23 (AMT), 144A (IF) (4) | | | |
| 200 | | New Jersey Institute of Technology, New Jersey, General Obligation Bonds, Series 2015A, | 7/25 at 100.00 | A1 | 226,358 |
| | | 5.000%, 7/01/45 | | | |
| 60 | | Rutgers State University, New Jersey, Revenue Bonds, Tender Option Bond Trust 2016-XF2356, | 5/23 at 100.00 | Aa3 | 86,164 |
| | | 14.818%, 5/01/43, 144A (IF) (4) | | | |
| 4,099 | | Total Education and Civic Organizations | | | 4,195,198 |
| | | Health Care – 13.9% (13.4% of Total Investments) | | | |
| | | Camden County Improvement Authority, New Jersey, Health Care Redevelopment Revenue | | | |
| | | Bonds, Cooper Health System Obligated Group Issue, Refunding Series 2014A: | | | |
| 105 | | 5.000%, 2/15/25 | 2/24 at 100.00 | BBB+ | 118,049 |
| 100 | | 5.000%, 2/15/34 | 2/24 at 100.00 | BBB+ | 107,566 |
| 105 | | Camden County Improvement Authority, New Jersey, Health Care Redevelopment Revenue | 2/23 at 100.00 | BBB+ | 113,321 |
| | | Bonds, Cooper Health System Obligated Group Issue, Series 2013A, 5.750%, 2/15/42 | | | |
| 200 | | New Jersey Health Care Facilities Financing Authority, New Jersey, Revenue Bonds, Saint | 7/21 at 100.00 | BB+ | 212,514 |
| | | Peters University Hospital, Refunding Series 2011, 6.250%, 7/01/35 | | | |
| 70 | | New Jersey Health Care Facilities Financing Authority, Revenue Bonds, AHS Hospital | 1/27 at 100.00 | AA– | 71,271 |
| | | Corporation, Refunding Series 2016, 4.000%, 7/01/41 | | | |
| 215 | | New Jersey Health Care Facilities Financing Authority, Revenue Bonds, Barnabas Health, | 7/24 at 100.00 | AA– | 233,131 |
| | | Refunding Series 2014A, 5.000%, 7/01/44 | | | |
| | | New Jersey Health Care Facilities Financing Authority, Revenue Bonds, Hackensack | | | |
| | | Meridian Health Obligated Group, Refunding Series 2017A: | | | |
| 125 | | 5.000%, 7/01/28 | 7/27 at 100.00 | AA– | 150,468 |
| 150 | | 5.000%, 7/01/57 | 7/27 at 100.00 | AA– | 166,257 |
| 110 | | New Jersey Health Care Facilities Financing Authority, Revenue Bonds, Hunterdon Medical | 7/24 at 100.00 | A+ | 110,850 |
| | | Center, Refunding Series 2014A, 4.000%, 7/01/45 | | | |
| 360 | | New Jersey Health Care Facilities Financing Authority, Revenue Bonds, Inspira Health | 7/27 at 100.00 | A2 | 400,910 |
| | | Obligated Group Issue, Series 2017A, 5.000%, 7/01/42 (UB) (4) | | | |
| 20 | | New Jersey Health Care Facilities Financing Authority, Revenue Bonds, Meridian Health | No Opt. Call | AA– | 21,466 |
| | | System Obligated Group, Refunding Series 2011, 5.000%, 7/01/21 | | | |
38
| | | | | | |
Principal | | | Optional Call | | |
Amount (000) | | Description (1) | Provisions (2) | Ratings (3) | Value |
| | | Health Care (continued) | | | |
| | | New Jersey Health Care Facilities Financing Authority, Revenue Bonds, Princeton | | | |
| | | HealthCare System, Series 2016A: | | | |
| $ 25 | | 5.000%, 7/01/32 | 7/26 at 100.00 | AA | $ 28,889 |
| 40 | | 5.000%, 7/01/33 | 7/26 at 100.00 | AA | 46,048 |
| 30 | | 5.000%, 7/01/34 | 7/26 at 100.00 | AA | 34,410 |
| 130 | | New Jersey Health Care Facilities Financing Authority, Revenue Bonds, Robert Wood | 7/24 at 100.00 | AA– | 143,251 |
| | | Johnson University Hospital Issue, Series 2014A, 5.000%, 7/01/39 | | | |
| 110 | | New Jersey Health Care Facilities Financing Authority, Revenue Bonds, Robert Wood | 7/23 at 100.00 | AA– | 122,137 |
| | | Johnson University Hospital, Series 2013A, 5.500%, 7/01/43 | | | |
| 100 | | New Jersey Health Care Facilities Financing Authority, Revenue Bonds, RWJ Barnabas | 7/26 at 100.00 | AA– | 112,194 |
| | | Health Obligated Group, Refunding Series 2016A, 5.000%, 7/01/43 | | | |
| | | New Jersey Health Care Facilities Financing Authority, Revenue Bonds, Saint Joseph’s | | | |
| | | Healthcare System Obligated Group Issue, Refunding Series 2016: | | | |
| 10 | | 3.000%, 7/01/32 | 7/26 at 100.00 | BBB– | 8,932 |
| 405 | | 4.000%, 7/01/48 | 7/26 at 100.00 | BBB– | 389,659 |
| 100 | | New Jersey Health Care Facilities Financing Authority, Revenue Bonds, Saint Luke’s | 8/23 at 100.00 | A– | 101,670 |
| | | Warren Hospital Obligated Group, Series 2013, 4.000%, 8/15/37 | | | |
| | | New Jersey Health Care Facilities Financing Authority, Revenue Bonds, University | | | |
| | | Hospital Issue, Refunding Series 2015A: | | | |
| 130 | | 4.125%, 7/01/38 – AGM Insured | 7/25 at 100.00 | AA | 132,404 |
| 110 | | 5.000%, 7/01/46 – AGM Insured | 7/25 at 100.00 | AA | 118,754 |
| 200 | | New Jersey Health Care Facilities Financing Authority, Revenue Bonds, Virtua Health, | 7/19 at 100.00 | AA | 202,280 |
| | | Series 2009A, 5.500%, 7/01/38 – AGC Insured | | | |
| 2,950 | | Total Health Care | | | 3,146,431 |
| | | Housing/Multifamily – 9.5% (9.2% of Total Investments) | | | |
| 55 | | New Jersey Economic Development Authority, Revenue Bonds, Provident Group – Kean | 1/27 at 100.00 | BBB– | 58,282 |
| | | Properties LLC – Kean University Student Housing Project, Series 2017A, 5.000%, 7/01/47 | | | |
| 100 | | New Jersey Economic Development Authority, Revenue Bonds, Provident Group – Rowan | 1/25 at 100.00 | BBB– | 104,405 |
| | | Properties LLC – Rowan University Student Housing Project, Series 2015A, 5.000%, 1/01/48 | | | |
| 155 | | New Jersey Economic Development Authority, Revenue Bonds, West Campus Housing LLC – New | 7/25 at 100.00 | BBB– | 158,189 |
| | | Jersey City University Student Housing Project, Series 2015, 5.000%, 7/01/47 | | | |
| 1,000 | | New Jersey Housing and Mortgage Finance Agency, Multifamily Revenue Bonds, Series 2009A, | 11/19 at 100.00 | AA– | 1,010,260 |
| | | 4.950%, 5/01/41 | | | |
| 120 | | New Jersey Housing and Mortgage Finance Agency, Multifamily Revenue Bonds, Series 2015A, | 11/24 at 100.00 | AA– | 121,009 |
| | | 4.000%, 11/01/45 | | | |
| 270 | | New Jersey Housing and Mortgage Finance Agency, Multifamily Revenue Bonds, Series 2016B, | 11/25 at 100.00 | AA– | 264,057 |
| | | 3.600%, 11/01/40 | | | |
| 435 | | New Jersey Housing and Mortgage Finance Agency, Multifamily Revenue Bonds, Series 2018A, | 11/27 at 100.00 | AA– | 441,603 |
| | | 3.875%, 11/01/38 | | | |
| 2,135 | | Total Housing/Multifamily | | | 2,157,805 |
| | | Housing/Single Family – 4.9% (4.7% of Total Investments) | | | |
| | | New Jersey Housing and Mortgage Finance Agency, Single Family Housing Revenue Bonds, | | | |
| | | Series 2018A: | | | |
| 165 | | 3.600%, 4/01/33 | 10/27 at 100.00 | AA | 167,505 |
| 90 | | 3.750%, 10/01/35 | 10/27 at 100.00 | AA | 91,059 |
| 90 | | New Jersey Housing and Mortgage Finance Agency, Single Family Housing Revenue Bonds, | 10/27 at 100.00 | AA | 91,356 |
| | | Series 2018B, 3.800%, 10/01/32 (AMT) | | | |
| 750 | | New Jersey Housing and Mortgage Finance Agency, Single Family Housing Revenue Bonds, | 4/28 at 100.00 | AA | 754,808 |
| | | Series 2019C, 3.950%, 10/01/44 (UB) (WI/DD, settling 3/21/19) | | | |
| 1,095 | | Total Housing/Single Family | | | 1,104,728 |
39
| | | | | | |
NJV | | Nuveen New Jersey Municipal Value Fund | | |
| | | Portfolio of Investments (continued) | | | |
| | | February 28, 2019 | | | |
| |
| |
| |
Principal | | | Optional Call | | |
Amount (000) | | Description (1) | Provisions (2) | Ratings (3) | Value |
| | | Long-Term Care – 2.3% (2.2% of Total Investments) | | | |
| $ 285 | | Burlington County Bridge Commission, New Jersey, Economic Development Revenue Bonds, The | 3/19 at 100.00 | N/R | $ 273,323 |
| | | Evergreens Project, Series 2007, 5.625%, 1/01/38 | | | |
| 15 | | New Jersey Economic Development Authority, Fixed Rate Revenue Bonds, Lions Gate Project, | 1/24 at 100.00 | N/R | 15,056 |
| | | Series 2014, 5.250%, 1/01/44 | | | |
| 140 | | New Jersey Economic Development Authority, Revenue Bonds, United Methodist Homes of New | 7/23 at 100.00 | BBB– | 144,101 |
| | | Jersey Obligated Group Issue, Refunding Series 2013, 5.000%, 7/01/34 | | | |
| 40 | | New Jersey Economic Development Authority, Revenue Bonds, United Methodist Homes of New | 7/24 at 100.00 | BBB– | 42,017 |
| | | Jersey Obligated Group Issue, Refunding Series 2014A, 5.000%, 7/01/29 | | | |
| 50 | | New Jersey Health Care Facilities Financing Authority, Revenue Bonds, Village Drive | 10/26 at 102.00 | N/R | 49,304 |
| | | Healthcare Urban Renewal LLC, Series 2018, 5.750%, 10/01/38, 144A | | | |
| 530 | | Total Long-Term Care | | | 523,801 |
| | | Tax Obligation/General – 7.7% (7.4% of Total Investments) | | | |
| 80 | | Cumberland County Improvement Authority, New Jersey, Guaranteed Lease Revenue Bonds, | 10/28 at 100.00 | AA | 81,929 |
| | | County Correctional Facility Project, Series 2018, 4.000%, 10/01/43 – BAM Insured | | | |
| | | Harrison, New Jersey, General Obligation Bonds, Parking Utility Series 2018: | | | |
| 35 | | 3.125%, 3/01/31 – BAM Insured | 3/28 at 100.00 | AA | 35,231 |
| 30 | | 3.250%, 3/01/32 – BAM Insured | 3/28 at 100.00 | AA | 30,259 |
| 50 | | 3.500%, 3/01/36 – BAM Insured | 3/28 at 100.00 | AA | 50,371 |
| 100 | | Jersey City, New Jersey, General Obligation Bonds, Refunding General Improvement Series | 11/27 at 100.00 | AA– | 119,174 |
| | | 2017A, 5.000%, 11/01/29 | | | |
| 125 | | Middlesex County, New Jersey, General Obligation Bonds, Refunding Redevelopment Series | No Opt. Call | AAA | 152,274 |
| | | 2017, 5.000%, 1/15/27 | | | |
| 110 | | Monroe Township Board of Education, Middlesex County, New Jersey, General Obligation | 3/25 at 100.00 | AA– | 124,245 |
| | | Bonds, Refunding Series 2015, 5.000%, 3/01/38 | | | |
| 20 | | Montclair Township, Essex County, New Jersey, General Obligation Bonds, Refunding | 1/24 at 100.00 | AAA | 22,676 |
| | | Parking Utility Series 2014A, 5.000%, 1/01/37 | | | |
| 100 | | Montclair Township, Essex County, New Jersey, General Obligation Bonds, Refunding School | No Opt. Call | AAA | 112,453 |
| | | Series 2017B, 4.000%, 3/01/25 | | | |
| | | New Brunswick Parking Authority, Middlesex County, New Jersey, Guaranteed Parking | | | |
| | | Revenue Bonds, Refunding Series 2016A: | | | |
| 300 | | 5.000%, 9/01/32 – BAM Insured | 9/26 at 100.00 | AA | 346,317 |
| 130 | | 5.000%, 9/01/39 – BAM Insured | 9/26 at 100.00 | AA | 146,438 |
| 195 | | New Brunswick Parking Authority, Middlesex County, New Jersey, Guaranteed Parking | 9/26 at 100.00 | AA | 178,643 |
| | | Revenue Bonds, Refunding Series 2016B, 3.000%, 9/01/39 – AGM Insured | | | |
| 150 | | Union County Utilities Authority, New Jersey, Resource Recovery Facility Lease Revenue | 12/21 at 100.00 | AA+ | 162,726 |
| | | Bonds, Covantan Union Inc. Lessee, Refunding Series 2011B, 5.250%, 12/01/31 (AMT) | | | |
| 170 | | Union County Utilities Authority, New Jersey, Solid Waste System County Deficiency | 6/21 at 100.00 | Aaa | 181,126 |
| | | Revenue Bonds, Series 2011A, 5.000%, 6/15/41 | | | |
| 1,595 | | Total Tax Obligation/General | | | 1,743,862 |
| | | Tax Obligation/Limited – 15.6% (15.1% of Total Investments) | | | |
| 245 | | Garden State Preservation Trust, New Jersey, Open Space and Farmland Preservation Bonds, | No Opt. Call | AA | 297,793 |
| | | Series 2005A, 5.750%, 11/01/28 – AGM Insured | | | |
| 150 | | Hudson County Improvement Authority, New Jersey, County Secured Lease Revenue Bonds, | 5/26 at 100.00 | AA | 169,128 |
| | | Hudson County Vocational Technical Schools Project, Series 2016, 5.250%, 5/01/51 | | | |
| | | New Jersey Economic Development Authority, Cigarette Tax Revenue Refunding Bonds, | | | |
| | | Series 2012: | | | |
| 250 | | 5.000%, 6/15/25 | 6/22 at 100.00 | BBB+ | 268,618 |
| 400 | | 5.000%, 6/15/28 | 6/22 at 100.00 | BBB+ | 425,928 |
40
| | | | | | |
Principal | | | Optional Call | | |
Amount (000) | | Description (1) | Provisions (2) | Ratings (3) | Value |
| | | Tax Obligation/Limited (continued) | | | |
| $ 85 | | New Jersey Economic Development Authority, Lease Revenue Bonds, State House Project, | 12/28 at 100.00 | A– | $ 85,751 |
| | | Series 2017B, 4.500%, 6/15/40 | | | |
| 115 | | New Jersey Economic Development Authority, Revenue Bonds, Motor Vehicle Surcharge, | 7/27 at 100.00 | BBB+ | 114,213 |
| | | Refunding Series 2017A, 3.375%, 7/01/30 | | | |
| 2,170 | | New Jersey Transportation Trust Fund Authority, Transportation System Bonds, Series | No Opt. Call | A– | 824,969 |
| | | 2009A, 0.000%, 12/15/39 | | | |
| | | New Jersey Transportation Trust Fund Authority, Transportation System Bonds, | | | |
| | | Series 2011A: | | | |
| 40 | | 6.000%, 6/15/35 | 6/21 at 100.00 | A– | 42,741 |
| 175 | | 5.500%, 6/15/41 | 6/21 at 100.00 | A– | 181,941 |
| | | New Jersey Transportation Trust Fund Authority, Transportation System Bonds, | | | |
| | | Series 2011B: | | | |
| 270 | | 5.250%, 6/15/36 | 6/21 at 100.00 | A– | 280,603 |
| 20 | | 5.000%, 6/15/37 | 6/21 at 100.00 | A– | 20,650 |
| 425 | | 5.000%, 6/15/42 | 6/21 at 100.00 | A– | 436,972 |
| 25 | | New Jersey Transportation Trust Fund Authority, Transportation System Bonds, Series | 12/28 at 100.00 | A– | 24,721 |
| | | 2018A, 4.250%, 12/15/38 | | | |
| 95 | | New Jersey Transportation Trust Fund Authority, Transportation System Bonds, Series | 12/28 at 100.00 | A– | 94,088 |
| | | 2019AA, 4.500%, 6/15/49 | | | |
| 110 | | Union County Improvement Authority, New Jersey, General Obligation Lease Bonds, Juvenile | No Opt. Call | Aaa | 259,272 |
| | | Detention Center Facility Project, Tender Option Bond Trust 2015-XF1019, 19.901%, | | | |
| | | 5/01/30, 144A (IF) (4) | | | |
| 4,575 | | Total Tax Obligation/Limited | | | 3,527,388 |
| | | Transportation – 13.4% (13.0% of Total Investments) | | | |
| 250 | | Casino Reinvestment Development Authority, New Jersey, Parking Revenue Bonds, Series | 3/19 at 100.00 | Baa2 | 250,745 |
| | | 2005A, 5.250%, 6/01/20 – NPFG Insured | | | |
| | | Delaware River and Bay Authority, Delaware and New Jersey, Revenue Bonds, Series 2014A: | | | |
| 150 | | 4.125%, 1/01/39 | 1/24 at 100.00 | A1 | 153,948 |
| 200 | | 5.000%, 1/01/44 | 1/24 at 100.00 | A1 | 222,096 |
| 540 | | Delaware River Joint Toll Bridge Commission, New Jersey and Pennsylvania, Bridge System | 7/27 at 100.00 | A1 | 609,493 |
| | | Revenue Bonds, Series 2017, 5.000%, 7/01/47 | | | |
| 175 | | Delaware River Port Authority, New Jersey and Pennsylvania, Revenue Bonds, Series 2018A, | 1/29 at 100.00 | A+ | 205,126 |
| | | 5.000%, 1/01/37 | | | |
| 295 | | Delaware River Port Authority, Pennsylvania and New Jersey, Revenue Refunding Bonds, | 1/23 at 100.00 | A | 322,591 |
| | | Port District Project, Series 2012, 5.000%, 1/01/27 | | | |
| 190 | | New Jersey Economic Development Authority, Private Activity Bonds, The Goethals Bridge | 1/24 at 100.00 | BBB | 208,479 |
| | | Replacement Project, Series 2013, 5.625%, 1/01/52 (AMT) | | | |
| 80 | | New Jersey Economic Development Authority, Special Facilities Revenue Bonds, Continental | 3/24 at 101.00 | BB | 90,364 |
| | | Airlines Inc., Series 2000A & 2000B, 5.625%, 11/15/30 (AMT) | | | |
| 320 | | New Jersey Economic Development Authority, Special Facility Revenue Bonds, Port Newark | 10/27 at 100.00 | Ba1 | 338,087 |
| | | Container Terminal LLC Project, Refunding Series 2017, 5.000%, 10/01/47 (AMT) | | | |
| 255 | | New Jersey Turnpike Authority, Revenue Bonds, Refunding Series 2015E, 5.000%, 1/01/45 | 1/25 at 100.00 | A+ | 281,097 |
| 315 | | Port Authority of New York and New Jersey, Consolidated Revenue Bonds, One Hundred | 12/23 at 100.00 | AA– | 352,743 |
| | | Seventy Ninth Series 2013, 5.000%, 12/01/43 | | | |
| 2,770 | | Total Transportation | | | 3,034,769 |
41
| | | | | | |
NJV | | Nuveen New Jersey Municipal Value Fund | | |
| | | Portfolio of Investments (continued) | | | |
| | | February 28, 2019 | | | |
| |
| |
| |
Principal | | | Optional Call | | |
Amount (000) | | Description (1) | Provisions (2) | Ratings (3) | Value |
| | | U.S. Guaranteed – 9.9% (9.6% of Total Investments) (5) | | | |
| $ 480 | | Guam Government, Limited Obligation Section 30 Revenue Bonds, Series 2009A, 5.750%, | 12/19 at 100.00 | N/R | $ 494,976 |
| | | 12/01/34 (Pre-refunded 12/01/19) | | | |
| | | New Jersey Economic Development Authority, Student Housing Revenue Bonds, Provident | | | |
| | | Group-Montclair Properties LLC, Montclair State University Student Housing Project, Series 2010A: | | | |
| 100 | | 5.750%, 6/01/31 (Pre-refunded 6/01/20) | 6/20 at 100.00 | N/R | 105,117 |
| 50 | | 5.875%, 6/01/42 (Pre-refunded 6/01/20) | 6/20 at 100.00 | N/R | 52,635 |
| | | New Jersey Health Care Facilities Financing Authority, Revenue Bonds, Palisades Medical | | | |
| | | Center Obligated Group Issue, Refunding Series 2013: | | | |
| 20 | | 5.250%, 7/01/31 (Pre-refunded 7/01/23) | 7/23 at 100.00 | N/R | 22,840 |
| 85 | | 5.250%, 7/01/31 (Pre-refunded 7/01/23) | 7/23 at 100.00 | N/R | 97,261 |
| 70 | | New Jersey Health Care Facilities Financing Authority, Revenue Bonds, Saint Barnabas | 7/21 at 100.00 | N/R | 76,252 |
| | | Health Care System, Refunding Series 2011A, 5.625%, 7/01/37 (Pre-refunded 7/01/21) | | | |
| 1,375 | | New Jersey Health Care Facilities Financing Authority, State Contract Bonds, Hospital | 10/19 at 100.00 | A– | 1,406,873 |
| | | Asset Transformation Program, Series 2009A, 5.750%, 10/01/31 (Pre-refunded 10/01/19) | | | |
| 2,180 | | Total U.S. Guaranteed | | | 2,255,954 |
| | | Utilities – 3.8% (3.7% of Total Investments) | | | |
| 470 | | Essex County Improvement Authority, New Jersey, Solid Waste Disposal Revenue Bonds, | 7/20 at 100.00 | BB– | 472,054 |
| | | Covanta Project, Series 2015, 5.250%, 7/01/45 (AMT), 144A | | | |
| 300 | | Industrial Pollution Control Financing Authority of Cape May County (New Jersey), | No Opt. Call | A | 324,546 |
| | | Pollution Control Revenue Refunding Bonds, 1991 Series A (Atlantic City Electric Company | | | |
| | | Project), 6.800%, 3/01/21 – NPFG Insured | | | |
| 65 | | Salem County Pollution Control Financing Authority, New Jersey, Pollution Control | No Opt. Call | BBB– | 68,872 |
| | | Revenue Bonds, Chambers Project, Refunding Series 2014A, 5.000%, 12/01/23 (AMT) | | | |
| 835 | | Total Utilities | | | 865,472 |
| $ 23,504 | | Total Long-Term Investments (cost $22,572,926) | | | 23,296,549 |
| |
Principal | | | Optional Call | | |
Amount (000) | | Description (1) | Provisions (2) | Ratings (3) | Value |
| | | SHORT-TERM INVESTMENTS – 0.7% (0.6% of Total Investments) | | | |
| | | MUNICIPAL BONDS – 0.7% (0.6% of Total Investments) | | | |
| | | Housing/Single Family – 0.7% (0.6% of Total Investments) | | | |
| $ 150 | | New Jersey Housing and Mortgage Finance Agency, Single Family Housing Revenue Bonds, | 3/19 at 100.00 | A-1 | $ 150,000 |
| | | Variable Rate Demand Obligations, Series 2005O, 1.600%, 10/01/26 (AMT) (6) | | | |
| $ 150 | | Total Short-Term Investments (cost $150,000) | | | 150,000 |
| | | Total Investments (cost $22,722,926) – 103.4% | | | 23,446,549 |
| | | Floating Rate Obligations – (3.7)% | | | (830,000) |
| | | Other Assets Less Liabilities – 0.3% (7) | | | 59,254 |
| | | Net Asset Applicable to Common Shares – 100% | | | $ 22,675,803 |
42
| | | | | | | | |
Investments in Derivatives | | |
Futures Contracts | | |
Description | Contract Position | Number of Contracts | Expiration Date | Notional Amount | Value | Unrealized Appreciation (Depreciation) | Variation Margin Receivable/ (Payable) |
| U.S. Treasury 5-Year Note | Short | (18) | 6/19 | $(2,066,480) | $(2,062,125) | $4,355 | $2,109 |
| | |
| (1) | All percentages shown in the Portfolio of Investments are based on net assets applicable to common shares unless otherwise noted. |
| (2) | Optional Call Provisions: Dates (month and year) and prices of the earliest optional call or redemption. There may be other call provisions at varying prices at later dates. Certain mortgage-backed securities may be subject to periodic principal paydowns. Optional Call Provisions are not covered by the report of independent registered public accounting firm. |
| (3) | For financial reporting purposes, the ratings disclosed are the highest of Standard & Poor’s Group (“Standard & Poor’s”), Moody’s Investors Service, Inc. (“Moody’s”) or Fitch, Inc. (“Fitch”) rating. This treatment of split-rated securities may differ from that used for other purposes, such as for Fund investment policies. Ratings below BBB by Standard & Poor’s, Baa by Moody’s or BBB by Fitch are considered to be below investment grade. Holdings designated N/R are not rated by any of these national rating agencies. Ratings are not covered by the report of independent registered public accounting firm. |
| (4) | Investment, or portion of investment, has been pledged to collateralize the net payment obligations for investments in inverse floating rate transactions. |
| (5) | Backed by an escrow or trust containing sufficient U.S. Government or U.S. Government agency securities, which ensure the timely payment of principal and interest. |
| (6) | Investment has maturity of greater than one year, but has variable rate and/or demand features which qualify it as a short-term investment. The rate disclosed, as well as the reference rate and spread, where applicable, is that in effect as of the end of the reporting period. This rate changes periodically based on market conditions or a specified market index. |
| (7) | Other assets less liabilities includes the unrealized appreciation (depreciation) of certain over-the-counter (”OTC”) derivatives as presented on the Statement of Assets and Liabilities, when applicable. The unrealized appreciation (depreciation) of OTC cleared and exchange-traded derivatives is recognized as part of cash collateral at brokers and/or the receivable or payable for variation margin as presented on the Statement of Assets and Liabilities, when applicable. |
| 144A | Investment is exempt from registration under Rule 144A of the Securities Act of 1933, as amended. These investments may only be resold in transactions exempt from registration, which are normally those transactions with qualified institutional buyers. |
| AMT | Alternative Minimum Tax |
| IF | Inverse floating rate security issued by a tender option bond (“TOB”) trust, the interest rate on which varies inversely with the Securities Industry Financial Markets Association (SIFMA) short-term rate, which resets weekly, or a similar short-term rate, and is reduced by the expenses related to the TOB trust. |
| UB | Underlying bond of an inverse floating rate trust reflected as a financing transaction. See Notes to Financial Statements, Note 3 – Portfolio Securities and Investments in Derivatives. Inverse Floating Rate Securities for more information. |
| WI/DD | Investment, or portion of investment, purchased on a when-issued or delayed delivery basis. |
| | See accompanying notes to financial statements. |
43
| | |
| NQP | Nuveen Pennsylvania Quality Municipal Income Fund Portfolio of Investments
February 28, 2019 |
| | | | | | |
Principal | | | Optional Call | | |
Amount (000) | | Description (1) | Provisions (2) | Ratings (3) | Value |
| | | LONG-TERM INVESTMENTS – 160.9% (100.0% of Total Investments) | | | |
| | | MUNICIPAL BONDS – 160.9% (100.0% of Total Investments) | | | |
| | | Consumer Staples – 0.4% (0.3% of Total Investments) | | | |
| $ 2,000 | | Pennsylvania Economic Development Financing Authority, Solid Waste Disposal Revenue | No Opt. Call | AA– | $ 2,445,880 |
| | | Bonds, Procter & Gamble Paper Project, Series 2001, 5.375%, 3/01/31 (AMT) | | | |
| | | Education and Civic Organizations – 18.4% (11.5% of Total Investments) | | | |
| 1,255 | | Allegheny County Higher Education Building Authority, Pennsylvania, College Revenue | No Opt. Call | Baa3 | 1,403,906 |
| | | Refunding Bonds, Robert Morris College, Series 1998A, 6.000%, 5/01/28 | | | |
| 940 | | Allegheny County Higher Education Building Authority, Pennsylvania, Revenue Bonds, | 3/23 at 100.00 | A | 940,329 |
| | | Duquesne University, Series 2013A, 3.500%, 3/01/34 | | | |
| | | Allegheny County Higher Education Building Authority, Pennsylvania, Revenue Bonds, | | | |
| | | Robert Morris University, Series 2016: | | | |
| 735 | | 3.000%, 10/15/30 | 10/26 at 100.00 | Baa3 | 654,569 |
| 1,000 | | 5.000%, 10/15/38 | 10/26 at 100.00 | Baa3 | 1,055,630 |
| 1,625 | | Allegheny County Higher Education Building Authority, Pennsylvania, Revenue Bonds, | 10/27 at 100.00 | Baa3 | 1,703,699 |
| | | Robert Morris University, Series 2017, 5.000%, 10/15/47 | | | |
| 3,215 | | Bucks County Industrial Development Authority, Pennsylvania, Revenue Bonds, School Lane | 3/27 at 100.00 | BBB– | 3,411,404 |
| | | Charter School Project, Series 2016, 5.125%, 3/15/36 | | | |
| 835 | | Chester County Industrial Development Authority, Pennsylvania, Avon Grove Charter School | 12/27 at 100.00 | BBB– | 857,628 |
| | | Revenue Bonds, Series 2017A, 5.000%, 12/15/47 | | | |
| 2,200 | | Crawford County Industrial Development Authority, Pennsylvania, College Revenue Bonds, | 5/26 at 100.00 | A– | 2,030,886 |
| | | Allegheny College, Series 2016, 3.000%, 5/01/34 | | | |
| 1,000 | | Cumberland County Municipal Authority, Pennsylvania, Revenue Bonds, Dickinson College | 11/27 at 100.00 | A+ | 1,124,420 |
| | | Project, Second Series 2017A, 5.000%, 11/01/39 | | | |
| 1,470 | | Dallas Area Municipal Authority, Pennsylvania, 5.000%, 5/01/48 | 5/29 at 100.00 | Baa3 | 1,524,449 |
| 1,020 | | Dallas Area Municipal Authority, Pennsylvania, Revenue Bonds, Misericordia University, | 5/24 at 100.00 | Baa3 | 1,053,140 |
| | | Series 2014, 5.000%, 5/01/37 | | | |
| 750 | | Delaware County Authority, Pennsylvania, General Revenue Bonds, Eastern University, | 3/19 at 100.00 | AA | 750,630 |
| | | Series 2006, 4.500%, 10/01/27 – RAAI Insured | | | |
| 4,595 | | Erie Higher Education Building Authority, Pennsylvania, Revenue Bonds, Gannon | 11/26 at 100.00 | BBB+ | 4,312,316 |
| | | University, Series 2016, 4.000%, 5/01/46 | | | |
| 2,395 | | General Authority of Southcentral Pennsylvania, Revenue Bonds, AICUP Financing | 10/27 at 100.00 | A– | 2,315,654 |
| | | Program-York College of Pennsylvania, Series 2017 PP4, 3.375%, 11/01/37 | | | |
| | | Huntingdon County General Authority, Pennsylvania, Revenue Bonds, Juniata College, | | | |
| | | Series 2016OO2: | | | |
| 590 | | 3.250%, 5/01/36 | 5/26 at 100.00 | BBB+ | 519,666 |
| 1,555 | | 3.500%, 5/01/41 | 5/26 at 100.00 | BBB+ | 1,345,246 |
| 815 | | Indiana County Industrial Development Authority, Pennsylvania, Revenue Bonds, Student | No Opt. Call | N/R | 805,334 |
| | | Cooperative Association Inc./Indiana University of Pennsylvania – Student Union Project, | | | |
| | | Series 1999B, 0.000%, 11/01/19 – AMBAC Insured | | | |
| | | Lackawanna County Industrial Development Authority, Pennsylvania, Revenue Bonds, | | | |
| | | University of Scranton, Series 2017: | | | |
| 475 | | 3.375%, 11/01/33 | 11/27 at 100.00 | A– | 467,148 |
| 2,910 | | 4.000%, 11/01/40 | 11/27 at 100.00 | A– | 2,914,307 |
| 5,235 | | Lycoming County Authority, Pennsylvania, Revenue Bonds, Pennsylvania College of | 5/22 at 100.00 | A | 5,542,242 |
| | | Technology, Series 2012, 5.000%, 5/01/32 | | | |
| 1,855 | | Montgomery County Higher Education and Health Authority, Pennsylvania, Revenue Bonds, | 9/28 at 100.00 | A+ | 2,051,519 |
| | | Thomas Jefferson University, Series 2018A, 5.000%, 9/01/48 | | | |
44
| | | | | | |
Principal | | | Optional Call | | |
Amount (000) | | Description (1) | Provisions (2) | Ratings (3) | Value |
| | | Education and Civic Organizations (continued) | | | |
| $ 2,155 | | Montgomery County Higher Education and Health Authority, Pennsylvania, Revenue Bonds, | 4/20 at 100.00 | BBB | $ 2,204,199 |
| | | Arcadia University, Series 2010, 5.625%, 4/01/40 | | | |
| 1,465 | | Pennsylvania Higher Educational Facilities Authority, Revenue Bonds, Holy Family | 9/23 at 100.00 | BBB– | 1,576,179 |
| | | University, Series 2013A, 6.500%, 9/01/38 | | | |
| 1,625 | | Pennsylvania Higher Educational Facilities Authority, General Revenue Bonds, State | 3/19 at 100.00 | Aa3 | 1,629,030 |
| | | System of Higher Education, Series 2008AH, 5.000%, 6/15/33 | | | |
| 2,415 | | Pennsylvania Higher Educational Facilities Authority, Revenue Bonds, AICUP Financing | 11/21 at 100.00 | A– | 2,572,506 |
| | | Program-Mount Aloysius College Project, Series 2011R-1, 5.000%, 11/01/35 | | | |
| | | Pennsylvania Higher Educational Facilities Authority, Revenue Bonds, Bryn Mawr College, | | | |
| | | Refunding Series 2014: | | | |
| 2,545 | | 5.000%, 12/01/38 | 12/24 at 100.00 | AA | 2,927,081 |
| 2,080 | | 5.000%, 12/01/44 | 12/24 at 100.00 | AA | 2,385,011 |
| 85 | | Pennsylvania Higher Educational Facilities Authority, Revenue Bonds, Drexel University, | 5/21 at 100.00 | A | 90,182 |
| | | Series 2011A, 5.250%, 5/01/41 | | | |
| 1,000 | | Pennsylvania Higher Educational Facilities Authority, Revenue Bonds, Gwynedd Mercy | 5/22 at 100.00 | BBB | 1,033,330 |
| | | College, Series 2012-KK1, 5.375%, 5/01/42 | | | |
| 320 | | Pennsylvania Higher Educational Facilities Authority, Revenue Bonds, LaSalle University, | 11/22 at 100.00 | BBB | 315,184 |
| | | Series 2012, 4.000%, 5/01/32 | | | |
| 2,000 | | Pennsylvania Higher Educational Facilities Authority, Revenue Bonds, Temple University, | 4/22 at 100.00 | Aa3 | 2,140,660 |
| | | First Series of 2012, 5.000%, 4/01/42 | | | |
| 7,125 | | Pennsylvania Higher Educational Facilities Authority, Revenue Bonds, Thomas Jefferson | 3/25 at 100.00 | A+ | 8,011,350 |
| | | University, Refunding Series 2015A, 5.250%, 9/01/50 (UB) (4) | | | |
| 760 | | Pennsylvania Higher Educational Facilities Authority, Revenue Bonds, Thomas Jefferson | 9/22 at 100.00 | A+ | 820,709 |
| | | University, Series 2012, 5.000%, 3/01/42 | | | |
| | | Pennsylvania Higher Educational Facilities Authority, Revenue Bonds, University of the | | | |
| | | Sciences in Philadelphia, Series 2012: | | | |
| 1,030 | | 4.000%, 11/01/39 | 11/22 at 100.00 | Baa1 | 1,040,681 |
| 4,300 | | 5.000%, 11/01/42 | 11/22 at 100.00 | Baa1 | 4,655,352 |
| 1,310 | | Pennsylvania Higher Educational Facilities Authority, Revenue Bonds, University of the | 11/25 at 100.00 | Baa1 | 1,450,628 |
| | | Sciences in Philadelphia, Series 2015A, 5.000%, 11/01/36 | | | |
| 1,590 | | Pennsylvania Higher Educational Facilities Authority, Revenue Bonds, Widener University, | 7/23 at 100.00 | A– | 1,696,721 |
| | | Series 2013A, 5.500%, 7/15/38 | | | |
| 3,005 | | Pennsylvania State University, Revenue Bonds, Series 2010, 5.000%, 3/01/35 | 3/20 at 100.00 | Aa1 | 3,094,278 |
| 1,255 | | Philadelphia Authority for Industrial Development, Pennsylvania, Revenue Bonds, La Salle | 11/27 at 100.00 | BBB | 1,150,860 |
| | | University, Series 2017, 3.625%, 5/01/35 | | | |
| 554 | | Philadelphia Authority for Industrial Development, Pennsylvania, Revenue Bonds, | 3/19 at 100.00 | N/R | 5,540 |
| | | Leadership Learning Partners, Series 2005A, 5.375%, 7/01/36 (5) | | | |
| 4,500 | | Philadelphia Authority for Industrial Development, Pennsylvania, Revenue Bonds, | 6/20 at 100.00 | BB | 4,635,000 |
| | | Philadelphia Performing Arts Charter School, Series 2013, 6.750%, 6/15/43, 144A | | | |
| 500 | | Philadelphia Authority for Industrial Development, Pennsylvania, Revenue Bonds, Richard | 3/19 at 100.00 | N/R | 426,960 |
| | | Allen Preparatory Charter School, Series 2006, 6.250%, 5/01/33 | | | |
| 2,420 | | Philadelphia Authority for Industrial Development, Pennsylvania, Revenue Bonds, | 3/28 at 100.00 | BB+ | 2,392,170 |
| | | University of the Arts, Series 2017, 5.000%, 3/15/45, 144A | | | |
| 2,320 | | Scranton-Lackawanna Health and Welfare Authority, Pennsylvania, Revenue Bonds, | 5/26 at 100.00 | A– | 2,530,818 |
| | | University of Scranton, Series 2016, 5.000%, 11/01/37 | | | |
| 5,250 | | Scranton-Lackawanna Health and Welfare Authority, Pennsylvania, University Revenue Bonds, | 6/26 at 100.00 | BB+ | 5,252,730 |
| | | Marywood University, Series 2016, 5.000%, 6/01/46 | | | |
| 5,000 | | State Public School Building Authority, Pennsylvania, College Revenue Bonds, Northampton | 3/21 at 100.00 | A1 | 5,321,450 |
| | | County Area Community College, Series 2011, 5.500%, 3/01/31 | | | |
| 3,555 | | Washington County Industrial Development Authority, Pennsylvania, College Revenue Bonds, | 11/27 at 100.00 | A– | 3,425,705 |
| | | AICUP Financing Program-Washington and Jefferson College Project, Series 2017-PP5, | | | |
| | | 3.375%, 11/01/36 | | | |
45
| | | | | | | |
NQP | | Nuveen Pennsylvania Quality Municipal Income Fund | |
| | | Portfolio of Investments (continued) | | | | |
| | | February 28, 2019 | | | | |
| |
| |
| |
| |
Principal | | | Optional Call | | |
Amount (000) | | Description (1) | Provisions (2) | Ratings (3) | Value |
| | | Education and Civic Organizations (continued) | | | |
| | | Wilkes-Barre Finance Authority, Pennsylvania, Revenue Bonds, University of Scranton, | | | |
| | | Series 2015A: | | | |
| $ 1,890 | | 5.000%, 11/01/32 | 11/25 at 100.00 | A– | $ 2,157,359 |
| 740 | | 5.000%, 11/01/33 | 11/25 at 100.00 | A– | 842,742 |
| 740 | | 4.000%, 11/01/35 | 11/25 at 100.00 | A– | 746,697 |
| 100,004 | | Total Education and Civic Organizations | | | 103,315,234 |
| | | Health Care – 34.4% (21.4% of Total Investments) | | | |
| 17,075 | | Allegheny County Hospital Development Authority, Pennsylvania, Revenue Bonds, Allegheny | 4/28 at 100.00 | A | 16,922,349 |
| | | Health Network Obligated Group Issue, Series 2018A, 4.000%, 4/01/44 | | | |
| | | Allegheny County Hospital Development Authority, Pennsylvania, Revenue Bonds, Ohio | | | |
| | | Valley General Hospital, Series 2005A: | | | |
| 1,685 | | 5.000%, 4/01/25 | 3/19 at 100.00 | Caa1 | 1,641,915 |
| 4,160 | | 5.125%, 4/01/35 | 3/19 at 100.00 | Caa1 | 3,724,406 |
| | | Beaver County Hospital Authority, Pennsylvania, Revenue Bonds, Heritage Valley Health | | | |
| | | System, Inc., Series 2012: | | | |
| 4,010 | | 5.000%, 5/15/26 | 5/21 at 100.00 | AA– | 4,257,818 |
| 1,910 | | 5.000%, 5/15/27 | 5/21 at 100.00 | AA– | 2,024,638 |
| 2,000 | | 5.000%, 5/15/28 | 5/21 at 100.00 | AA– | 2,120,040 |
| | | Berks County Industrial Development Authority, Pennsylvania, Health System Revenue | | | |
| | | Bonds, Tower Health Project, Series 2017: | | | |
| 7,285 | | 5.000%, 11/01/50 | 11/27 at 100.00 | A | 7,929,577 |
| 4,100 | | 5.000%, 11/01/50 (UB) (4) | 11/27 at 100.00 | A | 4,462,768 |
| 3,300 | | Berks County Municipal Authority, Pennsylvania, Revenue Bonds, Reading Hospital & | 5/22 at 100.00 | A | 3,425,169 |
| | | Medical Center Project, Series 2012A, 4.500%, 11/01/41 | | | |
| 4,000 | | Central Bradford Progress Authority, Pennsylvania, Revenue Bonds, Guthrie Health, | 12/21 at 100.00 | AA– | 4,286,200 |
| | | Refunding Series 2011, 5.375%, 12/01/41 | | | |
| | | Centre County Hospital Authority, Pennsylvania, Hospital Revenue Bonds, Mount Nittany | | | |
| | | Medical Center Project, Series 2016A: | | | |
| 805 | | 5.000%, 11/15/41 | 11/25 at 100.00 | AA– | 880,469 |
| 2,985 | | 5.000%, 11/15/46 | 11/25 at 100.00 | AA– | 3,252,605 |
| 420 | | Chester County Health and Education Facilities Authority, Pennsylvania, Health System | 5/20 at 100.00 | AA | 432,226 |
| | | Revenue Bonds, Jefferson Health System, Series 2010A, 5.000%, 5/15/40 | | | |
| | | Chester County Health and Education Facilities Authority, Pennsylvania, Health System | | | |
| | | Revenue Bonds, Main Line Health System, Series 2017A: | | | |
| 3,200 | | 4.000%, 10/01/36 | 10/27 at 100.00 | AA | 3,348,800 |
| 1,935 | | 4.000%, 10/01/37 | 10/27 at 100.00 | AA | 2,015,361 |
| | | Dauphin County General Authority, Pennsylvania, Health System Revenue Bonds, Pinnacle | | | |
| | | Health System Project, Refunding Series 2016A: | | | |
| 1,375 | | 5.000%, 6/01/34 | 6/26 at 100.00 | A+ | 1,539,065 |
| 375 | | 5.000%, 6/01/35 | 6/26 at 100.00 | A+ | 418,316 |
| 3,460 | | Dauphin County General Authority, Pennsylvania, Health System Revenue Bonds, Pinnacle | 6/22 at 100.00 | A+ | 3,690,021 |
| | | Health System Project, Series 2012A, 5.000%, 6/01/42 | | | |
| 1,500 | | Doylestown Hospital Authority, Pennsylvania, Hospital Revenue Bonds, Series 2013A, | 7/23 at 100.00 | BBB– | 1,599,630 |
| | | 5.000%, 7/01/28 | | | |
| 2,275 | | Doylestown Hospital Authority, Pennsylvania, Hospital Revenue Bonds, Series 2016A, | 7/26 at 100.00 | BBB– | 2,390,115 |
| | | 5.000%, 7/01/41 | | | |
| 5,000 | | Dubois Hospital Authority, Pennsylvania, Hospital Revenue Bonds, Penn Highlands | 1/28 at 100.00 | A– | 5,500,400 |
| | | Healthcare, Series 2018, 5.000%, 7/15/48 | | | |
| 6,845 | | Franklin County Industrial Development Authority, Pennsylvania, Revenue Bonds, | 7/20 at 100.00 | AA– | 7,124,755 |
| | | Chambersburg Hospital Project, Series 2010, 5.375%, 7/01/42 | | | |
| 4,555 | | Geisinger Authority, Montour County, Pennsylvania, Health System Revenue Bonds, | 6/24 at 100.00 | AA | 4,966,590 |
| | | Geisinger Health System, Series 2014A, 5.000%, 6/01/41 | | | |
46
| | | | | | |
Principal | | | Optional Call | | |
Amount (000) | | Description (1) | Provisions (2) | Ratings (3) | Value |
| | | Health Care (continued) | | | |
| $ 1,370 | | Indiana County Hospital Authority, Pennsylvania, Hospital Revenue Bonds, Indiana | 6/23 at 100.00 | Ba1 | $ 1,473,339 |
| | | Regional Medical Center, Series 2014A, 6.000%, 6/01/39 | | | |
| | | Lancaster County Hospital Authority, Revenue Bonds, University of Pennsylvania Health | | | |
| | | System, Refunding Series 2016: | | | |
| 3,000 | | 5.000%, 8/15/42 (UB) (4) | 8/26 at 100.00 | AA | 3,360,990 |
| 2,200 | | 5.000%, 8/15/46 (UB) (4) | 8/26 at 100.00 | AA | 2,444,596 |
| 3,450 | | Lehigh County General Purpose Authority, Pennsylvania, Hospital Revenue Bonds, Lehigh | 7/26 at 100.00 | A+ | 3,514,757 |
| | | Valley Health Network, Refunding Series 2016A, 4.000%, 7/01/35 | | | |
| 2,565 | | Lehigh County General Purpose Authority, Pennsylvania, Hospital Revenue Bonds, Lehigh | 7/22 at 100.00 | A+ | 2,597,652 |
| | | Valley Health Network, Series 2012B, 4.000%, 7/01/43 | | | |
| | | Lehigh County General Purpose Authority, Pennsylvania, Revenue Bonds, Good Shepherd | | | |
| | | Group, Refunding Series 2016: | | | |
| 1,265 | | 3.000%, 11/01/36 | 5/26 at 100.00 | A | 1,166,014 |
| 2,850 | | 4.000%, 11/01/41 (UB) (4) | 5/26 at 100.00 | A | 2,851,682 |
| 4,955 | | 4.000%, 11/01/46 (UB) (4) | 5/26 at 100.00 | A | 4,908,819 |
| 4,600 | | Lehigh County General Purpose Authority, Pennsylvania, Revenue Bonds, Good Shepherd | 11/22 at 100.00 | A | 4,657,776 |
| | | Group, Series 2012, 4.000%, 11/01/32 | | | |
| | | Lycoming County Authority, Pennsylvania, Health System Revenue Bonds, Susquehanna Health | | | |
| | | System Project, Series 2009A: | | | |
| 6,000 | | 5.500%, 7/01/28 | 7/19 at 100.00 | AA– | 6,066,660 |
| 2,840 | | 5.750%, 7/01/39 | 7/19 at 100.00 | AA– | 2,872,887 |
| | | Monroe County Hospital Authority, Pennsylvania, Hospital Revenue Bonds, Pocono Medical | | | |
| | | Center, Series 2016: | | | |
| 1,020 | | 3.375%, 7/01/32 | 7/26 at 100.00 | A+ | 1,007,648 |
| 2,650 | | 5.000%, 7/01/41 | 7/26 at 100.00 | A+ | 2,910,204 |
| 925 | | Montgomery County Industrial Development Authority, Pennsylvania, Health Facilities | 4/22 at 100.00 | AA | 985,541 |
| | | Revenue Bonds, Jefferson Health System, Series 2012A, 5.000%, 10/01/41 | | | |
| 7,500 | | Montgomery County Industrial Development Authority, Pennsylvania, Health System Revenue | 1/25 at 100.00 | Baa3 | 8,062,425 |
| | | Bonds, Albert Einstein Healthcare Network Issue, Series 2015A, 5.250%, 1/15/45 | | | |
| 4,000 | | Pennsylvania Economic Development Financing Authority, Revenue Bonds, University of | 7/23 at 100.00 | AA– | 4,312,960 |
| | | Pittsburgh Medical Center, Series 2013A, 5.000%, 7/01/43 | | | |
| 16,385 | | Pennsylvania Higher Educational Facilities Authority, Revenue Bonds, University of | 8/26 at 100.00 | AA | 16,698,446 |
| | | Pennsylvania Health System, Refunding Series 2016C, 4.000%, 8/15/41 (UB) (4) | | | |
| 3,100 | | Pennsylvania Higher Educational Facilities Authority, Revenue Bonds, University of | 8/22 at 100.00 | AA | 3,313,993 |
| | | Pennsylvania Health System, Series 2012A, 5.000%, 8/15/42 | | | |
| 4,885 | | Philadelphia Hospitals and Higher Education Facilities Authority, Pennsylvania, Hospital | 7/22 at 100.00 | BBB– | 5,181,226 |
| | | Revenue Bonds, Temple University Health System Obligated Group, Series 2012A, 5.625%, 7/01/42 | | | |
| 2,440 | | Philadelphia Hospitals and Higher Education Facilities Authority, Pennsylvania, Hospital | 7/21 at 100.00 | AA | 2,876,174 |
| | | Revenue Bonds, Children’s Hospital of Philadelphia, Tender Option Bond Trust 2015-XF0114, | | | |
| | | 11.323%, 7/01/41, 144A (IF) | | | |
| | | Pocono Mountains Industrial Park Authority, Pennsylvania, Hospital Revenue Bonds, Saint | | | |
| | | Luke’s Hospital -Monroe Project, Series 2015A: | | | |
| 3,000 | | 5.000%, 8/15/40 | 2/25 at 100.00 | A– | 3,247,650 |
| 1,170 | | 4.000%, 8/15/45 | 2/25 at 100.00 | A– | 1,173,721 |
| 3,000 | | Pottsville Hospital Authority, Pennsylvania, Hospital Revenue Bonds, Lehigh Valley Health | 1/27 at 100.00 | A+ | 3,291,090 |
| | | Network, Series 2016B, 5.000%, 7/01/45 | | | |
| 2,000 | | Saint Mary Hospital Authority, Pennsylvania, Hospital Revenue Bonds, Trinity Health | 12/28 at 100.00 | AA– | 2,256,140 |
| | | Credit Group, Refunding Series 2019PA, 5.000%, 12/01/48 | | | |
| 3,000 | | Southcentral Pennsylvania General Authority, Revenue Bonds, Wellspan Health Obligated | 6/24 at 100.00 | Aa3 | 3,234,540 |
| | | Group, Refunding Series 2014A, 5.000%, 6/01/44 | | | |
47
| | | | | | | |
NQP | | Nuveen Pennsylvania Quality Municipal Income Fund | |
| | | Portfolio of Investments (continued) | | | | |
| | | February 28, 2019 | | | | |
| |
| |
| |
| |
Principal | | | Optional Call | | |
Amount (000) | | Description (1) | Provisions (2) | Ratings (3) | Value |
| | | Health Care (continued) | | | |
| $ 1,800 | | The Hospitals and Higher Education Facilities Authority of Philadelphia, Pennsylvania, | 7/27 at 100.00 | BBB– | $ 1,990,962 |
| | | Hospital Revenue Bonds, Temple University Health System Obligated Group, Series of 2017, | | | |
| | | 5.000%, 7/01/30 | | | |
| 3,470 | | Washington County Hospital Authority, Pennsylvania, Hospital Revenue Bonds, The | 7/23 at 100.00 | A– | 3,723,622 |
| | | Washington Hospital Project, Series 2013A, 5.000%, 7/01/28 | | | |
| | | West Shore Area Authority, Cumberland County, Pennsylvania, Hospital Revenue Bonds, Holy | | | |
| | | Spirit Hospital of the Sisters of Christian Charity, Series 2011B: | | | |
| 1,835 | | 5.625%, 1/01/32 | 1/22 at 100.00 | AA | 2,012,445 |
| 1,970 | | 5.750%, 1/01/41 | 1/22 at 100.00 | AA | 2,166,094 |
| 575 | | Westmoreland County Industrial Development Authority, Pennsylvania, Health System | 7/20 at 100.00 | A3 | 594,113 |
| | | Revenue Bonds, Excela Health Project, Series 2010A, 5.125%, 7/01/30 | | | |
| 184,075 | | Total Health Care | | | 192,907,399 |
| | | Housing/Multifamily – 1.2% (0.8% of Total Investments) | | | |
| 160 | | Chester County Industrial Development Authority, Pennsylvania, Student Housing Revenue | 8/23 at 100.00 | Baa3 | 165,291 |
| | | Bonds, University Student Housing, LLC Project at West Chester University Series 2013A, | | | |
| | | 5.000%, 8/01/45 | | | |
| 1,650 | | Clarion County Industrial Development Authority, Pennsylvania, Revenue Bonds, Clarion | 7/24 at 100.00 | Baa3 | 1,649,885 |
| | | University Foundation Inc. Student Housing Project at Clarion University, Series 2014A, | | | |
| | | 5.000%, 7/01/45 | | | |
| 1,235 | | East Hempfield Township Industrial Development Authority, Pennsylvania, Student Services | 7/24 at 100.00 | BBB– | 1,279,250 |
| | | Inc. – Student Housing Project at Millersville University, Series 2014, 5.000%, 7/01/46 | | | |
| 1,900 | | East Hempfield Township Industrial Development Authority, Pennsylvania, Student Services | 7/25 at 100.00 | BBB– | 1,978,204 |
| | | Inc. – Student Housing Project at Millersville University, Series 2015, 5.000%, 7/01/47 | | | |
| 270 | | Pennsylvania Higher Educational Facilities Authority, Revenue Bonds, University | 7/26 at 100.00 | Baa3 | 292,329 |
| | | Properties Inc. Student Housing Project at East Stroudsburg University of Pennsylvania, | | | |
| | | Series 2016A, 5.000%, 7/01/31 | | | |
| 1,632 | | Philadelphia Authority for Industrial Development, Pennsylvania, Multifamily Housing | 3/19 at 100.00 | Baa3 | 1,633,322 |
| | | Revenue Bonds, Presbyterian Homes Germantown – Morrisville Project, Series 2005A, | | | |
| | | 5.625%, 7/01/35 | | | |
| 6,847 | | Total Housing/Multifamily | | | 6,998,281 |
| | | Housing/Single Family – 16.6% (10.3% of Total Investments) | | | |
| | | Pennsylvania Housing Finance Agency, Single Family Mortgage Revenue Bonds, Series | | | |
| | | 2012-114C: | | | |
| 4,750 | | 3.300%, 10/01/32 (UB) (4) | 10/21 at 100.00 | AA+ | 4,762,255 |
| 4,425 | | 3.650%, 10/01/37 | 10/21 at 100.00 | AA+ | 4,442,611 |
| 2,275 | | 3.650%, 10/01/37 (UB) (4) | 10/21 at 100.00 | AA+ | 2,284,055 |
| 1,980 | | 3.700%, 10/01/42 (UB) (4) | 10/21 at 100.00 | AA+ | 1,971,803 |
| | | Pennsylvania Housing Finance Agency, Single Family Mortgage Revenue Bonds, Series 2015B: | | | |
| 2,330 | | 3.950%, 10/01/40 (UB) (4) | 10/24 at 100.00 | AA+ | 2,343,118 |
| 3,000 | | 4.000%, 4/01/45 (UB) (4) | 10/24 at 100.00 | AA+ | 3,008,370 |
| | | Pennsylvania Housing Finance Agency, Single Family Mortgage Revenue Bonds, Series | | | |
| | | 2015-117B: | | | |
| 3,290 | | 3.900%, 10/01/35 (UB) (4) | 10/24 at 100.00 | AA+ | 3,354,550 |
| 2,465 | | 4.050%, 10/01/40 (UB) (4) | 10/24 at 100.00 | AA+ | 2,488,664 |
| 7,175 | | Pennsylvania Housing Finance Agency, Single Family Mortgage Revenue Bonds, Series | No Opt. Call | AA+ | 7,188,776 |
| | | 2015-118B, 4.100%, 10/01/45 (UB) (4) | | | |
| 2,045 | | Pennsylvania Housing Finance Agency, Single Family Mortgage Revenue Bonds, Series | 4/25 at 100.00 | AA+ | 2,056,023 |
| | | 2016-119, 3.500%, 10/01/36 | | | |
| 7,000 | | Pennsylvania Housing Finance Agency, Single Family Mortgage Revenue Bonds, Series | 10/25 at 100.00 | AA+ | 6,432,370 |
| | | 2016-120, 3.200%, 4/01/40 (UB) (4) | | | |
| 22,450 | | Pennsylvania Housing Finance Agency, Single Family Mortgage Revenue Bonds, Series | 10/25 at 100.00 | AA+ | 21,012,976 |
| | | 2016-121, 3.200%, 10/01/41 (UB) (4) | | | |
48
| | | | | | |
Principal | | | Optional Call | | |
Amount (000) | | Description (1) | Provisions (2) | Ratings (3) | Value |
| | | Housing/Single Family (continued) | | | |
| | | Pennsylvania Housing Finance Agency, Single Family Mortgage Revenue Bonds, Series | | | |
| | | 2017-122: | | | |
| $ 2,000 | | 3.650%, 10/01/32 (UB) (4) | 4/26 at 100.00 | AA+ | $ 2,047,100 |
| 6,725 | | 3.900%, 10/01/36 (UB) (4) | 4/26 at 100.00 | AA+ | 6,887,611 |
| | | Pennsylvania Housing Finance Agency, Single Family Mortgage Revenue Bonds, Series | | | |
| | | 2017-123B: | | | |
| 4,160 | | 3.450%, 10/01/32 (UB) (4) | 10/26 at 100.00 | AA+ | 4,228,266 |
| 4,165 | | 3.900%, 10/01/37 (UB) (4) | 10/26 at 100.00 | AA+ | 4,223,268 |
| 3,930 | | 4.000%, 10/01/42 (UB) (4) | 10/26 at 100.00 | AA+ | 3,953,816 |
| 5,000 | | Pennsylvania Housing Finance Agency, Single Family Mortgage Revenue Bonds, Series | 10/26 at 100.00 | AA+ | 4,829,600 |
| | | 2017-124B, 3.500%, 10/01/37 (UB) (4) | | | |
| | | Pennsylvania Housing Finance Agency, Single Family Mortgage Revenue Bonds, Series | | | |
| | | 2018-126A: | | | |
| 2,400 | | 3.700%, 10/01/33 (UB) (4) | 4/27 at 100.00 | AA+ | 2,451,288 |
| 2,260 | | 3.950%, 10/01/38 (UB) (4) | 4/27 at 100.00 | AA+ | 2,293,651 |
| 600 | | Pennsylvania Housing Finance Agency, Single Family Mortgage Revenue Bonds, Tender Option | 10/22 at 100.00 | AA+ | 611,022 |
| | | Bond Trust 2015-XF0109, 8.343%, 10/01/31, 144A (IF) (4) | | | |
| 94,425 | | Total Housing/Single Family | | | 92,871,193 |
| | | Industrials – 1.0% (0.6% of Total Investments) | | | |
| | | Pennsylvania Economic Development Financing Authority, Exempt Facilities Revenue | | | |
| | | Refunding Bonds, Amtrak Project, Series 2012A: | | | |
| 2,495 | | 5.000%, 11/01/23 (AMT) | 11/22 at 100.00 | A1 | 2,714,834 |
| 545 | | 5.000%, 11/01/27 (AMT) | 11/22 at 100.00 | A1 | 589,843 |
| 2,000 | | 5.000%, 11/01/41 (AMT) | 11/22 at 100.00 | A1 | 2,140,020 |
| 5,040 | | Total Industrials | | | 5,444,697 |
| | | Long-Term Care – 5.7% (3.5% of Total Investments) | | | |
| | | Berks County Industrial Development Authority, Pennsylvania, Healthcare Facilities | | | |
| | | Revenue Bonds, Highlands at Wyomissing, Series 2017A: | | | |
| 940 | | 5.000%, 5/15/37 | 5/27 at 100.00 | BBB | 1,002,548 |
| 1,160 | | 5.000%, 5/15/47 | 5/27 at 100.00 | BBB | 1,215,286 |
| | | Berks County Industrial Development Authority, Pennsylvania, Healthcare Facilities Revenue | | | |
| | | Bonds, The Highlands at Wyomissing, Series 2018: | | | |
| 1,000 | | 5.000%, 5/15/43 | 5/25 at 102.00 | BBB | 1,059,080 |
| 400 | | 5.000%, 5/15/48 | 5/25 at 102.00 | BBB | 420,984 |
| 230 | | Chester County Health and Education Facilities Authority, Pennsylvania, Revenue Bonds, | 12/25 at 100.00 | N/R | 232,341 |
| | | Simpson Senior Services Project, Series 2015A, 5.000%, 12/01/35 | | | |
| | | Cumberland County Municipal Authority, Pennsylvania, Revenue Bonds, Diakon Lutheran | | | |
| | | Social Ministries Project, Series 2015: | | | |
| 4,380 | | 4.000%, 1/01/33 | 1/25 at 100.00 | BBB+ | 4,407,200 |
| 5,740 | | 5.000%, 1/01/38 | 1/25 at 100.00 | BBB+ | 6,072,346 |
| | | Cumberland County Municipal Authority, Pennsylvania, Revenue Bonds, Diakon Lutheran | | | |
| | | Social Ministries Project, Series 2016: | | | |
| 985 | | 5.000%, 1/01/28 | 1/26 at 100.00 | BBB+ | 1,097,517 |
| 1,815 | | 5.000%, 1/01/29 | 1/26 at 100.00 | BBB+ | 2,010,185 |
| 735 | | 5.000%, 1/01/30 | 1/26 at 100.00 | BBB+ | 809,882 |
| 300 | | 3.250%, 1/01/36 | 1/26 at 100.00 | BBB+ | 267,063 |
| 2,015 | | 3.250%, 1/01/39 | 1/26 at 100.00 | BBB+ | 1,740,396 |
| | | Cumberland County Municipal Authority, Pennsylvania, Revenue Bonds, Diakon Lutheran | | | |
| | | Social Ministries Project, Series 2019A: | | | |
| 690 | | 4.125%, 1/01/38 | 1/29 at 100.00 | BBB+ | 684,266 |
| 1,410 | | 5.000%, 1/01/39 | 1/29 at 100.00 | BBB+ | 1,533,586 |
| 650 | | Lancaster County Hospital Authority, Pennsylvania, Health Center Revenue Bonds, Masonic | 5/25 at 100.00 | A | 706,043 |
| | | Villages Project, Series 2015, 5.000%, 11/01/35 | | | |
49
| | | | | | |
NQP | | Nuveen Pennsylvania Quality Municipal Income Fund | |
| | | Portfolio of Investments (continued) | | | |
| | | February 28, 2019 | | | |
| |
| |
| |
| |
Principal | | | Optional Call | | |
Amount (000) | | Description (1) | Provisions (2) | Ratings (3) | Value |
| | | Long-Term Care (continued) | | | |
| $ 530 | | Lancaster County Hospital Authority, Pennsylvania, Health Center Revenue Bonds, Saint | 4/22 at 100.00 | BB+ | $ 537,510 |
| | | Anne’s Retirement Community, Inc., Series 2012, 5.000%, 4/01/33 | | | |
| 1,250 | | Lancaster County Hospital Authority, Pennsylvania, Revenue Bonds, Landis Homes | 7/25 at 100.00 | BBB– | 1,302,150 |
| | | Retirement Community Project, Refunding Series 2015A, 5.000%, 7/01/45 | | | |
| | | Lancaster Industrial Development Authority, Pennsylvania, Revenue Bonds, Garden Spot | | | |
| | | Village Project, Series 2013: | | | |
| 1,000 | | 5.375%, 5/01/28 | 5/23 at 100.00 | BBB | 1,077,190 |
| 1,665 | | 5.750%, 5/01/35 | 5/23 at 100.00 | BBB | 1,802,379 |
| 1,500 | | Langhorne Manor Boro Higher Education and Health Authority, Pennsylvania, Revenue Bonds, | 3/19 at 100.00 | A– | 1,500,420 |
| | | Woods Services Project, Series 2013, 4.000%, 11/15/38 | | | |
| 2,150 | | Montgomery County Industrial Development Authority, Pennsylvania, Revenue Bonds, ACTS | 5/22 at 100.00 | A– | 2,302,499 |
| | | Retirement-Life Communities, Inc. Obligated Group, Refunding Series 2012, 5.000%, 11/15/26 | | | |
| 30,545 | | Total Long-Term Care | | | 31,780,871 |
| | | Materials – 1.2% (0.7% of Total Investments) | | | |
| 6,455 | | Pennsylvania Economic Development Financing Authority, Exempt Facilities Revenue Bonds, | 11/24 at 100.00 | N/R | 6,708,552 |
| | | National Gypsum Company, Refunding Series 2014, 5.500%, 11/01/44 (AMT) | | | |
| | | Tax Obligation/General – 24.4% (15.2% of Total Investments) | | | |
| 1,035 | | Adams County, Pennsylvania, General Obligation Bonds, Series 2017B, 2.500%, 11/15/29 | 11/25 at 100.00 | Aa2 | 1,026,772 |
| 1,700 | | Allegheny County, Pennsylvania, General Obligation Bonds, Series 2011C-65, | 5/21 at 100.00 | AA– | 1,823,352 |
| | | 5.375%, 5/01/31 | | | |
| | | Allegheny County, Pennsylvania, General Obligation Bonds, Series 2013C-72: | | | |
| 2,780 | | 5.250%, 12/01/32 | 12/23 at 100.00 | AA– | 3,158,858 |
| 2,000 | | 5.250%, 12/01/33 | 12/23 at 100.00 | AA– | 2,269,680 |
| | | Allegheny County, Pennsylvania, General Obligation Bonds, Series 2014C-74: | | | |
| 1,750 | | 5.000%, 12/01/32 | 12/24 at 100.00 | AA– | 1,995,490 |
| 1,285 | | 5.000%, 12/01/34 | 12/24 at 100.00 | AA– | 1,457,871 |
| 2,400 | | Allegheny County, Pennsylvania, General Obligation Bonds, Series 2018C-77, | 11/28 at 100.00 | AA– | 2,735,016 |
| | | 5.000%, 11/01/43 | | | |
| 5,100 | | Allegheny County, Pennsylvania, General Obligation Bonds, Series C69-C70 of 2012, | 12/22 at 100.00 | AA– | 5,574,096 |
| | | 5.000%, 12/01/37 | | | |
| | | Bethel Park School District, Allegheny County, Pennsylvania, General Obligation Bonds, | | | |
| | | Refunding Series 2016: | | | |
| 1,500 | | 4.000%, 8/01/31 | 8/26 at 100.00 | Aa2 | 1,609,335 |
| 1,500 | | 4.000%, 8/01/32 | 8/26 at 100.00 | Aa2 | 1,600,575 |
| 1,255 | | 4.000%, 8/01/33 | 8/26 at 100.00 | Aa2 | 1,334,805 |
| 1,950 | | Boyertown Area School District, Berks and Montgomery Counties, Pennsylvania, General | 4/24 at 100.00 | AA– | 2,163,622 |
| | | Obligation Bonds, Series 2015, 5.000%, 10/01/38 | | | |
| 3,000 | | Bristol Township School District, Bucks County, Pennsylvania, General Obligation Bonds, | 6/23 at 100.00 | A2 | 3,307,470 |
| | | Series 2013, 5.250%, 6/01/43 | | | |
| | | Canon-McMillan School District, Washington County, Pennsylvania, General Obligation | | | |
| | | Bonds, Series 2014D: | | | |
| 3,000 | | 5.000%, 12/15/37 | 12/24 at 100.00 | AA | 3,383,280 |
| 1,075 | | 5.000%, 12/15/38 – BAM Insured | 12/24 at 100.00 | AA | 1,211,106 |
| 1,100 | | 5.000%, 12/15/39 | 12/24 at 100.00 | AA | 1,238,017 |
| 7,465 | | Erie City School District, Erie County, Pennsylvania, General Obligation Bonds, Series | No Opt. Call | N/R | 4,830,527 |
| | | 2000, 0.000%, 9/01/30 – AMBAC Insured | | | |
| 6,680 | | Gateway School District, Allegheny County, Pennsylvania, General Obligation Bonds, | 10/22 at 100.00 | Aa3 | 6,935,710 |
| | | Refunding Series 2012, 4.000%, 10/15/32 | | | |
| 6,225 | | Lehighton Area School District, Carbon County, Pennsylvania, General Obligation Bonds, | 11/23 at 100.00 | AA | 6,862,876 |
| | | Limited Tax Series 2015A, 5.000%, 11/15/43 – BAM Insured | | | |
50
| | | | | | |
Principal | | | Optional Call | | |
Amount (000) | | Description (1) | Provisions (2) | Ratings (3) | Value |
| | | Tax Obligation/General (continued) | | | |
| | | North Allegheny School District, Allegheny County, Pennsylvania, General Obligation | | | |
| | | Bonds, Series 2015: | | | |
| $ 5,000 | | 5.000%, 5/01/31 | 5/25 at 100.00 | AA | $ 5,777,800 |
| 4,000 | | 5.000%, 5/01/32 | 5/25 at 100.00 | AA | 4,614,760 |
| 2,875 | | 5.000%, 5/01/33 | 5/25 at 100.00 | AA | 3,306,192 |
| | | Pennsbury School District, Bucks County, Pennsylvania, General Obligation Bonds, Series 2016A: | | | |
| 3,115 | | 5.000%, 10/01/32 | 4/25 at 100.00 | Aa2 | 3,584,835 |
| 1,000 | | 5.000%, 10/01/33 | 4/25 at 100.00 | Aa2 | 1,147,170 |
| 2,660 | | 5.000%, 10/01/34 | 4/25 at 100.00 | Aa2 | 3,038,545 |
| 2,045 | | 5.000%, 10/01/35 | 4/25 at 100.00 | Aa2 | 2,333,549 |
| 2,620 | | Pennsylvania Economic Development Financing Authority, Parking System Revenue Bonds, | 1/24 at 100.00 | AA | 2,957,142 |
| | | Capitol Region Parking System, Junior Insured Series 2013C, 5.500%, 1/01/30 – AGM Insured | | | |
| 3,925 | | Philadelphia School District, Pennsylvania, General Obligation Bonds, Series 2007A, | No Opt. Call | A+ | 4,538,517 |
| | | 5.000%, 6/01/34 – NPFG Insured | | | |
| 745 | | Pittsburgh School District, Allegheny County, Pennsylvania, General Obligation Bonds, | 9/22 at 100.00 | AA | 822,607 |
| | | Series 2014A, 5.000%, 9/01/25 – BAM Insured | | | |
| | | Pittsburgh, Pennsylvania, General Obligation Bonds, Series 2012B: | | | |
| 2,590 | | 5.000%, 9/01/25 | 9/22 at 100.00 | AA– | 2,855,190 |
| 6,800 | | 5.000%, 9/01/26 | 9/22 at 100.00 | AA– | 7,486,528 |
| 980 | | Radnor Township School District, Delaware County, Pennsylvania, General Obligation | 8/19 at 100.00 | Aa1 | 974,365 |
| | | Bonds, Series 2012, 3.000%, 2/15/34 | | | |
| 1,000 | | Radnor Township, Pennsylvania, General Obligation Bonds, Series 2012, 4.000%, 11/01/37 | 11/22 at 100.00 | Aa1 | 1,035,060 |
| 11,440 | | Reading School District, Berks County, Pennsylvania, General Obligation Bonds, Series | No Opt. Call | Baa2 | 7,311,418 |
| | | 2003B, 0.000%, 1/15/32 – NPFG Insured | | | |
| | | Scranton, Lackawanna County, Pennsylvania, General Obligation Notes, Series 2016: | | | |
| 270 | | 5.000%, 11/15/26 | 5/24 at 100.00 | BB+ | 293,771 |
| 2,925 | | 5.000%, 11/15/32 | 5/24 at 100.00 | BB+ | 3,097,224 |
| 1,000 | | South Park School District, Allegheny County, Pennsylvania, General Obligation Bonds, | 2/20 at 100.00 | AA | 1,001,940 |
| | | Series 2014, 3.375%, 8/01/32 – BAM Insured | | | |
| 21,000 | | State Public School Building Authority, Pennsylvania, Lease Revenue Bonds, Philadelphia | No Opt. Call | AA | 25,592,070 |
| | | School District, Series 2003, 5.500%, 6/01/28 – AGM Insured (UB) (4) | | | |
| | | The Redevelopment Authority of the City of Scranton, Lackawanna county, Pennsylvania, | | | |
| | | Guaranteed Lease Revenue Bonds, Series 2016A: | | | |
| 250 | | 5.000%, 11/15/21 | No Opt. Call | BB+ | 255,868 |
| 170 | | 5.000%, 11/15/28 | 5/24 at 100.00 | BB+ | 171,692 |
| 129,210 | | Total Tax Obligation/General | | | 136,714,701 |
| | | Tax Obligation/Limited – 9.9% (6.1% of Total Investments) | | | |
| 1,290 | | Allegheny County Redevelopment Authority, Pennsylvania, TIF Revenue Bonds, Pittsburg | 3/19 at 100.00 | N/R | 1,256,292 |
| | | Mills Project, Series 2004, 5.600%, 7/01/23 | | | |
| 1,475 | | Allentown Neighborhood Improvement Zone Development Authority, Pennsylvania, Tax | 5/22 at 100.00 | Baa3 | 1,524,708 |
| | | Revenue Bonds, Series 2012A, 5.000%, 5/01/35 | | | |
| 155 | | Allentown Neighborhood Improvement Zone Development Authority, Pennsylvania, Tax Revenue | 5/28 at 100.00 | Ba3 | 169,894 |
| | | Bonds, City Center Project, Series 2018, 5.000%, 5/01/33, 144A | | | |
| 1,115 | | Allentown Neighborhood Improvement Zone Development Authority, Pennsylvania, Tax Revenue | 5/27 at 100.00 | Ba3 | 1,189,504 |
| | | Bonds, City Center Refunding Project, Series 2017, 5.000%, 5/01/42, 144A | | | |
| | | Commonwealth Financing Authority, Pennsylvania, State Appropriation Lease Bonds, Master | | | |
| | | Settlement, Series 2018: | | | |
| 1,135 | | 5.000%, 6/01/33 | 6/28 at 100.00 | A1 | 1,294,899 |
| 7,215 | | 4.000%, 6/01/39 – AGM Insured (UB) (4) | 6/28 at 100.00 | AA | 7,397,107 |
| | | Government of Guam, Business Privilege Tax Bonds, Series 2011A: | | | |
| 1,670 | | 5.250%, 1/01/36 | 1/22 at 100.00 | BB | 1,744,048 |
| 655 | | 5.125%, 1/01/42 | 1/22 at 100.00 | BB | 672,790 |
51
| | | | | | | |
NQP | | Nuveen Pennsylvania Quality Municipal Income Fund | |
| | | Portfolio of Investments (continued) | | | | |
| | | February 28, 2019 | | | | |
| |
| |
| |
| |
Principal | | | Optional Call | | |
Amount (000) | | Description (1) | Provisions (2) | Ratings (3) | Value |
| | | Tax Obligation/Limited (continued) | | | |
| $ 1,662 | | Monroe County Industrial Development Authority, Pennsylvania, Special Obligation Revenue | 7/24 at 100.00 | N/R | $ 1,669,479 |
| | | Bonds, Tobyhanna Township Project, Series 2014, 6.875%, 7/01/33, 144A | | | |
| 3,500 | | Norristown Area School District, Pennsylvania, Installment Purchase Certificates of | 4/22 at 100.00 | Baa1 | 3,620,715 |
| | | Participation, Series 2012, 5.000%, 4/01/32 | | | |
| 1,935 | | Pennsylvania Turnpike Commission, Motor License Fund-Enhanced Turnpike Special Revenue | 12/21 at 100.00 | A2 | 2,031,324 |
| | | Bonds, Subordinate Series 2011B, 5.000%, 12/01/41 | | | |
| 7,000 | | Pennsylvania Turnpike Commission, Motor License Fund-Enhanced Turnpike Subordinate | 12/23 at 100.00 | AA– | 7,633,990 |
| | | Special Revenue Bonds, Series 2013B-1, 5.250%, 12/01/43 | | | |
| | | Pennsylvania Turnpike Commission, Motor License Fund-Enhanced Turnpike Subordinate | | | |
| | | Special Revenue Bonds, Series 2014A: | | | |
| 2,650 | | 0.000%, 12/01/37 (6) | 12/26 at 100.00 | AA– | 2,558,495 |
| 4,000 | | 0.000%, 12/01/44 (6) | 12/26 at 100.00 | AA– | 3,828,160 |
| 2,500 | | Pennsylvania Turnpike Commission, Oil Franchise Tax Revenue Bonds, Subordinate Series | 12/28 at 100.00 | A+ | 2,780,775 |
| | | 2018B, 5.000%, 12/01/48 | | | |
| 5,530 | | Philadelphia Authority For Industrial Development, Pennsylvania, City Agreement Revenue | 12/25 at 100.00 | A | 6,279,260 |
| | | Bonds, Cultural and Commercial Corridors Program, Refunding Series 2016A, 5.000%, 12/01/30 | | | |
| 3,820 | | Pittsburgh and Allegheny County Sports and Exhibition Authority, Pennsylvania, Hotel | 8/22 at 100.00 | AA | 4,178,431 |
| | | Room Excise Tax Revenue Bonds, Refunding Series 2012, 5.000%, 2/01/26 – AGM Insured | | | |
| 4,225 | | Puerto Rico Highway and Transportation Authority, Highway Revenue Bonds, Series 2007N, | No Opt. Call | C | 4,661,611 |
| | | 5.500%, 7/01/29 – AMBAC Insured | | | |
| 825 | | Washington County Redevelopment Authority, Pennsylvania, Tanger Outlet Victory Center | 1/28 at 100.00 | BB | 836,699 |
| | | Tax Increment Bonds, Series 2018, 5.000%, 7/01/35 | | | |
| 52,357 | | Total Tax Obligation/Limited | | | 55,328,181 |
| | | Transportation – 10.0% (6.2% of Total Investments) | | | |
| | | Delaware River Port Authority, Pennsylvania and New Jersey, Revenue Refunding Bonds, | | | |
| | | Port District Project, Series 2012: | | | |
| 1,270 | | 5.000%, 1/01/22 | No Opt. Call | A | 1,375,880 |
| 2,425 | | 5.000%, 1/01/23 | No Opt. Call | A | 2,679,407 |
| 2,310 | | 5.000%, 1/01/24 | 1/23 at 100.00 | A | 2,547,653 |
| 610 | | 5.000%, 1/01/25 | 1/23 at 100.00 | A | 671,671 |
| 4,000 | | Pennsylvania Economic Development Financing Authority, Parking System Revenue Bonds, | 1/24 at 100.00 | AA | 4,344,880 |
| | | Capitol Region Parking System, Series 2013A, 5.250%, 1/01/44 – AGM Insured | | | |
| 12,100 | | Pennsylvania Turnpike Commission, Turnpike Revenue Bonds, Capital Appreciation Series | 12/27 at 100.00 | A | 15,016,826 |
| | | 2009E, 6.375%, 12/01/38 | | | |
| 820 | | Pennsylvania Turnpike Commission, Turnpike Revenue Bonds, Refunding Subordinate Second | 6/26 at 100.00 | A3 | 892,849 |
| | | Series 2016B-2, 5.000%, 6/01/39 | | | |
| 3,000 | | Pennsylvania Turnpike Commission, Turnpike Revenue Bonds, Series 2014C, | 12/24 at 100.00 | A+ | 3,270,930 |
| | | 5.000%, 12/01/44 | | | |
| 10,470 | | Pennsylvania Turnpike Commission, Turnpike Revenue Bonds, Series 2015B, | 12/25 at 100.00 | A1 | 11,483,496 |
| | | 5.000%, 12/01/45 (UB) (4) | | | |
| 2,000 | | Pennsylvania Turnpike Commission, Turnpike Revenue Bonds, Subordinate Series 2009C, | 6/26 at 100.00 | AA | 2,448,680 |
| | | 6.250%, 6/01/33 – AGM Insured | | | |
| | | Pennsylvania Turnpike Commission, Turnpike Revenue Bonds, Subordinate Series 2017B-1: | | | |
| 1,430 | | 5.000%, 6/01/31 | 6/27 at 100.00 | A3 | 1,628,684 |
| 1,430 | | 5.000%, 6/01/33 | 6/27 at 100.00 | A3 | 1,610,208 |
| 585 | | Philadelphia, Pennsylvania, Airport Revenue Bonds, Refunding Series 2017A, 3.000%, | 7/27 at 100.00 | AA | 566,157 |
| | | 7/01/34 – AGM Insured | | | |
| 1,500 | | Philadelphia, Pennsylvania, Airport Revenue Bonds, Refunding Series 2017B, 5.000%, | 7/27 at 100.00 | A | 1,655,595 |
| | | 7/01/42 (AMT) | | | |
| 1,865 | | Philadelphia, Pennsylvania, Airport Revenue Bonds, Series 2010A, 5.250%, 6/15/28 | 6/20 at 100.00 | A | 1,947,153 |
52
| | | | | | |
Principal | | | Optional Call | | |
Amount (000) | | Description (1) | Provisions (2) | Ratings (3) | Value |
| | | Transportation (continued) | | | |
| | | Pittsburgh and Allegheny County Sports and Exhibition Authority, Pennsylvania, Parking | | | |
| | | Revenue Bonds, Series 2017: | | | |
| $ 1,000 | | 5.000%, 12/15/30 | 12/27 at 100.00 | A | $ 1,154,080 |
| 500 | | 5.000%, 12/15/33 | 12/27 at 100.00 | A | 568,495 |
| 550 | | 5.000%, 12/15/34 | 12/27 at 100.00 | A | 622,380 |
| 1,000 | | 5.000%, 12/15/36 | 12/27 at 100.00 | A | 1,123,440 |
| 250 | | 5.000%, 12/15/37 | 12/27 at 100.00 | A | 279,395 |
| 49,115 | | Total Transportation | | | 55,887,859 |
| | | U.S. Guaranteed – 17.2% (10.7% of Total Investments) (7) | | | |
| 2,325 | | Allegheny County, Pennsylvania, General Obligation Bonds, Series 2011C-65, 5.375%, | 5/21 at 100.00 | N/R | 2,507,838 |
| | | 5/01/31 (Pre-refunded 5/01/21) | | | |
| 6,025 | | Bethel Park School District, Allegheny County, Pennsylvania, General Obligation Bonds, | 8/19 at 100.00 | Aa2 | 6,109,892 |
| | | Series 2009, 5.000%, 8/01/29 (Pre-refunded 8/01/19) | | | |
| | | Bucks County Water and Sewer Authority, Pennsylvania, Revenue Bonds, Tender Option Bond | | | |
| | | Trust 2015-XF0123: | | | |
| 1,665 | | 11.024%, 12/01/33 (Pre-refunded 12/01/21) – AGM Insured, 144A (IF) (4) | 12/21 at 100.00 | AA | 2,119,112 |
| 825 | | 11.015%, 12/01/29 (Pre-refunded 12/01/21) – AGM Insured, 144A (IF) (4) | 12/21 at 100.00 | AA | 1,049,788 |
| 4,100 | | Centre County Hospital Authority, Pennsylvania, Hospital Revenue Bonds, Mount Nittany | 11/21 at 100.00 | AA– | 4,664,529 |
| | | Medical Center Project, Series 2011, 7.000%, 11/15/46 (Pre-refunded 11/15/21) | | | |
| | | Centre County, Pennsylvania, General Obligation Bonds, Series 2012B: | | | |
| 310 | | 4.000%, 7/01/24 (Pre-refunded 7/01/20) | 7/20 at 100.00 | AA | 319,629 |
| 915 | | 4.000%, 7/01/26 (Pre-refunded 7/01/20) | 7/20 at 100.00 | AA | 943,420 |
| 1,175 | | Chester County Health and Education Facilities Authority, Pennsylvania, Health System | 5/20 at 100.00 | N/R | 1,221,154 |
| | | Revenue Bonds, Jefferson Health System, Series 2010A, 5.000%, 5/15/40 (Pre-refunded 5/15/20) | | | |
| 3,280 | | Delaware River Port Authority, New Jersey and Pennsylvania, Revenue Bonds, Series | 1/20 at 100.00 | A+ | 3,372,332 |
| | | 2010E, 5.000%, 1/01/40 (Pre-refunded 1/01/20) | | | |
| 3,000 | | Erie County Hospital Authority, Pennsylvania, Hospital Revenue Bonds, Saint Vincent | 7/20 at 100.00 | N/R | 3,206,520 |
| | | Health Center Project, Series 2010A, 7.000%, 7/01/27 (Pre-refunded 7/01/20) | | | |
| 3,385 | | Lancaster County Hospital Authority, Pennsylvania, Health System Revenue Bonds, | 1/22 at 100.00 | N/R | 4,304,806 |
| | | Lancaster General Hospital Project, Tender Option Bond Trust 2015-XF0064, 11.331%, | | | |
| | | 7/01/42 (Pre-refunded 1/01/22), 144A (IF) | | | |
| | | Monroe County Hospital Authority, Pennsylvania, Hospital Revenue Bonds, Pocono Medical | | | |
| | | Center, Series 2012A: | | | |
| 365 | | 4.000%, 1/01/25 (Pre-refunded 1/01/22) | 1/22 at 100.00 | N/R | 387,013 |
| 3,000 | | 5.000%, 1/01/41 (Pre-refunded 1/01/22) | 1/22 at 100.00 | N/R | 3,267,540 |
| 3,730 | | Montgomery County Higher Education and Health Authority, Pennsylvania, Hospital Revenue | 6/22 at 100.00 | N/R | 4,106,581 |
| | | Bonds, Abington Memorial Hospital Obligated Group, Series 2012A, 5.000%, 6/01/31 | | | |
| | | (Pre-refunded 6/01/22) | | | |
| 1,130 | | Montgomery County Industrial Development Authority, Pennsylvania, FHA Insured Mortgage | 8/20 at 100.00 | N/R | 1,188,014 |
| | | Revenue Bonds, New Regional Medical Center Project, Series 2010, 5.375%, 8/01/38 | | | |
| | | (Pre-refunded 8/01/20) | | | |
| 3,010 | | Pennsylvania Economic Development Financing Authority, Health System Revenue Bonds , | 10/19 at 100.00 | N/R | 3,091,721 |
| | | Albert Einstein Healthcare, Series 2009A, 6.250%, 10/15/23 (Pre-refunded 10/15/19) | | | |
| 1,415 | | Pennsylvania Higher Educational Facilities Authority, Revenue Bonds, Drexel University, | 5/21 at 100.00 | N/R | 1,522,540 |
| | | Series 2011A, 5.250%, 5/01/41 (Pre-refunded 5/01/21) | | | |
| 1,300 | | Pennsylvania Higher Educational Facilities Authority, Revenue Bonds, Edinboro University | 7/20 at 100.00 | N/R | 1,372,540 |
| | | Foundation Student Housing Project, Series 2010, 6.000%, 7/01/43 (Pre-refunded 7/01/20) | | | |
| | | Pennsylvania Higher Educational Facilities Authority, Revenue Bonds, Foundation for | | | |
| | | Student Housing at Indiana University, Project Series 2012A: | | | |
| 1,000 | | 5.000%, 7/01/27 (Pre-refunded 7/01/22) | 7/22 at 100.00 | N/R | 1,103,490 |
| 750 | | 5.000%, 7/01/32 (Pre-refunded 7/01/22) | 7/22 at 100.00 | N/R | 827,617 |
| 1,195 | | Pennsylvania Higher Educational Facilities Authority, Revenue Bonds, Philadelphia | 6/23 at 100.00 | N/R | 1,354,640 |
| | | University, Refunding Series 2013, 5.000%, 6/01/32 (Pre-refunded 6/01/23) | | | |
53
| | | | | | |
NQP | | Nuveen Pennsylvania Quality Municipal Income Fund | |
| | | Portfolio of Investments (continued) | | | |
| | | February 28, 2019 | | | |
| |
| |
| |
| |
Principal | | | Optional Call | | |
Amount (000) | | Description (1) | Provisions (2) | Ratings (3) | Value |
| | | U.S. Guaranteed (7) (continued) | | | |
| $ 420 | | Pennsylvania Higher Educational Facilities Authority, Revenue Bonds, Shippensburg | 10/22 at 100.00 | BBB– | $ 466,637 |
| | | University Student Services, Inc. Student Housing Project at Shippensburg University of | | | |
| | | Pennsylvania, Series 2012, 5.000%, 10/01/44 (Pre-refunded 10/01/22) | | | |
| 2,015 | | Pennsylvania Higher Educational Facilities Authority, Revenue Bonds, Thomas Jefferson | 3/20 at 100.00 | A+ | 2,079,903 |
| | | University, Series 2010, 5.000%, 3/01/40 (Pre-refunded 3/01/20) | | | |
| | | Pennsylvania Turnpike Commission, Motor License Fund-Enhanced Turnpike Special Revenue | | | |
| | | Bonds, Subordinate Series 2010A1&2: | | | |
| 345 | | 5.500%, 12/01/34 (Pre-refunded 12/01/20) | 12/20 at 100.00 | N/R | 367,887 |
| 1,440 | | 5.500%, 12/01/34 (Pre-refunded 12/01/20) | 12/20 at 100.00 | AA– | 1,535,530 |
| 3,915 | | 5.000%, 12/01/38 (Pre-refunded 12/01/19) | 12/19 at 100.00 | AA– | 4,012,640 |
| 2,065 | | Pennsylvania Turnpike Commission, Motor License Fund-Enhanced Turnpike Special Revenue | 12/21 at 100.00 | N/R | 2,249,632 |
| | | Bonds, Subordinate Series 2011B, 5.000%, 12/01/41 (Pre-refunded 12/01/21) | | | |
| 3,180 | | Pennsylvania Turnpike Commission, Motor License Fund-Enhanced Turnpike Special Revenue | 12/21 at 100.00 | AA– | 3,468,808 |
| | | Bonds, Subordinate Series 2012A, 5.000%, 12/01/31 (Pre-refunded 12/01/21) | | | |
| 2,485 | | Pennsylvania Turnpike Commission, Turnpike Revenue Bonds, Subordinate Lien, Refunding | 12/19 at 100.00 | A | 2,546,976 |
| | | Series 2010B-1, 5.000%, 12/01/37 (Pre-refunded 12/01/19) | | | |
| 205 | | Philadelphia Gas Works, Pennsylvania, Revenue Bonds, Twelfth Series 1990B, 7.000%, | No Opt. Call | N/R | 212,116 |
| | | 5/15/20 – NPFG Insured (ETM) | | | |
| 7,165 | | Philadelphia Hospitals and Higher Education Facilities Authority, Pennsylvania, Health | 5/20 at 100.00 | N/R | 7,446,441 |
| | | System Revenue Bonds, Jefferson Health System, Series 2010B, 5.000%, 5/15/40 | | | |
| | | (Pre-refunded 5/15/20) | | | |
| 585 | | Philadelphia Hospitals and Higher Education Facilities Authority, Pennsylvania, Hospital | No Opt. Call | AA+ | 606,633 |
| | | Revenue Bonds, Presbyterian Medical Center of Philadelphia, Series 1993, 6.650%, 12/01/19 (ETM) | | | |
| 3,345 | | Philadelphia, Pennsylvania, General Obligation Bonds, Refunding Series 2011, 6.500%, | 8/20 at 100.00 | A | 3,568,413 |
| | | 8/01/41 (Pre-refunded 8/01/20) | | | |
| 1,470 | | Puerto Rico, Highway Revenue Bonds, Highway and Transportation Authority, Series 2003AA, | No Opt. Call | Baa2 | 1,488,213 |
| | | 5.500%, 7/01/19 – NPFG Insured (ETM) | | | |
| | | Saint Mary Hospital Authority, Pennsylvania, Health System Revenue Bonds, Catholic | | | |
| | | Health East, Series 2010A: | | | |
| 55 | | 5.000%, 11/15/40 (Pre-refunded 11/15/20) | 11/20 at 100.00 | N/R | 58,051 |
| 605 | | 5.000%, 11/15/40 (Pre-refunded 11/15/20) | 11/20 at 100.00 | AA– | 638,559 |
| 1,613 | | South Fork Municipal Authority, Pennsylvania, Hospital Revenue Bonds, Conemaugh Valley | 7/20 at 100.00 | N/R | 1,692,489 |
| | | Memorial Hospital, Series 2010, 5.500%, 7/01/29 (Pre-refunded 7/01/20) | | | |
| | | Union County Hospital Authority, Pennsylvania, Hospital Revenue Bonds, Evangelical | | | |
| | | Community Hospital Project, Refunding & Improvement Series 2011: | | | |
| 3,130 | | 6.875%, 8/01/31 (Pre-refunded 8/01/21) | 8/21 at 100.00 | A– | 3,509,763 |
| 2,500 | | 7.000%, 8/01/41 (Pre-refunded 8/01/21) | 8/21 at 100.00 | A– | 2,808,150 |
| | | West Shore Area Authority, Cumberland County, Pennsylvania, Hospital Revenue Bonds, Holy | | | |
| | | Spirit Hospital of the Sisters of Christian Charity Project, Series 2011: | | | |
| 325 | | 6.250%, 1/01/31 (Pre-refunded 1/01/21) | 1/21 at 100.00 | AA | 351,881 |
| 4,555 | | 6.500%, 1/01/36 (Pre-refunded 1/01/21) | 1/21 at 100.00 | AA | 4,951,285 |
| 1,930 | | Westmoreland County Municipal Authority, Pennsylvania, Municipal Service Revenue Bonds, | 8/23 at 100.00 | A+ | 3,006,786 |
| | | Tender Option Bond Trust 2016-XF1058, 13.689%, 8/15/37 (Pre-refunded 8/15/23), 144A (IF) (4) | | | |
| 1,110 | | Wilkes-Barre Finance Authority, Pennsylvania, Revenue Bonds, University of Scranton, | 11/20 at 100.00 | A– | 1,172,060 |
| | | Series 2010, 5.000%, 11/01/40 (Pre-refunded 11/01/20) | | | |
| 88,358 | | Total U.S. Guaranteed | | | 96,279,569 |
| | | Utilities – 9.1% (5.7% of Total Investments) | | | |
| 2,540 | | Beaver County Industrial Development Authority, Pennsylvania, Pollution Control Revenue | No Opt. Call | N/R | 2,209,800 |
| | | Bonds, FirstEnergy Nuclear Generation Project, Refunding Series 2005A, 4.000%, 1/01/35 | | | |
| | | (Mandatory Put 7/01/21) (5) | | | |
| 3,000 | | Beaver County Industrial Development Authority, Pennsylvania, Pollution Control Revenue | No Opt. Call | N/R | 3,000,000 |
| | | Refunding Bonds, FirstEnergy Nuclear Generation Project, Series 2006A, 4.375%, 1/01/35 | | | |
| | | (Mandatory Put 7/01/22) (5) | | | |
| 6,210 | | Beaver County Industrial Development Authority, Pennsylvania, Pollution Control Revenue | No Opt. Call | N/R | 5,402,700 |
| | | Refunding Bonds, FirstEnergy Nuclear Generation Project, Series 2006B, 3.500%, 12/01/35 | | | |
| | | (Mandatory Put 6/01/20) (5) | | | |
54
| | | | | | |
Principal | | | Optional Call | | |
Amount (000) | | Description (1) | Provisions (2) | Ratings (3) | Value |
| | | Utilities (continued) | | | |
| $ 9,855 | | Beaver County Industrial Development Authority, Pennsylvania, Pollution Control Revenue | No Opt. Call | N/R | $ 8,573,850 |
| | | Refunding Bonds, FirstEnergy Nuclear Generation Project, Series 2008A, 2.700%, 4/01/35 (5) | | | |
| 7,250 | | Delaware County Industrial Development Authority, Pennsylvania, Revenue Bonds, Covanta | 7/20 at 100.00 | BB– | 7,304,013 |
| | | Project, Refunding Series 2015A, 5.000%, 7/01/43 | | | |
| 4,015 | | Luzerne County Industrial Development Authority, Pennsylvania, Water Facility Revenue | 12/19 at 100.00 | A+ | 4,106,381 |
| | | Refunding Bonds, Pennsylvania-American Water Company, Series 2009, 5.500%, 12/01/39 | | | |
| 2,220 | | Pennsylvania Economic Development Financing Authority, Exempt Facilities Revenue | 9/25 at 100.00 | B+ | 2,243,421 |
| | | Refunding Bonds, PPL Energy Supply, LLC Project, Series 2009A, 6.400%, 12/01/38 | | | |
| 4,575 | | Pennsylvania Economic Development Financing Authority, Water Facilities Revenue Bonds, | 10/19 at 100.00 | AA– | 4,649,024 |
| | | Aqua Pennsylvania, Inc. Project, Series 2009A, 5.000%, 10/01/39 | | | |
| 5,000 | | Pennsylvania Economic Development Financing Authority, Water Facilities Revenue Bonds, | 11/19 at 100.00 | AA– | 5,096,550 |
| | | Aqua Pennsylvania, Inc. Project, Series 2009B, 5.000%, 11/15/40 | | | |
| 5,000 | | Philadelphia Gas Works, Pennsylvania, Revenue Bonds, General Ordinance, Fifteenth Series | 8/27 at 100.00 | A | 5,505,550 |
| | | 2017, 5.000%, 8/01/47 | | | |
| 2,735 | | Philadelphia Gas Works, Pennsylvania, Revenue Bonds, Refunding Thirteenth Series 2015, | 8/25 at 100.00 | A | 3,135,349 |
| | | 5.000%, 8/01/29 | | | |
| 52,400 | | Total Utilities | | | 51,226,638 |
| | | Water and Sewer – 11.4% (7.0% of Total Investments) | | | |
| | | Allegheny County Sanitary Authority, Pennsylvania, Sewer Revenue Bonds, Refunding | | | |
| | | Series 2015: | | | |
| 3,325 | | 5.000%, 12/01/40 | 12/25 at 100.00 | A+ | 3,716,984 |
| 3,320 | | 5.000%, 12/01/45 | 12/25 at 100.00 | A+ | 3,694,264 |
| | | Delaware County Regional Water Quality Control Authority, Pennsylvania, Sewer Revenue | | | |
| | | Bonds, Series 2015: | | | |
| 1,110 | | 5.000%, 5/01/40 | 5/25 at 100.00 | Aa3 | 1,246,685 |
| 2,220 | | 4.000%, 5/01/45 | 5/25 at 100.00 | Aa3 | 2,270,483 |
| | | Lehigh County Authority, Pennsylvania, Water and Sewer Revenue Bonds, Allentown | | | |
| | | Concession, Capital Appreciation Series 2013B: | | | |
| 7,295 | | 0.000%, 12/01/34 | No Opt. Call | A | 4,014,001 |
| 4,420 | | 0.000%, 12/01/35 | No Opt. Call | A | 2,319,439 |
| 12,500 | | Lehigh County Authority, Pennsylvania, Water and Sewer Revenue Bonds, Allentown | 12/23 at 100.00 | A | 13,842,375 |
| | | Concession, Series 2013A, 5.125%, 12/01/47 | | | |
| 1,100 | | Pennsylvania Economic Development Financing Authority, Sewage Sludge Disposal Revenue | 1/20 at 100.00 | BBB+ | 1,127,335 |
| | | Bonds, Philadelphia Biosolids Facility Project, Series 2009, 6.250%, 1/01/32 | | | |
| 6,560 | | Philadelphia, Pennsylvania, Water and Wastewater Revenue Bonds, Series 2011A, | 1/21 at 100.00 | A+ | 6,842,014 |
| | | 5.000%, 1/01/41 | | | |
| 2,500 | | Philadelphia, Pennsylvania, Water and Wastewater Revenue Bonds, Series 2013A, | 1/22 at 100.00 | A+ | 2,667,175 |
| | | 5.125%, 1/01/43 | | | |
| | | Philadelphia, Pennsylvania, Water and Wastewater Revenue Bonds, Series 2018A: | | | |
| 5,000 | | 5.000%, 10/01/48 (UB) (4) | 10/28 at 100.00 | A+ | 5,623,350 |
| 7,000 | | 5.000%, 10/01/53 (UB) (4) | 10/28 at 100.00 | A+ | 7,825,230 |
| 5,000 | | Pittsburgh Water and Sewer Authority, Pennsylvania, Water and Sewer System Revenue | 9/23 at 100.00 | A | 5,596,200 |
| | | Bonds, First Lien Series 2013B, 5.250%, 9/01/40 | | | |
| 2,840 | | Robinson Township Municipal Authority, Allegheny County, Pennsylvania, Water and Sewer | 11/19 at 100.00 | AA | 2,845,396 |
| | | Revenue Bonds, Series 2014, 4.000%, 5/15/40 | | | |
| 64,190 | | Total Water and Sewer | | | 63,630,931 |
| $ 865,021 | | Total Long-Term Investments (cost $869,729,598) | | | 901,539,986 |
| | | Floating Rate Obligations – (24.2)% | | | (135,390,000) |
| | | Variable Rate Demand Preferred Shares, net of deferred offering costs – (38.7)% (8) | | | (216,682,253) |
| | | Other Assets Less Liabilities – 2.0% (9) | | | 10,926,885 |
| | | Net Asset Applicable to Common Shares – 100% | | | $ 560,394,618 |
55
| | |
| NQP | Nuveen Pennsylvania Quality Municipal Income Fund Portfolio of Investments (continued)
February 28, 2019 |
| | | | | | | | |
Investments in Derivatives | | | | | | |
Futures Contracts | | | | | | | |
| | | | | | | | Variation |
| | | | | | | Unrealized | Margin |
| | Contract | Number of | Expiration | Notional | | Appreciation | Receivable/ |
Description | Position | Contracts | Date | Amount | Value | (Depreciation) | (Payable) |
| U.S. 10 Year Note | Short | (179) | 6/19 | $(21,939,515) | $(21,838,000) | $101,515 | $39,156 |
| U.S. Treasury Long Bond | Short | (120) | 6/19 | (17,504,152) | (17,336,250) | 167,902 | 52,500 |
Total | | | | $(39,443,667) | $(39,174,250) | $269,417 | $91,656 |
| | |
| (1) | All percentages shown in the Portfolio of Investments are based on net assets applicable to common shares unless otherwise noted. |
| (2) | Optional Call Provisions: Dates (month and year) and prices of the earliest optional call or redemption. There may be other call provisions at varying prices at later dates. Certain mortgage-backed securities may be subject to periodic principal paydowns. Optional Call Provisions are not covered by the report of independent registered public accounting firm. |
| (3) | For financial reporting purposes, the ratings disclosed are the highest of Standard & Poor’s Group (“Standard & Poor’s”), Moody’s Investors Service, Inc. (“Moody’s”) or Fitch, Inc. (“Fitch”) rating. This treatment of split-rated securities may differ from that used for other purposes, such as for Fund investment policies. Ratings below BBB by Standard & Poor’s, Baa by Moody’s or BBB by Fitch are considered to be below investment grade. Holdings designated N/R are not rated by any of these national rating agencies. Ratings are not covered by the report of independent registered public accounting firm. |
| (4) | Investment, or portion of investment, has been pledged to collateralize the net payment obligations for investments in inverse floating rate transactions. |
| (5) | As of, or subsequent to, the end of the reporting period, this security is non-income producing. Non-income producing, in the case of a fixed-income security, generally denotes that the issuer has (1) defaulted on the payment of principal or interest, (2) is under the protection of the Federal Bankruptcy Court or (3) the Fund’s Adviser has concluded that the issue is not likely to meet its future interest payment obligations and has ceased accruing additional income on the Fund’s records. |
| (6) | Step-up coupon bond, a bond with a coupon that increases (“steps up”), usually at regular intervals, while the bond is outstanding. The rate shown is the coupon as of the end of the reporting period. |
| (7) | Backed by an escrow or trust containing sufficient U.S. Government or U.S. Government agency securities, which ensure the timely payment of principal and interest. |
| (8) | Variable Rate Demand Preferred Shares, net of deferred offering costs as a percentage of Total Investments is 24.0%. |
| (9) | Other assets less liabilities includes the unrealized appreciation (depreciation) of certain over-the-counter (”OTC”) derivatives as presented on the Statement of Assets and Liabilities, when applicable. The unrealized appreciation (depreciation) of OTC cleared and exchange-traded derivatives is recognized as part of cash collateral at brokers and/or the receivable or payable for variation margin as presented on the Statement of Assets and Liabilities, when applicable. |
| 144A | Investment is exempt from registration under Rule 144A of the Securities Act of 1933, as amended. These investments may only be resold in transactions exempt from registration, which are normally those transactions with qualified institutional buyers. |
| AMT | Alternative Minimum Tax |
| ETM | Escrowed to maturity |
| IF | Inverse floating rate security issued by a tender option bond (“TOB”) trust, the interest rate on which varies inversely with the Securities Industry Financial Markets Association (SIFMA) short-term rate, which resets weekly, or a similar short-term rate, and is reduced by the expenses related to the TOB trust. |
| UB | Underlying bond of an inverse floating rate trust reflected as a financing transaction. See Notes to Financial Statements, Note 3 – Portfolio Securities and Investments in Derivatives. Inverse Floating Rate Securities for more information. |
| | See accompanying notes to financial statements. |
56
| | |
| NPN | Nuveen Pennsylvania Municipal Value Fund Portfolio of Investments
February 28, 2019 |
| | | | | | |
Principal | | | Optional Call | | |
Amount (000) | | Description (1) | Provisions (2) | Ratings (3) | Value |
| | | LONG-TERM INVESTMENTS – 101.1% (100.0% of Total Investments) | | | |
| | | MUNICIPAL BONDS – 101.1% (100.0% of Total Investments) | | | |
| | | Consumer Staples – 3.5% (3.5% of Total Investments) | | | |
| $ 485 | | District of Columbia Tobacco Settlement Corporation, Tobacco Settlement Asset-Backed | No Opt. Call | A– | $ 525,822 |
| | | Bonds, Series 2001, 6.500%, 5/15/33 | | | |
| 85 | | Pennsylvania Economic Development Financing Authority, Solid Waste Disposal Revenue | No Opt. Call | AA– | 103,950 |
| | | Bonds, Procter & Gamble Paper Project, Series 2001, 5.375%, 3/01/31 (AMT) | | | |
| 570 | | Total Consumer Staples | | | 629,772 |
| | | Education and Civic Organizations – 7.1% (7.0% of Total Investments) | | | |
| 50 | | Allegheny County Higher Education Building Authority, Pennsylvania, Revenue Bonds, | 10/27 at 100.00 | Baa3 | 53,311 |
| | | Robert Morris University, Series 2017, 5.000%, 10/15/37 | | | |
| 70 | | Bucks County Industrial Development Authority, Pennsylvania, Revenue Bonds, School Lane | 3/27 at 100.00 | BBB– | 74,276 |
| | | Charter School Project, Series 2016, 5.125%, 3/15/36 | | | |
| 20 | | Chester County Industrial Development Authority, Pennsylvania, Avon Grove Charter School | 12/27 at 100.00 | BBB– | 20,542 |
| | | Revenue Bonds, Series 2017A, 5.000%, 12/15/47 | | | |
| 100 | | Cumberland County Municipal Authority, Pennsylvania, Revenue Bonds, Dickinson College | 11/27 at 100.00 | A+ | 112,442 |
| | | Project, Second Series 2017A, 5.000%, 11/01/39 | | | |
| 30 | | Dallas Area Municipal Authority, Pennsylvania, 5.000%, 5/01/48 | 5/29 at 100.00 | Baa3 | 31,111 |
| 30 | | Dallas Area Municipal Authority, Pennsylvania, Revenue Bonds, Misericordia University, | 5/24 at 100.00 | Baa3 | 30,975 |
| | | Series 2014, 5.000%, 5/01/37 | | | |
| 60 | | Erie Higher Education Building Authority, Pennsylvania, Revenue Bonds, Gannon | 11/26 at 100.00 | BBB+ | 56,309 |
| | | University, Series 2016, 4.000%, 5/01/46 | | | |
| 60 | | General Authority of Southcentral Pennsylvania, Revenue Bonds, AICUP Financing | 10/27 at 100.00 | A– | 58,012 |
| | | Program-York College of Pennsylvania, Series 2017 PP4, 3.375%, 11/01/37 | | | |
| | | Huntingdon County General Authority, Pennsylvania, Revenue Bonds, Juniata College, | | | |
| | | Series 2016OO2: | | | |
| 15 | | 3.250%, 5/01/36 | 5/26 at 100.00 | BBB+ | 13,212 |
| 35 | | 3.500%, 5/01/41 | 5/26 at 100.00 | BBB+ | 30,279 |
| 50 | | Montgomery County Higher Education and Health Authority, Pennsylvania, Revenue Bonds, | 9/28 at 100.00 | A+ | 55,297 |
| | | Thomas Jefferson University, Series 2018A, 5.000%, 9/01/48 | | | |
| 90 | | Northampton County General Purpose Authority, Pennsylvania, Revenue Bonds, Lafayette | 11/28 at 100.00 | Aa3 | 93,297 |
| | | College, Refunding Series 2018, 4.000%, 11/01/38 | | | |
| 35 | | Pennsylvania Higher Educational Facilities Authority, Revenue Bonds, Holy Family | 9/23 at 100.00 | BBB– | 37,656 |
| | | University, Series 2013A, 6.500%, 9/01/38 | | | |
| 45 | | Pennsylvania Higher Educational Facilities Authority, Revenue Bonds, Thomas Jefferson | 9/22 at 100.00 | A+ | 48,595 |
| | | University, Series 2012, 5.000%, 3/01/42 | | | |
| | | Pennsylvania Higher Educational Facilities Authority, Revenue Bonds, University of the | | | |
| | | Sciences in Philadelphia, Series 2012: | | | |
| 35 | | 4.000%, 11/01/39 | 11/22 at 100.00 | Baa1 | 35,363 |
| 60 | | 5.000%, 11/01/42 | 11/22 at 100.00 | Baa1 | 64,958 |
| 95 | | Pennsylvania Higher Educational Facilities Authority, Revenue Bonds, Widener University, | 7/23 at 100.00 | A– | 101,376 |
| | | Series 2013A, 5.500%, 7/15/38 | | | |
| 70 | | Philadelphia Authority for Industrial Development, Pennsylvania, Revenue Bonds, La Salle | 11/27 at 100.00 | BBB | 64,191 |
| | | University, Series 2017, 3.625%, 5/01/35 | | | |
| 100 | | Philadelphia Authority for Industrial Development, Pennsylvania, Revenue Bonds, | 6/20 at 100.00 | BB | 103,000 |
| | | Philadelphia Performing Arts Charter School, Series 2013, 6.750%, 6/15/43, 144A | | | |
| 50 | | Philadelphia Authority for Industrial Development, Pennsylvania, Revenue Bonds, | 3/28 at 100.00 | BB+ | 49,425 |
| | | University of the Arts, Series 2017, 5.000%, 3/15/45, 144A | | | |
57
| | | | | | |
NPN | | Nuveen Pennsylvania Municipal Value Fund | | |
| | | Portfolio of Investments (continued) | | | |
| | | February 28, 2019 | | | |
| |
| |
| |
Principal | | | Optional Call | | |
Amount (000) | | Description (1) | Provisions (2) | Ratings (3) | Value |
| | | Education and Civic Organizations (continued) | | | |
| $ 140 | | Washington County Industrial Development Authority, Pennsylvania, College Revenue Bonds, | 11/27 at 100.00 | A– | $ 134,908 |
| | | AICUP Financing Program-Washington and Jefferson College Project, Series 2017-PP5, | | | |
| | | 3.375%, 11/01/36 | | | |
| 1,240 | | Total Education and Civic Organizations | | | 1,268,535 |
| | | Health Care – 18.1% (17.9% of Total Investments) | | | |
| 455 | | Allegheny County Hospital Development Authority, Pennsylvania, Revenue Bonds, Allegheny | 4/28 at 100.00 | A | 450,932 |
| | | Health Network Obligated Group Issue, Series 2018A, 4.000%, 4/01/44 | | | |
| 500 | | Allegheny County Hospital Development Authority, Pennsylvania, Revenue Bonds, University | 8/19 at 100.00 | AA– | 507,790 |
| | | of Pittsburgh Medical Center, Series 2009A, 5.500%, 8/15/34 | | | |
| 265 | | Berks County Industrial Development Authority, Pennsylvania, Health System Revenue | 11/27 at 100.00 | A | 288,447 |
| | | Bonds, Tower Health Project, Series 2017, 5.000%, 11/01/50 | | | |
| 100 | | Centre County Hospital Authority, Pennsylvania, Hospital Revenue Bonds, Mount Nittany | 11/25 at 100.00 | AA– | 108,965 |
| | | Medical Center Project, Series 2016A, 5.000%, 11/15/46 | | | |
| 75 | | Chester County Health and Education Facilities Authority, Pennsylvania, Health System | 10/27 at 100.00 | AA | 78,115 |
| | | Revenue Bonds, Main Line Health System, Series 2017A, 4.000%, 10/01/37 | | | |
| 55 | | Dauphin County General Authority, Pennsylvania, Health System Revenue Bonds, Pinnacle | 6/26 at 100.00 | A+ | 61,353 |
| | | Health System Project, Refunding Series 2016A, 5.000%, 6/01/35 | | | |
| 35 | | Dauphin County General Authority, Pennsylvania, Health System Revenue Bonds, Pinnacle | 6/22 at 100.00 | A+ | 37,327 |
| | | Health System Project, Series 2012A, 5.000%, 6/01/42 | | | |
| 225 | | Doylestown Hospital Authority, Pennsylvania, Hospital Revenue Bonds, Series 2016A, | 7/26 at 100.00 | BBB– | 236,385 |
| | | 5.000%, 7/01/41 | | | |
| 150 | | Dubois Hospital Authority, Pennsylvania, Hospital Revenue Bonds, Penn Highlands | 1/28 at 100.00 | A– | 165,012 |
| | | Healthcare, Series 2018, 5.000%, 7/15/48 | | | |
| 100 | | Lancaster County Hospital Authority, Revenue Bonds, University of Pennsylvania Health | 8/26 at 100.00 | AA | 111,118 |
| | | System, Refunding Series 2016B, 5.000%, 8/15/46 | | | |
| 150 | | Lancaster County Hospital Authority, Revenue Bonds, University of Pennsylvania Health | 8/26 at 100.00 | AA | 168,050 |
| | | System, Series 2016A, 5.000%, 8/15/42 | | | |
| 100 | | Lehigh County General Purpose Authority, Pennsylvania, Revenue Bonds, Good Shepherd | 5/26 at 100.00 | A | 100,059 |
| | | Group, Refunding Series 2016, 4.000%, 11/01/41 | | | |
| 40 | | Lehigh County General Purpose Authority, Pennsylvania, Revenue Bonds, Good Shepherd | 11/22 at 100.00 | A | 40,502 |
| | | Group, Series 2012, 4.000%, 11/01/32 | | | |
| 100 | | Lycoming County Authority, Pennsylvania, Health System Revenue Bonds, Susquehanna Health | 5/26 at 100.00 | AA– | 101,158 |
| | | System Project, Series 2009A, 5.750%, 7/01/39 | | | |
| 200 | | Montgomery County Industrial Development Authority, Pennsylvania, Health System Revenue | 1/25 at 100.00 | Baa3 | 214,998 |
| | | Bonds, Albert Einstein Healthcare Network Issue, Series 2015A, 5.250%, 1/15/45 | | | |
| 145 | | Philadelphia Hospitals and Higher Education Facilities Authority, Pennsylvania, Hospital Revenue | 7/22 at 100.00 | BBB– | 153,793 |
| | | Bonds, Temple University Health System Obligated Group, Series 2012A, 5.625%, 7/01/42 | | | |
| 200 | | Pottsville Hospital Authority, Pennsylvania, Hospital Revenue Bonds, Lehigh Valley Health Network, | 1/27 at 100.00 | A+ | 219,406 |
| | | Series 2016B, 5.000%, 7/01/45 | | | |
| 100 | | The Hospitals and Higher Education Facilities Authority of Philadelphia, Pennsylvania, | 7/27 at 100.00 | BBB– | 110,609 |
| | | Hospital Revenue Bonds, Temple University Health System Obligated Group, | | | |
| | | Series of 2017, 5.000%, 7/01/30 | | | |
| 100 | | West Shore Area Authority, Cumberland County, Pennsylvania, Hospital Revenue Bonds, Holy | 1/22 at 100.00 | AA | 109,954 |
| | | Spirit Hospital of the Sisters of Christian Charity, Series 2011B, 5.750%, 1/01/41 | | | |
| 3,095 | | Total Health Care | | | 3,263,973 |
| | | Housing/Multifamily – 7.3% (7.2% of Total Investments) | | | |
| 15 | | Chester County Industrial Development Authority, Pennsylvania, Student Housing Revenue | 8/23 at 100.00 | Baa3 | 15,496 |
| | | Bonds, University Student Housing, LLC Project at West Chester University Series 2013A, | | | |
| | | 5.000%, 8/01/45 | | | |
| 35 | | Clarion County Industrial Development Authority, Pennsylvania, Revenue Bonds, Clarion | 7/24 at 100.00 | Baa3 | 34,998 |
| | | University Foundation Inc. Student Housing Project at Clarion University, Series 2014A, | | | |
| | | 5.000%, 7/01/45 | | | |
| 30 | | East Hempfield Township Industrial Development Authority, Pennsylvania, Student Services | 7/24 at 100.00 | BBB– | 31,075 |
| | | Inc. – Student Housing Project at Millersville University, Series 2014, 5.000%, 7/01/46 | | | |
58
| | | | | | |
Principal | | | Optional Call | | |
Amount (000) | | Description (1) | Provisions (2) | Ratings (3) | Value |
| | | Housing/Multifamily (continued) | | | |
| $ 100 | | East Hempfield Township Industrial Development Authority, Pennsylvania, Student Services | 7/25 at 100.00 | BBB– | $ 104,116 |
| | | Inc. – Student Housing Project at Millersville University, Series 2015, 5.000%, 7/01/47 | | | |
| 300 | | Pennsylvania Higher Educational Facilities Authority, Revenue Bonds, University | 7/26 at 100.00 | Baa3 | 320,046 |
| | | Properties Inc. Student Housing Project at East Stroudsburg University of Pennsylvania, | | | |
| | | Series 2016A, 5.000%, 7/01/35 | | | |
| 800 | | Pittsburgh Urban Redevelopment Authority, Pennsylvania, Multifamily Housing Revenue | 10/19 at 100.00 | Aa1 | 806,920 |
| | | Bonds, Eva P. Mitchell Residence Project, Series 2009, 5.100%, 10/20/44 | | | |
| 1,280 | | Total Housing/Multifamily | | | 1,312,651 |
| | | Housing/Single Family – 11.3% (11.2% of Total Investments) | | | |
| | | Pennsylvania Housing Finance Agency, Single Family Mortgage Revenue Bonds, Series | | | |
| | | 2012-114: | | | |
| 65 | | 3.300%, 10/01/32 | 10/21 at 100.00 | AA+ | 65,168 |
| 25 | | 3.650%, 10/01/37 | 10/21 at 100.00 | AA+ | 25,100 |
| 40 | | 3.700%, 10/01/42 | 10/21 at 100.00 | AA+ | 39,834 |
| 115 | | Pennsylvania Housing Finance Agency, Single Family Mortgage Revenue Bonds, Series | 10/24 at 100.00 | AA+ | 115,321 |
| | | 2015-116B, 4.000%, 4/01/45 | | | |
| 315 | | Pennsylvania Housing Finance Agency, Single Family Mortgage Revenue Bonds, Series | 4/25 at 100.00 | AA+ | 315,605 |
| | | 2015-118B, 4.100%, 10/01/45 | | | |
| 55 | | Pennsylvania Housing Finance Agency, Single Family Mortgage Revenue Bonds, Series | 4/25 at 100.00 | AA+ | 55,296 |
| | | 2016-119, 3.500%, 10/01/36 | | | |
| 500 | | Pennsylvania Housing Finance Agency, Single Family Mortgage Revenue Bonds, Series | 10/25 at 100.00 | AA+ | 459,455 |
| | | 2016-120, 3.200%, 4/01/40 | | | |
| | | Pennsylvania Housing Finance Agency, Single Family Mortgage Revenue Bonds, Series | | | |
| | | 2016-121: | | | |
| 400 | | 3.200%, 10/01/41 (UB) (4) | 10/25 at 100.00 | AA+ | 374,396 |
| 100 | | 3.200%, 10/01/41 | 10/25 at 100.00 | AA+ | 93,599 |
| | | Pennsylvania Housing Finance Agency, Single Family Mortgage Revenue Bonds, Series | | | |
| | | 2017-123B: | | | |
| 70 | | 3.450%, 10/01/32 | 10/26 at 100.00 | AA+ | 71,149 |
| 75 | | 3.900%, 10/01/37 | 10/26 at 100.00 | AA+ | 76,049 |
| 70 | | 4.000%, 10/01/42 | 10/26 at 100.00 | AA+ | 70,424 |
| 250 | | Pennsylvania Housing Finance Agency, Single Family Mortgage Revenue Bonds, Series | 4/27 at 100.00 | AA+ | 245,340 |
| | | 2017-125B, 3.700%, 10/01/47 | | | |
| 25 | | Pennsylvania Housing Finance Agency, Single Family Mortgage Revenue Bonds, Tender Option | 10/22 at 100.00 | AA+ | 25,459 |
| | | Bond Trust 2015-XF0109, 8.343%, 10/01/31, 144A (IF) (4) | | | |
| 2,105 | | Total Housing/Single Family | | | 2,032,195 |
| | | Long-Term Care – 5.0% (4.9% of Total Investments) | | | |
| 155 | | Berks County Industrial Development Authority, Pennsylvania, Healthcare Facilities | 5/27 at 100.00 | BBB | 163,124 |
| | | Revenue Bonds, Highlands at Wyomissing, Series 2017A, 5.000%, 5/15/42 | | | |
| | | Cumberland County Municipal Authority, Pennsylvania, Revenue Bonds, Diakon Lutheran | | | |
| | | Social Ministries Project, Series 2015: | | | |
| 120 | | 4.000%, 1/01/33 | 1/25 at 100.00 | BBB+ | 120,745 |
| 135 | | 5.000%, 1/01/38 | 1/25 at 100.00 | BBB+ | 142,817 |
| 100 | | Cumberland County Municipal Authority, Pennsylvania, Revenue Bonds, Diakon Lutheran | 1/26 at 100.00 | BBB+ | 110,754 |
| | | Social Ministries Project, Series 2016, 5.000%, 1/01/29 | | | |
| | | Cumberland County Municipal Authority, Pennsylvania, Revenue Bonds, Diakon Lutheran | | | |
| | | Social Ministries Project, Series 2019A: | | | |
| 25 | | 4.125%, 1/01/38 | 1/29 at 100.00 | BBB+ | 24,792 |
| 30 | | 5.000%, 1/01/39 | 1/29 at 100.00 | BBB+ | 32,630 |
| 20 | | Lancaster County Hospital Authority, Pennsylvania, Health Center Revenue Bonds, Masonic | 5/25 at 100.00 | A | 21,724 |
| | | Villages Project, Series 2015, 5.000%, 11/01/35 | | | |
| 55 | | Lancaster Industrial Development Authority, Pennsylvania, Revenue Bonds, Garden Spot | 5/23 at 100.00 | BBB | 59,538 |
| | | Village Project, Series 2013, 5.750%, 5/01/35 | | | |
59
| | | | | | |
NPN | | Nuveen Pennsylvania Municipal Value Fund | | |
| | | Portfolio of Investments (continued) | | | |
| | | February 28, 2019 | | | |
| |
| |
Principal | | | Optional Call | | |
Amount (000) | | Description (1) | Provisions (2) | Ratings (3) | Value |
| | | Long-Term Care (continued) | | | |
| $ 200 | | Montgomery County Industrial Development Authority, Pennsylvania, Revenue Bonds, ACTS | 11/26 at 100.00 | A– | $ 217,006 |
| | | Retirement-Life Communities, Inc. Obligated Group, Series 2016, 5.000%, 11/15/36 | | | |
| 840 | | Total Long-Term Care | | | 893,130 |
| | | Materials – 1.0% (0.9% of Total Investments) | | | |
| 165 | | Pennsylvania Economic Development Financing Authority, Exempt Facilities Revenue Bonds, National | 11/24 at 100.00 | N/R | 171,481 |
| | | Gypsum Company, Refunding Series 2014, 5.500%, 11/01/44 (AMT) | | | |
| | | Tax Obligation/General – 8.0% (8.0% of Total Investments) | | | |
| 170 | | Adams County, Pennsylvania, General Obligation Bonds, Series 2017B, 2.500%, 11/15/29 | 11/25 at 100.00 | Aa2 | 168,648 |
| 220 | | Allegheny County, Pennsylvania, General Obligation Bonds, Series 2013C-72, 5.250%, 12/01/32 | 12/23 at 100.00 | AA– | 249,982 |
| 10 | | Allegheny County, Pennsylvania, General Obligation Bonds, Series C69-C70 of 2012, | 12/22 at 100.00 | AA– | 10,930 |
| | | 5.000%, 12/01/37 | | | |
| 45 | | Boyertown Area School District, Berks and Montgomery Counties, Pennsylvania, General | 4/24 at 100.00 | AA– | 49,930 |
| | | Obligation Bonds, Series 2015, 5.000%, 10/01/38 | | | |
| 115 | | Canon-McMillan School District, Washington County, Pennsylvania, General Obligation | 12/24 at 100.00 | AA | 129,429 |
| | | Bonds, Series 2014D, 5.000%, 12/15/39 | | | |
| 195 | | Lehighton Area School District, Carbon County, Pennsylvania, General Obligation Bonds, | 11/23 at 100.00 | AA | 214,982 |
| | | Limited Tax Series 2015A, 5.000%, 11/15/43 – BAM Insured | | | |
| 15 | | Pittsburgh School District, Allegheny County, Pennsylvania, General Obligation Bonds, | 9/22 at 100.00 | AA | 16,563 |
| | | Series 2014A, 5.000%, 9/01/25 – BAM Insured | | | |
| 400 | | Pittsburgh, Pennsylvania, General Obligation Bonds, Series 2012B, 5.000%, 9/01/26 | 9/22 at 100.00 | AA– | 440,384 |
| 20 | | Radnor Township School District, Delaware County, Pennsylvania, General Obligation | 8/19 at 100.00 | Aa1 | 19,885 |
| | | Bonds, Series 2012, 3.000%, 2/15/34 | | | |
| 35 | | Rostraver Township, Westmoreland County, Pennsylvania, General Obligation Bonds, Series | 9/25 at 100.00 | AA | 35,554 |
| | | 2018, 3.500%, 9/01/34 – AGM Insured | | | |
| 80 | | Scranton, Lackawanna County, Pennsylvania, General Obligation Notes, Series 2016, | 5/24 at 100.00 | BB+ | 84,710 |
| | | 5.000%, 11/15/32 | | | |
| | | The Redevelopment Authority of the City of Scranton, Lackawanna county, Pennsylvania, | | | |
| | | Guaranteed Lease Revenue Bonds, Series 2016A: | | | |
| 15 | | 5.000%, 11/15/21 | No Opt. Call | BB+ | 15,352 |
| 10 | | 5.000%, 11/15/28 | 5/24 at 100.00 | BB+ | 10,099 |
| 1,330 | | Total Tax Obligation/General | | | 1,446,448 |
| | | Tax Obligation/Limited – 5.4% (5.4% of Total Investments) | | | |
| 25 | | Allentown Neighborhood Improvement Zone Development Authority, Pennsylvania, Tax | 5/22 at 100.00 | Baa3 | 25,842 |
| | | Revenue Bonds, Series 2012A, 5.000%, 5/01/35 | | | |
| 230 | | Allentown Neighborhood Improvement Zone Development Authority, Pennsylvania, Tax Revenue | 5/27 at 100.00 | Ba3 | 245,368 |
| | | Bonds, City Center Refunding Project, Series 2017, 5.000%, 5/01/42, 144A | | | |
| | | Commonwealth Financing Authority, Pennsylvania, State Appropriation Lease Bonds, Master | | | |
| | | Settlement, Series 2018: | | | |
| 35 | | 5.000%, 6/01/33 | 6/28 at 100.00 | A1 | 39,931 |
| 15 | | 4.000%, 6/01/39 – AGM Insured | 6/28 at 100.00 | AA | 15,379 |
| 200 | | 4.000%, 6/01/39 – AGM Insured (UB) (4) | 6/28 at 100.00 | AA | 205,048 |
| 120 | | Government of Guam, Business Privilege Tax Bonds, Series 2011A, 5.250%, 1/01/36 | 1/22 at 100.00 | BB | 125,321 |
| 100 | | Monroe County Industrial Development Authority, Pennsylvania, Special Obligation Revenue | 7/24 at 100.00 | N/R | 100,450 |
| | | Bonds, Tobyhanna Township Project, Series 2014, 6.875%, 7/01/33, 144A | | | |
| 100 | | Pennsylvania Turnpike Commission, Motor License Fund-Enhanced Turnpike Subordinate | 12/26 at 100.00 | AA– | 96,547 |
| | | Special Revenue Bonds, Series 2014A, 0.000%, 12/01/37 (5) | | | |
| 100 | | Pennsylvania Turnpike Commission, Oil Franchise Tax Revenue Bonds, Subordinate Series | 12/28 at 100.00 | A+ | 111,231 |
| | | 2018B, 5.000%, 12/01/48 | | | |
| 15 | | Washington County Redevelopment Authority, Pennsylvania, Tanger Outlet Victory Center | 1/28 at 100.00 | BB | 15,213 |
| | | Tax Increment Bonds, Series 2018, 5.000%, 7/01/35 | | | |
| 940 | | Total Tax Obligation/Limited | | | 980,330 |
60
| | | | | | |
Principal | | | Optional Call | | |
Amount (000) | | Description (1) | Provisions (2) | Ratings (3) | Value |
| | | Transportation – 8.4% (8.3% of Total Investments) | | | |
| $ 245 | | Delaware River Joint Toll Bridge Commission, New Jersey and Pennsylvania, Bridge System | 7/27 at 100.00 | A1 | $ 277,967 |
| | | Revenue Bonds, Series 2017, 5.000%, 7/01/42 | | | |
| 125 | | Delaware River Port Authority, New Jersey and Pennsylvania, Revenue Bonds, Series 2018A, | 1/29 at 100.00 | A+ | 146,146 |
| | | 5.000%, 1/01/38 | | | |
| 140 | | Pennsylvania Economic Development Financing Authority, Parking System Revenue Bonds, | 1/24 at 100.00 | AA | 152,071 |
| | | Capitol Region Parking System, Series 2013A, 5.250%, 1/01/44 – AGM Insured | | | |
| 175 | | Pennsylvania Economic Development Financing Authority, Private Activity Revenue Bonds, | 6/26 at 100.00 | BBB | 187,504 |
| | | Pennsylvania Rapid Bridge Replacement Project, Series 2015, 5.000%, 6/30/42 (AMT) | | | |
| 585 | | Pennsylvania Turnpike Commission, Turnpike Revenue Bonds, Series 2015B, 5.000%, 12/01/45 | 12/25 at 100.00 | A1 | 641,628 |
| 100 | | Pittsburgh and Allegheny County Sports and Exhibition Authority, Pennsylvania, Parking | 12/27 at 100.00 | A | 113,160 |
| | | Revenue Bonds, Series 2017, 5.000%, 12/15/34 | | | |
| 1,370 | | Total Transportation | | | 1,518,476 |
| | | U.S. Guaranteed – 19.0% (18.8% of Total Investments) (6) | | | |
| 175 | | Bucks County Water and Sewer Authority, Pennsylvania, Revenue Bonds, Tender Option Bond | 12/21 at 100.00 | AA | 222,682 |
| | | Trust 2015-XF0123, 11.015%, 12/01/29 (Pre-refunded 12/01/21) – AGM Insured, 144A (IF) (4) | | | |
| 240 | | Delaware River Port Authority, New Jersey and Pennsylvania, Revenue Bonds, Series | 1/20 at 100.00 | A+ | 246,756 |
| | | 2010E, 5.000%, 1/01/40 (Pre-refunded 1/01/20) | | | |
| 550 | | Guam Government, Limited Obligation Section 30 Revenue Bonds, Series 2009A, 5.750%, | 12/19 at 100.00 | N/R | 567,160 |
| | | 12/01/34 (Pre-refunded 12/01/19) | | | |
| 5 | | Montgomery County Higher Education and Health Authority, Pennsylvania, Hospital Revenue | 6/19 at 100.00 | A+ | 5,042 |
| | | Bonds, Abington Memorial Hospital Obligated Group, Series 2009A, 5.125%, 6/01/33 | | | |
| | | (Pre-refunded 6/01/19) | | | |
| 500 | | Montgomery County Industrial Development Authority, Pennsylvania, Revenue Bonds, ACTS | 11/19 at 100.00 | A– | 515,865 |
| | | Retirement-Life Communities, Inc. Obligated Group, Series 2009A-1, 6.250%, 11/15/29 | | | |
| | | (Pre-refunded 11/15/19) | | | |
| 265 | | Pennsylvania Economic Development Financing Authority, Health System Revenue Bonds , | 10/19 at 100.00 | N/R | 272,195 |
| | | Albert Einstein Healthcare, Series 2009A, 6.250%, 10/15/23 (Pre-refunded 10/15/19) | | | |
| 50 | | Pennsylvania Higher Educational Facilities Authority, Revenue Bonds, Edinboro University | 7/20 at 100.00 | N/R | 52,790 |
| | | Foundation Student Housing Project, Series 2010, 6.000%, 7/01/43 (Pre-refunded 7/01/20) | | | |
| 120 | | Pennsylvania Higher Educational Facilities Authority, Revenue Bonds, Philadelphia | 6/23 at 100.00 | N/R | 136,031 |
| | | University, Refunding Series 2013, 5.000%, 6/01/32 (Pre-refunded 6/01/23) | | | |
| | | Pennsylvania Turnpike Commission, Motor License Fund-Enhanced Turnpike Special Revenue | | | |
| | | Bonds, Subordinate Series 2010A1&2: | | | |
| 110 | | 5.500%, 12/01/34 (Pre-refunded 12/01/20) | 12/20 at 100.00 | N/R | 117,297 |
| 480 | | 5.500%, 12/01/34 (Pre-refunded 12/01/20) | 12/20 at 100.00 | AA– | 511,843 |
| 100 | | 5.000%, 12/01/38 (Pre-refunded 12/01/19) | 12/19 at 100.00 | AA– | 102,494 |
| 55 | | Pennsylvania Turnpike Commission, Turnpike Revenue Bonds, Subordinate Lien, Refunding | 12/19 at 100.00 | A | 56,372 |
| | | Series 2010B-1, 5.000%, 12/01/37 (Pre-refunded 12/01/19) | | | |
| 390 | | Saint Mary Hospital Authority, Pennsylvania, Health System Revenue Bonds, Catholic | 5/19 at 100.00 | AA– | 393,604 |
| | | Health East, Series 2009D, 6.250%, 11/15/34 (Pre-refunded 5/15/19) | | | |
| 100 | | West Shore Area Authority, Cumberland County, Pennsylvania, Hospital Revenue Bonds, Holy | 1/21 at 100.00 | AA | 108,271 |
| | | Spirit Hospital of the Sisters of Christian Charity Project, Series 2011, 6.250%, 1/01/31 | | | |
| | | (Pre-refunded 1/01/21) | | | |
| 100 | | Wilkes-Barre Finance Authority, Pennsylvania, Revenue Bonds, University of Scranton, | 11/20 at 100.00 | A– | 105,591 |
| | | Series 2010, 5.000%, 11/01/40 (Pre-refunded 11/01/20) | | | |
| 3,240 | | Total U.S. Guaranteed | | | 3,413,993 |
| | | Utilities – 5.4% (5.4% of Total Investments) | | | |
| 140 | | Beaver County Industrial Development Authority, Pennsylvania, Pollution Control Revenue | No Opt. Call | N/R | 121,800 |
| | | Bonds, FirstEnergy Nuclear Generation Project, Refunding Series 2005A, 4.000%, 1/01/35 | | | |
| | | (Mandatory Put 7/01/21) (7) | | | |
| 250 | | Beaver County Industrial Development Authority, Pennsylvania, Pollution Control Revenue | No Opt. Call | N/R | 217,500 |
| | | Refunding Bonds, FirstEnergy Nuclear Generation Project, Series 2006B, 3.500%, 12/01/35 | | | |
| | | (Mandatory Put 6/01/20) (7) | | | |
61
| | | | | | |
NPN | | Nuveen Pennsylvania Municipal Value Fund | | |
| | | Portfolio of Investments (continued) | | | |
| | | February 28, 2019 | | | |
| |
| |
| |
Principal | | | Optional Call | | |
Amount (000) | | Description (1) | Provisions (2) | Ratings (3) | Value |
| | | Utilities (continued) | | | |
| $ 10 | | Beaver County Industrial Development Authority, Pennsylvania, Pollution Control Revenue | No Opt. Call | N/R | $ 8,700 |
| | | Refunding Bonds, FirstEnergy Nuclear Generation Project, Series 2008A, 2.700%, 4/01/35 (7) | | | |
| 170 | | Delaware County Industrial Development Authority, Pennsylvania, Revenue Bonds, Covanta | 7/20 at 100.00 | BB– | 171,266 |
| | | Project, Refunding Series 2015A, 5.000%, 7/01/43 | | | |
| 55 | | Pennsylvania Economic Development Financing Authority, Exempt Facilities Revenue Bonds, | No Opt. Call | N/R | 47,850 |
| | | Shippingport Project, First Energy Guarantor., Series 2006A, 2.550%, 11/01/41 (Mandatory | | | |
| | | Put 12/03/18) (7) | | | |
| 100 | | Pennsylvania Economic Development Financing Authority, Exempt Facilities Revenue | 9/25 at 100.00 | B+ | 101,055 |
| | | Refunding Bonds, PPL Energy Supply, LLC Project, Series 2009A, 6.400%, 12/01/38 | | | |
| 150 | | Philadelphia Gas Works, Pennsylvania, Revenue Bonds, General Ordinance, Fifteenth Series | 8/27 at 100.00 | A | 165,167 |
| | | 2017, 5.000%, 8/01/47 | | | |
| 125 | | Philadelphia Gas Works, Pennsylvania, Revenue Bonds, Refunding Thirteenth Series 2015, | 8/25 at 100.00 | A | 142,741 |
| | | 5.000%, 8/01/30 | | | |
| 1,000 | | Total Utilities | | | 976,079 |
| | | Water and Sewer – 1.6% (1.5% of Total Investments) | | | |
| 200 | | Lehigh County Authority, Pennsylvania, Water and Sewer Revenue Bonds, Allentown | 12/23 at 100.00 | A | 221,478 |
| | | Concession, Series 2013A, 5.125%, 12/01/47 | | | |
| 60 | | Robinson Township Municipal Authority, Allegheny County, Pennsylvania, Water and Sewer | 11/19 at 100.00 | AA | 60,114 |
| | | Revenue Bonds, Series 2014, 4.000%, 5/15/40 | | | |
| 260 | | Total Water and Sewer | | | 281,592 |
| $ 17,435 | | Total Long-Term Investments (cost $17,667,469) | | | 18,188,655 |
| | | Floating Rate Obligations – (2.5)% | | | (450,000) |
| | | Other Assets Less Liabilities – 1.4% (8) | | | 246,657 |
| | | Net Asset Applicable to Common Shares – 100% | | | $ 17,985,312 |
Investments in Derivatives
Futures Contracts
| | | | | | | | |
Description | Contract Position | Number of Contracts | Expiration Date | Notional Amount | Value | Unrealized Appreciation (Depreciation) | Variation Margin Receivable/ (Payable) |
| U.S. Treasury 10-Year Note | Short | (2) | 6/19 | $(245,134) | $(244,000) | $1,134 | $438 |
62
| | |
| (1) | All percentages shown in the Portfolio of Investments are based on net assets applicable to common shares unless otherwise noted. |
| (2) | Optional Call Provisions: Dates (month and year) and prices of the earliest optional call or redemption. There may be other call provisions at varying prices at later dates. Certain mortgage-backed securities may be subject to periodic principal paydowns. Optional Call Provisions are not covered by the report of independent registered public accounting firm. |
| (3) | For financial reporting purposes, the ratings disclosed are the highest of Standard & Poor’s Group (“Standard & Poor’s”), Moody’s Investors Service, Inc. (“Moody’s”) or Fitch, Inc. (“Fitch”) rating. This treatment of split-rated securities may differ from that used for other purposes, such as for Fund investment policies. Ratings below BBB by Standard & Poor’s, Baa by Moody’s or BBB by Fitch are considered to be below investment grade. Holdings designated N/R are not rated by any of these national rating agencies. Ratings are not covered by the report of independent registered public accounting firm. |
| (4) | Investment, or portion of investment, has been pledged to collateralize the net payment obligations for investments in inverse floating rate transactions. |
| (5) | Step-up coupon bond, a bond with a coupon that increases (“steps up”), usually at regular intervals, while the bond is outstanding. The rate shown is the coupon as of the end of the reporting period. |
| (6) | Backed by an escrow or trust containing sufficient U.S. Government or U.S. Government agency securities, which ensure the timely payment of principal and interest. |
| (7) | As of, or subsequent to, the end of the reporting period, this security is non-income producing. Non-income producing, in the case of a fixed-income security, generally denotes that the issuer has (1) defaulted on the payment of principal or interest, (2) is under the protection of the Federal Bankruptcy Court or (3) the Fund’s Adviser has concluded that the issue is not likely to meet its future interest payment obligations and has ceased accruing additional income on the Fund’s records. |
| (8) | Other assets less liabilities includes the unrealized appreciation (depreciation) of certain over-the-counter (”OTC”) derivatives as presented on the Statement of Assets and Liabilities, when applicable. The unrealized appreciation (depreciation) of OTC cleared and exchange-traded derivatives is recognized as part of cash collateral at brokers and/or the receivable or payable for variation margin as presented on the Statement of Assets and Liabilities, when applicable. |
| 144A | Investment is exempt from registration under Rule 144A of the Securities Act of 1933, as amended. These investments may only be resold in transactions exempt from registration, which are normally those transactions with qualified institutional buyers. |
| AMT | Alternative Minimum Tax |
| IF | Inverse floating rate security issued by a tender option bond (“TOB”) trust, the interest rate on which varies inversely with the Securities Industry Financial Markets Association (SIFMA) short-term rate, which resets weekly, or a similar short-term rate, and is reduced by the expenses related to the TOB trust. |
| UB | Underlying bond of an inverse floating rate trust reflected as a financing transaction. See Notes to Financial Statements, Note 3 – Portfolio Securities and Investments in Derivatives. Inverse Floating Rate Securities for more information. |
| | See accompanying notes to financial statements. |
63
Statement of Assets and Liabilities
February 28, 2019
| | | | | | | | | | | | | |
| | | NXJ | | | NJV | | | NQP | | | NPN | |
Assets | | | | | | | | | | | | |
| Long-term investments, at value (cost $919,559,816, $22,572,926, | | | | | | | | | | | | |
| $869,729,598 and $17,667,469, respectively) | | $ | 968,386,043 | | | $ | 23,296,549 | | | $ | 901,539,986 | | | $ | 18,188,655 | |
| Short-term investments, at value (cost approximates value) | | | 1,350,000 | | | | 150,000 | | | | — | | | | — | |
| Cash | | | 588,592 | | | | 87,507 | | | | 2,017,835 | | | | 88,638 | |
Cash collateral at brokers for investments in futures contracts(1) | | | — | | | | 13,277 | | | | 520,837 | | | | 2,294 | |
Cash collateral at brokers for investments in swaps(1) | | | 400,254 | | | | — | | | | — | | | | — | |
| Interest rate swaps premiums paid | | | 479 | | | | — | | | | — | | | | — | |
| Receivable for: | | | | | | | | | | | | | | | | |
| Interest | | | 9,876,203 | | | | 265,131 | | | | 10,160,004 | | | | 226,480 | |
| Investments sold | | | 1,157,388 | | | | — | | | | 299,680 | | | | 24,936 | |
| Variation margin on futures contracts | | | — | | | | 2,109 | | | | 91,656 | | | | 438 | |
| Variation margin on swap contracts | | | 21,077 | | | | — | | | | — | | | | — | |
| Other assets | | | 137,272 | | | | 260 | | | | 127,387 | | | | 230 | |
| Total assets | | | 981,917,308 | | | | 23,814,833 | | | | 914,757,385 | | | | 18,531,671 | |
Liabilities | | | | | | | | | | | | | | | | |
| Floating rate obligations | | | 20,065,000 | | | | 830,000 | | | | 135,390,000 | | | | 450,000 | |
| Payable for: | | | | | | | | | | | | | | | | |
| Dividends | | | 2,048,328 | | | | 67,583 | | | | 1,600,543 | | | | 48,245 | |
| Investments purchased | | | 3,690,000 | | | | 190,000 | | | | — | | | | — | |
| Variable Rate Demand Preferred (“VRDP”) Shares, net of deferred offering | | | | | | | | | | | | | | | | |
| costs (liquidation preference $313,900,000, $—, $217,500,000 and | | | | | | | | | | | | | | | | |
| $—, respectively) | | | 312,440,063 | | | | — | | | | 216,682,253 | | | | — | |
| Accrued expenses: | | | | | | | | | | | | | | | | |
| Management fees | | | 445,591 | | | | 10,645 | | | | 398,926 | | | | 8,056 | |
| Trustees fees | | | 129,209 | | | | 113 | | | | 122,251 | | | | 89 | |
| Other | | | 137,787 | | | | 40,689 | | | | 168,794 | | | | 39,969 | |
| Total liabilities | | | 338,955,978 | | | | 1,139,030 | | | | 354,362,767 | | | | 546,359 | |
| Net assets applicable to common shares | | $ | 642,961,330 | | | $ | 22,675,803 | | | $ | 560,394,618 | | | $ | 17,985,312 | |
| Common shares outstanding | | | 41,508,279 | | | | 1,530,856 | | | | 37,383,341 | | | | 1,219,074 | |
| Net asset value (“NAV”) per common share outstanding | | $ | 15.49 | | | $ | 14.81 | | | $ | 14.99 | | | $ | 14.75 | |
Net assets applicable to common shares consist of: | | | | | | | | | | | | | | | | |
| Common shares, $0.01 par value per share | | $ | 415,083 | | | $ | 15,309 | | | $ | 373,833 | | | $ | 12,191 | |
| Paid-in-surplus | | | 592,298,294 | | | | 21,905,922 | | | | 528,845,719 | | | | 17,446,482 | |
| Total distributable earnings | | | 50,247,953 | | | | 754,572 | | | | 31,175,066 | | | | 526,639 | |
| Net assets applicable to common shares | | $ | 642,961,330 | | | $ | 22,675,803 | | | $ | 560,394,618 | | | $ | 17,985,312 | |
| Authorized shares: | | | | | | | | | | | | | | | | |
| Common | | Unlimited | | | Unlimited | | | Unlimited | | | Unlimited | |
| Preferred | | Unlimited | | | | N/A | | | Unlimited | | | | N/A | |
(1) Cash pledged to collateralize the net payment obligations for investments in derivatives. | |
N/A — Fund is not authorized to issue Preferred Shares. | |
See accompanying notes to financial statements.
64
| | | | | |
| Statement of Operations | | | |
| |
| Year Ended February 28, 2019 | | | | |
| |
| |
| |
| | |
| | | NXJ | | | NJV | | | NQP | | | NPN | |
Investment Income | | $ | 41,355,291 | | | $ | 1,074,842 | | | $ | 36,614,178 | | | $ | 797,156 | |
Expenses | | | | | | | | | | | | | | | | |
| Management fees | | | 5,822,611 | | | | 143,021 | | | | 5,175,774 | | | | 105,058 | |
| Interest expense and amortization of offering costs | | | 7,283,675 | | | | 30,021 | | | | 7,887,830 | | | | 7,056 | |
| Custodian fees | | | 113,422 | | | | 17,869 | | | | 105,020 | | | | 16,694 | |
| Trustees fees | | | 28,475 | | | | 683 | | | | 24,672 | | | | 531 | |
| Professional fees | | | 249,196 | | | | 23,265 | | | | 25,768 | | | | 23,061 | |
| Shareholder reporting expenses | | | 65,223 | | | | 12,641 | | | | 69,092 | | | | 11,828 | |
| Shareholder servicing agent fees | | | 22,182 | | | | 262 | | | | 46,518 | | | | 220 | |
| Stock exchange listing fees | | | 11,758 | | | | 6,508 | | | | 10,435 | | | | 6,800 | |
| Investor relations expenses | | | 18,353 | | | | 1,089 | | | | 16,017 | | | | 1,028 | |
| Other | | | 80,446 | | | | 11,887 | | | | 106,314 | | | | 11,489 | |
| Total expenses | | | 13,695,341 | | | | 247,246 | | | | 13,467,440 | | | | 183,765 | |
| Net investment income (loss) | | | 27,659,950 | | | | 827,596 | | | | 23,146,738 | | | | 613,391 | |
Realized and Unrealized Gain (Loss) | | | | | | | | | | | | | | | | |
| Net realized gain (loss) from: | | | | | | | | | | | | | | | | |
| Investments | | | 7,263,592 | | | | 437,861 | | | | 384,135 | | | | 46,552 | |
| Futures contracts | | | — | | | | (8,966 | ) | | | (978,971 | ) | | | (788 | ) |
| Swaps | | | 5,370 | | | | (900 | ) | | | 660,566 | | | | — | |
| Change in net unrealized appreciation (depreciation) of: | | | | | | | | | | | | | | | | |
| Investments | | | (990,582 | ) | | | (470,302 | ) | | | 11,151,561 | | | | 39,967 | |
| Futures contracts | | | — | | | | 4,355 | | | | 269,417 | | | | 1,134 | |
| Swaps | | | (259,758 | ) | | | — | | | | (968,985 | ) | | | — | |
| Net realized and unrealized gain (loss) | | | 6,018,622 | | | | (37,952 | ) | | | 10,517,723 | | | | 86,865 | |
| Net increase (decrease) in net assets applicable to common shares | | | | | | | | | | | | | | | | |
| from operations | | $ | 33,678,572 | | | $ | 789,644 | | | $ | 33,664,461 | | | $ | 700,256 | |
See accompanying notes to financial statements.
65
Statement of Changes in Net Assets
| | | | | | | | | | | | | |
| | | NXJ | | | NJV | |
| | | Year | | | Year(1) | | | Year | | | Year(1) | |
| | | Ended | | | Ended | | | Ended | | | Ended | |
| | | 2/28/19 | | | 2/28/18 | | | 2/28/19 | | | 2/28/18 | |
Operations | | | | | | | | | | | | |
| Net investment income (loss) | | $ | 27,659,950 | | | $ | 30,307,036 | | | $ | 827,596 | | | $ | 881,233 | |
| Net realized gain (loss) from: | | | | | | | | | | | | | | | | |
| Investments | | | 7,263,592 | | | | (348,769 | ) | | | 437,861 | | | | 145,010 | |
| Futures contracts | | | — | | | | — | | | | (8,966 | ) | | | — | |
| Swaps | | | 5,370 | | | | 1,369,000 | | | | (900 | ) | | | — | |
| Change in net unrealized appreciation | | | | | | | | | | | | | | | | |
| (depreciation) of: | | | | | | | | | | | | | | | | |
| Investments | | | (990,582 | ) | | | 6,872,993 | | | | (470,302 | ) | | | (214,984 | ) |
| Futures contracts | | | — | | | | — | | | | 4,355 | | | | — | |
| Swaps | | | (259,758 | ) | | | (1,720,413 | ) | | | — | | | | — | |
| Net increase (decrease) in net assets | | | | | | | | | | | | | | | | |
| applicable to common shares | | | | | | | | | | | | | | | | |
| from operations | | | 33,678,572 | | | | 36,479,847 | | | | 789,644 | | | | 811,259 | |
Distributions to Common Shareholders(2) | | | | | | | | | | | | | | | | |
Dividends(3) | | | (31,162,872 | ) | | | (29,752,332 | ) | | | (1,364,370 | ) | | | (1,441,986 | ) |
| Decrease in net assets applicable to | | | | | | | | | | | | | | | | |
| common shares from distributions | | | | | | | | | | | | | | | | |
| to common shareholders | | | (31,162,872 | ) | | | (29,752,332 | ) | | | (1,364,370 | ) | | | (1,441,986 | ) |
Capital Share Transactions | | | | | | | | | | | | | | | | |
| Common shares: | | | | | | | | | | | | | | | | |
| Net proceeds from shares issued to | | | | | | | | | | | | | | | | |
| shareholders due to reinvestment | | | | | | | | | | | | | | | | |
| of distributions | | | — | | | | — | | | | — | | | | 2,200 | |
| Cost of shares repurchased | | | | | | | | | | | | | | | | |
| and retired | | | (13,238,385 | ) | | | (669,274 | ) | | | (259,677 | ) | | | — | |
| Net increase (decrease) in net assets | | | | | | | | | | | | | | | | |
| applicable to common shares from | | | | | | | | | | | | | | | | |
| capital share transactions | | | (13,238,385 | ) | | | (669,274 | ) | | | (259,677 | ) | | | 2,200 | |
| Net increase (decrease) in net assets | | | | | | | | | | | | | | | | |
| applicable to common shares | | | (10,722,685 | ) | | | 6,058,241 | | | | (834,403 | ) | | | (628,527 | ) |
| Net assets applicable to common | | | | | | | | | | | | | | | | |
| shares at the beginning of period | | | 653,684,015 | | | | 647,625,774 | | | | 23,510,206 | | | | 24,138,733 | |
| Net assets applicable to common | | | | | | | | | | | | | | | | |
| shares at the end of period | | $ | 642,961,330 | | | $ | 653,684,015 | | | $ | 22,675,803 | | | $ | 23,510,206 | |
(1) | Prior period amounts have been conformed to current year presentation. See Notes to Financial Statements, Note 9 – New Accounting Pronouncements for further details. |
(2) | The composition and per share amounts of the Funds’ distributions are presented in the Financial Highlights. The distribution information for the Funds as of its most recent tax year end is presented within the Notes to Financial Statements, Note 6 – Income Tax Information. |
(3) | For the fiscal year ended February 28, 2018, NXJ’s distributions to shareholders were paid from net investment income, while NJV’s, NQP's and NPN's distributions were paid from net investment income and accumulated net realized gains. |
See accompanying notes to financial statements.
66
| | | | | | | | | | | | | |
| | | NQP | | | NPN | |
| | | Year | | | Year(1) | | | Year | | | Year(1) | |
| | | Ended | | | Ended | | | Ended | | | Ended | |
| | | 2/28/19 | | | 2/28/18 | | | 2/28/19 | | | 2/28/18 | |
Operations | | | | | | | | | | | | |
| Net investment income (loss) | | $ | 23,146,738 | | | $ | 25,968,448 | | | $ | 613,391 | | | $ | 671,345 | |
| Net realized gain (loss) from: | | | | | | | | | | | | | | | | |
| Investments | | | 384,135 | | | | 953,724 | | | | 46,552 | | | | 159,795 | |
| Futures contracts | | | (978,971 | ) | | | — | | | | (788 | ) | | | — | |
| Swaps | | | 660,566 | | | | 1,066,000 | | | | — | | | | — | |
| Change in net unrealized appreciation | | | | | | | | | | | | | | | | |
| (depreciation) of: | | | | | | | | | | | | | | | | |
| Investments | | | 11,151,561 | | | | (4,563,430 | ) | | | 39,967 | | | | (351,563 | ) |
| Futures contracts | | | 269,417 | | | | — | | | | 1,134 | | | | — | |
| Swaps | | | (968,985 | ) | | | (362,007 | ) | | | — | | | | — | |
| Net increase (decrease) in net assets | | | | | | | | | | | | | | | | |
| applicable to common shares | | | | | | | | | | | | | | | | |
| from operations | | | 33,664,461 | | | | 23,062,735 | | | | 700,256 | | | | 479,577 | |
Distributions to Common Shareholders(2) | | | | | | | | | | | | | | | | |
Dividends(3) | | | (23,963,196 | ) | | | (26,144,401 | ) | | | (739,771 | ) | | | (946,866 | ) |
| Decrease in net assets applicable to | | | | | | | | | | | | | | | | |
| common shares from distributions | | | | | | | | | | | | | | | | |
| to common shareholders | | | (23,963,196 | ) | | | (26,144,401 | ) | | | (739,771 | ) | | | (946,866 | ) |
Capital Share Transactions | | | | | | | | | | | | | | | | |
| Common shares: | | | | | | | | | | | | | | | | |
| Net proceeds from shares issued to | | | | | | | | | | | | | | | | |
| shareholders due to reinvestment | | | | | | | | | | | | | | | | |
| of distributions | | | — | | | | — | | | | 1,486 | | | | 16,262 | |
| Cost of shares repurchased | | | | | | | | | | | | | | | | |
| and retired | | | (4,400,970 | ) | | | (196,781 | ) | | | (42,989 | ) | | | — | |
| Net increase (decrease) in net assets | | | | | | | | | | | | | | | | |
| applicable to common shares from | | | | | | | | | | | | | | | | |
| capital share transactions | | | (4,400,970 | ) | | | (196,781 | ) | | | (41,503 | ) | | | 16,262 | |
| Net increase (decrease) in net assets | | | | | | | | | | | | | | | | |
| applicable to common shares | | | 5,300,295 | | | | (3,278,447 | ) | | | (81,018 | ) | | | (451,027 | ) |
| Net assets applicable to common | | | | | | | | | | | | | | | | |
| shares at the beginning of period | | | 555,094,323 | | | | 558,372,770 | | | | 18,066,330 | | | | 18,517,357 | |
| Net assets applicable to common | | | | | | | | | | | | | | | | |
| shares at the end of period | | $ | 560,394,618 | | | $ | 555,094,323 | | | $ | 17,985,312 | | | $ | 18,066,330 | |
(1) | Prior period amounts have been conformed to current year presentation. See Notes to Financial Statements, Note 9 – New Accounting Pronouncements for further details. |
(2) | The composition and per share amounts of the Funds’ distributions are presented in the Financial Highlights. The distribution information for the Funds as of its most recent tax year end is presented within the Notes to Financial Statements, Note 6 – Income Tax Information. |
(3) | For the fiscal year ended February 28, 2018, NXJ’s distributions to shareholders were paid from net investment income, while NJV’s, NQP's and NPN's distributions were paid from net investment income and accumulated net realized gains. |
See accompanying notes to financial statements.
67
| | | |
| Statement of Cash Flows | | |
| |
| Year Ended February 28, 2019 | | |
| |
| |
| |
| | |
| | | NXJ | | | NQP | |
Cash Flows from Operating Activities: | | | | | | |
Net Increase (Decrease) in Net Assets Applicable to Common Shares from Operations | | $ | 33,678,572 | | | $ | 33,664,461 | |
| Adjustments to reconcile the net increase (decrease) in net assets applicable to common shares from | | | | | | | | |
| operations to net cash provided by (used in) operating activities: | | | | | | | | |
| Purchases of investments | | | (157,350,444 | ) | | | (75,240,815 | ) |
| Proceeds from sales and maturities of investments | | | 159,332,626 | | | | 78,335,777 | |
| Proceeds from (Purchase of) short-term investments, net | | | (1,350,000 | ) | | | — | |
| Premiums received (paid) for interest rate swaps | | | (479 | ) | | | — | |
| Taxes paid | | | (41 | ) | | | (46,144 | ) |
| Amortization (Accretion) of premiums and discounts, net | | | 1,145,044 | | | | 3,261,276 | |
| Amortization of deferred offering costs | | | 60,284 | | | | 45,450 | |
| (Increase) Decrease in: | | | | | | | | |
| Receivable for interest | | | 173,749 | | | | 433,822 | |
| Receivable for investments sold | | | 794,239 | | | | 12,596,568 | |
| Receivable for variation margin on futures contracts | | | — | | | | (91,656 | ) |
| Receivable for variation margin on swap contracts | | | (21,077 | ) | | | — | |
| Other assets | | | 2,519 | | | | 3,042 | |
| Increase (Decrease) in: | | | | | | | | |
| Payable for interest | | | — | | | | (131,310 | ) |
| Payable for investments purchased | | | 3,690,000 | | | | (11,804,356 | ) |
| Accrued management fees | | | (4,914 | ) | | | (380 | ) |
| Accrued Trustees fees | | | (12,936 | ) | | | (12,760 | ) |
| Accrued other expenses | | | (93,922 | ) | | | (217,663 | ) |
| Net realized (gain) loss from investments | | | (7,263,592 | ) | | | (384,135 | ) |
| Change in net unrealized (appreciation) depreciation of: | | | | | | | | |
| Investments | | | 990,582 | | | | (11,151,561 | ) |
Swaps(1) | | | — | | | | 968,985 | |
| Net cash provided by (used in) operating activities | | | 33,770,210 | | | | 30,228,601 | |
Cash Flows from Financing Activities | | | | | | | | |
| Proceeds from borrowings | | | 24,587,156 | | | | 5,771,427 | |
| Repayments of borrowings | | | (24,587,156 | ) | | | (5,771,427 | ) |
| (Payments for) VMTP Shares redeemed, at liquidation preference | | | — | | | | (87,000,000 | ) |
| Increase (Decrease) in floating rate obligations | | | 11,060,000 | | | | 87,565,000 | |
| Cash distributions paid to common shareholders | | | (31,288,109 | ) | | | (24,172,567 | ) |
| Cost of common shares repurchased and retired | | | (13,238,385 | ) | | | (4,400,970 | ) |
| Net cash provided by (used in) financing activities | | | (33,466,494 | ) | | | (28,008,537 | ) |
Net Increase (Decrease) in Cash and Cash Collateral at Brokers | | | 303,716 | | | | 2,220,064 | |
| Cash and cash collateral at brokers at the beginning of period | | | 685,130 | | | | 318,608 | |
| Cash and cash collateral at brokers at the end of period | | $ | 988,846 | | | $ | 2,538,672 | |
(1) Excluding over-the-counter cleared swaps. | |
| | |
Supplemental Disclosure of Cash Flow Information | | NXJ | | | NQP | |
| Cash paid for interest (excluding amortization of offering costs) | | $ | 7,250,046 | | | $ | 7,982,501 | |
See accompanying notes to financial statements.
68
THIS PAGE INTENTIONALLY LEFT BLANK
69
| |
| Financial Highlights |
| |
| |
| |
| |
| Selected data for a common share outstanding throughout each period: |
| |
| |
| | |
| | | | | | Investment Operations | | | Less Distributions to Common Shareholders | | | Common Share | |
| | | Beginning Common Share NAV | | | Net Investment Income (Loss) | | | Net Realized/ Unrealized Gain (Loss) | | | Total | | | From Net Investment Income | | | From Accumulated Net Realized Gains | | | Total | | | Discount Per Share Repurchased and Retired | | | Ending NAV | | | Ending Share Price | |
NXJ | | | | | | | | | | | | | | | | | | | | | | | | | | | | | | |
Year Ended 2/28-2/29: | | | | | | | | | | | | | |
| 2019 | | $ | 15.37 | | | $ | 0.66 | | | $ | 0.14 | | | $ | 0.80 | | | $ | (0.66 | ) | | $ | (0.08 | ) | | $ | (0.74 | ) | | $ | 0.06 | | | $ | 15.49 | | | $ | 13.47 | |
| 2018 | | | 15.21 | | | | 0.71 | | | | 0.15 | | | | 0.86 | | | | (0.70 | ) | | | — | | | | (0.70 | ) | | | — | * | | | 15.37 | | | | 13.10 | |
| 2017(e) | | | 16.18 | | | | 0.60 | | | | (0.94 | ) | | | (0.34 | ) | | | (0.63 | ) | | | — | | | | (0.63 | ) | | | — | | | | 15.21 | | | | 13.42 | |
| Year Ended 4/30: | | | | | | | | | | | | | | | | | | | | | | | | | | | | | | | | | | | | | | | | |
| 2016 | | | 15.53 | | | | 0.79 | | | | 0.66 | | | | 1.45 | | | | (0.82 | ) | | | (0.01 | ) | | | (0.83 | ) | | | 0.03 | | | | 16.18 | | | | 14.66 | |
| 2015 | | | 15.28 | | | | 0.67 | | | | 0.34 | | | | 1.01 | | | | (0.77 | ) | | | — | | | | (0.77 | ) | | | 0.01 | | | | 15.53 | | | | 13.58 | |
| 2014 | | | 16.12 | | | | 0.71 | | | | (0.87 | ) | | | (0.16 | ) | | | (0.68 | ) | | | — | | | | (0.68 | ) | | | — | * | | | 15.28 | | | | 13.64 | |
| | |
NJV | | | | | | | | | | | | | | | | | | | | | | | | | | | | | | | | | | | | | | | | |
Year Ended 2/28-2/29: | | | | | | | | | | | | | | | | | |
| 2019 | | | 15.15 | | | | 0.54 | | | | (0.02 | ) | | | 0.52 | | | | (0.55 | ) | | | (0.34 | ) | | | (0.89 | ) | | | 0.03 | | | | 14.81 | | | | 13.08 | |
| 2018 | | | 15.56 | | | | 0.57 | | | | (0.05 | ) | | | 0.52 | | | | (0.58 | ) | | | (0.35 | ) | | | (0.93 | ) | | | — | | | | 15.15 | | | | 13.55 | |
| 2017(e) | | | 16.32 | | | | 0.49 | | | | (0.58 | ) | | | (0.09 | ) | | | (0.52 | ) | | | (0.15 | ) | | | (0.67 | ) | | | — | | | | 15.56 | | | | 15.61 | |
| Year Ended 4/30: | | | | | | | | | | | | | | | | | | | | | | | | | | | | | | | | | | | | | | | | |
| 2016 | | | 16.41 | | | | 0.62 | | | | 0.11 | | | | 0.73 | | | | (0.61 | ) | | | (0.21 | ) | | | (0.82 | ) | | | — | | | | 16.32 | | | | 15.16 | |
| 2015 | | | 16.15 | | | | 0.62 | | | | 0.43 | | | | 1.05 | | | | (0.63 | ) | | | (0.18 | ) | | | (0.81 | ) | | | 0.02 | | | | 16.41 | | | | 14.75 | |
| 2014 | | | 16.98 | | | | 0.65 | | | | (0.66 | ) | | | (0.01 | ) | | | (0.63 | ) | | | (0.19 | ) | | | (0.82 | ) | | | — | | | | 16.15 | | | | 14.48 | |
| (a) | Total Return Based on Common Share NAV is the combination of changes in common share NAV, reinvested dividend income at NAV and reinvested capital gains distributions at NAV, if any. The last dividend declared in the period, which is typically paid on the first business day of the following month, is assumed to be reinvested at the ending NAV. The actual reinvest price for the last dividend declared in the period may often be based on the Fund’s market price (and not its NAV), and therefore may be different from the price used in the calculation. Total returns are not annualized. |
| | Total Return Based on Common Share Price is the combination of changes in the market price per share and the effect of reinvested dividend income and reinvested capital gains distributions, if any, at the average price paid per share at the time of reinvestment. The last dividend declared in the period, which is typically paid on the first business day of the following month, is assumed to be reinvested at the ending market price. The actual reinvestment for the last dividend declared in the period may take place over several days, and in some instances may not be based on the market price, so the actual reinvestment price may be different from the price used in the calculation. Total returns are not annualized. |
70
| | | | | | | | | | | | | | | | | |
| | | | | | | Common Share Supplemental Data/ Ratios Applicable to Common Shares | |
Common Share Total Returns | | | | | | Ratios to Average Net Assets(b) | | | | |
| | |
| | |
| | | | Based | | | Ending | | | | | | | | | | |
Based | | | on | | | Net | | | | | | Net | | | Portfolio | |
on | | | Share | | | Assets | | | | | | Investment | | | Turnover | |
NAV(a) | | | Price(a) | | | | (000) | | | Expenses(c) | | | Income (Loss) | | | Rate(d) | |
| | |
| | |
| | 5.77 | % | | | 8.86 | % | | $ | 642,961 | | | | 2.13 | % | | | 4.30 | % | | | 16 | % |
| | 5.66 | | | | 2.74 | | | | 653,684 | | | | 1.78 | | | | 4.55 | | | | 11 | |
| | (2.20 | ) | | | (4.35 | ) | | | 647,626 | | | | 1.76 | ** | | | 4.54 | ** | | | 12 | |
| | |
| | 9.85 | | | | 14.79 | | | | 688,971 | | | | 1.56 | | | | 5.12 | | | | 14 | |
| | 6.77 | | | | 5.35 | | | | 668,670 | | | | 1.71 | | | | 4.64 | | | | 14 | |
| | (0.71 | ) | | | (3.78 | ) | | | 100,181 | | | | 2.07 | | | | 4.83 | | | | 6 | |
| | |
| | |
| | |
| | 3.73 | | | | 3.39 | | | | 22,676 | | | | 1.07 | | | | 3.58 | | | | 24 | |
| | 3.31 | | | | (7.48 | ) | | | 23,510 | | | | 1.03 | | | | 3.63 | | | | 16 | |
| | (0.57 | ) | | | 7.39 | | | | 24,139 | | | | 0.96 | ** | | | 3.62 | ** | | | 14 | |
| | |
| | 4.57 | | | | 8.70 | | | | 25,297 | | | | 0.89 | | | | 3.87 | | | | 8 | |
| | 6.68 | | | | 7.62 | | | | 25,430 | | | | 0.87 | | | | 3.75 | | | | 13 | |
| | 0.25 | | | | (4.18 | ) | | | 25,272 | | | | 0.88 | | | | 4.12 | | | | 12 | |
| (b) | Net Investment Income (Loss) ratios reflect income earned and expenses incurred on assets attributable to preferred shares issued by the Fund, where applicable. |
| (c) | The expense ratios reflect, among other things, all interest expense and other costs related to preferred shares (as described in Note 4 – Fund Shares, Preferred Shares) and/or the interest expense deemed to have been paid by the Fund on the floating rate certificates issued by the special purpose trusts for the self-deposited inverse floaters held by the Fund (as described in Note 3 – Portfolio Securities and Investments in Derivatives, Inverse Floating Rate Securities), where applicable, as follows: |
| | | | | |
NXJ | | | NJV | |
| Year Ended 2/28-2/29: | | | Year Ended 2/28-2/29: | |
| 2019 | 1.13% | | 2019 | 0.13% |
| 2018 | 0.80 | | 2018 | 0.09 |
| 2017(e) | 0.79** | | 2017(e) | 0.07** |
| Year Ended 4/30: | | | Year Ended 4/30: | |
| 2016 | 0.57 | | 2016 | 0.04 |
| 2015 | 0.60 | | 2015 | 0.04 |
| 2014 | 0.98 | | 2014 | 0.04 |
| (d) | Portfolio Turnover Rate is calculated based on the lesser of long-term purchases or sales (as disclosed in Note 5 – Investment Transactions) divided by the average long-term market value during the period. |
| (e) | For the ten months ended February 28, 2017. |
| * | Rounds to less than $0.01 per share. |
| ** | Annualized. |
See accompanying notes to financial statements.
71
| |
| Financial Highlights (continued) |
| |
| |
| |
| |
| Selected data for a common share outstanding throughout each period: |
| |
| |
| | |
| | | | | | Investment Operations | | | Less Distributions to Common Shareholders | | | Common Share | |
| | | Beginning Common Share NAV | | | Net Investment Income (Loss) | | | Net Realized/ Unrealized Gain (Loss) | | | Total | | | From Net Investment Income | | | From Accumulated Net Realized Gains | | | Total | | | Discount Per Share Repurchased and Retired | | | Ending NAV | | | Ending Share Price | |
NQP | | | | | | | | | | | | | | | | | | | | | | | | | | | | | | |
Year Ended 2/28-2/29: | | | | | | | | | | |
| 2019 | | $ | 14.71 | | | $ | 0.62 | | | $ | 0.27 | | | $ | 0.89 | | | $ | (0.59 | ) | | $ | (0.04 | ) | | $ | (0.63 | ) | | $ | 0.02 | | | $ | 14.99 | | | $ | 13.02 | |
| 2018 | | | 14.79 | | | | 0.69 | | | | (0.08 | ) | | | 0.61 | | | | (0.69 | ) | | | — | *** | | | (0.69 | ) | | | — | * | | | 14.71 | | | | 12.52 | |
| 2017(e) | | | 16.08 | | | | 0.60 | | | | (1.24 | ) | | | (0.64 | ) | | | (0.62 | ) | | | (0.03 | ) | | | (0.65 | ) | | | — | | | | 14.79 | | | | 13.30 | |
Year Ended 4/30: | | | | | | | | | | | | | |
| 2016 | | | 15.64 | | | | 0.80 | | | | 0.46 | | | | 1.26 | | | | (0.83 | ) | | | — | | | | (0.83 | ) | | | 0.01 | | | | 16.08 | | | | 14.91 | |
| 2015 | | | 15.17 | | | | 0.81 | | | | 0.50 | | | | 1.31 | | | | (0.84 | ) | | | — | | | | (0.84 | ) | | | — | * | | | 15.64 | | | | 13.87 | |
| 2014 | | | 16.21 | | | | 0.74 | | | | (0.93 | ) | | | (0.19 | ) | | | (0.85 | ) | | | — | | | | (0.85 | ) | | | — | * | | | 15.17 | | | | 13.76 | |
| | |
NPN | | | | | | | | | | | | | | | | | | | | | | | | | | | | | | | | | | | | | | | | |
Year Ended 2/28-2/29: | | | | | |
| 2019 | | | 14.78 | | | | 0.50 | | | | 0.06 | | | | 0.56 | | | | (0.50 | ) | | | (0.10 | ) | | | (0.60 | ) | | | 0.01 | | | | 14.75 | | | | 13.19 | |
| 2018 | | | 15.16 | | | | 0.55 | | | | (0.16 | ) | | | 0.39 | | | | (0.58 | ) | | | (0.19 | ) | | | (0.77 | ) | | | — | | | | 14.78 | | | | 15.15 | |
| 2017(e) | | | 16.50 | | | | 0.51 | | | | (0.73 | ) | | | (0.22 | ) | | | (0.64 | ) | | | (0.48 | ) | | | (1.12 | ) | | | — | | | | 15.16 | | | | 15.83 | |
Year Ended 4/30: | | | | | | | | | |
| 2016 | | | 16.36 | | | | 0.68 | | | | 0.09 | | | | 0.77 | | | | (0.63 | ) | | | — | | | | (0.63 | ) | | | — | | | | 16.50 | | | | 16.45 | |
| 2015 | | | 15.91 | | | | 0.67 | | | | 0.41 | | | | 1.08 | | | | (0.63 | ) | | | — | | | | (0.63 | ) | | | — | | | | 16.36 | | | | 15.57 | |
| 2014 | | | 16.48 | | | | 0.67 | | | | (0.56 | ) | | | 0.11 | | | | (0.64 | ) | | | (0.04 | ) | | | (0.68 | ) | | | — | | | | 15.91 | | | | 14.45 | |
| (a) | Total Return Based on Common Share NAV is the combination of changes in common share NAV, reinvested dividend income at NAV and reinvested capital gains distributions at NAV, if any. The last dividend declared in the period, which is typically paid on the first business day of the following month, is assumed to be reinvested at the ending NAV. The actual reinvest price for the last dividend declared in the period may often be based on the Fund’s market price (and not its NAV), and therefore may be different from the price used in the calculation. Total returns are not annualized. |
| | Total Return Based on Common Share Price is the combination of changes in the market price per share and the effect of reinvested dividend income and reinvested capital gains distributions, if any, at the average price paid per share at the time of reinvestment. The last dividend declared in the period, which is typically paid on the first business day of the following month, is assumed to be reinvested at the ending market price. The actual reinvestment for the last dividend declared in the period may take place over several days, and in some instances may not be based on the market price, so the actual reinvestment price may be different from the price used in the calculation. Total returns are not annualized. |
72
| | | | | | | | | | | | | | | | | |
| | | | | | | Common Share Supplemental Data/ Ratios Applicable to Common Shares | |
Common Share Total Returns | | | | | | Ratios to Average Net Assets(b) | | | | |
| | |
| | |
| | | | Based | | | Ending | | | | | | | | | | |
Based | | | on | | | Net | | | | | | Net | | | Portfolio | |
on | | | Share | | | Assets | | | | | | Investment | | | Turnover | |
NAV(a) | | | Price(a) | | | | (000) | | | Expenses(c) | | | Income (Loss) | | | Rate(d) | |
| | |
| | |
| | 6.40 | % | | | 9.41 | % | | $ | 560,395 | | | | 2.44 | % | | | 4.19 | % | | | 8 | % |
| | 4.12 | | | | (0.85 | ) | | | 555,094 | | | | 2.05 | | | | 4.56 | | | | 12 | |
| | (4.19 | ) | | | (6.66 | ) | | | 558,373 | | | | 1.87 | ** | | | 4.57 | ** | | | 16 | |
| | |
| | 8.46 | | | | 14.21 | | | | 607,240 | | | | 1.51 | | | | 5.13 | | | | 16 | |
| | 8.79 | | | | 7.09 | | | | 592,540 | | | | 1.60 | | | | 5.21 | | | | 9 | |
| | (0.69 | ) | | | (3.65 | ) | | | 574,558 | | | | 1.87 | | | | 5.33 | | | | 8 | |
| | |
| | |
| | |
| | 3.99 | | | | (8.87 | ) | | | 17,985 | | | | 1.02 | | | | 3.41 | | | | 10 | |
| | 2.58 | | | | 0.68 | | | | 18,066 | | | | 1.02 | | | | 3.61 | | | | 28 | |
| | (1.33 | ) | | | 3.08 | | | | 18,517 | | | | 0.93 | ** | | | 3.80 | ** | | | 23 | |
| | |
| | 4.82 | | | | 10.09 | | | | 20,118 | | | | 0.85 | | | | 4.17 | | | | 14 | |
| | 6.87 | | | | 12.30 | | | | 19,952 | | | | 0.85 | | | | 4.11 | | | | 5 | |
| | 0.80 | | | | (4.45 | ) | | | 19,401 | | | | 0.85 | | | | 4.28 | | | | 6 | |
| (b) | Net Investment Income (Loss) ratios reflect income earned and expenses incurred on assets attributable to preferred shares issued by the Fund, where applicable. |
| (c) | The expense ratios reflect, among other things, all interest expense and other costs related to preferred shares (as described in Note 4 – Fund Shares, Preferred Shares) and/or the interest expense deemed to have been paid by the Fund on the floating rate certificates issued by the special purpose trusts for the self-deposited inverse floaters held by the Fund (as described in Note 3 – Portfolio Securities and Investments in Derivatives, Inverse Floating Rate Securities), where applicable, as follows: |
| | | | | |
NQP | | | NPN | |
| Year Ended 2/28-2/29: | | | Year Ended 2/28-2/29: | |
| 2019 | 1.43% | | 2019 | 0.04% |
| 2018 | 1.06 | | 2018 | 0.02 |
| 2017(e) | 0.89** | | 2017(e) | 0.01** |
| Year Ended 4/30: | | | Year Ended 4/30: | |
| 2016 | 0.56 | | 2016 | — |
| 2015 | 0.60 | | 2015 | — |
| 2014 | 0.68 | | 2014 | — |
| (d) | Portfolio Turnover Rate is calculated based on the lesser of long-term purchases or sales (as disclosed in Note 5 – Investment Transactions) divided by the average long-term market value during the period. |
| (e) | For the ten months ended February 28, 2017. |
| * | Rounds to less than $0.01 per share. |
| ** | Annualized. |
| *** | Rounds to less than $(0.01) per share. |
See accompanying notes to financial statements.
73
| |
| Financial Highlights (continued) |
| |
| |
| |
| | |
| | | MTP Shares at the End of Period (a) | | | VMTP Shares at the End of Period | | | VRDP Shares at the End of Period | | | MTP, VMTP and/or VRDP Shares at the End of Period | |
| | | Aggregate Amount Outstanding (000) | | | Asset Coverage Per $10 Share | | | Aggregate Amount Outstanding (000) | | | Asset Coverage Per $100,000 Share | | | Aggregate Amount Outstanding (000) | | | Asset Coverage Per $100,000 Share | | | Asset Coverage Per $1 Liquidation Preference | |
NXJ | | | | | | | | | | | | | | | | | | | | | |
| Year Ended 2/28-2/29: | | | | | | | | | | | | | | |
| 2019 | | $ | — | | | $ | — | | | $ | — | | | $ | — | | | $ | 313,900 | | | $ | 304,830 | | | $ | — | |
| 2018 | | | — | | | | — | | | | — | | | | — | | | | 313,900 | | | | 308,246 | | | | — | |
| 2017(b) | | | — | | | | — | | | | — | | | | — | | | | 313,900 | | | | 306,316 | | | | — | |
| Year Ended 4/30: | | | | | | | | | | | | | | | | | | |
| 2016 | | | — | | | | — | | | | — | | | | — | | | | 313,900 | | | | 319,488 | | | | — | |
| 2015 | | | — | | | | — | | | | — | | | | — | | | | 313,900 | | | | 313,020 | | | | — | |
| 2014 | | | — | | | | — | | | | — | | | | — | | | | 45,000 | | | | 322,624 | | | | — | |
| | |
NQP | | | | | | | | | | | | | | | | | | | | | | | | | | | | |
| Year Ended 2/28-2/29: | | | | | | | | | | | | | | | | | | | |
| 2019 | | | — | | | | — | | | | — | | | | — | | | | 217,500 | | | | 357,653 | | | | — | |
| 2018 | | | — | | | | — | | | | 87,000 | | | | 282,297 | | | | 217,500 | | | | 282,297 | | | | 2.82 | |
| 2017(b) | | | — | | | | — | | | | 87,000 | | | | 283,374 | | | | 217,500 | | | | 283,374 | | | | 2.83 | |
| Year Ended 4/30: | | | | | | | | | | | | | | | | | | |
| 2016 | | | — | | | | — | | | | 48,000 | | | | 328,716 | | | | 217,500 | | | | 328,716 | | | | 3.29 | |
| 2015 | | | — | | | | — | | | | 48,000 | | | | 323,179 | | | | 217,500 | | | | 323,179 | | | | 3.23 | |
| 2014 | | | 47,740 | | | | 31.66 | | | | — | | | | — | | | | 217,500 | | | | 316,618 | | | | 3.17 | |
| | |
| (a) | The Ending and Average Market Value Per Share for each Series of the Fund’s MTP Shares were as follows: |
| | |
| | | 2015 | | | 2014 | |
NXJ | | | | | | |
Series 2014 (NXJ PRCCL) | | | | | | |
| Ending Market Value per Share | | $ | — | | | $ | — | |
| Average Market Value per Share | | | — | | | 10.03 | ^ |
Series 2015 (NXJ PRCCL) | | | | | | | | |
| Ending Market Value per Share | | | — | | | | — | |
| Average Market Value per Share | | 10.01 | ^^ | | | — | |
| | |
NQP | | | | | | | | |
Series 2015 (NQP PRCCL) | | | | | | | | |
| Ending Market Value per Share | | | — | | | | 10.05 | |
| Average Market Value per Share | | 10.01 | ΩΩ | | | 10.03 | Ω |
Series 2015 (NQP PRDCL) | | | | | | | | |
| Ending Market Value per Share | | | — | | | | 10.04 | |
| Average Market Value per Share | | 10.02 | ΩΩ | | | 10.03 | Ω |
| (b) | For the ten months ended February 28, 2017. |
| ^ | For the period May 1, 2013 through September 9, 2013. |
| ^^ | For the period November 10, 2014 (effective date of the reorganizations) through February 9, 2015. |
| For the period February 11, 2014 (effective date of the reorganizations) through April 30, 2014. |
| ΩΩ | For the period May 1, 2014 through May 30, 2014. |
See accompanying notes to financial statements.
74
Notes to
Financial Statements
1. General Information and Significant Accounting Policies
General Information
Fund Information
The funds covered in this report and their corresponding New York Stock Exchange (“NYSE”) symbols are as follows (each a “Fund” and collectively, the “Funds”):
| · | Nuveen New Jersey Quality Municipal Income Fund (NXJ) |
| · | Nuveen New Jersey Municipal Value Fund (NJV) |
| · | Nuveen Pennsylvania Quality Municipal Income Fund (NQP) |
| · | Nuveen Pennsylvania Municipal Value Fund (NPN) |
The Funds are registered under the Investment Company Act of 1940 (the “1940 Act”), as amended, as diversified (non-diversified for NJV) closed-end management investment companies. NXJ, NJV, NQP and NPN were organized as Massachusetts business trusts on June 1, 1999, January 26, 2009, December 20, 1990 and January 26, 2009, respectively.
The end of the reporting period for the Funds is February 28, 2019, and the period covered by these Notes to Financial is the fiscal year ended February 28, 2019 (the “current fiscal period”).
Investment Adviser
The Funds’ investment adviser is Nuveen Fund Advisors, LLC (the “Adviser”), a subsidiary of Nuveen, LLC (“Nuveen”). Nuveen is the investment management arm of Teachers Insurance and Annuity Association of America (TIAA). The Adviser has overall responsibility for management of the Funds, oversees the management of the Funds’ portfolios, manages the Funds’ business affairs and provides certain clerical, bookkeeping and other administrative services, and if necessary asset allocation decisions. The Adviser has entered into sub-advisory agreements with Nuveen Asset Management, LLC (the “Sub-Adviser”), a subsidiary of the Adviser, under which the Sub-Adviser manages the investment portfolios of the Funds.
Investment Objectives and Principal Investment Strategies
Each Fund seeks to provide current income exempt from both regular federal and designated state income taxes by investing primarily in a portfolio of municipal obligations issued by state and local government authorities within a single state or certain U.S. territories. Under normal market conditions, each Fund invests at least 80% of the sum of its net assets and the amount of any borrowings for investment purposes in municipal bonds that pay interest that is exempt from regular federal personal income tax and a single state’s personal income tax. The Funds may invest up to 20% in municipal securities that are exempt from regular federal income tax, but not from that single state’s income tax if, in the Sub-Adviser’s judgement, such purchases are expected to enhance the Fund’s after-tax total return potential. To the extent that the Funds invest in bonds of municipal issuers located in other states, each Fund may have income that is not exempt from state personal income tax.
Significant Accounting Policies
Each Fund is an investment company and follows accounting and reporting guidance under Financial Accounting Standards Board (“FASB”) Accounting Standards Codification (ASC) Topic 946, “Financial Services – Investment Companies.” The following is a summary of significant accounting policies followed by the Funds in the preparation of their financial statements in accordance with U.S. generally accepted accounting principles (“U.S. GAAP”).
Investment Transactions
Investment transactions are recorded on a trade date basis. Realized gains and losses from investment transactions are determined on the specific identification method, which is the same basis used for federal income tax purposes. Investments purchased on a when-issued/delayed delivery basis may have extended settlement periods. Any investments so purchased are subject to market fluctuation during this period. The Funds have earmarked securities in their portfolios with a current value at least equal to the amount of the when-issued/delayed delivery purchase commitments.
As of the end of the reporting period, the following Funds’ outstanding when-issued/delayed delivery purchase commitments were as follows:
| | | | | | | |
| | | NXJ | | | NJV | |
| Outstanding when-issued/delayed delivery purchase commitments | | $ | 3,690,000 | | | $ | 190,000 | |
75
Notes to Financial Statements (continued)
Investment Income
Investment income is comprised of interest income, which reflects the amortization of premiums and accretion of discounts for financial reporting purposes, and is recorded on an accrual basis. Investment income also reflects payment-in-kind (“PIK”) interest and paydown gains and losses, if any. PIK interest represents income received in the form of securities in lieu of cash.
Professional Fees
Professional fees presented on the Statement of Operations consist of legal fees incurred in the normal course of operations, audit fees, tax consulting fees and, in some cases, workout expenditures. Workout expenditures are incurred in an attempt to protect or enhance an investment or to pursue other claims or legal actions on behalf of Fund shareholders. If a refund is received for workout expenditures paid in a prior reporting period, such amounts will be recognized as “Legal fee refund” on the Statement of Operations.
Dividends and Distributions to Common Shareholders
Dividends from net investment income, if any, are declared monthly. Net realized capital gains and/or market discount from investment transactions, if any, are distributed to shareholders at least annually. Furthermore, capital gains are distributed only to the extent they exceed available capital loss carryforwards.
Distributions to common shareholders of net investment income, net realized capital gains and/or market discount, if any, are recorded on the ex-dividend date. The amount and timing of distributions are determined in accordance with federal income tax regulations, which may differ from U.S. GAAP.
Compensation
The Funds pay no compensation directly to those of its trustees who are affiliated with the Adviser or to its officers, all of whom receive remuneration for their services to the Funds from the Adviser or its affiliates. The Funds’ Board of Trustees (the “Board”) has adopted a deferred compensation plan for independent trustees that enables trustees to elect to defer receipt of all or a portion of the annual compensation they are entitled to receive from certain Nuveen-advised funds. Under the plan, deferred amounts are treated as though equal dollar amounts had been invested in shares of select Nuveen-advised funds.
Indemnifications
Under the Funds’ organizational documents, their officers and trustees are indemnified against certain liabilities arising out of the performance of their duties to the Funds. In addition, in the normal course of business, the Funds enter into contracts that provide general indemnifications to other parties. The Funds’ maximum exposure under these arrangements is unknown as this would involve future claims that may be made against the Funds that have not yet occurred. However, the Funds have not had prior claims or losses pursuant to these contracts and expect the risk of loss to be remote.
Netting Agreements
In the ordinary course of business, the Funds may enter into transactions subject to enforceable International Swaps and Derivative Association, Inc. (ISDA) master agreements or other similar arrangements (“netting agreements”). Generally, the right to offset in netting agreements allows each Fund to offset certain securities and derivatives with a specific counterparty, when applicable, as well as any collateral received or delivered to that counterparty based on the terms of the agreements. Generally, each Fund manages its cash collateral and securities collateral on a counterparty basis.
The Funds’ investments subject to netting agreements as of the end of the reporting period, if any, are further described in Note 3 – Portfolio Securities and Investments in Derivatives.
Use of Estimates
The preparation of financial statements in conformity with U.S. GAAP requires management to make estimates and assumptions that affect the reported amounts of assets and liabilities at the date of the financial statements and the reported amounts of increases and decreases in net assets applicable to common shares from operations during the current fiscal period. Actual results may differ from those estimates.
2. Investment Valuation and Fair Value Measurements
The fair valuation input levels as described below are for fair value measurement purposes.
Fair value is defined as the price that would be received upon selling an investment or transferring a liability in an orderly transaction to an independent buyer in the principal or most advantageous market for the investment. A three-tier hierarchy is used to maximize the use of observable market data and minimize the use of unobservable inputs and to establish classification of fair value measurements for disclosure purposes. Observable inputs reflect the assumptions market participants would use in pricing the asset or liability. Observable inputs are based on market data obtained from sources independent of the reporting entity. Unobservable inputs reflect the reporting entity’s own assumptions about the assumptions market participants would use in pricing the asset or liability. Unobservable inputs are based on the best information available in the circumstances. The following is a summary of the three-tiered hierarchy of valuation input levels.
Level 1 – Inputs are unadjusted and prices are determined using quoted prices in active markets for identical securities.
76
Level 2 – Prices are determined using other significant observable inputs (including quoted prices for similar securities, interest rates, credit spreads, etc.).
Level 3 – Prices are determined using significant unobservable inputs (including management’s assumptions in determining the fair value of investments).
Prices of fixed income securities are provided by an independent pricing service (“pricing service”) approved by the Board. The pricing service establishes a security’s fair value using methods that may include consideration of the following: yields or prices of investments of comparable quality, type of issue, coupon, maturity and rating, market quotes or indications of value from security dealers, evaluations of anticipated cash flows or collateral, general market conditions and other information and analysis, including the obligor’s credit characteristics considered relevant. These securities are generally classified as Level 2. In pricing certain securities, particularly less liquid and lower quality securities, the pricing service may consider information about a security, its issuer or market activity, provided by the Adviser. These securities are generally classified as Level 2 or Level 3 depending on the observability of the significant inputs.
Prices of swap contracts are also provided by a pricing service approved by the Board using the same methods as described above and are generally classified as Level 2.
Futures contracts are valued using the closing settlement price or, in the absence of such a price, the last traded price and are generally classified as Level 1.
Certain securities may not be able to be priced by the pre-established pricing methods as described above. Such securities may be valued by the Board and/or its appointee at fair value. These securities generally include, but are not limited to, restricted securities (securities which may not be publicly sold without registration under the Securities Act of 1933, as amended) for which a pricing service is unable to provide a market price; securities whose trading has been formally suspended; debt securities that have gone into default and for which there is no current market quotation; a security whose market price is not available from a pre-established pricing source; a security with respect to which an event has occurred that is likely to materially affect the value of the security after the market has closed but before the calculation of a Fund’s net asset value (“NAV”) (as may be the case in non-U.S. markets on which the security is primarily traded) or make it difficult or impossible to obtain a reliable market quotation; and a security whose price, as provided by the pricing service, is not deemed to reflect the security’s fair value. As a general principle, the fair value of a security would appear to be the amount that the owner might reasonably expect to receive for it in a current sale. A variety of factors may be considered in determining the fair value of such securities, which may include consideration of the following: yields or prices of investments of comparable quality, type of issue, coupon, maturity and rating, market quotes or indications of value from security dealers, evaluations of anticipated cash flows or collateral, general market conditions and other information and analysis, including the obligor’s credit characteristics considered relevant. These securities are generally classified as Level 2 or Level 3 depending on the observability of the significant inputs. Regardless of the method employed to value a particular security, all valuations are subject to review by the Board and/or its appointee.
The inputs or methodologies used for valuing securities are not an indication of the risks associated with investing in those securities. The following is a summary of each Fund’s fair value measurements as of the end of the reporting period:
| | | | | | | | | | | | | |
NXJ | | Level 1 | | | Level 2 | | | Level 3 | | | Total | |
| Long-Term Investments*: | | | | | | | | | | | | |
| Municipal Bonds | | $ | — | | | $ | 968,386,043 | | | $ | — | | | $ | 968,386,043 | |
| Short Term Investments*: | | | | | | | | | | | | | | | | |
| Municipal Bonds | | | — | | | | 1,350,000 | | | | — | | | | 1,350,000 | |
| Investments in Derivatives: | | | | | | | | | | | | | | | | |
| Interest Rate Swaps** | | | — | | | | (259,758 | ) | | | — | | | | (259,758 | ) |
| Total | | $ | — | | | $ | 969,476,285 | | | $ | — | | | $ | 969,476,285 | |
| | |
NJV | | | | | | | | | | | | | | | | |
| Long-Term Investments*: | | | | | | | | | | | | | | | | |
| Municipal Bonds | | $ | — | | | $ | 23,296,549 | | | $ | — | | | $ | 23,296,549 | |
| Short-Term Investments*: | | | | | | | | | | | | | | | | |
| Municipal Bonds | | | — | | | | 150,000 | | | | — | | | | 150,000 | |
| Investments in Derivatives: | | | | | | | | | | | | | | | | |
| Futures Contracts** | | | 4,355 | | | | — | | | | — | | | | 4,355 | |
| Total | | $ | 4,355 | | | $ | 23,446,549 | | | $ | — | | | $ | 23,450,904 | |
| | |
NQP | | | | | | | | | | | | | | | | |
| Long-Term Investments*: | | | | | | | | | | | | | | | | |
| Municipal Bonds | | $ | — | | | $ | 901,539,986 | | | $ | — | | | $ | 901,539,986 | |
| Investments in Derivatives: | | | | | | | | | | | | | | | | |
| Futures Contracts** | | | 269,417 | | | | — | | | | — | | | | 269,417 | |
| Total | | $ | 269,417 | | | $ | 901,539,986 | | | $ | — | | | $ | 901,809,403 | |
77
| |
| Notes to Financial Statements (continued) |
| |
| |
| | |
NPN | | | | | | | | | | | | |
| Long-Term Investments*: | | | | | | | | | | | | |
| Municipal Bonds | | $ | — | | | $ | 18,188,655 | | | $ | — | | | $ | 18,188,655 | |
| Investments in Derivatives: | | | | | | | | | | | | | | | | |
| Futures Contracts** | | | 1,134 | | | | — | | | | — | | | | 1,134 | |
| Total | | $ | 1,134 | | | $ | 18,188,655 | | | $ | — | | | $ | 18,189,789 | |
| * | Refer to the Fund’s Portfolio of Investments for industry classifications. |
| ** | Represents net unrealized appreciation (depreciation) as reported in the Fund’s Portfolio of Investments. |
3. Portfolio Securities and Investments in Derivatives
Portfolio Securities
Inverse Floating Rate Securities
Each Fund is authorized to invest in inverse floating rate securities. An inverse floating rate security is created by depositing a municipal bond (referred to as an “Underlying Bond”), typically with a fixed interest rate, into a special purpose tender option bond (“TOB”) trust (referred to as the “TOB Trust”) created by or at the direction of one or more Funds. In turn, the TOB Trust issues (a) floating rate certificates (referred to as “Floaters”) in face amounts equal to some fraction of the Underlying Bond’s par amount or market value, and (b) an inverse floating rate certificate (referred to as an “Inverse Floater”) that represents all remaining or residual interest in the TOB Trust. Floaters typically pay short-term tax-exempt interest rates to third parties who are also provided a right to tender their certificate and receive its par value, which may be paid from the proceeds of a remarketing of the Floaters, by a loan to the TOB Trust from a third party liquidity provider (“Liquidity Provider”), or by the sale of assets from the TOB Trust. The Inverse Floater is issued to a long term investor, such as one or more of the Funds. The income received by the Inverse Floater holder varies inversely with the short-term rate paid to holders of the Floaters, and in most circumstances the Inverse Floater holder bears substantially all of the Underlying Bond’s downside investment risk and also benefits disproportionately from any potential appreciation of the Underlying Bond’s value. The value of an Inverse Floater will be more volatile than that of the Underlying Bond because the interest rate is dependent on not only the fixed coupon rate of the Underlying Bond but also on the short-term interest paid on the Floaters, and because the Inverse Floater essentially bears the risk of loss (and possible gain) of the greater face value of the Underlying Bond.
The Inverse Floater held by a Fund gives the Fund the right to (a) cause the holders of the Floaters to tender their certificates at par (or slightly more than par in certain circumstances), and (b) have the trustee of the TOB Trust (the “Trustee”) transfer the Underlying Bond held by the TOB Trust to the Fund, thereby collapsing the TOB Trust.
The Fund may acquire an Inverse Floater in a transaction where it (a) transfers an Underlying Bond that it owns to a TOB Trust created by a third party or (b) transfers an Underlying Bond that it owns, or that it has purchased in a secondary market transaction for the purpose of creating an Inverse Floater, to a TOB Trust created at its direction, and in return receives the Inverse Floater of the TOB Trust (referred to as a “self-deposited Inverse Floater”). A Fund may also purchase an Inverse Floater in a secondary market transaction from a third party creator of the TOB Trust without first owning the Underlying Bond (referred to as an “externally-deposited Inverse Floater”).
An investment in a self-deposited Inverse Floater is accounted for as a “financing” transaction (i.e., a secured borrowing). For a self-deposited Inverse Floater, the Underlying Bond deposited into the TOB Trust is identified in the Fund’s Portfolio of Investments as “(UB) – Underlying bond of an inverse floating rate trust reflected as a financing transaction,” with the Fund recognizing as liabilities, labeled “Floating rate obligations” on the Statement of Assets and Liabilities, (a) the liquidation value of Floaters issued by the TOB Trust, and (b) the amount of any borrowings by the TOB Trust from a Liquidity Provider to enable the TOB Trust to purchase outstanding Floaters in lieu of a remarketing. In addition, the Fund recognizes in “Investment Income” the entire earnings of the Underlying Bond, and recognizes (a) the interest paid to the holders of the Floaters or on the TOB Trust’s borrowings, and (b) other expenses related to remarketing, administration, trustee, liquidity and other services to a TOB Trust, as a component of “Interest expense and amortization of offering costs” on the Statement of Operations.
In contrast, an investment in an externally-deposited Inverse Floater is accounted for as a purchase of the Inverse Floater and is identified in the Fund’s Portfolio of Investments as “(IF) – Inverse floating rate investment.” For an externally-deposited Inverse Floater, a Fund’s Statement of Assets and Liabilities recognizes the Inverse Floater and not the Underlying Bond as an asset, and the Fund does not recognize the Floaters, or any related borrowings from a Liquidity Provider, as a liability. Additionally, the Fund reflects in “Investment Income” only the net amount of earnings on the Inverse Floater (net of the interest paid to the holders of the Floaters or the Liquidity Provider as lender, and the expenses of the Trust), and does not show the amount of that interest paid or the expenses of the TOB Trust as described above as interest expense on the Statement of Operations.
Fees paid upon the creation of a TOB Trust for self-deposited Inverse Floaters and externally-deposited Inverse Floaters are recognized as part of the cost basis of the Inverse Floater and are capitalized over the term of the TOB Trust.
78
As of the end of the reporting period, the aggregate value of Floaters issued by each Fund’s TOB Trust for self-deposited Inverse Floaters and externally-deposited Inverse Floaters was as follows:
| | | | | | | | | | | | | |
Floating Rate Obligations Outstanding | | NXJ | | | NJV | | | NQP | | | NPN | |
| Floating rate obligations: self-deposited Inverse Floaters | | $ | 20,065,000 | | | $ | 830,000 | | | $ | 135,390,000 | | | $ | 450,000 | |
| Floating rate obligations: externally-deposited Inverse Floaters | | | 87,248,000 | | | | 902,000 | | | | 23,585,000 | | | | 400,000 | |
| Total | | $ | 107,313,000 | | | $ | 1,732,000 | | | $ | 158,975,000 | | | $ | 850,000 | |
During the current fiscal period, the average amount of Floaters (including any borrowings from a Liquidity Provider) outstanding, and the average annual interest rate and fees related to self-deposited Inverse Floaters, were as follows:
| | | | | | | | | | | | | |
Self-Deposited Inverse Floaters | | NXJ | | | NJV | | | NQP | | | NPN | |
| Average floating rate obligations outstanding | | $ | 9,005,000 | | | $ | 1,476,411 | | | $ | 67,479,055 | | | $ | 343,562 | |
| Average annual interest rate and fees | | | 2.03 | % | | | 2.03 | % | | | 2.03 | % | | | 2.05 | % |
TOB Trusts are supported by a liquidity facility provided by a Liquidity Provider pursuant to which the Liquidity Provider agrees, in the event that Floaters are (a) tendered to the Trustee for remarketing and the remarketing does not occur, or (b) subject to mandatory tender pursuant to the terms of the TOB Trust agreement, to either purchase Floaters or to provide the Trustee with an advance from a loan facility to fund the purchase of Floaters by the TOB Trust. In certain circumstances, the Liquidity Provider may otherwise elect to have the Trustee sell the Underlying Bond to retire the Floaters that were tendered and not remarketed prior to providing such a loan. In these circumstances, the Liquidity Provider remains obligated to provide a loan to the extent that the proceeds of the sale of the Underlying Bond is not sufficient to pay the purchase price of the Floaters.
The size of the commitment under the loan facility for a given TOB Trust is at least equal to the balance of that TOB Trust’s outstanding Floaters plus any accrued interest. In consideration of the loan facility, fee schedules are in place and are charged by the Liquidity Provider(s). Any loans made by the Liquidity Provider will be secured by the purchased Floaters held by the TOB Trust. Interest paid on any outstanding loan balances will be effectively borne by the Fund that owns the Inverse Floaters of the TOB Trust that has incurred the borrowing and may be at a rate that is greater than the rate that would have been paid had the Floaters been successfully remarketed.
As described above, any amounts outstanding under a liquidity facility are recognized as a component of “Floating rate obligations” on the Statement of Assets and Liabilities by the Fund holding the corresponding Inverse Floaters issued by the borrowing TOB Trust. As of the end of the reporting period, there were no loans outstanding under any such facility.
Each Fund may also enter into shortfall and forbearance agreements (sometimes referred to as a “recourse arrangement”) (TOB Trusts involving such agreements are referred to herein as “Recourse Trusts”), under which a Fund agrees to reimburse the Liquidity Provider for the Trust’s Floaters, in certain circumstances, for the amount (if any) by which the liquidation value of the Underlying Bond held by the TOB Trust may fall short of the sum of the liquidation value of the Floaters issued by the TOB Trust plus any amounts borrowed by the TOB Trust from the Liquidity Provider, plus any shortfalls in interest cash flows. Under these agreements, a Fund’s potential exposure to losses related to or on an Inverse Floater may increase beyond the value of the Inverse Floater as a Fund may potentially be liable to fulfill all amounts owed to holders of the Floaters or the Liquidity Provider. Any such shortfall amount in the aggregate is recognized as “Unrealized depreciation on Recourse Trusts” on the Statement of Assets and Liabilities.
As of the end of the reporting period, each Fund’s maximum exposure to the Floaters issued by Recourse Trusts for self-deposited Inverse Floaters and externally-deposited Inverse Floaters was as follows:
| | | | | | | | | | | | | |
Floating Rate Obligations — Recourse Trusts | | NXJ | | | NJV | | | NQP | | | NPN | |
| Maximum exposure to Recourse Trusts: self-deposited Inverse Floaters | | $ | 20,065,000 | | | $ | 830,000 | | | $ | 120,390,000 | | | $ | 150,000 | |
| Maximum exposure to Recourse Trusts: externally-deposited Inverse Floaters | | | 78,583,000 | | | | 902,000 | | | | 11,955,000 | | | | 400,000 | |
| Total | | $ | 98,648,000 | | | $ | 1,732,000 | | | $ | 132,345,000 | | | $ | 550,000 | |
Zero Coupon Securities
A zero coupon security does not pay a regular interest coupon to its holders during the life of the security. Income to the holder of the security comes from accretion of the difference between the original purchase price of the security at issuance and the par value of the security at maturity and is effectively paid at maturity. The market prices of zero coupon securities generally are more volatile than the market prices of securities that pay interest periodically.
Investments in Derivatives
In addition to the inverse floating rate securities in which each Fund may invest, which are considered portfolio securities for financial reporting purposes, each Fund is authorized to invest in certain derivative investments such as futures, options and swap contracts. Each Fund limits its
79
Notes to Financial Statements (continued)
investments in futures, options on futures and swap contracts to the extent necessary for the Adviser to claim exclusion from registration by the Commodity Futures Trading Commission as a commodity pool operator with respect to the Fund. The Funds record derivative instruments at fair value, with changes in fair value recognized on the Statement of Operations, when applicable. Even though the Funds’ investments in derivatives may represent economic hedges, they are not considered to be hedge transactions for financial reporting purposes.
Futures Contracts
Upon execution of a futures contract, a Fund is obligated to deposit cash or eligible securities, also known as “initial margin,” into an account at its clearing broker equal to a specified percentage of the contract amount. Cash held by the broker to cover initial margin requirements on open futures contracts, if any, is recognized as “Cash collateral at brokers for investments in futures contracts” on the Statement of Assets and Liabilities. Investments in futures contracts obligate a Fund and the clearing broker to settle monies on a daily basis representing changes in the prior days “mark-to-market” of the open contracts. If a Fund has unrealized appreciation the clearing broker would credit the Fund’s account with an amount equal to appreciation and conversely if a Fund has unrealized depreciation the clearing broker would debit the Fund’s account with an amount equal to depreciation. These daily cash settlements are also known as “variation margin.” Variation margin is recognized as a receivable and/or payable for “Variation margin on futures contracts” on the Statement of Assets and Liabilities.
During the period the futures contract is open, changes in the value of the contract are recognized as an unrealized gain or loss by “marking-to-market” on a daily basis to reflect the changes in market value of the contract, which is recognized as a component of “Change in net unrealized appreciation (depreciation) of futures contracts” on the Statement of Operations. When the contract is closed or expired, a Fund records a realized gain or loss equal to the difference between the value of the contract on the closing date and value of the contract when originally entered into, which is recognized as a component of “Net realized gain (loss) from futures contracts” on the Statement of Operations.
Risks of investments in futures contracts include the possible adverse movement in the price of the securities or indices underlying the contracts, the possibility that there may not be a liquid secondary market for the contracts and/or that a change in the value of the contract may not correlate with a change in the value of the underlying securities or indices.
During the current fiscal period, NJV, NQP and NPN used U.S. Treasury futures as part of an overall portfolio construction strategy to manage portfolio duration and yield curve exposure.
The average notional amount of futures contracts outstanding during the current fiscal period was as follows:
| | | | | | | | | | |
| | | NJV | | | NQP | | | NPN | |
| Average notional amount of futures contracts outstanding* | | $ | 526,012 | | | $ | 18,254,911 | | | $ | 49,027 | |
| * | The average notional amount is calculated based on the absolute aggregate notional amount of contracts outstanding at the beginning of the current fiscal period and at the end of each fiscal quarter within the current fiscal period. |
The following table presents the fair value of all futures contracts held by NJV, NQP and NPN as of the end of the reporting period, the location of these instruments on the Statement of Assets and Liabilities and the primary underlying risk exposure.
| | | | | | | |
| | | Location on the Statement of Assets and Liabilities |
Underlying | Derivative | Asset Derivatives | | (Liability) Derivatives |
Risk Exposure | Instrument | Location | Value | | Location | Value |
NJV | | | | | | |
| Interest rate | Futures contracts | Receivable for | $ 4,355 | | — | $ — |
| variation margin | | | | |
| | | on futures | | | | |
| | | contracts* | | | | |
NQP | | | | | | |
| Interest rate | Futures contracts | Receivable for | $269,417 | | — | $ — |
| | variation margin | | | | |
| | | on futures | | | | |
| | | contracts* | | | | |
NPN | | | | | | |
| Interest rate | Futures contracts | Receivable for | $ 1,134 | | — | $ — |
| | variation margin | | | | |
| | | on futures | | | | |
| | | contracts* | | | | |
| * | Value represents unrealized appreciation (depreciation) of futures contracts as reported in the Fund’s Portfolio of Investments and not the asset and/or liability derivatives location as described in the table above. |
80
The following table presents the amount of net realized gain (loss) and change in net unrealized appreciation (depreciation) recognized on futures contracts on the Statement of Operations during the current fiscal period, and the primary underlying risk exposure.
| | | | | |
| | | | | Change in Net |
| | | | | Unrealized |
| | | | Net Realized | Appreciation |
| | Underlying | Derivative | Gain (Loss) from | (Depreciation) of |
Fund | Risk Exposure | Instrument | Futures Contracts | Futures Contracts |
NJV | Interest rate | Futures contracts | $ (8,966) | $ 4,355 |
NQP | Interest rate | Futures contracts | $(978,971) | $269,417 |
NPN | Interest rate | Futures contracts | $ (788) | $ 1,134 |
Interest Rate Swap Contracts
Interest rate swap contracts involve a Fund’s agreement with the counterparty to pay or receive a fixed rate payment in exchange for the counterparty receiving or paying a variable rate payment. Forward interest rate swap contracts involve a Fund’s agreement with a counterparty to pay, in the future, a fixed or variable rate payment in exchange for the counterparty paying the Fund a variable or fixed rate payment, the accruals for which begin at a specified date in the future (the “effective date”).
The amount of the payment obligation for an interest rate swap is based is based on the notional amount and the termination date of the contract. Interest rate swap contracts do not involve the delivery of securities or other underlying assets or principal. Accordingly, the risk of loss with respect to the swap counterparty on such transactions is limited to the net amount of interest payments that the Fund is to receive.
Interest rate swap contracts are valued daily. Upon entering into an interest rate swap contract (and beginning on the effective date for a forward interest rate swap contract), the Fund accrues the fixed rate payment expected to be paid or received and the variable rate payment expected to be received or paid on the interest rate swap contracts on a daily basis, and recognizes the daily change in the fair value of the Fund’s contractual rights and obligations under the contracts. For an over-the-counter (“OTC”) swap that is not cleared through a clearing house (“OTC Uncleared”), the amount recorded on these transactions is recognized on the Statement of Assets and Liabilities as a component of “Unrealized appreciation or depreciation on interest rate swaps.”
Upon the execution of an OTC swap cleared through a clearing house (“OTC Cleared”), the Fund is obligated to deposit cash or eligible securities, also known as “initial margin,” into an account at its clearing broker equal to a specified percentage of the contract amount. Cash deposited by the Fund to cover initial margin requirements on open swap contracts, if any, is recognized as a component of “Cash collateral at brokers for investments in swaps” on the Statement of Assets and Liabilities. Investments in OTC Cleared swaps obligate the Fund and the clearing broker to settle monies on a daily basis representing changes in the prior day’s “mark-to-market” of the swap contract. If the Fund has unrealized appreciation, the clearing broker will credit the Fund’s account with an amount equal to the appreciation. Conversely, if the Fund has unrealized depreciation, the clearing broker will debit the Fund’s account with an amount equal to the depreciation. These daily cash settlements are also known as “variation margin.” Variation margin for OTC Cleared swaps is recognized as a receivable and/or payable for “Variation margin on swap contracts” on the Statement of Assets and Liabilities. Upon the execution of an OTC Uncleared swap, neither the Fund nor the counterparty is required to deposit initial margin as the trades are recorded bilaterally between both parties to the swap contract, and the terms of the variation margin are subject to a predetermined threshold negotiated by the Fund and the counterparty. Variation margin for OTC Uncleared swaps is recognized as a component of “Unrealized appreciation or depreciation on interest rate swaps” as described in the preceding paragraph.
The net amount of periodic payments settled in cash are recognized as a component of “Net realized gain (loss) from swaps” on the Statement of Operations, in addition to the net realized gain or loss recorded upon the termination of the swap contract. For tax purposes, payments expected to be received or paid on the swap contracts are treated as ordinary income or expense, respectively. Changes in the value of the swap contracts during the fiscal period are recognized as a component of “Change in net unrealized appreciation (depreciation) of swaps” on the Statement of Operations. In certain instances, payments are made or received upon entering into the swap contract to compensate for differences between the stated terms of the swap agreements and prevailing market conditions (credit spreads, currency exchange rates, interest rates, and other relevant factors). Payments received or made at the beginning of the measurement period, if any, are recognized as “Interest rate swaps premiums received and/or paid” on the Statement of Assets and Liabilities.
During the current fiscal period, NXJ, NJV and NQP invested in forward interest rate swap contracts, reducing the Fund’s duration and limiting their vulnerability to rising rates.
The average notional amount of interest rate swap contracts outstanding during the current fiscal period was as follows:
| | | | | | | | | | |
| | | NXJ | | | NJV | | | NQP | |
| Average notional amount of interest rate swap contracts outstanding* | | $ | 7,600,000 | | | $ | — | | | $ | 20,640,000 | |
| * | The average notional amount is calculated based on the outstanding notional at the beginning of the current fiscal period and at the end of each fiscal quarter within the current fiscal period. NJV did not have any interest rate swaps at the beginning of the current fiscal period and at the end of each fiscal quarter within the current fiscal period. |
81
Notes to Financial Statements (continued)
The following table presents the fair value of all swap contracts held by the Funds as of the end of the reporting period, the location of these instruments on the Statement of Assets and Liabilities and the primary underlying risk exposure.
| | | | | | | |
| | | Location on the Statement of Assets and Liabilities |
Underlying | Derivative | Asset Derivatives | | (Liability) Derivatives |
Risk Exposure | Instrument | Location | Value | | Location | Value |
NXJ | | | | | | |
| Interest rate | Swaps (OTC Cleared) | Receivable for variation margin | $(259,758) | | — | $ — |
| | on swap contracts**^ | | | | |
| ** | Value represents unrealized appreciation (depreciation) of swaps as reported in the Fund’s Portfolio of Investments and not the asset and/or liability amount as described in the table above. |
| ^ | Some swap contracts require a counterparty to pay or receive a premium, which is disclosed on the Statement of Assets and Liabilities and is not reflected in the cumulative unrealized appreciation (depreciation) presented above. |
The following table presents the amount of net realized gain (loss) and change in net unrealized appreciation (depreciation) recognized on swap contracts on the Statement of Operations during the current fiscal period, and the primary underlying risk exposure.
| | | | | |
| | | | | Change in Net |
| | | | | Unrealized |
| | | | Net Realized | Appreciation |
| | Underlying | Derivative | Gain (Loss) from | (Depreciation) of |
Fund | Risk Exposure | Instrument | Swaps | Swaps |
NXJ | Interest rate | Swaps | $ 5,370 | $(259,758) |
NJV | Interest rate | Swaps | $ (900) | $ — |
NQP | Interest rate | Swaps | $660,566 | $(968,985) |
Market and Counterparty Credit Risk
In the normal course of business each Fund may invest in financial instruments and enter into financial transactions where risk of potential loss exists due to changes in the market (market risk) or failure of the other party to the transaction to perform (counterparty credit risk). The potential loss could exceed the value of the financial assets recorded on the financial statements. Financial assets, which potentially expose each Fund to counterparty credit risk, consist principally of cash due from counterparties on forward, option and swap transactions, when applicable. The extent of each Fund’s exposure to counterparty credit risk in respect to these financial assets approximates their carrying value as recorded on the Statement of Assets and Liabilities.
Each Fund helps manage counterparty credit risk by entering into agreements only with counterparties the Adviser believes have the financial resources to honor their obligations and by having the Adviser monitor the financial stability of the counterparties. Additionally, counterparties may be required to pledge collateral daily (based on the daily valuation of the financial asset) on behalf of each Fund with a value approximately equal to the amount of any unrealized gain above a pre-determined threshold. Reciprocally, when each Fund has an unrealized loss, the Funds have instructed the custodian to pledge assets of the Funds as collateral with a value approximately equal to the amount of the unrealized loss above a pre-determined threshold. Collateral pledges are monitored and subsequently adjusted if and when the valuations fluctuate, either up or down, by at least the pre-determined threshold amount.
4. Fund Shares
Common Share Transactions
Transactions in common shares during the Funds’ current and prior fiscal period, where applicable, were as follows:
| | | | | | | | | | | | | |
| | | NXJ | | | NJV | |
| | | Year | | | Year | | | Year | | | Year | |
| | | Ended | | | Ended | | | Ended | | | Ended | |
| | | 2/28/19 | | | 2/28/18 | | | 2/28/19 | | | 2/28/18 | |
| Common shares: | | | | | | | | | | | | |
| Issued to shareholders due to reinvestments of distributions | | | — | | | | — | | | | — | | | | 141 | |
| Repurchased and retired | | | (1,026,800 | ) | | | (49,600 | ) | | | (20,501 | ) | | | — | |
| Weighted average common share: | | | | | | | | | | | | | | | | |
| Price per share repurchased and retired | | $ | 12.87 | | | $ | 13.47 | | | $ | 12.65 | | | $ | — | |
| Discount per share repurchased and retired | | | 15.84 | % | | | 14.07 | % | | | 15.16 | % | | | — | % |
82
| | | | | | | | | | | | | |
| | | NQP | | | NPN | |
| | | Year | | | Year | | | Year | | | Year | |
| | | Ended | | | Ended | | | Ended | | | Ended | |
| | | 2/28/19 | | | 2/28/18 | | | 2/28/19 | | | 2/28/18 | |
| Common shares: | | | | | | | | | | | | |
| Issued to shareholders due to reinvestments of distributions | | | — | | | | — | | | | 100 | | | | 1,060 | |
| Repurchased and retired | | | (356,000 | ) | | | (15,500 | ) | | | (3,500 | ) | | | — | |
| Weighted average common share: | | | | | | | | | | | | | | | | |
| Price per share repurchased and retired | | $ | 12.34 | | | $ | 12.68 | | | $ | 12.26 | | | $ | — | |
| Discount per share repurchased and retired | | | 15.54 | % | | | 14.72 | % | | | 15.59 | % | | | — | % |
Preferred Shares
Variable Rate MuniFund Term Preferred Shares
The following Fund had issued and had outstanding Variable Rate MuniFund Term Preferred (“VMTP”) Shares, with a $100,000 liquidation preference per share. VMTP Shares were issued via private placement and were not publicly available.
On December 28, 2018, NQP redeemed all of its outstanding Series 2019 VMTP shares at their $100,000 liquidation preference per share, plus dividend amounts owed, using proceeds from newly created TOB trusts.
The average liquidation preference of VMTP Shares outstanding and annualized dividend rate for the Fund during the current fiscal period were as follows:
| | | | |
| | | NQP* | |
| Average liquidation preference of VMTP Shares outstanding | | $ | 83,543,046 | |
| Annualized dividend rate | | | 2.37 | % |
* For the period March 1, 2018 through December 27, 2018.
VMTP Shares are subject to restrictions on transfer, generally do not trade, and market quotations are generally not available. VMTP Shares are short-term or short/intermediate-term instruments that pay a variable dividend rate tied to a short-term index, plus an additional fixed “spread” amount established at the time of issuance. The fair value of VMTP Shares is expected to be approximately their liquidation preference so long as the fixed “spread” on the VMTP Shares remains roughly in line with the “spread” being demanded by investors on instruments having similar terms in the current market environment. In present market conditions, the Fund’s Adviser has determined that fair value of VMTP Shares is approximately their liquidation preference, but their fair value could vary if market conditions change materially. For financial reporting purposes, the liquidation preference of VMTP Shares is a liability and is recognized as a component of “Variable Rate MuniFund Term Preferred (“VMTP”) Shares, net of deferred offering costs” on the Statement of Assets and Liabilities.
Dividends on the VMTP shares (which are treated as interest payments for financial reporting purposes) are set weekly. Unpaid dividends on VMTP Shares are recognized as a component of “Interest payable” on the Statement of Assets and Liabilities. Dividends accrued on VMTP Shares are recognized as a component of “Interest expense and amortization of offering costs” on the Statement of Operations.
Costs incurred in connection with the Fund’s initial offering of VMTP Shares were recorded as a deferred charges, which were amortized over the life of the shares and are recognized as components of “Variable Rate MuniFund Term Preferred (“VMTP“) Shares, net of deferred offering costs” on the Statement of Assets and Liabilities and “Interest expense and amortization of offering costs” on the Statement of Operations.
In conjunction with NQP’s redemption of VMTP Shares, the remaining deferred cost of $5,225 was fully expensed during the current fiscal period, as the redemption was deemed an extinguishment of debt.
Variable Rate Demand Preferred Shares
The following Funds have issued and have outstanding Variable Rate Demand Preferred (“VRDP”) Shares, with a $100,000 liquidation preference per share. VRDP Shares are issued via private placement and are not publicly available.
As of the end of the reporting period, NXJ and NQP had $312,440,063 and $216,682,253 VRDP Shares at liquidation preference, net of deferred offering costs, respectively. Further details of the Funds’ VRDP Shares outstanding as of the end of the reporting period, were as follows:
| | | | | | |
| | | Shares | Liquidation | Special Rate | |
Fund | Series | Outstanding | Preference | Period Expiration | Maturity |
NXJ | 1 | 810 | $ 81,000,000 | July 24, 2019 | August 3, 2043 |
| | 2 | 1,443 | 144,300,000 | April 1, 2043 | April 1, 2043 |
| | 3 | 886 | 88,600,000 | April 1, 2043 | April 1, 2043 |
NQP | 2 | 1,125 | $112,500,000 | December 1, 2042 | December 1, 2042 |
| | 3 | 1,050 | 105,000,000 | December 1, 2042 | December 1, 2042 |
83
Notes to Financial Statements (continued)
VRDP Shares include a liquidity feature that allows VRDP shareholders to have their shares purchased by a liquidity provider with whom each Fund has contracted in the event that the VRDP Shares are not able to be successfully remarketed. Each Fund is required to redeem any VRDP Shares that are still owned by the liquidity provider after six months of continuous, unsuccessful remarketing. Each Fund pays an annual remarketing fee of 0.10% on the aggregate principal amount of all VRDP Shares outstanding. Each Fund’s VRDP Shares have successfully remarketed since issuance.
All series of NXJ’s and NQP’s VRDP Shares are considered to be Special Rate Period VRDP, which are sold to institutional investors. During the special rate period, the VRDP Shares will not be remarketed by a remarketing agent, be subject to optional or mandatory tender events, or be supported by a liquidity provider. During the special rate period, VRDP dividends will be set monthly as a floating rate based on the predetermined formula. Following the initial special rate period, Special Rate Period VRDP Shares will transition to traditional VRDP Shares with dividends set at weekly remarketings, and be supported by a designated liquidity provider, unless the Board approves a subsequent special rate period.
Dividends on the VRDP Shares (which are treated as interest payments for financial reporting purposes) are set at a rate established by a remarketing agent; therefore, the market value of the VRDP Shares is expected to approximate its liquidation preference. In the event that VRDP Shares are unable to be successfully remarketed, the dividend rate will be the maximum rate which is designed to escalate according to a specified schedule in order to enhance the remarketing agent’s ability to successfully remarket the VRDP Shares.
Subject to certain conditions, VRDP Shares may be redeemed, in whole or in part, at any time at the option of each Fund. Each Fund may also redeem certain of the VRDP Shares if the Fund fails to maintain certain asset coverage requirements and such failures are not cured by the applicable cure date. The redemption price per share is equal to the sum of the liquidation preference per share plus any accumulated but unpaid dividends.
The average liquidation preference of VRDP Shares outstanding and annualized dividend rate for each Fund during the current fiscal period were as follows:
| | | | | | | |
| | | NXJ | | | NQP | |
| Average liquidation preference of VRDP Shares outstanding | | $ | 313,900,000 | | | $ | 217,500,000 | |
| Annualized dividend rate | | | 2.24 | % | | | 2.22 | % |
For financial reporting purposes, the liquidation preference of VRDP Shares is a liability and is recognized as a component of “Variable Rate Demand Preferred (“VRDP”) Shares, net of deferred offering costs” on the Statement of Assets and Liabilities. Unpaid dividends on VRDP Shares are recognized as a component of “Interest payable” on the Statement of Assets and Liabilities, when applicable. Dividends accrued on VRDP Shares are recognized as a component of “Interest expense and amortization of offering costs” on the Statement of Operations. Costs incurred by the Funds in connection with their offerings of VRDP Shares were recorded as a deferred charge, which are amortized over the life of the shares and are recognized as a component of “Variable Rate Demand Preferred (“VRDP”) Shares, net of deferred offering costs” on the Statement of Assets and Liabilities and “Interest expense and amortization of offering costs” on the Statement of Operations. In addition to interest expense, each Fund may also pay a per annum liquidity fee to the liquidity provider, as well as a remarketing fee, which are recognized as “Liquidity fees” and “Remarketing fees,” respectively, on the Statement of Operations, when applicable.
Preferred Share Transactions
Transactions in preferred shares during the Funds’ current and prior fiscal period, were applicable, are noted in the following table.
Transactions in VMTP Shares for the Funds, where applicable, were as follows:
| | | | | | | | |
| | Year Ended | |
| | February 28, 2019 | |
NQP | Series | | Shares | | | Amount | |
| VMTP Shares redeemed | 2019 | | | (870 | ) | | $ | (87,000,000 | ) |
5. Investment Transactions
Long-term purchases and sales (including maturities but excluding derivative transactions, where applicable) during the current fiscal period were as follows:
| | | | | | | | | | | | | |
| | | NXJ | | | NJV | | | NQP | | | NPN | |
| Purchases | | $ | 157,350,444 | | | $ | 5,843,368 | | | $ | 75,240,815 | | | $ | 1,797,820 | |
| Sales and maturities | | | 159,332,626 | | | | 7,271,014 | | | | 78,335,777 | | | | 1,801,533 | |
84
6. Income Tax Information
Each Fund is a separate taxpayer for federal income tax purposes. Each Fund intends to distribute substantially all of its net investment income and net capital gains to shareholders and to otherwise comply with the requirements of Subchapter M of the Internal Revenue Code applicable to regulated investment companies. Therefore, no federal income tax provision is required. Furthermore, each Fund intends to satisfy conditions that will enable interest from municipal securities, which is exempt from regular federal and designated state income taxes, to retain such tax-exempt status when distributed to shareholders of the Funds. Net realized capital gains and ordinary income distributions paid by the Funds are subject to federal taxation.
For all open tax years and all major taxing jurisdictions, management of the Funds has concluded that there are no significant uncertain tax positions that would require recognition in the financial statements. Open tax years are those that are open for examination by taxing authorities (i.e., generally the last four tax year ends and the interim tax period since then). Furthermore, management of the Funds is also not aware of any tax positions for which it is reasonably possible that the total amounts of unrecognized tax benefits will significantly change in the next twelve months.
The following information is presented on an income tax basis. Differences between amounts for financial statement and federal income tax purposes are primarily due to timing differences in recognizing taxable market discount, timing differences in recognizing certain gains and losses on investment transactions and the treatment of investments in inverse floating rate securities reflected as financing transactions, if any. To the extent that differences arise that are permanent in nature, such amounts are reclassified within the capital accounts as detailed below. Temporary differences do not require reclassification. Temporary and permanent differences do not impact the NAVs of the Funds.
The tables below present the cost and unrealized appreciation (depreciation) of each Fund’s investment portfolio, as determined on a federal income tax basis, as of February 28, 2019.
For purposes of this disclosure, derivative tax cost is generally the sum of any upfront fees or premiums exchanged and any amounts unrealized for income statement reporting but realized in income and/or capital gains for tax reporting. If a particular derivative category does not disclose any tax unrealized appreciation or depreciation, the change in value of those derivatives have generally been fully realized for tax purposes.
| | | | | | | | | | | | | |
| | | NXJ | | | NJV | | | NQP | | | NPN | |
| Tax cost of investments | | $ | 899,999,637 | | | $ | 21,888,274 | | | $ | 733,786,198 | | | $ | 17,193,373 | |
| Gross unrealized: | | | | | | | | | | | | | | | | |
| Appreciation | | | 53,043,837 | | | | 866,546 | | | | 41,717,957 | | | | 705,236 | |
| Depreciation | | | (3,372,457 | ) | | | (138,275 | ) | | | (9,354,173 | ) | | | (159,954 | ) |
| Net unrealized appreciation (depreciation) of investments | | $ | 49,671,830 | | | $ | 728,271 | | | $ | 32,363,784 | | | $ | 545,282 | |
| | | | | | | NJV | | | NQP | | | NPN | |
| Tax cost of futures contracts | | | | | | $ | 4,355 | | | $ | 269,417 | | | $ | 1,134 | |
| Net unrealized appreciation (depreciation) of futures contracts | | | | | | | — | | | | — | | | | — | |
| | | | | | | | | | | | | | | NXJ | |
| Tax cost of swaps | | | | | | | | | | | | | | $ | 479 | |
| Net unrealized appreciation (depreciation) of swaps | | | | | | | | | | | | | | | (259,758 | ) |
Permanent differences, primarily due to treatment of notional principal contracts, distribution reallocations, federal taxes paid, taxable market discount and nondeductible offering costs, resulted in reclassifications among the Funds’ components of common share net assets as of February 28, 2019, the Funds’ tax year end.
The tax components of undistributed net tax-exempt income, net ordinary income and net long-term capital gains as of February 28, 2019, the Funds’ tax year end, were as follows:
| | | | | | | | | | | | | |
| | | NXJ | | | NJV | | | NQP | | | NPN | |
Undistributed net tax-exempt income1 | | $ | 2,452,953 | | | $ | 95,190 | | | $ | 1,036,040 | | | $ | 30,730 | |
Undistributed net ordinary income2 | | | 98,796 | | | | — | | | | 49,926 | | | | — | |
| Undistributed net long-term capital gains | | | 546,783 | | | | — | | | | — | | | | — | |
1 | Undistributed net tax-exempt income (on a tax basis) has not been reduced for the dividend declared on February 1, 2019, paid on March 1, 2019. |
2 | Net ordinary income consists of taxable market discount income and net short-term capital gains, if any. |
85
Notes to Financial Statements (continued)
The tax character of distributions paid during the Funds’ tax years ended February 28, 2019 and February 28, 2018 was designated for purposes of the dividends paid deduction as follows:
| | | | | | | | | | | | | |
2019 | | NXJ | | | NJV | | | NQP | | | NPN | |
Distributions from net tax-exempt income3 | | $ | 34,626,101 | | | $ | 809,414 | | | $ | 29,036,822 | | | $ | 616,600 | |
Distributions from net ordinary income2 | | | 546,433 | | | | 40,893 | | | | 134,366 | | | | 2,113 | |
Distributions from net long-term capital gains4 | | | 3,235,811 | | | | 518,863 | | | | 1,655,880 | | | | 127,308 | |
2018 | | NXJ | | | NJV | | | NQP | | | NPN | |
| Distributions from net tax-exempt income | | $ | 34,901,901 | | | $ | 886,594 | | | $ | 31,232,070 | | | $ | 709,942 | |
Distributions from net ordinary income2 | | | 119,237 | | | | 15,669 | | | | 143,468 | | | | 30,136 | |
| Distributions from net long-term capital gains | | | — | | | | 542,044 | | | | 64,183 | | | | 214,679 | |
2 | Net ordinary income consists of taxable market discount income and net short-term capital gains, if any. |
3 | The Funds hereby designate these amounts paid during the fiscal year ended February 28, 2019, as Exempt Interest Dividends. |
4 | The Funds hereby designate as long-term capital gain dividend, pursuant to the Internal Revenue Code Section 852(b)(3), the amount necessary to reduce earnings and profits of the Funds related to net capital gain to zero for the year ended February 28, 2019. |
During the Funds’ tax year ended February 28, 2019, NXJ utilized $3,586,406 of its capital loss carryforward.
The Funds have elected to defer late-year losses in accordance with federal income tax rules. These losses are treated as having arisen on the first day of the following fiscal year. The following Fund has elected to defer losses as follows:
| | | | |
| | | NQP | |
Post-October capital losses5 | | $ | 517,667 | |
Late-year ordinary losses6 | | | — | |
5 | Capital losses incurred from November 1, 2018 through February 28, 2019, the Funds’ tax year end. |
6 | Ordinary losses incurred from January 1, 2019 through February 28, 2019 and/or specified losses incurred from November 1, 2018 through February 28, 2019. |
7. Management Fees and Other Transactions with Affiliates
Management Fees
Each Fund’s management fee compensates the Adviser for overall investment advisory and administrative services and general office facilities. The Sub-Adviser is compensated for its services to the Funds from the management fees paid to the Adviser.
Each Fund’s management fee consists of two components – a fund-level fee, based only on the amount of assets within each individual Fund, and a complex-level fee, based on the aggregate amount of all eligible fund assets managed by the Adviser. This pricing structure enables Fund shareholders to benefit from growth in the assets within their respective Fund as well as from growth in the amount of complex-wide assets managed by the Adviser.
The annual fund-level fee, payable monthly, for each Fund is calculated according to the following schedules:
| | | | |
| | | NXJ | |
| | | NQP | |
Average Daily Managed Assets* | | Fund-Level Fee | |
| For the first $125 million | | | 0.4500 | % |
| For the next $125 million | | | 0.4375 | |
| For the next $250 million | | | 0.4250 | |
| For the next $500 million | | | 0.4125 | |
| For the next $1 billion | | | 0.4000 | |
| For the next $3 billion | | | 0.3750 | |
| For managed assets over $5 billion | | | 0.3625 | |
| | | | | |
| | | NJV | |
| | | NPN | |
Average Daily Net Assets* | | Fund-Level Fee | |
| For the first $125 million | | | 0.4000 | % |
| For the next $125 million | | | 0.3875 | |
| For the next $250 million | | | 0.3750 | |
| For the next $500 million | | | 0.3625 | |
| For the next $1 billion | | | 0.3500 | |
| For the next $3 billion | | | 0.3250 | |
| For managed assets over $5 billion | | | 0.3125 | |
86
The annual complex-level fee, payable monthly, for each Fund is calculated by multiplying the current complex-wide fee rate, determined according to the following schedule by the Fund’s daily managed assets (net assets for NJV and NPN):
| | | | |
Complex-Level Eligible Asset Breakpoint Level* | | Effective Complex-Level Fee Rate at Breakpoint Level | |
| $55 billion | | | 0.2000 | % |
| $56 billion | | | 0.1996 | |
| $57 billion | | | 0.1989 | |
| $60 billion | | | 0.1961 | |
| $63 billion | | | 0.1931 | |
| $66 billion | | | 0.1900 | |
| $71 billion | | | 0.1851 | |
| $76 billion | | | 0.1806 | |
| $80 billion | | | 0.1773 | |
| $91 billion | | | 0.1691 | |
| $125 billion | | | 0.1599 | |
| $200 billion | | | 0.1505 | |
| $250 billion | | | 0.1469 | |
| $300 billion | | | 0.1445 | |
| * | For the complex-level fees, managed assets include closed-end fund assets managed by the Adviser that are attributable to certain types of leverage. For these purposes, leverage includes the funds’ use of preferred stock and borrowings and certain investments in the residual interest certificates (also called inverse floating rate securities) in tender option bond (TOB) trusts, including the portion of assets held by a TOB trust that has been effectively financed by the trust’s issuance of floating rate securities, subject to an agreement by the Adviser as to certain funds to limit the amount of such assets for determining managed assets in certain circumstances. The complex-level fee is calculated based upon the aggregate daily managed assets of all Nuveen funds that constitute “eligible assets.” Eligible assets do not include assets attributable to investments in other Nuveen funds or assets in excess of a determined amount (originally $2 billion) added to the Nuveen fund complex in connection with the Adviser’s assumption of the management of the former First American Funds effective January 1, 2011. As of February 28, 2019, the complex-level fee for each Fund was 0.1591%. |
Other Transactions with Affiliates
Each Fund is permitted to purchase or sell securities from or to certain other funds managed by the Adviser (“inter-fund trade”) under specified conditions outlined in procedures adopted by the Board. These procedures have been designed to ensure that any inter-fund trade of securities by the Fund from or to another fund that is, or could be, considered an affiliate of the Fund under certain limited circumstances by virtue of having a common investment adviser (or affiliated investment adviser), common officer and/or common trustee complies with Rule 17a-7 of the 1940 Act. Further, as defined under these procedures, each inter-fund trade is effected at the current market price as provided by an independent pricing service. Unsettled inter-fund trades as of the end of the reporting period are recognized as a component of “Receivable for investments sold” and/or “Payable for investments purchased” on the Statement of Assets and Liabilities, when applicable.
During the current fiscal period, the Funds did not engage in inter-fund trades pursuant to these procedures.
8. Borrowing Arrangements
Committed Line of Credit
The Funds, along with certain other funds managed by the Adviser (“Participating Funds”), have established a 364-day, approximately $2.65 billion standby credit facility with a group of lenders, under which the Participating Funds may borrow for various purposes other than leveraging for investment purposes. Each Participating Fund is allocated a designated proportion of the facility’s capacity (and its associated costs, as described below) based upon a multi-factor assessment of the likelihood and frequency of its need to draw on the facility, the size of the Fund and its anticipated draws, and the potential importance of such draws to the operations and well-being of the Fund, relative to those of the other Funds. A Fund may effect draws on the facility in excess of its designated capacity if and to the extent that other Participating Funds have undrawn capacity. The credit facility expires in July 2019 unless extended or renewed.
The credit facility has the following terms: a fee of 0.15% per annum on unused commitment amounts, and interest at a rate equal to the higher of (a) one-month LIBOR (London Inter-Bank Offered Rate) plus 1.00% per annum or (b) the Fed Funds rate plus 1.00% per annum on amounts borrowed. Participating Funds paid administration, legal and arrangement fees, which are recognized as a component of “Other expenses” on the Statement of Operations, and along with commitment fees, have been allocated among such Participating Funds based upon the relative proportions of the facility’s aggregate capacity reserved for them and other factors deemed relevant by the Adviser and the Board of each Participating Fund.
87
Notes to Financial Statements (continued)
During the current fiscal period, the Funds utilized this facility. The Funds’ maximum outstanding balance during the utilization period was as follows:
| | | | | | | | | | | | | |
| | | NXJ | | | NJV | | | NQP | | | NPN | |
| Maximum outstanding balance | | $ | 22,300,000 | | | $ | 280,893 | | | $ | 4,000,000 | | | $ | 83,958 | |
During each Fund's utilization period(s) during the current fiscal period, the average daily balance outstanding and average annual interest rate on the Borrowings were as follows:
| | | | | | | | | | | | | |
| | | NXJ | | | NJV | | | NQP | | | NPN | |
| Average daily balance outstanding | | $ | 17,474,959 | | | $ | 280,893 | | | $ | 3,765,413 | | | $ | 83,958 | |
| Average annual interest rate | | | 2.97 | % | | | 3.50 | % | | | 3.13 | % | | | 3.50 | % |
Borrowings outstanding as of the end of the reporting period are recognized as “Borrowings” on the Statement of Assets and Liabilities, where applicable.
Inter-Fund Borrowing and Lending
The Securities and Exchange Commission (“SEC”) has granted an exemptive order permitting registered open-end and closed-end Nuveen funds to participate in an inter-fund lending facility whereby the Nuveen funds may directly lend to and borrow money from each other for temporary purposes (e.g., to satisfy redemption requests or when a sale of securities “fails,” resulting in an unanticipated cash shortfall) (the “Inter-Fund Program”). The closed-end Nuveen funds, including the Funds covered by this shareholder report, will participate only as lenders, and not as borrowers, in the Inter-Fund Program because such closed-end funds rarely, if ever, need to borrow cash to meet redemptions. The Inter-Fund Program is subject to a number of conditions, including, among other things, the requirements that (1) no fund may borrow or lend money through the Inter-Fund Program unless it receives a more favorable interest rate than is typically available from a bank or other financial institution for a comparable transaction; (2) no fund may borrow on an unsecured basis through the Inter-Fund Program unless the fund’s outstanding borrowings from all sources immediately after the inter-fund borrowing total 10% or less of its total assets; provided that if the borrowing fund has a secured borrowing outstanding from any other lender, including but not limited to another fund, the inter-fund loan must be secured on at least an equal priority basis with at least an equivalent percentage of collateral to loan value; (3) if a fund’s total outstanding borrowings immediately after an inter-fund borrowing would be greater than 10% of its total assets, the fund may borrow through the inter-fund loan on a secured basis only; (4) no fund may lend money if the loan would cause its aggregate outstanding loans through the Inter-Fund Program to exceed 15% of its net assets at the time of the loan; (5) a fund’s inter-fund loans to any one fund shall not exceed 5% of the lending fund’s net assets; (6) the duration of inter-fund loans will be limited to the time required to receive payment for securities sold, but in no event more than seven days; and (7) each inter-fund loan may be called on one business day’s notice by a lending fund and may be repaid on any day by a borrowing fund. In addition, a Nuveen fund may participate in the Inter-Fund Program only if and to the extent that such participation is consistent with the fund’s investment objective and investment policies. The Board is responsible for overseeing the Inter-Fund Program.
The limitations detailed above and the other conditions of the SEC exemptive order permitting the Inter-Fund Program are designed to minimize the risks associated with Inter-Fund Program for both the lending fund and the borrowing fund. However, no borrowing or lending activity is without risk. When a fund borrows money from another fund, there is a risk that the loan could be called on one day’s notice or not renewed, in which case the fund may have to borrow from a bank at a higher rate or take other actions to payoff such loan if an inter-fund loan is not available from another fund. Any delay in repayment to a lending fund could result in a lost investment opportunity or additional borrowing costs.
During the current reporting period, none of the Funds covered by this shareholder report have entered into any inter-fund loan activity.
9. New Accounting Pronouncements
Disclosure Update and Simplification
During August 2018, the SEC issued Final Rule Release No. 33-10532, Disclosure Update and Simplification (“Final Rule Release No. 33-10532”). Final Rule Release No. 33-10532 amends certain financial statement disclosure requirements to conform to U.S. GAAP. The amendments to Rule 6-04.17 of Regulation S-X (balance sheet) remove the requirement to separately state the book basis components of net assets: undistributed (over-distribution of) net investment income (“UNII”), accumulated undistributed net realized gains (losses), and net unrealized appreciation (depreciation) at the balance sheet date. Instead, consistent with U.S. GAAP, funds will be required to disclose total distributable earnings. The amendments to Rule 6-09 of Regulation S-X (statement of changes in net assets) remove the requirement to separately state the sources of distributions paid. Instead, consistent with U.S. GAAP, funds will be required to disclose the total amount of distributions paid, except that any tax return of capital must be separately disclosed. The amendments also remove the requirement to parenthetically state the book basis amount of UNII on the statement of changes in net assets.
88
The requirements of Final Rule Release No. 33-10532 are effective November 5, 2018, and the Funds’ Statement of Assets and Liabilities and Statement of Changes in Net Assets for the current reporting period have been modified accordingly. In addition, certain amounts within each Fund’s Statement of Changes in Net Assets for the prior fiscal period have been modified to conform to Final Rule Release No. 33-10532.
For the prior fiscal period, the total amount of distributions paid to shareholders from net investment income and from accumulated net realized gains, if any, are recognized as “Dividends” on the Statement of Changes in Net Assets.
As of February 28, 2018, the Funds’ Statement of Changes in Net Assets reflected the following balances.
| | | | | | | | | | | | | |
| | | NXJ | | | NJV | | | NQP | | | NPN | |
Distributions to Shareholders | | | | | | | | | | | | |
| From net investment income | | $ | (29,752,332 | ) | | $ | (895,598 | ) | | $ | (26,080,218 | ) | | $ | (711,822 | ) |
| From accumulated net realized gains | | | — | | | | (546,388 | ) | | | (64,183 | ) | | | (235,044 | ) |
| Decrease in net assets applicable to common shares from distributions to common shareholders | | | (29,752,332 | ) | | | (1,441,986 | ) | | | (26,144,401 | ) | | | (946,866 | ) |
| UNII at the end of period | | $ | 1,465,610 | | | $ | 48,099 | | | $ | (947,591 | ) | | $ | 5,626 | |
Fair Value Measurement: Disclosure Framework
During August 2018, the FASB issued ASU 2018-13 (“ASU 2018-13”), Fair Value Measurement: Disclosure Framework – Changes to the Disclosure Requirements for Fair Value Measurements. ASU 2018-13 modifies the disclosures required by Topic 820, Fair Value Measurements. The amendments in ASU 2018-13 are effective for all entities for fiscal years, and interim periods within those fiscal years, beginning after December 15, 2019. During the current reporting period, management early implemented this guidance. This implementation did not have a material impact on the Funds’ financial statements.
89
Additional Fund Information (Unaudited)
| | | | | | |
Board of Trustees | | | | | |
| Margo Cook * | Jack B. Evans | William C. Hunter | Albin F. Moschner | John K. Nelson | Judith M. Stockdale |
| Carole E. Stone | Terence J. Toth | Margaret L. Wolff | Robert L. Young | | |
| |
| * Interested Board Member. |
Fund Manager | Custodian | Legal Counsel | Independent Registered | Transfer Agent and |
| Nuveen Fund Advisors, LLC | State Street Bank | Chapman and Cutler LLP | Public Accounting Firm | Shareholder Services |
| 333 West Wacker Drive | and Trust Company | Chicago, IL 60603 | KPMG LLP | Computershare Trust |
| Chicago, IL 60606 | One Lincoln Street | | 200 East Randolph Street | Company, N.A. |
| | Boston, MA 02111 | | Chicago, IL 60601 | 250 Royall Street |
| | | | | Canton, MA 02021 |
| | | | | (800) 257-8787 |
Portfolio of Investments Information
Each Fund is required to file its complete schedule of portfolio holdings with the Securities and Exchange Commission (SEC) for the first and third quarters of each fiscal year as an exhibit to its report of Form N-PORT. You may obtain this information on the SEC’s website at http://www.sec.gov.
Nuveen Funds’ Proxy Voting InformationYou may obtain (i) information regarding how each fund voted proxies relating to portfolio securities held during the most recent twelve-month period ended June 30, without charge, upon request, by calling Nuveen toll-free at (800) 257-8787 or on Nuveen’s website at www.nuveen.com and (ii) a description of the policies and procedures that each fund used to determine how to vote proxies relating to portfolio securities without charge, upon request, by calling Nuveen toll free at (800) 257-8787. You may also obtain this information directly from the SEC. Visit the SEC on-line at http://www.sec.gov.
CEO Certification DisclosureEach Fund’s Chief Executive Officer (CEO) has submitted to the New York Stock Exchange (NYSE) the annual CEO certification as required by Section 303A.12(a) of the NYSE Listed Company Manual. Each Fund has filed with the SEC the certification of its CEO and Chief Financial Officer required by Section 302 of the Sarbanes-Oxley Act.
Common Share RepurchasesEach Fund intends to repurchase, through its open-market share repurchase program, shares of its own common stock at such times and in such amounts as is deemed advisable. During the period covered by this report, each Fund repurchased shares of its common stock, as shown in the accompanying table. Any future repurchases will be reported to shareholders in the next annual or semi-annual report.
| | | | | | | | | | | | | |
| | | NXJ | | | NJV | | | NQP | | | NPN | |
| Common shares repurchased | | | 1,026,800 | | | | 20,501 | | | | 356,000 | | | | 3,500 | |
FINRA BrokerCheck
The Financial Industry Regulatory Authority (FINRA) provides information regarding the disciplinary history of FINRA member firms and associated investment professionals. This information as well as an investor brochure describing FINRA BrokerCheck is available to the public by calling the FINRA BrokerCheck Hotline number at (800) 289-9999 or by visiting www.FINRA.org.
90Glossary of Terms Used in this Report (Unaudited)
| · | Auction Rate Bond: An auction rate bond is a security whose interest payments are adjusted periodically through an auction process, which process typically also serves as a means for buying and selling the bond. Auctions that fail to attract enough buyers for all the shares offered for sale are deemed to have “failed,” with current holders receiving a formula-based interest rate until the next scheduled auction. |
| · | Average Annual Total Return: This is a commonly used method to express an investment’s performance over a particular, usually multi-year time period. It expresses the return that would have been necessary each year to equal the investment’s actual cumulative performance (including change in NAV or market price and reinvested dividends and capital gains distributions, if any) over the time period being considered. |
| · | Duration: Duration is a measure of the expected period over which a bond’s principal and interest will be paid, and consequently is a measure of the sensitivity of a bond’s or bond fund’s value to changes when market interest rates change. Generally, the longer a bond’s or fund’s duration, the more the price of the bond or fund will change as interest rates change. |
| · | Effective Leverage: Effective leverage is a fund’s effective economic leverage, and includes both regulatory leverage (see leverage) and the leverage effects of certain derivative investments in the fund’s portfolio. Currently, the leverage effects of Tender Option Bond (TOB) inverse floater holdings are included in effective leverage values, in addition to any regulatory leverage. |
| · | Forward Interest Rate Swap: A contractual agreement between two counterparties under which one party agrees to make periodic payments to the other for an agreed period of time based on a fixed rate, while the other party agrees to make periodic payments based on a floating rate of interest based on an underlying index. Alternatively, both series of cashflows to be exchanged could be calculated using floating rates of interest but floating rates that are based upon different underlying indexes. |
| · | Gross Domestic Product (GDP): The total market value of all final goods and services produced in a country/region in a given year, equal to total consumer, investment and government spending, plus the value of exports, minus the value of imports. |
| · | Inverse Floating Rate Securities: Inverse floating rate securities, also known as inverse floaters or tender option bonds (TOBs), are created by depositing a municipal bond, typically with a fixed interest rate, into a special purpose trust. This trust, in turn, (a) issues floating rate certificates typically paying short-term tax-exempt interest rates to third parties in amounts equal to some fraction of the deposited bond’s par amount or market value, and (b) issues an inverse floating rate certificate (sometimes referred to as an “inverse floater”) to an investor (such as a Fund) interested in gaining investment exposure to a long-term municipal bond. The income received by the holder of the inverse floater varies inversely with the short-term rate paid to the floating rate certificates’ holders, and in most circumstances the holder of the inverse floater bears substantially all of the underlying bond’s downside investment risk. The holder of the inverse floater typically also benefits disproportionately from any potential appreciation of the underlying bond’s value. Hence, an inverse floater essentially represents an investment in the underlying bond on a leveraged basis. |
| · | Leverage: Leverage is created whenever a fund has investment exposure (both reward and/or risk) equivalent to more than 100% of the investment capital. |
| · | Net Asset Value (NAV) Per Share: A fund’s Net Assets is equal to its total assets (securities, cash, accrued earnings and receivables) less its total liabilities. NAV per share is equal to the fund’s Net Assets divided by its number of shares outstanding. |
91
Glossary of Terms Used in this Report (unaudited) (continued)
| · | Pre-Refunding: Pre-Refunding, also known as advanced refundings or refinancings, is a procedure used by state and local governments to refinance municipal bonds to lower interest expenses. The issuer sells new bonds with a lower yield and uses the proceeds to buy U.S. Treasury securities, the interest from which is used to make payments on the higher-yielding bonds. Because of this collateral, pre-refunding generally raises a bond’s credit rating and thus its value. |
| · | Regulatory Leverage: Regulatory leverage consists of preferred shares issued by or borrowings of a fund. Both of these are part of a fund’s capital structure. Regulatory leverage is subject to asset coverage limits set in the Investment Company Act of 1940. |
| · | S&P Municipal Bond Index: An unleveraged, market value-weighted index designed to measure the performance of the tax-exempt, investment-grade U.S. municipal bond market. Index returns assume reinvestment of distributions, but do not reflect any applicable sales charges or management fees. |
| · | S&P Municipal Bond New Jersey Index: An unleveraged, market value-weighted index designed to measure the performance of the tax-exempt, investment-grade New Jersey municipal bond market. Index returns assume reinvestment of distributions, but do not reflect any applicable sales charges or management fees. |
| · | S&P Municipal Bond Pennsylvania Index: An unleveraged, market value-weighted index designed to measure the performance of the tax-exempt, investment-grade Pennsylvania municipal bond market. Index returns assume reinvestment of distributions, but do not reflect any applicable sales charges or management fees. |
| · | Total Investment Exposure: Total investment exposure is a fund’s assets managed by the Adviser that are attributable to financial leverage. For these purposes, financial leverage includes a fund’s use of preferred stock and borrowings and investments in the residual interest certificates (also called inverse floating rate securities) in tender option bond (TOB) trusts, including the portion of assets held by a TOB trust that has been effectively financed by the trust’s issuance of floating rate securities. |
| · | Zero Coupon Bond: A zero coupon bond does not pay a regular interest coupon to its holders during the life of the bond. Income to the holder of the bond comes from accretion of the difference between the original purchase price of the bond at issuance and the par value of the bond at maturity and is effectively paid at maturity. The market prices of zero coupon bonds generally are more volatile than the market prices of bonds that pay interest periodically. |
92
Reinvest Automatically, Easily and Conveniently
Nuveen makes reinvesting easy. A phone call is all it takes to set up your reinvestment account.
Nuveen Closed-End Funds Automatic Reinvestment PlanNuveen Closed-End Fund allows you to conveniently reinvest distributions in additional Fund shares. By choosing to reinvest, you’ll be able to invest money regularly and automatically, and watch your investment grow through the power of compounding. Just like distributions in cash, there may be times when income or capital gains taxes may be payable on distributions that are reinvested. It is important to note that an automatic reinvestment plan does not ensure a profit, nor does it protect you against loss in a declining market.
Easy and convenient
To make recordkeeping easy and convenient, each month you’ll receive a statement showing your total distributions, the date of investment, the shares acquired and the price per share, and the total number of shares you own.
How shares are purchased
The shares you acquire by reinvesting will either be purchased on the open market or newly issued by the Fund. If the shares are trading at or above net asset value at the time of valuation, the Fund will issue new shares at the greater of the net asset value or 95% of the then-current market price. If the shares are trading at less than net asset value, shares for your account will be purchased on the open market. If the Plan Agent begins purchasing Fund shares on the open market while shares are trading below net asset value, but the Fund’s shares subsequently trade at or above their net asset value before the Plan Agent is able to complete its purchases, the Plan Agent may cease open-market purchases and may invest the uninvested portion of the distribution in newly-issued Fund shares at a price equal to the greater of the shares’ net asset value or 95% of the shares’ market value on the last business day immediately prior to the purchase date. Distributions received to purchase shares in the open market will normally be invested shortly after the distribution payment date. No interest will be paid on distributions awaiting reinvestment. Because the market price of the shares may increase before purchases are completed, the average purchase price per share may exceed the market price at the time of valuation, resulting in the acquisition of fewer shares than if the distribution had been paid in shares issued by the Fund. A pro rata portion of any applicable brokerage commissions on open market purchases will be paid by Plan participants. These commissions usually will be lower than those charged on individual transactions.
Flexible
You may change your distribution option or withdraw from the Plan at any time, should your needs or situation change. You can reinvest whether your shares are registered in your name, or in the name of a brokerage firm, bank, or other nominee. Ask your investment advisor if his or her firm will participate on your behalf. Participants whose shares are registered in the name of one firm may not be able to transfer the shares to another firm and continue to participate in the Plan. The Fund reserves the right to amend or terminate the Plan at any time. Although the Fund reserves the right to amend the Plan to include a service charge payable by the participants, there is no direct service charge to participants in the Plan at this time.
Call today to start reinvesting distributions
For more information on the Nuveen Automatic Reinvestment Plan or to enroll in or withdraw from the Plan, speak with your financial advisor or call us at (800) 257-8787.
93
Board Members & Officers (Unaudited)
The management of the Funds, including general supervision of the duties performed for the Funds by the Adviser, is the responsibility of the Board of Trustees of the Funds. The number of trustees of the Funds is set at ten. None of the trustees who are not “interested” persons of the Funds (referred to herein as “independent board members”) has ever been a director or employee of, or consultant to, Nuveen or its affiliates. The names and business addresses of the trustees and officers of the Funds, their principal occupations and other affiliations during the past five years, the number of portfolios each oversees and other directorships they hold are set forth below.
| | | | | |
Name, | Position(s) Held | Year First | Principal | Number |
| Year of Birth | with the Funds | Elected or | Occupation(s) | of Portfolios |
& Address | | Appointed | Including other | in Fund Complex |
| | | and Term(1) | Directorships | Overseen by |
| | | | During Past 5 Years | Board Member |
| |
| Independent Board Members: |
| |
■ TERENCE J. TOTH | | | Formerly, a Co-Founding Partner, Promus Capital (2008-2017); Director, | |
| 1959 | | | Fulcrum IT Service LLC (since 2010) and Quality Control Corporation | |
333 W. Wacker Drive | Chairman and | 2008 | (since 2012); member: Catalyst Schools of Chicago Board (since 2008) | 168 |
| Chicago, IL 6o6o6 | Board Member | Class II | and Mather Foundation Board (since 2012), and chair of its Investment | |
| | | | Committee; formerly, Director, Legal & General Investment | |
| | | | Management America, Inc. (2008-2013); formerly, CEO and President, | |
| | | | Northern Trust Global Investments (2004-2007): Executive Vice President, | |
| | | | Quantitative Management & Securities Lending (2000-2004); prior | |
| | | | thereto, various positions with Northern Trust Company (since 1994); | |
| | | | formerly, Member, Northern Trust Mutual Funds Board (2005-2007), | |
| | | | Northern Trust Global Investments Board (2004-2007), Northern Trust | |
| | | | Japan Board (2004-2007), Northern Trust Securities Inc. Board | |
| | | | (2003- 2007) and Northern Trust Hong Kong Board (1997-2004). | |
| |
■ JACK B. EVANS | | | Chairman (since 2019), formerly, President (1996-2019), The Hall-Perrine | |
| 1948 | | | Foundation, a private philanthropic corporation; Director and Chairman, | |
333 W. Wacker Drive | Board Member | 1999 | United Fire Group, a publicly held company; Director, Public Member, | 168 |
| Chicago, IL 6o6o6 | | Class III | American Board of Orthopaedic Surgery (since 2015); Life Trustee of | |
| | | | Coe College and the Iowa College Foundation; formerly, President | |
| | | | Pro-Tem of the Board of Regents for the State of Iowa University | |
| | | | System; formerly, Director, Alliant Energy and The Gazette Company; | |
| | | | formerly, Director, Federal Reserve Bank of Chicago; formerly, | |
| | | | President and Chief Operating Officer, SCI Financial Group, Inc., a | |
| | | | regional financial services firm. | |
| |
■ WILLIAM C. HUNTER | | | Dean Emeritus, formerly, Dean, Tippie College of Business, University of | |
| 1948 | | | Iowa(2006-2012); Director of Wellmark, Inc. (since 2009); past Director | |
333 W. Wacker Drive | Board Member | 2003 | (2005-2015), and past President (2010-2014) Beta Gamma Sigma, Inc., | 168 |
| Chicago, IL 6o6o6 | | Class I | The International Business Honor Society; formerly, Director (2004-2018) | |
| | | | of Xerox Corporation; Dean and Distinguished Professor of Finance, | |
| | | | School of Business at the University of Connecticut (2003-2006); | |
| | | | previously, Senior Vice President and Director of Research at the Federal | |
| | | | Reserve Bank of Chicago (1995-2003); formerly, Director (1997-2007), | |
| | | | Credit Research Center at Georgetown University. | |
| |
■ ALBIN F. MOSCHNER | | | Founder and Chief Executive Officer, Northcroft Partners, LLC, a | |
| 1952 | | | management consulting firm (since 2012); Chairman (since 2019), | |
333 W. Wacker Drive | Board Member | 2016 | and Director (since 2012), USA Technologies, Inc., a provider of solutions | 168 |
| Chicago, IL 6o6o6 | | Class III | and services to facilitate electronic payment transactions (since 2012); | |
| | | | formerly, Director, Wintrust Financial Corporation (1996-2016); previously, | |
| | | | held positions at Leap Wireless International, Inc., including Consultant | |
| | | | (2011-2012), Chief Operating Officer (2008-2011), and Chief Marketing | |
| | | | Officer (2004-2008); formerly, President, Verizon Card Services division of | |
| | | | Verizon Communications, Inc. (2000-2003); formerly, President, One Point | |
| | | | Services at One Point Communications (1999- 2000); formerly, Vice | |
| | | | Chairman of the Board, Diba, Incorporated (1996-1997); formerly, various | |
| | | | executive positions (1991-1996) and Chief Executive Officer (1995-1996) of | |
| | | | Zenith Electronics Corporation. | |
94
| | | | | |
Name, | Position(s) Held | Year First | Principal | Number |
Year of Birth | with the Funds | Elected or | Occupation(s) | of Portfolios |
& Address | | Appointed | Including other | in Fund Complex |
| | | and Term(1) | Directorships | Overseen by |
| | | | During Past 5 Years | Board Member |
| |
Independent Board Members (continued): |
| |
■ JOHN K. NELSON | | | Member of Board of Directors of Core12 LLC (since 2008), a private firm | |
| 1962 | | | which develops branding, marketing and communications strategies for | |
| 333 W. Wacker Drive | Board Member | 2013 | clients; serves on The President’s Council, Fordham University (since | 168 |
| Chicago, IL 6o6o6 | | Class II | 2010); and previously was a Director of The Curran Center for Catholic | |
| | | | American Studies (2009-2018) formerly, senior external advisor to the | |
| | | | financial services practice of Deloitte Consulting LLP (2012-2014): | |
| | | | formerly, Chairman of the Board of Trustees of Marian University (2010 | |
| | | | as trustee, 2011-2014 as Chairman); formerly, Chief Executive Officer of | |
| | | | ABN AMRO N.V. North America, and Global Head of its Financial Markets | |
| | | | Division (2007-2008); prior senior positions held at ABN AMRO include | |
| | | | Corporate Executive Vice President and Head of Global Markets-the | |
| | | | Americas (2006-2007), CEO of Wholesale Banking North America and | |
| | | | Global Head of Foreign Exchange and Futures Markets (2001-2006), and | |
| | | | Regional Commercial Treasurer and Senior Vice President Trading-North | |
| | | | America (1996-2001); formerly, Trustee at St. Edmund Preparatory | |
| | | | School in New York City. | |
| |
■ JUDITH M. STOCKDALE | | | Board Member, Land Trust Alliance (since 2013) and U.S. Endowment for | |
| 1947 | | | Forestry and Communities (since 2013); formerly, Executive Director | |
| 333 W. Wacker Drive | Board Member | 1997 | (1994-2012), Gaylord and Dorothy Donnelley Foundation; prior thereto, | 168 |
| Chicago, IL 6o6o6 | | Class I | Executive Director, Great Lakes Protection Fund (1990-1994). | |
| |
■ CAROLE E. STONE | | | Former Director, Chicago Board Options Exchange, Inc. (2006-2017); | |
| 1947 | | | and C2 Options Exchange, Incorporated (2009-2017); Director, Cboe, | |
| 333 W. Wacker Drive | Board Member | 2007 | L.C. Global Markets, Inc., formerly, CBOE Holdings, Inc. (since 2010); | 168 |
| Chicago, IL 6o6o6 | | Class I | formerly, Commissioner, New York State Commission on Public | |
| | | | Authority Reform (2005-2010). | |
| |
■ MARGARET L. WOLFF | | | Formerly, member of the Board of Directors (2013-2017) of Travelers | |
| 1955 | | | Insurance Company of Canada and The Dominion of Canada General | |
| 333 W. Wacker Drive | Board Member | 2016 | Insurance Company (each, a part of Travelers Canada, the Canadian | 168 |
| Chicago, IL 6o6o6 | | Class I | operation of The Travelers Companies, Inc.); formerly, Of Counsel, | |
| | | | Skadden, Arps, Slate, Meagher & Flom LLP (Mergers & Acquisitions | |
| | | | Group) (2005-2014); Member of the Board of Trustees of New York- | |
| | | | Presbyterian Hospital (since 2005); Member (since 2004) and Chair | |
| | | | (since 2015) of the Board of Trustees of The John A. Hartford Foundation | |
| | | | (a philanthropy dedicated to improving the care of older adults); | |
| | | | formerly, Member (2005-2015) and Vice Chair (2011-2015) of the | |
| | | | Board of Trustees of Mt. Holyoke College. | |
| |
■ ROBERT L. YOUNG(2) | | | Formerly, Chief Operating Officer and Director, J.P.Morgan Investment | |
| 1963 | | | Management Inc. (2010-2016); formerly, President and Principal | |
| 333 W. Wacker Drive | Board Member | 2017 | Executive Officer (2013-2016), and Senior Vice President and Chief | 166 |
| Chicago, IL 6o6o6 | | Class II | Operating Officer (2005-2010), of J.P.Morgan Funds; formerly, Director | |
| | | | and various officer positions for J.P.Morgan Investment Management | |
| | | | Inc. (formerly, JPMorgan Funds Management, Inc. and formerly, One | |
| | | | Group Administrative Services) and JPMorgan Distribution Services, | |
| | | | Inc. (formerly, One Group Dealer Services, Inc.) (1999-2017). | |
95
Board Members & Officers (Unaudited) (continued)
| | | | | |
Name, | Position(s) Held | Year First | Principal | Number |
Year of Birth | with the Funds | Elected or | Occupation(s) | of Portfolios |
& Address | | Appointed | Including other | in Fund Complex |
| | | and Term(1) | Directorships | Overseen by |
| | | | During Past 5 Years | Board Member |
| |
Interested Board Member: |
| |
■ MARGO L. COOK(3) | | | President (since 2017), formerly, Co-Chief Executive Officer and | |
| 1964 | | | Co-President (2016-2017), formerly, Senior Executive Vice President of | |
| 333 W. Wacker Drive | Board Member | 2016 | Nuveen Investments, Inc.; President, Global Products and Solutions | 168 |
| Chicago, IL 6o6o6 | | Class III | (since 2017), and, Co-Chief Executive Officer (since 2015), formerly, | |
| | | | Executive Vice President (2013-2015), of Nuveen Securities, LLC; | |
| | | | Executive Vice President (since 2017) of Nuveen, LLC; President (since | |
| | | | August 2017), formerly Co-President (2016- 2017), formerly, Senior | |
| | | | Executive Vice President of Nuveen Fund Advisors, LLC (Executive Vice | |
| | | | President since 2011); President (since 2017), Nuveen Alternative | |
| | | | Investments, LLC; Chartered Financial Analyst. | |
| |
Name, Year of Birth & Address | Position(s) Held with the Funds | Year First Elected or Appointed(4) | Principal Occupation(s) During Past 5 Years |
| |
Officers of the Funds: |
| |
■ CEDRIC H. ANTOSIEWICZ | | | Senior Managing Director (since 2017), formerly, Managing Director |
| 1962 | Chief | | (2004-2017) of Nuveen Securities, LLC; Senior Managing Director (since |
| 333 W. Wacker Drive | Administrative | 2007 | 2017), formerly, Managing Director (2014-2017) of Nuveen Fund |
| Chicago, IL 6o6o6 | Officer | | Advisors, LLC. |
| |
■ NATHANIEL T. JONES | | | Managing Director (since 2017), formerly, Senior Vice President |
| 1979 | | | (2016-2017), formerly, Vice President (2011-2016) of Nuveen; Managing |
| 333 W. Wacker Drive | Vice President | 2016 | Director of Nuveen Fund Advisors, LLC; Chartered Financial Analyst. |
| Chicago, IL 6o6o6 | and Treasurer | | |
| |
■ WALTER M. KELLY | | | Managing Director (since 2017), formerly, Senior Vice President |
| 1970 | Chief Compliance | | (2008-2017) of Nuveen. |
| 333 W. Wacker Drive | Officer and | 2003 | |
| Chicago, IL 6o6o6 | Vice President | | |
| |
■ DAVID J. LAMB | | | Managing Director (since 2017), formerly, Senior Vice President of |
| 1963 | | | Nuveen (since 2006), Vice President prior to 2006. |
| 333 W. Wacker Drive | Vice President | 2015 | |
| Chicago, IL 6o6o6 | | | |
| |
■ TINA M. LAZAR | | | Managing Director (since 2017), formerly, Senior Vice President |
| 1961 | | | (2014-2017) of Nuveen Securities, LLC. |
| 333 W. Wacker Drive | Vice President | 2002 | |
| Chicago, IL 6o6o6 | | | |
96
Name, Year of Birth & Address | Position(s) Held with the Funds | Year First Elected or Appointed(4) | Principal Occupation(s) During Past 5 Years |
| |
| Officers of the Funds (continued): |
| |
■ KEVIN J. MCCARTHY | | | Senior Managing Director (since 2017) and Secretary and General Counsel |
| 1966 | Vice President | | (since 2016) of Nuveen Investments, Inc., formerly, Executive Vice |
333 W. Wacker Drive | and Assistant | 2007 | President (2016-2017) and Managing Director and Assistant Secretary |
| Chicago, IL 6o6o6 | Secretary | | (2008-2016); Senior Managing Director (since 2017) and Assistant |
| | | | Secretary (since 2008) of Nuveen Securities, LLC, formerly Executive |
| | | | Vice President (2016-2017) and Managing Director (2008-2016); Senior |
| | | | Managing Director (since 2017), Secretary (since 2016) and Co-General |
| | | | Counsel (since 2011) of Nuveen Fund Advisors, LLC, formerly, Executive |
| | | | Vice President (2016-2017), Managing Director (2008-2016) and |
| | | | Assistant Secretary (2007-2016); Senior Managing Director (since 2017), |
| | | | Secretary (since 2016) and Associate General Counsel (since 2011) of |
| | | | Nuveen Asset Management, LLC, formerly Executive Vice President |
| | | | (2016-2017) and Managing Director and Assistant Secretary (2011-2016); |
| | | | Senior Managing Director (since 2017) and Secretary (since 2016) of |
| | | | Nuveen Investments Advisers, LLC, formerly Executive Vice President |
| | | | (2016-2017); Vice President (since 2007) and Secretary (since 2016), |
| | | | formerly, Assistant Secretary, of NWQ Investment Management |
| | | | Company, LLC, Symphony Asset Management LLC, Santa Barbara Asset |
| | | | Management, LLC and Winslow Capital Management, LLC (since 2010). |
| | | | Senior Managing Director (since 2017) and Secretary (since 2016) of |
| | | | Nuveen Alternative Investments, LLC. |
| |
■ WILLIAM T. MEYERS | | | Senior Managing Director (since 2017), formerly, Managing Director |
| 1966 | Vice President | | (2016-2017), Senior Vice President (2010-2016) of Nuveen Securities, LLC; |
333 W. Wacker Drive | | 2018 | and Nuveen Fund Advisors, LLC; Senior Managing Director (since 2017), |
| Chicago, IL 60606 | | | formerly, Managing Director (2016-2017), Senior Vice President |
| | | | (2010-2016) of Nuveen, has held various positions with Nuveen since 1991. |
| |
■ MICHAEL A. PERRY | | | Executive Vice President (since 2017), previously Managing Director |
| 1967 | | | from 2016), of Nuveen Fund Advisors, LLC and Nuveen Alternative |
333 W. Wacker Drive | Vice President | 2017 | Investments, LLC; Executive Vice President (since 2017), formerly, |
| Chicago, IL 6o6o6 | | | Managing Director (2015-2017), of Nuveen Securities, LLC; formerly, |
| | | | Managing Director (2010-2015) of UBS Securities, LLC. |
| |
■ CHRISTOPHER M. ROHRBACHER | | Managing Director (since 2017) and Assistant Secretary of Nuveen |
| 1971 | Vice President | | Securities, LLC; Managing Director (since 2017), formerly, Senior |
333 W. Wacker Drive | and Assistant | 2008 | Vice President (2016-2017) and Assistant Secretary (since 2016) of |
| Chicago, IL 6o6o6 | Secretary | | Nuveen Fund Advisors, LLC. |
| |
■ WILLIAM A. SIFFERMANN | | | Managing Director (since 2017), formerly Senior Vice President |
| 1975 | | | (2016-2017) and Vice President (2011-2016) of Nuveen. |
| 333 W. Wacker Drive | Vice President | 2017 | |
| Chicago, IL 6o6o6 | | | |
| |
■ JOEL T. SLAGER | | | Fund Tax Director for Nuveen Funds (since 2013); previously, |
| 1978 | Vice President | | Vice President of Morgan Stanley Investment Management, Inc., |
333 W. Wacker Drive | and Assistant | 2013 | Assistant Treasurer of the Morgan Stanley Funds (from 2010 to 2013). |
| Chicago, IL 6o6o6 | Secretary | | |
| |
■ E. SCOTT WICKERHAM | | | Senior Managing Director, Head of Fund Administration at Nuveen, LLC |
| 1973 | Vice President | | (since 2019), formerly, Managing Director; Principal Financial Officer, |
| TIAA | and Controller | 2019 | Principal Accounting Officer and Treasurer (since 2017) to the TIAA-CREF |
| 730 Third Avenue | | | Funds, the TIAA-CREF Life Funds, the TIAA Separate Account VA-1 and the |
| New York, NY 10017 | | | Treasurer (since 2017) to the CREF Accounts; Senior Director, TIAA-CREF |
| | | | Fund Administration (2014-2015); has held various positions with TIAA |
| | | | since 2006. |
97
Board Members & Officers (Unaudited) (continued)
Name, Year of Birth & Address | Position(s) Held with the Funds | Year First Elected or Appointed(4) | Principal Occupation(s) During Past 5 Years |
| |
| Officers of the Funds (continued): | | |
| |
■ MARK L. WINGET | | | Vice President and Assistant Secretary of Nuveen Securities, LLC |
| 1968 | Vice President | | (since 2008); Vice President (since 2010) and Associate General |
333 W. Wacker Drive | and Assistant | 2008 | Counsel (since 2008) of Nuveen. |
| Chicago, IL 60606 | Secretary | | |
| |
■ GIFFORD R. ZIMMERMAN | | | Managing Director (since 2002), and Assistant Secretary of Nuveen |
| 1956 | Vice President | | Securities, LLC; Managing Director (since 2004) and Assistant Secretary |
333 W. Wacker Drive | Secretary | 1988 | (since 1994) of Nuveen Investments, Inc.; Managing Director (since |
| Chicago, IL 60606 | | | 2002), Assistant Secretary (since 1997) and Co-General Counsel (since |
| | | | 2011) of Nuveen Fund Advisors, LLC; Managing Director, Assistant |
| | | | Secretary and Associate General Counsel of Nuveen Asset |
| | | | Management, LLC (since 2011); Vice President (since 2017), formerly, |
| | | | Managing Director (2003-2017) and Assistant Secretary (since 2003) of |
| | | | Symphony Asset Management LLC; Managing Director and Assistant |
| | | | Secretary (since 2002) of Nuveen Investments Advisers, LLC; Vice |
| | | | President and Assistant Secretary of NWQ Investment Management |
| | | | Company, LLC (since 2002), Santa Barbara Asset Management, LLC |
| | | | (since 2006), and of Winslow Capital Management, LLC, (since 2010); |
| | | | Chartered Financial Analyst. |
| | |
| (1) | The Board of Trustees is divided into three classes, Class I, Class II, and Class III, with each being elected to serve until the third succeeding annual shareholders’ meeting subsequent to its election or thereafter in each case when its respective successors are duly elected or appointed, except two board members are elected by the holders of Preferred Shares, when applicable, to serve until the next annual shareholders’ meeting subsequent to its election or thereafter in each case when its respective successors are duly elected or appointed. The year first elected or appointed represents the year in which the board member was first elected or appointed to any fund in the Nuveen Complex. |
| (2) | On May 25, 2017, Mr. Young was appointed as a Board Member, effective July 1, 2017. He is a Board Member of each of the Nuveen Funds, except Nuveen Diversified Dividend and Income Fund and Nuveen Real Estate Income Fund. |
| (3) | “Interested person” as defined in the 1940 Act, by reason of her position with Nuveen, LLC. and certain of its subsidiaries, which are affiliates of the Nuveen Funds. |
| (4) | Officers serve one year terms through August of each year. The year first elected or appointed represents the year in which the Officer was first elected or appointed to any fund in the Nuveen Complex. |
98
Notes
99
Nuveen:
Serving Investors for Generations
Since 1898, financial advisors and their clients have relied on Nuveen to provide dependable investment solutions through continued adherence to proven, long-term investing principles. Today, we offer a range of high quality solutions designed to be integral components of a well-diversified core portfolio.
Focused on meeting investor needs.
Nuveen is the investment manager of TIAA. We have grown into one of the world’s premier global asset managers, with specialist knowledge across all major asset classes and particular strength in solutions that provide income for investors and that draw on our expertise in alternatives and responsible investing. Nuveen is driven not only by the independent investment processes across the firm, but also the insights, risk management, analytics and other tools and resources that a truly world-class platform provides. As a global asset manager, our mission is to work in partnership with our clients to create solutions which help them secure their financial future.
Find out how we can help you.
To learn more about how the products and services of Nuveen may be able to help you meet your financial goals, talk to your financial advisor, or call us at (800) 257-8787. Please read the information provided carefully before you invest. Investors should consider the investment objective and policies, risk considerations, charges and expenses of any investment carefully. Where applicable, be sure to obtain a prospectus, which contains this and other relevant information. To obtain a prospectus, please contact your securities representative or Nuveen, 333 W. Wacker Dr., Chicago, IL 60606. Please read the prospectus carefully before you invest or send money.
Learn more about Nuveen Funds at: www.nuveen.com/closed-end funds
Nuveen Securities, LLC, member FINRA and SIPC | 333 West Wacker Drive Chicago, IL 60606 | www.nuveen.com | | EAN-D-0219D 803995-INV-Y-04/20 |
ITEM 2. CODE OF ETHICS.
As of the end of the period covered by this report, the registrant has adopted a code of ethics that applies to the registrant’s principal executive officer, principal financial officer, principal accounting officer or controller, or persons performing similar functions. There were no amendments to or waivers from the Code during the period covered by this report. The registrant has posted the code of ethics on its website at www.nuveen.com/CEF/Shareholder/FundGovernance.aspx. (To view the code, click on Code of Conduct.)
ITEM 3. AUDIT COMMITTEE FINANCIAL EXPERT.
As of the end of the period covered by this report, the registrant’s Board of Directors or Trustees (“Board”) determined that the registrant has at least one “audit committee financial expert” (as defined in Item 3 of Form N-CSR) serving on its Audit Committee. The registrant’s audit committee financial experts are Carole E. Stone, Jack B. Evans and William C. Hunter, who are “independent” for purposes of Item 3 of Form N-CSR.
ITEM 4. PRINCIPAL ACCOUNTANT FEES AND SERVICES.
SERVICES THAT THE FUND’S AUDITOR BILLED TO THE ADVISER AND AFFILIATED FUND SERVICE PROVIDERS
Audit Committee Pre-Approval Policies and Procedures. Generally, the Audit Committee must approve (i) all non-audit services to be performed for the Fund by the Fund’s independent accountants and (ii) all audit and non-audit services to be performed by the Fund’s independent accountants for the Affiliated Fund Service Providers with respect to operations and financial reporting of the Fund. Regarding tax and research projects conducted by the independent accountants for the Fund and Affiliated Fund Service Providers (with respect to operations and financial reports of the Fund) such engagements will be (i) pre-approved by the Audit Committee if they are expected to be for amounts greater than $10,000; (ii) reported to the Audit Committee chairman for his verbal approval prior to engagement if they are expected to be for amounts under $10,000 but greater than $5,000; and (iii) reported to the Audit Committee at the next Audit Committee meeting if they are expected to be for an amount under $5,000.
ITEM 6. SCHEDULE OF INVESTMENTS.
a) See Portfolio of Investments in Item 1.
b) Not applicable.
ITEM 8. PORTFOLIO MANAGERS OF CLOSED-END MANAGEMENT INVESTMENT COMPANIES.
Nuveen Fund Advisors, LLC is the registrant’s investment adviser (also referred to as the “Adviser”). The Adviser is responsible for the selection and on-going monitoring of the Fund’s investment portfolio, managing the Fund’s business affairs and providing certain clerical, bookkeeping and administrative services. The Adviser has engaged Nuveen Asset Management, LLC (“Nuveen Asset Management” or “Sub-Adviser”) as Sub-Adviser to provide discretionary investment advisory services. The following section provides information on the portfolio manager at the Sub-Adviser:
Item 8(a)(1). PORTFOLIO MANAGER BIOGRAPHY
As of the date of filing this report, the following individual at the Sub-Adviser (the “Portfolio Manager”) has primary responsibility for the day-to-day implementation of the Fund’s investment strategy:
Paul Brennan, CFA, CPA, manages several Nuveen municipal national and state mutual funds and closed-end bond funds. Paul began his career in the investment business in 1991, as a municipal credit analyst for Flagship Financial, before becoming a portfolio manager in 1994. He joined Nuveen Investments in 1997, when Nuveen acquired Flagship Financial that year. He earned his B.S. in Accountancy and Finance from Wright State University. He is a CPA, has earned the Chartered Financial Analyst (CFA) designation, and currently sits on the Nuveen Asset Management Investment Management Committee.
Item 8(a)(2). OTHER ACCOUNTS MANAGED BY THE PORTFOLIO MANAGER
Actual or apparent conflicts of interest may arise when a portfolio manager has day-to-day management responsibilities with respect to more than one account. More specifically, portfolio managers who manage multiple accounts are presented a number of potential conflicts, including, among others, those discussed below.
The management of multiple accounts may result in a portfolio manager devoting unequal time and attention to the management of each account. Nuveen Asset Management seeks to manage such competing interests for the time and attention of portfolio managers by having portfolio managers focus on a particular investment discipline. Most accounts managed by a portfolio manager in a particular investment strategy are managed using the same investment models.
If a portfolio manager identifies a limited investment opportunity which may be suitable for more than one account, an account may not be able to take full advantage of that opportunity due to an allocation of filled purchase or sale orders across all eligible accounts. To deal with these situations, Nuveen Asset Management has adopted procedures for allocating limited opportunities across multiple accounts.
With respect to many of its clients’ accounts, Nuveen Asset Management determines which broker to use to execute transaction orders, consistent with its duty to seek best execution of the transaction. However, with respect to certain other accounts, Nuveen Asset Management may be limited by the client with respect to the selection of brokers or may be instructed to direct trades through a particular broker. In these cases, Nuveen Asset Management may place separate, non-simultaneous, transactions for a Fund and other accounts which may temporarily affect the market price of the security or the execution of the transaction, or both, to the detriment of the Fund or the other accounts.
Some clients are subject to different regulations. As a consequence of this difference in regulatory requirements, some clients may not be permitted to engage in all the investment techniques or transactions or to engage in these transactions to the same extent as the other accounts managed by the portfolio manager. Finally, the appearance of a conflict of interest may arise where Nuveen Asset Management has an incentive, such as a performance-based management fee, which relates to the management of some accounts, with respect to which a portfolio manager has day-to-day management responsibilities.
Nuveen Asset Management has adopted certain compliance procedures which are designed to address these types of conflicts common among investment managers. However, there is no guarantee that such procedures will detect each and every situation in which a conflict arises.
Item 8(a)(3). FUND MANAGER COMPENSATION
As of the most recently completed fiscal year end, the primary portfolio manager’s compensation is as follows:
Portfolio manager compensation consists primarily of base pay, an annual cash bonus and long term incentive payments.
A portion of each portfolio manager’s annual cash bonus is based on the Fund’s pre-tax investment performance, generally measured over the past one- and three or five-year periods unless the portfolio manager’s tenure is shorter. Investment performance for the Fund generally is determined by evaluating the Fund’s performance relative to its benchmark(s) and/or Lipper industry peer group.
A portion of the cash bonus is based on a qualitative evaluation made by each portfolio manager’s supervisor taking into consideration a number of factors, including the portfolio manager’s team collaboration, expense management, support of personnel responsible for asset growth, and his or her compliance with Nuveen Asset Management’s policies and procedures.
The final factor influencing a portfolio manager’s cash bonus is the financial performance of Nuveen Asset Management based on its operating earnings.
There are generally no differences between the methods used to determine compensation with respect to the Fund and the Other Accounts shown in the table above.
Item 8(a)(4). OWNERSHIP OF NJV SECURITIES AS OF FEBRUARY 28, 2019