Nuveen makes things e-simple.
It only takes a minute to sign up for e-Reports. Once enrolled, you’ll receive an e-mail as soon as your Nuveen Fund information is ready—no more waiting for delivery by regular mail. Just click on the link within the e-mail to see the report and save it on your computer if you wish.
Free e-Reports right to your e-mail!
www.investordelivery.com
If you receive your Nuveen Fund dividends and statements from your financial professional or brokerage account.
or
www.nuveen.com/client-access
If you receive your Nuveen Fund dividends and statements directly from Nuveen.
NOT FDIC INSURED MAY LOSE
VALUE NO BANK GUARANTEE
Table of Contents
| | |
| 4 |
| | |
| 5 |
| | |
| 14 |
| | |
| 15 |
| | |
| 17 |
| | |
| 25 |
| | |
| 26 |
| | |
| 27 |
| | |
| 50 |
| | |
| 51 |
| | |
| 52 |
| | |
| 54 |
| | |
| 58 |
| | |
| 69 |
| | |
| 71 |
| | |
| 72 |
| | |
| 74 |
3
Chair’s Letter to Shareholders
Dear Shareholders,
A year has passed since the World Health Organization declared COVID-19 a global pandemic in March 2020. A year of global economic recession, financial market turbulence and some immeasurable losses. A year later the health crisis persists but the widespread distribution of vaccines in the U.S. is enabling us to look forward to what our “new normal” might be. In the meantime, extraordinary economic interventions by governments and central banks, around the world, are helping to bridge the gap.
With vaccine progress and economic stimulus beginning to provide real benefits to the global economy, markets are anticipating a strong rebound in growth, especially in the U.S. To extend relief programs enacted earlier in the crisis, the U.S. government passed $900 billion in aid to individuals and businesses in late December 2020. Another $1.9 trillion relief package was signed into law in March 2021 providing extended unemployment benefits, direct payments to individuals and families, assistance to state and local municipalities, grants to education and public health, and other support. The U.S. Federal Reserve, along with other central banks around the world, has pledged to keep monetary conditions accommodative for as long as necessary, as they consider the recent increase in inflation risks as transitory.
While the markets’ longer-term outlook has brightened, we expect intermittent bouts of volatility to continue. COVID-19 cases are still elevated in some regions, as more virulent strains have spread and vaccination rollouts have been uneven around the world. The recovery hinges on controlling the virus, and estimates vary considerably on when economic activity might be fully restored. While achieving sufficient inoculation of the population depends on many variables, including logistics, public confidence, real-world efficacy and the emergence of variant virus strains, vaccination rates are gathering pace and three options (Pfizer/BioNTech, Moderna and Johnson & Johnson) were authorized for use in the U.S. By early April the U.S. was administering an average of 3 million doses per day, up from 1.3 million per day on average at the beginning of February, according to Bloomberg’s vaccine tracker. On the political front, the Biden administration’s full policy agenda and the potential for Congressional gridlock remain to be seen, either of which could cause investment outlooks to shift. Nevertheless, short-term market fluctuations can provide opportunities to invest in new ideas as well as upgrade existing positioning within our goal of providing long-term value for our shareholders. For more than 120 years, the careful consideration of risk and reward has guided Nuveen’s focus on delivering long-term results to our shareholders.
If you have concerns about what’s coming next, it can be an opportune time to assess your portfolio’s resilience and readiness. We encourage you to review your time horizon, risk tolerance and investment goals with your financial professional. On behalf of the other members of the Nuveen Fund Board, we look forward to continuing to earn your trust in the months and years ahead.
Terence J. Toth
Chair of the Board
April 23, 2021
4
Portfolio Managers’ Comments
Nuveen California Municipal Value Fund 2 (NCB)
Nuveen New Jersey Municipal Value Fund (NJV)
Nuveen New York Municipal Value Fund 2 (NYV)
Nuveen Pennsylvania Municipal Value Fund (NPN)
These Funds feature portfolio management by Nuveen Asset Management, LLC (NAM), an affiliate of Nuveen Fund Advisors, LLC, the Funds’ investment adviser. Portfolio managers Paul L. Brennan, CFA, and Scott R. Romans, PhD, review U.S. economic and market conditions, key investment strategies and the twelve-month performance of the Nuveen California, New Jersey, New York and Pennsylvania Funds. Paul assumed portfolio management responsibility for the New Jersey and Pennsylvania Funds in 2011. Scott assumed portfolio management responsibility for the California Fund in 2003 and the New York Fund in 2011.
What factors affected the U.S. economy and the market during the twelve-month annual reporting period ended February 28, 2021?
The U.S. economy rebounded more quickly than expected from the deep downturn caused by the COVID-19 crisis and containment measures, but had not made a full recovery by the end of 2020. The economy fell into a deep recession in February 2020 due to the restrictions on business and social activity to mitigate the COVID-19 spread. In the first and second quarters of 2020, annualized gross domestic product (GDP) shrank 5% and 31.4%, respectively. Government relief programs provided significant aid to individuals and businesses as the economy began reopening in May 2020, which helped the economy bounce back strongly over the second half of the year. U.S. GDP grew 4.3% on an annualized basis in the fourth quarter of 2020 and 33.4% (annualized) in the third quarter, but remained down 3.5% in 2020 overall (from the 2019 annual level to the 2020 annual level) as measured by the Bureau of Economic Analysis “third” estimate. GDP measures the value of goods and services produced by the nation’s economy less the value of the goods and services used up in production, adjusted for price changes.
Although, consumer spending, the largest driver of the economy, remained resilient despite the disruption caused by the health and economic crisis, it declined significantly as unemployment rose sharply starting in March 2020. These measures rebounded markedly in the second half of 2020, although the momentum slowed toward the end of 2020 amid a resurgence of COVID-19 infections. As of February 2021, slightly more than half of the 22 million jobs lost in March and April 2020 have been recovered resulting in an unemployment rate of 6.2% in February 2021 as reported by the Bureau of Labor Statistics, up from 3.5% in February 2020. The average hourly earnings rate increased, growing at an annualized rate of 5.3% in February 2021, despite the spike in unemployment.
This material is not intended to be a recommendation or investment advice, does not constitute a solicitation to buy, sell or hold a security or an investment strategy and is not provided in a fiduciary capacity. The information provided does not take into account the specific objectives or circumstances of any particular investor, or suggest any specific course of action. Investment decisions should be made based on an investor’s objectives and circumstances and in consultation with his or her advisors.
Certain statements in this report are forward-looking statements. Discussions of specific investments are for illustration only and are not intended as recommendations of individual investments. The forward-looking statements and other views expressed herein are those of the portfolio manager as of the date of this report. Actual future results or occurrences may differ significantly from those anticipated in any forward-looking statements, and the views expressed herein are subject to change at any time, due to numerous market and other factors. The Funds disclaim any obligation to update publicly or revise any forward-looking statements or views expressed herein.
For financial reporting purposes, the ratings disclosed are the highest rating given by one of the following national rating agencies: Standard & Poor’s Group (S&P), Moody’s Investors Service, Inc. (Moody’s) or Fitch, Inc. (Fitch). This treatment of split-rated securities may differ from that used for other purposes, such as for Fund investment policies. Credit ratings are subject to change. AAA, AA, A and BBB are investment grade ratings, while BB, B, CCC, CC, C and D are below investment grade ratings. Holdings designated N/R are not rated by these national rating agencies.
Bond insurance guarantees only the payment of principal and interest on the bond when due, and not the value of the bonds themselves, which will fluctuate with the bond market and the financial success of the issuer and the insurer. Insurance relates specifically to the bonds in the portfolio and not to the share prices of a Fund. No representation is made as to the insurers’ ability to meet their commitments.
Refer to the Glossary of Terms Used in this Report for further definition of the terms used within this section.
5
Portfolio Managers’ Comments (continued)
Earnings data was skewed by the concentration of job losses in lower-wage work, which effectively eliminated most of the low-wage data, resulting in an average of mostly higher numbers. The overall trend of inflation remained muted, as decreases in apparel, transportation and pharmaceutical drug prices offset an increase in food, energy and used car prices. The Bureau of Labor Statistics said the Consumer Price Index (CPI) increased 1.7% over the twelve-month reporting period ended February 28, 2021, before seasonal adjustment.
With the onset of the COVID-19 crisis, the Federal Reserve (Fed) enacted an array of emergency measures in March 2020 to stabilize the financial system and support the markets, including cutting its main interest rate to near zero, offering lending programs to aid small and large companies and allowing unlimited bond purchases, known as quantitative easing. In August 2020, the Fed announced a change in its inflation targeting policy, moving from a program of absolute targeting to an average inflation targeting policy. Under this regime, the Fed will tolerate the inflation rate temporarily overshooting the target rate to offset periods of below-target inflation, so that inflation averages a 2% target rate over time. Fed officials remained cautious, acknowledging the economy’s significant improvement from the COVID-19 recession but also expressing concerns about near-term weakness, and left monetary policy unchanged over the remainder of their meetings in 2020 and early 2021.
The federal government also intervened with historic relief measures, starting with three aid packages in March and April 2020. These included $2 trillion allocated across direct payments to Americans, an expansion of unemployment insurance, loans to large and small businesses, funding to hospitals and health agencies and support to state and local governments, and more than $100 billion in funding to health agencies and employers offering paid leave. In December 2020, the government enacted a $900 billion relief package extending some of these programs, and followed in March 2021 with another $1.9 trillion deal providing support to individuals and families, small businesses, state and local governments, education and public health/vaccination.
The COVID-19 crisis rapidly dwarfed all other market concerns starting in late February 2020. Equity and commodity markets sold off and safe-haven assets rallied in March 2020 as countries initiated quarantines, restricted travel and shuttered factories and businesses. The potential economic shock was particularly difficult to assess at the time, which amplified market volatility. An ill-timed oil price war between the Organization of the Petroleum Exporting Countries (OPEC) and non-OPEC member Russia, which caused oil prices to plunge in March 2020, exacerbated the market sell-off. At year end, the announcement of high efficacy rates in several COVID-19 vaccine trials, followed by regulatory authorizations and public vaccination drives across Western countries, improved the outlook for 2021 and led to risk-on sentiment in the markets. Market volatility picked up in early 2021, however, as a stronger economic outlook and improving vaccination rates led to rising inflation concerns and an increase in long-term interest rates.
Geopolitical uncertainty remained elevated during 2020 in anticipation of the U.S. presidential election in November 2020 and the Brexit transition period set to expire in December 2020. However, political risks began to ease with the election of President Joe Biden and a final deal struck between the European Union and U.K. before the end of the transition period. Although China and the U.S. signed a “phase one” trade deal in January 2020, tensions continued to flare over other trade and technology/security issues, Hong Kong’s sovereignty and the management of the COVID-19 crisis.
Despite the severe sell-off in March 2020 and an abrupt increase in interest rates toward the end of the reporting period, the broad municipal bond market managed positive performance in the twelve-month reporting period overall. For most of the reporting period, a significant decline in interest rates drove municipal bond prices higher, with positive technical and fundamental conditions also supporting credit spread tightening. This contrasted sharply with the beginning of the reporting period when coronavirus risks drove U.S. Treasury yields to historic lows and rate volatility increased sharply during a six-week period from late February to the end of March 2020. As liquidity became stressed, investors began to liquidate any asset possible, including municipal bonds. Municipal bond prices declined rapidly (and yields spiked higher), amid rampant selling across both the high grade and high yield segments
6
that was exacerbated in some cases by exchange-traded fund and closed-end fund selling. Municipal bond prices became severely dislocated from Treasury prices. Credit spreads widened significantly during the March 2020 sell-off, ending the month above their long-term average. Ongoing monetary and fiscal interventions from the Fed and U.S. government helped the market stabilize, then recover over the course of 2020.
The municipal yield curve steepened over this reporting period, initially driven by a pronounced drop in yields at the short end of the curve. Then a new steepening cycle began in early 2021 as markets priced in a stronger economic recovery and higher inflation, fueled by increasing vaccination rates and more federal stimulus, which drove longer-term interest rates higher.
Municipal bond gross issuance nationwide remained strong in the reporting period, with deals postponed rather than canceled during the COVID-driven sell-off. The overall low level of interest rates has encouraged issuers to continue to actively refund their outstanding debt. In these transactions the issuers are issuing new bonds and taking the bond proceeds and redeeming (calling) old bonds. These refunding transactions have ranged from 30% to 60% of total issuance over the past few years. Thus, the net issuance (all bonds issued less bonds redeemed) is actually much lower than the gross issuance. This lower net issuance was an overall positive technical factor on municipal bond investment performance in recent years. Notably, taxable municipal bond issuance has increased meaningfully since the advent of the Tax Cut and Jobs Act of 2017, which prohibits municipal issuers from issuing new tax-exempt bonds to pre-refund existing tax-exempt bonds. However, municipalities have taken advantage of the low interest rate environment and the strong demand for yield to issue taxable municipal debt, enabling them to save on net interest costs while adding to the scarcity value of tax-exempt issues.
While municipal bond funds suffered significant outflows in March 2020, particularly from high yield municipal bond funds, fund flows rebounded strongly over the remainder of 2020 and sustained a robust pace through early 2021. Demand has been resilient even though municipal defaults, as expected, have increased somewhat during the COVID-19 crisis. Notably, default activity has occurred mainly in sectors with greater COVID-19 risk exposure, such as senior living, corporate-backed and real estate-backed. Moreover, while there are some pockets of municipal credit ratings stress, a wave of downgrades has not materialized. With interest rates in the U.S. and globally still near all-time lows, even after the recent increase in long-term rates, the appetite for yield has continued to drive investors toward higher after-tax yielding assets, including U.S. municipal bonds. Additionally, as tax payers have adjusted to the 2017 tax law, which caps the state and local tax (SALT) deduction for individuals, there has been increased demand for tax-exempt municipal bonds, especially in states with high income taxes and/or property taxes.
How were the economic and market environments in California, New Jersey, New York and Pennsylvania during the twelvemonth reporting period ended February 28, 2021?
California’s $3.1 trillion economy is the largest in the United States and ranks fifth in the world, according to the International Monetary Fund. California job growth regained some of the lost jobs over the summer but lags the national average. California’s economy is driven by high technology, international trade and tourism but is also supplemented by better residential construction and real estate conditions. The state’s unemployment rate was 8.5% as of February 2021, down from its recent peak of 16.2% in April 2020 but still high compared to pre-COVID-19 crisis unemployment rate of 4.3% in February 2020 and higher than the nation’s 6.2% as of February 2021. According to the S&P CoreLogic Case-Shiller Index, home prices in San Diego, Los Angeles and San Francisco rose 14.2%, 10.8% and 9.5%, respectively, over the twelve months ended January 2021 (most recent data available at the time this report was prepared), compared with an average increase of 11.2% nationally. The enacted Fiscal Year 2021 general fund budget totals $133.9 billion, which is 8.9% lower than the revised Fiscal Year 2020 budget. The Fiscal Year 2021 Budget projected a $54.3 billion deficit due to the economic fallout from the COVID-19 crisis shutdowns. The state made various cuts to education, health and human services, and government operations, which include drawing down on reserves, borrowing from internal funds, deferred
7
Portfolio Managers’ Comments (continued)
revenue to schools and making temporary tax law changes to fill the gap. Governor Newsom released his Budget Proposal for Fiscal Year 2021-2022 in January 2021 totaling $154.51 billion. This is up 5.5% over revised Fiscal Year 2021 Budget. Revenues are nearly back to pre-COVID-19 crisis levels and state costs have not risen as dramatically as anticipated, and as a result, the state experiences a significant windfall of $15 billion to be allocated toward the Fiscal Year 2022 Budget. The state plans to use those funds on one-time or temporary spending, making deposits to reserves, reducing taxes to low income taxpayers and repaying debts and liabilities made in Fiscal Year 2021 and additional payments to CalPERS (California Public Employees' Retirement System). The revised budget will come in May 2021. The Budget proposal does not factor in federal stimulus enacted in December 2020 nor the American Rescue Plan Act funding. California is estimated to receive $42 billion under the American Rescue Plan: $26 billion for the state and $16 billion for its local governments. For the state of California, its Fiscal Year end is June 30, 2021. Due to the COVID-19 crisis, the state’s budget will be impacted to a varying degree as tax receipts are reduced and the expense to fight the virus increases. As of February 2021, Standard & Poor’s affirmed its AA-/Stable rating and outlook on California general obligation (GO) debt and Moody’s Investors Service affirmed its state GO rating of Aa2 with a stable outlook. Moody’s upgraded the state’s GO on October 14, 2019 to Aa2, citing its “continued expansion of the state's massive, diverse and dynamic economy and corresponding growth in revenue. The action also recognizes the state government's disciplined approach to managing revenue growth indicated by its use of surplus funds to build reserves and pay down long-term liabilities.”
New Jersey’s economy is slowly recovering from the pandemic. Several characteristics that historically positioned the state to do quite well, such as its proximity to New York City’s extensive job market, a shoreline along the Atlantic coast that benefits from a strong tourism industry and two large transportation hubs in the Port of New York and New Jersey and Newark airport, exposed the state to the epicenter of the virus outbreak. New Jersey lost 341,700 jobs in 2020, led by declines in leisure and hospitality as well as education and health services sectors. After steep losses at the beginning of the pandemic, from April to December, the state regained 49% of jobs lost. This is lower than the 55.5% of jobs regained nationally. New Jersey’s unemployment rate peaked at 16.6% in April 2020 and has declined to 7.8% as of February 2021, well above the national rate of 6.2%. New Jersey continues to be challenged by a structural budget gap and low reserves. For Fiscal Year 2021, the state implemented a “millionaire’s tax,” cut expenses and issued $4.3 billion in bonds to finance the expected budget deficit. Revenue has declined less than originally projected, allowing Governor Murphy to propose funding 100% of the actuarially recommended pension contribution in the Fiscal Year 2022 budget, one year earlier than expected. The governor’s budget proposal does not raise taxes but spends down $4 billion in reserves. The budget that is ultimately enacted by the legislature could vary from this proposal, particularly since the state will be receiving federal stimulus funds from the American Rescue Plan that were not accounted for in the governor’s spending plan. For the state of New Jersey, its Fiscal Year end is June 30, 2021. The state carries a BBB+ rating and stable outlook by S&P and A- rating and negative outlook by Fitch. On April 9, 2021 (subsequent to the close of the reporting period), Moody’s affirmed its rating on New Jersey’s general obligation debt at A3 but changed the outlook to stable from negative.
New York State’s $1.7 trillion economy represents 8.0% of U.S. gross domestic product and, according to the International Monetary Fund, would be the eleventh largest economy in the world on a stand-alone basis. Prior to the COVID-19 crisis, New York State's financial profile had generally improved over the previous decade, and Fiscal Year 2020 saw New York State post a $355 million General Fund surplus, equal to 0.9% of General Fund revenues. New York State's economy has been severely impacted by the COVID-19 crisis. Unemployment for the state topped out at 16.2% in April 2020, well above the national peak of 14.8%. New York State’s unemployment stood at 8.9% in February 2021, exceeding the national average of 6.2% and second worst in the nation. New York State’s Fiscal Year 2021 budget contained appropriations for all state debt service, introduced no new taxes and held school funding basically level. In response to the uncertainty surrounding the impact of the COVID-19 crisis, the budget legislation authorized up to $11 billion of borrowing if necessary and also authorized the state budget director to make spending reductions should they be required. Fiscal Year 2021 revenues were not as dire as initially feared, and have come in ahead of earlier estimates.
8
This, coupled with certain expenditure reductions, has allowed the state to project that Fiscal Year 2021 will end in balance. New York State is in line to receive $12.2 billion in federal assistance for the state government alone under the American Recovery Act. Total state-wide assistance to both the state and local governments is estimated at $50 billion. For the state of New York, its Fiscal Year end is March 31, 2021. New York is a high-income state, with per-capita income at 126% of the U.S. average, third highest among the 50 states. New York is also a heavily indebted state. According to Moody's, New York ranked fifth in the nation in debt per capita in 2019 (NY: $3,314; median: $1,071), eighth in debt per capita as a percentage of personal income (NY: 4.6%; median: 2.0%) and ninth in debt to gross state domestic product (NY: 3.7%; median: 1.9%). The state’s pensions have traditionally been well funded, with a combined funding ratio of 95.7% in Fiscal Year 2020. On March 12, 2021, Moody’s affirmed its “Aa2” stable rating on New York State. Moody’s had downgraded New York State from Aa1 to Aa2 on October 1, 2020, citing the challenges from the COVID-19 crisis. S&P confirmed its “AA+” rating for New York State on March 12, 2021. However, S&P’s outlook for New York State’s rating is negative, citing the impact of the COVID-19 crisis on the state’s economy. Municipal bond supply totaled $53.2 billion for the twelve-month period ended February 28, 2021, a 10.1% increase from the same period a year earlier. This ranked New York third among state issuers behind only California and Texas.
Pennsylvania has the sixth-largest economy among U.S. states, based on a 2019 real total GDP of $726.2 billion. The Commonwealth is home to 12.8 million residents, making it the fifth-largest state by population. Severe job losses associated with the fallout of the COVID-19 crisis caused employment in Pennsylvania to contract by 7.3% on a year-over-year basis, as of February 2021. The nation’s employment contracted by 6.2% over the same period. Pennsylvania’s economy is large and diverse, but it has lagged the U.S. for the better part of a decade in terms of job, GDP and income growth. Pennsylvania’s Independent Fiscal Office projects that it will take six years for the Commonwealth’s labor market to return to its pre-COVID-19 crisis level. Pennsylvania came into the current economic recession with a weaker financial position than most states. This is most evident in the state’s very slim budget reserve, which covers just 0.3 days of expenses. Through February 2021, General Fund collections totaled $23.9 billion, which is $901.3 million, or 3.9%, above estimate. Pennsylvania received $4.7 billion in federal aid under the CARES Act in 2020, with $2.2 billion of the funds allocated to eligible local governments. An estimated $7.3 billion of federal relief funding is expected to come to the Pennsylvania state government from the American Rescue Plan Act of 2021. Governor Wolf’s Fiscal Year 2022 proposed budget totals $37.8 billion and is a $3.8 billion (11.1%) increase over the prior year. The budget includes a $1.35 billion increase in K-12 spending as well as $3 billion over a ten-year period to workers and businesses to recover from the COVID-19 crisis. Funding for this spending increase comes from a proposal to raise income taxes from 3.07% to 4.49% on higher-income earners, legalizing and taxing marijuana, and a severance tax on the natural gas industry. The Commonwealth has an above-average debt burden relative to other states. Its net tax-supported debt totaled $19.4 billion in 2019, which is 2.6% of state personal income, compared to the Moody’s 50-state median of 2.0%. For the state of Pennsylvania, its Fiscal Year end is June 30, 2021. Pennsylvania’s adjusted net pension liability totaling $79 billion is also above average, ranking it the fifth highest among the states. As of March 2021, Pennsylvania’s general obligation (GO) debt was rated Aa3 by Moody’s and A+ by S&P.
What key strategies were used to manage these Funds during the twelve-month reporting period ended February 28, 2021?
The Nuveen California Municipal Value Fund 2 seeks to provide current income exempt from both regular federal and California state income taxes by investing primarily in a portfolio of municipal obligations issued by state and local government authorities within the state of California or certain U.S. territories. Under normal market conditions, the Fund invests at least 80% of the sum of its net assets and the amount of any borrowings for investment purposes in municipal bonds that pay interest that is exempt from regular federal personal income tax and California’s personal income tax. The Fund may invest up to 20% in municipal securities that are exempt from regular federal income tax, but not from California’s income tax if, in the Sub-Adviser’s judgement, such purchases are expected to enhance the Fund’s after-tax total return potential. To the extent that the Fund invests in bonds of municipal issuers
9
Portfolio Managers’ Comments (continued)
located in other states, the Fund may have income that is not exempt from state personal income tax. NCB’s use of tender option bonds to more efficiently implement its investment strategy may create up to 10% effective leverage.
The Nuveen New Jersey Municipal Value Fund’s primary investment objective is to provide current income exempt from regular federal and New Jersey income taxes; secondary investment objective is to enhance portfolio value and total return. The Fund invests in municipal securities that are exempt from federal and New Jersey state income taxes. The Fund invests at least 80% of its managed assets in municipal securities rated investment grade at the time of investment, or, if they are unrated, are judged by the portfolio manager to be of comparable quality. The Fund may invest up to 20% of managed assets in municipal securities that are not exempt from New Jersey state income taxes if the portfolio manager believes doing so would enhance the Fund’s after-tax total returns. The Fund may invest up to 20% of its managed assets in municipal securities rated below investment quality or judged by the portfolio manager to be of comparable quality, of which up to 10% of its managed assets may be rated below B-/B3 or of comparable quality. The Fund may invest in inverse floating rate municipal securities, also known as tender option bonds. The Fund’s use of tender option bonds to more efficiently implement its investment strategy may create up to 10% effective leverage.
The Nuveen New York Municipal Value Fund 2’s investment objective is to provide current income exempt from both regular federal and New York state income taxes by investing primarily in a portfolio of municipal obligations issued by state and local government authorities within the state of New York or certain U.S. territories. Under normal market conditions, the Fund invests at least 80% of the sum of its net assets and the amount of any borrowings for investment purposes in municipal bonds that pay interest that is exempt from regular federal personal income tax and a single state’s personal income tax. The Fund may invest up to 20% in municipal securities that are exempt from regular federal income tax, but not from that single state’s income tax if, in the Sub-Adviser’s judgement, such purchases are expected to enhance the Fund’s after-tax total return potential. To the extent that the Fund invests in bonds of municipal issuers located in other states, the Fund may have income that is not exempt from state personal income tax. The Fund’s use of tender option bonds to more efficiently implement its investment strategy may create up to 10% effective leverage.
The Nuveen Pennsylvania Municipal Value Fund’s primary investment objective is to provide current income exempt from regular federal and Pennsylvania income taxes; secondary investment objective is to enhance portfolio value and total return. The Fund invests in state municipal securities that are exempt from federal, Pennsylvania state, and local income taxes. The Fund invests at least 80% of its managed assets in municipal securities rated investment grade at the time of investment, or, if they are unrated, are judged by the portfolio manager to be of comparable quality. The Fund may invest up to 20% of managed assets in municipal securities that are not exempt from Pennsylvania state income taxes if the portfolio manager believes doing so would enhance the Fund’s after-tax total returns. The Fund may invest up to 20% of its managed assets in municipal securities rated below investment quality or judged by the portfolio manager to be of comparable quality, of which up to 10% of its managed assets may be rated below B-/B3 or of comparable quality. The Fund may invest in inverse floating rate municipal securities, also known as tender option bonds. The Fund’s use of tender option bonds to more efficiently implement its investment strategy may create up to 10% effective leverage.
The twelve-month reporting period was bookended by challenging conditions in the municipal bond market, with the advent of the COVID-19 crisis at the beginning of the reporting period and a sudden increase in long-term interest rates at the end of the reporting period. The health and economic crisis and the anticipated recovery from the COVID-19 crisis recession contributed to elevated interest rate volatility and considerable swings in municipal market valuations during this reporting period. Despite these fluctuations, municipal yields ended the reporting period slightly higher than where they began and credit spreads largely recovered from the dramatic widening seen at the peak of the market sell-off in March-April 2020. The municipal yield curve steepened over the reporting period as a whole, with the market pricing in the prospects for a strengthening economic recovery aided by massive fiscal stimulus, accommodative monetary policy and vaccination progress. At the state level, both the New Jersey and Pennsylvania
10
municipal markets outperformed the national market during the reporting period and the California and New York municipal markets underperformed the national market, as measured by their respective state S&P Municipal Bond Indexes.
The Funds’ trading activity continued to focus on pursuing each Fund’s investment objectives and continued to seek bonds in areas of the market that were expected to demonstrate resilience and perform well over the long term. Additionally, as closed ends funds do not need to manage cash to meet investor redemptions, the Funds weren’t forced to sell positions during periods of market turbulence.
For NJV and NPN, trading activity was somewhat lighter during this reporting period as the Funds were well positioned for the environment and the prevailing environment offered fewer opportunities to replace positions with more attractive names. Portfolio turnover was mainly driven by the proceeds from called and maturing bonds, bond coupon income and a small amount of strategic and tactical sales. In preparation for the NJV and NPN mergers after the close of the reporting period, we sold all of NJV’s and NPN’s alternative minimum tax (AMT) bonds because the acquiring Fund has an AMT-free mandate.
The state of New Jersey was an active issuer during this reporting period, with three deals coming to market in November 2020, December 2020 and January 2021 for COVID-19 GO Emergency Bonds, New Jersey Transportation Trust Fund Authority and New Jersey Economic Development Authority. NJV participated in all three new issues, which were well received by the marketplace. Additionally, the New Jersey Fund added issues for Atlantic City Electric, New Jersey Housing and Mortgage Finance Agency, New Jersey-American Water Company, New Jersey State Turnpike Authority and a number of county and local municipalities (including Mercer, Monmouth and Union counties). NJV also bought New Jersey Higher Education Assistance Authority bonds.
NPN bought bonds issued by two school districts (Philadelphia and Allentown), St. Luke’s Hospital Bethlehem, Pennsylvania Housing Finance Agency, Philadelphia Gas Works and Williamsport Sanitary Authority Sewer. Management continued to limit the New Jersey and Pennsylvania Funds’ exposure to each state’s government debt due to concerns about their fiscal health that predated the COVID-19 crisis.
Also during this reporting period, NPN acquired shares in Energy Harbor when its holdings of certain municipal bonds issued by FirstEnergy Solutions were converted into Energy Harbor equity as part of FirstEnergy Solution’s emergence from bankruptcy protection. Over time, NPN expects to sell these shares and reinvest the proceeds into municipal bonds.
For NCB and NYV, the prevailing market environment was favorable for the Funds to pursue both bond swapping and bond rotation strategies during the reporting period. The Funds’ employed a tax loss swapping strategy, which entails selling depreciated bonds with lower yields and buying similarly structured but higher yielding bonds. For example, the Funds’ sold and then bought the same name with a longer maturity structure, which in effect offered a higher yield for the same credit or sold a position to replace it with a similar name bond or structure as the prevailing yields moved higher. This approach was implemented to enhance each Fund’s income earning capability and seek to make the Funds more tax efficient. The Funds’ bond rotation strategy involved selling a higher quality, lower yielding bond to buy a lower rated, higher yielding bond, when the valuations looked relatively more favorable for the lower rated bond. For NCB, the trading activity during this reporting period resulted in net additions to airports and airport-related projects, multi-family housing, health care, charter schools and Puerto Rico (namely in COFINAs). For NYV, there were net additions to public transportation, airports, airline gates secured by airline leases, health care and Puerto Rico (primarily COFINAs).
During the twelve-month reporting period, NJV and NPN used inverse floating rate securities. The Funds' employ inverse floaters for a variety of reasons, including duration management, income enhancement and total return enhancement. As part of the Funds’ duration management strategies, the two Funds used U.S. Treasury futures as part of an overall portfolio construction strategy to manage portfolio duration and yield curve exposure. The hedging strategies performed as expected given the direction of interest rates during
11
Portfolio Managers’ Comments (continued)
the reporting period, the Treasury futures had a positive impact to NJV and NPN, which enabled the Funds to invest in longer duration bonds that were contributors to performance and helped support the Funds’ dividends. The Treasury futures positions were eliminated from the two Funds prior to the end of the reporting period.
How did the Funds perform during the twelve-month reporting period ended February 28, 2021?
The tables in the Performance Overview and Holding Summaries section of this report provide total returns at net asset value (NAV) for the period ended February 28, 2021. Each Fund’s total returns at net asset value (NAV) are compared with the performance of corresponding market indexes.
For the twelve-month reporting period ended February 28, 2021, the total returns on common share NAV for all four Funds underperformed their respective state’s S&P Municipal Bond Index.
The Funds' were positioned with longer duration profiles than their respective state’s S&P Municipal Bond Index. NCB and NYV’s duration and yield curve positioning detracted from performance relative to their respective state indexes. Duration had a neutral impact on NJV and a small positive impact on NPN, with the steepening yield curve a slight headwind to both Funds.
In terms of credit quality and sector positioning, the Funds continued to emphasize lower rated, higher yielding bonds and sectors, which tended to outperform high grade, low yielding bonds and sectors. For NCB, credit ratings allocations had a relatively neutral impact on relative performance versus the California index because the Fund was less exposed to the strong outperformance of B rated credit, while NYV’s overweight allocations to BBB rated and below investment grade credits contributed positively to performance relative to the New York index. NJV’s credit ratings and sector allocations detracted from performance relative to the New Jersey index. The Fund holds less exposure than the state index to state appropriation debt, much of which is BBB rated, and the resulting underweight to both the sector and BBB rated credit cost NJV in terms of relative performance. Credit quality and sector positioning for NPN was unfavorable relative to the Pennsylvania index, as lower rated bonds severely underperformed during the pandemic sell-off and only partially recovered over the remainder of the reporting period.
The strongest performing sectors of the California municipal market included tobacco, other revenue, health care and pre-refunded bonds, while the education, transportation (airports), health care (primarily life care) and industrial development revenue (IDR) sectors were the weakest performers. For New Jersey, the better performing sectors included transportation, housing, tobacco and other revenue, and NJV held underweights in each of these sectors except housing. But New Jersey saw the most weakness in the education sector (where NJV was overweighted), while the tax-supported (slight overweight), health care (overweight) and pre-refunded sectors (neutral weight) trailed only marginally. The best performing areas of the New York municipal market were the utilities, tobacco and IDR sectors, and the bottom performing sectors were education, transportation (airports and public transportation) and health care (life care). Pennsylvania's municipal market was led by the tax supported, transportation and utility sectors (and NPN was overweighted in utility and underweight in tax supported and transportation), whereas the biggest laggards were the health care, IDR and housing sectors (and NPN held overweights in each sector).
Security selection in NJV added value relative to the New Jersey index. The Fund had more favorable yield curve/duration positioning in its state debt selections, including GOs, New Jersey Transportation Trust Fund Authority and New Jersey Economic Development Authority. However, some of the relative gain was offset by our selection in housing and education bonds. Holdings in housing bonds underperformed as the low interest rate environment accelerated mortgage refinancing activity, shortening the expected average life of the bonds. NJV’s education holdings included a number of smaller, lower rated private schools (such as
12
Rider University, Stevens Institute of Technology and Seton Hall), student residence halls project and student loan debt, which hadn’t rebounded to the same extent as higher rated education credits.
Mixed performance from NPN’s security selection resulted in an overall neutral impact to relative performance versus the state index. Our selection was most beneficial in the utilities, transportation, IDR, housing and tax supported debt sectors. In the utilities sector, a position in Energy Harbor stock was the leading performer as the stock price recovered from negative headline risk earlier in the reporting period. The Fund owns Energy Harbor common stock after certain bonds held by the Fund were converted to equity as part of the company’s exit from bankruptcy in February 2020. However, selection in health care and education credits was disadvantageous.
13
IMPACT OF THE FUNDS’ LEVERAGE STRATEGIES ON PERFORMANCE
One important factor impacting the returns of the Funds’ common shares relative to their comparative benchmarks was the Funds’ use of leverage through investments in inverse floating rate securities, which represent leveraged investments in underlying bonds. The Funds use leverage because our research has shown that, over time, leveraging provides opportunities for additional income. The opportunity arises when short-term rates that a Fund pays on its leveraging instruments are lower than the interest the Fund earns on its portfolio of long-term bonds that it has bought with the proceeds of that leverage. This has been particularly true in the recent market environment where short-term rates have been low by historical standards.
However, use of leverage can expose Fund common shares to additional price volatility. When a Fund uses leverage, the Fund’s common shares will experience a greater increase in their net asset value if the municipal bonds acquired through the use of leverage increase in value, but will also experience a correspondingly larger decline in their net asset value if the bonds acquired through leverage decline in value. All this will make the shares’ total return performance more variable over time.
In addition, common share income in levered funds will typically decrease in comparison to unlevered funds when short-term interest rates increase and increase when short-term interest rates decrease. In recent quarters, fund leverage expenses have generally tracked the overall movement of short-term tax-exempt interest rates. While fund leverage expenses are somewhat higher than their recent lows, leverage nevertheless continues to provide the opportunity for incremental common share income, particularly over longer-term periods.
The use of leverage through inverse floating rate securities had a negligible impact on the performance of NJV and NPN over the reporting period. NCB and NYV did not utilize leverage over the reporting period.
| | | | | |
| As of February 28, 2021, the Funds’ percentages of leverage are as shown in the accompanying table. | | | |
| |
| | NCB | NJV | NYV | NPN |
| Effective Leverage* | 0.00% | 6.13% | 0.00% | 4.15% |
| Regulatory Leverage* | 0.00% | 0.00% | 0.00% | 0.00% |
* Effective Leverage is a Fund’s effective economic leverage, and includes both regulatory leverage and the leverage effects of certain derivative and other investments in a Fund’s portfolio that increase the Fund’s investment exposure. Currently, the leverage effects of Tender Option Bond (TOB) inverse floater holdings are included in effective leverage values, in addition to any regulatory leverage. Regulatory leverage consists of preferred shares issued or borrowings of a Fund. Both of these are part of a Fund’s capital structure. A Fund, however, may from time to time borrow on a typically transient basis in connection with its day-to-day operations, primarily in connection with the need to settle portfolio trades. Such incidental borrowings are excluded from the calculation of a Fund’s effective leverage ratio. Regulatory leverage is subject to asset coverage limits set forth in the Investment Company Act of 1940.
14
COMMON SHARE DISTRIBUTION INFORMATION
The following information regarding the Funds’ distributions is current as of February 28, 2021. Each Fund’s distribution levels may vary over time based on each Fund’s investment activity and portfolio investment value changes.
During the current reporting period, each Fund’s distributions to common shareholders were as shown in the accompanying table.
| | | | | |
| | | Per Common Share Amounts | |
| Monthly Distributions (Ex-Dividend date) | NCB | NJV | NYV | NPN |
| March 2020 | $0.0345 | $0.03100 | $ 0.0275 | $ 0.0305 |
| April | 0.0345 | 0.03100 | 0.0275 | 0.0305 |
| May | 0.0345 | 0.03100 | 0.0275 | 0.0305 |
| June | 0.0345 | 0.03100 | 0.0275 | 0.0305 |
| July | 0.0345 | 0.03100 | 0.0275 | 0.0305 |
| August | 0.0345 | 0.03100 | 0.0275 | 0.0305 |
| September | 0.0345 | 0.03100 | 0.0275 | 0.0305 |
| October | 0.0345 | 0.03250 | 0.0285 | 0.0305 |
| November | 0.0345 | 0.03250 | 0.0285 | 0.0305 |
| December | 0.0345 | 0.03250 | 0.0285 | 0.0305 |
| January | 0.0345 | 0.03250 | 0.0285 | 0.0305 |
| February 2021 | 0.0345 | 0.03250 | 0.0285 | 0.0305 |
| Total Distributions from Net Investment Income | $0.4140 | $0.37950 | $0.33500 | $0.36600 |
| Total Distributions from Long Term Capital Gains* | $0.0493 | $ — | $ 0.0613 | $ 0.0842 |
| Total Distributions from Short Term Capital Gains* | $0.0014 | $ — | $ — | $ — |
| Total Distributions | $0.4647 | $ 0.3795 | $ 0.3963 | $ 0.4502 |
| |
| Yields | | | | |
| Market Yield* | 2.70% | 2.65% | 2.37% | 2.62% |
| Taxable-Equivalent Yield* | 5.88% | 5.47% | 4.66% | 4.65% |
* Market Yield is based on the Fund’s current annualized monthly dividend divided by the Fund’s current market price as of the end of the reporting period. Taxable-Equivalent Yield represents the yield that must be earned on a fully taxable investment in order to equal the yield of the Fund on an after-tax basis. It is based on a combined federal and state income tax rate of 54.1%, 51.6%, 49.6% and 43.9% for the California, New Jersey, New York and Pennsylvania Funds, respectively. Your actual combined federal and state income tax rate may differ from the assumed rate. The Taxable-Equivalent Yield also takes into account the percentage of the Fund’s income generated and paid by the Fund (based on payments made during the previous calendar year) that was either exempt from federal income tax but not from state income tax (e.g., income from an out-of-state municipal bond), or was exempt from neither federal nor state income tax. Separately, if the comparison were instead to investments that generate qualified dividend income, which is taxable at a rate lower than an individual’s ordinary graduated tax rate, the fund’s Taxable-Equivalent Yield would be lower.
Each Fund seeks to pay regular monthly dividends out of its net investment income at a rate that reflects its past and projected net income performance. To permit each Fund to maintain a more stable monthly dividend, the Fund may pay dividends at a rate that may be more or less than the amount of net income actually earned by the Fund during the period. Distributions to common shareholders are determined on a tax basis, which may differ from amounts recorded in the accounting records. In instances where the monthly dividend exceeds the earned net investment income, the Fund would report a negative undistributed net ordinary income. Refer to Note 6 – Income Tax Information for additional information regarding the amounts of undistributed net ordinary income and undistributed net long-term capital gains and the character of the actual distributions paid by the Fund during the period.
15
Common Share Information (continued)
All monthly dividends paid by each Fund during the current reporting period were paid from net investment income. If a portion of the Fund’s monthly distributions is sourced or comprised of elements other than net investment income, including capital gains and/or a return of capital, shareholders will be notified of those sources. For financial reporting purposes, the per share amounts of each Fund’s distributions for the reporting period are presented in this report’s Financial Highlights. For income tax purposes, distribution information for each Fund as of its most recent tax year end is presented in Note 6 – Income Tax Information within the Notes to Financial Statements of this report.
NUVEEN CLOSED-END FUND DISTRIBUTION AMOUNTS
The Nuveen Closed-End Funds’ monthly and quarterly periodic distributions to shareholders are posted on www.nuveen.com and can be found on Nuveen’s enhanced closed-end fund resource page, which is at https://www.nuveen.com/resource-center-closed-end-funds, along with other Nuveen closed-end fund product updates. To ensure timely access to the latest information, shareholders may use a subscribe function, which can be activated at this web page (https://www.nuveen.com/subscriptions).
COMMON SHARE REPURCHASES
During August 2020, the Funds’ Board of Trustees reauthorized an open-market share repurchase program, allowing each Fund to repurchase an aggregate of up to approximately 10% of its outstanding shares.
As of February 28, 2021, and since the inception of the Funds’ repurchase programs, the Funds have cumulatively repurchased and retired their outstanding common shares as shown in the accompanying table.
| | | | | |
| | NCB | NJV | NYV | NPN |
| Common shares cumulatively repurchased and retired | — | 42,000 | — | 3,500 |
| Common shares authorized for repurchase | 330,000 | 150,000 | 230,000 | 120,000 |
During the current reporting period, the following Fund repurchased and retired its common shares at a weighted average price per share and a weighted average discount per share as shown in the following table.
| | |
| | NJV |
| Common shares repurchased and retired | 6,499 |
| Weighted average price per common share repurchased and retired | $12.82 |
| Weighted average discount per common share repurchased and retired | 15.23% |
OTHER COMMON SHARE INFORMATION
As of February 28, 2021, and during the current reporting period, the Funds’ common share prices were trading at a premium/ (discount) to their common share NAVs as shown in the accompanying table.
| | | | | |
| | NCB | NJV | NYV | NPN |
| Common share NAV | $16.25 | $15.43 | $15.66 | $15.08 |
| Common share Price | $15.35 | $14.70 | $14.42 | $13.96 |
| Premium/(Discount) to NAV | (5.54)% | (4.71)% | (7.92)% | (7.43)% |
| 12-month average premium/(discount) to NAV | (8.11)% | (11.43)% | (9.28)% | (6.96)% |
16
| | |
| Nuveen California Municipal Value Fund 2 |
| | Performance Overview and Holding Summaries as of |
| | February 28, 2021 |
| | | | |
| Refer to the Glossary of Terms Used in this Report for further definition of the terms used within this section. | | |
| Average Annual Total Returns as of February 28, 2021 | | | |
| | | Average Annual | |
| | 1-Year | 5-Year | 10-Year |
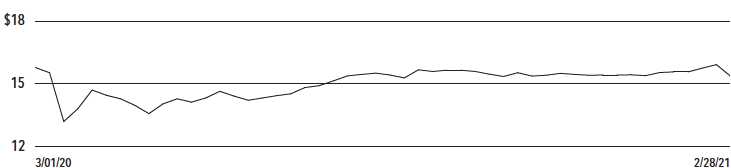
| NCB at Common Share NAV | (1.01)% | 3.46% | 5.92% |
| NCB at Common Share Price | 0.81% | 1.78% | 6.40% |
| S&P Municipal Bond California Index | 0.76% | 3.36% | 5.03% |
| S&P Municipal Bond Index | 1.22% | 3.41% | 4.51% |
Past performance is not predictive of future results. Current performance may be higher or lower than the data shown. Returns do not reflect the deduction of taxes that shareholders may have to pay on Fund distributions or upon the sale of Fund shares. Returns at NAV are net of Fund expenses, and assume reinvestment of distributions. Comparative index return information is provided for the Fund’s shares at NAV only. Indexes are not available for direct investment.
Common Share Price Performance — Weekly Closing Price
17
| | |
| NCB | Performance Overview and Holding Summaries as of |
| | February 28, 2021 (continued) |
This data relates to the securities held in the Fund’s portfolio of investments as of the end of the reporting period. It should not be construed as a measure of performance for the Fund itself. Holdings are subject to change.
For financial reporting purposes, the ratings disclosed are the highest rating given by one of the following national rating agencies: Standard & Poor’s Group, Moody’s Investors Service, Inc. or Fitch, Inc. This treatment of split-rated securities may differ from that used for other purposes, such as for Fund investment policies. Credit ratings are subject to change. AAA, AA, A and BBB are investment grade ratings; BB, B, CCC, CC, C and D are below-investment grade ratings. Holdings designated N/R are not rated by these national rating agencies.
| | |
| Fund Allocation | |
| (% of net assets) | |
| Long-Term Municipal Bonds | 90.6% |
| Short-Term Municipal Bonds | 2.2% |
| Other Assets Less Liabilities | 7.2% |
| Net Assets | 100% |
| States and Territories | |
| (% of total investments) | |
| California | 98.0% |
| Puerto Rico | 2.0% |
| Total | 100% |
| | |
| Portfolio Composition | |
| (% of total investments) | |
| Tax Obligation/General | 25.3% |
| Utilities | 24.7% |
| Transportation | 16.5% |
| Health Care | 9.7% |
| Tax Obligation/Limited | 8.6% |
| U.S. Guaranteed | 5.8% |
| Other | 9.4% |
| Total | 100% |
| | |
| Portfolio Credit Quality | |
| (% of total investment exposure) | |
| U.S. Guaranteed | 5.8% |
| AAA | 10.1% |
| AA | 48.0% |
| A | 16.4% |
| BBB | 8.0% |
| BB or Lower | 3.8% |
| N/R (not rated) | 7.9% |
| Total | 100% |
18
| | |
| NJV | Nuveen New Jersey Municipal Value Fund |
| | Performance Overview and Holding Summaries as of |
| | February 28, 2021 |
| | | | |
| Refer to Glossary of Terms Used in this Report for further definition of the terms used within this section. | | |
| Average Annual Total Returns as of February 28, 2021 | | | |
| |
| | | Average Annual | |
| | 1-Year | 5-Year | 10-Year |
| NJV at Common Share NAV | (0.63)% | 3.57% | 5.45% |
| NJV at Common Share Price | 8.31% | 4.52% | 6.21% |
| S&P Municipal Bond New Jersey Index | 1.31% | 4.38% | 5.11% |
| S&P Municipal Bond Index | 1.22% | 3.41% | 4.51% |
Past performance is not predictive of future results. Current performance may be higher or lower than the data shown. Returns do not reflect the deduction of taxes that shareholders may have to pay on Fund distributions or upon the sale of Fund shares. Returns at NAV are net of Fund expenses, and assume reinvestment of distributions. Comparative index return information is provided for the Fund’s shares at NAV only. Indexes are not available for direct investment.
Common Share Price Performance — Weekly Closing Price
19
| | |
| NJV | Performance Overview and Holding Summaries as of |
| | February 28, 2021 (continued) |
This data relates to the securities held in the Fund’s portfolio of investments as of the end of the reporting period. It should not be construed as a measure of performance for the Fund itself. Holdings are subject to change.
For financial reporting purposes, the ratings disclosed are the highest rating given by one of the following national rating agencies: Standard & Poor’s Group, Moody’s Investors Service, Inc. or Fitch, Inc. This treatment of split-rated securities may differ from that used for other purposes, such as for Fund investment policies. Credit ratings are subject to change. AAA, AA, A and BBB are investment grade ratings; BB, B, CCC, CC, C and D are below-investment grade ratings. Holdings designated N/R are not rated by these national rating agencies.
| | |
| Fund Allocation | |
| (% of net assets) | |
| Long-Term Municipal Bonds | 92.5% |
| Other Assets Less Liabilities | 11.0% |
| Net Assets Plus Floating | |
| Rate Obligations | 103.5% |
| Floating Rate Obligations | (3.5)% |
| Net Assets | 100% |
| States and Territories | |
| (% of total investments) | |
| New Jersey | 91.3% |
| Pennsylvania | 4.7% |
| Delaware | 2.4% |
| New York | 1.6% |
| Total | 100% |
| | |
| Portfolio Composition | |
| (% of total investments) | |
| Tax Obligation/Limited | 17.8% |
| Health Care | 16.0% |
| Transportation | 14.1% |
| Education and Civic Organizations | 11.6% |
| Tax Obligation/General | 10.6% |
| Housing/Multifamily | 8.3% |
| Housing/Single Family | 6.1% |
| U.S. Guaranteed | 5.8% |
| Other | 9.7% |
| Total | 100% |
| | |
| Portfolio Credit Quality | |
| (% of total investment exposure) | |
| U.S. Guaranteed | 6.9% |
| AAA | 6.1% |
| AA | 32.2% |
| A | 21.9% |
| BBB | 25.6% |
| BB or Lower | 5.3% |
| N/R | 2.0% |
| Total | 100% |
20
| | |
| NYV | Nuveen New York Municipal Value Fund 2 |
| | Performance Overview and Holding Summaries as of |
| | February 28, 2021 |
| | | | |
Refer to the Glossary of Terms Used in this Report for further definition of the terms used within this section.
|
| Average Annual Total Returns as of February 28, 2021 | | | |
| | | Average Annual | |
| | 1-Year | 5-Year | 10-Year |
| NYV at Common Share NAV | (1.54)% | 3.38% | 4.77% |
| NYV at Common Share Price | 0.35% | 2.52% | 4.98% |
| S&P Municipal Bond New York Index | 0.74% | 3.10% | 4.23% |
| S&P Municipal Bond Index | 1.22% | 3.41% | 4.51% |
Past performance is not predictive of future results. Current performance may be higher or lower than the data shown. Returns do not reflect the deduction of taxes that shareholders may have to pay on Fund distributions or upon the sale of Fund shares. Returns at NAV are net of Fund expenses, and assume reinvestment of distributions. Comparative index return information is provided for the Fund’s shares at NAV only. Indexes are not available for direct investment.
Common Share Price Performance — Weekly Closing Price
21
| | |
| NYV | Performance Overview and Holding Summaries as of |
| | February 28, 2021 (continued) |
This data relates to the securities held in the Fund’s portfolio of investments as of the end of the reporting period. It should not be construed as a measure of performance for the Fund itself. Holdings are subject to change.
For financial reporting purposes, the ratings disclosed are the highest rating given by one of the following national rating agencies: Standard & Poor’s Group, Moody’s Investors Service, Inc. or Fitch, Inc. This treatment of split-rated securities may differ from that used for other purposes, such as for Fund investment policies. Credit ratings are subject to change. AAA, AA, A and BBB are investment grade ratings; BB, B, CCC, CC, C and D are below-investment grade ratings. Holdings designated N/R are not rated by these national rating agencies.
| | |
| Fund Allocation | |
| (% of net assets) | |
| Long-Term Municipal Bonds | 98.3% |
| Short-Term Municipal Bonds | 1.7% |
| Other Assets Less Liabilities | 0.0% |
| Net Assets | 100% |
| States and Territories | |
| (% of total investments) | |
| New York | 97.1% |
| District of Columbia | 1.9% |
| Puerto Rico | 0.9% |
| Guam | 0.1% |
| Total | 100% |
| | |
| Portfolio Composition | |
| (% of total investments) | |
| Utilities | 22.1% |
| Transportation | 21.9% |
| Education and Civic Organizations | 19.7% |
| Tax Obligation/Limited | 19.2% |
| Tax Obligation/General | 6.8% |
| Other | 10.3% |
| Total | 100% |
| | |
| Portfolio Credit Quality | |
| (% of total investment exposure) | |
| AAA | 10.4% |
| AA | 52.7% |
| A | 14.3% |
| BBB | 8.2% |
| BB or Lower | 6.3% |
| N/R | 8.1% |
| Total | 100% |
22
| | |
| NPN | Nuveen Pennsylvania Municipal Value Fund |
| | Performance Overview and Holding Summaries as of |
| | February 28, 2021 |
| | | | |
| Refer to Glossary of Terms Used in this Report for further definition of the terms used within this section. | | |
| Average Annual Total Returns as of February 28, 2021 | | | |
| |
| | | Average Annual | |
| | 1-Year | 5-Year | 10-Year |
| NPN at Common Share NAV | (0.72)% | 2.98% | 4.96% |
| NPN at Common Share Price | (1.76)% | 2.66% | 4.89% |
| S&P Municipal Bond Pennsylvania Index | 1.37% | 3.66% | 4.69% |
| S&P Municipal Bond Index | 1.22% | 3.41% | 4.51% |
Past performance is not predictive of future results. Current performance may be higher or lower than the data shown. Returns do not reflect the deduction of taxes that shareholders may have to pay on Fund distributions or upon the sale of Fund shares. Returns at NAV are net of Fund expenses, and assume reinvestment of distributions. Comparative index return information is provided for the Fund’s shares at NAV only. Indexes are not available for direct investment.
Common Share Price Performance — Weekly Closing Price
23
| | |
| NPN | Performance Overview and Holding Summaries as of |
| | February 28, 2021 (continued) |
This data relates to the securities held in the Fund’s portfolio of investments as of the end of the reporting period. It should not be construed as a measure of performance for the Fund itself. Holdings are subject to change.
For financial reporting purposes, the ratings disclosed are the highest rating given by one of the following national rating agencies: Standard & Poor’s Group, Moody’s Investors Service, Inc. or Fitch, Inc. This treatment of split-rated securities may differ from that used for other purposes, such as for Fund investment policies. Credit ratings are subject to change. AAA, AA, A and BBB are investment grade ratings; BB, B, CCC, CC, C and D are below-investment grade ratings. Holdings designated N/R are not rated by these national rating agencies.
| | |
| Fund Allocation | |
| (% of net assets) | |
| Long-Term Municipal Bonds | 88.3% |
| Common Stocks | 2.2% |
| Short-Term Municipal Bonds | 2.5% |
| Other Assets Less Liabilities | 9.4% |
| Net Assets Plus Floating | |
| Rate Obligations | 102.4% |
| Floating Rate Obligations | (2.4)% |
| Net Assets | 100% |
| States and Territories | |
| (% of total municipal bonds) | |
| Pennsylvania | 95.0% |
| District of Columbia | 2.1% |
| Puerto Rico | 1.3% |
| New Jersey | 0.9% |
| Guam | 0.7% |
| Total | 100% |
| | |
| Portfolio Composition | |
| (% of total investments) | |
| Health Care | 22.2% |
| Housing/Single Family | 11.8% |
| Tax Obligation/General | 10.7% |
| Tax Obligation/Limited | 8.9% |
| Education and Civic Organizations | 8.7% |
| Transportation | 8.5% |
| U.S. Guaranteed | 8.2% |
| Utilities | 6.8% |
| Long-Term Care | 6.2% |
| Other | 8.0% |
| Total | 100% |
| | |
| Portfolio Credit Quality | |
| (% of total investment exposure) | |
| U.S. Guaranteed | 10.0% |
| AAA | 3.3% |
| AA | 29.9% |
| A | 29.7% |
| BBB | 12.8% |
| BB or Lower | 8.4% |
| N/R | 3.5% |
| N/A | 2.4% |
| Total | 100% |
24
Shareholder Meeting Report
The annual meeting of shareholders was held on December 7, 2020 for NCB, NJV and NPN. The meeting was held virtually due to public health concerns regarding the ongoing COVID-19 pandemic; at this meeting the shareholders were asked to elect Board members and to approve an Agreement and Plan of Reorganization. The meeting for NCB, NJV and NPN was subsequently adjourned to January 15, 2021 and additionally to February 17, 2021 for NCB and NPN in order to seek additional shareholder participation. A special meeting of shareholders was held on December 7, 2020 for NYV. The meeting was held virtually due to public health concerns regarding the ongoing COVID-19 pandemic; at this meeting NYV shareholders were asked to approve an Agreement and Plan of Reorganization. The meeting was subsequently adjourned to January 15, 2021 in order to seek additional shareholder participation.
| | | | | |
| | NCB | NJV | NYV | NPN |
| | Common | Common | Common | Common |
| | Shares | Shares | Shares | Shares |
| To approve an Agreement and Plan of Reorganization | | | | |
| For | 1,699,795 | 791,576 | 1,255,948 | 635,082 |
| Against | 88,346 | 27,659 | 26,316 | 86,586 |
| Abstain | 68,791 | 104,245 | 56,553 | 48,677 |
| BNV | 1,271,587 | 468,824 | — | 392,586 |
| Total | 3,128,519 | 1,392,304 | 1,338,817 | 1,162,931 |
| |
| Election of Board Members: | | | | |
| John K. Nelson | | | | |
| For | 2,468,637 | 968,051 | — | 932,535 |
| Withhold | 472,503 | 331,900 | — | 207,463 |
| Total | 2,941,140 | 1,299,951 | — | 1,139,998 |
| Terence J. Toth | | | | |
| For | 2,466,073 | 968,051 | — | 932,535 |
| Withhold | 475,067 | 331,900 | — | 207,463 |
| Total | 2,941,140 | 1,299,951 | — | 1,139,998 |
| Robert L. Young | | | | |
| For | 2,473,581 | 968,051 | — | 932,535 |
| Withhold | 467,559 | 331,900 | — | 207,463 |
| Total | 2,941,140 | 1,299,951 | — | 1,139,998 |
25
Report of Independent Registered Public Accounting Firm
To the Shareholders and Board of Trustees
Nuveen California Municipal Value Fund 2
Nuveen New Jersey Municipal Value Fund
Nuveen New York Municipal Value Fund 2
Nuveen Pennsylvania Municipal Value Fund:
Opinion on the Financial Statements
We have audited the accompanying statements of assets and liabilities of Nuveen California Municipal Value Fund 2, Nuveen New Jersey Municipal Value Fund, Nuveen New York Municipal Value Fund 2, and Nuveen Pennsylvania Municipal Value Fund (the Funds), including the portfolios of investments, as of February 28, 2021, the related statements of operations for the year then ended, the statements of changes in net assets for each of the years in the two-year period then ended, and the related notes (collectively, the financial statements) and the financial highlights for each of the years in the five-year period then ended for Nuveen California Municipal Value Fund 2, the financial highlights for each of the years in the four-year period then ended, the ten-month period ended February 28, 2017, and the year ended April 30, 2016 for Nuveen New Jersey Municipal Value Fund and Nuveen Pennsylvania Municipal Value Fund, and the financial highlights for each of the years in the four-year period then ended, the five-month period ended February 28, 2017, and the year ended September 30, 2016 for Nuveen New York Municipal Value Fund 2. In our opinion, the financial statements and financial highlights present fairly, in all material respects, the financial position of the Funds as of February 28, 2021, the results of their operations for the year then ended, the changes in their net assets for each of the years in the two-year period then ended, and the financial highlights for each of the years in the five-year period then ended for Nuveen California Municipal Value Fund 2, the financial highlights for each of the years in the four-year period then ended, the ten-month period ended February 28, 2017, and the year ended April 30, 2016 for Nuveen New Jersey Municipal Value Fund and Nuveen Pennsylvania Municipal Value Fund, and the financial highlights for each of the years in the four-year period then ended, the five-month period ended February 28, 2017, and the year ended September 30, 2016 for Nuveen New York Municipal Value Fund 2, in conformity with U.S. generally accepted accounting principles.
Fund Reorganizations
As discussed in note 1 to the financial statements, on March 8, 2021 (subsequent to the close of the reporting period), Nuveen California Municipal Value Fund acquired Nuveen California Municipal Value Fund 2, and Nuveen AMT-Free Municipal Value Fund acquired Nuveen New Jersey Municipal Value Fund and Nuveen Pennsylvania Municipal Value Fund. Additionally, on April 12, 2021 (subsequent to the close of the reporting period), Nuveen New York Municipal Value Fund acquired Nuveen New York Municipal Value Fund 2.
Basis for Opinion
These financial statements and financial highlights are the responsibility of the Funds’ management. Our responsibility is to express an opinion on these financial statements and financial highlights based on our audits. We are a public accounting firm registered with the Public Company Accounting Oversight Board (United States) (PCAOB) and are required to be independent with respect to the Funds in accordance with the U.S. federal securities laws and the applicable rules and regulations of the Securities and Exchange Commission and the PCAOB.
We conducted our audits in accordance with the standards of the PCAOB. Those standards require that we plan and perform the audit to obtain reasonable assurance about whether the financial statements and financial highlights are free of material misstatement, whether due to error or fraud. Our audits included performing procedures to assess the risks of material misstatement of the financial statements and financial highlights, whether due to error or fraud, and performing procedures that respond to those risks. Such procedures included examining, on a test basis, evidence regarding the amounts and disclosures in the financial statements and financial highlights. Such procedures also included confirmation of securities owned as of February 28, 2021, by correspondence with custodians and brokers or other appropriate auditing procedures. Our audits also included evaluating the accounting principles used and significant estimates made by management, as well as evaluating the overall presentation of the financial statements and financial highlights. We believe that our audits provide a reasonable basis for our opinion.
/s/ KPMG LLP
We have served as the auditor of one or more Nuveen investment companies since 2014.
Chicago, Illinois
April 27, 2021
26
| | |
| Nuveen California Municipal Value Fund 2 |
| | Portfolio of Investments |
| | February 28, 2021 |
| | | | | | |
| Principal | | | Optional Call | | |
| Amount (000) | | Description (1) | Provisions (2) | Ratings (3) | Value |
| | LONG-TERM INVESTMENTS – 90.6% (97.6% of Total Investments) | | | |
| | MUNICIPAL BONDS – 90.6% (97.6% of Total Investments) | | | |
| | Consumer Staples – 2.7% (3.0% of Total Investments) | | | |
| $ 10 | | California County Tobacco Securitization Agency, Tobacco Settlement Asset-Backed Bonds, | 6/30 at 100.00 | BBB+ | $ 11,409 |
| | Los Angeles County Securitization Corporation, Series 2020A, 4.000%, 6/01/49 | | | |
| 1,100 | | Golden State Tobacco Securitization Corporation, California, Tobacco Settlement | 6/22 at 100.00 | N/R | 1,141,294 |
| | Asset-Backed Bonds, Series 2018A-1, 5.250%, 6/01/47 | | | |
| 1,000 | | Silicon Valley Tobacco Securitization Authority, California, Tobacco Settlement | 3/21 at 32.31 | N/R | 321,870 |
| | Asset-Backed Bonds, Santa Clara County Tobacco Securitization Corporation, Series 2007A, | | | |
| | 0.000%, 6/01/41 | | | |
| 2,110 | | Total Consumer Staples | | | 1,474,573 |
| | Education and Civic Organizations – 1.2% (1.3% of Total Investments) | | | |
| 200 | | California Municipal Finance Authority, Charter School Revenue Bonds, Partnerships to | 8/22 at 100.00 | BB | 204,502 |
| | Uplift Communities Project, Series 2012A, 5.250%, 8/01/42 | | | |
| 100 | | California Municipal Finance Authority, Charter School Revenue Bonds, Rocketship | 6/22 at 102.00 | N/R | 107,990 |
| | Education Multiple Projects, Series 2014A, 7.250%, 6/01/43 | | | |
| 35 | | California School Finance Authority, School Facility Revenue Bonds, Alliance for | 7/25 at 100.00 | BBB | 39,105 |
| | College-Ready Public Schools Project, Series 2016A, 5.000%, 7/01/46, 144A | | | |
| 260 | | California School Finance Authority, School Facility Revenue Bonds, Alliance for | 7/25 at 101.00 | BBB | 294,356 |
| | College-Ready Public Schools Project, Series 2016C, 5.250%, 7/01/52 | | | |
| 595 | | Total Education and Civic Organizations | | | 645,953 |
| | Health Care – 8.7% (9.3% of Total Investments) | | | |
| 1,090 | | California Health Facilities Financing Authority, Revenue Bonds, Children’s Hospital Los | 8/27 at 100.00 | BBB+ | 1,266,842 |
| | Angeles, Series 2017A, 5.000%, 8/15/47 | | | |
| 330 | | California Health Facilities Financing Authority, Revenue Bonds, CommonSpirit Health, | 4/30 at 100.00 | BBB+ | 377,249 |
| | Series 2020A, 4.000%, 4/01/44 | | | |
| 70 | | California Health Facilities Financing Authority, Revenue Bonds, Lucile Salter Packard | 8/24 at 100.00 | AA– | 76,808 |
| | Children’s Hospital, Series 2014A, 5.000%, 8/15/43 | | | |
| 40 | | California Health Facilities Financing Authority, Revenue Bonds, Providence Health & | 10/24 at 100.00 | AA– | 45,665 |
| | Services, Refunding Series 2014A, 5.000%, 10/01/38 | | | |
| 150 | | California Health Facilities Financing Authority, Revenue Bonds, Providence Health & | 10/24 at 100.00 | AA– | 170,541 |
| | Services, Series 2014B, 5.000%, 10/01/44 | | | |
| 20 | | California Municipal Finance Authority, Revenue Bonds, Eisenhower Medical Center, | 7/27 at 100.00 | Baa2 | 23,226 |
| | Refunding Series 2017A, 5.000%, 7/01/42 | | | |
| 100 | | California Municipal Finance Authority, Revenue Bonds, NorthBay Healthcare Group, Series | 11/26 at 100.00 | BBB– | 113,841 |
| | 2017A, 5.250%, 11/01/41 | | | |
| 1,000 | | California Statewide Communities Development Authority, California, Redlands Community | 10/26 at 100.00 | A– | 1,136,540 |
| | Hospital, Revenue Bonds, Series 2016, 5.000%, 10/01/46 | | | |
| 150 | | California Statewide Communities Development Authority, California, Revenue Bonds, Loma | 12/24 at 100.00 | BB | 167,317 |
| | Linda University Medical Center, Series 2014A, 5.250%, 12/01/34 | | | |
| 785 | | California Statewide Communities Development Authority, California, Revenue Bonds, Loma | 6/26 at 100.00 | BB | 878,729 |
| | Linda University Medical Center, Series 2016A, 5.250%, 12/01/56, 144A | | | |
| 380 | | San Buenaventura, California, Revenue Bonds, Community Memorial Health System, Series | 12/21 at 100.00 | BB | 395,964 |
| | 2011, 7.500%, 12/01/41 | | | |
| 4,115 | | Total Health Care | | | 4,652,722 |
27
| | | | | | |
| NCB | | Nuveen California Municipal Value Fund 2 | | |
| | | Portfolio of Investments (continued) | | | |
| | | February 28, 2021 | | | |
| |
| |
| |
| Principal | | | Optional Call | | |
| Amount (000) | | Description (1) | Provisions (2) | Ratings (3) | Value |
| | Housing/Multifamily – 2.9% (3.1% of Total Investments) | | | |
| $ 250 | | California Community Housing Agency, California, Essential Housing Revenue Bonds, | 2/30 at 100.00 | N/R | $ 284,652 |
| | Serenity at Larkspur Apartments, Series 2020A, 5.000%, 2/01/50, 144A | | | |
| 349 | | California Housing Finance Agency, Municipal Certificate Revenue Bonds, Class A Series | No Opt. Call | BBB+ | 391,612 |
| | 2019-2, 4.000%, 3/20/33 | | | |
| 54 | | California Housing Finance Agency, Municipal Certificate Revenue Bonds, Class A | No Opt. Call | BBB+ | 61,758 |
| | Series2019-1, 4.250%, 1/15/35 | | | |
| | California Municipal Finance Authority, Mobile Home Park Revenue Bonds, Caritas | | | |
| | Affordable Housing Inc. Projects, Senior Series 2014A: | | | |
| 15 | | 5.250%, 8/15/39 | 8/24 at 100.00 | A– | 16,473 |
| 40 | | 5.250%, 8/15/49 | 8/24 at 100.00 | A– | 43,624 |
| 70 | | California Municipal Finance Authority, Mobile Home Park Revenue Bonds, Caritas Projects | 8/22 at 100.00 | A– | 73,284 |
| | Series 2012A, 5.500%, 8/15/47 | | | |
| 250 | | California Municipal Finance Authority, Mobile Home Park Revenue Bonds, Caritas Projects | 8/22 at 100.00 | N/R | 264,805 |
| | Series 2012B, 7.250%, 8/15/47 | | | |
| 355 | | CSCDA Community Improvement Authority, California, Essential Housing Revenue Bonds, | 1/31 at 100.00 | N/R | 412,748 |
| | Center City Anaheim, Series 2020A, 5.000%, 1/01/54, 144A | | | |
| 1,383 | | Total Housing/Multifamily | | | 1,548,956 |
| | Long-Term Care – 1.9% (2.0% of Total Investments) | | | |
| 1,000 | | California Health Facilities Financing Authority, Insured Revenue Bonds, Community | 3/21 at 100.00 | AA | 1,004,330 |
| | Program for Persons with Developmental Disabilities, Series 2011A, 6.250%, 2/01/26 | | | |
| | Tax Obligation/General – 23.5% (25.3% of Total Investments) | | | |
| 2,100 | | Carlsbad Unified School District, San Diego County, California, General Obligation | 5/24 at 100.00 | Aa1 | 2,457,735 |
| | Bonds, Series 2009B, 6.000%, 5/01/34 | | | |
| | Los Angeles Unified School District, Los Angeles County, California, General Obligation | | | |
| | Bonds, Election 2008 Series 2018B-1: | | | |
| 1,000 | | 5.000%, 7/01/37 | 1/28 at 100.00 | AA+ | 1,224,500 |
| 1,000 | | 5.250%, 7/01/42 | 1/28 at 100.00 | AA+ | 1,226,440 |
| 1,000 | | Manhattan Beach Unified School District, Los Angeles County, California, General | 9/30 at 100.00 | Aa1 | 1,174,570 |
| | Obligation Bonds, Election 2016 Measure C Series 2020B, 4.000%, 9/01/45 | | | |
| 1,000 | | Oxnard Union High School District, Ventura County, California, General Obligation Bonds, | 8/28 at 100.00 | Aa2 | 1,220,860 |
| | Election 2018 Series 2020B, 5.000%, 8/01/45 | | | |
| 840 | | San Benito High School District, San Benito and Santa Clara Counties, California, | 8/27 at 100.00 | Aa3 | 1,027,328 |
| | General Obligation Bonds, 2016 Election Series 2017, 5.250%, 8/01/46 | | | |
| 9,000 | | San Marcos Unified School District, San Diego County, California, General Obligation | No Opt. Call | AA– | 3,769,920 |
| | Bonds, 2010 Election, Series 2012B, 0.000%, 8/01/51 | | | |
| 500 | | Western Riverside Water & Wastewater Financing Authority, California, Revenue Bonds, | 3/21 at 100.00 | AA+ | 501,880 |
| | Western Municipal Water District, Series 2009, 5.625%, 9/01/39 – AGC Insured | | | |
| 16,440 | | Total Tax Obligation/General | | | 12,603,233 |
| | Tax Obligation/Limited – 7.9% (8.6% of Total Investments) | | | |
| 180 | | Golden State Tobacco Securitization Corporation, California, Enhanced Tobacco Settlement | 6/25 at 100.00 | Aa3 | 205,969 |
| | Asset-Backed Revenue Bonds, Refunding Series 2015A, 5.000%, 6/01/40 | | | |
| 1,000 | | Los Angeles County Metropolitan Transportation Authority, California, Measure R Sales | 6/26 at 100.00 | AAA | 1,196,290 |
| | Tax Revenue Bonds, Senior Series 2016A, 5.000%, 6/01/38 | | | |
| 1,150 | | Los Angeles County Metropolitan Transportation Authority, California, Proposition C | 7/27 at 100.00 | AAA | 1,406,783 |
| | Sales Tax Revenue Bonds, Senior Lien Series 2017A, 5.000%, 7/01/39 | | | |
| | Patterson Public Finance Authority, California, Revenue Bonds, Community Facilities | | | |
| | District 2001-1, Senior Series 2013A: | | | |
| 210 | | 5.250%, 9/01/30 | 9/23 at 100.00 | N/R | 228,934 |
| 190 | | 5.750%, 9/01/39 | 9/23 at 100.00 | N/R | 206,847 |
28
| | | | | | |
| Principal | | | Optional Call | | |
| Amount (000) | | Description (1) | Provisions (2) | Ratings (3) | Value |
| | Tax Obligation/Limited (continued) | | | |
| $ 35 | | Patterson Public Finance Authority, California, Revenue Bonds, Community Facilities | 9/23 at 100.00 | N/R | $ 38,209 |
| | District 2001-1, Subordinate Lien Series 2013B, 5.875%, 9/01/39 | | | |
| | Puerto Rico Sales Tax Financing Corporation, Sales Tax Revenue Bonds, Restructured 2018A-1: | | | |
| 685 | | 0.000%, 7/01/46 | 7/28 at 41.38 | N/R | 210,596 |
| 507 | | 5.000%, 7/01/58 | 7/28 at 100.00 | N/R | 561,523 |
| 15 | | Riverside County Redevelopment Agency, California, Tax Allocation Bonds, Jurupa Valley | 10/21 at 100.00 | A | 15,550 |
| | Project Area, Series 2011B, 6.500%, 10/01/25 | | | |
| 20 | | San Clemente, California, Special Tax Revenue Bonds, Community Facilities District | 9/25 at 100.00 | N/R | 22,402 |
| | 2006-1 Marblehead Coastal, Series 2015, 5.000%, 9/01/40 | | | |
| 25 | | Signal Hill Redevelopment Agency, California, Project 1 Tax Allocation Bonds, Series | 4/21 at 100.00 | N/R | 25,118 |
| | 2011, 7.000%, 10/01/26 | | | |
| 100 | | Temecula Public Financing Authority, California, Special Tax Bonds, Community Facilities | 9/27 at 100.00 | N/R | 109,627 |
| | District 16-01, Series 2017, 5.750%, 9/01/32, 144A | | | |
| 30 | | Transbay Joint Powers Authority, California, Tax Allocation Bonds, Senior Green Series | 4/30 at 100.00 | A– | 36,586 |
| | 2020A, 5.000%, 10/01/45 | | | |
| 4,147 | | Total Tax Obligation/Limited | | | 4,264,434 |
| | Transportation – 15.3% (16.5% of Total Investments) | | | |
| 1,500 | | Bay Area Toll Authority, California, Revenue Bonds, San Francisco Bay Area Toll Bridge, | 4/29 at 100.00 | AA– | 1,845,780 |
| | Subordinate Series 2019S-H, 5.000%, 4/01/44 | | | |
| 35 | | California Municipal Finance Authority, Special Facility Revenue Bonds, United Airlines, | No Opt. Call | B+ | 39,241 |
| | Inc. Los Angeles International Airport Project, Series 2019, 4.000%, 7/15/29 (AMT) | | | |
| 1,000 | | Long Beach, California, Harbor Revenue Bonds, Series 2017C, 5.000%, 5/15/47 | 5/27 at 100.00 | AA | 1,157,050 |
| 1,000 | | Los Angeles Department of Airports, California, Revenue Bonds, Los Angeles International | 5/28 at 100.00 | Aa2 | 1,242,550 |
| | Airport, Refunding Senior Lien Series 2018B, 5.000%, 5/15/32 (AMT) | | | |
| 1,000 | | Los Angeles Department of Airports, California, Revenue Bonds, Los Angeles International | 5/28 at 100.00 | Aa3 | 1,207,520 |
| | Airport, Subordinate Lien Series 2018A, 5.250%, 5/15/48 (AMT) | | | |
| 305 | | Port of Oakland, California, Revenue Bonds, Refunding Series 2012P, 5.000%, 5/01/31 (AMT) | 5/22 at 100.00 | A+ | 318,929 |
| 1,820 | | San Francisco Airports Commission, California, Revenue Bonds, San Francisco | 5/26 at 100.00 | A1 | 2,134,787 |
| | International Airport, Second Governmental Purpose Series 2016C, 5.000%, 5/01/46 | | | |
| 250 | | San Joaquin Hills Transportation Corridor Agency, Orange County, California, Toll Road | 1/25 at 100.00 | BBB+ | 278,720 |
| | Revenue Bonds, Refunding Junior Lien Series 2014B, 5.250%, 1/15/44 | | | |
| 6,910 | | Total Transportation | | | 8,224,577 |
| | U.S. Guaranteed – 5.4% (5.8% of Total Investments) (4) | | | |
| 35 | | California Health Facilities Financing Authority, Revenue Bonds, Providence Health & | 10/24 at 100.00 | N/R | 40,731 |
| | Services, Refunding Series 2014A, 5.000%, 10/01/38 (Pre-refunded 10/01/24) | | | |
| 150 | | California Statewide Communities Development Authority, School Facility Revenue Bonds, | 7/21 at 100.00 | N/R | 153,353 |
| | Alliance College-Ready Public Schools, Series 2011A, 7.000%, 7/01/46 (Pre-refunded 7/01/21) | | | |
| 395 | | Foothill/Eastern Transportation Corridor Agency, California, Toll Road Revenue Bonds, | 1/24 at 100.00 | BBB+ | 457,880 |
| | Refunding Junior Lien Series 2013C, 6.500%, 1/15/43 (Pre-refunded 1/15/24) | | | |
| | Foothill/Eastern Transportation Corridor Agency, California, Toll Road Revenue Bonds, | | | |
| | Refunding Series 2013A: | | | |
| 865 | | 5.750%, 1/15/46 (Pre-refunded 1/15/24) | 1/24 at 100.00 | A– | 999,862 |
| 865 | | 6.000%, 1/15/53 (Pre-refunded 1/15/24) | 1/24 at 100.00 | A– | 1,004,948 |
29
| | | | | | |
| NCB | | Nuveen California Municipal Value Fund 2 | | |
| | | Portfolio of Investments (continued) | | | |
| | | February 28, 2021 | | | |
| |
| |
| Principal | | | Optional Call | | |
| Amount (000) | | Description (1) | Provisions (2) | Ratings (3) | Value |
| | U.S. Guaranteed (4) (continued) | | | |
| $ 80 | | National City Community Development Commission, California, Tax Allocation Bonds, | 8/21 at 100.00 | A | $ 82,105 |
| | National City Redevelopment Project, Series 2011, 6.500%, 8/01/24 (Pre-refunded 8/01/21) | | | |
| 30 | | Novato Redevelopment Agency, California, Tax Allocation Bonds, Hamilton Field | 9/21 at 100.00 | N/R | 30,979 |
| | Redevelopment Project, Series 2011, 6.750%, 9/01/40 (Pre-refunded 9/01/21) | | | |
| 95 | | Rancho Santa Fe CSD Financing Authority, California, Revenue Bonds, Superior Lien Series | 9/21 at 100.00 | A– | 97,619 |
| | 2011A, 5.750%, 9/01/30 (Pre-refunded 9/01/21) | | | |
| 40 | | Yorba Linda Redevelopment Agency, Orange County, California, Tax Allocation Revenue | 9/21 at 100.00 | N/R | 41,149 |
| | Bonds, Yorba Linda Redevelopment Project, Subordinate Lien Series 2011A, 6.000%, 9/01/26 | | | |
| | (Pre-refunded 9/01/21) | | | |
| 2,555 | | Total U.S. Guaranteed | | | 2,908,626 |
| | Utilities – 21.1% (22.7% of Total Investments) | | | |
| 1,000 | | California Infrastructure and Economic Development Bank Clean Water State Revolving Fund | 4/28 at 100.00 | AAA | 1,230,440 |
| | Revenue Bonds, Green Series 2018, 5.000%, 10/01/43 | | | |
| 1,075 | | California Pollution Control Financing Authority, Water Furnishing Revenue Bonds, Poseidon | 7/22 at 100.00 | BBB | 1,139,661 |
| | Resources Channelside LP Desalination Project, Series 2012, 5.000%, 11/21/45 (AMT), 144A | | | |
| 415 | | Los Angeles Department of Water and Power, California, Power System Revenue Bonds, | 1/26 at 100.00 | Aa2 | 488,397 |
| | Series 2016B, 5.000%, 7/01/37 | | | |
| 1,245 | | Los Angeles Department of Water and Power, California, Power System Revenue Bonds, | 1/27 at 100.00 | Aa2 | 1,484,961 |
| | Series 2017A, 5.000%, 7/01/42 | | | |
| 375 | | Los Angeles, California, Wastewater System Revenue Bonds, Green Subordinate Lien Series | 6/27 at 100.00 | AA | 455,288 |
| | 2017A, 5.250%, 6/01/47 | | | |
| 1,000 | | M-S-R Energy Authority, California, Gas Revenue Bonds, Citigroup Prepay Contracts, | No Opt. Call | A | 1,581,240 |
| | Series 2009C, 6.500%, 11/01/39 | | | |
| | Puerto Rico Aqueduct and Sewerage Authority, Revenue Bonds, Senior Lien Series 2012A: | | | |
| 25 | | 5.500%, 7/01/28 | 7/22 at 100.00 | CCC | 26,400 |
| 100 | | 5.750%, 7/01/37 | 7/22 at 100.00 | CCC | 105,930 |
| 80 | | 6.000%, 7/01/47 | 7/22 at 100.00 | CCC | 85,007 |
| 1,190 | | Sacramento, California, Wastewater Revenue Bonds, Series 2019, 5.000%, 9/01/39 | 9/29 at 100.00 | AA | 1,492,284 |
| 335 | | San Diego Public Facilities Financing Authority, California, Water Utility Revenue | 8/26 at 100.00 | Aa3 | 406,707 |
| | Bonds, Refunding Subordinate Lien Series 2016B, 5.000%, 8/01/32 | | | |
| 2,400 | | Southern California Public Power Authority, Natural Gas Project 1 Revenue Bonds, Series | No Opt. Call | A2 | 2,801,736 |
| | 2007A, 5.250%, 11/01/24 | | | |
| 9,240 | | Total Utilities | | | 11,298,051 |
| $ 48,495 | | Total Long-Term Investments (cost $42,593,773) | | | 48,625,455 |
30
| | | | | | |
| Principal | | | Optional Call | | |
| Amount (000) | | Description (1) | Provisions (2) | Ratings (3) | Value |
| | SHORT-TERM INVESTMENTS – 2.2% (2.4% of Total Investments) | | | |
| | MUNICIPAL BONDS – 2.2% (2.4% of Total Investments) | | | |
| | Health Care – 0.4% (0.4% of Total Investments) | | | |
| $ 200 | | ABAG Finance Authority for Nonprofit Corporations, California, Revenue Bonds, Variable Rate | 3/21 at 100.00 | VMIG1 | $ 200,000 |
| | Demand Obligation, Sharp HealthCare, Refunding Series 2009D, 0.020%, 8/01/35 (5) | | | |
| | Utilities – 1.8% (2.0% of Total Investments) | | | |
| 1,000 | | Los Angeles Department of Water and Power, California, Waterworks Revenue Bonds, Variable | 3/21 at 100.00 | A-1+ | 1,000,000 |
| | Rate Demand Obligation, Series 2019A-2, 0.010%, 7/01/45 (5) | | | |
| $ 1,200 | | Total Short-Term Investments (cost $1,200,000) | | | 1,200,000 |
| | Total Investments (cost $43,793,773) – 92.8% | | | 49,825,455 |
| | Other Assets Less Liabilities – 7.2% | | | 3,847,241 |
| | Net Asset Applicable to Common Shares – 100% | | | $ 53,672,696 |
(1) All percentages shown in the Portfolio of Investments are based on net assets applicable to common shares unless otherwise noted.
(2) Optional Call Provisions: Dates (month and year) and prices of the earliest optional call or redemption. There may be other call provisions at varying prices at later dates. Certain mortgage-backed securities may be subject to periodic principal paydowns. Optional Call Provisions are not covered by the report of independent registered public accounting firm.
(3) For financial reporting purposes, the ratings disclosed are the highest of Standard & Poor’s Group (“Standard & Poor’s”), Moody’s Investors Service, Inc. (“Moody’s”) or Fitch, Inc. (“Fitch”) rating. This treatment of split-rated securities may differ from that used for other purposes, such as for Fund investment policies. Ratings below BBB by Standard & Poor’s, Baa by Moody’s or BBB by Fitch are considered to be below investment grade. Holdings designated N/R are not rated by any of these national rating agencies. Ratings are not covered by the report of independent registered public accounting firm.
(4) Backed by an escrow or trust containing sufficient U.S. Government or U.S. Government agency securities, which ensure the timely payment of principal and interest.
(5) Investment has a maturity of greater than one year, but has variable rate and/or demand features which qualify it as a short-term investment. The rate disclosed, as well as the reference rate and spread, where applicable, is that in effect as of the end of the reporting period. This rate changes periodically based on market conditions or a specified market index.
144A Investment is exempt from registration under Rule 144A of the Securities Act of 1933, as amended. These investments may only be resold in transactions exempt from registration, which are normally those transactions with qualified institutional buyers.
AMT Alternative Minimum Tax
See accompanying notes to financial statements.
31
| | |
| NJV | Nuveen New Jersey Municipal Value Fund |
| | Portfolio of Investments |
| | February 28, 2021 |
| | | | | | |
| Principal | | | Optional Call | | |
| Amount (000) | | Description (1) | Provisions (2) | Ratings (3) | Value |
| | LONG-TERM INVESTMENTS – 92.5% (100.0% of Total Investments) | | | |
| | MUNICIPAL BONDS – 92.5% (100.0% of Total Investments) | | | |
| | Consumer Discretionary – 0.3% (0.3% of Total Investments) | | | |
| $ 100 | | Middlesex County Improvement Authority, New Jersey, Senior Revenue Bonds, Heldrich | 3/21 at 100.00 | Caa3 | $ 68,639 |
| | Center Hotel/Conference Center Project, Series 2005A, 5.000%, 1/01/32 | | | |
|
| | Consumer Staples – 3.2% (3.4% of Total Investments) | | | |
| | Tobacco Settlement Financing Corporation, New Jersey, Tobacco Settlement Asset-Backed | | | |
| | Bonds, Series 2018A: | | | |
| 215 | | 4.000%, 6/01/37 | 6/28 at 100.00 | A– | 242,170 |
| 305 | | 5.250%, 6/01/46 | 6/28 at 100.00 | BBB+ | 362,941 |
| 125 | | Tobacco Settlement Financing Corporation, New Jersey, Tobacco Settlement Asset-Backed | 6/28 at 100.00 | BB+ | 144,427 |
| | Bonds, Series 2018B, 5.000%, 6/01/46 | | | |
| 645 | | Total Consumer Staples | | | 749,538 |
|
| | Education and Civic Organizations – 10.8% (11.6% of Total Investments) | | | |
| 110 | | Camden County Improvement Authority, New Jersey, Lease Revenue Bonds, Rowan University | 12/23 at 100.00 | A | 120,524 |
| | School of Osteopathic Medicine Project, Refunding Series 2013A, 5.000%, 12/01/32 | | | |
| 25 | | New Jersey Economic Development Authority, Charter School Revenue Bonds, Foundation | 1/28 at 100.00 | BBB– | 28,688 |
| | Academy Charter School, Series 2018A, 5.000%, 7/01/38 | | | |
| | New Jersey Economic Development Authority, Charter School Revenue Bonds, North Star | | | |
| | Academy Charter School of Newark, Series 2017: | | | |
| 220 | | 4.000%, 7/15/37 | 7/27 at 100.00 | BBB– | 233,873 |
| 25 | | 5.000%, 7/15/47 | 7/27 at 100.00 | BBB– | 27,922 |
| 100 | | New Jersey Economic Development Authority, Charter School Revenue Bonds, Teaneck | 9/27 at 100.00 | BB | 105,328 |
| | Community Charter School, Series 2017A, 5.125%, 9/01/52, 144A | | | |
| 115 | | New Jersey Economic Development Authority, Revenue Bonds, The Seeing Eye Inc., Refunding | No Opt. Call | A | 132,762 |
| | Series 2015, 5.000%, 3/01/25 | | | |
| | New Jersey Economic Development Authority, Revenue Bonds, The Seeing Eye Inc., Refunding | | | |
| | Series 2017: | | | |
| 15 | | 5.000%, 6/01/32 | 12/27 at 100.00 | A | 17,615 |
| 20 | | 3.000%, 6/01/32 | 12/27 at 100.00 | A | 20,361 |
| 145 | | New Jersey Educational Facilities Authority, Revenue Bonds, College of New Jersey, | 7/26 at 100.00 | A | 148,921 |
| | Refunding Series 2016F, 3.000%, 7/01/40 | | | |
| 100 | | New Jersey Educational Facilities Authority, Revenue Bonds, Kean University, Refunding | 7/25 at 100.00 | AA | 107,555 |
| | Series 2015H, 4.000%, 7/01/39 – AGM Insured | | | |
| 50 | | New Jersey Educational Facilities Authority, Revenue Bonds, Montclair State University, | 7/24 at 100.00 | A+ | 55,562 |
| | Series 2014A, 5.000%, 7/01/44 | | | |
| | New Jersey Educational Facilities Authority, Revenue Bonds, Rider University, Series 2012A: | | | |
| 100 | | 5.000%, 7/01/32 | 7/21 at 100.00 | BB+ | 100,355 |
| 30 | | 5.000%, 7/01/37 | 7/21 at 100.00 | BB+ | 30,080 |
| | New Jersey Educational Facilities Authority, Revenue Bonds, Rider University, Series 2017F: | | | |
| 5 | | 3.750%, 7/01/37 | 7/27 at 100.00 | BB+ | 4,646 |
| 100 | | 4.000%, 7/01/42 | 7/27 at 100.00 | BB+ | 93,445 |
| 100 | | 5.000%, 7/01/47 | 7/27 at 100.00 | BB+ | 102,944 |
| 75 | | New Jersey Educational Facilities Authority, Revenue Bonds, Seton Hall University, | 7/23 at 100.00 | BBB+ | 79,591 |
| | Series 2013D, 5.000%, 7/01/38 | | | |
| | New Jersey Educational Facilities Authority, Revenue Bonds, Seton Hall University, | | | |
| | Series 2016C: | | | |
| 435 | | 3.000%, 7/01/41 | 7/26 at 100.00 | BBB+ | 437,162 |
| 50 | | 3.000%, 7/01/46 | 7/26 at 100.00 | BBB+ | 49,485 |
| 25 | | 4.000%, 7/01/46 | 7/26 at 100.00 | BBB+ | 26,414 |
32
| | | | | | |
| Principal | | | Optional Call | | |
| Amount (000) | | Description (1) | Provisions (2) | Ratings (3) | Value |
| | Education and Civic Organizations (continued) | | | |
| | New Jersey Educational Facilities Authority, Revenue Bonds, Stevens Institute of | | | |
| | Technology, Series 2017A: | | | |
| $ 30 | | 5.000%, 7/01/47 | 7/27 at 100.00 | BBB+ | $ 34,010 |
| 200 | | 4.000%, 7/01/47 | 7/27 at 100.00 | BBB+ | 213,244 |
| 25 | | New Jersey Educational Facilities Authority, Revenue Bonds, The College of Saint | 7/26 at 100.00 | BB | 26,006 |
| | Elizabeth, Series 2016D, 5.000%, 7/01/46 | | | |
| 80 | | New Jersey Higher Education Assistance Authority, Student Loan Revenue Bonds, Refunding | 6/28 at 100.00 | Aa1 | 81,959 |
| | Senior Series 2019A, 2.375%, 12/01/29 | | | |
| 30 | | New Jersey Higher Education Assistance Authority, Student Loan Revenue Bonds, Series | 3/21 at 100.00 | Aaa | 30,021 |
| | 2010-2, 5.000%, 12/01/30 | | | |
| 200 | | New Jersey Institute of Technology, New Jersey, General Obligation Bonds, Series 2015A, | 7/25 at 100.00 | A1 | 223,686 |
| | 5.000%, 7/01/45 | | | |
| 2,410 | | Total Education and Civic Organizations | | | 2,532,159 |
| | Health Care – 14.8% (16.0% of Total Investments) | | | |
| | Camden County Improvement Authority, New Jersey, Health Care Redevelopment Revenue | | | |
| | Bonds, Cooper Health System Obligated Group Issue, Refunding Series 2014A: | | | |
| 105 | | 5.000%, 2/15/25 | 2/24 at 100.00 | BBB+ | 117,483 |
| 100 | | 5.000%, 2/15/34 | 2/24 at 100.00 | BBB+ | 108,245 |
| 105 | | Camden County Improvement Authority, New Jersey, Health Care Redevelopment Revenue | 2/23 at 100.00 | BBB+ | 111,713 |
| | Bonds, Cooper Health System Obligated Group Issue, Series 2013A, 5.750%, 2/15/42 | | | |
| 200 | | New Jersey Health Care Facilities Financing Authority, New Jersey, Revenue Bonds, Saint | 7/21 at 100.00 | BB+ | 202,536 |
| | Peters University Hospital, Refunding Series 2011, 6.250%, 7/01/35 | | | |
| 80 | | New Jersey Health Care Facilities Financing Authority, Revenue Bonds, AHS Hospital | 1/27 at 100.00 | AA– | 88,168 |
| | Corporation, Refunding Series 2016, 4.000%, 7/01/41 | | | |
| 230 | | New Jersey Health Care Facilities Financing Authority, Revenue Bonds, Barnabas Health, | 7/24 at 100.00 | AA– | 258,377 |
| | Refunding Series 2014A, 5.000%, 7/01/44 | | | |
| | New Jersey Health Care Facilities Financing Authority, Revenue Bonds, Hackensack | | | |
| | Meridian Health Obligated Group, Refunding Series 2017A: | | | |
| 150 | | 5.000%, 7/01/28 | 7/27 at 100.00 | AA– | 185,631 |
| 150 | | 5.000%, 7/01/57 | 7/27 at 100.00 | AA– | 172,989 |
| 110 | | New Jersey Health Care Facilities Financing Authority, Revenue Bonds, Hunterdon Medical | 7/24 at 100.00 | A+ | 114,335 |
| | Center, Refunding Series 2014A, 4.000%, 7/01/45 | | | |
| 50 | | New Jersey Health Care Facilities Financing Authority, Revenue Bonds, Inspira Health | 7/26 at 100.00 | AA– | 54,638 |
| | Obligated Group Issue, Refunding Series 2016A, 4.000%, 7/01/41 | | | |
| 360 | | New Jersey Health Care Facilities Financing Authority, Revenue Bonds, Inspira Health | 7/27 at 100.00 | AA– | 423,637 |
| | Obligated Group Issue, Series 2017A, 5.000%, 7/01/42 (UB) (4) | | | |
| 20 | | New Jersey Health Care Facilities Financing Authority, Revenue Bonds, Meridian Health | No Opt. Call | AA– | 20,320 |
| | System Obligated Group, Refunding Series 2011, 5.000%, 7/01/21 | | | |
| | New Jersey Health Care Facilities Financing Authority, Revenue Bonds, Princeton | | | |
| | HealthCare System, Series 2016A: | | | |
| 25 | | 5.000%, 7/01/32 | 7/26 at 100.00 | AA | 30,121 |
| 40 | | 5.000%, 7/01/33 | 7/26 at 100.00 | AA | 48,102 |
| 30 | | 5.000%, 7/01/34 | 7/26 at 100.00 | AA | 35,974 |
| 130 | | New Jersey Health Care Facilities Financing Authority, Revenue Bonds, Robert Wood | 7/24 at 100.00 | AA– | 146,432 |
| | Johnson University Hospital Issue, Series 2014A, 5.000%, 7/01/39 | | | |
| 110 | | New Jersey Health Care Facilities Financing Authority, Revenue Bonds, Robert Wood | 7/23 at 100.00 | AA– | 121,151 |
| | Johnson University Hospital, Series 2013A, 5.500%, 7/01/43 | | | |
| 125 | | New Jersey Health Care Facilities Financing Authority, Revenue Bonds, RWJ Barnabas | 7/26 at 100.00 | AA– | 147,944 |
| | Health Obligated Group, Refunding Series 2016A, 5.000%, 7/01/43 | | | |
| | New Jersey Health Care Facilities Financing Authority, Revenue Bonds, Saint Joseph’s | | | |
| | Healthcare System Obligated Group Issue, Refunding Series 2016: | | | |
| 10 | | 3.000%, 7/01/32 | 7/26 at 100.00 | BBB– | 10,524 |
| 405 | | 4.000%, 7/01/48 | 7/26 at 100.00 | BBB– | 442,353 |
33
| | | | | | |
| NJV | | Nuveen New Jersey Municipal Value Fund | | |
| | | Portfolio of Investments (continued) | | | |
| | | February 28, 2021 | | | |
| |
| |
| |
| Principal | | | Optional Call | | |
| Amount (000) | | Description (1) | Provisions (2) | Ratings (3) | Value |
| | Health Care (continued) | | | |
| $ 100 | | New Jersey Health Care Facilities Financing Authority, Revenue Bonds, Saint Luke’s | 8/23 at 100.00 | A– | $ 104,491 |
| | Warren Hospital Obligated Group, Series 2013, 4.000%, 8/15/37 | | | |
| | New Jersey Health Care Facilities Financing Authority, Revenue Bonds, University | | | |
| | Hospital Issue, Refunding Series 2015A: | | | |
| 130 | | 4.125%, 7/01/38 – AGM Insured | 7/25 at 100.00 | AA | 139,971 |
| 110 | | 5.000%, 7/01/46 – AGM Insured | 7/25 at 100.00 | AA | 123,322 |
| | New Jersey Health Care Facilities Financing Authority, Revenue Bonds, Valley Health | | | |
| | System Obligated Group, Series 2019: | | | |
| 50 | | 4.000%, 7/01/44 | 7/29 at 100.00 | A+ | 56,657 |
| 205 | | 3.000%, 7/01/49 | 7/29 at 100.00 | A+ | 208,590 |
| 3,130 | | Total Health Care | | | 3,473,704 |
| | Housing/Multifamily – 7.7% (8.3% of Total Investments) | | | |
| 55 | | New Jersey Economic Development Authority, Revenue Bonds, Provident Group – Kean | 1/27 at 100.00 | B | 55,606 |
| | Properties LLC – Kean University Student Housing Project, Series 2017A, 5.000%, 7/01/47 | | | |
| 100 | | New Jersey Economic Development Authority, Revenue Bonds, Provident Group – Rowan | 1/25 at 100.00 | Ba3 | 102,798 |
| | Properties LLC – Rowan University Student Housing Project, Series 2015A, 5.000%, 1/01/48 | | | |
| 155 | | New Jersey Economic Development Authority, Revenue Bonds, West Campus Housing LLC – New | 7/25 at 100.00 | BB– | 156,068 |
| | Jersey City University Student Housing Project, Series 2015, 5.000%, 7/01/47 | | | |
| 130 | | New Jersey Housing & Mortgage Finance Agency, Multifamily Conduit Revenue Bonds, | No Opt. Call | Aaa | 132,296 |
| | Riverside Village Family Apartments Phase 1 Project, Series 2019F, 1.350%, 12/01/22 | | | |
| 120 | | New Jersey Housing and Mortgage Finance Agency, Multifamily Revenue Bonds, Series 2015A, | 11/24 at 100.00 | AA– | 125,713 |
| | 4.000%, 11/01/45 | | | |
| 270 | | New Jersey Housing and Mortgage Finance Agency, Multifamily Revenue Bonds, Series 2016B, | 11/25 at 100.00 | AA– | 283,133 |
| | 3.600%, 11/01/40 | | | |
| 435 | | New Jersey Housing and Mortgage Finance Agency, Multifamily Revenue Bonds, Series 2018A, | 11/27 at 100.00 | AA– | 473,741 |
| | 3.875%, 11/01/38 | | | |
| 100 | | New Jersey Housing and Mortgage Finance Agency, Multifamily Revenue Bonds, Series 2019A, | 11/28 at 100.00 | AA– | 105,546 |
| | 2.900%, 11/01/39 | | | |
| | New Jersey Housing and Mortgage Finance Agency, Multifamily Revenue Bonds, Series 2019B: | | | |
| 175 | | 1.375%, 11/01/21 | No Opt. Call | AA– | 176,293 |
| 200 | | 1.500%, 5/01/23 | No Opt. Call | AA– | 204,028 |
| 1,740 | | Total Housing/Multifamily | | | 1,815,222 |
| | Housing/Single Family – 5.6% (6.1% of Total Investments) | | | |
| | New Jersey Housing and Mortgage Finance Agency, Single Family Housing Revenue Bonds, | | | |
| | Series 2018A: | | | |
| 150 | | 3.600%, 4/01/33 | 10/27 at 100.00 | AA | 162,942 |
| 95 | | 3.750%, 10/01/35 | 10/27 at 100.00 | AA | 103,965 |
| 720 | | New Jersey Housing and Mortgage Finance Agency, Single Family Housing Revenue Bonds, | 4/28 at 100.00 | AA | 774,770 |
| | Series 2019C, 3.950%, 10/01/44 (UB) (4) | | | |
| 290 | | New Jersey Housing and Mortgage Finance Agency, Single Family Housing Revenue Bonds, | 4/29 at 100.00 | AA | 286,587 |
| | Series 2020E, 2.250%, 10/01/40 | | | |
| 1,255 | | Total Housing/Single Family | | | 1,328,264 |
| | Long-Term Care – 1.6% (1.7% of Total Investments) | | | |
| 35 | | New Jersey Economic Development Authority, Fixed Rate Revenue Bonds, Lions Gate Project, | 1/24 at 100.00 | N/R | 35,465 |
| | Series 2014, 5.250%, 1/01/44 | | | |
| 140 | | New Jersey Economic Development Authority, Revenue Bonds, United Methodist Homes of New | 7/23 at 100.00 | BBB– | 146,092 |
| | Jersey Obligated Group Issue, Refunding Series 2013, 5.000%, 7/01/34 | | | |
| 40 | | New Jersey Economic Development Authority, Revenue Bonds, United Methodist Homes of New | 7/24 at 100.00 | BBB– | 43,202 |
| | Jersey Obligated Group Issue, Refunding Series 2014A, 5.000%, 7/01/29 | | | |
| 100 | | New Jersey Economic Development Authority, Revenue Bonds, White Horse HMT Urban Renewal | 1/28 at 102.00 | N/R | 98,984 |
| | | LLC Project, Series 2020, 5.000%, 1/01/40, 144A | | | |
34
| | | | | | |
| Principal | | | Optional Call | | |
| Amount (000) | | Description (1) | Provisions (2) | Ratings (3) | Value |
| | Long-Term Care (continued) | | | |
| $ 50 | | New Jersey Health Care Facilities Financing Authority, Revenue Bonds, Village Drive | 10/26 at 102.00 | N/R | $ 47,251 |
| | Healthcare Urban Renewal LLC, Series 2018, 5.750%, 10/01/38, 144A | | | |
| 365 | | Total Long-Term Care | | | 370,994 |
| | Tax Obligation/General – 9.8% (10.6% of Total Investments) | | | |
| 80 | | Cumberland County Improvement Authority, New Jersey, Guaranteed Lease Revenue Bonds, | 10/28 at 100.00 | AA | 90,416 |
| | County Correctional Facility Project, Series 2018, 4.000%, 10/01/43 – BAM Insured | | | |
| | Harrison, New Jersey, General Obligation Bonds, Parking Utility Series 2018: | | | |
| 35 | | 3.125%, 3/01/31 – BAM Insured | 3/28 at 100.00 | AA | 37,847 |
| 30 | | 3.250%, 3/01/32 – BAM Insured | 3/28 at 100.00 | AA | 32,499 |
| 50 | | 3.500%, 3/01/36 – BAM Insured | 3/28 at 100.00 | AA | 54,187 |
| 150 | | Hudson County Improvement Authority, New Jersey, County Secured Lease Revenue Bonds, | 5/26 at 100.00 | AA | 179,202 |
| | Hudson County Vocational Technical Schools Project, Series 2016, 5.250%, 5/01/51 | | | |
| 100 | | Jersey City, New Jersey, General Obligation Bonds, Refunding General Improvement Series | 11/27 at 100.00 | AA– | 122,832 |
| | 2017A, 5.000%, 11/01/29 | | | |
| 50 | | Mercer County, New Jersey, General Obligation Bonds, General Capital Improvement Open | No Opt. Call | N/R | 50,252 |
| | Space Farmland Notes Series 2020A, 2.000%, 6/10/21 | | | |
| 125 | | Middlesex County, New Jersey, General Obligation Bonds, Refunding Redevelopment Series | No Opt. Call | AAA | 155,845 |
| | 2017, 5.000%, 1/15/27 | | | |
| 115 | | Monmouth County Improvement Authority, New Jersey, Governmental Pooled Loan Revenue | No Opt. Call | N/R | 115,769 |
| | Bonds, Series 2020A, 2.000%, 7/12/21 | | | |
| 20 | | Montclair Township, Essex County, New Jersey, General Obligation Bonds, Refunding | 1/24 at 100.00 | AAA | 22,450 |
| | Parking Utility Series 2014A, 5.000%, 1/01/37 | | | |
| 100 | | Montclair Township, Essex County, New Jersey, General Obligation Bonds, Refunding School | No Opt. Call | AAA | 114,027 |
| | Series 2017B, 4.000%, 3/01/25 | | | |
| | New Brunswick Parking Authority, Middlesex County, New Jersey, Guaranteed Parking | | | |
| | Revenue Bonds, Refunding Series 2016A: | | | |
| 300 | | 5.000%, 9/01/32 – BAM Insured | 9/26 at 100.00 | AA | 356,148 |
| 140 | | 5.000%, 9/01/39 – BAM Insured | 9/26 at 100.00 | AA | 163,460 |
| 70 | | New Jersey State, General Obligation Bonds, Covid-19 Emergency Series 2020A, | No Opt. Call | A3 | 84,784 |
| | 4.000%, 6/01/32 | | | |
| 100 | | New Jersey State, General Obligation Bonds, Various Purpose Series 2020, 2.250%, 6/01/35 | 12/27 at 100.00 | A3 | 98,974 |
| 200 | | Ocean City, New Jersey, General Obligation Bonds, General Improvement Series 2019, | 9/26 at 100.00 | AA | 206,204 |
| | 2.250%, 9/15/33 | | | |
| 125 | | Sussex County, New Jersey, General Obligation Bonds, Series 2019, 3.000%, 6/01/27 | 6/26 at 100.00 | AA+ | 137,066 |
| 170 | | Union County Utilities Authority, New Jersey, Solid Waste System County Deficiency | 6/21 at 100.00 | Aaa | 172,108 |
| | Revenue Bonds, Series 2011A, 5.000%, 6/15/41 | | | |
| 100 | | Union County, New Jersey, General Obligation Bonds, Bond Anticipation Notes Series 2020, | No Opt. Call | N/R | 101,143 |
| | 4.000%, 6/18/21 | | | |
| 2,060 | | Total Tax Obligation/General | | | 2,295,213 |
| | Tax Obligation/Limited – 16.4% (17.8% of Total Investments) | | | |
| 245 | | Garden State Preservation Trust, New Jersey, Open Space and Farmland Preservation Bonds, | No Opt. Call | AA | 303,457 |
| | Series 2005A, 5.750%, 11/01/28 – AGM Insured | | | |
| | New Jersey Economic Development Authority, Cigarette Tax Revenue Refunding Bonds, | | | |
| | Series 2012: | | | |
| 250 | | 5.000%, 6/15/25 | 6/22 at 100.00 | BBB | 261,743 |
| 400 | | 5.000%, 6/15/28 | 6/22 at 100.00 | BBB | 416,296 |
| 100 | | New Jersey Economic Development Authority, Lease Revenue Bonds, State House Project, | 12/28 at 100.00 | Baa1 | 113,356 |
| | Series 2017B, 4.500%, 6/15/40 | | | |
| 125 | | New Jersey Economic Development Authority, Revenue Bonds, Motor Vehicle Surcharge, | 7/27 at 100.00 | BBB | 129,540 |
| | Refunding Series 2017A, 3.375%, 7/01/30 | | | |
35
| | | | | | |
| NJV | | Nuveen New Jersey Municipal Value Fund | | |
| | | Portfolio of Investments (continued) | | | |
| | | February 28, 2021 | | | |
| |
| |
| |
| Principal | | | Optional Call | | |
| Amount (000) | | Description (1) | Provisions (2) | Ratings (3) | Value |
| | Tax Obligation/Limited (continued) | | | |
| $ 15 | | New Jersey Economic Development Authority, School Facilities Construction Bonds, Social | 12/30 at 100.00 | Baa1 | $ 16,258 |
| | Series 2021QQQ, 4.000%, 6/15/50 | | | |
| 2,170 | | New Jersey Transportation Trust Fund Authority, Transportation System Bonds, Series | No Opt. Call | Baa1 | 1,252,784 |
| | 2009A, 0.000%, 12/15/39 | | | |
| | New Jersey Transportation Trust Fund Authority, Transportation System Bonds, Series 2011B: | | | |
| 180 | | 5.500%, 6/15/31 | 6/21 at 100.00 | Baa1 | 182,282 |
| 275 | | 5.250%, 6/15/36 | 6/21 at 100.00 | Baa1 | 278,165 |
| 50 | | New Jersey Transportation Trust Fund Authority, Transportation System Bonds, Series | 6/22 at 100.00 | Baa1 | 51,989 |
| | 2012A, 5.000%, 6/15/42 | | | |
| 50 | | New Jersey Transportation Trust Fund Authority, Transportation System Bonds, Series | 12/29 at 100.00 | Baa1 | 55,179 |
| | 2019A, 4.000%, 12/15/39 | | | |
| | New Jersey Transportation Trust Fund Authority, Transportation System Bonds, Series 2019BB: | | | |
| 225 | | 3.500%, 6/15/46 | 12/28 at 100.00 | Baa1 | 232,918 |
| 100 | | 4.000%, 6/15/50 | 12/28 at 100.00 | Baa1 | 108,006 |
| | New Jersey Transportation Trust Fund Authority, Transportation System Bonds, Series 2020AA: | | | |
| 30 | | 4.000%, 6/15/45 | 12/30 at 100.00 | Baa1 | 32,683 |
| 70 | | 5.000%, 6/15/50 | 12/30 at 100.00 | Baa1 | 83,072 |
| 40 | | 3.000%, 6/15/50 | 12/30 at 100.00 | Baa1 | 39,050 |
| 110 | | Union County Improvement Authority, New Jersey, General Obligation Lease Bonds, Juvenile | No Opt. Call | Aaa | 311,149 |
| | Detention Center Facility Project, Tender Option Bond Trust 2015-XF1019, 24.463%, | | | |
| | 5/01/30, 144A (IF) (4) | | | |
| 4,435 | | Total Tax Obligation/Limited | | | 3,867,927 |
|
| | Transportation – 13.1% (14.1% of Total Investments) | | | |
| | Delaware River and Bay Authority, Delaware and New Jersey, Revenue Bonds, Series 2014A: | | | |
| 150 | | 4.125%, 1/01/39 | 1/24 at 100.00 | A1 | 160,368 |
| 200 | | 5.000%, 1/01/44 | 1/24 at 100.00 | A1 | 219,170 |
| 130 | | Delaware River and Bay Authority, Delaware and New Jersey, Revenue Bonds, Series 2019, | 1/29 at 100.00 | A1 | 146,757 |
| | 4.000%, 1/01/44 | | | |
| 540 | | Delaware River Joint Toll Bridge Commission, New Jersey and Pennsylvania, Bridge System | 7/27 at 100.00 | A1 | 643,966 |
| | Revenue Bonds, Series 2017, 5.000%, 7/01/47 | | | |
| 295 | | Delaware River Joint Toll Bridge Commission, New Jersey and Pennsylvania, Bridge System | No Opt. Call | A1 | 377,137 |
| | Revenue Bonds, Series 2019A, 5.000%, 7/01/28 | | | |
| 175 | | Delaware River Port Authority, New Jersey and Pennsylvania, Revenue Bonds, Series 2018A, | 1/29 at 100.00 | A+ | 214,517 |
| | 5.000%, 1/01/37 | | | |
| 295 | | Delaware River Port Authority, Pennsylvania and New Jersey, Revenue Refunding Bonds, | 1/23 at 100.00 | A | 311,992 |
| | Port District Project, Series 2012, 5.000%, 1/01/27 | | | |
| 255 | | New Jersey Turnpike Authority, Revenue Bonds, Refunding Series 2015E, 5.000%, 1/01/45 | 1/25 at 100.00 | A+ | 293,304 |
| 315 | | Port Authority of New York and New Jersey, Consolidated Revenue Bonds, One Hundred | 12/23 at 100.00 | Aa3 | 347,363 |
| | Seventy Ninth Series 2013, 5.000%, 12/01/43 | | | |
| 250 | | South Jersey Transportation Authority, New Jersey, Transportation System Revenue Bonds, | 11/29 at 100.00 | AA | 319,992 |
| | Refunding Series 2019A, 5.000%, 11/01/31 – AGM Insured | | | |
| 30 | | South Jersey Transportation Authority, New Jersey, Transportation System Revenue Bonds, | 11/30 at 100.00 | BBB+ | 37,077 |
| | Series 2020A, 5.000%, 11/01/45 | | | |
| 2,635 | | Total Transportation | | | 3,071,643 |
|
| | U.S. Guaranteed – 5.3% (5.8% of Total Investments) (5) | | | |
| 45 | | New Jersey Economic Development Authority, Rutgers University General Obligation Lease | 6/23 at 100.00 | Aa3 | 64,346 |
| | Revenue Bonds, Tender Option Bond 2016-XF2357, Formerly Tender Option Bond Trust 3359, | | | |
| | 18.143%, 6/15/46 (Pre-refunded 6/15/23), 144A (IF) (4) | | | |
| | New Jersey Health Care Facilities Financing Authority, Revenue Bonds, Palisades Medical | | | |
| | Center Obligated Group Issue, Refunding Series 2013: | | | |
| 20 | | 5.250%, 7/01/31 (Pre-refunded 7/01/23) | 7/23 at 100.00 | N/R | 22,134 |
| 85 | | 5.250%, 7/01/31 (Pre-refunded 7/01/23) | 7/23 at 100.00 | N/R | 94,806 |
36
| | | | | | |
| Principal | | | Optional Call | | |
| Amount (000) | | Description (1) | Provisions (2) | Ratings (3) | Value |
| | U.S. Guaranteed (5) (continued) | | | |
| $ 75 | | New Jersey Health Care Facilities Financing Authority, Revenue Bonds, Saint Barnabas | 7/21 at 100.00 | N/R | $ 76,339 |
| | Health Care System, Refunding Series 2011A, 5.625%, 7/01/37 (Pre-refunded 7/01/21) | | | |
| | New Jersey Transportation Trust Fund Authority, Transportation System Bonds, Series 2011A: | | | |
| 75 | | 6.000%, 6/15/35 (Pre-refunded 6/15/21) | 6/21 at 100.00 | Baa1 | 76,235 |
| 300 | | 5.500%, 6/15/41 (Pre-refunded 6/15/21) | 6/21 at 100.00 | Baa1 | 304,527 |
| | New Jersey Transportation Trust Fund Authority, Transportation System Bonds, Series 2011B: | | | |
| 70 | | 5.000%, 6/15/37 (Pre-refunded 6/15/21) | 6/21 at 100.00 | Baa1 | 70,956 |
| 450 | | 5.000%, 6/15/42 (Pre-refunded 6/15/21) | 6/21 at 100.00 | Baa1 | 456,147 |
| 60 | | Rutgers State University, New Jersey, Revenue Bonds, Tender Option Bond 2016-XF2356, | 5/23 at 100.00 | Aa3 | 84,724 |
| | Formerly Tender Option Bond Trust 3339, 18.183%, 5/01/43 (Pre-refunded 5/01/23), 144A (IF) (4) | | | |
| 1,180 | | Total U.S. Guaranteed | | | 1,250,214 |
| | Utilities – 3.9% (4.3% of Total Investments) | | | |
| 300 | | Industrial Pollution Control Financing Authority of Cape May County (New Jersey), | No Opt. Call | A | 300,000 |
| | Pollution Control Revenue Refunding Bonds, 1991 Series A (Atlantic City Electric Company | | | |
| | Project), 6.800%, 3/01/21 – NPFG Insured | | | |
| 215 | | New Jersey Economic Development Authority, Natural Gas Facilities Revenue Bonds, New | 8/24 at 100.00 | A1 | 216,361 |
| | Jersey Natural Gas Company Project, Refunding Series 2011A, 2.750%, 8/01/39 | | | |
| 100 | | New Jersey Economic Development Authority, Water Facilities Revenue Bonds, Middlesex | 8/29 at 100.00 | A+ | 108,802 |
| | Water Company, Series 2019, 4.000%, 8/01/59 (AMT) | | | |
| 300 | | Salem County Pollution Control Financing Authority, New Jersey, Revenue Bonds, Atlantic | No Opt. Call | A | 299,199 |
| | City Electric Company Project, Refunding Series 2020, 2.250%, 6/01/29 | | | |
| 915 | | Total Utilities | | | 924,362 |
| $ 20,870 | | Total Long-Term Investments (cost $20,046,019) | | | 21,747,879 |
| | Floating Rate Obligations – (3.5)% | | | (810,000) |
| | Other Assets Less Liabilities – 11.0% | | | 2,585,209 |
| | Net Asset Applicable to Common Shares – 100% | | | $ 23,523,088 |
(1) All percentages shown in the Portfolio of Investments are based on net assets applicable to common shares unless otherwise noted.
(2) Optional Call Provisions: Dates (month and year) and prices of the earliest optional call or redemption. There may be other call provisions at varying prices at later dates. Certain mortgage-backed securities may be subject to periodic principal paydowns. Optional Call Provisions are not covered by the report of independent registered public accounting firm.
(3) For financial reporting purposes, the ratings disclosed are the highest of Standard & Poor’s Group (“Standard & Poor’s”), Moody’s Investors Service, Inc. (“Moody’s”) or Fitch, Inc. (“Fitch”) rating. This treatment of split-rated securities may differ from that used for other purposes, such as for Fund investment policies. Ratings below BBB by Standard & Poor’s, Baa by Moody’s or BBB by Fitch are considered to be below investment grade. Holdings designated N/R are not rated by any of these national rating agencies. Ratings are not covered by the report of independent registered public accounting firm.
(4) Investment, or portion of investment, has been pledged to collateralize the net payment obligations for investments in inverse floating rate transactions.
(5) Backed by an escrow or trust containing sufficient U.S. Government or U.S. Government agency securities, which ensure the timely payment of principal and interest.
144A Investment is exempt from registration under Rule 144A of the Securities Act of 1933, as amended. These investments may only be resold in transactions exempt from registration, which are normally those transactions with qualified institutional buyers.
AMT Alternative Minimum Tax
IF Inverse floating rate security issued by a tender option bond (“TOB”) trust, the interest rate on which varies inversely with the Securities Industry Financial Markets Association (SIFMA) short-term rate, which resets weekly, or a similar short-term rate, and is reduced by the expenses related to the TOB trust.
UB Underlying bond of an inverse floating rate trust reflected as a financing transaction. See Notes to Financial Statements, Note 4 – Portfolio Securities and Investments in Derivatives for more information.
See accompanying notes to financial statements.
37
| | |
| NYV | Nuveen New York Municipal Value Fund 2 |
| | Portfolio of Investments |
| | February 28, 2021 |
| | | | | | |
| Principal | | | Optional Call | | |
| Amount (000) | | Description (1) | Provisions (2) | Ratings (3) | Value |
| | LONG-TERM INVESTMENTS – 98.3% (98.3% of Total Investments) | | | |
| | MUNICIPAL BONDS – 98.3% (98.3% of Total Investments) | | | |
| | Consumer Staples – 3.8% (3.8% of Total Investments) | | | |
| $ 640 | | District of Columbia Tobacco Settlement Corporation, Tobacco Settlement Asset-Backed | No Opt. Call | A– | $ 709,517 |
| | Bonds, Series 2001, 6.500%, 5/15/33 | | | |
| 100 | | Erie County Tobacco Asset Securitization Corporation, New York, Tobacco Settlement | 3/21 at 100.00 | B– | 100,098 |
| | Asset-Backed Bonds, Series 2005A, 5.000%, 6/01/38 | | | |
| | New York Counties Tobacco Trust VI, New York, Tobacco Settlement Pass-Through Bonds, | | | |
| | Series 2016A-1: | | | |
| 100 | | 5.625%, 6/01/35 | No Opt. Call | BBB | 108,249 |
| 380 | | 5.750%, 6/01/43 | No Opt. Call | BB+ | 477,990 |
| 1,220 | | Total Consumer Staples | | | 1,395,854 |
| | Education and Civic Organizations – 19.7% (19.7% of Total Investments) | | | |
| 500 | | Albany Industrial Development Agency, New York, Revenue Bonds, Brighter Choice Charter | 4/21 at 100.00 | BB | 500,880 |
| | Schools, Series 2007A, 5.000%, 4/01/37 | | | |
| | Build New York City Resource Corporation, New York, Revenue Bonds, South Bronx Charter | | | |
| | School for International Cultures and the Arts Project, Series 2013A: | | | |
| 50 | | 5.000%, 4/15/33 | 4/23 at 100.00 | BB+ | 51,922 |
| 75 | | 5.000%, 4/15/43 | 4/23 at 100.00 | BB+ | 77,245 |
| 100 | | Build NYC Resource Corporation, New York, Revenue Bonds, Family Life Academy Charter | 12/30 at 100.00 | N/R | 104,064 |
| | School, Series 2020C-1, 5.000%, 6/01/40, 144A | | | |
| 100 | | Dormitory Authority of the State of New York, General Revenue Bonds, Saint Johns | 7/23 at 100.00 | A– | 106,775 |
| | University, Series 2013A, 5.000%, 7/01/44 | | | |
| 200 | | Dormitory Authority of the State of New York, Revenue Bonds, New York University, Series | 7/25 at 100.00 | Aa2 | 235,886 |
| | 2015A, 5.000%, 7/01/35 | | | |
| 1,000 | | Dormitory Authority of the State of New York, Revenue Bonds, New York University, Series | 7/28 at 100.00 | Aa2 | 1,223,540 |
| | 2018A, 5.000%, 7/01/48 | | | |
| 45 | | Dormitory Authority of the State of New York, Revenue Bonds, Rochester Institute of | 7/29 at 100.00 | A1 | 54,721 |
| | Technology, Series 2019A, 5.000%, 7/01/49 | | | |
| 435 | | Dormitory Authority of the State of New York, Revenue Bonds, Rockefeller University, | 7/29 at 100.00 | Aa1 | 535,633 |
| | Green Series 2019B, 5.000%, 7/01/50 | | | |
| 1,000 | | Dormitory Authority of the State of New York, Revenue Bonds, Rockefeller University, | 7/29 at 100.00 | Aa1 | 1,286,740 |
| | Series 2019A, 5.000%, 7/01/35 | | | |
| 165 | | Dormitory Authority of the State of New York, Revenue Bonds, Vaughn College of | 12/26 at 100.00 | BB– | 175,840 |
| | Aeronautics & Technology, Series 2016A, 5.500%, 12/01/36, 144A | | | |
| 145 | | Glen Cove Local Economic Assistance Corporation, New York, Revenue Bonds, Garvies Point | 1/34 at 100.00 | N/R | 155,658 |
| | Public Improvement Project, Capital Appreciation Series 2016C, 0.000%, 1/01/55 (4) | | | |
| 100 | | Hempstead Town Local Development Corporation, New York, Revenue Bonds, Adelphi | 9/23 at 100.00 | A– | 107,392 |
| | University Project, Series 2013, 5.000%, 9/01/38 | | | |
| 185 | | New York City Industrial Development Agency, New York, PILOT Payment in Lieu of Taxes | 1/31 at 100.00 | AA | 194,067 |
| | Revenue Bonds, Queens Baseball Stadium Project, Refunding Series 2021A, 3.000%, 1/01/39 – | | | |
| | AGM Insured | | | |
| 3,000 | | New York City Industrial Development Agency, New York, PILOT Payment in Lieu of Taxes | No Opt. Call | AA | 1,755,030 |
| | Revenue Bonds, Yankee Stadium Project, Series 2009A, 0.000%, 3/01/40 – AGC Insured | | | |
| 335 | | New York City Trust for Cultural Resources, New York, Revenue Bonds, Whitney Museum of | No Opt. Call | AA | 452,434 |
| | American Art, Refunding Series 2021, 5.000%, 7/01/31 | | | |
| 125 | | New York Liberty Development Corporation, New York, Liberty Revenue Bonds, Bank of | 3/29 at 100.00 | A2 | 126,508 |
| | America Tower at One Bryant Park Project, Second Priority Refunding Series 2019 Class 2, | | | |
| | | 2.625%, 9/15/69 | | | |
38
| | | | | | |
| Principal | | | Optional Call | | |
| Amount (000) | | Description (1) | Provisions (2) | Ratings (3) | Value |
| | Education and Civic Organizations (continued) | | | |
| $ 100 | | New York Liberty Development Corporation, New York, Liberty Revenue Bonds, Bank of | 3/29 at 100.00 | Baa2 | $ 96,760 |
| | America Tower at One Bryant Park Project, Second Priority Refunding Series 2019 Class 3, | | | |
| | 2.800%, 9/15/69 | | | |
| 7,660 | | Total Education and Civic Organizations | | | 7,241,095 |
| | Health Care – 3.6% (3.6% of Total Investments) | | | |
| 750 | | Dormitory Authority of the State of New York, Revenue Bonds, Montefiore Obligated Group, | 3/30 at 100.00 | BBB | 832,792 |
| | Series 2020A, 4.000%, 9/01/50 | | | |
| 150 | | Dutchess County Local Development Corporation, New York, Revenue Bonds, Health Quest | 7/26 at 100.00 | A– | 159,860 |
| | Systems, Inc Project, Series 2016B, 4.000%, 7/01/41 | | | |
| 285 | | Monroe County Industrial Development Corporation, New York, Revenue Bonds, Rochester | 12/30 at 100.00 | BBB+ | 319,784 |
| | Regional Health Project, Series 2020A, 4.000%, 12/01/46 | | | |
| 1,185 | | Total Health Care | | | 1,312,436 |
| | Industrials – 2.5% (2.5% of Total Investments) | | | |
| 830 | | New York Liberty Development Corporation, New York, Liberty Revenue Bonds, 3 World Trade | 11/24 at 100.00 | N/R | 902,915 |
| | Center Project, Class 1 Series 2014, 5.000%, 11/15/44, 144A | | | |
| | Long-Term Care – 0.1% (0.1% of Total Investments) | | | |
| 25 | | Monroe County Industrial Development Corporation, New York, Revenue Bonds, Saint Ann’s | 1/26 at 103.00 | N/R | 27,440 |
| | Community Project, Series 2019, 5.000%, 1/01/40 | | | |
| | Materials – 0.3% (0.3% of Total Investments) | | | |
| 105 | | Build New York City Resource Corporation, New York, Solid Waste Disposal Revenue Bonds, | 1/25 at 100.00 | N/R | 116,066 |
| | Pratt Paper NY, Inc Project, Series 2014, 5.000%, 1/01/35 (AMT), 144A | | | |
| | Tax Obligation/General – 6.8% (6.8% of Total Investments) | | | |
| 1,000 | | Nassau County, New York, General Obligation Bonds, General Improvement Series 2016C, | 4/26 at 100.00 | A+ | 1,166,560 |
| | 5.000%, 4/01/35 | | | |
| 835 | | New York City, New York, General Obligation Bonds, Fiscal 2020 SeriesD-1, 4.000%, 3/01/44 | 3/30 at 100.00 | AA | 937,196 |
| 400 | | Yonkers, New York, General Obligation Bonds, Refunding Series 2011A, 5.000%, 10/01/24 – | 10/21 at 100.00 | AA | 411,348 |
| | AGM Insured | | | |
| 2,235 | | Total Tax Obligation/General | | | 2,515,104 |
| | Tax Obligation/Limited – 19.2% (19.2% of Total Investments) | | | |
| 1,000 | | Dormitory Authority of the State of New York, State Personal Income Tax Revenue Bonds, | 3/29 at 100.00 | AA+ | 1,203,290 |
| | General Purpose, Series 2019A Bidding Group 2,3,4, 5.000%, 3/15/46 | | | |
| 500 | | Dormitory Authority of the State of New York, State Personal Income Tax Revenue Bonds, | 9/30 at 100.00 | AA+ | 591,735 |
| | General Purpose, Series 2020A Bidding Group 2, 4.000%, 3/15/34 | | | |
| 1,500 | | Dormitory Authority of the State of New York, State Sales Tax Revenue Bonds, Series | 9/25 at 100.00 | AA+ | 1,773,540 |
| | 2015B Group A,B&C, 5.000%, 3/15/35 | | | |
| 540 | | Hudson Yards Infrastructure Corporation, New York, Revenue Bonds, Second Indenture | 2/27 at 100.00 | Aa3 | 632,156 |
| | Fiscal 2017 Series A, 5.000%, 2/15/42 | | | |
| 1,000 | | New York City Transitional Finance Authority, New York, Building Aid Revenue Bonds, | 7/28 at 100.00 | AA | 1,204,280 |
| | Fiscal 2019 Subseries S-1, 5.000%, 7/15/43 | | | |
| 300 | | New York City Transitional Finance Authority, New York, Future Tax Secured Bonds, | 2/24 at 100.00 | AAA | 337,089 |
| | Subordinate Fiscal 2014 Series D-1, 5.000%, 2/01/35 | | | |
| 155 | | Puerto Rico Sales Tax Financing Corporation, Sales Tax Revenue Bonds, Restructured | 7/28 at 100.00 | N/R | 171,669 |
| | 2018A-1, 5.000%, 7/01/58 | | | |
| 1,000 | | Sales Tax Asset Receivable Corporation of New York City, New York, Sales Tax Asset | 10/24 at 100.00 | AA+ | 1,154,720 |
| | Revenue Bonds, Fiscal 2015 Series A, 5.000%, 10/15/30 | | | |
| 5,995 | | Total Tax Obligation/Limited | | | 7,068,479 |
39
| | | | | | |
| NYV | | Nuveen New York Municipal Value Fund 2 | | |
| | | Portfolio of Investments (continued) | | | |
| | | February 28, 2021 | | | |
| |
| |
| |
| |
| Principal | | | Optional Call | | |
| Amount (000) | | Description (1) | Provisions (2) | Ratings (3) | Value |
| | Transportation – 20.2% (20.2% of Total Investments) | | | |
| $ 2,000 | | New York City Industrial Development Agency, New York, Civic Facility Revenue Bonds, | 3/21 at 100.00 | N/R | $ 1,500,000 |
| | Bronx Parking Development Company, LLC Project, Series 2007, 5.750%, 10/01/37 (5) | | | |
| 1,155 | | New York Liberty Development Corporation, New York, Liberty Revenue Bonds, 4 World Trade | 11/21 at 100.00 | A | 1,188,091 |
| | Center Project, Series 2011, 5.000%, 11/15/44 | | | |
| 645 | | New York Transportation Development Corporation, New York, Special Facilities Bonds, | 7/24 at 100.00 | BBB | 718,091 |
| | LaGuardia Airport Terminal B Redevelopment Project, Series 2016A, 5.000%, 7/01/46 (AMT) | | | |
| | New York Transportation Development Corporation, New York, Special Facility Revenue | | | |
| | Bonds, American Airlines, Inc John F Kennedy International Airport Project, Refunding | | | |
| | Series 2016: | | | |
| 100 | | 5.000%, 8/01/26 (AMT) | 8/21 at 100.00 | B+ | 101,748 |
| 540 | | 5.000%, 8/01/31 (AMT) | 8/21 at 100.00 | B+ | 548,964 |
| 20 | | New York Transportation Development Corporation, New York, Special Facility Revenue | 8/30 at 100.00 | B+ | 23,762 |
| | Bonds, American Airlines, Inc John F Kennedy International Airport Project, Series 2020, | | | |
| | 5.375%, 8/01/36 (AMT) | | | |
| 60 | | New York Transportation Development Corporation, New York, Special Facility Revenue | 12/30 at 100.00 | Baa1 | 73,877 |
| | Bonds, Terminal 4 John F Kennedy International Airport Project, Series 2020A, 5.000%, | | | |
| | 12/01/37 (AMT) | | | |
| 70 | | New York Transportation Development Corporation, New York, Special Facility Revenue | 12/30 at 100.00 | Baa1 | 86,259 |
| | Bonds, Terminal 4 John F Kennedy International Airport Project, Series 2020C, 5.000%, 12/01/37 | | | |
| | New York Transportation Development Corporation, Special Facility Revenue Bonds, Delta | | | |
| | Air Lines, Inc – LaGuardia Airport Terminals C&D Redevelopment Project, Series 2018: | | | |
| 400 | | 5.000%, 1/01/28 (AMT) | No Opt. Call | Baa3 | 486,708 |
| 100 | | 5.000%, 1/01/31 (AMT) | 1/28 at 100.00 | Baa3 | 119,417 |
| 105 | | New York Transportation Development Corporation, Special Facility Revenue Bonds, Delta | 10/30 at 100.00 | Baa3 | 129,613 |
| | Air Lines, Inc – LaGuardia Airport Terminals C&D Redevelopment Project, Series 2020, | | | |
| | 5.000%, 10/01/35 (AMT) | | | |
| 765 | | Port Authority of New York and New Jersey, Consolidated Revenue Bonds, Two Hundred | 9/28 at 100.00 | Aa3 | 872,284 |
| | Eleventh Series 2018, 4.000%, 9/01/43 | | | |
| 800 | | Port Authority of New York and New Jersey, Consolidated Revenue Bonds, Two Hundred Fifth | 11/27 at 100.00 | Aa3 | 956,888 |
| | Series 2017, 5.000%, 11/15/47 | | | |
| 525 | | Triborough Bridge and Tunnel Authority, New York, General Purpose Revenue Bonds, MTA | 5/27 at 100.00 | AA– | 622,739 |
| | Bridges & Tunnels, Series 2017A, 5.000%, 11/15/47 | | | |
| 7,285 | | Total Transportation | | | 7,428,441 |
| | Utilities – 22.1% (22.1% of Total Investments) | | | |
| 25 | | Guam Power Authority, Revenue Bonds, Series 2012A, 5.000%, 10/01/34 | 10/22 at 100.00 | BBB | 26,038 |
| 285 | | Long Island Power Authority, New York, Electric System General Revenue Bonds, Series | 9/24 at 100.00 | A | 320,104 |
| | 2014A, 5.000%, 9/01/44 | | | |
| | Long Island Power Authority, New York, Electric System General Revenue Bonds, Series 2017: | | | |
| 1,000 | | 5.000%, 9/01/42 | 9/27 at 100.00 | A | 1,205,140 |
| 105 | | 5.000%, 9/01/47 | 9/27 at 100.00 | A | 125,645 |
| 900 | | New York City Municipal Water Finance Authority, New York, Water and Sewer System | 12/21 at 100.00 | AA+ | 932,967 |
| | Revenue Bonds, Second General Resolution, Fiscal 2012 Series BB, 5.000%, 6/15/44 | | | |
| 2,000 | | New York City Municipal Water Finance Authority, New York, Water and Sewer System Second | 12/27 at 100.00 | AA+ | 2,432,200 |
| | General Resolution Revenue Bonds, Fiscal 2018 Series EE, 5.000%, 6/15/40 | | | |
| | New York State Environmental Facilities Corporation, State Clean Water and Drinking | | | |
| | Water Revolving Funds Revenue Bonds, New York City Municipal Water Finance Authority | | | |
| | Projects-Second Resolution Bonds,: | | | |
| 500 | | 5.000%, 6/15/43 | 6/28 at 100.00 | AAA | 616,410 |
| 1,000 | | 5.000%, 6/15/48 | 6/28 at 100.00 | AAA | 1,227,680 |
| 100 | | Niagara Area Development Corporation, New York, Solid Waste Disposal Facility Revenue | 7/23 at 100.00 | B1 | 104,712 |
| | | Refunding Bonds, Covanta Energy Project, Series 2018A, 4.750%, 11/01/42 (AMT), 144A | | | |
40
| | | | | | |
| Principal | | | Optional Call | | |
| Amount (000) | | Description (1) | Provisions (2) | Ratings (3) | Value |
| | Utilities (continued) | | | |
| | Puerto Rico Aqueduct and Sewerage Authority, Revenue Bonds, Senior Lien Series 2012A: | | | |
| $ 15 | | 5.500%, 7/01/28 | 7/22 at 100.00 | CCC | $ 15,840 |
| 70 | | 5.750%, 7/01/37 | 7/22 at 100.00 | CCC | 74,151 |
| 50 | | 6.000%, 7/01/47 | 7/22 at 100.00 | CCC | 53,130 |
| 905 | | Utility Debt Securitization Authority, New York, Restructuring Bonds, Series 2013TE, | 12/23 at 100.00 | AAA | 1,011,862 |
| | 5.000%, 12/15/41 | | | |
| 6,955 | | Total Utilities | | | 8,145,879 |
| $ 33,495 | | Total Long-Term Investments (cost $32,621,970) | | | 36,153,709 |
|
| Principal | | | Optional Call | | |
| Amount (000) | | Description (1) | Provisions (2) | Ratings (3) | Value |
| | SHORT-TERM INVESTMENTS – 1.7% (1.7% of Total Investments) | | | |
| | MUNICIPAL BONDS – 1.7% (1.7% of Total Investments) | | | |
| | Transportation – 1.7% (1.7% of Total Investments) | | | |
| $ 620 | | Triborough Bridge and Tunnel Authority, New York, General Purpose Revenue Bonds, Variable | 3/21 at 100.00 | VMIG1 | $ 620,000 |
| | Rate Demand Obligation, Series 2005B-3 & 2005B-4, 0.020%, 1/01/32 (6) | | | |
| $ 620 | | Total Short-Term Investments (cost $620,000) | | | 620,000 |
| | Total Investments (cost $33,241,970) – 100.0% | | | 36,773,709 |
| | Other Assets Less Liabilities – 0.0% | | | 10,720 |
| | Net Asset Applicable to Common Shares – 100% | | | $ 36,784,429 |
(1) All percentages shown in the Portfolio of Investments are based on net assets applicable to common shares unless otherwise noted.
(2) Optional Call Provisions: Dates (month and year) and prices of the earliest optional call or redemption. There may be other call provisions at varying prices at later dates. Certain mortgage-backed securities may be subject to periodic principal paydowns. Optional Call Provisions are not covered by the report of independent registered public accounting firm.
(3) For financial reporting purposes, the ratings disclosed are the highest of Standard & Poor’s Group (“Standard & Poor’s”), Moody’s Investors Service, Inc. (“Moody’s”) or Fitch, Inc. (“Fitch”) rating. This treatment of split-rated securities may differ from that used for other purposes, such as for Fund investment policies. Ratings below BBB by Standard & Poor’s, Baa by Moody’s or BBB by Fitch are considered to be below investment grade. Holdings designated N/R are not rated by any of these national rating agencies. Ratings are not covered by the report of independent registered public accounting firm.
(4) Step-up coupon bond, a bond with a coupon that increases (“steps up”), usually at regular intervals, while the bond is outstanding. The rate shown is the coupon as of the end of the reporting period.
(5) Defaulted security. A security whose issuer has failed to fully pay principal and/or interest when due, or is under the protection of bankruptcy.
(6) Investment has a maturity of greater than one year, but has variable rate and/or demand features which qualify it as a short-term investment. The rate disclosed, as well as the reference rate and spread, where applicable, is that in effect as of the end of the reporting period. This rate changes periodically based on market conditions or a specified market index.
144A Investment is exempt from registration under Rule 144A of the Securities Act of 1933, as amended. These investments may only be resold in transactions exempt from registration, which are normally those transactions with qualified institutional buyers.
AMT Alternative Minimum Tax
See accompanying notes to financial statements.
41
| | |
| NPN | Nuveen Pennsylvania Municipal Value Fund |
| | Portfolio of Investments |
| | February 28, 2021 |
| | | | | | |
| Principal | | | Optional Call | | |
| Amount (000) | | Description (1) | Provisions (2) | Ratings (3) | Value |
| | LONG-TERM INVESTMENTS – 90.5% (97.4% of Total Investments) | | | |
| | MUNICIPAL BONDS – 88.3% (95.0% of Total Investments) | | | |
| | Consumer Staples – 1.9% (2.0% of Total Investments) | | | |
| $ 315 | | District of Columbia Tobacco Settlement Corporation, Tobacco Settlement Asset-Backed | No Opt. Call | A– | $ 349,215 |
| | Bonds, Series 2001, 6.500%, 5/15/33 | | | |
|
| | Education and Civic Organizations – 8.1% (8.7% of Total Investments) | | | |
| 50 | | Allegheny County Higher Education Building Authority, Pennsylvania, Revenue Bonds, | 10/27 at 100.00 | Baa3 | 56,442 |
| | Robert Morris University, Series 2017, 5.000%, 10/15/37 | | | |
| 15 | | Berks County Municipal Authority, Pennsylvania, Revenue Bonds, Alvernia University | 10/29 at 100.00 | BB+ | 15,921 |
| | Project, Series 2020, 5.000%, 10/01/39 | | | |
| 70 | | Bucks County Industrial Development Authority, Pennsylvania, Revenue Bonds, School Lane | 3/27 at 100.00 | BBB– | 79,170 |
| | Charter School Project, Series 2016, 5.125%, 3/15/36 | | | |
| 20 | | Chester County Industrial Development Authority, Pennsylvania, Avon Grove Charter School | 12/27 at 100.00 | BBB– | 22,214 |
| | Revenue Bonds, Series 2017A, 5.000%, 12/15/47 | | | |
| 100 | | Cumberland County Municipal Authority, Pennsylvania, Revenue Bonds, Dickinson College | 11/27 at 100.00 | A+ | 117,047 |
| | Project, Second Series 2017A, 5.000%, 11/01/39 | | | |
| 30 | | Dallas Area Municipal Authority, Pennsylvania, Revenue Bonds, Misericordia University | 5/29 at 100.00 | Baa3 | 33,928 |
| | Project, Series 2019, 5.000%, 5/01/48 | | | |
| 30 | | Dallas Area Municipal Authority, Pennsylvania, Revenue Bonds, Misericordia University, | 5/24 at 100.00 | Baa3 | 32,106 |
| | Series 2014, 5.000%, 5/01/37 | | | |
| 60 | | Erie Higher Education Building Authority, Pennsylvania, Revenue Bonds, Gannon | 11/26 at 100.00 | BBB+ | 62,120 |
| | University, Series 2016, 4.000%, 5/01/46 | | | |
| 75 | | General Authority of Southcentral Pennsylvania, Revenue Bonds, AICUP Financing | 10/27 at 100.00 | A– | 78,635 |
| | Program-York College of Pennsylvania, Series 2017 PP4, 3.375%, 11/01/37 | | | |
| | Huntingdon County General Authority, Pennsylvania, Revenue Bonds, Juniata College, | | | |
| | Series 2016OO2: | | | |
| 15 | | 3.250%, 5/01/36 | 5/26 at 100.00 | BBB | 15,021 |
| 35 | | 3.500%, 5/01/41 | 5/26 at 100.00 | BBB | 35,130 |
| 50 | | Montgomery County Higher Education and Health Authority, Pennsylvania, Revenue Bonds, | 9/28 at 100.00 | A | 58,905 |
| | Thomas Jefferson University, Series 2018A, 5.000%, 9/01/48 | | | |
| | Montgomery County Higher Education and Health Authority, Pennsylvania, Revenue Bonds, | | | |
| | Thomas Jefferson University, Series 2019: | | | |
| 50 | | 4.000%, 9/01/44 | 9/29 at 100.00 | A | 55,807 |
| 25 | | 4.000%, 9/01/49 | 9/29 at 100.00 | A | 27,723 |
| 90 | | Northampton County General Purpose Authority, Pennsylvania, Revenue Bonds, Lafayette | 11/28 at 100.00 | Aa3 | 101,301 |
| | College, Refunding Series 2018, 4.000%, 11/01/38 | | | |
| 35 | | Pennsylvania Higher Educational Facilites Authority, Revenue Bonds, Holy Family | 9/23 at 100.00 | BBB– | 38,299 |
| | University, Series 2013A, 6.500%, 9/01/38 | | | |
| 45 | | Pennsylvania HIgher Educational Facilities Authority, Revenue Bonds, Thomas Jefferson | 9/22 at 100.00 | A | 47,103 |
| | University, Series 2012, 5.000%, 3/01/42 | | | |
| | Pennsylvania Higher Educational Facilities Authority, Revenue Bonds, University of the | | | |
| | Sciences in Philadelphia, Series 2012: | | | |
| 35 | | 4.000%, 11/01/39 | 11/22 at 100.00 | Baa1 | 35,942 |
| 60 | | 5.000%, 11/01/42 | 11/22 at 100.00 | Baa1 | 62,998 |
| 95 | | Pennsylvania Higher Educational Facilities Authority, Revenue Bonds, Widener University, | 7/23 at 100.00 | A– | 101,034 |
| | Series 2013A, 5.500%, 7/15/38 | | | |
42
| | | | | | |
Principal | | | Optional Call | | |
Amount (000) | | Description (1) | Provisions (2) | Ratings (3) | Value |
| | Education and Civic Organizations (continued) | | | |
| $ 25 | | Philadelphia Authority for Industrial Development, Pennsylvania, Charter School Revenue | 6/28 at 100.00 | BB+ | $ 28,410 |
| | Bonds, Philadelphia Performing Arts: A String Theory Charter School, Series 2020, 5.000%, | | | |
| | 6/15/50, 144A | | | |
| 70 | | Philadelphia Authority for Industrial Development, Pennsylvania, Revenue Bonds, La Salle | 11/27 at 100.00 | BB+ | 69,042 |
| | University, Series 2017, 3.625%, 5/01/35 | | | |
| 50 | | Philadelphia Authority for Industrial Development, Pennsylvania, Revenue Bonds, | 3/28 at 100.00 | BB+ | 52,850 |
| | University of the Arts, Series 2017, 5.000%, 3/15/45, 144A | | | |
| 100 | | Scranton-Lackawanna Health and Welfare Authority, Pennsylvania, University Revenue | 6/26 at 100.00 | BB+ | 104,975 |
| | Bonds, Marywood University, Series 2016, 5.000%, 6/01/46 | | | |
| 145 | | Washington County Industrial Development Authority, Pennsylvania, College Revenue Bonds, | 11/27 at 100.00 | A– | 152,504 |
| | AICUP Financing Program-Washington and Jefferson College Project, Series 2017-PP5, | | | |
| | 3.375%, 11/01/36 | | | |
| 1,375 | | Total Education and Civic Organizations | | | 1,484,627 |
| | Health Care – 20.7% (22.2% of Total Investments) | | | |
| 465 | | Allegheny County Hospital Development Authority, Pennsylvania, Revenue Bonds, Allegheny | 4/28 at 100.00 | A | 508,171 |
| | Health Network Obligated Group Issue, Series 2018A, 4.000%, 4/01/44 | | | |
| 115 | | Allegheny County Hospital Development Authority, Pennsylvania, Revenue Bonds, University | 7/29 at 100.00 | A | 131,868 |
| | of Pittsburgh Medical Center, Series 2019A, 4.000%, 7/15/35 | | | |
| 380 | | Berks County Industrial Development Authority, Pennsylvania, Health System Revenue | 11/27 at 100.00 | BB– | 413,463 |
| | Bonds, Tower Health Project, Series 2017, 5.000%, 11/01/50 | | | |
| 155 | | Bucks County Industrial Development Authority, Pennsylvania, Hospital Revenue Bonds, | 8/30 at 100.00 | A– | 155,990 |
| | Saint Luke’s University Health Network Project, Series 2021, 3.000%, 8/15/53 | | | |
| 100 | | Centre County Hospital Authority, Pennsylvania, Hospital Revenue Bonds, Mount Nittany | 11/25 at 100.00 | AA– | 114,292 |
| | Medical Center Project, Series 2016A, 5.000%, 11/15/46 | | | |
| 75 | | Chester County Health and Education Facilities Authority, Pennsylvania, Health System | 10/27 at 100.00 | AA | 85,015 |
| | Revenue Bonds, Main Line Health System, Series 2017A, 4.000%, 10/01/37 | | | |
| 190 | | Chester County Health and Education Facilities Authority, Pennsylvania, Health System | 9/30 at 100.00 | AA | 218,376 |
| | Revenue Bonds, Main Line Health System, Series 2020A, 4.000%, 9/01/50 | | | |
| 200 | | Cumberland County Municipal Authority, Pennsylvania, Revenue Bonds, Penn State Health, | 11/29 at 100.00 | A+ | 227,352 |
| | Series 2019, 4.000%, 11/01/44 | | | |
| 55 | | Dauphin County General Authority, Pennsylvania, Health System Revenue Bonds, Pinnacle | 6/26 at 100.00 | A | 64,390 |
| | Health System Project, Refunding Series 2016A, 5.000%, 6/01/35 | | | |
| 35 | | Dauphin County General Authority, Pennsylvania, Health System Revenue Bonds, Pinnacle | 6/22 at 100.00 | A | 36,419 |
| | Health System Project, Series 2012A, 5.000%, 6/01/42 | | | |
| 225 | | Doylestown Hospital Authority, Pennsylvania, Hospital Revenue Bonds, Series 2016A, | 7/26 at 100.00 | BBB– | 246,098 |
| | 5.000%, 7/01/41 | | | |
| 25 | | Doylestown Hospital Authority, Pennsylvania, Hospital Revenue Bonds, Series 2019A, | 7/29 at 100.00 | BBB– | 25,873 |
| | 4.000%, 7/01/45 | | | |
| 150 | | Dubois Hospital Authority, Pennsylvania, Hospital Revenue Bonds, Penn Highlands | 1/28 at 100.00 | A– | 170,998 |
| | Healthcare, Series 2018, 5.000%, 7/15/48 | | | |
| 100 | | Lancaster County Hospital Authority, Revenue Bonds, University of Pennsylvania Health | 8/26 at 100.00 | AA | 118,312 |
| | System, Refunding Series 2016B, 5.000%, 8/15/46 | | | |
| 155 | | Lancaster County Hospital Authority, Revenue Bonds, University of Pennsylvania Health | 8/26 at 100.00 | AA | 184,506 |
| | System, Series 2016A, 5.000%, 8/15/42 | | | |
| 100 | | Lehigh County General Purpose Authority, Pennsylvania, Revenue Bonds, Good Shepherd | 5/26 at 100.00 | A | 106,997 |
| | Group, Refunding Series 2016, 4.000%, 11/01/41 | | | |
| 200 | | Montgomery County Industrial Development Authority, Pennsylvania, Health System Revenue | 1/25 at 100.00 | Ba1 | 219,212 |
| | Bonds, Albert Einstein Healthcare Network Issue, Series 2015A, 5.250%, 1/15/45 | | | |
43
| | | | | | |
| NPN | | Nuveen Pennsylvania Municipal Value Fund | | |
| | | Portfolio of Investments (continued) | | | |
| | | February 28, 2021 | | | |
| |
| |
| Principal | | | Optional Call | | |
| Amount (000) | | Description (1) | Provisions (2) | Ratings (3) | Value |
| | Health Care (continued) | | | |
| $ 145 | | Philadelphia Hospitals and Higher Education Facilities Authority, Pennsylvania, Hospital | 7/22 at 100.00 | BBB– | $ 152,489 |
| | Revenue Bonds, Temple University Health System Obligated Group, Series 2012A, | | | |
| | 5.625%, 7/01/42 | | | |
| 100 | | Philadelphia Hospitals and Higher Education Facilities Authority, Pennsylvania, Hospital | 7/27 at 100.00 | BBB– | 115,412 |
| | Revenue Bonds, Temple University Health System Obligated Group, Series of 2017, | | | |
| | 5.000%, 7/01/30 | | | |
| 200 | | Pottsville Hospital Authority, Pennsylvania, Hospital Revenue Bonds, Lehigh Valley | 1/27 at 100.00 | A+ | 232,234 |
| | Health Network, Series 2016B, 5.000%, 7/01/45 | | | |
| 210 | | Southcentral Pennsylvania General Authority, Revenue Bonds, Wellspan Health Obligated | 6/29 at 100.00 | Aa3 | 256,215 |
| | Group, Series 2019A, 5.000%, 6/01/49 | | | |
| 15 | | Westmoreland County Industrial Development Authority, Pennsylvania, Revenue Bonds, | 1/31 at 100.00 | Baa1 | 16,941 |
| | Excela Health Project, Series 2020A, 4.000%, 7/01/37 | | | |
| 3,395 | | Total Health Care | | | 3,800,623 |
| | Housing/Multifamily – 2.8% (3.0% of Total Investments) | | | |
| 15 | | Chester County Industrial Development Authority, Pennsylvania, Student Housing Revenue | 8/23 at 100.00 | Ba2 | 15,085 |
| | Bonds, University Student Housing, LLC Project at West Chester University Series 2013A, | | | |
| | 5.000%, 8/01/45 | | | |
| 35 | | Clarion County Industrial Development Authority, Pennsylvania, Revenue Bonds, Clarion | 7/24 at 100.00 | A1 | 38,126 |
| | University Foundation Inc Student Housing Project at Clarion University, Series 2014A, | | | |
| | 5.000%, 7/01/45 | | | |
| 30 | | East Hempfield Township Industrial Development Authority, Pennsylvania, Student Services | 7/24 at 100.00 | BB+ | 30,541 |
| | Inc – Student Housing Project at Millersville University, Series 2014, 5.000%, 7/01/46 | | | |
| 100 | | East Hempfield Township Industrial Development Authority, Pennsylvania, Student Services | 7/25 at 100.00 | BB+ | 102,282 |
| | Inc – Student Housing Project at Millersville University, Series 2015, 5.000%, 7/01/47 | | | |
| 300 | | Pennsylvania Higher Educational Facilities Authority, Revenue Bonds, University | 7/26 at 100.00 | Baa3 | 321,093 |
| | Properties Inc Student Housing Project at East Stroudsburg University of Pennsylvania, Series | | | |
| | 2016A, 5.000%, 7/01/35 | | | |
| 480 | | Total Housing/Multifamily | | | 507,127 |
| | Housing/Single Family – 10.9% (11.8% of Total Investments) | | | |
| | Pennsylvania Housing Finance Agency, Single Family Mortgage Revenue Bonds, | | | |
| | Series 2012-114: | | | |
| 65 | | 3.300%, 10/01/32 | 10/21 at 100.00 | AA+ | 65,679 |
| 25 | | 3.650%, 10/01/37 | 10/21 at 100.00 | AA+ | 25,236 |
| 35 | | 3.700%, 10/01/42 | 10/21 at 100.00 | AA+ | 35,340 |
| 55 | | Pennsylvania Housing Finance Agency, Single Family Mortgage Revenue Bonds, Series | 4/25 at 100.00 | AA+ | 56,749 |
| | 2016-119, 3.500%, 10/01/36 | | | |
| 480 | | Pennsylvania Housing Finance Agency, Single Family Mortgage Revenue Bonds, Series | 10/25 at 100.00 | AA+ | 495,811 |
| | 2016-120, 3.200%, 4/01/40 | | | |
| | Pennsylvania Housing Finance Agency, Single Family Mortgage Revenue Bonds, | | | |
| | Series 2016-121: | | | |
| 400 | | 3.200%, 10/01/41 (UB) (4) | 10/25 at 100.00 | AA+ | 412,028 |
| 100 | | 3.200%, 10/01/41 | 10/25 at 100.00 | AA+ | 103,007 |
| | Pennsylvania Housing Finance Agency, Single Family Mortgage Revenue Bonds, | | | |
| | Series 2017-123B: | | | |
| 70 | | 3.450%, 10/01/32 | 10/26 at 100.00 | AA+ | 74,932 |
| 45 | | 3.900%, 10/01/37 | 4/21 at 100.00 | AA+ | 45,135 |
| 250 | | Pennsylvania Housing Finance Agency, Single Family Mortgage Revenue Bonds, Series | 4/27 at 100.00 | AA+ | 265,195 |
| | 2017-125B, 3.700%, 10/01/47 | | | |
| 250 | | Pennsylvania Housing Finance Agency, Single Family Mortgage Revenue Bonds, Series | 10/28 at 100.00 | AA+ | 259,565 |
| | 2019-129, 3.350%, 10/01/45 | | | |
44
| | | | | | |
| Principal | | | Optional Call | | |
| Amount (000) | | Description (1) | Provisions (2) | Ratings (3) | Value |
| | Housing/Single Family (continued) | | | |
| $ 125 | | Pennsylvania Housing Finance Agency, Single Family Mortgage Revenue Bonds, Series | 10/28 at 100.00 | AA+ | $ 127,442 |
| | 2019-130A, 3.000%, 10/01/46 | | | |
| 45 | | Pennsylvania Housing Finance Agency, Single Family Mortgage Revenue Bonds, Series | 10/29 at 100.00 | AA+ | 45,464 |
| | 2020-133, 2.500%, 10/01/45 | | | |
| 1,945 | | Total Housing/Single Family | | | 2,011,583 |
| | Industrials – 0.6% (0.6% of Total Investments) | | | |
| 100 | | Pennsylvania Economic Development Financing Authority, Solid Waste Disposal Revenue | No Opt. Call | A– | 105,035 |
| | Bonds, Waste Management Inc, Project, Series 2011, 2.150%, 7/01/41 (AMT) (Mandatory | | | |
| | Put 7/01/24) | | | |
| | Long-Term Care – 5.8% (6.2% of Total Investments) | | | |
| 155 | | Berks County Industrial Development Authority, Pennsylvania, Healthcare Facilities | 5/27 at 100.00 | BBB | 173,536 |
| | Revenue Bonds, Highlands at Wyomissing, Series 2017A, 5.000%, 5/15/42 | | | |
| 35 | | Chester County Health and Education Facilities Authority, Pennsylvania, Revenue Bonds, | 12/25 at 103.00 | N/R | 35,650 |
| | Simpson Senior Services Project, Series 2019, 5.000%, 12/01/51 | | | |
| 70 | | Cumberland County Municipal Authority, Pennsylvania, Revenue Bonds, Asbury Pennsylvania | 1/25 at 104.00 | N/R | 75,363 |
| | Obligated Group, Refunding Series 2019, 5.000%, 1/01/45 | | | |
| | Cumberland County Municipal Authority, Pennsylvania, Revenue Bonds, Diakon Lutheran | | | |
| | Social Ministries Project, Series 2015: | | | |
| 105 | | 4.000%, 1/01/33 | 1/25 at 100.00 | BBB+ | 110,914 |
| 120 | | 5.000%, 1/01/38 | 1/25 at 100.00 | BBB+ | 132,043 |
| 100 | | Cumberland County Municipal Authority, Pennsylvania, Revenue Bonds, Diakon Lutheran | 1/26 at 100.00 | BBB+ | 114,939 |
| | Social Ministries Project, Series 2016, 5.000%, 1/01/29 | | | |
| | Cumberland County Municipal Authority, Pennsylvania, Revenue Bonds, Diakon Lutheran | | | |
| | Social Ministries Project, Series 2019A: | | | |
| 25 | | 4.125%, 1/01/38 | 1/29 at 100.00 | BBB+ | 28,252 |
| 30 | | 5.000%, 1/01/39 | 1/29 at 100.00 | BBB+ | 35,326 |
| 20 | | Lancaster County Hospital Authority, Pennsylvania, Health Center Revenue Bonds, Masonic | 5/25 at 100.00 | A | 21,985 |
| | Villages Project, Series 2015, 5.000%, 11/01/35 | | | |
| 40 | | Lancaster County Hospital Authority, Pennsylvania, Health Center Revenue Bonds, Saint | 3/27 at 102.00 | BB+ | 42,856 |
| | Anne’s Retirement Community, Inc, Series 2020, 5.000%, 3/01/50 | | | |
| 200 | | Montgomery County Industrial Development Authority, Pennsylvania, Revenue Bonds, ACTS | 11/26 at 100.00 | A– | 233,236 |
| | Retirement-Life Communities, Inc Obligated Group, Series 2016, 5.000%, 11/15/36 | | | |
| 55 | | Northampton County Industrial Development Authority, Pennsylvania, Revenue Bonds, | 11/26 at 103.00 | BB+ | 58,411 |
| | Morningstar Senior Living, Inc, Series 2019, 5.000%, 11/01/44 | | | |
| 955 | | Total Long-Term Care | | | 1,062,511 |
| | Tax Obligation/General – 7.5% (8.1% of Total Investments) | | | |
| 160 | | Adams County, Pennsylvania, General Obligation Bonds, Series 2017B, 2.500%, 11/15/29 | 11/25 at 100.00 | Aa2 | 169,598 |
| 35 | | Allentown City School District, Lehigh County, Pennsylvania, General Obligation Bonds, | 3/21 at 100.00 | N/R | 35,003 |
| | Limited Tax Revenue Anticipation Note Series 2020, 2.375%, 3/31/21 | | | |
| 105 | | Avon Grove School District, Chester County, Pennsylvania, General Obligation Bonds, | 5/29 at 100.00 | AA | 123,933 |
| | Series 2021A, 4.000%, 11/15/37 (WI/DD, Settling 3/02/21) | | | |
| 125 | | Bethel Park School District, Allegheny County, Pennsylvania, General Obligation Bonds, | 8/26 at 100.00 | Aa2 | 143,476 |
| | Refunding Series 2016, 4.000%, 8/01/33 | | | |
| 45 | | Boyertown Area School District, Berks and Montgomery Counties, Pennsylvania, General | 4/24 at 100.00 | AA– | 50,613 |
| | Obligation Bonds, Series 2015, 5.000%, 10/01/38 | | | |
| 115 | | Canon-McMillan School District, Washington County, Pennsylvania, General Obligation | 12/24 at 100.00 | AA | 131,228 |
| | Bonds, Series 2014D, 5.000%, 12/15/39 | | | |
45
| | | | | | |
| NPN | | Nuveen Pennsylvania Municipal Value Fund | | |
| | | Portfolio of Investments (continued) | | | |
| | | February 28, 2021 | | | |
| |
| |
| |
| |
| Principal | | | Optional Call | | |
| Amount (000) | | Description (1) | Provisions (2) | Ratings (3) | Value |
| | Tax Obligation/General (continued) | | | |
| $ 100 | | Colonial School District, Montgomery County, Pennsylvania, General Obligation Bonds, | 2/27 at 100.00 | Aaa | $ 120,031 |
| | Series 2020, 5.000%, 2/15/44 | | | |
| 25 | | Easton Area School District, Northampton County, Pennsylvania, General Obligation Bonds, | 2/28 at 100.00 | Aa2 | 31,298 |
| | Series 2020B, 5.000%, 2/01/31 | | | |
| 25 | | Lancaster School District, Lancaster County, Pennsylvania, General Obligation Bonds, | 12/28 at 100.00 | AA | 29,445 |
| | Series 2020, 4.000%, 6/01/35 – AGM Insured | | | |
| 195 | | Lehighton Area School District, Carbon County, Pennsylvania, General Obligation Bonds, | 11/23 at 100.00 | AA | 215,510 |
| | Limited Tax Series 2015A, 5.000%, 11/15/43 – BAM Insured | | | |
| 55 | | Philadelphia School District, Pennsylvania, General Obligation Bonds, Tax & Revenue | No Opt. Call | N/R | 55,705 |
| | Anticipation Note Series 2020-21A, 4.000%, 6/30/21 | | | |
| 15 | | PIttsburgh School District, Allegheny County, Pennsylvania, General Obligation Bonds, | 9/22 at 100.00 | AA | 16,055 |
| | Series 2014A, 5.000%, 9/01/25 – BAM Insured | | | |
| 35 | | Rostraver Township, Westmoreland County, Pennsylvania, General Obligation Bonds, Series | 9/25 at 100.00 | AA | 37,396 |
| | 2018, 3.500%, 9/01/34 – AGM Insured | | | |
| 80 | | Scranton, Lackawanna County, Pennsylvania, General Obligation Notes, Series 2016, | 5/24 at 100.00 | BB+ | 85,295 |
| | 5.000%, 11/15/32 | | | |
| | The Redevelopment Authority of the City of Scranton, Lackawanna county, Pennsylvania, | | | |
| | Guaranteed Lease Revenue Bonds, Series 2016A: | | | |
| 5 | | 5.000%, 11/15/21 | No Opt. Call | BB+ | 5,041 |
| 10 | | 5.000%, 11/15/28 | 5/24 at 100.00 | BB+ | 10,231 |
| 100 | | Upper Dublin School District, Montgomery County, Pennsylvania, General Obligation Bonds, | 3/29 at 100.00 | Aa3 | 114,982 |
| | Series 2021A, 4.000%, 9/15/38 | | | |
| 1,230 | | Total Tax Obligation/General | | | 1,374,840 |
| | Tax Obligation/Limited – 8.2% (8.9% of Total Investments) | | | |
| 25 | | Allentown Neighborhood Improvement Zone Development Authority, Pennsylvania, Tax | 5/22 at 100.00 | Baa3 | 26,005 |
| | Revenue Bonds, Series 2012A, 5.000%, 5/01/35 | | | |
| 230 | | Allentown Neighborhood Improvement Zone Development Authority, Pennsylvania, Tax Revenue | 5/27 at 100.00 | Baa3 | 260,963 |
| | Bonds, City Center Refunding Project, Series 2017, 5.000%, 5/01/42, 144A | | | |
| 100 | | Chester, Delaware County, Pennsylvania, Tax and Revenue Anticipation Notes, Series 2021, | 7/21 at 100.00 | N/R | 99,817 |
| | 4.500%, 11/30/21, 144A | | | |
| | Commonwealth Financing Authority, Pennsylvania, State Appropriation Lease Bonds, Master | | | |
| | Settlement, Series 2018: | | | |
| 40 | | 5.000%, 6/01/33 | 6/28 at 100.00 | A1 | 48,980 |
| 155 | | 4.000%, 6/01/39 – AGM Insured (4) | 6/28 at 100.00 | AA | 175,367 |
| 200 | | 4.000%, 6/01/39 – AGM Insured (UB) | 6/28 at 100.00 | AA | 226,280 |
| 120 | | Government of Guam, Business Privilege Tax Bonds, Series 2011A, 5.250%, 1/01/36 | 1/22 at 100.00 | BB | 123,158 |
| 100 | | Monroe County Industrial Development Authority, Pennsylvania, Special Obligation Revenue | 7/24 at 100.00 | N/R | 102,868 |
| | Bonds, Tobyhanna Township Project, Series 2014, 6.875%, 7/01/33, 144A | | | |
| 100 | | Pennsylvania Turnpike Commission, Motor License Fund-Enhanced Turnpike Subordinate | 12/26 at 100.00 | AA– | 109,775 |
| | Special Revenue Bonds, Series 2014A, 0.000%, 12/01/37 (5) | | | |
| 100 | | Pennsylvania Turnpike Commission, Oil Franchise Tax Revenue Bonds, Subordinate Series | 12/28 at 100.00 | A+ | 119,021 |
| | 2018B, 5.000%, 12/01/48 | | | |
| | Puerto Rico Sales Tax Financing Corporation, Sales Tax Revenue Bonds, Restructured 2018A-1: | | | |
| 50 | | 4.500%, 7/01/34 | 7/25 at 100.00 | N/R | 54,570 |
| 72 | | 5.000%, 7/01/58 | 7/28 at 100.00 | N/R | 79,743 |
46
| | | | | | |
| Principal | | | Optional Call | | |
| Amount (000) | | Description (1) | Provisions (2) | Ratings (3) | Value |
| | Tax Obligation/Limited (continued) | | | |
| | Puerto Rico Sales Tax Financing Corporation, Sales Tax Revenue Bonds, Taxable | | | |
| | Restructured Cofina Project Series 2019A-2: | | | |
| $ 10 | | 4.329%, 7/01/40 | 7/28 at 100.00 | N/R | $ 10,757 |
| 10 | | 4.329%, 7/01/40 | 7/28 at 100.00 | N/R | 10,757 |
| 49 | | 4.784%, 7/01/58 | 7/28 at 100.00 | N/R | 53,585 |
| 15 | | Washington County Redevelopment Authority, Pennsylvania, Tanger Outlet Victory Center | 1/28 at 100.00 | BB | 16,176 |
| | Tax Increment Bonds, Series 2018, 5.000%, 7/01/35 | | | |
| 1,376 | | Total Tax Obligation/Limited | | | 1,517,822 |
| | Transportation – 7.9% (8.5% of Total Investments) | | | |
| 245 | | Delaware River Joint Toll Bridge Commission, New Jersey and Pennsylvania, Bridge System | 7/27 at 100.00 | A1 | 295,093 |
| | Revenue Bonds, Series 2017, 5.000%, 7/01/42 | | | |
| 125 | | Delaware River Port Authority, New Jersey and Pennsylvania, Revenue Bonds, Series 2018A, | 1/29 at 100.00 | A+ | 152,800 |
| | 5.000%, 1/01/38 | | | |
| 140 | | Pennsylvania Economic Development Financing Authority, Parking System Revenue Bonds, | 1/24 at 100.00 | AA | 152,058 |
| | Capitol Region Parking System, Series 2013A, 5.250%, 1/01/44 – AGM Insured | | | |
| 585 | | Pennsylvania Turnpike Commission, Turnpike Revenue Bonds, Series 2015B, 5.000%, 12/01/45 | 12/25 at 100.00 | A1 | 677,629 |
| 50 | | Pennsylvania Turnpike Commission, Turnpike Revenue Bonds, Subordinate Series 2021A, | 12/30 at 100.00 | A | 56,100 |
| | 4.000%, 12/01/50 | | | |
| 100 | | Pittsburgh and Allegheny County Sports and Exhibition Authority, Pennsylvania, Parking | 12/27 at 100.00 | A | 121,960 |
| | Revenue Bonds, Series 2017, 5.000%, 12/15/34 | | | |
| 1,245 | | Total Transportation | | | 1,455,640 |
| | U.S. Guaranteed – 7.6% (8.2% of Total Investments) (6) | | | |
| 220 | | Allegheny County, Pennsylvania, General Obligation Bonds, Series 2013C-72, 5.250%, | 12/23 at 100.00 | AA– | 250,096 |
| | 12/01/32 (Pre-refunded 12/01/23) | | | |
| 20 | | Allegheny County, Pennsylvania, General Obligation Bonds, Series C69-C70 of 2012, | 12/22 at 100.00 | AA– | 21,688 |
| | 5.000%, 12/01/37 (Pre-refunded 12/01/22) | | | |
| 175 | | Bucks County Water and Sewer Authority, Pennsylvania, Revenue Bonds, Tender Option Bond | 12/21 at 100.00 | AA | 194,129 |
| | Trust 2015-XF0123, 13.398%, 12/01/29 (Pre-refunded 12/01/21), AGM Insured, 144A (IF) (4) | | | |
| | Cumberland County Municipal Authority, Pennsylvania, Revenue Bonds, Diakon Lutheran | | | |
| | Social Ministries Project, Series 2015: | | | |
| 20 | | 4.000%, 1/01/33 (Pre-refunded 1/01/25) | 1/25 at 100.00 | N/R | 22,547 |
| 15 | | 5.000%, 1/01/38 (Pre-refunded 1/01/25) | 1/25 at 100.00 | N/R | 17,477 |
| 55 | | Lancaster Industrial Development Authority, Pennsylvania, Revenue Bonds, Garden Spot | 5/23 at 100.00 | N/R | 61,486 |
| | Village Project, Series 2013, 5.750%, 5/01/35 (Pre-refunded 5/01/23) | | | |
| 105 | | Lehigh County Authority, Pennsylvania, Water and Sewer Revenue Bonds, Allentown | 12/23 at 100.00 | N/R | 118,695 |
| | Concession, Series 2013A, 5.125%, 12/01/47 (Pre-refunded 12/01/23) | | | |
| 40 | | Lehigh County General Purpose Authority, Pennsylvania, Revenue Bonds, Good Shepherd | 11/22 at 100.00 | A | 42,524 |
| | Group, Series 2012, 4.000%, 11/01/32 (Pre-refunded 11/01/22) | | | |
| 120 | | Pennsylvania Higher Educational Facilities Authority, Revenue Bonds, Philadelphia | 6/23 at 100.00 | N/R | 132,679 |
| | University, Refunding Series 2013, 5.000%, 6/01/32 (Pre-refunded 6/01/23) | | | |
| 400 | | Pittsburgh, Pennsylvania, General Obligation Bonds, Series 2012B, 5.000%, 9/01/26 | 9/22 at 100.00 | AA– | 429,064 |
| | (Pre-refunded 9/01/22) | | | |
| 100 | | West Shore Area Authority, Cumberland County, Pennsylvania, Hospital Revenue Bonds, Holy | 1/22 at 100.00 | A1 | 104,629 |
| | Spirit Hospital of the Sisters of Christian Charity, Series 2011B, 5.750%, 1/01/41 | | | |
| | (Pre-refunded 1/01/22) | | | |
| 1,270 | | Total U.S. Guaranteed | | | 1,395,014 |
47
| | | | | | |
| NPN | | Nuveen Pennsylvania Municipal Value Fund | | |
| | | Portfolio of Investments (continued) | | | |
| | | February 28, 2021 | | | |
| |
| |
| Principal | | | Optional Call | | |
| Amount (000) | | Description (1) | Provisions (2) | Ratings (3) | Value |
| | Utilities – 6.3% (6.8% of Total Investments) | | | |
| $ 140 | | Beaver County Industrial Development Authority, Pennsylvania, Pollution Control Revenue | No Opt. Call | N/R | $ 175 |
| | Bonds, FirstEnergy Nuclear Generation Project, Refunding Series 2005A, 4.000%, 1/01/35 (7) | | | |
| 10 | | Beaver County Industrial Development Authority, Pennsylvania, Pollution Control Revenue | No Opt. Call | N/R | 13 |
| | Bonds, FirstEnergy Nuclear Generation Project, Refunding Series 2008A, 2.700%, 4/01/35 (7) | | | |
| 250 | | Beaver County Industrial Development Authority, Pennsylvania, Pollution Control Revenue | No Opt. Call | N/R | 313 |
| | Bonds, FirstEnergy Nuclear Generation Project, Series 2006B, 3.500%, 12/01/35 (7) | | | |
| 20 | | Bucks County Water and Sewer Authority, Pennsylvania, Water System Revenue Bonds, Series | 12/28 at 100.00 | AA | 17,969 |
| | 2020, 2.125%, 12/01/45 | | | |
| 95 | | Lehigh County Authority, Pennsylvania, Water and Sewer Revenue Bonds, Allentown | 12/23 at 100.00 | A | 105,298 |
| | Concession, Series 2013A, 5.125%, 12/01/47 | | | |
| 55 | | Pennsylvania Economic Development Financing Authority, Exempt Facilities Revenue Bonds, | No Opt. Call | N/R | 69 |
| | Shippingport Project, First Energy Guarantor, Series 2006A, 2.550%, 11/01/41 (7) | | | |
| 90 | | Pennsylvania Economic Development Financing Authority, Exempt Facilities Revenue | 9/25 at 100.00 | B | 79,376 |
| | Refunding Bonds, PPL Energy Supply, LLC Project, Series 2009A, 6.400%, 12/01/38 | | | |
| 250 | | Pennsylvania Economic Development Financing Authority, Revenue Bonds, | 10/29 at 100.00 | A+ | 266,062 |
| | Pennsylvania-American Water Company, Refunding Series 2019, 3.000%, 4/01/39 | | | |
| 105 | | Philadelphia Gas Works, Pennsylvania, Revenue Bonds, 1998 General Ordinance, Sixteenth | 8/30 at 100.00 | AA | 129,525 |
| | Series 2020A, 5.000%, 8/01/50 – AGM Insured | | | |
| 150 | | Philadelphia Gas Works, Pennsylvania, Revenue Bonds, General Ordinance, Fifteenth Series | 8/27 at 100.00 | A | 175,761 |
| | 2017, 5.000%, 8/01/47 | | | |
| 125 | | Philadelphia Gas Works, Pennsylvania, Revenue Bonds, Refunding Thirteenth Series 2015, | 8/25 at 100.00 | A | 145,380 |
| | 5.000%, 8/01/30 | | | |
| 20 | | Pittsburgh Water and Sewer Authority, Pennsylvania, Water and Sewer System Revenue | 9/30 at 100.00 | AA | 23,117 |
| | Bonds, First Lien Series 2020B, 4.000%, 9/01/45 – AGM Insured | | | |
| 25 | | Pittsburgh Water and Sewer Authority, Pennsylvania, Water and Sewer System Revenue | 9/29 at 100.00 | AA | 29,826 |
| | Bonds, Refunding Subordinate Series 2019B, 4.000%, 9/01/34 – AGM Insured | | | |
| 40 | | Upper Allegheny Joint Sanitary Authority, Allegheny County, Pennsylvania, Sewer Revenue | 9/29 at 100.00 | AA | 42,226 |
| | Bonds, Refunding Series 2019A, 3.000%, 9/01/44 – AGM Insured | | | |
| | Williamsport Sanitary Authority, Lycoming County, Pennsylvania, Sewer Revenue Bonds, | | | |
| | Series 2021: | | | |
| 100 | | 5.000%, 1/01/25 – BAM Insured | No Opt. Call | AA | 116,954 |
| 25 | | 5.000%, 1/01/28 – BAM Insured | No Opt. Call | AA | 31,733 |
| 1,500 | | Total Utilities | | | 1,163,797 |
| $ 15,186 | | Total Municipal Bonds (cost $15,301,635) | | | 16,227,834 |
|
| Shares | | Description (1) | | | Value |
| | COMMON STOCKS – 2.2% (2.4% of Total Investments) | | | |
| | Electric Utilities – 2.2% (2.4% of Total Investments) | | | |
| 14,686 | | Energy Harbor Corp (8),(9),(10) | | | $ 413,044 |
| | Total Common Stocks (cost $407,801) | | | 413,044 |
| | Total Long-Term Investments (cost $15,709,436) | | | 16,640,878 |
48
| | | | | | |
Principal | | | Optional Call | | |
Amount (000) | | Description (1) | Provisions (2) | Ratings (3) | Value |
| | SHORT-TERM INVESTMENTS – 2.5% (2.6% of Total Investments) | | | |
| | MUNICIPAL BONDS – 2.5% (2.6% of Total Investments) | | | |
| | Tax Obligation/General – 2.5% (2.6% of Total Investments) | | | |
| $ 450 | | Mercer County, Pennsylvania, General Obligation Bonds, Variable Rate Demand Obligation, | 3/21 at 100.00 | A-1 | $ 450,000 |
| | Series 2011, 0.040%, 10/01/31 – AGM Insured (11) | | | |
| $ 450 | | Total Short-Term Investments (cost $450,000) | | | 450,000 |
| | Total Investments (cost $16,159,436)–93.0% | | | 17,090,878 |
| | Floating Rate Obligations – (2.4)% | | | (450,000) |
| | Other Assets Less Liabilities – 9.4% | | | 1,739,944 |
| | Net Asset Applicable to Common Shares – 100% | | | $ 18,380,822 |
(1) All percentages shown in the Portfolio of Investments are based on net assets applicable to common shares unless otherwise noted.
(2) Optional Call Provisions: Dates (month and year) and prices of the earliest optional call or redemption. There may be other call provisions at varying prices at later dates. Certain mortgage-backed securities may be subject to periodic principal paydowns. Optional Call Provisions are not covered by the report of independent registered public accounting firm.
(3) For financial reporting purposes, the ratings disclosed are the highest of Standard & Poor’s Group (“Standard & Poor’s”), Moody’s Investors Service, Inc. (“Moody’s”) or Fitch, Inc. (“Fitch”) rating. This treatment of split-rated securities may differ from that used for other purposes, such as for Fund investment policies. Ratings below BBB by Standard & Poor’s, Baa by Moody’s or BBB by Fitch are considered to be below investment grade. Holdings designated N/R are not rated by any of these national rating agencies. Ratings are not covered by the report of independent registered public accounting firm.
(4) Investment, or portion of investment, has been pledged to collateralize the net payment obligations for investments in inverse floating rate transactions.
(5) Step-up coupon bond, a bond with a coupon that increases (“steps up”), usually at regular intervals, while the bond is outstanding. The rate shown is the coupon as of the end of the reporting period.
(6) Backed by an escrow or trust containing sufficient U.S. Government or U.S. Government agency securities, which ensure the timely payment of principal and interest.
(7) Defaulted security. A security whose issuer has failed to fully pay principal and/or interest when due, or is under the protection of bankruptcy.
(8) Common Stock received as part of the bankruptcy settlements for Beaver County Industrial Development Authority, Pennsylvania, Pollution Control Revenue Bonds, FirstEnergy Nuclear Generation Project, Refunding Series 2005A, 4.000%, 1/01/35; Beaver County Industrial Development Authority, Pennsylvania, Pollution Control Revenue Refunding Bonds, FirstEnergy Nuclear Generation Project, Series 2006A, 4.375%, 1/01/35; Beaver County Industrial Development Authority, Pennsylvania, Pollution Control Revenue Refunding Bonds, FirstEnergy Nuclear Generation Project, Series 2006B, 3.500%, 12/01/35; and Pennsylvania Economic Development Financing Authority, Exempt Facilities Revenue Bonds, Shippingport Project, First Energy Guarantor, Series 2006A, 2.550%, 11/01/41.
(9) For fair value measurement disclosure purposes, investment classified as Level 2. See Notes to Financial Statements, Note 3 - Investment Valuation and Fair Value Measurements for more information.
(10) Non-income producing; issuer has not declared an ex-dividend date within the past twelve months.
(11) Investment has a maturity of greater than one year, but has variable rate and/or demand features which qualify it as a short-term investment. The rate disclosed, as well as the reference rate and spread, where applicable, is that in effect as of the end of the reporting period. This rate changes periodically based on market conditions or a specified market index.
144A Investment is exempt from registration under Rule 144A of the Securities Act of 1933, as amended. These investments may only be resold in transactions exempt from registration, which are normally those transactions with qualified institutional buyers.
AMT Alternative Minimum Tax
IF Inverse floating rate security issued by a tender option bond (“TOB”) trust, the interest rate on which varies inversely with the Securities Industry Financial Markets Association (SIFMA) short-term rate, which resets weekly, or a similar short-term rate, and is reduced by the expenses related to the TOB trust.
UB Underlying bond of an inverse floating rate trust reflected as a financing transaction. See Notes to Financial Statements, Note 4 – Portfolio Securities and Investments in Derivatives for more information.
WI/DD Purchased on a when-issued or delayed delivery basis.
See accompanying notes to financial statements.
49
Statement of Assets and Liabilities
February 28, 2021
| | | | | | | | | | | | | |
| | | NCB | | | NJV | | | NYV | | | NPN | |
| Assets | | | | | | | | | | | | |
| Long-term investments, at value (cost $42,593,773, $20,046,019 | | | | | | | | | | | | |
| $32,621,970 and $15,709,436, respectively) | | $ | 48,625,455 | | | $ | 21,747,879 | | | $ | 36,153,709 | | | $ | 16,640,878 | |
| Short-term investments, at value (cost approximates value) | | | 1,200,000 | | | | — | | | | 620,000 | | | | 450,000 | |
| Cash | | | 3,610,735 | | | | 2,525,516 | | | | — | | | | 1,028,867 | |
| Receivable for: | | | | | | | | | | | | | | | | |
| Interest | | | 514,897 | | | | 210,847 | | | | 438,591 | | | | 180,435 | |
| Investments sold | | | — | | | | — | | | | — | | | | 816,886 | |
| Other assets | | | — | | | | — | | | | 6 | | | | — | |
| Total assets | | | 53,951,087 | | | | 24,484,242 | | | | 37,212,306 | | | | 19,117,066 | |
| Liabilities | | | | | | | | | | | | | | | | |
| Cash overdraft | | | — | | | | — | | | | 80,059 | | | | — | |
| Floating rate obligations | | | — | | | | 810,000 | | | | — | | | | 450,000 | |
| Payable for: | | | | | | | | | | | | | | | | |
| Dividends | | | 111,434 | | | | 48,542 | | | | 64,956 | | | | 35,893 | |
| Interest | | | — | | | | 1,493 | | | | — | | | | 867 | |
| Investments purchased - when-issued/delayed-delivery | | | | | | | | | | | | | | | | |
| settlement | | | — | | | | — | | | | — | | | | 126,084 | |
| Accrued expenses: | | | | | | | | | | | | | | | | |
| Management fees | | | 23,328 | | | | 10,872 | | | | 15,954 | | | | 8,263 | |
| Professional fees | | | 26,346 | | | | 23,715 | | | | 23,779 | | | | 23,619 | |
| Trustees fees | | | 577 | | | | 248 | | | | 406 | | | | 194 | |
| Merger | | | 79,112 | | | | 27,930 | | | | 224,091 | | | | 53,936 | |
| Other | | | 37,594 | | | | 38,354 | | | | 18,632 | | | | 37,388 | |
| Total liabilities | | | 278,391 | | | | 961,154 | | | | 427,877 | | | | 736,244 | |
| Net assets applicable to common shares | | $ | 53,672,696 | | | $ | 23,523,088 | | | $ | 36,784,429 | | | $ | 18,380,822 | |
| Common shares outstanding | | | 3,302,961 | | | | 1,524,357 | | | | 2,349,612 | | | | 1,219,222 | |
| Net asset value (“NAV”) per common share outstanding | | $ | 16.25 | | | $ | 15.43 | | | $ | 15.66 | | | $ | 15.08 | |
| Net assets applicable to common shares consist of: | | | | | | | | | | | | | | | | |
| Common shares, $0.01 par value per share | | $ | 33,030 | | | $ | 15,244 | | | $ | 23,496 | | | $ | 12,192 | |
| Paid-in-surplus | | | 47,023,878 | | | | 21,762,557 | | | | 33,179,476 | | | | 17,353,760 | |
| Total distributable earnings | | | 6,615,788 | | | | 1,745,287 | | | | 3,581,457 | | | | 1,014,870 | |
| Net assets applicable to common shares | | $ | 53,672,696 | | | $ | 23,523,088 | | | $ | 36,784,429 | | | $ | 18,380,822 | |
| Authorized shares: | | | | | | | | | | | | | | | | |
| Common | | Unlimited | | | Unlimited | | | Unlimited | | | Unlimited | |
See accompanying notes to financial statements.
50
| | | | | |
| �� | | |
| |
| Year Ended February 28, 2021 | | | | |
| |
| |
| | |
| | |
| | | NCB | | | NJV | | | NYV | | | NPN | |
| Investment Income | | $ | 1,917,907 | | | $ | 842,688 | | | $ | 1,194,649 | | | $ | 673,375 | |
| Expenses | | | | | | | | | | | | | | | | |
| Management fees | | | 300,153 | | | | 138,690 | | | | 205,901 | | | | 106,747 | |
| Interest expense and amortization of offering costs | | | — | | | | 7,313 | | | | — | | | | 3,913 | |
| Custodian fees | | | 15,862 | | | | 19,787 | | | | 13,303 | | | | 19,088 | |
| Trustees fees | | | 1,503 | | | | 646 | | | | 1,044 | | | | 511 | |
| Professional fees | | | 29,675 | | | | 26,049 | | | | 26,581 | | | | 25,816 | |
| Shareholder reporting expenses | | | 11,898 | | | | 12,647 | | | | 10,794 | | | | 12,179 | |
| Shareholder servicing agent fees | | | 172 | | | | 194 | | | | 172 | | | | 172 | |
| Stock exchange listing fees | | | 12,175 | | | | 12,142 | | | | 6,577 | | | | 12,142 | |
| Investor relations expenses | | | 2,730 | | | | 1,268 | | | | 1,888 | | | | 1,015 | |
| Merger expenses | | | 195,000 | | | | 60,000 | | | | 420,000 | | | | 95,000 | |
| Other | | | 18,318 | | | | 18,115 | | | | 10,476 | | | | 17,853 | |
| Total expenses | | | 587,486 | | | | 296,851 | | | | 696,736 | | | | 294,436 | |
| Net investment income (loss) | | | 1,330,421 | | | | 545,837 | | | | 497,913 | | | | 378,939 | |
| Realized and Unrealized Gain (Loss) | | | | | | | | | | | | | | | | |
| Net realized gain (loss) from: | | | | | | | | | | | | | | | | |
| Investments | | | 288,611 | | | | 191,282 | | | | (211,579 | ) | | | 87,086 | |
| Futures contracts | | | — | | | | (83,820 | ) | | | — | | | | (12,910 | ) |
| Change in net unrealized appreciation (depreciation) of: | | | | | | | | | | | | | | | | |
| Investments | | | (2,207,959 | ) | | | (872,681 | ) | | | (899,823 | ) | | | (604,222 | ) |
| Futures contracts | | | — | | | | 32,954 | | | | — | | | | 10,380 | |
| Net realized and unrealized gain (loss) | | | (1,919,348 | ) | | | (732,265 | ) | | | (1,111,402 | ) | | | (519,666 | ) |
| Net increase (decrease) in net assets applicable to common shares | | | | | | | | | | | | | | | | |
| from operations | | $ | (588,927 | ) | | $ | (186,428 | ) | | $ | (613,489 | ) | | $ | (140,727 | ) |
See accompanying notes to financial statements.
51
Statement of Changes in Net Assets
| | | | | | | | | | | | | |
| | | NCB
| | | NJV
| |
| | | Year | | | Year | | | Year | | | Year | |
| | | Ended | | | Ended | | | Ended | | | Ended | |
| | | 2/28/21 | | | 2/29/20 | | | 2/28/21 | | | 2/29/20 | |
| Operations | | | | | | | | | | | | |
| Net investment income (loss) | | $ | 1,330,421 | | | $ | 1,757,745 | | | $ | 545,837 | | | $ | 699,471 | |
| Net realized gain (loss) from: | | | | | | | | | | | | | | | | |
| Investments | | | 288,611 | | | | 592,194 | | | | 191,282 | | | | 61,707 | |
| Futures contracts | | | — | | | | — | | | | (83,820 | ) | | | (104,424 | ) |
| Change in net unrealized appreciation (depreciation) of: | | | | | | | | | | | | | | | | |
| Investments | | | (2,207,959 | ) | | | 4,019,668 | | | | (872,681 | ) | | | 1,850,918 | |
| Futures contracts | | | — | | | | — | | | | 32,954 | | | | (37,309 | ) |
| Net increase (decrease) in net assets applicable to common shares | | | | | | | | | | | | | | | | |
| from operations | | | (588,927 | ) | | | 6,369,607 | | | | (186,428 | ) | | | 2,470,363 | |
| Distributions to Common Shareholders | | | | | | | | | | | | | | | | |
| Dividends | | | (1,534,886 | ) | | | (2,220,524 | ) | | | (579,334 | ) | | | (773,848 | ) |
| Decrease in net assets applicable to common shares from | | | | | | | | | | | | | | | | |
| distributions to common shareholders | | | (1,534,886 | ) | | | (2,220,524 | ) | | | (579,334 | ) | | | (773,848 | ) |
| Capital Share Transactions | | | | | | | | | | | | | | | | |
| Common shares: | | | | | | | | | | | | | | | | |
| Net proceeds from shares issued to shareholders due to | | | | | | | | | | | | | | | | |
| reinvestment of distributions | | | — | | | | 31,433 | | | | — | | | | — | |
| Cost of shares repurchased and retired | | | — | | | | — | | | | (83,468 | ) | | | — | |
| Net increase (decrease) in net assets applicable to common | | | | | | | | | | | | | | | | |
| shares from capital share transactions | | | — | | | | 31,433 | | | | (83,468 | ) | | | — | |
| Net increase (decrease) in net assets | | | | | | | | | | | | | | | | |
| applicable to common shares | | | (2,123,813 | ) | | | 4,180,516 | | | | (849,230 | ) | | | 1,696,515 | |
| Net assets applicable to common | | | | | | | | | | | | | | | | |
| shares at the beginning of period | | | 55,796,509 | | | | 51,615,993 | | | | 24,372,318 | | | | 22,675,803 | |
| Net assets applicable to common | | | | | | | | | | | | | | | | |
| shares at the end of period | | $ | 53,672,696 | | | $ | 55,796,509 | | | $ | 23,523,088 | | | $ | 24,372,318 | |
See accompanying notes to financial statements.
52
| | | | | | | | | | | | | |
| | | NYV | | | NPN
| |
| | | Year | | | Year | | | Year | | | Year | |
| | | Ended | | | Ended | | | Ended | | | Ended | |
| | | 2/28/21 | | | 2/29/20 | | | 2/28/21 | | | 2/29/20 | |
| Operations | | | | | | | | | | | | |
| Net investment income (loss) | | $ | 497,913 | | | $ | 1,015,341 | | | $ | 378,939 | | | $ | 551,303 | |
| Net realized gain (loss) from: | | | | | | | | | | | | | | | | |
| Investments | | | (211,579 | ) | | | 836,215 | | | | 87,086 | | | | 150,369 | |
| Futures contracts | | | — | | | | — | | | | (12,910 | ) | | | (28,350 | ) |
| Change in net unrealized appreciation (depreciation) of: | | | | | | | | | | | | | | | | |
| Investments | | | (899,823 | ) | | | 2,071,166 | | | | (604,222 | ) | | | 1,014,478 | |
| Futures contracts | | | — | | | | — | | | | 10,380 | | | | (11,514 | ) |
| Net increase (decrease) in net assets applicable to common shares | | | | | | | | | | | | | | | | |
| from operations | | | (613,489 | ) | | | 3,922,722 | | | | (140,727 | ) | | | 1,676,286 | |
| Distributions to Common Shareholders | | | | | | | | | | | | | | | | |
| Dividends | | | (931,151 | ) | | | (1,645,669 | ) | | | (548,881 | ) | | | (593,448 | ) |
| Decrease in net assets applicable to common shares from | | | | | | | | | | | | | | | | |
| distributions to common shareholders | | | (931,151 | ) | | | (1,645,669 | ) | | | (548,881 | ) | | | (593,448 | ) |
| Capital Share Transactions | | | | | | | | | | | | | | | | |
| Common shares: | | | | | | | | | | | | | | | | |
| Net proceeds from shares issued to shareholders due to | | | | | | | | | | | | | | | | |
| reinvestment of distributions | | | — | | | | — | | | | 1,030 | | | | 1,250 | |
| Cost of shares repurchased and retired | | | — | | | | — | | | | — | | | | — | |
| Net increase (decrease) in net assets applicable to common | | | | | | | | | | | | | | | | |
| shares from capital share transactions | | | — | | | | — | | | | 1,030 | | | | 1,250 | |
| Net increase (decrease) in net assets | | | | | | | | | | | | | | | | |
| applicable to common shares | | | (1,544,640 | ) | | | 2,277,053 | | | | (688,578 | ) | | | 1,084,088 | |
| Net assets applicable to common | | | | | | | | | | | | | | | | |
| shares at the beginning of period | | | 38,329,069 | | | | 36,052,016 | | | | 19,069,400 | | | | 17,985,312 | |
| Net assets applicable to common | | | | | | | | | | | | | | | | |
| shares at the end of period | | $ | 36,784,429 | | | $ | 38,329,069 | | | $ | 18,380,822 | | | $ | 19,069,400 | |
See accompanying notes to financial statements.
53
| | | | | | | | | | | |
| | | | | | |
| |
| |
| |
| Selected data for a common share outstanding throughout each period: | | | | |
|
|
| | |
| | | | | | | | | | | | | | Less Distributions to | | | | | | | | | | | | | |
| | | | | Investment Operations | | | | | | Common Shareholders | | | | | | | | | Common Share | | | | |
| | | | | | | | | | | | | | | | | From | | | | | | | | | | | | | |
| | | | | | | | | | | | | | | | | Accum- | | | | | | Discount | | | | | | | |
| | Beginning | | | Net | | | Net | | | | | | From | | | ulated | | | | | | Per | | | | | | | |
| | Common | | | Investment | | | Realized/ | | | | | | Net | | | Net | | | | | | Share | | | | | | Ending | |
| | Share | | | Income | | | Unrealized | | | | | | Investment | | | Realized | | | | | | Repurchased | | | Ending | | | Share | |
| | NAV | | | (Loss) | | | Gain (Loss) | | | Total | | | Income | | | Gains | | | Total | | | and Retired | | | NAV | | | Price | |
| | |
NCB | | | | | | | | | | | | | | | | | | | | | | | | | | | | | | |
Year Ended 2/28-2/29: | | | | | | | | | | | | | | | | | | | | | | | | | | | | |
| 2021 | | $ | 16.89 | | | $ | 0.40 | | | $ | (0.58 | ) | | $ | (0.18 | ) | | $ | (0.41 | ) | | $ | (0.05 | ) | | $ | (0.46 | ) | | $ | — | | | $ | 16.25 | | | $ | 15.35 | |
| 2020 | | | 15.64 | | | | 0.53 | | | | 1.39 | | | | 1.92 | | | | (0.55 | ) | | | (0.12 | ) | | | (0.67 | ) | | | — | | | | 16.89 | | | | 15.70 | |
| 2019 | | | 15.90 | | | | 0.66 | | | | (0.27 | ) | | | 0.39 | | | | (0.65 | ) | | | — | | | | (0.65 | ) | | | — | | | | 15.64 | | | | 16.00 | |
| 2018 | | | 16.28 | | | | 0.68 | | | | (0.10 | ) | | | 0.58 | | | | (0.83 | ) | | | (0.13 | ) | | | (0.96 | ) | | | — | | | | 15.90 | | | | 15.62 | |
| 2017 | | | 17.23 | | | | 0.77 | | | | (0.73 | ) | | | 0.04 | | | | (0.79 | ) | | | (0.20 | ) | | | (0.99 | ) | | | — | | | | 16.28 | | | | 16.70 | |
| | |
NJV | | | | | | | | | | | | | | | | | | | | | | | | | | | | | | | | | | | | | | | | |
Year Ended 2/28-2/29: | | | | | | | | | | | | | | | | | | | | | | | | | | | | | | | | | | | | | |
| 2021 | | | 15.92 | | | | 0.36 | | | | (0.48 | ) | | | (0.12 | ) | | | (0.38 | ) | | | — | | | | (0.38 | ) | | | 0.01 | | | | 15.43 | | | | 14.70 | |
| 2020 | | | 14.81 | | | | 0.46 | | | | 1.16 | | | | 1.62 | | | | (0.51 | ) | | | — | | | | (0.51 | ) | | | — | | | | 15.92 | | | | 13.96 | |
| 2019 | | | 15.15 | | | | 0.54 | | | | (0.02 | ) | | | 0.52 | | | | (0.55 | ) | | | (0.34 | ) | | | (0.89 | ) | | | 0.03 | | | | 14.81 | | | | 13.08 | |
| 2018 | | | 15.56 | | | | 0.57 | | | | (0.05 | ) | | | 0.52 | | | | (0.58 | ) | | | (0.35 | ) | | | (0.93 | ) | | | — | | | | 15.15 | | | | 13.55 | |
| 2017(d) | | | 16.32 | | | | 0.49 | | | | (0.58 | ) | | | (0.09 | ) | | | (0.52 | ) | | | (0.15 | ) | | | (0.67 | ) | | | — | | | | 15.56 | | | | 15.61 | |
| Year Ended 4/30: | | | | | | | | | | | | | | | | | | | | | | | | | | | | | | | | | | | | | | | | |
| 2016 | | | 16.41 | | | | 0.62 | | | | 0.11 | | | | 0.73 | | | | (0.61 | ) | | | (0.21 | ) | | | (0.82 | ) | | | — | | | | 16.32 | | | | 15.16 | |
(a) Total Return Based on Common Share NAV is the combination of changes in common share NAV, reinvested dividend income at NAV and reinvested capital gains distributions at NAV, if any. The last dividend declared in the period, which is typically paid on the first business day of the following month, is assumed to be reinvested at the ending NAV. The actual reinvest price for the last dividend declared in the period may often be based on the Fund’s market price (and not its NAV), and therefore may be different from the price used in the calculation. Total returns are not annualized.
Total Return Based on Common Share Price is the combination of changes in the market price per share and the effect of reinvested dividend income and reinvested capital gains distributions, if any, at the average price paid per share at the time of reinvestment. The last dividend declared in the period, which is typically paid on the first business day of the following month, is assumed to be reinvested at the ending market price. The actual reinvestment for the last dividend declared in the period may take place over several days, and in some instances may not be based on the market price, so the actual reinvestment price may be different from the price used in the calculation. Total returns are not annualized.
54
| | | | | | | | | | | | | | | | | |
| | | | | | | | | | Common Share Supplemental Data/ | | | | |
| | | | | | | | | | Ratios Applicable to Common Shares | | | | |
| Common Share | | | | | | | | | | | | | |
| Total Returns | | | | | | Ratios to Average Net Assets(b) | | | | |
| | |
| | | | Based | | | Ending | | | | | | | | | | |
Based | | | on | | | Net | | | | | | Net | | | Portfolio | |
on | | | Share | | | Assets | | | | | | Investment | | | Turnover | |
NAV(a) | | | Price(a) | | | | (000 | ) | | Expenses | | | Income (Loss) | | | Rate(c) | |
| | |
| | (1.01 | )% | | | 0.81 | % | | $ | 53,673 | | | | 1.09 | % | | | 2.47 | % | | | 10 | % |
| | 12.52 | | | | 2.31 | | | | 55,797 | | | | 0.71 | | | | 3.27 | | | | 25 | |
| | 2.50 | | | | 6.77 | | | | 51,616 | | | | 0.76 | | | | 4.17 | | | | 27 | |
| | 3.56 | | | | (0.90 | ) | | | 52,469 | | | | 0.77 | | | | 4.14 | | | | 8 | |
| | 0.25 | | | | 0.10 | | | | 53,601 | | | | 0.74 | | | | 4.52 | | | | 23 | |
| | |
| | (0.63 | ) | | | 8.31 | | | | 23,523 | | | | 1.28 | | | | 2.35 | | | | 7 | |
| | 11.07 | | | | 10.71 | | | | 24,372 | | | | 0.99 | | | | 2.97 | | | | 21 | |
| | 3.73 | | | | 3.39 | | | | 22,676 | | | | 1.07 | | | | 3.58 | | | | 24 | |
| | 3.31 | | | | (7.48 | ) | | | 23,510 | | | | 1.03 | | | | 3.63 | | | | 16 | |
| | (0.57 | ) | | | 7.39 | | | | 24,139 | | | | 0.96 | * | | | 3.62 | * | | | 14 | |
| | 4.57 | | | | 8.70 | | | | 25,297 | | | | 0.89 | | | | 3.87 | | | | 8 | |
(b) • The expense ratios reflect, among other things, the interest expense deemed to have been paid by the Fund on the floating rate certificates issued by the special purpose trusts for the self-deposited inverse floaters held by the Fund (as described in Note 4 – Portfolio Securities and Investments in Derivatives), where applicable, as follows:
| | | | | |
NCB | | | NJV | |
| Year Ended 2/28-2/29: | | | Year Ended 2/28-2/29: | |
| 2021 | —% | | 2021 | 0.03% |
| 2020 | — | | 2020 | 0.06 |
| 2019 | — | | 2019 | 0.13 |
| 2018 | — | | 2018 | 0.09 |
| 2017 | — | | 2017(d) | 0.07* |
| | | Year Ended 4/30: | |
| | | 2016 | 0.04 |
(c) Portfolio Turnover Rate is calculated based on the lesser of long-term purchases or sales (as disclosed in Note 4 – Portfolio Securities and Investments in Derivatives), divided by the average long-term market value during the period.
(d) For the ten months ended February 28, 2017.
* Annualized.
See accompanying notes to financial statements.
55
| | | | | | | | | | | |
Financial Highlights (continued) | | | | | | |
|
|
| Selected data for a common share outstanding throughout each period: | | | | |
| | |
| | | | | | | | | | | | | | Less Distributions to | | | | | | | | | | | | | |
| | | | | Investment Operations | | | | | | Common Shareholders | | | | | | | | | Common Share | | | | |
| | | | | | | | | | | | | | | | | From | | | | | | | | | | | | | |
| | | | | | | | | | | | | | | | | Accum- | | | | | | Discount | | | | | | | |
| | Beginning | | | Net | | | Net | | | | | | From | | | ulated | | | | | | Per | | | | | | | |
| | Common | | | Investment | | | Realized/ | | | | | | Net | | | Net | | | | | | Share | | | | | | Ending | |
| | Share | | | Income | | | Unrealized | | | | | | Investment | | | Realized | | | | | | Repurchased | | | Ending | | | Share | |
| | NAV | | | (Loss) | | | Gain (Loss) | | | Total | | | Income | | | Gains | | | Total | | | and Retired | | | NAV | | | Price | |
| | |
NYV | | | | | | | | | | | | | | | | | | | | | | | | | | | | | | |
Year Ended 2/28-2/29: | | | | | | | | | | | | | | | | | | | | | | | | | | | | |
| 2021 | | $ | 16.31 | | | $ | 0.21 | | | $ | (0.46 | ) | | $ | (0.25 | ) | | $ | (0.34 | ) | | $ | (0.06 | ) | | $ | (0.40 | ) | | $ | — | | | $ | 15.66 | | | $ | 14.42 | |
| 2020 | | | 15.34 | | | | 0.43 | | | | 1.25 | | | | 1.68 | | | | (0.47 | ) | | | (0.24 | ) | | | (0.71 | ) | | | — | | | | 16.31 | | | | 14.77 | |
| 2019 | | | 15.10 | | | | 0.53 | | | | 0.22 | | | | 0.75 | | | | (0.51 | ) | | | — | | | | (0.51 | ) | | | — | | | | 15.34 | | | | 13.68 | |
| 2018 | | | 15.46 | | | | 0.55 | | | | (0.21 | ) | | | 0.34 | | | | (0.59 | ) | | | (0.11 | ) | | | (0.70 | ) | | | — | | | | 15.10 | | | | 13.78 | |
| 2017(d) | | | 16.14 | | | | 0.25 | | | | (0.64 | ) | | | (0.39 | ) | | | (0.29 | ) | | | — | | | | (0.29 | ) | | | — | | | | 15.46 | | | | 14.87 | |
| Year Ended 9/30: | | | | | | | | | | | | | | | | | | | | | | | | | | | | | | | | | | | | | | | | |
| 2016 | | | 15.89 | | | | 0.81 | | | | 0.07 | | | | 0.88 | | | | (0.63 | ) | | | — | | | | (0.63 | ) | | | — | | | | 16.14 | | | | 15.90 | |
| | |
NPN | | | | | | | | | | | | | | | | | | | | | | | | | | | | | | | | | | | | | | | | |
Year Ended 2/28-2/29: | | | | | | | | | | | | | | | | | | | | | | | | | | | | | | | | | | | | | |
| 2021 | | | 15.64 | | | | 0.31 | | | | (0.42 | ) | | | (0.11 | ) | | | (0.37 | ) | | | (0.08 | ) | | | (0.45 | ) | | | — | | | | 15.08 | | | | 13.96 | |
| 2020 | | | 14.75 | | | | 0.45 | | | | 0.93 | | | | 1.38 | | | | (0.47 | ) | | | (0.02 | ) | | | (0.49 | ) | | | — | | | | 15.64 | | | | 14.67 | |
| 2019 | | | 14.78 | | | | 0.50 | | | | 0.06 | | | | 0.56 | | | | (0.50 | ) | | | (0.10 | ) | | | (0.60 | ) | | | 0.01 | | | | 14.75 | | | | 13.19 | |
| 2018 | | | 15.16 | | | | 0.55 | | | | (0.16 | ) | | | 0.39 | | | | (0.58 | ) | | | (0.19 | ) | | | (0.77 | ) | | | — | | | | 14.78 | | | | 15.15 | |
| 2017(e) | | | 16.50 | | | | 0.51 | | | | (0.73 | ) | | | (0.22 | ) | | | (0.64 | ) | | | (0.48 | ) | | | (1.12 | ) | | | — | | | | 15.16 | | | | 15.83 | |
| Year Ended 4/30: | | | | | | | | | | | | | | | | | | | | | | | | | | | | | | | | | | | | | | | | |
| 2016 | | | 16.36 | | | | 0.68 | | | | 0.09 | | | | 0.77 | | | | (0.63 | ) | | | — | | | | (0.63 | ) | | | — | | | | 16.50 | | | | 16.45 | |
(a) Total Return Based on Common Share NAV is the combination of changes in common share NAV, reinvested dividend income at NAV and reinvested capital gains distributions at NAV, if any. The last dividend declared in the period, which is typically paid on the first business day of the following month, is assumed to be reinvested at the ending NAV. The actual reinvest price for the last dividend declared in the period may often be based on the Fund’s market price (and not its NAV), and therefore may be different from the price used in the calculation. Total returns are not annualized.
Total Return Based on Common Share Price is the combination of changes in the market price per share and the effect of reinvested dividend income and reinvested capital gains distributions, if any, at the average price paid per share at the time of reinvestment. The last dividend declared in the period, which is typically paid on the first business day of the following month, is assumed to be reinvested at the ending market price. The actual reinvestment for the last dividend declared in the period may take place over several days, and in some instances may not be based on the market price, so the actual reinvestment price may be different from the price used in the calculation. Total returns are not annualized.
56
| | | | | | | | | | | | | | | | | |
| | | | | | | | | | Common Share Supplemental Data/ | | | | |
| | | | | | | | | | Ratios Applicable to Common Shares | | | | |
Common Share
| | | | | | | | | | | | | |
Total Returns
| | | | | | Ratios to Average Net Assets(b) | | | | |
| | |
| | | | Based | | | Ending | | | | | | | | | | |
Based | | | on | | | Net | | | | | | Net | | | Portfolio | |
on | | | Share | | | Assets | | | | | | Investment | | | Turnover | |
NAV(a) | | | Price(a) | | | | (000 | ) | | Expenses | | | Income (Loss) | | | Rate(c) | |
| | |
| | (1.54 | )% | | | 0.35 | % | | $ | 36,784 | | | | 1.88 | % | | | 1.35 | % | | | 12 | % |
| | 11.11 | | | | 13.32 | | | | 38,329 | | | | 0.75 | | | | 2.73 | | | | 17 | |
| | 5.05 | | | | 3.08 | | | | 36,052 | | | | 0.75 | | | | 3.50 | | | | 34 | |
| | 2.17 | | | | (2.83 | ) | | | 35,489 | | | | 0.75 | | | | 3.53 | | | | 27 | |
| | (2.41 | ) | | | (4.67 | ) | | | 36,329 | | | | 0.85 | * | | | 3.90 | * | | | 13 | |
| | 5.62 | | | | 11.45 | | | | 37,927 | | | | 0.76 | | | | 5.01 | | | | 8 | |
| | |
| | (0.72 | ) | | | (1.76 | ) | | | 18,381 | | | | 1.61 | | | | 2.07 | | | | 8 | |
| | 9.54 | | | | 15.04 | | | | 19,069 | | | | 1.03 | | | | 2.97 | | | | 20 | |
| | 3.99 | | | | (8.87 | ) | | | 17,985 | | | | 1.02 | | | | 3.41 | | | | 10 | |
| | 2.58 | | | | 0.68 | | | | 18,066 | | | | 1.02 | | | | 3.61 | | | | 28 | |
| | (1.33 | ) | | | 3.08 | | | | 18,517 | | | | 0.93 | * | | | 3.80 | * | | | 23 | |
| | 9.54 | | | | 15.04 | | | | 19,069 | | | | 1.03 | | | | 2.97 | | | | 20 | |
(b) • The expense ratios reflect, among other things, the interest expense deemed to have been paid by the Fund on the floating rate certificates issued by the special purpose trusts for the self-deposited inverse floaters held by the Fund (as described in Note 4 – Portfolio Securities and Investments in Derivatives), where applicable, as follows:
| | | | | |
NYV | | | NPN | |
| Year Ended 2/28-2/29: | | | Year Ended 2/28-2/29: | |
| 2021 | —% | | 2021 | 0.02% |
| 2020 | — | | 2020 | 0.04 |
| 2019 | — | | 2019 | 0.04 |
| 2018 | — | | 2018 | 0.02 |
| 2017(d) | — | | 2017(e) | 0.01* |
| Year Ended 9/30: | | | Year Ended 4/30: | |
| 2016 | — | | 2016 | — |
(c) Portfolio Turnover Rate is calculated based on the lesser of long-term purchases or sales (as disclosed in Note 4 – Portfolio Securities and Investments in Derivatives) divided by the average long-term market value during the period.
(d) For the five months ended February 28, 2017.
(e) For the ten months ended February 28, 2017.
* Annualized.
See accompanying notes to financial statements.
57
Notes toFinancial Statements
1. General Information
Fund Information
The funds covered in this report and their corresponding New York Stock Exchange (“NYSE”) symbols are as follows (each a “Fund” and collectively, the “Funds”):
• Nuveen California Municipal Value Fund 2 (NCB)
• Nuveen New Jersey Municipal Value Fund (NJV)
• Nuveen New York Municipal Value Fund 2 (NYV)
• Nuveen Pennsylvania Municipal Value Fund (NPN)
The Funds are registered under the Investment Company Act of 1940 (the “1940 Act”), as amended, as diversified (non-diversified for NJV) closed-end management investment companies. The Funds were organized as Massachusetts business trusts on January 26, 2009.
The end of the reporting period for the Funds is February 28, 2021, and the period covered by these Notes to Financial Statements is the fiscal year ended February 28, 2021 (the “current fiscal period”).
Investment Adviser and Sub-Adviser
The Funds’ investment adviser is Nuveen Fund Advisors, LLC (the “Adviser”), a subsidiary of Nuveen, LLC (“Nuveen”). Nuveen is the investment management arm of Teachers Insurance and Annuity Association of America (TIAA). The Adviser has overall responsibility for management of the Funds, oversees the management of the Funds’ portfolios, manages the Funds’ business affairs and provides certain clerical, bookkeeping and other administrative services, and, if necessary, asset allocation decisions. The Adviser has entered into sub-advisory agreements with Nuveen Asset Management, LLC (the “Sub-Adviser”), a subsidiary of the Adviser, under which the Sub-Adviser manages the investment portfolios of the Funds.
Fund Mergers
During August 2020, the Funds’ Board of Directors/Trustees (the “Board”) approved a merger for each Fund included in this report (each a “Merger” and collectively the “Mergers”). The Mergers are intended to create larger funds with lower operating expenses and increased trading volume on the exchange for common shares. The approved Mergers are as follows:
| | | | |
| | Target Fund Approval Date of | |
Target Fund | Acquiring Fund | Merger by Shareholders | Merger Completed* |
| NCB | Nuveen California Municipal Value Fund (NCA) | February 17, 2021 | March 8, 2021 |
| NJV | Nuveen AMT-Free Municipal Value Fund (NUW) | January 15, 2021 | March 8, 2021 |
| NYV | Nuveen New York Municipal Value Fund (NNY) | January 15, 2021 | April 12, 2021 |
| NPN | NUW | February 17, 2021 | March 8, 2021 |
* Merger completed before the opening of business, and subsequent to the reporting period.
See Note 9 - Subsequent Events for further details.
Other Matters
The outbreak of the novel coronavirus (“COVID-19”) and subsequent global pandemic began significantly impacting the U.S. and global financial markets and economies during the calendar quarter ended March 31, 2020. The worldwide spread of COVID-19 has created significant uncertainty in the global economy. The duration and extent of COVID-19 over the long term cannot be reasonably estimated at this time. The ultimate impact of COVID-19 and the extent to which COVID-19 impacts the Funds’ normal course of business, results of operations, investments, and cash flows will depend on future developments, which are highly uncertain and difficult to predict. Management continues to monitor and evaluate this situation.
2. Significant Accounting Policies
The accompanying financial statements were prepared in accordance with accounting principles generally accepted in the United States of America (“U.S. GAAP”), which may require the use of estimates made by management and the evaluation of subsequent events. Actual results may differ from
58
those estimates. Each Fund is an investment company and follows the accounting guidance in the Financial Accounting Standards Board (“FASB”) Accounting Standards Codification 946, Financial Services—Investment Companies. The NAV for financial reporting purposes may differ from the NAV for processing security and common share transactions. The NAV for financial reporting purposes includes security and common share transactions through the date of the report. Total return is computed based on the NAV used for processing security and common share transactions. The following is a summary of the significant accounting policies consistently followed by the Funds.
Compensation
The Funds pay no compensation directly to those of its trustees who are affiliated with the Adviser or to its officers, all of whom receive remuneration for their services to the Funds from the Adviser or its affiliates. The Board has adopted a deferred compensation plan for independent trustees that enables trustees to elect to defer receipt of all or a portion of the annual compensation they are entitled to receive from certain Nuveen-advised funds. Under the plan, deferred amounts are treated as though equal dollar amounts had been invested in shares of select Nuveen-advised funds.
Distributions to Common Shareholders
Distributions to common shareholders are recorded on the ex-dividend date. The amount, character and timing of distributions are determined in accordance with federal income tax regulations, which may differ from U.S. GAAP.
Indemnifications
Under the Funds’ organizational documents, their officers and trustees are indemnified against certain liabilities arising out of the performance of their duties to the Funds. In addition, in the normal course of business, the Funds enter into contracts that provide general indemnifications to other parties. The Funds’ maximum exposure under these arrangements is unknown as this would involve future claims that may be made against the Funds that have not yet occurred. However, the Funds have not had prior claims or losses pursuant to these contracts and expect the risk of loss to be remote.
Investments and Investment Income
Securities transactions are accounted for as of the trade date for financial reporting purposes. Realized gains and losses on securities transactions are based upon the specific identification method. Investment income is comprised of interest income, which is recorded on an accrual basis and includes accretion of discounts and amortization of premiums for financial reporting purposes. Investment income also reflects payment-in-kind (“PIK”) interest and paydown gains and losses, if any. PIK interest represents income received in the form of securities in lieu of cash. Investment income also reflects dividend income, which is recorded on the ex-dividend date.
Netting Agreements
In the ordinary course of business, the Funds may enter into transactions subject to enforceable International Swaps and Derivative Association, Inc. (ISDA) master agreements or other similar arrangements (“netting agreements”). Generally, the right to offset in netting agreements allows each Fund to offset certain securities and derivatives with a specific counterparty, when applicable, as well as any collateral received or delivered to that counterparty based on the terms of the agreements. Generally, each Fund manages its cash collateral and securities collateral on a counterparty basis.
The Funds’ investments subject to netting agreements as of the end of the reporting period, if any, are further described in Note 4 – Portfolio Securities and Investments in Derivatives.
New Accounting Pronouncements and Rule Issuances
Reference Rate Reform
In March 2020, FASB issued Accounting Standards Update (“ASU”) 2020-04, Reference Rate Reform: Facilitation of the Effects of Reference Rate Reform on Financial Reporting. The main objective of the new guidance is to provide relief to companies that will be impacted by the expected change in benchmark interest rates at the end of 2021, when participating banks will no longer be required to submit London Interbank Offered Rate (LIBOR) quotes by the UK Financial Conduct Authority (FCA). The new guidance allows companies to, provided the only change to existing contracts are a change to an approved benchmark interest rate, account for modifications as a continuance of the existing contract without additional analysis. For new and existing contracts, the Funds may elect to apply the optional expedients as of March 12, 2020 through December 31, 2022. Management has not yet elected to apply the optional expedients, but is currently assessing the impact of the ASU’s adoption to the Funds’ financial statements and various filings.
Securities and Exchange Commission (“SEC”) Adopts New Rules to Modernize Fund Valuation Framework
In December 2020, the SEC voted to adopt a new rule governing fund valuation practices. New Rule 2a-5 under the 1940 Act establishes requirements for determining fair value in good faith for purposes of the 1940 Act. Rule 2a-5 will permit fund boards to designate certain parties to perform fair value determinations, subject to board oversight and certain other conditions. Rule 2a-5 also defines when market quotations are “readily available” for purposes of Section 2(a)(41) of the 1940 Act, which requires a fund to fair value a security when market quotation are not readily available. The SEC also
59
Notes to Financial Statements (continued)
adopted new Rule 31a-4 under the 1940 Act, which sets forth the recordkeeping requirements associated with fair value determinations. Finally, the SEC is rescinding previously issued guidance on related issues, including the role of a board in determining fair value and the accounting and auditing of fund investments. Rule 2a-5 and Rule 31a-4 will become effective on March 8, 2021, with a compliance date of September 8, 2022. A fund may voluntarily comply with the rules after the effective date, and in advance of the compliance date, under certain conditions. Management is currently assessing the impact of these provisions on the Funds’ financial statements.
3. Investment Valuation and Fair Value Measurements
The Funds’ investments in securities are recorded at their estimated fair value utilizing valuation methods approved by the Board. Fair value is defined as the price that would be received upon selling an investment or transferring a liability in an orderly transaction to an independent buyer in the principal or most advantageous market for the investment. U.S. GAAP establishes the three-tier hierarchy is used to maximize the use of observable market data and minimize the use of unobservable inputs and to establish classification of fair value measurements for disclosure purposes. Observable inputs reflect the assumptions market participants would use in pricing the asset or liability. Observable inputs are based on market data obtained from sources independent of the reporting entity. Unobservable inputs reflect management’s assumptions about the assumptions market participants would use in pricing the asset or liability. Unobservable inputs are based on the best information available in the circumstances. The following is a summary of the three-tiered hierarchy of valuation input levels.
Level 1 – Inputs are unadjusted and prices are determined using quoted prices in active markets for identical securities.
Level 2 – Prices are determined using other significant observable inputs (including quoted prices for similar securities, interest rates, credit spreads, etc.).
Level 3 – Prices are determined using significant unobservable inputs (including management’s assumptions in determining the fair value of investments).
A description of the valuation techniques applied to the Funds’ major classifications of assets and liabilities measured at fair value follows:
Prices of fixed-income securities are generally provided by an independent pricing service (“pricing service”) approved by the Board. The pricing service establishes a security’s fair value using methods that may include consideration of the following: yields or prices of investments of comparable quality, type of issue, coupon, maturity and rating, market quotes or indications of value from security dealers, evaluations of anticipated cash flows or collateral, general market conditions and other information and analysis, including the obligor’s credit characteristics considered relevant. In pricing certain securities, particularly less liquid and lower quality securities, the pricing service may consider information about a security, its issuer or market activity, provided by the Adviser. These securities are generally classified as Level 2.
Equity securities and exchange-traded funds listed or traded on a national market or exchange are valued based on their sale price at the official close of business of such market or exchange on the valuation date. Foreign equity securities are valued at the last sale price or official closing price reported on the exchange where traded and converted to U.S. dollars at the prevailing rates of exchange on the date of valuation. To the extent these securities are actively traded and that valuation adjustments are not applied, they are generally classified as Level 1. If there is no official close of business, then the latest available sale price is utilized. If no sales are reported, then the mean of the latest available bid and ask prices is utilized and are generally classified as Level 2.
Futures contracts are valued using the closing settlement price or, in the absence of such a price, the last traded price and are generally classified as Level 1.
Any portfolio security or derivative for which market quotations are not readily available or for which the above valuation procedures are deemed not to reflect fair value are valued at fair value, as determined in good faith using procedures approved by the Board. As a general principle, the fair value of a security would appear to be the amount that the owner might reasonably expect to receive for it in a current sale. A variety of factors may be considered in determining the fair value of such securities, which may include consideration of the following: yields or prices of investments of comparable quality, type of issue, coupon, maturity and rating, market quotes or indications of value from security dealers, evaluations of anticipated cash flows or collateral, general market conditions and other information and analysis, including the obligor’s credit characteristics considered relevant. To the extent the inputs are observable and timely, the values would be classified as Level 2 of the fair value hierarchy; otherwise they would be classified as Level 3.
The following table summarizes the market value of the Funds’ investments as of the end of the reporting period, based on the inputs used to value them:
| | | | | | | | | | | | | |
NCB | | Level 1 | | | Level 2 | | | Level 3 | | | Total | |
| Long-Term Investments*: | | | | | | | | | | | | |
| Municipal Bonds | | $ | — | | | $ | 48,625,455 | | | $ | — | | | $ | 48,625,455 | |
| Short-Term Investments*: | | | | | | | | | | | | | | | | |
| Municipal Bonds | | | — | | | | 1,200,000 | | | | — | | | | 1,200,000 | |
| Total | | $ | — | | | $ | 49,825,455 | | | $ | — | | | $ | 49,825,455 | |
60
| | | | | | | | | | | | | |
NJV | | Level 1 | | | Level 2 | | | Level 3 | | | Total | |
| Long-Term Investments*: | | | | | | | | | | | | |
| Municipal Bonds | | $ | — | | | $ | 21,747,879 | | | $ | — | | | $ | 21,747,879 | |
| Total | | $ | — | | | $ | 21,747,879 | | | $ | — | | | $ | 21,747,879 | |
| | |
NYV | | | | | | | | | | | | | | | | |
| Long-Term Investments*: | | | | | | | | | | | | | | | | |
| Municipal Bonds | | $ | — | | | $ | 36,153,709 | | | $ | — | | | $ | 36,153,709 | |
| Short-Term Investments*: | | | | | | | | | | | | | | | | |
| Municipal Bonds | | | — | | | | 620,000 | | | | — | | | | 620,000 | |
| Total | | $ | — | | | $ | 36,773,709 | | | $ | — | | | $ | 36,773,709 | |
| | |
NPN | | | | | | | | | | | | | | | | |
| Long-Term Investments*: | | | | | | | | | | | | | | | | |
| Municipal Bonds | | $ | — | | | $ | 16,227,834 | | | $ | — | | | $ | 16,227,834 | |
| Common Stocks | | | — | | | | 413,044 | ** | | | — | | | | 413,044 | |
| Short-Term Investments*: | | | | | | | | | | | | | | | | |
| Municipal Bonds | | | — | | | | 450,000 | | | | — | | | | 450,000 | |
| Total | | $ | — | | | $ | 17,090,878 | | | $ | — | | | $ | 17,090,878 | |
* Refer to the Fund’s Portfolio of Investments for industry classifications.
** Refer to the Fund’s Portfolio of Investments for securities classified as Level 2.
4. Portfolio Securities and Investments in Derivatives
Portfolio Securities
Inverse Floating Rate Securities
Each Fund is authorized to invest in inverse floating rate securities. An inverse floating rate security is created by depositing a municipal bond (referred to as an “Underlying Bond”), typically with a fixed interest rate, into a special purpose tender option bond (“TOB”) trust (referred to as the “TOB Trust”) created by or at the direction of one or more Funds. In turn, the TOB Trust issues (a) floating rate certificates (referred to as “Floaters”) in face amounts equal to some fraction of the Underlying Bond’s par amount or market value, and (b) an inverse floating rate certificate (referred to as an “Inverse Floater”) that represents all remaining or residual interest in the TOB Trust. Floaters typically pay short-term tax-exempt interest rates to third parties who are also provided a right to tender their certificate and receive its par value, which may be paid from the proceeds of a remarketing of the Floaters, by a loan to the TOB Trust from a third party liquidity provider (“Liquidity Provider”), or by the sale of assets from the TOB Trust. The Inverse Floater is issued to a long term investor, such as one or more of the Funds. The income received by the Inverse Floater holder varies inversely with the short-term rate paid to holders of the Floaters, and in most circumstances the Inverse Floater holder bears substantially all of the Underlying Bond’s downside investment risk and also benefits disproportionately from any potential appreciation of the Underlying Bond’s value. The value of an Inverse Floater will be more volatile than that of the Underlying Bond because the interest rate is dependent on not only the fixed coupon rate of the Underlying Bond but also on the short-term interest paid on the Floaters, and because the Inverse Floater essentially bears the risk of loss (and possible gain) of the greater face value of the Underlying Bond.
The Inverse Floater held by a Fund gives the Fund the right to (a) cause the holders of the Floaters to tender their certificates at par (or slightly more than par in certain circumstances), and (b) have the trustee of the TOB Trust (the “Trustee”) transfer the Underlying Bond held by the TOB Trust to the Fund, thereby collapsing the TOB Trust.
The Fund may acquire an Inverse Floater in a transaction where it (a) transfers an Underlying Bond that it owns to a TOB Trust created by a third party or (b) transfers an Underlying Bond that it owns, or that it has purchased in a secondary market transaction for the purpose of creating an Inverse Floater, to a TOB Trust created at its direction, and in return receives the Inverse Floater of the TOB Trust (referred to as a “self-deposited Inverse Floater”). A Fund may also purchase an Inverse Floater in a secondary market transaction from a third party creator of the TOB Trust without first owning the Underlying Bond (referred to as an “externally-deposited Inverse Floater”).
An investment in a self-deposited Inverse Floater is accounted for as a “financing” transaction (i.e., a secured borrowing). For a self-deposited Inverse Floater, the Underlying Bond deposited into the TOB Trust is identified in the Fund’s Portfolio of Investments as “(UB) – Underlying bond of an inverse floating rate trust reflected as a financing transaction,” with the Fund recognizing as liabilities, labeled “Floating rate obligations” on the Statement of Assets and Liabilities, (a) the liquidation value of Floaters issued by the TOB Trust, and (b) the amount of any borrowings by the TOB Trust from a Liquidity Provider to enable the TOB Trust to purchase outstanding Floaters in lieu of a remarketing. In addition, the Fund recognizes in “Investment Income” the entire earnings of the Underlying Bond, and recognizes (a) the interest paid to the holders of the Floaters or on the TOB Trust’s borrowings, and (b) other expenses related to remarketing, administration, trustee, liquidity and other services to a TOB Trust, as a component of “Interest expense and amortization of offering costs” on the Statement of Operations. Earnings due from the Underlying Bond and interest due to the
61
Notes to Financial Statements (continued)
holders of the Floaters as of the end of the reporting period are recognized as components of “Receivable for interest” and “Payable for interest” on the Statement of Assets and Liabilities, respectively.
In contrast, an investment in an externally-deposited Inverse Floater is accounted for as a purchase of the Inverse Floater and is identified in the Fund’s Portfolio of Investments as “(IF) – Inverse floating rate investment.” For an externally-deposited Inverse Floater, a Fund’s Statement of Assets and Liabilities recognizes the Inverse Floater and not the Underlying Bond as an asset, and the Fund does not recognize the Floaters, or any related borrowings from a Liquidity Provider, as a liability. Additionally, the Fund reflects in “Investment Income” only the net amount of earnings on the Inverse Floater (net of the interest paid to the holders of the Floaters or the Liquidity Provider as lender, and the expenses of the Trust), and does not show the amount of that interest paid or the expenses of the TOB Trust as described above as interest expense on the Statement of Operations.
Fees paid upon the creation of a TOB Trust for self-deposited Inverse Floaters and externally-deposited Inverse Floaters are recognized as part of the cost basis of the Inverse Floater and are capitalized over the term of the TOB Trust.
As of the end of the reporting period, the aggregate value of Floaters issued by each Fund’s TOB Trust for self-deposited Inverse Floaters and externally-deposited Inverse Floaters was as follows:
| | | | | | | | | | | | | |
Floating Rate Obligations Outstanding | | NCB | | | NJV | | | NYV | | | NPN | |
| Floating rate obligations: self-deposited Inverse Floaters | | $ | — | | | $ | 810,000 | | | $ | — | | | $ | 450,000 | |
| Floating rate obligations: externally-deposited Inverse Floaters | | | — | | | | 725,000 | | | | — | | | | 345,000 | |
| Total | | $ | — | | | $ | 1,535,000 | | | $ | — | | | $ | 795,000 | |
During the current fiscal period, the average amount of Floaters (including any borrowings from a Liquidity Provider) outstanding, and the average annual interest rate and fees related to self-deposited Inverse Floaters, were as follows:
| | | | | | | | | | | | | |
Self-Deposited Inverse Floaters | | NCB | | | NJV | | | NYV | | | NPN | |
| Average floating rate obligations outstanding | | $ | — | | | $ | 810,000 | | | $ | — | | | $ | 450,000 | |
| Average annual interest rate and fees | | | — | % | | | 0.90 | % | | | — | % | | | 0.87 | % |
TOB Trusts are supported by a liquidity facility provided by a Liquidity Provider pursuant to which the Liquidity Provider agrees, in the event that Floaters are (a) tendered to the Trustee for remarketing and the remarketing does not occur, or (b) subject to mandatory tender pursuant to the terms of the TOB Trust agreement, to either purchase Floaters or to provide the Trustee with an advance from a loan facility to fund the purchase of Floaters by the TOB Trust. In certain circumstances, the Liquidity Provider may otherwise elect to have the Trustee sell the Underlying Bond to retire the Floaters that were tendered and not remarketed prior to providing such a loan. In these circumstances, the Liquidity Provider remains obligated to provide a loan to the extent that the proceeds of the sale of the Underlying Bond is not sufficient to pay the purchase price of the Floaters.
The size of the commitment under the loan facility for a given TOB Trust is at least equal to the balance of that TOB Trust’s outstanding Floaters plus any accrued interest. In consideration of the loan facility, fee schedules are in place and are charged by the Liquidity Provider(s). Any loans made by the Liquidity Provider will be secured by the purchased Floaters held by the TOB Trust. Interest paid on any outstanding loan balances will be effectively borne by the Fund that owns the Inverse Floaters of the TOB Trust that has incurred the borrowing and may be at a rate that is greater than the rate that would have been paid had the Floaters been successfully remarketed.
As described above, any amounts outstanding under a liquidity facility are recognized as a component of “Floating rate obligations” on the Statement of Assets and Liabilities by the Fund holding the corresponding Inverse Floaters issued by the borrowing TOB Trust. As of the end of the reporting period, there were no loans outstanding under any such facility.
Each Fund may also enter into shortfall and forbearance agreements (sometimes referred to as a “recourse arrangement”) (TOB Trusts involving such agreements are referred to herein as “Recourse Trusts”), under which a Fund agrees to reimburse the Liquidity Provider for the Trust’s Floaters, in certain circumstances, for the amount (if any) by which the liquidation value of the Underlying Bond held by the TOB Trust may fall short of the sum of the liquidation value of the Floaters issued by the TOB Trust plus any amounts borrowed by the TOB Trust from the Liquidity Provider, plus any shortfalls in interest cash flows. Under these agreements, a Fund’s potential exposure to losses related to or on an Inverse Floater may increase beyond the value of the Inverse Floater as a Fund may potentially be liable to fulfill all amounts owed to holders of the Floaters or the Liquidity Provider. Any such shortfall amount in the aggregate is recognized as “Unrealized depreciation on Recourse Trusts” on the Statement of Assets and Liabilities.
As of the end of the reporting period, each Fund’s maximum exposure to the Floaters issued by Recourse Trusts for self-deposited Inverse Floaters and externally-deposited Inverse Floaters was as follows:
| | | | | | | | | | | | | |
Floating Rate Obligations — Recourse Trusts | | NCB | | | NJV | | | NYV | | | NPN | |
| Maximum exposure to Recourse Trusts: self-deposited Inverse Floaters | | $ | — | | | $ | 810,000 | | | $ | — | | | $ | 450,000 | |
| Maximum exposure to Recourse Trusts: externally-deposited Inverse Floaters | | | — | | | | 725,000 | | | | — | | | | 345,000 | |
| Total | | $ | — | | | $ | 1,535,000 | | | $ | — | | | $ | 795,000 | |
62
Zero Coupon Securities
A zero coupon security does not pay a regular interest coupon to its holders during the life of the security. Income to the holder of the security comes from accretion of the difference between the original purchase price of the security at issuance and the par value of the security at maturity and is effectively paid at maturity. The market prices of zero coupon securities generally are more volatile than the market prices of securities that pay interest periodically.
Investment Transactions
Long-term purchases and sales (including maturities but excluding derivative transactions, where applicable) during the current fiscal period were as follows:
| | | | | | | | | | | | | |
| | NCB | | | NJV | | | NYV | | | NPN | |
| Purchases | | $ | 5,487,089 | | | $ | 1,696,544 | | | $ | 7,348,260 | | | $ | 1,462,556 | |
| Sales and maturities | | | 4,963,345 | | | | 4,287,346 | | | | 3,999,849 | | | | 3,533,057 | |
The Funds may purchase securities on a when-issued or delayed-delivery basis. Securities purchased on a when-issued or delayed-delivery basis may have extended settlement periods; interest income is not accrued until settlement date. Any securities so purchased are subject to market fluctuation during this period. The Funds have earmarked securities in their portfolios with a current value at least equal to the amount of the when issued/delayed-delivery purchase commitments. If a Fund has outstanding when-issued/delayed-delivery purchases commitments as of the end of the reporting period, such amounts are recognized on the Statement of Assets and Liabilities.
Investments in Derivatives
In addition to the inverse floating rate securities in which each Fund may invest, which are considered portfolio securities for financial reporting purposes, each Fund is authorized to invest in certain derivative investments such as futures, options and swap contracts. Each Fund limits its investments in futures, options on futures and swap contracts to the extent necessary for the Adviser to claim exclusion from registration by the Commodity Futures Trading Commission as a commodity pool operator with respect to the Fund. The Funds record derivative instruments at fair value, with changes in fair value recognized on the Statement of Operations, when applicable. Even though the Funds’ investments in derivatives may represent economic hedges, they are not considered to be hedge transactions for financial reporting purposes.
Futures Contracts
Upon execution of a futures contract, a Fund is obligated to deposit cash or eligible securities, also known as “initial margin,” into an account at its clearing broker equal to a specified percentage of the contract amount. Cash held by the broker to cover initial margin requirements on open futures contracts, if any, is recognized as “Cash collateral at brokers for investments in futures contracts” on the Statement of Assets and Liabilities. Investments in futures contracts obligate a Fund and the clearing broker to settle monies on a daily basis representing changes in the prior days “mark-to-market” of the open contracts. If a Fund has unrealized appreciation the clearing broker would credit the Fund’s account with an amount equal to appreciation and conversely if a Fund has unrealized depreciation the clearing broker would debit the Fund’s account with an amount equal to depreciation. These daily cash settlements are also known as “variation margin.” Variation margin is recognized as a receivable and/or payable for “Variation margin on futures contracts” on the Statement of Assets and Liabilities.
During the period the futures contract is open, changes in the value of the contract are recognized as an unrealized gain or loss by “marking-to-market” on a daily basis to reflect the changes in market value of the contract, which is recognized as a component of “Change in net unrealized appreciation (depreciation) of futures contracts” on the Statement of Operations. When the contract is closed or expired, a Fund records a realized gain or loss equal to the difference between the value of the contract on the closing date and value of the contract when originally entered into, which is recognized as a component of “Net realized gain (loss) from futures contracts” on the Statement of Operations.
Risks of investments in futures contracts include the possible adverse movement in the price of the securities or indices underlying the contracts, the possibility that there may not be a liquid secondary market for the contracts and/or that a change in the value of the contract may not correlate with a change in the value of the underlying securities or indices.
During the current fiscal period, NJV and NPN used U.S. Treasury futures as part of an overall portfolio construction strategy to manage portfolio duration and yield curve exposure.
| | | |
| The average notional amount of futures contracts outstanding during the current fiscal period was as follows: | | |
| | NJV | | | NPN | |
| Average notional amount of futures contracts outstanding* | | $ | 2,519,549 | | | $ | 658,979 | |
* The average notional amount is calculated based on the absolute aggregate notional amount of contracts outstanding at the beginning of the current fiscal period and at the end of each fiscal quarter within the current fiscal period.
63
Notes to Financial Statements (continued)
The following table presents the amount of net realized gain (loss) and change in net unrealized appreciation (depreciation) recognized on futures contracts on the Statement of Operations during the current fiscal period, and the primary underlying risk exposure.
| | | | | | | | | |
| | | | | | | Change in Net | |
| | | | | | | Unrealized | |
| | | | Net Realized | | | Appreciation | |
| Underlying | Derivative | | Gain (Loss) from | | | (Depreciation) of | |
Fund | Risk Exposure | Instrument | | Futures Contracts | | | Futures Contracts | |
NJV | Interest rate | Futures contracts | | $ | (83,820 | ) | | $ | 32,954 | |
NPN | Interest rate | Futures contracts | | $ | (12,910 | ) | | $ | 10,380 | |
Market and Counterparty Credit Risk
In the normal course of business each Fund may invest in financial instruments and enter into financial transactions where risk of potential loss exists due to changes in the market (market risk) or failure of the other party to the transaction to perform (counterparty credit risk). The potential loss could exceed the value of the financial assets recorded on the financial statements. Financial assets, which potentially expose each Fund to counterparty credit risk, consist principally of cash due from counterparties on forward, option and swap transactions, when applicable. The extent of each Fund’s exposure to counterparty credit risk in respect to these financial assets approximates their carrying value as recorded on the Statement of Assets and Liabilities.
Each Fund helps manage counterparty credit risk by entering into agreements only with counterparties the Adviser believes have the financial resources to honor their obligations and by having the Adviser monitor the financial stability of the counterparties. Additionally, counterparties may be required to pledge collateral daily (based on the daily valuation of the financial asset) on behalf of each Fund with a value approximately equal to the amount of any unrealized gain above a pre-determined threshold. Reciprocally, when each Fund has an unrealized loss, the Funds have instructed the custodian to pledge assets of the Funds as collateral with a value approximately equal to the amount of the unrealized loss above a pre-determined threshold. Collateral pledges are monitored and subsequently adjusted if and when the valuations fluctuate, either up or down, by at least the pre-determined threshold amount.
| | | | | | | |
5. Fund Shares | | | | | | |
Common Share Transactions | | | | | | |
| Transactions in common shares for the Funds during the Funds’ current and prior fiscal period, where applicable, were as follows: | |
|
| | NCB | | | NJV | | | NPN | |
| | Year | | | Year | | | Year | | | Year | | | Year | | | Year | |
| | Ended | | | Ended | | | Ended | | | Ended | | | Ended | | | Ended | |
| | 2/28/21 | | | 2/29/20 | | | 2/28/21 | | | 2/29/20 | | | 2/28/21 | | | 2/29/20 | |
| | |
| Common shares: | | | | | | | | | | | | | | | | | | |
Issued to shareholders due to reinvestments of distributions | | | — | | | | 1,938 | | | | — | | | | — | | | | 68 | | | | 80 | |
| Repurchased and retired | | | — | | | | — | | | | (6,499 | ) | | | — | | | | — | | | | — | |
| Weighted average common share: | | | | | | | | | | | | | | | | | | | | | | | | |
| Price per share repurchased and retired | | $ | — | | | $ | — | | | $ | 12.82 | | | $ | — | | | $ | — | | | $ | — | |
| Discount per share repurchased and retired | | | — | % | | | — | % | | | (15.23 | )% | | | — | % | | | — | % | | | — | % |
6. Income Tax Information
Each Fund is a separate taxpayer for federal income tax purposes. Each Fund intends to distribute substantially all of its net investment income and net capital gains to shareholders and to otherwise comply with the requirements of Subchapter M of the Internal Revenue Code applicable to regulated investment companies. Therefore, no federal income tax provision is required. Furthermore, each Fund intends to satisfy conditions that will enable interest from municipal securities, which is exempt from regular federal and designated state income taxes, to retain such tax-exempt status when distributed to shareholders of the Funds. Net realized capital gains and ordinary income distributions paid by the Funds are subject to federal taxation.
For all open tax years and all major taxing jurisdictions, management of the Funds has concluded that there are no significant uncertain tax positions that would require recognition in the financial statements. Open tax years are those that are open for examination by taxing authorities (i.e., generally the last four tax year ends and the interim tax period since then). Furthermore, management of the Funds is also not aware of any tax positions for which it is reasonably possible that the total amounts of unrecognized tax benefits will significantly change in the next twelve months.
The following information is presented on an income tax basis. Differences between amounts for financial statement and federal income tax purposes are primarily due to timing differences in recognizing taxable market discount, timing differences in recognizing certain gains and losses on investment transactions and the treatment of investments in inverse floating rate securities reflected as financing transactions, if any. To the extent that differences arise that are permanent in nature, such amounts are reclassified within the capital accounts as detailed below. Temporary differences do not require reclassification. Temporary and permanent differences do not impact the NAVs of the Funds.
64
The table below presents the cost and unrealized appreciation (depreciation) of each Fund’s investment portfolio, as determined on a federal income tax basis, as of February 28, 2021.
| | | | | | | | | | | | | |
| | NCB | | | NJV | | | NYV | | | NPN | |
| Tax cost of investments | | $ | 43,516,554 | | | $ | 19,232,278 | | | $ | 33,005,952 | | | $ | 15,693,665 | |
| Gross unrealized: | | | | | | | | | | | | | | | | |
| Appreciation | | | 6,338,339 | | | | 1,741,348 | | | | 3,811,818 | | | | 988,989 | |
| Depreciation | | | (29,438 | ) | | | (35,747 | ) | | | (44,061 | ) | | | (41,774 | ) |
| Net unrealized appreciation (depreciation) of investments | | $ | 6,308,901 | | | $ | 1,705,601 | | | $ | 3,767,757 | | | $ | 947,215 | |
Permanent differences, primarily due to treatment of notional principal contracts, distribution reallocations, federal taxes paid, paydowns, taxable market discount and nondeductible reorganization expenses, resulted in reclassifications among the Funds’ components of common share net assets as of February 28, 2021, the Funds’ tax year end.
The tax components of undistributed net tax-exempt income, net ordinary income and net long-term capital gains as of February 28, 2021, the Funds’ tax year end, were as follows:
| | | | | | | | | | | | | |
| | NCB | | | NJV | | | NYV | | | NPN | |
Undistributed net tax-exempt income1 | | $ | 108,389 | | | $ | 28,594 | | | $ | 95,665 | | | $ | 21,454 | |
Undistributed net ordinary income2 | | | 22,479 | | | | — | | | | — | | | | — | |
| Undistributed net long-term capital gains | | | 289,971 | | | | 60,635 | | | | — | | | | 83,387 | |
1 Undistributed net tax-exempt income (on a tax basis) has not been reduced for the dividend declared on February 1, 2021, paid on March 1, 2021.
2 Net ordinary income consists of taxable market discount income and net short-term capital gains, if any.
The tax character of distributions paid during the Funds’ tax years ended February 28, 2021 and February 29, 2020 was designated for purposes of the dividends paid deduction as follows:
| | | | | | | | | | | | | |
2021 | | NCB | | | NJV | | | NYV | | | NPN | |
Distributions from net tax-exempt income3 | | $ | 1,367,700 | | | $ | 579,334 | | | $ | 781,274 | | | $ | 443,511 | |
Distribution from net ordinary income2 | | | 4,350 | | | | — | | | | 6,026 | | | | 2,712 | |
Distributions from net long-term capital gains4 | | | 162,836 | | | | — | | | | 143,851 | | | | 102,658 | |
2020 | | NCB | | | NJV | | | NYV | | | NPN | |
| Distributions from net tax-exempt income | | $ | 1,817,209 | | | $ | 783,330 | | | $ | 1,078,044 | | | $ | 574,798 | |
Distributions from net ordinary income2 | | | 151,855 | | | | 2,000 | | | | 34,498 | | | | 2,434 | |
| Distributions from net long-term capital gains | | | 300,900 | | | | — | | | | 553,099 | | | | 19,261 | |
2 Net ordinary income consists of taxable market discount income and net short-term capital gains, if any.
3 The Funds hereby designate these amounts paid during the fiscal year ended February 28, 2021 as Exempt Interest Dividends.
4 The Funds hereby designate as long-term capital gain dividend pursuant to the Internal Revenue Code Section 852(b)(3), the amount to reduce earnings an profits related to net capital gain to zero for the year ended February 28, 2021.
As of February 28, 2021, the Funds’ tax year end, the following Fund had unused capital losses carrying forward available for federal income tax purposes to be applied against future capital gains, if any. The capital losses are not subject to expiration.
| | | | |
| | NYV | |
| Not subject to expiration: | | | |
| Short-term | | $ | 185,036 | |
| Long-term | | | 29,965 | |
| Total | | $ | 215,001 | |
| As of February 28, 2021, the Funds’ tax year end, NJV utilized $80,016 capital loss carryforward. | | | | |
65
Notes to Financial Statements (continued)
7. Management Fees and Other Transactions with Affiliates
Management Fees
Each Fund’s management fee compensates the Adviser for overall investment advisory and administrative services and general office facilities. The Sub-Adviser is compensated for its services to the Funds from the management fees paid to the Adviser.
Each Fund’s management fee consists of two components – a fund-level fee, based only on the amount of assets within each individual Fund, and a complex-level fee, based on the aggregate amount of all eligible fund assets managed by the Adviser. This pricing structure enables Fund shareholders to benefit from growth in the assets within their respective Fund as well as from growth in the amount of complex-wide assets managed by the Adviser.
The annual fund-level fee, payable monthly, for each Fund is calculated according to the following schedule:
| | | | |
Average Daily Net Assets* | | Fund-Level Fee | |
| For the first $125 million | | | 0.4000 | % |
| For the next $125 million | | | 0.3875 | |
| For the next $250 million | | | 0.3750 | |
| For the next $500 million | | | 0.3625 | |
| For the next $1 billion | | | 0.3500 | |
| For the next $3 billion | | | 0.3250 | |
| For managed assets over $5 billion | | | 0.3125 | |
The annual complex-level fee, payable monthly, for each Fund is calculated by multiplying the current complex-wide fee rate, determined according to the following schedule by the Fund’s daily net assets:
| | | | |
Complex-Level Eligible Asset Breakpoint Level* | | Effective Complex-Level Fee Rate at Breakpoint Level | |
| $55 billion | | | 0.2000 | % |
| $56 billion | | | 0.1996 | |
| $57 billion | | | 0.1989 | |
| $60 billion | | | 0.1961 | |
| $63 billion | | | 0.1931 | |
| $66 billion | | | 0.1900 | |
| $71 billion | | | 0.1851 | |
| $76 billion | | | 0.1806 | |
| $80 billion | | | 0.1773 | |
| $91 billion | | | 0.1691 | |
| $125 billion | | | 0.1599 | |
| $200 billion | | | 0.1505 | |
| $250 billion | | | 0.1469 | |
| $300 billion | | | 0.1445 | |
* For the complex-level fees, managed assets include closed-end fund assets managed by the Adviser that are attributable to certain types of leverage. For these purposes, leverage includes the funds’ use of preferred stock and borrowings and certain investments in the residual interest certificates (also called inverse floating rate securities) in tender option bond (TOB) trusts, including the portion of assets held by a TOB trust that has been effectively financed by the trust’s issuance of floating rate securities, subject to an agreement by the Adviser as to certain funds to limit the amount of such assets for determining managed assets in certain circumstances. The complex-level fee is calculated based upon the aggregate daily managed assets of all Nuveen open-end and closed-end funds that constitute “eligible assets.” Eligible assets do not include assets attributable to investments in other Nuveen funds or assets in excess of a determined amount (originally $2 billion) added to the Nuveen fund complex in connection with the Adviser’s assumption of the management of the former First American Funds effective January 1, 2011, but do not include certain assets of certain Nuveen funds that were reorganized into funds advised by an affiliate of the Adviser during the 2019 calendar year. As of February 28, 2021, the complex-level fee for each Fund was 0.1558%.
Other Transactions with Affiliates
Each Fund is permitted to purchase or sell securities from or to certain other funds or accounts managed by the Sub-Adviser (“Affiliated Entity”) under specified conditions outlined in procedures adopted by the Board (“cross-trade”). These procedures have been designed to ensure that any cross-trade of securities by the Fund from or to an Affiliated Entity by virtue of having a common investment adviser (or affiliated investment adviser), common officer and/or common trustee complies with Rule 17a-7 under the 1940 Act. These transactions are effected at the current market price (as provided by an independent pricing service) without incurring broker commissions.
66
| | | | | |
| During the current fiscal period, the Funds engaged in cross-trades pursuant to these procedures as follows: | | | |
| | | | |
Cross-Trades | NCB | NJV | NYV | NPN |
| Purchases | $714,316 | $ 100,000 | $624,713 | $ — |
| Sales | — | 2,602,593 | 397,164 | 1,151,721 |
8. Borrowing Arrangements
Committed Line of Credit
The Funds, along with certain other funds managed by the Adviser (“Participating Funds”), have established a 364-day, $2.405 billion standby credit facility with a group of lenders, under which the Participating Funds may borrow for various purposes other than leveraging for investment purposes. Each Participating Fund is allocated a designated proportion of the facility’s capacity (and its associated costs, as described below) based upon a multi-factor assessment of the likelihood and frequency of its need to draw on the facility, the size of the Fund and its anticipated draws, and the potential importance of such draws to the operations and well-being of the Fund, relative to those of the other Funds. A Fund may effect draws on the facility in excess of its designated capacity if and to the extent that other Participating Funds have undrawn capacity. The credit facility expires in June 2021 unless extended or renewed.
The credit facility has the following terms: a 0.10% upfront fee, 0.15% per annum on unused commitment amounts and a drawn interest rate equal to the higher of (a) one-month LIBOR (London Inter-Bank Offered Rate) plus 1.25% (1.00% prior to June 24, 2020) per annum or (b) the Fed Funds rate plus 1.25% (1.00% prior to June 24, 2020) per annum on amounts borrowed. Participating Funds paid administration, legal and arrangement fees, which are recognized as a component of “Other expenses” on the Statement of Operations, and along with commitment fees, have been allocated among such Participating Funds based upon the relative proportions of the facility’s aggregate capacity reserved for them and other factors deemed relevant by the Adviser and the Board of each Participating Fund.
During the current fiscal period, NJV utilized this facility for 4 days. The Fund’s daily balance outstanding and average annual interest rate during the utilization period(s) was $51,260 and 1.39%, respectively. The Fund’s maximum outstanding daily balance during the utilization period was $51,260. Borrowings outstanding as of the end of the reporting period, if any are recognized as “Borrowings” on the Statement of Assets and Liabilities.
During the current fiscal period, NCB, NYV and NPN did not utilize this facility.
Inter-Fund Borrowing and Lending
The SEC has granted an exemptive order permitting registered open-end and closed-end Nuveen funds to participate in an inter-fund lending facility whereby the Nuveen funds may directly lend to and borrow money from each other for temporary purposes (e.g., to satisfy redemption requests or when a sale of securities “fails,” resulting in an unanticipated cash shortfall) (the “Inter-Fund Program”). The closed-end Nuveen funds, including the Funds covered by this shareholder report, will participate only as lenders, and not as borrowers, in the Inter-Fund Program because such closed-end funds rarely, if ever, need to borrow cash to meet redemptions. The Inter-Fund Program is subject to a number of conditions, including, among other things, the requirements that (1) no fund may borrow or lend money through the Inter-Fund Program unless it receives a more favorable interest rate than is typically available from a bank or other financial institution for a comparable transaction; (2) no fund may borrow on an unsecured basis through the Inter-Fund Program unless the fund’s outstanding borrowings from all sources immediately after the inter-fund borrowing total 10% or less of its total assets; provided that if the borrowing fund has a secured borrowing outstanding from any other lender, including but not limited to another fund, the inter-fund loan must be secured on at least an equal priority basis with at least an equivalent percentage of collateral to loan value; (3) if a fund’s total outstanding borrowings immediately after an inter-fund borrowing would be greater than 10% of its total assets, the fund may borrow through the inter-fund loan on a secured basis only; (4) no fund may lend money if the loan would cause its aggregate outstanding loans through the Inter-Fund Program to exceed 15% of its net assets at the time of the loan; (5) a fund’s inter-fund loans to any one fund shall not exceed 5% of the lending fund’s net assets; (6) the duration of inter-fund loans will be limited to the time required to receive payment for securities sold, but in no event more than seven days; and (7) each inter-fund loan may be called on one business day’s notice by a lending fund and may be repaid on any day by a borrowing fund. In addition, a Nuveen fund may participate in the Inter-Fund Program only if and to the extent that such participation is consistent with the fund’s investment objective and investment policies. The Board is responsible for overseeing the Inter-Fund Program.
The limitations detailed above and the other conditions of the SEC exemptive order permitting the Inter-Fund Program are designed to minimize the risks associated with Inter-Fund Program for both the lending fund and the borrowing fund. However, no borrowing or lending activity is without risk. When a fund borrows money from another fund, there is a risk that the loan could be called on one day’s notice or not renewed, in which case the fund may have to borrow from a bank at a higher rate or take other actions to payoff such loan if an inter-fund loan is not available from another fund. Any delay in repayment to a lending fund could result in a lost investment opportunity or additional borrowing costs.
During the current reporting period, none of the Funds covered by this shareholder report have entered into any inter-fund loan activity.
67
Notes to Financial Statements (continued)
9. Subsquent Events
Fund Mergers
As noted in Note 1 – General Information, Fund Mergers, the following Mergers occurred subsequent to the reporting period.
Before the opening of business on March 8, 2021, NCB merged into NCA. Upon the closing of the Mergers, NCB transferred its assets to NCA in exchange for common shares of NCA and the assumption by NCA of the liabilities of NCB. NCB was then liquidated, dissolved and terminated in accordance with its Declaration of Trust. Shareholders of NCB became shareholders of NCA. Holders of common shares of NCB received newly issued common shares of NCA, the aggregate NAV of which is equal to the aggregate NAV of the common shares of NCB held immediately prior to the Merger (including for this purpose fractional Acquiring Fund shares to which shareholders would be entitled).
Before the opening of business on March 8, 2021 NJV and NPN merged into NUW.
Upon the closing of the Mergers, NJV and NPN transferred their assets to NUW in exchange for common shares of NUW and the assumption by NUW of the liabilities of NJV and NPN. Each NJV and NPN was then liquidated, dissolved and terminated in accordance with its Declaration of Trust. Shareholders of NJV and NPN became shareholders of NUW. Holders of common shares of NJV and NPN received newly issued common shares of NUW, the aggregate NAV of which is equal to the aggregate NAV of the common shares of NJV and NPN held immediately prior to each Merger (including for this purpose fractional Acquiring Fund shares to which shareholders would be entitled).
Before the opening of business on April 12, 2021 NYV merged into NNY.
Upon the closing of the Mergers, NYV transferred its assets to NNY in exchange for common shares of NNY and the assumption by NNY of the liabilities of NYV. NYV was then liquidated, dissolved and terminated in accordance with its Declaration of Trust. Shareholders of NYV became shareholders of NNY. Holders of common shares of NYV received newly issued common shares of NNY, the aggregate NAV of which is equal to the aggregate NAV of the common shares of NYV held immediately prior to the Merger (including for this purpose fractional Acquiring Fund shares to which shareholders would be entitled).
68
Shareholder Update
(Unaudited)
CURRENT INVESTMENT OBJECTIVES, INVESTMENT POLICIES AND PRINCIPAL RISKS OF THE FUNDS
NUVEEN CALIFORNIA MUNICIPAL VALUE FUND 2 (NCB)
Effective March 8, 2021, NCB was reorganized into the Nuveen California Municipal Value Fund (formerly Nuveen California Municipal Value Fund, Inc.) (NCA). In the reorganization, the shareholders of NCB became shareholders of NCA. Holders of common shares of NCB received newly issued common shares of NCA, with cash being distributed in lieu of fractional common shares. As a result, for the current investment objectives, investment policies and principal risks following the reorganization, please review the most-recent annual shareholder report filed for NCA dated May 6, 2021.
NUVEEN NEW JERSEY MUNICIPAL VALUE FUND (NJV)
Effective March 8, 2021, NJV was reorganized into Nuveen AMT-Free Municipal Value Fund (NUW). In the reorganization, the shareholders of NJV became shareholders of NUW. Holders of common shares of NJV received newly issued common shares of NUW, with cash being distributed in lieu of fractional common shares. As a result, for the current investment objectives, investment policies and principal risks following the reorganization, please review the most-recent annual shareholder report filed for NUW dated January 7, 2021.
NUVEEN NEW YORK MUNICIPAL VALUE FUND 2 (NYV)
Effective April 12, 2021, NYV was reorganized into Nuveen New York Municipal Value Fund (formerly Nuveen New York Municipal Value Fund, Inc.) (NNY). In the reorganization, shareholders of NYV became shareholders of NNY. Holders of common shares of NYV received newly issued common shares of NNY, with cash being distributed in lieu of fractional common shares. As a result, for the current investment objectives, investment policies and principal risks following the reorganization, please review the most-recent annual shareholder report filed for NNY, dated May 6, 2021.
NUVEEN PENNSYLVANIA MUNICIPAL VALUE FUND (NPN)
Effective March 8, 2021, NPN was reorganized into Nuveen AMT-Free Municipal Value Fund (NUW). In the reorganization, shareholders of NPN became shareholders of NUW. Holders of common shares of NPN received newly issued common shares of NUW, with cash being distributed in lieu of fractional common shares. As a result, for the current investment objectives, investment policies and principal risks following the reorganization, please review the most-recent annual shareholder report filed for NUW dated January 7, 2021.
69
Shareholder Update (Unaudited) (continued)
CHANGES OCCURRING DURING THE FISCAL YEAR
The following information in this annual report is a summary of certain changes during the most recent fiscal year. This information may not reflect all of the changes that have occurred since you purchased shares of a Fund.
During the most recent fiscal year, there have been no changes to: (i) the Funds’ investment objectives and principal investment policies that have not been approved by shareholders, (ii) the principal risks of the Fund, (iii) the portfolio managers of the Funds; (iv) a Fund’s charter or by-laws that would delay or prevent a change of control of the Fund that have not been approved by shareholders except as follows:
Amended and Restated By-Laws
On October 5, 2020, after a rigorous and deliberative review, and consistent with the interests of the Nuveen California Municipal Value Fund 2, Nuveen New Jersey Municipal Value Fund, Nuveen Pennsylvania Municipal Value Fund and the Nuveen New York Municipal Value Fund 2 (each a “Fund” and collectively the “Funds”) long-term shareholders, the Board of Trustees of each Fund adopted Amended and Restated By-Laws.
Among other changes, the Amended and Restated By-Laws require compliance with certain amended deadlines and procedural and informational requirements in connection with advance notice of shareholder proposals or nominations, including certain information about the proponent and the proposal, or in the case of a nomination, the nominee. Any shareholder considering making a nomination or other proposal should carefully review and comply with those provisions of the Amended and Restated By-Laws.
The Amended and Restated By-Laws also include provisions (the “Control Share By-Law”) pursuant to which, in summary, a shareholder who obtains beneficial ownership of common shares of a Fund in a “Control Share Acquisition” may exercise voting rights with respect to such shares only to the extent the authorization of such voting rights is approved by other shareholders of the Fund. The Control Share By-Law is primarily intended to protect the interests of the Fund and its long-term shareholders by limiting the risk that the Fund will become subject to undue influence by opportunistic traders pursuing short-term agendas adverse to the best interests of the Fund and its long-term shareholders. The Control Share By-Law does not eliminate voting rights for common shares acquired in Control Share Acquisitions, but rather entrusts the Fund's other "non-interested" shareholders with determining whether to approve the authorization of the voting rights of the person acquiring such shares.
Subject to various conditions and exceptions, the Control Share By-Law defines a “Control Share Acquisition” to include an acquisition of common shares that, but for the Control Share By-Law, would give the beneficial owner, upon the acquisition of such shares, the ability to exercise voting power in the election of Trustees of a Fund in any of the following ranges:
(i) one-tenth or more, but less than one-fifth of all voting power;
(ii) one-fifth or more, but less than one-third of all voting power;
(iii) one-third or more, but less than a majority of all voting power; or
(iv) a majority or more of all voting power.
The Control Share By-Law generally excludes certain acquisitions of common shares from the definition of a Control Share Acquisition, including acquisitions of common shares that occurred prior to October 5, 2020, though such shares are included in assessing whether any subsequent share acquisition exceeds one of the enumerated thresholds.
Subject to certain conditions and procedural requirements set forth in the Control Share By-Law, including the delivery of a “Control Share Acquisition Statement” to the Funds’ Secretary setting forth certain required information, a shareholder who obtains or proposes to obtain beneficial ownership of common shares in a Control Share Acquisition generally may demand a special meeting of shareholders for the purpose of considering whether the voting rights of such acquiring person with respect to such shares shall be authorized.
This discussion is only a high-level summary of certain aspects of the Amended and Restated By-Laws, and is qualified in its entirety by reference to the Amended and Restated By-Laws. Shareholders should refer to the Amended and Restated By-Laws for more information. A copy of the Amended and Restated By-Laws can be found in the Current Report on Form 8-K filed by the Funds with the Securities and Exchange Commission on October 6, 2020, which is available at www.sec.gov, and may also be obtained by writing to the Secretary of the Funds at 333 West Wacker Drive, Chicago, Illinois 60606.
70
Additional FundInformation | | | | | | | |
| Board of Trustees | | | | | | |
| Jack B. Evans | William C. Hunter | Albin F. Moschner | John K. Nelson | Judith M. Stockdale | Carole E. Stone |
| Terence J. Toth | Matthew Thornton III | Margaret L. Wolff | Robert L. Young | | | |
| |
| |
| Investment Adviser | Custodian | Legal Counsel | Independent Registered | Transfer Agent and |
| Nuveen Fund Advisors, LLC | State Street Bank | Chapman and Cutler LLP | Public Accounting Firm | Shareholder Services |
| 333 West Wacker Drive | and Trust Company | Chicago, IL 60603 | KPMG LLP | | Computershare Trust |
| Chicago, IL 60606 | One Lincoln Street | | 200 East Randolph Street | Company, N.A. |
| | Boston, MA 02111 | | Chicago, IL 60601 | 150 Royall Street |
| | | | | | Canton, MA 02021 |
| | | | | | (800) 257-8787 |
| |
| Portfolio of Investments Information | | | | | |
Each Fund is required to file its complete schedule of portfolio holdings with the Securities and Exchange Commission (SEC) for the first and third quarters of each fiscal year as an exhibit to its report of Form N-PORT. You may obtain this information on the SEC’s website at http://www.sec.gov.
Nuveen Funds’ Proxy Voting Information
You may obtain (i) information regarding how each fund voted proxies relating to portfolio securities held during the most recent twelve-month period ended June 30, without charge, upon request, by calling Nuveen toll-free at (800) 257-8787 or on Nuveen’s website at www.nuveen.com and (ii) a description of the policies and procedures that each fund used to determine how to vote proxies relating to portfolio securities without charge, upon request, by calling Nuveen toll free at (800) 257-8787. You may also obtain this information directly from the SEC. Visit the SEC on-line at http://www.sec.gov.
CEO Certification Disclosure
Each Fund’s Chief Executive Officer (CEO) has submitted to the New York Stock Exchange (NYSE) the annual CEO certification as required by Section 303A.12(a) of the NYSE Listed Company Manual. Each Fund has filed with the SEC the certification of its CEO and Chief Financial Officer required by Section 302 of the Sarbanes-Oxley Act.
Common Share Repurchases
Each Fund intends to repurchase, through its open-market share repurchase program, shares of its own common stock at such times and in such amounts as is deemed advisable. During the period covered by this report, each Fund repurchased shares of its common stock, as shown in the accompanying table. Any future repurchases will be reported to shareholders in the next annual or semi-annual report.
| | | | | |
| | NCB | NJV | NYV | NPN |
| Common shares repurchased | 0 | 6,499 | 0 | 0 |
The Financial Industry Regulatory Authority (FINRA) provides information regarding the disciplinary history of FINRA member firms and associated investment professionals. This information as well as an investor brochure describing FINRA BrokerCheck is available to the public by calling the FINRA BrokerCheck Hotline number at (800) 289-9999 or by visiting www.FINRA.org.
71
Glossary of Terms Used in this Report
(Unaudited)
■ Average Annual Total Return: This is a commonly used method to express an investment’s performance over a particular, usually multi-year time period. It expresses the return that would have been necessary each year to equal the investment’s actual cumulative performance (including change in NAV or market price and reinvested dividends and capital gains distributions, if any) over the time period being considered.
■ Duration: Duration is a measure of the expected period over which a bond’s principal and interest will be paid, and consequently is a measure of the sensitivity of a bond’s or bond fund’s value to changes when market interest rates change. Generally, the longer a bond’s or fund’s duration, the more the price of the bond or fund will change as interest rates change.
■ Effective Leverage: Effective leverage is a fund’s effective economic leverage, and includes both regulatory leverage (see leverage) and the leverage effects of certain derivative investments in the fund’s portfolio. Currently, the leverage effects of Tender Option Bond (TOB) inverse floater holdings are included in effective leverage values, in addition to any regulatory leverage.
■ Gross Domestic Product (GDP): The total market value of all final goods and services produced in a country/region in a given year, equal to total consumer, investment and government spending, plus the value of exports, minus the value of imports
■ Inverse Floating Rate Securities: Inverse floating rate securities, also known as inverse floaters or tender option bonds (TOBs), are created by depositing a municipal bond, typically with a fixed interest rate, into a special purpose trust. This trust, in turn, (a) issues floating rate certificates typically paying short-term tax-exempt interest rates to third parties in amounts equal to some fraction of the deposited bond’s par amount or market value, and (b) issues an inverse floating rate certificate (sometimes referred to as an “inverse floater”) to an investor (such as a Fund) interested in gaining investment exposure to a long-term municipal bond. The income received by the holder of the inverse floater varies inversely with the short-term rate paid to the floating rate certificates’ holders, and in most circumstances the holder of the inverse floater bears substantially all of the underlying bond’s downside investment risk. The holder of the inverse floater typically also benefits disproportionately from any potential appreciation of the underlying bond’s value. Hence, an inverse floater essentially represents an investment in the underlying bond on a leveraged basis.
■ Leverage: Leverage is created whenever a fund has investment exposure (both reward and/or risk) equivalent to more than 100% of the investment capital.
■ Net Asset Value (NAV) Per Share: A fund’s Net Assets is equal to its total assets (securities, cash, accrued earnings and receivables) less its total liabilities. NAV per share is equal to the fund’s Net Assets divided by its number of shares outstanding.
■ Pre-Refunding: Pre-Refunding, also known as advanced refundings or refinancings, is a procedure used by state and local governments to refinance municipal bonds to lower interest expenses. The issuer sells new bonds with a lower yield and uses the proceeds to buy U.S. Treasury securities, the interest from which is used to make payments on the higher-yielding bonds. Because of this collateral, pre-refunding generally raises a bond’s credit rating and thus its value.
■ Regulatory Leverage: Regulatory leverage consists of preferred shares issued by or borrowings of a fund. Both of these are part of a fund’s capital structure. Regulatory leverage is subject to asset coverage limits set in the Investment Company Act of 1940.
72
■ S&P Municipal Bond Index: An unleveraged, market value-weighted index designed to measure the performance of the tax-exempt, investment-grade U.S. municipal bond market. Index returns assume reinvestment of distributions, but do not reflect any applicable sales charges or management fees.
■ S&P Municipal Bond California Index: An unleveraged, market value-weighted index designed to measure the performance of the tax-exempt, investment grade California municipal bond market. Index returns assume reinvestment of distributions but do not reflect any applicable sales charges or management fees.
■ S&P Municipal Bond New Jersey Index: An unleveraged, market value-weighted index designed to measure the performance of the tax-exempt, investment-grade New Jersey municipal bond market. Index returns assume reinvestment of distributions, but do not reflect any applicable sales charges or management fees.
■ S&P Municipal Bond New York Index: An unleveraged, market value-weighted index designed to measure the performance of the tax-exempt, investment-grade New York municipal bond market. Index returns assume reinvestment of distributions, but do not reflect any applicable sales charges or management fees.
■ S&P Municipal Bond Pennsylvania Index: An unleveraged, market value-weighted index designed to measure the performance of the tax-exempt, investment-grade Pennsylvania municipal bond market. Index returns assume reinvestment of distributions, but do not reflect any applicable sales charges or management fees.
■ Total Investment Exposure: Total investment exposure is a fund’s assets managed by the Adviser that are attributable to financial leverage. For these purposes, financial leverage includes a fund’s use of preferred stock and borrowings and investments in the residual interest certificates (also called inverse floating rate securities) in tender option bond (TOB) trusts, including the portion of assets held by a TOB trust that has been effectively financed by the trust’s issuance of floating rate securities.
■ Zero Coupon Bond: A zero coupon bond does not pay a regular interest coupon to its holders during the life of the bond. Income to the holder of the bond comes from accretion of the difference between the original purchase price of the bond at issuance and the par value of the bond at maturity and is effectively paid at maturity. The market prices of zero coupon bonds generally are more volatile than the market prices of bonds that pay interest periodically.
73
Board Members &Officers (Unaudited) The management of the Funds, including general supervision of the duties performed for the Funds by the Adviser, is the responsibility of the Board of Trustees of the Funds. None of the trustees who are not “interested” persons of the Funds (referred to herein as “independent board members”) has ever been a director or employee of, or consultant to, Nuveen or its affiliates. The names and business addresses of the trustees and officers of the Funds, their principal occupations and other affiliations during the past five years, the number of portfolios each Trustee oversees and other directorships they hold are set forth below.
| | | | | |
Name, | Position(s) Held | Year First | Principal | Number |
Year of Birth | with the Funds | Elected or | Occupation(s) | of Portfolios |
& Address | | Appointed | Including other | in Fund |
| | | and Term(1)
| Directorships
| Complex
|
| |
| During Past 5 Years
| Overseen by |
| | |
| Board Member |
|
Independent Board Members:
| | | |
|
■ TERENCE J. TOTH | | | Formerly, a Co-Founding Partner, Promus Capital (investment advisory | |
| 1959 | | | firm) (2008-2017); Director, Quality Control Corporation (manufacturing) | |
| 333 W. Wacker Drive | Chair and | 2008 | (since 2012); member: Catalyst Schools of Chicago Board (since 2008) | 142 |
| Chicago, IL 6o6o6 | Board Member | Class II | and Mather Foundation Board (philanthropy) (since 2012), and chair of | |
| | | its Investment Committee; formerly, Director, Fulcrum IT Services LLC | |
| | | (information technology services firm to government entities) (2010-2019); | |
| | | formerly, Director, Legal & General Investment Management America, Inc. | |
| | | (asset management) (2008-2013); formerly, CEO and President, Northern | |
| | | Trust Global Investments (financial services) (2004-2007): Executive Vice | |
| | | President, Quantitative Management & Securities Lending (2000-2004); | |
| | | prior thereto, various positions with Northern Trust Company (financial | |
| | | services) (since 1994); formerly, Member, Northern Trust Mutual Funds | |
| | | Board (2005-2007), Northern Trust Global Investments Board (2004-2007), | |
| | | Northern Trust Japan Board (2004-2007), Northern Trust Securities Inc. | |
| | | Board (2003-2007) and Northern Trust Hong Kong Board (1997-2004). | |
|
■ JACK B. EVANS | | | Chairman (since 2019), formerly, President (1996-2019), The Hall-Perrine | |
| 1948 | | | Foundation, (private philanthropic corporation); Director and Chairman | |
| 333 W. Wacker Drive | Board Member | 1999 | (since 2009), United Fire Group, a publicly held company; formerly, | 142 |
| Chicago, IL 6o6o6 | | Class III | Director, Public Member, American Board of Orthopaedic Surgery | |
| | | (2015-2020); Life Trustee of Coe College and the Iowa College Foundation; | |
| | | formerly, Member and President Pro-Tem of the Board of Regents for the | |
| | | State of Iowa University System (2000- 2004); formerly, Director | |
| | | (2000-2004), Alliant Energy; formerly, Director (1996- 2015), The Gazette | |
| | | Company (media and publishing); formerly, Director (1998- 2003), Federal | |
| | | Reserve Bank of Chicago; formerly, President and Chief Operating Officer | |
| | | (1972-1995), SCI Financial Group, Inc., (regional financial services firm). | |
|
■ WILLIAM C. HUNTER | | | Dean Emeritus, formerly, Dean, Tippie College of Business, University of | |
| 1948 | | | Iowa (2006-2012); Director of Wellmark, Inc. (since 2009); past Director | |
| 333 W. Wacker Drive | Board Member | 2003 | (2005-2015), and past President (2010-2014) Beta Gamma Sigma, Inc., | 142 |
| Chicago, IL 6o6o6 | | Class I | The International Business Honor Society; formerly, Director (2004-2018) | |
| | | of Xerox Corporation; Dean and Distinguished Professor of Finance, | |
| | | School of Business at the University of Connecticut (2003-2006); | |
| | | previously, Senior Vice President and Director of Research at the Federal | |
| | | Reserve Bank of Chicago (1995-2003); formerly, Director (1997-2007), | |
| | | Credit Research Center at Georgetown University. | |
74
Name, | Position(s) Held | Year First | Principal | Number |
Year of Birth | with the Funds | Elected or | Occupation(s) | of Portfolios |
& Address | | Appointed | Including other | in Fund |
| | | and Term(1)
| Directorships
| Complex
|
| |
| During Past 5 Years
| Overseen by |
| | |
| Board Member |
|
| Independent Board Members (continued): | | | |
|
■ ALBIN F. MOSCHNER | | | Founder and Chief Executive Officer, Northcroft Partners, LLC, | |
| 1952 | | | (management consulting) (since 2012); formerly, Chairman (2019), | |
| 333 W. Wacker Drive | Board Member | 2016 | and Director (2012-2019), USA Technologies, Inc., (provider of | 142 |
| Chicago, IL 6o6o6 | | Class III | solutions and services to facilitate electronic payment transactions); | |
| | | formerly, Director, Wintrust Financial Corporation (1996-2016); | |
| | | previously, held positions at Leap Wireless International, Inc., (consumer | |
| | | wireless services) including Consultant (2011-2012), Chief Operating | |
| | | Officer (2008-2011), and Chief Marketing Officer (2004-2008); formerly, | |
| | | President, Verizon Card Services division of Verizon Communications, | |
| | | Inc. (2000-2003); formerly, President, One Point Services at One Point | |
| | | Communications (telecommunication services) (1999-2000); formerly, | |
| | | Vice Chairman of the Board, Diba, Incorporated (internet technology | |
| | | provider) (1996-1997); formerly, various executive positions (1991-1996) | |
| | | and Chief Executive Officer (1995-1996) of Zenith Electronics Corporation | |
| | | (consumer electronics). | |
|
■ JOHN K. NELSON | | | Member of Board of Directors of Core12 LLC. (private firm which develops | |
| 1962 | | | branding, marketing and communications strategies for clients) (since | |
| 333 W. Wacker Drive | Board Member | 2013 | 2008); served on The President’s Council of Fordham University (2010- | 142 |
| Chicago, IL 6o6o6 | | Class II | 2019) and previously a Director of the Curran Center for Catholic American | |
| | | Studies (2009-2018); formerly, senior external advisor to the Financial | |
| | | Services practice of Deloitte Consulting LLP. (2012-2014); former Chair of | |
| | | the Board of Trustees of Marian University (2010-2014 as trustee, 2011-2014 | |
| | | as Chair); formerly Chief Executive Officer of ABN AMRO Bank N.V., North | |
| | | America, and Global Head of the Financial Markets Division (2007-2008), | |
| | | with various executive leadership roles in ABN AMRO Bank N.V. between | |
| | | 1996 and 2007. | |
|
■ JUDITH M. STOCKDALE | | | Board Member, Land Trust Alliance (national public charity addressing | |
| 1947 | | | natural land and water conservation in the U.S.) (since 2013); formerly, | |
| 333 W. Wacker Drive | Board Member | 1997 | Board Member, U.S. Endowment for Forestry and Communities | 142 |
| Chicago, IL 6o6o6 | | Class I | (national endowment addressing forest health, sustainable forest | |
| | | production and markets, and economic health of forest-reliant communities | |
| | | in the U.S.) (2013-2019); formerly, Executive Director (1994-2012), Gaylord | |
| | | and Dorothy Donnelley Foundation (private foundation endowed to support | |
| | | both natural land conservation and artistic vitality); prior thereto, Executive | |
| | | Director, Great Lakes Protection Fund (1990-1994). | |
|
■ CAROLE E. STONE | | | Former Director, Chicago Board Options Exchange, Inc. (2006-2017); and | |
| 1947 | | | C2 Options Exchange, Incorporated (2009-2017); formerly, Director, Cboe, | |
| 333 W. Wacker Drive | Board Member | 2007 | Global Markets, Inc. (2010-2020) (formerly named CBOE Holdings, Inc.; | 142 |
| Chicago, IL 6o6o6 | | Class I | formerly, Commissioner, New York State Commission on Public | |
| | | Authority Reform (2005-2010). | |
75
Board Members & Officers (Unaudited) (continued)
Name, | Position(s) Held | Year First | Principal | Number |
Year of Birth | with the Funds | Elected or | Occupation(s) | of Portfolios |
& Address | | Appointed | Including other | in Fund |
| | | and Term(1)
| Directorships
| Complex
|
| |
| During Past 5 Years
| Overseen by |
| | |
| Board Member |
|
| Independent Board Members (continued): | | | |
|
■ MATTHEW THORNTON III | | | Formerly, Executive Vice President and Chief Operating Officer (2018-2019), | |
| 1958 | | | FedEx Freight Corporation, a subsidiary of FedEx Corporation (“FedEx”) | |
| 333 W. Wacker Drive | Board Member | 2020 | (provider of transportation, e-commerce and business services through its | 142 |
| Chicago, IL 6o6o6 | | Class III | portfolio of companies); formerly, Senior Vice President, U.S. Operations | |
| | | (2006-2018), Federal Express Corporation, a subsidiary of FedEx; formerly, | |
| | | Member of the Board of Directors (2012-2018), Safe Kids Worldwide® (a | |
| | | non-profit organization dedicated to preventing childhood injuries). | |
| | | Member of the Board of Directors (since 2014), The Sherwin-Williams | |
| | | Company (develops, manufactures, distributes and sells paints, coatings | |
| | | and related products); Director (since 2020), Crown Castle International | |
| | | (provider of communications infrastructure) | |
|
■ MARGARET L. WOLFF | | | Formerly, member of the Board of Directors (2013-2017) of Travelers | |
| 1955 | | | Insurance Company of Canada and The Dominion of Canada General | |
| 333 W. Wacker Drive | Board Member | 2016 | Insurance Company (each, a part of Travelers Canada, the Canadian | 142 |
| Chicago, IL 6o6o6 | | Class I | operation of The Travelers Companies, Inc.); formerly, Of Counsel, | |
| | | Skadden, Arps, Slate, Meagher & Flom LLP (legal services, Mergers & | |
| | | Acquisitions Group) (2005-2014); Member of the Board of Trustees of | |
| | | New York-Presbyterian Hospital (since 2005); Member (since 2004) and | |
| | | Chair (since 2015) of the Board of Trustees of The John A. Hartford | |
| | | Foundation (philanthropy dedicated to improving the care of older adults); | |
| | | formerly, Member (2005-2015) and Vice Chair (2011-2015) of the Board of | |
| | | Trustees of Mt. Holyoke College. | |
|
■ ROBERT L. YOUNG | | | Formerly, Chief Operating Officer and Director, J.P.Morgan Investment | |
| 1963 | | | Management Inc. (financial services) (2010-2016); formerly, President | |
| 333 W. Wacker Drive | Board Member | 2017 | and Principal Executive Officer (2013-2016), and Senior Vice President | 142 |
| Chicago, IL 6o6o6 | | Class II | and Chief Operating Officer (2005-2010), of J.P.Morgan Funds; formerly, | |
| | | Director and various officer positions for J.P.Morgan Investment | |
| | | Management Inc. (formerly, JPMorgan Funds Management, Inc. and | |
| | | formerly, One Group Administrative Services) and JPMorgan Distribution | |
| | | Services, Inc. (financial services) (formerly, One Group Dealer Services, | |
| | | Inc.) (1999-2017). | |
76
| | | | |
Name, | Position(s) Held | Year First | Principal |
Year of Birth | with the Funds | Elected or | Occupation(s) |
& Address | | Appointed(2) | During Past 5 Years |
|
| Officers of the Funds: | | | |
|
|
■ DAVID J. LAMB | | | Managing Director of Nuveen Fund Advisors, LLC and Nuveen Securities, LLC (since 2020); |
| 1963 | Chief | | Managing Director (since 2017), formerly, Senior Vice President of Nuveen, LLC (since 2006), |
| 333 W. Wacker Drive | Administrative | 2015 | Vice President prior to 2006 |
| Chicago, IL 6o6o6 | Officer | | |
|
■ MARK J. CZARNIECKI | | | Vice President and Assistant Secretary of Nuveen Securities, LLC (since 2016) and Nuveen Fund |
| 1979 | Vice President | | Advisors (since 2017); Vice President and Associate General Counsel of Nuveen, LLC (since 2013) |
| 901 Marquette Avenue | and Assistant | 2013 | and Vice President, Assistant Secretary and Associate General Counsel of Nuveen Asset |
| Minneapolis, MN 55402 | Secretary | | Management (since 2018). |
|
■ DIANA R. GONZALEZ | | | Vice President and Assistant Secretary of Nuveen Fund Advisors, LLC (since 2017); Vice President |
| 1978 | Vice President | | and Associate General Counsel of Nuveen, LLC (since 2017); Associate General Counsel of Jackson |
| 333 W. Wacker Drive | and Assistant | 2017 | National Asset Management, LLC (2012-2017). |
| Chicago, IL 6o6o6 | Secretary | | |
|
■ NATHANIEL T. JONES | | | Managing Director (since 2017), formerly, Senior Vice President (2016-2017), formerly, |
| 1979 | | | Vice President (2011-2016) of Nuveen, LLC; Managing Director (since 2015) of Nuveen Fund |
| 333 W. Wacker Drive | Vice President | 2016 | Advisors, LLC; Chartered Financial Analyst. |
| Chicago, IL 6o6o6 | and Treasurer | | |
|
■ TINA M. LAZAR | | | Managing Director (since 2017), formerly, Senior Vice President (2014-2017) of |
| 1961 | | | Nuveen Securities, LLC. |
| 333 W. Wacker Drive | Vice President | 2002 | |
| Chicago, IL 6o6o6 | | | |
|
■ BRIAN J. LOCKHART | | | Managing Director (since 2019) of Nuveen Fund Advisors, LLC; Managing Director (since 2017), |
| 1974 | | | formerly, Vice President (2010-2017) of Nuveen, LLC; Head of Investment Oversight (since 2017), |
| 333 W. Wacker Drive | Vice President | 2019 | formerly, Team Leader of Manager Oversight (2015-2017); Chartered Financial Analyst and Certified |
| Chicago, IL 6o6o6 | | | Financial Risk Manager. |
|
■ JACQUES M. LONGERSTAEY
| | Senior Managing Director, Chief Risk Officer, Nuveen, LLC (since May 2019); Senior Managing |
| 1963 | | | Director (since May 2019) of Nuveen Fund Advisors, LLC; formerly, Chief Investment and Model |
8500 Andrew Carnegie Blvd. | Vice President | 2019 | Risk Officer, Wealth & Investment Management Division, Wells Fargo Bank (NA) (2013-2019). |
| Charlotte, NC 28262 | | | |
|
■ KEVIN J. MCCARTHY | | | Senior Managing Director (since 2017) and Secretary and General Counsel (since 2016) of Nuveen |
| 1966 | Vice President | | Investments, Inc., formerly, Executive Vice President (2016-2017) and Managing Director and |
| 333 W. Wacker Drive | and Assistant | 2007 | Assistant Secretary (2008-2016); Senior Managing Director (since 2017) and Assistant Secretary |
| Chicago, IL 6o6o6 | Secretary | | (since 2008) of Nuveen Securities, LLC, formerly Executive Vice President (2016-2017) and |
| | | Managing Director (2008-2016); Senior Managing Director (since 2017), and Secretary (since 2016) |
| | | of Nuveen Fund Advisors, LLC, formerly, Co-General Counsel (2011-2020), Executive Vice President |
| | | (2016-2017), Managing Director (2008-2016) and Assistant Secretary (2007-2016); Senior |
| | | Managing Director (since 2017), Secretary (since 2016) of Nuveen Asset Management, LLC, |
| | | formerly, Associate General Counsel (2011-2020), Executive Vice President (2016-2017) and |
| | | Managing Director and Assistant Secretary (2011- 2016); Vice President (since 2007) and Secretary |
| | | (since 2016), formerly, Assistant Secretary, of NWQ Investment Management Company, LLC, Santa |
| | | Barbara Asset Management, LLC and Winslow Capital Management, LLC (since 2010). Senior |
| | | Managing Director (since 2017) and Secretary (since 2016) of Nuveen Alternative Investments, LLC. |
77
Board Members & Officers (Unaudited) (continued)
| | | | |
Name, | Position(s) Held | Year First | Principal |
Year of Birth | with the Funds | Elected or | Occupation(s) |
& Address | | Appointed(2) | During Past 5 Years |
|
| Officers of the Funds (continued) | | |
|
|
■ JON SCOTT MEISSNER | | | Managing Director of Mutual Fund Tax and Financial Reporting groups at Nuveen (since 2017); |
| 1973 | Vice President | | Managing Director of Nuveen Fund Advisors, LLC (since 2019); Senior Director of Teachers |
| 8500 Andrew Carnegie Blvd. | and Assistant | 2019 | Advisors, LLC and TIAA-CREF Investment Management, LLC (since 2016); Senior Director |
| Charlotte, NC 28262 | Secretary | | (since 2015) Mutual Fund Taxation to the TIAA-CREF Funds, the TIAA-CREF Life Funds, the TIAA |
| | | Separate Account VA-1 and the CREF Accounts; has held various positions with TIAA since 2004. |
|
■ DEANN D. MORGAN | | | President, Nuveen Fund Advisors, LLC (since 2020); Executive Vice President, Global Head of |
| 1969 | | | Product at Nuveen, LLC (since 2019); Co-Chief Executive Officer of Nuveen Securities, LLC |
| 730 Third Avenue | Vice President | 2020 | since 2020); Managing Member of MDR Collaboratory LLC (since 2018); Managing Director, |
| New York, NY 10017 | | | (Head of Wealth Management Product Structuring & COO Multi Asset Investing. The Blackstone |
| | | Group (2013-2017) |
|
■ CHRISTOPHER M. ROHRBACHER | | Managing Director (since 2017) and Assistant Secretary of Nuveen Securities, LLC; Managing |
| 1971 | Vice President | | Director (since 2017) General Counsel (since 2020), and Assistant Secretary (since 2016), |
| 333 W. Wacker Drive | and Assistant | 2008 | formerly, Senior Vice President (2016-2017), of Nuveen Fund Advisors, LLC; Managing |
| Chicago, IL 6o6o6 | Secretary | | Director, Associate General Counsel and Assistant Secretary of Nuveen Asset Management, |
| | | LLC (since 2020); Managing Director (since 2017), and Associate General Counsel (since 2016), |
| | | formerly, Senior Vice President (2012-2017) and Assistant General Counsel (2008-2016) of |
| | | Nuveen, LLC. |
|
■ WILLIAM A. SIFFERMANN
| | Managing Director (since 2017), formerly Senior Vice President (2016-2017) and Vice President |
| 1975 | | | (2011-2016) of Nuveen, LLC. |
| 333 W. Wacker Drive | Vice President | 2017 | |
| Chicago, IL 6o6o6 | | | |
|
■ E. SCOTT WICKERHAM | | | Senior Managing Director, Head of Fund Administration at Nuveen, LLC (since 2019), |
| 1973 | Vice President | | formerly, Managing Director; Senior Managing Director (since 2019) of Nuveen Fund Advisers, |
| 8500 Andrew Carnegie Blvd. | and Controller | 2019 | (LLC; Principal Financial Officer, Principal Accounting Officer and Treasurer (since 2017) of the |
| Charlotte, NC 28262 | | | TIAA-CREF Funds, the TIAA-CREF Life Funds, the TIAA Separate Account VA-1 and Principal |
| | | Financial Officer, Principal Accounting Officer (since 2020) and Treasurer (since 2017) to the CREF |
| | | Accounts; formerly, Senior Director, TIAA-CREF Fund Administration (2014-2015); has held various |
| | | positions with TIAA since 2006. |
|
■ MARK L. WINGET | | | Vice President and Assistant Secretary of Nuveen Securities, LLC (since 2008), and Nuveen |
| 1968 | Vice President | | Fund Advisors, LLC (since 2019); Vice President, Associate General Counsel and Assistant |
| 333 W. Wacker Drive | and Secretary | 2008 | Secretary of Nuveen Asset Management, LLC (since 2020); Vice President (since 2010) and |
| Chicago, IL 60606 | | | Associate General Counsel (since 2019), formerly, Assistant General Counsel (2008-2016) of |
| | | Nuveen, LLC. |
78
| | | | |
Name, | Position(s) Held | Year First | Principal |
Year of Birth | with the Funds | Elected or | Occupation(s) |
& Address | | Appointed(2) | During Past 5 Years |
|
| Officers of the Funds (continued) | | |
|
■ GIFFORD R. ZIMMERMAN
| | Formerly: Managing Director (2002-2020) and Assistant Secretary (2002-2020) of Nuveen |
| 1956 | Vice President | | Securities, LLC; formerly, Managing Director (2002-2020), Assistant Secretary (1997-2020) and |
| 333 W. Wacker Drive | and Chief | 1988 | Co-General Counsel (2011- 2020) of Nuveen Fund Advisors, LLC; formerly, Managing Director |
| Chicago, IL 60606 | Compliance Officer | | (2004-2020) and Assistant Secretary (1994-2020) of Nuveen Investments, Inc.; formerly, |
| | | Managing Director, Assistant Secretary and Associate General Counsel of Nuveen Asset |
| | | Management, LLC (2011-2020); formerly, Vice President and Assistant Secretary of NWQ |
| | | Investment Management Company, LLC (2002-2020), Santa Barbara Asset Management, LLC |
| | | (2006-2020) and Winslow Capital Management, LLC (2010-2020); Chartered Financial Analyst. |
| (1) | The Board of Trustees is divided into three classes, Class I, Class II, and Class III, with each being elected to serve until the third succeeding annual shareholders’ meeting subsequent to its election or thereafter in each case when its respective successors are duly elected or appointed, except two board members are elected by the holders of Preferred Shares, when applicable, to serve until the next annual shareholders’ meeting subsequent to its election or thereafter in each case when its respective successors are duly elected or appointed. The year first elected or appointed represents the year in which the board member was first elected or appointed to any fund in the Nuveen complex. |
| (2) | Officers serve indefinite terms until their successor has been duly elected and qualified, their death or their resignation or removal. The year first elected or appointed represents the year in which the Officer was first elected or appointed to any fund in the Nuveen complex. |
79
Nuveen:
Serving Investors for Generations
Since 1898, financial professionals and their clients have relied on Nuveen to provide dependable investment solutions through continued adherence to proven, long-term investing principles. Today, we offer a range of high quality solutions designed to be integral components of a well-diversified core portfolio.
Focused on meeting investor needs.
Nuveen is the investment manager of TIAA. We have grown into one of the world’s premier global asset managers, with specialist knowledge across all major asset classes and particular strength in solutions that provide income for investors and that draw on our expertise in alternatives and responsible investing. Nuveen is driven not only by the independent investment processes across the firm, but also the insights, risk management, analytics and other tools and resources that a truly world-class platform provides. As a global asset manager, our mission is to work in partnership with our clients to create solutions which help them secure their financial future.
Find out how we can help you.
To learn more about how the products and services of Nuveen may be able to help you meet your financial goals, talk to your financial professional, or call us at (800) 257-8787. Please read the information provided carefully before you invest. Investors should consider the investment objective and policies, risk considerations, charges and expenses of any investment carefully. Where applicable, be sure to obtain a prospectus, which contains this and other relevant information. To obtain a prospectus, please contact your securities representative or Nuveen, 333 W. Wacker Dr., Chicago, IL 60606. Please read the prospectus carefully before you invest or send money.
Learn more about Nuveen Funds at: www.nuveen.com/closed-end funds
Nuveen Securities, LLC, member FINRA and SIPC | 333 West Wacker Drive Chicago, IL 60606 | www.nuveen.com
| | EAN-D-0221D 1596466-INV-Y-04/22 |