Life is Complex.
Nuveen makes things e-simple.
It only takes a minute to sign up for e-Reports. Once enrolled, you’ll receive an e-mail as soon as your Nuveen Fund information is ready—no more waiting for delivery by regular mail. Just click on the link within the e-mail to see the report and save it on your computer if you wish.
Free e-Reports
right to your e-mail!
www.investordelivery.com
If you receive your Nuveen Fund
dividends and statements from your
financial advisor or brokerage account.
or
www.nuveen.com/client-access
If you receive your Nuveen Fund
dividends and statements directly from
Nuveen.
NOT FDIC INSURED MAY LOSE
VALUE NO BANK GUARANTEE
3
Chair’s Letterto Shareholders
Dear Shareholders,
The COVID-19 crisis is taking an unprecedented toll on our health, societies, economies and financial markets. Our thoughts are with all whose lives have been affected by the disease and its economic fallout. The extreme “social distancing” efforts needed to contain the coronavirus are causing a severe contraction in economic activity and amplifying market volatility, as global supply chains and consumer and business demand remain significantly disrupted. However, the full economic impact remains to be seen. The number of confirmed cases is still accelerating in the U.S. and other parts of the world, and previous epidemics offer few parallels to today’s situation. The spike in market volatility during March reflected great uncertainty, and while conditions have stabilized to some degree, we expect that large swings in both directions are likely to continue until there is more clarity.
While we do not want to understate the dampening effect on the global economy, differentiating short-term interruptions from the longer-lasting implications to the economy may provide opportunities. Some areas of the global economy were already on the mend prior to the coron-avirus epidemic. Momentum could pick up again as factories come back online and consumer demand resumes once the virus is under control and temporary bans on movement and travel are lifted. Central banks and governments around the world have announced economic stimulus measures. In the U.S., the Federal Reserve has cut its benchmark interest rate to near zero and introduced programs that helped revive the U.S. economy after the 2008 financial crisis. The U.S. government has approved three relief packages, including a $2 trillion-dollar package directly supporting businesses and individuals. The Coronavirus Aid, Relief and Economic Security Act, called the CARES Act, provides direct payments and expanded unemployment benefits to individuals, loans and grants to small businesses, loans and other money to large corporations and funding for hospitals, public health, education and state and local governments. Additional aid will likely be approved in the months ahead.
In the meantime, patience and a long-term perspective are key for investors. When market fluctuations are the leading headlines day after day, it’s tempting to “do something.” However, your long-term goals can’t be met with short-term thinking. We encourage you to talk to your financial advisor, who can review your time horizon, risk tolerance and investment goals. On behalf of the other members of the Nuveen Fund Board, we look forward to continuing to earn your trust in the months and years ahead.
Sincerely,
Terence J. Toth
Chair of the Board
April 22, 2020
4
Portfolio Manager’s CommentsNuveen New Jersey Quality Municipal Income Fund (NXJ)Nuveen New Jersey Municipal Value Fund (NJV)Nuveen Pennsylvania Quality Municipal Income Fund (NQP)Nuveen Pennsylvania Municipal Value Fund (NPN) These Funds feature portfolio management by Nuveen Asset Management, LLC (NAM), an affiliate of Nuveen Fund Advisors, LLC, the Funds’ investment adviser. Portfolio manager Paul L. Brennan, CFA, reviews U.S. economic and market conditions, key investment strategies and the twelve-month performance of the Nuveen New Jersey and Pennsylvania Funds. Paul assumed portfolio management responsibility for these four Funds in 2011.
What factors affected the U.S. economy and the national municipal bond market during the twelve-month reporting period ended February 29, 2020?
The longest economic expansion in U.S. history came to an abrupt halt in early 2020 amid the coronavirus pandemic. With large portions of the economy shut down, companies closing either temporarily or permanently, and nearly half of the U.S. population asked to stay home (as of March 2020, subsequent to the close of this reporting period), the economy is expected to show a deep contraction in the first quarter of 2020 and a dramatic increase in unemployment in the coming months.
In this twelve-month reporting period, however, the coronavirus had not yet had an impact on domestic economic indicators. Overall, economic growth remained steady over this reporting period. In the fourth quarter of 2019, gross domestic product (GDP) grew at an annualized rate of 2.1%, according to the “second” estimate by the Bureau of Economic Analysis. GDP measures the value of goods and services produced by the nation’s economy less the value of the goods and services used up in production, adjusted for price changes. In the final months of the year, the economy was boosted by moderate consumer spending, along with positive contributions from government spending and trade, which offset weakness in business investment. For 2019 as a whole, U.S. GDP grew 2.3%, a decline from 2.9% in 2018 and the slowest pace since 2016.
Consumer spending, the largest driver of the economy, remained well supported in this reporting period by low unemployment, wage gains and tax cuts. As reported by the Bureau of Labor Statistics, the unemployment rate fell to 3.5% in February 2020 from 3.8% in February 2019 and job gains averaged around 194,000 per month for the past twelve months. As the jobs market has
This material is not intended to be a recommendation or investment advice, does not constitute a solicitation to buy, sell or hold a security or an investment strategy and is not provided in a fiduciary capacity. The information provided does not take into account the specific objectives or circumstances of any particular investor, or suggest any specific course of action. Investment decisions should be made based on an investor’s objectives and circumstances and in consultation with his or her advisors.
Certain statements in this report are forward-looking statements. Discussions of specific investments are for illustration only and are not intended as recommendations of individual investments. The forward-looking statements and other views expressed herein are those of the portfolio manager as of the date of this report. Actual future results or occurrences may differ significantly from those anticipated in any forward-looking statements, and the views expressed herein are subject to change at any time, due to numerous market and other factors. The Funds disclaim any obligation to update publicly or revise any forward-looking statements or views expressed herein.
For financial reporting purposes, the ratings disclosed are the highest rating given by one of the following national rating agencies: Standard & Poor’s Group (S&P), Moody’s Investors Service, Inc. (Moody’s) or Fitch, Inc. (Fitch). This treatment of split-rated securities may differ from that used for other purposes, such as for Fund investment policies. Credit ratings are subject to change. AAA, AA, A and BBB are investment grade ratings, while BB, B, CCC, CC, C and D are below investment grade ratings. Holdings designated N/R are not rated by these national rating agencies.
Bond insurance guarantees only the payment of principal and interest on the bond when due, and not the value of the bonds themselves, which will fluctuate with the bond market and the financial success of the issuer and the insurer. Insurance relates specifically to the bonds in the portfolio and not to the share prices of a Fund. No representation is made as to the insurers’ ability to meet their commitments.
Refer to the Glossary of Terms Used in this Report for further definition of the terms used within this section.
5
Portfolio Manager’s Comments (continued)
tightened, average hourly earnings grew at an annualized rate of 3.0% in February 2020. However, inflation remained subdued. The Bureau of Labor Statistics said the Consumer Price Index (CPI) increased 2.3% over the twelve-month reporting period ended February 29, 2020 before seasonal adjustment.
Low mortgage rates and low inventory drove home prices moderately higher in this reporting period. The S&P CoreLogic Case-Shiller U.S. National Home Price Index, which covers all nine U.S. census divisions, was up 3.9% year-over-year in January 2020 (most recent data available at the time this report was prepared). The 10-City and 20-City Composites reported year-over-year increases of 2.6% and 3.1%, respectively.
As data pointed to slower momentum in the overall economy, the U.S. Federal Reserve (Fed) left rates unchanged throughout the first half of 2019 then cut rates by 0.25% at each of the July 2019, September 2019 and October 2019 policy committee meetings. Markets registered disappointment with the Fed’s explanation that the rate cuts were a “mid-cycle adjustment,” rather than a prolonged easing period, and its signal that there would be no additional rate cuts in 2019. Also in the latter half of 2019, the Fed announced it would stop shrinking its bond portfolio sooner than scheduled, as well as began buying short-term Treasury bills to help money markets operate smoothly and maintain short-term borrowing rates at low levels. Fed Chairman Powell emphasized that the Treasury bill purchases were not a form of quantitative easing. The Fed continued its Treasury bill buying in January 2020, as well as left its benchmark interest rate unchanged, while noting the emerging coronavirus risks. (Subsequent to the end of this reporting period and in response to the COVID-19 outbreak, the Fed enacted an array of emergency measures to stabilize the financial system and support the markets, including cutting its main interest rate to near zero, offering lending programs to aid small and large companies and allowing unlimited bond purchases, known as quantitative easing. Meanwhile, the U.S. government approved three aid packages, totaling more than $100 billion in funding to health agencies and employers offering paid leave and $2 trillion in direct payments to Americans, an expansion of unemployment insurance and loans to large and small businesses.)
While trade and tariff policy drove market sentiment for most of the twelve-month reporting period, the outbreak of the novel coronavirus and its associated disease COVID-19 rapidly dwarfed all other market concerns as the reporting period was closing. Equity and commodity markets sold-off and safe-haven assets rallied as China and other countries initiated quarantines, restricted travel and shuttered factories and businesses. The potential economic shock was particularly difficult to assess, which amplified market volatility.
Prior to the virus outbreak, markets had become more bullish on the outlook for 2020 as trade policy and Brexit appeared to make progress at the end of 2019. The U.S. and China agreed on a partial trade deal, which included rolling back some tariffs, increasing China’s purchases of U.S. agriculture products and the consideration of intellectual property, technology and financial services rights. The “phase one” deal was signed on January 15, 2020. While much of the focus remained on the U.S.-China relationship, trade spats between the U.S. and Mexico, the European Union (EU), Brazil and Argentina also arose throughout the reporting period. In January 2020, the U.S. Congress fully approved the U.S., Mexico and Canada Agreement (USMCA), which replaces the North American Free Trade Agreement. With more clarity on trade deals, the trade-related deterioration in global manufacturing and export data was expected to improve. However, the COVID-19 outbreak has since upended those assumptions.
The U.K. officially left the EU on January 31, 2020. After former Prime Minister Theresa May was unable to secure a Brexit deal by the original March 29, 2019 deadline, she resigned as of June 7, 2019. When her successor, Boris Johnson, failed to meet the EU’s first deadline extension of October 31, 2019, the EU approved a “flextension” to January 31, 2020. The Conservative Party won a large
6
majority in the December 2019 general election and Parliament passed the Brexit Bill days later, facilitating the U.K.’s exit at the end of January 2020. Britain must now redefine its relationship with the EU during the 11-month transition period.
Investors also remained watchful of local political dynamics around the world. In Italy, the prime minister unexpectedly resigned in August 2019, and the newly formed coalition government appeared to take a less antagonistic stance. Europe’s traditional centrist parties lost seats in the May 2019 Parliamentary elections and populist parties saw marginal gains. Europe also contended with the “yellow vest” protests in France, immigration policy concerns, Russian sanctions and political risk in Turkey. Anti-government protests erupted across Latin America, Hong Kong and Lebanon during 2019. Venezuela’s economic and political crisis deepened. Argentina surprised the market with the return of a less market-friendly administration. Brazil’s Bolsonaro administration achieved a legislative win on pension reform and kept the economy on a path of modest growth. The ruling parties in India and South Africa maintained their majorities, where slower economic growth could complicate their respective reform mandates.
Municipal bonds delivered strong performance over the twelve-month reporting period. The significant decline in interest rates was the main driver of higher municipal bond prices, with positive technical and fundamental conditions also supporting credit spread tightening. Signs that the economy’s momentum was slowing, a more dovish central bank policy, geopolitical tensions (especially regarding trade) and bouts of equity market volatility drove interest rates considerably lower over the reporting period. The U.S. Treasury market began pricing coronavirus risk toward the very end of the reporting period, with a steep fall in yields, but the municipal market registered a relatively smaller move at the time. The U.S. Treasury yield curve flattened overall, with a portion of the curve temporarily inverting from late August 2019 to late September 2019. The municipal yield curve also flattened overall, as yields on longer maturities fell more than those of shorter maturities. Despite concerns about the broader economic outlook, credit conditions remained favorable for municipal credits. State tax revenues have increased across the 50 states and a healthy housing market added to local government tax revenues. Defaults in 2019 were mainly confined to idiosyncratic situations.
Municipal bond gross issuance nationwide remained robust in this reporting period. The overall low level of interest rates encouraged issuers to continue to actively refund their outstanding debt. In these transactions the issuers are issuing new bonds and taking the bond proceeds and redeeming (calling) old bonds. These refunding transactions have ranged from 30% to 60% of total issuance over the past few years. Thus, the net issuance (all bonds issued less bonds redeemed) is actually much lower than the gross issuance. So, while gross issuance volume has been adequate, the net has not and this was an overall positive technical factor on municipal bond investment performance in recent years. Notably, taxable municipal bond issuance increased meaningfully in 2019. The Tax Cut and Jobs Act of 2017 prohibits municipal issuers from issuing new tax-exempt bonds to pre-refund existing tax-exempt bonds. However, municipalities have taken advantage of the low interest rate environment and the strong demand for yield to issue taxable municipal debt, enabling them to save on net interest costs.
Demand for municipal bonds was robust in this reporting period, with consistently positive cash flows into municipal bond funds in calendar year 2019 and the first two months of 2020. (Fund flows turned more volatile after the close of the reporting period as markets began to assess the coronavirus impact.) Low interest rates in the U.S. and globally have continued to drive investors toward higher after-tax yielding assets, including U.S. municipal bonds. Additionally, as tax payers have begun to assess the impact of the 2017 tax law, which caps the state and local tax (SALT) deduction for individuals, there has been increased demand for tax-exempt municipal bonds in 2019 to date, especially in states with high income and/or property taxes.
7
Portfolio Manager’s Comments (continued)
How were the economic and market environments in New Jersey and Pennsylvania during the twelve-month reporting period ended February 29, 2020?
New Jersey’s economy is improving but continues to trail peers. Several characteristics position the state to do quite well, such as its proximity to New York City’s extensive job market, a shoreline along the Atlantic coast that benefits from a strong tourism industry and two large transportation hubs in the Port of New York and New Jersey and Newark airport. However, for years following the recession, the state’s recovery fell short of many of its peers. New Jersey had the slowest job growth rate in the Northeast until the middle of 2015. In 2019, most major industries reported job gains, led by education and health services, professional and business services, trade, transportation and utilities, and leisure and hospitality, while the information and financial sectors lost jobs. In June 2019, New Jersey’s unemployment rate fell below the national average for the first time in more than two years. However, it has risen in recent months and as of February 2020, the state’s unemployment rate registered 3.8%, slightly higher than the national rate of 3.5%. The sluggishness of the state’s recovery exacerbated fiscal pressures caused by growing pension, health care and debt service payments. In the proposed Fiscal Year 2021 budget, expenditures on these three line items constitute 25% of expenses, despite efforts to reduce health care costs in recent years. The $4.6 billion pension payment in the Fiscal Year 2021 budget proposed by Governor Murphy funds only 80% of the actuarially recommended contribution. New Jersey continues to be challenged by a structural budget gap and low reserves. For the third year in a row, the governor proposed implementing a millionaire’s tax to raise revenues. Positively, the budget proposes a $300 million deposit to the state’s rainy day fund, the second deposit in two years, after more than a decade without funding. For the state of New Jersey, its Fiscal Year end is June 30, 2020, although, subsequent to the close of this reporting period, the state is planning to extend the Fiscal Year to September 30, 2020, in order to give the state more time to pass a budget for Fiscal Year 2021. Due to the COVID-19 crisis, the state’s budget will be impacted to a varying degree as tax receipts are reduced and the expense to fight the virus increases. The state carries an A- rating by S&P, A3 by Moody’s and A by Fitch, all with stable outlooks.
Pennsylvania has the sixth-largest economy among U.S. states, measured by a 2018 gross domestic product of $783 billion. Year-over-year job growth slowed in 2019 to 0.7%, down from 1.1% for 2018. The unemployment rate for the Commonwealth was 4.7% as of February 2020, compared to a national rate of 3.5%. Pennsylvania’s economy is fairly stable, which tends to track the national economy but with less volatility. During periods of national economic contraction, Pennsylvania will outperform the U.S. in areas such as growth in real personal income and employment. However, during periods of economic expansion, Pennsylvania will often lag the rate of growth of the national economy. The education and health care sectors represent an outsized 21.2% of total employment in the Commonwealth, compared with 15.9% for the nation. Approximately two-fifths of the net new jobs in the state are related to the health care industry. An aging population is driving this demand. Pennsylvania’s population is the seventh oldest in the U.S., as measured by the share of residents aged 55 and older. The aging population, coupled with very slow population growth in the state, will likely have negative implications for long-term job growth, overall economic performance and state revenues. Pennsylvania’s financial profile is weaker than most states. The Commonwealth has a history of late budget passage and structural deficits. The state has relied heavily on one-time revenue sources and borrowing to fund its increased spending. In 2018, the state issued almost $1.7 billion of deficit financing to plug part of its Fiscal Year 2017 budgetary gap of $3.2 billion. The state closed Fiscal Year 2018 with a modest operating surplus, enabling it to deposit $22 million into its rainy day fund. This was the first deposit to the rainy day fund since the recession. Fiscal Year 2019 also closed with a small general fund surplus of $22 million. On a budgetary basis, Pennsylvania’s 2019 year-end general fund balance, including its rainy day fund, was a narrow 1.27% of that year’s revenues. Fiscal Year 2020 year-to-date general fund collections are 1.2% above estimate, through the month of February 2020. The Governor’s proposed Fiscal Year 2021 budget totals $36.1 billion, an increase of 4.2% over the prior year. The budget is balanced with no increases in taxes. For the state of Pennsylvania, its Fiscal Year end is June 30, 2020. Due to the COVID-19 crisis, the state’s budget
8
will be impacted to a varying degree as tax receipts are reduced and the expense to fight the virus increases. As of February 2020, Pennsylvania’s general obligation (GO) debt was rated Aa3 by Moody’s and A+ by S&P.
What key strategies were used to manage these Funds during the twelve-month reporting period ended February 29, 2020?
Each Fund seeks to provide current income exempt from both regular federal and designated state income taxes by investing primarily in a portfolio of municipal obligations issued by state and local government authorities within a single state or certain U.S. territories. Under normal market conditions, each Fund invests at least 80% of the sum of its net assets and the amount of any borrowings for investment purposes in municipal bonds that pay interest that is exempt from regular federal personal income tax and a single state’s personal income tax. The Funds may invest up to 20% in municipal securities that are exempt from regular federal income tax, but not from that single state’s income tax if, in the Sub-Adviser’s judgement, such purchases are expected to enhance the Fund’s after-tax total return potential. To the extent that the Funds invest in bonds of municipal issuers located in other states, each Fund may have income that is not exempt from state personal income tax.
Municipal bonds performed well in this reporting period as valuations benefited from the falling interest rate environment and favorable technical supply-demand conditions. The municipal bond market experienced historically robust demand in the reporting period, particularly in high tax states such as California, New York and New Jersey, that exceeded the moderate pace of issuance. The new limits on state and local tax, or SALT, deductions resulted in larger than expected tax burdens for some high income taxpayers, driving demand for the tax benefits offered by municipal bonds. The New Jersey and Pennsylvania municipal markets outperformed the national market over this reporting period, as measured by their respective state S&P Municipal Bond Indexes.
Our trading activity continued to focus on pursuing the Funds’ investment objectives. We continued to seek bonds in areas of the market that we expected to perform well as the economy continued to improve. Trading activity was somewhat lighter during this reporting period as the Funds were well positioned for the environment and the opportunities offered by the marketplace in the low interest rate environment were less appealing. Sector and credit quality positioning remained stable across the Funds, while we allowed their durations to drift slightly lower over the reporting period. In New Jersey, the Funds added health care, higher education, transportation and local general obligation (GO) bonds. Both Pennsylvania Funds bought single-family housing, health care, higher education and utilities bonds. NPN also added a water and sewer credit. We continued to limit the Funds’ exposure to each state’s GO bonds due to concerns about their fiscal health. To fund these purchases, we reinvested the proceeds primarily from called and maturing bonds.
NJV and NPN held more exposure to bonds with 2019 call dates than NXJ and NQP. As we sought to diversify call risk in NJV and NPN, we sold some of these bonds. The Funds also experienced an elevated level of refundings in their portfolios during calendar years 2018 and 2019. The two Funds were launched in 2009 when interest rates were higher and redemptions of bonds callable in 2019 was elevated in the low interest rate environment. While the bulk of this call activity is now behind NVJ and NPN, we should note that these trades have had a short-term negative impact on the two Funds’ earnings, as the older bonds, which were issued when prevailing interest rates were higher, are being replaced with the lower yielding bonds available in the current market.
As of February 29, 2020, the four Funds continued to use inverse floating rate securities. We employ inverse floaters for a variety of reasons, including duration management, income enhancement and total return enhancement. As part of our duration management strategies, the four Funds used U.S. Treasury futures and NXJ also used interest rate swaps as part of an overall portfolio construction strategy to manage portfolio duration and yield curve exposure. The hedging strategies performed as expected given the direction
9
Portfolio Manager’s Comments (continued)
of interest rates during the reporting period. Although the Treasury futures detracted modestly from performance due to falling interest rates during this reporting period, they enabled the Funds to invest in longer duration bonds that were key contributors to performance and that helped support the Funds’ dividends. The forward interest rate swap positions were eliminated from NXJ prior to the end of the reporting period. The forward interest rate swaps had a negligible impact on the Fund’s performance during the reporting period.
How did the Funds perform during the twelve-month reporting period ended February 29, 2020?
The tables in each Fund’s Performance Overview and Holding Summaries section of this report provide the Funds’ total returns for the one-year, five-year and ten-year periods ended February 29, 2020. Each Fund’s total returns at common share net asset value (NAV) are compared with the performance of corresponding market indexes.
For the twelve-month reporting period ended February 29, 2020, the total returns on common share NAV for all four Funds outperformed the national S&P Municipal Bond Index and their respective state’s S&P Municipal Bond Index.
Given the substantial decline in interest rates, duration and yield curve positioning drove much of the Funds’ relative outperformance in the reporting period. The Funds’ longer overall durations and emphasis on intermediate and longer maturity bonds were advantageous as yields on the long end of the yield curve fell by a larger magnitude than yields on the shorter end.
The Funds’ credit quality positioning also contributed positively to performance, although to a lesser extent than duration and yield curve positioning. All four Funds held heavy allocations to lower rated, higher yielding bonds, particularly single A and BBB rated credits, as well as modest exposure to below investment grade bonds. The lower rated segments outperformed in this reporting period as investor demand for yield remained strong and credit conditions remained favorable.
Sector performance largely followed along credit quality lines, with the best performing sectors being those that include a higher proportion of lower rated bonds. The New Jersey Funds benefited from their allocations to the health care, housing and toll roads sectors, as well as New Jersey tobacco settlement bonds. For the Pennsylvania Funds, allocations to the health care, higher education, housing and toll road sectors were the most advantageous to performance. Least helpful to performance across the four Funds were the exposures to higher credit quality sectors such as local GOs (including county, city and school district issues) and pre-refunded bonds. The short maturities of pre-refunded bonds also contributed to their performance lag in this reporting period. Additionally, the four Funds employed U.S. Treasury futures as part of their duration management strategies (as mentioned in the key strategies discussion), which had a slightly negative impact on the total return performance of the Funds.
In addition, the use of regulatory leverage was a factor affecting the performance of NXJ and NQP. NJV and NPN do not use regulatory leverage. Leverage is discussed in more detail later in the Fund Leverage section of this report.
An Update on COVID-19 Coronavirus and its Impact on the Securities Markets
The COVID-19 coronavirus pandemic has delivered a shock to the global economy. Containment efforts around the world have halted business and manufacturing operations and restricted people’s movement and travel. The disruptions to global supply chains, consumer demand, business investment and the global financial system are just beginning to be seen.
10
Although the detection of the virus in China was made public in December 2019, markets did not start to fully acknowledge the risks and potential economic impact until the latter portion of February 2020, when outbreaks outside of China were first reported. Global stock markets began to sell off severely, reaching a bear market (a 20% drop from the previous high) within three weeks, the fastest bear market decline in history. Even certain parts of the bond market suffered, below investment grade municipal and corporate bonds generally dropped the furthest, mostly out of concerns for the continued financial stability of lower quality issuers. Demand for safe-haven assets, along with mounting recession fears, drove the yield on the 10-year U.S. Treasury note below 1% in March 2020, an all-time low. Additionally, oil prices collapsed to an 18-year low on supply glut concerns, as shutdowns across the global economy sharply reduced oil demand while Saudi Arabia and Russia engaged in a price war.
Central banks and governments have responded with liquidity injections to ease the strain on financial systems and stimulus measures to buffer the shock to businesses and consumers. These measures have helped stabilize the markets over the short term, but volatility will likely remain elevated until the health crisis itself is under control (via fewer new cases, lower infection rates and/or verified treatments). There are still many unknowns and new information is incoming daily, compounding the difficulty of modeling outcomes for epidemiologists and economists alike.
After the end of the reporting period, the performance of each of the Funds in this report was negatively impacted by these events. Prices of municipal securities fell, which caused the leverage ratios of NXJ and NQP to increase markedly. After the U.S. Government took several actions to support the economy and the securities markets, those markets have largely normalized since the worst of the market dislocation in late March 2020, and bond prices have mostly recovered. However, it is possible that similar market dislocations will recur as the COVID-19 pandemic and society’s response to it plays out.
Additionally, the economic disruption caused by the COVID-19 pandemic is also very likely to negatively impact the state and local budgetary matters described earlier in the report, with states and localities being more likely to run budget deficits (or larger deficits) during the period of economic contraction stemming from the COVID-19 pandemic.
Nuveen, LLC and our portfolio management teams are monitoring the situation carefully and continuously refining our views and approaches to managing the Funds to best pursue investment objectives while mitigating risks through all market environments.
11
IMPACT OF THE FUNDS’ LEVERAGE STRATEGIES ON PERFORMANCE
One important factor impacting the returns of the Funds’ common shares relative to their comparative benchmarks was the Funds’ use of leverage through their issuance of preferred shares and/or investments in inverse floating rate securities, which represent leveraged investments in underlying bonds. The Funds use leverage because our research has shown that, over time, leveraging provides opportunities for additional income. The opportunity arises when short-term rates that a Fund pays on its leveraging instruments are lower than the interest the Fund earns on its portfolio of long-term bonds that it has bought with the proceeds of that leverage. This has been particularly true in the recent market environment where short-term rates have been low by historical standards.
However, use of leverage can expose Fund common shares to additional price volatility. When a Fund uses leverage, the Fund’s common shares will experience a greater increase in their net asset value if the municipal bonds acquired through the use of leverage increase in value, but will also experience a correspondingly larger decline in their net asset value if the bonds acquired through leverage decline in value, which will make the shares’ net asset value more volatile, and total return performance more variable, over time.
In addition, common share income in levered funds will typically decrease in comparison to unlevered funds when short-term interest rates increase and increase when short-term interest rates decrease. In recent quarters, fund leverage expenses have generally tracked the overall movement of short-term tax-exempt interest rates. While fund leverage expenses are somewhat higher than their all-time lows after the 2007-2009 financial crisis, which has contributed to a reduction in common share net income and long-term total return potential, leverage nevertheless continues to provide the opportunity for incremental common share income. Management believes that the potential benefits from leverage continue to outweigh the associated increase in risk and volatility previously described.
Leverage from issuance of preferred shares had a positive impact on the performance of NXJ and NQP over the reporting period. The use of leverage through inverse floating rate securities had a positive impact on the performance of the Funds over the reporting period. Subsequent to the close of the reporting period, the outbreak of the COVID-19 pandemic led to a significant downturn in global economies and capital markets. As security prices fell, each Fund’s use of leverage impacted total returns negatively.
As of February 29, 2020, the Funds’ percentages of leverage are as shown in the accompanying table.
| | | | | |
| NXJ | NJV | NQP | NPN |
Effective Leverage* | 37.22% | 6.47% | 38.07% | 4.27% |
Regulatory Leverage* | 30.64% | 0.00% | 26.22% | 0.00% |
* Effective Leverage is a Fund’s effective economic leverage, and includes both regulatory leverage and the leverage effects of certain derivative and other investments in a Fund’s portfolio that increase the Fund’s investment exposure. Currently, the leverage effects of Tender Option Bond (TOB) inverse floater holdings are included in effective leverage values, in addition to any regulatory leverage. Regulatory leverage consists of preferred shares issued or borrowings of a Fund. Both of these are part of a Fund’s capital structure. A Fund, however, may from time to time borrow on a typically transient basis in connection with its day-to-day operations, primarily in connection with the need to settle portfolio trades. Such incidental borrowings are excluded from the calculation of a Fund’s effective leverage ratio. Regulatory leverage is subject to asset coverage limits set forth in the Investment Company Act of 1940.
12
THE FUNDS’ REGULATORY LEVERAGE
As of February 29, 2020, the following Funds have issued and outstanding preferred shares as shown in the accompanying table. As mentioned previously, NJV and NPN do not use regulatory leverage.
| | | | | | | | | | |
| | Variable Rate | | | Variable Rate | | | | |
| | Preferred* | | | Remarketed Preferred** | | | | |
| | Shares Issued at | | | Shares Issued at | | | | |
| | Liquidation Preference | | | Liquidation Preference | | | Total | |
NXJ | | $ | 313,900,000 | | | $ | — | | | $ | 313,900,000 | |
NQP | | $ | 217,500,000 | | | $ | — | | | $ | 217,500,000 | |
* Preferred shares of the Fund featuring a floating rate dividend based on a predetermined formula or spread to an index rate. Includes the following preferred shares AMTP, iMTP, MFP-VRM and VRDP in Special Rate Mode, where applicable. See Notes to Financial Statements, Note 5 – Fund Shares, Preferred Shares for further details.
** Preferred shares of the Fund featuring floating rate dividends set by a remarketing agent via a regular remarketing. Includes the following preferred shares VRDP not in Special Rate Mode, MFP-VRRM and MFP-VRDM, where applicable. See Notes to Financial Statements, Note 5 – Fund Shares, Preferred Shares for further details.
Refer to Notes to Financial Statements, Note – 5 Fund Shares, Preferred Shares for further details on preferred shares and each Fund’s respective transactions.
13
COMMON SHARE DISTRIBUTION INFORMATION
The following information regarding the Funds’ distributions is current as of February 29, 2020. Each Fund’s distribution levels may vary over time based on each Fund’s investment activity and portfolio investment value changes.
During the current reporting period, each Fund’s distributions to common shareholders were as shown in the accompanying table.
| | | | | | | | | | | | | |
| | | Per Common Share Amounts | |
| Monthly Distributions (Ex-Dividend Date) | | NXJ | | | NJV | | | NQP | | | NPN | |
March 2019 | | $ | 0.0545 | | | $ | 0.0450 | | | $ | 0.0505 | | | $ | 0.0405 | |
April | | | 0.0545 | | | | 0.0450 | | | | 0.0505 | | | | 0.0405 | |
May | | | 0.0545 | | | | 0.0450 | | | | 0.0505 | | | | 0.0405 | |
June | | | 0.0545 | | | | 0.0450 | | | | 0.0505 | | | | 0.0405 | |
July | | | 0.0545 | | | | 0.0450 | | | | 0.0505 | | | | 0.0405 | |
August | | | 0.0545 | | | | 0.0450 | | | | 0.0505 | | | | 0.0405 | |
September | | | 0.0545 | | | | 0.0410 | | | | 0.0505 | | | | 0.0380 | |
October | | | 0.0545 | | | | 0.0410 | | | | 0.0505 | | | | 0.0380 | |
November | | | 0.0545 | | | | 0.0410 | | | | 0.0505 | | | | 0.0380 | |
December | | | 0.0515 | | | | 0.0375 | | | | 0.0505 | | | | 0.0380 | |
January | | | 0.0515 | | | | 0.0375 | | | | 0.0505 | | | | 0.0380 | |
February 2020 | | | 0.0515 | | | | 0.0375 | | | | 0.0505 | | | | 0.0380 | |
| Total Distributions from Net Investment Income | | $ | 0.6450 | | | $ | 0.5055 | | | $ | 0.6060 | | | $ | 0.4710 | |
| Total Distributions from Long-Term Capital Gains* | | $ | 0.0104 | | | $ | 0.0000 | | | $ | 0.0000 | | | $ | 0.0158 | |
| Total Distributions | | $ | 0.6554 | | | $ | 0.5055 | | | $ | 0.6060 | | | $ | 0.4868 | |
| | |
| Yields | | | | | | | | | | | | | | | | |
Market Yield** | | | 4.20 | % | | | 3.22 | % | | | 4.19 | % | | | 3.11 | % |
Taxable-Equivalent Yield** | | | 8.65 | % | | | 6.65 | % | | | 7.46 | % | | | 5.52 | % |
* Distribution paid December 2019.
** Market Yield is based on the Fund’s current annualized monthly dividend divided by the Fund’s current market price as of the end of the reporting period. Taxable-Equivalent Yield represents the yield that must be earned on a fully taxable investment in order to equal the yield of the Fund on an after-tax basis. It is based on a combined federal and state income tax rate of 51.6% and 43.9% for the New Jersey and Pennsylvania Funds, respectively. Your actual combined federal and state income tax rate may differ from the assumed rate. The Taxable-Equivalent Yield also takes into account the percentage of the Fund’s income generated and paid by the Fund (based on payments made during the previous calendar year) that was either exempt from federal income tax but not from state income tax (e.g., income from an out-of-state municipal bond), or was exempt from neither federal nor state income tax. Separately, if the comparison were instead to investments that generate qualified dividend income, which is taxable at a rate lower than an individual’s ordinary graduated tax rate, the fund’s Taxable-Equivalent Yield would be lower.
Each Fund seeks to pay regular monthly dividends out of its net investment income at a rate that reflects its past and projected net income performance. To permit each Fund to maintain a more stable monthly dividend, the Fund may pay dividends at a rate that may be more or less than the amount of net income actually earned by the Fund during the period. Distributions to common shareholders are determined on a tax basis, which may differ from amounts recorded in the accounting records. In instances where the monthly dividend exceeds the earned net investment income, the Fund would report a negative undistributed net ordinary income. Refer to Note 6 – Income Tax Information for additional information regarding the amounts of undistributed net ordinary income and undistributed net long-term capital gains and the character of the actual distributions paid by the Fund during the period.
14
All monthly dividends paid by each Fund during the current reporting period were paid from net investment income. If a portion of the Fund’s monthly distributions is sourced or comprised of elements other than net investment income, including capital gains and/or a return of capital, shareholders will be notified of those sources. For financial reporting purposes, the per share amounts of each Fund’s distributions for the reporting period are presented in this report’s Financial Highlights. For income tax purposes, distribution information for each Fund as of its most recent tax year end is presented in Note 6 – Income Tax Information within the Notes to Financial Statements of this report.
CHANGE IN METHOD OF PUBLISHING NUVEEN CLOSED-END FUND DISTRIBUTION AMOUNTS
During November 2019, the Nuveen Closed-End Funds discontinued the practice of announcing Fund distribution amounts and timing via press release. Instead, information about the Nuveen Closed-End Funds’ monthly and quarterly periodic distributions to shareholders are posted and can be found on Nuveen’s enhanced closed-end fund resource page, which is at www.nuveen.com/closed-end-fund-distributions, along with other Nuveen closed-end fund product updates. Shareholders can expect regular distribution information to be posted on www.nuveen.com on the first business day of each month. To ensure that our shareholders have timely access to the latest information, a subscribe function can be activated at this link here, or at this web page (www.nuveen.com/en-us/people/about-nuveen/for-the-media).
COMMON SHARE REPURCHASES
During August 2019, the Funds’ Board of Trustees reauthorized an open-market share repurchase program, allowing each Fund to repurchase an aggregate of up to approximately 10% of its outstanding shares.
As of February 29, 2020, and since the inception of the Funds’ repurchase programs, the Funds have cumulatively repurchased and retired their outstanding common shares as shown in the accompanying table.
| | | | | |
| NXJ | NJV | NQP | NPN |
Common shares cumulatively repurchased and retired | 1,685,000 | 35,501 | 734,900 | 3,500 |
Common shares authorized for repurchase | 4,150,000 | 155,000 | 3,740,000 | 120,000 |
During the current reporting period, the Funds did not repurchase any of their outstanding common shares.
OTHER COMMON SHARE INFORMATION
As of February 29, 2020, and during the current reporting period, the Funds’ common share prices were trading at a premium/ (discount) to their common share NAVs as shown in the accompanying table.
| | | | | | | | | | | | | |
| | NXJ | | | NJV | | | NQP | | | NPN | |
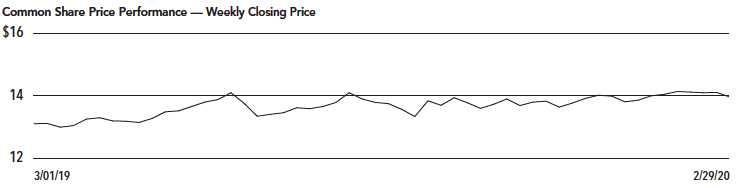
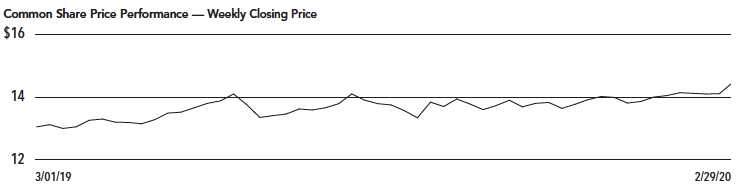
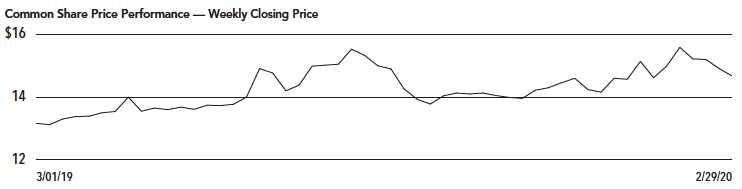
Common share NAV | | $ | 17.12 | | | $ | 15.92 | | | $ | 16.37 | | | $ | 15.64 | |
Common share Price | | $ | 14.73 | | | $ | 13.96 | | | $ | 14.46 | | | $ | 14.67 | |
Premium/(Discount) to NAV | | | (13.96 | )% | | | (12.31 | )% | | | (11.67 | )% | | | (6.20 | )% |
12-month average premium/(discount) to NAV | | | (12.11 | )% | | | (11.17 | )% | | | (11.49 | )% | | | (6.05 | )% |
15
Risk Considerations and Investment Policy Updates
Risk Considerations
Fund shares are not guaranteed or endorsed by any bank or other insured depository institution, and are not federally insured by the Federal Deposit Insurance Corporation.
Nuveen New Jersey Quality Municipal Income Fund (NXJ)
Investing in closed-end funds involves risk; principal loss is possible. There is no guarantee the Fund’s investment objectives will be achieved. Closed-end fund shares may frequently trade at a discount or premium to their net asset value. Debt or fixed income securities such as those held by the Fund, are subject to market risk, credit risk, interest rate risk, derivatives risk, liquidity risk, and income risk. As interest rates rise, bond prices fall. Leverage increases return volatility and magnifies the Fund’s potential return and its risks; there is no guarantee a fund’s leverage strategy will be successful. State concentration makes the Fund more susceptible to local adverse economic, political, or regulatory changes affecting municipal bond issuers. These and other risk considerations such as inverse floater risk and tax risk are described in more detail on the Fund’s web page at www.nuveen.com/NXJ.
Nuveen New Jersey Municipal Value Fund (NJV)
Investing in closed-end funds involves risk; principal loss is possible. There is no guarantee the Fund’s investment objectives will be achieved. Closed-end fund shares may frequently trade at a discount or premium to their net asset value. Debt or fixed income securities such as those held by the Fund, are subject to market risk, credit risk, interest rate risk, derivatives risk, liquidity risk, and income risk. As interest rates rise, bond prices fall. State concentration makes the Fund more susceptible to local adverse economic, political, or regulatory changes affecting municipal bond issuers. These and other risk considerations such as tax risk are described in more detail on the Fund’s web page at www.nuveen.com/NJV.
Nuveen Pennsylvania Quality Municipal Income Fund (NQP)
Investing in closed-end funds involves risk; principal loss is possible. There is no guarantee the Fund’s investment objectives will be achieved. Closed-end fund shares may frequently trade at a discount or premium to their net asset value. Debt or fixed income securities such as those held by the Fund, are subject to market risk, credit risk, interest rate risk, derivatives risk, liquidity risk, and income risk. As interest rates rise, bond prices fall. Leverage increases return volatility and magnifies the Fund’s potential return and its risks; there is no guarantee a fund’s leverage strategy will be successful. State concentration makes the Fund more susceptible to local adverse economic, political, or regulatory changes affecting municipal bond issuers. These and other risk considerations such as inverse floater risk and tax risk are described in more detail on the Fund’s web page at www.nuveen.com/NQP.
Nuveen Pennsylvania Municipal Value Fund (NPN)
Investing in closed-end funds involves risk; principal loss is possible. There is no guarantee the Fund’s investment objectives will be achieved. Closed-end fund shares may frequently trade at a discount or premium to their net asset value. Debt or fixed income securities such as those held by the Fund, are subject to market risk, credit risk, interest rate risk, derivatives risk, liquidity risk, and income risk. As interest rates rise, bond prices fall. State concentration makes the Fund more susceptible to local adverse economic, political, or regulatory changes affecting municipal bond issuers. These and other risk considerations such as tax risk are described in more detail on the Fund’s web page at www.nuveen.com/NPN.
16
Investment Policy Updates
Change in Investment Policy
Each of the Funds has recently adopted the following policy regarding limits to investments in illiquid securities:
While there are no such limits imposed by applicable regulations, certain Nuveen Closed-End Funds formerly had investment policies that placed limits on a Fund’s ability to invest in illiquid securities. All exchange-listed Nuveen Closed-End Funds now have no formal limit on their ability to invest in such illiquid securities, but each Fund’s portfolio management team will monitor such investments in the regular, overall management of the Fund’s portfolio securities.
New Temporary Investment Policy
Each of the Funds has adopted the following policy regarding its temporary investments.
Each Fund may temporarily depart from its normal investment policies and strategies – for instance, by allocating up to 100% of its assets to cash equivalents, short-term investments, or municipal bonds that do not comply with a Fund’s Name Policy – in response to adverse or unusual market, economic, political or other conditions. Such conditions could include a temporary decline in the availability of municipal bonds that comply with a Fund’s Name Policy. During these periods, the weighted average maturity of a Fund’s investment portfolio may fall below the defined range described in the respective Fund Summary under “Principal Investment Strategies” and a Fund may not achieve its investment objective to distribute income that is exempt from regular federal and state personal income tax.
17
| | |
| NXJ | Nuveen New Jersey Quality Municipal |
| Income Fund |
| Performance Overview and Holding Summaries as of |
| February 29, 2020 |
| | | | |
Refer to Glossary of Terms Used in this Report for further definition of the terms used within this section. |
Average Annual Total Returns as of February 29, 2020
|
|
| Average Annual |
| 1-Year | 5-Year | 10-Year |
NXJ at Common Share NAV | 15.02% | 6.54% | 6.90% |
NXJ at Common Share Price | 14.43% | 6.91% | 6.74% |
S&P Municipal Bond New Jersey Index | 10.29% | 4.87% | 5.05% |
S&P Municipal Bond Index | 8.94% | 3.93% | 4.56% |
Past performance is not predictive of future results. Current performance may be higher or lower than the data shown. Returns do not reflect the deduction of taxes that shareholders may have to pay on Fund distributions or upon the sale of Fund shares. Returns at NAV are net of Fund expenses, and assume reinvestment of distributions. Comparative index return information is provided for the Fund’s shares at NAV only. Indexes are not available for direct investment.
18
This data relates to the securities held in the Fund’s portfolio of investments as of the end of the reporting period. It should not be construed as a measure of performance for the Fund itself. Holdings are subject to change.
For financial reporting purposes, the ratings disclosed are the highest rating given by one of the following national rating agencies: Standard & Poor’s Group, Moody’s Investors Service, Inc. or Fitch, Inc. This treatment of split-rated securities may differ from that used for other purposes, such as for Fund investment policies. Credit ratings are subject to change. AAA, AA, A and BBB are investment grade ratings; BB, B, CCC, CC, C and D are below-investment grade ratings. Holdings designated N/R are not rated by these national rating agencies.
| | |
| Fund Allocation | |
| (% of net assets) | |
Long-Term Municipal Bonds | 148.0% |
Other Assets Less Liabilities | 0.9% |
| Net Assets Plus Floating Rate | |
| Obligations & VRDP Shares, | |
| net of deferred offering costs | 148.9% |
Floating Rate Obligations | (4.9)% |
VRDP Shares, net of deferred offering costs | (44.0)% |
| Net Assets | 100% |
| | |
| States and Territories | |
| (% of total investments) | |
New Jersey | 87.2% |
Pennsylvania | 5.1% |
New York | 4.7% |
Delaware | 2.1% |
Guam | 0.9% |
| Total | 100% |
| | |
| Portfolio Composition | |
| (% of total investments) | |
Tax Obligation/Limited | 23.1% |
Transportation | 19.8% |
Health Care | 13.8% |
Education and Civic Organizations | 13.4% |
U.S. Guaranteed | 7.4% |
Tax Obligation/General | 5.6% |
Other | 16.9% |
| Total | 100% |
| | |
| Portfolio Credit Quality | |
| (% of total investment exposure) | |
U.S. Guaranteed | 7.5% |
AAA | 10.2% |
AA | 31.7% |
A | 27.7% |
BBB | 15.4% |
BB or Lower | 7.0% |
N/R (not rated) | 0.5% |
| Total | 100% |
19
| | |
| NJV | Nuveen New Jersey Municipal Value Fund |
| Performance Overview and Holding Summaries as of |
| February 29, 2020 |
| | | | |
Refer to Glossary of Terms Used in this Report for further definition of the terms used within this section.
|
Average Annual Total Returns as of February 29, 2020
|
|
| Average Annual |
| 1-Year | 5-Year | 10-Year |
NJV at Common Share NAV | 11.07% | 4.30% | 5.45% |
NJV at Common Share Price | 10.71% | 4.30% | 4.95% |
S&P Municipal Bond New Jersey Index | 10.29% | 4.87% | 5.05% |
S&P Municipal Bond Index | 8.94% | 3.93% | 4.56% |
Past performance is not predictive of future results. Current performance may be higher or lower than the data shown. Returns do not reflect the deduction of taxes that shareholders may have to pay on Fund distributions or upon the sale of Fund shares. Returns at NAV are net of Fund expenses, and assume reinvestment of distributions. Comparative index return information is provided for the Fund’s shares at NAV only. Indexes are not available for direct investment.
20
This data relates to the securities held in the Fund’s portfolio of investments as of the end of the reporting period. It should not be construed as a measure of performance for the Fund itself. Holdings are subject to change.
For financial reporting purposes, the ratings disclosed are the highest rating given by one of the following national rating agencies: Standard & Poor’s Group, Moody’s Investors Service, Inc. or Fitch, Inc. This treatment of split-rated securities may differ from that used for other purposes, such as for Fund investment policies. Credit ratings are subject to change. AAA, AA, A and BBB are investment grade ratings; BB, B, CCC, CC, C and D are below-investment grade ratings. Holdings designated N/R are not rated by these national rating agencies.
| | |
| Fund Allocation | |
| (% of net assets) | |
Long-Term Municipal Bonds | 103.1% |
Other Assets Less Liabilities | 0.2% |
| Net Assets Plus Floating | |
| Rate Obligations | 103.3% |
Floating Rate Obligations | (3.3)% |
| Net Assets | 100% |
| | |
| States and Territories | |
| (% of total investments) | |
New Jersey | 90.0% |
Pennsylvania | 6.4% |
Delaware | 2.2% |
New York | 1.4% |
| Total | 100% |
| | |
| Portfolio Composition | |
| (% of total investments) | |
Education and Civic Organizations | 16.5% |
Transportation | 16.2% |
Tax Obligation/Limited | 15.6% |
Health Care | 14.1% |
Tax Obligation/General | 8.3% |
Housing/Multifamily | 8.0% |
U.S. Guaranteed | 6.4% |
Other | 14.9% |
| Total | 100% |
| | |
| Portfolio Credit Quality | |
| (% of total investment exposure) | |
U.S. Guaranteed | 6.8% |
AAA | 9.9% |
AA | 31.6% |
A | 29.7% |
BBB | 14.8% |
BB or Lower | 6.5% |
N/R (not rated) | 0.7% |
| Total | 100% |
21
| | |
| NQP | Nuveen Pennsylvania Quality Municipal |
| Income Fund |
| Performance Overview and Holding Summaries as of |
| February 29, 2020 |
| | | | |
Refer to Glossary of Terms Used in this Report for further definition of the terms used within this section. |
| Average Annual Total Returns as of February 29, 2020 |
|
| Average Annual |
| 1-Year | 5-Year | 10-Year |
NQP at Common Share NAV | 13.62% | 5.42% | 6.48% |
NQP at Common Share Price | 15.97% | 5.60% | 6.75% |
S&P Municipal Bond Pennsylvania Index | 9.24% | 4.15% | 4.72% |
S&P Municipal Bond Index | 8.94% | 3.93% | 4.56% |
Past performance is not predictive of future results. Current performance may be higher or lower than the data shown. Returns do not reflect the deduction of taxes that shareholders may have to pay on Fund distributions or upon the sale of Fund shares. Returns at NAV are net of Fund expenses, and assume reinvestment of distributions. Comparative index return information is provided for the Fund’s shares at NAV only. Indexes are not available for direct investment.
22
This data relates to the securities held in the Fund’s portfolio of investments as of the end of the reporting period. It should not be construed as a measure of performance for the Fund itself. Holdings are subject to change.
For financial reporting purposes, the ratings disclosed are the highest rating given by one of the following national rating agencies: Standard & Poor’s Group, Moody’s Investors Service, Inc. or Fitch, Inc. This treatment of split-rated securities may differ from that used for other purposes, such as for Fund investment policies. Credit ratings are subject to change. AAA, AA, A and BBB are investment grade ratings; BB, B, CCC, CC, C and D are below-investment grade ratings. Holdings designated N/R are not rated by these national rating agencies.
| | |
| Fund Allocation | |
| (% of net assets) | |
Long-Term Municipal Bonds | 153.6% |
Common Stocks | 2.8% |
Other Assets Less Liabilities | 1.1% |
| Net Assets Plus Floating Rate Obligations | |
| & VRDP Shares, net of deferred offering | |
| costs | 157.5% |
Floating Rate Obligations | (22.1)% |
VRDP Shares, net of deferred offering costs | (35.4)% |
| Net Assets | 100% |
| | |
| States and Territories | |
| (% of total municipal bonds) | |
Pennsylvania | 98.2% |
Puerto Rico | 1.5% |
Guam | 0.3% |
| Total | 100% |
| | |
| Portfolio Composition | |
| (% of total investments) | |
Health Care | 21.1% |
Tax Obligation/General | 13.9% |
Education and Civic Organizations | 11.5% |
U.S. Guaranteed | 12.4% |
Housing/Single Family | 9.5% |
Water and Sewer | 7.0% |
Transportation | 6.3% |
Tax Obligation/Limited | 5.9% |
Other | 12.4% |
| Total | 100% |
| | |
| Portfolio Credit Quality | |
| (% of total investment exposure) | |
U.S. Guaranteed | 13.9% |
AAA | 0.4% |
AA | 33.7% |
A | 29.9% |
BBB | 11.4% |
BB or Lower | 5.4% |
N/R | 3.6% |
N/A | 1.7% |
| Total | 100% |
23
| | |
| NPN | Nuveen Pennsylvania Municipal Value Fund |
| Performance Overview and Holding Summaries as of |
| February 29, 2020 |
| | | | |
Refer to Glossary of Terms Used in this Report for further definition of the terms used within this section.
|
Average Annual Total Returns as of February 29, 2020
|
|
| Average Annual |
| 1-Year | 5-Year | 10-Year |
NPN at Common Share NAV | 9.54% | 3.84% | 5.12% |
NPN at Common Share Price | 15.04% | 4.21% | 4.72% |
S&P Municipal Bond Pennsylvania Index | 9.24% | 4.15% | 4.72% |
S&P Municipal Bond Index | 8.94% | 3.93% | 4.56% |
Past performance is not predictive of future results. Current performance may be higher or lower than the data shown. Returns do not reflect the deduction of taxes that shareholders may have to pay on Fund distributions or upon the sale of Fund shares. Returns at NAV are net of Fund expenses, and assume reinvestment of distributions. Comparative index return information is provided for the Fund’s shares at NAV only. Indexes are not available for direct investment.
24
This data relates to the securities held in the Fund’s portfolio of investments as of the end of the reporting period. It should not be construed as a measure of performance for the Fund itself. Holdings are subject to change.
For financial reporting purposes, the ratings disclosed are the highest rating given by one of the following national rating agencies: Standard & Poor’s Group, Moody’s Investors Service, Inc. or Fitch, Inc. This treatment of split-rated securities may differ from that used for other purposes, such as for Fund investment policies. Credit ratings are subject to change. AAA, AA, A and BBB are investment grade ratings; BB, B, CCC, CC, C and D are below-investment grade ratings. Holdings designated N/R are not rated by these national rating agencies.
| | |
| Fund Allocation | |
| (% of net assets) | |
Long-Term Municipal Bonds | 99.2% |
Common Stocks | 2.2% |
Other Assets Less Liabilities | 1.0% |
| Net Assets Plus Floating | |
| Rate Obligations | 102.4% |
Floating Rate Obligations | (2.4)% |
| Net Assets | 100% |
| | |
| States and Territories | |
| (% of total municipal bonds) | |
Pennsylvania | 96.0% |
District of Columbia | 2.5% |
Puerto Rico | 0.8% |
Guam | 0.7% |
| Total | 100% |
| | |
| Portfolio Composition | |
| (% of total investments) | |
Health Care | 20.3% |
Housing/Single Family | 10.8% |
Tax Obligation/General | 9.0% |
Transportation | 8.5% |
Education and Civic Organizations | 8.4% |
Tax Obligation/Limited | 7.7% |
Housing/Multifamily | 7.0% |
U.S. Guaranteed | 6.6% |
Utilities | 6.5% |
Long-Term Care | 5.8% |
Other | 9.4% |
| Total | 100% |
| | |
| Portfolio Credit Quality | |
| (% of total investment exposure) | |
U.S. Guaranteed | 8.2% |
AAA | 0.6% |
AA | 34.3% |
A | 29.0% |
BBB | 15.3% |
BB or Lower | 7.2% |
N/R | 3.3% |
N/A | 2.1% |
| Total | 100% |
25
Shareholder Meeting Report
The annual meeting of shareholders was held in the offices of Nuveen on December 5, 2019 for NXJ, NJV, NQP and NPN; at this meeting the shareholders were asked to elect Board Members.
| | | | | | | |
| NXJ | NJV | NQP | NPN |
| Common and | | | Common and | | |
| Preferred | | | Preferred | | |
| shares voting | | | shares voting | | |
| together | Preferred | Common | together | Preferred | Common |
| as a class | Shares | Shares | as a class | Shares | Shares |
| Approval of the Board Members was reached as follows: | | | | | | |
Judith M. Stockdale | | | | | | |
| For | 33,037,362 | — | 1,168,809 | 27,325,058 | — | 1,029,090 |
| Withhold | 3,523,659 | — | 36,912 | 4,252,693 | — | 63,891 |
| Total | 36,561,021 | — | 1,205,721 | 31,577,751 | — | 1,092,981 |
Carole E. Stone | | | | | | |
| For | 33,027,905 | — | 1,169,938 | 27,080,166 | — | 1,031,387 |
| Withhold | 3,533,116 | — | 35,783 | 4,497,585 | — | 61,594 |
| Total | 36,561,021 | — | 1,205,721 | 31,577,751 | — | 1,092,981 |
Margaret L. Wolff | | | | | | |
| For | 33,077,453 | — | 1,176,088 | 27,258,091 | — | 1,033,514 |
| Withhold | 3,483,568 | — | 29,633 | 4,319,660 | — | 59,467 |
| Total | 36,561,021 | — | 1,205,721 | 31,577,751 | — | 1,092,981 |
William C. Hunter | | | | | | |
| For | — | 3,139 | 1,176,088 | — | 2,175 | 1,031,387 |
| Withhold | — | — | 29,633 | — | — | 61,594 |
| Total | — | 3,139 | 1,205,721 | — | 2,175 | 1,092,981 |
Albin F. Moschner | | | | | | |
| For | — | 3,139 | — | — | 2,175 | — |
| Withhold | — | — | — | — | — | — |
| Total | — | 3,139 | — | — | 2,175 | — |
26
Report of Independent Registered Public Accounting Firm
To the Shareholders and Board of Trustees
Nuveen New Jersey Quality Municipal Income Fund
Nuveen New Jersey Municipal Value Fund
Nuveen Pennsylvania Quality Municipal Income Fund
Nuveen Pennsylvania Municipal Value Fund:
Opinion on the Financial Statements
We have audited the accompanying statements of assets and liabilities of Nuveen New Jersey Quality Municipal Income Fund, Nuveen New Jersey Municipal Value Fund, Nuveen Pennsylvania Quality Municipal Income Fund, and Nuveen Pennsylvania Municipal Value Fund (the Funds), including the portfolios of investments, as of February 29, 2020, the related statements of operations for the year then ended, the statements of changes in net assets for each of the years in the two-year period then ended, the statements of cash flows (Nuveen New Jersey Quality Municipal Income Fund and Nuveen Pennsylvania Quality Municipal Income Fund) for the year then ended, and the related notes (collectively, the financial statements) and the financial highlights for each of the years in the three-year period then ended, the ten-month period from May 1, 2016 through February 28, 2017, and each of the years in the two-year period ended April 30, 2016. In our opinion, the financial statements and financial highlights present fairly, in all material respects, the financial position of the Funds as of February 29, 2020, the results of their operations and their cash flows (where applicable) for the year then ended, the changes in their net assets for each of the years in the two-year period then ended, and the financial highlights for each of the years in the three-year period then ended, the ten-month period from May 1, 2016 through February 28, 2017, and each of the years in the two-year period ended April 30, 2016, in conformity with U.S. generally accepted accounting principles.
Basis for Opinion
These financial statements and financial highlights are the responsibility of the Funds’ management. Our responsibility is to express an opinion on these financial statements and financial highlights based on our audits. We are a public accounting firm registered with the Public Company Accounting Oversight Board (United States) (PCAOB) and are required to be independent with respect to the Funds in accordance with the U.S. federal securities laws and the applicable rules and regulations of the Securities and Exchange Commission and the PCAOB.
We conducted our audits in accordance with the standards of the PCAOB. Those standards require that we plan and perform the audit to obtain reasonable assurance about whether the financial statements and financial highlights are free of material misstatement, whether due to error or fraud. Our audits included performing procedures to assess the risks of material misstatement of the financial statements and financial highlights, whether due to error or fraud, and performing procedures that respond to those risks. Such procedures included examining, on a test basis, evidence regarding the amounts and disclosures in the financial statements and financial highlights. Such procedures also included confirmation of securities owned as of February 29, 2020, by correspondence with custodians and brokers or other appropriate auditing procedures. Our audits also included evaluating the accounting principles used and significant estimates made by management, as well as evaluating the overall presentation of the financial statements and financial highlights. We believe that our audits provide a reasonable basis for our opinion.
/s/ KPMG LLP
We have served as the auditor of one or more Nuveen investment companies since 2014.
Chicago, Illinois
April 27, 2020
27
| | |
| NXJ | Nuveen New Jersey Quality Municipal |
| Income Fund |
| |
| February 29, 2020 |
| | | | | | |
| Principal | | | Optional Call | | |
| Amount (000) | | Description (1) | Provisions (2) | Ratings (3) | Value |
| | LONG-TERM INVESTMENTS – 148.0% (100.0% of Total Investments) | | | |
| | MUNICIPAL BONDS – 148.0% (100.0% of Total Investments) | | | |
| | Consumer Discretionary – 0.5% (0.3% of Total Investments) | | | |
| | Middlesex County Improvement Authority, New Jersey, Senior Revenue Bonds, Heldrich | | | |
| | Center Hotel/Conference Center Project, Series 2005A: | | | |
| $ 2,460 | | 5.000%, 1/01/32 | 3/20 at 100.00 | Caa2 | $ 2,033,682 |
| 1,485 | | 5.125%, 1/01/37 | 3/20 at 100.00 | Caa2 | 1,148,454 |
| 3,945 | | Total Consumer Discretionary | | | 3,182,136 |
| | Consumer Staples – 4.7% (3.2% of Total Investments) | | | |
| | Tobacco Settlement Financing Corporation, New Jersey, Tobacco Settlement Asset-Backed | | | |
| | Bonds, Series 2018A: | | | |
| 8,505 | | 4.000%, 6/01/37 | 6/28 at 100.00 | A– | 9,799,291 |
| 965 | | 5.000%, 6/01/46 | 6/28 at 100.00 | BBB+ | 1,175,804 |
| 11,680 | | 5.250%, 6/01/46 | 6/28 at 100.00 | BBB+ | 14,501,421 |
| 6,930 | | Tobacco Settlement Financing Corporation, New Jersey, Tobacco Settlement Asset-Backed | 6/28 at 100.00 | BB+ | 8,168,044 |
| | Bonds, Series 2018B, 5.000%, 6/01/46 | | | |
| 28,080 | | Total Consumer Staples | | | 33,644,560 |
| | Education and Civic Organizations – 19.8% (13.4% of Total Investments) | | | |
| 1,760 | | Camden County Improvement Authority, New Jersey, Lease Revenue Bonds, Rowan University | 12/23 at 100.00 | A | 2,000,539 |
| | School of Osteopathic Medicine Project, Refunding Series 2013A, 5.000%, 12/01/32 | | | |
| 1,000 | | New Jersey Economic Development Authority, Charter School Revenue Bonds, Foundation | 1/28 at 100.00 | BBB– | 1,165,280 |
| | Academy Charter School, Series 2018A, 5.000%, 7/01/50 | | | |
| 175 | | New Jersey Economic Development Authority, Charter School Revenue Bonds, Teaneck | 9/27 at 100.00 | BB | 197,414 |
| | Community Charter School, Series 2017A, 5.125%, 9/01/52, 144A | | | |
| 2,025 | | New Jersey Economic Development Authority, Revenue Bonds, The Seeing Eye Inc, Refunding | No Opt. Call | A | 2,411,856 |
| | Series 2015, 5.000%, 3/01/25 | | | |
| | New Jersey Economic Development Authority, Revenue Bonds, The Seeing Eye Inc, Refunding | | | |
| | Series 2017: | | | |
| 500 | | 5.000%, 6/01/32 | 12/27 at 100.00 | A | 628,760 |
| 820 | | 3.000%, 6/01/32 | 12/27 at 100.00 | A | 885,305 |
| 2,455 | | New Jersey Economic Development Authority, Rutgers University General Obligation Lease | 6/23 at 100.00 | Aa3 | 3,588,424 |
| | Revenue Bonds, Tender Option Bond 2016-XF2357, 14.783%, 6/15/46, 144A (IF) (4) | | | |
| | New Jersey Education Facilities Authority Revenue Bonds, The College of New Jersey | | | |
| | Issue, Series 2013A: | | | |
| 2,475 | | 5.000%, 7/01/38 | 7/23 at 100.00 | A+ | 2,744,800 |
| 3,250 | | 5.000%, 7/01/43 | 7/23 at 100.00 | A+ | 3,595,377 |
| 1,100 | | New Jersey Educational Facilities Authority, Revenue Bonds, Kean University, Refunding | 7/25 at 100.00 | AA | 1,222,793 |
| | Series 2015H, 4.000%, 7/01/39 – AGM Insured | | | |
| 5,950 | | New Jersey Educational Facilities Authority, Revenue Bonds, Montclair State University, | 7/24 at 100.00 | A+ | 6,780,917 |
| | Series 2014A, 5.000%, 7/01/44 | | | |
| | New Jersey Educational Facilities Authority, Revenue Bonds, Montclair State University, | | | |
| | Series 2015D: | | | |
| 2,395 | | 5.000%, 7/01/31 | 7/25 at 100.00 | A+ | 2,852,996 |
| 1,600 | | 5.000%, 7/01/33 | 7/25 at 100.00 | A+ | 1,900,768 |
| 1,000 | | 5.000%, 7/01/34 | 7/25 at 100.00 | A+ | 1,186,490 |
| | New Jersey Educational Facilities Authority, Revenue Bonds, Passaic County Community | | | |
| | College, Series 2010C: | | | |
| 1,500 | | 5.250%, 7/01/32 | 7/20 at 100.00 | Baa1 | 1,519,785 |
| 1,000 | | 5.375%, 7/01/41 | 7/20 at 100.00 | Baa1 | 1,013,330 |
28
| | | | | | |
| Principal | | | Optional Call | | |
| Amount (000) | | Description (1) | Provisions (2) | Ratings (3) | Value |
| | Education and Civic Organizations (continued) | | | |
| $ 4,335 | | New Jersey Educational Facilities Authority, Revenue Bonds, Princeton University, Tender | 7/21 at 100.00 | AAA | $ 5,019,106 |
| | Option Bond Trust 2015-XF0099, 11.220%, 7/01/39, 144A (IF) | | | |
| 4,000 | | New Jersey Educational Facilities Authority, Revenue Bonds, Princeton University, Tender | 7/24 at 100.00 | AAA | 5,899,000 |
| | Option Bond Trust 2015-XF0149, 11.567%, 7/01/44, 144A (IF) (4) | | | |
| | New Jersey Educational Facilities Authority, Revenue Bonds, Ramapo College, Refunding | | | |
| | Series 2012B: | | | |
| 550 | | 5.000%, 7/01/37 | 7/22 at 100.00 | A | 593,615 |
| 1,050 | | 5.000%, 7/01/42 | 7/22 at 100.00 | A | 1,131,512 |
| | New Jersey Educational Facilities Authority, Revenue Bonds, Rider University, | | | |
| | Series 2012A: | | | |
| 1,150 | | 5.000%, 7/01/32 | 7/21 at 100.00 | Baa2 | 1,201,727 |
| 740 | | 5.000%, 7/01/37 | 7/21 at 100.00 | Baa2 | 771,598 |
| | New Jersey Educational Facilities Authority, Revenue Bonds, Rider University, | | | |
| | Series 2017F: | | | |
| 330 | | 3.750%, 7/01/37 | 7/27 at 100.00 | Baa2 | 353,760 |
| 3,830 | | 4.000%, 7/01/42 | 7/27 at 100.00 | Baa2 | 4,151,337 |
| 4,205 | | 5.000%, 7/01/47 | 7/27 at 100.00 | Baa2 | 4,912,786 |
| 1,200 | | New Jersey Educational Facilities Authority, Revenue Bonds, Seton Hall University, | 7/25 at 100.00 | A– | 1,405,860 |
| | Refunding Series 2015C, 5.000%, 7/01/35 | | | |
| 775 | | New Jersey Educational Facilities Authority, Revenue Bonds, Seton Hall University, | 7/27 at 100.00 | A– | 847,036 |
| | Refunding Series 2017D, 3.500%, 7/01/44 | | | |
| | New Jersey Educational Facilities Authority, Revenue Bonds, Seton Hall University, | | | |
| | Series 2013D: | | | |
| 685 | | 5.000%, 7/01/38 | 7/23 at 100.00 | A– | 762,268 |
| 1,935 | | 5.000%, 7/01/43 | 7/23 at 100.00 | A– | 2,144,619 |
| 1,970 | | New Jersey Educational Facilities Authority, Revenue Bonds, Seton Hall University, | 7/26 at 100.00 | A– | 2,055,577 |
| | Series 2016C, 3.000%, 7/01/46 | | | |
| 860 | | New Jersey Educational Facilities Authority, Revenue Bonds, Stevens Institute of | 7/30 at 100.00 | BBB+ | 1,017,879 |
| | Technology Issue, Green Series 2020A, 4.000%, 7/01/50 (WI/DD, Settling 3/11/20) | | | |
| | New Jersey Educational Facilities Authority, Revenue Bonds, Stevens Institute of | | | |
| | Technology, Series 2017A: | | | |
| 1,060 | | 5.000%, 7/01/37 | 7/27 at 100.00 | BBB+ | 1,321,385 |
| 2,500 | | 5.000%, 7/01/42 | 7/27 at 100.00 | BBB+ | 3,085,750 |
| 3,160 | | 5.000%, 7/01/47 | 7/27 at 100.00 | BBB+ | 3,877,036 |
| 1,050 | | 4.000%, 7/01/47 | 7/27 at 100.00 | BBB+ | 1,199,079 |
| 975 | | New Jersey Educational Facilities Authority, Revenue Bonds, The College of Saint | 7/26 at 100.00 | BB | 1,067,167 |
| | Elizabeth, Series 2016D, 5.000%, 7/01/46 | | | |
| 4,560 | | New Jersey Educational Facilities Authority, Revenue Bonds, William Paterson University, | 7/25 at 100.00 | A2 | 5,289,007 |
| | Series 2015C, 5.000%, 7/01/40 | | | |
| | New Jersey Educational Facilities Authority, Revenue Bonds, William Paterson University, | | | |
| | Series 2017B: | | | |
| 2,000 | | 5.000%, 7/01/42 – AGM Insured | 7/27 at 100.00 | AA | 2,442,300 |
| 2,420 | | 5.000%, 7/01/47 – AGM Insured | 7/27 at 100.00 | AA | 2,935,678 |
| | New Jersey Higher Education Assistance Authority, Senior Student Loan Revenue Bonds, | | | |
| | Refunding Series 2018A: | | | |
| 2,500 | | 3.750%, 12/01/30 (AMT) | 6/28 at 100.00 | Aaa | 2,844,525 |
| 2,560 | | 4.000%, 12/01/32 (AMT) | 6/28 at 100.00 | Aaa | 2,952,448 |
| 2,000 | | 4.000%, 12/01/33 (AMT) | 6/28 at 100.00 | Aaa | 2,301,880 |
| 2,135 | | 4.000%, 12/01/35 (AMT) | 6/28 at 100.00 | Aaa | 2,447,863 |
| | New Jersey Higher Education Assistance Authority, Student Loan Revenue Bonds, Senior | | | |
| | Lien Series 2016-1A: | | | |
| 6,180 | | 3.500%, 12/01/32 (AMT) | 12/25 at 100.00 | Aaa | 6,682,125 |
| 1,430 | | 4.000%, 12/01/39 (AMT) | 12/25 at 100.00 | Aaa | 1,574,158 |
| 1,880 | | New Jersey Higher Education Assistance Authority, Student Loan Revenue Bonds, Senior | 6/28 at 100.00 | Aa1 | 2,000,865 |
| | Series 2019B, 3.250%, 12/01/39 (AMT) | | | |
29
| | |
| NXJ | Nuveen New Jersey Quality Municipal Income Fund |
| Portfolio of Investments (continued) |
| February 29, 2020 |
| | | | | | |
| Principal | | | Optional Call | | |
| Amount (000) | | Description (1) | Provisions (2) | Ratings (3) | Value |
| | Education and Civic Organizations (continued) | | | |
| $ 600 | | New Jersey Higher Education Assistance Authority, Student Loan Revenue Bonds, Series | 3/20 at 100.00 | Aaa | $ 600,480 |
| | 2010-1A, 5.000%, 12/01/25 | | | |
| 960 | | New Jersey Higher Education Assistance Authority, Student Loan Revenue Bonds, Series | 12/20 at 100.00 | Aaa | 989,539 |
| | 2010-2, 5.000%, 12/01/30 | | | |
| 660 | | New Jersey Higher Education Assistance Authority, Student Loan Revenue Bonds, Series | 12/21 at 100.00 | Aaa | 703,837 |
| | 2011-1, 5.750%, 12/01/27 (AMT) | | | |
| | New Jersey Higher Education Assistance Authority, Student Loan Revenue Bonds, | | | |
| | Series 2012-1A: | | | |
| 2,115 | | 4.250%, 12/01/25 (AMT) | 12/22 at 100.00 | Aaa | 2,272,546 |
| 695 | | 4.375%, 12/01/26 (AMT) | 12/22 at 100.00 | Aaa | 748,376 |
| 500 | | New Jersey Higher Education Assistance Authority, Student Loan Revenue Bonds, Series | 12/22 at 100.00 | Aaa | 556,825 |
| | 2012-1B, 5.750%, 12/01/39 (AMT) | | | |
| 710 | | New Jersey Higher Education Assistance Authority, Student Loan Revenue Bonds, Series | 12/22 at 100.00 | Aaa | 752,643 |
| | 2013-1A, 3.750%, 12/01/26 (AMT) | | | |
| | New Jersey Higher Education Assistance Authority, Student Loan Revenue Bonds, Series | | | |
| | 2015-1A: | | | |
| 4,655 | | 4.000%, 12/01/28 (AMT) | 12/24 at 100.00 | Aaa | 5,168,912 |
| 2,400 | | 4.000%, 12/01/30 (AMT) | 12/24 at 100.00 | Aaa | 2,650,152 |
| 6,855 | | New Jersey Higher Education Assistance Authority, Student Loan Revenue Bonds, | 12/26 at 100.00 | Aaa | 7,667,523 |
�� | | Subordinate Series 2017-C, 4.250%, 12/01/47 (AMT) | | | |
| 3,560 | | New Jersey Higher Education Assistance Authority, Student Loan Revenue Bonds, | 6/28 at 100.00 | A2 | 3,805,070 |
| | Subordinate Series 2019C, 3.625%, 12/01/49 (AMT) | | | |
| | New Jersey Higher Education Assistance Authority, Student Loan Revenue Bonds, Tender | | | |
| | Option Bond Trust 2015-XF0151: | | | |
| 666 | | 8.658%, 12/01/23 (AMT), 144A (IF) (4) | 12/22 at 100.00 | Aaa | 814,618 |
| 595 | | 8.825%, 12/01/24 (AMT), 144A (IF) (4) | 12/22 at 100.00 | Aaa | 727,031 |
| 405 | | 9.147%, 12/01/25 (AMT), 144A (IF) (4) | 12/22 at 100.00 | Aaa | 498,567 |
| 125 | | 9.246%, 12/01/26 (AMT), 144A (IF) (4) | 12/22 at 100.00 | Aaa | 153,528 |
| 1,535 | | 10.618%, 12/01/27 (AMT), 144A (IF) | 12/23 at 100.00 | Aaa | 2,048,688 |
| 2,300 | | New Jersey Institute of Technology, New Jersey, General Obligation Bonds, Series 2015A, | 7/25 at 100.00 | A1 | 2,712,804 |
| | 5.000%, 7/01/45 | | | |
| 122,366 | | Total Education and Civic Organizations | | | 140,854,919 |
| | Financials – 0.8% (0.5% of Total Investments) | | | |
| | New Jersey Economic Development Authority, Revenue Refunding Bonds, Kapkowski Road | | | |
| | Landfill Project, Series 2002: | | | |
| 3,780 | | 5.750%, 10/01/21 | No Opt. Call | Ba2 | 3,878,809 |
| 1,500 | | 6.500%, 4/01/28 | No Opt. Call | Ba2 | 1,795,560 |
| 5,280 | | Total Financials | | | 5,674,369 |
| | Health Care – 20.5% (13.8% of Total Investments) | | | |
| | Camden County Improvement Authority, New Jersey, Health Care Redevelopment Revenue | | | |
| | Bonds, Cooper Health System Obligated Group Issue, Refunding Series 2014A: | | | |
| 175 | | 5.000%, 2/15/25 | 2/24 at 100.00 | BBB+ | 200,634 |
| 220 | | 5.000%, 2/15/26 | 2/24 at 100.00 | BBB+ | 252,135 |
| 1,320 | | 5.000%, 2/15/27 | 2/24 at 100.00 | BBB+ | 1,514,212 |
| 1,385 | | 5.000%, 2/15/28 | 2/24 at 100.00 | BBB+ | 1,589,011 |
| 1,385 | | 5.000%, 2/15/29 | 2/24 at 100.00 | BBB+ | 1,587,196 |
| 2,500 | | 5.000%, 2/15/32 | 2/24 at 100.00 | BBB+ | 2,851,850 |
| 3,040 | | 5.000%, 2/15/33 | 2/24 at 100.00 | BBB+ | 3,462,590 |
| 1,000 | | 5.000%, 2/15/34 | 2/24 at 100.00 | BBB+ | 1,137,440 |
| 1,950 | | 5.000%, 2/15/35 | 2/24 at 100.00 | BBB+ | 2,214,498 |
| 6,100 | | Camden County Improvement Authority, New Jersey, Health Care Redevelopment Revenue | 2/23 at 100.00 | BBB+ | 6,828,706 |
| | Bonds, Cooper Health System Obligated Group Issue, Series 2013A, 5.750%, 2/15/42 | | | |
30
| | | | | | |
| Principal | | | Optional Call | | |
| Amount (000) | | Description (1) | Provisions (2) | Ratings (3) | Value |
| | Health Care (continued) | | | |
| $ 225 | | New Jersey Health Care Facilities Finance Authority, Revenue Bonds, AHS Hospital | 3/20 at 100.00 | AA– | $ 225,758 |
| | Corporation, Series 2008A, 5.000%, 7/01/27 | | | |
| | New Jersey Health Care Facilities Financing Authority, New Jersey, Revenue Bonds, Saint | | | |
| | Peters University Hospital, Refunding Series 2011: | | | |
| 2,000 | | 6.000%, 7/01/26 | 7/21 at 100.00 | BB+ | 2,108,080 |
| 3,425 | | 6.250%, 7/01/35 | 7/21 at 100.00 | BB+ | 3,617,690 |
| 3,550 | | New Jersey Health Care Facilities Financing Authority, New Jersey, Revenue Bonds, Saint | 3/20 at 100.00 | BB+ | 3,562,816 |
| | Peters University Hospital, Series 2007, 5.750%, 7/01/37 | | | |
| 1,145 | | New Jersey Health Care Facilities Financing Authority, Revenue and Refunding Bonds, | 7/22 at 100.00 | AA– | 1,252,355 |
| | Barnabas Health, Series 2012A, 5.000%, 7/01/24 | | | |
| 2,525 | | New Jersey Health Care Facilities Financing Authority, Revenue Bonds, AHS Hospital | 1/27 at 100.00 | AA– | 2,880,874 |
| | Corporation, Refunding Series 2016, 4.000%, 7/01/41 | | | |
| 11,000 | | New Jersey Health Care Facilities Financing Authority, Revenue Bonds, Barnabas Health, | 7/24 at 100.00 | AA– | 12,771,000 |
| | Refunding Series 2014A, 5.000%, 7/01/44 | | | |
| | New Jersey Health Care Facilities Financing Authority, Revenue Bonds, Hackensack | | | |
| | Meridian Health Obligated Group, Refunding Series 2017A: | | | |
| 700 | | 5.000%, 7/01/28 | 7/27 at 100.00 | AA– | 894,033 |
| 4,140 | | 5.000%, 7/01/57 | 7/27 at 100.00 | AA– | 5,009,400 |
| | New Jersey Health Care Facilities Financing Authority, Revenue Bonds, Hunterdon Medical | | | |
| | Center, Refunding Series 2014A: | | | |
| 2,055 | | 5.000%, 7/01/45 | 7/24 at 100.00 | A+ | 2,330,000 |
| 1,310 | | 4.000%, 7/01/45 | 7/24 at 100.00 | A+ | 1,399,342 |
| 12,010 | | New Jersey Health Care Facilities Financing Authority, Revenue Bonds, Inspira Health | 7/27 at 100.00 | AA– | 14,656,764 |
| | Obligated Group Issue, Series 2017A, 5.000%, 7/01/42 (UB) (4) | | | |
| | New Jersey Health Care Facilities Financing Authority, Revenue Bonds, Meridian Health | | | |
| | System Obligated Group, Refunding Series 2011: | | | |
| 3,000 | | 5.000%, 7/01/25 | 7/22 at 100.00 | AA– | 3,278,370 |
| 3,000 | | 5.000%, 7/01/26 | 7/22 at 100.00 | AA– | 3,275,460 |
| 2,500 | | 5.000%, 7/01/27 | 7/22 at 100.00 | AA– | 2,725,925 |
| 1,450 | | New Jersey Health Care Facilities Financing Authority, Revenue Bonds, Meridian Health | 7/23 at 100.00 | AA– | 1,623,594 |
| | System Obligated Group, Refunding Series 2013A, 5.000%, 7/01/32 | | | |
| | New Jersey Health Care Facilities Financing Authority, Revenue Bonds, Princeton | | | |
| | HealthCare System, Series 2016A: | | | |
| 830 | | 5.000%, 7/01/32 | 7/26 at 100.00 | AA | 1,031,217 |
| 1,055 | | 5.000%, 7/01/33 | 7/26 at 100.00 | AA | 1,309,994 |
| 1,370 | | 5.000%, 7/01/34 | 7/26 at 100.00 | AA | 1,699,581 |
| | New Jersey Health Care Facilities Financing Authority, Revenue Bonds, Robert Wood | | | |
| | Johnson University Hospital Issue, Series 2014A: | | | |
| 4,235 | | 5.000%, 7/01/39 | 7/24 at 100.00 | AA– | 4,946,099 |
| 5,955 | | 5.000%, 7/01/43 | 7/24 at 100.00 | AA– | 6,934,895 |
| 3,945 | | New Jersey Health Care Facilities Financing Authority, Revenue Bonds, Robert Wood | 7/23 at 100.00 | AA– | 4,468,896 |
| | Johnson University Hospital, Series 2013A, 5.500%, 7/01/43 | | | |
| 780 | | New Jersey Health Care Facilities Financing Authority, Revenue Bonds, RWJ Barnabas | 7/26 at 100.00 | AA– | 958,152 |
| | Health Obligated Group, Refunding Series 2016A, 5.000%, 7/01/43 | | | |
| | New Jersey Health Care Facilities Financing Authority, Revenue Bonds, Saint Joseph’s | | | |
| | Healthcare System Obligated Group Issue, Refunding Series 2016: | | | |
| 1,600 | | 3.000%, 7/01/32 | 7/26 at 100.00 | BBB– | 1,655,808 |
| 1,135 | | 4.000%, 7/01/34 | 7/26 at 100.00 | BBB– | 1,272,199 |
| 1,600 | | 5.000%, 7/01/35 | 7/26 at 100.00 | BBB– | 1,891,728 |
| 2,700 | | 5.000%, 7/01/36 | 7/26 at 100.00 | BBB– | 3,186,945 |
| 3,095 | | 5.000%, 7/01/41 | 7/26 at 100.00 | BBB– | 3,612,763 |
| 5,600 | | 4.000%, 7/01/48 | 7/26 at 100.00 | BBB– | 6,140,848 |
| 2,345 | | New Jersey Health Care Facilities Financing Authority, Revenue Bonds, Saint Luke’s | 8/23 at 100.00 | A– | 2,527,605 |
| | Warren Hospital Obligated Group, Series 2013, 4.000%, 8/15/37 | | | |
31
| | |
| NXJ | Nuveen New Jersey Quality Municipal Income Fund |
| Portfolio of Investments (continued) |
| February 29, 2020 |
| | | | | | |
| Principal | | | Optional Call | | |
| Amount (000) | | Description (1) | Provisions (2) | Ratings (3) | Value |
| | Health Care (continued) | | | |
| | New Jersey Health Care Facilities Financing Authority, Revenue Bonds, University | | | |
| | Hospital Issue, Refunding Series 2015A: | | | |
| $ 5,055 | | 4.125%, 7/01/38 – AGM Insured | 7/25 at 100.00 | AA | $ 5,594,166 |
| 3,910 | | 5.000%, 7/01/46 – AGM Insured | 7/25 at 100.00 | AA | 4,504,359 |
| | New Jersey Health Care Facilities Financing Authority, Revenue Bonds, Valley Health | | | |
| | System Obligated Group, Series 2019: | | | |
| 2,055 | | 4.000%, 7/01/44 | 7/29 at 100.00 | A+ | 2,419,701 |
| 7,675 | | 3.000%, 7/01/49 | 7/29 at 100.00 | A+ | 8,165,125 |
| 128,050 | | Total Health Care | | | 145,569,814 |
| | Housing/Multifamily – 3.3% (2.3% of Total Investments) | | | |
| 1,845 | | New Jersey Economic Development Authority, Revenue Bonds, Provident Group – Kean | 1/27 at 100.00 | BBB– | 2,092,673 |
| | Properties LLC – Kean University Student Housing Project, Series 2017A, 5.000%, 7/01/47 | | | |
| 1,900 | | New Jersey Economic Development Authority, Revenue Bonds, Provident Group – Rowan | 1/25 at 100.00 | BBB– | 2,082,001 |
| | Properties LLC – Rowan University Student Housing Project, Series 2015A, 5.000%, 1/01/48 | | | |
| 6,075 | | New Jersey Economic Development Authority, Revenue Bonds, West Campus Housing LLC – New | 7/25 at 100.00 | BB+ | 6,687,725 |
| | Jersey City University Student Housing Project, Series 2015, 5.000%, 7/01/47 | | | |
| | New Jersey Housing and Mortgage Finance Agency, Multifamily Housing Revenue Bonds, | | | |
| | Series 2013-2: | | | |
| 2,165 | | 4.350%, 11/01/33 (AMT) | 11/22 at 100.00 | AA | 2,297,779 |
| 1,235 | | 4.600%, 11/01/38 (AMT) | 11/22 at 100.00 | AA | 1,311,051 |
| 1,235 | | 4.750%, 11/01/46 (AMT) | 11/22 at 100.00 | AA | 1,308,878 |
| 4,320 | | New Jersey Housing and Mortgage Finance Agency, Multifamily Revenue Bonds, Series 2015A, | 11/24 at 100.00 | AA– | 4,660,848 |
| | 4.000%, 11/01/45 | | | |
| | New Jersey Housing and Mortgage Finance Agency, Multifamily Revenue Bonds, Series 2017D: | | | |
| 1,125 | | 3.900%, 11/01/32 (AMT) | 5/26 at 100.00 | AA– | 1,241,921 |
| 1,750 | | 4.250%, 11/01/37 (AMT) | 5/26 at 100.00 | AA– | 1,941,993 |
| 21,650 | | Total Housing/Multifamily | | | 23,624,869 |
| | Housing/Single Family – 6.7% (4.5% of Total Investments) | | | |
| | New Jersey Housing & Mortgage Finance Agency, Single Family Home Mortgage Revenue Bonds, | | | |
| | Series 2011A: | | | |
| 7,590 | | 4.450%, 10/01/25 | 4/21 at 100.00 | Aa2 | 7,856,788 |
| 7,590 | | 4.650%, 10/01/29 | 4/21 at 100.00 | Aa2 | 7,853,449 |
| | New Jersey Housing and Mortgage Finance Agency, Single Family Housing Revenue Bonds, | | | |
| | Series 2018A: | | | |
| 6,615 | | 3.600%, 4/01/33 | 10/27 at 100.00 | AA | 7,387,367 |
| 4,070 | | 3.750%, 10/01/35 | 10/27 at 100.00 | AA | 4,567,558 |
| 3,535 | | New Jersey Housing and Mortgage Finance Agency, Single Family Housing Revenue Bonds, | 10/27 at 100.00 | AA | 3,935,551 |
| | Series 2018B, 3.800%, 10/01/32 (AMT) | | | |
| | New Jersey Housing and Mortgage Finance Agency, Single Family Housing Revenue Bonds, | | | |
| | Series 2019C: | | | |
| 5,260 | | 3.500%, 10/01/34 (UB) (4) | 4/28 at 100.00 | AA | 5,876,945 |
| 5,255 | | 3.850%, 10/01/39 (UB) (4) | 4/28 at 100.00 | AA | 5,851,863 |
| 3,590 | | 3.950%, 10/01/44 (UB) (4) | 4/28 at 100.00 | AA | 3,982,746 |
| 43,505 | | Total Housing/Single Family | | | 47,312,267 |
| | Long-Term Care – 1.5% (1.0% of Total Investments) | | | |
| 510 | | New Jersey Economic Development Authority, Fixed Rate Revenue Bonds, Lions Gate Project, | 1/24 at 100.00 | N/R | 537,387 |
| | Series 2014, 5.250%, 1/01/44 | | | |
| 5,000 | | New Jersey Economic Development Authority, Revenue Bonds, United Methodist Homes of New | 7/23 at 100.00 | BBB– | 5,337,150 |
| | Jersey Obligated Group Issue, Refunding Series 2013, 5.000%, 7/01/34 | | | |
| 1,410 | | New Jersey Economic Development Authority, Revenue Bonds, United Methodist Homes of New | 7/24 at 100.00 | BBB– | 1,550,041 |
| | Jersey Obligated Group Issue, Refunding Series 2014A, 5.000%, 7/01/29 | | | |
32
| | | | | | |
| Principal | | | Optional Call | | |
| Amount (000) | | Description (1) | Provisions (2) | Ratings (3) | Value |
| | Long-Term Care (continued) | | | |
| $ 1,635 | | New Jersey Economic Development Authority, Revenue Bonds, White Horse HMT Urban Renewal | 1/28 at 102.00 | N/R | $ 1,675,711 |
| | LLC Project, Series 2020, 5.000%, 1/01/40, 144A (WI/DD, Settling 3/05/20) | | | |
| 1,450 | | New Jersey Health Care Facilities Financing Authority, Revenue Bonds, Village Drive | 10/26 at 102.00 | N/R | 1,553,226 |
| | Healthcare Urban Renewal LLC, Series 2018, 5.750%, 10/01/38, 144A | | | |
| 10,005 | | Total Long-Term Care | | | 10,653,515 |
| | Tax Obligation/General – 8.3% (5.6% of Total Investments) | | | |
| 2,225 | | Cumberland County Improvement Authority, New Jersey, County General Obligation Revenue | 9/24 at 100.00 | AA | 2,591,902 |
| | Bonds, Technical High School Project, Series 2014, 5.000%, 9/01/39 – AGM Insured | | | |
| 440 | | Cumberland County Improvement Authority, New Jersey, County General Obligation Revenue | 1/28 at 100.00 | AA | 486,037 |
| | Bonds, Technical High School Project, Series 2018, 3.125%, 1/15/32 – BAM Insured | | | |
| 2,920 | | Cumberland County Improvement Authority, New Jersey, Guaranteed Lease Revenue Bonds, | 10/28 at 100.00 | AA | 3,399,814 |
| | County Correctional Facility Project, Series 2018, 4.000%, 10/01/43 – BAM Insured | | | |
| 4,150 | | Essex County Improvement Authority, New Jersey, Project Consolidation Revenue Bonds, | No Opt. Call | Aaa | 4,663,396 |
| | Refunding Series 2007, 5.250%, 12/15/22 – AMBAC Insured | | | |
| 1,000 | | Gloucester Township, New Jersey, General Obligation Bonds, Series 2019, 2.000%, | No Opt. Call | AA | 1,033,100 |
| | 2/01/24 – BAM Insured | | | |
| 680 | | Hamilton Township, Mercer County Board of Education, New Jersey, General Obligation | 12/27 at 100.00 | AA | 741,118 |
| | Bonds, Series 2017, 3.250%, 12/15/38 | | | |
| | Harrison, New Jersey, General Obligation Bonds, Parking Utility Series 2018: | | | |
| 1,340 | | 3.125%, 3/01/31 – BAM Insured | 3/28 at 100.00 | AA | 1,472,955 |
| 1,110 | | 3.250%, 3/01/32 – BAM Insured | 3/28 at 100.00 | AA | 1,226,606 |
| 1,255 | | 3.500%, 3/01/36 – BAM Insured | 3/28 at 100.00 | AA | 1,395,824 |
| | Hudson County Improvement Authority, New Jersey, County Guaranteed Governmental Loan | | | |
| | Revenue Bonds, Guttenberg General Obligation Bond Project, Series 2018: | | | |
| 375 | | 3.250%, 8/01/34 | 8/25 at 100.00 | AA | 403,493 |
| 1,040 | | 5.000%, 8/01/42 | 8/25 at 100.00 | AA | 1,230,819 |
| | Jersey City, New Jersey, General Obligation Bonds, Refunding General Improvement | | | |
| | Series 2017A: | | | |
| 1,000 | | 5.000%, 11/01/29 | 11/27 at 100.00 | AA– | 1,269,890 |
| 515 | | 5.000%, 11/01/31 | 11/27 at 100.00 | AA– | 648,231 |
| 440 | | 5.000%, 11/01/33 | 11/27 at 100.00 | AA– | 551,342 |
| 1,100 | | Linden, New Jersey, General Obligation Bonds, Refunding Series 2011, 4.000%, 5/01/23 | 5/21 at 100.00 | AA– | 1,140,194 |
| 1,975 | | Middletown Township Board of Education, Monmouth County, New Jersey, Refunding Series | 8/20 at 100.00 | AA– | 2,008,140 |
| | 2010, 5.000%, 8/01/27 | | | |
| 760 | | Montclair Township, Essex County, New Jersey, General Obligation Bonds, Refunding | 1/24 at 100.00 | AAA | 876,660 |
| | Parking Utility Series 2014A, 5.000%, 1/01/37 | | | |
| | New Brunswick Parking Authority, Middlesex County, New Jersey, Guaranteed Parking | | | |
| | Revenue Bonds, Refunding Series 2012: | | | |
| 465 | | 5.000%, 9/01/28 | 9/22 at 100.00 | A+ | 509,077 |
| 610 | | 5.000%, 9/01/29 | 9/22 at 100.00 | A+ | 668,408 |
| 300 | | 5.000%, 9/01/31 | 9/22 at 100.00 | A+ | 328,713 |
| 250 | | 3.625%, 9/01/34 | 9/22 at 100.00 | A+ | 260,750 |
| 2,190 | | New Brunswick, New Jersey, General Obligation Bonds, Cultural Center Project, Series | 9/27 at 100.00 | AA | 2,503,455 |
| | 2017, 4.000%, 9/15/44 – AGM Insured | | | |
| 3,250 | | New Jersey State, General Obligation Bonds, Various Purpose Series 2020, 2.250%, 6/01/35 | 12/27 at 100.00 | A– | 3,265,470 |
| | South Orange Village Township, New Jersey, General Obligation Bonds, Refunding | | | |
| | Series 2020: | | | |
| 500 | | 4.000%, 1/15/23 | No Opt. Call | AA– | 544,505 |
| 400 | | 4.000%, 1/15/25 | No Opt. Call | AA– | 458,860 |
| 500 | | 4.000%, 1/15/26 | No Opt. Call | AA– | 584,910 |
33
| | |
| NXJ | Nuveen New Jersey Quality Municipal Income Fund |
| Portfolio of Investments (continued) |
| February 29, 2020 |
| | | | | | |
| Principal | | | Optional Call | | |
| Amount (000) | | Description (1) | Provisions (2) | Ratings (3) | Value |
| | Tax Obligation/General (continued) | | | |
| | Sparta Township Board of Education, Sussex County, New Jersey, General Obligation Bonds, | | | |
| | Refunding Series 2015: | | | |
| $ 1,000 | | 5.000%, 2/15/34 | 2/25 at 100.00 | AA | $ 1,180,490 |
| 1,395 | | 5.000%, 2/15/35 | 2/25 at 100.00 | AA | 1,644,300 |
| 3,975 | | Union County Improvement Authority, New Jersey, Lease Revenue Bonds, Plainfield – Park | No Opt. Call | AA+ | 9,344,470 |
| | Madison Redevelopment Project, Tender Option Trust 2016-XG0057, 14.591%, | | | |
| | 3/01/34, 144A (IF) (4) | | | |
| 5,165 | | Union County Utilities Authority, New Jersey, Resource Recovery Facility Lease Revenue | 12/21 at 100.00 | AA+ | 5,539,049 |
| | Bonds, Covantan Union Inc Lessee, Refunding Series 2011B, 5.250%, 12/01/31 (AMT) | | | |
| 2,515 | | Union County Utilities Authority, New Jersey, Solid Waste System County Deficiency | 6/21 at 100.00 | Aaa | 2,636,651 |
| | Revenue Bonds, Series 2011A, 5.000%, 6/15/41 | | | |
| 2,170 | | Union County, New Jersey, General Obligation Bonds, Refunding Series 2017, 3.000%, 3/01/27 | 9/25 at 100.00 | Aaa | 2,411,456 |
| 1,515 | | Washington Township Board of Education, Mercer County, New Jersey, General Obligation | No Opt. Call | Aa3 | 1,938,791 |
| | Bonds, Series 2005, 5.250%, 1/01/27 – AGM Insured | | | |
| 48,525 | | Total Tax Obligation/General | | | 58,958,876 |
| | Tax Obligation/Limited – 34.2% (23.1% of Total Investments) | | | |
| 3,775 | | Bergen County Improvement Authority, New Jersey, Guaranteed Lease Revenue Bonds, County | No Opt. Call | Aaa | 4,811,426 |
| | Administration Complex Project, Series 2005, 5.000%, 11/15/26 | | | |
| 3,000 | | Garden State Preservation Trust, New Jersey, Open Space and Farmland Preservation Bonds, | No Opt. Call | AA | 2,786,370 |
| | Series 2003B, 0.000%, 11/01/25 – AGM Insured | | | |
| 2,230 | | Garden State Preservation Trust, New Jersey, Open Space and Farmland Preservation Bonds, | No Opt. Call | AA | 2,856,429 |
| | Series 2005A, 5.750%, 11/01/28 – AGM Insured | | | |
| | Government of Guam, Business Privilege Tax Bonds, Series 2011A: | | | |
| 5,005 | | 5.250%, 1/01/36 | 1/22 at 100.00 | BB | 5,326,071 |
| 3,020 | | 5.125%, 1/01/42 | 1/22 at 100.00 | BB | 3,197,214 |
| 500 | | Government of Guam, Business Privilege Tax Bonds, Series 2012B-1, 5.000%, 1/01/29 | 1/22 at 100.00 | BB | 530,690 |
| | Hudson County Improvement Authority, New Jersey, County Secured Lease Revenue Bonds, | | | |
| | Hudson County Vocational Technical Schools Project, Series 2016: | | | |
| 10,310 | | 5.000%, 5/01/46 | 5/26 at 100.00 | AA | 12,294,263 |
| 3,700 | | 5.250%, 5/01/51 | 5/26 at 100.00 | AA | 4,449,287 |
| | New Jersey Economic Development Authority, Cigarette Tax Revenue Refunding Bonds, | | | |
| | Series 2012: | | | |
| 310 | | 5.000%, 6/15/21 | No Opt. Call | BBB+ | 324,669 |
| 6,400 | | 5.000%, 6/15/25 | 6/22 at 100.00 | BBB+ | 6,891,008 |
| 3,480 | | 5.000%, 6/15/26 | 6/22 at 100.00 | BBB+ | 3,742,044 |
| 7,945 | | 5.000%, 6/15/28 | 6/22 at 100.00 | BBB+ | 8,520,854 |
| 415 | | 5.000%, 6/15/29 | 6/22 at 100.00 | BBB+ | 444,424 |
| 5,350 | | New Jersey Economic Development Authority, Lease Revenue Bonds, State House Project, | 12/28 at 100.00 | A– | 6,340,445 |
| | Series 2017B, 4.500%, 6/15/40 | | | |
| 5,495 | | New Jersey Economic Development Authority, Revenue Bonds, Motor Vehicle Surcharge, | 7/27 at 100.00 | BBB+ | 5,884,760 |
| | Refunding Series 2017A, 3.375%, 7/01/30 | | | |
| 6,385 | | New Jersey Economic Development Authority, School Facilities Construction Bonds, Series | 6/24 at 100.00 | A– | 7,344,410 |
| | 2014UU, 5.000%, 6/15/27 | | | |
| 11,345 | | New Jersey Economic Development Authority, School Facilities Construction Bonds, Series | 6/25 at 100.00 | BBB+ | 13,207,509 |
| | 2015WW, 5.250%, 6/15/40 | | | |
| 5,000 | | New Jersey Economic Development Authority, School Facilities Construction Financing | 6/24 at 100.00 | A– | 5,762,350 |
| | Program Bonds, Refunding Series 2014PP, 5.000%, 6/15/26 | | | |
| 6,000 | | New Jersey Economic Development Authority, Sublease Revenue Bonds, New Jersey Transit | No Opt. Call | A– | 7,186,320 |
| | Corporation Projects, Refunding Series 2017B, 5.000%, 11/01/25 | | | |
| | New Jersey Transportation Trust Fund Authority, Federal Highway Reimbursement Revenue | | | |
| | Notes, Series 2016A-1: | | | |
| 1,130 | | 5.000%, 6/15/29 | 6/26 at 100.00 | A+ | 1,360,667 |
| 655 | | 5.000%, 6/15/30 | 6/26 at 100.00 | A+ | 786,007 |
34
| | | | | | |
| Principal | | | Optional Call | | |
| Amount (000) | | Description (1) | Provisions (2) | Ratings (3) | Value |
| | Tax Obligation/Limited (continued) | | | |
| $ 32,965 | | New Jersey Transportation Trust Fund Authority, Transportation System Bonds, Capital | No Opt. Call | A– | $ 25,827,418 |
| | Appreciation Series 2010A, 0.000%, 12/15/30 | | | |
| 8,100 | | New Jersey Transportation Trust Fund Authority, Transportation System Bonds, Refunding | No Opt. Call | A– | 9,062,361 |
| | Series 2006A, 5.500%, 12/15/22 | | | |
| | New Jersey Transportation Trust Fund Authority, Transportation System Bonds, Refunding | | | |
| | Series 2006C: | | | |
| 37,565 | | 0.000%, 12/15/32 – AGM Insured | No Opt. Call | AA | 28,627,535 |
| 39,090 | | 0.000%, 12/15/33 – AGM Insured | No Opt. Call | AA | 28,970,381 |
| 5,160 | | 0.000%, 12/15/34 – AGM Insured | No Opt. Call | AA | 3,717,728 |
| 7,000 | | New Jersey Transportation Trust Fund Authority, Transportation System Bonds, Series | No Opt. Call | A– | 8,214,150 |
| | 2010D, 5.000%, 12/15/24 | | | |
| | New Jersey Transportation Trust Fund Authority, Transportation System Bonds, | | | |
| | Series 2011B: | | | |
| 750 | | 5.500%, 6/15/31 | 6/21 at 100.00 | A– | 791,385 |
| 4,320 | | 5.250%, 6/15/36 | 6/21 at 100.00 | A– | 4,538,419 |
| | New Jersey Transportation Trust Fund Authority, Transportation System Bonds, | | | |
| | Series 2018A: | | | |
| 1,150 | | 5.000%, 12/15/35 | 12/28 at 100.00 | A– | 1,437,178 |
| 440 | | 5.000%, 12/15/36 | 12/28 at 100.00 | A– | 548,684 |
| 4,615 | | 4.250%, 12/15/38 | 12/28 at 100.00 | A– | 5,395,996 |
| 3,025 | | New Jersey Transportation Trust Fund Authority, Transportation System Bonds, Series | 12/28 at 100.00 | A– | 3,526,242 |
| | 2019AA, 4.500%, 6/15/49 | | | |
| 2,050 | | New Jersey Transportation Trust Fund Authority, Transportation System Bonds, Series | 12/28 at 100.00 | A– | 2,189,257 |
| | 2019BB, 3.500%, 6/15/46 | | | |
| 3,860 | | Passaic County Improvement Authority, New Jersey, Lease Revenue Bonds, Preakness | 5/25 at 100.00 | AA | 4,225,195 |
| | Healthcare Center Expansion Project, Refunding Series 2015, 3.750%, 5/01/36 | | | |
| 4,005 | | Passaic County Improvement Authority, New Jersey, Lease Revenue Bonds, Preakness | 5/22 at 100.00 | Aa1 | 4,158,111 |
| | Healthcare Center Expansion Project, Series 2012, 3.500%, 5/01/35 | | | |
| | Union County Improvement Authority, New Jersey, General Obligation Lease Bonds, Juvenile | | | |
| | Detention Center Facility Project, Tender Option Bond Trust 2015-XF1019: | | | |
| 285 | | 20.588%, 5/01/28, 144A (IF) (4) | No Opt. Call | Aaa | 779,059 |
| 285 | | 20.655%, 5/01/29, 144A (IF) (4) | No Opt. Call | Aaa | 831,966 |
| 200 | | 20.655%, 5/01/30, 144A (IF) (4) | No Opt. Call | Aaa | 614,876 |
| 370 | | 20.449%, 5/01/31, 144A (IF) (4) | No Opt. Call | Aaa | 1,186,934 |
| 385 | | 20.556%, 5/01/32, 144A (IF) (4) | No Opt. Call | Aaa | 1,304,111 |
| 400 | | 20.560%, 5/01/33, 144A (IF) (4) | No Opt. Call | Aaa | 1,417,800 |
| 415 | | 20.655%, 5/01/34, 144A (IF) (4) | No Opt. Call | Aaa | 1,540,526 |
| 247.885 | | Total Tax Obligation/Limited | | | 242,952,529 |
| | Transportation – 29.2% (19.8% of Total Investments) | | | |
| 5,550 | | Casino Reinvestment Development Authority, New Jersey, Parking Revenue Bonds, Series | 3/20 at 100.00 | Baa2 | 5,570,091 |
| | 2005A, 5.250%, 6/01/20 – NPFG Insured | | | |
| 2,400 | | Delaware River and Bay Authority, Delaware and New Jersey, Revenue Bonds, Series 2012A, | 1/23 at 100.00 | A1 | 2,630,256 |
| | 5.000%, 1/01/42 | | | |
| | Delaware River and Bay Authority, Delaware and New Jersey, Revenue Bonds, Series 2014A: | | | |
| 1,285 | | 5.000%, 1/01/34 | 1/24 at 100.00 | A1 | 1,465,748 |
| 5,890 | | 4.125%, 1/01/39 | 1/24 at 100.00 | A1 | 6,470,283 |
| 7,800 | | 5.000%, 1/01/44 | 1/24 at 100.00 | A1 | 8,811,426 |
| 2,580 | | Delaware River and Bay Authority, Delaware and New Jersey, Revenue Bonds, Series 2019, | 1/29 at 100.00 | A1 | 3,054,978 |
| | 4.000%, 1/01/44 | | | |
| | Delaware River Joint Toll Bridge Commission, New Jersey and Pennsylvania, Bridge System | | | |
| | Revenue Bonds, Refunding Series 2015: | | | |
| 1,000 | | 4.000%, 7/01/34 – BAM Insured | 7/25 at 100.00 | AA | 1,124,310 |
| 2,820 | | 4.000%, 7/01/35 – BAM Insured | 7/25 at 100.00 | AA | 3,166,550 |
35
| | |
| NXJ | Nuveen New Jersey Quality Municipal Income Fund |
| Portfolio of Investments (continued) |
| February 29, 2020 |
| | | | | | |
| Principal | | | Optional Call | | |
| Amount (000) | | Description (1) | Provisions (2) | Ratings (3) | Value |
| | Transportation (continued) | | | |
| | Delaware River Joint Toll Bridge Commission, New Jersey and Pennsylvania, Bridge System | | | |
| | Revenue Bonds, Refunding Series 2019B: | | | |
| $ 2,005 | | 5.000%, 7/01/28 | No Opt. Call | A1 | $ 2,642,690 |
| 1,520 | | 5.000%, 7/01/29 | No Opt. Call | A1 | 2,049,355 |
| | Delaware River Joint Toll Bridge Commission, New Jersey and Pennsylvania, Bridge System | | | |
| | Revenue Bonds, Series 2017: | | | |
| 2,820 | | 5.000%, 7/01/42 | 7/27 at 100.00 | A1 | 3,496,123 |
| 10,210 | | 5.000%, 7/01/47 | 7/27 at 100.00 | A1 | 12,558,300 |
| | Delaware River Joint Toll Bridge Commission, New Jersey and Pennsylvania, Bridge System | | | |
| | Revenue Bonds, Series 2019A: | | | |
| 1,050 | | 5.000%, 7/01/28 | No Opt. Call | A1 | 1,382,966 |
| 1,350 | | 5.000%, 7/01/29 | No Opt. Call | A1 | 1,820,151 |
| 950 | | 5.000%, 7/01/30 | 7/29 at 100.00 | A1 | 1,270,692 |
| 7,035 | | Delaware River Port Authority, New Jersey and Pennsylvania, Revenue Bonds, Series 2013, | 1/24 at 100.00 | A+ | 8,004,212 |
| | 5.000%, 1/01/40 | | | |
| 2,325 | | Delaware River Port Authority, New Jersey and Pennsylvania, Revenue Bonds, Series 2018A, | 1/29 at 100.00 | A+ | 3,010,968 |
| | 5.000%, 1/01/37 | | | |
| | Delaware River Port Authority, Pennsylvania and New Jersey, Revenue Refunding Bonds, | | | |
| | Port District Project, Series 2012: | | | |
| 1,800 | | 5.000%, 1/01/24 | 1/23 at 100.00 | A | 1,988,946 |
| 1,635 | | 5.000%, 1/01/25 | 1/23 at 100.00 | A | 1,806,135 |
| 1,875 | | 5.000%, 1/01/26 | 1/23 at 100.00 | A | 2,069,119 |
| 3,525 | | 5.000%, 1/01/27 | 1/23 at 100.00 | A | 3,884,761 |
| 5,555 | | New Jersey Economic Development Authority, Private Activity Bonds, The Goethals Bridge | 1/24 at 100.00 | BBB | 6,332,978 |
| | Replacement Project, Series 2013, 5.625%, 1/01/52 (AMT) | | | |
| | New Jersey Economic Development Authority, Special Facilities Revenue Bonds, Continental | | | |
| | Airlines Inc, Series 1999: | | | |
| 1,000 | | 5.125%, 9/15/23 (AMT) | 8/22 at 101.00 | BB | 1,078,040 |
| 1,800 | | 5.250%, 9/15/29 (AMT) | 8/22 at 101.00 | BB | 1,980,900 |
| 2,250 | | New Jersey Economic Development Authority, Special Facilities Revenue Bonds, | 3/24 at 101.00 | BB | 2,609,595 |
| | Continental Airlines Inc, Series 2000A & 2000B, 5.625%, 11/15/30 (AMT) | | | |
| | New Jersey Economic Development Authority, Special Facility Revenue Bonds, Port Newark | | | |
| | Container Terminal LLC Project, Refunding Series 2017: | | | |
| 5,660 | | 5.000%, 10/01/37 (AMT) | 10/27 at 100.00 | Ba1 | 6,780,680 |
| 7,440 | | 5.000%, 10/01/47 (AMT) | 10/27 at 100.00 | Ba1 | 8,763,130 |
| | New Jersey Transit Corporation, Grant Anticipation Notes, Federal Transit Administration | | | |
| | Section 5307 Urbanized Area Formula Funds, Series 2014A: | | | |
| 6,000 | | 5.000%, 9/15/20 | No Opt. Call | A | 6,127,320 |
| 5,750 | | 5.000%, 9/15/21 | No Opt. Call | A | 6,099,082 |
| 6,570 | | New Jersey Turnpike Authority, Revenue Bonds, Refunding Series 2015E, 5.000%, 1/01/45 | 1/25 at 100.00 | A+ | 7,759,696 |
| 3,065 | | New Jersey Turnpike Authority, Revenue Bonds, Series 2005A, 5.250%, 1/01/29 – | No Opt. Call | AA | 4,169,473 |
| | AGM Insured | | | |
| 7,620 | | New Jersey Turnpike Authority, Revenue Bonds, Series 2012B, 5.000%, 1/01/28 | 1/23 at 100.00 | A+ | 8,487,994 |
| 3,625 | | New Jersey Turnpike Authority, Revenue Bonds, Tender Option Bond Trust 2016-XF1057, | 7/22 at 100.00 | A+ | 5,007,321 |
| | 14.147%, 1/01/43, 144A (IF) (4) | | | |
| 2,750 | | Passaic County Improvement Authority, New Jersey, Revenue Bonds, Paterson Parking Deck | 3/20 at 100.00 | A2 | 2,758,470 |
| | Facility, Series 2005, 5.000%, 4/15/35 – AGM Insured | | | |
| 7,235 | | Port Authority of New York and New Jersey, Consolidated Revenue Bonds, One Hundred | 12/23 at 100.00 | AA– | 8,276,261 |
| | Seventy Ninth Series 2013, 5.000%, 12/01/43 | | | |
| 5,000 | | Port Authority of New York and New Jersey, Consolidated Revenue Bonds, One Hundred | 1/23 at 100.00 | AA– | 5,343,150 |
| | Seventy Seventh Series 2013, 4.000%, 1/15/43 (AMT) | | | |
| 12,000 | | Port Authority of New York and New Jersey, Consolidated Revenue Bonds, Two Hundred | 11/29 at 100.00 | AA– | 14,181,480 |
| | Eighteen Series 2019, 4.000%, 11/01/47 (AMT) (UB) (4) | | | |
36
| | | | | | |
| Principal | | | Optional Call | | |
| Amount (000) | | Description (1) | Provisions (2) | Ratings (3) | Value |
| | Transportation (continued) | | | |
| | Port Authority of New York and New Jersey, Consolidated Revenue Bonds, Two Hundred | | | |
| | Fourteen Series 2019: | | | |
| $ 2,000 | | 4.000%, 9/01/37 (AMT) (UB) (4) | 9/29 at 100.00 | AA– | $ 2,407,640 |
| 2,500 | | 4.000%, 9/01/38 (AMT) (UB) (4) | 9/29 at 100.00 | AA– | 3,000,100 |
| 2,500 | | 4.000%, 9/01/39 (AMT) (UB) (4) | 9/29 at 100.00 | AA– | 2,992,875 |
| | Port Authority of New York and New Jersey, Special Project Bonds, JFK International Air | | | |
| | Terminal LLC, Sixth Series 1997: | | | |
| 12,445 | | 5.750%, 12/01/22 – NPFG Insured (AMT) | 3/20 at 100.00 | BBB+ | 12,804,909 |
| 12,130 | | 5.750%, 12/01/25 – NPFG Insured (AMT) | 3/20 at 100.00 | BBB+ | 12,492,566 |
| 182,320 | | Total Transportation | | | 207,731,720 |
| | U.S. Guaranteed – 10.9% (7.4% of Total Investments) (5) | | | |
| | Delaware River Joint Toll Bridge Commission, Pennsylvania, Bridge System Revenue Bonds, | | | |
| | Refunding Series 2012A: | | | |
| 2,150 | | 5.000%, 7/01/24 (Pre-refunded 7/01/22) | 7/22 at 100.00 | A1 | 2,356,250 |
| 650 | | 4.000%, 7/01/26 (Pre-refunded 7/01/22) | 7/22 at 100.00 | A1 | 697,398 |
| 625 | | 4.000%, 7/01/27 (Pre-refunded 7/01/22) | 7/22 at 100.00 | A1 | 670,575 |
| 25 | | Essex County Improvement Authority, New Jersey, Project Consolidation Revenue Bonds, | No Opt. Call | Aaa | 28,108 |
| | Refunding Series 2007, 5.250%, 12/15/22 – AMBAC Insured (ETM) | | | |
| 2,280 | | Monroe Township Board of Education, Middlesex County, New Jersey, General Obligation | 3/25 at 100.00 | AA– | 2,747,924 |
| | Bonds, Refunding Series 2015, 5.000%, 3/01/38 (Pre-refunded 3/01/25) | | | |
| 655 | | New Jersey Economic Development Authority, School Facilities Construction Bonds, Series | 6/25 at 100.00 | N/R | 805,486 |
| | 2015WW, 5.250%, 6/15/40 (Pre-refunded 6/15/25) | | | |
| | New Jersey Economic Development Authority, Student Housing Revenue Bonds, Provident | | | |
| | Group-Montclair Properties LLC, Montclair State University Student Housing Project, Series 2010A: | | | |
| 3,870 | | 5.750%, 6/01/31 (Pre-refunded 6/01/20) | 6/20 at 100.00 | N/R | 3,917,407 |
| 2,100 | | 5.875%, 6/01/42 (Pre-refunded 6/01/20) | 6/20 at 100.00 | N/R | 2,126,355 |
| 70 | | New Jersey Environmental Infrastructure Trust, Environmental Infrastructure Bonds, | No Opt. Call | N/R | 73,353 |
| | Refunding Series 2012A-R, 4.000%, 9/01/21 (ETM) | | | |
| 30 | | New Jersey Environmental Infrastructure Trust, Environmental Infrastructure Bonds, | 9/21 at 100.00 | N/R | 31,058 |
| | Series 2012A, 3.250%, 9/01/31 (Pre-refunded 9/01/21) | | | |
| | New Jersey Health Care Facilities Financing Authority, Revenue Bonds, Kennedy Health | | | |
| | System Obligated Group Issue, Refunding Series 2012: | | | |
| 4,165 | | 3.750%, 7/01/27 (ETM) | No Opt. Call | N/R | 4,763,552 |
| 3,375 | | 5.000%, 7/01/31 (Pre-refunded 7/01/22) | 7/22 at 100.00 | N/R | 3,702,881 |
| 1,500 | | 5.000%, 7/01/37 (Pre-refunded 7/01/22) | 7/22 at 100.00 | N/R | 1,645,725 |
| | New Jersey Health Care Facilities Financing Authority, Revenue Bonds, Palisades Medical | | | |
| | Center Obligated Group Issue, Refunding Series 2013: | | | |
| 555 | | 5.250%, 7/01/31 (Pre-refunded 7/01/23) | 7/23 at 100.00 | N/R | 635,148 |
| 2,570 | | 5.250%, 7/01/31 (Pre-refunded 7/01/23) | 7/23 at 100.00 | N/R | 2,945,708 |
| 275 | | 5.500%, 7/01/43 (Pre-refunded 7/01/23) | 7/23 at 100.00 | N/R | 316,965 |
| 1,285 | | 5.500%, 7/01/43 (Pre-refunded 7/01/23) | 7/23 at 100.00 | N/R | 1,483,378 |
| 7,670 | | New Jersey Health Care Facilities Financing Authority, Revenue Bonds, Saint Barnabas | 7/21 at 100.00 | N/R | 8,155,588 |
| | Health Care System, Refunding Series 2011A, 5.625%, 7/01/37 (Pre-refunded 7/01/21) | | | |
| 3,805 | | New Jersey Health Care Facilities Financing Authority, Revenue Bonds, St Clare’s | 5/20 at 100.00 | AA | 3,860,629 |
| | Hospital, Series 2004A, 5.250%, 7/01/20 – RAAI Insured (ETM) | | | |
| | New Jersey Institute of Technology, New Jersey, General Obligation Bonds, Series 2012A: | | | |
| 175 | | 5.000%, 7/01/42 (Pre-refunded 7/01/22) | 7/22 at 100.00 | N/R | 192,001 |
| 400 | | 5.000%, 7/01/42 (Pre-refunded 7/01/22) | 7/22 at 100.00 | A1 | 438,860 |
| 1,555 | | New Jersey Sports and Exposition Authority, Convention Center Luxury Tax Bonds, Series | No Opt. Call | Baa2 | 1,698,340 |
| | 2004, 5.500%, 3/01/22 – NPFG Insured (ETM) | | | |
| | New Jersey Transportation Trust Fund Authority, Transportation System Bonds, | | | |
| | Series 2011A: | | | |
| 145 | | 6.000%, 6/15/35 (Pre-refunded 6/15/21) | 6/21 at 100.00 | A– | 154,644 |
| 1,220 | | 5.500%, 6/15/41 (Pre-refunded 6/15/21) | 6/21 at 100.00 | A– | 1,293,529 |
37
| | |
| NXJ | Nuveen New Jersey Quality Municipal Income Fund |
| Portfolio of Investments (continued) |
| February 29, 2020 |
| | | | | | |
| Principal | | | Optional Call | | |
| Amount (000) | | Description (1) | Provisions (2) | Ratings (3) | Value |
| | U.S. Guaranteed (5) (continued) | | | |
| | New Jersey Transportation Trust Fund Authority, Transportation System Bonds, Series 2011B: | | | |
| $ 445 | | 5.000%, 6/15/37 (Pre-refunded 6/15/21) | 6/21 at 100.00 | A– | $ 468,986 |
| 2,680 | | 5.000%, 6/15/42 (Pre-refunded 6/15/21) | 6/21 at 100.00 | A– | 2,824,452 |
| | North Hudson Sewerage Authority, New Jersey, Gross Revenue Lease Certificates, Senior | | | |
| | Lien Series 2012A: | | | |
| 1,455 | | 5.000%, 6/01/27 (Pre-refunded 6/01/22) | 6/22 at 100.00 | N/R | 1,593,036 |
| 2,365 | | 5.000%, 6/01/27 (Pre-refunded 6/01/22) | 6/22 at 100.00 | A+ | 2,583,810 |
| 225 | | 5.000%, 6/01/42 (Pre-refunded 6/01/22) | 6/22 at 100.00 | N/R | 246,346 |
| 3,775 | | 5.000%, 6/01/42 (Pre-refunded 6/01/22) | 6/22 at 100.00 | A+ | 4,128,717 |
| 15,840 | | North Hudson Sewerage Authority, New Jersey, Sewerage Revenue Refunding Bonds, Series | No Opt. Call | Baa2 | 15,289,402 |
| | 2001A, 0.000%, 8/01/23 – NPFG Insured (ETM) | | | |
| 2,100 | | Passaic County Improvement Authority, New Jersey, County Guaranteed Parking Revenue | 5/20 at 100.00 | Aa1 | 2,114,427 |
| | Bonds, 200 Hospital Plaza Project, Series 2010, 5.000%, 5/01/42 (Pre-refunded 5/01/20) | | | |
| 2,170 | | Rutgers State University, New Jersey, Revenue Bonds, Tender Option Bond 2016-XF2356, | 5/23 at 100.00 | Aa3 | 3,324,418 |
| | 15.088%, 5/01/43, (Pre-refunded 5/01/23), 144A (IF) (4) | | | |
| 72,205 | | Total U.S. Guaranteed | | | 77,314,456 |
| | Utilities – 4.7% (3.1% of Total Investments) | | | |
| 13,500 | | Essex County Improvement Authority, New Jersey, Solid Waste Disposal Revenue Bonds, | 7/20 at 100.00 | BB– | 13,675,770 |
| | Covanta Project, Series 2015, 5.250%, 7/01/45 (AMT), 144A | | | |
| 1,510 | | Industrial Pollution Control Financing Authority of Cape May County (New Jersey), | No Opt. Call | A | 1,594,122 |
| | Pollution Control Revenue Refunding Bonds, 1991 Series A (Atlantic City Electric Company | | | |
| | Project), 6.800%, 3/01/21 – NPFG Insured | | | |
| | New Jersey Economic Development Authority, Energy Facilities Revenue Bonds, UMM Energy | | | |
| | Partners, LLC Project, Series 2012A: | | | |
| 1,000 | | 4.750%, 6/15/32 (AMT) | 6/22 at 100.00 | Baa2 | 1,066,590 |
| 1,225 | | 5.125%, 6/15/43 (AMT) | 6/22 at 100.00 | Baa2 | 1,311,559 |
| 1,850 | | New Jersey Economic Development Authority, Natural Gas Facilities Revenue Bonds, New | 8/24 at 100.00 | Aa3 | 1,881,135 |
| | Jersey Natural Gas Company Project, Refunding Series 2011A, 2.750%, 8/01/39 | | | |
| 5,100 | | New Jersey Economic Development Authority, Water Facilities Revenue Bonds, New | 5/20 at 100.00 | A+ | 5,134,425 |
| | Jersey-American Water Company Inc Project, Refunding Series 2010B, 5.600%, 11/01/34 (AMT) | | | |
| 2,040 | | New Jersey Economic Development Authority, Water Facilities Revenue Bonds, New | 11/20 at 100.00 | A+ | 2,084,819 |
| | Jersey-American Water Company Inc Project, Refunding Series 2010D, 4.875%, 11/01/29 (AMT) | | | |
| 2,700 | | Passaic County Utilities Authority, New Jersey, Solid Waste Disposal Revenue Bonds, | No Opt. Call | AA | 3,842,181 |
| | Refunding Series 2018, 5.000%, 3/01/37 | | | |
| 2,305 | | Salem County Pollution Control Financing Authority, New Jersey, Pollution Control | No Opt. Call | BBB | 2,492,950 |
| | Revenue Bonds, Chambers Project, Refunding Series 2014A, 5.000%, 12/01/23 (AMT) | | | |
| 31,230 | | Total Utilities | | | 33,083,551 |
| | Water and Sewer – 2.9% (2.0% of Total Investments) | | | |
| 15,670 | | New Jersey Economic Development Authority, Water Facilities Revenue Bonds, Middlesex | 10/22 at 100.00 | A+ | 16,455,537 |
| | Water Company, Series 2012C, 4.250%, 10/01/47 (AMT) | | | |
| 2,355 | | New Jersey Economic Development Authority, Water Facilities Revenue Bonds, Middlesex | 8/29 at 100.00 | A+ | 2,657,076 |
| | Water Company, Series 2019, 4.000%, 8/01/59 (AMT) | | | |
| | New Jersey Environmental Infrastructure Trust, Environmental Infrastructure Bonds, | | | |
| | Series 2012A: | | | |
| 65 | | 3.250%, 9/01/31 | No Opt. Call | N/R | 67,292 |
| 1,585 | | 3.250%, 9/01/31 | No Opt. Call | N/R | 1,624,894 |
| 19,675 | | Total Water and Sewer | | | 20,804,799 |
| $ 964,721 | | Total Long-Term Investments (cost $934,297,090) | | | 1,051,362,380 |
| | Floating Rate Obligations – (4.9)% | | | (34,780,000) |
| | Variable Rate Demand Preferred Shares, net of deferred offering costs – (44.0)% (6) | | | (312,500,511) |
| | Other Assets Less Liabilities – 0.9% (7) | | | 6,354,701 |
| | Net Assets Applicable to Common Shares – 100% | | | $ 710,436,570 |
38
Investments in Derivatives
Futures Contracts
| | | | | | | | |
| | | | | | | Variation |
| | | | | | Unrealized | Margin |
| Contract | Number of | Expiration | Notional | | Appreciation | Receivable/ |
| Description | Position | Contracts | Date | Amount | Value | (Depreciation) | (Payable) |
U.S. Treasury 10-Year Note | Short | (98) | 6/20 | $(13,002,059) | $(13,205,500) | $(203,441) | $ (139,344) |
| | |
(1) | All percentages shown in the Portfolio of Investments are based on net assets applicable to common shares unless otherwise noted. |
(2) | Optional Call Provisions: Dates (month and year) and prices of the earliest optional call or redemption. There may be other call provisions at varying prices at later dates. Certain mortgage-backed securities may be subject to periodic principal paydowns. Optional Call Provisions are not covered by the report of independent registered public accounting firm. |
(3) | For financial reporting purposes, the ratings disclosed are the highest of Standard & Poor’s Group (“Standard & Poor’s”), Moody’s Investors Service, Inc. (“Moody’s”) or Fitch, Inc. (“Fitch”) rating. This treatment of split-rated securities may differ from that used for other purposes, such as for Fund investment policies. Ratings below BBB by Standard & Poor’s, Baa by Moody’s or BBB by Fitch are considered to be below investment grade. Holdings designated N/R are not rated by any of these national rating agencies. Ratings are not covered by the report of independent registered public accounting firm. |
(4) | Investment, or portion of investment, has been pledged to collateralize the net payment obligations for investments in inverse floating rate transactions. |
(5) | Backed by an escrow or trust containing sufficient U.S. Government or U.S. Government agency securities, which ensure the timely payment of principal and interest. |
(6) | Variable Rate Demand Preferred Shares, net of deferred offering costs as a percentage of Total Investments is 29.7%. |
(7) | Other assets less liabilities includes the unrealized appreciation (depreciation) of certain over-the-counter (“OTC”) derivatives as presented on the Statement of Assets and Liabilities, when applicable. The unrealized appreciation (depreciation) of OTC cleared and exchange-traded derivatives is recognized as part of the cash collateral at brokers and/or the receivable or payable for variation margin as presented on the Statement of Assets and Liabilities, when applicable. |
144A | Investment is exempt from registration under Rule 144A of the Securities Act of 1933, as amended. These investments may only be resold in transactions exempt from registration, which are normally those transactions with qualified institutional buyers. |
AMT | Alternative Minimum Tax |
ETM | Escrowed to maturity |
IF | Inverse floating rate security issued by a tender option bond (“TOB”) trust, the interest rate on which varies inversely with the Securities Industry Financial Markets Association (SIFMA) short-term rate, which resets weekly, or a similar short-term rate, and is reduced by the expenses related to the TOB trust. |
UB | Underlying bond of an inverse floating rate trust reflected as a financing transaction. See Notes to Financial Statements, Note 4 – Portfolio Securities and Investments in Derivatives, Inverse Floating Rate Securities for more information. |
WI/DD | Purchased on a when-issued or delayed delivery basis. |
| See accompanying notes to financial statements. |
39
| | |
| NJV | Nuveen New Jersey Municipal Value Fund |
| Portfolio of Investments |
| February 29, 2020 |
| | | | | | |
| Principal | | | Optional Call | | |
| Amount (000) | | Description (1) | Provisions (2) | Ratings (3) | Value |
| | LONG-TERM INVESTMENTS – 103.1% (100.0% of Total Investments) | | | |
| | MUNICIPAL BONDS – 103.1% (100.0% of Total Investments) | | | |
| | Consumer Discretionary – 0.3% (0.3% of Total Investments) | | | |
| $ 100 | | Middlesex County Improvement Authority, New Jersey, Senior Revenue Bonds, Heldrich | 3/20 at 100.00 | Caa2 | $ 82,670 |
| | Center Hotel/Conference Center Project, Series 2005A, 5.000%, 1/01/32 | | | |
| | Consumer Staples – 3.2% (3.1% of Total Investments) | | | |
| | Tobacco Settlement Financing Corporation, New Jersey, Tobacco Settlement Asset-Backed | | | |
| | Bonds, Series 2018A: | | | |
| 215 | | 4.000%, 6/01/37 | 6/28 at 100.00 | A– | 247,719 |
| 305 | | 5.250%, 6/01/46 | 6/28 at 100.00 | BBB+ | 378,676 |
| 125 | | Tobacco Settlement Financing Corporation, New Jersey, Tobacco Settlement Asset-Backed | 6/28 at 100.00 | BB+ | 147,331 |
| | Bonds, Series 2018B, 5.000%, 6/01/46 | | | |
| 645 | | Total Consumer Staples | | | 773,726 |
| | Education and Civic Organizations – 17.0% (16.5% of Total Investments) | | | |
| 110 | | Camden County Improvement Authority, New Jersey, Lease Revenue Bonds, Rowan University | 12/23 at 100.00 | A | 125,034 |
| | School of Osteopathic Medicine Project, Refunding Series 2013A, 5.000%, 12/01/32 | | | |
| 25 | | New Jersey Economic Development Authority, Charter School Revenue Bonds, Foundation | 1/28 at 100.00 | BBB– | 29,664 |
| | Academy Charter School, Series 2018A, 5.000%, 7/01/38 | | | |
| | New Jersey Economic Development Authority, Charter School Revenue Bonds, North Star | | | |
| | Academy Charter School of Newark, Series 2017: | | | |
| 220 | | 4.000%, 7/15/37 | 7/27 at 100.00 | BBB– | 240,623 |
| 25 | | 5.000%, 7/15/47 | 7/27 at 100.00 | BBB– | 29,191 |
| 100 | | New Jersey Economic Development Authority, Charter School Revenue Bonds, Teaneck | 9/27 at 100.00 | BB | 112,808 |
| | Community Charter School, Series 2017A, 5.125%, 9/01/52, 144A | | | |
| 115 | | New Jersey Economic Development Authority, Revenue Bonds, The Seeing Eye Inc, Refunding | No Opt. Call | A | 136,970 |
| | Series 2015, 5.000%, 3/01/25 | | | |
| | New Jersey Economic Development Authority, Revenue Bonds, The Seeing Eye Inc, Refunding | | | |
| | Series 2017: | | | |
| 15 | | 5.000%, 6/01/32 | 12/27 at 100.00 | A | 18,863 |
| 20 | | 3.000%, 6/01/32 | 12/27 at 100.00 | A | 21,593 |
| 45 | | New Jersey Economic Development Authority, Rutgers University General Obligation Lease | 6/23 at 100.00 | Aa3 | 65,776 |
| | Revenue Bonds, Tender Option Bond 2016-XF2357, 14.783%, 6/15/46, 144A (IF) (4) | | | |
| 185 | | New Jersey Educational Facilities Authority, Revenue Bonds, College of New Jersey, | 7/26 at 100.00 | A+ | 195,103 |
| | Refunding Series 2016F, 3.000%, 7/01/40 | | | |
| 100 | | New Jersey Educational Facilities Authority, Revenue Bonds, Kean University, Refunding | 7/25 at 100.00 | AA | 111,163 |
| | Series 2015H, 4.000%, 7/01/39 – AGM Insured | | | |
| 50 | | New Jersey Educational Facilities Authority, Revenue Bonds, Montclair State University, | 7/24 at 100.00 | A+ | 56,983 |
| | Series 2014A, 5.000%, 7/01/44 | | | |
| | New Jersey Educational Facilities Authority, Revenue Bonds, Rider University, | | | |
| | Series 2012A: | | | |
| 100 | | 5.000%, 7/01/32 | 7/21 at 100.00 | Baa2 | 104,498 |
| 30 | | 5.000%, 7/01/37 | 7/21 at 100.00 | Baa2 | 31,281 |
| | New Jersey Educational Facilities Authority, Revenue Bonds, Rider University, | | | |
| | Series 2017F: | | | |
| 5 | | 3.750%, 7/01/37 | 7/27 at 100.00 | Baa2 | 5,360 |
| 100 | | 4.000%, 7/01/42 | 7/27 at 100.00 | Baa2 | 108,390 |
| 100 | | 5.000%, 7/01/47 | 7/27 at 100.00 | Baa2 | 116,832 |
| 75 | | New Jersey Educational Facilities Authority, Revenue Bonds, Seton Hall University, | 7/23 at 100.00 | A– | 83,460 |
| | Series 2013D, 5.000%, 7/01/38 | | | |
40
| | | | | | |
| Principal | | | Optional Call | | |
| Amount (000) | | Description (1) | Provisions (2) | Ratings (3) | Value |
| | Education and Civic Organizations (continued) | | | |
| | New Jersey Educational Facilities Authority, Revenue Bonds, Seton Hall University, | | | |
| | Series 2016C: | | | |
| $ 435 | | 3.000%, 7/01/41 | 7/26 at 100.00 | A– | $ 457,102 |
| 50 | | 3.000%, 7/01/46 | 7/26 at 100.00 | A– | 52,172 |
| 25 | | 4.000%, 7/01/46 | 7/26 at 100.00 | A– | 27,723 |
| | New Jersey Educational Facilities Authority, Revenue Bonds, Stevens Institute of | | | |
| | Technology, Series 2017A: | | | |
| 30 | | 5.000%, 7/01/47 | 7/27 at 100.00 | BBB+ | 36,807 |
| 200 | | 4.000%, 7/01/47 | 7/27 at 100.00 | BBB+ | 228,396 |
| 25 | | New Jersey Educational Facilities Authority, Revenue Bonds, The College of Saint | 7/26 at 100.00 | BB | 27,363 |
| | Elizabeth, Series 2016D, 5.000%, 7/01/46 | | | |
| 265 | | New Jersey Higher Education Assistance Authority, Senior Student Loan Revenue Bonds, | 6/28 at 100.00 | Aaa | 303,833 |
| | Refunding Series 2018A, 4.000%, 12/01/35 (AMT) | | | |
| 100 | | New Jersey Higher Education Assistance Authority, Student Loan Revenue Bonds, Refunding | 6/28 at 100.00 | Aa1 | 103,084 |
| | Senior Series 2019A, 2.375%, 12/01/29 | | | |
| 20 | | New Jersey Higher Education Assistance Authority, Student Loan Revenue Bonds, Senior | 12/25 at 100.00 | Aaa | 20,598 |
| | Lien Series 2016-1A, 2.750%, 12/01/27 (AMT) | | | |
| 200 | | New Jersey Higher Education Assistance Authority, Student Loan Revenue Bonds, Senior | 12/26 at 100.00 | Aaa | 222,344 |
| | Lien Series 2017-1A, 4.000%, 12/01/40 (AMT) | | | |
| 150 | | New Jersey Higher Education Assistance Authority, Student Loan Revenue Bonds, Senior | 6/28 at 100.00 | Aa1 | 159,644 |
| | Series 2019B, 3.250%, 12/01/39 (AMT) | | | |
| 30 | | New Jersey Higher Education Assistance Authority, Student Loan Revenue Bonds, Series | 12/20 at 100.00 | Aaa | 30,923 |
| | 2010-2, 5.000%, 12/01/30 | | | |
| 100 | | New Jersey Higher Education Assistance Authority, Student Loan Revenue Bonds, Series | 12/22 at 100.00 | Aaa | 111,365 |
| | 2012-1B, 5.750%, 12/01/39 (AMT) | | | |
| 100 | | New Jersey Higher Education Assistance Authority, Student Loan Revenue Bonds, Series | 12/22 at 100.00 | Aaa | 106,541 |
| | 2013-1A, 4.000%, 12/01/28 (AMT) | | | |
| 180 | | New Jersey Higher Education Assistance Authority, Student Loan Revenue Bonds, Series | 12/24 at 100.00 | Aaa | 198,761 |
| | 2015-1A, 4.000%, 12/01/30 (AMT) | | | |
| 160 | | New Jersey Higher Education Assistance Authority, Student Loan Revenue Bonds, | 6/28 at 100.00 | A2 | 171,014 |
| | Subordinate Series 2019C, 3.625%, 12/01/49 (AMT) | | | |
| 49 | | New Jersey Higher Education Assistance Authority, Student Loan Revenue Bonds, Tender | 12/22 at 100.00 | Aaa | 59,934 |
| | Option Bond Trust 2015-XF0151, 8.658%, 12/01/23 (AMT), 144A (IF) (4) | | | |
| 200 | | New Jersey Institute of Technology, New Jersey, General Obligation Bonds, Series 2015A, | 7/25 at 100.00 | A1 | 235,896 |
| | 5.000%, 7/01/45 | | | |
| 3,739 | | Total Education and Civic Organizations | | | 4,147,092 |
| | Health Care – 14.5% (14.1% of Total Investments) | | | |
| | Camden County Improvement Authority, New Jersey, Health Care Redevelopment Revenue | | | |
| | Bonds, Cooper Health System Obligated Group Issue, Refunding Series 2014A: | | | |
| 105 | | 5.000%, 2/15/25 | 2/24 at 100.00 | BBB+ | 120,380 |
| 100 | | 5.000%, 2/15/34 | 2/24 at 100.00 | BBB+ | 113,744 |
| 105 | | Camden County Improvement Authority, New Jersey, Health Care Redevelopment Revenue | 2/23 at 100.00 | BBB+ | 117,543 |
| | Bonds, Cooper Health System Obligated Group Issue, Series 2013A, 5.750%, 2/15/42 | | | |
| 200 | | New Jersey Health Care Facilities Financing Authority, New Jersey, Revenue Bonds, Saint | 7/21 at 100.00 | BB+ | 211,252 |
| | Peters University Hospital, Refunding Series 2011, 6.250%, 7/01/35 | | | |
| 80 | | New Jersey Health Care Facilities Financing Authority, Revenue Bonds, AHS Hospital | 1/27 at 100.00 | AA– | 91,275 |
| | Corporation, Refunding Series 2016, 4.000%, 7/01/41 | | | |
| 230 | | New Jersey Health Care Facilities Financing Authority, Revenue Bonds, Barnabas Health, | 7/24 at 100.00 | AA– | 267,030 |
| | Refunding Series 2014A, 5.000%, 7/01/44 | | | |
| | New Jersey Health Care Facilities Financing Authority, Revenue Bonds, Hackensack | | | |
| | Meridian Health Obligated Group, Refunding Series 2017A: | | | |
| 150 | | 5.000%, 7/01/28 | 7/27 at 100.00 | AA– | 191,578 |
| 150 | | 5.000%, 7/01/57 | 7/27 at 100.00 | AA– | 181,500 |
41
| | |
| NJV | Nuveen New Jersey Municipal Value Fund |
| Portfolio of Investments (continued) |
| February 29, 2020 |
| | | | | | |
| Principal | | | Optional Call | | |
| Amount (000) | | Description (1) | Provisions (2) | Ratings (3) | Value |
| | Health Care (continued) | | | |
| $ 110 | | New Jersey Health Care Facilities Financing Authority, Revenue Bonds, Hunterdon Medical | 7/24 at 100.00 | A+ | $ 117,502 |
| | Center, Refunding Series 2014A, 4.000%, 7/01/45 | | | |
| 45 | | New Jersey Health Care Facilities Financing Authority, Revenue Bonds, Inspira Health | 7/26 at 100.00 | AA– | 50,789 |
| | Obligated Group Issue, Refunding Series 2016A, 4.000%, 7/01/41 | | | |
| 360 | | New Jersey Health Care Facilities Financing Authority, Revenue Bonds, Inspira Health | 7/27 at 100.00 | AA– | 439,337 |
| | Obligated Group Issue, Series 2017A, 5.000%, 7/01/42 (UB) (4) | | | |
| 20 | | New Jersey Health Care Facilities Financing Authority, Revenue Bonds, Meridian Health | No Opt. Call | AA– | 21,077 |
| | System Obligated Group, Refunding Series 2011, 5.000%, 7/01/21 | | | |
| | New Jersey Health Care Facilities Financing Authority, Revenue Bonds, Princeton | | | |
| | HealthCare System, Series 2016A: | | | |
| 25 | | 5.000%, 7/01/32 | 7/26 at 100.00 | AA | 31,061 |
| 40 | | 5.000%, 7/01/33 | 7/26 at 100.00 | AA | 49,668 |
| 30 | | 5.000%, 7/01/34 | 7/26 at 100.00 | AA | 37,217 |
| 130 | | New Jersey Health Care Facilities Financing Authority, Revenue Bonds, Robert Wood | 7/24 at 100.00 | AA– | 151,828 |
| | Johnson University Hospital Issue, Series 2014A, 5.000%, 7/01/39 | | | |
| 110 | | New Jersey Health Care Facilities Financing Authority, Revenue Bonds, Robert Wood | 7/23 at 100.00 | AA– | 124,608 |
| | Johnson University Hospital, Series 2013A, 5.500%, 7/01/43 | | | |
| 100 | | New Jersey Health Care Facilities Financing Authority, Revenue Bonds, RWJ Barnabas | 7/26 at 100.00 | AA– | 122,840 |
| | Health Obligated Group, Refunding Series 2016A, 5.000%, 7/01/43 | | | |
| | New Jersey Health Care Facilities Financing Authority, Revenue Bonds, Saint Joseph’s | | | |
| | Healthcare System Obligated Group Issue, Refunding Series 2016: | | | |
| 10 | | 3.000%, 7/01/32 | 7/26 at 100.00 | BBB– | 10,349 |
| 405 | | 4.000%, 7/01/48 | 7/26 at 100.00 | BBB– | 444,115 |
| 100 | | New Jersey Health Care Facilities Financing Authority, Revenue Bonds, Saint Luke’s | 8/23 at 100.00 | A– | 107,787 |
| | Warren Hospital Obligated Group, Series 2013, 4.000%, 8/15/37 | | | |
| | New Jersey Health Care Facilities Financing Authority, Revenue Bonds, University | | | |
| | Hospital Issue, Refunding Series 2015A: | | | |
| 130 | | 4.125%, 7/01/38 – AGM Insured | 7/25 at 100.00 | AA | 143,866 |
| 110 | | 5.000%, 7/01/46 – AGM Insured | 7/25 at 100.00 | AA | 126,721 |
| | New Jersey Health Care Facilities Financing Authority, Revenue Bonds, Valley Health | | | |
| | System Obligated Group, Series 2019: | | | |
| 50 | | 4.000%, 7/01/44 | 7/29 at 100.00 | A+ | 58,874 |
| 200 | | 3.000%, 7/01/49 | 7/29 at 100.00 | A+ | 212,772 |
| 3,095 | | Total Health Care | | | 3,544,713 |
| | Housing/Multifamily – 8.3% (8.0% of Total Investments) | | | |
| 55 | | New Jersey Economic Development Authority, Revenue Bonds, Provident Group – Kean | 1/27 at 100.00 | BBB– | 62,383 |
| | Properties LLC – Kean University Student Housing Project, Series 2017A, 5.000%, 7/01/47 | | | |
| 100 | | New Jersey Economic Development Authority, Revenue Bonds, Provident Group – Rowan | 1/25 at 100.00 | BBB– | 109,579 |
| | Properties LLC – Rowan University Student Housing Project, Series 2015A, 5.000%, 1/01/48 | | | |
| 155 | | New Jersey Economic Development Authority, Revenue Bonds, West Campus Housing LLC – New | 7/25 at 100.00 | BB+ | 170,633 |
| | Jersey City University Student Housing Project, Series 2015, 5.000%, 7/01/47 | | | |
| 130 | | New Jersey Housing & Mortgage Finance Agency, Multifamily Conduit Revenue Bonds, | No Opt. Call | Aaa | 131,053 |
| | Riverside Village Family Apartments Phase 1 Project, Series 2019F, 1.350%, 12/01/22 | | | |
| 120 | | New Jersey Housing and Mortgage Finance Agency, Multifamily Revenue Bonds, Series 2015A, | 11/24 at 100.00 | AA– | 129,468 |
| | 4.000%, 11/01/45 | | | |
| 270 | | New Jersey Housing and Mortgage Finance Agency, Multifamily Revenue Bonds, Series 2016B, | 11/25 at 100.00 | AA– | 288,452 |
| | 3.600%, 11/01/40 | | | |
| 435 | | New Jersey Housing and Mortgage Finance Agency, Multifamily Revenue Bonds, Series 2018A, | 11/27 at 100.00 | AA– | 485,665 |
| | 3.875%, 11/01/38 | | | |
42
| | | | | | |
| Principal | | | Optional Call | | |
| Amount (000) | | Description (1) | Provisions (2) | Ratings (3) | Value |
| | Housing/Multifamily (continued) | | | |
| $ 100 | | New Jersey Housing and Mortgage Finance Agency, Multifamily Revenue Bonds, Series 2019A, | 11/28 at 100.00 | AA– | $ 105,544 |
| | 2.900%, 11/01/39 | | | |
| | New Jersey Housing and Mortgage Finance Agency, Multifamily Revenue Bonds, Series 2019B: | | | |
| 150 | | 1.300%, 11/01/20 | No Opt. Call | AA– | 150,305 |
| 175 | | 1.375%, 11/01/21 | No Opt. Call | AA– | 175,908 |
| 200 | | 1.500%, 5/01/23 | No Opt. Call | AA– | 202,162 |
| 1,890 | | Total Housing/Multifamily | | | 2,011,152 |
| | Housing/Single Family – 4.8% (4.7% of Total Investments) | | | |
| | New Jersey Housing and Mortgage Finance Agency, Single Family Housing Revenue Bonds, | | | |
| | Series 2018A: | | | |
| 155 | | 3.600%, 4/01/33 | 10/27 at 100.00 | AA | 173,098 |
| 95 | | 3.750%, 10/01/35 | 10/27 at 100.00 | AA | 106,614 |
| 85 | | New Jersey Housing and Mortgage Finance Agency, Single Family Housing Revenue Bonds, | 10/27 at 100.00 | AA | 94,631 |
| | Series 2018B, 3.800%, 10/01/32 (AMT) | | | |
| 720 | | New Jersey Housing and Mortgage Finance Agency, Single Family Housing Revenue Bonds, | 4/28 at 100.00 | AA | 798,768 |
| | Series 2019C, 3.950%, 10/01/44 (UB) (4) | | | |
| 1,055 | | Total Housing/Single Family | | | 1,173,111 |
| | Long-Term Care – 1.5% (1.5% of Total Investments) | | | |
| 15 | | New Jersey Economic Development Authority, Fixed Rate Revenue Bonds, Lions Gate Project, | 1/24 at 100.00 | N/R | 15,806 |
| | Series 2014, 5.250%, 1/01/44 | | | |
| 140 | | New Jersey Economic Development Authority, Revenue Bonds, United Methodist Homes of New | 7/23 at 100.00 | BBB– | 149,440 |
| | Jersey Obligated Group Issue, Refunding Series 2013, 5.000%, 7/01/34 | | | |
| 40 | | New Jersey Economic Development Authority, Revenue Bonds, United Methodist Homes of New | 7/24 at 100.00 | BBB– | 43,973 |
| | Jersey Obligated Group Issue, Refunding Series 2014A, 5.000%, 7/01/29 | | | |
| 100 | | New Jersey Economic Development Authority, Revenue Bonds, White Horse HMT Urban Renewal | 1/28 at 102.00 | N/R | 102,490 |
| | LLC Project, Series 2020, 5.000%, 1/01/40, 144A (WI/DD, Settling 3/05/20) | | | |
| 50 | | New Jersey Health Care Facilities Financing Authority, Revenue Bonds, Village Drive | 10/26 at 102.00 | N/R | 53,559 |
| | Healthcare Urban Renewal LLC, Series 2018, 5.750%, 10/01/38, 144A | | | |
| 345 | | Total Long-Term Care | | | 365,268 |
| | Tax Obligation/General – 8.6% (8.3% of Total Investments) | | | |
| 80 | | Cumberland County Improvement Authority, New Jersey, Guaranteed Lease Revenue Bonds, | 10/28 at 100.00 | AA | 93,146 |
| | County Correctional Facility Project, Series 2018, 4.000%, 10/01/43 – BAM Insured | | | |
| 125 | | Gloucester Township, New Jersey, General Obligation Bonds, Series 2019, 2.000%, | No Opt. Call | AA | 129,137 |
| | 2/01/24 – BAM Insured | | | |
| | Harrison, New Jersey, General Obligation Bonds, Parking Utility Series 2018: | | | |
| 35 | | 3.125%, 3/01/31 – BAM Insured | 3/28 at 100.00 | AA | 38,473 |
| 30 | | 3.250%, 3/01/32 – BAM Insured | 3/28 at 100.00 | AA | 33,152 |
| 50 | | 3.500%, 3/01/36 – BAM Insured | 3/28 at 100.00 | AA | 55,610 |
| 100 | | Jersey City, New Jersey, General Obligation Bonds, Refunding General Improvement Series | 11/27 at 100.00 | AA– | 126,989 |
| | 2017A, 5.000%, 11/01/29 | | | |
| 125 | | Middlesex County, New Jersey, General Obligation Bonds, Refunding Redevelopment Series | No Opt. Call | AAA | 159,406 |
| | 2017, 5.000%, 1/15/27 | | | |
| 20 | | Montclair Township, Essex County, New Jersey, General Obligation Bonds, Refunding | 1/24 at 100.00 | AAA | 23,070 |
| | Parking Utility Series 2014A, 5.000%, 1/01/37 | | | |
| 100 | | Montclair Township, Essex County, New Jersey, General Obligation Bonds, Refunding School | No Opt. Call | AAA | 115,729 |
| | Series 2017B, 4.000%, 3/01/25 | | | |
| | New Brunswick Parking Authority, Middlesex County, New Jersey, Guaranteed Parking | | | |
| | Revenue Bonds, Refunding Series 2016A: | | | |
| 300 | | 5.000%, 9/01/32 – BAM Insured | 9/26 at 100.00 | AA | 370,017 |
| 140 | | 5.000%, 9/01/39 – BAM Insured | 9/26 at 100.00 | AA | 168,882 |
| 100 | | New Jersey State, General Obligation Bonds, Various Purpose Series 2020, 2.250%, 6/01/35 | 12/27 at 100.00 | A– | 100,476 |
43
| | |
| NJV | Nuveen New Jersey Municipal Value Fund |
| Portfolio of Investments (continued) |
| February 29, 2020 |
| | | | | | |
| Principal | | | Optional Call | | |
| Amount (000) | | Description (1) | Provisions (2) | Ratings (3) | Value |
| | Tax Obligation/General (continued) | | | |
| $ 200 | | Ocean City, New Jersey, General Obligation Bonds, General Improvement Series 2019, | 9/26 at 100.00 | AA | $ 204,052 |
| | 2.250%, 9/15/33 | | | |
| 125 | | Sussex County, New Jersey, General Obligation Bonds, Series 2019, 3.000%, 6/01/27 | 6/26 at 100.00 | AA+ | 139,912 |
| 150 | | Union County Utilities Authority, New Jersey, Resource Recovery Facility Lease Revenue | 12/21 at 100.00 | AA+ | 160,863 |
| | Bonds, Covantan Union Inc Lessee, Refunding Series 2011B, 5.250%, 12/01/31 (AMT) | | | |
| 170 | | Union County Utilities Authority, New Jersey, Solid Waste System County Deficiency | 6/21 at 100.00 | Aaa | 178,223 |
| | Revenue Bonds, Series 2011A, 5.000%, 6/15/41 | | | |
| 1,850 | | Total Tax Obligation/General | | | 2,097,137 |
| | Tax Obligation/Limited – 16.1% (15.6% of Total Investments) | | | |
| 245 | | Garden State Preservation Trust, New Jersey, Open Space and Farmland Preservation Bonds, | No Opt. Call | AA | 313,823 |
| | Series 2005A, 5.750%, 11/01/28 – AGM Insured | | | |
| 150 | | Hudson County Improvement Authority, New Jersey, County Secured Lease Revenue Bonds, | 5/26 at 100.00 | AA | 180,377 |
| | Hudson County Vocational Technical Schools Project, Series 2016, 5.250%, 5/01/51 | | | |
| | New Jersey Economic Development Authority, Cigarette Tax Revenue Refunding Bonds, | | | |
| | Series 2012: | | | |
| 250 | | 5.000%, 6/15/25 | 6/22 at 100.00 | BBB+ | 269,180 |
| 400 | | 5.000%, 6/15/28 | 6/22 at 100.00 | BBB+ | 428,992 |
| 100 | | New Jersey Economic Development Authority, Lease Revenue Bonds, State House Project, | 12/28 at 100.00 | A– | 118,513 |
| | Series 2017B, 4.500%, 6/15/40 | | | |
| 125 | | New Jersey Economic Development Authority, Revenue Bonds, Motor Vehicle Surcharge, | 7/27 at 100.00 | BBB+ | 133,866 |
| | Refunding Series 2017A, 3.375%, 7/01/30 | | | |
| 2,170 | | New Jersey Transportation Trust Fund Authority, Transportation System Bonds, Series | No Opt. Call | A– | 1,262,354 |
| | 2009A, 0.000%, 12/15/39 | | | |
| | New Jersey Transportation Trust Fund Authority, Transportation System Bonds, | | | |
| | Series 2011B: | | | |
| 180 | | 5.500%, 6/15/31 | 6/21 at 100.00 | A– | 189,932 |
| 275 | | 5.250%, 6/15/36 | 6/21 at 100.00 | A– | 288,904 |
| 5 | | New Jersey Transportation Trust Fund Authority, Transportation System Bonds, Series | 6/22 at 100.00 | A– | 5,359 |
| | 2012A, 5.000%, 6/15/42 | | | |
| 25 | | New Jersey Transportation Trust Fund Authority, Transportation System Bonds, Series | 12/28 at 100.00 | A– | 29,231 |
| | 2018A, 4.250%, 12/15/38 | | | |
| 100 | | New Jersey Transportation Trust Fund Authority, Transportation System Bonds, Series | 12/28 at 100.00 | A– | 116,570 |
| | 2019AA, 4.500%, 6/15/49 | | | |
| 230 | | New Jersey Transportation Trust Fund Authority, Transportation System Bonds, Series | 12/28 at 100.00 | A– | 245,624 |
| | 2019BB, 3.500%, 6/15/46 | | | |
| 110 | | Union County Improvement Authority, New Jersey, General Obligation Lease Bonds, Juvenile | No Opt. Call | Aaa | 331,958 |
| | Detention Center Facility Project, Tender Option Bond Trust 2015-XF1019, 20.136%, 5/01/30, | | | |
| | 144A (IF) (4) | | | |
| 4,365 | | Total Tax Obligation/Limited | | | 3,914,683 |
| | Transportation – 16.7% (16.2% of Total Investments) | | | |
| 250 | | Casino Reinvestment Development Authority, New Jersey, Parking Revenue Bonds, Series | 3/20 at 100.00 | Baa2 | 250,905 |
| | 2005A, 5.250%, 6/01/20 – NPFG Insured | | | |
| | Delaware River and Bay Authority, Delaware and New Jersey, Revenue Bonds, Series 2014A: | | | |
| 150 | | 4.125%, 1/01/39 | 1/24 at 100.00 | A1 | 164,778 |
| 200 | | 5.000%, 1/01/44 | 1/24 at 100.00 | A1 | 225,934 |
| 130 | | Delaware River and Bay Authority, Delaware and New Jersey, Revenue Bonds, Series 2019, | 1/29 at 100.00 | A1 | 153,933 |
| | 4.000%, 1/01/44 | | | |
| 540 | | Delaware River Joint Toll Bridge Commission, New Jersey and Pennsylvania, Bridge System | 7/27 at 100.00 | A1 | 664,200 |
| | Revenue Bonds, Series 2017, 5.000%, 7/01/47 | | | |
| 295 | | Delaware River Joint Toll Bridge Commission, New Jersey and Pennsylvania, Bridge System | No Opt. Call | A1 | 388,547 |
| | Revenue Bonds, Series 2019A, 5.000%, 7/01/28 | | | |
44
| | | | | | |
| Principal | | | Optional Call | | |
| Amount (000) | | Description (1) | Provisions (2) | Ratings (3) | Value |
| | Transportation (continued) | | | |
| $ 175 | | Delaware River Port Authority, New Jersey and Pennsylvania, Revenue Bonds, Series 2018A, | 1/29 at 100.00 | A+ | $ 226,632 |
| | 5.000%, 1/01/37 | | | |
| 295 | | Delaware River Port Authority, Pennsylvania and New Jersey, Revenue Refunding Bonds, | 1/23 at 100.00 | A | 325,108 |
| | Port District Project, Series 2012, 5.000%, 1/01/27 | | | |
| 190 | | New Jersey Economic Development Authority, Private Activity Bonds, The Goethals Bridge | 1/24 at 100.00 | BBB | 216,610 |
| | Replacement Project, Series 2013, 5.625%, 1/01/52 (AMT) | | | |
| 80 | | New Jersey Economic Development Authority, Special Facilities Revenue Bonds, Continental | 3/24 at 101.00 | BB | 92,786 |
| | Airlines Inc, Series 2000A & 2000B, 5.625%, 11/15/30 (AMT) | | | |
| 320 | | New Jersey Economic Development Authority, Special Facility Revenue Bonds, Port Newark | 10/27 at 100.00 | Ba1 | 376,909 |
| | Container Terminal LLC Project, Refunding Series 2017, 5.000%, 10/01/47 (AMT) | | | |
| 255 | | New Jersey Turnpike Authority, Revenue Bonds, Refunding Series 2015E, 5.000%, 1/01/45 | 1/25 at 100.00 | A+ | 301,175 |
| 315 | | Port Authority of New York and New Jersey, Consolidated Revenue Bonds, One Hundred | 12/23 at 100.00 | AA– | 360,335 |
| | Seventy Ninth Series 2013, 5.000%, 12/01/43 | | | |
| 250 | | South Jersey Transportation Authority, New Jersey, Transportation System Revenue Bonds, | 11/29 at 100.00 | AA | 327,802 |
| | Refunding Series 2019A, 5.000%, 11/01/31 – AGM Insured | | | |
| 3,445 | | Total Transportation | | | 4,075,654 |
| | U.S. Guaranteed – 6.5% (6.4% of Total Investments) (5) | | | |
| 110 | | Monroe Township Board of Education, Middlesex County, New Jersey, General Obligation | 3/25 at 100.00 | AA– | 132,575 |
| | Bonds, Refunding Series 2015, 5.000%, 3/01/38 (Pre-refunded 3/01/25) | | | |
| | New Jersey Economic Development Authority, Student Housing Revenue Bonds, Provident | | | |
| | Group-Montclair Properties LLC, Montclair State University Student Housing Project, Series 2010A: | | | |
| 100 | | 5.750%, 6/01/31 (Pre-refunded 6/01/20) | 6/20 at 100.00 | N/R | 101,225 |
| 50 | | 5.875%, 6/01/42 (Pre-refunded 6/01/20) | 6/20 at 100.00 | N/R | 50,628 |
| | New Jersey Health Care Facilities Financing Authority, Revenue Bonds, Palisades Medical | | | |
| | Center Obligated Group Issue, Refunding Series 2013: | | | |
| 20 | | 5.250%, 7/01/31 (Pre-refunded 7/01/23) | 7/23 at 100.00 | N/R | 22,888 |
| 85 | | 5.250%, 7/01/31 (Pre-refunded 7/01/23) | 7/23 at 100.00 | N/R | 97,426 |
| 75 | | New Jersey Health Care Facilities Financing Authority, Revenue Bonds, Saint Barnabas | 7/21 at 100.00 | N/R | 79,748 |
| | Health Care System, Refunding Series 2011A, 5.625%, 7/01/37 (Pre-refunded 7/01/21) | | | |
| | New Jersey Transportation Trust Fund Authority, Transportation System Bonds, | | | |
| | Series 2011A: | | | |
| 85 | | 6.000%, 6/15/35 (Pre-refunded 6/15/21) | 6/21 at 100.00 | A– | 90,653 |
| 275 | | 5.500%, 6/15/41 (Pre-refunded 6/15/21) | 6/21 at 100.00 | A– | 291,574 |
| | New Jersey Transportation Trust Fund Authority, Transportation System Bonds, | | | |
| | Series 2011B: | | | |
| 65 | | 5.000%, 6/15/37 (Pre-refunded 6/15/21) | 6/21 at 100.00 | A– | 68,504 |
| 530 | | 5.000%, 6/15/42 (Pre-refunded 6/15/21) | 6/21 at 100.00 | A– | 558,567 |
| 10 | | Passaic County Improvement Authority, New Jersey, County Guaranteed Parking Revenue | 5/20 at 100.00 | Aa1 | 10,069 |
| | Bonds, 200 Hospital Plaza Project, Series 2010, 5.000%, 5/01/42 (Pre-refunded 5/01/20) | | | |
| 60 | | Rutgers State University, New Jersey, Revenue Bonds, Tender Option Bond 2016-XF2356, | 5/23 at 100.00 | Aa3 | 91,919 |
| | 15.088%, 5/01/43, (Pre-refunded 5/01/23), 144A (IF) (4) | | | |
| 1,465 | | Total U.S. Guaranteed | | | 1,595,776 |
| | Utilities – 5.1% (4.9% of Total Investments) | | | |
| 470 | | Essex County Improvement Authority, New Jersey, Solid Waste Disposal Revenue Bonds, | 7/20 at 100.00 | BB– | 476,120 |
| | Covanta Project, Series 2015, 5.250%, 7/01/45 (AMT), 144A | | | |
| 300 | | Industrial Pollution Control Financing Authority of Cape May County (New Jersey), | No Opt. Call | A | 316,713 |
| | Pollution Control Revenue Refunding Bonds, 1991 Series A (Atlantic City Electric Company | | | |
| | Project), 6.800%, 3/01/21 – NPFG Insured | | | |
| 205 | | New Jersey Economic Development Authority, Natural Gas Facilities Revenue Bonds, New | 8/24 at 100.00 | Aa3 | 208,450 |
| | Jersey Natural Gas Company Project, Refunding Series 2011A, 2.750%, 8/01/39 | | | |
| 160 | | New Jersey Economic Development Authority, Water Facilities Revenue Bonds, New | 12/29 at 100.00 | A+ | 166,851 |
| | Jersey-American Water Company Inc Project, Refunding Series 2019A, 2.200%, 10/01/39 (AMT) | | | |
| | (Mandatory Put 12/03/29) | | | |
45
| | |
| NJV | Nuveen New Jersey Municipal Value Fund |
| Portfolio of Investments (continued) |
| February 29, 2020 |
| | | | | | |
| Principal | | | Optional Call | | |
| Amount (000) | | Description (1) | Provisions (2) | Ratings (3) | Value |
| | Utilities (continued) | | | |
| $ 60 | | Salem County Pollution Control Financing Authority, New Jersey, Pollution Control | No Opt. Call | BBB | $ 64,892 |
| | Revenue Bonds, Chambers Project, Refunding Series 2014A, 5.000%, 12/01/23 (AMT) | | | |
| 1,195 | | Total Utilities | | | 1,233,026 |
| | Water and Sewer – 0.5% (0.4% of Total Investments) | | | |
| 100 | | New Jersey Economic Development Authority, Water Facilities Revenue Bonds, Middlesex | 8/29 at 100.00 | A+ | 112,827 |
| | Water Company, Series 2019, 4.000%, 8/01/59 (AMT) | | | |
| $ 23,289 | | Total Long-Term Investments (cost $22,552,294) | | | 25,126,835 |
| | Floating Rate Obligations – (3.3)% | | | (810,000) |
| | Other Assets Less Liabilities – 0.2% (6) | | | 55,483 |
| | Net Assets Applicable to Common Shares – 100% | | | $ 24,372,318 |
Investments in Derivatives
Futures Contracts
| | | | | | | | |
| | | | | | | Variation |
| | | | | | Unrealized | Margin |
| Contract | Number of | Expiration | Notional | | Appreciation | Receivable/ |
| Description | Position | Contracts | Date | Amount | Value | (Depreciation) | (Payable) |
U.S. Treasury 5-Year Note | Short | (23) | 6/20 | $(2,790,296) | $(2,823,250) | $(32,954) | $(21,922) |
| | |
(1) | All percentages shown in the Portfolio of Investments are based on net assets applicable to common shares unless otherwise noted. |
(2) | Optional Call Provisions: Dates (month and year) and prices of the earliest optional call or redemption. There may be other call provisions at varying prices at later dates. Certain mortgage-backed securities may be subject to periodic principal paydowns. Optional Call Provisions are not covered by the report of independent registered public accounting firm. |
(3) | For financial reporting purposes, the ratings disclosed are the highest of Standard & Poor’s Group (“Standard & Poor’s”), Moody’s Investors Service, Inc. (“Moody’s”) or Fitch, Inc. (“Fitch”) rating. This treatment of split-rated securities may differ from that used for other purposes, such as for Fund investment policies. Ratings below BBB by Standard & Poor’s, Baa by Moody’s or BBB by Fitch are considered to be below investment grade. Holdings designated N/R are not rated by any of these national rating agencies. Ratings are not covered by the report of independent registered public accounting firm. |
(4) | Investment, or portion of investment, has been pledged to collateralize the net payment obligations for investments in inverse floating rate transactions. |
(5) | Backed by an escrow or trust containing sufficient U.S. Government or U.S. Government agency securities, which ensure the timely payment of principal and interest. |
(6) | Other assets less liabilities includes the unrealized appreciation (depreciation) of certain over-the-counter (“OTC”) derivatives as presented on the Statement of Assets and Liabilities, when applicable. The unrealized appreciation (depreciation) of OTC cleared and exchange-traded derivatives is recognized as part of the cash collateral at brokers and/or the receivable or payable for variation margin as presented on the Statement of Assets and Liabilities, when applicable. |
144A | Investment is exempt from registration under Rule 144A of the Securities Act of 1933, as amended. These investments may only be resold in transactions exempt from registration, which are normally those transactions with qualified institutional buyers. |
AMT | Alternative Minimum Tax |
IF | Inverse floating rate security issued by a tender option bond (“TOB”) trust, the interest rate on which varies inversely with the Securities Industry Financial Markets Association (SIFMA) short-term rate, which resets weekly, or a similar short-term rate, and is reduced by the expenses related to the TOB trust. |
UB | Underlying bond of an inverse floating rate trust reflected as a financing transaction. See Notes to Financial Statements, Note 4 – Portfolio Securities and Investments in Derivatives, Inverse Floating Rate Securities for more information. |
WI/DD | Purchased on a when-issued or delayed delivery basis. |
| See accompanying notes to financial statements. |
46
| | |
| NQP | Nuveen Pennsylvania Quality Municipal |
| Income Fund |
| Portfolio of Investments |
| February 29, 2020 |
| | | | | | |
| Principal | | | Optional Call | | |
| Amount (000) | | Description (1) | Provisions (2) | Ratings (3) | Value |
| | LONG-TERM INVESTMENTS – 156.4% (100.0% of Total Investments) | | | |
| | MUNICIPAL BONDS – 153.6% (98.2% of Total Investments) | | | |
| | Consumer Staples – 0.4% (0.3% of Total Investments) | | | |
| $ 2,000 | | Pennsylvania Economic Development Financing Authority, Solid Waste Disposal Revenue | No Opt. Call | AA– | $ 2,701,400 |
| | Bonds, Procter & Gamble Paper Project, Series 2001, 5.375%, 3/01/31 (AMT) | | | |
| | Education and Civic Organizations – 18.0% (11.5% of Total Investments) | | | |
| 1,160 | | Allegheny County Higher Education Building Authority, Pennsylvania, College Revenue | No Opt. Call | Baa3 | 1,348,767 |
| | Refunding Bonds, Robert Morris College, Series 1998A, 6.000%, 5/01/28 | | | |
| 940 | | Allegheny County Higher Education Building Authority, Pennsylvania, Revenue Bonds, | 3/23 at 100.00 | A | 977,967 |
| | Duquesne University, Series 2013A, 3.500%, 3/01/34 | | | |
| | Allegheny County Higher Education Building Authority, Pennsylvania, Revenue Bonds, | | | |
| | Robert Morris University, Series 2016: | | | |
| 735 | | 3.000%, 10/15/30 | 10/26 at 100.00 | Baa3 | 737,352 |
| 1,000 | | 5.000%, 10/15/38 | 10/26 at 100.00 | Baa3 | 1,135,100 |
| 1,625 | | Allegheny County Higher Education Building Authority, Pennsylvania, Revenue Bonds, | 10/27 at 100.00 | Baa3 | 1,849,786 |
| | Robert Morris University, Series 2017, 5.000%, 10/15/47 | | | |
| | Berks County Municipal Authority, Pennsylvania University, Revenue Bonds, Alvernia | | | |
| | University Project, Series 2020: | | | |
| 590 | | 5.000%, 10/01/39 | 10/29 at 100.00 | BB+ | 686,518 |
| 20 | | 5.000%, 10/01/49 | 10/29 at 100.00 | BB+ | 22,897 |
| 3,215 | | Bucks County Industrial Development Authority, Pennsylvania, Revenue Bonds, School Lane | 3/27 at 100.00 | BBB– | 3,788,653 |
| | Charter School Project, Series 2016, 5.125%, 3/15/36 | | | |
| 835 | | Chester County Industrial Development Authority, Pennsylvania, Avon Grove Charter School | 12/27 at 100.00 | BBB– | 967,698 |
| | Revenue Bonds, Series 2017A, 5.000%, 12/15/47 | | | |
| 2,200 | | Crawford County Industrial Development Authority, Pennsylvania, College Revenue Bonds, | 5/26 at 100.00 | A– | 2,306,656 |
| | Allegheny College, Series 2016, 3.000%, 5/01/34 | | | |
| 1,000 | | Cumberland County Municipal Authority, Pennsylvania, Revenue Bonds, Dickinson College | 11/27 at 100.00 | A+ | 1,227,740 |
| | Project, Second Series 2017A, 5.000%, 11/01/39 | | | |
| 1,470 | | Dallas Area Municipal Authority, Pennsylvania, Revenue Bonds, Misericordia University | 5/29 at 100.00 | Baa3 | 1,712,168 |
| | Project, Series 2019, 5.000%, 5/01/48 | | | |
| 1,020 | | Dallas Area Municipal Authority, Pennsylvania, Revenue Bonds, Misericordia University, | 5/24 at 100.00 | Baa3 | 1,118,736 |
| | Series 2014, 5.000%, 5/01/37 | | | |
| 750 | | Delaware County Authority, Pennsylvania, General Revenue Bonds, Eastern University, | 3/20 at 100.00 | AA | 751,440 |
| | Series 2006, 4.500%, 10/01/27 – RAAI Insured | | | |
| 4,595 | | Erie Higher Education Building Authority, Pennsylvania, Revenue Bonds, Gannon | 11/26 at 100.00 | BBB+ | 4,894,272 |
| | University, Series 2016, 4.000%, 5/01/46 | | | |
| 2,395 | | General Authority of Southcentral Pennsylvania, Revenue Bonds, AICUP Financing | 10/27 at 100.00 | A– | 2,602,982 |
| | Program-York College of Pennsylvania, Series 2017 PP4, 3.375%, 11/01/37 | | | |
| | Huntingdon County General Authority, Pennsylvania, Revenue Bonds, Juniata College, | | | |
| | Series 2016OO2: | | | |
| 590 | | 3.250%, 5/01/36 | 5/26 at 100.00 | BBB+ | 623,034 |
| 1,555 | | 3.500%, 5/01/41 | 5/26 at 100.00 | BBB+ | 1,647,694 |
| | Lackawanna County Industrial Development Authority, Pennsylvania, Revenue Bonds, | | | |
| | University of Scranton, Series 2017: | | | |
| 475 | | 3.375%, 11/01/33 | 11/27 at 100.00 | A– | 516,871 |
| 2,910 | | 4.000%, 11/01/40 | 11/27 at 100.00 | A– | 3,222,185 |
| 5,235 | | Lycoming County Authority, Pennsylvania, Revenue Bonds, Pennsylvania College of | 5/22 at 100.00 | A | 5,608,413 |
| | Technology, Series 2012, 5.000%, 5/01/32 | | | |
47
| | |
| NQP | Nuveen Pennsylvania Quality Municipal Income Fund |
| Portfolio of Investments (continued) |
| February 29, 2020 |
| | | | | | |
| Principal | | | Optional Call | | |
| Amount (000) | | Description (1) | Provisions (2) | Ratings (3) | Value |
| | Education and Civic Organizations (continued) | | | |
| $ 1,855 | | Montgomery County Higher Education and Health Authority, Pennsylvania, Revenue Bonds, | 9/28 at 100.00 | A | $ 2,303,984 |
| | Thomas Jefferson University, Series 2018A, 5.000%, 9/01/48 | | | |
| | Montgomery County Higher Education and Health Authority, Pennsylvania, Revenue Bonds, | | | |
| | Thomas Jefferson University, Series 2019: | | | |
| 3,410 | | 4.000%, 9/01/44 | 9/29 at 100.00 | A | 3,940,630 |
| 395 | | 4.000%, 9/01/49 | 9/29 at 100.00 | A | 453,369 |
| 2,155 | | Montgomery County Higher Education and Health Authority, Pennsylvania, Revenue Bonds, | 4/20 at 100.00 | BBB | 2,163,017 |
| | Arcadia University, Series 2010, 5.625%, 4/01/40 | | | |
| 1,465 | | Pennsylvania Higher Educational Facilities Authority, Revenue Bonds, Holy Family | 9/23 at 100.00 | BBB– | 1,656,842 |
| | University, Series 2013A, 6.500%, 9/01/38 | | | |
| 1,625 | | Pennsylvania Higher Educational Facilities Authority, General Revenue Bonds, State | 3/20 at 100.00 | Aa3 | 1,629,712 |
| | System of Higher Education, Series 2008AH, 5.000%, 6/15/33 | | | |
| 2,415 | | Pennsylvania Higher Educational Facilities Authority, Revenue Bonds, AICUP Financing | 11/21 at 100.00 | A– | 2,568,932 |
| | Program-Mount Aloysius College Project, Series 2011R-1, 5.000%, 11/01/35 | | | |
| | Pennsylvania Higher Educational Facilities Authority, Revenue Bonds, Bryn Mawr College, | | | |
| | Refunding Series 2014: | | | |
| 2,545 | | 5.000%, 12/01/38 | 12/24 at 100.00 | AA+ | 3,010,862 |
| 2,080 | | 5.000%, 12/01/44 | 12/24 at 100.00 | AA+ | 2,447,370 |
| 85 | | Pennsylvania Higher Educational Facilities Authority, Revenue Bonds, Drexel University, | 5/21 at 100.00 | A | 88,926 |
| | Series 2011A, 5.250%, 5/01/41 | | | |
| 1,000 | | Pennsylvania Higher Educational Facilities Authority, Revenue Bonds, Gwynedd Mercy | 5/22 at 100.00 | BBB | 1,076,430 |
| | College, Series 2012-KK1, 5.375%, 5/01/42 | | | |
| 320 | | Pennsylvania Higher Educational Facilities Authority, Revenue Bonds, LaSalle University, | 11/22 at 100.00 | BBB– | 336,896 |
| | Series 2012, 4.000%, 5/01/32 | | | |
| 2,000 | | Pennsylvania Higher Educational Facilities Authority, Revenue Bonds, Temple University, | 4/22 at 100.00 | Aa3 | 2,144,000 |
| | First Series of 2012, 5.000%, 4/01/42 | | | |
| 7,125 | | Pennsylvania Higher Educational Facilities Authority, Revenue Bonds, Thomas Jefferson | 3/25 at 100.00 | A | 8,391,255 |
| | University, Refunding Series 2015A, 5.250%, 9/01/50 (UB) (5) | | | |
| 760 | | Pennsylvania Higher Educational Facilities Authority, Revenue Bonds, Thomas Jefferson | 9/22 at 100.00 | A | 824,121 |
| | University, Series 2012, 5.000%, 3/01/42 | | | |
| | Pennsylvania Higher Educational Facilities Authority, Revenue Bonds, University of the | | | |
| | Sciences in Philadelphia, Series 2012: | | | |
| 1,030 | | 4.000%, 11/01/39 | 11/22 at 100.00 | Baa1 | 1,081,912 |
| 4,300 | | 5.000%, 11/01/42 | 11/22 at 100.00 | Baa1 | 4,663,178 |
| 1,310 | | Pennsylvania Higher Educational Facilities Authority, Revenue Bonds, University of the | 11/25 at 100.00 | Baa1 | 1,524,250 |
| | Sciences in Philadelphia, Series 2015A, 5.000%, 11/01/36 | | | |
| 1,590 | | Pennsylvania Higher Educational Facilities Authority, Revenue Bonds, Widener University, | 7/23 at 100.00 | A– | 1,762,324 |
| | Series 2013A, 5.500%, 7/15/38 | | | |
| 1,255 | | Philadelphia Authority for Industrial Development, Pennsylvania, Revenue Bonds, La Salle | 11/27 at 100.00 | BBB– | 1,332,132 |
| | University, Series 2017, 3.625%, 5/01/35 | | | |
| 554 | | Philadelphia Authority for Industrial Development, Pennsylvania, Revenue Bonds, | 3/20 at 100.00 | N/R | 5,540 |
| | Leadership Learning Partners, Series 2005A, 5.375%, 7/01/36 (4) | | | |
| 4,500 | | Philadelphia Authority for Industrial Development, Pennsylvania, Revenue Bonds, | 6/20 at 100.00 | BB | 4,546,485 |
| | Philadelphia Performing Arts Charter School, Series 2013, 6.750%, 6/15/43, 144A | | | |
| 500 | | Philadelphia Authority for Industrial Development, Pennsylvania, Revenue Bonds, Richard | 3/20 at 100.00 | N/R | 487,710 |
| | Allen Preparatory Charter School, Series 2006, 6.250%, 5/01/33 | | | |
| 2,420 | | Philadelphia Authority for Industrial Development, Pennsylvania, Revenue Bonds, | 3/28 at 100.00 | BB+ | 2,691,960 |
| | University of the Arts, Series 2017, 5.000%, 3/15/45, 144A | | | |
| 2,320 | | Scranton-Lackawanna Health and Welfare Authority, Pennsylvania, Revenue Bonds, | 5/26 at 100.00 | A– | 2,714,493 |
| | University of Scranton, Series 2016, 5.000%, 11/01/37 | | | |
| 5,250 | | Scranton-Lackawanna Health and Welfare Authority, Pennsylvania, University Revenue Bonds, | 6/26 at 100.00 | BB+ | 5,642,280 |
| | Marywood University, Series 2016, 5.000%, 6/01/46 | | | |
48
| | | | | | |
| Principal | | | Optional Call | | |
| Amount (000) | | Description (1) | Provisions (2) | Ratings (3) | Value |
| | Education and Civic Organizations (continued) | | | |
| $ 5,000 | | State Public School Building Authority, Pennsylvania, College Revenue Bonds, Northampton | 3/21 at 100.00 | A1 | $ 5,224,150 |
| | County Area Community College, Series 2011, 5.500%, 3/01/31 | | | |
| 3,555 | | Washington County Industrial Development Authority, Pennsylvania, College Revenue Bonds, | 11/27 at 100.00 | A– | 3,856,997 |
| | AICUP Financing Program-Washington and Jefferson College Project, Series 2017-PP5, | | | |
| | 3.375%, 11/01/36 | | | |
| | Wilkes-Barre Finance Authority, Pennsylvania, Revenue Bonds, University of Scranton, | | | |
| | Series 2015A: | | | |
| 1,890 | | 5.000%, 11/01/32 | 11/25 at 100.00 | A– | 2,251,198 |
| 740 | | 5.000%, 11/01/33 | 11/25 at 100.00 | A– | 878,765 |
| 740 | | 4.000%, 11/01/35 | 11/25 at 100.00 | A– | 821,378 |
| 100,504 | | Total Education and Civic Organizations | | | 110,268,027 |
| | Health Care – 33.0% (21.1% of Total Investments) | | | |
| 17,075 | | Allegheny County Hospital Development Authority, Pennsylvania, Revenue Bonds, Allegheny | 4/28 at 100.00 | A | 19,354,683 |
| | Health Network Obligated Group Issue, Series 2018A, 4.000%, 4/01/44 | | | |
| | Allegheny County Hospital Development Authority, Pennsylvania, Revenue Bonds, University | | | |
| | of Pittsburgh Medical Center, Series 2019A: | | | |
| 210 | | 4.000%, 7/15/35 | 7/29 at 100.00 | A+ | 250,925 |
| 1,000 | | 4.000%, 7/15/37 | 7/29 at 100.00 | A+ | 1,188,500 |
| 460 | | 4.000%, 7/15/38 | 7/29 at 100.00 | A+ | 544,911 |
| | Beaver County Hospital Authority, Pennsylvania, Revenue Bonds, Heritage Valley Health | | | |
| | System, Inc, Series 2012: | | | |
| | Berks County Industrial Development Authority, Pennsylvania, Health System Revenue | | | |
| | Bonds, Tower Health Project, Series 2017: | | | |
| 10,000 | | 5.000%, 11/01/50 | 11/27 at 100.00 | BBB+ | 11,900,900 |
| 4,100 | | 5.000%, 11/01/50 (UB) (5) | 11/27 at 100.00 | BBB+ | 4,879,369 |
| 3,300 | | Berks County Municipal Authority, Pennsylvania, Revenue Bonds, Reading Hospital & | 5/22 at 100.00 | BBB+ | 3,449,391 |
| | Medical Center Project, Series 2012A, 4.500%, 11/01/41 | | | |
| | Centre County Hospital Authority, Pennsylvania, Hospital Revenue Bonds, Mount Nittany | | | |
| | Medical Center Project, Series 2016A: | | | |
| 805 | | 5.000%, 11/15/41 | 11/25 at 100.00 | AA– | 944,901 |
| 2,985 | | 5.000%, 11/15/46 | 11/25 at 100.00 | AA– | 3,465,943 |
| | Chester County Health and Education Facilities Authority, Pennsylvania, Health System | | | |
| | Revenue Bonds, Main Line Health System, Series 2017A: | | | |
| 3,200 | | 4.000%, 10/01/36 | 10/27 at 100.00 | AA | 3,750,272 |
| 1,935 | | 4.000%, 10/01/37 | 10/27 at 100.00 | AA | 2,261,570 |
| 6,395 | | Chester County Health and Education Facilities Authority, Pennsylvania, Health System | 9/30 at 100.00 | AA | 7,594,063 |
| | Revenue Bonds, Main Line Health System, Series 2020A, 4.000%, 9/01/50 | | | |
| | Dauphin County General Authority, Pennsylvania, Health System Revenue Bonds, Pinnacle | | | |
| | Health System Project, Refunding Series 2016A: | | | |
| 1,375 | | 5.000%, 6/01/34 | 6/26 at 100.00 | A+ | 1,658,346 |
| 375 | | 5.000%, 6/01/35 | 6/26 at 100.00 | A+ | 451,643 |
| 3,460 | | Dauphin County General Authority, Pennsylvania, Health System Revenue Bonds, Pinnacle | 6/22 at 100.00 | A+ | 3,730,295 |
| | Health System Project, Series 2012A, 5.000%, 6/01/42 | | | |
| 1,500 | | Doylestown Hospital Authority, Pennsylvania, Hospital Revenue Bonds, Series 2013A, | 7/23 at 100.00 | BBB– | 1,657,995 |
| | 5.000%, 7/01/28 | | | |
| 2,275 | | Doylestown Hospital Authority, Pennsylvania, Hospital Revenue Bonds, Series 2016A, | 7/26 at 100.00 | BBB– | 2,638,067 |
| | 5.000%, 7/01/41 | | | |
| 1,225 | | Doylestown Hospital Authority, Pennsylvania, Hospital Revenue Bonds, Series 2019A, | 7/29 at 100.00 | BBB– | 1,338,227 |
| | 4.000%, 7/01/45 | | | |
| 5,000 | | Dubois Hospital Authority, Pennsylvania, Hospital Revenue Bonds, Penn Highlands | 1/28 at 100.00 | A– | 6,026,600 |
| | Healthcare, Series 2018, 5.000%, 7/15/48 | | | |
| 4,555 | | Geisinger Authority, Montour County, Pennsylvania, Health System Revenue Bonds, | 6/24 at 100.00 | AA | 5,197,164 |
| | Geisinger Health System, Series 2014A, 5.000%, 6/01/41 | | | |
49
| | |
| NQP | Nuveen Pennsylvania Quality Municipal Income Fund |
| Portfolio of Investments (continued) |
| February 29, 2020 |
| | | | | | |
| Principal | | | Optional Call | | |
| Amount (000) | | Description (1) | Provisions (2) | Ratings (3) | Value |
| | Health Care (continued) | | | |
| $ 1,370 | | Indiana County Hospital Authority, Pennsylvania, Hospital Revenue Bonds, Indiana | 6/23 at 100.00 | Ba2 | $ 1,510,329 |
| | Regional Medical Center, Series 2014A, 6.000%, 6/01/39 | | | |
| 2,200 | | Lancaster County Hospital Authority, Revenue Bonds, University of Pennsylvania Health | 8/26 at 100.00 | AA | 2,649,020 |
| | System, Refunding Series 2016B, 5.000%, 8/15/46 (UB) (5) | | | |
| 3,000 | | Lancaster County Hospital Authority, Revenue Bonds, University of Pennsylvania Health | 8/26 at 100.00 | AA | 3,630,510 |
| | System, Series 2016A, 5.000%, 8/15/42 (UB) (5) | | | |
| 3,450 | | Lehigh County General Purpose Authority, Pennsylvania, Hospital Revenue Bonds, Lehigh | 7/26 at 100.00 | A+ | 3,925,134 |
| | Valley Health Network, Refunding Series 2016A, 4.000%, 7/01/35 | | | |
| 2,565 | | Lehigh County General Purpose Authority, Pennsylvania, Hospital Revenue Bonds, Lehigh | 7/22 at 100.00 | A+ | 2,698,662 |
| | Valley Health Network, Series 2012B, 4.000%, 7/01/43 | | | |
| | Lehigh County General Purpose Authority, Pennsylvania, Revenue Bonds, Good Shepherd | | | |
| | Group, Refunding Series 2016: | | | |
| 1,265 | | 3.000%, 11/01/36 | 5/26 at 100.00 | A | 1,336,055 |
| 2,850 | | 4.000%, 11/01/41 (UB) (5) | 5/26 at 100.00 | A | 3,098,007 |
| 4,955 | | 4.000%, 11/01/46 (UB) (5) | 5/26 at 100.00 | A | 5,360,864 |
| 4,600 | | Lehigh County General Purpose Authority, Pennsylvania, Revenue Bonds, Good Shepherd | 11/22 at 100.00 | A | 4,805,114 |
| | Group, Series 2012, 4.000%, 11/01/32 | | | |
| | Monroe County Hospital Authority, Pennsylvania, Hospital Revenue Bonds, Pocono Medical Center, | | | |
| | Series 2016: | | | |
| 1,020 | | 3.375%, 7/01/32 | 7/26 at 100.00 | A+ | 1,094,021 |
| 2,650 | | 5.000%, 7/01/41 | 7/26 at 100.00 | A+ | 3,146,743 |
| 7,500 | | Montgomery County Industrial Development Authority, Pennsylvania, Health System Revenue | 1/25 at 100.00 | Ba1 | 8,596,500 |
| | Bonds, Albert Einstein Healthcare Network Issue, Series 2015A, 5.250%, 1/15/45 | | | |
| 4,000 | | Pennsylvania Economic Development Financing Authority, Revenue Bonds, University of | 7/23 at 100.00 | A+ | 4,418,240 |
| | Pittsburgh Medical Center, Series 2013A, 5.000%, 7/01/43 | | | |
| 16,385 | | Pennsylvania Higher Educational Facilities Authority, Revenue Bonds, University of | 8/26 at 100.00 | AA | 18,633,677 |
| | Pennsylvania Health System, Refunding Series 2016C, 4.000%, 8/15/41 (UB) (5) | | | |
| 3,100 | | Pennsylvania Higher Educational Facilities Authority, Revenue Bonds, University of | 8/22 at 100.00 | AA | 3,348,372 |
| | Pennsylvania Health System, Series 2012A, 5.000%, 8/15/42 | | | |
| 13,525 | | Pennsylvania Higher Educational Facilities Authority, Revenue Bonds, University of | 8/29 at 100.00 | AA | 15,880,920 |
| | Pennsylvania Health System, Series 2019, 4.000%, 8/15/49 (UB) (5) | | | |
| 4,885 | | Philadelphia Hospitals and Higher Education Facilities Authority, Pennsylvania, Hospital | 7/22 at 100.00 | BBB– | 5,313,805 |
| | Revenue Bonds, Temple University Health System Obligated Group, Series 2012A, 5.625%, 7/01/42 | | | |
| 2,440 | | Philadelphia Hospitals and Higher Education Facilities Authority, Pennsylvania, Hospital | 7/21 at 100.00 | AA | 2,801,828 |
| | Revenue Bonds, Children’s Hospital of Philadelphia, Tender Option Bond Trust 2015-XF0114, | | | |
| | 11.212%, 7/01/41, 144A (IF) | | | |
| | Pocono Mountains Industrial Park Authority, Pennsylvania, Hospital Revenue Bonds, Saint | | | |
| | Luke’s Hospital -Monroe Project, Series 2015A: | | | |
| 3,000 | | 5.000%, 8/15/40 | 2/25 at 100.00 | A– | 3,480,720 |
| 1,170 | | 4.000%, 8/15/45 | 2/25 at 100.00 | A– | 1,280,588 |
| 3,000 | | Pottsville Hospital Authority, Pennsylvania, Hospital Revenue Bonds, Lehigh Valley Health Network, | 1/27 at 100.00 | A+ | 3,573,030 |
| | Series 2016B, 5.000%, 7/01/45 | | | |
| 2,000 | | Saint Mary Hospital Authority, Pennsylvania, Hospital Revenue Bonds, Trinity Health | 12/28 at 100.00 | AA– | 2,533,240 |
| | Credit Group, Refunding Series 2019PA, 5.000%, 12/01/48 | | | |
| 3,000 | | Southcentral Pennsylvania General Authority, Revenue Bonds, Wellspan Health Obligated | 6/24 at 100.00 | Aa3 | 3,387,720 |
| | Group, Refunding Series 2014A, 5.000%, 6/01/44 | | | |
| 2,000 | | Southcentral Pennsylvania General Authority, Revenue Bonds, Wellspan Health Obligated | 6/29 at 100.00 | Aa3 | 2,516,500 |
| | Group, Series 2019A, 5.000%, 6/01/49 | | | |
| 1,800 | | The Hospitals and Higher Education Facilities Authority of Philadelphia, Pennsylvania, Hospital | 7/27 at 100.00 | BBB– | 2,171,862 |
| | Revenue Bonds, Temple University Health System Obligated Group, Series of 2017, | | | |
| | 5.000%, 7/01/30 | | | |
| 3,470 | | Washington County Hospital Authority, Pennsylvania, Hospital Revenue Bonds, The | 7/23 at 100.00 | A | 3,807,145 |
| | Washington Hospital Project, Series 2013A, 5.000%, 7/01/28 | | | |
50
| | | | | | |
| Principal | | | Optional Call | | |
| Amount (000) | | Description (1) | Provisions (2) | Ratings (3) | Value |
| | Health Care (continued) | | | |
| | West Shore Area Authority, Cumberland County, Pennsylvania, Hospital Revenue Bonds, Holy | | | |
| | Spirit Hospital of the Sisters of Christian Charity, Series 2011B: | | | |
| $ 1,835 | | 5.625%, 1/01/32 | 1/22 at 100.00 | AA | $ 1,981,029 |
| 1,970 | | 5.750%, 1/01/41 | 1/22 at 100.00 | AA | 2,130,457 |
| 575 | | Westmoreland County Industrial Development Authority, Pennsylvania, Health System | 7/20 at 100.00 | Baa1 | 581,659 |
| | Revenue Bonds, Excela Health Project, Series 2010A, 5.125%, 7/01/30 | | | |
| 176,810 | | Total Health Care | | | 201,975,516 |
| | Housing/Multifamily – 1.2% (0.8% of Total Investments) | | | |
| 160 | | Chester County Industrial Development Authority, Pennsylvania, Student Housing Revenue | 8/23 at 100.00 | Baa3 | 175,833 |
| | Bonds, University Student Housing, LLC Project at West Chester University Series 2013A, | | | |
| | 5.000%, 8/01/45 | | | |
| 1,650 | | Clarion County Industrial Development Authority, Pennsylvania, Revenue Bonds, Clarion | 7/24 at 100.00 | Baa3 | 1,751,656 |
| | University Foundation Inc Student Housing Project at Clarion University, Series 2014A, | | | |
| | 5.000%, 7/01/45 | | | |
| 1,235 | | East Hempfield Township Industrial Development Authority, Pennsylvania, Student Services | 7/24 at 100.00 | BBB– | 1,382,978 |
| | Inc – Student Housing Project at Millersville University, Series 2014, 5.000%, 7/01/46 | | | |
| 1,900 | | East Hempfield Township Industrial Development Authority, Pennsylvania, Student Services | 7/25 at 100.00 | BBB– | 2,167,672 |
| | Inc – Student Housing Project at Millersville University, Series 2015, 5.000%, 7/01/47 | | | |
| 270 | | Pennsylvania Higher Educational Facilities Authority, Revenue Bonds, University | 7/26 at 100.00 | Baa3 | 319,224 |
| | Properties Inc Student Housing Project at East Stroudsburg University of Pennsylvania, Series | | | |
| | 2016A, 5.000%, 7/01/31 | | | |
| 1,577 | | Philadelphia Authority for Industrial Development, Pennsylvania, Multifamily Housing | 3/20 at 100.00 | Baa3 | 1,579,618 |
| | Revenue Bonds, Presbyterian Homes Germantown – Morrisville Project, Series 2005A, | | | |
| | 5.625%, 7/01/35 | | | |
| 6,792 | | Total Housing/Multifamily | | | 7,376,981 |
| | Housing/Single Family – 14.9% (9.5% of Total Investments) | | | |
| | Pennsylvania Housing Finance Agency, Single Family Mortgage Revenue Bonds, | | | |
| | Series 2012-114: | | | |
| 4,750 | | 3.300%, 10/01/32 (UB) (5) | 10/21 at 100.00 | AA+ | 4,855,070 |
| 4,425 | | 3.650%, 10/01/37 | 10/21 at 100.00 | AA+ | 4,521,554 |
| 2,275 | | 3.650%, 10/01/37 (UB) (5) | 10/21 at 100.00 | AA+ | 2,324,641 |
| 1,830 | | 3.700%, 10/01/42 (UB) (5) | 10/21 at 100.00 | AA+ | 1,866,728 |
| | Pennsylvania Housing Finance Agency, Single Family Mortgage Revenue Bonds, Series | | | |
| | 2015-116B: | | | |
| 2,330 | | 3.950%, 10/01/40 (UB) (5) | 10/24 at 100.00 | AA+ | 2,506,381 |
| 3,000 | | 4.000%, 4/01/45 (UB) (5) | 10/24 at 100.00 | AA+ | 3,200,220 |
| | Pennsylvania Housing Finance Agency, Single Family Mortgage Revenue Bonds, Series | | | |
| | 2015-117B: | | | |
| 3,290 | | 3.900%, 10/01/35 (UB) | 10/24 at 100.00 | AA+ | 3,566,163 |
| 870 | | 4.050%, 10/01/40 (UB) (5) | 4/20 at 100.00 | AA+ | 872,210 |
| 2,045 | | Pennsylvania Housing Finance Agency, Single Family Mortgage Revenue Bonds, Series | 4/25 at 100.00 | AA+ | 2,186,984 |
| | 2016-119, 3.500%, 10/01/36 | | | |
| 7,000 | | Pennsylvania Housing Finance Agency, Single Family Mortgage Revenue Bonds, Series | 10/25 at 100.00 | AA+ | 7,340,550 |
| | 2016-120, 3.200%, 4/01/40 (UB) (5) | | | |
| 22,450 | | Pennsylvania Housing Finance Agency, Single Family Mortgage Revenue Bonds, Series | 10/25 at 100.00 | AA+ | 23,483,149 |
| | 2016-121, 3.200%, 10/01/41 (UB) (5) | | | |
| | Pennsylvania Housing Finance Agency, Single Family Mortgage Revenue Bonds, | | | |
| | Series 2017-122: | | | |
| 2,000 | | 3.650%, 10/01/32 (UB) (5) | 4/26 at 100.00 | AA+ | 2,203,580 |
| 6,725 | | 3.900%, 10/01/36 (UB) (5) | 4/26 at 100.00 | AA+ | 7,427,224 |
| | Pennsylvania Housing Finance Agency, Single Family Mortgage Revenue Bonds, Series | | | |
| | 2017-123B: | | | |
| 4,160 | | 3.450%, 10/01/32 (UB) (5) | 10/26 at 100.00 | AA+ | 4,578,496 |
| 4,165 | | 3.900%, 10/01/37 (UB) (5) | 10/26 at 100.00 | AA+ | 4,622,275 |
51
| | |
| NQP | Nuveen Pennsylvania Quality Municipal Income Fund |
| Portfolio of Investments (continued) |
| February 29, 2020 |
| | | | | | |
| Principal | | | Optional Call | | |
| Amount (000) | | Description (1) | Provisions (2) | Ratings (3) | Value |
| | Housing/Single Family (continued) | | | |
| $ 5,000 | | Pennsylvania Housing Finance Agency, Single Family Mortgage Revenue Bonds, Series | 10/26 at 100.00 | AA+ | $ 5,413,900 |
| | 2017-124B, 3.500%, 10/01/37 (UB) (5) | | | |
| | Pennsylvania Housing Finance Agency, Single Family Mortgage Revenue Bonds, | | | |
| | Series 2018-126A: | | | |
| 2,400 | | 3.700%, 10/01/33 (UB) (5) | 4/27 at 100.00 | AA+ | 2,693,304 |
| 2,260 | | 3.950%, 10/01/38 (UB) (5) | 4/27 at 100.00 | AA+ | 2,533,460 |
| 3,880 | | Pennsylvania Housing Finance Agency, Single Family Mortgage Revenue Bonds, Series | 4/29 at 100.00 | AA+ | 4,117,378 |
| | 2019-131A, 3.000%, 10/01/39 | | | |
| 520 | | Pennsylvania Housing Finance Agency, Single Family Mortgage Revenue Bonds, Tender Option | 10/22 at 100.00 | AA+ | 589,342 |
| | Bonds Trust 2015-XF0109, 8.274%, 10/01/31, 144A (IF) (5) | | | |
| 85,375 | | Total Housing/Single Family | | | 90,902,609 |
| | Industrials – 0.9% (0.6% of Total Investments) | | | |
| | Pennsylvania Economic Development Financing Authority, Exempt Facilities Revenue | | | |
| | Refunding Bonds, Amtrak Project, Series 2012A: | | | |
| 2,495 | | 5.000%, 11/01/23 (AMT) | 11/22 at 100.00 | A1 | 2,747,943 |
| 545 | | 5.000%, 11/01/27 (AMT) | 11/22 at 100.00 | A1 | 598,830 |
| 2,000 | | 5.000%, 11/01/41 (AMT) | 11/22 at 100.00 | A1 | 2,165,060 |
| 5,040 | | Total Industrials | | | 5,511,833 |
| | Long-Term Care – 6.8% (4.3% of Total Investments) | | | |
| | Berks County Industrial Development Authority, Pennsylvania, Healthcare Facilities Revenue | | | |
| | Bonds, The Highlands at Wyomissing, Series 2018: | | | |
| 1,000 | | 5.000%, 5/15/43 | 5/25 at 102.00 | BBB | 1,143,890 |
| 400 | | 5.000%, 5/15/48 | 5/25 at 102.00 | BBB | 454,944 |
| | Berks County Industrial Development Authority, Pennsylvania, Healthcare Facilities | | | |
| | Revenue Bonds, Highlands at Wyomissing, Series 2017A: | | | |
| 940 | | 5.000%, 5/15/37 | 5/27 at 100.00 | BBB | 1,113,975 |
| 1,160 | | 5.000%, 5/15/47 | 5/27 at 100.00 | BBB | 1,348,117 |
| 1,760 | | Chester County Health and Education Facilities Authority, Pennsylvania, Revenue Bonds, | 12/25 at 103.00 | N/R | 1,984,893 |
| | Simpson Senior Services Project, Series 2019, 5.000%, 12/01/51 | | | |
| 230 | | Chester County Health and Education Facilities Authority, Pennsylvania, Revenue Bonds, | 12/25 at 100.00 | N/R | 258,617 |
| | Simpson Senior Services Project, Series 2015A, 5.000%, 12/01/35 | | | |
| | Cumberland County Municipal Authority, Pennsylvania, Revenue Bonds, Diakon Lutheran | | | |
| | Social Ministries Project, Series 2016: | | | |
| 985 | | 5.000%, 1/01/28 | 1/26 at 100.00 | BBB+ | 1,158,281 |
| 1,815 | | 5.000%, 1/01/29 | 1/26 at 100.00 | BBB+ | 2,132,843 |
| 735 | | 5.000%, 1/01/30 | 1/26 at 100.00 | BBB+ | 860,582 |
| 300 | | 3.250%, 1/01/36 | 1/26 at 100.00 | BBB+ | 309,645 |
| 2,015 | | 3.250%, 1/01/39 | 1/26 at 100.00 | BBB+ | 2,074,523 |
| | Cumberland County Municipal Authority, Pennsylvania, Revenue Bonds, Diakon Lutheran | | | |
| | Social Ministries Project, Series 2015: | | | |
| 4,380 | | 4.000%, 1/01/33 | 1/25 at 100.00 | BBB+ | 4,687,607 |
| 5,740 | | 5.000%, 1/01/38 | 1/25 at 100.00 | BBB+ | 6,484,535 |
| | Cumberland County Municipal Authority, Pennsylvania, Revenue Bonds, Diakon Lutheran | | | |
| | Social Ministries Project, Series 2019A: | | | |
| 690 | | 4.125%, 1/01/38 | 1/29 at 100.00 | BBB+ | 769,274 |
| 1,410 | | 5.000%, 1/01/39 | 1/29 at 100.00 | BBB+ | 1,712,741 |
| 3,005 | | Cumberland County Municipal Authority, Pennsylvania, Revenue Bonds, Asbury Pennsylvania | 1/25 at 104.00 | N/R | 3,358,298 |
| | Obligated Group, Refunding Series 2019, 5.000%, 1/01/45 | | | |
| 650 | | Lancaster County Hospital Authority, Pennsylvania, Health Center Revenue Bonds, Masonic | 5/25 at 100.00 | A | 745,999 |
| | Villages Project, Series 2015, 5.000%, 11/01/35 | | | |
| 530 | | Lancaster County Hospital Authority, Pennsylvania, Health Center Revenue Bonds, Saint | 4/22 at 100.00 | BB+ | 557,979 |
| | Anne’s Retirement Community, Inc, Series 2012, 5.000%, 4/01/33 | | | |
| | Lancaster County Hospital Authority, Pennsylvania, Health Center Revenue Bonds, Saint | | | |
| | Anne’s Retirement Community, Inc, Series 2020: | | | |
| 975 | | 5.000%, 3/01/40 (WI/DD, Settling 3/03/20) | 3/27 at 102.00 | BB+ | 1,137,991 |
| 715 | | 5.000%, 3/01/50 (WI/DD, Settling 3/03/20) | 3/27 at 102.00 | BB+ | 825,074 |
52
| | | | | | |
| Principal | | | Optional Call | | |
| Amount (000) | | Description (1) | Provisions (2) | Ratings (3) | Value |
| | Long-Term Care (continued) | | | |
| $ 1,250 | | Lancaster County Hospital Authority, Pennsylvania, Revenue Bonds, Landis Homes | 7/25 at 100.00 | BBB– | $ 1,376,725 |
| | Retirement Community Project, Refunding Series 2015A, 5.000%, 7/01/45 | | | |
| 1,500 | | Langhorne Manor Boro Higher Education and Health Authority, Pennsylvania, Revenue Bonds, | 3/20 at 100.00 | A– | 1,502,130 |
| | Woods Services Project, Series 2013, 4.000%, 11/15/38 | | | |
| 2,150 | | Montgomery County Industrial Development Authority, Pennsylvania, Revenue Bonds, ACTS | 5/22 at 100.00 | A– | 2,325,096 |
| | Retirement-Life Communities, Inc Obligated Group, Refunding Series 2012, 5.000%, 11/15/26 | | | |
| | Northampton County Industrial Development Authority, Pennsylvania, Revenue Bonds, | | | |
| | Morningstar Senior Living, Inc, Series 2019: | | | |
| 1,845 | | 5.000%, 11/01/44 | 11/26 at 103.00 | BB+ | 2,112,820 |
| 1,000 | | 5.000%, 11/01/49 | 11/26 at 103.00 | BB+ | 1,138,610 |
| 37,180 | | Total Long-Term Care | | | 41,575,189 |
| | Materials – 1.1% (0.7% of Total Investments) | | | |
| 6,455 | | Pennsylvania Economic Development Financing Authority, Exempt Facilities Revenue Bonds, | 11/24 at 100.00 | N/R | 6,982,374 |
| | National Gypsum Company, Refunding Series 2014, 5.500%, 11/01/44 (AMT) | | | |
| | Tax Obligation/General – 21.7% (13.9% of Total Investments) | | | |
| 840 | | Adams County, Pennsylvania, General Obligation Bonds, Series 2017B, 2.500%, 11/15/29 | 11/25 at 100.00 | Aa2 | 893,222 |
| 1,700 | | Allegheny County, Pennsylvania, General Obligation Bonds, Series 2011C-65, | 5/21 at 100.00 | AA– | 1,787,244 |
| | 5.375%, 5/01/31 | | | |
| | Allegheny County, Pennsylvania, General Obligation Bonds, Series 2013C-72: | | | |
| 2,780 | | 5.250%, 12/01/32 | 12/23 at 100.00 | AA– | 3,223,632 |
| 2,000 | | 5.250%, 12/01/33 | 12/23 at 100.00 | AA– | 2,318,460 |
| | Allegheny County, Pennsylvania, General Obligation Bonds, Series 2014C-74: | | | |
| 1,750 | | 5.000%, 12/01/32 | 12/24 at 100.00 | AA– | 2,067,695 |
| 1,285 | | 5.000%, 12/01/34 | 12/24 at 100.00 | AA– | 1,514,141 |
| 2,400 | | Allegheny County, Pennsylvania, General Obligation Bonds, Series 2018C-77, | 11/28 at 100.00 | AA– | 3,031,776 |
| | 5.000%, 11/01/43 | | | |
| 5,100 | | Allegheny County, Pennsylvania, General Obligation Bonds, Series C69-C70 of 2012, | 12/22 at 100.00 | AA– | 5,647,587 |
| | 5.000%, 12/01/37 | | | |
| | Bethel Park School District, Allegheny County, Pennsylvania, General Obligation Bonds, | | | |
| | Refunding Series 2016: | | | |
| 1,500 | | 4.000%, 8/01/31 | 8/26 at 100.00 | Aa2 | 1,762,710 |
| 1,255 | | 4.000%, 8/01/33 | 8/26 at 100.00 | Aa2 | 1,464,033 |
| 1,950 | | Boyertown Area School District, Berks and Montgomery Counties, Pennsylvania, General | 4/24 at 100.00 | AA– | 2,237,216 |
| | Obligation Bonds, Series 2015, 5.000%, 10/01/38 | | | |
| | Canon-McMillan School District, Washington County, Pennsylvania, General Obligation | | | |
| | Bonds, Series 2014D: | | | |
| 3,000 | | 5.000%, 12/15/37 | 12/24 at 100.00 | AA | 3,510,990 |
| 1,075 | | 5.000%, 12/15/38 – BAM Insured | 12/24 at 100.00 | AA | 1,256,847 |
| 1,100 | | 5.000%, 12/15/39 | 12/24 at 100.00 | AA | 1,286,065 |
| 2,900 | | Colonial School District, Montgomery County, Pennsylvania, General Obligation Bonds, | 2/27 at 100.00 | Aaa | 3,564,361 |
| | Series 2020, 5.000%, 2/15/44 | | | |
| 7,465 | | Erie City School District, Erie County, Pennsylvania, General Obligation Bonds, Series | No Opt. Call | N/R | 5,866,744 |
| | 2000, 0.000%, 9/01/30 – AMBAC Insured | | | |
| 6,225 | | Lehighton Area School District, Carbon County, Pennsylvania, General Obligation Bonds, | 11/23 at 100.00 | AA | 7,030,888 |
| | Limited Tax Series 2015A, 5.000%, 11/15/43 – BAM Insured | | | |
| | North Allegheny School District, Allegheny County, Pennsylvania, General Obligation | | | |
| | Bonds, Series 2015: | | | |
| 5,000 | | 5.000%, 5/01/31 | 5/25 at 100.00 | AA | 5,997,550 |
| 4,000 | | 5.000%, 5/01/32 | 5/25 at 100.00 | AA | 4,787,920 |
| 2,875 | | 5.000%, 5/01/33 | 5/25 at 100.00 | AA | 3,434,734 |
| | Penn Manor School District, Lancaster County, Pennsylvania, General Obligation Bonds, | | | |
| | Series 2019A: | | | |
| 1,000 | | 4.000%, 3/01/35 | 9/27 at 100.00 | AA | 1,158,540 |
| 1,000 | | 4.000%, 3/01/36 | 9/27 at 100.00 | AA | 1,156,190 |
53
| | |
| NQP | Nuveen Pennsylvania Quality Municipal Income Fund |
| Portfolio of Investments (continued) |
| February 29, 2020 |
| | | | | | |
| Principal | | | Optional Call | | |
| Amount (000) | | Description (1) | Provisions (2) | Ratings (3) | Value |
| | Tax Obligation/General (continued) | | | |
| | Pennsbury School District, Bucks County, Pennsylvania, General Obligation Bonds, | | | |
| | Series 2016A: | | | |
| $ 1,000 | | 5.000%, 10/01/33 | 4/25 at 100.00 | Aa2 | $ 1,192,640 |
| 2,660 | | 5.000%, 10/01/34 | 4/25 at 100.00 | Aa2 | 3,168,752 |
| 2,045 | | 5.000%, 10/01/35 | 4/25 at 100.00 | Aa2 | 2,433,018 |
| 2,620 | | Pennsylvania Economic Development Financing Authority, Parking System Revenue Bonds, | 1/24 at 100.00 | AA | 3,046,667 |
| | Capitol Region Parking System, Junior Insured Series 2013C, 5.500%, 1/01/30 – AGM Insured | | | |
| 3,925 | | Philadelphia School District, Pennsylvania, General Obligation Bonds, Series 2007A, | No Opt. Call | A+ | 5,355,663 |
| | 5.000%, 6/01/34 – NPFG Insured | | | |
| 745 | | Pittsburgh School District, Allegheny County, Pennsylvania, General Obligation Bonds, | 9/22 at 100.00 | AA | 822,137 |
| | Series 2014A, 5.000%, 9/01/25 – BAM Insured | | | |
| | Pittsburgh, Pennsylvania, General Obligation Bonds, Series 2012B: | | | |
| 2,590 | | 5.000%, 9/01/25 | 9/22 at 100.00 | AA– | 2,850,709 |
| 6,800 | | 5.000%, 9/01/26 | 9/22 at 100.00 | AA– | 7,475,648 |
| 1,000 | | Radnor Township, Pennsylvania, General Obligation Bonds, Series 2012, 4.000%, 11/01/37 | 11/22 at 100.00 | Aa1 | 1,070,710 |
| 11,440 | | Reading School District, Berks County, Pennsylvania, General Obligation Bonds, Series | No Opt. Call | Baa2 | 8,856,848 |
| | 2003B, 0.000%, 1/15/32 – NPFG Insured | | | |
| | Scranton, Lackawanna County, Pennsylvania, General Obligation Notes, Series 2016: | | | |
| 260 | | 5.000%, 11/15/26 | 5/24 at 100.00 | BB+ | 290,761 |
| 2,925 | | 5.000%, 11/15/32 | 5/24 at 100.00 | BB+ | 3,228,966 |
| 21,000 | | State Public School Building Authority, Pennsylvania, Lease Revenue Bonds, Philadelphia | No Opt. Call | AA | 27,633,690 |
| | School District, Series 2003, 5.500%, 6/01/28 – AGM Insured (UB) (5) | | | |
| | The Redevelopment Authority of the City of Scranton, Lackawanna county, Pennsylvania, | | | |
| | Guaranteed Lease Revenue Bonds, Series 2016A: | | | |
| 170 | | 5.000%, 11/15/21 | No Opt. Call | BB+ | 176,045 |
| 170 | | 5.000%, 11/15/28 | 5/24 at 100.00 | BB+ | 179,124 |
| 117,550 | | Total Tax Obligation/General | | | 132,779,923 |
| | Tax Obligation/Limited – 9.3% (5.9% of Total Investments) | | | |
| 1,070 | | Allegheny County Redevelopment Authority, Pennsylvania, TIF Revenue Bonds, Pittsburg | 3/20 at 100.00 | N/R | 1,070,086 |
| | Mills Project, Series 2004, 5.600%, 7/01/23 | | | |
| 1,475 | | Allentown Neighborhood Improvement Zone Development Authority, Pennsylvania, Tax | 5/22 at 100.00 | Baa3 | 1,580,094 |
| | Revenue Bonds, Series 2012A, 5.000%, 5/01/35 | | | |
| 155 | | Allentown Neighborhood Improvement Zone Development Authority, Pennsylvania, Tax Revenue | 5/28 at 100.00 | Ba3 | 188,840 |
| | Bonds, City Center Project, Series 2018, 5.000%, 5/01/33, 144A | | | |
| 1,115 | | Allentown Neighborhood Improvement Zone Development Authority, Pennsylvania, Tax Revenue | 5/27 at 100.00 | Ba3 | 1,305,464 |
| | Bonds, City Center Refunding Project, Series 2017, 5.000%, 5/01/42, 144A | | | |
| 1,000 | | Chester, Delaware County, Pennsylvania, Tax and Revenue Anticipation Notes, Series 2020, | 7/20 at 100.00 | N/R | 988,073 |
| | 4.125%, 11/30/20, 144A | | | |
| | Commonwealth Financing Authority, Pennsylvania, State Appropriation Lease Bonds, Master | | | |
| | Settlement, Series 2018: | | | |
| 1,135 | | 5.000%, 6/01/33 | 6/28 at 100.00 | A1 | 1,431,882 |
| 1,250 | | 4.000%, 6/01/39 – AGM Insured | 6/28 at 100.00 | AA | 1,436,975 |
| 7,215 | | 4.000%, 6/01/39 – AGM Insured (UB) (5) | 6/28 at 100.00 | AA | 8,294,220 |
| | Government of Guam, Business Privilege Tax Bonds, Series 2011A: | | | |
| 1,670 | | 5.250%, 1/01/36 | 1/22 at 100.00 | BB | 1,777,130 |
| 655 | | 5.125%, 1/01/42 | 1/22 at 100.00 | BB | 693,435 |
| 1,620 | | Monroe County Industrial Development Authority, Pennsylvania, Special Obligation Revenue | 7/24 at 100.00 | N/R | 1,710,331 |
| | Bonds, Tobyhanna Township Project, Series 2014, 6.875%, 7/01/33, 144A | | | |
| | Pennsylvania Turnpike Commission, Motor License Fund-Enhanced Turnpike Subordinate | | | |
| | Special Revenue Bonds, Series 2014A: | | | |
| 2,650 | | 0.000%, 12/01/37 (6) | 12/26 at 100.00 | AA– | 2,894,383 |
| 4,000 | | 0.000%, 12/01/44 (6) | 12/26 at 100.00 | AA– | 4,339,160 |
| 2,500 | | Pennsylvania Turnpike Commission, Oil Franchise Tax Revenue Bonds, Subordinate Series | 12/28 at 100.00 | A+ | 3,100,050 |
| | 2018B, 5.000%, 12/01/48 | | | |
| 5,530 | | Philadelphia Authority For Industrial Development, Pennsylvania, City Agreement Revenue | 12/25 at 100.00 | A | 6,681,567 |
| | Bonds, Cultural and Commercial Corridors Program, Refunding Series 2016A, 5.000%, 12/01/30 | | | |
54
| | | | | | |
| Principal | | | Optional Call | | |
| Amount (000) | | Description (1) | Provisions (2) | Ratings (3) | Value |
| | Tax Obligation/Limited (continued) | | | |
| $ 3,820 | | Pittsburgh and Allegheny County Sports and Exhibition Authority, Pennsylvania, Hotel | 8/22 at 100.00 | AA | $ 4,180,035 |
| | Room Excise Tax Revenue Bonds, Refunding Series 2012, 5.000%, 2/01/26 – AGM Insured | | | |
| 4,225 | | Puerto Rico Highway and Transportation Authority, Highway Revenue Bonds, Series 2007N, | No Opt. Call | C | 4,777,250 |
| | 5.500%, 7/01/29 – AMBAC Insured | | | |
| | Puerto Rico Sales Tax Financing Corporation, Sales Tax Revenue Bonds, Restructured 2018A-1: | | | |
| 83 | | 4.750%, 7/01/53 | 7/28 at 100.00 | N/R | 93,966 |
| 3,885 | | 5.000%, 7/01/58 | 7/28 at 100.00 | N/R | 4,455,590 |
| | Puerto Rico Sales Tax Financing Corporation, Sales Tax Revenue Bonds, Taxable | | | |
| | Restructured Cofina Project Series 2019A-2: | | | |
| 705 | | 4.329%, 7/01/40 | 7/28 at 100.00 | N/R | 783,537 |
| 413 | | 4.329%, 7/01/40 | 7/28 at 100.00 | N/R | 459,008 |
| 3,295 | | 4.784%, 7/01/58 | 7/28 at 100.00 | N/R | 3,724,174 |
| 825 | | Washington County Redevelopment Authority, Pennsylvania, Tanger Outlet Victory Center | 1/28 at 100.00 | BB | 919,817 |
| | Tax Increment Bonds, Series 2018, 5.000%, 7/01/35 | | | |
| 50,291 | | Total Tax Obligation/Limited | | | 56,885,067 |
| | Transportation – 9.8% (6.3% of Total Investments) | | | |
| | Delaware River Port Authority, Pennsylvania and New Jersey, Revenue Refunding Bonds, | | | |
| | Port District Project, Series 2012: | | | |
| 2,425 | | 5.000%, 1/01/23 | No Opt. Call | A | 2,676,836 |
| 2,310 | | 5.000%, 1/01/24 | 1/23 at 100.00 | A | 2,552,481 |
| 610 | | 5.000%, 1/01/25 | 1/23 at 100.00 | A | 673,849 |
| 4,000 | | Pennsylvania Economic Development Financing Authority, Parking System Revenue Bonds, | 1/24 at 100.00 | AA | 4,504,840 |
| | Capitol Region Parking System, Series 2013A, 5.250%, 1/01/44 – AGM Insured | | | |
| 12,100 | | Pennsylvania Turnpike Commission, Turnpike Revenue Bonds, Capital Appreciation Series | 12/27 at 100.00 | A | 16,380,617 |
| | 2009E, 6.375%, 12/01/38 | | | |
| 820 | | Pennsylvania Turnpike Commission, Turnpike Revenue Bonds, Refunding Subordinate Second | 6/26 at 100.00 | A3 | 982,827 |
| | Series 2016B-2, 5.000%, 6/01/39 | | | |
| 3,000 | | Pennsylvania Turnpike Commission, Turnpike Revenue Bonds, Series 2014C, 5.000%, 12/01/44 | 12/24 at 100.00 | A+ | 3,487,620 |
| 10,470 | | Pennsylvania Turnpike Commission, Turnpike Revenue Bonds, Series 2015B, 5.000%, | 12/25 at 100.00 | A1 | 12,409,672 |
| | 12/01/45 (UB) (5) | | | |
| 2,000 | | Pennsylvania Turnpike Commission, Turnpike Revenue Bonds, Subordinate Series 2009C, | 6/26 at 100.00 | AA | 2,587,640 |
| | 6.250%, 6/01/33 – AGM Insured | | | |
| | Pennsylvania Turnpike Commission, Turnpike Revenue Bonds, Subordinate Series 2017B-1: | | | |
| 1,430 | | 5.000%, 6/01/31 | 6/27 at 100.00 | A3 | 1,779,721 |
| 1,430 | | 5.000%, 6/01/33 | 6/27 at 100.00 | A3 | 1,767,852 |
| 1,500 | | Pennsylvania Turnpike Commission, Turnpike Revenue Bonds, Subordinate Series 2019A, | 12/29 at 100.00 | A3 | 1,709,040 |
| | 4.000%, 12/01/49 | | | |
| 585 | | Philadelphia, Pennsylvania, Airport Revenue Bonds, Refunding Series 2017A, 3.000%, | 7/27 at 100.00 | AA | 625,540 |
| | 7/01/34 – AGM Insured | | | |
| 1,500 | | Philadelphia, Pennsylvania, Airport Revenue Bonds, Refunding Series 2017B, 5.000%, | 7/27 at 100.00 | A | 1,817,955 |
| | 7/01/42 (AMT) | | | |
| 1,865 | | Philadelphia, Pennsylvania, Airport Revenue Bonds, Series 2010A, 5.250%, 6/15/28 | 6/20 at 100.00 | A | 1,887,380 |
| | Pittsburgh and Allegheny County Sports and Exhibition Authority, Pennsylvania, Parking | | | |
| | Revenue Bonds, Series 2017: | | | |
| 1,000 | | 5.000%, 12/15/30 | 12/27 at 100.00 | A | 1,252,370 |
| 500 | | 5.000%, 12/15/33 | 12/27 at 100.00 | A | 621,640 |
| 550 | | 5.000%, 12/15/34 | 12/27 at 100.00 | A | 682,242 |
| 1,000 | | 5.000%, 12/15/36 | 12/27 at 100.00 | A | 1,224,990 |
| 250 | | 5.000%, 12/15/37 | 12/27 at 100.00 | A | 304,933 |
| 49,345 | | Total Transportation | | | 59,930,045 |
| | U.S. Guaranteed – 19.4% (12.4% of Total Investments) (7) | | | |
| 2,325 | | Allegheny County, Pennsylvania, General Obligation Bonds, Series 2011C-65, 5.375%, | 5/21 at 100.00 | N/R | 2,448,504 |
| | 5/01/31 (Pre-refunded 5/01/21) | | | |
55
| | |
| NQP | Nuveen Pennsylvania Quality Municipal Income Fund |
| Portfolio of Investments (continued) |
| February 29, 2020 |
| | | | | | |
| Principal | | | Optional Call | | |
| Amount (000) | | Description (1) | Provisions (2) | Ratings (3) | Value |
| | U.S. Guaranteed (7) (continued) | | | |
| | Beaver County Hospital Authority, Pennsylvania, Revenue Bonds, Heritage Valley Health | | | |
| | System, Inc, Series 2012: | | | |
| $ 4,010 | | 5.000%, 5/15/26 (Pre-refunded 5/15/21) | 5/21 at 100.00 | AA– | $ 4,207,212 |
| 2,000 | | 5.000%, 5/15/28 (Pre-refunded 5/15/21) | 5/21 at 100.00 | AA– | 2,098,360 |
| 1,910 | | 5.000%, 5/15/27 (Pre-refunded 5/15/21) | 5/21 at 100.00 | AA– | 2,003,934 |
| 3,000 | | Bristol Township School District, Bucks County, Pennsylvania, General Obligation Bonds, | 6/23 at 100.00 | A2 | 3,427,710 |
| | Series 2013, 5.250%, 6/01/43 (Pre-refunded 6/01/23) | | | |
| | Bucks County Water and Sewer Authority, Pennsylvania, Revenue Bonds, Tender Option Bond | | | |
| | Trust 2015-XF0123: | | | |
| 825 | | 11.158%, 12/01/29, AGM Insured, (Pre-refunded 12/01/21), 144A (IF) (5) | 12/21 at 100.00 | AA | 1,008,282 |
| 1,665 | | 11.167%, 12/01/33, (Pre-refunded 12/01/21), 144A (IF) (5) | 12/21 at 100.00 | AA | 2,035,263 |
| 4,000 | | Central Bradford Progress Authority, Pennsylvania, Revenue Bonds, Guthrie Health, | 12/21 at 100.00 | AA– | 4,311,240 |
| | Refunding Series 2011, 5.375%, 12/01/41 (Pre-refunded 12/01/21) | | | |
| 4,100 | | Centre County Hospital Authority, Pennsylvania, Hospital Revenue Bonds, Mount Nittany | 11/21 at 100.00 | AA– | 4,522,382 |
| | Medical Center Project, Series 2011, 7.000%, 11/15/46 (Pre-refunded 11/15/21) | | | |
| 310 | | Centre County, Pennsylvania, General Obligation Bonds, Series 2012B, 4.000%, 7/01/24 | 7/20 at 100.00 | AA | 313,320 |
| | (Pre-refunded 7/01/20) | | | |
| | Chester County Health and Education Facilities Authority, Pennsylvania, Health System | | | |
| | Revenue Bonds, Jefferson Health System, Series 2010A: | | | |
| 1,175 | | 5.000%, 5/15/40 (Pre-refunded 5/15/20) | 5/20 at 100.00 | N/R | 1,184,776 |
| 420 | | 5.000%, 5/15/40 (Pre-refunded 5/15/20) | 5/20 at 100.00 | AA | 423,536 |
| 3,000 | | Erie County Hospital Authority, Pennsylvania, Hospital Revenue Bonds, Saint Vincent | 7/20 at 100.00 | N/R | 3,059,910 |
| | Health Center Project, Series 2010A, 7.000%, 7/01/27 (Pre-refunded 7/01/20) | | | |
| 6,845 | | Franklin County Industrial Development Authority, Pennsylvania, Revenue Bonds, | 7/20 at 100.00 | AA– | 6,946,785 |
| | Chambersburg Hospital Project, Series 2010, 5.375%, 7/01/42 (Pre-refunded 7/01/20) | | | |
| 6,680 | | Gateway School District, Allegheny County, Pennsylvania, General Obligation Bonds, | 10/22 at 100.00 | A1 | 7,236,043 |
| | Refunding Series 2012, 4.000%, 10/15/32 (Pre-refunded 10/15/22) | | | |
| 3,385 | | Lancaster County Hospital Authority, Pennsylvania, Health System Revenue Bonds, | 1/22 at 100.00 | N/R | 4,151,093 |
| | Lancaster General Hospital Project, Tender Option Bond Trust 2015-XF0064, 11.219%, | | | |
| | 7/01/42, (Pre-refunded 1/01/22), 144A (IF) | | | |
| | Lancaster Industrial Development Authority, Pennsylvania, Revenue Bonds, Garden Spot | | | |
| | Village Project, Series 2013: | | | |
| 1,000 | | 5.375%, 5/01/28 (Pre-refunded 5/01/23) | 5/23 at 100.00 | N/R | 1,142,850 |
| 1,665 | | 5.750%, 5/01/35 (Pre-refunded 5/01/23) | 5/23 at 100.00 | N/R | 1,922,309 |
| | Monroe County Hospital Authority, Pennsylvania, Hospital Revenue Bonds, Pocono Medical Center, | | | |
| | Series 2012A: | | | |
| 365 | | 4.000%, 1/01/25 (Pre-refunded 1/01/22) | 1/22 at 100.00 | N/R | 385,258 |
| 3,000 | | 5.000%, 1/01/41 (Pre-refunded 1/01/22) | 1/22 at 100.00 | N/R | 3,220,740 |
| 3,730 | | Montgomery County Higher Education and Health Authority, Pennsylvania, Hospital Revenue | 6/22 at 100.00 | N/R | 4,075,100 |
| | Bonds, Abington Memorial Hospital Obligated Group, Series 2012A, 5.000%, 6/01/31 | | | |
| | (Pre-refunded 6/01/22) | | | |
| 1,130 | | Montgomery County Industrial Development Authority, Pennsylvania, FHA Insured Mortgage | 8/20 at 100.00 | N/R | 1,151,074 |
| | Revenue Bonds, New Regional Medical Center Project, Series 2010, 5.375%, 8/01/38 | | | |
| | (Pre-refunded 8/01/20) | | | |
| 925 | | Montgomery County Industrial Development Authority, Pennsylvania, Health Facilities | 4/22 at 100.00 | AA | 1,005,290 |
| | Revenue Bonds, Jefferson Health System, Series 2012A, 5.000%, 10/01/41 (Pre-refunded 4/01/22) | | | |
| 3,500 | | Norristown Area School District, Pennsylvania, Installment Purchase Certificates of | 4/22 at 100.00 | Baa1 | 3,784,900 |
| | Participation, Series 2012, 5.000%, 4/01/32 (Pre-refunded 4/01/22) | | | |
| 1,415 | | Pennsylvania Higher Educational Facilities Authority, Revenue Bonds, Drexel University, | 5/21 at 100.00 | N/R | 1,488,127 |
| | Series 2011A, 5.250%, 5/01/41 (Pre-refunded 5/01/21) | | | |
| 1,300 | | Pennsylvania Higher Educational Facilities Authority, Revenue Bonds, Edinboro University | 7/20 at 100.00 | N/R | 1,322,152 |
| | Foundation Student Housing Project, Series 2010, 6.000%, 7/01/43 (Pre-refunded 7/01/20) | | | |
56
| | | | | | |
| Principal | | | Optional Call | | |
| Amount (000) | | Description (1) | Provisions (2) | Ratings (3) | Value |
| | U.S. Guaranteed (7) (continued) | | | |
| | Pennsylvania Higher Educational Facilities Authority, Revenue Bonds, Foundation for | | | |
| | Student Housing at Indiana University, Project Series 2012A: | | | |
| $ 1,000 | | 5.000%, 7/01/27 (Pre-refunded 7/01/22) | 7/22 at 100.00 | N/R | $ 1,097,150 |
| 750 | | 5.000%, 7/01/32 (Pre-refunded 7/01/22) | 7/22 at 100.00 | N/R | 822,862 |
| 1,195 | | Pennsylvania Higher Educational Facilities Authority, Revenue Bonds, Philadelphia | 6/23 at 100.00 | N/R | 1,355,823 |
| | University, Refunding Series 2013, 5.000%, 6/01/32 (Pre-refunded 6/01/23) | | | |
| 420 | | Pennsylvania Higher Educational Facilities Authority, Revenue Bonds, Shippensburg | 10/22 at 100.00 | N/R | 464,575 |
| | University Student Services, Inc Student Housing Project at Shippensburg University of | | | |
| | Pennsylvania, Series 2012, 5.000%, 10/01/44 (Pre-refunded 10/01/22) | | | |
| | Pennsylvania Turnpike Commission, Motor License Fund-Enhanced Turnpike Special Revenue | | | |
| | Bonds, Subordinate Series 2010A1&2: | | | |
| 345 | | 5.500%, 12/01/34 (Pre-refunded 12/01/20) | 12/20 at 100.00 | N/R | 357,085 |
| 1,440 | | 5.500%, 12/01/34 (Pre-refunded 12/01/20) | 12/20 at 100.00 | AA– | 1,490,990 |
| | Pennsylvania Turnpike Commission, Motor License Fund-Enhanced Turnpike Special Revenue | | | |
| | Bonds, Subordinate Series 2011B: | | | |
| 2,065 | | 5.000%, 12/01/41 (Pre-refunded 12/01/21) | 12/21 at 100.00 | N/R | 2,217,913 |
| 1,935 | | 5.000%, 12/01/41 (Pre-refunded 12/01/21) | 12/21 at 100.00 | A2 | 2,076,526 |
| 3,180 | | Pennsylvania Turnpike Commission, Motor License Fund-Enhanced Turnpike Special Revenue | 12/21 at 100.00 | AA– | 3,415,479 |
| | Bonds, Subordinate Series 2012A, 5.000%, 12/01/31 (Pre-refunded 12/01/21) | | | |
| 7,000 | | Pennsylvania Turnpike Commission, Motor License Fund-Enhanced Turnpike Subordinate | 12/23 at 100.00 | AA– | 8,135,470 |
| | Special Revenue Bonds, Series 2013B-1, 5.250%, 12/01/43 (Pre-refunded 12/01/23) | | | |
| 105 | | Philadelphia Gas Works, Pennsylvania, Revenue Bonds, Twelfth Series 1990B, 7.000%, | No Opt. Call | N/R | 106,279 |
| | 5/15/20 – NPFG Insured (ETM) | | | |
| 7,165 | | Philadelphia Hospitals and Higher Education Facilities Authority, Pennsylvania, Health | 5/20 at 100.00 | N/R | 7,224,613 |
| | System Revenue Bonds, Jefferson Health System, Series 2010B, 5.000%, 5/15/40 | | | |
| | (Pre-refunded 5/15/20) | | | |
| 3,345 | | Philadelphia, Pennsylvania, General Obligation Bonds, Refunding Series 2011, 6.500%, | 8/20 at 100.00 | A | 3,422,504 |
| | 8/01/41 (Pre-refunded 8/01/20) | | | |
| | Saint Mary Hospital Authority, Pennsylvania, Health System Revenue Bonds, Catholic | | | |
| | Health East, Series 2010A: | | | |
| 55 | | 5.000%, 11/15/40 (Pre-refunded 11/15/20) | 11/20 at 100.00 | N/R | 56,601 |
| 605 | | 5.000%, 11/15/40 (Pre-refunded 11/15/20) | 11/20 at 100.00 | AA– | 622,606 |
| 1,613 | | South Fork Municipal Authority, Pennsylvania, Hospital Revenue Bonds, Conemaugh Valley | 7/20 at 100.00 | N/R | 1,637,372 |
| | Memorial Hospital, Series 2010, 5.500%, 7/01/29 (Pre-refunded 7/01/20) | | | |
| | Union County Hospital Authority, Pennsylvania, Hospital Revenue Bonds, Evangelical | | | |
| | Community Hospital Project, Refunding & Improvement Series 2011: | | | |
| 3,130 | | 6.875%, 8/01/31 (Pre-refunded 8/01/21) | 8/21 at 100.00 | A– | 3,394,391 |
| 2,500 | | 7.000%, 8/01/41 (Pre-refunded 8/01/21) | 8/21 at 100.00 | A– | 2,714,075 |
| 1,930 | | Westmoreland County Municipal Authority, Pennsylvania, Municipal Service Revenue Bonds, | 8/23 at 100.00 | A+ | 3,031,104 |
| | Tender Option Bond Trust 2016-XF1058, 14.365%, 8/15/37, (Pre-refunded 8/15/23), 144A (IF) (5) | | | |
| | West Shore Area Authority, Cumberland County, Pennsylvania, Hospital Revenue Bonds, Holy | | | |
| | Spirit Hospital of the Sisters of Christian Charity Project, Series 2011: | | | |
| 325 | | 6.250%, 1/01/31 (Pre-refunded 1/01/21) | 1/21 at 100.00 | AA | 339,635 |
| 4,555 | | 6.500%, 1/01/36 (Pre-refunded 1/01/21) | 1/21 at 100.00 | AA | 4,769,085 |
| 1,110 | | Wilkes-Barre Finance Authority, Pennsylvania, Revenue Bonds, University of Scranton, | 11/20 at 100.00 | A– | 1,140,514 |
| | Series 2010, 5.000%, 11/01/40 (Pre-refunded 11/01/20) | | | |
| 109,448 | | Total U.S. Guaranteed | | | 118,768,802 |
| | Utilities – 6.2% (3.9% of Total Investments) | | | |
| 2,540 | | Beaver County Industrial Development Authority, Pennsylvania, Pollution Control Revenue | No Opt. Call | N/R | 12,700 |
| | Bonds, FirstEnergy Nuclear Generation Project, Refunding Series 2005A, 4.000%, 1/01/35 (4) | | | |
| 6,210 | | Beaver County Industrial Development Authority, Pennsylvania, Pollution Control Revenue | No Opt. Call | N/R | 31,050 |
| | Bonds, FirstEnergy Nuclear Generation Project, Series 2006B, 3.500%, 12/01/35 (4) | | | |
| 3,000 | | Beaver County Industrial Development Authority, Pennsylvania, Pollution Control Revenue | No Opt. Call | N/R | 3,217,500 |
| | Refunding Bonds, FirstEnergy Nuclear Generation Project, Series 2006A, 4.375%, 1/01/35 | | | |
| | (Mandatory Put 7/01/22) (4) | | | |
57
| | |
| NQP | Nuveen Pennsylvania Quality Municipal Income Fund |
| Portfolio of Investments (continued) |
| February 29, 2020 |
| | | | | | |
| Principal | | | Optional Call | | |
| Amount (000) | | Description (1) | Provisions (2) | Ratings (3) | Value |
| | Utilities (continued) | | | |
| $ 7,250 | | Delaware County Industrial Development Authority, Pennsylvania, Revenue Bonds, Covanta | 7/20 at 100.00 | BB– | $ 7,338,522 |
| | Project, Refunding Series 2015A, 5.000%, 7/01/43 | | | |
| 295 | | Luzerne County Industrial Development Authority, Pennsylvania, Revenue Bonds, | 12/29 at 100.00 | A+ | 314,632 |
| | Pennsylvania-American Water Company Project, Refunding Series 2019, 2.450%, 12/01/39 (AMT) | | | |
| | (Mandatory Put 12/03/29) | | | |
| 9,855 | | Pennsylvania Economic Development Financing Authority, Exempt Facilities Revenue Bonds, | No Opt. Call | N/R | 49,275 |
| | Shippingport Project, First Energy Guarantor, Series 2005A, 3.750%, 12/01/40 | | | |
| 3,475 | | Pennsylvania Economic Development Financing Authority, Exempt Facilities Revenue Bonds, | 10/29 at 100.00 | A– | 3,630,333 |
| | York Water Company Project, Refunding Series 2019A, 3.000%, 10/01/36 (AMT) | | | |
| 3,400 | | Pennsylvania Economic Development Financing Authority, Exempt Facilities Revenue Bonds, | 11/29 at 100.00 | A– | 3,543,310 |
| | York Water Company Project, Refunding Series 2019B, 3.100%, 11/01/38 (AMT) | | | |
| 2,025 | | Pennsylvania Economic Development Financing Authority, Exempt Facilities Revenue | 9/25 at 100.00 | B | 2,372,956 |
| | Refunding Bonds, PPL Energy Supply, LLC Project, Series 2009A, 6.400%, 12/01/38 | | | |
| 7,500 | | Pennsylvania Economic Development Financing Authority, Revenue Bonds, | 10/29 at 100.00 | A+ | 8,045,175 |
| | Pennsylvania-American Water Company, Refunding Series 2019, 3.000%, 4/01/39 | | | |
| 5,000 | | Philadelphia Gas Works, Pennsylvania, Revenue Bonds, General Ordinance, Fifteenth Series | 8/27 at 100.00 | A | 6,030,250 |
| | 2017, 5.000%, 8/01/47 | | | |
| 2,735 | | Philadelphia Gas Works, Pennsylvania, Revenue Bonds, Refunding Thirteenth Series 2015, | 8/25 at 100.00 | A | 3,279,074 |
| | 5.000%, 8/01/29 | | | |
| 53,285 | | Total Utilities | | | 37,864,777 |
| | Water and Sewer – 10.9% (7.0% of Total Investments) | | | |
| | Allegheny County Sanitary Authority, Pennsylvania, Sewer Revenue Bonds, Refunding | | | |
| | Series 2015: | | | |
| 3,325 | | 5.000%, 12/01/40 | 12/25 at 100.00 | A+ | 3,957,581 |
| 3,320 | | 5.000%, 12/01/45 | 12/25 at 100.00 | A+ | 3,925,070 |
| | Delaware County Regional Water Quality Control Authority, Pennsylvania, Sewer Revenue | | | |
| | Bonds, Series 2015: | | | |
| 1,110 | | 5.000%, 5/01/40 | 5/25 at 100.00 | Aa3 | 1,302,296 |
| 2,220 | | 4.000%, 5/01/45 | 5/25 at 100.00 | Aa3 | 2,430,833 |
| | Lehigh County Authority, Pennsylvania, Water and Sewer Revenue Bonds, Allentown | | | |
| | Concession, Capital Appreciation Series 2013B: | | | |
| 7,295 | | 0.000%, 12/01/34 | No Opt. Call | A | 5,253,567 |
| 4,420 | | 0.000%, 12/01/35 | No Opt. Call | A | 3,094,089 |
| 12,500 | | Lehigh County Authority, Pennsylvania, Water and Sewer Revenue Bonds, Allentown | 12/23 at 100.00 | A | 14,173,250 |
| | Concession, Series 2013A, 5.125%, 12/01/47 | | | |
| 1,045 | | Pennsylvania Economic Development Financing Authority, Sewage Sludge Disposal Revenue | 3/20 at 100.00 | BBB+ | 1,063,204 |
| | Bonds, Philadelphia Biosolids Facility Project, Series 2009, 6.250%, 1/01/32 | | | |
| 6,560 | | Philadelphia, Pennsylvania, Water and Wastewater Revenue Bonds, Series 2011A, | 1/21 at 100.00 | A+ | 6,765,131 |
| | 5.000%, 1/01/41 | | | |
| 2,500 | | Philadelphia, Pennsylvania, Water and Wastewater Revenue Bonds, Series 2013A, | 1/22 at 100.00 | A+ | 2,672,500 |
| | 5.125%, 1/01/43 | | | |
| | Philadelphia, Pennsylvania, Water and Wastewater Revenue Bonds, Series 2018A: | | | |
| 5,000 | | 5.000%, 10/01/48 (UB) (5) | 10/28 at 100.00 | A+ | 6,260,900 |
| 7,000 | | 5.000%, 10/01/53 (UB) (5) | 10/28 at 100.00 | A+ | 8,722,420 |
| 1,000 | | Philadelphia, Pennsylvania, Water and Wastewater Revenue Bonds, Series 2019B, | 11/29 at 100.00 | A+ | 1,271,290 |
| | 5.000%, 11/01/54 | | | |
| 5,000 | | Pittsburgh Water and Sewer Authority, Pennsylvania, Water and Sewer System Revenue | 9/23 at 100.00 | A | 5,720,600 |
| | Bonds, First Lien Series 2013B, 5.250%, 9/01/40 | | | |
| 62,295 | | Total Water and Sewer | | | 66,612,731 |
| $ 862,370 | | Total Municipal Bonds (cost $856,818,841) | | | 940,135,274 |
58
| | | | |
| Shares | | Description (1) | Value |
| | COMMON STOCKS – 2.8% (1.8% of Total Investments) | |
| | Electric Utilities – 2.8% (1.8% of Total Investments) | |
| 598,493 | | Energy Harbor Corp, (8) (9) | $ 17,057,038 |
| | Total Common Stocks (cost $14,852,636) | 17,057,038 |
| | Total Long-Term Investments (cost $871,671,477) | 957,192,312 |
| | Floating Rate Obligations – (22.1)% | (135,255,000) |
| | Variable Rate Demand Preferred Shares, net of deferred offering costs – (35.4%) (10) | (216,716,745) |
| | Other Assets Less Liabilities – 1.1% (11) | 6,799,373 |
| | Net Assets Applicable to Common Shares – 100% | $ 612,019,940 |
Investments in Derivatives
Futures Contracts
| | | | | | | | |
| | | | | | | Variation |
| | | | | | Unrealized | Margin |
| Contract | Number of | Expiration | Notional | | Appreciation | Receivable/ |
| Description | Position | Contracts | Date | Amount | Value | (Depreciation) | (Payable) |
U.S. Treasury 10-Year Note | Short | (149) | 6/20 | $(19,768,435) | $(20,077,750) | $(309,314) | $(211,859) |
U.S. Treasury Long Bond | Short | (119) | 6/20 | (19,738,436) | (20,259,750) | (521,315) | (330,969) |
Total | | | | $(39,506,871) | $(40,337,500) | $(830,629) | $(542,828) |
| | |
(1) | All percentages shown in the Portfolio of Investments are based on net assets applicable to common shares unless otherwise noted. |
(2) | Optional Call Provisions: Dates (month and year) and prices of the earliest optional call or redemption. There may be other call provisions at varying prices at later dates. Certain mortgage-backed securities may be subject to periodic principal paydowns. Optional Call Provisions are not covered by the report of independent registered public accounting firm. |
(3) | For financial reporting purposes, the ratings disclosed are the highest of Standard & Poor’s Group (“Standard & Poor’s”), Moody’s Investors Service, Inc. (“Moody’s”) or Fitch, Inc. (“Fitch”) rating. This treatment of split-rated securities may differ from that used for other purposes, such as for Fund investment policies. Ratings below BBB by Standard & Poor’s, Baa by Moody’s or BBB by Fitch are considered to be below investment grade. Holdings designated N/R are not rated by any of these national rating agencies. Ratings are not covered by the report of independent registered public accounting firm. |
(4) | Defaulted security. A security whose issuer has failed to fully pay principal and/or interest when due, or is under the protection of bankruptcy. |
(5) | Investment, or portion of investment, has been pledged to collateralize the net payment obligations for investments in inverse floating rate transactions. |
(6) | Step-up coupon bond, a bond with a coupon that increases (“steps up”), usually at regular intervals, while the bond is outstanding. The rate shown is the coupon as of the end of the reporting period. |
(7) | Backed by an escrow or trust containing sufficient U.S. Government or U.S. Government agency securities, which ensure the timely payment of principal and interest. |
(8) | For fair value measurement disclosure purposes, investment classified as Level 2. See Notes to Financial Statements, Note 3 – Investment Valuation and Fair Value Measurements for more information. |
(9) | Common Stock received as part of the bankruptcy settlements for Beaver County Industrial Development Authority, Pennsylvania, Pollution Control Revenue Bonds, FirstEnergy Nuclear Generation Project, Refunding Series 2005A, 4.000%, 1/01/35; Beaver County Industrial Development Authority, Pennsylvania, Pollution Control Revenue Refunding Bonds, FirstEnergy Nuclear Generation Project, Series 2006A, 4.375%, 1/01/35; and Beaver County Industrial Development Authority, Pennsylvania, Pollution Control Revenue Refunding Bonds, FirstEnergy Nuclear Generation Project, Series 2006B, 3.500%, 12/01/35. |
(10) | Variable Rate Demand Preferred Shares, net of deferred offering costs as a percentage of Total Investments is 22.6%. |
(11) | Other assets less liabilities includes the unrealized appreciation (depreciation) of certain over-the-counter (“OTC”) derivatives as presented on the Statement of Assets and Liabilities, when applicable. The unrealized appreciation (depreciation) of OTC cleared and exchange-traded derivatives is recognized as part of the cash collateral at brokers and/or the receivable or payable for variation margin as presented on the Statement of Assets and Liabilities, when applicable. |
144A | Investment is exempt from registration under Rule 144A of the Securities Act of 1933, as amended. These investments may only be resold in transactions exempt from registration, which are normally those transactions with qualified institutional buyers. |
AMT | Alternative Minimum Tax |
ETM | Escrowed to maturity |
IF | Inverse floating rate security issued by a tender option bond (“TOB”) trust, the interest rate on which varies inversely with the Securities Industry Financial Markets Association (SIFMA) short-term rate, which resets weekly, or a similar short-term rate, and is reduced by the expenses related to the TOB trust. |
UB | Underlying bond of an inverse floating rate trust reflected as a financing transaction. See Notes to Financial Statements, Note 4 – Portfolio Securities and Investments in Derivatives, Inverse Floating Rate Securities for more information. |
WI/DD | Purchased on a when-issued or delayed delivery basis. |
| See accompanying notes to financial statements. |
59
| | |
| NPN | Nuveen Pennsylvania Municipal Value Fund |
| Portfolio of Investments |
| February 29, 2020 |
| | | | | | |
| Principal | | | Optional Call | | |
| Amount (000) | | Description (1) | Provisions (2) | Ratings (3) | Value |
| | LONG-TERM INVESTMENTS – 101.4% (100.0% of Total Investments) | | | |
| | MUNICIPAL BONDS – 99.2% (97.8% of Total Investments) | | | |
| | Consumer Staples – 3.2% (3.1% of Total Investments) | | | |
| $ 400 | | District of Columbia Tobacco Settlement Corporation, Tobacco Settlement Asset-Backed | No Opt. Call | A– | $ 474,976 |
| | Bonds, Series 2001, 6.500%, 5/15/33 | | | |
| 95 | | Pennsylvania Economic Development Financing Authority, Solid Waste Disposal Revenue | No Opt. Call | AA– | 128,317 |
| | Bonds, Procter & Gamble Paper Project, Series 2001, 5.375%, 3/01/31 (AMT) | | | |
| 495 | | Total Consumer Staples | | | 603,293 |
| | Education and Civic Organizations – 8.5% (8.4% of Total Investments) | | | |
| 50 | | Allegheny County Higher Education Building Authority, Pennsylvania, Revenue Bonds, | 10/27 at 100.00 | Baa3 | 57,810 |
| | Robert Morris University, Series 2017, 5.000%, 10/15/37 | | | |
| 15 | | Berks County Municipal Authority, Pennsylvania University, Revenue Bonds, Alvernia | 10/29 at 100.00 | BB+ | 17,454 |
| | University Project, Series 2020, 5.000%, 10/01/39 | | | |
| 70 | | Bucks County Industrial Development Authority, Pennsylvania, Revenue Bonds, School Lane | 3/27 at 100.00 | BBB– | 82,490 |
| | Charter School Project, Series 2016, 5.125%, 3/15/36 | | | |
| 20 | | Chester County Industrial Development Authority, Pennsylvania, Avon Grove Charter School | 12/27 at 100.00 | BBB– | 23,178 |
| | Revenue Bonds, Series 2017A, 5.000%, 12/15/47 | | | |
| 100 | | Cumberland County Municipal Authority, Pennsylvania, Revenue Bonds, Dickinson College | 11/27 at 100.00 | A+ | 122,774 |
| | Project, Second Series 2017A, 5.000%, 11/01/39 | | | |
| 30 | | Dallas Area Municipal Authority, Pennsylvania, Revenue Bonds, Misericordia University | 5/29 at 100.00 | Baa3 | 34,942 |
| | Project, Series 2019, 5.000%, 5/01/48 | | | |
| 30 | | Dallas Area Municipal Authority, Pennsylvania, Revenue Bonds, Misericordia University, | 5/24 at 100.00 | Baa3 | 32,904 |
| | Series 2014, 5.000%, 5/01/37 | | | |
| 60 | | Erie Higher Education Building Authority, Pennsylvania, Revenue Bonds, Gannon | 11/26 at 100.00 | BBB+ | 63,908 |
| | University, Series 2016, 4.000%, 5/01/46 | | | |
| 75 | | General Authority of Southcentral Pennsylvania, Revenue Bonds, AICUP Financing | 10/27 at 100.00 | A– | 81,513 |
| | Program-York College of Pennsylvania, Series 2017 PP4, 3.375%, 11/01/37 | | | |
| | Huntingdon County General Authority, Pennsylvania, Revenue Bonds, Juniata College, | | | |
| | Series 2016OO2: | | | |
| 15 | | 3.250%, 5/01/36 | 5/26 at 100.00 | BBB+ | 15,840 |
| 35 | | 3.500%, 5/01/41 | 5/26 at 100.00 | BBB+ | 37,086 |
| 50 | | Montgomery County Higher Education and Health Authority, Pennsylvania, Revenue Bonds, | 9/28 at 100.00 | A | 62,102 |
| | Thomas Jefferson University, Series 2018A, 5.000%, 9/01/48 | | | |
| | Montgomery County Higher Education and Health Authority, Pennsylvania, Revenue Bonds, | | | |
| | Thomas Jefferson University, Series 2019: | | | |
| 50 | | 4.000%, 9/01/44 | 9/29 at 100.00 | A | 57,781 |
| 25 | | 4.000%, 9/01/49 | 9/29 at 100.00 | A | 28,694 |
| 90 | | Northampton County General Purpose Authority, Pennsylvania, Revenue Bonds, Lafayette | 11/28 at 100.00 | Aa3 | 104,998 |
| | College, Refunding Series 2018, 4.000%, 11/01/38 | | | |
| 35 | | Pennsylvania Higher Educational Facilties Authority, Revenue Bonds, Holy Family | 9/23 at 100.00 | BBB– | 39,583 |
| | University, Series 2013A, 6.500%, 9/01/38 | | | |
| 45 | | Pennsylvania Higher Educational Facilities Authority, Revenue Bonds, Thomas Jefferson | 9/22 at 100.00 | A | 48,797 |
| | University, Series 2012, 5.000%, 3/01/42 | | | |
| | Pennsylvania Higher Educational Facilities Authority, Revenue Bonds, University of the | | | |
| | Sciences in Philadelphia, Series 2012: | | | |
| 35 | | 4.000%, 11/01/39 | 11/22 at 100.00 | Baa1 | 36,764 |
| 60 | | 5.000%, 11/01/42 | 11/22 at 100.00 | Baa1 | 65,068 |
| 95 | | Pennsylvania Higher Educational Facilities Authority, Revenue Bonds, Widener University, | 7/23 at 100.00 | A– | 105,296 |
| | Series 2013A, 5.500%, 7/15/38 | | | |
60
| | | | | | |
| Principal | | | Optional Call | | |
| Amount (000) | | Description (1) | Provisions (2) | Ratings (3) | Value |
| | Education and Civic Organizations (continued) | | | |
| $ 70 | | Philadelphia Authority for Industrial Development, Pennsylvania, Revenue Bonds, La Salle | 11/27 at 100.00 | BBB– | $ 74,302 |
| | University, Series 2017, 3.625%, 5/01/35 | | | |
| 100 | | Philadelphia Authority for Industrial Development, Pennsylvania, Revenue Bonds, | 6/20 at 100.00 | BB | 101,033 |
| | Philadelphia Performing Arts Charter School, Series 2013, 6.750%, 6/15/43, 144A | | | |
| 50 | | Philadelphia Authority for Industrial Development, Pennsylvania, Revenue Bonds, | 3/28 at 100.00 | BB+ | 55,619 |
| | University of the Arts, Series 2017, 5.000%, 3/15/45, 144A | | | |
| 100 | | Scranton-Lackawanna Health and Welfare Authority, Pennsylvania, University Revenue Bonds, | 6/26 at 100.00 | BB+ | 107,472 |
| | Marywood University, Series 2016, 5.000%, 6/01/46 | | | |
| 145 | | Washington County Industrial Development Authority, Pennsylvania, College Revenue Bonds, | 11/27 at 100.00 | A– | 157,318 |
| | AICUP Financing Program-Washington and Jefferson College Project, Series 2017-PP5, | | | |
| | 3.375%, 11/01/36 | | | |
| 1,450 | | Total Education and Civic Organizations | | | 1,614,726 |
| | Health Care – 20.6% (20.3% of Total Investments) | | | |
| 460 | | Allegheny County Hospital Development Authority, Pennsylvania, Revenue Bonds, Allegheny | 4/28 at 100.00 | A | 521,415 |
| | Health Network Obligated Group Issue, Series 2018A, 4.000%, 4/01/44 | | | |
| 115 | | Allegheny County Hospital Development Authority, Pennsylvania, Revenue Bonds, University | 7/29 at 100.00 | A+ | 137,411 |
| | of Pittsburgh Medical Center, Series 2019A, 4.000%, 7/15/35 | | | |
| 380 | | Berks County Industrial Development Authority, Pennsylvania, Health System Revenue | 11/27 at 100.00 | BBB+ | 452,234 |
| | Bonds, Tower Health Project, Series 2017, 5.000%, 11/01/50 | | | |
| 100 | | Centre County Hospital Authority, Pennsylvania, Hospital Revenue Bonds, Mount Nittany | 11/25 at 100.00 | AA– | 116,112 |
| | Medical Center Project, Series 2016A, 5.000%, 11/15/46 | | | |
| 75 | | Chester County Health and Education Facilities Authority, Pennsylvania, Health System | 10/27 at 100.00 | AA | 87,658 |
| | Revenue Bonds, Main Line Health System, Series 2017A, 4.000%, 10/01/37 | | | |
| 190 | | Chester County Health and Education Facilities Authority, Pennsylvania, Health System | 9/30 at 100.00 | AA | 225,625 |
| | Revenue Bonds, Main Line Health System, Series 2020A, 4.000%, 9/01/50 | | | |
| 200 | | Cumberland County Municipal Authority, Pennsylvania, Revenue Bonds, Penn State Health, | 11/29 at 100.00 | A+ | 229,658 |
| | Series 2019, 4.000%, 11/01/44 | | | |
| 55 | | Dauphin County General Authority, Pennsylvania, Health System Revenue Bonds, Pinnacle | 6/26 at 100.00 | A+ | 66,241 |
| | Health System Project, Refunding Series 2016A, 5.000%, 6/01/35 | | | |
| 35 | | Dauphin County General Authority, Pennsylvania, Health System Revenue Bonds, Pinnacle | 6/22 at 100.00 | A+ | 37,734 |
| | Health System Project, Series 2012A, 5.000%, 6/01/42 | | | |
| 225 | | Doylestown Hospital Authority, Pennsylvania, Hospital Revenue Bonds, Series 2016A, | 7/26 at 100.00 | BBB– | 260,908 |
| | 5.000%, 7/01/41 | | | |
| 25 | | Doylestown Hospital Authority, Pennsylvania, Hospital Revenue Bonds, Series 2019A, | 7/29 at 100.00 | BBB– | 27,311 |
| | 4.000%, 7/01/45 | | | |
| 150 | | Dubois Hospital Authority, Pennsylvania, Hospital Revenue Bonds, Penn Highlands | 1/28 at 100.00 | A– | 180,798 |
| | Healthcare, Series 2018, 5.000%, 7/15/48 | | | |
| 100 | | Lancaster County Hospital Authority, Revenue Bonds, University of Pennsylvania Health | 8/26 at 100.00 | AA | 120,410 |
| | System, Refunding Series 2016B, 5.000%, 8/15/46 | | | |
| 155 | | Lancaster County Hospital Authority, Revenue Bonds, University of Pennsylvania Health | 8/26 at 100.00 | AA | 187,576 |
| | System, Series 2016A, 5.000%, 8/15/42 | | | |
| 100 | | Lehigh County General Purpose Authority, Pennsylvania, Revenue Bonds, Good Shepherd | 5/26 at 100.00 | A | 108,702 |
| | Group, Refunding Series 2016, 4.000%, 11/01/41 | | | |
| 40 | | Lehigh County General Purpose Authority, Pennsylvania, Revenue Bonds, Good Shepherd | 11/22 at 100.00 | A | 41,784 |
| | Group, Series 2012, 4.000%, 11/01/32 | | | |
| 200 | | Montgomery County Industrial Development Authority, Pennsylvania, Health System Revenue | 1/25 at 100.00 | Ba1 | 229,240 |
| | Bonds, Albert Einstein Healthcare Network Issue, Series 2015A, 5.250%, 1/15/45 | | | |
| 145 | | Philadelphia Hospitals and Higher Education Facilities Authority, Pennsylvania, Hospital | 7/22 at 100.00 | BBB– | 157,728 |
| | Revenue Bonds, Temple University Health System Obligated Group, Series 2012A, 5.625%, 7/01/42 | | | |
| 200 | | Pottsville Hospital Authority, Pennsylvania, Hospital Revenue Bonds, Lehigh Valley Health Network, | 1/27 at 100.00 | A+ | 238,202 |
| | Series 2016B, 5.000%, 7/01/45 | | | |
| 210 | | Southcentral Pennsylvania General Authority, Revenue Bonds, Wellspan Health Obligated | 6/29 at 100.00 | Aa3 | 264,232 |
| | Group, Series 2019A, 5.000%, 6/01/49 | | | |
61
| | |
| NPN | Nuveen Pennsylvania Municipal Value Fund |
| Portfolio of Investments (continued) |
| February 29, 2020 |
| | | | | | |
| Principal | | | Optional Call | | |
| Amount (000) | | Description (1) | Provisions (2) | Ratings (3) | Value |
| | Health Care (continued) | | | |
| $ 100 | | The Hospitals and Higher Education Facilities Authority of Philadelphia, Pennsylvania, Hospital | 7/27 at 100.00 | BBB– | $ 120,659 |
| | Revenue Bonds, Temple University Health System Obligated Group, Series of 2017, 5.000%, 7/01/30 | | | |
| 100 | | West Shore Area Authority, Cumberland County, Pennsylvania, Hospital Revenue Bonds, Holy | 1/22 at 100.00 | AA | 108,145 |
| | Spirit Hospital of the Sisters of Christian Charity, Series 2011B, 5.750%, 1/01/41 | | | |
| 3,360 | | Total Health Care | | | 3,919,783 |
| | Housing/Multifamily – 7.1% (7.0% of Total Investments) | | | |
| 15 | | Chester County Industrial Development Authority, Pennsylvania, Student Housing Revenue | 8/23 at 100.00 | Baa3 | 16,484 |
| | Bonds, University Student Housing, LLC Project at West Chester University Series 2013A, | | | |
| | 5.000%, 8/01/45 | | | |
| 35 | | Clarion County Industrial Development Authority, Pennsylvania, Revenue Bonds, Clarion | 7/24 at 100.00 | Baa3 | 37,156 |
| | University Foundation Inc Student Housing Project at Clarion University, Series 2014A, | | | |
| | 5.000%, 7/01/45 | | | |
| 30 | | East Hempfield Township Industrial Development Authority, Pennsylvania, Student Services | 7/24 at 100.00 | BBB– | 33,595 |
| | Inc – Student Housing Project at Millersville University, Series 2014, 5.000%, 7/01/46 | | | |
| 100 | | East Hempfield Township Industrial Development Authority, Pennsylvania, Student Services | 7/25 at 100.00 | BBB– | 114,088 |
| | Inc – Student Housing Project at Millersville University, Series 2015, 5.000%, 7/01/47 | | | |
| 300 | | Pennsylvania Higher Educational Facilities Authority, Revenue Bonds, University | 7/26 at 100.00 | Baa3 | 352,746 |
| | Properties Inc Student Housing Project at East Stroudsburg University of Pennsylvania, Series | | | |
| | 2016A, 5.000%, 7/01/35 | | | |
| 800 | | Pittsburgh Urban Redevelopment Authority, Pennsylvania, Multifamily Housing Revenue | 3/20 at 100.00 | Aa1 | 801,712 |
| | Bonds, Eva P Mithcell Residence Project, Series 2009, 5.100%, 10/20/44 | | | |
| 1,280 | | Total Housing/Multifamily | | | 1,355,781 |
| | Housing/Single Family – 10.9% (10.8% of Total Investments) | | | |
| | Pennsylvania Housing Finance Agency, Single Family Mortgage Revenue Bonds, | | | |
| | Series 2012-114: | | | |
| 65 | | 3.300%, 10/01/32 | 10/21 at 100.00 | AA+ | 66,438 |
| 25 | | 3.650%, 10/01/37 | 10/21 at 100.00 | AA+ | 25,545 |
| 35 | | 3.700%, 10/01/42 | 10/21 at 100.00 | AA+ | 35,702 |
| 115 | | Pennsylvania Housing Finance Agency, Single Family Mortgage Revenue Bonds, Series | 10/24 at 100.00 | AA+ | 122,675 |
| | 2015-116B, 4.000%, 4/01/45 | | | |
| 55 | | Pennsylvania Housing Finance Agency, Single Family Mortgage Revenue Bonds, Series | 4/25 at 100.00 | AA+ | 58,819 |
| | 2016-119, 3.500%, 10/01/36 | | | |
| 500 | | Pennsylvania Housing Finance Agency, Single Family Mortgage Revenue Bonds, Series | 10/25 at 100.00 | AA+ | 524,325 |
| | 2016-120, 3.200%, 4/01/40 | | | |
| | Pennsylvania Housing Finance Agency, Single Family Mortgage Revenue Bonds, | | | |
| | Series 2016-121: | | | |
| 400 | | 3.200%, 10/01/41 (UB) (4) | 10/25 at 100.00 | AA+ | 418,408 |
| 100 | | 3.200%, 10/01/41 | 10/25 at 100.00 | AA+ | 104,602 |
| | Pennsylvania Housing Finance Agency, Single Family Mortgage Revenue Bonds, | | | |
| | Series 2017-123B: | | | |
| 70 | | 3.450%, 10/01/32 | 10/26 at 100.00 | AA+ | 77,042 |
| 75 | | 3.900%, 10/01/37 | 10/26 at 100.00 | AA+ | 83,234 |
| 250 | | Pennsylvania Housing Finance Agency, Single Family Mortgage Revenue Bonds, Series | 4/27 at 100.00 | AA+ | 270,405 |
| | 2017-125B, 3.700%, 10/01/47 | | | |
| 250 | | Pennsylvania Housing Finance Agency, Single Family Mortgage Revenue Bonds, Series | 10/28 at 100.00 | AA+ | 267,960 |
| | 2019-129, 3.350%, 10/01/45 | | | |
| 25 | | Pennsylvania Housing Finance Agency, Single Family Mortgage Revenue Bonds, Tender Option | 10/22 at 100.00 | AA+ | 28,334 |
| | Bonds Trust 2015-XF0109, 8.274%, 10/01/31, 144A (IF) (4) | | | |
| 1,965 | | Total Housing/Single Family | | | 2,083,489 |
| | Industrials – 0.6% (0.6% of Total Investments) | | | |
| 100 | | Pennsylvania Economic Development Financing Authority, Solid Waste Disposal Revenue | No Opt. Call | A– | 104,093 |
| | Bonds, Waste Management Inc, Project, Series 2011, 2.150%, 7/01/41 (AMT) (Mandatory Put 7/01/24) | | | |
62
| | | | | | |
| Principal | | | Optional Call | | |
| Amount (000) | | Description (1) | Provisions (2) | Ratings (3) | Value |
| | Long-Term Care – 5.9% (5.8% of Total Investments) | | | |
| $ 155 | | Berks County Industrial Development Authority, Pennsylvania, Healthcare Facilities | 5/27 at 100.00 | BBB | $ 181,662 |
| | Revenue Bonds, Highlands at Wyomissing, Series 2017A, 5.000%, 5/15/42 | | | |
| 35 | | Chester County Health and Education Facilities Authority, Pennsylvania, Revenue Bonds, | 12/25 at 103.00 | N/R | 39,472 |
| | Simpson Senior Services Project, Series 2019, 5.000%, 12/01/51 | | | |
| 100 | | Cumberland County Municipal Authority, Pennsylvania, Revenue Bonds, Diakon Lutheran | 1/26 at 100.00 | BBB+ | 117,512 |
| | Social Ministries Project, Series 2016, 5.000%, 1/01/29 | | | |
| | Cumberland County Municipal Authority, Pennsylvania, Revenue Bonds, Diakon Lutheran | | | |
| | Social Ministries Project, Series 2015: | | | |
| 125 | | 4.000%, 1/01/33 | 1/25 at 100.00 | BBB+ | 133,779 |
| 135 | | 5.000%, 1/01/38 | 1/25 at 100.00 | BBB+ | 152,511 |
| | Cumberland County Municipal Authority, Pennsylvania, Revenue Bonds, Diakon Lutheran | | | |
| | Social Ministries Project, Series 2019A: | | | |
| 25 | | 4.125%, 1/01/38 | 1/29 at 100.00 | BBB+ | 27,872 |
| 30 | | 5.000%, 1/01/39 | 1/29 at 100.00 | BBB+ | 36,441 |
| 60 | | Cumberland County Municipal Authority, Pennsylvania, Revenue Bonds, Asbury Pennsylvania | 1/25 at 104.00 | N/R | 67,054 |
| | Obligated Group, Refunding Series 2019, 5.000%, 1/01/45 | | | |
| 20 | | Lancaster County Hospital Authority, Pennsylvania, Health Center Revenue Bonds, Masonic | 5/25 at 100.00 | A | 22,954 |
| | Villages Project, Series 2015, 5.000%, 11/01/35 | | | |
| 40 | | Lancaster County Hospital Authority, Pennsylvania, Health Center Revenue Bonds, Saint | 3/27 at 102.00 | BB+ | 46,158 |
| | Anne’s Retirement Community, Inc, Series 2020, 5.000%, 3/01/50 (WI/DD, Settling 3/03/20) | | | |
| 200 | | Montgomery County Industrial Development Authority, Pennsylvania, Revenue Bonds, ACTS | 11/26 at 100.00 | A– | 238,736 |
| | Retirement-Life Communities, Inc Obligated Group, Series 2016, 5.000%, 11/15/36 | | | |
| 55 | | Northampton County Industrial Development Authority, Pennsylvania, Revenue Bonds, | 11/26 at 103.00 | BB+ | 62,984 |
| | Morningstar Senior Living, Inc, Series 2019, 5.000%, 11/01/44 | | | |
| 980 | | Total Long-Term Care | | | 1,127,135 |
| | Materials – 0.9% (0.9% of Total Investments) | | | |
| 165 | | Pennsylvania Economic Development Financing Authority, Exempt Facilities Revenue Bonds, | 11/24 at 100.00 | N/R | 178,481 |
| | National Gypsum Company, Refunding Series 2014, 5.500%, 11/01/44 (AMT) | | | |
| | Tax Obligation/General – 9.2% (9.0% of Total Investments) | | | |
| 160 | | Adams County, Pennsylvania, General Obligation Bonds, Series 2017B, 2.500%, 11/15/29 | 11/25 at 100.00 | Aa2 | 170,137 |
| 220 | | Allegheny County, Pennsylvania, General Obligation Bonds, Series 2013C-72, | 12/23 at 100.00 | AA– | 255,107 |
| | 5.250%, 12/01/32 | | | |
| 10 | | Allegheny County, Pennsylvania, General Obligation Bonds, Series C69-C70 of 2012, | 12/22 at 100.00 | AA– | 11,074 |
| | 5.000%, 12/01/37 | | | |
| 125 | | Bethel Park School District, Allegheny County, Pennsylvania, General Obligation Bonds, | 8/26 at 100.00 | Aa2 | 145,820 |
| | Refunding Series 2016, 4.000%, 8/01/33 | | | |
| 45 | | Boyertown Area School District, Berks and Montgomery Counties, Pennsylvania, General | 4/24 at 100.00 | AA– | 51,628 |
| | Obligation Bonds, Series 2015, 5.000%, 10/01/38 | | | |
| 115 | | Canon-McMillan School District, Washington County, Pennsylvania, General Obligation | 12/24 at 100.00 | AA | 134,452 |
| | Bonds, Series 2014D, 5.000%, 12/15/39 | | | |
| 100 | | Colonial School District, Montgomery County, Pennsylvania, General Obligation Bonds, | 2/27 at 100.00 | Aaa | 122,909 |
| | Series 2020, 5.000%, 2/15/44 | | | |
| 25 | | Easton Area School District, Northampton County, Pennsylvania, General Obligation Bonds, | 2/28 at 100.00 | Aa2 | 31,947 |
| | Series 2020B, 5.000%, 2/01/31 | | | |
| 195 | | Lehighton Area School District, Carbon County, Pennsylvania, General Obligation Bonds, | 11/23 at 100.00 | AA | 220,245 |
| | Limited Tax Series 2015A, 5.000%, 11/15/43 – BAM Insured | | | |
| 15 | | Pittsburgh School District, Allegheny County, Pennsylvania, General Obligation Bonds, | 9/22 at 100.00 | AA | 16,553 |
| | Series 2014A, 5.000%, 9/01/25 – BAM Insured | | | |
| 400 | | Pittsburgh, Pennsylvania, General Obligation Bonds, Series 2012B, 5.000%, 9/01/26 | 9/22 at 100.00 | AA– | 439,744 |
| 35 | | Rostraver Township, Westmoreland County, Pennsylvania, General Obligation Bonds, Series | 9/25 at 100.00 | AA | 37,960 |
| | 2018, 3.500%, 9/01/34 – AGM Insured | | | |
| 80 | | Scranton, Lackawanna County, Pennsylvania, General Obligation Notes, Series 2016, | 5/24 at 100.00 | BB+ | 88,314 |
| | 5.000%, 11/15/32 | | | |
63
| | |
| NPN | Nuveen Pennsylvania Municipal Value Fund |
| Portfolio of Investments (continued) |
| February 29, 2020 |
| | | | | | |
| Principal | | | Optional Call | | |
| Amount (000) | | Description (1) | Provisions (2) | Ratings (3) | Value |
| | Tax Obligation/General (continued) | | | |
| | The Redevelopment Authority of the City of Scranton, Lackawanna county, Pennsylvania, | | | |
| | Guaranteed Lease Revenue Bonds, Series 2016A: | | | |
| $ 10 | | 5.000%, 11/15/21 | No Opt. Call | BB+ | $ 10,356 |
| 10 | | 5.000%, 11/15/28 | 5/24 at 100.00 | BB+ | 10,537 |
| 1,545 | | Total Tax Obligation/General | | | 1,746,783 |
| | Tax Obligation/Limited – 7.8% (7.7% of Total Investments) | | | |
| 25 | | Allentown Neighborhood Improvement Zone Development Authority, Pennsylvania, Tax | 5/22 at 100.00 | Baa3 | 26,781 |
| | Revenue Bonds, Series 2012A, 5.000%, 5/01/35 | | | |
| 230 | | Allentown Neighborhood Improvement Zone Development Authority, Pennsylvania, Tax Revenue | 5/27 at 100.00 | Ba3 | 269,289 |
| | Bonds, City Center Refunding Project, Series 2017, 5.000%, 5/01/42, 144A | | | |
| 100 | | Chester, Delaware County, Pennsylvania, Tax and Revenue Anticipation Notes, Series 2020, | 7/20 at 100.00 | N/R | 98,807 |
| | 4.125%, 11/30/20, 144A | | | |
| | Commonwealth Financing Authority, Pennsylvania, State Appropriation Lease Bonds, Master | | | |
| | Settlement, Series 2018: | | | |
| 35 | | 5.000%, 6/01/33 | 6/28 at 100.00 | A1 | 44,155 |
| 155 | | 4.000%, 6/01/39 – AGM Insured | 6/28 at 100.00 | AA | 178,185 |
| 200 | | 4.000%, 6/01/39 – AGM Insured (UB) (4) | 6/28 at 100.00 | AA | 229,916 |
| 120 | | Government of Guam, Business Privilege Tax Bonds, Series 2011A, 5.250%, 1/01/36 | 1/22 at 100.00 | BB | 127,698 |
| 100 | | Monroe County Industrial Development Authority, Pennsylvania, Special Obligation Revenue | 7/24 at 100.00 | N/R | 105,576 |
| | Bonds, Tobyhanna Township Project, Series 2014, 6.875%, 7/01/33, 144A | | | |
| 100 | | Pennsylvania Turnpike Commission, Motor License Fund-Enhanced Turnpike Subordinate | 12/26 at 100.00 | AA– | 109,222 |
| | Special Revenue Bonds, Series 2014A, 0.000%, 12/01/37 (5) | | | |
| 100 | | Pennsylvania Turnpike Commission, Oil Franchise Tax Revenue Bonds, Subordinate Series | 12/28 at 100.00 | A+ | 124,002 |
| | 2018B, 5.000%, 12/01/48 | | | |
| | Puerto Rico Sales Tax Financing Corporation, Sales Tax Revenue Bonds, Restructured 2018A-1: | | | |
| 17 | | 4.500%, 7/01/34 | 7/25 at 100.00 | N/R | 18,710 |
| 72 | | 5.000%, 7/01/58 | 7/28 at 100.00 | N/R | 82,575 |
| | Puerto Rico Sales Tax Financing Corporation, Sales Tax Revenue Bonds, Taxable | | | |
| | Restructured Cofina Project Series 2019A-2: | | | |
| 10 | | 4.329%, 7/01/40 | 7/28 at 100.00 | N/R | 11,114 |
| 38 | | 4.784%, 7/01/58 | 7/28 at 100.00 | N/R | 42,949 |
| 15 | | Washington County Redevelopment Authority, Pennsylvania, Tanger Outlet Victory Center | 1/28 at 100.00 | BB | 16,724 |
| | Tax Increment Bonds, Series 2018, 5.000%, 7/01/35 | | | |
| 1,317 | | Total Tax Obligation/Limited | | | 1,485,703 |
| | Transportation – 8.6% (8.5% of Total Investments) | | | |
| 245 | | Delaware River Joint Toll Bridge Commission, New Jersey and Pennsylvania, Bridge System | 7/27 at 100.00 | A1 | 303,741 |
| | Revenue Bonds, Series 2017, 5.000%, 7/01/42 | | | |
| 125 | | Delaware River Port Authority, New Jersey and Pennsylvania, Revenue Bonds, Series 2018A, | 1/29 at 100.00 | A+ | 161,331 |
| | 5.000%, 1/01/38 | | | |
| 140 | | Pennsylvania Economic Development Financing Authority, Parking System Revenue Bonds, | 1/24 at 100.00 | AA | 157,670 |
| | Capitol Region Parking System, Series 2013A, 5.250%, 1/01/44 – AGM Insured | | | |
| 175 | | Pennsylvania Economic Development Financing Authority, Private Activity Revenue Bonds, | 6/26 at 100.00 | BBB | 206,855 |
| | Pennsylvania Rapid Bridge Replacement Project, Series 2015, 5.000%, 6/30/42 (AMT) | | | |
| 585 | | Pennsylvania Turnpike Commission, Turnpike Revenue Bonds, Series 2015B, 5.000%, 12/01/45 | 12/25 at 100.00 | A1 | 693,377 |
| 100 | | Pittsburgh and Allegheny County Sports and Exhibition Authority, Pennsylvania, Parking | 12/27 at 100.00 | A | 124,044 |
| | Revenue Bonds, Series 2017, 5.000%, 12/15/34 | | | |
| 1,370 | | Total Transportation | | | 1,647,018 |
| | U.S. Guaranteed – 6.7% (6.6% of Total Investments) (6) | | | |
| 175 | | Bucks County Water and Sewer Authority, Pennsylvania, Revenue Bonds, Tender Option Bond | 12/21 at 100.00 | AA | 213,878 |
| | Trust 2015-XF0123, 11.158%, 12/01/29 – AGM Insured (Pre-refunded 12/01/21), 144A (IF) (4) | | | |
| 55 | | Lancaster Industrial Development Authority, Pennsylvania, Revenue Bonds, Garden Spot | 5/23 at 100.00 | N/R | 63,500 |
| | Village Project, Series 2013, 5.750%, 5/01/35 (Pre-refunded 5/01/23) | | | |
64
| | | | | | |
| Principal | | | Optional Call | | |
| Amount (000) | | Description (1) | Provisions (2) | Ratings (3) | Value |
| | U.S. Guaranteed (6) (continued) | | | |
| $ 50 | | Pennsylvania Higher Educational Facilities Authority, Revenue Bonds, Edinboro University | 7/20 at 100.00 | N/R | $ 50,852 |
| | Foundation Student Housing Project, Series 2010, 6.000%, 7/01/43 (Pre-refunded 7/01/20) | | | |
| 120 | | Pennsylvania Higher Educational Facilities Authority, Revenue Bonds, Philadelphia | 6/23 at 100.00 | N/R | 136,149 |
| | University, Refunding Series 2013, 5.000%, 6/01/32 (Pre-refunded 6/01/23) | | | |
| | Pennsylvania Turnpike Commission, Motor License Fund-Enhanced Turnpike Special Revenue | | | |
| | Bonds, Subordinate Series 2010A1&2: | | | |
| 110 | | 5.500%, 12/01/34 (Pre-refunded 12/01/20) | 12/20 at 100.00 | N/R | 113,853 |
| 480 | | 5.500%, 12/01/34 (Pre-refunded 12/01/20) | 12/20 at 100.00 | AA– | 496,997 |
| 100 | | West Shore Area Authority, Cumberland County, Pennsylvania, Hospital Revenue Bonds, Holy | 1/21 at 100.00 | AA | 104,503 |
| | Spirit Hospital of the Sisters of Christian Charity Project, Series 2011, 6.250%, 1/01/31 | | | |
| | (Pre-refunded 1/01/21) | | | |
| 100 | | Wilkes-Barre Finance Authority, Pennsylvania, Revenue Bonds, University of Scranton, | 11/20 at 100.00 | A– | 102,749 |
| | Series 2010, 5.000%, 11/01/40 (Pre-refunded 11/01/20) | | | |
| 1,190 | | Total U.S. Guaranteed | | | 1,282,481 |
| | Utilities – 6.6% (6.5% of Total Investments) | | | |
| 140 | | Beaver County Industrial Development Authority, Pennsylvania, Pollution Control Revenue | No Opt. Call | N/R | 700 |
| | Bonds, FirstEnergy Nuclear Generation Project, Refunding Series 2005A, 4.000%, 1/01/35 (7) | | | |
| 250 | | Beaver County Industrial Development Authority, Pennsylvania, Pollution Control Revenue | No Opt. Call | N/R | 1,250 |
| | Bonds, FirstEnergy Nuclear Generation Project, Series 2006B, 3.500%, 12/01/35 (7) | | | |
| 170 | | Delaware County Industrial Development Authority, Pennsylvania, Revenue Bonds, Covanta | 7/20 at 100.00 | BB– | 172,076 |
| | Project, Refunding Series 2015A, 5.000%, 7/01/43 | | | |
| 125 | | Luzerne County Industrial Development Authority, Pennsylvania, Revenue Bonds, | 12/29 at 100.00 | A+ | 133,319 |
| | Pennsylvania-American Water Company Project, Refunding Series 2019, 2.450%, 12/01/39 (AMT) | | | |
| | (Mandatory Put 12/03/29) | | | |
| 10 | | Pennsylvania Economic Development Financing Authority, Exempt Facilities Revenue Bonds, | No Opt. Call | N/R | 50 |
| | Shippingport Project, First Energy Guarantor, Series 2005A, 3.750%, 12/01/40 | | | |
| 55 | | Pennsylvania Economic Development Financing Authority, Exempt Facilities Revenue Bonds, | No Opt. Call | N/R | 275 |
| | Shippingport Project, First Energy Guarantor, Series 2006A, 2.550%, 11/01/41 (7) | | | |
| 235 | | Pennsylvania Economic Development Financing Authority, Exempt Facilities Revenue Bonds, | 10/29 at 100.00 | A– | 245,504 |
| | York Water Company Project, Refunding Series 2019A, 3.000%, 10/01/36 (AMT) | | | |
| 90 | | Pennsylvania Economic Development Financing Authority, Exempt Facilities Revenue | 9/25 at 100.00 | B | 105,465 |
| | Refunding Bonds, PPL Energy Supply, LLC Project, Series 2009A, 6.400%, 12/01/38 | | | |
| 250 | | Pennsylvania Economic Development Financing Authority, Revenue Bonds, | 10/29 at 100.00 | A+ | 268,172 |
| | Pennsylvania-American Water Company, Refunding Series 2019, 3.000%, 4/01/39 | | | |
| 150 | | Philadelphia Gas Works, Pennsylvania, Revenue Bonds, General Ordinance, Fifteenth Series | 8/27 at 100.00 | A | 180,908 |
| | 2017, 5.000%, 8/01/47 | | | |
| 125 | | Philadelphia Gas Works, Pennsylvania, Revenue Bonds, Refunding Thirteenth Series 2015, | 8/25 at 100.00 | A | 149,420 |
| | 5.000%, 8/01/30 | | | |
| 1,600 | | Total Utilities | | | 1,257,139 |
| | Water and Sewer – 2.6% (2.6% of Total Investments) | | | |
| 200 | | Allegheny County Sanitary Authority, Pennsylvania, Sewer Revenue Bonds, Refunding Series | 12/20 at 100.00 | AA | 205,958 |
| | 2010, 5.000%, 6/01/40 – AGM Insured | | | |
| 200 | | Lehigh County Authority, Pennsylvania, Water and Sewer Revenue Bonds, Allentown | 12/23 at 100.00 | A | 226,772 |
| | Concession, Series 2013A, 5.125%, 12/01/47 | | | |
| 25 | | Pittsburgh Water and Sewer Authority, Pennsylvania, Water and Sewer System Revenue | 9/29 at 100.00 | AA | 29,870 |
| | Bonds, Refunding Subordinate Series 2019B, 4.000%, 9/01/34 – AGM Insured | | | |
| 40 | | Upper Allegheny Joint Sanitary Authority, Allegheny County, Pennsylvania, Sewer Revenue | 9/29 at 100.00 | AA | 41,829 |
| | Bonds, Refunding Series 2019A, 3.000%, 9/01/44 – AGM Insured | | | |
| 465 | | Total Water and Sewer | | | 504,429 |
| $ 17,282 | | Total Municipal Bonds (cost $17,497,419) | | | 18,910,334 |
65
| | |
| NPN | Nuveen Pennsylvania Municipal Value Fund |
| Portfolio of Investments (continued) |
| February 29, 2020 |
| | | | |
| Shares | | Description (1) | Value |
| | COMMON STOCKS – 2.2% (2.2% of Total Investments) | |
| | Electric Utilities – 2.2% (2.2% of Total Investments) | |
| 14,613 | | Energy Harbor Corp, (8), (9) | $ 416,484 |
| | Total Common Stocks (cost $293,735) | 416,484 |
| | Total Long-Term Investments (cost $17,791,154) | 19,326,818 |
| | Floating Rate Obligations – (2.4)% | (450,000) |
| | Other Assets Less Liabilities – 1.0% (10) | 192,582 |
| | Net Assets Applicable to Common Shares – 100% | $ 19,069,400 |
Investments in Derivatives
Futures Contracts
| | | | | | | | |
| | | | | | | Variation |
| | | | | | Unrealized | Margin |
| Contract | Number of | Expiration | Notional | | Appreciation | Receivable/ |
| Description | Position | Contracts | Date | Amount | Value | (Depreciation) | (Payable) |
U.S. Treasury 10-Year Note | Short | (5) | 6/20 | $(663,370) | $(673,750) | $(10,380) | (7,109) |
| | |
(1) | All percentages shown in the Portfolio of Investments are based on net assets applicable to common shares unless otherwise noted. |
(2) | Optional Call Provisions: Dates (month and year) and prices of the earliest optional call or redemption. There may be other call provisions at varying prices at later dates. Certain mortgage-backed securities may be subject to periodic principal paydowns. Optional Call Provisions are not covered by the report of independent registered public accounting firm. |
(3) | For financial reporting purposes, the ratings disclosed are the highest of Standard & Poor’s Group (“Standard & Poor’s”), Moody’s Investors Service, Inc. (“Moody’s”) or Fitch, Inc. (“Fitch”) rating. This treatment of split-rated securities may differ from that used for other purposes, such as for Fund investment policies. Ratings below BBB by Standard & Poor’s, Baa by Moody’s or BBB by Fitch are considered to be below investment grade. Holdings designated N/R are not rated by any of these national rating agencies. Ratings are not covered by the report of independent registered public accounting firm. |
(4) | Investment, or portion of investment, has been pledged to collateralize the net payment obligations for investments in inverse floating rate transactions. |
(5) | Step-up coupon bond, a bond with a coupon that increases (“steps up”), usually at regular intervals, while the bond is outstanding. The rate shown is the coupon as of the end of the reporting period. |
(6) | Backed by an escrow or trust containing sufficient U.S. Government or U.S. Government agency securities, which ensure the timely payment of principal and interest. |
(7) | Defaulted security. A security whose issuer has failed to fully pay principal and/or interest when due, or is under the protection of bankruptcy. |
(8) | For fair value measurement disclosure purposes, investment classified as Level 2. See Notes to Financial Statements, Note 3 – Investment Valuation and Fair Value Measurements for more information. |
(9) | Common Stock received as part of the bankruptcy settlements for Beaver County Industrial Development Authority, Pennsylvania, Pollution Control Revenue Bonds, FirstEnergy Nuclear Generation Project, Refunding Series 2005A, 4.000%, 1/01/35; Beaver County Industrial Development Authority, Pennsylvania, Pollution Control Revenue Refunding Bonds, FirstEnergy Nuclear Generation Project, Series 2006A, 4.375%, 1/01/35; Beaver County Industrial Development Authority, Pennsylvania, Pollution Control Revenue Refunding Bonds, FirstEnergy Nuclear Generation Project, Series 2006B, 3.500%, 12/01/35; and Pennsylvania Economic Development Financing Authority, Exempt Facilities Revenue Bonds, Shippingport Project, First Energy Guarantor, Series 2006A, 2.550%, 11/01/41. |
(10) | Other assets less liabilities includes the unrealized appreciation (depreciation) of certain over-the-counter (“OTC”) derivatives as presented on the Statement of Assets and Liabilities, when applicable. The unrealized appreciation (depreciation) of OTC cleared and exchange-traded derivatives is recognized as part of the cash collateral at brokers and/or the receivable or payable for variation margin as presented on the Statement of Assets and Liabilities, when applicable. |
144A | Investment is exempt from registration under Rule 144A of the Securities Act of 1933, as amended. These investments may only be resold in transactions exempt from registration, which are normally those transactions with qualified institutional buyers. |
AMT | Alternative Minimum Tax |
IF | Inverse floating rate security issued by a tender option bond (“TOB”) trust, the interest rate on which varies inversely with the Securities Industry Financial Markets Association (SIFMA) short-term rate, which resets weekly, or a similar short-term rate, and is reduced by the expenses related to the TOB trust. |
UB | Underlying bond of an inverse floating rate trust reflected as a financing transaction. See Notes to Financial Statements, Note 4 – Portfolio Securities and Investments in Derivatives, Inverse Floating Rate Securities for more information. |
WI/DD | Purchased on a when-issued or delayed delivery basis. |
| See accompanying notes to financial statements. |
66
Statement of Assets and Liabilities
February 29, 2020
| | | | | | | | | | | | | |
| | NXJ | | | NJV | | | NQP | | | NPN | |
| Assets | | | | | | | | | | | | |
Long-term investments, at value (cost $934,297,090, $22,552,294, | | | | | | | | | | | | |
| $871,671,477 and $17,791,154, respectively) | | $ | 1,051,362,380 | | | $ | 25,126,835 | | | $ | 957,192,312 | | | $ | 19,326,818 | |
Cash | | | 1,757,983 | | | | 41,312 | | | | — | | | | 121,176 | |
Cash collateral at brokers for investments in futures contracts(1) | | | 120,000 | | | | 17,500 | | | | 515,046 | | | | 5,750 | |
Receivable for: | | | | | | | | | | | | | | | | |
| Interest | | | 9,986,881 | | | | 234,525 | | | | 10,488,573 | | | | 216,535 | |
| Investments sold | | | — | | | | — | | | | 5,020,418 | | | | — | |
Other assets | | | 166,386 | | | | 8 | | | | 154,117 | | | | 6 | |
| Total assets | | | 1,063,393,630 | | | | 25,420,180 | | | | 973,370,466 | | | | 19,670,285 | |
| Liabilities | | | | | | | | | | | | | | | | |
Cash overdraft | | | — | | | | — | | | | 3,778,443 | | | | — | |
Floating rate obligations | | | 34,780,000 | | | | 810,000 | | | | 135,255,000 | | | | 450,000 | |
Payable for: | | | | | | | | | | | | | | | | |
| Dividends | | | 1,942,678 | | | | 55,979 | | | | 1,729,392 | | | | 45,013 | |
| Interest | | | 191,593 | | | | 4,389 | | | | 707,243 | | | | 2,607 | |
| Investments purchased - when-issued/delayed-delivery settlement | | | 2,655,000 | | | | 101,937 | | | | 1,937,351 | | | | 45,554 | |
| Variation margin on futures contracts | | | 139,344 | | | | 21,922 | | | | 542,828 | | | | 7,109 | |
Variable Rate Demand Preferred (“VRDP”) Shares, net of deferred offering | | | | | | | | | | | | | | | | |
| costs (liquidation preference $313,900,000, $—, $217,500,000 and | | | | | | | | | | | | | | | | |
| $—, respectively) | | | 312,500,511 | | | | — | | | | 216,716,745 | | | | — | |
Accrued expenses: | | | | | | | | | | | | | | | | |
| Management fees | | | 481,961 | | | | 11,335 | | | | 429,842 | | | | 8,677 | |
| Trustees fees | | | 158,464 | | | | 82 | | | | 149,560 | | | | 65 | |
| Other | | | 107,509 | | | | 42,218 | | | | 104,122 | | | | 41,861 | |
| Total liabilities | | | 352,957,060 | | | | 1,047,862 | | | | 361,350,526 | | | | 600,885 | |
Net assets applicable to common shares | | $ | 710,436,570 | | | $ | 24,372,318 | | | $ | 612,019,940 | | | $ | 19,069,400 | |
Common shares outstanding | | | 41,508,279 | | | | 1,530,856 | | | | 37,383,341 | | | | 1,219,154 | |
Net asset value (“NAV”) per common share outstanding | | $ | 17.12 | | | $ | 15.92 | | | $ | 16.37 | | | $ | 15.64 | |
| Net assets applicable to common shares consist of: | | | | | | | | | | | | | | | | |
Common shares, $0.01 par value per share | | $ | 415,083 | | | $ | 15,309 | | | $ | 373,833 | | | $ | 12,192 | |
Paid-in-surplus | | | 592,319,767 | | | | 21,905,922 | | | | 528,820,243 | | | | 17,447,731 | |
Total distributable earnings | | | 117,701,720 | | | | 2,451,087 | | | | 82,825,864 | | | | 1,609,477 | |
Net assets applicable to common shares | | $ | 710,436,570 | | | $ | 24,372,318 | | | $ | 612,019,940 | | | $ | 19,069,400 | |
Authorized shares: | | | | | | | | | | | | | | | | |
| Common | | Unlimited | | | Unlimited | | | Unlimited | | | Unlimited | |
| Preferred | | Unlimited | | | | N/A | | | Unlimited | | | | N/A | |
(1) Cash pledged to collateralize the net payment obligations for investments in derivatives.
|
N/A — Fund is not authorized to issue Preferred Shares. |
See accompanying notes to financial statements.
67
| |
|
|
| Year Ended February 29, 2020 |
|
|
|
| | |
| | NXJ | | | NJV | | | NQP | | | NPN | |
| Investment Income | | $ | 40,703,196 | | | $ | 932,804 | | | $ | 36,341,132 | | | $ | 742,737 | |
| Expenses | | | | | | | | | | | | | | | | |
Management fees | | | 5,988,959 | | | | 140,882 | | | | 5,348,952 | | | | 108,078 | |
Interest expense and amortization of offering costs | | | 7,532,927 | | | | 14,778 | | | | 7,392,884 | | | | 8,296 | |
Custodian fees | | | 108,597 | | | | 20,432 | | | | 92,985 | | | | 19,446 | |
Trustees fees | | | 25,991 | | | | 616 | | | | 21,064 | | | | 485 | |
Professional fees | | | 126,694 | | | | 26,649 | | | | 82,870 | | | | 26,593 | |
Shareholder reporting expenses | | | 57,005 | | | | 8,682 | | | | 58,794 | | | | 8,289 | |
Shareholder servicing agent fees | | | 20,248 | | | | 155 | | | | 38,510 | | | | 122 | |
Stock exchange listing fees | | | 11,685 | | | | 6,896 | | | | 10,552 | | | | 6,896 | |
Investor relations expenses | | | 36,740 | | | | 1,041 | | | | 30,042 | | | | 877 | |
Other | | | 87,922 | | | | 13,202 | | | | 77,603 | | | | 12,352 | |
Total expenses | | | 13,996,768 | | | | 233,333 | | | | 13,154,256 | | | | 191,434 | |
Net investment income (loss) | | | 26,706,428 | | | | 699,471 | | | | 23,186,876 | | | | 551,303 | |
| Realized and Unrealized Gain (Loss) | | | | | | | | | | | | | | | | |
Net realized gain (loss) from: | | | | | | | | | | | | | | | | |
| Investments | | | 1,066,098 | | | | 61,707 | | | | 2,791,478 | | | | 150,369 | |
| Futures contracts | | | (567,288 | ) | | | (104,424 | ) | | | (4,309,126 | ) | | | (28,350 | ) |
| Swaps | | | (820,253 | ) | | | — | | | | — | | | | — | |
Change in net unrealized appreciation (depreciation) of: | | | | | | | | | | | | | | | | |
| Investments | | | 68,238,463 | | | | 1,850,918 | | | | 53,710,447 | | | | 1,014,478 | |
| Futures contracts | | | (203,441 | ) | | | (37,309 | ) | | | (1,100,046 | ) | | | (11,514 | ) |
| Swaps | | | 259,758 | | | | — | | | | — | | | | — | |
Net realized and unrealized gain (loss) | | | 67,973,337 | | | | 1,770,892 | | | | 51,092,753 | | | | 1,124,983 | |
Net increase (decrease) in net assets applicable to common shares | | | | | | | | | | | | | | | | |
from operations | | $ | 94,679,765 | | | $ | 2,470,363 | | | $ | 74,279,629 | | | $ | 1,676,286 | |
See accompanying notes to financial statements.
68
Statement of Changes in Net Assets
| | | | | | | | | | | | | |
| | NXJ | | | NJV | |
| | Year | | | Year | | | Year | | | Year | |
| | Ended | | | Ended | | | Ended | | | Ended | |
| | 2/29/20 | | | 2/28/19 | | | 2/29/20 | | | 2/28/19 | |
| Operations | | | | | | | | | | | | |
Net investment income (loss) | | $ | 26,706,428 | | | $ | 27,659,950 | | | $ | 699,471 | | | $ | 827,596 | |
Net realized gain (loss) from: | | | | | | | | | | | | | | | | |
| Investments | | | 1,066,098 | | | | 7,263,592 | | | | 61,707 | | | | 437,861 | |
| Futures contracts | | | (567,288 | ) | | | — | | | | (104,424 | ) | | | (8,966 | ) |
| Swaps | | | (820,253 | ) | | | 5,370 | | | | — | | | | (900 | ) |
Change in net unrealized appreciation | | | | | | | | | | | | | | | | |
| (depreciation) of: | | | | | | | | | | | | | | | | |
| Investments | | | 68,238,463 | | | | (990,582 | ) | | | 1,850,918 | | | | (470,302 | ) |
| Futures contracts | | | (203,441 | ) | | | — | | | | (37,309 | ) | | | 4,355 | |
| Swaps | | | 259,758 | | | | (259,758 | ) | | | — | | | | — | |
Net increase (decrease) in net assets | | | | | | | | | | | | | | | | |
| applicable to common shares | | | | | | | | | | | | | | | | |
| from operations | | | 94,679,765 | | | | 33,678,572 | | | | 2,470,363 | | | | 789,644 | |
| Distributions to Common Shareholders | | | | | | | | | | | | | | | | |
Dividends | | | (27,204,525 | ) | | | (31,162,872 | ) | | | (773,848 | ) | | | (1,364,370 | ) |
Decrease in net assets applicable to | | | | | | | | | | | | | | | | |
| common shares from distributions | | | | | | | | | | | | | | | | |
| to common shareholders | | | (27,204,525 | ) | | | (31,162,872 | ) | | | (773,848 | ) | | | (1,364,370 | ) |
| Capital Share Transactions | | | | | | | | | | | | | | | | |
Common shares: | | | | | | | | | | | | | | | | |
| Net proceeds from shares issued to | | | | | | | | | | | | | | | | |
| shareholders due to reinvestment | | | | | | | | | | | | | | | | |
| of distributions | | | — | | | | — | | | | — | | | | — | |
| Cost of shares repurchased | | | | | | | | | | | | | | | | |
| and retired | | | — | | | | (13,238,385 | ) | | | — | | | | (259,677 | ) |
Net increase (decrease) in net assets | | | | | | | | | | | | | | | | |
| applicable to common shares from | | | | | | | | | | | | | | | | |
| capital share transactions | | | — | | | | (13,238,385 | ) | | | — | | | | (259,677 | ) |
Net increase (decrease) in net assets | | | | | | | | | | | | | | | | |
| applicable to common shares | | | 67,475,240 | | | | (10,722,685 | ) | | | 1,696,515 | | | | (834,403 | ) |
Net assets applicable to common | | | | | | | | | | | | | | | | |
| shares at the beginning of period | | | 642,961,330 | | | | 653,684,015 | | | | 22,675,803 | | | | 23,510,206 | |
Net assets applicable to common | | | | | | | | | | | | | | | | |
| shares at the end of period | | $ | 710,436,570 | | | $ | 642,961,330 | | | $ | 24,372,318 | | | $ | 22,675,803 | |
See accompanying notes to financial statements.
69
| |
| Statement of Changes in Net Assets (continued) |
|
|
|
| | |
| | NQP | | | NPN | |
| | Year | | | Year | | | Year | | | Year | |
| | Ended | | | Ended | | | Ended | | | Ended | |
| | 2/29/20 | | | 2/28/19 | | | 2/29/20 | | | 2/28/19 | |
| Operations | | | | | | | | | | | | |
Net investment income (loss) | | $ | 23,186,876 | | | $ | 23,146,738 | | | $ | 551,303 | | | $ | 613,391 | |
Net realized gain (loss) from: | | | | | | | | | | | | | | | | |
| Investments | | | 2,791,478 | | | | 384,135 | | | | 150,369 | | | | 46,552 | |
| Futures contracts | | | (4,309,126 | ) | | | (978,971 | ) | | | (28,350 | ) | | | (788 | ) |
| Swaps | | | — | | | | 660,566 | | | | — | | | | — | |
Change in net unrealized appreciation | | | | | | | | | | | | | | | | |
| (depreciation) of: | | | | | | | | | | | | | | | | |
| Investments | | | 53,710,447 | | | | 11,151,561 | | | | 1,014,478 | | | | 39,967 | |
| Futures contracts | | | (1,100,046 | ) | | | 269,417 | | | | (11,514 | ) | | | 1,134 | |
| Swaps | | | — | | | | (968,985 | ) | | | — | | | | — | |
Net increase (decrease) in net assets | | | | | | | | | | | | | | | | |
| applicable to common shares | | | | | | | | | | | | | | | | |
| from operations | | | 74,279,629 | | | | 33,664,461 | | | | 1,676,286 | | | | 700,256 | |
| Distributions to Common Shareholders | | | | | | | | | | | | | | | | |
Dividends | | | (22,654,307 | ) | | | (23,963,196 | ) | | | (593,448 | ) | | | (739,771 | ) |
Decrease in net assets applicable to | | | | | | | | | | | | | | | | |
| common shares from distributions | | | | | | | | | | | | | | | | |
| to common shareholders | | | (22,654,307 | ) | | | (23,963,196 | ) | | | (593,448 | ) | | | (739,771 | ) |
| Capital Share Transactions | | | | | | | | | | | | | | | | |
Common shares: | | | | | | | | | | | | | | | | |
| Net proceeds from shares issued to | | | | | | | | | | | | | | | | |
| shareholders due to reinvestment | | | | | | | | | | | | | | | | |
| of distributions | | | — | | | | — | | | | 1,250 | | | | 1,486 | |
| Cost of shares repurchased | | | | | | | | | | | | | | | | |
| and retired | | | — | | | | (4,400,970 | ) | | | — | | | | (42,989 | ) |
Net increase (decrease) in net assets | | | | | | | | | | | | | | | | |
| applicable to common shares from | | | | | | | | | | | | | | | | |
| capital share transactions | | | — | | | | (4,400,970 | ) | | | 1,250 | | | | (41,503 | ) |
Net increase (decrease) in net assets | | | | | | | | | | | | | | | | |
| applicable to common shares | | | 51,625,322 | | | | 5,300,295 | | | | 1,084,088 | | | | (81,018 | ) |
Net assets applicable to common | | | | | | | | | | | | | | | | |
| shares at the beginning of period | | | 560,394,618 | | | | 555,094,323 | | | | 17,985,312 | | | | 18,066,330 | |
Net assets applicable to common | | | | | | | | | | | | | | | | |
| shares at the end of period | | $ | 612,019,940 | | | $ | 560,394,618 | | | $ | 19,069,400 | | | $ | 17,985,312 | |
See accompanying notes to financial statements.
70
| |
|
|
| Year Ended February 29, 2020 |
|
|
|
| | |
| | NXJ | | | NQP | |
| Cash Flows from Operating Activities: | | | | | | |
| Net Increase (Decrease) in Net Assets Applicable to Common | | | | | | |
| Shares from Operations | | $ | 94,679,765 | | | $ | 74,279,629 | |
Adjustments to reconcile the net increase (decrease) in net assets | | | | | | | | |
| applicable to common shares from operations to net cash provided by | | | | | | | | |
| (used in) operating activities: | | | | | | | | |
Purchases of investments | | | (92,133,232 | ) | | | (93,118,304 | ) |
Proceeds from sales and maturities of investments | | | 77,471,809 | | | | 91,080,330 | |
Proceeds from (Purchase of) short-term investments, net | | | 1,350,000 | | | | — | |
Premiums received (paid) for interest rate swaps | | | 479 | | | | — | |
Taxes paid | | | (51,842 | ) | | | (2,397 | ) |
Amortization (Accretion) of premiums and discounts, net | | | 1,041,489 | | | | 2,889,970 | |
Amortization of deferred offering costs | | | 60,448 | | | | 34,492 | |
(Increase) Decrease in: | | | | | | | | |
| Receivable for interest | | | (110,678 | ) | | | (328,569 | ) |
| Receivable for investments sold | | | 1,157,388 | | | | (4,720,738 | ) |
| Receivable for variation margin on futures contracts | | | — | | | | 91,656 | |
| Receivable for variation margin on swap contracts | | | 21,077 | | | | — | |
| Other assets | | | (29,114 | ) | | | (26,730 | ) |
Increase (Decrease) in: | | | | | | | | |
| Payable for interest | | | 191,593 | | | | 707,243 | |
| Payable for investments purchased - regular settlement | | | (3,690,000 | ) | | | — | |
| Payable for investments purchased - when-issued/delayed-delivery settlement | | | 2,655,000 | | | | 1,937,351 | |
| Payable for variation margin on futures contracts | | | 139,344 | | | | 542,828 | |
| Accrued management fees | | | 36,370 | | | | 30,916 | |
| Accrued Trustees fees | | | 29,255 | | | | 27,309 | |
| Accrued other expenses | | | (30,278 | ) | | | (64,672 | ) |
Net realized (gain) loss from investments | | | (1,066,098 | ) | | | (2,791,478 | ) |
Change in net unrealized (appreciation) depreciation of investments | | | (68,238,463 | ) | | | (53,710,447 | ) |
Net cash provided by (used in) operating activities | | | 13,484,312 | | | | 16,858,389 | |
| Cash Flow from Financing Activities: | | | | | | | | |
Increase (Decrease) in cash overdraft | | | — | | | | 3,778,443 | |
Proceeds from borrowings | | | 20,839,751 | | | | 17,570,051 | |
(Repayments) of borrowings | | | (20,839,751 | ) | | | (17,570,051 | ) |
Proceeds from floating rate obligations | | | 14,715,000 | | | | 8,745,000 | |
Repayments of floating rate obligations | | | — | | | | (8,880,000 | ) |
Cash distributions paid to common shareholders | | | (27,310,175 | ) | | | (22,525,458 | ) |
Net cash provided by (used in) financing activities | | | (12,595,175 | ) | | | (18,882,015 | ) |
| Net Increase (Decrease) in Cash and Cash Collateral at Brokers | | | 889,137 | | | | (2,023,626 | ) |
Cash and cash collateral at brokers at the beginning of period | | | 988,846 | | | | 2,538,672 | |
Cash and cash collateral at brokers at the end of period | | $ | 1,877,983 | | | $ | 515,046 | |
| | |
| Supplemental Disclosure of Cash Flow Information | | NXJ | | | NQP | |
Cash paid for interest (excluding amortization of offering costs) | | $ | 7,280,885 | | | $ | 6,651,150 | |
See accompanying notes to financial statements.
71
| |
|
|
|
|
|
Selected data for a common share outstanding throughout each period: |
|
|
| | |
| | | | | Investment Operations | | | Less Distributions to Common Shareholders | | | Common Share | |
| | | Beginning Common Share NAV | | | Net Investment Income (Loss) | | | Net Realized/ Unrealized Gain (Loss) | | | Total | | | From Net Investment Income | | | From Accum- ulated Net Realized Gains | | | Total | | | Discount Per Share Repurchased and Retired | | | Ending NAV | | | Ending Share Price | |
| NXJ | | | | | | | | | | | | | | | | | | | | | | | | | | | | | | |
Year Ended 2/28-2/29:
| | | | | | | | | | | | | | | | | | | | | | |
2020 | | $ | 15.49 | | | $ | 0.64 | | | $ | 1.65 | | | $ | 2.29 | | | $ | (0.65 | ) | | $ | (0.01 | ) | | $ | (0.66 | ) | | $ | — | | | $ | 17.12 | | | $ | 14.73 | |
2019 | | | 15.37 | | | | 0.66 | | | | 0.14 | | | | 0.80 | | | | (0.66 | ) | | | (0.08 | ) | | | (0.74 | ) | | | 0.06 | | | | 15.49 | | | | 13.47 | |
2018 | | | 15.21 | | | | 0.71 | | | | 0.15 | | | | 0.86 | | | | (0.70 | ) | | | — | | | | (0.70 | ) | | | — | * | | | 15.37 | | | | 13.10 | |
2017(e) | | | 16.18 | | | | 0.60 | | | | (0.94 | ) | | | (0.34 | ) | | | (0.63 | ) | | | — | | | | (0.63 | ) | | | — | | | | 15.21 | | | | 13.42 | |
Year Ended 4/30:
| | | | | | | | | | | | | | | | | | | | | | | | | | | | | |
2016 | | | 15.53 | | | | 0.79 | | | | 0.66 | | | | 1.45 | | | | (0.82 | ) | | | (0.01 | ) | | | (0.83 | ) | | | 0.03 | | | | 16.18 | | | | 14.66 | |
2015 | | | 15.28 | | | | 0.67 | | | | 0.34 | | | | 1.01 | | | | (0.77 | ) | | | — | | | | (0.77 | ) | | | 0.01 | | | | 15.53 | | | | 13.58 | |
| | |
| NJV | | | | | | | | | | | | | | | | | | | | | | | | | | | | | | | | | | | | | | | | |
Year Ended 2/28-2/29:
| | | | | | | | | | | | | | | | | | | | | | | | | | | | | |
2020 | | | 14.81 | | | | 0.46 | | | | 1.16 | | | | 1.62 | | | | (0.51 | ) | | | — | | | | (0.51 | ) | | | — | | | | 15.92 | | | | 13.96 | |
2019 | | | 15.15 | | | | 0.54 | | | | (0.02 | ) | | | 0.52 | | | | (0.55 | ) | | | (0.34 | ) | | | (0.89 | ) | | | 0.03 | | | | 14.81 | | | | 13.08 | |
2018 | | | 15.56 | | | | 0.57 | | | | (0.05 | ) | | | 0.52 | | | | (0.58 | ) | | | (0.35 | ) | | | (0.93 | ) | | | — | | | | 15.15 | | | | 13.55 | |
2017(e) | | | 16.32 | | | | 0.49 | | | | (0.58 | ) | | | (0.09 | ) | | | (0.52 | ) | | | (0.15 | ) | | | (0.67 | ) | | | — | | | | 15.56 | | | | 15.61 | |
Year Ended 4/30:
| | | | | | | | | | | | | | | | | | | | | | | | | | | | | |
2016 | | | 16.41 | | | | 0.62 | | | | 0.11 | | | | 0.73 | | | | (0.61 | ) | | | (0.21 | ) | | | (0.82 | ) | | | — | | | | 16.32 | | | | 15.16 | |
2015 | | | 16.15 | | | | 0.62 | | | | 0.43 | | | | 1.05 | | | | (0.63 | ) | | | (0.18 | ) | | | (0.81 | ) | | | 0.02 | | | | 16.41 | | | | 14.75 | |
| | |
(a) | Total Return Based on Common Share NAV is the combination of changes in common share NAV, reinvested dividend income at NAV and reinvested capital gains distributions at NAV, if any. The last dividend declared in the period, which is typically paid on the first business day of the following month, is assumed to be reinvested at the ending NAV. The actual reinvest price for the last dividend declared in the period may often be based on the Fund’s market price (and not its NAV), and therefore may be different from the price used in the calculation. Total returns are not annualized. |
| Total Return Based on Common Share Price is the combination of changes in the market price per share and the effect of reinvested dividend income and reinvested capital gains distributions, if any, at the average price paid per share at the time of reinvestment. The last dividend declared in the period, which is typically paid on the first business day of the following month, is assumed to be reinvested at the ending market price. The actual reinvestment for the last dividend declared in the period may take place over several days, and in some instances may not be based on the market price, so the actual reinvestment price may be different from the price used in the calculation. Total returns are not annualized. |
72
| | | | | | | | | | | | | | | | | |
| | | | | | | Common Share Supplemental Data/ Ratios Applicable to Common Shares | |
Common Share Total Returns | | | | | | Ratios to Average Net Assets(b) | | | | |
| | |
| | |
Based on NAV(a) | | | Based on Share Price(a) | | | Ending Net Assets (000) | | | Expenses(c) | | | Net Investment Income (Loss) | | | Portfolio Turnover Rate(d) | |
| | |
| | |
| | 15.02 | % | | | 14.43 | % | | $ | 710,437 | | | | 2.07 | % | | | 3.94 | % | | | 8 | % |
| | 5.77 | | | | 8.86 | | | | 642,961 | | | | 2.13 | | | | 4.30 | | | | 16 | |
| | 5.66 | | | | 2.74 | | | | 653,684 | | | | 1.78 | | | | 4.55 | | | | 11 | |
| | (2.20 | ) | | | (4.35 | ) | | | 647,626 | | | | 1.76 | ** | | | 4.54 | ** | | | 12 | |
| | |
| | 9.85 | | | | 14.79 | | | | 688,971 | | | | 1.56 | | | | 5.12 | | | | 14 | |
| | 6.77 | | | | 5.35 | | | | 668,670 | | | | 1.71 | | | | 4.64 | | | | 14 | |
| | |
| | |
| | |
| | 11.07 | | | | 10.71 | | | | 24,372 | | | | 0.99 | | | | 2.97 | | | | 21 | |
| | 3.73 | | | | 3.39 | | | | 22,676 | | | | 1.07 | | | | 3.58 | | | | 24 | |
| | 3.31 | | | | (7.48 | ) | | | 23,510 | | | | 1.03 | | | | 3.63 | | | | 16 | |
| | (0.57 | ) | | | 7.39 | | | | 24,139 | | | | 0.96 | ** | | | 3.62 | ** | | | 14 | |
| | |
| | 4.57 | | | | 8.70 | | | | 25,297 | | | | 0.89 | | | | 3.87 | | | | 8 | |
| | 6.68 | | | | 7.62 | | | | 25,430 | | | | 0.87 | | | | 3.75 | | | | 13 | |
| | |
(b) | Net Investment Income (Loss) ratios reflect income earned and expenses incurred (as further described below) on assets attributable to preferred shares issued by the Fund, where applicable. |
(c) | The expense ratios reflect, among other things, all interest expense and other costs related to preferred shares (as described in Note 5 – Fund Shares, Preferred Shares) and/or the interest expense deemed to have been paid by the Fund on the floating rate certificates issued by the special purpose trusts for the self-deposited inverse floaters held by the Fund (as described in Note 4 – Portfolio Securities and Investments in Derivatives, Inverse Floating Rate Securities), where applicable, as follows: |
| | | | | |
| NXJ | | | NJV | |
Year Ended 2/28-2/29: | | Year Ended 2/28-2/29: |
2020 | 1.11% | | 2020 | 0.06% |
2019 | 1.13 | | 2019 | 0.13 |
2018 | 0.80 | | 2018 | 0.09 |
2017(e) | 0.79** | | 2017(e) | 0.07** |
Year Ended 4/30: | | Year Ended 4/30: |
2016 | 0.57 | | 2016 | 0.04 |
2015 | 0.60 | | 2015 | 0.04 |
| | |
(d) | Portfolio Turnover Rate is calculated based on the lesser of long-term purchases or sales (as disclosed in Note 4 – Portfolio Securities and Investments in Derivatives, Investment Transactions) divided by the average long-term market value during the period. |
(e) | For the ten months ended February 28, 2017. |
* | Rounds to less than $0.01 per share. |
** | Annualized. |
See accompanying notes to financial statements.
73
| |
| Financial Highlights (continued) |
|
|
|
|
Selected data for a common share outstanding throughout each period: |
|
|
| | |
| | | | | Investment Operations | | | Less Distributions to Common Shareholders | | | Common Share | |
| | | Beginning Common Share NAV | | | Net Investment Income (Loss) | | | Net Realized/ Unrealized Gain (Loss) | | | Total | | | From Net Investment Income | | | From Accum- ulated Net Realized Gains | | | Total | | | Discount Per Share Repurchased and Retired | | | Ending NAV | | | Ending Share Price | |
| NQP | | | | | | | | | | | | | | | | | | | | | | | | | | | | | | |
Year Ended 2/28-2/29:
| | | | | | | | | | | | | | | | | | | | | | |
2020 | | $ | 14.99 | | | $ | 0.62 | | | $ | 1.37 | | | $ | 1.99 | | | $ | (0.61 | ) | | $ | — | | | $ | (0.61 | ) | | $ | — | | | $ | 16.37 | | | $ | 14.46 | |
2019 | | | 14.71 | | | | 0.62 | | | | 0.27 | | | | 0.89 | | | | (0.59 | ) | | | (0.04 | ) | | | (0.63 | ) | | | 0.02 | | | | 14.99 | | | | 13.02 | |
2018 | | | 14.79 | | | | 0.69 | | | | (0.08 | ) | | | 0.61 | | | | (0.69 | ) | | | — | *** | | | (0.69 | ) | | | — | * | | | 14.71 | | | | 12.52 | |
2017(e) | | | 16.08 | | | | 0.60 | | | | (1.24 | ) | | | (0.64 | ) | | | (0.62 | ) | | | (0.03 | ) | | | (0.65 | ) | | | — | | | | 14.79 | | | | 13.30 | |
Year Ended 4/30: | | | | | | | | | | | | | | | | | | | | | | | | | | | | | |
2016 | | | 15.64 | | | | 0.80 | | | | 0.46 | | | | 1.26 | | | | (0.83 | ) | | | — | | | | (0.83 | ) | | | 0.01 | | | | 16.08 | | | | 14.91 | |
2015 | | | 15.17 | | | | 0.81 | | | | 0.50 | | | | 1.31 | | | | (0.84 | ) | | | — | | | | (0.84 | ) | | | — | * | | | 15.64 | | | | 13.87 | |
| | |
| NPN | | | | | | | | | | | | | | | | | | | | | | | | | | | | | | | | | | | | | | | | |
Year Ended 2/28-2/29:
| | | | | | | | | | | | | | | | | | | | | | | | | | | | | |
2020 | | | 14.75 | | | | 0.45 | | | | 0.93 | | | | 1.38 | | | | (0.47 | ) | | | (0.02 | ) | | | (0.49 | ) | | | — | | | | 15.64 | | | | 14.67 | |
2019 | | | 14.78 | | | | 0.50 | | | | 0.06 | | | | 0.56 | | | | (0.50 | ) | | | (0.10 | ) | | | (0.60 | ) | | | 0.01 | | | | 14.75 | | | | 13.19 | |
2018 | | | 15.16 | | | | 0.55 | | | | (0.16 | ) | | | 0.39 | | | | (0.58 | ) | | | (0.19 | ) | | | (0.77 | ) | | | — | | | | 14.78 | | | | 15.15 | |
2017(e) | | | 16.50 | | | | 0.51 | | | | (0.73 | ) | | | (0.22 | ) | | | (0.64 | ) | | | (0.48 | ) | | | (1.12 | ) | | | — | | | | 15.16 | | | | 15.83 | |
Year Ended 4/30:
| | | | | | | | | | | | | | | | | | | | | | | | | | | | | |
2016 | | | 16.36 | | | | 0.68 | | | | 0.09 | | | | 0.77 | | | | (0.63 | ) | | | — | | | | (0.63 | ) | | | — | | | | 16.50 | | | | 16.45 | |
2015 | | | 15.91 | | | | 0.67 | | | | 0.41 | | | | 1.08 | | | | (0.63 | ) | | | — | | | | (0.63 | ) | | | — | | | | 16.36 | | | | 15.57 | |
| | |
(a) | Total Return Based on Common Share NAV is the combination of changes in common share NAV, reinvested dividend income at NAV and reinvested capital gains distributions at NAV, if any. The last dividend declared in the period, which is typically paid on the first business day of the following month, is assumed to be reinvested at the ending NAV. The actual reinvest price for the last dividend declared in the period may often be based on the Fund’s market price (and not its NAV), and therefore may be different from the price used in the calculation. Total returns are not annualized. |
| Total Return Based on Common Share Price is the combination of changes in the market price per share and the effect of reinvested dividend income and reinvested capital gains distributions, if any, at the average price paid per share at the time of reinvestment. The last dividend declared in the period, which is typically paid on the first business day of the following month, is assumed to be reinvested at the ending market price. The actual reinvestment for the last dividend declared in the period may take place over several days, and in some instances may not be based on the market price, so the actual reinvestment price may be different from the price used in the calculation. Total returns are not annualized. |
74
| | | | | | | | | | | | | | | | | |
| | | | | | | Common Share Supplemental Data/ Ratios Applicable to Common Shares | |
Common Share Total Returns | | | | | | Ratios to Average Net Assets(b) | | | | |
| | |
| | |
Based on NAV(a) | | | Based on Share Price(a) | | | Ending Net Assets (000) | | | Expenses(c) | | | Net Investment Income (Loss) | | | Portfolio Turnover Rate(d) | |
| | |
| | |
| | 13.62 | % | | | 15.97 | % | | $ | 612,020 | | | | 2.24 | % | | | 3.95 | % | | | 11 | % |
| | 6.40 | | | | 9.41 | | | | 560,395 | | | | 2.44 | | | | 4.19 | | | | 8 | |
| | 4.12 | | | | (0.85 | ) | | | 555,094 | | | | 2.05 | | | | 4.56 | | | | 12 | |
| | (4.19 | ) | | | (6.66 | ) | | | 558,373 | | | | 1.87 | ** | | | 4.57 | ** | | | 16 | |
| | |
| | 8.46 | | | | 14.21 | | | | 607,240 | | | | 1.51 | | | | 5.13 | | | | 16 | |
| | 8.79 | | | | 7.09 | | | | 592,540 | | | | 1.60 | | | | 5.21 | | | | 9 | |
| | |
| | |
| | |
| | 9.54 | | | | 15.04 | | | | 19,069 | | | | 1.03 | | | | 2.97 | | | | 20 | |
| | 3.99 | | | | (8.87 | ) | | | 17,985 | | | | 1.02 | | | | 3.41 | | | | 10 | |
| | 2.58 | | | | 0.68 | | | | 18,066 | | | | 1.02 | | | | 3.61 | | | | 28 | |
| | (1.33 | ) | | | 3.08 | | | | 18,517 | | | | 0.93 | ** | | | 3.80 | ** | | | 23 | |
| | |
| | 4.82 | | | | 10.09 | | | | 20,118 | | | | 0.85 | | | | 4.17 | | | | 14 | |
| | 6.87 | | | | 12.30 | | | | 19,952 | | | | 0.85 | | | | 4.11 | | | | 5 | |
| | |
(b) | Net Investment Income (Loss) ratios reflect income earned and expenses incurred (as further described below) on assets attributable to preferred shares issued by the Fund, where applicable. |
(c) | The expense ratios reflect, among other things, all interest expense and other costs related to preferred shares (as described in Note 5 – Fund Shares, Preferred Shares) and/or the interest expense deemed to have been paid by the Fund on the floating rate certificates issued by the special purpose trusts for the self-deposited inverse floaters held by the Fund (as described in Note 4 – Portfolio Securities and Investments in Derivatives, Inverse Floating Rate Securities), where applicable, as follows: |
| | | | | |
| NQP | | | NPN | |
Year Ended 2/28-2/29: | | Year Ended 2/28-2/29: |
2020 | 1.26% | | 2020 | 0.04% |
2019 | 1.43 | | 2019 | 0.04 |
2018 | 1.06 | | 2018 | 0.02 |
2017(e) | 0.89** | | 2017(e) | 0.01** |
Year Ended 4/30: | | Year Ended 4/30: |
2016 | 0.56 | | 2016 | — |
2015 | 0.60 | | 2015 | — |
| | |
(d) | Portfolio Turnover Rate is calculated based on the lesser of long-term purchases or sales (as disclosed in Note 4 – Portfolio Securities and Investments in Derivatives, Investment Transactions) divided by the average long-term market value during the period. |
(e) | For the ten months ended February 28, 2017. |
* | Rounds to less than $0.01 per share. |
** | Annualized. |
*** | Rounds to more than $(0.01) per share. |
See accompanying notes to financial statements.
75
| |
| Financial Highlights (continued) |
|
|
|
| | |
| | VMTP Shares at the End of Period | | | VRDP Shares at the End of Period | | | VMTP and VRDP Shares at the End of Period | |
| | | Aggregate Amount Outstanding (000) | | | Asset Coverage Per $100,000 Share | | | Aggregate Amount Outstanding (000) | | | Asset Coverage Per $100,000 Share | | | Asset Coverage Per $1 Liquidation Preference | |
| NXJ | | | | | | | | | | | | | | | |
Year Ended 2/28-2/29: | | | | | | | | | | | | | | | |
2020 | | $ | — | | | $ | — | | | $ | 313,900 | | | $ | 326,326 | | | $ | — | |
2019 | | | — | | | | — | | | | 313,900 | | | | 304,830 | | | | — | |
2018 | | | — | | | | — | | | | 313,900 | | | | 308,246 | | | | — | |
2017(b) | | | — | | | | — | | | | 313,900 | | | | 306,316 | | | | — | |
Year Ended 4/30: | | | | | | | | | | | | | | | | | | | | |
2016 | | | — | | | | — | | | | 313,900 | | | | 319,488 | | | | — | |
2015(a) | | | — | | | | — | | | | 313,900 | | | | 313,020 | | | | — | |
| | |
| NQP | | | | | | | | | | | | | | | | | | | | |
Year Ended 2/28-2/29: | | | | | | | | | | | | | | | | | | | | |
2020 | | | — | | | | — | | | | 217,500 | | | | 381,388 | | | | — | |
2019 | | | — | | | | — | | | | 217,500 | | | | 357,653 | | | | — | |
2018 | | | 87,000 | | | | 282,297 | | | | 217,500 | | | | 282,297 | | | | 2.82 | |
2017(b) | | | 87,000 | | | | 283,374 | | | | 217,500 | | | | 283,374 | | | | 2.83 | |
Year Ended 4/30: | | | | | | | | | | | | | | | | | | | | |
2016 | | | 48,000 | | | | 328,716 | | | | 217,500 | | | | 328,716 | | | | 3.29 | |
2015(a) | | | 48,000 | | | | 323,179 | | | | 217,500 | | | | 323,179 | | | | 3.23 | |
| | |
(a) | The Ending and Average Market Value Per Share for each Series of the Fund’s MTP Shares were as follows: |
| | | |
| 2015 | |
| NXJ | | |
| Series 2015 (NXJ PRCCL) | | |
Ending Market Value per Share | | $ | — | |
Average Market Value per Share | 10.01 | ^
|
| | | | | |
| NQP | | | | |
| Series 2015 (NQP PRCCL) | | | | |
Ending Market Value per Share | | | — | |
Average Market Value per Share | | | 10.01 | Ω |
| Series 2015 (NQP PRDCL) | | | | |
Ending Market Value per Share | | | — | |
Average Market Value per Share | | | 10.02 | Ω |
| | |
(b) | For the ten months ended February 28, 2017. |
^ | For the period November 10, 2014 (effective date of the reorganizations) through February 9, 2015. |
| For the period May 1, 2014 through May 30, 2014. |
See accompanying notes to financial statements.
76
Notes toFinancial Statements 1. General Information
Fund Information
The funds covered in this report and their corresponding New York Stock Exchange (“NYSE”) symbols are as follows (each a “Fund” and collectively, the “Funds”):
| • | Nuveen New Jersey Quality Municipal Income Fund (NXJ) |
| • | Nuveen New Jersey Municipal Value Fund (NJV) |
| • | Nuveen Pennsylvania Quality Municipal Income Fund (NQP) |
| • | Nuveen Pennsylvania Municipal Value Fund (NPN) |
The Funds are registered under the Investment Company Act of 1940 (the “1940 Act”), as amended, as diversified (non-diversified for NJV) closed-end management investment companies. NXJ, NJV, NQP and NPN were organized as Massachusetts business trusts on June 1, 1999, January 26, 2009, December 20, 1990 and January 26, 2009, respectively.
The end of the reporting period for the Funds is February 29, 2020, and the period covered by these Notes to Financial Statements is the fiscal year ended February 29, 2020 (the “current fiscal period”).
Investment Adviser and Sub-Adviser
The Funds’ investment adviser is Nuveen Fund Advisors, LLC (the “Adviser”), a subsidiary of Nuveen, LLC (“Nuveen”). Nuveen is the investment management arm of Teachers Insurance and Annuity Association of America (TIAA). The Adviser has overall responsibility for management of the Funds, oversees the management of the Funds’ portfolios, manages the Funds’ business affairs and provides certain clerical, bookkeeping and other administrative services, and, if necessary, asset allocation decisions. The Adviser has entered into sub-advisory agreements with Nuveen Asset Management, LLC (the “Sub-Adviser”), a subsidiary of the Adviser, under which the Sub-Adviser manages the investment portfolios of the Funds.
2. Significant Accounting Policies
The accompanying financial statements were prepared in accordance with accounting principles generally accepted in the United States of America (“U.S. GAAP”), which may require the use of estimates made by management and the evaluation of subsequent events. Actual results may differ from those estimates. Each Fund is an investment company and follows the accounting guidance in the Financial Accounting Standards Board (“FASB”) Accounting Standards Codification 946, Financial Services—Investment Companies. The net asset value (“NAV”) for financial reporting purposes may differ from the NAV for processing security and common share transactions. The NAV for financial reporting purposes includes security and common share transactions through the date of the report. Total return is computed based on the NAV used for processing security and common share transactions. The following is a summary of the significant accounting policies consistently followed by the Funds.
Compensation
The Funds pay no compensation directly to those of its trustees who are affiliated with the Adviser or to its officers, all of whom receive remuneration for their services to the Funds from the Adviser or its affiliates. The Funds’ Board of Trustees (the “Board”) has adopted a deferred compensation plan for independent trustees that enables trustees to elect to defer receipt of all or a portion of the annual compensation they are entitled to receive from certain Nuveen-advised funds. Under the plan, deferred amounts are treated as though equal dollar amounts had been invested in shares of select Nuveen-advised funds.
Distributions to Common Shareholders
Distributions to common shareholders are recorded on the ex-dividend date. The amount, character and timing of distributions are determined in accordance with federal income tax regulations, which may differ from U.S. GAAP.
Indemnifications
Under the Funds’ organizational documents, their officers and trustees are indemnified against certain liabilities arising out of the performance of their duties to the Funds. In addition, in the normal course of business, the Funds enter into contracts that provide general indemnifications to other parties. The Funds’ maximum exposure under these arrangements is unknown as this would involve future claims that may be made against the Funds that have not yet occurred. However, the Funds have not had prior claims or losses pursuant to these contracts and expect the risk of loss to be remote.
77
Notes to Financial Statements (continued)
Investments and Investment Income
Securities transactions are accounted for as of the trade date for financial reporting purposes. Realized gains and losses on securities transactions are based upon the specific identification method. Investment income is comprised of interest income, which is recorded on an accrual basis and includes accretion of discounts and amortization of premiums for financial reporting purposes. Investment income also reflects payment-in-kind (“PIK”) interest and paydown gains and losses, if any. PIK interest represents income received in the form of securities in lieu of cash. Investment income also reflects dividend income, which is recorded on the ex-dividend date.
Netting Agreements
In the ordinary course of business, the Funds may enter into transactions subject to enforceable International Swaps and Derivative Association, Inc. (ISDA) master agreements or other similar arrangements (“netting agreements”). Generally, the right to offset in netting agreements allows each Fund to offset certain securities and derivatives with a specific counterparty, when applicable, as well as any collateral received or delivered to that counterparty based on the terms of the agreements. Generally, each Fund manages its cash collateral and securities collateral on a counterparty basis.
The Funds’ investments subject to netting agreements as of the end of the reporting period, if any, are further described in Note 4 – Portfolio Securities and Investments in Derivatives.
New Accounting Pronouncements and Rule Issuances
FASB Accounting Standards Update (“ASU”) 2017-08 (“ASU 2017-08”) Premium Amortization on Purchased Callable Debt Securities
The FASB has issued ASU 2017-08, which shortens the premium amortization period for purchased non-contingently callable debt securities. ASU 2017-08 specifies that the premium amortization period ends at the earliest call date, for purchased non-contingently callable debt securities. ASU 2017-08 is effective for fiscal years, and interim periods within those fiscal years, beginning after December 15, 2018. During the current fiscal period, ASU 2017-08 became effective for the Funds and it did not have a material impact on the Funds’ financial statements.
Fair Value Measurement: Disclosure Framework
During August 2018, the FASB issued ASU 2018-13 (“ASU 2018-13”), Fair Value Measurement: Disclosure Framework – Changes to the Disclosure Requirements for Fair Value Measurements. ASU 2018-13 modifies the disclosures required by Topic 820, Fair Value Measurements. The amendments in ASU 2018-13 are effective for all entities for fiscal years, and interim periods within those fiscal years, beginning after December 15, 2019. Management has early implemented this guidance and it did not have a material impact on the Funds’ financial statements.
3. Investment Valuation and Fair Value Measurements
The fair valuation input levels as described below are for fair value measurement purposes.
The Funds’ investments in securities are recorded at their estimated fair value. Fair value is defined as the price that would be received upon selling an investment or transferring a liability in an orderly transaction to an independent buyer in the principal or most advantageous market for the investment. A three-tier hierarchy is used to maximize the use of observable market data and minimize the use of unobservable inputs and to establish classification of fair value measurements for disclosure purposes. Observable inputs reflect the assumptions market participants would use in pricing the asset or liability. Observable inputs are based on market data obtained from sources independent of the reporting entity. Unobservable inputs reflect the reporting entity’s own assumptions about the assumptions market participants would use in pricing the asset or liability. Unobservable inputs are based on the best information available in the circumstances. The following is a summary of the three-tiered hierarchy of valuation input levels.
Level 1 – Inputs are unadjusted and prices are determined using quoted prices in active markets for identical securities.
Level 2 – Prices are determined using other significant observable inputs (including quoted prices for similar securities, interest rates, credit spreads, etc.).
Level 3 – Prices are determined using significant unobservable inputs (including management’s assumptions in determining the fair value of investments).
Common stocks and other equity-type securities are valued at the last sales price on the securities exchange on which such securities are primarily traded and are generally classified as Level 1. Securities primarily traded on the Nasdaq National Market (“Nasdaq”) are valued at the Nasdaq Official Closing Price and are generally classified as Level 1. However, securities traded on a securities exchange or Nasdaq for which there were no transactions on a given day or securities not listed on a securities exchange or Nasdaq are valued at the quoted bid price and are generally classified as Level 2.
Prices of fixed income securities are provided by an independent pricing service (“pricing service”) approved by the Board. The pricing service establishes a security’s fair value using methods that may include consideration of the following: yields or prices of investments of comparable quality, type of issue, coupon, maturity and rating, market quotes or indications of value from security dealers, evaluations of anticipated cash flows or collateral, general market conditions and other information and analysis, including the obligor’s credit characteristics considered relevant. These securities are generally classified as Level 2. In pricing certain securities, particularly less liquid and lower quality securities, the pricing service may
78
consider information about a security, its issuer or market activity, provided by the Adviser. These securities are generally classified as Level 2 or Level 3 depending on the observability of the significant inputs.
Prices of swap contracts are also provided by a pricing service approved by the Board using the same methods as described above and are generally classified as Level 2.
Futures contracts are valued using the closing settlement price or, in the absence of such a price, the last traded price and are generally classified as Level 1.
Certain securities may not be able to be priced by the pre-established pricing methods as described above. Such securities may be valued by the Board and/or its appointee at fair value. These securities generally include, but are not limited to, restricted securities (securities which may not be publicly sold without registration under the Securities Act of 1933, as amended) for which a pricing service is unable to provide a market price; securities whose trading has been formally suspended; debt securities that have gone into default and for which there is no current market quotation; a security whose market price is not available from a pre-established pricing source; a security with respect to which an event has occurred that is likely to materially affect the value of the security after the market has closed but before the calculation of a Fund’s NAV (as may be the case in non-U.S. markets on which the security is primarily traded) or make it difficult or impossible to obtain a reliable market quotation; and a security whose price, as provided by the pricing service, is not deemed to reflect the security’s fair value. As a general principle, the fair value of a security would appear to be the amount that the owner might reasonably expect to receive for it in a current sale. A variety of factors may be considered in determining the fair value of such securities, which may include consideration of the following: yields or prices of investments of comparable quality, type of issue, coupon, maturity and rating, market quotes or indications of value from security dealers, evaluations of anticipated cash flows or collateral, general market conditions and other information and analysis, including the obligor’s credit characteristics considered relevant. These securities are generally classified as Level 2 or Level 3 depending on the observability of the significant inputs. Regardless of the method employed to value a particular security, all valuations are subject to review by the Board and/or its appointee.
The inputs or methodologies used for valuing securities are not an indication of the risks associated with investing in those securities. The following is a summary of each Fund’s fair value measurements as of the end of the reporting period:
| | | | | | | | | | | | | |
| NXJ | | Level 1 | | | Level 2 | | | Level 3 | | | Total | |
Long-Term Investments*: | | | | | | | | | | | | |
| Municipal Bonds | | $ | — | | | $ | 1,051,362,380 | | | $ | — | | | $ | 1,051,362,380 | |
Investments in Derivatives: | | | | | | | | | | | | | | | | |
| Futures Contracts** | | | (203,441 | ) | | | — | | | | — | | | | (203,441 | ) |
Total | | $ | (203,441 | ) | | $ | 1,051,362,380 | | | $ | — | | | $ | 1,051,158,939 | |
| NJV | | | | | | | | | | | | | | | | |
Long-Term Investments*: | | | | | | | | | | | | | | | | |
| Municipal Bonds | | $ | — | | | $ | 25,126,835 | | | $ | — | | | $ | 25,126,835 | |
Investments in Derivatives: | | | | | | | | | | | | | | | | |
| Futures Contracts** | | | (32,954 | ) | | | — | | | | — | | | | (32,954 | ) |
Total | | $ | (32,954 | ) | | $ | 25,126,835 | | | $ | — | | | $ | 25,093,881 | |
| NQP | | | | | | | | | | | | | | | | |
Long-Term Investments*: | | | | | | | | | | | | | | | | |
| Municipal Bonds | | $ | — | | | $ | 940,135,274 | | | $ | — | | | $ | 940,135,274 | |
| Common Stocks | | | — | | | | 17,057,038 | *** | | | — | | | | 17,057,038 | |
Investments in Derivatives: | | | | | | | | | | | | | | | | |
| Futures Contracts** | | | (830,629 | ) | | | — | | | | — | | | | (830,629 | ) |
Total | | $ | (830,629 | ) | | $ | 957,192,312 | | | $ | — | | | $ | 956,361,683 | |
| NPN | | | | | | | | | | | | | | | | |
Long-Term Investments*: | | | | | | | | | | | | | | | | |
| Municipal Bonds | | $ | — | | | $ | 18,910,334 | | | $ | — | | | $ | 18,910,334 | |
| Common Stocks | | | — | | | | 416,484 | *** | | | — | | | | 416,484 | |
Investments in Derivatives: | | | | | | | | | | | | | | | | |
| Futures Contracts** | | | (10,380 | ) | | | — | | | | — | | | | (10,380 | ) |
Total | | $ | (10,380 | ) | | $ | 19,326,818 | | | $ | — | | | $ | 19,316,438 | |
* Refer to the Fund’s Portfolio of Investments for industry classifications.
** Represents net unrealized appreciation (depreciation) as reported in the Fund’s Portfolio of Investments.
*** Refer to the Fund’s Portfolio of Investments for securities classified as Level 2.
79
Notes to Financial Statements (continued)
4. Portfolio Securities and Investments in Derivatives
Portfolio Securities
Inverse Floating Rate Securities
Each Fund is authorized to invest in inverse floating rate securities. An inverse floating rate security is created by depositing a municipal bond (referred to as an “Underlying Bond”), typically with a fixed interest rate, into a special purpose tender option bond (“TOB”) trust (referred to as the “TOB Trust”) created by or at the direction of one or more Funds. In turn, the TOB Trust issues (a) floating rate certificates (referred to as “Floaters”) in face amounts equal to some fraction of the Underlying Bond’s par amount or market value, and (b) an inverse floating rate certificate (referred to as an “Inverse Floater”) that represents all remaining or residual interest in the TOB Trust. Floaters typically pay short-term tax-exempt interest rates to third parties who are also provided a right to tender their certificate and receive its par value, which may be paid from the proceeds of a remarketing of the Floaters, by a loan to the TOB Trust from a third party liquidity provider (“Liquidity Provider”), or by the sale of assets from the TOB Trust. The Inverse Floater is issued to a long term investor, such as one or more of the Funds. The income received by the Inverse Floater holder varies inversely with the short-term rate paid to holders of the Floaters, and in most circumstances the Inverse Floater holder bears substantially all of the Underlying Bond’s downside investment risk and also benefits disproportionately from any potential appreciation of the Underlying Bond’s value. The value of an Inverse Floater will be more volatile than that of the Underlying Bond because the interest rate is dependent on not only the fixed coupon rate of the Underlying Bond but also on the short-term interest paid on the Floaters, and because the Inverse Floater essentially bears the risk of loss (and possible gain) of the greater face value of the Underlying Bond.
The Inverse Floater held by a Fund gives the Fund the right to (a) cause the holders of the Floaters to tender their certificates at par (or slightly more than par in certain circumstances), and (b) have the trustee of the TOB Trust (the “Trustee”) transfer the Underlying Bond held by the TOB Trust to the Fund, thereby collapsing the TOB Trust.
The Fund may acquire an Inverse Floater in a transaction where it (a) transfers an Underlying Bond that it owns to a TOB Trust created by a third party or (b) transfers an Underlying Bond that it owns, or that it has purchased in a secondary market transaction for the purpose of creating an Inverse Floater, to a TOB Trust created at its direction, and in return receives the Inverse Floater of the TOB Trust (referred to as a “self-deposited Inverse Floater”). A Fund may also purchase an Inverse Floater in a secondary market transaction from a third party creator of the TOB Trust without first owning the Underlying Bond (referred to as an “externally-deposited Inverse Floater”).
An investment in a self-deposited Inverse Floater is accounted for as a “financing” transaction (i.e., a secured borrowing). For a self-deposited Inverse Floater, the Underlying Bond deposited into the TOB Trust is identified in the Fund’s Portfolio of Investments as “(UB) – Underlying bond of an inverse floating rate trust reflected as a financing transaction,” with the Fund recognizing as liabilities, labeled “Floating rate obligations” on the Statement of Assets and Liabilities, (a) the liquidation value of Floaters issued by the TOB Trust, and (b) the amount of any borrowings by the TOB Trust from a Liquidity Provider to enable the TOB Trust to purchase outstanding Floaters in lieu of a remarketing. In addition, the Fund recognizes in “Investment Income” the entire earnings of the Underlying Bond, and recognizes (a) the interest paid to the holders of the Floaters or on the TOB Trust’s borrowings, and (b) other expenses related to remarketing, administration, trustee, liquidity and other services to a TOB Trust, as a component of “Interest expense and amortization of offering costs” on the Statement of Operations. Earnings due from the Underlying Bond and interest due to the holders of the Floaters as of the end of the reporting period are recognized as components of “Receivable for interest” and “Payable for interest” on the Statement of Assets and Liabilities, respectively.
In contrast, an investment in an externally-deposited Inverse Floater is accounted for as a purchase of the Inverse Floater and is identified in the Fund’s Portfolio of Investments as “(IF) – Inverse floating rate investment.” For an externally-deposited Inverse Floater, a Fund’s Statement of Assets and Liabilities recognizes the Inverse Floater and not the Underlying Bond as an asset, and the Fund does not recognize the Floaters, or any related borrowings from a Liquidity Provider, as a liability. Additionally, the Fund reflects in “Investment Income” only the net amount of earnings on the Inverse Floater (net of the interest paid to the holders of the Floaters or the Liquidity Provider as lender, and the expenses of the Trust), and does not show the amount of that interest paid or the expenses of the TOB Trust as described above as interest expense on the Statement of Operations.
Fees paid upon the creation of a TOB Trust for self-deposited Inverse Floaters and externally-deposited Inverse Floaters are recognized as part of the cost basis of the Inverse Floater and are capitalized over the term of the TOB Trust.
As of the end of the reporting period, the aggregate value of Floaters issued by each Fund’s TOB Trust for self-deposited Inverse Floaters and externally-deposited Inverse Floaters was as follows:
| | | | | | | | | | | | | |
| Floating Rate Obligations Outstanding | | NXJ | | | NJV | | | NQP | | | NPN | |
Floating rate obligations: self-deposited Inverse Floaters | | $ | 34,780,000 | | | $ | 810,000 | | | $ | 135,255,000 | | | $ | 450,000 | |
Floating rate obligations: externally-deposited Inverse Floaters | | | 72,563,000 | | | | 877,000 | | | | 23,415,000 | | | | 400,000 | |
Total | | $ | 107,343,000 | | | $ | 1,687,000 | | | $ | 158,670,000 | | | $ | 850,000 | |
80
During the current fiscal period, the average amount of Floaters (including any borrowings from a Liquidity Provider) outstanding, and the average annual interest rate and fees related to self-deposited Inverse Floaters, were as follows:
| | | | | | | | | | | | | |
| Self-Deposited Inverse Floaters | | NXJ | | | NJV | | | NQP | | | NPN | |
Average floating rate obligations outstanding | | $ | 24,570,683 | | | $ | 791,093 | | | $ | 131,365,191 | | | $ | 450,000 | |
Average annual interest rate and fees | | | 1.83 | % | | | 1.87 | % | | | 1.91 | % | | | 1.84 | % |
TOB Trusts are supported by a liquidity facility provided by a Liquidity Provider pursuant to which the Liquidity Provider agrees, in the event that Floaters are (a) tendered to the Trustee for remarketing and the remarketing does not occur, or (b) subject to mandatory tender pursuant to the terms of the TOB Trust agreement, to either purchase Floaters or to provide the Trustee with an advance from a loan facility to fund the purchase of Floaters by the TOB Trust. In certain circumstances, the Liquidity Provider may otherwise elect to have the Trustee sell the Underlying Bond to retire the Floaters that were tendered and not remarketed prior to providing such a loan. In these circumstances, the Liquidity Provider remains obligated to provide a loan to the extent that the proceeds of the sale of the Underlying Bond is not sufficient to pay the purchase price of the Floaters.
The size of the commitment under the loan facility for a given TOB Trust is at least equal to the balance of that TOB Trust’s outstanding Floaters plus any accrued interest. In consideration of the loan facility, fee schedules are in place and are charged by the Liquidity Provider(s). Any loans made by the Liquidity Provider will be secured by the purchased Floaters held by the TOB Trust. Interest paid on any outstanding loan balances will be effectively borne by the Fund that owns the Inverse Floaters of the TOB Trust that has incurred the borrowing and may be at a rate that is greater than the rate that would have been paid had the Floaters been successfully remarketed.
As described above, any amounts outstanding under a liquidity facility are recognized as a component of “Floating rate obligations” on the Statement of Assets and Liabilities by the Fund holding the corresponding Inverse Floaters issued by the borrowing TOB Trust. As of the end of the reporting period, there were no loans outstanding under any such facility.
Each Fund may also enter into shortfall and forbearance agreements (sometimes referred to as a “recourse arrangement”) (TOB Trusts involving such agreements are referred to herein as “Recourse Trusts”), under which a Fund agrees to reimburse the Liquidity Provider for the Trust’s Floaters, in certain circumstances, for the amount (if any) by which the liquidation value of the Underlying Bond held by the TOB Trust may fall short of the sum of the liquidation value of the Floaters issued by the TOB Trust plus any amounts borrowed by the TOB Trust from the Liquidity Provider, plus any shortfalls in interest cash flows. Under these agreements, a Fund’s potential exposure to losses related to or on an Inverse Floater may increase beyond the value of the Inverse Floater as a Fund may potentially be liable to fulfill all amounts owed to holders of the Floaters or the Liquidity Provider. Any such shortfall amount in the aggregate is recognized as “Unrealized depreciation on Recourse Trusts” on the Statement of Assets and Liabilities.
As of the end of the reporting period, each Fund’s maximum exposure to the Floaters issued by Recourse Trusts for self-deposited Inverse Floaters and externally-deposited Inverse Floaters was as follows:
| | | | | | | | | | | | | |
| Floating Rate Obligations — Recourse Trusts | | NXJ | | | NJV | | | NQP | | | NPN | |
Maximum exposure to Recourse Trusts: self-deposited Inverse Floaters | | $ | 34,780,000 | | | $ | 810,000 | | | $ | 120,255,000 | | | $ | 150,000 | |
Maximum exposure to Recourse Trusts: externally-deposited Inverse Floaters | | | 63,898,000 | | | | 877,000 | | | | 11,785,000 | | | | 400,000 | |
Total | | $ | 98,678,000 | | | $ | 1,687,000 | | | $ | 132,040,000 | | | $ | 550,000 | |
Zero Coupon Securities
A zero coupon security does not pay a regular interest coupon to its holders during the life of the security. Income to the holder of the security comes from accretion of the difference between the original purchase price of the security at issuance and the par value of the security at maturity and is effectively paid at maturity. The market prices of zero coupon securities generally are more volatile than the market prices of securities that pay interest periodically.
Investment Transactions
Long-term purchases and sales (including maturities but excluding derivative transactions, where applicable) during the current fiscal period were as follows:
| | | | | | | | | | | | | |
| | NXJ | | | NJV | | | NQP | | | NPN | |
Purchases | | $ | 92,133,232 | | | $ | 4,974,110 | | | $ | 93,118,304 | | | $ | 3,793,853 | |
Sales and maturities | | | 77,471,809 | | | | 5,120,991 | | | | 91,080,330 | | | | 3,745,409 | |
81
Notes to Financial Statements (continued)
The Funds may purchase securities on a when-issued or delayed-delivery basis. Securities purchased on a when-issued or delayed-delivery basis may have extended settlement periods; interest income is not accrued until settlement date. Any securities so purchased are subject to market fluctuation during this period. The Funds have earmarked securities in their portfolios with a current value at least equal to the amount of the when issued/ delayed-delivery purchase commitments. If a Fund has outstanding when-issued/delayed-delivery purchases commitments as of the end of the reporting period, such amounts are recognized on the Statement of Assets and Liabilities.
Investments in Derivatives
In addition to the inverse floating rate securities in which each Fund may invest, which are considered portfolio securities for financial reporting purposes, each Fund is authorized to invest in certain derivative investments such as futures, options and swap contracts. Each Fund limits its investments in futures, options on futures and swap contracts to the extent necessary for the Adviser to claim exclusion from registration by the Commodity Futures Trading Commission as a commodity pool operator with respect to the Fund. The Funds record derivative instruments at fair value, with changes in fair value recognized on the Statement of Operations, when applicable. Even though the Funds’ investments in derivatives may represent economic hedges, they are not considered to be hedge transactions for financial reporting purposes.
Futures Contracts
Upon execution of a futures contract, a Fund is obligated to deposit cash or eligible securities, also known as “initial margin,” into an account at its clearing broker equal to a specified percentage of the contract amount. Cash held by the broker to cover initial margin requirements on open futures contracts, if any, is recognized as “Cash collateral at brokers for investments in futures contracts” on the Statement of Assets and Liabilities. Investments in futures contracts obligate a Fund and the clearing broker to settle monies on a daily basis representing changes in the prior days “mark-to-market” of the open contracts. If a Fund has unrealized appreciation the clearing broker would credit the Fund’s account with an amount equal to appreciation and conversely if a Fund has unrealized depreciation the clearing broker would debit the Fund’s account with an amount equal to depreciation. These daily cash settlements are also known as “variation margin.” Variation margin is recognized as a receivable and/or payable for “Variation margin on futures contracts” on the Statement of Assets and Liabilities.
During the period the futures contract is open, changes in the value of the contract are recognized as an unrealized gain or loss by “marking-to-market” on a daily basis to reflect the changes in market value of the contract, which is recognized as a component of “Change in net unrealized appreciation (depreciation) of futures contracts” on the Statement of Operations. When the contract is closed or expired, a Fund records a realized gain or loss equal to the difference between the value of the contract on the closing date and value of the contract when originally entered into, which is recognized as a component of “Net realized gain (loss) from futures contracts” on the Statement of Operations.
Risks of investments in futures contracts include the possible adverse movement in the price of the securities or indices underlying the contracts, the possibility that there may not be a liquid secondary market for the contracts and/or that a change in the value of the contract may not correlate with a change in the value of the underlying securities or indices.
During the current fiscal period, the Funds used U.S. Treasury futures as part of an overall portfolio construction strategy to manage portfolio duration and yield curve exposure.
The average notional amount of futures contracts outstanding during the current fiscal period was as follows:
| | | | | | | | | | | | | |
| | NXJ | | | NJV | | | NQP | | | NPN | |
Average notional amount of futures contracts outstanding* | | $ | 8,012,638 | | | $ | 2,349,556 | | | $ | 39,694,491 | | | $ | 414,668 | |
* The average notional amount is calculated based on the absolute aggregate notional of contracts outstanding at the beginning of the current fiscal period and at the end of each fiscal quarter within the current fiscal period.
82
The following table presents the fair value of all futures contracts held by the Funds as of the end of the reporting period, the location of these instruments on the Statement of Assets and Liabilities and the primary underlying risk exposure.
| | | | | | | |
| | Location on the Statement of Assets and Liabilities |
| Underlying | Derivative | Asset Derivatives | (Liability) Derivatives |
| Risk Exposure | Instrument | Location | | Value | Location | Value |
| NXJ | | | | | | |
Interest rate | Futures contracts | — | | $ — | Payable for | $(203,441) |
| | | | | variation margin | |
| | | | | on future | |
| | | | | contracts* | |
|
| NJV | | | | | | |
Interest rate | Future contracts | — | | $ — | Payable for | $ (32,954) |
| | | | | variation margin | |
| | | | | on future | |
| | | | | contracts* | |
|
| NQP | | | | | | |
Interest rate | Futures contracts | — | | $ — | Payable for | $(830,629) |
| | | | | variation margin | |
| | | | | on future | |
| | | | | contracts* | |
|
| NPN | | | | | | |
Interest rate | Futures contracts | — | | $ — | Payable for | $ (10,380) |
| | | | | variation margin | |
| | | | | on future | |
| | | | | contracts* | |
* Value represents the cumulative unrealized appreciation (depreciation) of futures contracts as reported in the Fund’s Portfolio of Investments and not the daily asset and/or liability derivatives location as described in the table above.
The following table presents the amount of net realized gain (loss) and change in net unrealized appreciation (depreciation) recognized on futures contracts on the Statement of Operations during the current fiscal period, and the primary underlying risk exposure.
| | | | | |
| | | | Change in Net |
| | | | Unrealized |
| | | Net Realized | Appreciation |
| Underlying | Derivative | Gain (Loss) from | (Depreciation) of |
| Fund | Risk Exposure | Instrument | Futures Contracts | Futures Contracts |
| NXJ | Interest rate | Futures contracts | $ (567,288) | $ (203,441) |
| NJV | Interest rate | Futures contracts | $ (104,424) | $ (37,309) |
| NQP | Interest rate | Futures contracts | $(4,309,126) | $(1,100,046) |
| NPN | Interest rate | Futures contracts | $ (28,350) | $ (11,514) |
Interest Rate Swap Contracts
Interest rate swap contracts involve a Fund’s agreement with the counterparty to pay or receive a fixed rate payment in exchange for the counterparty receiving or paying a variable rate payment. Forward interest rate swap contracts involve a Fund’s agreement with a counterparty to pay, in the future, a fixed or variable rate payment in exchange for the counterparty paying the Fund a variable or fixed rate payment, the accruals for which begin at a specified date in the future (the “effective date”).
The amount of the payment obligation for an interest rate swap is based is based on the notional amount and the termination date of the contract. Interest rate swap contracts do not involve the delivery of securities or other underlying assets or principal. Accordingly, the risk of loss with respect to the swap counterparty on such transactions is limited to the net amount of interest payments that the Fund is to receive.
Interest rate swap contracts are valued daily. Upon entering into an interest rate swap contract (and beginning on the effective date for a forward interest rate swap contract), the Fund accrues the fixed rate payment expected to be paid or received and the variable rate payment expected to be received or paid on the interest rate swap contracts on a daily basis, and recognizes the daily change in the fair value of the Fund’s contractual rights and obligations under the contracts. For an over-the-counter (“OTC”) swap that is not cleared through a clearing house (“OTC Uncleared”), the amount recorded on these transactions is recognized on the Statement of Assets and Liabilities as a component of “Unrealized appreciation or depreciation on interest rate swaps.”
83
Notes to Financial Statements (continued)
Upon the execution of an OTC swap cleared through a clearing house (“OTC Cleared”), the Fund is obligated to deposit cash or eligible securities, also known as “initial margin,” into an account at its clearing broker equal to a specified percentage of the contract amount. Cash deposited by the Fund to cover initial margin requirements on open swap contracts, if any, is recognized as a component of “Cash collateral at brokers for investments in swaps” on the Statement of Assets and Liabilities. Investments in OTC Cleared swaps obligate the Fund and the clearing broker to settle monies on a daily basis representing changes in the prior day’s “mark-to-market” of the swap contract. If the Fund has unrealized appreciation, the clearing broker will credit the Fund’s account with an amount equal to the appreciation. Conversely, if the Fund has unrealized depreciation, the clearing broker will debit the Fund’s account with an amount equal to the depreciation. These daily cash settlements are also known as “variation margin.” Variation margin for OTC Cleared swaps is recognized as a receivable and/or payable for “Variation margin on swap contracts” on the Statement of Assets and Liabilities. Upon the execution of an OTC Uncleared swap, neither the Fund nor the counterparty is required to deposit initial margin as the trades are recorded bilaterally between both parties to the swap contract, and the terms of the variation margin are subject to a predetermined threshold negotiated by the Fund and the counterparty. Variation margin for OTC Uncleared swaps is recognized as a component of “Unrealized appreciation or depreciation on interest rate swaps” as described in the preceding paragraph.
The net amount of periodic payments settled in cash are recognized as a component of “Net realized gain (loss) from swaps” on the Statement of Operations, in addition to the net realized gain or loss recorded upon the termination of the swap contract. For tax purposes, payments expected to be received or paid on the swap contracts are treated as ordinary income or expense, respectively. Changes in the value of the swap contracts during the fiscal period are recognized as a component of “Change in net unrealized appreciation (depreciation) of swaps” on the Statement of Operations. In certain instances, payments are made or received upon entering into the swap contract to compensate for differences between the stated terms of the swap agreements and prevailing market conditions (credit spreads, currency exchange rates, interest rates, and other relevant factors). Payments received or made at the beginning of the measurement period, if any, are recognized as “Interest rate swaps premiums received and/or paid” on the Statement of Assets and Liabilities.
During the current fiscal period, NXJ invested in forward interest rate swap contracts, reducing the Fund’s duration and limiting its vulnerability to rising rates.
The average notional amount of interest rate swap contracts outstanding during the current fiscal period was as follows:
| | |
| NXJ |
Average notional amount of interest rate swap contracts outstanding* | $3,800,000 |
* The average notional amount is calculated based on the outstanding notional at the beginning of the current fiscal period and at the end of each fiscal quarter within the current fiscal period.
The following table presents the amount of net realized gain (loss) and change in net unrealized appreciation (depreciation) recognized on swap contracts on the Statement of Operations during the current fiscal period, and the primary underlying risk exposure.
| | | | | |
| | | | Change in Net |
| | | | Unrealized |
| | | Net Realized | Appreciation |
| Underlying | Derivative | Gain (Loss) from | (Depreciation) of |
| Fund | Risk Exposure | Instrument | Swaps | Swaps |
| NXJ | Interest rate | Swaps | $(820,253) | $259,758 |
Market and Counterparty Credit Risk
In the normal course of business each Fund may invest in financial instruments and enter into financial transactions where risk of potential loss exists due to changes in the market (market risk) or failure of the other party to the transaction to perform (counterparty credit risk). The potential loss could exceed the value of the financial assets recorded on the financial statements. Financial assets, which potentially expose each Fund to counterparty credit risk, consist principally of cash due from counterparties on forward, option and swap transactions, when applicable. The extent of each Fund’s exposure to counterparty credit risk in respect to these financial assets approximates their carrying value as recorded on the Statement of Assets and Liabilities.
Each Fund helps manage counterparty credit risk by entering into agreements only with counterparties the Adviser believes have the financial resources to honor their obligations and by having the Adviser monitor the financial stability of the counterparties. Additionally, counterparties may be required to pledge collateral daily (based on the daily valuation of the financial asset) on behalf of each Fund with a value approximately equal to the amount of any unrealized gain above a pre-determined threshold. Reciprocally, when each Fund has an unrealized loss, the Funds have instructed the custodian to pledge assets of the Funds as collateral with a value approximately equal to the amount of the unrealized loss above a pre-determined threshold. Collateral pledges are monitored and subsequently adjusted if and when the valuations fluctuate, either up or down, by at least the pre-determined threshold amount.
84
5. Fund Shares
Common Share Transactions
Transactions in common shares for the Funds during the Funds’ current and prior fiscal period, where applicable, were as follows:
| | | | | | | | | | | | | |
| | NXJ | | | NJV | |
| | Year | | | Year | | | Year | | | Year | |
| | Ended | | | Ended | | | Ended | | | Ended | |
| | 2/29/20 | | | 2/28/19 | | | 2/29/20 | | | 2/28/19 | |
Common shares: | | | | | | | | | | | | |
| Issued to shareholders due to reinvestments of distributions | | | — | | | | — | | | | — | | | | — | |
| Repurchased and retired | | | — | | | | (1,026,800 | ) | | | — | | | | (20,501 | ) |
Weighted average common share: | | | | | | | | | | | | | | | | |
| Price per share repurchased and retired | | $ | — | | | $ | 12.87 | | | $ | — | | | $ | 12.65 | |
| Discount per share repurchased and retired | | | — | % | | | 15.84 | % | | | — | % | | | 15.16 | % |
| | |
| | NQP | | | NPN | |
| | Year | | | Year | | | Year | | | Year | |
| | Ended | | | Ended | | | Ended | | | Ended | |
| | 2/29/20 | | | 2/28/19 | | | 2/29/20 | | | 2/28/19 | |
Common shares: | | | | | | | | | | | | |
| Issued to shareholders due to reinvestments of distributions | | | — | | | | — | | | | 80 | | | | 100 | |
| Repurchased and retired | | | — | | | | (356,000 | ) | | | — | | | | (3,500 | ) |
Weighted average common share: | | | | | | | | | | | | | | | | |
| Price per share repurchased and retired | | $ | — | | | $ | 12.34 | | | $ | — | | | $ | 12.26 | |
| Discount per share repurchased and retired | | | — | % | | | 15.54 | % | | | — | % | | | 15.59 | % |
Preferred Shares
Variable Rate Demand Preferred Shares
The following Funds have issued and have outstanding Variable Rate Demand Preferred (“VRDP”) Shares, with a $100,000 liquidation preference per share. VRDP Shares are issued via private placement and are not publicly available.
As of the end of the reporting period, NXJ and NQP had $312,500,511 and $216,716,745 VRDP Shares at liquidation preference, net of deferred offering costs, respectively. Further details of the Funds’ VRDP Shares outstanding as of the end of the reporting period, were as follows:
| | | | | | | | | | | | | | | |
| | | | | Shares | | | Remarketing | | | Liquidation | | Special Rate | |
| Fund | | Series | | | Outstanding | | | Fees* | | | Preference | | Period Expiration | Maturity |
| NXJ | | | 1 | | | | 810 | | | | N/A | | | $ | 81,000,000 | | July 22, 2020 | August 3, 2043 |
| | | 2 | | | | 1,443 | | | | N/A | | | | 144,300,000 | | April 1, 2043** | April 1, 2043 |
| | | 3 | | | | 886 | | | | N/A | | | | 88,600,000 | | April 1, 2043** | April 1, 2043 |
| NQP | | | 2 | | | | 1,125 | | | | N/A | | | $ | 112,500,000 | | December 1, 2042** | December 1, 2042 |
| | | 3 | | | | 1,050 | | | | N/A | | | | 105,000,000 | | December 1, 2042** | December 1, 2042 |
* Remarketing fees as a percentage of the aggregate principal amount of all VRDP Shares outstanding for each series.
** Subject to earlier termination by either the Fund or the holder.
N/A - Not applicable. Series is considered to be Special Rate VRDP and therefore does not pay a remarketing fee.
VRDP Shares include a liquidity feature that allows VRDP shareholders to have their shares purchased by a liquidity provider with whom each Fund has contracted in the event that the VRDP Shares are not able to be successfully remarketed. Each Fund is required to redeem any VRDP Shares that are still owned by the liquidity provider after six months of continuous, unsuccessful remarketing. Each Fund pays an annual remarketing fee on the aggregate principal amount of all VRDP Shares outstanding. Each Fund’s VRDP Shares have successfully remarketed since issuance.
All series of NXJ’s and NQP’s VRDP Shares are considered to be Special Rate Period VRDP, which are sold to institutional investors. During the special rate period, the VRDP Shares will not be remarketed by a remarketing agent, be subject to optional or mandatory tender events, or be supported by a liquidity provider and are not subject to remarking fees or liquidity fees. During the special rate period, VRDP dividends will be set monthly as a floating rate based on the predetermined formula. Following the initial special rate period, Special Rate Period VRDP Shares may transition to traditional VRDP Shares with dividends set at weekly remarketings, and be supported by a designated liquidity provider, or the Board may approve a subsequent special rate period.
85
Notes to Financial Statements (continued)
Dividends on the VRDP Shares (which are treated as interest payments for financial reporting purposes) are set at a rate established by a remarketing agent; therefore, the market value of the VRDP Shares is expected to approximate its liquidation preference. In the event that VRDP Shares are unable to be successfully remarketed, the dividend rate will be the maximum rate which is designed to escalate according to a specified schedule in order to enhance the remarketing agent’s ability to successfully remarket the VRDP Shares.
Subject to certain conditions, VRDP Shares may be redeemed, in whole or in part, at any time at the option of each Fund. Each Fund may also redeem certain of the VRDP Shares if the Fund fails to maintain certain asset coverage requirements and such failures are not cured by the applicable cure date. The redemption price per share is equal to the sum of the liquidation preference per share plus any accumulated but unpaid dividends.
The average liquidation preference of VRDP Shares outstanding and annualized dividend rate for each Fund during the current fiscal period were as follows:
| | | | | | | |
| | NXJ | | | NQP | |
Average liquidation preference of VRDP Shares outstanding | | $ | 313,900,000 | | | $ | 217,500,000 | |
Annualized dividend rate | | | 2.24 | % | | | 2.23 | % |
For financial reporting purposes, the liquidation preference of VRDP Shares is a liability and is recognized as a component of “Variable Rate Demand Preferred (“VRDP”) Shares, net of deferred offering costs” on the Statement of Assets and Liabilities. Unpaid dividends on VRDP Shares are recognized as a component of “Interest payable” on the Statement of Assets and Liabilities, when applicable. Dividends accrued on VRDP Shares are recognized as a component of “Interest expense and amortization of offering costs” on the Statement of Operations. Costs incurred by the Funds in connection with their offerings of VRDP Shares were recorded as a deferred charge, which are amortized over the life of the shares and are recognized as a component of “Variable Rate Demand Preferred (“VRDP”) Shares, net of deferred offering costs” on the Statement of Assets and Liabilities and “Interest expense and amortization of offering costs” on the Statement of Operations. In addition to interest expense, each Fund may also pay a per annum liquidity fee to the liquidity provider, as well as a remarketing fee, which are recognized as “Liquidity fees” and “Remarketing fees,” respectively, on the Statement of Operations.
Preferred Share Transactions
Transactions in preferred shares for the Funds during the Funds’ current and prior fiscal period, were applicable, are noted in the following table.
Transactions in VMTP Shares for the Funds, where applicable, were as follows:
| | | | | | | | |
| | Year Ended February 28, 2019 | |
| NQP | Series | | Shares | | | Amount | |
VMTP Shares redeemed | 2019 | | | (870 | ) | | $ | (87,000,000 | ) |
6. Income Tax Information
Each Fund is a separate taxpayer for federal income tax purposes. Each Fund intends to distribute substantially all of its net investment income and net capital gains to shareholders and to otherwise comply with the requirements of Subchapter M of the Internal Revenue Code applicable to regulated investment companies. Therefore, no federal income tax provision is required. Furthermore, each Fund intends to satisfy conditions that will enable interest from municipal securities, which is exempt from regular federal and designated state income taxes, to retain such tax-exempt status when distributed to shareholders of the Funds. Net realized capital gains and ordinary income distributions paid by the Funds are subject to federal taxation.
For all open tax years and all major taxing jurisdictions, management of the Funds has concluded that there are no significant uncertain tax positions that would require recognition in the financial statements. Open tax years are those that are open for examination by taxing authorities (i.e., generally the last four tax year ends and the interim tax period since then). Furthermore, management of the Funds is also not aware of any tax positions for which it is reasonably possible that the total amounts of unrecognized tax benefits will significantly change in the next twelve months.
The following information is presented on an income tax basis. Differences between amounts for financial statement and federal income tax purposes are primarily due to timing differences in recognizing taxable market discount, timing differences in recognizing certain gains and losses on investment transactions and the treatment of investments in inverse floating rate securities reflected as financing transactions, if any. To the extent that differences arise that are permanent in nature, such amounts are reclassified within the capital accounts as detailed below. Temporary differences do not require reclassification. Temporary and permanent differences do not impact the NAVs of the Funds.
86
The table below presents the cost and unrealized appreciation (depreciation) of each Fund’s investment portfolio, as determined on a federal income tax basis, as of February 29, 2020.
For purposes of this disclosure, derivative tax cost is generally the sum of any upfront fees or premiums exchanged and any amounts unrealized for income statement reporting but realized in income and/or capital gains for tax reporting. If a particular derivative category does not disclose any tax unrealized appreciation or depreciation, the change in value of those derivatives have generally been fully realized for tax purposes.
| | | | | | | | | | | | | |
| | NXJ | | | NJV | | | NQP | | | NPN | |
Tax cost of investments | | $ | 898,276,923 | | | $ | 21,706,448 | | | $ | 735,433,498 | | | $ | 17,314,718 | |
Gross unrealized: | | | | | | | | | | | | | | | | |
| Appreciation | | | 118,690,847 | | | | 2,577,431 | | | | 88,273,541 | | | | 1,668,116 | |
| Depreciation | | | (588,848 | ) | | | — | | | | (2,600,389 | ) | | | (116,396 | ) |
Net unrealized appreciation (depreciation) of investments | | $ | 118,101,999 | | | $ | 2,577,431 | | | $ | 85,673,152 | | | $ | 1,551,720 | |
Permanent differences, primarily due to treatment of notional principal contracts, distribution reallocations, federal taxes paid, taxable market discount and nondeductible offering costs, resulted in reclassifications among the Funds’ components of common share net assets as of February 29, 2020, the Funds’ tax year end.
The tax components of undistributed net tax-exempt income, net ordinary income and net long-term capital gains as of February 29, 2020, the Funds’ tax year end, were as follows:
| | | | | | | | | | | | | |
| | NXJ | | | NJV | | | NQP | | | NPN | |
Undistributed net tax-exempt income1 | | $ | 2,202,331 | | | $ | 11,079 | | | $ | 1,642,510 | | | $ | 1,503 | |
Undistributed net ordinary income2 | | | 4,742 | | | | — | | | | 204,934 | | | | — | |
Undistributed net long-term capital gains | | | — | | | | — | | | | — | | | | 102,582 | |
1 Undistributed net tax-exempt income (on a tax basis) has not been reduced for the dividend declared on February 3, 2020, paid on March 2, 2020.
2 Net ordinary income consists of taxable market discount income and net short-term capital gains, if any.
The tax character of distributions paid during the Funds’ tax years ended February 29, 2020 and February 28, 2019 was designated for purposes of the dividends paid deduction as follows:
| | | | | | | | | | | | | |
| 2020 | | NXJ | | | NJV | | | NQP | | | NPN | |
Distributions from net tax-exempt income3 | | $ | 33,822,993 | | | $ | 783,330 | | | $ | 27,340,285 | | | $ | 574,798 | |
Distributions from net ordinary income2 | | | 96,471 | | | | 2,000 | | | | 38,513 | | | | 2,434 | |
Distributions from net long-term capital gains4 | | | 433,490 | | | | — | | | | — | | | | 19,261 | |
| | |
| 2019 | | NXJ | | | NJV | | | NQP | | | NPN | |
Distributions from net tax-exempt income | | $ | 34,626,101 | | | $ | 809,414 | | | $ | 29,036,822 | | | $ | 616,600 | |
Distributions from net ordinary income2 | | | 546,433 | | | | 40,893 | | | | 134,366 | | | | 2,113 | |
Distributions from net long-term capital gains | | | 3,235,811 | | | | 518,863 | | | | 1,655,880 | | | | 127,308 | |
2 Net ordinary income consists of taxable market discount income and net short-term capital gains, if any.
3 The Funds hereby designate these amounts paid during the fiscal year ended February 29, 2020, as Exempt Interest Dividends.
4 The Funds hereby designate as long-term capital gain dividend pursuant to the Internal Revenue Code Section 852(b)(3), the amount to reduce earnings an profits related to net capital gain to zero for the year ended February 29,2020
As of February 29, 2020, the Funds’ tax year end, the following Funds had unused capital losses carrying forward available for federal income tax purposes to be applied against future capital gains, if any. The capital losses are not subject to expiration.
| | | | | | | | | | |
| | NXJ | | | NJV | | | NQP | |
Not subject to expiration: | | | | | | | | | |
| Short-term | | $ | — | | | $ | 52,303 | | | $ | 2,269,003 | |
| Long-term | | | 469,676 | | | | 27,713 | | | | 537,870 | |
Total | | $ | 469,676 | | | $ | 80,016 | | | $ | 2,806,873 | |
87
Notes to Financial Statements (continued)
7. Management Fees and Other Transactions with Affiliates
Management Fees
Each Fund’s management fee compensates the Adviser for overall investment advisory and administrative services and general office facilities. The Sub-Adviser is compensated for its services to the Funds from the management fees paid to the Adviser.
Each Fund’s management fee consists of two components – a fund-level fee, based only on the amount of assets within each individual Fund, and a complex-level fee, based on the aggregate amount of all eligible fund assets managed by the Adviser. This pricing structure enables Fund shareholders to benefit from growth in the assets within their respective Fund as well as from growth in the amount of complex-wide assets managed by the Adviser.
The annual fund-level fee, payable monthly, for each Fund is calculated according to the following schedules:
| | |
| NXJ |
| NQP |
| Average Daily Managed Assets* | Fund-Level Fee |
For the first $125 million | 0.4500% |
For the next $125 million | 0.4375 |
For the next $250 million | 0.4250 |
For the next $500 million | 0.4125 |
For the next $1 billion | 0.4000 |
For the next $3 billion | 0.3750 |
For managed assets over $5 billion | 0.3625 |
|
| NJV |
| NPN |
| Average Daily Net Assets* | Fund-Level Fee |
For the first $125 million | 0.4000% |
For the next $125 million | 0.3875 |
For the next $250 million | 0.3750 |
For the next $500 million | 0.3625 |
For the next $1 billion | 0.3500 |
For the next $3 billion | 0.3250 |
For managed assets over $5 billion | 0.3125 |
The annual complex-level fee, payable monthly, for each Fund is calculated by multiplying the current complex-wide fee rate, determined according to the following schedule by the Fund’s daily managed assets (net assets for NJV and NPN):
| | |
| Complex-Level Eligible Asset Breakpoint Level* | Effective Complex-Level Fee Rate at Breakpoint Level |
$55 billion | 0.2000% |
$56 billion | 0.1996 |
$57 billion | 0.1989 |
$60 billion | 0.1961 |
$63 billion | 0.1931 |
$66 billion | 0.1900 |
$71 billion | 0.1851 |
$76 billion | 0.1806 |
$80 billion | 0.1773 |
$91 billion | 0.1691 |
$125 billion | 0.1599 |
$200 billion | 0.1505 |
$250 billion | 0.1469 |
$300 billion | 0.1445 |
* For the complex-level fees, managed assets include closed-end fund assets managed by the Adviser that are attributable to certain types of leverage. For these purposes, leverage includes the funds’ use of preferred stock and borrowings and certain investments in the residual interest certificates (also called inverse floating rate securities) in tender option bond (TOB) trusts, including the portion of assets held by a TOB trust that has been effectively financed by the trust’s issuance of floating rate securities, subject to an agreement by the Adviser as to certain funds to limit the amount of such assets for determining managed assets in certain circumstances. The complex-level fee is calculated based upon the aggregate daily managed assets of all Nuveen open-end and closed-end funds that constitute “eligible assets.” Eligible assets do not include assets attributable to investments in other Nuveen funds or assets in excess of a determined amount (originally $2 billion) added to the Nuveen fund complex in connection with the Adviser’s assumption of the management of the former First American Funds effective January 1, 2011, but do not include certain assets of certain Nuveen funds that were reorganized into funds advised by an affiliate of the Adviser during the 2019 calendar year. As of February 29, 2020, the complex-level fee for each Fund was 0.1554%.
88
Other Transactions with Affiliates
Each Fund is permitted to purchase or sell securities from or to certain other funds managed by the Adviser (“inter-fund trade”) under specified conditions outlined in procedures adopted by the Board. These procedures have been designed to ensure that any inter-fund trade of securities by the Fund from or to another fund that is, or could be, considered an affiliate of the Fund under certain limited circumstances by virtue of having a common investment adviser (or affiliated investment adviser), common officer and/or common trustee complies with Rule 17a-7 of the 1940 Act. Further, as defined under these procedures, each inter-fund trade is effected at the current market price as provided by an independent pricing service. Unsettled inter-fund trades as of the end of the reporting period are recognized as a component of “Receivable for investments sold” and/or “Payable for investments purchased” on the Statement of Assets and Liabilities, when applicable.
During the current fiscal period, the Funds did not engage in inter-fund trades pursuant to these procedures.
8. Borrowing Arrangements
Committed Line of Credit
The Funds, along with certain other funds managed by the Adviser (“Participating Funds”), have established a 364-day, $2.65 billion standby credit facility with a group of lenders, under which the Participating Funds may borrow for various purposes other than leveraging for investment purposes. Each Participating Fund is allocated a designated proportion of the facility’s capacity (and its associated costs, as described below) based upon a multi-factor assessment of the likelihood and frequency of its need to draw on the facility, the size of the Fund and its anticipated draws, and the potential importance of such draws to the operations and well-being of the Fund, relative to those of the other Funds. A Fund may effect draws on the facility in excess of its designated capacity if and to the extent that other Participating Funds have undrawn capacity. The credit facility expires in June 2020 unless extended or renewed.
The credit facility has the following terms: a fee of 0.15% per annum on unused commitment amounts, and interest at a rate equal to the higher of (a) one-month LIBOR (London Inter-Bank Offered Rate) plus 1.00% per annum or (b) the Fed Funds rate plus 1.00% per annum on amounts borrowed. Participating Funds paid administration, legal and arrangement fees, which are recognized as a component of “Other expenses” on the Statement of Operations, and along with commitment fees, have been allocated among such Participating Funds based upon the relative proportions of the facility’s aggregate capacity reserved for them and other factors deemed relevant by the Adviser and the Board of each Participating Fund.
During the current fiscal period, the Funds utilized this facility. Each Fund’s maximum outstanding balance during the utilization period was as follows:
| | | | | | | | | | | | | |
| | NXJ | | | NJV | | | NQP | | | NPN | |
Maximum outstanding balance | | $ | 10,400,000 | | | $ | 60,681 | | | $ | 15,100,000 | | | $ | 154,174 | |
During each Fund’s utilization period(s) during the current fiscal period, the average daily balance outstanding and average annual interest rate on the Borrowings were as follows:
| | | | | | | | | | | | | |
| | NXJ | | | NJV | | | NQP | | | NPN | |
Utilization period (days outstanding) | | | 23 | | | | 2 | | | | 6 | | | | 2 | |
Average daily balance outstanding | | $ | 5,864,326 | | | $ | 60,681 | | | $ | 9,990,017 | | | $ | 154,174 | |
Average annual interest rate | | | 3.23 | % | | | 2.76 | % | | | 2.73 | % | | | 2.76 | % |
Borrowings outstanding as of the end of the reporting period are recognized as “Borrowings” on the Statement of Assets and Liabilities, where applicable.
Inter-Fund Borrowing and Lending
The Securities and Exchange Commission (“SEC”) has granted an exemptive order permitting registered open-end and closed-end Nuveen funds to participate in an inter-fund lending facility whereby the Nuveen funds may directly lend to and borrow money from each other for temporary purposes (e.g., to satisfy redemption requests or when a sale of securities “fails,” resulting in an unanticipated cash shortfall) (the “Inter-Fund Program”). The closed-end Nuveen funds, including the Funds covered by this shareholder report, will participate only as lenders, and not as borrowers, in the Inter-Fund Program because such closed-end funds rarely, if ever, need to borrow cash to meet redemptions. The Inter-Fund Program is subject to a number of conditions, including, among other things, the requirements that (1) no fund may borrow or lend money through the Inter-Fund Program unless it receives a more favorable interest rate than is typically available from a bank or other financial institution for a comparable transaction; (2) no fund may borrow on an unsecured basis through the Inter-Fund Program unless the fund’s outstanding borrowings from all sources immediately after the inter-fund borrowing total 10% or less of its total assets; provided that if the borrowing fund has a secured borrowing outstanding from any other lender, including but not limited to another fund, the inter-fund loan must be secured on at least an equal priority basis with at least an equivalent percentage of collateral to loan value; (3) if a fund’s total outstanding borrowings immediately after an inter-fund borrowing would be greater than 10% of its total assets, the fund may borrow through the inter-fund loan on a secured basis only; (4) no fund may lend money if the loan would cause its aggregate outstanding loans through the Inter-Fund Program to exceed 15% of its net assets at the time
89
Notes to Financial Statements (continued)
of the loan; (5) a fund’s inter-fund loans to any one fund shall not exceed 5% of the lending fund’s net assets; (6) the duration of inter-fund loans will be limited to the time required to receive payment for securities sold, but in no event more than seven days; and (7) each inter-fund loan may be called on one business day’s notice by a lending fund and may be repaid on any day by a borrowing fund. In addition, a Nuveen fund may participate in the Inter-Fund Program only if and to the extent that such participation is consistent with the fund’s investment objective and investment policies. The Board is responsible for overseeing the Inter-Fund Program.
The limitations detailed above and the other conditions of the SEC exemptive order permitting the Inter-Fund Program are designed to minimize the risks associated with Inter-Fund Program for both the lending fund and the borrowing fund. However, no borrowing or lending activity is without risk. When a fund borrows money from another fund, there is a risk that the loan could be called on one day’s notice or not renewed, in which case the fund may have to borrow from a bank at a higher rate or take other actions to payoff such loan if an inter-fund loan is not available from another fund. Any delay in repayment to a lending fund could result in a lost investment opportunity or additional borrowing costs.
During the current reporting period, none of the Funds covered by this shareholder report have entered into any inter-fund loan activity.
9. Subsequent Event
Other Matters
Subsequent to the current fiscal period, the COVID-19 outbreak was declared a pandemic by the World Health Organization. The COVID-19 coronavirus pandemic was first detected in China in December 2019 and subsequently spread internationally. Containment efforts around the world have halted business and manufacturing operations and restricted people’s movement and travel. The virus and those containment efforts have caused disruptions to global supply chains, consumer demand, business investment and the global financial system. The impact of the coronavirus may last for an extended period of time and has resulted in substantial market volatility and has resulted in significant economic downturn. The potential impact to the Funds is uncertain at this time and management continues to monitor and evaluate the situation.
Reference Rate Reform
In March 2020, FASB issued ASU 2020-04, Reference Rate Reform: Facilitation of the Effects of Reference Rate Reform on Financial Reporting. The main objective of the new guidance is to provide relief to companies that will be impacted by the expected change in benchmark interest rates at the end of 2021, when participating banks will no longer be required to submit London Interbank Offered Rate (LIBOR) quotes by the UK Financial Conduct Authority (FCA). The new guidance allows companies to, provided the only change to existing contracts are a change to an approved benchmark interest rate, account for modifications as a continuance of the existing contract without additional analysis. In addition, derivative contracts that qualified for hedge accounting prior to modification, will be allowed to continue to receive such treatment, even if critical terms change due to a change in the benchmark interest rate. For new and existing contracts, the Funds may elect to apply the amendments as of March 12, 2020 through December 31, 2022. Management is currently assessing the impact of the ASU’s adoption to the Funds’ financial statements and various filings.
90
Additional Fund Information (Unaudited)
| | | | | | | |
| Board of Trustees | | | | | | |
Jack B. Evans | William C. Hunter | Albin F. Moschner | John K. Nelson | Judith M. Stockdale | Carole E. Stone |
Terence J. Toth | Margaret L. Wolff | Robert L. Young | | | | |
|
|
| Investment Adviser | Custodian | Legal Counsel | Independent Registered | Transfer Agent and |
Nuveen Fund Advisors, LLC | State Street Bank | Chapman and Cutler LLP | Public Accounting Firm | Shareholder Services |
333 West Wacker Drive | and Trust Company | Chicago, IL 60603 | KPMG LLP | | Computershare Trust |
Chicago, IL 60606 | One Lincoln Street | | 200 East Randolph Street | Company, N.A. |
| Boston, MA 02111 | | Chicago, IL 60601 | 150 Royall Street |
| | | | | Canton, MA 02021 |
| | | | | (800) 257-8787 |
Portfolio of Investments Information
Each Fund is required to file its complete schedule of portfolio holdings with the Securities and Exchange Commission (SEC) for the first and third quarters of each fiscal year as an exhibit to its report of Form N-PORT. You may obtain this information on the SEC’s website at http://www.sec.gov.
Nuveen Funds’ Proxy Voting InformationYou may obtain (i) information regarding how each fund voted proxies relating to portfolio securities held during the most recent twelve-month period ended June 30, without charge, upon request, by calling Nuveen toll-free at (800) 257-8787 or on Nuveen’s website at www.nuveen.com and (ii) a description of the policies and procedures that each fund used to determine how to vote proxies relating to portfolio securities without charge, upon request, by calling Nuveen toll free at (800) 257-8787. You may also obtain this information directly from the SEC. Visit the SEC on-line at http://www.sec.gov.
CEO Certification DisclosureEach Fund’s Chief Executive Officer (CEO) has submitted to the New York Stock Exchange (NYSE) the annual CEO certification as required by Section 303A.12(a) of the NYSE Listed Company Manual. Each Fund has filed with the SEC the certification of its CEO and Chief Financial Officer required by Section 302 of the Sarbanes-Oxley Act.
Common Share RepurchasesEach Fund intends to repurchase, through its open-market share repurchase program, shares of its own common stock at such times and in such amounts as is deemed advisable. During the period covered by this report, each Fund repurchased shares of its common stock, as shown in the accompanying table. Any future repurchases will be reported to shareholders in the next annual or semi-annual report.
| | | | | |
| NXJ | NJV | NQP | NPN |
Common shares repurchased | — | — | — | — |
FINRA BrokerCheck
The Financial Industry Regulatory Authority (FINRA) provides information regarding the disciplinary history of FINRA member firms and associated investment professionals. This information as well as an investor brochure describing FINRA BrokerCheck is available to the public by calling the FINRA BrokerCheck Hotline number at (800) 289-9999 or by visiting www.FINRA.org.
Glossary of Terms Used in this Report (Unaudited)
| ■ | Average Annual Total Return: This is a commonly used method to express an investment’s performance over a particular, usually multi-year time period. It expresses the return that would have been necessary each year to equal the investment’s actual cumula- tive performance (including change in NAV or market price and reinvested dividends and capital gains distributions, if any) over the time period being considered. |
| ■ | Duration: Duration is a measure of the expected period over which a bond’s principal and interest will be paid, and consequently is a measure of the sensitivity of a bond’s or bond fund’s value to changes when market interest rates change. Generally, the longer a bond’s or fund’s duration, the more the price of the bond or fund will change as interest rates change. |
| ■ | Effective Leverage: Effective leverage is a fund’s effective economic leverage, and includes both regulatory leverage (see leverage) and the leverage effects of certain derivative investments in the fund’s portfolio. Currently, the leverage effects of Tender Option Bond (TOB) inverse floater holdings are included in effective leverage values, in addition to any regulatory leverage. |
| ■ | Forward Interest Rate Swap: A contractual agreement between two counterparties under which one party agrees to make peri- odic payments to the other for an agreed period of time based on a fixed rate, while the other party agrees to make periodic payments based on a floating rate of interest based on an underlying index. Alternatively, both series of cashflows to be exchanged could be calculated using floating rates of interest but floating rates that are based upon different underlying indexes. |
| ■ | Gross Domestic Product (GDP): The total market value of all final goods and services produced in a country/region in a given year, equal to total consumer, investment and government spending, plus the value of exports, minus the value of imports. |
| ■ | Inverse Floating Rate Securities: Inverse floating rate securities, also known as inverse floaters or tender option bonds (TOBs), are created by depositing a municipal bond, typically with a fixed interest rate, into a special purpose trust. This trust, in turn, (a) issues floating rate certificates typically paying short-term tax-exempt interest rates to third parties in amounts equal to some fraction of the deposited bond’s par amount or market value, and (b) issues an inverse floating rate certificate (sometimes referred to as an “inverse floater”) to an investor (such as a Fund) interested in gaining investment exposure to a long-term municipal bond. The income received by the holder of the inverse floater varies inversely with the short-term rate paid to the floating rate certificates’ holders, and in most circumstances the holder of the inverse floater bears substantially all of the underlying bond’s downside invest- ment risk. The holder of the inverse floater typically also benefits disproportionately from any potential appreciation of the underlying bond’s value. Hence, an inverse floater essentially represents an investment in the underlying bond on a leveraged basis. |
| ■ | Leverage: Leverage is created whenever a fund has investment exposure (both reward and/or risk) equivalent to more than 100% of the investment capital. |
| ■ | Net Asset Value (NAV) Per Share: A fund’s Net Assets is equal to its total assets (securities, cash, accrued earnings and receivables) less its total liabilities. NAV per share is equal to the fund’s Net Assets divided by its number of shares outstanding. |
| ■ | Pre-Refunding: Pre-Refunding, also known as advanced refundings or refinancings, is a procedure used by state and local govern- ments to refinance municipal bonds to lower interest expenses. The issuer sells new bonds with a lower yield and uses the proceeds to buy U.S. Treasury securities, the interest from which is used to make payments on the higher-yielding bonds. Because of this collateral, pre-refunding generally raises a bond’s credit rating and thus its value. |
92
| ■ | Regulatory Leverage: Regulatory leverage consists of preferred shares issued by or borrowings of a fund. Both of these are part of a fund’s capital structure. Regulatory leverage is subject to asset coverage limits set in the Investment Company Act of 1940. |
| ■ | S&P Municipal Bond Index: An unleveraged, market value-weighted index designed to measure the performance of the tax- exempt, investment-grade U.S. municipal bond market. Index returns assume reinvestment of distributions, but do not reflect any applicable sales charges or management fees. |
| ■ | S&P Municipal Bond New Jersey Index: An unleveraged, market value-weighted index designed to measure the performance of the tax-exempt, investment-grade New Jersey municipal bond market. Index returns assume reinvestment of distributions, but do not reflect any applicable sales charges or management fees. |
| ■ | S&P Municipal Bond Pennsylvania Index: An unleveraged, market value-weighted index designed to measure the performance of the tax-exempt, investment-grade Pennsylvania municipal bond market. Index returns assume reinvestment of distributions, but do not reflect any applicable sales charges or management fees. |
| ■ | Total Investment Exposure: Total investment exposure is a fund’s assets managed by the Adviser that are attributable to financial leverage. For these purposes, financial leverage includes a fund’s use of preferred stock and borrowings and investments in the residual interest certificates (also called inverse floating rate securities) in tender option bond (TOB) trusts, including the portion of assets held by a TOB trust that has been effectively financed by the trust’s issuance of floating rate securities. |
| ■ | Zero Coupon Bond: A zero coupon bond does not pay a regular interest coupon to its holders during the life of the bond. Income to the holder of the bond comes from accretion of the difference between the original purchase price of the bond at issuance and the par value of the bond at maturity and is effectively paid at maturity. The market prices of zero coupon bonds generally are more volatile than the market prices of bonds that pay interest periodically. |
93
Reinvest Automatically, Easily and Conveniently
Nuveen makes reinvesting easy. A phone call is all it takes to set up your reinvestment account.
Nuveen Closed-End Funds Automatic Reinvestment PlanNuveen Closed-End Fund allows you to conveniently reinvest distributions in additional Fund shares. By choosing to reinvest, you’ll be able to invest money regularly and automatically, and watch your investment grow through the power of compounding. Just like distributions in cash, there may be times when income or capital gains taxes may be payable on distributions that are reinvested. It is important to note that an automatic reinvestment plan does not ensure a profit, nor does it protect you against loss in a declining market.
Easy and convenient
To make recordkeeping easy and convenient, each month you’ll receive a statement showing your total distributions, the date of investment, the shares acquired and the price per share, and the total number of shares you own.
How shares are purchased
The shares you acquire by reinvesting will either be purchased on the open market or newly issued by the Fund. If the shares are trading at or above net asset value at the time of valuation, the Fund will issue new shares at the greater of the net asset value or 95% of the then-current market price. If the shares are trading at less than net asset value, shares for your account will be purchased on the open market. If the Plan Agent begins purchasing Fund shares on the open market while shares are trading below net asset value, but the Fund’s shares subsequently trade at or above their net asset value before the Plan Agent is able to complete its purchases, the Plan Agent may cease open-market purchases and may invest the uninvested portion of the distribution in newly-issued Fund shares at a price equal to the greater of the shares’ net asset value or 95% of the shares’ market value on the last business day immediately prior to the purchase date. Distributions received to purchase shares in the open market will normally be invested shortly after the distribution payment date. No interest will be paid on distributions awaiting reinvestment. Because the market price of the shares may increase before purchases are completed, the average purchase price per share may exceed the market price at the time of valuation, resulting in the acquisition of fewer shares than if the distribution had been paid in shares issued by the Fund. A pro rata portion of any applicable brokerage commissions on open market purchases will be paid by Plan participants. These commissions usually will be lower than those charged on individual transactions.
Flexible
You may change your distribution option or withdraw from the Plan at any time, should your needs or situation change. You can reinvest whether your shares are registered in your name, or in the name of a brokerage firm, bank, or other nominee. Ask your investment advisor if his or her firm will participate on your behalf. Participants whose shares are registered in the name of one firm may not be able to transfer the shares to another firm and continue to participate in the Plan. The Fund reserves the right to amend or terminate the Plan at any time. Although the Fund reserves the right to amend the Plan to include a service charge payable by the participants, there is no direct service charge to participants in the Plan at this time.
Call today to start reinvesting distributions
For more information on the Nuveen Automatic Reinvestment Plan or to enroll in or withdraw from the Plan, speak with your financial advisor or call us at (800) 257-8787.
94
Board Members & Officers (Unaudited)
The management of the Funds, including general supervision of the duties performed for the Funds by the Adviser, is the responsibility of the Board of Trustees of the Funds. The number of trustees of the Funds is set at nine. None of the trustees who are not “interested” persons of the Funds (referred to herein as “independent board members”) has ever been a director or employee of, or consultant to, Nuveen or its affiliates. The names and business addresses of the trustees and officers of the Funds, their principal occupations and other affiliations during the past five years, the number of portfolios each Trustee oversees and other directorships they hold are set forth below.
| | | | | |
| Name, | Position(s) Held | Year First | Principal | Number |
| Year of Birth | with the Funds | Elected or | Occupation(s) | of Portfolios |
| & Address | | Appointed | Including other | in Fund Complex |
| | and Term(1) | Directorships | Overseen by |
| | | During Past 5 Years | Board Member |
|
Independent Board Members:
|
|
■ TERENCE J. TOTH | | | Formerly, a Co-Founding Partner, Promus Capital (2008-2017); Director, | |
| 1959 | | | Quality Control Corporation (since 2012); member: Catalyst Schools of | |
| 333 W. Wacker Drive | Chairman and | 2008 | Chicago Board (since 2008) and Mather Foundation Board (since 2012), | 156 |
| Chicago, IL 6o6o6 | Board Member | Class II | and chair of its Investment Committee; formerly, Director, Fulcrum IT | |
| | | Services LLC (2010- 2019); formerly, Director, Legal & General Investment | |
| | | Management America, Inc. (2008-2013); formerly, CEO and President, | |
| | | Northern Trust Global Investments (2004-2007): Executive Vice President, | |
| | | Quantitative Management & Securities Lending (2000-2004); prior thereto, | |
| | | various positions with Northern Trust Company (since 1994); formerly, | |
| | | Member, Northern Trust Mutual Funds Board (2005-2007), Northern Trust | |
| | | Global Investments Board (2004-2007), Northern Trust Japan Board | |
| | | (2004-2007), Northern Trust Securities Inc. Board (2003-2007) and Northern | |
| | | Trust Hong Kong Board (1997-2004). | |
|
■ JACK B. EVANS | | | Chairman (since 2019), formerly, President (1996-2019), The Hall-Perrine | |
| 1948 | | | Foundation, a private philanthropic corporation; Director and Chairman, | |
| 333 W. Wacker Drive | Board Member | 1999 | United Fire Group, a publicly held company; Director, Public Member, | 156 |
| Chicago, IL 6o6o6 | | Class III | American Board of Orthopaedic Surgery (since 2015); Life Trustee of | |
| | | Coe College and the Iowa College Foundation; formerly, President | |
| | | Pro-Tem of the Board of Regents for the State of Iowa University System; | |
| | | formerly, Director, Alliant Energy and The Gazette Company; formerly, | |
| | | Director, Federal Reserve Bank of Chicago; formerly, President and Chief | |
| | | Operating Officer, SCI Financial Group, Inc., a regional financial services firm. | |
|
■ WILLIAM C. HUNTER | | | Dean Emeritus, formerly, Dean, Tippie College of Business, University of | |
| 1948 | | | Iowa (2006-2012); Director of Wellmark, Inc. (since 2009); past Director | |
| 333 W. Wacker Drive | Board Member | 2003 | (2005-2015), and past President (2010-2014) Beta Gamma Sigma, Inc., | 156 |
| Chicago, IL 6o6o6 | | Class I | The International Business Honor Society; formerly, Director (2004-2018) | |
| | | of Xerox Corporation; Dean and Distinguished Professor of Finance, | |
| | | School of Business at the University of Connecticut (2003-2006); previously, | |
| | | Senior Vice President and Director of Research at the Federal Reserve Bank | |
| | | of Chicago (1995-2003); formerly, Director (1997-2007), Credit Research | |
| | | Center at Georgetown University. | |
|
■ ALBIN F. MOSCHNER | | | Founder and Chief Executive Officer, Northcroft Partners, LLC, a | |
| 1952 | | | management consulting firm (since 2012); formerly, Chairman (2019), | |
| 333 W. Wacker Drive | Board Member | 2016 | and Director (2012-2019), USA Technologies, Inc., a provider of | 156 |
| Chicago, IL 6o6o6 | | Class III | solutions and services to facilitate electronic payment transactions; | |
| | | formerly, Director, Wintrust Financial Corporation (1996-2016); previously, | |
| | | held positions at Leap Wireless International, Inc., including Consultant | |
| | | (2011-2012), Chief Operating Officer (2008-2011), and Chief Marketing | |
| | | Officer (2004-2008); formerly, President, Verizon Card Services division | |
| | | of Verizon Communications, Inc. (2000-2003); formerly, President, One | |
| | | Point Services at One Point Communications (1999- 2000); formerly, | |
| | | Vice Chairman of the Board, Diba, Incorporated (1996-1997); formerly, | |
| | | various executive positions (1991-1996) and Chief Executive Officer | |
| | | (1995-1996) of Zenith Electronics Corporation. | |
95
Board Members & Officers (Unaudited) (continued)
| | | | | |
| Name, | Position(s) Held | Year First | Principal | Number |
| Year of Birth | with the Funds | Elected or | Occupation(s) | of Portfolios |
| & Address | | Appointed | Including other | in Fund Complex |
| | and Term(1) | Directorships | Overseen by |
| | | During Past 5 Years | Board Member |
|
Independent Board Members (continued):
|
|
■ JOHN K. NELSON | | | Member of Board of Directors of Core12 LLC. (since 2008), a private firm | |
| 1962 | | | which develops branding, marketing and communications strategies for | |
| 333 W. Wacker Drive | Board Member | 2013 | clients; served on The President’s Council of Fordham University (2010- | 156 |
| Chicago, IL 6o6o6 | | Class II | 2019) and previously a Director of the Curran Center for Catholic | |
| | | American Studies (2009- 2018); formerly, senior external advisor to the | |
| | | Financial Services practice of Deloitte Consulting LLP. (2012-2014); former | |
| | | Chair of the Board of Trustees of Marian University (2010-2014 as trustee, | |
| | | 2011-2014 as Chair); formerly Chief Executive Officer of ABN AMRO | |
| | | Bank N.V., North America, and Global Head of the Financial Markets | |
| | | Division (2007-2008), with various executive leadership roles in ABN | |
| | | AMRO Bank N.V. between 1996 and 2007. | |
|
■ JUDITH M. STOCKDALE | | | Board Member, Land Trust Alliance (since 2013); formerly, Board Member, | |
| 1947 | | | U.S. Endowment for Forestry and Communities (2013-2019); formerly, | |
| 333 W. Wacker Drive | Board Member | 1997 | Executive Director (1994-2012), Gaylord and Dorothy Donnelley | 156 |
| Chicago, IL 6o6o6 | | Class I | Foundation; prior thereto, Executive Director, Great Lakes Protection | |
| | | Fund (1990-1994). | |
|
■ CAROLE E. STONE | | | Former Director, Chicago Board Options Exchange, Inc. (2006-2017); | |
| 1947 | | | and C2 Options Exchange, Incorporated (2009-2017); Director, Cboe, | |
| 333 W. Wacker Drive | Board Member | 2007 | Global Markets, Inc., formerly, CBOE Holdings, Inc. (since 2010); | 156 |
| Chicago, IL 6o6o6 | | Class I | formerly, Commissioner, New York State Commission on Public | |
| | | Authority Reform (2005-2010). | |
|
■ MARGARET L. WOLFF | | | Formerly, member of the Board of Directors (2013-2017) of Travelers | |
| 1955 | | | Insurance Company of Canada and The Dominion of Canada General | |
| 333 W. Wacker Drive | Board Member | 2016 | Insurance Company (each, a part of Travelers Canada, the Canadian | 156 |
| Chicago, IL 6o6o6 | | Class I | operation of The Travelers Companies, Inc.); formerly, Of Counsel, | |
| | | Skadden, Arps, Slate, Meagher & Flom LLP (Mergers & Acquisitions | |
| | | Group) (2005-2014); Member of the Board of Trustees of New | |
| | | York-Presbyterian Hospital (since 2005); Member (since 2004) and | |
| | | Chair (since 2015) of the Board of Trustees of The John A. Hartford | |
| | | Foundation (a philanthropy dedicated to improving the care of older | |
| | | adults); formerly, Member (2005-2015) and Vice Chair (2011-2015) of | |
| | | the Board of Trustees of Mt. Holyoke College. | |
|
■ ROBERT L. YOUNG | | | Formerly, Chief Operating Officer and Director, J.P.Morgan Investment | |
| 1963 | | | Management Inc. (2010-2016); formerly, President and Principal | |
| 333 W. Wacker Drive | Board Member | 2017 | Executive Officer (2013-2016), and Senior Vice President and Chief | 156 |
| Chicago, IL 6o6o6 | | Class II | Operating Officer (2005-2010), of J.P.Morgan Funds; formerly, Director | |
| | | and various officer positions for J.P.Morgan Investment Management Inc. | |
| | | (formerly, JPMorgan Funds Management, Inc. and formerly, One Group | |
| | | Administrative Services) and JPMorgan Distribution Services, Inc. | |
| | | (formerly, One Group Dealer Services, Inc.) (1999-2017). | |
96
| | | | |
| Name, | Position(s) Held | Year First | Principal |
| Year of Birth | with the Funds | Elected or | Occupation(s) |
| & Address | | Appointed(2) | During Past 5 Years |
|
Officers of the Funds:
|
|
■ CEDRIC H. ANTOSIEWICZ | | | Senior Managing Director (since 2017), formerly, Managing Director |
| 1962 | Chief | | (2004-2017) of Nuveen Securities, LLC; Senior Managing Director (since |
| 333 W. Wacker Drive | Administrative | 2007 | 2017), formerly, Managing Director (2014-2017) of Nuveen Fund |
| Chicago, IL 6o6o6 | Officer | | Advisors, LLC. |
|
|
■ NATHANIEL T. JONES | | | Managing Director (since 2017), formerly, Senior Vice President |
| 1979 | | | (2016-2017), formerly, Vice President (2011-2016) of Nuveen; Managing |
| 333 W. Wacker Drive | Vice President | 2016 | Director (since 2015) of Nuveen Fund Advisors, LLC; Chartered Financial Analyst. |
| Chicago, IL 6o6o6 | and Treasurer | | |
|
|
■ WALTER M. KELLY | | | Managing Director (since 2017), formerly, Senior Vice President |
| 1970 | Chief Compliance | | (2008-2017) of Nuveen. |
| 333 W. Wacker Drive | Officer and | 2003 | |
| Chicago, IL 6o6o6 | Vice President | | |
|
|
■ DAVID J. LAMB | | | Managing Director (since 2017), formerly, Senior Vice President of |
| 1963 | | | Nuveen (since 2006), Vice President prior to 2006. |
| 333 W. Wacker Drive | Vice President | 2015 | |
| Chicago, IL 6o6o6 | | | |
|
|
■ TINA M. LAZAR | | | Managing Director (since 2017), formerly, Senior Vice President |
| 1961 | | | (2014-2017) of Nuveen Securities, LLC. |
| 333 W. Wacker Drive | Vice President | 2002 | |
| Chicago, IL 6o6o6 | | | |
|
|
■ BRIAN J. LOCKHART | | | Managing Director (since 2019) of Nuveen Fund Advisors, LLC; Managing Director |
| 1974 | | | (since 2017), formerly, Vice President (2010-2017) of Nuveen; Head of Investment |
| 333 W. Wacker Drive | Vice President | 2019 | Oversight (since 2017), formerly, Team Leader of Manager Oversight (2015-2017); |
| Chicago, IL 6o6o6 | | | Chartered Financial Analyst and Certified Financial Risk Manager. |
|
|
■ JACQUES M. LONGERSTAEY | | | Senior Managing Director, Chief Risk Officer, Nuveen, LLC (since May 2019); Senior |
| 1963 | | | Managing Director (since May 2019) of Nuveen Fund Advisors, LLC; formerly, Chief |
| 8500 Andrew Carnegie Blvd. | Vice President | 2019 | Investment and Model Risk Officer, Wealth & Investment Management Division, |
| Charlotte, NC 28262 | | | Wells Fargo Bank (NA) (from 2013-2019). |
97
Board Members & Officers (Unaudited) (continued)
| | | | |
| Name, | Position(s) Held | Year First | Principal |
| Year of Birth | with the Funds | Elected or | Occupation(s) |
| & Address | | Appointed(2) | During Past 5 Years |
|
Officers of the Funds (continued):
|
|
■ KEVIN J. MCCARTHY | | | Senior Managing Director (since 2017) and Secretary and General Counsel |
| 1966 | Vice President | | (since 2016) of Nuveen Investments, Inc., formerly, Executive Vice |
| 333 W. Wacker Drive | and Assistant | 2007 | President (2016-2017) and Managing Director and Assistant Secretary |
| Chicago, IL 6o6o6 | Secretary | | (2008-2016); Senior Managing Director (since 2017) and Assistant |
| | | Secretary (since 2008) of Nuveen Securities, LLC, formerly Executive |
| | | Vice President (2016-2017) and Managing Director (2008-2016); Senior |
| | | Managing Director (since 2017), Secretary (since 2016) and Co-General |
| | | Counsel (since 2011) of Nuveen Fund Advisors, LLC, formerly, Executive |
| | | Vice President (2016-2017), Managing Director (2008-2016) and Assistant |
| | | Secretary (2007-2016); Senior Managing Director (since 2017), Secretary |
| | | (since 2016) and Associate General Counsel (since 2011) of Nuveen Asset |
| | | Management, LLC, formerly Executive Vice President (2016-2017) and |
| | | Managing Director and Assistant Secretary (2011- 2016); Senior Managing |
| | | Director (since 2017) and Secretary (since 2016) of Nuveen Investments |
| | | Advisers, LLC, formerly Executive Vice President (2016- 2017); Vice President |
| | | (since 2007) and Secretary (since 2016), formerly, Assistant Secretary, of |
| | | NWQ Investment Management Company, LLC, Symphony Asset |
| | | Management LLC, Santa Barbara Asset Management, LLC and Winslow |
| | | Capital Management, LLC (since 2010). Senior Managing Director (since 2017) |
| | | and Secretary (since 2016) of Nuveen Alternative Investments, LLC. |
|
■ JON SCOTT MEISSNER | | | Managing Director of Mutual Fund Tax and Financial Reporting groups at |
| 1973 | | | Nuveen (since 2017); Managing Director of Nuveen Fund Advisors, LLC |
| 8500 Andrew Carnegie Blvd. | Vice President | 2019 | (since 2019); Senior Director of Teachers Advisors, LLC and TIAA-CREF |
| Charlotte, NC 28262 | | | Investment Management, LLC (since 2016); Senior Director (since 2015) Mutual |
| | | Fund Taxation to the TIAA-CREF Funds, the TIAA-CREF Life Funds, the TIAA |
| | | Separate Account VA-1 and the CREF Accounts; has held various positions with |
| | | TIAA since 2004. |
|
■ WILLIAM T. MEYERS | | | Senior Managing Director (since 2017), formerly, Managing Director |
| 1966 | | | (2016-2017), Senior Vice President (2010-2016) of Nuveen Securities, LLC |
| 333 W. Wacker Drive | Vice President | 2018 | and Nuveen Fund Advisors, LLC; Senior Managing Director (since 2017), |
| Chicago, IL 60606 | | | formerly, Managing Director (2016-2017), Senior Vice President (2010-2016) |
| | | of Nuveen, has held various positions with Nuveen since 1991. |
|
■ DEANN D. MORGAN | | | Executive Vice President, Global Head of Product at Nuveen (since November |
| 1969 | | | 2019); Managing Member MDR Collaboratory LLC (since 2018); Managing |
| 100 Park Avenue | Vice President | 2020 | Director, Head of Wealth Management Product Structuring & COO Multi |
| New York, NY 10016 | | | Asset Investing, The Blackstone Group (2013-2017). |
|
■ MICHAEL A. PERRY | | | Executive Vice President (since 2017), previously Managing Director |
| 1967 | | | from 2016), of Nuveen Fund Advisors, LLC and Nuveen Alternative |
| 333 W. Wacker Drive | Vice President | 2017 | Investments, LLC; Executive Vice President (since 2017), formerly, |
| Chicago, IL 6o6o6 | | | Managing Director (2015-2017), of Nuveen Securities, LLC; formerly, |
| | | Managing Director (2010-2015) of UBS Securities, LLC. |
|
■ CHRISTOPHER M. ROHRBACHER | | | Managing Director (since 2017) and Assistant Secretary of Nuveen |
| 1971 | Vice President | | Securities, LLC; Managing Director (since 2017), formerly, Senior |
| 333 W. Wacker Drive | and Assistant | 2008 | Vice President (2016-2017), Co-General Counsel (since 2019) and |
| Chicago, IL 6o6o6 | Secretary | | Assistant Secretary (since 2016) of Nuveen Fund Advisors, LLC; |
| | | Managing Director (since 2017), formerly, Senior Vice President |
| | | (2012-2017) and Associate General Counsel (since 2016), formerly, |
| | | Assistant General Counsel (2008-2016) of Nuveen. |
98
| | | | |
| Name, | Position(s) Held | Year First | Principal |
| Year of Birth | with the Funds | Elected or | Occupation(s) |
| & Address | | Appointed(2) | During Past 5 Years |
|
Officers of the Funds (continued): |
|
■ WILLIAM A. SIFFERMANN | | | Managing Director (since 2017), formerly Senior Vice President |
| 1975 | | | (2016-2017) and Vice President (2011-2016) of Nuveen. |
| 333 W. Wacker Drive | Vice President | 2017 | |
| Chicago, IL 6o6o6 | | | |
|
■ E. SCOTT WICKERHAM | | | Senior Managing Director, Head of Fund Administration at Nuveen, LLC |
| 1973 | Vice President | | (since 2019), formerly, Managing Director; Senior Managing Director |
| TIAA | and Controller | 2019 | (since 2019), Nuveen Fund Advisers, LLC; Principal Financial Officer, |
| 730 Third Avenue | | | Principal Accounting Officer and Treasurer (since 2017) to the TIAA-CREF Funds, |
| New York, NY 10017 | | | the TIAA-CREF Life Funds, the TIAA Separate Account VA-1 and the Treasurer |
| | | (since 2017) to the CREF Accounts; Senior Director, TIAA-CREF Fund Administration |
| | | (2014-2015); has held various positions with TIAA since 2006. |
|
■ MARK L. WINGET | | | Vice President and Assistant Secretary of Nuveen Securities, LLC (since |
| 1968 | Vice President | | 2008); Vice President and Assistant Secretary of Nuveen Fund Advisors, LLC |
| 333 W. Wacker Drive | and Assistant | 2008 | (since 2019); Vice President (since 2010) and Associate General Counsel |
| Chicago, IL 60606 | Secretary | | (since 2016), formerly, Assistant General Counsel (2008-2016) of Nuveen. |
|
■ GIFFORD R. ZIMMERMAN | | | Managing Director (since 2002), and Assistant Secretary of Nuveen |
| 1956 | Vice President | | Securities, LLC; Managing Director (since 2004) and Assistant Secretary |
| 333 W. Wacker Drive | Secretary | 1988 | (since 1994) of Nuveen Investments, Inc.; Managing Director (since |
| Chicago, IL 60606 | | | 2002), Assistant Secretary (since 1997) and Co-General Counsel (since 2011) |
| | | of Nuveen Fund Advisors, LLC; Managing Director, Assistant Secretary and |
| | | Associate General Counsel of Nuveen Asset Management, LLC (since 2011); |
| | | Vice President (since 2017), formerly, Managing Director (2003-2017) and |
| | | Assistant Secretary (since 2003) of Symphony Asset Management LLC; |
| | | Managing Director and Assistant Secretary (since 2002) of Nuveen Investments |
| | | Advisers, LLC; Vice President and Assistant Secretary of NWQ Investment |
| | | Management Company, LLC (since 2002), Santa Barbara Asset Management, LLC |
| | | (since 2006), and of Winslow Capital Management, LLC, (since 2010); Chartered |
| | | Financial Analyst. |
| | |
(1) | The Board of Trustees is divided into three classes, Class I, Class II, and Class III, with each being elected to serve until the third succeeding annual shareholders’ meeting subsequent to its election or thereafter in each case when its respective successors are duly elected or appointed, except two board members are elected by the holders of Preferred Shares, when applicable, to serve until the next annual shareholders’ meeting subsequent to its election or thereafter in each case when its respective successors are duly elected or appointed. The year first elected or appointed represents the year in which the board member was first elected or appointed to any fund in the Nuveen complex. |
(2) | Officers serve one year terms through August of each year. The year first elected or appointed represents the year in which the Officer was first elected or appointed to any fund in the Nuveen complex. |
99
Nuveen:
Serving Investors for Generations
Since 1898, financial advisors and their clients have relied on Nuveen to provide dependable investment solutions through continued adherence to proven, long-term investing principles. Today, we offer a range of high quality solutions designed to be integral components of a well-diversified core portfolio.
Focused on meeting investor needs.
Nuveen is the investment manager of TIAA. We have grown into one of the world’s premier global asset managers, with specialist knowledge across all major asset classes and particular strength in solutions that provide income for investors and that draw on our expertise in alternatives and responsible investing. Nuveen is driven not only by the independent investment processes across the firm, but also the insights, risk management, analytics and other tools and resources that a truly world-class platform provides. As a global asset manager, our mission is to work in partnership with our clients to create solutions which help them secure their financial future.
Find out how we can help you.
To learn more about how the products and services of Nuveen may be able to help you meet your financial goals, talk to your financial advisor, or call us at (800) 257-8787. Please read the information provided carefully before you invest. Investors should consider the investment objective and policies, risk considerations, charges and expenses of any investment carefully. Where applicable, be sure to obtain a prospectus, which contains this and other relevant information. To obtain a prospectus, please contact your securities representative or Nuveen, 333 W. Wacker Dr., Chicago, IL 60606. Please read the prospectus carefully before you invest or send money.
Learn more about Nuveen Funds at: www.nuveen.com/closed-end funds
| Nuveen Securities, LLC, member FINRA and SIPC | 333 West Wacker Drive Chicago, IL 60606 | www.nuveen.com |  | EAN-D-0220D 1137137-INV-Y-04/21 |