EXHIBIT 4.17
EVALUATION OF THE P&NG RESERVES OF EAGLEFORD ENERGY INC. (As of August 31, 2011)
Copies: Eagleford Energy Inc. (2 copies) Sproule Associates Limited (1 copy) Electronic (1 copy) Project No.: 3391.18388 Prepared For: Eagleford Energy Inc. Authors: Attila A. Szabo, P.Eng., Project Leader Exclusivity: This report has been prepared for the exclusive use of Eagleford Energy Inc. It may not be reproduced, distributed, or made available to any other company or person, regulatory body, or organization without the knowledge and written consent of Sproule, and without the complete contents of the report being made available to that party.
Table of Contents — Page 1 Table of Contents Introduction Field Operations Historical Data, Interests and Burdens Evaluation Standards Evaluation Procedures Evaluation Results BOE Cautionary Statement Forward-Looking Statements Exclusivity Certification Permit to Practice Certificates Summary Table S-1 Summary of the Evaluation of the P&NG Reserves of Eagleford Energy Inc. (As of August 31, 2011) Before Income Tax Table S-2 Summary of Selected Price Forecasts (Effective August 31, 2011) Table S-3 Summary of Reserves and Net Present Values Total Proved Plus Probable Reserves Before Income Tax Table S-3A Summary of Reserves and Net Present Values Total Proved Developed Producing Reserves Before Income Tax Table S-3B Summary of Reserves and Net Present Values Total Probable Reserves Before Income Tax 3391.18388.AAS.smr P:\Eagleford Energy 18388\Report\Summary.doc
Table of Contents — Page 2 Discussion Reserves and Production Net Present Values Table D-1 Summary of the Evaluation of the P&NG Reserves by Property of Eagleford Energy Inc. (As of August 31, 2011) Before Income Tax Table D-2 Summary of Reserves and Net Present Values Total Proved Plus Probable Reserves Before Income Tax Table D-2A Summary of Reserves and Net Present Values Total Proved Developed Producing Reserves Before Income Tax Table D-2B Summary of Reserves and Net Present Values Total Probable Reserves Before Income Tax Constant Prices and Costs Table C-1 Summary of the Evaluation of the P&NG Reserves of Eagleford Energy Inc. (As of August 31, 2011) Before Income Tax Table C-2 Summary of the Evaluation of the P&NG Reserves by Property of Eagleford Energy Inc. (As of August 31, 2011) Before Income Tax Table C-3 Summary of the Reserves and Net Present Values Total Proved Plus Probable Reserves Before Income Tax Table C-3A Summary of Reserves and Net Present Values Total Proved Developed Producing Reserves Before Income Tax 3391.18388.AAS.smr P:\Eagleford Energy 18388\Report\Summary.doc
Table of Contents — Page 3 Table C-3B Summary of Reserves and Net Present Values Total Probable Reserves Before Income Tax Table C-4 Summary of Oil and Gas Reserves As of August 31, 2011 Constant Prices and Costs Table C-5 Summary of Net Present Values of Future Net Revenue As of August 31, 2011 Constant Prices and Costs Table C-6 Total Future Net Revenue (Undiscounted) As of August 31, 2011 Constant Prices and Costs Table C-7 Net Present Value of Future Net Revenue by Production Group As of August 31, 2011 Constant Prices and Costs Table C-8 Summary of Pricing Assumptions As of August 31, 2011 Constant Prices and Costs National Instrument 51-101 Forecast Prices and Costs Reconciliation Form 51-101F2 Report on Reserves Data by Independent Qualified Reserves Evaluator or Auditor Table 1 Summary of Oil and Gas Reserves As of August 31, 2011 Forecast Prices and Costs Table 2 Summary of Net Present Values of Future Net Revenue As of August 31, 2011 Forecast Prices and Costs 3391.18388.AAS.smr P:\Eagleford Energy 18388\Report\Summary.doc
Table of Contents — Page 4 Table 3 Total Future Net Revenue (Undiscounted) As of August 31, 2011 Forecast Prices and Costs Table 4 Net Present Value of Future Net Revenue by Production Group As of August 31, 2011 Forecast Prices and Costs Table 5 Summary of Pricing and Inflation Rate Assumptions As of August 31, 2011 Forecast Prices and Costs Table 6 Reconciliation of Company Gross Reserves (Before Royalty) by Principal Product Type As of August 31, 2011 Forecast Prices and Costs Areas Alberta Area 1 Botha Area 2 Haynes Appendices Appendix A Definitions Appendix B Prices Appendix C Abbreviations Appendix D General Evaluation Parameters 3391.18388.AAS.smr P:\Eagleford Energy 18388\Report\Summary.doc
Introduction — Page 1 Introduction This report was prepared by Sproule Associates Limited (“Sproule”) at the request of Mr. James Cassina, President of Eagleford Energy Inc. Eagleford Energy Inc. is hereinafter referred to as "the Company". The effective date of this report is August 31, 2011, and it consists of an evaluation of the P&NG reserves of the Company's interests in Alberta, Canada. This report was prepared in September and October 2011 for the purpose of evaluating the Company’s P&NG reserves according to the Canadian Oil and Gas Evaluation Handbook (COGEH) reserve definitions that are consistent with the standards of National Instrument 51-101. This report was prepared for the Company’s corporate purposes. At the request of the Company, estimates of the Capital Gas Cost Allowance (GCA) and Tax pools have not been included. This report is included in one (1) volume and consists of an Introduction, Summary, Discussion, Constant Prices and Costs, National Instrument 51-101, and Appendices. The Introduction includes the summary of evaluation standards and procedures and pertinent author certificates; the Summary includes high-level summaries of the evaluation; and the Discussion includes general commentaries pertaining to the evaluation of the P&NG reserves. The Constant Prices and Costs section includes constant prices at August 31, 2011, for purposes of the Securities and Exchange Commission (SEC). The National Instrument 51-101 section presents Form 51-101F2 ― Report on Reserves Data by Independent Qualified Reserves Evaluator or Auditor, and Tables 1 to 5 using Forecast Prices and Costs and Table 6 - Reconciliation of Company Gross Reserves (Before Royalty) by Principal Product Type. Reserves definitions, product price forecasts, abbreviations, units, conversion factors and general evaluation parameters are included in Appendices A, B, C, and D. This report also contains detailed descriptions and evaluations for the individual properties (areas), on a property-by-property basis, including the following: Summary of the property evaluation; Summary of Pertinent Data; Table 1 – Well List/Reservoir Data; Table 2 - Summary of the estimates of proved and probable natural gas reserves and net present values; 3391.18388.AAS.smr P:\Eagleford Energy 18388\Report\Summary.doc
Introduction — Page 2 Table 3 - Forecasts of proved and probable natural gas production, revenue, and net present values, before income taxes; Table 4 – Entity Interests; Production history plots. Field Operations In the preparation of this evaluation, a field inspection of the properties was not performed. The relevant engineering data were made available by the Company or obtained from public sources and the non-confidential files at Sproule. No material information regarding the reserves evaluation would have been obtained by an on-site visit. Historical Data, Interests and Burdens 1. Al l historical production, revenue and expense data, product prices actually received, and other data that were obtained from the Company or from public sources were accepted as represented, without any further investigation by Sproule. 2. Property descriptions, details of interests held, and well data, as supplied by the Company, were accepted as represented. No investigation was made into either the legal titles held or any operating agreements in place relating to the subject properties. 3. Lessor and overriding royalties and other burdens were obtained from the Company. No further investigation was undertaken by Sproule. 4. Sproule reserves the right to review all calculations made, referred to or included in this report and to revise the estimates as a result of erroneous data supplied by the Company or information that exists but was not made available to us, which becomes known subsequent to the preparation of this report. Evaluation Standards This report has been prepared by Sproule using current geological and engineering knowledge, techniques and computer software. It has been prepared within the Code of Ethics of the Association of Professional Engineers, Geologists and Geophysicists of Alberta 3391.18388.AAS.smr P:\Eagleford Energy 18388\Report\Summary.doc
Introduction — Page 3 (“APEGGA”). This report adheres in all material aspects to the “best practices” recommended in the COGE Handbook which are in accordance with principles and definitions established by the Calgary Chapter of the Society of Petroleum Evaluation Engineers. The COGE Handbook is incorporated by reference in National Instrument 51-101. Evaluation Procedures 1. The Company provided Sproule with recent revenue statements to determine certain economic parameters. 2. The forecast of the natural gas price used in this evaluation was based on Sproule’s August 31, 2011 price forecasts. Further discussion is included in Appendix B. 3. The constant price used in this report complies with the Securities & Exchange Commission’s (SEC) regulations. It was calculated as the unweighted arithmetic average of the first-day-of-the-month price for each month within the 12-month period prior to the end of the reporting period. 4. Well abandonment and disconnect costs were included in this report at the entity level for wells which have reserves assigned. No allowances for reclamation or salvage values were made. Further discussion is included in Appendix D. 5. For this evaluation, Sproule worked on the reserves evaluation model, Value Navigator (ValNav). The functionality of the program is not the responsibility of Sproule, and results were accepted as calculated by the model. Sproule’s responsibility is limited to the quality of the data input and reasonableness of the outcoming results. Evaluation Results 1. The analysis of individual properties as reported herein was conducted within the context and scope of an evaluation of a unique group of properties in aggregate. Use of this report outside of this scope may not be appropriate. 2. The accuracy of reserves estimates and associated economic analysis is, in part, a function of the quality and quantity of available data and of engineering and geological interpretation and judgment. Given the data provided at the time this report was prepared, the estimates presented herein are considered reasonable. However, they should be accepted with the understanding that reservoir and financial performance 3391.18388.AAS.smr P:\Eagleford Energy 18388\Report\Summary.doc
Introduction — Page 4 subsequent to the date of the estimates may necessitate revision. These revisions may be material. 3. The net present values of the reserves presented in this report simply represent discounted future cash flow values at several discount rates. Though net present values form an integral part of fair market value estimations, without consideration for other economic criteria, they are not to be construed as Sproule’s opinion of fair market value. 4. Due to rounding, certain totals may not be consistent from one presentation to the next. BOE Cautionary Statement BOE’s (or ‘McfGE’s’ or other applicable units of equivalency) may be misleading, particularly if used in isolation. A BOE conversion ratio of 6 Mcf:1 bbl (or ‘An McfGE conversion ratio of 1 bbl:6 Mcf’) is based on an energy equivalency conversion method primarily applicable at the burner tip and does not represent a value equivalency at the wellhead. Forward-Looking Statements This report may contain forward-looking statements including expectations of future production revenues and capital expenditures. Information concerning reserves may also be deemed to be forward-looking as estimates involve the implied assessment that the reserves described can be profitably produced in future. These statements are based on current expectations that involve a number of risks and uncertainties, which could cause actual results to differ from those anticipated. These risks include, but are not limited to: the underlying risks of the oil and gas industry (i.e., corporate commitment, regulatory approval, operational risks in development, exploration and production); potential delays or changes in plans with respect to exploration or development projects or capital expenditures; the uncertainty of reserves estimations; the uncertainty of estimates and projections relating to production; costs and expenses; health, safety and environmental factors; commodity prices; and exchange rate fluctuation. Exclusivity This report has been prepared for the exclusive use of Eagleford Energy Inc. It may not be reproduced, distributed, or made available to any other company or person, regulatory body, or organization without the knowledge and written consent of Sproule, and without the complete contents of the report being made available to that party. 3391.18388.AAS.smr P:\Eagleford Energy 18388\Report\Summary.doc
Introduction — Page 5 Certification Report Preparation The report entitled “Evaluation of the P&NG Reserves of Eagleford Energy Inc. (As of August 31, 2011)” was prepared by the following Sproule personnel: Original Signed by Attila A. Szabo, P.Eng. _______________________________ Attila A. Szabo, P.Eng. Project Leader; Senior Petroleum Engineer and Partner _07_/_10_/2011 dd/mm/yr Sproule Executive Endorsement This report has been reviewed and endorsed by the following Executive of Sproule: Original Signed by Harry J. Helwerda, P.Eng., FEC _______________________________ Harry J. Helwerda, P.Eng., FEC Executive Vice-President and Director _07_/_10_/2011 dd/mm/yr Permit to Practice Sproule Associates Limited is a member of the Association of Professional Engineers, Geologists and Geophysicists of Alberta and our permit number is P00417. 3391.18388.AAS.smr P:\Eagleford Energy 18388\Report\Summary.doc
Introduction — Page 6 Certificate Attila A. Szabo, B.Sc., P.Eng. I, Attila A. Szabo, Senior Petroleum Engineer and Partner, of Sproule, 900, 140 Fourth Ave SW, Calgary, Alberta, declare the following: 1. I hold the following degree: a. B.Sc., Chemical Engineering (1980), University of Calgary, Calgary, Alberta, Canada 2. I am a registered professional: a. Professional Engineer (P.Eng.) Province of Alberta, Canada 3. I am a member of the following professional organizations: a. Association of Professional Engineers, Geologists and Geophysicists of Alberta (APEGGA) b. Society of Petroleum Engineers (SPE) c. Society of Petroleum Evaluation Engineers (SPEE) 4. I am a qualified reserves evaluator and reserves auditor as defined in National Instrument 51-101. 5. My contribution to the report entitled “Evaluation of the P&NG Reserves of Eagleford Energy Inc. (As of August 31, 2011)” is based on my engineering knowledge and the data provided to me by the Company, from public sources, and from the non-confidential files of Sproule. I did not undertake a field inspection of the properties. 6. I have no interest, direct or indirect, nor do I expect to receive any interest, direct or indirect, in the properties described in the above-named report or in the securities of Eagleford Energy Inc. Original Signed by Attila A. Szabo, P.Eng. Attila A. Szabo, P.Eng. 3391.18388.AAS.smr P:\Eagleford Energy 18388\Report\Summary.doc
Introduction — Page 7 Certificate Harry J. Helwerda, B.Sc., P.Eng., FEC I, Harry J. Helwerda, Executive Vice-President, and Director of Sproule, 900, 140 Fourth Ave SW, Calgary, Alberta, declare the following: 1. I hold the following degree: a. B.Sc. Civil Engineering (1978) University of Calgary, Calgary AB, Canada 2. I am a registered professional: a. Professional Engineer (P.Eng.) Province of Alberta, Canada 3. I have been bestowed with the designation Fellow Engineers Canada (FEC) 4. I am a member of the following professional organizations: a. Association of Professional Engineers, Geologists and Geophysicists of Alberta (APEGGA) b. Society of Petroleum Engineers (SPE) c. Society of Petroleum Evaluation Engineers (SPEE) 5. I am a qualified reserves evaluator and reserves auditor as defined in National Instrument 51-101. 6. My contribution to the report entitled “Evaluation of the P&NG Reserves of Eagleford Energy Inc. (As of August 31, 2011)” is based on my engineering knowledge and the data provided to me by the Company, from public sources, and from the non-confidential files of Sproule. I did not undertake a field inspection of the properties. 7. I have no interest, direct or indirect, nor do I expect to receive any interest, direct or indirect, in the properties described in the above-named report or in the securities of Eagleford Energy Inc. Original Signed by Harry J. Helwerda, P.Eng., FEC Harry J. Helwerda, P.Eng., FEC 3391.18388.AAS.smr P:\Eagleford Energy 18388\Report\Summary.doc
Summary — Page 1 Summary Table S-1 summarizes our evaluation, before income taxes, of the P&NG reserves of Eagleford Energy Inc., as of August 31, 2011. Changes to royalties enacted by legislation in Alberta have been included in the report. The reserves definitions and ownership classification used in this evaluation are the standards defined by COGEH reserve definitions and consistent with NI 51-101 and used by Sproule. The natural gas reserves are presented in millions of cubic feet, at base conditions of 14.65 psia and 60 degrees Fahrenheit. The net present values of the reserves are presented (on a before tax basis) in Canadian dollars and are based on annual projections of net revenue, which were discounted at various rates using the mid-period discounting method. These rates are 5, 10, 15 and 20 percent and undiscounted. The price forecasts that formed the basis for the revenue projections in the evaluation were based on Sproule’s August 31, 2011 pricing model. Table S-2 presents a summary of selected forecasts. Summary forecasts of production and net revenue for the various reserves categories are presented in Tables S-3 through S-3B, respectively. Well abandonment and disconnect costs have been included in this report at the entity level for all wells assigned reserves and are summarized in the Corporate totals for the various reserves categories. 3391.18388.AAS.smr P:\Eagleford Energy 18388\Report\Summary.doc

111004 03:19 SAL V110831 Esc admin Default Scenario Consolidation 18388 1 of 1 S1 Table S-1 Eagleford Energy Inc. Consolidation SUMMARY OF THE EVALUATION OF THE P.& N.G. RESERVES (As of Date: 2011-08-31) Remaining Reserves Net Present Values Before Income Taxes Company Gross 100% Gross Net @ 0% @ 5% @ 10% @ 15% @ 20% M$ M$ M$ M$ M$ Non-Assoc, Assoc Gas (MMcf) Proved Developed Producing 3901 203 161 444 288 205 155 124 Probable Developed Producing 1276 66 49 182 77 39 23 15 Total Proved+Probable 5177 269 211 626 365 243 178 139 Grand Total (Mboe) Proved Developed Producing 650.1 33.8 26.9 444 288 205 155 124 Probable Developed Producing 212.7 11.1 8.2 182 77 39 23 15 Total Proved+Probable 862.9 44.8 35.1 626 365 243 178 139
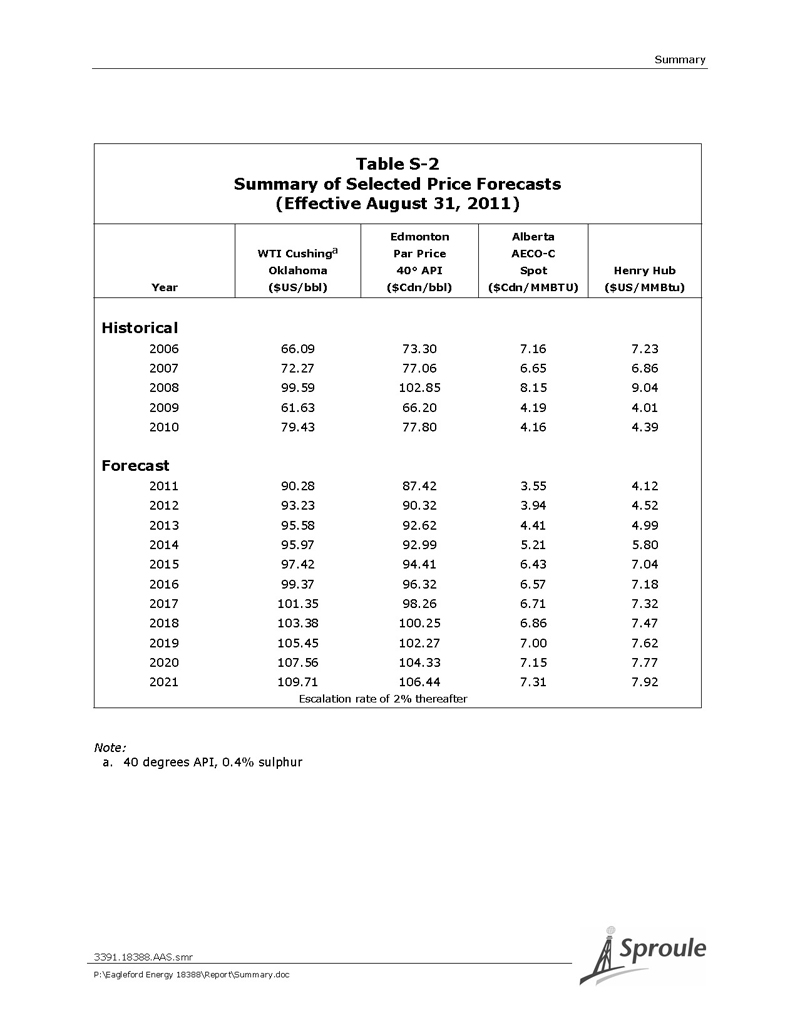
Summary Table S-2 Summary of Selected Price Forecasts (Effective August 31, 2011) Edmonton Alberta WTI Cushinga Par Price AECO-C Oklahoma 40° API Spot Henry Hub Year ($US/bbl) ($Cdn/bbl) ($Cdn/MMBTU) ($US/MMBtu) Historical 2006 66.09 73.30 7.16 7.23 2007 72.27 77.06 6.65 6.86 2008 99.59 102.85 8.15 9.04 2009 61.63 66.20 4.19 4.01 2010 79.43 77.80 4.16 4.39 Forecast 2011 90.28 87.42 3.55 4.12 2012 93.23 90.32 3.94 4.52 2013 95.58 92.62 4.41 4.99 2014 95.97 92.99 5.21 5.80 2015 97.42 94.41 6.43 7.04 2016 99.37 96.32 6.57 7.18 2017 101.35 98.26 6.71 7.32 2018 103.38 100.25 6.86 7.47 2019 105.45 102.27 7.00 7.62 2020 107.56 104.33 7.15 7.77 2021 109.71 106.44 7.31 7.92 Escalation rate of 2% thereafter Note: a. 40 degrees API, 0.4% sulphur 3391.18388.AAS.smr P:\Eagleford Energy 18388\Report\Summary.doc

111004 03:19 SAL V110831 Esc admin Default Scenario Eagleford Energy Inc. Consolidation 18388 1 of 1 H4 Table S-3 Proved+Probable Eagleford Energy Inc. Prod. Start: 2011-09-01 SUMMARY OF RESERVES AND NET PRESENT VALUE (As of Date: 2011-08-31) Reserves LtMed Heavy Solution Non-Assoc Pentanes Total Equiv Oil Oil Gas Assoc Gas Ethane Propane Butane Plus NGL Sulphur Oil Mbbl Mbbl MMcf MMcf Mbbl Mbbl Mbbl Mbbl Mbbl MLt Mboe Gross 0.0 0.0 0 5177 0.0 0.0 0.0 0.0 0.0 0.0 862.9 Co Grs 0.0 0.0 0 269 0.0 0.0 0.0 0.0 0.0 0.0 44.8 Co Net 0.0 0.0 0 211 0.0 0.0 0.0 0.0 0.0 0.0 35.1 Net Present Value Discount Total Net Before Tax ARTC Aband SK Tax Before Tax Rate Capital Net Rev Cap GCA Cost Overhead Cash Flow % M$ M$ M$ M$ M$ M$ 0.0 0 633 0 6 0 626 5.0 0 366 0 1 0 365 8.0 0 283 0 0 0 282 10.0 0 244 0 0 0 243 12.0 0 213 0 0 0 213 15.0 0 178 0 0 0 178 20.0 0 139 0 0 0 139 25.0 0 113 0 0 0 113 Reserve Life = 38.2 yrs Reserve Half Life = 9.2 yrs BOE Reserve Index = 14.3 YEARLY SUMMARY OF RESERVES AND NET PRESENT VALUE (As of Date: 2011-08-31) Oil Gas BOE BTax Comp Comp Comp Oil Gas Other Total Non- Lease Other Total Aband Cash Year Grs Grs Grs Rev Rev Rev Crown Crown Expen Expen Cap Etc Flow bbl/d Mcf/d boe/d M$ M$ M$ M$ M$ M$ M$ M$ M$ M$ 2011 0 52 9 0 24 0 4 0 14 0 0 0 5 2012 0 50 8 0 75 0 15 0 41 0 0 0 19 2013 0 47 8 0 78 0 17 0 40 0 0 0 22 2014 0 44 7 0 86 0 21 0 39 0 0 0 27 2015 0 41 7 0 99 0 27 0 38 0 0 0 34 2016 0 39 6 0 95 0 26 0 36 0 0 0 33 2017 0 36 6 0 91 0 24 0 35 0 0 0 32 2018 0 34 6 0 87 0 22 0 34 0 0 0 30 2019 0 32 5 0 83 0 21 0 34 0 0 0 29 2020 0 30 5 0 80 0 19 0 33 0 0 0 28 2021 0 28 5 0 76 0 17 0 32 0 0 0 28 2022 0 26 4 0 73 0 15 0 31 0 0 0 27 2023 0 25 4 0 70 0 14 0 30 0 0 0 26 2024 0 23 4 0 67 0 13 0 30 0 0 0 25 2025 0 22 4 0 64 0 11 0 29 0 0 0 23 2026 0 20 3 0 61 0 10 0 28 0 0 0 22 2027 0 19 3 0 58 0 9 0 28 0 0 0 21 2028 0 18 3 0 56 0 8 0 27 0 0 0 20 2029 0 17 3 0 53 0 7 0 27 0 0 0 19 2030 0 16 3 0 51 0 7 0 26 0 0 0 18 SubT 0 1428 0 306 0 633 0 0 0 489 19yr 0 574 0 42 0 387 0 0 6 138 Total 0 2001 0 349 0 1020 0 0 6 626 Discounted 5% 0 1121 0 226 0 530 0 0 1 365 Cash 10% 0 747 0 162 0 342 0 0 0 243 Streams 15% 0 554 0 124 0 251 0 0 0 178 20% 0 439 0 100 0 200 0 0 0 139

111004 03:19 SAL V110831 Esc admin Default Scenario Eagleford Energy Inc. Consolidation 18388 1 of 1 H4 Table S-3A Proved Developed Producing Eagleford Energy Inc. Prod. Start: 2011-09-01 SUMMARY OF RESERVES AND NET PRESENT VALUE (As of Date: 2011-08-31) Reserves LtMed Heavy Solution Non-Assoc Pentanes Total Equiv Oil Oil Gas Assoc Gas Ethane Propane Butane Plus NGL Sulphur Oil Mbbl Mbbl MMcf MMcf Mbbl Mbbl Mbbl Mbbl Mbbl MLt Mboe Gross 0.0 0.0 0 3901 0.0 0.0 0.0 0.0 0.0 0.0 650.1 Co Grs 0.0 0.0 0 203 0.0 0.0 0.0 0.0 0.0 0.0 33.8 Co Net 0.0 0.0 0 161 0.0 0.0 0.0 0.0 0.0 0.0 26.9 Net Present Value Discount Total Net Before Tax ARTC Aband SK Tax Before Tax Rate Capital Net Rev Cap GCA Cost Overhead Cash Flow % M$ M$ M$ M$ M$ M$ 0.0 0 449 0 5 0 444 5.0 0 290 0 1 0 288 8.0 0 233 0 1 0 233 10.0 0 205 0 0 0 205 12.0 0 182 0 0 0 182 15.0 0 155 0 0 0 155 20.0 0 124 0 0 0 124 25.0 0 102 0 0 0 102 Reserve Life = 30.2 yrs Reserve Half Life = 7.1 yrs BOE Reserve Index = 11.2 YEARLY SUMMARY OF RESERVES AND NET PRESENT VALUE (As of Date: 2011-08-31) Oil Gas BOE BTax Comp Comp Comp Oil Gas Other Total Non- Lease Other Total Aband Cash Year Grs Grs Grs Rev Rev Rev Crown Crown Expen Expen Cap Etc Flow bbl/d Mcf/d boe/d M$ M$ M$ M$ M$ M$ M$ M$ M$ M$ 2011 0 51 8 0 23 0 4 0 14 0 0 0 5 2012 0 48 8 0 72 0 14 0 40 0 0 0 18 2013 0 44 7 0 73 0 15 0 38 0 0 0 20 2014 0 41 7 0 79 0 18 0 36 0 0 0 25 2015 0 37 6 0 90 0 23 0 35 0 0 0 32 2016 0 34 6 0 84 0 21 0 33 0 0 0 30 2017 0 32 5 0 79 0 19 0 32 0 0 0 28 2018 0 29 5 0 74 0 17 0 31 0 0 0 27 2019 0 27 4 0 70 0 15 0 30 0 0 0 26 2020 0 25 4 0 66 0 13 0 29 0 0 0 25 2021 0 23 4 0 62 0 11 0 28 0 0 0 23 2022 0 21 3 0 58 0 9 0 27 0 0 0 22 2023 0 19 3 0 54 0 8 0 26 0 0 0 20 2024 0 18 3 0 51 0 7 0 25 0 0 0 19 2025 0 16 3 0 48 0 6 0 24 0 0 0 18 2026 0 15 3 0 45 0 5 0 24 0 0 0 16 2027 0 14 2 0 42 0 4 0 23 0 0 0 15 2028 0 13 2 0 40 0 3 0 23 0 0 0 14 2029 0 12 2 0 37 0 3 0 22 0 0 0 12 2030 0 11 2 0 35 0 2 0 22 0 0 0 11 SubT 0 1184 0 217 0 561 0 0 0 406 11yr 0 216 0 11 0 162 0 0 5 38 Total 0 1400 0 228 0 722 0 0 5 444 Discounted 5% 0 885 0 162 0 433 0 0 1 288 Cash 10% 0 627 0 124 0 299 0 0 0 205 Streams 15% 0 481 0 99 0 227 0 0 0 155 20% 0 389 0 81 0 184 0 0 0 124
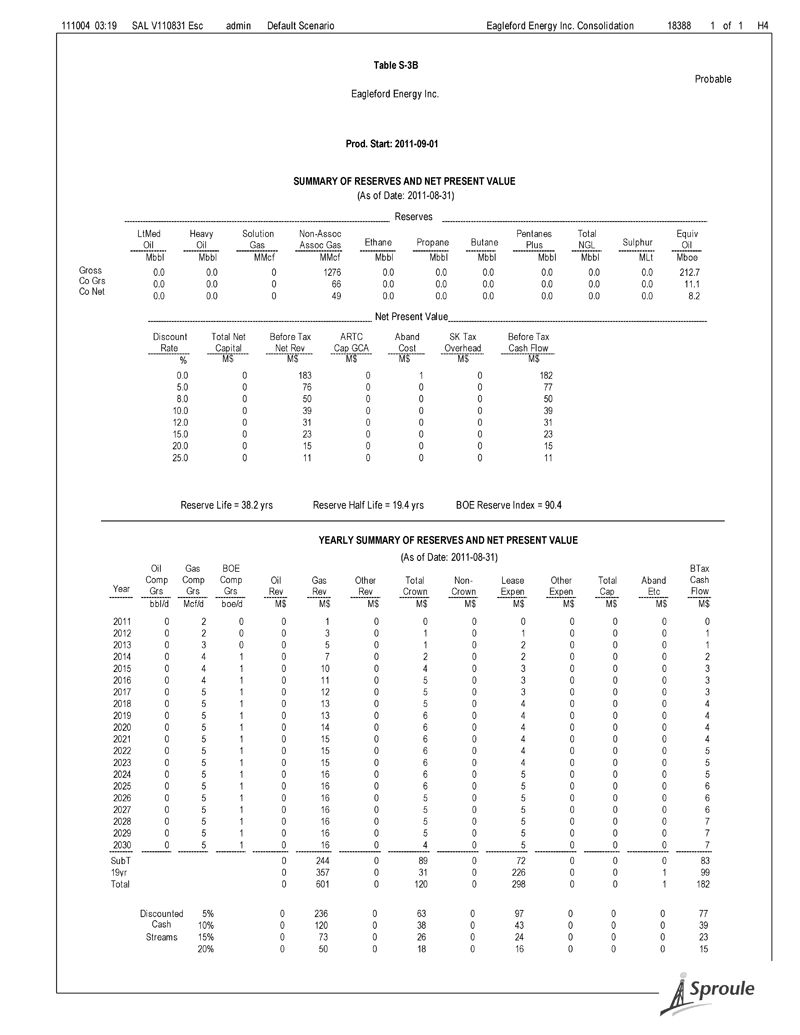
111004 03:19 SAL V110831 Esc admin Default Scenario Eagleford Energy Inc. Consolidation 18388 1 of 1 H4 Table S-3B Probable Eagleford Energy Inc. Prod. Start: 2011-09-01 SUMMARY OF RESERVES AND NET PRESENT VALUE (As of Date: 2011-08-31) Reserves LtMed Heavy Solution Non-Assoc Pentanes Total Equiv Oil Oil Gas Assoc Gas Ethane Propane Butane Plus NGL Sulphur Oil Mbbl Mbbl MMcf MMcf Mbbl Mbbl Mbbl Mbbl Mbbl MLt Mboe Gross 0.0 0.0 0 1276 0.0 0.0 0.0 0.0 0.0 0.0 212.7 Co Grs 0.0 0.0 0 66 0.0 0.0 0.0 0.0 0.0 0.0 11.1 Co Net 0.0 0.0 0 49 0.0 0.0 0.0 0.0 0.0 0.0 8.2 Net Present Value Discount Total Net Before Tax ARTC Aband SK Tax Before Tax Rate Capital Net Rev Cap GCA Cost Overhead Cash Flow % M$ M$ M$ M$ M$ M$ 0.0 0 183 0 1 0 182 5.0 0 76 0 0 0 77 8.0 0 50 0 0 0 50 10.0 0 39 0 0 0 39 12.0 0 31 0 0 0 31 15.0 0 23 0 0 0 23 20.0 0 15 0 0 0 15 25.0 0 11 0 0 0 11 Reserve Life = 38.2 yrs Reserve Half Life = 19.4 yrs BOE Reserve Index = 90.4 YEARLY SUMMARY OF RESERVES AND NET PRESENT VALUE (As of Date: 2011-08-31) Oil Gas BOE BTax Comp Comp Comp Oil Gas Other Total Non- Lease Other Total Aband Cash Year Grs Grs Grs Rev Rev Rev Crown Crown Expen Expen Cap Etc Flow bbl/d Mcf/d boe/d M$ M$ M$ M$ M$ M$ M$ M$ M$ M$ 2011 0 2 0 0 1 0 0 0 0 0 0 0 0 2012 0 2 0 0 3 0 1 0 1 0 0 0 1 2013 0 3 0 0 5 0 1 0 2 0 0 0 1 2014 0 4 1 0 7 0 2 0 2 0 0 0 2 2015 0 4 1 0 10 0 4 0 3 0 0 0 3 2016 0 4 1 0 11 0 5 0 3 0 0 0 3 2017 0 5 1 0 12 0 5 0 3 0 0 0 3 2018 0 5 1 0 13 0 5 0 4 0 0 0 4 2019 0 5 1 0 13 0 6 0 4 0 0 0 4 2020 0 5 1 0 14 0 6 0 4 0 0 0 4 2021 0 5 1 0 15 0 6 0 4 0 0 0 4 2022 0 5 1 0 15 0 6 0 4 0 0 0 5 2023 0 5 1 0 15 0 6 0 4 0 0 0 5 2024 0 5 1 0 16 0 6 0 5 0 0 0 5 2025 0 5 1 0 16 0 6 0 5 0 0 0 6 2026 0 5 1 0 16 0 5 0 5 0 0 0 6 2027 0 5 1 0 16 0 5 0 5 0 0 0 6 2028 0 5 1 0 16 0 5 0 5 0 0 0 7 2029 0 5 1 0 16 0 5 0 5 0 0 0 7 2030 0 5 1 0 16 0 4 0 5 0 0 0 7 SubT 0 244 0 89 0 72 0 0 0 83 19yr 0 357 0 31 0 226 0 0 1 99 Total 0 601 0 120 0 298 0 0 1 182 Discounted 5% 0 236 0 63 0 97 0 0 0 77 Cash 10% 0 120 0 38 0 43 0 0 0 39 Streams 15% 0 73 0 26 0 24 0 0 0 23 20% 0 50 0 18 0 16 0 0 0 15
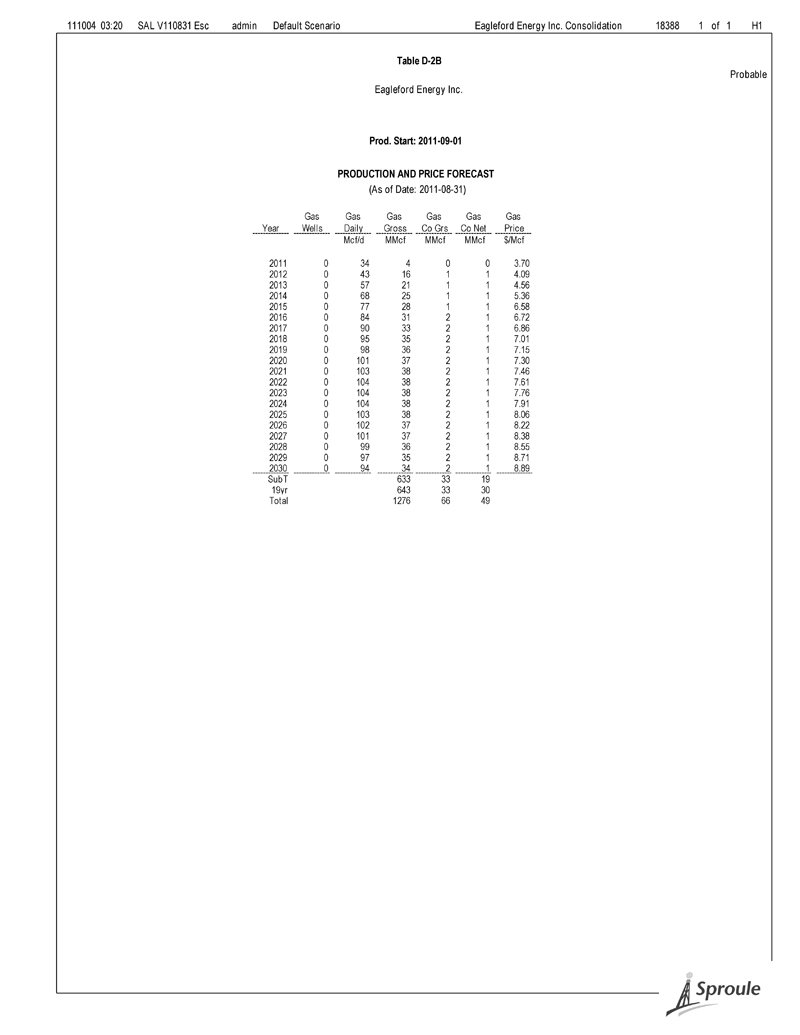
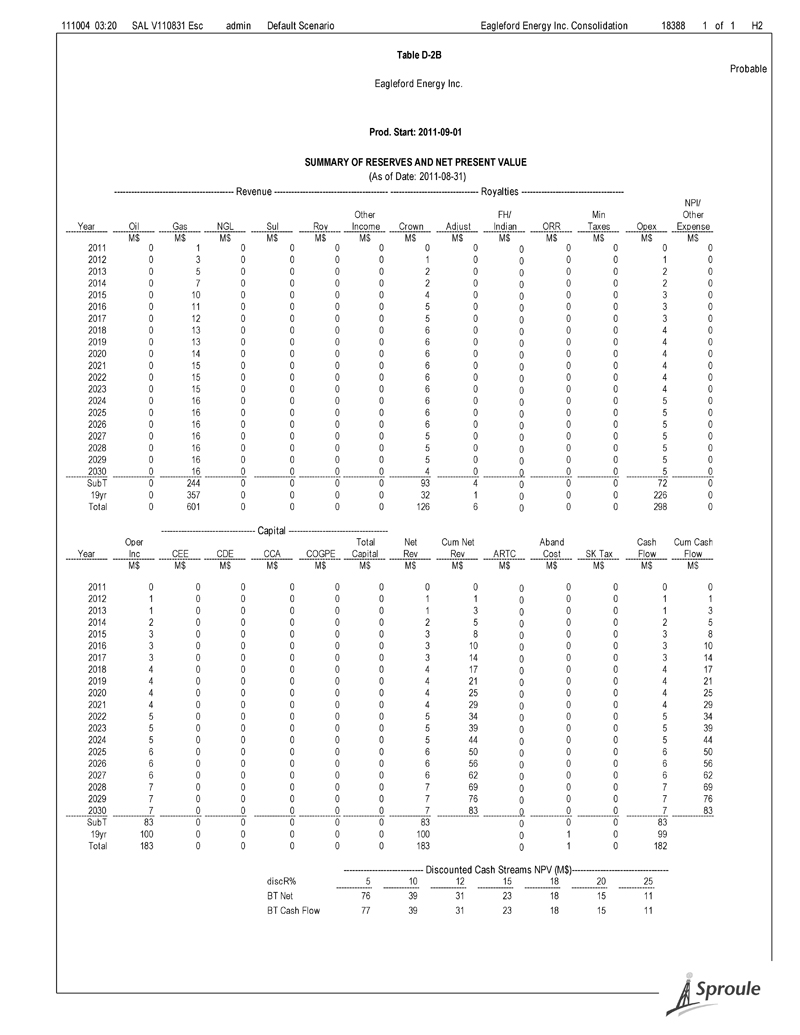
Discussion — Page 1 Discussion The Company’s P&NG reserves are located in the province of Alberta, Canada. Reserves and Production The natural gas reserves were estimated from production decline curve analyses. Forecasts of net revenue were prepared by predicting annual production from the reserves, and product prices. Annual production was forecast taking into account historical production trends of the Company’s producing wells, applicable regulatory conditions, existing or anticipated contract rates, and by comparison with other wells in the vicinity producing from similar reservoirs. Net Present Values The estimates of the P&NG reserves and their respective net present values, summarized by property and by reserves category, before income taxes, are presented in Table D-1. Detailed forecasts of production and net revenue for the various reserves categories for the Company are presented in Tables D-2 through D-2B. Well abandonment and disconnect costs are included at the entity level for all entities that have reserves assigned. 3391.18388.AAS.smr P:\Eagleford Energy 18388\Report\Summary.doc
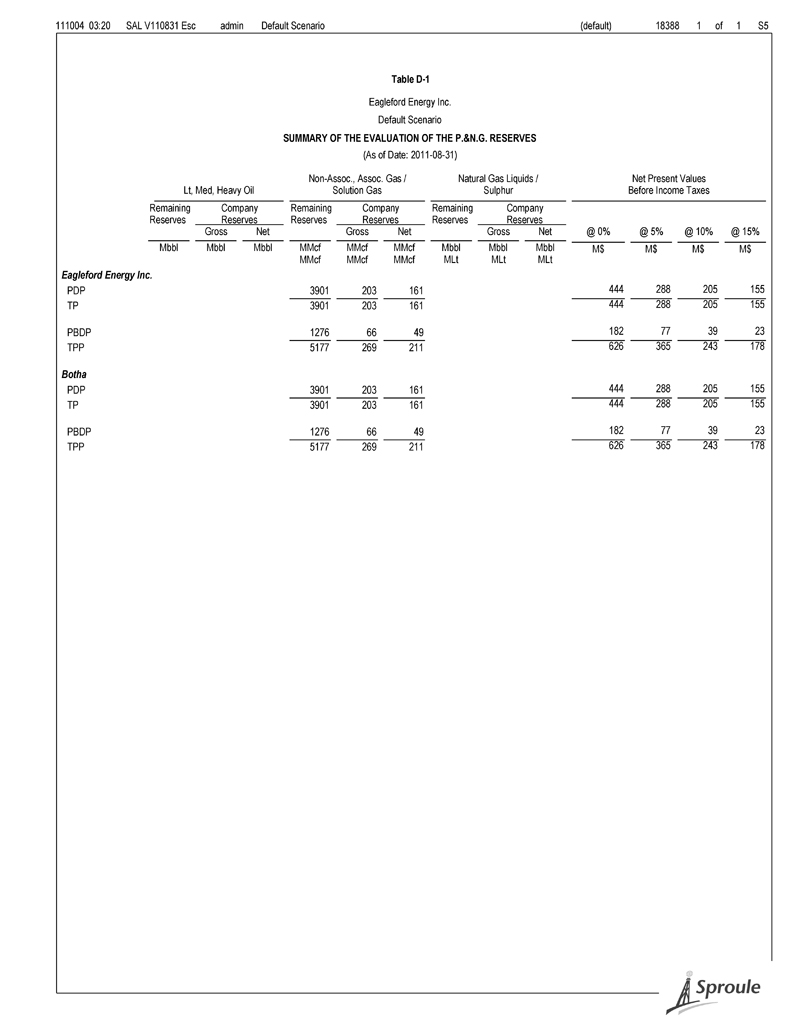
(default) 18388 1 of 1 S5 Table D-1 Eagleford Energy Inc. Default Scenario SUMMARY OF THE EVALUATION OF THE P.&N.G. RESERVES (As of Date: 2011-08-31) Non-Assoc., Assoc. Gas / Natural Gas Liquids / Net Present Values Lt, Med, Heavy Oil Solution Gas Sulphur Before Income Taxes Remaining Company Remaining Company Remaining Company Reserves Reserves Reserves Reserves Reserves Reserves Gross Net Gross Net Gross Net @ 0% @ 5% @ 10% @ 15% Mbbl Mbbl Mbbl MMcf MMcf MMcf Mbbl Mbbl Mbbl M$ M$ M$ M$ MMcf MMcf MMcf MLt MLt MLt Eagleford Energy Inc. PDP 3901 203 161 444 288 205 155 TP 3901 203 161 444 288 205 155 PBDP 1276 66 49 182 77 39 23 TPP 5177 269 211 626 365 243 178 Botha PDP 3901 203 161 444 288 205 155 TP 3901 203 161 444 288 205 155 PBDP 1276 66 49 182 77 39 23 TPP 5177 269 211 626 365 243 178

111004 03:20 SAL V110831 Esc admin Default Scenario Eagleford Energy Inc. Consolidation 18388 1 of 1 H4 Table D-2 Proved+Probable Eagleford Energy Inc. Prod. Start: 2011-09-01 SUMMARY OF RESERVES AND NET PRESENT VALUE (As of Date: 2011-08-31) Reserves LtMed Heavy Solution Non-Assoc Pentanes Total Equiv Oil Oil Gas Assoc Gas Ethane Propane Butane Plus NGL Sulphur Oil Mbbl Mbbl MMcf MMcf Mbbl Mbbl Mbbl Mbbl Mbbl MLt Mboe Gross 0.0 0.0 0 5177 0.0 0.0 0.0 0.0 0.0 0.0 862.9 Co Grs 0.0 0.0 0 269 0.0 0.0 0.0 0.0 0.0 0.0 44.8 Co Net 0.0 0.0 0 211 0.0 0.0 0.0 0.0 0.0 0.0 35.1 Net Present Value Discount Total Net Before Tax ARTC Aband SK Tax Before Tax Rate Capital Net Rev Cap GCA Cost Overhead Cash Flow % M$ M$ M$ M$ M$ M$ 0.0 0 633 0 6 0 626 5.0 0 366 0 1 0 365 8.0 0 283 0 0 0 282 10.0 0 244 0 0 0 243 12.0 0 213 0 0 0 213 15.0 0 178 0 0 0 178 20.0 0 139 0 0 0 139 25.0 0 113 0 0 0 113 Reserve Life = 38.2 yrs Reserve Half Life = 9.2 yrs BOE Reserve Index = 14.3 YEARLY SUMMARY OF RESERVES AND NET PRESENT VALUE (As of Date: 2011-08-31) Oil Gas BOE BTax Comp Comp Comp Oil Gas Other Total Non- Lease Other Total Aband Cash Year Grs Grs Grs Rev Rev Rev Crown Crown Expen Expen Cap Etc Flow bbl/d Mcf/d boe/d M$ M$ M$ M$ M$ M$ M$ M$ M$ M$ 2011 0 52 9 0 24 0 4 0 14 0 0 0 5 2012 0 50 8 0 75 0 15 0 41 0 0 0 19 2013 0 47 8 0 78 0 17 0 40 0 0 0 22 2014 0 44 7 0 86 0 21 0 39 0 0 0 27 2015 0 41 7 0 99 0 27 0 38 0 0 0 34 2016 0 39 6 0 95 0 26 0 36 0 0 0 33 2017 0 36 6 0 91 0 24 0 35 0 0 0 32 2018 0 34 6 0 87 0 22 0 34 0 0 0 30 2019 0 32 5 0 83 0 21 0 34 0 0 0 29 2020 0 30 5 0 80 0 19 0 33 0 0 0 28 2021 0 28 5 0 76 0 17 0 32 0 0 0 28 2022 0 26 4 0 73 0 15 0 31 0 0 0 27 2023 0 25 4 0 70 0 14 0 30 0 0 0 26 2024 0 23 4 0 67 0 13 0 30 0 0 0 25 2025 0 22 4 0 64 0 11 0 29 0 0 0 23 2026 0 20 3 0 61 0 10 0 28 0 0 0 22 2027 0 19 3 0 58 0 9 0 28 0 0 0 21 2028 0 18 3 0 56 0 8 0 27 0 0 0 20 2029 0 17 3 0 53 0 7 0 27 0 0 0 19 2030 0 16 3 0 51 0 7 0 26 0 0 0 18 SubT 0 1428 0 306 0 633 0 0 0 489 19yr 0 574 0 42 0 387 0 0 6 138 Total 0 2001 0 349 0 1020 0 0 6 626 Discounted 5% 0 1121 0 226 0 530 0 0 1 365 Cash 10% 0 747 0 162 0 342 0 0 0 243 Streams 15% 0 554 0 124 0 251 0 0 0 178 20% 0 439 0 100 0 200 0 0 0 139

111004 03:20 SAL V110831 Esc admin Default Scenario Eagleford Energy Inc. Consolidation 18388 1 of 1 H1 Table D-2 Proved+Probable Eagleford Energy Inc. Prod. Start: 2011-09-01 PRODUCTION AND PRICE FORECAST (As of Date: 2011-08-31) Gas Gas Gas Gas Gas Gas Year Wells Daily Gross Co Grs Co Net Price Mcf/d MMcf MMcf MMcf $/Mcf 2011 2 1007 123 6 5 3.70 2012 2 965 353 18 14 4.09 2013 2 904 330 17 13 4.56 2014 2 848 309 16 11 5.36 2015 2 795 290 15 10 6.58 2016 2 745 273 14 10 6.72 2017 2 698 255 13 9 6.86 2018 2 655 239 12 9 7.01 2019 2 614 224 12 8 7.15 2020 2 575 211 11 8 7.30 2021 2 539 197 10 8 7.46 2022 2 506 185 10 7 7.61 2023 2 474 173 9 7 7.76 2024 2 445 163 8 7 7.91 2025 2 417 152 8 6 8.06 2026 2 391 143 7 6 8.22 2027 2 366 134 7 6 8.38 2028 2 343 126 7 5 8.55 2029 2 322 118 6 5 8.71 2030 2 302 110 6 5 8.89 SubT 4106 213 160 19yr 1071 56 51 Total 5177 269 211

111004 03:20 SAL V110831 Esc admin Default Scenario Eagleford Energy Inc. Consolidation 18388 1 of 1 H2 Table D-2 Proved+Probable Eagleford Energy Inc. Prod. Start: 2011-09-01 SUMMARY OF RESERVES AND NET PRESENT VALUE (As of Date: 2011-08-31) ------------------------------------------ Revenue ---------------------------------------- ------------------------------- Royalties ------------------------------------ NPI/ Other FH/ Min Other Year Oil Gas NGL Sul Roy Income Crown Adjust Indian ORR Taxes Opex Expense M$ M$ M$ M$ M$ M$ M$ M$ M$ M$ M$ M$ M$ 2011 0 24 0 0 0 0 5 0 0 0 0 14 0 2012 0 75 0 0 0 0 16 1 0 0 0 41 0 2013 0 78 0 0 0 0 18 1 0 0 0 40 0 2014 0 86 0 0 0 0 22 1 0 0 0 39 0 2015 0 99 0 0 0 0 29 1 0 0 0 38 0 2016 0 95 0 0 0 0 27 1 0 0 0 36 0 2017 0 91 0 0 0 0 25 1 0 0 0 35 0 2018 0 87 0 0 0 0 23 1 0 0 0 34 0 2019 0 83 0 0 0 0 21 1 0 0 0 34 0 2020 0 80 0 0 0 0 20 1 0 0 0 33 0 2021 0 76 0 0 0 0 18 1 0 0 0 32 0 2022 0 73 0 0 0 0 16 1 0 0 0 31 0 2023 0 70 0 0 0 0 15 1 0 0 0 30 0 2024 0 67 0 0 0 0 13 1 0 0 0 30 0 2025 0 64 0 0 0 0 12 1 0 0 0 29 0 2026 0 61 0 0 0 0 11 0 0 0 0 28 0 2027 0 58 0 0 0 0 10 0 0 0 0 28 0 2028 0 56 0 0 0 0 9 0 0 0 0 27 0 2029 0 53 0 0 0 0 8 0 0 0 0 27 0 2030 0 51 0 0 0 0 7 0 0 0 0 26 0 SubT 0 1428 0 0 0 0 322 16 0 0 0 633 0 19yr 0 574 0 0 0 0 44 2 0 0 0 387 0 Total 0 2001 0 0 0 0 366 17 0 0 0 1020 0 --------------------------------- Capital ----------------------------------- Oper Total Net Cum Net Aband Cash Cum Cash Year Inc CEE CDE CCA COGPE Capital Rev Rev ARTC Cost SK Tax Flow Flow M$ M$ M$ M$ M$ M$ M$ M$ M$ M$ M$ M$ M$ 2011 5 0 0 0 0 0 5 5 0 0 0 5 5 2012 19 0 0 0 0 0 19 25 0 0 0 19 25 2013 22 0 0 0 0 0 22 46 0 0 0 22 46 2014 27 0 0 0 0 0 27 73 0 0 0 27 73 2015 34 0 0 0 0 0 34 108 0 0 0 34 108 2016 33 0 0 0 0 0 33 141 0 0 0 33 141 2017 32 0 0 0 0 0 32 172 0 0 0 32 172 2018 30 0 0 0 0 0 30 203 0 0 0 30 203 2019 29 0 0 0 0 0 29 232 0 0 0 29 232 2020 28 0 0 0 0 0 28 260 0 0 0 28 260 2021 28 0 0 0 0 0 28 288 0 0 0 28 288 2022 27 0 0 0 0 0 27 315 0 0 0 27 315 2023 26 0 0 0 0 0 26 340 0 0 0 26 340 2024 25 0 0 0 0 0 25 365 0 0 0 25 365 2025 23 0 0 0 0 0 23 388 0 0 0 23 388 2026 22 0 0 0 0 0 22 410 0 0 0 22 410 2027 21 0 0 0 0 0 21 431 0 0 0 21 431 2028 20 0 0 0 0 0 20 452 0 0 0 20 452 2029 19 0 0 0 0 0 19 471 0 0 0 19 471 2030 18 0 0 0 0 0 18 489 0 0 0 18 489 SubT 489 0 0 0 0 0 489 0 0 0 489 19yr 144 0 0 0 0 0 144 0 6 0 138 Total 633 0 0 0 0 0 633 0 6 0 626 ---------------------------- Discounted Cash Streams NPV (M$)----------------------------------discR% 5 10 12 15 18 20 25 BT Net 366 244 213 178 153 139 113 BT Cash Flow 365 243 213 178 152 139 113
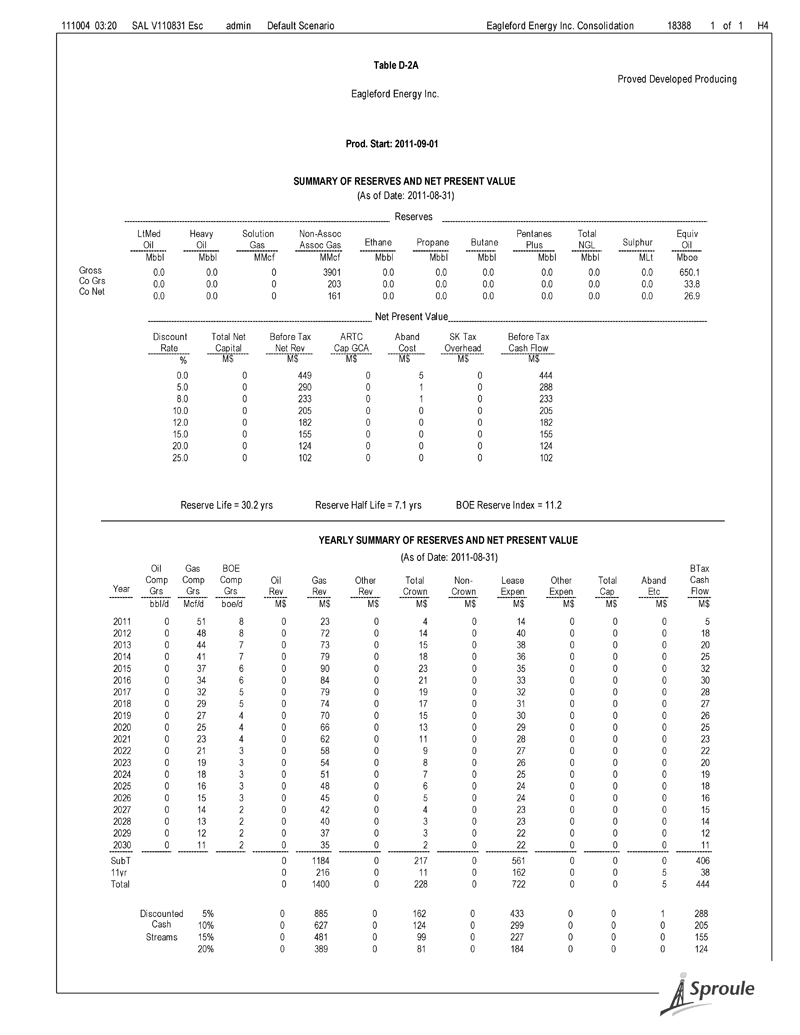
111004 03:20 SAL V110831 Esc admin Default Scenario Eagleford Energy Inc. Consolidation 18388 1 of 1 H4 Table D-2A Proved Developed Producing Eagleford Energy Inc. Prod. Start: 2011-09-01 SUMMARY OF RESERVES AND NET PRESENT VALUE (As of Date: 2011-08-31) Reserves LtMed Heavy Solution Non-Assoc Pentanes Total Equiv Oil Oil Gas Assoc Gas Ethane Propane Butane Plus NGL Sulphur Oil Mbbl Mbbl MMcf MMcf Mbbl Mbbl Mbbl Mbbl Mbbl MLt Mboe Gross 0.0 0.0 0 3901 0.0 0.0 0.0 0.0 0.0 0.0 650.1 Co Grs 0.0 0.0 0 203 0.0 0.0 0.0 0.0 0.0 0.0 33.8 Co Net 0.0 0.0 0 161 0.0 0.0 0.0 0.0 0.0 0.0 26.9 Net Present Value Discount Total Net Before Tax ARTC Aband SK Tax Before Tax Rate Capital Net Rev Cap GCA Cost Overhead Cash Flow % M$ M$ M$ M$ M$ M$ 0.0 0 449 0 5 0 444 5.0 0 290 0 1 0 288 8.0 0 233 0 1 0 233 10.0 0 205 0 0 0 205 12.0 0 182 0 0 0 182 15.0 0 155 0 0 0 155 20.0 0 124 0 0 0 124 25.0 0 102 0 0 0 102 Reserve Life = 30.2 yrs Reserve Half Life = 7.1 yrs BOE Reserve Index = 11.2 YEARLY SUMMARY OF RESERVES AND NET PRESENT VALUE (As of Date: 2011-08-31) Oil Gas BOE BTax Comp Comp Comp Oil Gas Other Total Non- Lease Other Total Aband Cash Year Grs Grs Grs Rev Rev Rev Crown Crown Expen Expen Cap Etc Flow bbl/d Mcf/d boe/d M$ M$ M$ M$ M$ M$ M$ M$ M$ M$ 2011 0 51 8 0 23 0 4 0 14 0 0 0 5 2012 0 48 8 0 72 0 14 0 40 0 0 0 18 2013 0 44 7 0 73 0 15 0 38 0 0 0 20 2014 0 41 7 0 79 0 18 0 36 0 0 0 25 2015 0 37 6 0 90 0 23 0 35 0 0 0 32 2016 0 34 6 0 84 0 21 0 33 0 0 0 30 2017 0 32 5 0 79 0 19 0 32 0 0 0 28 2018 0 29 5 0 74 0 17 0 31 0 0 0 27 2019 0 27 4 0 70 0 15 0 30 0 0 0 26 2020 0 25 4 0 66 0 13 0 29 0 0 0 25 2021 0 23 4 0 62 0 11 0 28 0 0 0 23 2022 0 21 3 0 58 0 9 0 27 0 0 0 22 2023 0 19 3 0 54 0 8 0 26 0 0 0 20 2024 0 18 3 0 51 0 7 0 25 0 0 0 19 2025 0 16 3 0 48 0 6 0 24 0 0 0 18 2026 0 15 3 0 45 0 5 0 24 0 0 0 16 2027 0 14 2 0 42 0 4 0 23 0 0 0 15 2028 0 13 2 0 40 0 3 0 23 0 0 0 14 2029 0 12 2 0 37 0 3 0 22 0 0 0 12 2030 0 11 2 0 35 0 2 0 22 0 0 0 11 SubT 0 1184 0 217 0 561 0 0 0 406 11yr 0 216 0 11 0 162 0 0 5 38 Total 0 1400 0 228 0 722 0 0 5 444 Discounted 5% 0 885 0 162 0 433 0 0 1 288 Cash 10% 0 627 0 124 0 299 0 0 0 205 Streams 15% 0 481 0 99 0 227 0 0 0 155 20% 0 389 0 81 0 184 0 0 0 124
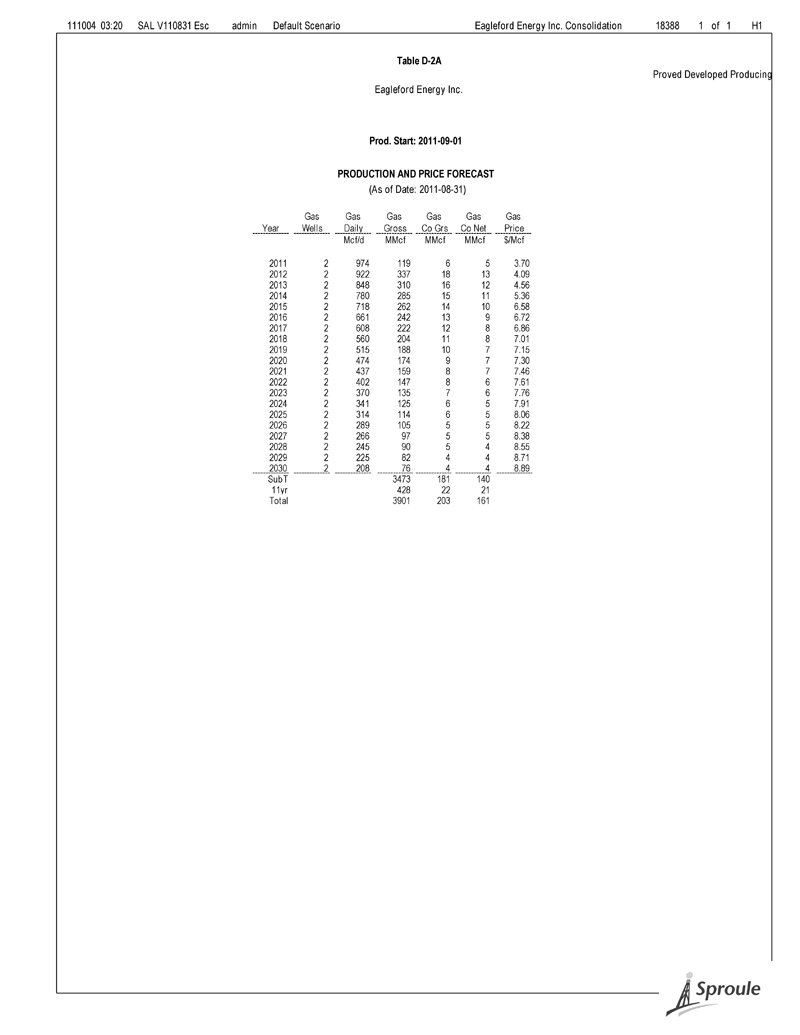
111004 03:20 SAL V110831 Esc admin Default Scenario Eagleford Energy Inc. Consolidation 18388 1 of 1 H1 Table D-2A Proved Developed Producing Eagleford Energy Inc. Prod. Start: 2011-09-01 PRODUCTION AND PRICE FORECAST (As of Date: 2011-08-31) Gas Gas Gas Gas Gas Gas Year Wells Daily Gross Co Grs Co Net Price Mcf/d MMcf MMcf MMcf $/Mcf 2011 2 974 119 6 5 3.70 2012 2 922 337 18 13 4.09 2013 2 848 310 16 12 4.56 2014 2 780 285 15 11 5.36 2015 2 718 262 14 10 6.58 2016 2 661 242 13 9 6.72 2017 2 608 222 12 8 6.86 2018 2 560 204 11 8 7.01 2019 2 515 188 10 7 7.15 2020 2 474 174 9 7 7.30 2021 2 437 159 8 7 7.46 2022 2 402 147 8 6 7.61 2023 2 370 135 7 6 7.76 2024 2 341 125 6 5 7.91 2025 2 314 114 6 5 8.06 2026 2 289 105 5 5 8.22 2027 2 266 97 5 5 8.38 2028 2 245 90 5 4 8.55 2029 2 225 82 4 4 8.71 2030 2 208 76 4 4 8.89 SubT 3473 181 140 11yr 428 22 21 Total 3901 203 161
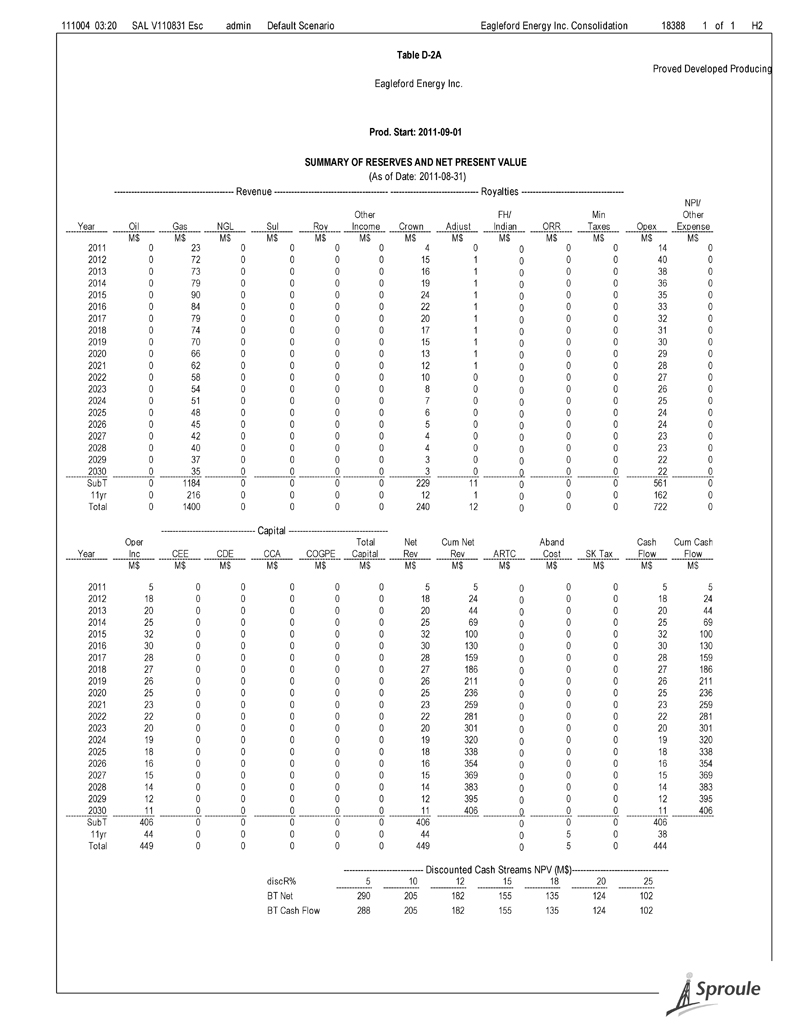
111004 03:20 SAL V110831 Esc admin Default Scenario Eagleford Energy Inc. Consolidation 18388 1 of 1 H2 Table D-2A Proved Developed Producing Eagleford Energy Inc. Prod. Start: 2011-09-01 SUMMARY OF RESERVES AND NET PRESENT VALUE (As of Date: 2011-08-31) ------------------------------------------ Revenue ---------------------------------------- ------------------------------- Royalties ------------------------------------ NPI/ Other FH/ Min Other Year Oil Gas NGL Sul Roy Income Crown Adjust Indian ORR Taxes Opex Expense M$ M$ M$ M$ M$ M$ M$ M$ M$ M$ M$ M$ M$ 2011 0 23 0 0 0 0 4 0 0 0 0 14 0 2012 0 72 0 0 0 0 15 1 0 0 0 40 0 2013 0 73 0 0 0 0 16 1 0 0 0 38 0 2014 0 79 0 0 0 0 19 1 0 0 0 36 0 2015 0 90 0 0 0 0 24 1 0 0 0 35 0 2016 0 84 0 0 0 0 22 1 0 0 0 33 0 2017 0 79 0 0 0 0 20 1 0 0 0 32 0 2018 0 74 0 0 0 0 17 1 0 0 0 31 0 2019 0 70 0 0 0 0 15 1 0 0 0 30 0 2020 0 66 0 0 0 0 13 1 0 0 0 29 0 2021 0 62 0 0 0 0 12 1 0 0 0 28 0 2022 0 58 0 0 0 0 10 0 0 0 0 27 0 2023 0 54 0 0 0 0 8 0 0 0 0 26 0 2024 0 51 0 0 0 0 7 0 0 0 0 25 0 2025 0 48 0 0 0 0 6 0 0 0 0 24 0 2026 0 45 0 0 0 0 5 0 0 0 0 24 0 2027 0 42 0 0 0 0 4 0 0 0 0 23 0 2028 0 40 0 0 0 0 4 0 0 0 0 23 0 2029 0 37 0 0 0 0 3 0 0 0 0 22 0 2030 0 35 0 0 0 0 3 0 0 0 0 22 0 SubT 0 1184 0 0 0 0 229 11 0 0 0 561 0 11yr 0 216 0 0 0 0 12 1 0 0 0 162 0 Total 0 1400 0 0 0 0 240 12 0 0 0 722 0 --------------------------------- Capital ----------------------------------- Oper Total Net Cum Net Aband Cash Cum Cash Year Inc CEE CDE CCA COGPE Capital Rev Rev ARTC Cost SK Tax Flow Flow M$ M$ M$ M$ M$ M$ M$ M$ M$ M$ M$ M$ M$ 2011 5 0 0 0 0 0 5 5 0 0 0 5 5 2012 18 0 0 0 0 0 18 24 0 0 0 18 24 2013 20 0 0 0 0 0 20 44 0 0 0 20 44 2014 25 0 0 0 0 0 25 69 0 0 0 25 69 2015 32 0 0 0 0 0 32 100 0 0 0 32 100 2016 30 0 0 0 0 0 30 130 0 0 0 30 130 2017 28 0 0 0 0 0 28 159 0 0 0 28 159 2018 27 0 0 0 0 0 27 186 0 0 0 27 186 2019 26 0 0 0 0 0 26 211 0 0 0 26 211 2020 25 0 0 0 0 0 25 236 0 0 0 25 236 2021 23 0 0 0 0 0 23 259 0 0 0 23 259 2022 22 0 0 0 0 0 22 281 0 0 0 22 281 2023 20 0 0 0 0 0 20 301 0 0 0 20 301 2024 19 0 0 0 0 0 19 320 0 0 0 19 320 2025 18 0 0 0 0 0 18 338 0 0 0 18 338 2026 16 0 0 0 0 0 16 354 0 0 0 16 354 2027 15 0 0 0 0 0 15 369 0 0 0 15 369 2028 14 0 0 0 0 0 14 383 0 0 0 14 383 2029 12 0 0 0 0 0 12 395 0 0 0 12 395 2030 11 0 0 0 0 0 11 406 0 0 0 11 406 SubT 406 0 0 0 0 0 406 0 0 0 406 11yr 44 0 0 0 0 0 44 0 5 0 38 Total 449 0 0 0 0 0 449 0 5 0 444 ---------------------------- Discounted Cash Streams NPV (M$)----------------------------------discR% 5 10 12 15 18 20 25 BT Net 290 205 182 155 135 124 102 BT Cash Flow 288 205 182 155 135 124 102

111004 03:20 SAL V110831 Esc admin Default Scenario Eagleford Energy Inc. Consolidation 18388 1 of 1 H4 Table D-2B Probable Eagleford Energy Inc. Prod. Start: 2011-09-01 SUMMARY OF RESERVES AND NET PRESENT VALUE (As of Date: 2011-08-31) Reserves LtMed Heavy Solution Non-Assoc Pentanes Total Equiv Oil Oil Gas Assoc Gas Ethane Propane Butane Plus NGL Sulphur Oil Mbbl Mbbl MMcf MMcf Mbbl Mbbl Mbbl Mbbl Mbbl MLt Mboe Gross 0.0 0.0 0 1276 0.0 0.0 0.0 0.0 0.0 0.0 212.7 Co Grs 0.0 0.0 0 66 0.0 0.0 0.0 0.0 0.0 0.0 11.1 Co Net 0.0 0.0 0 49 0.0 0.0 0.0 0.0 0.0 0.0 8.2 Net Present Value Discount Total Net Before Tax ARTC Aband SK Tax Before Tax Rate Capital Net Rev Cap GCA Cost Overhead Cash Flow % M$ M$ M$ M$ M$ M$ 0.0 0 183 0 1 0 182 5.0 0 76 0 0 0 77 8.0 0 50 0 0 0 50 10.0 0 39 0 0 0 39 12.0 0 31 0 0 0 31 15.0 0 23 0 0 0 23 20.0 0 15 0 0 0 15 25.0 0 11 0 0 0 11 Reserve Life = 38.2 yrs Reserve Half Life = 19.4 yrs BOE Reserve Index = 90.4 YEARLY SUMMARY OF RESERVES AND NET PRESENT VALUE (As of Date: 2011-08-31) Oil Gas BOE BTax Comp Comp Comp Oil Gas Other Total Non- Lease Other Total Aband Cash Year Grs Grs Grs Rev Rev Rev Crown Crown Expen Expen Cap Etc Flow bbl/d Mcf/d boe/d M$ M$ M$ M$ M$ M$ M$ M$ M$ M$ 2011 0 2 0 0 1 0 0 0 0 0 0 0 0 2012 0 2 0 0 3 0 1 0 1 0 0 0 1 2013 0 3 0 0 5 0 1 0 2 0 0 0 1 2014 0 4 1 0 7 0 2 0 2 0 0 0 2 2015 0 4 1 0 10 0 4 0 3 0 0 0 3 2016 0 4 1 0 11 0 5 0 3 0 0 0 3 2017 0 5 1 0 12 0 5 0 3 0 0 0 3 2018 0 5 1 0 13 0 5 0 4 0 0 0 4 2019 0 5 1 0 13 0 6 0 4 0 0 0 4 2020 0 5 1 0 14 0 6 0 4 0 0 0 4 2021 0 5 1 0 15 0 6 0 4 0 0 0 4 2022 0 5 1 0 15 0 6 0 4 0 0 0 5 2023 0 5 1 0 15 0 6 0 4 0 0 0 5 2024 0 5 1 0 16 0 6 0 5 0 0 0 5 2025 0 5 1 0 16 0 6 0 5 0 0 0 6 2026 0 5 1 0 16 0 5 0 5 0 0 0 6 2027 0 5 1 0 16 0 5 0 5 0 0 0 6 2028 0 5 1 0 16 0 5 0 5 0 0 0 7 2029 0 5 1 0 16 0 5 0 5 0 0 0 7 2030 0 5 1 0 16 0 4 0 5 0 0 0 7 SubT 0 244 0 89 0 72 0 0 0 83 19yr 0 357 0 31 0 226 0 0 1 99 Total 0 601 0 120 0 298 0 0 1 182 Discounted 5% 0 236 0 63 0 97 0 0 0 77 Cash 10% 0 120 0 38 0 43 0 0 0 39 Streams 15% 0 73 0 26 0 24 0 0 0 23 20% 0 50 0 18 0 16 0 0 0 15
111004 03:20 SAL V110831 Esc admin Default Scenario Eagleford Energy Inc. Consolidation 18388 1 of 1 H1 Table D-2B Probable Eagleford Energy Inc. Prod. Start: 2011-09-01 PRODUCTION AND PRICE FORECAST (As of Date: 2011-08-31) Gas Gas Gas Gas Gas Gas Year Wells Daily Gross Co Grs Co Net Price Mcf/d MMcf MMcf MMcf $/Mcf 2011 0 34 4 0 0 3.70 2012 0 43 16 1 1 4.09 2013 0 57 21 1 1 4.56 2014 0 68 25 1 1 5.36 2015 0 77 28 1 1 6.58 2016 0 84 31 2 1 6.72 2017 0 90 33 2 1 6.86 2018 0 95 35 2 1 7.01 2019 0 98 36 2 1 7.15 2020 0 101 37 2 1 7.30 2021 0 103 38 2 1 7.46 2022 0 104 38 2 1 7.61 2023 0 104 38 2 1 7.76 2024 0 104 38 2 1 7.91 2025 0 103 38 2 1 8.06 2026 0 102 37 2 1 8.22 2027 0 101 37 2 1 8.38 2028 0 99 36 2 1 8.55 2029 0 97 35 2 1 8.71 2030 0 94 34 2 1 8.89 SubT 633 33 19 19yr 643 33 30 Total 1276 66 49
111004 03:20 SAL V110831 Esc admin Default Scenario Eagleford Energy Inc. Consolidation 18388 1 of 1 H2 Table D-2B Probable Eagleford Energy Inc. Prod. Start: 2011-09-01 SUMMARY OF RESERVES AND NET PRESENT VALUE (As of Date: 2011-08-31) ------------------------------------------ Revenue ---------------------------------------- ------------------------------- Royalties ------------------------------------ NPI/ Other FH/ Min Other Year Oil Gas NGL Sul Roy Income Crown Adjust Indian ORR Taxes Opex Expense M$ M$ M$ M$ M$ M$ M$ M$ M$ M$ M$ M$ M$ 2011 0 1 0 0 0 0 0 0 0 0 0 0 0 2012 0 3 0 0 0 0 1 0 0 0 0 1 0 2013 0 5 0 0 0 0 2 0 0 0 0 2 0 2014 0 7 0 0 0 0 2 0 0 0 0 2 0 2015 0 10 0 0 0 0 4 0 0 0 0 3 0 2016 0 11 0 0 0 0 5 0 0 0 0 3 0 2017 0 12 0 0 0 0 5 0 0 0 0 3 0 2018 0 13 0 0 0 0 6 0 0 0 0 4 0 2019 0 13 0 0 0 0 6 0 0 0 0 4 0 2020 0 14 0 0 0 0 6 0 0 0 0 4 0 2021 0 15 0 0 0 0 6 0 0 0 0 4 0 2022 0 15 0 0 0 0 6 0 0 0 0 4 0 2023 0 15 0 0 0 0 6 0 0 0 0 4 0 2024 0 16 0 0 0 0 6 0 0 0 0 5 0 2025 0 16 0 0 0 0 6 0 0 0 0 5 0 2026 0 16 0 0 0 0 6 0 0 0 0 5 0 2027 0 16 0 0 0 0 5 0 0 0 0 5 0 2028 0 16 0 0 0 0 5 0 0 0 0 5 0 2029 0 16 0 0 0 0 5 0 0 0 0 5 0 2030 0 16 0 0 0 0 4 0 0 0 0 5 0 SubT 0 244 0 0 0 0 93 4 0 0 0 72 0 19yr 0 357 0 0 0 0 32 1 0 0 0 226 0 Total 0 601 0 0 0 0 126 6 0 0 0 298 0 --------------------------------- Capital ----------------------------------- Oper Total Net Cum Net Aband Cash Cum Cash Year Inc CEE CDE CCA COGPE Capital Rev Rev ARTC Cost SK Tax Flow Flow M$ M$ M$ M$ M$ M$ M$ M$ M$ M$ M$ M$ M$ 2011 0 0 0 0 0 0 0 0 0 0 0 0 0 2012 1 0 0 0 0 0 1 1 0 0 0 1 1 2013 1 0 0 0 0 0 1 3 0 0 0 1 3 2014 2 0 0 0 0 0 2 5 0 0 0 2 5 2015 3 0 0 0 0 0 3 8 0 0 0 3 8 2016 3 0 0 0 0 0 3 10 0 0 0 3 10 2017 3 0 0 0 0 0 3 14 0 0 0 3 14 2018 4 0 0 0 0 0 4 17 0 0 0 4 17 2019 4 0 0 0 0 0 4 21 0 0 0 4 21 2020 4 0 0 0 0 0 4 25 0 0 0 4 25 2021 4 0 0 0 0 0 4 29 0 0 0 4 29 2022 5 0 0 0 0 0 5 34 0 0 0 5 34 2023 5 0 0 0 0 0 5 39 0 0 0 5 39 2024 5 0 0 0 0 0 5 44 0 0 0 5 44 2025 6 0 0 0 0 0 6 50 0 0 0 6 50 2026 6 0 0 0 0 0 6 56 0 0 0 6 56 2027 6 0 0 0 0 0 6 62 0 0 0 6 62 2028 7 0 0 0 0 0 7 69 0 0 0 7 69 2029 7 0 0 0 0 0 7 76 0 0 0 7 76 2030 7 0 0 0 0 0 7 83 0 0 0 7 83 SubT 83 0 0 0 0 0 83 0 0 0 83 19yr 100 0 0 0 0 0 100 0 1 0 99 Total 183 0 0 0 0 0 183 0 1 0 182 ---------------------------- Discounted Cash Streams NPV (M$)----------------------------------discR% 5 10 12 15 18 20 25 BT Net 76 39 31 23 18 15 11 BT Cash Flow 77 39 31 23 18 15 11
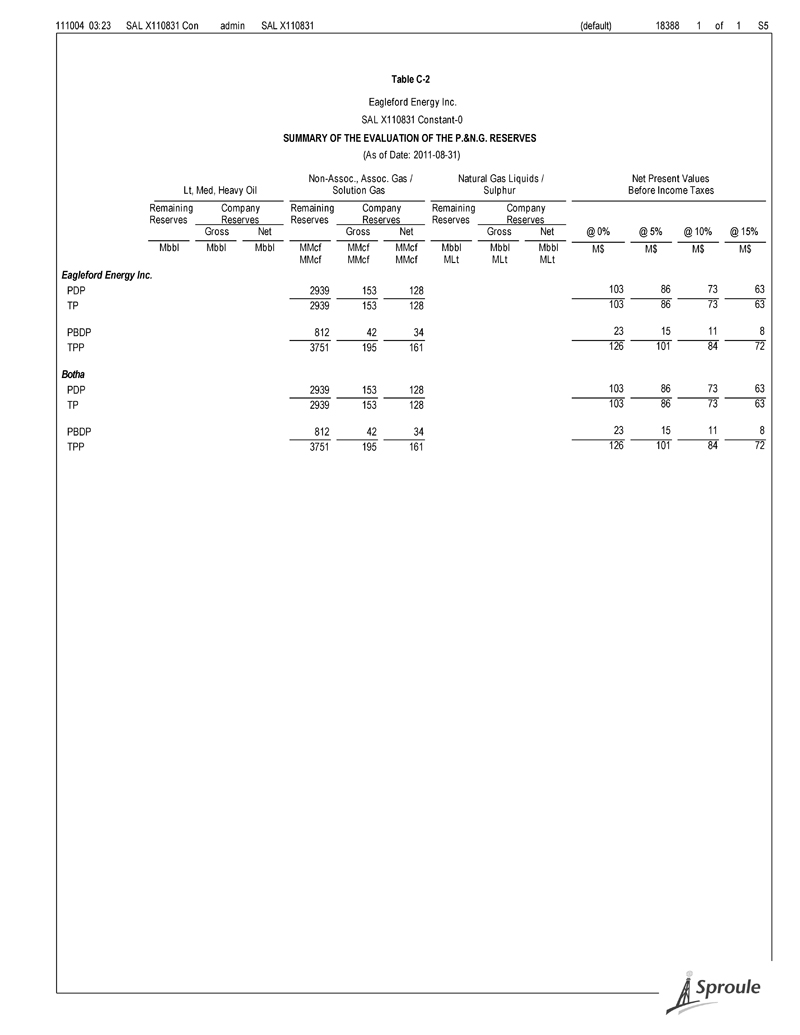
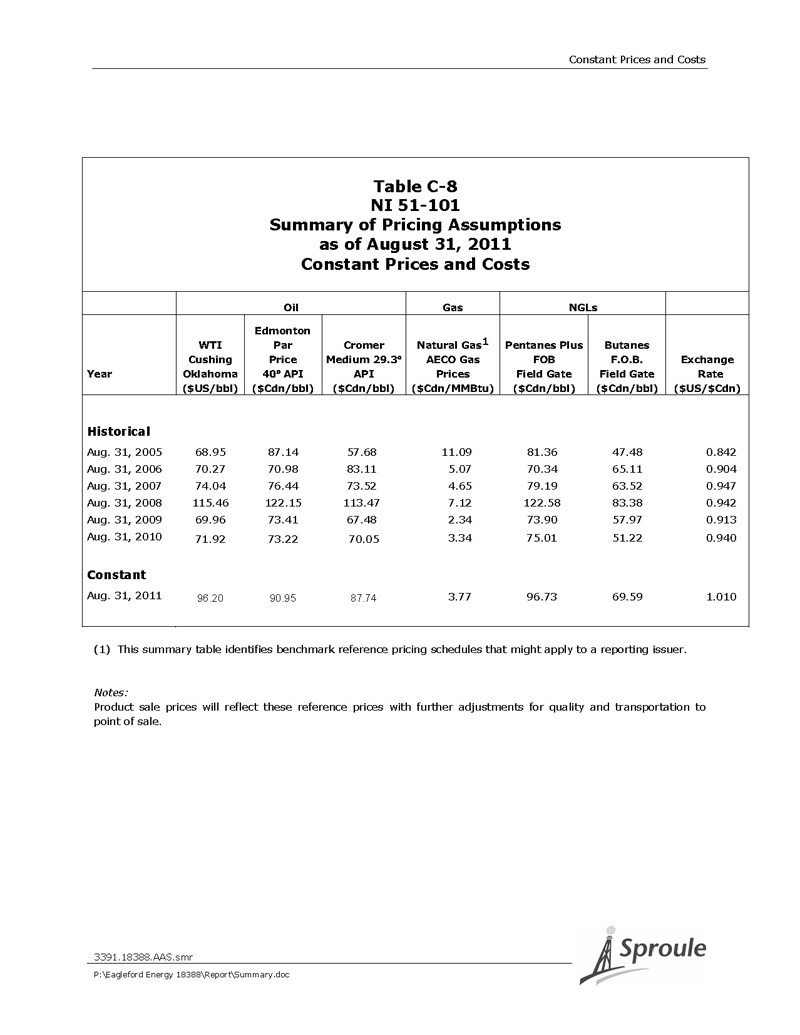
Constant Prices and Costs Constant Prices and Costs The constant price used in this report complies with the Securities & Exchange Commission’s (SEC) regulations. It was calculated as the unweighted arithmetic average of the first-day-of-the-month price for each month within the 12-month period prior to the end of the reporting period. Table C-1, on the following page, summarizes our evaluation, based on constant prices and costs, before income taxes, of the P&NG reserves of Eagleford Energy Inc., as of August 31, 2011. The table presents summaries of the P&NG reserves for the various reserves categories valuation. Table C-2 is also included and summarizes the reserves and values by property for the constant price case, before income taxes. Tables C-3 through C-3B show the cash flow forecasts for the constant price case for the various reserves categories. The natural gas constant price used in this specific evaluation was based on the August 31, 2011 actual posted price as determined by Sproule. The constant price used in this report is as follows: Natural Gas: AECO-C Spot 3.77 $/MMbtu Appropriate adjustments have been made to the natural gas price to account for quality and transportation, and to reflect actual historical prices received for each property. This blending of constant prices may result in the appearance of varying constant prices in the Corporate cash flows. The remaining assumptions relating to the calculation and evaluation of the reserves are the same as those presented in the detailed evaluation. It is important to note that the estimate of the reserves to be recovered from a gas field is the sum of all the cumulative production until an economic limit is reached. The economic limit is a function of the production forecast, future prices and operating costs (including royalties and taxes) to maintain production. Consequently, when estimates of future prices and costs are changed, economic limits are also altered. In the evaluation process, production forecasts are truncated at the economic limits and thus, reserves estimates vary 3391.18388.AAS.smr P:\Eagleford Energy 18388\Report\Summary.doc
Constant Prices and Costs with price and cost sensitivities, as is the case between forecast and constant prices and cost forecasts. Also, some entities may have reserves assigned to them under one price and cost scenario, but under less favourable price and cost projections, the net present values of the hydrocarbons that could be recovered may not be sufficient to offset the capital investment. Those entities whose undiscounted net present value became negative under less favourable price and cost projections were not included in the summary tables. The values of the reserves presented in this constant price and cost evaluation should not be taken out of context, as they were prepared to comply with the Securities & Exchange Commission’s (SEC) regulations; therefore, they do not reflect our opinion of the market value of these reserves. Table C-4 presents a summary of the various reserves categories. Table C-5 presents a summary of net present values of future net revenue, before income taxes. Table C-6 presents the total future net revenue (undiscounted) for the total proved and total proved plus probable reserves categories. Table C-7 presents the net present value of future net revenue by production group for the total proved and total proved plus probable reserves categories. Table C-8 presents the summary of pricing assumptions for constant prices and costs. 3391.18388.AAS.smr P:\Eagleford Energy 18388\Report\Summary.doc
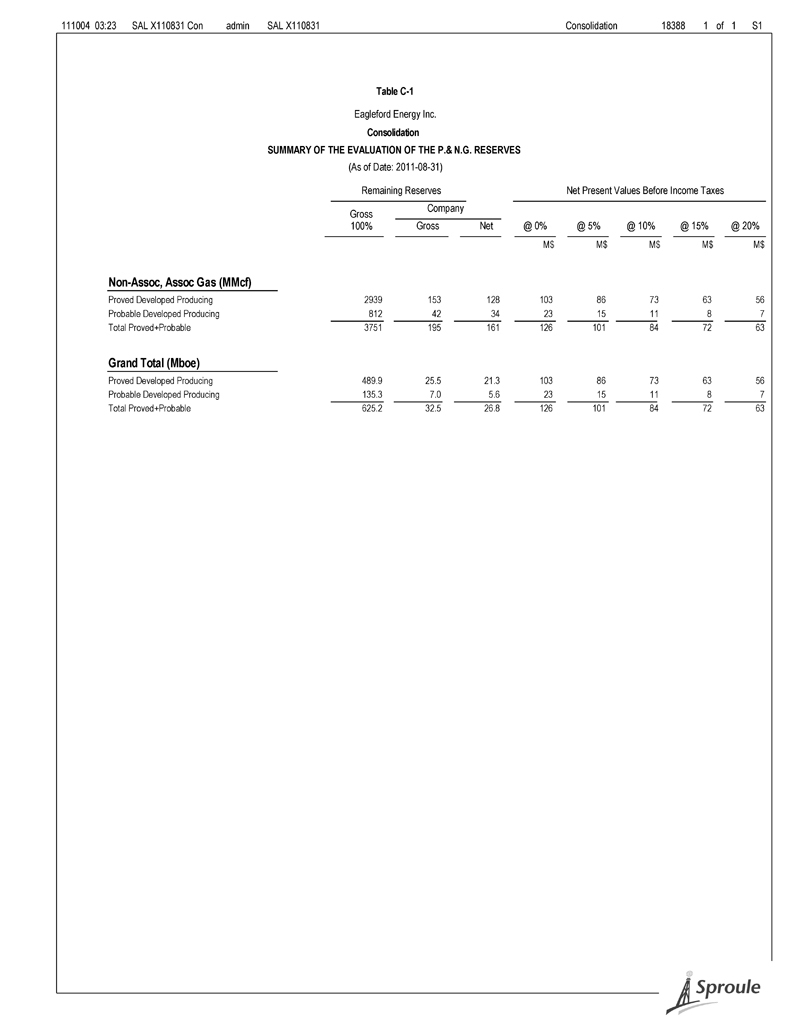
111004 03:23 SAL X110831 Con admin SAL X110831 Consolidation 18388 1 of 1 S1 Table C-1 Eagleford Energy Inc. Consolidation SUMMARY OF THE EVALUATION OF THE P.& N.G. RESERVES (As of Date: 2011-08-31) Remaining Reserves Net Present Values Before Income Taxes Company Gross 100% Gross Net @ 0% @ 5% @ 10% @ 15% @ 20% M$ M$ M$ M$ M$ Non-Assoc, Assoc Gas (MMcf) Proved Developed Producing 2939 153 128 103 86 73 63 56 Probable Developed Producing 812 42 34 23 15 11 8 7 Total Proved+Probable 3751 195 161 126 101 84 72 63 Grand Total (Mboe) Proved Developed Producing 489.9 25.5 21.3 103 86 73 63 56 Probable Developed Producing 135.3 7.0 5.6 23 15 11 8 7 Total Proved+Probable 625.2 32.5 26.8 126 101 84 72 63
(default) 18388 1 of 1 S5 Table C-2 Eagleford Energy Inc. SAL X110831 Constant-0 SUMMARY OF THE EVALUATION OF THE P.&N.G. RESERVES (As of Date: 2011-08-31) Non-Assoc., Assoc. Gas / Natural Gas Liquids / Net Present Values Lt, Med, Heavy Oil Solution Gas Sulphur Before Income Taxes Remaining Company Remaining Company Remaining Company Reserves Reserves Reserves Reserves Reserves Reserves Gross Net Gross Net Gross Net @ 0% @ 5% @ 10% @ 15% Mbbl Mbbl Mbbl MMcf MMcf MMcf Mbbl Mbbl Mbbl M$ M$ M$ M$ MMcf MMcf MMcf MLt MLt MLt Eagleford Energy Inc. PDP 2939 153 128 103 86 73 63 TP 2939 153 128 103 86 73 63 PBDP 812 42 34 23 15 11 8 TPP 3751 195 161 126 101 84 72 Botha PDP 2939 153 128 103 86 73 63 TP 2939 153 128 103 86 73 63 PBDP 812 42 34 23 15 11 8 TPP 3751 195 161 126 101 84 72
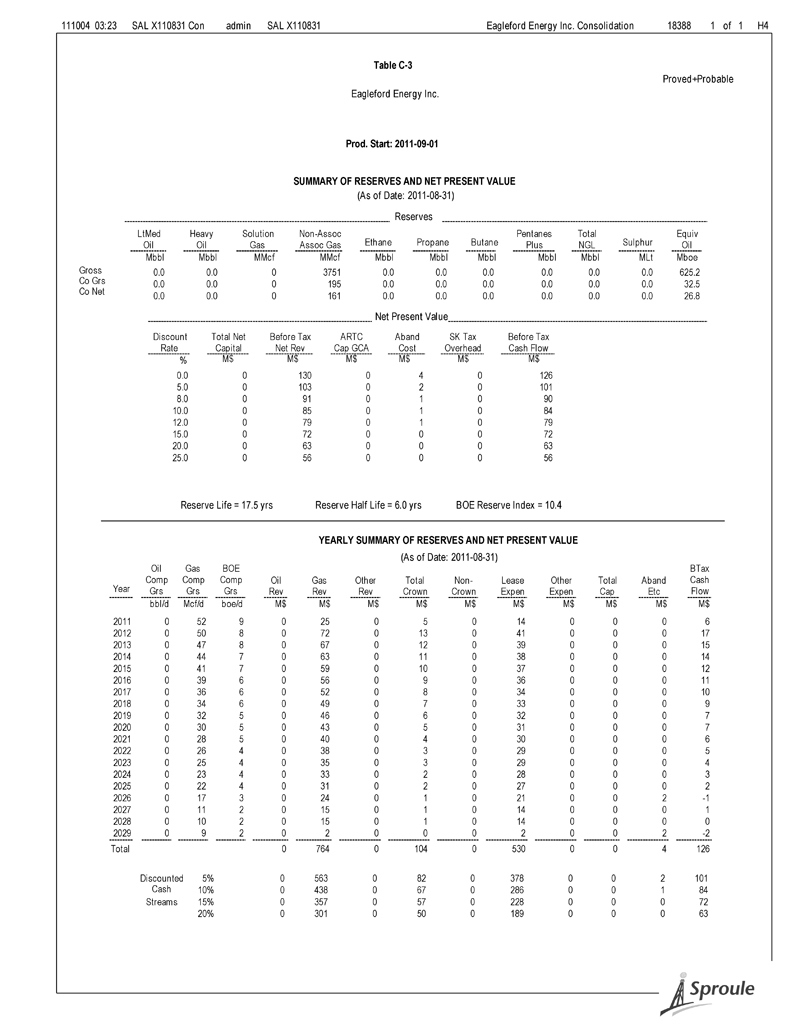
111004 03:23 SAL X110831 Con admin SAL X110831 Eagleford Energy Inc. Consolidation 18388 1 of 1 H4 Table C-3 Proved+Probable Eagleford Energy Inc. Prod. Start: 2011-09-01 SUMMARY OF RESERVES AND NET PRESENT VALUE (As of Date: 2011-08-31) Reserves LtMed Heavy Solution Non-Assoc Pentanes Total Equiv Oil Oil Gas Assoc Gas Ethane Propane Butane Plus NGL Sulphur Oil Mbbl Mbbl MMcf MMcf Mbbl Mbbl Mbbl Mbbl Mbbl MLt Mboe Gross 0.0 0.0 0 3751 0.0 0.0 0.0 0.0 0.0 0.0 625.2 Co Grs 0.0 0.0 0 195 0.0 0.0 0.0 0.0 0.0 0.0 32.5 Co Net 0.0 0.0 0 161 0.0 0.0 0.0 0.0 0.0 0.0 26.8 Net Present Value Discount Total Net Before Tax ARTC Aband SK Tax Before Tax Rate Capital Net Rev Cap GCA Cost Overhead Cash Flow % M$ M$ M$ M$ M$ M$ 0.0 0 130 0 4 0 126 5.0 0 103 0 2 0 101 8.0 0 91 0 1 0 90 10.0 0 85 0 1 0 84 12.0 0 79 0 1 0 79 15.0 0 72 0 0 0 72 20.0 0 63 0 0 0 63 25.0 0 56 0 0 0 56 Reserve Life = 17.5 yrs Reserve Half Life = 6.0 yrs BOE Reserve Index = 10.4 YEARLY SUMMARY OF RESERVES AND NET PRESENT VALUE (As of Date: 2011-08-31) Oil Gas BOE BTax Comp Comp Comp Oil Gas Other Total Non- Lease Other Total Aband Cash Year Grs Grs Grs Rev Rev Rev Crown Crown Expen Expen Cap Etc Flow bbl/d Mcf/d boe/d M$ M$ M$ M$ M$ M$ M$ M$ M$ M$ 2011 0 52 9 0 25 0 5 0 14 0 0 0 6 2012 0 50 8 0 72 0 13 0 41 0 0 0 17 2013 0 47 8 0 67 0 12 0 39 0 0 0 15 2014 0 44 7 0 63 0 11 0 38 0 0 0 14 2015 0 41 7 0 59 0 10 0 37 0 0 0 12 2016 0 39 6 0 56 0 9 0 36 0 0 0 11 2017 0 36 6 0 52 0 8 0 34 0 0 0 10 2018 0 34 6 0 49 0 7 0 33 0 0 0 9 2019 0 32 5 0 46 0 6 0 32 0 0 0 7 2020 0 30 5 0 43 0 5 0 31 0 0 0 7 2021 0 28 5 0 40 0 4 0 30 0 0 0 6 2022 0 26 4 0 38 0 3 0 29 0 0 0 5 2023 0 25 4 0 35 0 3 0 29 0 0 0 4 2024 0 23 4 0 33 0 2 0 28 0 0 0 3 2025 0 22 4 0 31 0 2 0 27 0 0 0 2 2026 0 17 3 0 24 0 1 0 21 0 0 2 -1 2027 0 11 2 0 15 0 1 0 14 0 0 0 1 2028 0 10 2 0 15 0 1 0 14 0 0 0 0 2029 0 9 2 0 2 0 0 0 2 0 0 2 -2 Total 0 764 0 104 0 530 0 0 4 126 Discounted 5% 0 563 0 82 0 378 0 0 2 101 Cash 10% 0 438 0 67 0 286 0 0 1 84 Streams 15% 0 357 0 57 0 228 0 0 0 72 20% 0 301 0 50 0 189 0 0 0 63

111004 03:23 SAL X110831 Con admin SAL X110831 Eagleford Energy Inc. Consolidation 18388 1 of 1 H1 Table C-3 Proved+Probable Eagleford Energy Inc. Prod. Start: 2011-09-01 PRODUCTION AND PRICE FORECAST (As of Date: 2011-08-31) Gas Gas Gas Gas Gas Gas Year Wells Daily Gross Co Grs Co Net Price Mcf/d MMcf MMcf MMcf $/Mcf 2011 2 1007 123 6 5 3.92 2012 2 965 353 18 14 3.92 2013 2 904 330 17 13 3.92 2014 2 848 309 16 12 3.92 2015 2 795 290 15 12 3.92 2016 2 745 273 14 11 3.92 2017 2 698 255 13 11 3.92 2018 2 655 239 12 10 3.92 2019 2 614 224 12 10 3.92 2020 2 575 211 11 9 3.92 2021 2 539 197 10 9 3.92 2022 2 506 185 10 8 3.92 2023 2 474 173 9 8 3.92 2024 2 445 163 8 8 3.92 2025 2 417 152 8 7 3.92 2026 2 320 117 6 6 3.92 2027 1 207 76 4 4 3.92 2028 1 195 71 4 3 3.92 2029 1 183 11 1 1 3.92 Total 3751 195 161
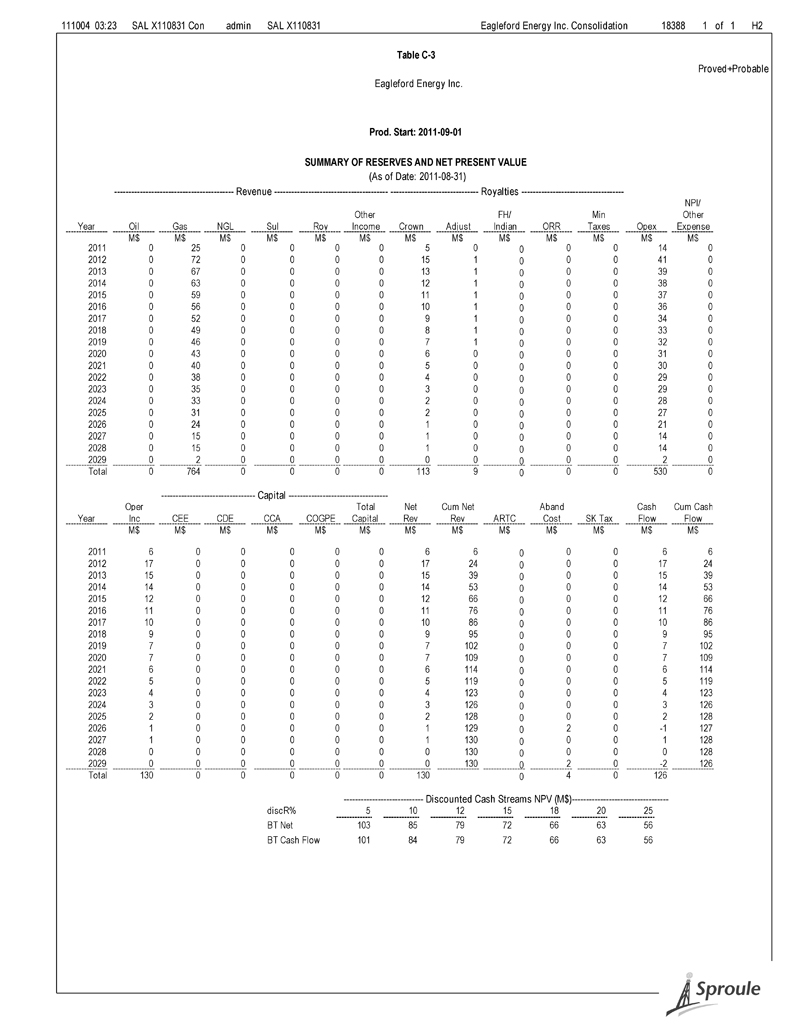
111004 03:23 SAL X110831 Con admin SAL X110831 Eagleford Energy Inc. Consolidation 18388 1 of 1 H2 Table C-3 Proved+Probable Eagleford Energy Inc. Prod. Start: 2011-09-01 SUMMARY OF RESERVES AND NET PRESENT VALUE (As of Date: 2011-08-31) ------------------------------------------ Revenue ---------------------------------------- ------------------------------- Royalties ------------------------------------ NPI/ Other FH/ Min Other Year Oil Gas NGL Sul Roy Income Crown Adjust Indian ORR Taxes Opex Expense M$ M$ M$ M$ M$ M$ M$ M$ M$ M$ M$ M$ M$ 2011 0 25 0 0 0 0 5 0 0 0 0 14 0 2012 0 72 0 0 0 0 15 1 0 0 0 41 0 2013 0 67 0 0 0 0 13 1 0 0 0 39 0 2014 0 63 0 0 0 0 12 1 0 0 0 38 0 2015 0 59 0 0 0 0 11 1 0 0 0 37 0 2016 0 56 0 0 0 0 10 1 0 0 0 36 0 2017 0 52 0 0 0 0 9 1 0 0 0 34 0 2018 0 49 0 0 0 0 8 1 0 0 0 33 0 2019 0 46 0 0 0 0 7 1 0 0 0 32 0 2020 0 43 0 0 0 0 6 0 0 0 0 31 0 2021 0 40 0 0 0 0 5 0 0 0 0 30 0 2022 0 38 0 0 0 0 4 0 0 0 0 29 0 2023 0 35 0 0 0 0 3 0 0 0 0 29 0 2024 0 33 0 0 0 0 2 0 0 0 0 28 0 2025 0 31 0 0 0 0 2 0 0 0 0 27 0 2026 0 24 0 0 0 0 1 0 0 0 0 21 0 2027 0 15 0 0 0 0 1 0 0 0 0 14 0 2028 0 15 0 0 0 0 1 0 0 0 0 14 0 2029 0 2 0 0 0 0 0 0 0 0 0 2 0 Total 0 764 0 0 0 0 113 9 0 0 0 530 0 --------------------------------- Capital ----------------------------------- Oper Total Net Cum Net Aband Cash Cum Cash Year Inc CEE CDE CCA COGPE Capital Rev Rev ARTC Cost SK Tax Flow Flow M$ M$ M$ M$ M$ M$ M$ M$ M$ M$ M$ M$ M$ 2011 6 0 0 0 0 0 6 6 0 0 0 6 6 2012 17 0 0 0 0 0 17 24 0 0 0 17 24 2013 15 0 0 0 0 0 15 39 0 0 0 15 39 2014 14 0 0 0 0 0 14 53 0 0 0 14 53 2015 12 0 0 0 0 0 12 66 0 0 0 12 66 2016 11 0 0 0 0 0 11 76 0 0 0 11 76 2017 10 0 0 0 0 0 10 86 0 0 0 10 86 2018 9 0 0 0 0 0 9 95 0 0 0 9 95 2019 7 0 0 0 0 0 7 102 0 0 0 7 102 2020 7 0 0 0 0 0 7 109 0 0 0 7 109 2021 6 0 0 0 0 0 6 114 0 0 0 6 114 2022 5 0 0 0 0 0 5 119 0 0 0 5 119 2023 4 0 0 0 0 0 4 123 0 0 0 4 123 2024 3 0 0 0 0 0 3 126 0 0 0 3 126 2025 2 0 0 0 0 0 2 128 0 0 0 2 128 2026 1 0 0 0 0 0 1 129 0 2 0 -1 127 2027 1 0 0 0 0 0 1 130 0 0 0 1 128 2028 0 0 0 0 0 0 0 130 0 0 0 0 128 2029 0 0 0 0 0 0 0 130 0 2 0 -2 126 Total 130 0 0 0 0 0 130 0 4 0 126 ---------------------------- Discounted Cash Streams NPV (M$)----------------------------------discR% 5 10 12 15 18 20 25 BT Net 103 85 79 72 66 63 56 BT Cash Flow 101 84 79 72 66 63 56
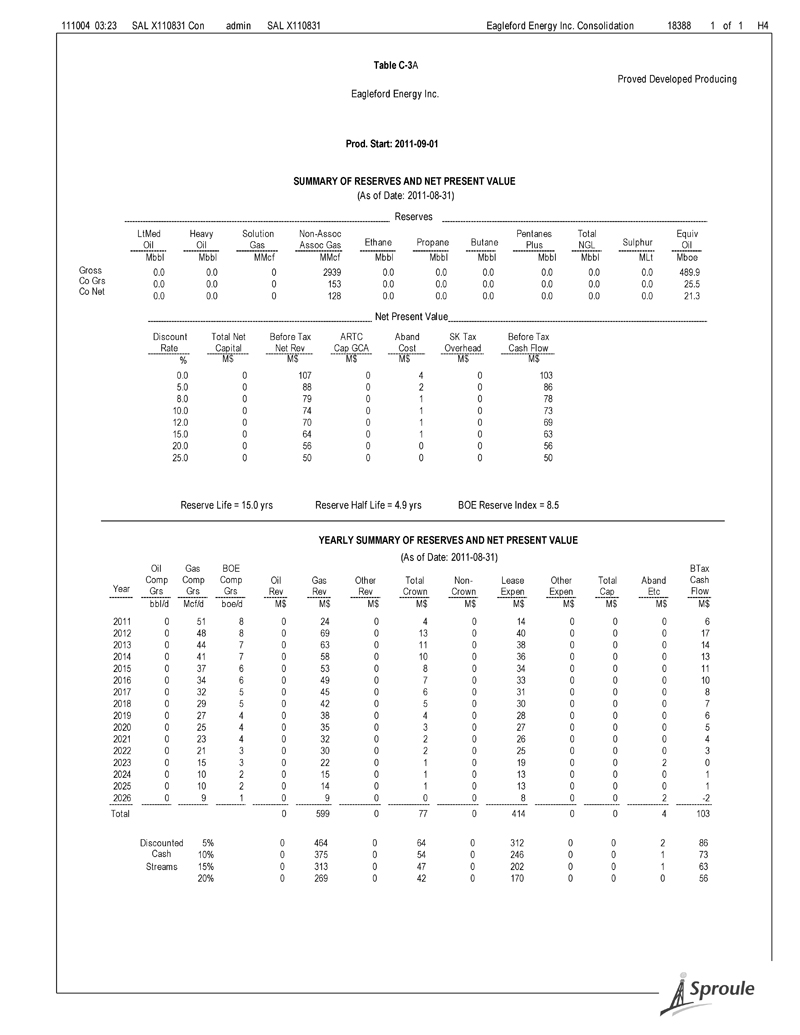
111004 03:23 SAL X110831 Con admin SAL X110831 Eagleford Energy Inc. Consolidation 18388 1 of 1 H4 Table C-3A Proved Developed Producing Eagleford Energy Inc. Prod. Start: 2011-09-01 SUMMARY OF RESERVES AND NET PRESENT VALUE (As of Date: 2011-08-31) Reserves LtMed Heavy Solution Non-Assoc Pentanes Total Equiv Oil Oil Gas Assoc Gas Ethane Propane Butane Plus NGL Sulphur Oil Mbbl Mbbl MMcf MMcf Mbbl Mbbl Mbbl Mbbl Mbbl MLt Mboe Gross 0.0 0.0 0 2939 0.0 0.0 0.0 0.0 0.0 0.0 489.9 Co Grs 0.0 0.0 0 153 0.0 0.0 0.0 0.0 0.0 0.0 25.5 Co Net 0.0 0.0 0 128 0.0 0.0 0.0 0.0 0.0 0.0 21.3 Net Present Value Discount Total Net Before Tax ARTC Aband SK Tax Before Tax Rate Capital Net Rev Cap GCA Cost Overhead Cash Flow % M$ M$ M$ M$ M$ M$ 0.0 0 107 0 4 0 103 5.0 0 88 0 2 0 86 8.0 0 79 0 1 0 78 10.0 0 74 0 1 0 73 12.0 0 70 0 1 0 69 15.0 0 64 0 1 0 63 20.0 0 56 0 0 0 56 25.0 0 50 0 0 0 50 Reserve Life = 15.0 yrs Reserve Half Life = 4.9 yrs BOE Reserve Index = 8.5 YEARLY SUMMARY OF RESERVES AND NET PRESENT VALUE (As of Date: 2011-08-31) Oil Gas BOE BTax Comp Comp Comp Oil Gas Other Total Non- Lease Other Total Aband Cash Year Grs Grs Grs Rev Rev Rev Crown Crown Expen Expen Cap Etc Flow bbl/d Mcf/d boe/d M$ M$ M$ M$ M$ M$ M$ M$ M$ M$ 2011 0 51 8 0 24 0 4 0 14 0 0 0 6 2012 0 48 8 0 69 0 13 0 40 0 0 0 17 2013 0 44 7 0 63 0 11 0 38 0 0 0 14 2014 0 41 7 0 58 0 10 0 36 0 0 0 13 2015 0 37 6 0 53 0 8 0 34 0 0 0 11 2016 0 34 6 0 49 0 7 0 33 0 0 0 10 2017 0 32 5 0 45 0 6 0 31 0 0 0 8 2018 0 29 5 0 42 0 5 0 30 0 0 0 7 2019 0 27 4 0 38 0 4 0 28 0 0 0 6 2020 0 25 4 0 35 0 3 0 27 0 0 0 5 2021 0 23 4 0 32 0 2 0 26 0 0 0 4 2022 0 21 3 0 30 0 2 0 25 0 0 0 3 2023 0 15 3 0 22 0 1 0 19 0 0 2 0 2024 0 10 2 0 15 0 1 0 13 0 0 0 1 2025 0 10 2 0 14 0 1 0 13 0 0 0 1 2026 0 9 1 0 9 0 0 0 8 0 0 2 -2 Total 0 599 0 77 0 414 0 0 4 103 Discounted 5% 0 464 0 64 0 312 0 0 2 86 Cash 10% 0 375 0 54 0 246 0 0 1 73 Streams 15% 0 313 0 47 0 202 0 0 1 63 20% 0 269 0 42 0 170 0 0 0 56
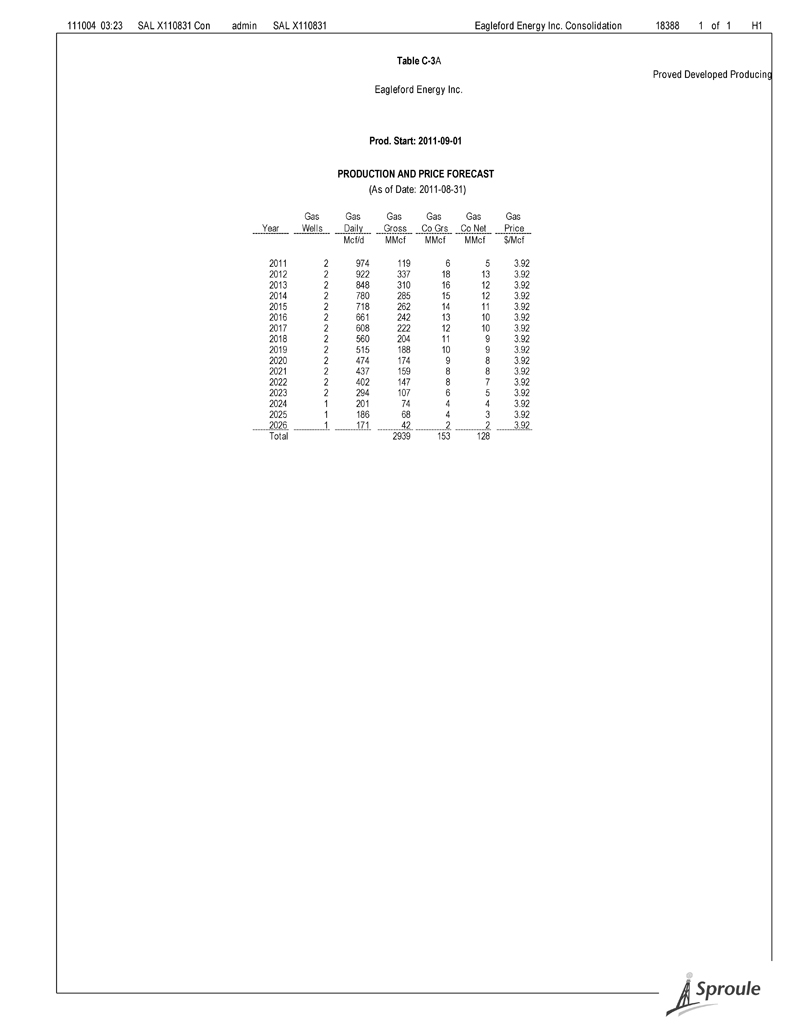
111004 03:23 SAL X110831 Con admin SAL X110831 Eagleford Energy Inc. Consolidation 18388 1 of 1 H1 Table C-3A Proved Developed Producing Eagleford Energy Inc. Prod. Start: 2011-09-01 PRODUCTION AND PRICE FORECAST (As of Date: 2011-08-31) Gas Gas Gas Gas Gas Gas Year Wells Daily Gross Co Grs Co Net Price Mcf/d MMcf MMcf MMcf $/Mcf 2011 2 974 119 6 5 3.92 2012 2 922 337 18 13 3.92 2013 2 848 310 16 12 3.92 2014 2 780 285 15 12 3.92 2015 2 718 262 14 11 3.92 2016 2 661 242 13 10 3.92 2017 2 608 222 12 10 3.92 2018 2 560 204 11 9 3.92 2019 2 515 188 10 9 3.92 2020 2 474 174 9 8 3.92 2021 2 437 159 8 8 3.92 2022 2 402 147 8 7 3.92 2023 2 294 107 6 5 3.92 2024 1 201 74 4 4 3.92 2025 1 186 68 4 3 3.92 2026 1 171 42 2 2 3.92 Total 2939 153 128
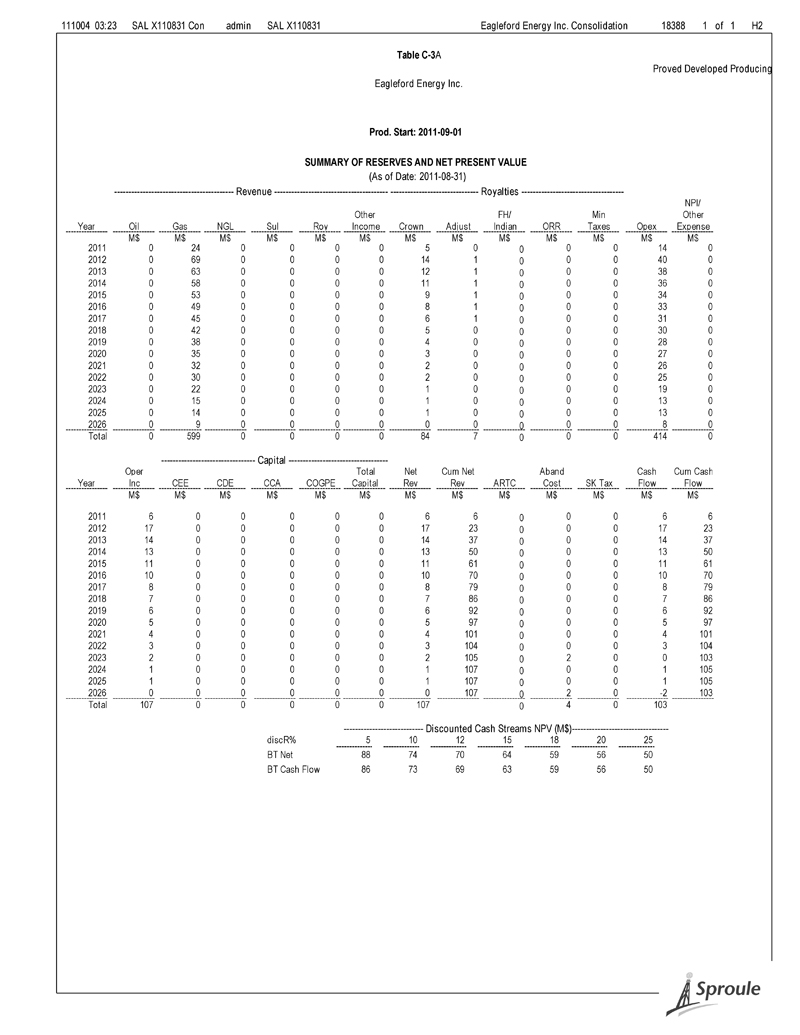
111004 03:23 SAL X110831 Con admin SAL X110831 Eagleford Energy Inc. Consolidation 18388 1 of 1 H2 Table C-3A Proved Developed Producing Eagleford Energy Inc. Prod. Start: 2011-09-01 SUMMARY OF RESERVES AND NET PRESENT VALUE (As of Date: 2011-08-31) ------------------------------------------ Revenue ---------------------------------------- ------------------------------- Royalties ------------------------------------ NPI/ Other FH/ Min Other Year Oil Gas NGL Sul Roy Income Crown Adjust Indian ORR Taxes Opex Expense M$ M$ M$ M$ M$ M$ M$ M$ M$ M$ M$ M$ M$ 2011 0 24 0 0 0 0 5 0 0 0 0 14 0 2012 0 69 0 0 0 0 14 1 0 0 0 40 0 2013 0 63 0 0 0 0 12 1 0 0 0 38 0 2014 0 58 0 0 0 0 11 1 0 0 0 36 0 2015 0 53 0 0 0 0 9 1 0 0 0 34 0 2016 0 49 0 0 0 0 8 1 0 0 0 33 0 2017 0 45 0 0 0 0 6 1 0 0 0 31 0 2018 0 42 0 0 0 0 5 0 0 0 0 30 0 2019 0 38 0 0 0 0 4 0 0 0 0 28 0 2020 0 35 0 0 0 0 3 0 0 0 0 27 0 2021 0 32 0 0 0 0 2 0 0 0 0 26 0 2022 0 30 0 0 0 0 2 0 0 0 0 25 0 2023 0 22 0 0 0 0 1 0 0 0 0 19 0 2024 0 15 0 0 0 0 1 0 0 0 0 13 0 2025 0 14 0 0 0 0 1 0 0 0 0 13 0 2026 0 9 0 0 0 0 0 0 0 0 0 8 0 Total 0 599 0 0 0 0 84 7 0 0 0 414 0 --------------------------------- Capital ----------------------------------- Oper Total Net Cum Net Aband Cash Cum Cash Year Inc CEE CDE CCA COGPE Capital Rev Rev ARTC Cost SK Tax Flow Flow M$ M$ M$ M$ M$ M$ M$ M$ M$ M$ M$ M$ M$ 2011 6 0 0 0 0 0 6 6 0 0 0 6 6 2012 17 0 0 0 0 0 17 23 0 0 0 17 23 2013 14 0 0 0 0 0 14 37 0 0 0 14 37 2014 13 0 0 0 0 0 13 50 0 0 0 13 50 2015 11 0 0 0 0 0 11 61 0 0 0 11 61 2016 10 0 0 0 0 0 10 70 0 0 0 10 70 2017 8 0 0 0 0 0 8 79 0 0 0 8 79 2018 7 0 0 0 0 0 7 86 0 0 0 7 86 2019 6 0 0 0 0 0 6 92 0 0 0 6 92 2020 5 0 0 0 0 0 5 97 0 0 0 5 97 2021 4 0 0 0 0 0 4 101 0 0 0 4 101 2022 3 0 0 0 0 0 3 104 0 0 0 3 104 2023 2 0 0 0 0 0 2 105 0 2 0 0 103 2024 1 0 0 0 0 0 1 107 0 0 0 1 105 2025 1 0 0 0 0 0 1 107 0 0 0 1 105 2026 0 0 0 0 0 0 0 107 0 2 0 -2 103 Total 107 0 0 0 0 0 107 0 4 0 103 ---------------------------- Discounted Cash Streams NPV (M$)----------------------------------discR% 5 10 12 15 18 20 25 BT Net 88 74 70 64 59 56 50 BT Cash Flow 86 73 69 63 59 56 50
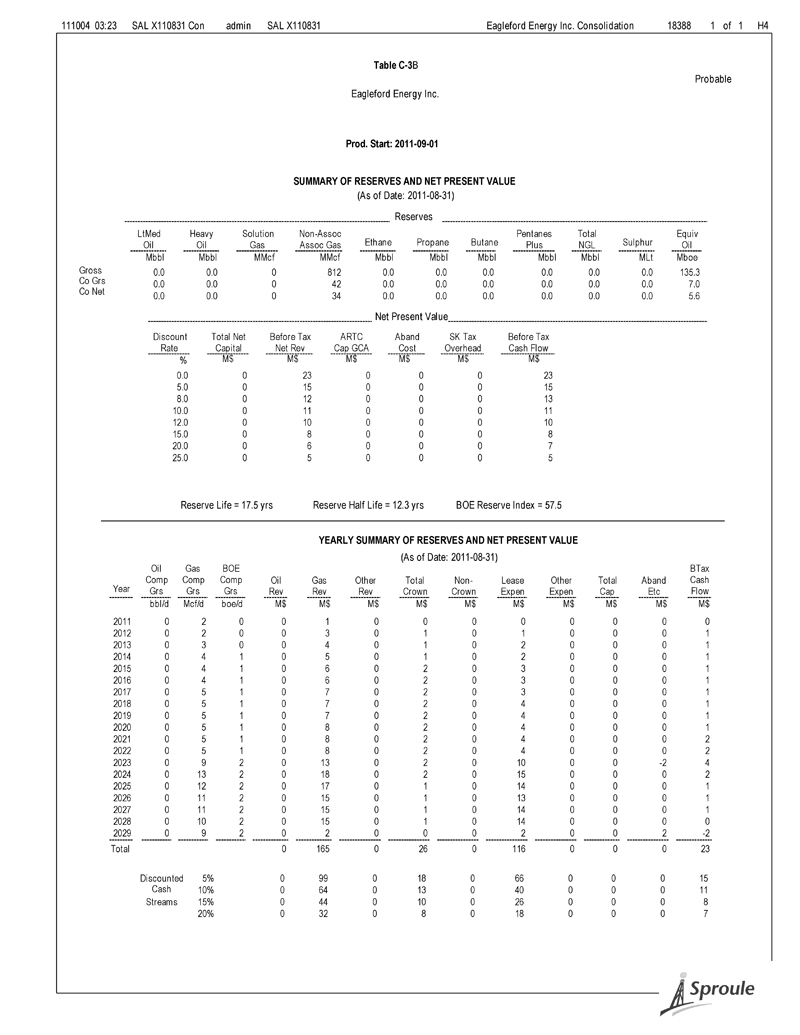
111004 03:23 SAL X110831 Con admin SAL X110831 Eagleford Energy Inc. Consolidation 18388 1 of 1 H4 Table C-3B Probable Eagleford Energy Inc. Prod. Start: 2011-09-01 SUMMARY OF RESERVES AND NET PRESENT VALUE (As of Date: 2011-08-31) Reserves LtMed Heavy Solution Non-Assoc Pentanes Total Equiv Oil Oil Gas Assoc Gas Ethane Propane Butane Plus NGL Sulphur Oil Mbbl Mbbl MMcf MMcf Mbbl Mbbl Mbbl Mbbl Mbbl MLt Mboe Gross 0.0 0.0 0 812 0.0 0.0 0.0 0.0 0.0 0.0 135.3 Co Grs 0.0 0.0 0 42 0.0 0.0 0.0 0.0 0.0 0.0 7.0 Co Net 0.0 0.0 0 34 0.0 0.0 0.0 0.0 0.0 0.0 5.6 Net Present Value Discount Total Net Before Tax ARTC Aband SK Tax Before Tax Rate Capital Net Rev Cap GCA Cost Overhead Cash Flow % M$ M$ M$ M$ M$ M$ 0.0 0 23 0 0 0 23 5.0 0 15 0 0 0 15 8.0 0 12 0 0 0 13 10.0 0 11 0 0 0 11 12.0 0 10 0 0 0 10 15.0 0 8 0 0 0 8 20.0 0 6 0 0 0 7 25.0 0 5 0 0 0 5 Reserve Life = 17.5 yrs Reserve Half Life = 12.3 yrs BOE Reserve Index = 57.5 YEARLY SUMMARY OF RESERVES AND NET PRESENT VALUE (As of Date: 2011-08-31) Oil Gas BOE BTax Comp Comp Comp Oil Gas Other Total Non- Lease Other Total Aband Cash Year Grs Grs Grs Rev Rev Rev Crown Crown Expen Expen Cap Etc Flow bbl/d Mcf/d boe/d M$ M$ M$ M$ M$ M$ M$ M$ M$ M$ 2011 0 2 0 0 1 0 0 0 0 0 0 0 0 2012 0 2 0 0 3 0 1 0 1 0 0 0 1 2013 0 3 0 0 4 0 1 0 2 0 0 0 1 2014 0 4 1 0 5 0 1 0 2 0 0 0 1 2015 0 4 1 0 6 0 2 0 3 0 0 0 1 2016 0 4 1 0 6 0 2 0 3 0 0 0 1 2017 0 5 1 0 7 0 2 0 3 0 0 0 1 2018 0 5 1 0 7 0 2 0 4 0 0 0 1 2019 0 5 1 0 7 0 2 0 4 0 0 0 1 2020 0 5 1 0 8 0 2 0 4 0 0 0 1 2021 0 5 1 0 8 0 2 0 4 0 0 0 2 2022 0 5 1 0 8 0 2 0 4 0 0 0 2 2023 0 9 2 0 13 0 2 0 10 0 0 -2 4 2024 0 13 2 0 18 0 2 0 15 0 0 0 2 2025 0 12 2 0 17 0 1 0 14 0 0 0 1 2026 0 11 2 0 15 0 1 0 13 0 0 0 1 2027 0 11 2 0 15 0 1 0 14 0 0 0 1 2028 0 10 2 0 15 0 1 0 14 0 0 0 0 2029 0 9 2 0 2 0 0 0 2 0 0 2 -2 Total 0 165 0 26 0 116 0 0 0 23 Discounted 5% 0 99 0 18 0 66 0 0 0 15 Cash 10% 0 64 0 13 0 40 0 0 0 11 Streams 15% 0 44 0 10 0 26 0 0 0 8 20% 0 32 0 8 0 18 0 0 0 7
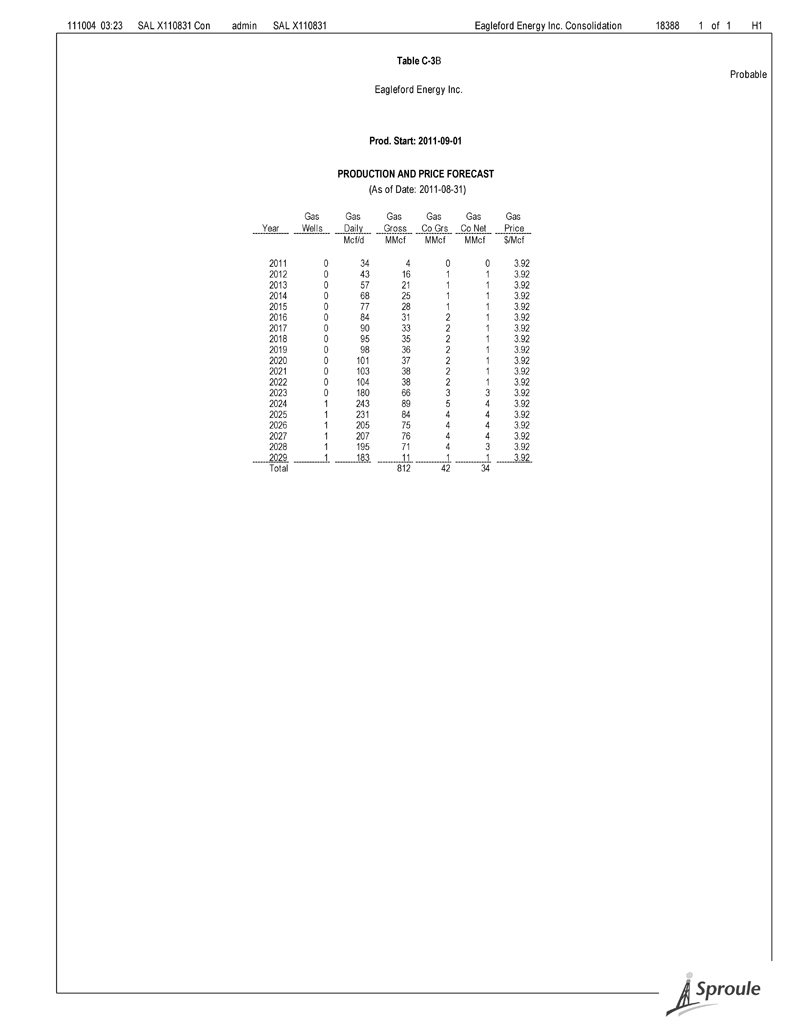
111004 03:23 SAL X110831 Con admin SAL X110831 Eagleford Energy Inc. Consolidation 18388 1 of 1 H1 Table C-3B Probable Eagleford Energy Inc. Prod. Start: 2011-09-01 PRODUCTION AND PRICE FORECAST (As of Date: 2011-08-31) Gas Gas Gas Gas Gas Gas Year Wells Daily Gross Co Grs Co Net Price Mcf/d MMcf MMcf MMcf $/Mcf 2011 0 34 4 0 0 3.92 2012 0 43 16 1 1 3.92 2013 0 57 21 1 1 3.92 2014 0 68 25 1 1 3.92 2015 0 77 28 1 1 3.92 2016 0 84 31 2 1 3.92 2017 0 90 33 2 1 3.92 2018 0 95 35 2 1 3.92 2019 0 98 36 2 1 3.92 2020 0 101 37 2 1 3.92 2021 0 103 38 2 1 3.92 2022 0 104 38 2 1 3.92 2023 0 180 66 3 3 3.92 2024 1 243 89 5 4 3.92 2025 1 231 84 4 4 3.92 2026 1 205 75 4 4 3.92 2027 1 207 76 4 4 3.92 2028 1 195 71 4 3 3.92 2029 1 183 11 1 1 3.92 Total 812 42 34
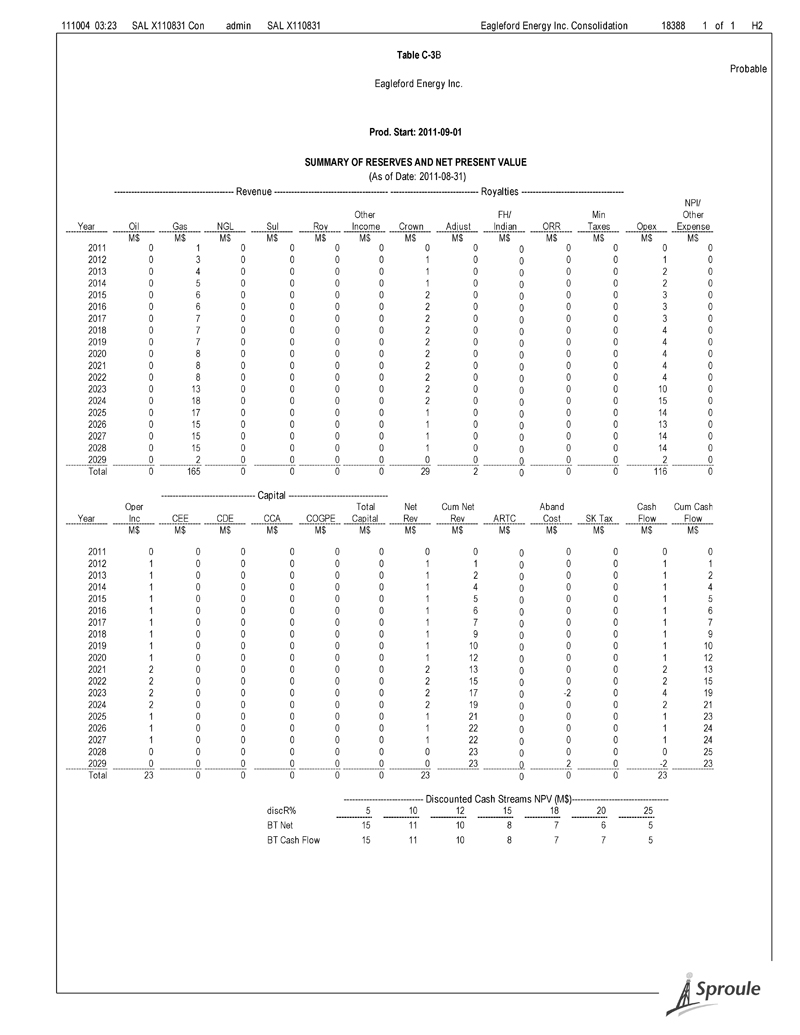
111004 03:23 SAL X110831 Con admin SAL X110831 Eagleford Energy Inc. Consolidation 18388 1 of 1 H2 Table C-3B Probable Eagleford Energy Inc. Prod. Start: 2011-09-01 SUMMARY OF RESERVES AND NET PRESENT VALUE (As of Date: 2011-08-31) ------------------------------------------ Revenue ---------------------------------------- ------------------------------- Royalties ------------------------------------ NPI/ Other FH/ Min Other Year Oil Gas NGL Sul Roy Income Crown Adjust Indian ORR Taxes Opex Expense M$ M$ M$ M$ M$ M$ M$ M$ M$ M$ M$ M$ M$ 2011 0 1 0 0 0 0 0 0 0 0 0 0 0 2012 0 3 0 0 0 0 1 0 0 0 0 1 0 2013 0 4 0 0 0 0 1 0 0 0 0 2 0 2014 0 5 0 0 0 0 1 0 0 0 0 2 0 2015 0 6 0 0 0 0 2 0 0 0 0 3 0 2016 0 6 0 0 0 0 2 0 0 0 0 3 0 2017 0 7 0 0 0 0 2 0 0 0 0 3 0 2018 0 7 0 0 0 0 2 0 0 0 0 4 0 2019 0 7 0 0 0 0 2 0 0 0 0 4 0 2020 0 8 0 0 0 0 2 0 0 0 0 4 0 2021 0 8 0 0 0 0 2 0 0 0 0 4 0 2022 0 8 0 0 0 0 2 0 0 0 0 4 0 2023 0 13 0 0 0 0 2 0 0 0 0 10 0 2024 0 18 0 0 0 0 2 0 0 0 0 15 0 2025 0 17 0 0 0 0 1 0 0 0 0 14 0 2026 0 15 0 0 0 0 1 0 0 0 0 13 0 2027 0 15 0 0 0 0 1 0 0 0 0 14 0 2028 0 15 0 0 0 0 1 0 0 0 0 14 0 2029 0 2 0 0 0 0 0 0 0 0 0 2 0 Total 0 165 0 0 0 0 29 2 0 0 0 116 0 --------------------------------- Capital ----------------------------------- Oper Total Net Cum Net Aband Cash Cum Cash Year Inc CEE CDE CCA COGPE Capital Rev Rev ARTC Cost SK Tax Flow Flow M$ M$ M$ M$ M$ M$ M$ M$ M$ M$ M$ M$ M$ 2011 0 0 0 0 0 0 0 0 0 0 0 0 0 2012 1 0 0 0 0 0 1 1 0 0 0 1 1 2013 1 0 0 0 0 0 1 2 0 0 0 1 2 2014 1 0 0 0 0 0 1 4 0 0 0 1 4 2015 1 0 0 0 0 0 1 5 0 0 0 1 5 2016 1 0 0 0 0 0 1 6 0 0 0 1 6 2017 1 0 0 0 0 0 1 7 0 0 0 1 7 2018 1 0 0 0 0 0 1 9 0 0 0 1 9 2019 1 0 0 0 0 0 1 10 0 0 0 1 10 2020 1 0 0 0 0 0 1 12 0 0 0 1 12 2021 2 0 0 0 0 0 2 13 0 0 0 2 13 2022 2 0 0 0 0 0 2 15 0 0 0 2 15 2023 2 0 0 0 0 0 2 17 0 -2 0 4 19 2024 2 0 0 0 0 0 2 19 0 0 0 2 21 2025 1 0 0 0 0 0 1 21 0 0 0 1 23 2026 1 0 0 0 0 0 1 22 0 0 0 1 24 2027 1 0 0 0 0 0 1 22 0 0 0 1 24 2028 0 0 0 0 0 0 0 23 0 0 0 0 25 2029 0 0 0 0 0 0 0 23 0 2 0 -2 23 Total 23 0 0 0 0 0 23 0 0 0 23 ---------------------------- Discounted Cash Streams NPV (M$)----------------------------------discR% 5 10 12 15 18 20 25 BT Net 15 11 10 8 7 6 5 BT Cash Flow 15 11 10 8 7 7 5
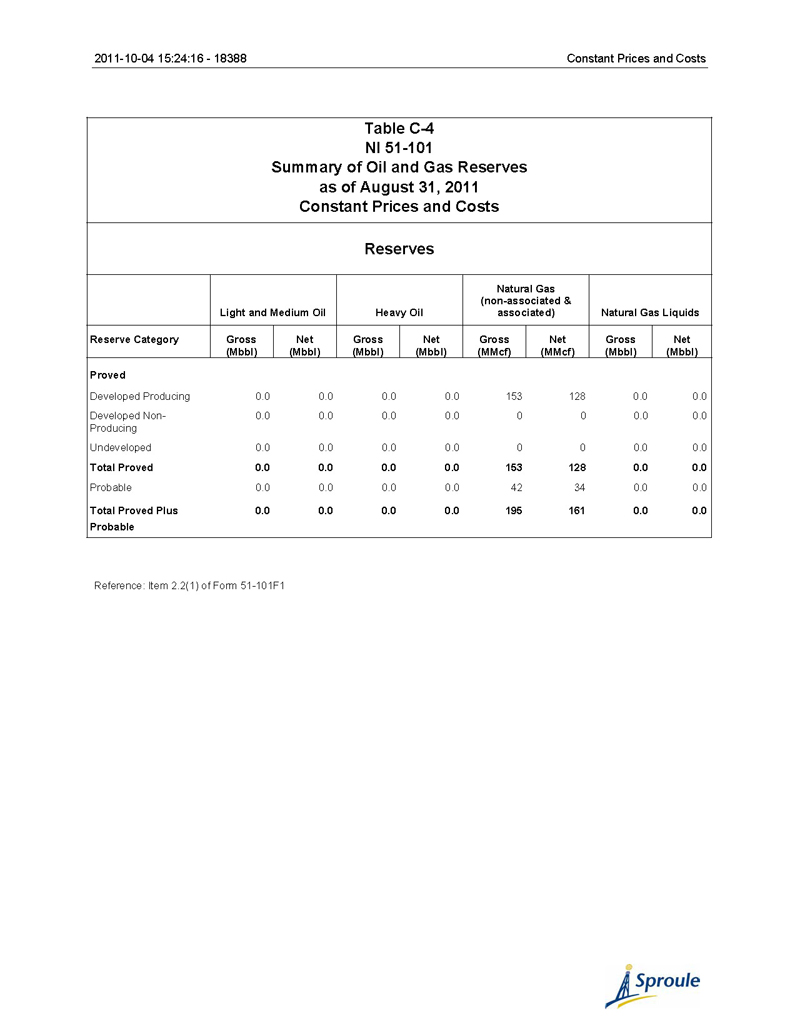
2011-10-04 15:24:16 - 18388 Constant Prices and Costs Table C-4 NI 51-101 Summary of Oil and Gas Reserves as of August 31, 2011 Constant Prices and Costs Reserves Natural Gas (non-associated & Light and Medium Oil Heavy Oil associated) Natural Gas Liquids Reserve Category Gross Net Gross Net Gross Net Gross Net (Mbbl) (Mbbl) (Mbbl) (Mbbl) (MMcf) (MMcf) (Mbbl) (Mbbl) Proved Developed Producing 0.0 0.0 0.0 0.0 153 128 0.0 0.0 Developed Non- 0.0 0.0 0.0 0.0 0 0 0.0 0.0 Producing Undeveloped 0.0 0.0 0.0 0.0 0 0 0.0 0.0 Total Proved 0.0 0.0 0.0 0.0 153 128 0.0 0.0 Probable 0.0 0.0 0.0 0.0 42 34 0.0 0.0 Total Proved Plus 0.0 0.0 0.0 0.0 195 161 0.0 0.0 Probable Reference: Item 2.2(1) of Form 51-101F1
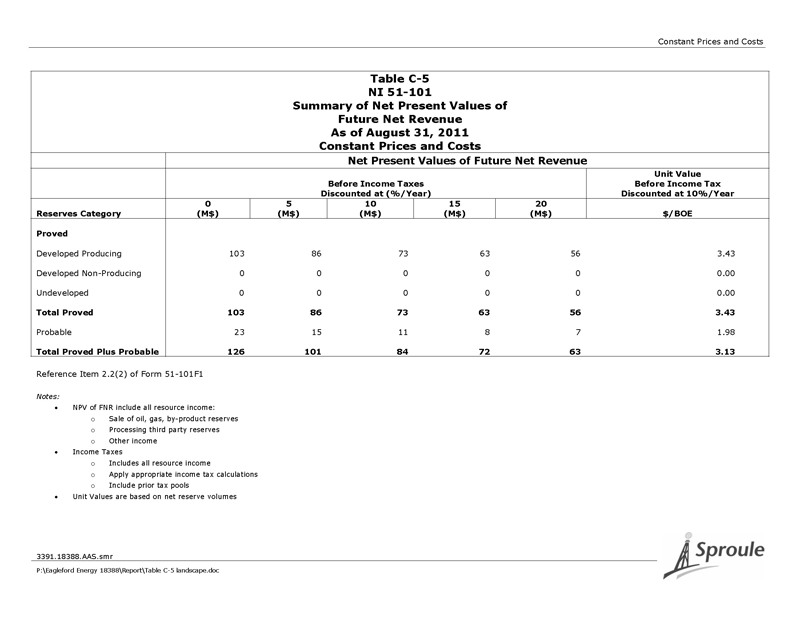
Constant Prices and Costs Table C-5 NI 51-101 Summary of Net Present Values of Future Net Revenue As of August 31, 2011 Constant Prices and Costs Net Present Values of Future Net Revenue Unit Value Before Income Taxes Before Income Tax Discounted at (%/Year) Discounted at 10%/Year 0 5 10 15 20 Reserves Category (M$) (M$) (M$) (M$) (M$) $/BOE Proved Developed Producing 103 86 73 63 56 3.43 Developed Non-Producing 0 0 0 0 0 0.00 Undeveloped 0 0 0 0 0 0.00 Total Proved 103 86 73 63 56 3.43 Probable 23 15 11 8 7 1.98 Total Proved Plus Probable 126 101 84 72 63 3.13 Reference Item 2.2(2) of Form 51-101F1 Notes: NP V of FNR include all resource income: o Sale of oil, gas, by-product reserves o Proc essing third party reserves o Other income Income Taxes o Incl udes all resource income o App ly appropriate income tax calculations o Incl ude prior tax pools Un it Values are based on net reserve volumes 3391.18388 ..AAS.smr P:\Eagleford Energy 18388\Report\Table C-5 landscape .doc
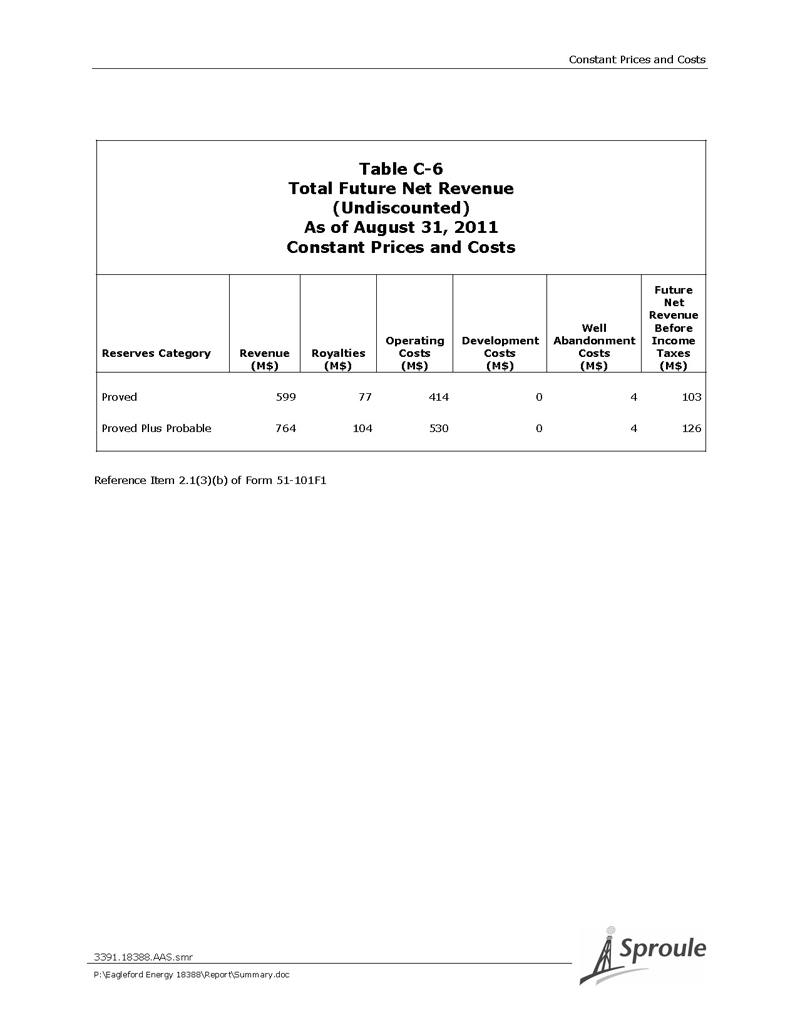
Constant Prices and Costs Table C-6 Total Future Net Revenue (Undiscounted) As of August 31, 2011 Constant Prices and Costs Future Net Revenue Well Before Operating Development Abandonment Income Reserves Category Revenue Royalties Costs Costs Costs Taxes (M$) (M$) (M$) (M$) (M$) (M$) Proved 599 77 414 0 4 103 Proved Plus Probable 764 104 530 0 4 126 Reference Item 2.1(3)(b) of Form 51-101F1 3391.18388.AAS.smr P:\Eagleford Energy 18388\Report\Summary.doc
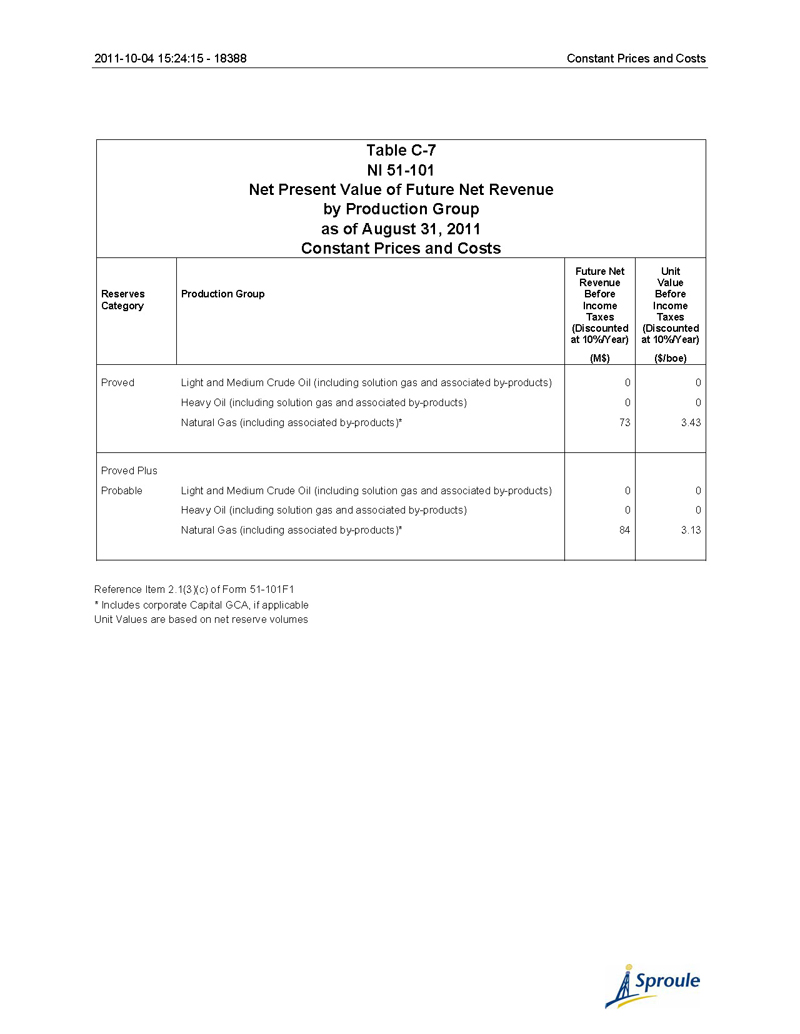
2011-10-04 15:24:15 - 18388 Constant Prices and Costs Table C-7 NI 51-101 Net Present Value of Future Net Revenue by Production Group as of August 31, 2011 Constant Prices and Costs Future Net Unit Revenue Value Reserves Production Group Before Before Category Income Income Taxes Taxes (Discounted (Discounted at 10%/Year) at 10%/Year) (M$) ($/boe) Proved Light and Medium Crude Oil (including solution gas and associated by-products) 0 0 Heavy Oil (including solution gas and associated by-products) 0 0 Natural Gas (including associated by-products)* 73 3.43 Proved Plus Probable Light and Medium Crude Oil (including solution gas and associated by-products) 0 0 Heavy Oil (including solution gas and associated by-products) 0 0 Natural Gas (including associated by-products)* 84 3.13 Reference Item 2.1(3)(c) of Form 51-101F1 * Includes corporate Capital GCA, if applicable Unit Values are based on net reserve volumes
Constant Prices and Costs Table C-8 NI 51-101 Summary of Pricing Assumptions as of August 31, 2011 Constant Prices and Costs Oil Gas NGLs Edmonton WTI Par Cromer Natural Gas1 Pentanes Plus Butanes Cushing Price Medium 29.3° AECO Gas FOB F.O.B. Exchange Year Oklahoma 40° API API Prices Field Gate Field Gate Rate ($US/bbl) ($Cdn/bbl) ($Cdn/bbl) ($Cdn/MMBtu) ($Cdn/bbl) ($Cdn/bbl) ($US/$Cdn) Historical Aug. 31, 2005 68.95 87.14 57.68 11.09 81.36 47.48 0.842 Aug. 31, 2006 70.27 70.98 83.11 5.07 70.34 65.11 0.904 Aug. 31, 2007 74.04 76.44 73.52 4.65 79.19 63.52 0.947 Aug. 31, 2008 115.46 122.15 113.47 7.12 122.58 83.38 0.942 Aug. 31, 2009 69.96 73.41 67.48 2.34 73.90 57.97 0.913 Aug. 31, 2010 71.92 73.22 70.05 3.34 75.01 51.22 0.940 Constant Aug. 31, 2011 96.20 90.95 87.74 3.77 96.73 69.59 1.010 (1) This summary table identifies benchmark reference pricing schedules that might apply to a reporting issuer. Notes: Product sale prices will reflect these reference prices with further adjustments for quality and transportation to point of sale. 3391.18388.AAS.smr P:\Eagleford Energy 18388\Report\Summary.doc
National Instrument 51-101 – Page 1 National Instrument 51-101 This report was prepared for the purpose of evaluating the Company’s P&NG reserves according to the Canadian Oil and Gas Evaluation Handbook (COGEH) reserve definitions and standards, which are consistent with National Instrument 51-101 (NI 51-101). In accordance with these standards, and by reference in NI 51-101, certain tables are presented for the forecast prices and costs case, which summarize the reserves and net present values, as of August 31, 2011. Form 51-101F2, which follows, presents a Report on Reserves Data by Independent Qualified Reserves Evaluator or Auditor. Forecast Prices and Costs Table 1 presents a summary of the various reserves categories. Table 2 presents a summary of net present values of future net revenue, before taxes. Table 3 presents the total future net revenue (undiscounted) for the total proved and total proved plus probable reserves categories. Table 4 presents the net present value of future net revenue by production group for the total proved and total proved plus probable reserves categories. Table 5 presents a summary of pricing and inflation rate assumptions. Reconciliation Table 6 presents the Reconciliation of the Company’s Gross Reserves (Before Royalty) by Principal Product Type, using forecast prices and costs. 3391.18388.AAS.smr P:\Eagleford Energy 18388\Report\Summary.doc
Form 51-101F2 Report on Reserves Data by Independent Qualified Reserves Evaluator or Auditor Report on Reserves Data To the Board of Directors of Eagleford Energy Inc. (the “Company”): 1. We have evaluated the Company’s Reserves Data as at August 31, 2011. The reserves data are estimates of proved reserves and probable reserves and related future net revenue as at August 31, 2011, estimated using forecast prices and costs. 2. The Reserves Data are the responsibility of the Company’s management. Our responsibility is to express an opinion on the Reserves Data based on our evaluation. We carried out our evaluation in accordance with standards set out in the Canadian Oil and Gas Evaluation Handbook (the “COGE Handbook”), prepared jointly by the Society of Petroleum Evaluation Engineers (Calgary Chapter) and the Canadian Institute of Mining, Metallurgy & Petroleum (Petroleum Society). 3. Those standards require that we plan and perform an evaluation to obtain reasonable assurance as to whether the reserves data are free of material misstatement. An evaluation also includes assessing whether the reserves data are in accordance with principles and definitions presented in the COGE Handbook. 0826.00000.RNJ.dlb P:\Eagleford Energy 18388\Report\Summary.doc
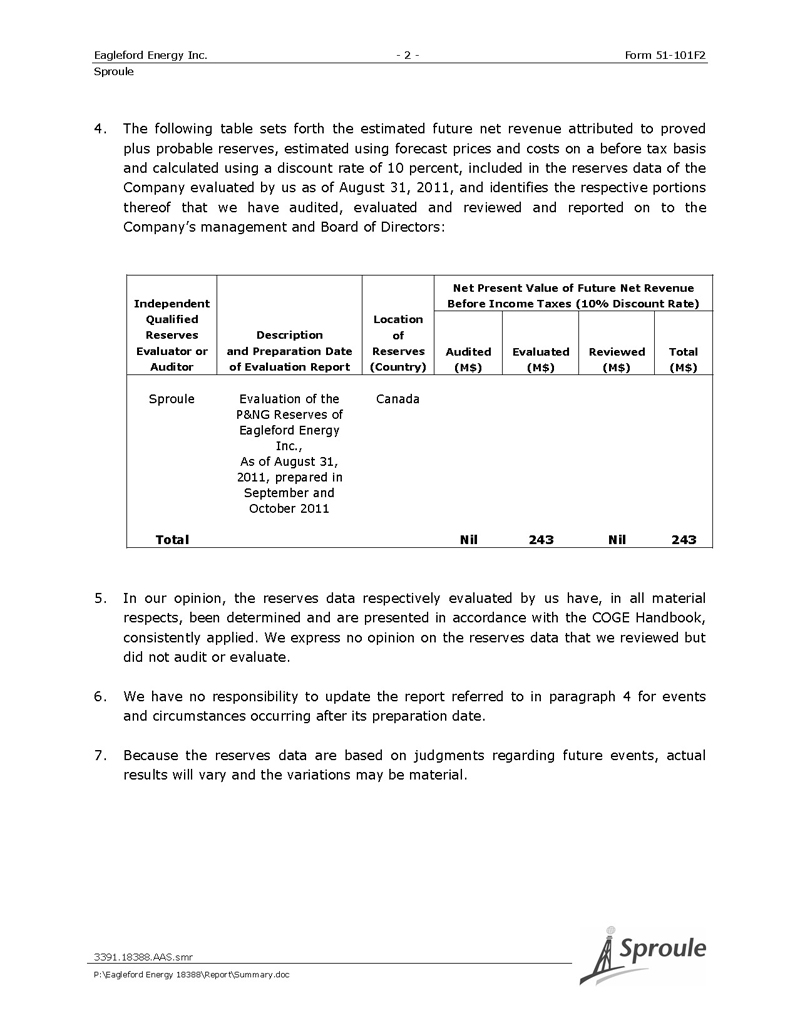
Eagleford Energy Inc. - 2 - Form 51-101F2 Sproule 4. The following table sets forth the estimated future net revenue attributed to proved plus probable reserves, estimated using forecast prices and costs on a before tax basis and calculated using a discount rate of 10 percent, included in the reserves data of the Company evaluated by us as of August 31, 2011, and identifies the respective portions thereof that we have audited, evaluated and reviewed and reported on to the Company’s management and Board of Directors: Net Present Value of Future Net Revenue Independent Before Income Taxes (10% Discount Rate) Qualified Location Reserves Description of Evaluator or and Preparation Date Reserves Audited Evaluated Reviewed Total Auditor of Evaluation Report (Country) (M$) (M$) (M$) (M$) Sproule Evaluation of the Canada P&NG Reserves of Eagleford Energy Inc., As of August 31, 2011, prepared in September and October 2011 Total Nil 243 Nil 243 5. In our opinion, the reserves data respectively evaluated by us have, in all material respects, been determined and are presented in accordance with the COGE Handbook, consistently applied. We express no opinion on the reserves data that we reviewed but did not audit or evaluate. 6. We have no responsibility to update the report referred to in paragraph 4 for events and circumstances occurring after its preparation date. 7. Because the reserves data are based on judgments regarding future events, actual results will vary and the variations may be material. 3391.18388.AAS.smr P:\Eagleford Energy 18388\Report\Summary.doc
Eagleford Energy Inc. - 3 - Form 51-101F2 Sproule Executed as to our report referred to above: Sproule Associates Limited Calgary, Alberta October 7, 2011 Original Signed by Attila A. Szabo, P.Eng. ____________________________ Attila A. Szabo, P.Eng., Project Leader, Senior Petroleum Engineer and Partner Original Signed by Harry J. Helwerda, P.Eng., FEC _____________________________ Harry J. Helwerda, P.Eng., FEC Executive Vice-President and Director 3391.18388.AAS.smr P:\Eagleford Energy 18388\Report\Summary.doc

2011-10-04 15:21:15 - 18388 National Instrument 51-101 Table 1 NI 51-101 Summary of Oil and Gas Reserves as of August 31, 2011 Forecast Prices and Costs Reserves Natural Gas (non-associated & Light and Medium Oil Heavy Oil associated) Natural Gas Liquids Reserve Category Gross Net Gross Net Gross Net Gross Net (Mbbl) (Mbbl) (Mbbl) (Mbbl) (MMcf) (MMcf) (Mbbl) (Mbbl) Proved Developed Producing 0.0 0.0 0.0 0.0 203 161 0.0 0.0 Developed Non- 0.0 0.0 0.0 0.0 0 0 0.0 0.0 Producing Undeveloped 0.0 0.0 0.0 0.0 0 0 0.0 0.0 Total Proved 0.0 0.0 0.0 0.0 203 161 0.0 0.0 Probable 0.0 0.0 0.0 0.0 66 49 0.0 0.0 Total Proved Plus 0.0 0.0 0.0 0.0 269 211 0.0 0.0 Probable Reference: Item 2.2(1) of Form 51-101F1
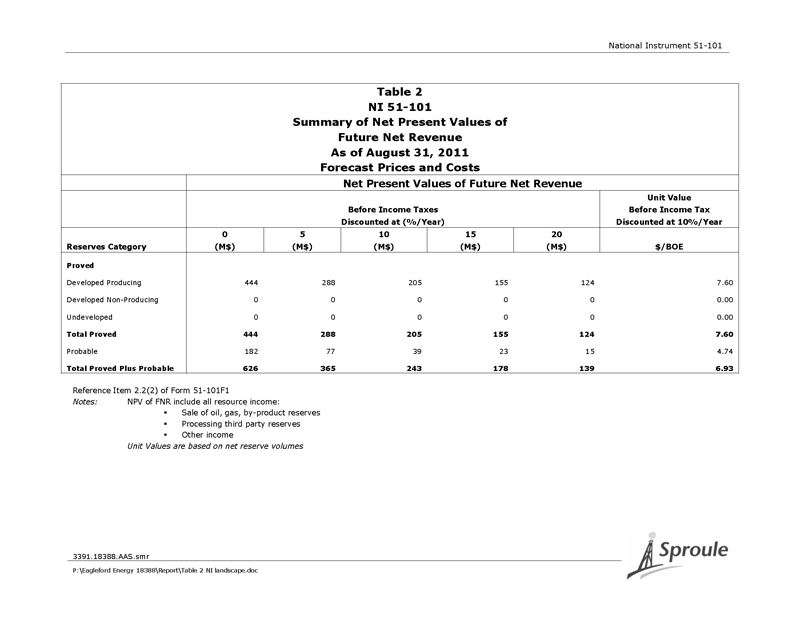
National Instrument 51-101 Table 2 NI 51-101 Summary of Net Present Values of Future Net Revenue As of August 31, 2011 Forecast Prices and Costs Net Present Values of Future Net Revenue Unit Value Before Income Taxes Before Income Tax Discounted at (%/Year) Discounted at 10%/Year 0 5 10 15 20 Reserves Category (M$) (M$) (M$) (M$) (M$) $/BOE Proved Developed Producing 444 288 205 155 124 7.60 Developed Non-Producing 0 0 0 0 0 0.00 Undeveloped 0 0 0 0 0 0.00 Total Proved 444 288 205 155 124 7.60 Probable 182 77 39 23 15 4.74 Total Proved Plus Probable 626 365 243 178 139 6.93 Reference Item 2.2(2) of Form 51-101F1 Notes: NPV of FNR include all resource income: Sa le of oil, gas, by-product reserves Processing third party reserves Othe r income Unit Values are based on net reserve volumes 3391.18388 ..AAS.smr P:\Eagleford Energy 18388\Report\Table 2 NI landscape .doc
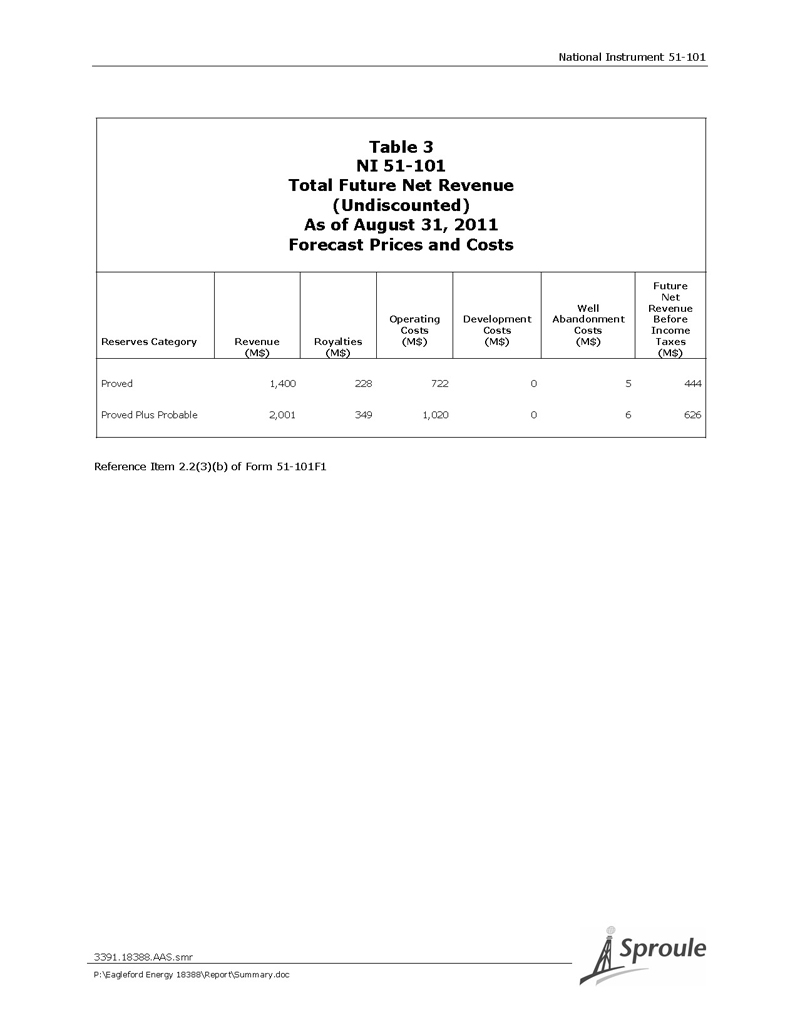
National Instrument 51-101 Table 3 NI 51-101 Total Future Net Revenue (Undiscounted) As of August 31, 2011 Forecast Prices and Costs Future Net Well Revenue Operating Development Abandonment Before Costs Costs Costs Income Reserves Category Revenue Royalties (M$) (M$) (M$) Taxes (M$) (M$) (M$) Proved 1,400 228 722 0 5 444 Proved Plus Probable 2,001 349 1,020 0 6 626 Reference Item 2.2(3)(b) of Form 51-101F1 3391.18388.AAS.smr P:\Eagleford Energy 18388\Report\Summary.doc

2011-10-04 15:21:15 - 18388 National Instrument 51-101 Table 4 NI 51-101 Net Present Value of Future Net Revenue by Production Group as of August 31, 2011 Forecast Prices and Costs Future Net Unit Revenue Value Reserves Production Group Before Before Category Income Income Taxes Taxes (Discounted (Discounted at 10%/Year) at 10%/Year) (M$) ($/boe) Proved Light and Medium Crude Oil (including solution gas and associated by-products) 0 0 Heavy Oil (including solution gas and associated by-products) 0 0 Natural Gas (including associated by-products)* 205 7.60 Proved Plus Probable Light and Medium Crude Oil (including solution gas and associated by-products) 0 0 Heavy Oil (including solution gas and associated by-products) 0 0 Natural Gas (including associated by-products)* 243 6.93 Reference Item 2.1(3)(c) of Form 51-101F1 * Includes corporate Capital GCA, if applicable Unit Values are based on net reserve volumes
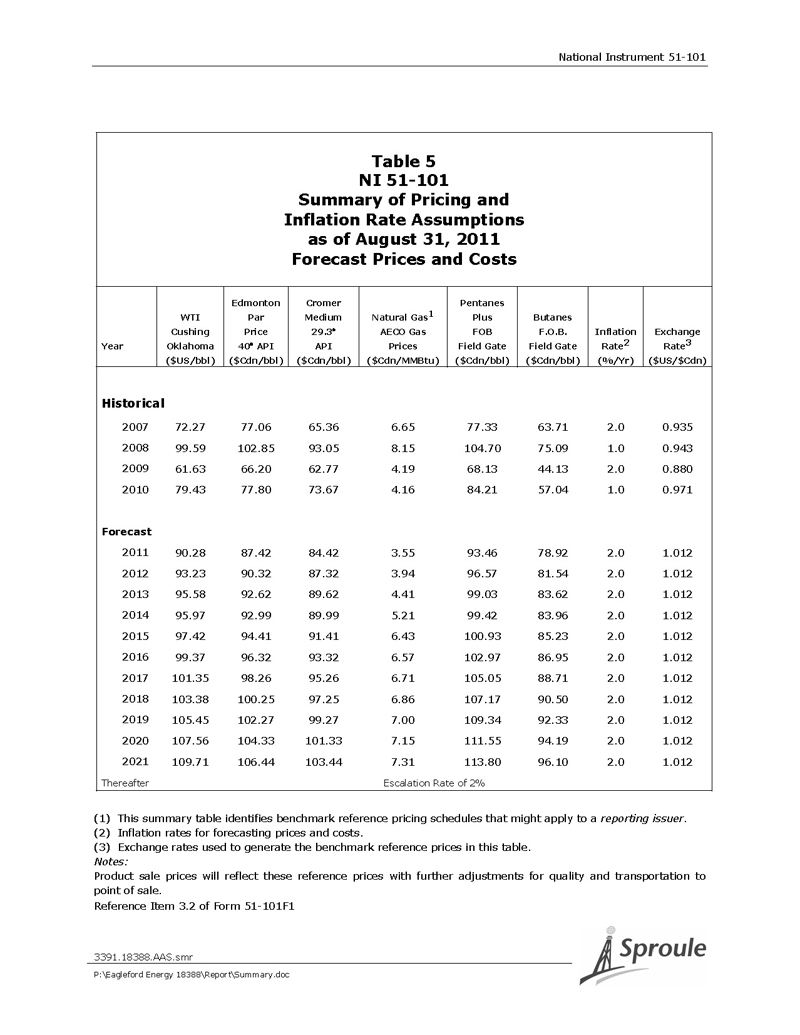
National Instrument 51-101 Table 5 NI 51-101 Summary of Pricing and Inflation Rate Assumptions as of August 31, 2011 Forecast Prices and Costs Edmonton Cromer Pentanes WTI Par Medium Natural Gas1 Plus Butanes Cushing Price 29.3° AECO Gas FOB F.O.B. Inflation Exchange Year Oklahoma 40° API API Prices Field Gate Field Gate Rate2 Rate3 ($US/bbl) ($Cdn/bbl) ($Cdn/bbl) ($Cdn/MMBtu) ($Cdn/bbl) ($Cdn/bbl) (%/Yr) ($US/$Cdn) Historical 2007 72.27 77.06 65.36 6.65 77.33 63.71 2.0 0.935 2008 99.59 102.85 93.05 8.15 104.70 75.09 1.0 0.943 2009 61.63 66.20 62.77 4.19 68.13 44.13 2.0 0.880 2010 79.43 77.80 73.67 4.16 84.21 57.04 1.0 0.971 Forecast 2011 90.28 87.42 84.42 3.55 93.46 78.92 2.0 1.012 2012 93.23 90.32 87.32 3.94 96.57 81.54 2.0 1.012 2013 95.58 92.62 89.62 4.41 99.03 83.62 2.0 1.012 2014 95.97 92.99 89.99 5.21 99.42 83.96 2.0 1.012 2015 97.42 94.41 91.41 6.43 100.93 85.23 2.0 1.012 2016 99.37 96.32 93.32 6.57 102.97 86.95 2.0 1.012 2017 101.35 98.26 95.26 6.71 105.05 88.71 2.0 1.012 2018 103.38 100.25 97.25 6.86 107.17 90.50 2.0 1.012 2019 105.45 102.27 99.27 7.00 109.34 92.33 2.0 1.012 2020 107.56 104.33 101.33 7.15 111.55 94.19 2.0 1.012 2021 109.71 106.44 103.44 7.31 113.80 96.10 2.0 1.012 Thereafter Escalation Rate of 2% (1) This summary table identifies benchmark reference pricing schedules that might apply to a reporting issuer. (2) Inflation rates for forecasting prices and costs. (3) Exchange rates used to generate the benchmark reference prices in this table. Notes: Product sale prices will reflect these reference prices with further adjustments for quality and transportation to point of sale. Reference Item 3.2 of Form 51-101F1 3391.18388.AAS.smr P:\Eagleford Energy 18388\Report\Summary.doc
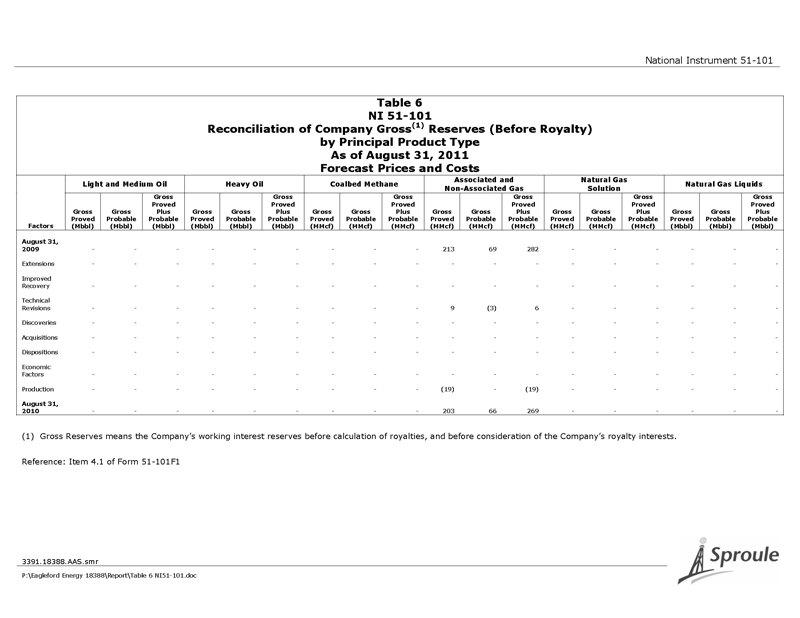
National Instrument 51-101 Table 6 NI 51-101 Reconciliation of Company Gross (1) Reserves (Before Royalty) by Principal Product Type As of August 31, 2011 Forecast Prices and Costs Associated and Natural Gas Light and Medium Oil Heavy Oil Coalbed Methane Natural Gas Liquids Non-Associated Gas Solution Gross Gross Gross Gross Gross Gross Proved Proved Proved Proved Proved Proved Gross Gross Plus Gross Gross Plus Gross Gross Plus Gross Gross Plus Gross Gross Plus Gross Gross Plus Proved Probable Probable Proved Probable Probable Proved Probable Probable Proved Probable Probable Proved Probable Probable Proved Probable Probable Factors (Mbbl) (Mbbl) (Mbbl) (Mbbl) (Mbbl) (Mbbl) (MMcf) (MMcf) (MMcf) (MMcf) (MMcf) (MMcf) (MMcf) (MMcf) (MMcf) (Mbbl) (Mbbl) (Mbbl) August 31, 2009 - - - - - - - - - 213 69 282 - - - - - - Extensions - - - - - - - - - - - - - - - - - - Improved Recovery - - - - - - - - - - - - - - - - - - Technical Revisions - - - - - - - - - 9 (3) 6 - - - - - -Discoveries - - - - - - - - - - - - - - - - - -Acquisitions - - - - - - - - - - - - - - - - - -Dispositions - - - - - - - - - - - - - - - - - - Economic Factors - - - - - - - - - - - - - - - - - - Production - - - - - - - - - (19) - (19) - - - - - - August 31, 2010 - - - - - - - - - 203 66 269 - - - - - - (1) Gross Reserves means the Company’s working interest reserves before calculation of royalties, and before consideration of the Company’s royalty interests . Reference: Item 4.1 of Form 51-101F1 3391.18388 .AAS.smr P:\Eagleford Energy 18388\Report\Table 6 NI51-101.doc
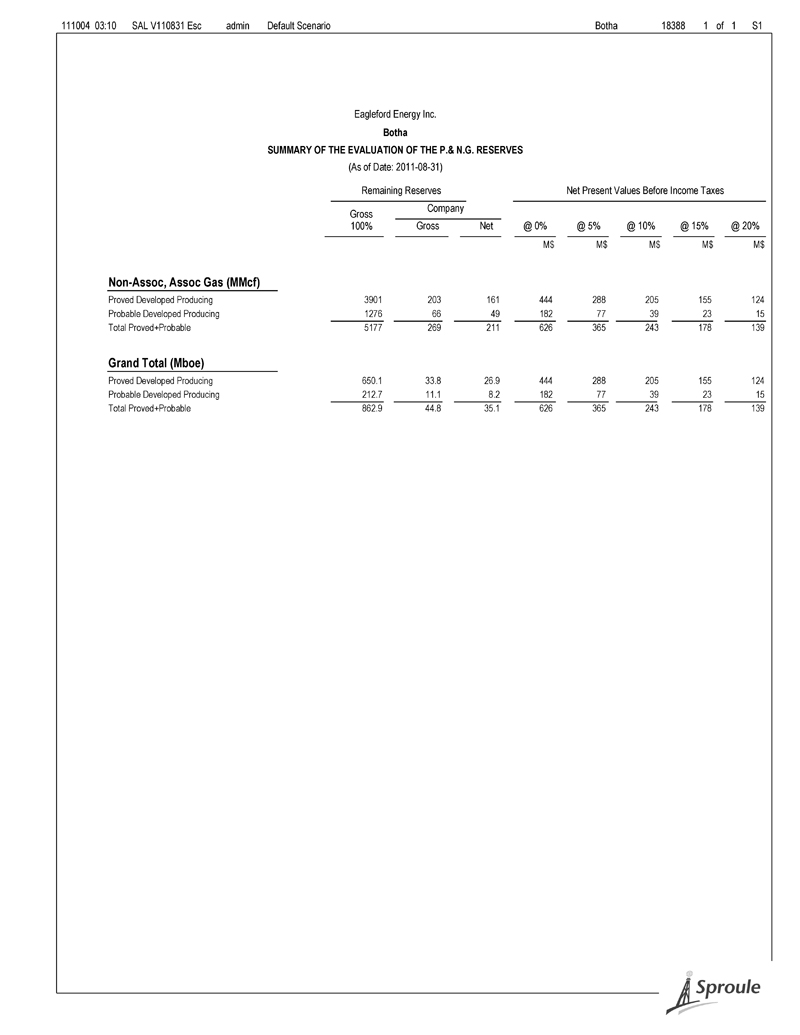
111004 03:10 SAL V110831 Esc admin Default Scenario Botha 18388 1 of 1 S1 Eagleford Energy Inc. Botha SUMMARY OF THE EVALUATION OF THE P.& N.G. RESERVES (As of Date: 2011-08-31) Remaining Reserves Net Present Values Before Income Taxes Company Gross 100% Gross Net @ 0% @ 5% @ 10% @ 15% @ 20% M$ M$ M$ M$ M$ Non-Assoc, Assoc Gas (MMcf) Proved Developed Producing 3901 203 161 444 288 205 155 124 Probable Developed Producing 1276 66 49 182 77 39 23 15 Total Proved+Probable 5177 269 211 626 365 243 178 139 Grand Total (Mboe) Proved Developed Producing 650.1 33.8 26.9 444 288 205 155 124 Probable Developed Producing 212.7 11.1 8.2 182 77 39 23 15 Total Proved+Probable 862.9 44.8 35.1 626 365 243 178 139
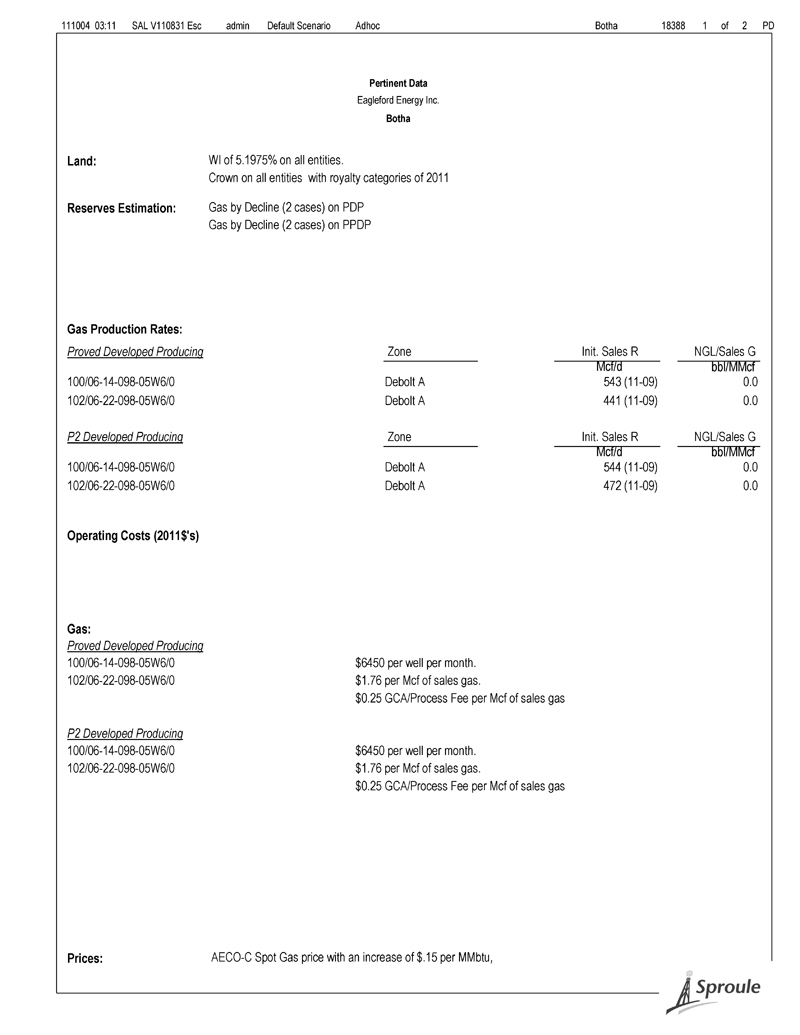
111004 03:11 SAL V110831 Esc admin Default Scenario Adhoc Botha 18388 1 of 2 PD Pertinent Data Eagleford Energy Inc. Botha Land: WI of 5.1975% on all entities. Crown on all entities with royalty categories of 2011 Reserves Estimation: Gas by Decline (2 cases) on PDP Gas by Decline (2 cases) on PPDP Gas Production Rates: Proved Developed Producing Zone Init. Sales R NGL/Sales G Mcf/d bbl/MMcf 100/06-14-098-05W6/0 Debolt A 543 (11-09) 0.0 102/06-22-098-05W6/0 Debolt A 441 (11-09) 0.0 P2 Developed Producing Zone Init. Sales R NGL/Sales G Mcf/d bbl/MMcf 100/06-14-098-05W6/0 Debolt A 544 (11-09) 0.0 102/06-22-098-05W6/0 Debolt A 472 (11-09) 0.0 Operating Costs (2011$'s) Gas: Proved Developed Producing 100/06-14-098-05W6/0 $6450 per well per month. 102/06-22-098-05W6/0 $1.76 per Mcf of sales gas. $0.25 GCA/Process Fee per Mcf of sales gas P2 Developed Producing 100/06-14-098-05W6/0 $6450 per well per month. 102/06-22-098-05W6/0 $1.76 per Mcf of sales gas. $0.25 GCA/Process Fee per Mcf of sales gas Prices: AECO-C Spot Gas price with an increase of $.15 per MMbtu, with heating value of 1000

111004 03:11 SAL V110831 Esc admin Default Scenario Adhoc Botha 18388 2 of 2 PD with heating value of 1000 Abandonment: M$30 on all entities.
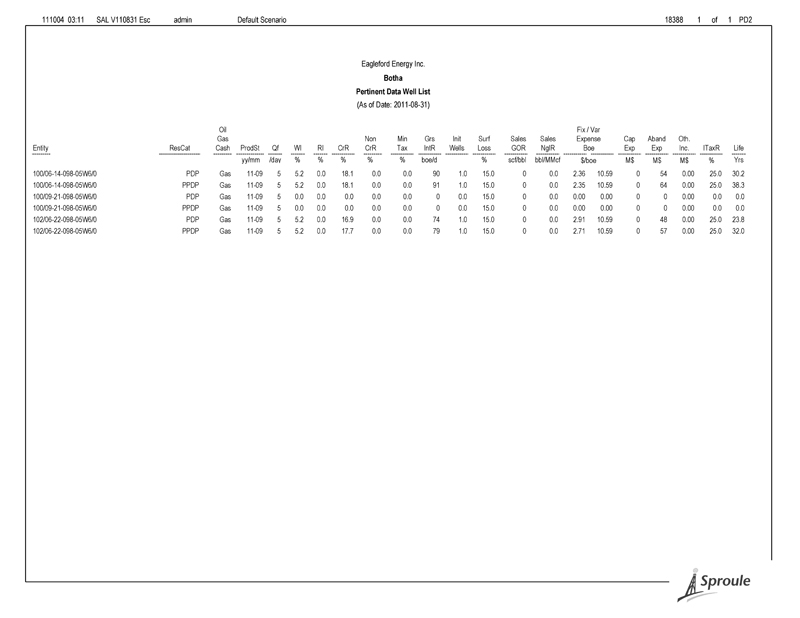
111004 03:11 SAL V110831 Esc admin Default Scenario 18388 1 of 1 PD2 Eagleford Energy Inc. Botha Pertinent Data Well List (As of Date: 2011-08-31) Oil Fix / Var Gas Non Min Grs Init Surf Sales Sales Expense Cap Aband Oth. Entity ResCat Cash ProdSt Qf WI RI CrR CrR Tax IntR Wells Loss GOR NglR Boe Exp Exp Inc. ITaxR Life yy/mm /day % % % % % boe/d % scf/bbl bbl/MMcf $/boe M$ M$ M$ % Yrs 100/06-14-098-05W6/0 PDP Gas 11-09 5 5.2 0.0 18.1 0.0 0.0 90 1.0 15.0 0 0.0 2.36 10.59 0 54 0.00 25.0 30.2 100/06-14-098-05W6/0 PPDP Gas 11-09 5 5.2 0.0 18.1 0.0 0.0 91 1.0 15.0 0 0.0 2.35 10.59 0 64 0.00 25.0 38.3 100/09-21-098-05W6/0 PDP Gas 11-09 5 0.0 0.0 0.0 0.0 0.0 0 0.0 15.0 0 0.0 0.00 0.00 0 0 0.00 0.0 0.0 100/09-21-098-05W6/0 PPDP Gas 11-09 5 0.0 0.0 0.0 0.0 0.0 0 0.0 15.0 0 0.0 0.00 0.00 0 0 0.00 0.0 0.0 102/06-22-098-05W6/0 PDP Gas 11-09 5 5.2 0.0 16.9 0.0 0.0 74 1.0 15.0 0 0.0 2.91 10.59 0 48 0.00 25.0 23.8 102/06-22-098-05W6/0 PPDP Gas 11-09 5 5.2 0.0 17.7 0.0 0.0 79 1.0 15.0 0 0.0 2.71 10.59 0 57 0.00 25.0 32.0
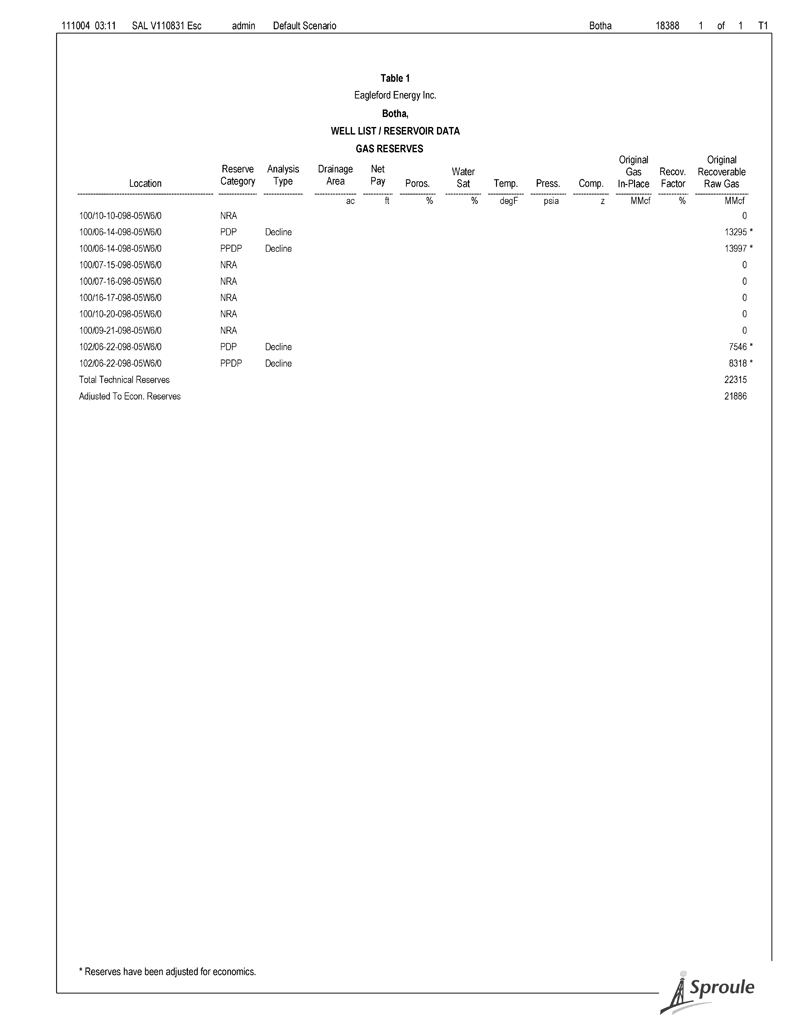
111004 03:11 SAL V110831 Esc admin Default Scenario Botha 18388 1 of 1 T1 Table 1 Eagleford Energy Inc. Botha, WELL LIST / RESERVOIR DATA GAS RESERVES Original Original Reserve Analysis Drainage Net Water Gas Recov. Recoverable Location Category Type Area Pay Poros. Sat Temp. Press. Comp. In-Place Factor Raw Gas ac ft % % degF psia z MMcf % MMcf 100/10-10-098-05W6/0 NRA 0 100/06-14-098-05W6/0 PDP Decline 13295 * 100/06-14-098-05W6/0 PPDP Decline 13997 * 100/07-15-098-05W6/0 NRA 0 100/07-16-098-05W6/0 NRA 0 100/16-17-098-05W6/0 NRA 0 100/10-20-098-05W6/0 NRA 0 100/09-21-098-05W6/0 NRA 0 102/06-22-098-05W6/0 PDP Decline 7546 * 102/06-22-098-05W6/0 PPDP Decline 8318 * Total Technical Reserves 22315 Adjusted To Econ. Reserves 21886 * Reserves have been adjusted for economics.
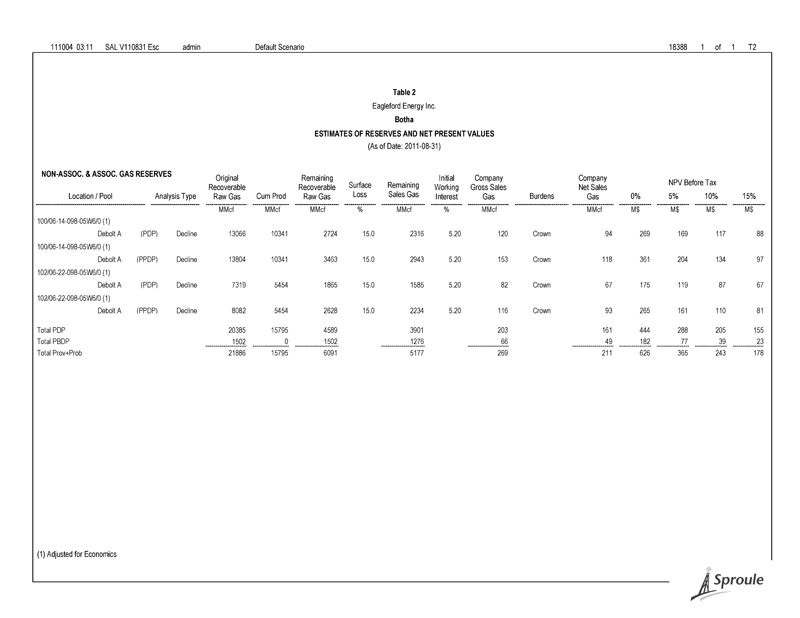
111004 03:11 SAL V110831 Esc admin Default Scenario 18388 1 of 1 T2 Table 2 Eagleford Energy Inc. Botha ESTIMATES OF RESERVES AND NET PRESENT VALUES (As of Date: 2011-08-31) NON-ASSOC. & ASSOC. GAS RESERVES Original Remaining Initial Company Company Surface Remaining NPV Before Tax Recoverable Recoverable Working Gross Sales Net Sales Location / Pool Analysis Type Raw Gas Cum Prod Raw Gas Loss Sales Gas Interest Gas Burdens Gas 0% 5% 10% 15% MMcf MMcf MMcf % MMcf % MMcf MMcf M$ M$ M$ M$ 100/06-14-098-05W6/0 (1) Debolt A (PDP) Decline 13066 10341 2724 15.0 2316 5.20 120 Crown 94 269 169 117 88 100/06-14-098-05W6/0 (1) Debolt A (PPDP) Decline 13804 10341 3463 15.0 2943 5.20 153 Crown 118 361 204 134 97 102/06-22-098-05W6/0 (1) Debolt A (PDP) Decline 7319 5454 1865 15.0 1585 5.20 82 Crown 67 175 119 87 67 102/06-22-098-05W6/0 (1) Debolt A (PPDP) Decline 8082 5454 2628 15.0 2234 5.20 116 Crown 93 265 161 110 81 Total PDP 20385 15795 4589 3901 203 161 444 288 205 155 Total PBDP 1502 0 1502 1276 66 49 182 77 39 23 Total Prov+Prob 21886 15795 6091 5177 269 211 626 365 243 178 (1) Adjusted for Economics
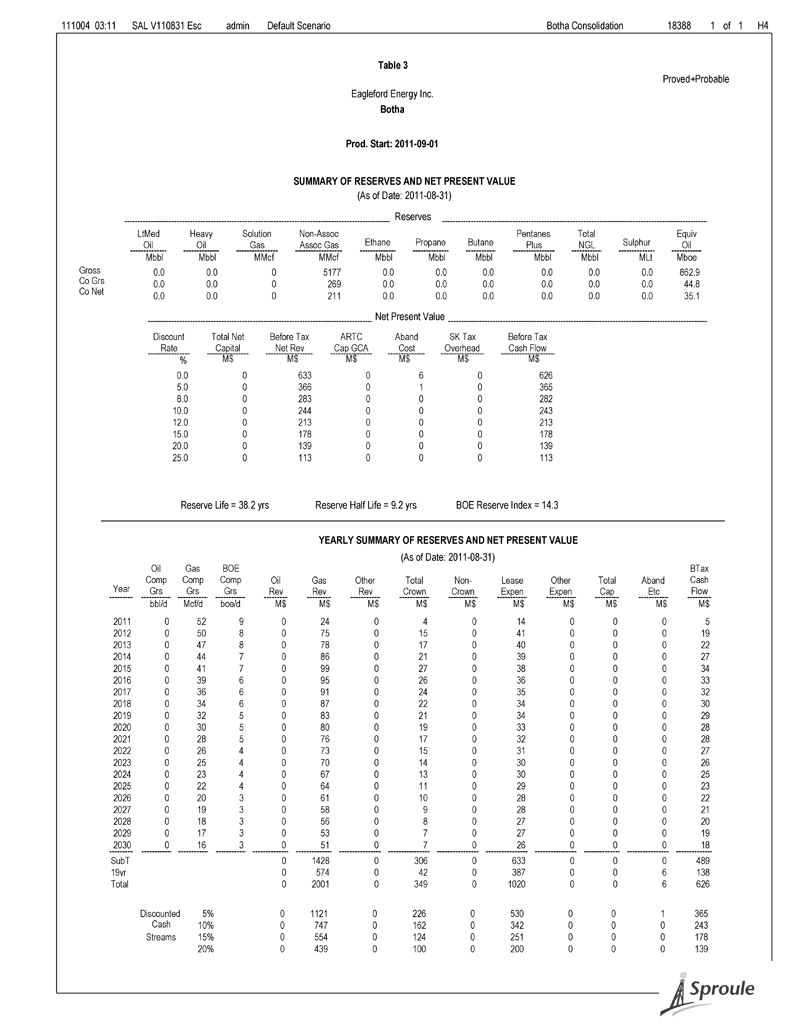
111004 03:11 SAL V110831 Esc admin Default Scenario Botha Consolidation 18388 1 of 1 H4 Table 3 Proved+Probable Eagleford Energy Inc. Botha Prod. Start: 2011-09-01 SUMMARY OF RESERVES AND NET PRESENT VALUE (As of Date: 2011-08-31) Reserves LtMed Heavy Solution Non-Assoc Pentanes Total Equiv Oil Oil Gas Assoc Gas Ethane Propane Butane Plus NGL Sulphur Oil Mbbl Mbbl MMcf MMcf Mbbl Mbbl Mbbl Mbbl Mbbl MLt Mboe Gross 0.0 0.0 0 5177 0.0 0.0 0.0 0.0 0.0 0.0 862.9 Co Grs 0.0 0.0 0 269 0.0 0.0 0.0 0.0 0.0 0.0 44.8 Co Net 0.0 0.0 0 211 0.0 0.0 0.0 0.0 0.0 0.0 35.1 Net Present Value Discount Total Net Before Tax ARTC Aband SK Tax Before Tax Rate Capital Net Rev Cap GCA Cost Overhead Cash Flow % M$ M$ M$ M$ M$ M$ 0.0 0 633 0 6 0 626 5.0 0 366 0 1 0 365 8.0 0 283 0 0 0 282 10.0 0 244 0 0 0 243 12.0 0 213 0 0 0 213 15.0 0 178 0 0 0 178 20.0 0 139 0 0 0 139 25.0 0 113 0 0 0 113 Reserve Life = 38.2 yrs Reserve Half Life = 9.2 yrs BOE Reserve Index = 14.3 YEARLY SUMMARY OF RESERVES AND NET PRESENT VALUE (As of Date: 2011-08-31) Oil Gas BOE BTax Comp Comp Comp Oil Gas Other Total Non- Lease Other Total Aband Cash Year Grs Grs Grs Rev Rev Rev Crown Crown Expen Expen Cap Etc Flow bbl/d Mcf/d boe/d M$ M$ M$ M$ M$ M$ M$ M$ M$ M$ 2011 0 52 9 0 24 0 4 0 14 0 0 0 5 2012 0 50 8 0 75 0 15 0 41 0 0 0 19 2013 0 47 8 0 78 0 17 0 40 0 0 0 22 2014 0 44 7 0 86 0 21 0 39 0 0 0 27 2015 0 41 7 0 99 0 27 0 38 0 0 0 34 2016 0 39 6 0 95 0 26 0 36 0 0 0 33 2017 0 36 6 0 91 0 24 0 35 0 0 0 32 2018 0 34 6 0 87 0 22 0 34 0 0 0 30 2019 0 32 5 0 83 0 21 0 34 0 0 0 29 2020 0 30 5 0 80 0 19 0 33 0 0 0 28 2021 0 28 5 0 76 0 17 0 32 0 0 0 28 2022 0 26 4 0 73 0 15 0 31 0 0 0 27 2023 0 25 4 0 70 0 14 0 30 0 0 0 26 2024 0 23 4 0 67 0 13 0 30 0 0 0 25 2025 0 22 4 0 64 0 11 0 29 0 0 0 23 2026 0 20 3 0 61 0 10 0 28 0 0 0 22 2027 0 19 3 0 58 0 9 0 28 0 0 0 21 2028 0 18 3 0 56 0 8 0 27 0 0 0 20 2029 0 17 3 0 53 0 7 0 27 0 0 0 19 2030 0 16 3 0 51 0 7 0 26 0 0 0 18 SubT 0 1428 0 306 0 633 0 0 0 489 19yr 0 574 0 42 0 387 0 0 6 138 Total 0 2001 0 349 0 1020 0 0 6 626 Discounted 5% 0 1121 0 226 0 530 0 0 1 365 Cash 10% 0 747 0 162 0 342 0 0 0 243 Streams 15% 0 554 0 124 0 251 0 0 0 178 20% 0 439 0 100 0 200 0 0 0 139
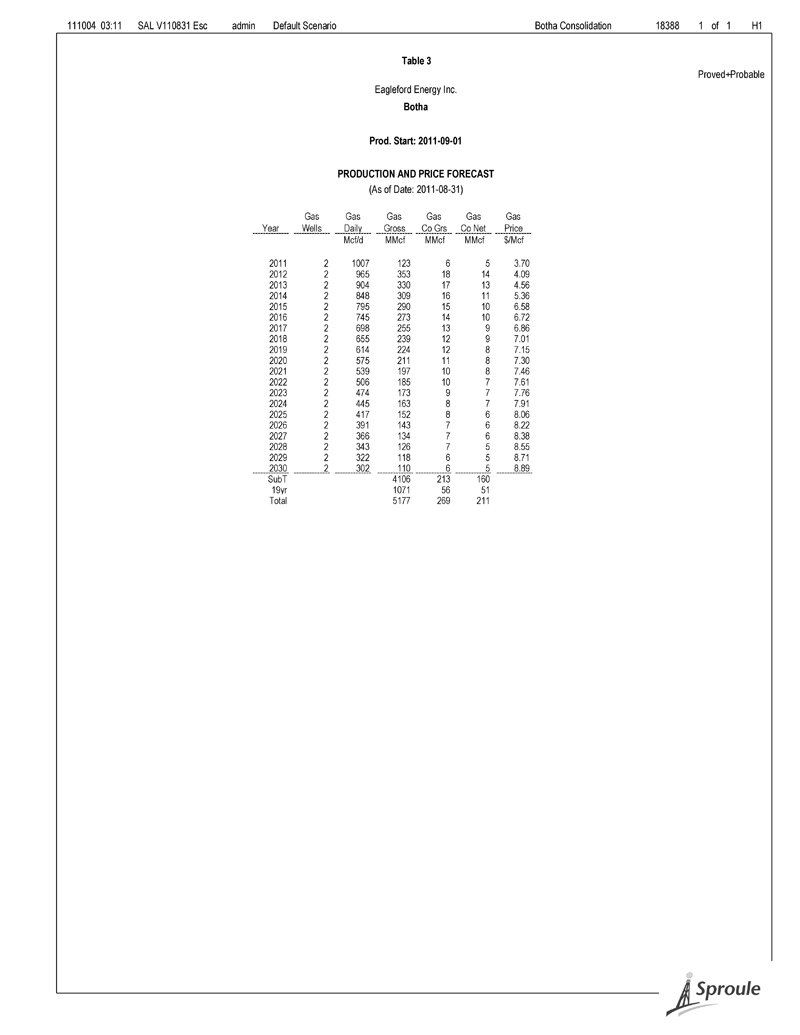
111004 03:11 SAL V110831 Esc admin Default Scenario Botha Consolidation 18388 1 of 1 H1 Table 3 Proved+Probable Eagleford Energy Inc. Botha Prod. Start: 2011-09-01 PRODUCTION AND PRICE FORECAST (As of Date: 2011-08-31) Gas Gas Gas Gas Gas Gas Year Wells Daily Gross Co Grs Co Net Price Mcf/d MMcf MMcf MMcf $/Mcf 2011 2 1007 123 6 5 3.70 2012 2 965 353 18 14 4.09 2013 2 904 330 17 13 4.56 2014 2 848 309 16 11 5.36 2015 2 795 290 15 10 6.58 2016 2 745 273 14 10 6.72 2017 2 698 255 13 9 6.86 2018 2 655 239 12 9 7.01 2019 2 614 224 12 8 7.15 2020 2 575 211 11 8 7.30 2021 2 539 197 10 8 7.46 2022 2 506 185 10 7 7.61 2023 2 474 173 9 7 7.76 2024 2 445 163 8 7 7.91 2025 2 417 152 8 6 8.06 2026 2 391 143 7 6 8.22 2027 2 366 134 7 6 8.38 2028 2 343 126 7 5 8.55 2029 2 322 118 6 5 8.71 2030 2 302 110 6 5 8.89 SubT 4106 213 160 19yr 1071 56 51 Total 5177 269 211
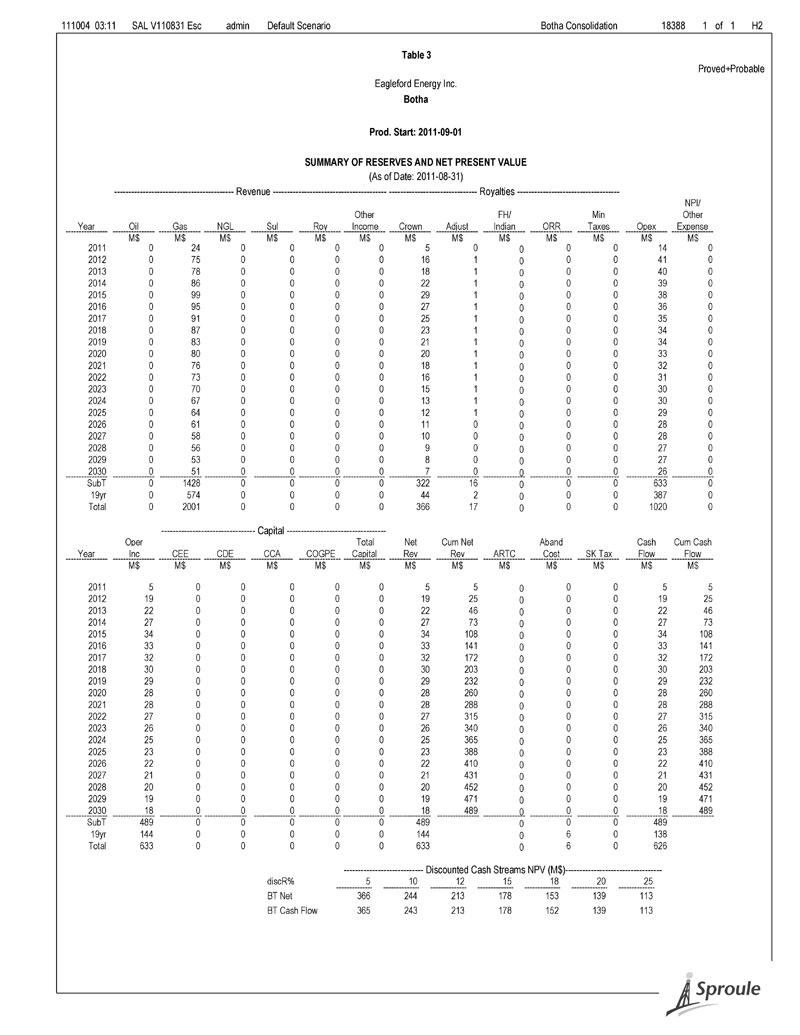
111004 03:11 SAL V110831 Esc admin Default Scenario Botha Consolidation 18388 1 of 1 H2 Table 3 Proved+Probable Eagleford Energy Inc. Botha Prod. Start: 2011-09-01 SUMMARY OF RESERVES AND NET PRESENT VALUE (As of Date: 2011-08-31) ------------------------------------------ Revenue ---------------------------------------- ------------------------------- Royalties ------------------------------------ NPI/ Other FH/ Min Other Year Oil Gas NGL Sul Roy Income Crown Adjust Indian ORR Taxes Opex Expense M$ M$ M$ M$ M$ M$ M$ M$ M$ M$ M$ M$ M$ 2011 0 24 0 0 0 0 5 0 0 0 0 14 0 2012 0 75 0 0 0 0 16 1 0 0 0 41 0 2013 0 78 0 0 0 0 18 1 0 0 0 40 0 2014 0 86 0 0 0 0 22 1 0 0 0 39 0 2015 0 99 0 0 0 0 29 1 0 0 0 38 0 2016 0 95 0 0 0 0 27 1 0 0 0 36 0 2017 0 91 0 0 0 0 25 1 0 0 0 35 0 2018 0 87 0 0 0 0 23 1 0 0 0 34 0 2019 0 83 0 0 0 0 21 1 0 0 0 34 0 2020 0 80 0 0 0 0 20 1 0 0 0 33 0 2021 0 76 0 0 0 0 18 1 0 0 0 32 0 2022 0 73 0 0 0 0 16 1 0 0 0 31 0 2023 0 70 0 0 0 0 15 1 0 0 0 30 0 2024 0 67 0 0 0 0 13 1 0 0 0 30 0 2025 0 64 0 0 0 0 12 1 0 0 0 29 0 2026 0 61 0 0 0 0 11 0 0 0 0 28 0 2027 0 58 0 0 0 0 10 0 0 0 0 28 0 2028 0 56 0 0 0 0 9 0 0 0 0 27 0 2029 0 53 0 0 0 0 8 0 0 0 0 27 0 2030 0 51 0 0 0 0 7 0 0 0 0 26 0 SubT 0 1428 0 0 0 0 322 16 0 0 0 633 0 19yr 0 574 0 0 0 0 44 2 0 0 0 387 0 Total 0 2001 0 0 0 0 366 17 0 0 0 1020 0 --------------------------------- Capital ----------------------------------- Oper Total Net Cum Net Aband Cash Cum Cash Year Inc CEE CDE CCA COGPE Capital Rev Rev ARTC Cost SK Tax Flow Flow M$ M$ M$ M$ M$ M$ M$ M$ M$ M$ M$ M$ M$ 2011 5 0 0 0 0 0 5 5 0 0 0 5 5 2012 19 0 0 0 0 0 19 25 0 0 0 19 25 2013 22 0 0 0 0 0 22 46 0 0 0 22 46 2014 27 0 0 0 0 0 27 73 0 0 0 27 73 2015 34 0 0 0 0 0 34 108 0 0 0 34 108 2016 33 0 0 0 0 0 33 141 0 0 0 33 141 2017 32 0 0 0 0 0 32 172 0 0 0 32 172 2018 30 0 0 0 0 0 30 203 0 0 0 30 203 2019 29 0 0 0 0 0 29 232 0 0 0 29 232 2020 28 0 0 0 0 0 28 260 0 0 0 28 260 2021 28 0 0 0 0 0 28 288 0 0 0 28 288 2022 27 0 0 0 0 0 27 315 0 0 0 27 315 2023 26 0 0 0 0 0 26 340 0 0 0 26 340 2024 25 0 0 0 0 0 25 365 0 0 0 25 365 2025 23 0 0 0 0 0 23 388 0 0 0 23 388 2026 22 0 0 0 0 0 22 410 0 0 0 22 410 2027 21 0 0 0 0 0 21 431 0 0 0 21 431 2028 20 0 0 0 0 0 20 452 0 0 0 20 452 2029 19 0 0 0 0 0 19 471 0 0 0 19 471 2030 18 0 0 0 0 0 18 489 0 0 0 18 489 SubT 489 0 0 0 0 0 489 0 0 0 489 19yr 144 0 0 0 0 0 144 0 6 0 138 Total 633 0 0 0 0 0 633 0 6 0 626 ---------------------------- Discounted Cash Streams NPV (M$)----------------------------------discR% 5 10 12 15 18 20 25 BT Net 366 244 213 178 153 139 113 BT Cash Flow 365 243 213 178 152 139 113
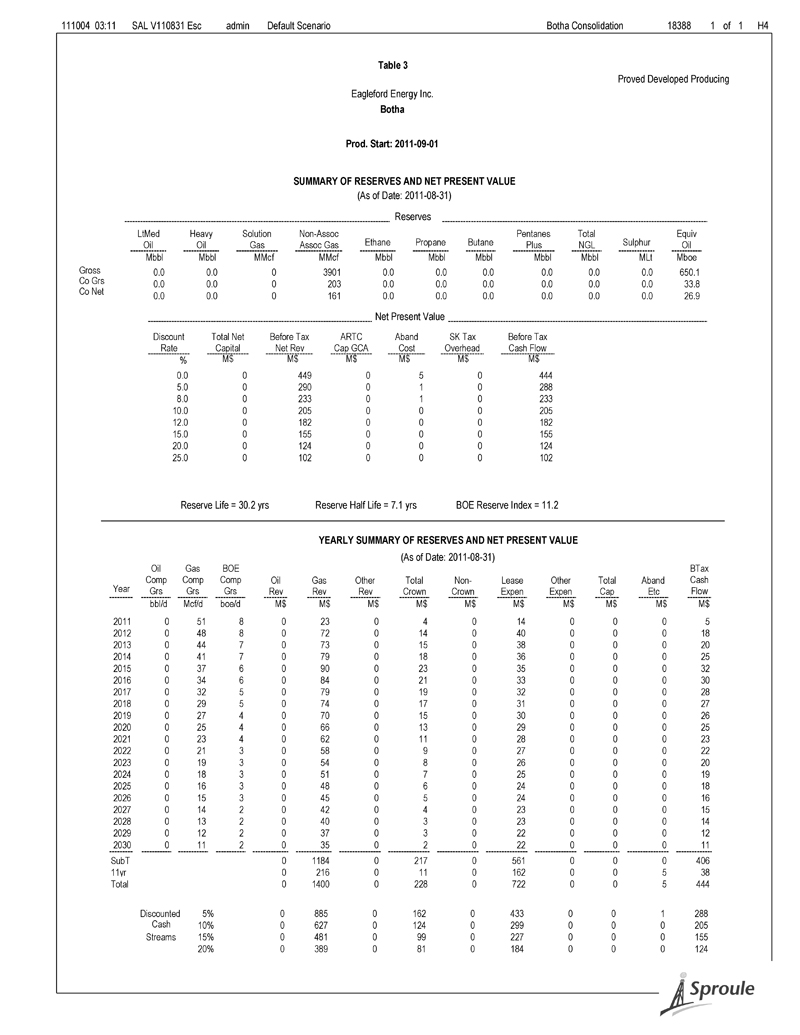
111004 03:11 SAL V110831 Esc admin Default Scenario Botha Consolidation 18388 1 of 1 H4 Table 3 Proved Developed Producing Eagleford Energy Inc. Botha Prod. Start: 2011-09-01 SUMMARY OF RESERVES AND NET PRESENT VALUE (As of Date: 2011-08-31) Reserves LtMed Heavy Solution Non-Assoc Pentanes Total Equiv Oil Oil Gas Assoc Gas Ethane Propane Butane Plus NGL Sulphur Oil Mbbl Mbbl MMcf MMcf Mbbl Mbbl Mbbl Mbbl Mbbl MLt Mboe Gross 0.0 0.0 0 3901 0.0 0.0 0.0 0.0 0.0 0.0 650.1 Co Grs 0.0 0.0 0 203 0.0 0.0 0.0 0.0 0.0 0.0 33.8 Co Net 0.0 0.0 0 161 0.0 0.0 0.0 0.0 0.0 0.0 26.9 Net Present Value Discount Total Net Before Tax ARTC Aband SK Tax Before Tax Rate Capital Net Rev Cap GCA Cost Overhead Cash Flow % M$ M$ M$ M$ M$ M$ 0.0 0 449 0 5 0 444 5.0 0 290 0 1 0 288 8.0 0 233 0 1 0 233 10.0 0 205 0 0 0 205 12.0 0 182 0 0 0 182 15.0 0 155 0 0 0 155 20.0 0 124 0 0 0 124 25.0 0 102 0 0 0 102 Reserve Life = 30.2 yrs Reserve Half Life = 7.1 yrs BOE Reserve Index = 11.2 YEARLY SUMMARY OF RESERVES AND NET PRESENT VALUE (As of Date: 2011-08-31) Oil Gas BOE BTax Comp Comp Comp Oil Gas Other Total Non- Lease Other Total Aband Cash Year Grs Grs Grs Rev Rev Rev Crown Crown Expen Expen Cap Etc Flow bbl/d Mcf/d boe/d M$ M$ M$ M$ M$ M$ M$ M$ M$ M$ 2011 0 51 8 0 23 0 4 0 14 0 0 0 5 2012 0 48 8 0 72 0 14 0 40 0 0 0 18 2013 0 44 7 0 73 0 15 0 38 0 0 0 20 2014 0 41 7 0 79 0 18 0 36 0 0 0 25 2015 0 37 6 0 90 0 23 0 35 0 0 0 32 2016 0 34 6 0 84 0 21 0 33 0 0 0 30 2017 0 32 5 0 79 0 19 0 32 0 0 0 28 2018 0 29 5 0 74 0 17 0 31 0 0 0 27 2019 0 27 4 0 70 0 15 0 30 0 0 0 26 2020 0 25 4 0 66 0 13 0 29 0 0 0 25 2021 0 23 4 0 62 0 11 0 28 0 0 0 23 2022 0 21 3 0 58 0 9 0 27 0 0 0 22 2023 0 19 3 0 54 0 8 0 26 0 0 0 20 2024 0 18 3 0 51 0 7 0 25 0 0 0 19 2025 0 16 3 0 48 0 6 0 24 0 0 0 18 2026 0 15 3 0 45 0 5 0 24 0 0 0 16 2027 0 14 2 0 42 0 4 0 23 0 0 0 15 2028 0 13 2 0 40 0 3 0 23 0 0 0 14 2029 0 12 2 0 37 0 3 0 22 0 0 0 12 2030 0 11 2 0 35 0 2 0 22 0 0 0 11 SubT 0 1184 0 217 0 561 0 0 0 406 11yr 0 216 0 11 0 162 0 0 5 38 Total 0 1400 0 228 0 722 0 0 5 444 Discounted 5% 0 885 0 162 0 433 0 0 1 288 Cash 10% 0 627 0 124 0 299 0 0 0 205 Streams 15% 0 481 0 99 0 227 0 0 0 155 20% 0 389 0 81 0 184 0 0 0 124

111004 03:11 SAL V110831 Esc admin Default Scenario Botha Consolidation 18388 1 of 1 H1 Table 3 Proved Developed Producing Eagleford Energy Inc. Botha Prod. Start: 2011-09-01 PRODUCTION AND PRICE FORECAST (As of Date: 2011-08-31) Gas Gas Gas Gas Gas Gas Year Wells Daily Gross Co Grs Co Net Price Mcf/d MMcf MMcf MMcf $/Mcf 2011 2 974 119 6 5 3.70 2012 2 922 337 18 13 4.09 2013 2 848 310 16 12 4.56 2014 2 780 285 15 11 5.36 2015 2 718 262 14 10 6.58 2016 2 661 242 13 9 6.72 2017 2 608 222 12 8 6.86 2018 2 560 204 11 8 7.01 2019 2 515 188 10 7 7.15 2020 2 474 174 9 7 7.30 2021 2 437 159 8 7 7.46 2022 2 402 147 8 6 7.61 2023 2 370 135 7 6 7.76 2024 2 341 125 6 5 7.91 2025 2 314 114 6 5 8.06 2026 2 289 105 5 5 8.22 2027 2 266 97 5 5 8.38 2028 2 245 90 5 4 8.55 2029 2 225 82 4 4 8.71 2030 2 208 76 4 4 8.89 SubT 3473 181 140 11yr 428 22 21 Total 3901 203 161
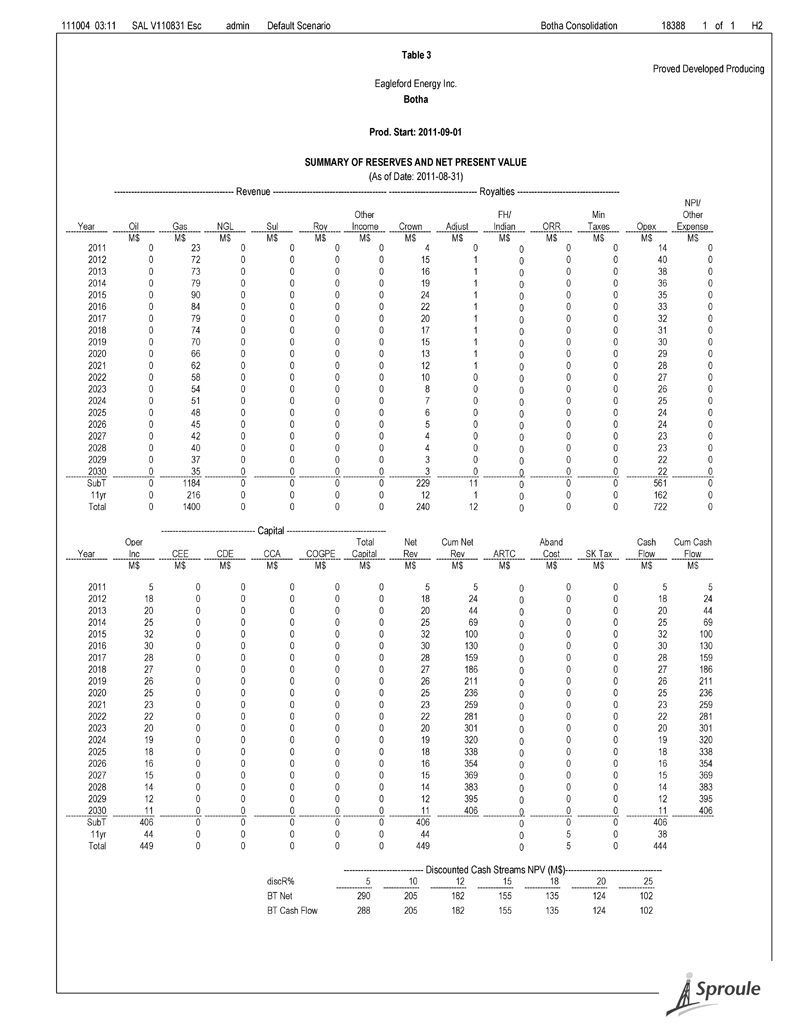
111004 03:11 SAL V110831 Esc admin Default Scenario Botha Consolidation 18388 1 of 1 H2 Table 3 Proved Developed Producing Eagleford Energy Inc. Botha Prod. Start: 2011-09-01 SUMMARY OF RESERVES AND NET PRESENT VALUE (As of Date: 2011-08-31) ------------------------------------------ Revenue ---------------------------------------- ------------------------------- Royalties ------------------------------------ NPI/ Other FH/ Min Other Year Oil Gas NGL Sul Roy Income Crown Adjust Indian ORR Taxes Opex Expense M$ M$ M$ M$ M$ M$ M$ M$ M$ M$ M$ M$ M$ 2011 0 23 0 0 0 0 4 0 0 0 0 14 0 2012 0 72 0 0 0 0 15 1 0 0 0 40 0 2013 0 73 0 0 0 0 16 1 0 0 0 38 0 2014 0 79 0 0 0 0 19 1 0 0 0 36 0 2015 0 90 0 0 0 0 24 1 0 0 0 35 0 2016 0 84 0 0 0 0 22 1 0 0 0 33 0 2017 0 79 0 0 0 0 20 1 0 0 0 32 0 2018 0 74 0 0 0 0 17 1 0 0 0 31 0 2019 0 70 0 0 0 0 15 1 0 0 0 30 0 2020 0 66 0 0 0 0 13 1 0 0 0 29 0 2021 0 62 0 0 0 0 12 1 0 0 0 28 0 2022 0 58 0 0 0 0 10 0 0 0 0 27 0 2023 0 54 0 0 0 0 8 0 0 0 0 26 0 2024 0 51 0 0 0 0 7 0 0 0 0 25 0 2025 0 48 0 0 0 0 6 0 0 0 0 24 0 2026 0 45 0 0 0 0 5 0 0 0 0 24 0 2027 0 42 0 0 0 0 4 0 0 0 0 23 0 2028 0 40 0 0 0 0 4 0 0 0 0 23 0 2029 0 37 0 0 0 0 3 0 0 0 0 22 0 2030 0 35 0 0 0 0 3 0 0 0 0 22 0 SubT 0 1184 0 0 0 0 229 11 0 0 0 561 0 11yr 0 216 0 0 0 0 12 1 0 0 0 162 0 Total 0 1400 0 0 0 0 240 12 0 0 0 722 0 --------------------------------- Capital ----------------------------------- Oper Total Net Cum Net Aband Cash Cum Cash Year Inc CEE CDE CCA COGPE Capital Rev Rev ARTC Cost SK Tax Flow Flow M$ M$ M$ M$ M$ M$ M$ M$ M$ M$ M$ M$ M$ 2011 5 0 0 0 0 0 5 5 0 0 0 5 5 2012 18 0 0 0 0 0 18 24 0 0 0 18 24 2013 20 0 0 0 0 0 20 44 0 0 0 20 44 2014 25 0 0 0 0 0 25 69 0 0 0 25 69 2015 32 0 0 0 0 0 32 100 0 0 0 32 100 2016 30 0 0 0 0 0 30 130 0 0 0 30 130 2017 28 0 0 0 0 0 28 159 0 0 0 28 159 2018 27 0 0 0 0 0 27 186 0 0 0 27 186 2019 26 0 0 0 0 0 26 211 0 0 0 26 211 2020 25 0 0 0 0 0 25 236 0 0 0 25 236 2021 23 0 0 0 0 0 23 259 0 0 0 23 259 2022 22 0 0 0 0 0 22 281 0 0 0 22 281 2023 20 0 0 0 0 0 20 301 0 0 0 20 301 2024 19 0 0 0 0 0 19 320 0 0 0 19 320 2025 18 0 0 0 0 0 18 338 0 0 0 18 338 2026 16 0 0 0 0 0 16 354 0 0 0 16 354 2027 15 0 0 0 0 0 15 369 0 0 0 15 369 2028 14 0 0 0 0 0 14 383 0 0 0 14 383 2029 12 0 0 0 0 0 12 395 0 0 0 12 395 2030 11 0 0 0 0 0 11 406 0 0 0 11 406 SubT 406 0 0 0 0 0 406 0 0 0 406 11yr 44 0 0 0 0 0 44 0 5 0 38 Total 449 0 0 0 0 0 449 0 5 0 444 ---------------------------- Discounted Cash Streams NPV (M$)----------------------------------discR% 5 10 12 15 18 20 25 BT Net 290 205 182 155 135 124 102 BT Cash Flow 288 205 182 155 135 124 102
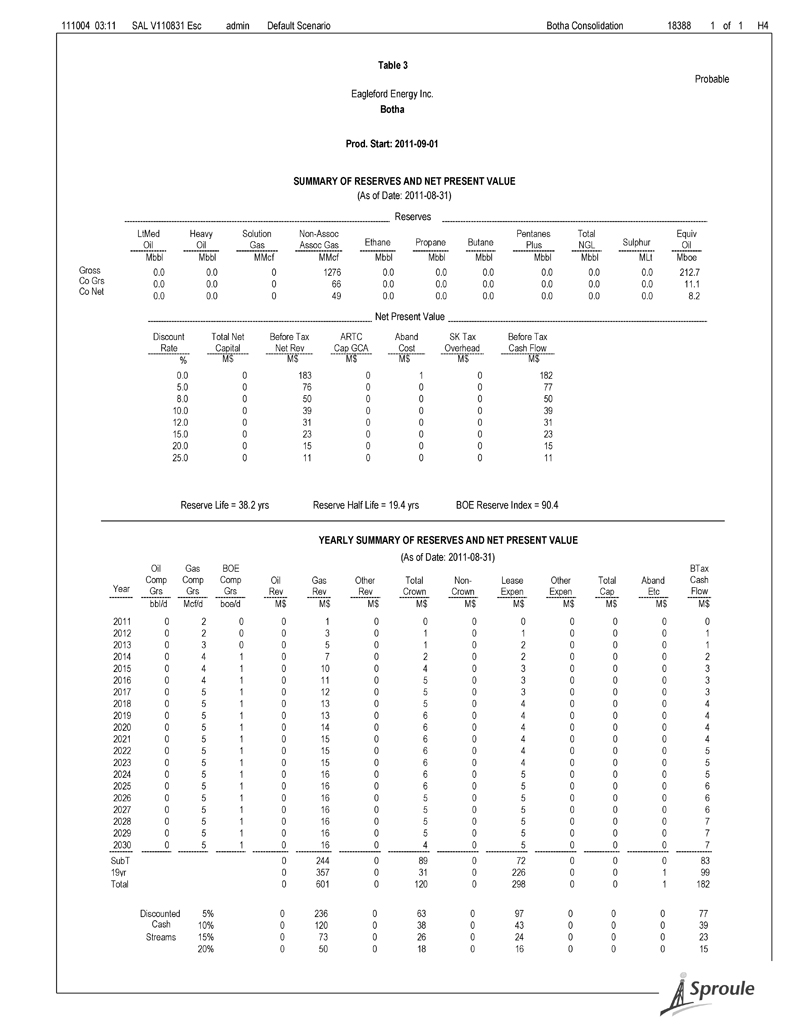
111004 03:11 SAL V110831 Esc admin Default Scenario Botha Consolidation 18388 1 of 1 H4 Table 3 Probable Eagleford Energy Inc. Botha Prod. Start: 2011-09-01 SUMMARY OF RESERVES AND NET PRESENT VALUE (As of Date: 2011-08-31) Reserves LtMed Heavy Solution Non-Assoc Pentanes Total Equiv Oil Oil Gas Assoc Gas Ethane Propane Butane Plus NGL Sulphur Oil Mbbl Mbbl MMcf MMcf Mbbl Mbbl Mbbl Mbbl Mbbl MLt Mboe Gross 0.0 0.0 0 1276 0.0 0.0 0.0 0.0 0.0 0.0 212.7 Co Grs 0.0 0.0 0 66 0.0 0.0 0.0 0.0 0.0 0.0 11.1 Co Net 0.0 0.0 0 49 0.0 0.0 0.0 0.0 0.0 0.0 8.2 Net Present Value Discount Total Net Before Tax ARTC Aband SK Tax Before Tax Rate Capital Net Rev Cap GCA Cost Overhead Cash Flow % M$ M$ M$ M$ M$ M$ 0.0 0 183 0 1 0 182 5.0 0 76 0 0 0 77 8.0 0 50 0 0 0 50 10.0 0 39 0 0 0 39 12.0 0 31 0 0 0 31 15.0 0 23 0 0 0 23 20.0 0 15 0 0 0 15 25.0 0 11 0 0 0 11 Reserve Life = 38.2 yrs Reserve Half Life = 19.4 yrs BOE Reserve Index = 90.4 YEARLY SUMMARY OF RESERVES AND NET PRESENT VALUE (As of Date: 2011-08-31) Oil Gas BOE BTax Comp Comp Comp Oil Gas Other Total Non- Lease Other Total Aband Cash Year Grs Grs Grs Rev Rev Rev Crown Crown Expen Expen Cap Etc Flow bbl/d Mcf/d boe/d M$ M$ M$ M$ M$ M$ M$ M$ M$ M$ 2011 0 2 0 0 1 0 0 0 0 0 0 0 0 2012 0 2 0 0 3 0 1 0 1 0 0 0 1 2013 0 3 0 0 5 0 1 0 2 0 0 0 1 2014 0 4 1 0 7 0 2 0 2 0 0 0 2 2015 0 4 1 0 10 0 4 0 3 0 0 0 3 2016 0 4 1 0 11 0 5 0 3 0 0 0 3 2017 0 5 1 0 12 0 5 0 3 0 0 0 3 2018 0 5 1 0 13 0 5 0 4 0 0 0 4 2019 0 5 1 0 13 0 6 0 4 0 0 0 4 2020 0 5 1 0 14 0 6 0 4 0 0 0 4 2021 0 5 1 0 15 0 6 0 4 0 0 0 4 2022 0 5 1 0 15 0 6 0 4 0 0 0 5 2023 0 5 1 0 15 0 6 0 4 0 0 0 5 2024 0 5 1 0 16 0 6 0 5 0 0 0 5 2025 0 5 1 0 16 0 6 0 5 0 0 0 6 2026 0 5 1 0 16 0 5 0 5 0 0 0 6 2027 0 5 1 0 16 0 5 0 5 0 0 0 6 2028 0 5 1 0 16 0 5 0 5 0 0 0 7 2029 0 5 1 0 16 0 5 0 5 0 0 0 7 2030 0 5 1 0 16 0 4 0 5 0 0 0 7 SubT 0 244 0 89 0 72 0 0 0 83 19yr 0 357 0 31 0 226 0 0 1 99 Total 0 601 0 120 0 298 0 0 1 182 Discounted 5% 0 236 0 63 0 97 0 0 0 77 Cash 10% 0 120 0 38 0 43 0 0 0 39 Streams 15% 0 73 0 26 0 24 0 0 0 23 20% 0 50 0 18 0 16 0 0 0 15
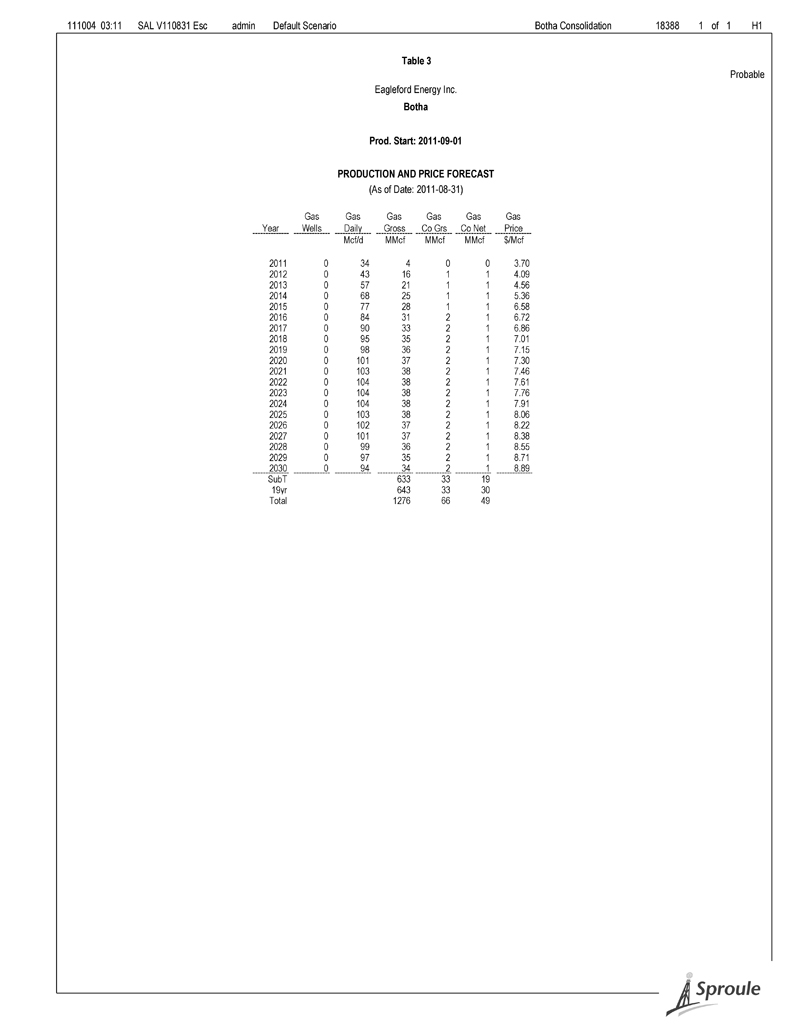
111004 03:11 SAL V110831 Esc admin Default Scenario Botha Consolidation 18388 1 of 1 H1 Table 3 Probable Eagleford Energy Inc. Botha Prod. Start: 2011-09-01 PRODUCTION AND PRICE FORECAST (As of Date: 2011-08-31) Gas Gas Gas Gas Gas Gas Year Wells Daily Gross Co Grs Co Net Price Mcf/d MMcf MMcf MMcf $/Mcf 2011 0 34 4 0 0 3.70 2012 0 43 16 1 1 4.09 2013 0 57 21 1 1 4.56 2014 0 68 25 1 1 5.36 2015 0 77 28 1 1 6.58 2016 0 84 31 2 1 6.72 2017 0 90 33 2 1 6.86 2018 0 95 35 2 1 7.01 2019 0 98 36 2 1 7.15 2020 0 101 37 2 1 7.30 2021 0 103 38 2 1 7.46 2022 0 104 38 2 1 7.61 2023 0 104 38 2 1 7.76 2024 0 104 38 2 1 7.91 2025 0 103 38 2 1 8.06 2026 0 102 37 2 1 8.22 2027 0 101 37 2 1 8.38 2028 0 99 36 2 1 8.55 2029 0 97 35 2 1 8.71 2030 0 94 34 2 1 8.89 SubT 633 33 19 19yr 643 33 30 Total 1276 66 49
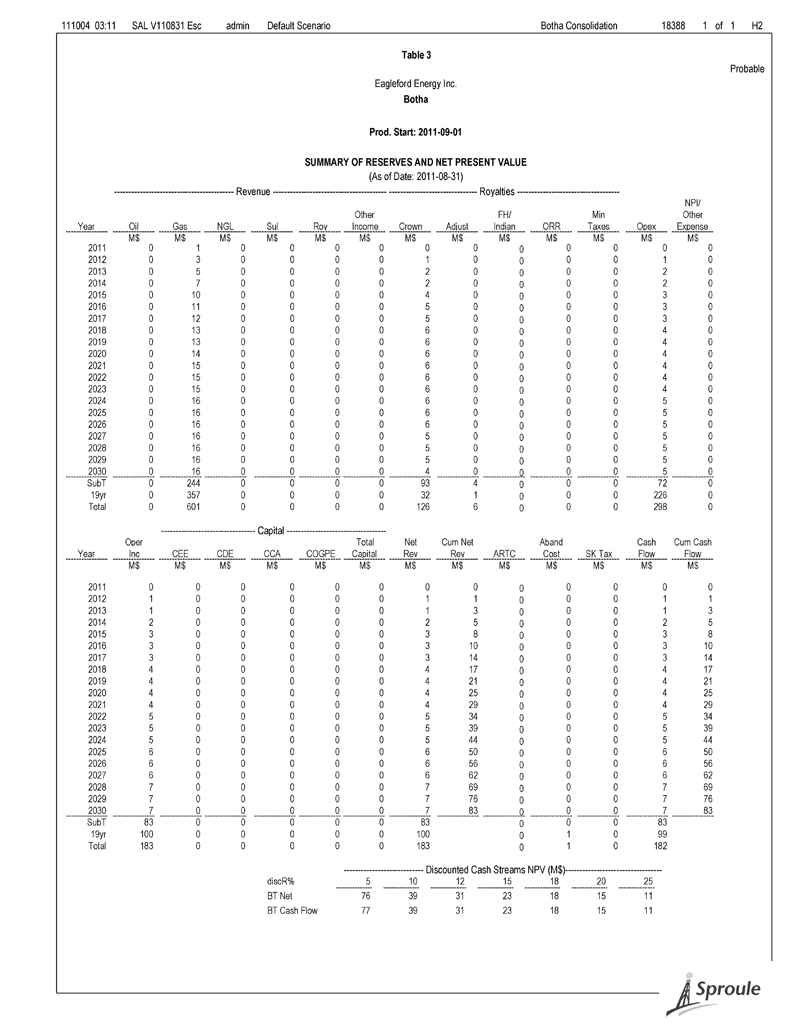
111004 03:11 SAL V110831 Esc admin Default Scenario Botha Consolidation 18388 1 of 1 H2 Table 3 Probable Eagleford Energy Inc. Botha Prod. Start: 2011-09-01 SUMMARY OF RESERVES AND NET PRESENT VALUE (As of Date: 2011-08-31) ------------------------------------------ Revenue ---------------------------------------- ------------------------------- Royalties ------------------------------------ NPI/ Other FH/ Min Other Year Oil Gas NGL Sul Roy Income Crown Adjust Indian ORR Taxes Opex Expense M$ M$ M$ M$ M$ M$ M$ M$ M$ M$ M$ M$ M$ 2011 0 1 0 0 0 0 0 0 0 0 0 0 0 2012 0 3 0 0 0 0 1 0 0 0 0 1 0 2013 0 5 0 0 0 0 2 0 0 0 0 2 0 2014 0 7 0 0 0 0 2 0 0 0 0 2 0 2015 0 10 0 0 0 0 4 0 0 0 0 3 0 2016 0 11 0 0 0 0 5 0 0 0 0 3 0 2017 0 12 0 0 0 0 5 0 0 0 0 3 0 2018 0 13 0 0 0 0 6 0 0 0 0 4 0 2019 0 13 0 0 0 0 6 0 0 0 0 4 0 2020 0 14 0 0 0 0 6 0 0 0 0 4 0 2021 0 15 0 0 0 0 6 0 0 0 0 4 0 2022 0 15 0 0 0 0 6 0 0 0 0 4 0 2023 0 15 0 0 0 0 6 0 0 0 0 4 0 2024 0 16 0 0 0 0 6 0 0 0 0 5 0 2025 0 16 0 0 0 0 6 0 0 0 0 5 0 2026 0 16 0 0 0 0 6 0 0 0 0 5 0 2027 0 16 0 0 0 0 5 0 0 0 0 5 0 2028 0 16 0 0 0 0 5 0 0 0 0 5 0 2029 0 16 0 0 0 0 5 0 0 0 0 5 0 2030 0 16 0 0 0 0 4 0 0 0 0 5 0 SubT 0 244 0 0 0 0 93 4 0 0 0 72 0 19yr 0 357 0 0 0 0 32 1 0 0 0 226 0 Total 0 601 0 0 0 0 126 6 0 0 0 298 0 --------------------------------- Capital ----------------------------------- Oper Total Net Cum Net Aband Cash Cum Cash Year Inc CEE CDE CCA COGPE Capital Rev Rev ARTC Cost SK Tax Flow Flow M$ M$ M$ M$ M$ M$ M$ M$ M$ M$ M$ M$ M$ 2011 0 0 0 0 0 0 0 0 0 0 0 0 0 2012 1 0 0 0 0 0 1 1 0 0 0 1 1 2013 1 0 0 0 0 0 1 3 0 0 0 1 3 2014 2 0 0 0 0 0 2 5 0 0 0 2 5 2015 3 0 0 0 0 0 3 8 0 0 0 3 8 2016 3 0 0 0 0 0 3 10 0 0 0 3 10 2017 3 0 0 0 0 0 3 14 0 0 0 3 14 2018 4 0 0 0 0 0 4 17 0 0 0 4 17 2019 4 0 0 0 0 0 4 21 0 0 0 4 21 2020 4 0 0 0 0 0 4 25 0 0 0 4 25 2021 4 0 0 0 0 0 4 29 0 0 0 4 29 2022 5 0 0 0 0 0 5 34 0 0 0 5 34 2023 5 0 0 0 0 0 5 39 0 0 0 5 39 2024 5 0 0 0 0 0 5 44 0 0 0 5 44 2025 6 0 0 0 0 0 6 50 0 0 0 6 50 2026 6 0 0 0 0 0 6 56 0 0 0 6 56 2027 6 0 0 0 0 0 6 62 0 0 0 6 62 2028 7 0 0 0 0 0 7 69 0 0 0 7 69 2029 7 0 0 0 0 0 7 76 0 0 0 7 76 2030 7 0 0 0 0 0 7 83 0 0 0 7 83 SubT 83 0 0 0 0 0 83 0 0 0 83 19yr 100 0 0 0 0 0 100 0 1 0 99 Total 183 0 0 0 0 0 183 0 1 0 182 ---------------------------- Discounted Cash Streams NPV (M$)----------------------------------discR% 5 10 12 15 18 20 25 BT Net 76 39 31 23 18 15 11 BT Cash Flow 77 39 31 23 18 15 11

111004 03:12 SAL V110831 Esc admin Default Scenario 100/06-14-098-05W6/0 18388 1 of 1 H4 Table 3 Proved Developed Producing Eagleford Energy Inc. Botha 100/06-14-098-05W6/0 Zone: Debolt A, Prod. Start: 2011-09-01 SUMMARY OF RESERVES AND NET PRESENT VALUE (As of Date: 2011-08-31) Reserves LtMed Heavy Solution Non-Assoc Pentanes Total Equiv Oil Oil Gas Assoc Gas Ethane Propane Butane Plus NGL Sulphur Oil Mbbl Mbbl MMcf MMcf Mbbl Mbbl Mbbl Mbbl Mbbl MLt Mboe Gross 0.0 0.0 0 2316 0.0 0.0 0.0 0.0 0.0 0.0 386.0 Co Grs 0.0 0.0 0 120 0.0 0.0 0.0 0.0 0.0 0.0 20.1 Co Net 0.0 0.0 0 94 0.0 0.0 0.0 0.0 0.0 0.0 15.7 Net Present Value Discount Total Net Before Tax ARTC Aband SK Tax Before Tax Rate Capital Net Rev Cap GCA Cost Overhead Cash Flow % M$ M$ M$ M$ M$ M$ 0.0 0 272 0 3 0 269 5.0 0 169 0 1 0 169 8.0 0 135 0 0 0 134 10.0 0 118 0 0 0 117 12.0 0 104 0 0 0 104 15.0 0 88 0 0 0 88 20.0 0 70 0 0 0 70 25.0 0 57 0 0 0 57 Reserve Life = 30.2 yrs Reserve Half Life = 7.7 yrs BOE Reserve Index = 12.1 YEARLY SUMMARY OF RESERVES AND NET PRESENT VALUE (As of Date: 2011-08-31) Oil Gas BOE BTax Comp Comp Comp Oil Gas Other Total Non- Lease Other Total Aband Cash Year Grs Grs Grs Rev Rev Rev Crown Crown Expen Expen Cap Etc Flow bbl/d Mcf/d boe/d M$ M$ M$ M$ M$ M$ M$ M$ M$ M$ 2011 0 28 5 0 13 0 2 0 7 0 0 0 3 2012 0 27 4 0 40 0 8 0 22 0 0 0 10 2013 0 25 4 0 41 0 9 0 21 0 0 0 11 2014 0 23 4 0 44 0 11 0 20 0 0 0 14 2015 0 21 4 0 50 0 14 0 19 0 0 0 18 2016 0 19 3 0 48 0 13 0 18 0 0 0 17 2017 0 18 3 0 45 0 12 0 18 0 0 0 16 2018 0 17 3 0 43 0 11 0 17 0 0 0 15 2019 0 15 3 0 40 0 10 0 16 0 0 0 14 2020 0 14 2 0 38 0 8 0 16 0 0 0 14 2021 0 13 2 0 36 0 7 0 15 0 0 0 13 2022 0 12 2 0 34 0 6 0 15 0 0 0 13 2023 0 11 2 0 32 0 6 0 14 0 0 0 12 2024 0 10 2 0 30 0 5 0 14 0 0 0 11 2025 0 10 2 0 28 0 4 0 14 0 0 0 10 2026 0 9 1 0 27 0 4 0 13 0 0 0 10 2027 0 8 1 0 25 0 3 0 13 0 0 0 9 2028 0 8 1 0 24 0 3 0 13 0 0 0 9 2029 0 7 1 0 23 0 2 0 12 0 0 0 8 2030 0 7 1 0 21 0 2 0 12 0 0 0 7 SubT 0 683 0 140 0 308 0 0 0 234 11yr 0 166 0 9 0 120 0 0 3 35 Total 0 849 0 149 0 428 0 0 3 269 Discounted 5% 0 519 0 103 0 246 0 0 1 169 Cash 10% 0 361 0 77 0 166 0 0 0 117 Streams 15% 0 274 0 61 0 125 0 0 0 88 20% 0 220 0 50 0 101 0 0 0 70
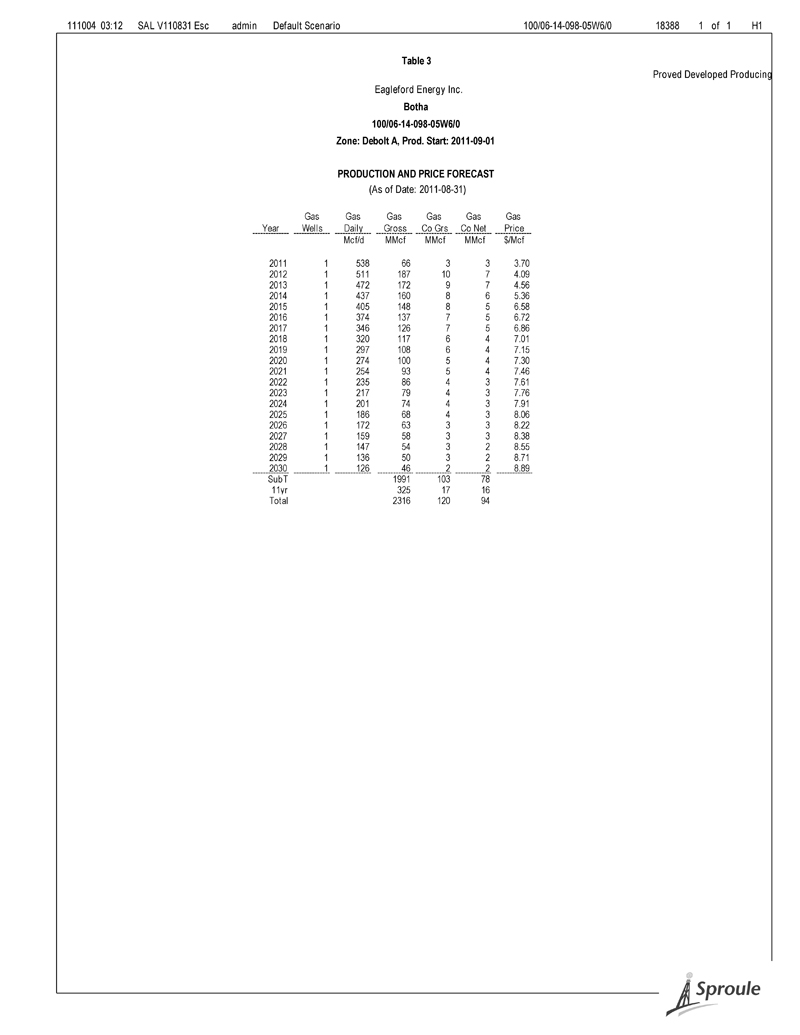
111004 03:12 SAL V110831 Esc admin Default Scenario 100/06-14-098-05W6/0 18388 1 of 1 H1 Table 3 Proved Developed Producing Eagleford Energy Inc. Botha 100/06-14-098-05W6/0 Zone: Debolt A, Prod. Start: 2011-09-01 PRODUCTION AND PRICE FORECAST (As of Date: 2011-08-31) Gas Gas Gas Gas Gas Gas Year Wells Daily Gross Co Grs Co Net Price Mcf/d MMcf MMcf MMcf $/Mcf 2011 1 538 66 3 3 3.70 2012 1 511 187 10 7 4.09 2013 1 472 172 9 7 4.56 2014 1 437 160 8 6 5.36 2015 1 405 148 8 5 6.58 2016 1 374 137 7 5 6.72 2017 1 346 126 7 5 6.86 2018 1 320 117 6 4 7.01 2019 1 297 108 6 4 7.15 2020 1 274 100 5 4 7.30 2021 1 254 93 5 4 7.46 2022 1 235 86 4 3 7.61 2023 1 217 79 4 3 7.76 2024 1 201 74 4 3 7.91 2025 1 186 68 4 3 8.06 2026 1 172 63 3 3 8.22 2027 1 159 58 3 3 8.38 2028 1 147 54 3 2 8.55 2029 1 136 50 3 2 8.71 2030 1 126 46 2 2 8.89 SubT 1991 103 78 11yr 325 17 16 Total 2316 120 94
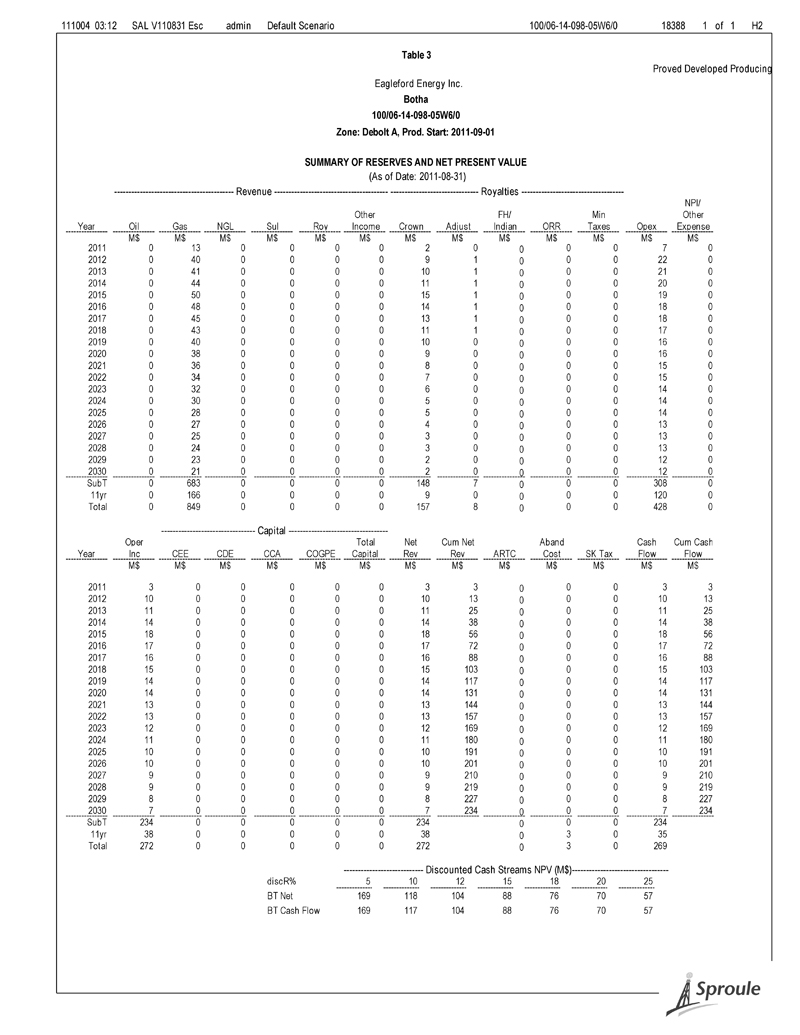
111004 03:12 SAL V110831 Esc admin Default Scenario 100/06-14-098-05W6/0 18388 1 of 1 H2 Table 3 Proved Developed Producing Eagleford Energy Inc. Botha 100/06-14-098-05W6/0 Zone: Debolt A, Prod. Start: 2011-09-01 SUMMARY OF RESERVES AND NET PRESENT VALUE (As of Date: 2011-08-31) ------------------------------------------ Revenue ---------------------------------------- ------------------------------- Royalties ------------------------------------ NPI/ Other FH/ Min Other Year Oil Gas NGL Sul Roy Income Crown Adjust Indian ORR Taxes Opex Expense M$ M$ M$ M$ M$ M$ M$ M$ M$ M$ M$ M$ M$ 2011 0 13 0 0 0 0 2 0 0 0 0 7 0 2012 0 40 0 0 0 0 9 1 0 0 0 22 0 2013 0 41 0 0 0 0 10 1 0 0 0 21 0 2014 0 44 0 0 0 0 11 1 0 0 0 20 0 2015 0 50 0 0 0 0 15 1 0 0 0 19 0 2016 0 48 0 0 0 0 14 1 0 0 0 18 0 2017 0 45 0 0 0 0 13 1 0 0 0 18 0 2018 0 43 0 0 0 0 11 1 0 0 0 17 0 2019 0 40 0 0 0 0 10 0 0 0 0 16 0 2020 0 38 0 0 0 0 9 0 0 0 0 16 0 2021 0 36 0 0 0 0 8 0 0 0 0 15 0 2022 0 34 0 0 0 0 7 0 0 0 0 15 0 2023 0 32 0 0 0 0 6 0 0 0 0 14 0 2024 0 30 0 0 0 0 5 0 0 0 0 14 0 2025 0 28 0 0 0 0 5 0 0 0 0 14 0 2026 0 27 0 0 0 0 4 0 0 0 0 13 0 2027 0 25 0 0 0 0 3 0 0 0 0 13 0 2028 0 24 0 0 0 0 3 0 0 0 0 13 0 2029 0 23 0 0 0 0 2 0 0 0 0 12 0 2030 0 21 0 0 0 0 2 0 0 0 0 12 0 SubT 0 683 0 0 0 0 148 7 0 0 0 308 0 11yr 0 166 0 0 0 0 9 0 0 0 0 120 0 Total 0 849 0 0 0 0 157 8 0 0 0 428 0 --------------------------------- Capital ----------------------------------- Oper Total Net Cum Net Aband Cash Cum Cash Year Inc CEE CDE CCA COGPE Capital Rev Rev ARTC Cost SK Tax Flow Flow M$ M$ M$ M$ M$ M$ M$ M$ M$ M$ M$ M$ M$ 2011 3 0 0 0 0 0 3 3 0 0 0 3 3 2012 10 0 0 0 0 0 10 13 0 0 0 10 13 2013 11 0 0 0 0 0 11 25 0 0 0 11 25 2014 14 0 0 0 0 0 14 38 0 0 0 14 38 2015 18 0 0 0 0 0 18 56 0 0 0 18 56 2016 17 0 0 0 0 0 17 72 0 0 0 17 72 2017 16 0 0 0 0 0 16 88 0 0 0 16 88 2018 15 0 0 0 0 0 15 103 0 0 0 15 103 2019 14 0 0 0 0 0 14 117 0 0 0 14 117 2020 14 0 0 0 0 0 14 131 0 0 0 14 131 2021 13 0 0 0 0 0 13 144 0 0 0 13 144 2022 13 0 0 0 0 0 13 157 0 0 0 13 157 2023 12 0 0 0 0 0 12 169 0 0 0 12 169 2024 11 0 0 0 0 0 11 180 0 0 0 11 180 2025 10 0 0 0 0 0 10 191 0 0 0 10 191 2026 10 0 0 0 0 0 10 201 0 0 0 10 201 2027 9 0 0 0 0 0 9 210 0 0 0 9 210 2028 9 0 0 0 0 0 9 219 0 0 0 9 219 2029 8 0 0 0 0 0 8 227 0 0 0 8 227 2030 7 0 0 0 0 0 7 234 0 0 0 7 234 SubT 234 0 0 0 0 0 234 0 0 0 234 11yr 38 0 0 0 0 0 38 0 3 0 35 Total 272 0 0 0 0 0 272 0 3 0 269 ---------------------------- Discounted Cash Streams NPV (M$)----------------------------------discR% 5 10 12 15 18 20 25 BT Net 169 118 104 88 76 70 57 BT Cash Flow 169 117 104 88 76 70 57

111004 03:12 SAL V110831 Esc admin Default Scenario 100/06-14-098-05W6/0 18388 1 of 1 H4 Table 3 Proved+Probable Developed Producing Eagleford Energy Inc. Botha 100/06-14-098-05W6/0 Zone: Debolt A, Prod. Start: 2011-09-01 SUMMARY OF RESERVES AND NET PRESENT VALUE (As of Date: 2011-08-31) Reserves LtMed Heavy Solution Non-Assoc Pentanes Total Equiv Oil Oil Gas Assoc Gas Ethane Propane Butane Plus NGL Sulphur Oil Mbbl Mbbl MMcf MMcf Mbbl Mbbl Mbbl Mbbl Mbbl MLt Mboe Gross 0.0 0.0 0 2943 0.0 0.0 0.0 0.0 0.0 0.0 490.5 Co Grs 0.0 0.0 0 153 0.0 0.0 0.0 0.0 0.0 0.0 25.5 Co Net 0.0 0.0 0 118 0.0 0.0 0.0 0.0 0.0 0.0 19.7 Net Present Value Discount Total Net Before Tax ARTC Aband SK Tax Before Tax Rate Capital Net Rev Cap GCA Cost Overhead Cash Flow % M$ M$ M$ M$ M$ M$ 0.0 0 365 0 3 0 361 5.0 0 204 0 1 0 204 8.0 0 156 0 0 0 156 10.0 0 134 0 0 0 134 12.0 0 116 0 0 0 116 15.0 0 97 0 0 0 97 20.0 0 75 0 0 0 75 25.0 0 61 0 0 0 61 Reserve Life = 38.2 yrs Reserve Half Life = 9.8 yrs BOE Reserve Index = 15.2 YEARLY SUMMARY OF RESERVES AND NET PRESENT VALUE (As of Date: 2011-08-31) Oil Gas BOE BTax Comp Comp Comp Oil Gas Other Total Non- Lease Other Total Aband Cash Year Grs Grs Grs Rev Rev Rev Crown Crown Expen Expen Cap Etc Flow bbl/d Mcf/d boe/d M$ M$ M$ M$ M$ M$ M$ M$ M$ M$ 2011 0 28 5 0 13 0 2 0 7 0 0 0 3 2012 0 27 4 0 40 0 8 0 22 0 0 0 10 2013 0 25 4 0 42 0 9 0 21 0 0 0 12 2014 0 24 4 0 47 0 12 0 21 0 0 0 14 2015 0 22 4 0 54 0 15 0 20 0 0 0 19 2016 0 21 4 0 52 0 15 0 19 0 0 0 18 2017 0 20 3 0 50 0 14 0 19 0 0 0 17 2018 0 19 3 0 48 0 13 0 18 0 0 0 16 2019 0 18 3 0 46 0 12 0 18 0 0 0 16 2020 0 17 3 0 44 0 11 0 18 0 0 0 15 2021 0 16 3 0 42 0 10 0 17 0 0 0 15 2022 0 15 2 0 41 0 9 0 17 0 0 0 14 2023 0 14 2 0 39 0 9 0 16 0 0 0 14 2024 0 13 2 0 37 0 8 0 16 0 0 0 14 2025 0 12 2 0 36 0 7 0 16 0 0 0 13 2026 0 11 2 0 34 0 7 0 15 0 0 0 12 2027 0 11 2 0 33 0 6 0 15 0 0 0 12 2028 0 10 2 0 32 0 6 0 15 0 0 0 11 2029 0 10 2 0 30 0 5 0 15 0 0 0 11 2030 0 9 1 0 29 0 5 0 14 0 0 0 10 SubT 0 788 0 182 0 339 0 0 0 267 19yr 0 373 0 31 0 244 0 0 3 95 Total 0 1161 0 213 0 583 0 0 3 361 Discounted 5% 0 628 0 134 0 290 0 0 1 204 Cash 10% 0 412 0 95 0 184 0 0 0 134 Streams 15% 0 303 0 72 0 134 0 0 0 97 20% 0 239 0 57 0 107 0 0 0 75
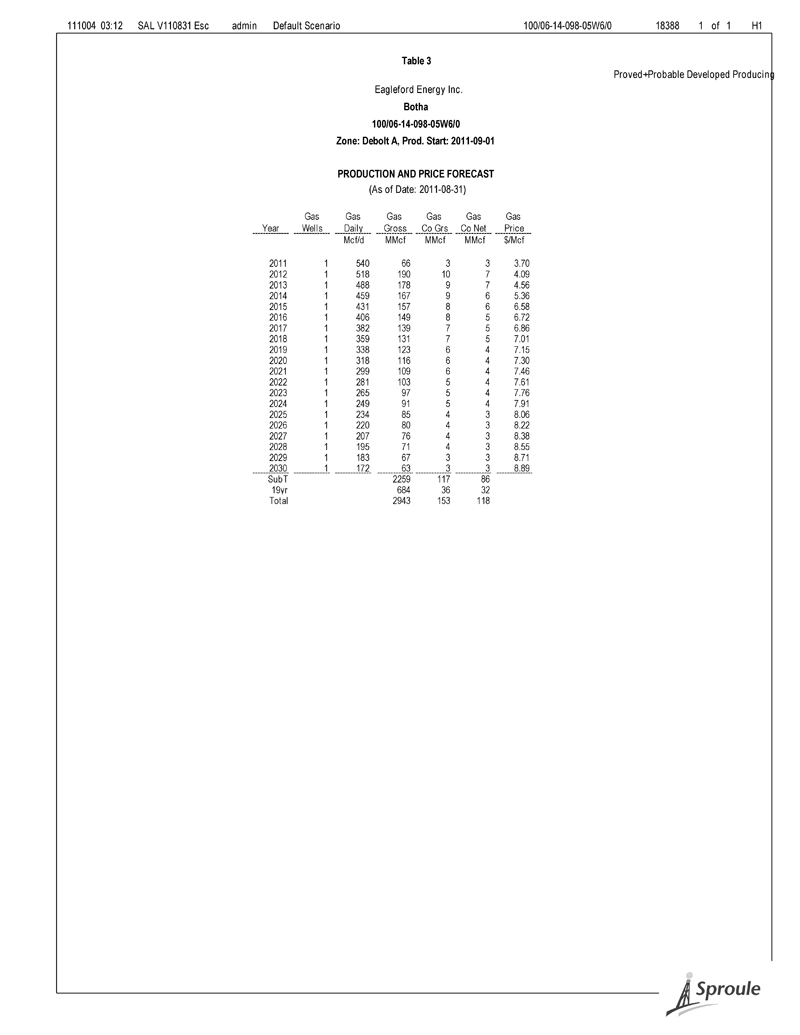
111004 03:12 SAL V110831 Esc admin Default Scenario 100/06-14-098-05W6/0 18388 1 of 1 H1 Table 3 Proved+Probable Developed Producing Eagleford Energy Inc. Botha 100/06-14-098-05W6/0 Zone: Debolt A, Prod. Start: 2011-09-01 PRODUCTION AND PRICE FORECAST (As of Date: 2011-08-31) Gas Gas Gas Gas Gas Gas Year Wells Daily Gross Co Grs Co Net Price Mcf/d MMcf MMcf MMcf $/Mcf 2011 1 540 66 3 3 3.70 2012 1 518 190 10 7 4.09 2013 1 488 178 9 7 4.56 2014 1 459 167 9 6 5.36 2015 1 431 157 8 6 6.58 2016 1 406 149 8 5 6.72 2017 1 382 139 7 5 6.86 2018 1 359 131 7 5 7.01 2019 1 338 123 6 4 7.15 2020 1 318 116 6 4 7.30 2021 1 299 109 6 4 7.46 2022 1 281 103 5 4 7.61 2023 1 265 97 5 4 7.76 2024 1 249 91 5 4 7.91 2025 1 234 85 4 3 8.06 2026 1 220 80 4 3 8.22 2027 1 207 76 4 3 8.38 2028 1 195 71 4 3 8.55 2029 1 183 67 3 3 8.71 2030 1 172 63 3 3 8.89 SubT 2259 117 86 19yr 684 36 32 Total 2943 153 118
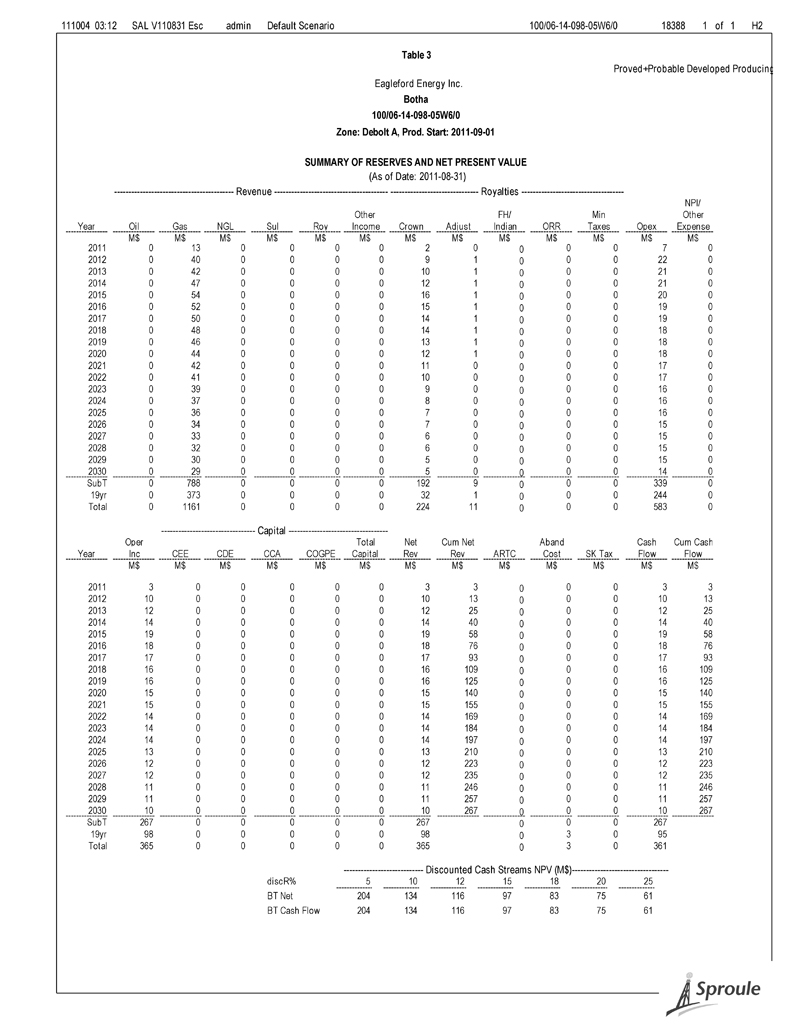
111004 03:12 SAL V110831 Esc admin Default Scenario 100/06-14-098-05W6/0 18388 1 of 1 H2 Table 3 Proved+Probable Developed Producing Eagleford Energy Inc. Botha 100/06-14-098-05W6/0 Zone: Debolt A, Prod. Start: 2011-09-01 SUMMARY OF RESERVES AND NET PRESENT VALUE (As of Date: 2011-08-31) ------------------------------------------ Revenue ---------------------------------------- ------------------------------- Royalties ------------------------------------ NPI/ Other FH/ Min Other Year Oil Gas NGL Sul Roy Income Crown Adjust Indian ORR Taxes Opex Expense M$ M$ M$ M$ M$ M$ M$ M$ M$ M$ M$ M$ M$ 2011 0 13 0 0 0 0 2 0 0 0 0 7 0 2012 0 40 0 0 0 0 9 1 0 0 0 22 0 2013 0 42 0 0 0 0 10 1 0 0 0 21 0 2014 0 47 0 0 0 0 12 1 0 0 0 21 0 2015 0 54 0 0 0 0 16 1 0 0 0 20 0 2016 0 52 0 0 0 0 15 1 0 0 0 19 0 2017 0 50 0 0 0 0 14 1 0 0 0 19 0 2018 0 48 0 0 0 0 14 1 0 0 0 18 0 2019 0 46 0 0 0 0 13 1 0 0 0 18 0 2020 0 44 0 0 0 0 12 1 0 0 0 18 0 2021 0 42 0 0 0 0 11 0 0 0 0 17 0 2022 0 41 0 0 0 0 10 0 0 0 0 17 0 2023 0 39 0 0 0 0 9 0 0 0 0 16 0 2024 0 37 0 0 0 0 8 0 0 0 0 16 0 2025 0 36 0 0 0 0 7 0 0 0 0 16 0 2026 0 34 0 0 0 0 7 0 0 0 0 15 0 2027 0 33 0 0 0 0 6 0 0 0 0 15 0 2028 0 32 0 0 0 0 6 0 0 0 0 15 0 2029 0 30 0 0 0 0 5 0 0 0 0 15 0 2030 0 29 0 0 0 0 5 0 0 0 0 14 0 SubT 0 788 0 0 0 0 192 9 0 0 0 339 0 19yr 0 373 0 0 0 0 32 1 0 0 0 244 0 Total 0 1161 0 0 0 0 224 11 0 0 0 583 0 --------------------------------- Capital ----------------------------------- Oper Total Net Cum Net Aband Cash Cum Cash Year Inc CEE CDE CCA COGPE Capital Rev Rev ARTC Cost SK Tax Flow Flow M$ M$ M$ M$ M$ M$ M$ M$ M$ M$ M$ M$ M$ 2011 3 0 0 0 0 0 3 3 0 0 0 3 3 2012 10 0 0 0 0 0 10 13 0 0 0 10 13 2013 12 0 0 0 0 0 12 25 0 0 0 12 25 2014 14 0 0 0 0 0 14 40 0 0 0 14 40 2015 19 0 0 0 0 0 19 58 0 0 0 19 58 2016 18 0 0 0 0 0 18 76 0 0 0 18 76 2017 17 0 0 0 0 0 17 93 0 0 0 17 93 2018 16 0 0 0 0 0 16 109 0 0 0 16 109 2019 16 0 0 0 0 0 16 125 0 0 0 16 125 2020 15 0 0 0 0 0 15 140 0 0 0 15 140 2021 15 0 0 0 0 0 15 155 0 0 0 15 155 2022 14 0 0 0 0 0 14 169 0 0 0 14 169 2023 14 0 0 0 0 0 14 184 0 0 0 14 184 2024 14 0 0 0 0 0 14 197 0 0 0 14 197 2025 13 0 0 0 0 0 13 210 0 0 0 13 210 2026 12 0 0 0 0 0 12 223 0 0 0 12 223 2027 12 0 0 0 0 0 12 235 0 0 0 12 235 2028 11 0 0 0 0 0 11 246 0 0 0 11 246 2029 11 0 0 0 0 0 11 257 0 0 0 11 257 2030 10 0 0 0 0 0 10 267 0 0 0 10 267 SubT 267 0 0 0 0 0 267 0 0 0 267 19yr 98 0 0 0 0 0 98 0 3 0 95 Total 365 0 0 0 0 0 365 0 3 0 361 ---------------------------- Discounted Cash Streams NPV (M$)----------------------------------discR% 5 10 12 15 18 20 25 BT Net 204 134 116 97 83 75 61 BT Cash Flow 204 134 116 97 83 75 61
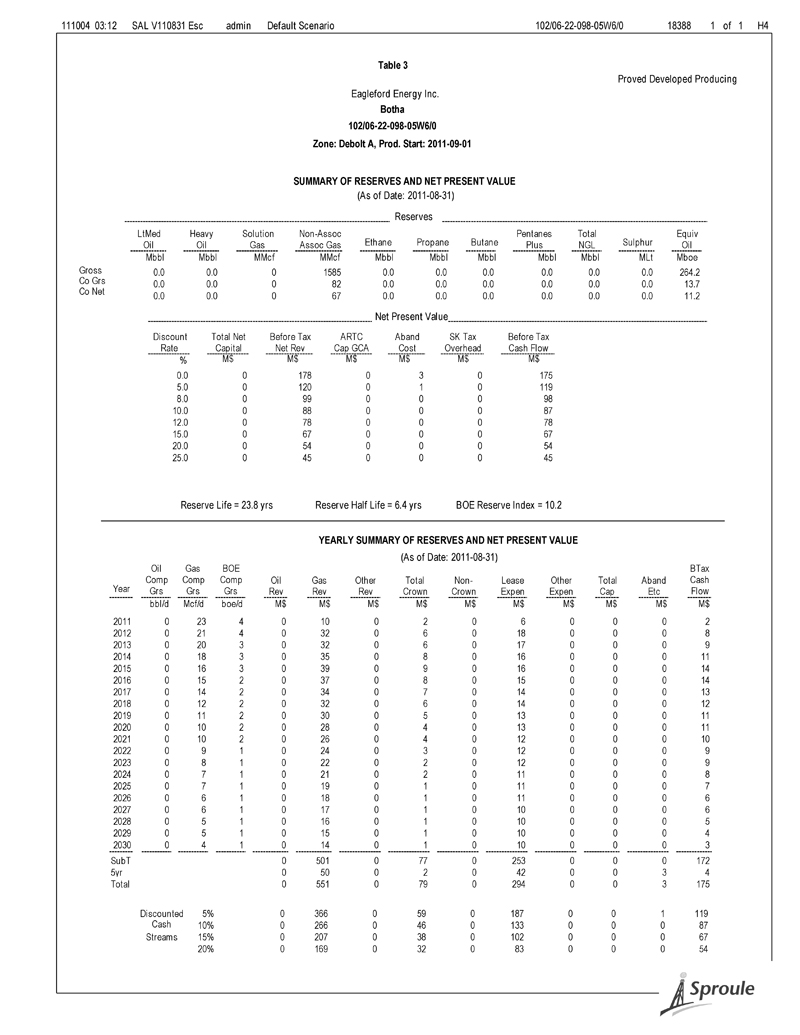
111004 03:12 SAL V110831 Esc admin Default Scenario 102/06-22-098-05W6/0 18388 1 of 1 H4 Table 3 Proved Developed Producing Eagleford Energy Inc. Botha 102/06-22-098-05W6/0 Zone: Debolt A, Prod. Start: 2011-09-01 SUMMARY OF RESERVES AND NET PRESENT VALUE (As of Date: 2011-08-31) Reserves LtMed Heavy Solution Non-Assoc Pentanes Total Equiv Oil Oil Gas Assoc Gas Ethane Propane Butane Plus NGL Sulphur Oil Mbbl Mbbl MMcf MMcf Mbbl Mbbl Mbbl Mbbl Mbbl MLt Mboe Gross 0.0 0.0 0 1585 0.0 0.0 0.0 0.0 0.0 0.0 264.2 Co Grs 0.0 0.0 0 82 0.0 0.0 0.0 0.0 0.0 0.0 13.7 Co Net 0.0 0.0 0 67 0.0 0.0 0.0 0.0 0.0 0.0 11.2 Net Present Value Discount Total Net Before Tax ARTC Aband SK Tax Before Tax Rate Capital Net Rev Cap GCA Cost Overhead Cash Flow % M$ M$ M$ M$ M$ M$ 0.0 0 178 0 3 0 175 5.0 0 120 0 1 0 119 8.0 0 99 0 0 0 98 10.0 0 88 0 0 0 87 12.0 0 78 0 0 0 78 15.0 0 67 0 0 0 67 20.0 0 54 0 0 0 54 25.0 0 45 0 0 0 45 Reserve Life = 23.8 yrs Reserve Half Life = 6.4 yrs BOE Reserve Index = 10.2 YEARLY SUMMARY OF RESERVES AND NET PRESENT VALUE (As of Date: 2011-08-31) Oil Gas BOE BTax Comp Comp Comp Oil Gas Other Total Non- Lease Other Total Aband Cash Year Grs Grs Grs Rev Rev Rev Crown Crown Expen Expen Cap Etc Flow bbl/d Mcf/d boe/d M$ M$ M$ M$ M$ M$ M$ M$ M$ M$ 2011 0 23 4 0 10 0 2 0 6 0 0 0 2 2012 0 21 4 0 32 0 6 0 18 0 0 0 8 2013 0 20 3 0 32 0 6 0 17 0 0 0 9 2014 0 18 3 0 35 0 8 0 16 0 0 0 11 2015 0 16 3 0 39 0 9 0 16 0 0 0 14 2016 0 15 2 0 37 0 8 0 15 0 0 0 14 2017 0 14 2 0 34 0 7 0 14 0 0 0 13 2018 0 12 2 0 32 0 6 0 14 0 0 0 12 2019 0 11 2 0 30 0 5 0 13 0 0 0 11 2020 0 10 2 0 28 0 4 0 13 0 0 0 11 2021 0 10 2 0 26 0 4 0 12 0 0 0 10 2022 0 9 1 0 24 0 3 0 12 0 0 0 9 2023 0 8 1 0 22 0 2 0 12 0 0 0 9 2024 0 7 1 0 21 0 2 0 11 0 0 0 8 2025 0 7 1 0 19 0 1 0 11 0 0 0 7 2026 0 6 1 0 18 0 1 0 11 0 0 0 6 2027 0 6 1 0 17 0 1 0 10 0 0 0 6 2028 0 5 1 0 16 0 1 0 10 0 0 0 5 2029 0 5 1 0 15 0 1 0 10 0 0 0 4 2030 0 4 1 0 14 0 1 0 10 0 0 0 3 SubT 0 501 0 77 0 253 0 0 0 172 5yr 0 50 0 2 0 42 0 0 3 4 Total 0 551 0 79 0 294 0 0 3 175 Discounted 5% 0 366 0 59 0 187 0 0 1 119 Cash 10% 0 266 0 46 0 133 0 0 0 87 Streams 15% 0 207 0 38 0 102 0 0 0 67 20% 0 169 0 32 0 83 0 0 0 54

111004 03:12 SAL V110831 Esc admin Default Scenario 102/06-22-098-05W6/0 18388 1 of 1 H1 Table 3 Proved Developed Producing Eagleford Energy Inc. Botha 102/06-22-098-05W6/0 Zone: Debolt A, Prod. Start: 2011-09-01 PRODUCTION AND PRICE FORECAST (As of Date: 2011-08-31) Gas Gas Gas Gas Gas Gas Year Wells Daily Gross Co Grs Co Net Price Mcf/d MMcf MMcf MMcf $/Mcf 2011 1 436 53 3 2 3.70 2012 1 411 150 8 6 4.09 2013 1 376 137 7 5 4.56 2014 1 343 125 7 5 5.36 2015 1 314 115 6 4 6.58 2016 1 287 105 5 4 6.72 2017 1 262 96 5 4 6.86 2018 1 239 87 5 4 7.01 2019 1 219 80 4 3 7.15 2020 1 200 73 4 3 7.30 2021 1 183 67 3 3 7.46 2022 1 167 61 3 3 7.61 2023 1 153 56 3 3 7.76 2024 1 140 51 3 2 7.91 2025 1 128 47 2 2 8.06 2026 1 117 43 2 2 8.22 2027 1 107 39 2 2 8.38 2028 1 97 36 2 2 8.55 2029 1 89 32 2 2 8.71 2030 1 81 30 2 1 8.89 SubT 1482 77 62 5yr 103 5 5 Total 1585 82 67
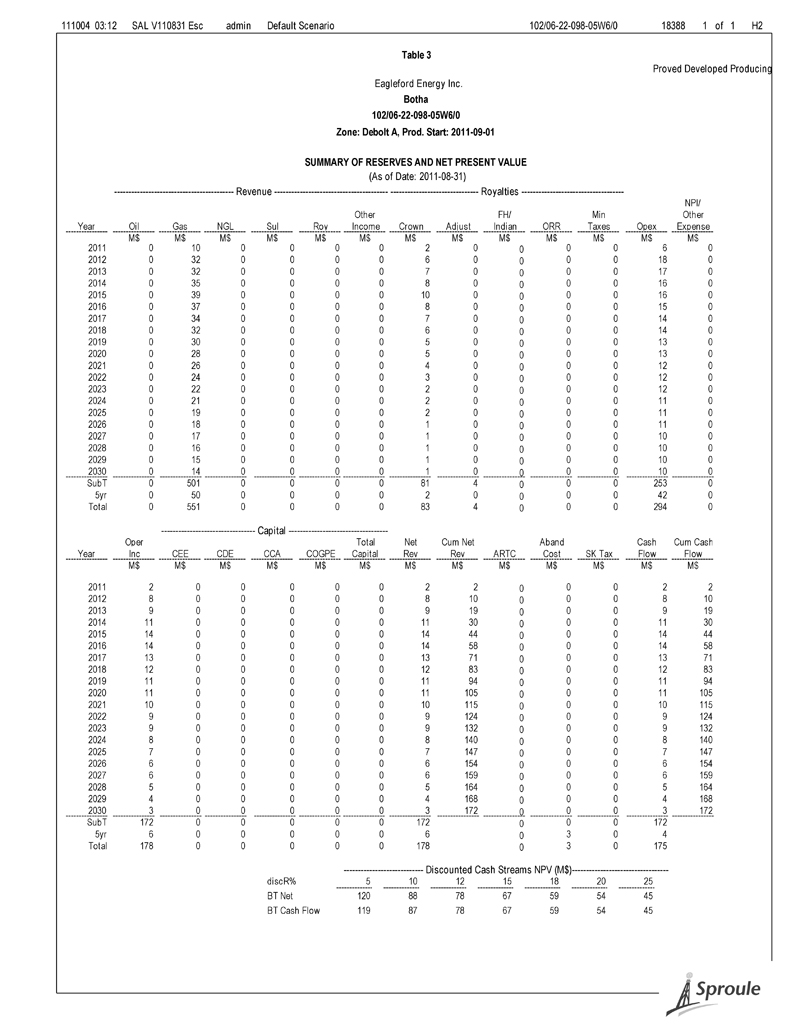
111004 03:12 SAL V110831 Esc admin Default Scenario 102/06-22-098-05W6/0 18388 1 of 1 H2 Table 3 Proved Developed Producing Eagleford Energy Inc. Botha 102/06-22-098-05W6/0 Zone: Debolt A, Prod. Start: 2011-09-01 SUMMARY OF RESERVES AND NET PRESENT VALUE (As of Date: 2011-08-31) ------------------------------------------ Revenue ---------------------------------------- ------------------------------- Royalties ------------------------------------ NPI/ Other FH/ Min Other Year Oil Gas NGL Sul Roy Income Crown Adjust Indian ORR Taxes Opex Expense M$ M$ M$ M$ M$ M$ M$ M$ M$ M$ M$ M$ M$ 2011 0 10 0 0 0 0 2 0 0 0 0 6 0 2012 0 32 0 0 0 0 6 0 0 0 0 18 0 2013 0 32 0 0 0 0 7 0 0 0 0 17 0 2014 0 35 0 0 0 0 8 0 0 0 0 16 0 2015 0 39 0 0 0 0 10 0 0 0 0 16 0 2016 0 37 0 0 0 0 8 0 0 0 0 15 0 2017 0 34 0 0 0 0 7 0 0 0 0 14 0 2018 0 32 0 0 0 0 6 0 0 0 0 14 0 2019 0 30 0 0 0 0 5 0 0 0 0 13 0 2020 0 28 0 0 0 0 5 0 0 0 0 13 0 2021 0 26 0 0 0 0 4 0 0 0 0 12 0 2022 0 24 0 0 0 0 3 0 0 0 0 12 0 2023 0 22 0 0 0 0 2 0 0 0 0 12 0 2024 0 21 0 0 0 0 2 0 0 0 0 11 0 2025 0 19 0 0 0 0 2 0 0 0 0 11 0 2026 0 18 0 0 0 0 1 0 0 0 0 11 0 2027 0 17 0 0 0 0 1 0 0 0 0 10 0 2028 0 16 0 0 0 0 1 0 0 0 0 10 0 2029 0 15 0 0 0 0 1 0 0 0 0 10 0 2030 0 14 0 0 0 0 1 0 0 0 0 10 0 SubT 0 501 0 0 0 0 81 4 0 0 0 253 0 5yr 0 50 0 0 0 0 2 0 0 0 0 42 0 Total 0 551 0 0 0 0 83 4 0 0 0 294 0 --------------------------------- Capital ----------------------------------- Oper Total Net Cum Net Aband Cash Cum Cash Year Inc CEE CDE CCA COGPE Capital Rev Rev ARTC Cost SK Tax Flow Flow M$ M$ M$ M$ M$ M$ M$ M$ M$ M$ M$ M$ M$ 2011 2 0 0 0 0 0 2 2 0 0 0 2 2 2012 8 0 0 0 0 0 8 10 0 0 0 8 10 2013 9 0 0 0 0 0 9 19 0 0 0 9 19 2014 11 0 0 0 0 0 11 30 0 0 0 11 30 2015 14 0 0 0 0 0 14 44 0 0 0 14 44 2016 14 0 0 0 0 0 14 58 0 0 0 14 58 2017 13 0 0 0 0 0 13 71 0 0 0 13 71 2018 12 0 0 0 0 0 12 83 0 0 0 12 83 2019 11 0 0 0 0 0 11 94 0 0 0 11 94 2020 11 0 0 0 0 0 11 105 0 0 0 11 105 2021 10 0 0 0 0 0 10 115 0 0 0 10 115 2022 9 0 0 0 0 0 9 124 0 0 0 9 124 2023 9 0 0 0 0 0 9 132 0 0 0 9 132 2024 8 0 0 0 0 0 8 140 0 0 0 8 140 2025 7 0 0 0 0 0 7 147 0 0 0 7 147 2026 6 0 0 0 0 0 6 154 0 0 0 6 154 2027 6 0 0 0 0 0 6 159 0 0 0 6 159 2028 5 0 0 0 0 0 5 164 0 0 0 5 164 2029 4 0 0 0 0 0 4 168 0 0 0 4 168 2030 3 0 0 0 0 0 3 172 0 0 0 3 172 SubT 172 0 0 0 0 0 172 0 0 0 172 5yr 6 0 0 0 0 0 6 0 3 0 4 Total 178 0 0 0 0 0 178 0 3 0 175 ---------------------------- Discounted Cash Streams NPV (M$)----------------------------------discR% 5 10 12 15 18 20 25 BT Net 120 88 78 67 59 54 45 BT Cash Flow 119 87 78 67 59 54 45
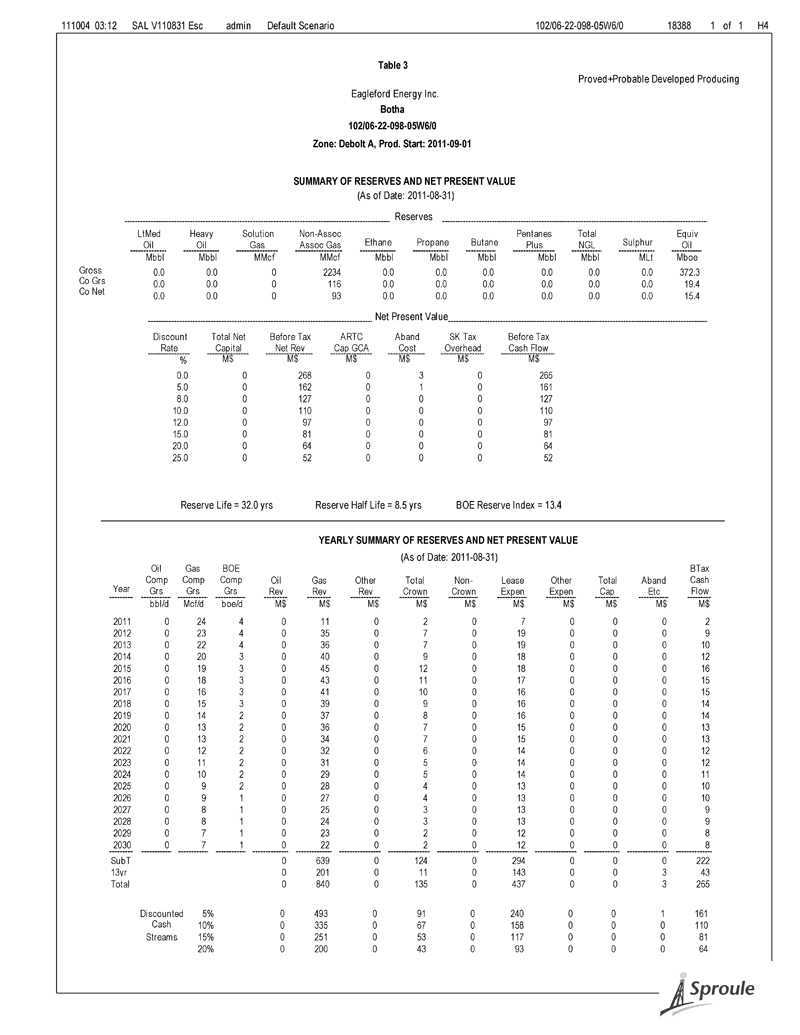
111004 03:12 SAL V110831 Esc admin Default Scenario 102/06-22-098-05W6/0 18388 1 of 1 H4 Table 3 Proved+Probable Developed Producing Eagleford Energy Inc. Botha 102/06-22-098-05W6/0 Zone: Debolt A, Prod. Start: 2011-09-01 SUMMARY OF RESERVES AND NET PRESENT VALUE (As of Date: 2011-08-31) Reserves LtMed Heavy Solution Non-Assoc Pentanes Total Equiv Oil Oil Gas Assoc Gas Ethane Propane Butane Plus NGL Sulphur Oil Mbbl Mbbl MMcf MMcf Mbbl Mbbl Mbbl Mbbl Mbbl MLt Mboe Gross 0.0 0.0 0 2234 0.0 0.0 0.0 0.0 0.0 0.0 372.3 Co Grs 0.0 0.0 0 116 0.0 0.0 0.0 0.0 0.0 0.0 19.4 Co Net 0.0 0.0 0 93 0.0 0.0 0.0 0.0 0.0 0.0 15.4 Net Present Value Discount Total Net Before Tax ARTC Aband SK Tax Before Tax Rate Capital Net Rev Cap GCA Cost Overhead Cash Flow % M$ M$ M$ M$ M$ M$ 0.0 0 268 0 3 0 265 5.0 0 162 0 1 0 161 8.0 0 127 0 0 0 127 10.0 0 110 0 0 0 110 12.0 0 97 0 0 0 97 15.0 0 81 0 0 0 81 20.0 0 64 0 0 0 64 25.0 0 52 0 0 0 52 Reserve Life = 32.0 yrs Reserve Half Life = 8.5 yrs BOE Reserve Index = 13.4 YEARLY SUMMARY OF RESERVES AND NET PRESENT VALUE (As of Date: 2011-08-31) Oil Gas BOE BTax Comp Comp Comp Oil Gas Other Total Non- Lease Other Total Aband Cash Year Grs Grs Grs Rev Rev Rev Crown Crown Expen Expen Cap Etc Flow bbl/d Mcf/d boe/d M$ M$ M$ M$ M$ M$ M$ M$ M$ M$ 2011 0 24 4 0 11 0 2 0 7 0 0 0 2 2012 0 23 4 0 35 0 7 0 19 0 0 0 9 2013 0 22 4 0 36 0 7 0 19 0 0 0 10 2014 0 20 3 0 40 0 9 0 18 0 0 0 12 2015 0 19 3 0 45 0 12 0 18 0 0 0 16 2016 0 18 3 0 43 0 11 0 17 0 0 0 15 2017 0 16 3 0 41 0 10 0 16 0 0 0 15 2018 0 15 3 0 39 0 9 0 16 0 0 0 14 2019 0 14 2 0 37 0 8 0 16 0 0 0 14 2020 0 13 2 0 36 0 7 0 15 0 0 0 13 2021 0 13 2 0 34 0 7 0 15 0 0 0 13 2022 0 12 2 0 32 0 6 0 14 0 0 0 12 2023 0 11 2 0 31 0 5 0 14 0 0 0 12 2024 0 10 2 0 29 0 5 0 14 0 0 0 11 2025 0 9 2 0 28 0 4 0 13 0 0 0 10 2026 0 9 1 0 27 0 4 0 13 0 0 0 10 2027 0 8 1 0 25 0 3 0 13 0 0 0 9 2028 0 8 1 0 24 0 3 0 13 0 0 0 9 2029 0 7 1 0 23 0 2 0 12 0 0 0 8 2030 0 7 1 0 22 0 2 0 12 0 0 0 8 SubT 0 639 0 124 0 294 0 0 0 222 13yr 0 201 0 11 0 143 0 0 3 43 Total 0 840 0 135 0 437 0 0 3 265 Discounted 5% 0 493 0 91 0 240 0 0 1 161 Cash 10% 0 335 0 67 0 158 0 0 0 110 Streams 15% 0 251 0 53 0 117 0 0 0 81 20% 0 200 0 43 0 93 0 0 0 64
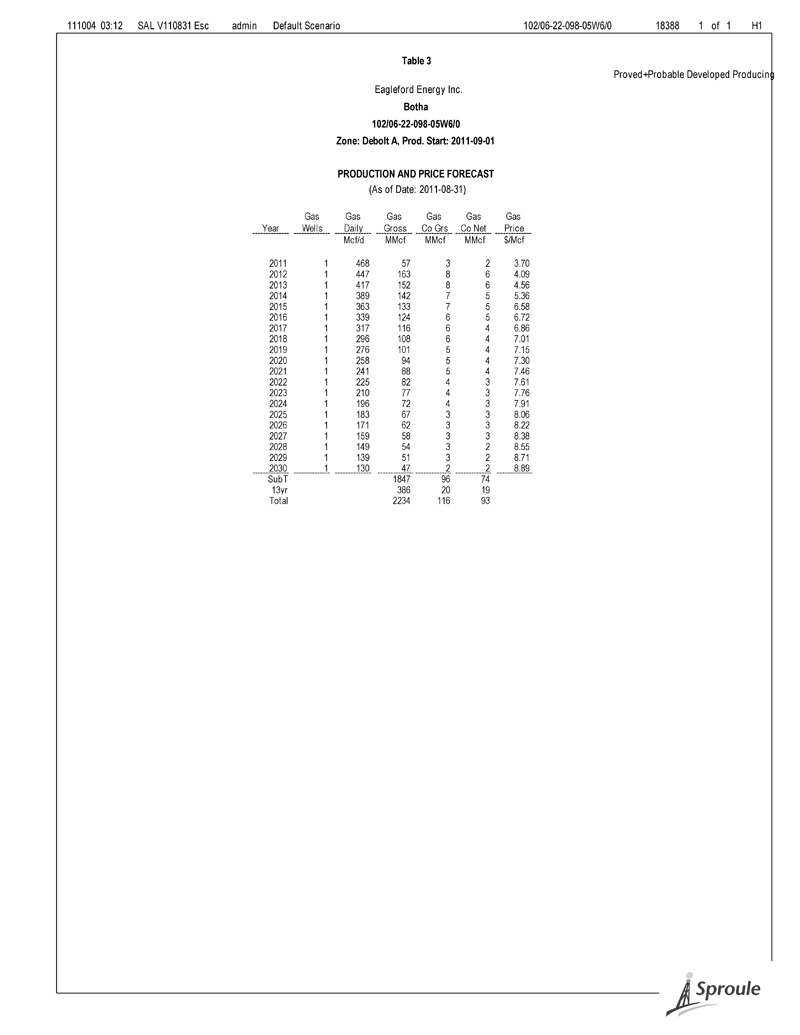
111004 03:12 SAL V110831 Esc admin Default Scenario 102/06-22-098-05W6/0 18388 1 of 1 H1 Table 3 Proved+Probable Developed Producing Eagleford Energy Inc. Botha 102/06-22-098-05W6/0 Zone: Debolt A, Prod. Start: 2011-09-01 PRODUCTION AND PRICE FORECAST (As of Date: 2011-08-31) Gas Gas Gas Gas Gas Gas Year Wells Daily Gross Co Grs Co Net Price Mcf/d MMcf MMcf MMcf $/Mcf 2011 1 468 57 3 2 3.70 2012 1 447 163 8 6 4.09 2013 1 417 152 8 6 4.56 2014 1 389 142 7 5 5.36 2015 1 363 133 7 5 6.58 2016 1 339 124 6 5 6.72 2017 1 317 116 6 4 6.86 2018 1 296 108 6 4 7.01 2019 1 276 101 5 4 7.15 2020 1 258 94 5 4 7.30 2021 1 241 88 5 4 7.46 2022 1 225 82 4 3 7.61 2023 1 210 77 4 3 7.76 2024 1 196 72 4 3 7.91 2025 1 183 67 3 3 8.06 2026 1 171 62 3 3 8.22 2027 1 159 58 3 3 8.38 2028 1 149 54 3 2 8.55 2029 1 139 51 3 2 8.71 2030 1 130 47 2 2 8.89 SubT 1847 96 74 13yr 386 20 19 Total 2234 116 93

111004 03:12 SAL V110831 Esc admin Default Scenario 102/06-22-098-05W6/0 18388 1 of 1 H2 Table 3 Proved+Probable Developed Producing Eagleford Energy Inc. Botha 102/06-22-098-05W6/0 Zone: Debolt A, Prod. Start: 2011-09-01 SUMMARY OF RESERVES AND NET PRESENT VALUE (As of Date: 2011-08-31) ------------------------------------------ Revenue ---------------------------------------- ------------------------------- Royalties ------------------------------------ NPI/ Other FH/ Min Other Year Oil Gas NGL Sul Roy Income Crown Adjust Indian ORR Taxes Opex Expense M$ M$ M$ M$ M$ M$ M$ M$ M$ M$ M$ M$ M$ 2011 0 11 0 0 0 0 2 0 0 0 0 7 0 2012 0 35 0 0 0 0 7 1 0 0 0 19 0 2013 0 36 0 0 0 0 8 1 0 0 0 19 0 2014 0 40 0 0 0 0 10 1 0 0 0 18 0 2015 0 45 0 0 0 0 13 1 0 0 0 18 0 2016 0 43 0 0 0 0 12 1 0 0 0 17 0 2017 0 41 0 0 0 0 11 0 0 0 0 16 0 2018 0 39 0 0 0 0 10 0 0 0 0 16 0 2019 0 37 0 0 0 0 9 0 0 0 0 16 0 2020 0 36 0 0 0 0 8 0 0 0 0 15 0 2021 0 34 0 0 0 0 7 0 0 0 0 15 0 2022 0 32 0 0 0 0 6 0 0 0 0 14 0 2023 0 31 0 0 0 0 6 0 0 0 0 14 0 2024 0 29 0 0 0 0 5 0 0 0 0 14 0 2025 0 28 0 0 0 0 4 0 0 0 0 13 0 2026 0 27 0 0 0 0 4 0 0 0 0 13 0 2027 0 25 0 0 0 0 3 0 0 0 0 13 0 2028 0 24 0 0 0 0 3 0 0 0 0 13 0 2029 0 23 0 0 0 0 2 0 0 0 0 12 0 2030 0 22 0 0 0 0 2 0 0 0 0 12 0 SubT 0 639 0 0 0 0 130 6 0 0 0 294 0 13yr 0 201 0 0 0 0 12 1 0 0 0 143 0 Total 0 840 0 0 0 0 142 7 0 0 0 437 0 --------------------------------- Capital ----------------------------------- Oper Total Net Cum Net Aband Cash Cum Cash Year Inc CEE CDE CCA COGPE Capital Rev Rev ARTC Cost SK Tax Flow Flow M$ M$ M$ M$ M$ M$ M$ M$ M$ M$ M$ M$ M$ 2011 2 0 0 0 0 0 2 2 0 0 0 2 2 2012 9 0 0 0 0 0 9 11 0 0 0 9 11 2013 10 0 0 0 0 0 10 21 0 0 0 10 21 2014 12 0 0 0 0 0 12 34 0 0 0 12 34 2015 16 0 0 0 0 0 16 49 0 0 0 16 49 2016 15 0 0 0 0 0 15 65 0 0 0 15 65 2017 15 0 0 0 0 0 15 79 0 0 0 15 79 2018 14 0 0 0 0 0 14 93 0 0 0 14 93 2019 14 0 0 0 0 0 14 107 0 0 0 14 107 2020 13 0 0 0 0 0 13 120 0 0 0 13 120 2021 13 0 0 0 0 0 13 133 0 0 0 13 133 2022 12 0 0 0 0 0 12 145 0 0 0 12 145 2023 12 0 0 0 0 0 12 157 0 0 0 12 157 2024 11 0 0 0 0 0 11 168 0 0 0 11 168 2025 10 0 0 0 0 0 10 178 0 0 0 10 178 2026 10 0 0 0 0 0 10 188 0 0 0 10 188 2027 9 0 0 0 0 0 9 197 0 0 0 9 197 2028 9 0 0 0 0 0 9 206 0 0 0 9 206 2029 8 0 0 0 0 0 8 214 0 0 0 8 214 2030 8 0 0 0 0 0 8 222 0 0 0 8 222 SubT 222 0 0 0 0 0 222 0 0 0 222 13yr 46 0 0 0 0 0 46 0 3 0 43 Total 268 0 0 0 0 0 268 0 3 0 265 ---------------------------- Discounted Cash Streams NPV (M$)----------------------------------discR% 5 10 12 15 18 20 25 BT Net 162 110 97 81 70 64 52 BT Cash Flow 161 110 97 81 70 64 52
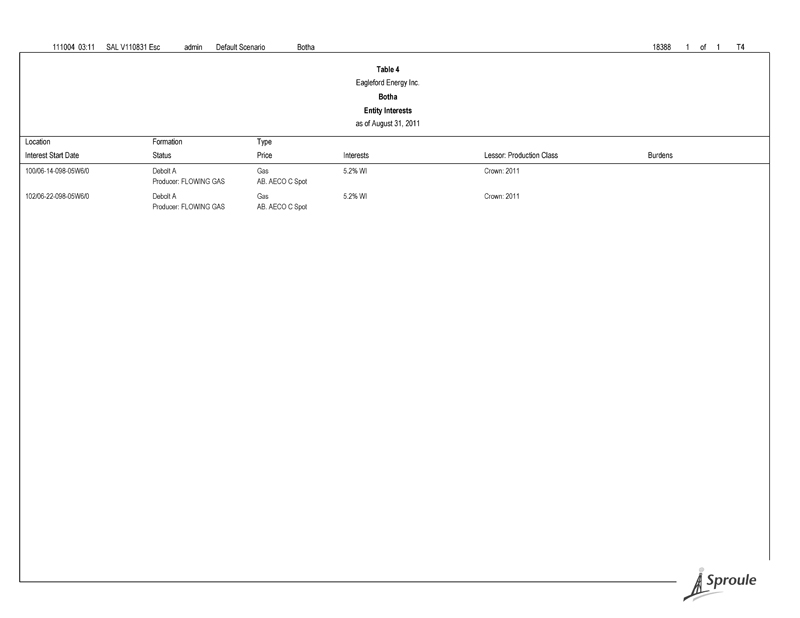
111004 03:11 SAL V110831 Esc admin Default Scenario Botha 18388 1 of 1 T4 Table 4 Eagleford Energy Inc. Botha Entity Interests as of August 31, 2011 Location Formation Type Interest Start Date Status Price Interests Lessor: Production Class Burdens 100/06-14-098-05W6/0 Debolt A Gas 5.2% WI Crown: 2011 Producer: FLOWING GAS AB. AECO C Spot 102/06-22-098-05W6/0 Debolt A Gas 5.2% WI Crown: 2011 Producer: FLOWING GAS AB. AECO C Spot
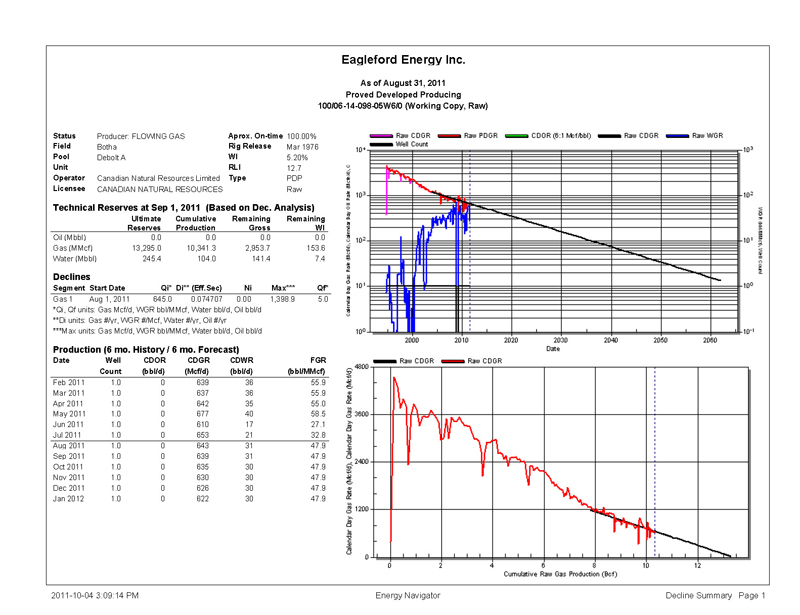
Eagleford Energy Inc. As of August 31, 2011 Proved Developed Producing 100/06-14-098-05W6/0 (Working Copy, Raw) Status Producer: FLOWING GAS Aprox. On-time 100.00% Field Botha Rig Release Mar 1976 Pool Debolt A WI 5.20% Unit RLI 12.7 Operator Canadian Natural Resources Limited Type PDP Licensee CANADIAN NATURAL RESOURCES LIMITED Raw Technical Reserves at Sep 1, 2011 (Based on Dec. Analysis) Ultimate Cumulative Remaining Remaining Reserves Production Gross WI Oil (Mbbl) 0.0 0.0 0.0 0.0 Gas (MMcf) 13,295.0 10,341.3 2,953.7 153.6 Water (Mbbl) 245.4 104.0 141.4 7.4 Declines Segment Start Date Qi* Di** (Eff.Sec) Ni Max*** Qf* Gas 1 Aug 1, 2011 645.0 0.074707 0.00 1,398.9 5.0 *Qi, Qf units: Gas Mcf/d, WGR bbl/MMcf, Water bbl/d, Oil bbl/d **Di units: Gas #/yr, WGR #/Mcf, Water #/yr, Oil #/yr ***Max units: Gas Mcf/d, WGR bbl/MMcf, Water bbl/d, Oil bbl/d Production (6 mo. History / 6 mo. Forecast) Date Well CDOR CDGR CDWR FGR Count (bbl/d) (Mcf/d) (bbl/d) (bbl/MMcf) Feb 2011 1.0 0 639 36 55.9 Mar 2011 1.0 0 637 36 55.9 Apr 2011 1.0 0 642 35 55.0 May 2011 1.0 0 677 40 58.5 Jun 2011 1.0 0 610 17 27.1 Jul 2011 1.0 0 653 21 32.8 Aug 2011 1.0 0 643 31 47.9 Sep 2011 1.0 0 639 31 47.9 Oct 2011 1.0 0 635 30 47.9 Nov 2011 1.0 0 630 30 47.9 Dec 2011 1.0 0 626 30 47.9 Jan 2012 1.0 0 622 30 47.9 2011-10-04 3:09:14 PM Energy Navigator Decline Summary Page 1
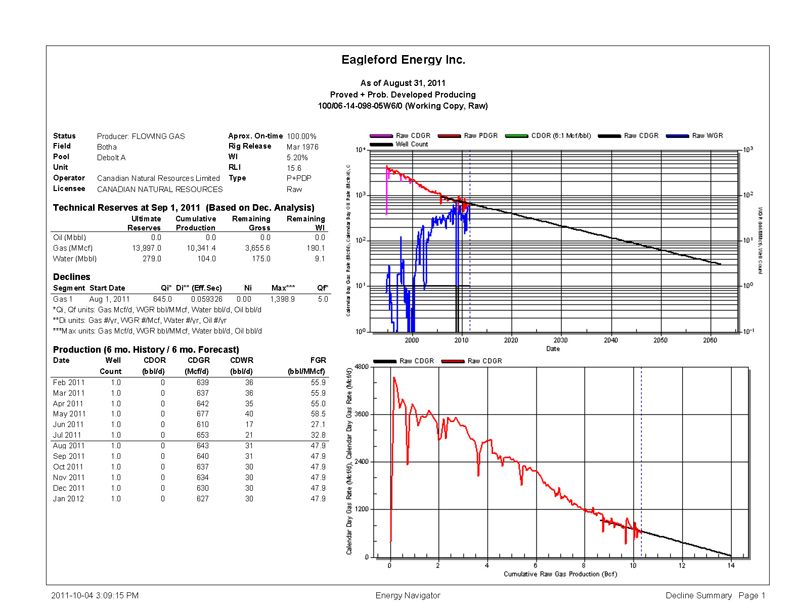
Eagleford Energy Inc. As of August 31, 2011 Proved + Prob. Developed Producing 100/06-14-098-05W6/0 (Working Copy, Raw) Status Producer: FLOWING GAS Aprox. On-time 100.00% Field Botha Rig Release Mar 1976 Pool Debolt A WI 5.20% Unit RLI 15.6 Operator Canadian Natural Resources Limited Type P+PDP Licensee CANADIAN NATURAL RESOURCES LIMITED Raw Technical Reserves at Sep 1, 2011 (Based on Dec. Analysis) Ultimate Cumulative Remaining Remaining Reserves Production Gross WI Oil (Mbbl) 0.0 0.0 0.0 0.0 Gas (MMcf) 13,997.0 10,341.4 3,655.6 190.1 Water (Mbbl) 279.0 104.0 175.0 9.1 Declines Segment Start Date Qi* Di** (Eff.Sec) Ni Max*** Qf* Gas 1 Aug 1, 2011 645.0 0.059326 0.00 1,398.9 5.0 *Qi, Qf units: Gas Mcf/d, WGR bbl/MMcf, Water bbl/d, Oil bbl/d **Di units: Gas #/yr, WGR #/Mcf, Water #/yr, Oil #/yr ***Max units: Gas Mcf/d, WGR bbl/MMcf, Water bbl/d, Oil bbl/d Production (6 mo. History / 6 mo. Forecast) Date Well CDOR CDGR CDWR FGR Count (bbl/d) (Mcf/d) (bbl/d) (bbl/MMcf) Feb 2011 1.0 0 639 36 55.9 Mar 2011 1.0 0 637 36 55.9 Apr 2011 1.0 0 642 35 55.0 May 2011 1.0 0 677 40 58.5 Jun 2011 1.0 0 610 17 27.1 Jul 2011 1.0 0 653 21 32.8 Aug 2011 1.0 0 643 31 47.9 Sep 2011 1.0 0 640 31 47.9 Oct 2011 1.0 0 637 30 47.9 Nov 2011 1.0 0 634 30 47.9 Dec 2011 1.0 0 630 30 47.9 Jan 2012 1.0 0 627 30 47.9 2011-10-04 3:09:15 PM Energy Navigator Decline Summary Page 1
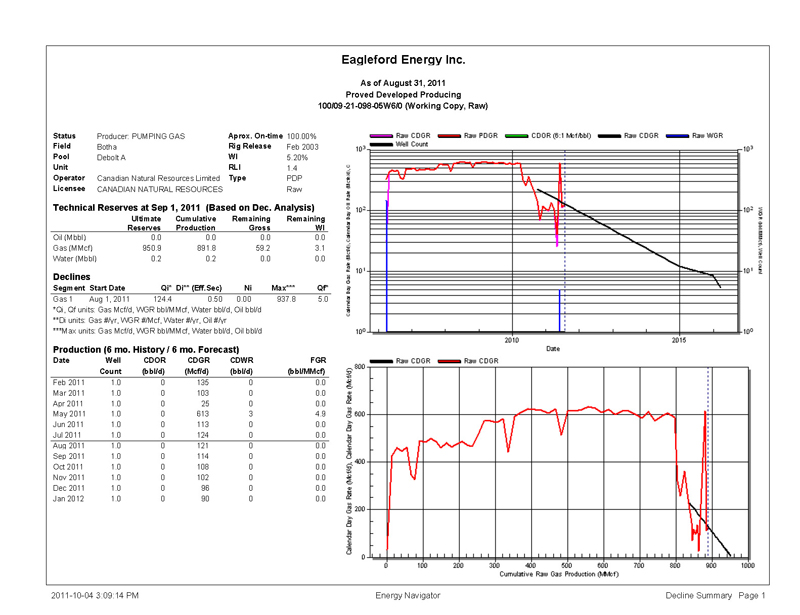
Eagleford Energy Inc. As of August 31, 2011 Proved Developed Producing 100/09-21-098-05W6/0 (Working Copy, Raw) Status Producer: PUMPING GAS Aprox. On-time 100.00% Field Botha Rig Release Feb 2003 Pool Debolt A WI 5.20% Unit RLI 1.4 Operator Canadian Natural Resources Limited Type PDP Licensee CANADIAN NATURAL RESOURCES LIMITED Raw Technical Reserves at Sep 1, 2011 (Based on Dec. Analysis) Ultimate Cumulative Remaining Remaining Reserves Production Gross WI Oil (Mbbl) 0.0 0.0 0.0 0.0 Gas (MMcf) 950.9 891.8 59.2 3.1 Water (Mbbl) 0.2 0.2 0.0 0.0 Declines Segment Start Date Qi* Di** (Eff.Sec) Ni Max*** Qf* Gas 1 Aug 1, 2011 124.4 0.50 0.00 937.8 5.0 *Qi, Qf units: Gas Mcf/d, WGR bbl/MMcf, Water bbl/d, Oil bbl/d **Di units: Gas #/yr, WGR #/Mcf, Water #/yr, Oil #/yr ***Max units: Gas Mcf/d, WGR bbl/MMcf, Water bbl/d, Oil bbl/d Production (6 mo. History / 6 mo. Forecast) Date Well CDOR CDGR CDWR FGR Count (bbl/d) (Mcf/d) (bbl/d) (bbl/MMcf) Feb 2011 1.0 0 135 0 0.0 Mar 2011 1.0 0 103 0 0.0 Apr 2011 1.0 0 25 0 0.0 May 2011 1.0 0 613 3 4.9 Jun 2011 1.0 0 113 0 0.0 Jul 2011 1.0 0 124 0 0.0 Aug 2011 1.0 0 121 0 0.0 Sep 2011 1.0 0 114 0 0.0 Oct 2011 1.0 0 108 0 0.0 Nov 2011 1.0 0 102 0 0.0 Dec 2011 1.0 0 96 0 0.0 Jan 2012 1.0 0 90 0 0.0 2011-10-04 3:09:14 PM Energy Navigator Decline Summary Page 1
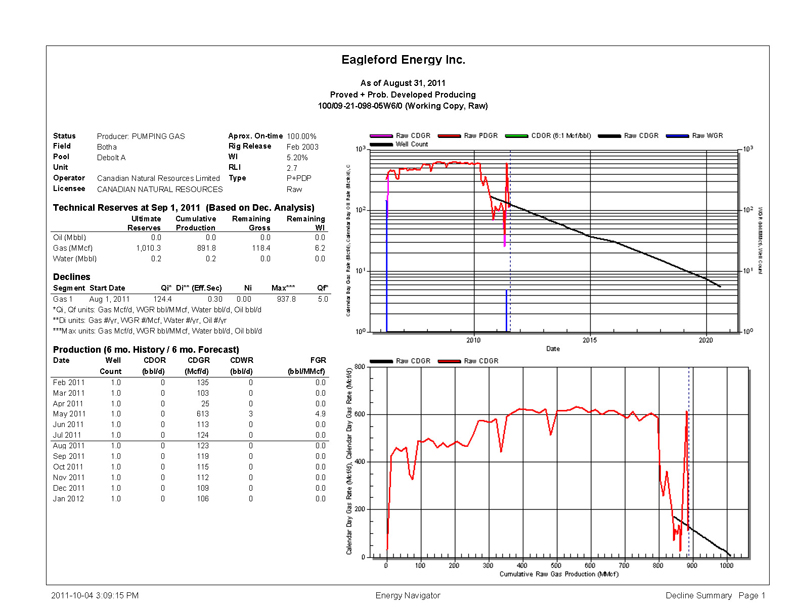
Eagleford Energy Inc. As of August 31, 2011 Proved + Prob. Developed Producing 100/09-21-098-05W6/0 (Working Copy, Raw) Status Producer: PUMPING GAS Aprox. On-time 100.00% Field Botha Rig Release Feb 2003 Pool Debolt A WI 5.20% Unit RLI 2.7 Operator Canadian Natural Resources Limited Type P+PDP Licensee CANADIAN NATURAL RESOURCES LIMITED Raw Technical Reserves at Sep 1, 2011 (Based on Dec. Analysis) Ultimate Cumulative Remaining Remaining Reserves Production Gross WI Oil (Mbbl) 0.0 0.0 0.0 0.0 Gas (MMcf) 1,010.3 891.8 118.4 6.2 Water (Mbbl) 0.2 0.2 0.0 0.0 Declines Segment Start Date Qi* Di** (Eff.Sec) Ni Max*** Qf* Gas 1 Aug 1, 2011 124.4 0.30 0.00 937.8 5.0 *Qi, Qf units: Gas Mcf/d, WGR bbl/MMcf, Water bbl/d, Oil bbl/d **Di units: Gas #/yr, WGR #/Mcf, Water #/yr, Oil #/yr ***Max units: Gas Mcf/d, WGR bbl/MMcf, Water bbl/d, Oil bbl/d Production (6 mo. History / 6 mo. Forecast) Date Well CDOR CDGR CDWR FGR Count (bbl/d) (Mcf/d) (bbl/d) (bbl/MMcf) Feb 2011 1.0 0 135 0 0.0 Mar 2011 1.0 0 103 0 0.0 Apr 2011 1.0 0 25 0 0.0 May 2011 1.0 0 613 3 4.9 Jun 2011 1.0 0 113 0 0.0 Jul 2011 1.0 0 124 0 0.0 Aug 2011 1.0 0 123 0 0.0 Sep 2011 1.0 0 119 0 0.0 Oct 2011 1.0 0 115 0 0.0 Nov 2011 1.0 0 112 0 0.0 Dec 2011 1.0 0 109 0 0.0 Jan 2012 1.0 0 106 0 0.0 2011-10-04 3:09:15 PM Energy Navigator Decline Summary Page 1
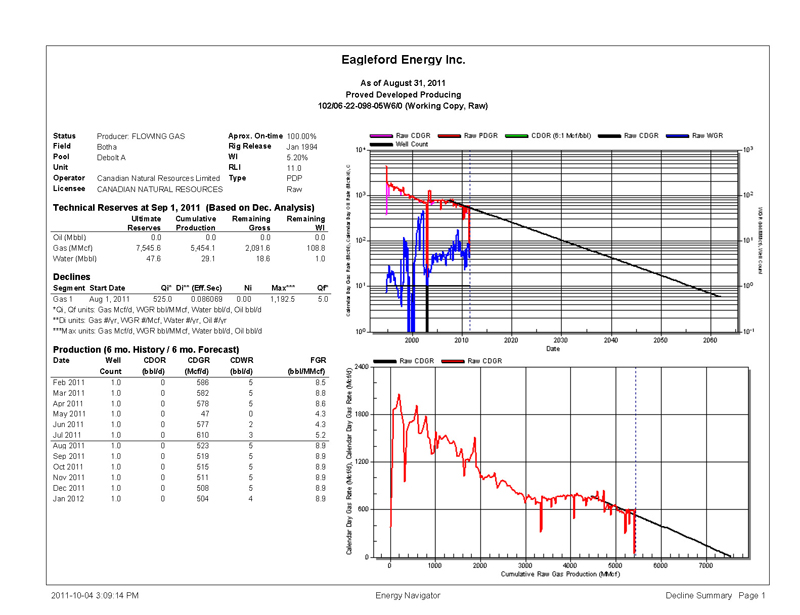
Eagleford Energy Inc. As of August 31, 2011 Proved Developed Producing 102/06-22-098-05W6/0 (Working Copy, Raw) Status Producer: FLOWING GAS Aprox. On-time 100.00% Field Botha Rig Release Jan 1994 Pool Debolt A WI 5.20% Unit RLI 11.0 Operator Canadian Natural Resources Limited Type PDP Licensee CANADIAN NATURAL RESOURCES LIMITED Raw Technical Reserves at Sep 1, 2011 (Based on Dec. Analysis) Ultimate Cumulative Remaining Remaining Reserves Production Gross WI Oil (Mbbl) 0.0 0.0 0.0 0.0 Gas (MMcf) 7,545.6 5,454.1 2,091.6 108.8 Water (Mbbl) 47.6 29.1 18.6 1.0 Declines Segment Start Date Qi* Di** (Eff.Sec) Ni Max*** Qf* Gas 1 Aug 1, 2011 525.0 0.086069 0.00 1,192.5 5.0 *Qi, Qf units: Gas Mcf/d, WGR bbl/MMcf, Water bbl/d, Oil bbl/d **Di units: Gas #/yr, WGR #/Mcf, Water #/yr, Oil #/yr ***Max units: Gas Mcf/d, WGR bbl/MMcf, Water bbl/d, Oil bbl/d Production (6 mo. History / 6 mo. Forecast) Date Well CDOR CDGR CDWR FGR Count (bbl/d) (Mcf/d) (bbl/d) (bbl/MMcf) Feb 2011 1.0 0 586 5 8.5 Mar 2011 1.0 0 582 5 8.8 Apr 2011 1.0 0 578 5 8.6 May 2011 1.0 0 47 0 4.3 Jun 2011 1.0 0 577 2 4.3 Jul 2011 1.0 0 610 3 5.2 Aug 2011 1.0 0 523 5 8.9 Sep 2011 1.0 0 519 5 8.9 Oct 2011 1.0 0 515 5 8.9 Nov 2011 1.0 0 511 5 8.9 Dec 2011 1.0 0 508 5 8.9 Jan 2012 1.0 0 504 4 8.9 2011-10-04 3:09:14 PM Energy Navigator Decline Summary Page 1
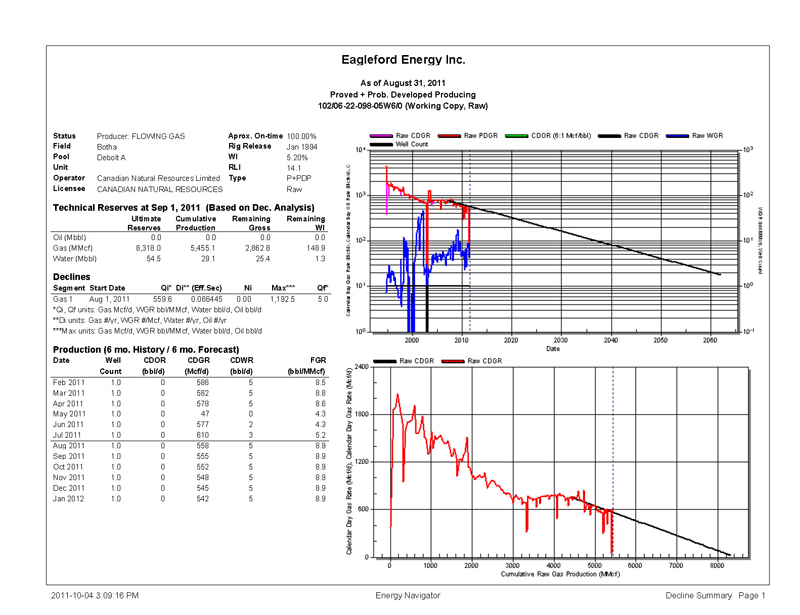
Eagleford Energy Inc. As of August 31, 2011 Proved + Prob. Developed Producing 102/06-22-098-05W6/0 (Working Copy, Raw) Status Producer: FLOWING GAS Aprox. On-time 100.00% Field Botha Rig Release Jan 1994 Pool Debolt A WI 5.20% Unit RLI 14.1 Operator Canadian Natural Resources Limited Type P+PDP Licensee CANADIAN NATURAL RESOURCES LIMITED Raw Technical Reserves at Sep 1, 2011 (Based on Dec. Analysis) Ultimate Cumulative Remaining Remaining Reserves Production Gross WI Oil (Mbbl) 0.0 0.0 0.0 0.0 Gas (MMcf) 8,318.0 5,455.1 2,862.8 148.9 Water (Mbbl) 54.5 29.1 25.4 1.3 Declines Segment Start Date Qi* Di** (Eff.Sec) Ni Max*** Qf* Gas 1 Aug 1, 2011 559.6 0.066445 0.00 1,192.5 5.0 *Qi, Qf units: Gas Mcf/d, WGR bbl/MMcf, Water bbl/d, Oil bbl/d **Di units: Gas #/yr, WGR #/Mcf, Water #/yr, Oil #/yr ***Max units: Gas Mcf/d, WGR bbl/MMcf, Water bbl/d, Oil bbl/d Production (6 mo. History / 6 mo. Forecast) Date Well CDOR CDGR CDWR FGR Count (bbl/d) (Mcf/d) (bbl/d) (bbl/MMcf) Feb 2011 1.0 0 586 5 8.5 Mar 2011 1.0 0 582 5 8.8 Apr 2011 1.0 0 578 5 8.6 May 2011 1.0 0 47 0 4.3 Jun 2011 1.0 0 577 2 4.3 Jul 2011 1.0 0 610 3 5.2 Aug 2011 1.0 0 558 5 8.9 Sep 2011 1.0 0 555 5 8.9 Oct 2011 1.0 0 552 5 8.9 Nov 2011 1.0 0 548 5 8.9 Dec 2011 1.0 0 545 5 8.9 Jan 2012 1.0 0 542 5 8.9 2011-10-04 3:09:16 PM Energy Navigator Decline Summary Page 1
111004 03:33 SAL V110831 Esc admin Default Scenario Haynes 18388 1 of 1 S1 Eagleford Energy Inc. Haynes SUMMARY OF THE EVALUATION OF THE P.& N.G. RESERVES (As of Date: 2011-08-31) Remaining Reserves Net Present Values Before Income Taxes Company Gross 100% Gross Net @ 0% @ 5% @ 10% @ 15% @ 20% M$ M$ M$ M$ M$ No reserves assigned to this area.
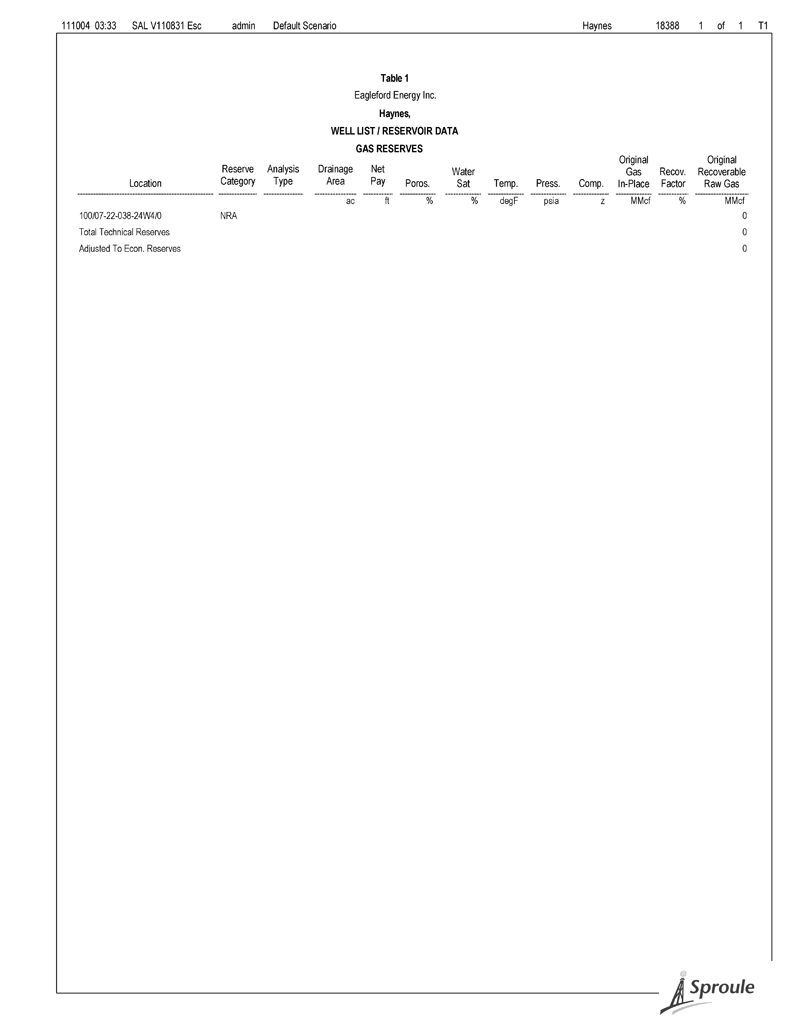
111004 03:33 SAL V110831 Esc admin Default Scenario Haynes 18388 1 of 1 T1 Table 1 Eagleford Energy Inc. Haynes, WELL LIST / RESERVOIR DATA GAS RESERVES Original Original Reserve Analysis Drainage Net Water Gas Recov. Recoverable Location Category Type Area Pay Poros. Sat Temp. Press. Comp. In-Place Factor Raw Gas ac ft % % degF psia z MMcf % MMcf 100/07-22-038-24W4/0 NRA 0 Total Technical Reserves 0 Adjusted To Econ. Reserves 0
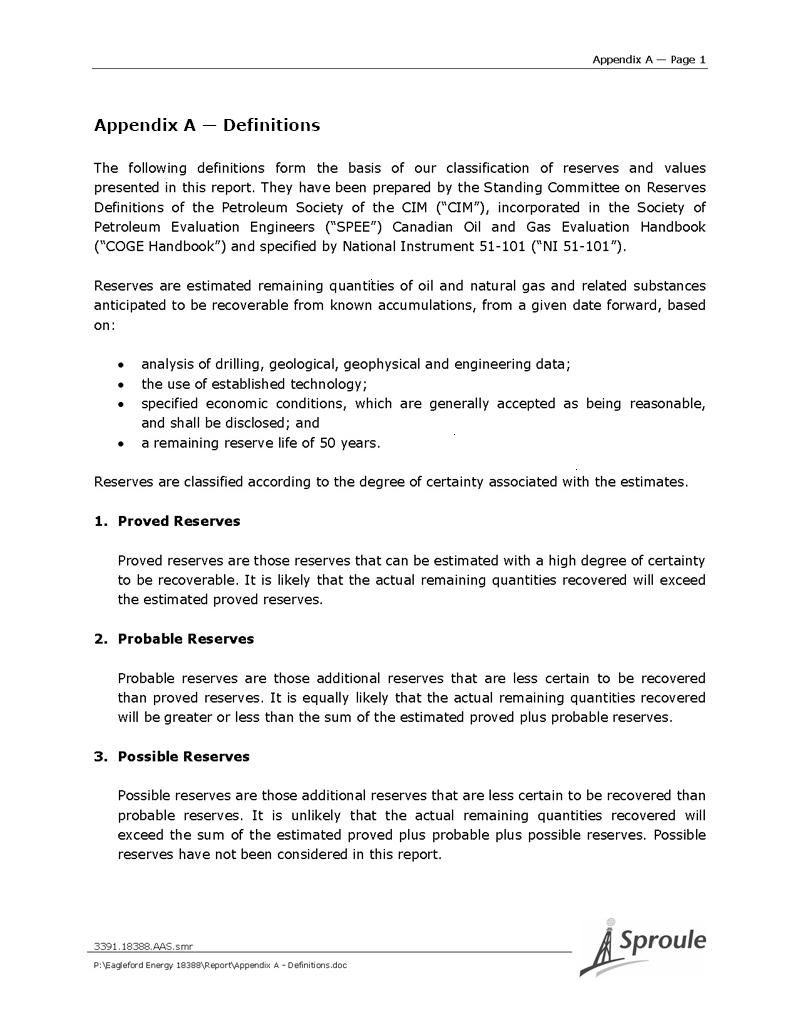
Appendix A — Page 1 Appendix A — Definitions The following definitions form the basis of our classification of reserves and values presented in this report. They have been prepared by the Standing Committee on Reserves Definitions of the Petroleum Society of the CIM (“CIM”), incorporated in the Society of Petroleum Evaluation Engineers (“SPEE”) Canadian Oil and Gas Evaluation Handbook (“COGE Handbook”) and specified by National Instrument 51-101 (“NI 51-101”). Reserves are estimated remaining quantities of oil and natural gas and related substances anticipated to be recoverable from known accumulations, from a given date forward, based on: analysis of drilling, geological, geophysical and engineering data; the use of established technology; specif ied economic conditions, which are generally accepted as being reasonable, and shall be disclosed; and a remaining reserve life of 50 years. Reserves are classified according to the degree of certainty associated with the estimates.
1. Proved Reserves Proved reserves are those reserves that can be estimated with a high degree of certainty to be recoverable. It is likely that the actual remaining quantities recovered will exceed the estimated proved reserves. 2. Probable Reserves Probable reserves are those additional reserves that are less certain to be recovered than proved reserves. It is equally likely that the actual remaining quantities recovered will be greater or less than the sum of the estimated proved plus probable reserves. 3. Possible Reserves Possible reserves are those additional reserves that are less certain to be recovered than probable reserves. It is unlikely that the actual remaining quantities recovered will exceed the sum of the estimated proved plus probable plus possible reserves. Possible reserves have not been considered in this report. 3391.18388.AAS.smr P:\Eagleford Energy 18388\Report\Appendix A - Definitions.doc
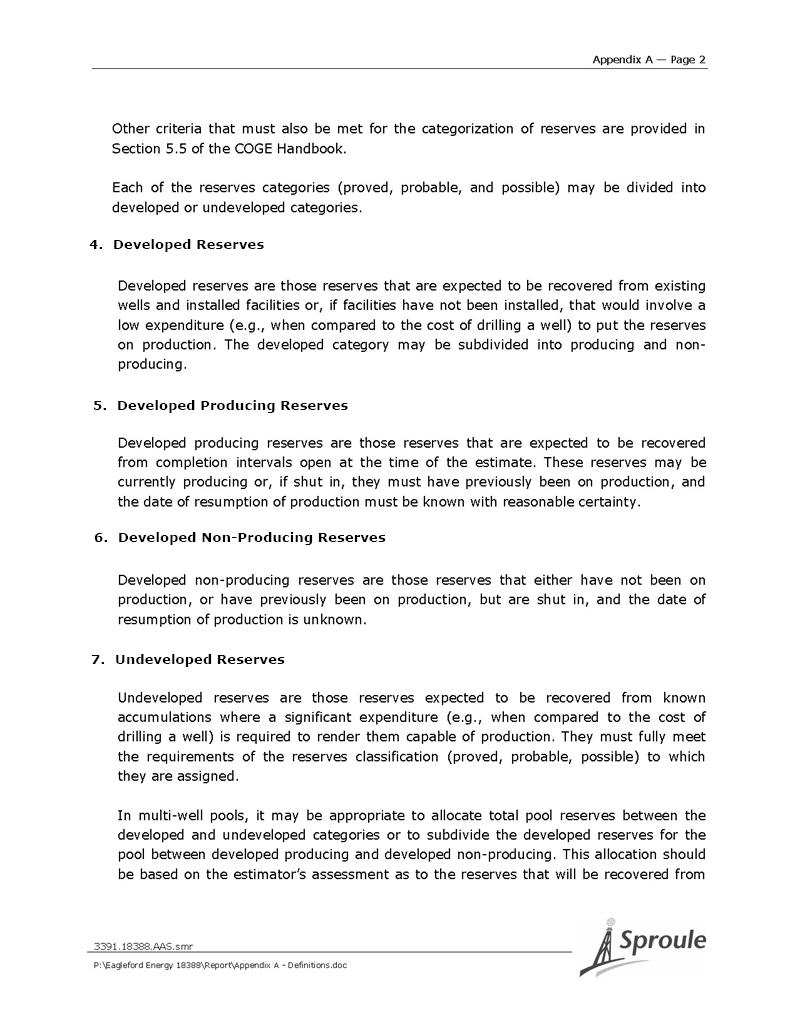
Appendix A — Page 2 Other criteria that must also be met for the categorization of reserves are provided in Section 5.5 of the COGE Handbook. Each of the reserves categories (proved, probable, and possible) may be divided into developed or undeveloped categories. 4. Developed Reserves Developed reserves are those reserves that are expected to be recovered from existing wells and installed facilities or, if facilities have not been installed, that would involve a low expenditure (e.g., when compared to the cost of drilling a well) to put the reserves on production. The developed category may be subdivided into producing and non-producing. 5. Developed Producing Reserves Developed producing reserves are those reserves that are expected to be recovered from completion intervals open at the time of the estimate. These reserves may be currently producing or, if shut in, they must have previously been on production, and the date of resumption of production must be known with reasonable certainty. 6. Developed Non-Producing Reserves Developed non-producing reserves are those reserves that either have not been on production, or have previously been on production, but are shut in, and the date of resumption of production is unknown. 7. Undeveloped Reserves Undeveloped reserves are those reserves expected to be recovered from known accumulations where a significant expenditure (e.g., when compared to the cost of drilling a well) is required to render them capable of production. They must fully meet the requirements of the reserves classification (proved, probable, possible) to which they are assigned. In multi-well pools, it may be appropriate to allocate total pool reserves between the developed and undeveloped categories or to subdivide the developed reserves for the pool between developed producing and developed non-producing. This allocation should be based on the estimator’s assessment as to the reserves that will be recovered from 3391.18388.AAS.smr P:\Eagleford Energy 18388\Report\Appendix A - Definitions.doc
Appendix A — Page 3 specific wells, facilities, and completion intervals in the pool and their respective development and production status. 8. Levels of Certainty for Reported Reserves T he qualitative certainty levels contained in the definitions in Sections 1, 2 and 3 are applicable to individual reserves entities, which refers to the lowest level at which reserves estimates are made, and to reported reserves, which refers to the highest level sum of individual entity estimates for which reserve estimates are made. Reported total reserves estimated by deterministic or probabilistic methods, whether comprised of a single reserves entity or an aggregate estimate for multiple entities, should target the following levels of certainty under a specific set of economic conditions: a. There is a 90% probability that at least the estimated proved reserves will be recovered. b. There is a 50% probability that at least the sum of the estimated proved reserves plus probable reserves will be recovered. c. There is a 10% probability that at least the sum of the estimated proved reserves plus probable reserves plus possible reserves will be recovered. A quantitative measure of the probability associated with a reserves estimate is generated only when a probabilistic estimate is conducted. The majority of reserves estimates will be performed using deterministic methods that do not provide a quantitative measure of probability. In principle, there should be no difference between estimates prepared using probabilistic or deterministic methods. Additional clarification of certainty levels associated with reserves estimates and the effect of aggregation is provided in Section 5.5.3 of the COGE Handbook. Whether deterministic or probabilistic methods are used, evaluators are expressing their professional judgement as to what are reasonable estimates. 9. Remaining Recoverable Reserves are the total remaining recoverable reserves associated with the acreage in which the Company has an interest. 10. Company Gross Reserves are the Company’s working interest share of the remaining reserves, before deduction of any royalties. 3391.18388.AAS.smr P:\Eagleford Energy 18388\Report\Appendix A - Definitions.doc
Appendix A — Page 4 11. Company Net Reserves are the gross remaining reserves of the properties in which the Company has an interest, less all Crown, freehold, and overriding royalties and interests owned by others. 12. Net Production Revenue is income derived from the sale of net reserves of oil, non-associated and associated gas, and gas by-products, less all capital and operating costs. 13. Fair Market Value is defined as the price at which a purchaser seeking an economic and commercial return on investment would be willing to buy, and a vendor would be willing to sell, where neither is under compulsion to buy or sell and both are competent and have reasonable knowledge of the facts. 14. Barrels of Oil Equivalent (BOE) Reserves – BOE is the sum of the oil reserves, plus the gas reserves divided by a factor of 6, plus the natural gas liquid reserves, all expressed in barrels or thousands of barrels. Equivalent reserves can also be expressed in thousands of cubic feet of gas equivalent (McfGE) using a conversion ratio of 1 bbl:6 Mcf. 15. Oil (or Crude Oil) – a mixture consisting mainly of pentanes and heavier hydrocarbons that exists in the liquid phase in reservoirs and remains liquid at atmospheric pressure and temperature. Crude oil may contain small amounts of sulphur and other non-hydrocarbons, but does not include liquids obtained from the processing of natural gas. 16. Gas (or Natural Gas) – a mixture of lighter hydrocarbons that exist either in the gaseous phase or in solution in crude oil in reservoirs, but are gaseous at atmospheric conditions. Natural gas may contain sulphur or other non-hydrocarbon compounds. 17. Non-Associated Gas – an accumulation of natural gas in a reservoir where there is no crude oil. 18. Associated Gas – the gas cap overlying a crude oil accumulation in a reservoir. 19. Solution Gas – gas dissolved in crude oil. 20. Natural Gas Liquids – those hydrocarbon components that can be removed from natural gas as liquids including, but not limited to, ethane, propane, butanes, pentanes plus, condensate, and small quantities of non-hydrocarbons. 3391.18388.AAS.smr P:\Eagleford Energy 18388\Report\Appendix A - Definitions.doc
Appendix B — Page 1 Appendix B — Prices (As of August 31, 2011) Sproule’s short-term outlook for oil and gas prices adopts the NYMEX futures market for the forecast period ending August 31, 2014. The forecast used in this evaluation was derived as of August 31, 2011, and reflects the arithmetic average of the futures market at the close of trading each day, for the month prior to the Termination of Trading date for an September contract. The oil price forecasts are based on the NYMEX Division light, sweet (low-sulphur) crude oil futures contract, which specifies the West Texas Intermediate crude as a deliverable, and the gas price forecasts are based on the NYMEX Division Henry Hub natural gas futures contract. The NYMEX oil and gas futures prices are the foundation of Sproule’s energy pricing models in the early years. This data is combined with Sproule’s assumptions respecting long-term prices, inflation rates, and exchange rates, together with estimates of transportation costs and prices of competing fuels, to forecast wellhead and plantgate prices for Canadian oil, natural gas, and natural gas by-product production. The following paragraphs briefly describe some of the key considerations included in Sproule’s long-term outlook for oil and natural gas price forecasts. Oil Prices In the long term, the price of oil will be governed by supply and demand, and the degree that OPEC is able to manage supply will be a major determinant in establishing oil prices for the next 10 years. A strong demand for crude oil, instability in the Middle East, and the increasing cost of exploration and development has served to increase the price of crude oil throughout the world. In recognition of these factors, Sproule's long-term forecast has been set at $90.00 US per barrel (2011 dollars). Transmission costs, a significant item in forecasting Canadian wellhead prices, are expected to increase at rates that are generally less than the rate of inflation. The exchange rate ($U.S. per $Canadian) reflects a projection of 1.01. The oil price forecasts set out in Table P-1 are based on a forecast of prices for West Texas Intermediate crude at Cushing, Oklahoma. The price of this marker crude is expected to directly reflect world oil prices over the forecast period. The Edmonton par price is for a 40 to 45 degree API crude having less than 0.5 percent sulphur. The actual wellhead price of oil will vary with the quality of the crude and the cost of the transportation from the wellhead to the trading hub in Edmonton. This cost, which is referred to as the price differential, is based on the actual difference between the revenue received at the wellhead and the 3391.18388.AAS.smr P:\Eagleford Energy 18388\Report\Appendix B - Prices (August 31, 2011).doc
![]()
Appendix B — Page 2 Edmonton par price postings of major crude oil purchasers. In the absence of actual crude oil price statistics, the differential is based on the price of similar quality crude in the area. Natural Gas Prices The New York Mercantile Exchange (NYMEX) posted price for gas bought and sold at the Henry Hub in Louisiana has become a common index for Canadian natural gas producers with access to the American marketplace. In Alberta and Saskatchewan, the AECO price at Suffield is a reflection of the market price for natural gas sold locally, and the Sumas price on the British Columbia/ Washington border is critical to the BC producer. Developing a balance between supply and demand for natural gas produced in Western Canada has proved a challenge to the Canadian producer, where drilling activity, which leads to gas well completions, must serve to replace declining gas well production and fill new or expanded pipeline systems. In the early 1990’s, the Alberta, Saskatchewan and BC price of natural gas has often been suppressed, relative to the market opportunities in the United States, because local natural gas delivery exceeded the pipeline capacity leaving the provinces. Various new pipeline projects have provided sufficient market access to allow Western Canadian producers to double their production since 1986. With each new pipeline, the drilling activity expanded to ensure the pipeline was full and continued until a surplus in local productive capacity would once again depress the price of natural gas in the western provinces. An additional 1.1 Bcf per day of pipeline capacity completed during the 1998/99 winter, followed by 1.2 Bcf per day of capacity in the Alliance Pipeline, created additional market access for Canadian gas. This has strengthened the Canadian gas price and has created an integrated North American market. The average long-term price at Alberta AECO-C is approximately $Cdn 6.00 per MMBtu in real terms. In the United States, Sproule maintains a long-term threshold of $6.50 U.S. per MMBtu, in real terms. Detailed price schedules are set out in Table P-2. The actual plantgate price will vary with the heat content of the natural gas and the cost of transportation from the plantgate to the trading hub. In the absence of actual natural gas price statistics, the differential is based on the price of natural gas in the area. The evaluation of uncontracted shut-in gas reserves in Western Canada considers the proximity to existing infrastructure, and the production start date varies with the magnitude of the reserves and the development plans of the operator. To the extent the plant and gathering facilities of sufficient capacity are currently available, the production start date is deferred a year or two and the economics of plant development may curtail the production of the reserves to an average daily rate of 1.0 MMcfpd per 3.5 Bcf of reserves. For reserves located in remote areas, or reserves that are considered of poor quality, the production start date is no earlier than 2014. 3391.18388.AAS.smr P:\Eagleford Energy 18388\Report\Appendix B - Prices (August 31, 2011).doc
![]()
Appendix B — Page 3 Natural Gas By-Products Ethane, propane, butanes, and pentanes plus prices were forecast to continue their historic relationships with crude prices in major Eastern Canadian and U.S. market areas. Ethane prices are expected to increase from present levels at a rate that corresponds to the local Alberta spot price of gas. Sulphur prices reflect the current market. The price forecasts for natural gas by-products are set out in Table P-1. The prices for these by-products were adjusted in this report to reflect the actual prices received at the plantgate. 3391.18388.AAS.smr P:\Eagleford Energy 18388\Report\Appendix B - Prices (August 31, 2011).doc
![]()
Appendix B — Page 4 Table P-1 Summary of Price Forecasts and Inflation and Exchange Rates ($Cdn) Effective August 31, 2011 Light Crude Oil Heavy & Medium Oil Natural Gas Liquids & Sulphur Operating WTI Synthetic Western & Capital Cushing Edmonton Crude Oil Cromer Hardisty Hardisty Canada Cromer Hardisty Edmonton Plant Cost Oklahoma Par Price Edmonton LSB Heavy Lloyd Blend Select Medium Bow River Ethane Edmonton Edmonton Pentanes Gate Inflation Exchange 40oAPI 40oAPI 34oAPI 35oAPI 12oAPI 20.5oAPI 20.5oAPI 29.3oAPI 24.9oAPI Plant Gate Propane Butane Plus Sulphur Rate Rate Year ($US/bbl) ($/bbl) ($/bbl) ($/bbl) ($/bbl) ($/bbl) ($/bbl) ($/bbl) ($/bbl) ($/bbl) ($/bbl) ($/bbl) ($/bbl) ($/LT (%/Yr) ($US/$Cdn) Historical 2007 72.27 77.06 44.77 51.93 52.24 65.36 53.16 18.42 49.53 63.71 77.33 38.02 2.0 0.935 2008 99.59 102.85 107.11 76.32 82.58 83.62 93.05 83.85 22.59 58.80 75.09 104.70 303.84 1.0 0.943 2009 61.63 66.20 69.20 63.86 55.65 58.49 58.66 62.77 59.71 11.61 38.39 44.13 68.13 -5.08 2.0 0.880 2010 79.43 77.80 80.89 76.57 62.30 67.17 67.21 73.67 68.27 11.53 46.98 57.04 84.21 57.18 1.0 0.971 Forecast 2011 90.28 87.42 91.42 84.42 61.19 69.94 69.94 80.71 69.94 9.83 53.34 78.92 93.46 50.00 2.0 1.012 2012 93.23 90.32 94.32 87.32 63.23 72.26 72.26 83.39 72.26 10.93 55.11 81.54 96.57 51.00 2.0 1.012 2013 95.58 92.62 96.62 89.62 64.84 74.10 74.10 85.52 74.10 12.21 56.51 83.62 99.03 52.02 2.0 1.012 2014 95.97 92.99 96.99 89.99 65.10 74.40 74.40 85.86 74.40 14.43 56.74 83.96 99.42 79.59 2.0 1.012 2015 97.42 94.41 98.41 91.41 66.09 75.53 75.53 87.16 75.53 17.82 57.60 85.23 100.93 81.18 2.0 1.012 2016 99.37 96.32 100.32 93.32 67.42 77.05 77.05 88.92 77.05 18.20 58.76 86.95 102.97 82.81 2.0 1.012 2017 101.35 98.26 102.26 95.26 68.78 78.61 78.61 90.72 78.61 18.60 59.95 88.71 105.05 84.46 2.0 1.012 2018 103.38 100.25 104.25 97.25 70.17 80.20 80.20 92.55 80.20 19.00 61.16 90.50 107.17 86.15 2.0 1.012 2019 105.45 102.27 106.27 99.27 71.59 81.82 81.82 94.42 81.82 19.41 62.40 92.33 109.34 87.87 2.0 1.012 2020 107.56 104.33 108.33 101.33 73.03 83.47 83.47 96.33 83.47 19.82 63.66 94.19 111.55 89.63 2.0 1.012 2021 109.71 106.44 110.44 103.44 74.51 85.15 85.15 98.27 85.15 20.25 64.94 96.10 113.80 91.42 2.0 1.012 Thereafter Escalation Rate of 2% 3391.18388 .AAS.smr P:\Eagleford Energy 18388\Report\Table P-1 - August 31, 2011.doc
![]()
Appendix B — Page 5 Table P-2 Natural Gas Price Forecasts, Various Trading Points ($Cdn/MMbtu) Effective August 31, 2011 Alberta Gas Reference B.C. B.C. Huntingdon/ Henry Hub Price AECO -C Aggregator Alliance Average Westcoast Sumas Price Year Plant Gate Spot Intra-Alta Pipeline Wellhead Station 2 30-day Spot Dawn ($US/MMbtu) Historical 2007 6.20 6.65 6.34 6.04 6.00 6.40 7.01 7.69 6.86 2008 7.88 8.15 8.08 7.91 7.33 8.20 8.78 9.60 9.04 2009 3.85 4.19 3.91 3.35 3.29 4.17 4.54 4.91 4.01 2010 3.88 4.16 3.14 3.37 3.04 4.01 4.43 4.89 4.39 Forecast 2011 3.27 3.55 2.65 2.57 2.87 3.49 4.04 4.32 4.12 2012 3.69 3.94 3.11 3.07 3.26 3.88 4.43 4.72 4.52 2013 4.17 4.41 3.63 3.63 3.73 4.35 4.90 5.18 4.99 2014 4.99 5.21 4.48 4.48 4.53 5.15 5.70 5.98 5.80 2015 6.21 6.43 5.70 5.70 5.75 6.37 6.92 7.20 7.04 2016 6.39 6.57 6.05 5.84 5.89 6.51 7.06 7.34 7.18 2017 6.54 6.71 6.20 5.99 6.03 6.65 7.20 7.49 7.32 2018 6.68 6.86 6.34 6.13 6.18 6.80 7.35 7.63 7.47 2019 6.83 7.00 6.49 6.28 6.32 6.94 7.49 7.78 7.62 2020 6.98 7.15 6.64 6.43 6.47 7.09 7.64 7.93 7.77 2021 7.13 7.31 6.79 6.58 6.63 7.25 7.80 8.08 7.92 Thereafter Escalation Rate of 2% 3391.18388 .AAS.smr P:\Eagleford Energy 18388\Report\Table P-2 - August 31, 2011.doc
![]()
Appendix C — Page 1 Appendix C — Abbreviations This appendix contains a list of abbreviations that may be found in Sproule reports, as well as a table comparing Imperial and Metric units. Two conversion tables, used to prepare this report, are also provided. AOF absolute open flow ARTC Alberta Royalty Tax Credit BOE barrels of oil equivalent bopd barrels of oil per day bwpd barrels of water per day Cr Crown DCQ daily contract quantity DSU drilling spacing unit FH Freehold GCA gas cost allowance GOR gas-oil ratio GORR gross overriding royalty LPG liquid petroleum gas McfGE thousands of cubic feet of gas equivalent Mcfpd thousands of cubic feet per day MPR maximum permissive rate MRL maximum rate limitation NC ‘new’ Crown NCI net carried interest NGL natural gas liquids NORR net overriding royalty NPI net profits interest OC ‘old’ Crown ORRI overriding royalty interest P&NG petroleum and natural gas PSU production spacing unit PVT pressure-volume-temperature TCGSL TransCanada Gas Services Limited UOCR Unit Operating Cost Rates for operating gas cost allowance WI working interest 3391.18388.AAS.smr P:\Eagleford Energy 18388\Report\Appendix C - Abbrev.doc
![]()
Appendix C — Page 2 Imperial Units Metric Units M (103) one thousand Prefixes k (103) one thousand MM (106) million M (106) million B (109) one billion G (109) one billion T (1012) one trillion T (1012) one trillion E (1018) one milliard in. inches Length cm centimetres ft feet m metres mi mile km kilometres ft2 square feet Area m2 square metres ac acres ha hectares cf or ft3 cubic feet Volume m3 cubic metres scf standard cubic feet gal gallons L litres Mcf thousand cubic feet Mcfpd thousand cubic feet per day MMcf million cubic feet MMcfpd million cubic feet per day Bcf billion cubic feet (109) bbl barrels m3 cubic metre Mbbl thousand barrels stb stock tank barrel stm3 stock tank cubic metres bbl/d barrels per day m3/d cubic metre per day bbl/mo barrels per month Btu British thermal units Energy J joules MJ/m3 megajoules per cubic metre (106) TJ/d terajoule per day (1012) oz ounce Mass g gram lb pounds kg kilograms ton ton t tonne lt long to ns Mlt thousand long tons psi pounds per square inch Pressure Pa pascals kPa kilopascals (103) psia pounds per square inch absolute psig pounds per square inch gauge Temperatur °F degrees Fahrenheit e °C degrees Celsius °R degrees Rankine K Kelvin M$ thousand dollars Dollars k$ thousand dollars 3391.18388.AAS.smr P:\Eagleford Energy 18388\Report\Appendix C - Abbrev.doc
![]()
Appendix C — Page 3 Imperial Units Metric Units sec second Time s second min minute min minute hr hour h hour day day d day wk week week mo month month yr year a annum 3391.18388.AAS.smr P:\Eagleford Energy 18388\Report\Appendix C - Abbrev.doc
![]()
Appendix C — Page 4 Conversion Factors — Metric to Imperial cubic metres (m3) (@ 15°C) x 6.29010 = barrels (bbl) (@ 60°F), water m3 (@ 15°C) x 6.3300 = bbl (@ 60°F), Ethane m3 (@ 15°C) x 6.30001 = bbl (@ 60°F), Propane m3 (@ 15°C) x 6.29683 = bbl (@ 60°F), Butanes m3 (@ 15°C) x 6.29287 = bbl (@ 60°F), oil, Pentanes Plus m3 (@ 101.325 kPaa, 15°C) x 0.0354937 = thousands of cubic feet (Mcf) (@ 14.65 psia, 60°F) 1,000 cubic metres (103m3) (@ 101.325 kPaa, 15°C) x 35.49373 = Mcf (@ 14.65 psia, 60°F) hectares (ha) x 2.4710541 = acres 1,000 square metres (103m2) x 0.2471054 = acres 10,000 cubic metres (ha.m) x 8.107133 = acre feet (ac-ft) m3/103m3 (@ 101.325 kPaa, 15° C) x 0.0437809 = Mcf/Ac.ft. (@ 14.65 psia, 60°F) joules (j) x 0.000948213 = Btu megajoules per cubic metre (MJ/m3) x 26.714952 = British thermal units per standard cubic foot (Btu/scf) (@ 101.325 kPaa, 15°C) (@ 14.65 psia, 60°F) dollars per gigajoule ($/GJ) x 1.054615 = $/Mcf (1,000 Btu gas) metres (m) x 3.28084 = feet (ft) kilometres (km) x 0.6213712 = miles (mi) dollars per 1,000 cubic metres ($/103m3) x 0.0288951 = dollars per thousand cubic feet ($/Mcf) (@ 15.025 psia) B.C. ($/103m3) x 0.02817399 = $/Mcf (@ 14.65 psia) Alta. dollars per cubic metre ($/m3) x 0.158910 = dollars per barrel ($/bbl) gas/oil ratio (GOR) (m3/m3) x 5.640309 = GOR (scf/bbl) kilowatts (kW) x 1.341022 = horsepower kilopascals (kPa) x 0.145038 = psi tonnes (t) x 0.9842064 = long tons (LT) kilograms (kg) x 2.204624 = pounds (lb) litres (L) x 0.2199692 = gallons (Imperial) litres (L) x 0.264172 = gallons (U.S.) cubic metres per million cubic metres (m3/106m3) (C3) x 0.177496 = barrels per million cubic feet (bbl/MMcf) (@ 14.65 psia) m3/106m3) (C4) x 0.1774069 = bbl/MMcf (@ 14.65 psia) m3/106m3) (C5+) x 0.1772953 = bbl/MMcf (@ 14.65 psia) tonnes per million cubic metres (t/106m3) (sulphur) x 0.0277290 = LT/MMcf (@ 14.65 psia) millilitres per cubic meter (mL/m3) (C5+) x 0.0061974 = gallons (Imperial) per thousand cubic feet (gal (Imp)/Mcf) (mL/m3) (C5+) x 0.0074428 = gallons (U.S.) per thousand cubic feet (gal (U.S.)/Mcf) Kelvin (K) x 1.8 = degrees Rankine (°R) millipascal seconds (mPa.s) x 1.0 = centipoise 3391.18388.AAS.smr P:\Eagleford Energy 18388\Report\Appendix C - Abbrev.doc
![]()
Appendix C — Page 5 Conversion Factors — Imperial to Metric barrels (bbl) (@ 60°F) x 0.15898 = cubic metres (m3) (@ 15°C), water bbl (@ 60°F) x 0.15798 = m3 (@ 15°C), Ethane bbl (@ 60°F) x 0.15873 = m3 (@ 15°C), Propane bbl (@ 60°F) x 0.15881 = m3 (@ 15°C), Butanes bbl (@ 60°F) x 0.15891 = m3 (@ 15°C), oil, Pentanes Plus thousands of cubic feet (Mcf) (@ 14.65 psia, 60°F) x 28.17399 = m3 (@ 101.325 kPaa, 15°C) Mcf (@ 14.65 psia, 60°F) x 0.02817399 = 1,000 cubic metres (103m3) (@ 101.325 kPaa, 15°C) acres x 0.4046856 = hectares (ha) acres x 4.046856 = 1,000 square metres (103m2) acre feet (ac-ft) x 0.123348 = 10,000 cubic metres (104m3) (ha.m) Mcf/ac-ft (@ 14.65 psia, 60°F) x 22.841028 = 103m3/m3 (@ 101.325 kPaa, 15°C) Btu x 1054.615 = joules (J) British thermal units per standard cubic foot (Btu/Scf) x 0.03743222 = megajoules per cubic metre (MJ/m3) (@ 14.65 psia, 60°F) (@ 101.325 kPaa, 15°C) $/Mcf (1,000 Btu gas) x 0.9482133 = dollars per gigajoule ($/GJ) $/Mcf (@ 14.65 psia, 60°F) Alta. x 35.49373 = $/103m3 (@ 101.325 kPaa, 15°C) $/Mcf (@ 15.025 psia, 60°F), B.C. x 34.607860 = $/103m3 (@ 101.325 kPaa, 15°C) feet (ft) x 0.3048 = metres (m) miles (mi) x 1.609344 = kilometres (km) $/bbl x 6.29287 = $/m3 (average for 30°-50° API) GOR (scf/bbl) x 0.177295 = gas/oil ratio (GOR) (m3/m3) horsepower x 0.7456999 = kilowatts (kW) psi x 6.894757 = kilopascals (kPa) long tons (LT) x 1.016047 = tonnes (t) pounds (lb) x 0.453592 = kilograms (kg) gallons (Imperial) x 4.54609 = litres (L) (.001 m3) gallons (U.S.) x 3.785412 = litres (L) (.001 m3) barrels per million cubic feet (bbl/MMcf) (@ 14.65 psia) (C3) x 5.6339198 = cubic metres per million cubic metres (m3/106m3) bbl/MMcf (C4) x 5.6367593 = (m3/106m3) bbl/MMcf (C5+) x 5.6403087 = (m3/106m3) LT/MMcf (sulphur) x 36.063298 = tonnes per million cubic metres (t/106m3) gallons (Imperial) per thousand cubic feet (gal (Imp)/Mcf) (C5+) x 161.3577 = millilitres per cubic meter (mL/m3) gallons (U.S.) per thousand cubic feet (gal (U.S.)/Mcf) (C5+) x 134.3584 = (mL/m3) degrees Rankine (°R) x 0.555556 = Kelvin (K) centipoises x 1.0 = millipascal seconds (mPa.s) 3391.18388.AAS.smr P:\Eagleford Energy 18388\Report\Appendix C - Abbrev.doc
![]()
Appendix D— Page 1 Appendix D — General Evaluation Parameters Royalties and Mineral Taxes The lessor and overriding royalties were based on existing agreements and government regulations. The Crown royalty rates and the Freehold Mineral Taxes were based upon existing provincial regulations. Changes to royalties enacted by legislation in Alberta have been included in this report. Operating and Capital Costs Operating and capital costs were based on current costs and were escalated to the dates when these costs would be incurred. When escalated, the operating costs and capital costs were escalated based upon the schedule of escalation factors included in Appendix B, Table P-1. Where applicable, a fee for dehydration, gathering, compression and processing was applied against royalty gas and credited to the Company. By-Product Reserves The Company’s proved and probable by-product reserves are associated with a number of the properties evaluated in this report. The by-product reserves and production forecasts were based on the recovery rates determined from revenue statements (barrels per MMcf or long tons per MMcf of natural gas) or from natural gas compositional analysis and the natural gas reserves and production forecasts. Future prices were estimated based on the forecasts presented in Appendix B. Gas Cost Allowance The operating portion of the gas cost allowance (GCA) has been included with each individual entity. The value has been estimated based on either custom processing fees or actual operating costs, as reported by the Facility Cost Centre (FCC) operator. The Alberta Department of Energy Unit Operating Cost Rates (UOCR) Plant Types, or UOCR-designated facility rates, are replaced by the FCC in 2009. These FCC costs have been estimated based on the old custom processing fees or UOCR’s. 3391.18388.AAS.smr P:\Eagleford Energy 18388\Report\Appendix D - General.doc
![]()
Appendix D— Page 2 The Corporate Effective Royalty Rate is replaced by the Facility Effective Royalty Rate (FERR) in 2009. The FERR will include a capital cost component, which will replace the Capital GCA pools. As this GCA is in the transitional stages of changing to new regulations, the capital portion of the GCA is estimated based on the historical Capital GCA pools until enough information is available to include it with the operating portion. Abandonment and Reclamation Well abandonment and disconnect costs were estimated and included in our report at the individual entity level for all wells that were assigned reserves. No allowance for surface lease reclamation and salvage value was included. No abandonment costs have been estimated for suspended wells, gathering systems, batteries, plants, or processing facilities. Corporate Income Taxes At the request of the Company, income taxes have not been considered in this report. However, for completeness, the procedure used in calculating Canadian income tax is set out below. All royalties on production from Indian Lands are deductible. Non-Crown (that is, freehold or overriding) royalties are subdivided as follows, for income tax calculations: (a) Production royalties are those non-Crown royalties which are subject to payments to the Crown (including Freehold Mineral Taxes (Alberta), Freehold Production Taxes (Saskatchewan), and Incremental Taxes (Manitoba)). (b) Resource Royalties are those non-Crown royalties which are not subject to non-deductible Crown payments. The procedure for calculating Canadian income taxes used in this report, is as follows: 1. Determine revenues from the production and sale of oil, gas, and by-products, including sulphur, from field processing of gas of other producers, and from gas production royalties. (This calculation is to be made gross of any Crown charges.) 2. Deduct operating and direct overhead costs. 3. Deduct capital cost allowance (depreciation). 3391.18388.AAS.smr P:\Eagleford Energy 18388\Report\Appendix D - General.doc
![]()
Appendix D— Page 3 4. Deduct production royalties paid or payable. 5. Deduct Crown charges (Crown royalties and freehold mineral taxes). 6. Deduct resource royalties paid. 7. Deduct intangible costs: 10 percent of non-amortized balance at end of year for Canadian Oil and Gas Property Expense (COGPE), 30 percent of non-amortized balance at end of year for Canadian Development Expense (CDE), 100 percent of Canadian Exploration Expense (CEE). 8. Deduct interest, NPI expenses, abandonment costs, and Saskatchewan capital tax. 9. Deduct earned depletions. This deduction was discontinued many years ago. However, some companies could have a residual balance available. If so, the amount that can be claimed is the lesser of production profits (for this purpose includes resource royalties earned and is reduced by deduction for resource royalties paid or payable, and COGPE, CDE, and CEE deductions and interest) and the remaining balance of earned depletion. 10. Add resource royalties received or receivable, and other income (including NPI income). 11. Calculate taxable income for federal and provincial tax purposes, which equals the amount by which the aggregate of Items 1 and 10 exceed the aggregate of Items 2 through 9. 12. Calculate federal income taxes payable by multiplying federal taxable income by the federal tax rate. 13. Calculate provincial income taxes payable by multiplying provincial taxable income by the appropriate provincial tax rate. 3391.18388.AAS.smr P:\Eagleford Energy 18388\Report\Appendix D - General.doc
![]()
Appendix D— Page 4 Processing Income Some clarification is required with regard to the definition of field processing plants. The following describes plants where the processing revenue would be included in the resource revenue. (a) Field separation and dehydration facilities. (b) A natural gas processing plant which processes raw natural gas to the point of acceptance by a common carrier, including the processing of hydrogen sulphide. (c) Fully integrated plants that take raw natural gas through the whole process of converting such gas to natural gas liquids and to further convert the natural gas liquids to liquefied petroleum products. The following describes plants where the processing revenue would not be included in the resource revenue. (a) Straddle plants which enhance the recovery of natural gas liquids. (b) Any part of a natural gas processing plant that is devoted primarily to the recovery of ethane. (c) Plants used in the processing of heavy crude oil or a tar sands deposit. Capital Cost Allowance Capital cost allowance (CCA) is the rate at which the government allows depreciation on tangible capital investment items. The principal classes of interest to an oil or gas producer for new capital investments are: Class Description Write-Off 2 Oil or gas transmission pipelines of 6% declining balance more than 15 years’ life. 7 Vessels, including offshore drilling vessels. 25% declining balance 3391.18388.AAS.smr P:\Eagleford Energy 18388\Report\Appendix D - General.doc
![]()
Appendix D— Page 5 Class Description 8 Oil or gas transmission pipelines with a life of 15 years or less, any refineries, separators not included in Class 43, compressors. 12 The cost, after November 16, 1978, of removing overburden after the start of production at a mine. Computer software, other than systems software. 28 Mining assets acquired in a major expansion of a mine or before the start of production which would otherwise be in Class 41. 41 Drilling rigs, gas or oil well equipment. Oil or gas gathering lines leading to a transmission pipeline or natural gas processing plant, and field processing plants. Automotive equipment. Mining buildings, equipment, social capital and spur lines not included in Class 28. Electric data processing equipment including systems software. 43 Refineries acquired after May 8, 1972. Plants acquired after April 10, 1978 to upgrade heavy oil, straddle plants, and any part of a gas processing plant devoted primarily to the recovery of ethane. Write-Off 20% declining balance 100% 25% declining balance 25% declining balance 30% declining balance When using the declining balance, the prescribed rate is applied to the undepreciated portion of the capital costs in a particular class at the end of the fiscal year. It is not necessary to claim full capital cost allowance, and any amount from zero to the stated maximum can be claimed. In the year that the capital cost is incurred, only one-half of the stated maximum is allowed. The asset descriptions contained in the Income Tax Act are drafted precisely. If an asset does not exactly fit the description of a class, then it is not to be included in that class. Class 8 is a residual class. If property does not qualify for inclusion in any other class, and if it is not specifically excluded from Class 8, then it falls into Class 8. 3391.18388.AAS.smr P:\Eagleford Energy 18388\Report\Appendix D - General.doc
![]()
Appendix D— Page 6 Resource Allowance As of January 1, 2007, there is no further deductible percentage for Resource Allowance. Intangible Costs Intangible costs are certain of the capital costs which, for taxable net income calculation purposes, are expensed or written off in the year of expenditures or at a specified rate over a number of years. A distinction is made for tax purposes between Canadian Exploration Expense, Canadian Development Expense, and Canadian Oil and Gas Property Expense. All these expenses may be carried forward indefinitely. These expenses must be reduced by the amount of any incentive payments made by the Federal government for exploration or development. (a) Canadian Exploration Expense (CEE) includes intangible costs of drilling exploratory wells, as well as geological and geophysical expenses and all dry wells. These costs may be written off at the rate of 100 percent by principal business corporations in the year in which the expenditure was made. (b) Canadian Development Expense (CDE) includes intangible development drilling costs. Canadian Development Expense is written off at the rate of 30 percent per annum of the diminishing balance. (c) Canadian Oil and Gas Property Expense (COGPE) includes the cost of purchasing any producing oil and gas reserves and any unproven P&NG properties. This expense is written off at the rate of 10 percent per annum of the diminishing balance. Income Tax Rates The tax rates used for an escalated case reflect the current position of the Federal and Provincial governments with respect to income taxes in Canada. A constant case will reflect the current tax rates held flat for the projection period. The following table provides the taxation rates for the current year and the final year of the transition period. 3391.18388.AAS.smr P:\Eagleford Energy 18388\Report\Appendix D - General.doc
![]()
Appendix D— Page 7 Resource and Processing Income Resource Income Processing Income(1) 2008 2009 2010 2011 2012 2008 2009 2010 2011 2012 Net Federal Rate: 19.5 19.0 18.0 16.5 15.0 19.5 19.0 18.0 16.5 15.0 Provincial Rates: Alberta 10.0 10.0 10.0 10.0 10.0 10.0 10.0 10.0 10.0 10.0 British Columbia 12.0 12.0 12.0 12.0 12.0 12.0 12.0 12.0 12.0 12.0 Manitoba 14.0/ 13.0 13.0 13.0 13.0 14.0/ 13.0 13.0 13.0 13.0 13.0 13.0 Newfoundland 14.0 14.0 14.0 14.0 14.0 5.0 5.0 5.0 5.0 5.0 Nova Scotia 16.0 16.0 16.0 16.0 16.0 16.0 16.0 16.0 16.0 16.0 Ontario 14.0 14.0 14.0 14.0 14.0 12.0 12.0 12.0 12.0 12.0 Saskatchewan 13.0/ 12.0 12.0 12.0 12.0 10.0 10.0 10.0 10.0 10.0 12.0 (1) Manufacturing and processing. 3391.18388.AAS.smr P:\Eagleford Energy 18388\Report\Appendix D - General.doc
![]()
Appendix D— Page 8 Capital Taxes A federal “Large Corporation Tax” of 0.175 percent is employed in Canada on capital in excess of $50 million. The capital tax is fully creditable against the existing corporate surtax which is currently 1.12 percent for all types of income. This report includes the cost of the corporate surtax but does not reflect the impact of the federal Large Corporation Tax. Successor Rules Successor rules may apply where there has been an acquisition by a corporation, in which case resource tax pools that are transferred to the purchaser will be streamed so that they will only be allowed as deductions against proceeds attributable to the resource properties acquired from the vendor. This report does not reflect the impact of Successor Rules. Net Present Values The estimates of the P&NG reserves and their respective net present values are summarized by property and by reserves category in the Discussion section of this report. Detailed forecasts of production and net revenue for the various reserves categories are presented in Tables in the Summary and Discussion sections. 3391.18388.AAS.smr P:\Eagleford Energy 18388\Report\Appendix D - General.doc