Paracorp Inc.
Annual Report 2018
As of March 31, 2018
Matisse Discounted Closed-End Fund
Strategy
Institutional Class Shares
This report and the financial statements contained herein are submitted for the general information of the shareholders of the Matisse Discounted Closed-End Fund Strategy (the "Fund"). The Fund's shares are not deposits or obligations of, or guaranteed by, any depository institution. The Fund's shares are not insured by the FDIC, Federal Reserve Board or any other agency, and are subject to investment risks, including possible loss of principal amount invested. Neither the Fund nor the Fund's distributor is a bank.
The Matisse Discounted Closed-End Fund Strategy is distributed by Capital Investment Group, Inc., Member FINRA/SIPC, 100 E. Six Forks Road, Suite 200, Raleigh, NC, 27609. There is no affiliation between the Matisse Discounted Closed-End Fund Strategy, including its principals, and Capital Investment Group, Inc.
Statements in this Annual Report that reflect projections or expectations of future financial or economic performance of the Matisse Discounted Closed-End Fund Strategy ("Fund") and of the market in general and statements of the Fund's plans and objectives for future operations are forward-looking statements. No assurance can be given that actual results or events will not differ materially from those projected, estimated, assumed or anticipated in any such forward-looking statements. Important factors that could result in such differences, in addition to the other factors noted with such forward-looking statements, include, without limitation, general economic conditions such as inflation, recession and interest rates. Past performance is not a guarantee of future results.
An investor should consider the investment objectives, risks, charges and expenses of the Fund carefully before investing. The prospectus contains this and other information about the Fund. A copy of the prospectus is available at ncfunds.com or by calling Shareholder Services at 800-773-3863. The prospectus should be read carefully before investing. |
For More Information on Your Matisse Discounted Closed-End Fund Strategy:
See Our Web sites @ matissefunds.com
or
Call Our Shareholder Services Group at 800-773-3863.
Dear Fellow Shareholders of the Matisse Discounted Closed-End Fund Strategy:
Please find enclosed for your review the Annual Report for the Matisse Discounted Closed-End Fund Strategy (the "Fund") for the fiscal year ending March 31, 2018. The Fund formally launched on October 31, 2012.
As you can see from the table below, Fund performance for the fiscal year was positive, and well ahead of our balanced benchmarks (S-Network Composite Closed-End Fund Total Return Index, S&P Target Risk Moderate Index, and the Barclays U.S. Aggregate Bond Total Return Bond Index) . This has taken the Fund's performance since inception ahead of its balanced benchmarks as well.
Three major factors contributed during the fiscal year to the Fund's performance relative to these indexes:
| | First, a positive factor: the Fund owns closed-end funds ("CEFs") that own foreign stocks and bonds as well as US stocks and bonds. This is in keeping with our diversified approach. For the fiscal year, while US equities as measured by the S&P 500 rose 14%: |
| o | Foreign developed equities as measured by the MSCI EAFE Index rose 15%. |
| o | Emerging market equities as measured by the MSCI Emerging Market Index, a drag on performance for much of our Fund's life, gained 25%. |
| o | The US Dollar lost about 10% of its value against a basket of foreign currencies. |
Our Emerging Market CEFs were an especially important contributor to the Fund's fiscal year performance. Not only did their underlying portfolios (generally) turn in strong gains, but several of our holdings finalized a settlement with a large investor in which the CEFs agreed to tender for approximately half of their outstanding shares at NAV. These CEFs' discounts narrowed, and the tender is scheduled to take place by the end of June.
| | Second, a negative factor: although discounts on Equity and Balanced CEFs narrowed on average, Taxable Bond CEF and (especially) Municipal Bond CEF discounts widened sharply. For the fiscal year: |
| o | Balanced CEF discounts narrowed by 2.3%. |
| o | International Equity CEF discounts narrowed by 0.3%. |
| o | US & Sector Equity CEF discounts narrowed by 1.7%. |
| o | Taxable Bond CEF discounts widened by 1.0%. |
| o | Municipal Bond CEF discounts widened by 4.8%. |
| o | The CEF universe overall saw its average discount widen by 1.2%, from 5.26% to 6.44%. |
On average, then, discount movement in the overall CEF universe was a drag on our results.
| | Third, a positive factor: we added substantial additional value during the fiscal year through our normal process of replacing less attractively discounted CEFs in our portfolio with highly discounted CEFs. The net impact of this discount movement and "capture" for the Fund during the fiscal year was +191 bps, accounting for a substantial portion of our alpha. This result was especially encouraging in light of the discount-related headwinds noted in the paragraph above. |
Average Annual Total Returns
Periods ended March 31, 2018 | One year | Five years | Annualized since inception1 | Gross Expense Ratio2 | Net Expense Ratio2 | Fund Expense Limit3 |
Matisse Discounted Closed-End Fund Strategy – Institutional Class Shares | 10.89% | 7.15% | 7.78% | 2.71% | 2.67% | 1.25% |
S&P 500 Index4 | 13.99% | 13.29% | 14.66% | N/A | N/A | N/A |
S-Network Composite Closed-End Fund Total Return Index4 | 6.79% | 5.93% | 6.64% | N/A | N/A | N/A |
S&P Target Risk Moderate Index4 | 7.46% | 5.30% | 5.89% | N/A | N/A | N/A |
MSCI EAFE Total Return Index4 | 14.80% | 6.49% | 8.07% | N/A | N/A | N/A |
Barclays U.S. Aggregate Bond Total Return Bond Index4 | 1.20% | 1.82% | 1.67% | N/A | N/A | N/A |
The performance information quoted above represents past performance and past performance does not guarantee future results. Investment return and principal value of an investment will fluctuate so that an investor's shares, when redeemed, may be worth more or less than their original cost. Current performance may be lower or higher than the performance data quoted. Performance data, current to the most recent month end, may be obtained by calling the Fund at 800-773-3863. Fee waivers and expense reimbursements have positively impacted Fund performance.
1The Inception date of the Institutional Class Shares is October 31, 2012.
2 Gross and net expense ratios are from the Fund's prospectus dated July 28, 2017.
3 The Fund's advisor has entered into an Expense Limitation Agreement with the Fund under which it has agreed to waive or reduce its fees in an amount that limits the Fund's annual operating expenses (exclusive of acquired fund fees and expenses, interest, taxes, brokerage fees and commissions, extraordinary expenses, and payments under the Rule 12b-1 distribution plan) to not more than 1.25% of the average daily net assets of the Fund through July 31, 2018. The Expense Limitation agreement may not be terminated prior to that date. The Fund's advisor cannot recoup from the Fund any amounts paid by the Fund's advisor under the Expense Limitation Agreement. Further, net annual operating expenses for the Fund may exceed those contemplated by the waiver due to acquired fund fees and other expenses that are not waived under the Expense Limitation Agreement.
4You cannot invest directly in this index. This index does not have an investment advisor and does not pay any commissions, expenses, or taxes. If this index did pay commissions, expenses, or taxes, its returns would be lower. Performance returns for the indexes shown in this table are since the Fund's inception date of October 31, 2012.
Portfolio positioning
We are excited about the opportunity reflected in the large discounts to NAV at which our current holdings trade. As of the end of March, our average holding traded at a 14.1% discount to NAV. The overall CEF universe also trades at an attractive discount (6.4% as of the end of March vs. its long-run average of 3.8%), and a broad selection of state-specific Municipal Bond CEFs (which figure prominently in the Fund) trade at wider discounts than at any time in history other than late 2008. We have enjoyed good relative performance recently. However, this outperformance has come despite the fact that CEF discounts remain at very attractive levels relative to their history.
Where are we finding the greatest opportunities? In several asset classes whose discounts remain unusually wide relative to their history:
| | International Equity CEFs are 8.4% discounted on average, compared to their 7.0% average since 1/1/061, and the conclusion of the tender offers discussed above should provide activist investors in the space (including the Fund) with extra cash to take larger positions in other Foreign/EM CEFs and, thereby, increase the chances of similar results there. |
| | Municipal Bond CEFs are 8.7% discounted on average, compared to their 3.0% average since 1/1/06. 1 Investors appear to be extremely afraid of rising rates, and are, therefore, providing us with the opportunity to own investment-grade bonds---already at essentially 7-year price lows---at an additional 15% discount! |
| | Taxable Bond CEFs are 5.1% discounted on average, compared to their 4.6% average discount since 1/1/06. 1 In general, we are waiting for discounts in this space to become more attractive before taking significant positions, given where we are in the credit cycle. |
In addition to these broad opportunities, we own highly discounted CEFs in many different asset classes and sectors. On a lookthrough basis, our portfolio of CEFs was about 62% allocated to stocks at the end of the fiscal year, with more foreign than domestic stocks. We are large-cap tilted. Given the attractive opportunities, about 25% of our Fund was invested in municipal bonds on a lookthrough basis.
Our outlook
We will continue to focus primarily on diligently capturing inefficiencies created by other participants in the niche, retail-dominated closed-end fund space. However, we are also watching several interesting developments as "clues" to guide us in how to "lean" our lookthrough portfolio allocation. (As always, we'll make our primary decision based on the attractiveness of the discounts we see.)
| | As the US economy continues to perform reasonably well, bond yields have bounced higher, with the 10-year Treasury closing the quarter at about 2.7% and touching 3.0% in April. With an unemployment rate of 4.1%, we seem to be at "full employment". Inflation, by most measures, is solidly above 2%, and the Fed funds rate has climbed to 1.7% with LIBOR above 2.3%. Despite the rate increases, investment-grade bonds still yield 4% at most, stocks yield around 2%, and money market rates are about 1-2%, making CEF cash distributions of 5-7% awfully appealing to retail investors with few income alternatives. |
1 The Advisor calculates the average discounts for Closed-End Fund asset categories based on detailed historical data from Bloomberg, specifically month-end closing trading prices and Net Asset Values ("NAVs") for each CEF, where the discount equals the closing trading price divided by the closing NAV, minus one.
| | Valuations on US stocks bear watching here. The median S&P 500 company trades at 22 times earnings, and 18 times tax-bill-bumped 2018 projected earnings. The median NASDAQ 100 company trades at 27 times earnings, and 20 times 2018 projected earnings. These are the highest trailing projected earnings in the past 8 years, and are now higher than the since-1987 average of 19.1. Bond yields may be low from a long-term perspective, but they are at 7-year highs, and thus no longer are at the extremes that some might point to for "relative value" justification (aka the "Fed Model"). Foreign stocks---especially stocks in many emerging markets---are substantially cheaper, and foreign currencies appear to be undervalued by many metrics (for example, purchasing power parity) vs. the US dollar. |
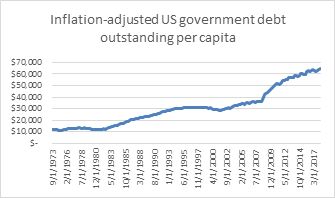
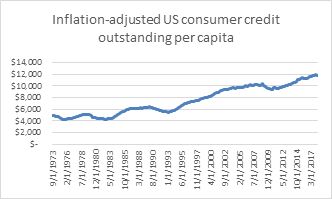
| | The US is in the 9th year of economic expansion, making it the second-longest uninterrupted US expansion ever (second to the 1990s, of course). Unless you think the business cycle has been abolished, the likelihood of a recession in the next few years is fairly high. Financial and other imbalances have built up in this expansion just as they built up in the 1990s and the 2002-2007 period, and the proper measurement of ("reckoning for") these imbalances will only be clear after the next downturn. One thing that is clear is that the entire financial system has record levels of debt, which makes the economy ultra-sensitive to interest rates. (See charts below.) Since the Fed is well aware of this, they are likely to keep a "lid" on longer-term interest rates for generations to come. We see this as beneficial for bonds, and bond CEFs going forward. In simplest terms: A) If rates remain stable or fall, bonds could provide acceptable returns augmented by extra income from Bond CEFs at discounts; B) if rates begin to rise, the economy could collapse, bond returns would likely be better than stock returns, and the Fed would likely employ extraordinary means to bring rates down again, supporting bond prices. |
We appreciate your interest in, and investment in, the Fund. We'll continue to keep you updated on the important developments we see in the misunderstood, retail-dominated world of closed-end funds. Feel free to contact the Fund at 800-773-3863, or your Fund Management Team at (503) 210-3005 to discuss the Matisse Discounted Closed-End Fund Strategy and our investment approach.
Sincerely,
| Eric Boughton, CFA | Bryn Torkelson | |
Portfolio Manager | Founder & CIO | |
Matisse Capital | Matisse Capital | |
(RCMAT0417003)
| Matisse Discounted Closed-End Fund Strategy | | | | | | | | | | | |
| Institutional Class Shares | | | | | | | | | | | |
| | | | | | | | | | | | | | | | | | |
| Performance Update (Unaudited) | | | | | | | | | | | |
| | | | | | | | | | | | | | | | | | |
| For the period from October 31, 2012 (Date of Initial Public Investment) through March 31, 2018 |
| | | | | | | | | | | | | | | | | | |
| Comparison of the Change in Value of a $10,000 Investment | | | | | | | | |
| | | | | | | | | | | | | | | | | | |
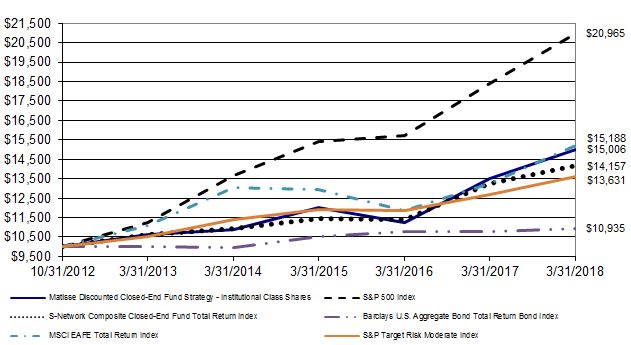
| This graph assumes an initial investment of $10,000 at October 31, 2012 (Date of Initial Public Investment). All dividends and distributions are reinvested. This graph depicts the performance of the Matisse Discounted Closed-End Fund Strategy versus the Fund's benchmark index, the S&P 500 Index. Other indices shown are the S-Network Composite Closed-End Fund Total Return Index, the Barclays U.S. Aggregate Total Return Bond Index, the S&P Target Risk Moderate Index, and the MSCI EAFE Total Return Index. It is important to note that the Fund is a professionally managed mutual fund while the indices are not available for investment and are unmanaged. The comparison is shown for illustrative purposes only. |
| | Average Annual Total Returns |
| | | | | | | | | | | | | | Gross | | Net | | Fund |
| | | For Periods Ended | One | | Five | | Since | | Expense | Expense | Expense |
| | | March 31, 2018 | | Year | | Years | | Inception* | Ratio** | | Ratio** | | Limit** |
| | | Institutional Class Shares | 10.89% | | 7.15% | | 7.78% | | 2.71% | | 2.67% | | 1.25% |
| | | S&P 500 Index | | 13.99% | | 13.29% | | 14.66% | | N/A | | N/A | | N/A |
| | | S-Network Composite Closed-End Fund Total | | | | | | | | | | | |
| | | | Return Index | | 6.79% | | 5.93% | | 6.64% | | N/A | | N/A | | N/A |
| | | S&P Target Risk Moderate Index | 7.46% | | 5.30% | | 5.89% | | N/A | | N/A | | N/A |
| | | MSCI EAFE Total Return Index | 14.80% | | 6.49% | | 8.07% | | N/A | | N/A | | N/A |
| | | Barclays U.S. Aggregate Total Return Bond Index | 1.20% | | 1.82% | | 1.67% | | N/A | | N/A | | N/A |
| | | *For the period from October 31, 2012 (Date of Initial Public Investment) through March 31, 2018. |
| | | **The gross expense ratio, the net expense ratio, and the fund expense limits shown are from the Fund's prospectus dated July 28, 2017. |
| | | | | | | | | | | | | | | | |
| Performance quoted above represents past performance, which is no guarantee of future results. Investment return and principal value will fluctuate so that shares, when redeemed, may be worth more or less than their original cost. Current performance may be lower or higher than the performance data quoted. An investor may obtain performance data, current to the most recent month-end, by visiting ncfunds.com. |
| The graph and table do not reflect the deduction of taxes that a shareholder would pay on Fund distributions or the redemption of Fund shares. Average annual total returns are historical in nature and measure net investment income and capital gain or loss from portfolio investments assuming reinvestments of dividends and distributions. |
| Matisse Discounted Closed-End Fund Strategy | | | | | |
| | | | | | | | | | |
| Schedule of Investments | | | | | | |
| | | | | | | | | | |
| As of March 31, 2018 | | | | | | |
| | | | | | | | Shares | | Value (Note 1) |
| | | | | | | | | | |
| CLOSED-END FUNDS - 97.44% | | | | | | |
| | | Aberdeen Emerging Markets Equity Income Fund, Inc. | | 81,716 | $ | 738,304 |
| | | Aberdeen Emerging Markets Smaller Co. Opportunities Fund, Inc. | 198,003 | | 2,931,177 |
| | | Aberdeen Greater China Fund, Inc. | | | 216,700 | | 2,921,116 |
| | | Aberdeen Indonesia Fund, Inc. | | | | 99,300 | | 723,897 |
| | | Aberdeen Latin America Equity Fund, Inc. | | | 97,737 | | 2,676,049 |
| | | Aberdeen Singapore Fund, Inc. | | | | 148,199 | | 1,965,119 |
| | | Adams Natural Resources Fund, Inc. | | | 93,954 | | 1,710,931 |
| | | Alliance California Municipal Income Fund, Inc. | | | 31,685 | | 402,716 |
| | | ASA Gold and Precious Metals Ltd. | | | 78,167 | | 814,500 |
| | | Asia Tigers Fund, Inc. | | | | 499 | | 6,277 |
| | | Bancroft Fund Ltd. | | | | 12,109 | | 254,168 |
| | | BlackRock Muni New York Intermediate Duration Fund, Inc. | | 11,270 | | 145,270 |
| | | BlackRock MuniYield California Quality Fund, Inc. | | 50,100 | | 667,332 |
| | | BlackRock New York Municipal Bond Trust | | | 5,268 | | 69,643 |
| | | BlackRock New York Municipal Income Trust II | | | 2,642 | | 34,584 |
| | | BrandywineGLOBAL Global Income Opportunities Fund, Inc. | | 25,286 | | 325,937 |
| | | Central and Eastern Europe Fund, Inc. | | | 94,708 | | 2,427,366 |
| | | Central Securities Corp. | | | | 178,885 | | 4,769,074 |
| | | Dividend and Income Fund, Inc. | | | | 310,000 | | 3,893,600 |
| | | DTF Tax-Free Income, Inc. | | | | 5,002 | | 66,577 |
| | | Eagle Capital Growth Fund, Inc. | | | | 36,140 | | 276,110 |
| | | Eagle Growth & Income Opportunities Fund | | | 191,000 | | 2,870,711 |
| | | Eaton Vance California Municipal Bond Fund | | | 93,873 | | 963,137 |
| | | Eaton Vance California Municipal Bond Fund II | | | 8,970 | | 95,889 |
| | | Eaton Vance California Municipal Income Trust | | | 133,177 | | 1,514,222 |
| | | Eaton Vance Michigan Municipal Bond Fund | | | 16,000 | | 208,000 |
| | | Eaton Vance Michigan Municipal Income Trust | | | 60,000 | | 734,400 |
| | | Eaton Vance New Jersey Municipal Bond Fund | | | 77,000 | | 902,440 |
| | | Eaton Vance New Jersey Municipal Income Trust | | 137,000 | | 1,530,290 |
| | | Eaton Vance New York Municipal Bond Fund II | | | 19,721 | | 211,409 |
| | | Eaton Vance Ohio Municipal Income Trust | | | 26,433 | | 328,827 |
| | | First Trust Strategic High Income Fund II | | | 91,328 | | 1,114,202 |
| | | General American Investors Co., Inc. | | | 14,943 | | 500,142 |
| | | Invesco Pennsylvania Value Municipal Income Trust | | 50,270 | | 590,672 |
| | | Ivy High Income Opportunities Fund | | | 100 | | 1,418 |
| | | Mexico Equity & Income Fund, Inc. | | | 60,796 | | 666,324 |
| | | MFS California Municipal Fund | | | | 36,272 | | 379,042 |
| | | Morgan Stanley China A Share Fund, Inc. | | | 90,179 | | 2,245,457 |
| | | Morgan Stanley Emerging Markets Domestic Debt Fund, Inc. | | 100 | | 782 |
| | | Morgan Stanley Emerging Markets Fund, Inc. | | | 222,499 | | 4,100,568 |
| | | Neuberger Berman New York Intermediate Municipal Fund, Inc. | | 44,534 | | 517,040 |
| | | Nuveen Connecticut Quality Municipal Income Fund | | 356,000 | | 4,094,000 |
| | | Nuveen Maryland Quality Municipal Income Fund | | 52,786 | | 638,711 |
| | | Nuveen Michigan Quality Municipal Income Fund | | | 203,747 | | 2,581,474 |
| | | Nuveen New Jersey Quality Municipal Income Fund | | 302,900 | | 3,952,845 |
| | | Nuveen New York Quality Municipal Income Fund | | 1,400 | | 17,766 |
| | | | | | | | | | (Continued) |
| Matisse Discounted Closed-End Fund Strategy | | | | | |
| | | | | | | | | | |
| Schedule of Investments - Continued | | | | | | |
| | | | | | | | | | |
| As of March 31, 2018 | | | | | | |
| | | | | | | | Shares | | Value (Note 1) |
| | | | | | | | | | |
| CLOSED-END FUNDS - Continued | | | | | | |
| | | Nuveen North Carolina Quality Municipal Income Fund | | 73,405 | $ | 900,679 |
| | | Nuveen Pennsylvania Quality Municipal Income Fund | | 73,423 | | 919,256 |
| | * | Pershing Square Holdings Ltd. Fund | | | 220,000 | | 2,695,000 |
| | | Principal Real Estate Income Fund | | | 56,616 | | 947,180 |
| | | RMR Real Estate Income Fund | | | | 238,423 | | 3,974,511 |
| | | Templeton Dragon Fund, Inc. | | | | 88,086 | | 1,959,033 |
| | * | Terra Capital PLC | | | | 1,162,649 | | 1,168,462 |
| | | The Asia Pacific Fund, Inc. | | | | 100,520 | | 1,487,696 |
| | | The China Fund, Inc. | | | | 129,171 | | 2,859,846 |
| | * | The Gabelli Global Small and Mid Cap Value Trust | | 103,788 | | 1,241,823 |
| | | The Gabelli Healthcare & WellnessRx Trust | | | 89,486 | | 850,117 |
| | | The GDL Fund | | | | | 428,000 | | 3,988,960 |
| | | The Latin American Discovery Fund, Inc. | | | 200,000 | | 2,452,000 |
| | | The Mexico Fund, Inc. | | | | 218,727 | | 3,545,565 |
| | | The New Ireland Fund, Inc. | | | | 96,596 | | 1,163,982 |
| | | The Taiwan Fund, Inc. | | | | 49,978 | | 1,057,035 |
| | | Third Point Offshore Investors Ltd. | | | 114,000 | | 1,852,500 |
| | | | | | | | | | |
| | | Total Closed-End Funds (Cost $86,069,281) | | | | | 91,643,160 |
| | | | | | | | | | |
| SHORT-TERM INVESTMENT - 3.98% | | | | | | |
| § | Fidelity Institutional Money Market Funds - Government Portfolio, 1.36% | 3,742,725 | $ | 3,742,725 |
| | | | | | | | | | |
| | Total Short-Term Investment (Cost $3,742,725) | | | | | 3,742,725 |
| | | | | | | | | | |
| Total Value of Investments (Cost $89,812,006) - 101.42% | | | $ | 95,385,885 |
| | | | | | | | | | |
| Liabilities in Excess of Other Assets - (1.42)% | | | | | (1,337,246) |
| | | | | | | | | | |
| | Net Assets - 100.00% | | | | | $ | 94,048,639 |
| | | | | | | | | | |
| | * | Non-income producing investment | | | | | |
| | § | Represents 7 day effective SEC yield | | | | | |
| | The following acronym or abbreviation is used in this Schedule: | | | | |
| | | PLC - Public Limited Company | | | | | | |
| | | | | | | | | |
| | | | Summary of Investments | | | | |
| | | | | | % of Net | | | |
| | | | | | Assets | | Value | |
| | | | Closed-End Funds | 97.44% | $ | 91,643,160 | |
| | | | Short-Term Investment | 3.98% | | 3,742,725 | |
| | | | Liabilities in Excess of Other Assets | (1.42)% | | (1,337,246) | |
| | | | Total Net Assets | | 100.00% | $ | 94,048,639 | |
| | | | | | | | | |
| | | | | | | | | |
| See Notes to Financial Statements | | | | | |
| Matisse Discounted Closed-End Fund Strategy | | |
| | | | |
| Statement of Assets and Liabilities | | |
| | | | |
| As of March 31, 2018 | | |
| | | | |
| Assets: | | |
| Investments, at value (cost $89,812,006) | $ | 95,385,885 |
| Cash | | 33,013 |
| Receivables: | | |
| Investments sold | | 740,365 |
| Dividends and interest | | 64,017 |
| Prepaid Expenses: | | |
| Registration and filing expenses | | 18,384 |
| Fund accounting fees | | 385 |
| | | | |
| Total assets | | 96,242,049 |
| | | | |
| Liabilities: | | |
| Payables: | | |
| Investments purchased | | 703,497 |
| Fund shares purchased | | 1,309,233 |
| Distributions | | 66,374 |
| Accrued expenses: | | |
| | Advisory fees | | 85,441 |
| | Professional fees | | 15,000 |
| | Custody fees | | 10,202 |
| | Trustee fees and meeting expenses | | 2,000 |
| | Compliance fees | | 917 |
| | Miscellaneous expenses | | 350 |
| | Administration fees | | 263 |
| | Shareholder reports and fulfillment expenses | | 133 |
| | | | |
| Total liabilities | | 2,193,410 |
| | | | |
| Net Assets | $ | 94,048,639 |
| | | | |
| Net Assets Consist of: | | |
| Paid in Interest | $ | 81,881,761 |
| Accumulated net investment loss | | (456,164) |
| Accumulated net realized gain on investments | | 7,049,163 |
| Net unrealized appreciation on investments | | 5,573,879 |
| | | | |
| Net Assets | $ | 94,048,639 |
| | | | |
| Institutional Class shares outstanding, no par value (unlimited authorized shares) | | 8,475,187 |
| Net Assets | $ | 94,048,639 |
| Net Asset Value, Maximum Offering Price and Redemption Price Per Share | $ | 11.10 |
| | | | |
| | | | |
| | | | |
| See Notes to Financial Statements | | |
| Matisse Discounted Closed-End Fund Strategy | | |
| | | | |
| Statement of Operations | | |
| | | | |
| | | | |
| For the fiscal year ended March 31, 2018 | | |
| | | | |
| Investment Income: | | |
| Dividends | $ | 2,789,635 |
| | | | |
| Total Investment Income | | 2,789,635 |
| | | | |
| Expenses: | | |
Advisory fees (note 2) | | 1,178,458 |
Administration fees (note 2) | | 112,865 |
| Registration and filing expenses | | 51,828 |
Fund accounting fees (note 2) | | 44,550 |
Custody fees (note 2) | | 27,478 |
| Professional fees | | 27,435 |
Transfer agent fees (note 2) | | 25,500 |
| Shareholder reports and fulfillment expenses | | 14,812 |
Compliance fees (note 2) | | 11,992 |
| Trustee fees and meeting expenses | | 8,058 |
Distribution and service fees - Class A Shares (note 4)(a) | | 6,391 |
| Security pricing fees | | 5,528 |
| Insurance fees | | 4,619 |
Miscellaneous expenses (note 2) | | 4,700 |
| | | | |
| Total Expenses | | 1,524,214 |
| | | | |
Advisor fees waived (note 2) | | (90,579) |
| | | | |
| Net Expenses | | 1,433,635 |
| | | | |
| Net Investment Income | | 1,356,000 |
| | | | |
| Realized and Unrealized Gain (Loss) on Investments: | | |
| | | | |
| Net realized gain from: | | |
| | Investments | | 11,894,425 |
| | Capital gain distributions from underlying funds | | 1,451,810 |
| Total net realized gain | | 13,346,235 |
| | | | |
| Net change in unrealized appreciation on investments | | (2,628,348) |
| | | | |
| Net Realized and Unrealized Gain on Investments | | 10,717,887 |
| | | | |
| Net Increase in Net Assets Resulting from Operations | $ | 12,073,887 |
| | | | |
| (a) | The Class A Shares liquidated as of December 21, 2017. | | |
| | | | |
| | | | |
| | | | |
| | | | |
| See Notes to Financial Statements | | |
| Matisse Discounted Closed-End Fund Strategy | | | | | | |
| | | | | | | | | | | | | |
| Statements of Changes in Net Assets | | | | | | | | |
| | | | | | | | | | | | | |
| For the fiscal years ended March 31, | | | | | | 2018 | | 2017 |
| | | | | | | | | | | | | |
| Operations: | | | | | | | | | |
| Net investment income | | | | | $ | 1,356,000 | $ | 3,446,879 |
| Net realized gain from investment transactions | | | | 11,894,425 | | 6,041,989 |
| Capital gain distributions from underlying funds | | | | 1,451,810 | | 1,681,555 |
| Net change in unrealized appreciation (depreciation) on investments | | (2,628,348) | | 10,149,659 |
| | | | | | | | | | | | | |
| Net Increase in Net Assets Resulting from Operations | | | | 12,073,887 | | 21,320,082 |
| | | | | | | | | | | | | |
| Distributions to Shareholders: | | | | | | | | |
| Net investment income | | | | | | | | |
| Institutional Class Shares | | | | | | (2,092,940) | | (3,362,804) |
| Class A Shares (a) | | | | | | (5,346) | | (173,715) |
| Realized gains | | | | | | | | |
| Institutional Class Shares | | | | | | (1,676,646) | | - |
| | | | | | | | | | | | | |
| Decrease in Net Assets Resulting from Distributions | | | | (3,774,932) | | (3,536,519) |
| | | | | | | | | | | | | |
| Beneficial Interest Transactions: | | | | | | | | |
| Shares sold | | | | | | | 12,449,173 | | 15,795,312 |
| Reinvested dividends and distributions | | | | | | 3,541,624 | | 3,450,637 |
| Shares repurchased | | | | | | (39,605,892) | | (43,816,248) |
| | | | | | | | | | | | | |
| Decrease from Beneficial Interest Transactions | | | | (23,615,095) | | (24,570,299) |
| | | | | | | | | | | | | |
| Net Decrease in Net Assets | | | | | | (15,316,140) | | (6,786,736) |
| | | | | | | | | | | | | |
| Net Assets: | | | | | | | | | |
| Beginning of year | | | | | | 109,364,779 | | 116,151,515 |
| End of year | | | | | | $ | 94,048,639 | $ | 109,364,779 |
| | | | | | | | | | | | | |
| Undistributed (Accumulated) Net Investment Income (Loss) | | | $ | (456,164) | $ | 286,122 |
| | | | | | | | | | | | | |
| (a) | The Class A Shares liquidated as of December 21, 2017. | | | | | |
| | | | | | | | | | | | | |
| | | | | | | | | | | | | |
| | | | | | | | | | | | | |
| See Notes to Financial Statements | | | | | | | | (Continued) |
| Matisse Discounted Closed-End Fund Strategy | | | | | | |
| | | | | | | | | | | | | |
| Statements of Changes in Net Assets - Continued | | | | | | |
| | | | | | | | | | | | | |
| For the fiscal years ended March 31, | | 2018 | | 2017 |
| | | | | | | | | | | | | |
| Share Information: | | | | | | | | |
| | Institutional Class Shares | | Shares | | Amount | | Shares | | Amount |
| | | Shares sold | | 1,116,983 | $ | 12,387,225 | | 1,594,819 | $ | 15,535,375 |
| | | Reinvested dividends and distributions | | 315,345 | | 3,536,278 | | 341,561 | | 3,278,135 |
| | | Shares repurchased | | (3,042,129) | | (34,218,565) | | (4,135,616) | | (40,337,262) |
| | Net Decrease in Shares of | | | | | | | | |
| | | Beneficial Interest | | (1,609,801) | $ | (18,295,062) | | (2,199,236) | $ | (21,523,752) |
| | | | | | | | | | | | | |
| Share Information: | | | | | | | | |
| | Class A Shares (a) | | Shares | | Amount | | Shares | | Amount |
| | | Shares sold | | 6,167 | $ | 61,948 | | 29,376 | $ | 259,937 |
| | | Reinvested dividends and distributions | | 514 | | 5,346 | | 19,232 | | 172,502 |
| | | Shares repurchased | | (515,285) | | (5,387,327) | | (386,726) | | (3,478,986) |
| | Net Decrease in Shares of | | | | | | | | |
| | | Beneficial Interest | | (508,604) | $ | (5,320,033) | | (338,118) | $ | (3,046,547) |
| | | | | | | | | | | | | |
| (a) | The Class A Shares liquidated as of December 21, 2017. | | | | | |
| | | | | | | | | | | | | |
| | | | | | | | | | | | | |
| | | | | | | | | | | | | |
| | | | | | | | | | | | | |
| See Notes to Financial Statements | | | | | | | | |
| Matisse Discounted Closed-End Fund Strategy | | | | | | | | | |
| | | | | | | | | | | | | | | | |
| Financial Highlights | | | | | | | | | | | |
| | | | | | | |
| For a share outstanding during each | | Institutional Class Shares |
| of the fiscal years ended March 31, | | 2018 | | 2017 | | 2016 | | 2015 | | 2014 | |
| | | | | | | | | | | | | | | | |
| Net Asset Value, Beginning of Year | $ | 10.36 | $ | 8.88 | $ | 10.28 | $ | 10.13 | $ | 10.35 | |
| | | | | | | | | | | | | | | | |
| Income from Investment Operations | | | | | | | | | | | |
| Net investment income | | 0.13 | (e) | 0.29 | (e) | 0.41 | (e) | 0.46 | | 0.58 | |
| Net realized and unrealized gain (loss) | | | | | | | | | | | |
| | on investments | | 0.99 | | 1.48 | | (1.08) | | 0.36 | | (0.17) | |
| | | | | | | | | | | | | | | | |
| Total from Investment Operations | | 1.12 | | 1.77 | | (0.67) | | 0.82 | | 0.41 | |
| | | | | | | | | | | | | | | | |
| Less Distributions: | | | | | | | | | | | |
| Dividends (from net investment income) | | (0.20) | | (0.29) | | (0.40) | | (0.51) | | (0.56) | |
| Distributions (from capital gains) | | (0.18) | | - | | - | | (0.16) | | (0.07) | |
| Return of capital | | - | | - | | (0.33) | | - | | - | |
| | | | | | | | | | | | | | | | |
| Total Distributions | | (0.38) | | (0.29) | | (0.73) | | (0.67) | | (0.63) | |
| | | | | | | | | | | | | | | | |
| Redemption Fees | | - | | - | | - | | 0.00 | (d) | 0.00 | (d) |
| | | | | | | | | | | | | | | | |
| Net Asset Value, End of Year | $ | 11.10 | $ | 10.36 | $ | 8.88 | $ | 10.28 | $ | 10.13 | |
| | | | | | | | | | | | | | | | |
| Total Return (a) | | | 10.89% | | 20.27% | | (6.20)% | | 8.37% | | 4.21% | |
| | | | | | | | | | | | | | | | |
| Net Assets, End of Year (in thousands) | $ | 94,049 | $ | 104,448 | $ | 109,113 | $ | 119,616 | $ | 78,390 | |
| | | | | | | | | | | | | | | | |
| Ratios of: | | | | | | | | | | | | | |
| Interest Expense to Average Net Assets | - | | 0.00% | (d) | 0.12% | | 0.06% | | 0.09% | |
| Gross Expenses to Average Net Assets (b) | 1.33% | | 1.50% | (c) | 1.62% | (c) | 1.59% | (c) | 1.59% | (c) |
| Net Expenses to Average Net Assets (b) | 1.25% | | 1.25% | | 1.37% | | 1.43% | | 1.59% | |
| Net Investment Income to Average | | | | | | | | | | | |
| | Net Assets (b) | | 1.19% | | 2.98% | | 4.46% | | 4.48% | | 5.96% | |
| | | | | | | | | | | | | | | | |
| Portfolio turnover rate | | 71.82% | | 99.61% | | 134.60% | | 164.94% | | 150.92% | |
| | | | | | | | | | | | | | | | |
| (a) | Includes adjustments in accordance with accounting principles generally accepted in the United States, and, consequently, the net asset value for financial reporting purposes and the returns based upon those net asset values may differ from the net asset values and returns from shareholder transactions. |
| (b) | Recognition of the Fund's net investment income is affected by the timing of dividend declarations of underlying funds. The expenses of the underlying funds are excluded from the Fund's expense ratio. |
| (c) | Includes interest expense. | | | | | | | | | | | |
| (d) | Less than $0.01 per share. | | | | | | | | | | | |
| (e) | Calculated using the average shares method. | | | | | | | | | |
| | | | | | | | | | | | | | | | |
| | | | | | | | | | | | | | | | |
| | | | | | | | | | | | | | | | |
| | | | | | | | | | | | | | | | |
| | | | | | | | | | | | | | | | |
| | | | | | | | | | | | | | | | |
| See Notes to Financial Statements | | | | | | | | | | | |
Matisse Discounted Closed-End Fund Strategy
Notes to Financial Statements
As of March 31, 2018
1. Organization and Significant Accounting Policies
The Matisse Discounted Closed-End Fund Strategy ("Fund") is a series of the Starboard Investment Trust ("Trust"). The Trust is organized as a Delaware statutory trust and is registered under the Investment Company Act of 1940, as amended (the "1940 Act"), as an open-end management investment company. The Fund is a separate diversified series of the Trust.
The Fund's investment advisor, Deschutes Portfolio Strategies, LLC, dba Matisse Capital, (the "Advisor"), seeks to achieve the Fund's investment objective of long-term capital appreciation and income by investing in unaffiliated closed-end funds that pay regular periodic cash distributions, the interests of which typically trade at substantial discounts relative to their underlying net asset values.
The Fund currently has an unlimited number of authorized shares, which were divided into two classes - Institutional Class Shares and Class A Shares. Each class of shares had equal rights as to assets of the Fund, and the classes were identical except that the Class A Shares were subject to distribution and service fees, which are further discussed in Note 4. Income, expenses (other than distribution and service fees), and realized and unrealized gains or losses on investments were allocated to each class of shares based upon its relative net assets. All classes had equal voting privileges, except where otherwise required by law or when the Trustees determine that the matter to be voted on affects only the interests of the shareholders of a particular class. The Date of Initial Public Investment for the Institutional Class Shares was October 31, 2012. The Date of Initial Public Investment for the Class A Shares was May 15, 2013.
Through a written consent dated November 15, 2017, the Board of Trustees (the "Board" or "Trustees") approved the liquidation of the Class A Shares and the discontinuation of all agreements associated with Class A Shares effective January 16, 2018. Investors in the Class A Shares fully liquidated as of December 21, 2017 through voluntary redemptions by the investors. Therefore, there were no shares left to redeem as of January 16, 2018.
The following is a summary of significant accounting policies consistently followed by the Fund. The policies are in conformity with accounting principles generally accepted in the United States of America ("GAAP"). The Fund follows the accounting and reporting guidance in the Financial Accounting Standards Board ("FASB") Accounting Standards Codification 946 "Financial Services – Investment Companies," and Financial Accounting Standards Update ("ASU") 2013-08.
Investment Valuation
The Fund's investments in securities are carried at fair value. Securities listed on an exchange or quoted on a national market system are valued at the last sales price as of 4:00 p.m. Eastern Time. Securities traded in the NASDAQ over-the-counter market are generally valued at the NASDAQ Official Closing Price. Other securities traded in the over-the-counter market and listed securities for which no sale was reported on that date are valued at the mean of the most recent bid and ask prices. Instruments with maturities of 60 days or less are valued at amortized cost, which approximates market value. Investments in open-end investment companies are valued at their respective net asset values as reported by such investment companies. Securities and assets for which representative market quotations are not readily available (e.g., if the exchange on which the security is principally traded closes early or if trading of the particular security is halted during the day and does not resume prior to the Fund's net asset value calculation) or which cannot be accurately valued using the Fund's normal pricing procedures are valued at fair value as determined in good faith under policies approved by the Trustees. A security's "fair value" price may differ from the price next available for that security using the Fund's normal pricing procedures.
Fair Value Measurement
Various inputs are used in determining the value of the Fund's investments. These inputs are summarized in the three broad levels listed below:
Level 1: Unadjusted quoted prices in active markets for identical securities
Level 2: Other significant observable inputs (including quoted prices for similar securities, interest rates, credit risk, etc.)
(Continued)
Matisse Discounted Closed-End Fund Strategy
Notes to Financial Statements
As of March 31, 2018
Level 3: Significant unobservable inputs (including the Fund's own assumptions in determining fair value of investments)
The availability of observable inputs can vary from security to security and is affected by a wide variety of factors, including, for example, the type of security, whether the security is new and not yet established in the marketplace, the liquidity of markets, and other characteristics particular to the security. To the extent that valuation is based on models or inputs that are less observable or unobservable in the market, the determination of fair value requires more judgment. Accordingly, the degree of judgment exercised in determining fair value is greatest for instruments categorized in Level 3.
The inputs used to measure fair value may fall into different levels of the fair value hierarchy. In such cases, for disclosure purposes, the level in the fair value hierarchy within which the fair value measurement falls in its entirety, is determined based on the lowest level input that is significant to the fair value measurement in its entirety.
The inputs or methodology used for valuing securities are not necessarily an indication of the risk associated with investing in those securities. The following table summarizes the inputs as of March 31, 2018 for the Fund's investments measured at fair value:
| | | |
| Investments in Securities (a) | | Total | | Level 1 | | Level 2 | | Level 3 |
| Closed-End Funds | $ | 91,643,160 | $ | 91,643,160 | $ | - | $ | - |
| Short-Term Investment | | 3,742,725 | | 3,742,725 | | - | | - |
| Total Assets | $ | 95,385,885 | $ | 95,385,885 | $ | - | $ | - |
| | | | | | | | | |
| (a) | The Fund had no transfers into or out of Level 1, 2, or 3 during the fiscal year ended March 31, 2018. The Fund did not hold any Level 3 securities during the year. The Fund recognizes transfers at the end of the reporting period. |
Investment Transactions and Investment Income
Investment transactions are accounted for as of the date purchased or sold (trade date). Dividend income is recorded on the ex-dividend date. Certain dividends from foreign securities will be recorded as soon as the Fund is informed of the dividend if such information is obtained subsequent to the ex-dividend date. Gains and losses are determined on the identified cost basis, which is the same basis used for federal income tax purposes.
Distributions
The Fund may declare and distribute dividends from net investment income, if any, monthly or quarterly. Distributions from capital gains, if any, are generally declared and distributed annually. Dividends and distributions to shareholders are recorded on ex-date.
Expenses
The Fund bears expenses incurred specifically on its behalf as well as a portion of general expenses, which are allocated according to methods reviewed annually by the Trustees.
Estimates
The preparation of financial statements in conformity with GAAP requires management to make estimates and assumptions that affect the reported amounts of assets and liabilities and disclosure of contingent assets and liabilities at the date of the financial statements and the reported amounts of increases and decreases in the net assets from operations during the reporting period. Actual results could differ from those estimates.
Federal Income Taxes
No provision for income taxes is included in the accompanying financial statements, as the Fund intends to distribute to shareholders all taxable investment income and realized gains and otherwise comply with Subchapter M of the Internal Revenue Code applicable to regulated investment companies.
(Continued)
Matisse Discounted Closed-End Fund Strategy
Notes to Financial Statements
As of March 31, 2018
2. Transactions with Related Parties and Service Providers
Advisor
The Fund pays monthly fees to the Advisor based upon the average daily net assets. For the period from April 1, 2017 through June 7, 2017, the rate was calculated at an annual rate of 1.20%. Through approval by the Board at a quarterly meeting held on June 8, 2017, for the period from June 8, 2017 through the fiscal year ended March 31, 2018, the rate was decreased and calculated at an annual rate of 0.99%. For the fiscal year ended March 31, 2018, $1,178,458 in advisory fees were incurred, of which $90,579 in advisory fees were waived by the Advisor.
The Advisor has entered into another contractual agreement (the "Expense Limitation Agreement") with the Trust, on behalf of the Fund, under which it has agreed to waive or reduce its fees and to assume other expenses of the Fund, if necessary, in amounts that limit the Fund's total operating expenses (exclusive of those expenses and other expenditures which are capitalized in accordance with generally accepted accounting principles, acquired fund fees and expenses, other extraordinary expenses not incurred in the ordinary course of each Fund's business, and amounts, if any, payable pursuant to a plan adopted in accordance with Rule 12b-1 under the Investment Company Act of 1940) to not more than 1.25% of the average daily net assets of the Fund. The current term of the Expense Limitation Agreement remains in effect until July 31, 2018. While there can be no assurance that the Expense Limitation Agreement will continue after that date, it is expected to continue from year-to-year thereafter. The Advisor cannot recoup from the Fund any expenses paid by the Advisor under the Expense Limitation Agreement.
Administrator
The Fund pays a monthly fee to the Fund's administrator, The Nottingham Company ("the Administrator"), based upon the average daily net assets of the Fund and calculated at the annual rates as shown in the schedule below which is subject to a minimum of $2,000 per month. The Administrator also receives a fee to procure and pay the Fund's custodian, additional compensation for fund accounting and recordkeeping services, and additional compensation for certain costs involved with the daily valuation of securities and as reimbursement for out-of-pocket expenses.
Matisse Discounted Closed-End Fund Strategy
Notes to Financial Statements
As of March 31, 2018
A breakdown of these fees is provided in the following table:
| Administration Fees* | Custody Fees* | | Fund Accounting Fees | | Fund Accounting Fees (asset-based fee) | | Blue Sky Administration Fees (annual) |
| Average Net Assets | Annual Rate | Average Net Assets | Annual Rate | (Average monthly) | Net Assets | Annual Rate | Per state |
| First $100 million | 0.100% | First $200 million | 0.020% | | $2,250 | | First $50 million | 0.02% | | $150 |
| Next $100 million | 0.090% | Over $200 million | 0.009% | | $500/ additional class | | Next $50 million | 0.015% | | |
| Next $100 million | 0.080% | | | | | | Over $100 million | 0.01% | | |
| Next $100 million | 0.070% | | *Minimum monthly fees of $2,000 and $417 for Administration and Custody, respectively. |
| Next $100 million | 0.060% | |
| Over $500 million | 0.050% | |
| Over $750 million | 0.040% | | |
| Over $1 billion | 0.030% | | |
The Fund incurred $112,865 in administration fees, $27,478 in custody fees, and $44,550 in fund accounting fees for the fiscal year ended March 31, 2018.
Compliance Services
Cipperman Compliance Services, LLC provides services as the Trust's Chief Compliance Officer. Cipperman Compliance Services, LLC is entitled to receive customary fees from the Fund for their services pursuant to the Compliance Services agreement with the Fund.
Transfer Agent
Nottingham Shareholder Services, LLC ("Transfer Agent") serves as transfer, dividend paying, and shareholder servicing agent for the Fund. For its services, the Transfer Agent is entitled to receive compensation from the Fund pursuant to the Transfer Agent's fee arrangements with the Fund.
Distributor
Capital Investment Group, Inc. (the "Distributor") serves as the Fund's principal underwriter and distributor. For its services, the Distributor is entitled to receive compensation from the Fund pursuant to the Distributor's fee arrangements with the Fund.
Because the underlying funds have varied expense and fee levels and the Fund may own different proportions of underlying funds at different times, the amount of fees and expense incurred indirectly by the Fund will vary.
3. Trustees and Officers
The Board of Trustees is responsible for the management and supervision of the Fund. The Trustees approve all significant agreements between the Trust, on behalf of the Fund, and those companies that furnish services to the Fund; review performance of the Advisor and the Fund; and oversee activities of the Fund. Officers of the Trust and Trustees who are interested persons of the Trust or the Advisor will receive no salary or fees from the Trust. Trustees who are not "interested persons" of the Trust or the Advisor within the meaning of the 1940 Act (the "Independent Trustees") receive $2,000 each year from each Fund. The Trust will reimburse each Trustee and officer of the Trust for his or her travel and other expenses relating to attendance of Board meetings. Additional fees may also be incurred during the year as special meetings are necessary in addition to the regularly scheduled meetings of the Board of Trustees.
(Continued)
Matisse Discounted Closed-End Fund Strategy
Notes to Financial Statements
As of March 31, 2018
Certain officers of the Trust may also be officers of the Administrator.
4. Distribution and Service Fees
The Trustees, including a majority of the Trustees who are not "interested persons" of the Trust as defined in the 1940 Act and who have no direct or indirect financial interest in such plan or in any agreement related to such plan, adopted a distribution plan pursuant to Rule 12b-1 of the 1940 Act (the "Plan") for the Class A Shares. The 1940 Act regulates the manner in which a regulated investment company may assume expenses of distributing and promoting the sales of its shares and servicing of its shareholder accounts. The Plan provides that the Fund may incur certain expenses, which may not exceed 0.25% per annum of the Fund's average daily net assets attributable to the Class A Shares, for payment to the Distributor and others for items such as advertising expenses, selling expenses, commissions, travel or other expenses reasonably intended to result in sales of shares of the Fund or support servicing of shareholder accounts. The Class A Shares liquidated as of December 21, 2017, and the Plan was terminated. For the fiscal year ended March 31, 2018, $6,391 in fees were incurred by the Class A Shares until the discontinuation of the Plan.
5. Purchases and Sales of Investment Securities
For the fiscal year ended March 31, 2018, the aggregate cost of purchases and proceeds from sales of investment securities (excluding short-term securities) were as follows:
| Purchases of Securities | Proceeds from Sales of Securities |
| $77,239,554 | $96,946,129 |
6. Federal Income Tax
Distributions are determined in accordance with Federal income tax regulations, which may differ from GAAP, and, therefore, may differ significantly in amount or character from net investment income and realized gains for financial reporting purposes. The general ledger is adjusted for permanent book/tax differences to reflect tax character but is not adjusted for temporary differences.
Management has reviewed the Fund's tax positions to be taken on the federal income tax returns during the open years ended March 31, 2015 through March 31, 2017, and the yet to be filed March 31, 2018 return, and determined that the Fund does not have a liability for uncertain tax positions. The Fund recognizes interest and penalties, if any, related to unrecognized tax benefits as income tax expense in the Statement of Operations. During the fiscal year, the Fund did not incur any interest or penalties.
Distributions during the year ended were characterized for tax purposes as follows:
| | | March 31, 2018 | March 31, 2017 |
| Ordinary Income | $ 1,669,951 | $ 3,533,338 |
| Tax-Exempt Income | 428,335 | 3,181 |
| Long-Term Capital Gain | 1,676,646 | - |
Matisse Discounted Closed-End Fund Strategy
Notes to Financial Statements
As of March 31, 2018
At March 31, 2018, the tax-basis cost of investments and components of distributable earnings were as follows:
| Cost of Investments | $ | 90,273,360 |
| | | |
| Unrealized Appreciation | $ | 8,381,494 |
| Unrealized Depreciation | | (3,268,969) |
| Net Unrealized Appreciation | $ | 5,112,525 |
| | | |
| Undistributed Long-Term Gains | | 7,054,353 |
| | | |
| Distributable Earnings | $ | 12,166,878 |
The difference between components of distributable earnings on a tax basis and the amounts reflected in the Statement of Assets and Liabilities are primarily due to wash sale losses. The Fund also had an adjustment relating to mark-to-market appreciation on PFIC lots totaling $456,164 as of the fiscal year ended March 31, 2018.
7. Beneficial Ownership
The beneficial ownership, either directly or indirectly, of 25% or more of the voting securities of a fund creates a presumption of control of a fund, under Section 2(a)(9) of the Investment Company Act of 1940. As of March 31, 2018, Charles Schwab & Co., Inc. held 55.76% of the Fund and Pershing, LLC held 26.06% of the Fund. The Fund has no knowledge as to whether all or any portion of the shares owned of record by Charles Schwab & Co., Inc. and Pershing, LLC are also owned beneficially.
8. Commitments and Contingencies
Under the Trust's organizational documents, its officers and Trustees are indemnified against certain liabilities arising out of the performance of their duties to the Fund. In addition, in the normal course of business, the Trust entered into contracts with its service providers, on behalf of the Fund, and others that provide for general indemnifications. The Fund's maximum exposure under these arrangements is unknown, as this would involve future claims that may be made against the Fund. The Fund expects risk of loss to be remote.
9. Subsequent Events
The Fund has evaluated the need for disclosures and/or adjustments resulting from subsequent events through the date of issuance of these financial statements. This evaluation did not result in any additional subsequent events that necessitated disclosures and/or adjustments in addition to the disclosure above.
REPORT OF INDEPENDENT REGISTERED PUBLIC ACCOUNTING FIRM
To the Board of Trustees of Starboard Investment Trust
and the Shareholders of Matisse Discounted Closed-End Fund Strategy
Opinion on the Financial Statements
We have audited the accompanying statement of assets and liabilities of Matisse Discounted Closed-End Fund Strategy, a series of shares of beneficial interest in Starboard Investment Trust (the "Fund"), including the schedule of investments, as of March 31, 2018, and the related statement of operations for the year then ended, the statements of changes in net assets for each of the years in the two-year period then ended and the financial highlights for each of the years in the five-year period then ended, and the related notes (collectively referred to as the "financial statements"). In our opinion, the financial statements present fairly, in all material respects, the financial position of the Fund as of March 31, 2018, and the results of its operations for the year then ended, the changes in its net assets for each of the years in the two-year period then ended and its financial highlights for each of the years in the five-year period then ended, in conformity with accounting principles generally accepted in the United States of America.
Basis for Opinion
These financial statements are the responsibility of the Fund's management. Our responsibility is to express an opinion on the Fund's financial statements based on our audits. We are a public accounting firm registered with the Public Company Accounting Oversight Board (United States) ("PCAOB") and are required to be independent with respect to the Fund in accordance with the U.S. federal securities law and the applicable rules and regulations of the Securities and Exchange Commission and the PCAOB.
We conducted our audits in accordance with the standards of the PCAOB. Those standards require that we plan and perform the audits to obtain reasonable assurance about whether the financial statements are free of material misstatement, whether due to error or fraud. The Fund is not required to have, nor were we engaged to perform, an audit of its internal control over financial reporting. As part of our audits we are required to obtain an understanding of internal control over financial reporting but not for the purpose of expressing an opinion on the effectiveness of the Fund's internal control over financial reporting. Accordingly, we express no such opinion.
Our audits included performing procedures to assess the risk of material misstatement of the financial statements, whether due to error or fraud, and performing procedures that respond to those risks. Such procedures include examining, on a test basis, evidence regarding the amounts and disclosures in the financial statements. Our procedures included confirmation of securities owned as of March 31, 2018 by correspondence with the custodian and brokers. Our audits also included evaluating the accounting principles used and significant estimates made by management, as well as evaluating the overall presentation of the financial statements. We believe that our audits provide a reasonable basis for our opinion.
BBD, LLP
We have served as the auditor of one or more of the Funds in the Starboard Investment Trust since 2012.
Philadelphia, Pennsylvania
May 30, 2018
Matisse Discounted Closed-End Fund Strategy
Additional Information
(Unaudited)
1. Proxy Voting Policies and Voting Record
A copy of the Trust's Proxy Voting and Disclosure Policy and the Advisor's Disclosure Policy are included as Appendix B to the Fund's Statement of Additional Information and are available, without charge, upon request, by calling 800-773-3863, and on the website of the Securities and Exchange Commission ("SEC") at sec.gov. Information regarding how the Fund voted proxies relating to portfolio securities during the most recent 12-month period ended June 30 is available (1) without charge, upon request, by calling the Fund at the number above and (2) on the SEC's website at sec.gov.
2. Quarterly Portfolio Holdings
The Fund files its complete schedule of portfolio holdings with the SEC for the first and third quarters of each fiscal year on Form N-Q. The Fund's Forms N-Q are available on the SEC's website at sec.gov. You may review and make copies at the SEC's Public Reference Room in Washington, D.C. Information on the operation of the Public Reference Room may be obtained by calling the SEC at 800-SEC-0330. You may also obtain copies without charge, upon request, by calling the Fund at 800-773-3863.
3. Tax Information
We are required to advise you within 60 days of the Fund's fiscal year-end regarding federal tax status of certain distributions received by shareholders during each fiscal year. The following information is provided for the Fund's fiscal year ended March 31, 2018.
During the fiscal year, the Fund paid $1,669,951 in income distributions and $1,676,646 in long-term capital gain distributions. The Fund also paid $428,335 in tax-exempt distributions during the fiscal year ended March 31, 2018.
Dividend and distributions received by retirement plans such as IRAs, Keogh-type plans, and 403(b) plans need not be reported as taxable income. However, many retirement plans may need this information for their annual information meeting.
4. Schedule of Shareholder Expenses
As a shareholder of the Fund, you incur ongoing costs, including management fees; distribution [and/or service] (12b-1) fees; and other Fund expenses. This Example is intended to help you understand your ongoing costs (in dollars) of investing in the Fund and to compare these costs with the ongoing costs of investing in other mutual funds.
The Example is based on an investment of $1,000 invested at the beginning of the period and held for the entire period from October 1, 2017 through March 31, 2018.
Actual Expenses – The first line of the table below provides information about actual account values and actual expenses. You may use the information in this line, together with the amount you invested, to estimate the expenses that you paid over the period. Simply divide your account value by $1,000 (e.g., an $8,600 account value divided by $1,000 = 8.6), then multiply the result by the number in the first line under the heading entitled "Expenses Paid During Period" to estimate the expenses you paid on your account during this period.
Hypothetical Example for Comparison Purposes – The second line of the table below provides information about hypothetical account values and hypothetical expenses based on the Fund's actual expense ratio and an assumed rate of return of 5% per year before expenses, which is not the Fund's actual return. The hypothetical account values and expenses may not be used to estimate the actual ending account balance or expenses you paid for the period. You may use this information to compare the ongoing costs of investing in the Fund and other funds. To do so, compare this 5% hypothetical example with the 5% hypothetical examples that appear in the shareholder reports of the other funds.
Please note that the expenses shown in the table are meant to highlight your ongoing costs only and do not reflect any transactional costs, such as sales charges (loads), redemption fees, or exchange fees. Therefore, the second line of the table is useful in comparing ongoing costs only, and will not help you determine the relative total costs of owning different funds. In addition, if these transactional costs were included, your costs would have been higher.
(Continued)
| Institutional Class Shares | Beginning Account Value October 1, 2017 | Ending Account Value March 31, 2018 | Expenses Paid During Period* |
Actual Hypothetical (5% annual return before expenses) | | | |
| $1,000.00 | $1,022.50 | $6.30 |
| $1,000.00 | $1,018.70 | $6.29 |
*Expenses are equal to the average account value over the period multiplied by the Fund's annualized expense ratio of 1.25%, multiplied by the number of days in the most recent period divided by the number of days in the fiscal year (to reflect the six month period).
5. Approval of Advisory Agreement
In connection with the regular Board meeting held on March 8, 2018, the Board, including a majority of the Independent Trustees, discussed the approval of a management agreement between the Trust and the Advisor, with respect to the Fund (the "Investment Advisory Agreement").
The Trustees were assisted by legal counsel throughout the review process. The Trustees relied upon the advice of legal counsel and their own business judgment in determining the material factors to be considered in evaluating the Investment Advisory Agreement and the weight to be given to each factor considered. The conclusions reached by the Trustees were based on a comprehensive evaluation of all of the information provided and were not the result of any one factor. Moreover, each Trustee may have afforded different weight to the various factors in reaching his conclusions with respect to the approval of the Investment Advisory Agreement. In connection with their deliberations regarding approval of the Investment Advisory Agreement, the Trustees reviewed materials prepared by the Advisor.
Nature, Extent, and Quality of Services. The Trustees considered the responsibilities of the Advisor under the Investment Advisory Agreement. The Trustees reviewed the services being provided by the Advisor to the Fund including, without limitation, the quality of its investment advisory services since the Fund's inception (including research and recommendations with respect to portfolio securities); its procedures for formulating investment recommendations and assuring compliance with the Fund's investment objectives, policies and limitations; its coordination of services for the Fund among the Fund's service providers; and its efforts to promote the Fund, grow the Fund's assets, and assist in the distribution of Fund shares. The Trustees evaluated the Advisor's staffing, personnel, and methods of operating; the education and experience of the Advisor's personnel; the Advisor's compliance program; and the financial condition of the Advisor.
The Trustees reviewed the financial statements for the Advisor and discussed the financial stability and profitability of the firm. The Trustees noted that the Advisor waives a portion of its investment advisory fee or reimburses the Fund in order to help limit the Fund's annual operating expenses. The Trustees also considered potential benefits for the Advisor in managing the Fund, including promotion of the Advisor's name, the ability for the Advisor to place small accounts into the Fund, and the potential for the Advisor to generate soft dollars from Fund trades that may benefit the Advisor as well.
After reviewing the foregoing information and further information in the memorandum from the Advisor (e.g., descriptions of the Advisor's business, the Advisor's compliance program, and the Advisor's Form ADV), the Board concluded that the nature, extent, and quality of the services provided by the Advisor were satisfactory and adequate for the Fund.
Performance. The Trustees compared the performance of the Fund with the performance of its benchmark index, comparable funds with similar strategies managed by other investment advisers, and applicable peer group data (e.g., Lipper peer group average). The Trustees noted that the Fund outperformed its peer group and category for all periods shown. The Trustees also considered the consistency of the Advisor's management of the Fund with its investment objective, policies and limitations. After reviewing the investment performance of the Fund, the Advisor's experience managing the Fund, the Advisor's historical investment performance, and other factors, the Board concluded that the investment performance of the Fund and the Advisor was satisfactory.
(Continued)
Matisse Discounted Closed-End Fund Strategy
Additional Information
(Unaudited)
Fees and Expenses. The Trustees first noted that the management fee for the Fund under the Investment Advisory Agreement was 0.99% of average daily net assets. The Trustees then compared the advisory fee and expense ratio of the Fund to other comparable funds. The Trustees noted that the management fee and expense ratio were both higher than the peer group average. However, the Trustees also noted that the Fund had significantly fewer assets than its peer group average and that the Advisor had indicated that its management fee was in line with the smaller funds in the peer group.
Following this comparison, and upon further consideration and discussion of the foregoing, the Board concluded that the fees to be paid to the Advisor by the Fund were not unreasonable in relation to the nature and quality of the services provided by the Advisor and that they reflected charges that were within a range of what could have been negotiated at arm's length.
Profitability. The Board reviewed the Advisor's profitability analysis in connection with its management of the Fund. The Board noted that the Advisor did realize a small profit for the twelve months ended December 31, 2017. The Board considered the quality of the Advisor's service to the Fund, and after further discussion, concluded that the Advisor's level of profitability was not excessive.
Economies of Scale. In this regard, the Trustees reviewed the Fund's operational history and noted that the size of the Fund had not provided an opportunity to realize economies of scale. The Trustees then reviewed the Fund's fee arrangements for breakpoints or other provisions that would allow the Fund's shareholders to benefit from economies of scale in the future as the Fund grows. The Trustees determined that the maximum management fee would stay the same regardless of the Fund's asset levels and therefore, did not reflect economies of scale. The Trustees noted that the Fund was a relatively small size and economies of scale were unlikely to be achievable in the near future. It was pointed out that breakpoints in the advisory fee could be reconsidered in the future as the Fund grows.
The Trustees noted that the Advisor waives a portion of its investment advisory fee or reimburses the Fund in order to help limit the Fund's annual operating expenses. The Trustees determined that these arrangements provided potential savings for the benefit of the Fund's investors.
Conclusion. Having reviewed and discussed in depth such information from the Advisor as the Trustees believed to be reasonably necessary to evaluate the terms of the Investment Advisory Agreement and as assisted by the advice of legal counsel, the Trustees concluded that renewal of the Investment Advisory Agreement was in the best interest of the shareholders of the Fund.
6. Information about Trustees and Officers
The business and affairs of the Fund and the Trust are managed under the direction of the Board of Trustees of the Trust. Information concerning the Trustees and officers of the Trust and Fund is set forth below. Generally, each Trustee and officer serves an indefinite term or until certain circumstances such as their resignation, death, or otherwise as specified in the Trust's organizational documents. Any Trustee may be removed at a meeting of shareholders by a vote meeting the requirements of the Trust's organizational documents. The Statement of Additional Information of the Fund includes additional information about the Trustees and officers and is available, without charge, upon request by calling the Fund toll-free at 800-773-3863. The address of each Trustee and officer, unless otherwise indicated below, is 116 South Franklin Street, Rocky Mount, North Carolina 27804. The Independent Trustees each received aggregate compensation of $2,000 during the fiscal year ended March 31, 2018 from the Fund for their services to the Fund and Trust.
(Continued)
Matisse Discounted Closed-End Fund Strategy
Additional Information
(Unaudited)
Name, Age
and Address | Position
held with
Fund or Trust | Length of Time Served | Principal Occupation
During Past 5 Years | Number of Portfolios in Fund Complex Overseen by Trustee | Other Directorships
Held by Trustee
During Past 5 Years |
| Independent Trustees |
James H. Speed, Jr.
Date of Birth: 06/1953 | Independent Trustee, Chairman | Trustee since 7/09, Chair since 5/12 | Previously President and CEO of NC Mutual Insurance Company (insurance company) from 2003 to 2015. | 16 | Independent Trustee of the Brown Capital Management Mutual Funds for its four series, Hillman Capital Management Investment Trust for its one series, Centaur Mutual Funds Trust for its one series, Chesapeake Investment Trust, previously known as Gardner Lewis Trust, for its one series and WST Investment Trust for its two series (all registered investment companies). Member of Board of Directors of M&F Bancorp. Member of Board of Directors of Investors Title Company. Previously, Board of Directors of NC Mutual Life Insurance Company. |
Theo H. Pitt, Jr.
Date of Birth: 04/1936 | Independent Trustee | Since 9/10 | Senior Partner, Community Financial Institutions Consulting (financial consulting) since 1999; Partner, Pikar Properties (real estate) since 2001. | 16 | Independent Trustee of World Funds Trust for its forty nine series, Chesapeake Investment Trust, previously known as Gardner Lewis Investment Trust, for its one series, Leeward Investment Trust for its two series and Hillman Capital Management Investment Trust for its one series (all registered investment companies). |
Michael G. Mosley
Date of Birth: 01/1953 | Independent Trustee | Since 7/10 | Owner of Commercial Realty Services (real estate) since 2004. | 16 | None. |
J. Buckley Strandberg
Date of Birth: 03/1960 | Independent Trustee | Since 7/09 | President of Standard Insurance and Realty (insurance and property management) since 1982. | 16 | None. |
| Other Officers |
Katherine M. Honey
Date of Birth: 09/1973 | President and Principal Executive Officer | Since 05/15 | EVP of The Nottingham Company since 2008. | n/a | n/a |
Matthew J. Beck
Date of Birth: 06/1988 | Secretary | Since 05/15 | General Counsel of The Nottingham Company since 2014. | n/a | n/a |
(Continued)
Matisse Discounted Closed-End Fund Strategy
Additional Information
(Unaudited)
Name, Age
and Address | Position
held with
Fund or Trust | Length of Time Served | Principal Occupation
During Past 5 Years | Number of Portfolios in Fund Complex Overseen by Trustee | Other Directorships
Held by Trustee
During Past 5 Years |
Ashley E. Harris Date of Birth: 03/1984 | Treasurer, Assistant Secretary and Principal Financial Officer | Since 05/15 | Fund Accounting Manager and Financial Reporting, The Nottingham Company since 2008. | n/a | n/a |
Stacey Gillespie Date of Birth: 05/1974 | Chief Compliance Officer | Since 03/16 | Compliance Director, Cipperman Compliance Services, LLC (09/15-present). Formerly, Chief Compliance Officer of Boenning & Scattergood, Inc. (2013-2015) and Director of Investment Compliance at Boenning & Scattergood, Inc. (2007-2013). | n/a | n/a |
Matisse Discounted Closed-End Fund Strategy
is a series of
The Starboard Investment Trust
For Shareholder Service Inquiries: | For Investment Advisor Inquiries: |
| |
Nottingham Shareholder Services | Deschutes Portfolio Strategies |
116 South Franklin Street | 4949 Meadows Road |
Post Office Box 69 | Suite 200 |
Rocky Mount, North Carolina 27802-0069 | Lake Oswego, Oregon 97035 |
| |
Telephone: | Telephone: |
| |
800-773-3863 | 800-773-3863 |
| | |
| World Wide Web @: | World Wide Web @: |
| | |
| ncfunds.com | matissefunds.com |
Pursuant to the requirements of the Securities Exchange Act of 1934 and the Investment Company Act of 1940, the registrant has duly caused this report to be signed on its behalf by the undersigned, thereunto duly authorized.
Pursuant to the requirements of the Securities Exchange Act of 1934 and the Investment Company Act of 1940, this report has been signed below by the following persons on behalf of the registrant and in the capacities and on the dates indicated.