Paracorp Inc.
Item 1. REPORTS TO STOCKHOLDERS.
Annual Report 2018
As of May 31, 2018
Crow Point Growth Fund
Institutional Class Shares
This report and the financial statements contained herein are submitted for the general information of the shareholders of the Crow Point Growth Fund (the "Fund"). The Fund's shares are not deposits or obligations of, or guaranteed by, any depository institution. The Fund's shares are not insured by the FDIC, Federal Reserve Board or any other agency, and are subject to investment risks, including possible loss of principal amount invested. Neither the Fund nor the Fund's distributor is a bank.
The Crow Point Growth Fund is distributed by Capital Investment Group, Inc., Member FINRA/SIPC, 100 E. Six Forks Road, Suite 200, Raleigh, NC 27609. There is no affiliation between the Crow Point Growth Fund, including its principals, and Capital Investment Group, Inc.
Statements in this Annual Report that reflect projections or expectations of future financial or economic performance of the Crow Point Growth Fund ("Fund") and of the market in general and statements of the Fund's plans and objectives for future operations are forward-looking statements. No assurance can be given that actual results or events will not differ materially from those projected, estimated, assumed or anticipated in any such forward-looking statements. Important factors that could result in such differences, in addition to the other factors noted with such forward-looking statements, include, without limitation, general economic conditions such as inflation, recession and interest rates. Past performance is not a guarantee of future results.
An investor should consider the investment objectives, risks, charges and expenses of the Fund carefully before investing. The prospectus contains this and other information about the Fund. A copy of the prospectus is available at ncfunds.com or by calling Shareholder Services at 800-773-3863. The prospectus should be read carefully before investing. |
For More Information on the Crow Point Growth Fund:
See Our Web site @ ncfunds.com
or
Call Our Shareholder Services Group at 800-773-3863.
July 1, 2018
Dear Fellow Shareholders of the Crow Point Growth Fund:
Enclosed for your review is the Annual Report for the Crow Point Growth Fund (the "Fund"), a series of the Starboard Investment Trust (the "Trust") for the fiscal year ending May 31, 2018.
The return for the Fund during the fiscal year ended May 31, 2018 was 14.95%, compared to 16.35% for the Russell 2000 Value Index during that same period. For the periods, long portfolio positions accounted for all of the investment gains, while short portfolio positions generated investment losses and options generated a small net gain.
Market Environment Observations
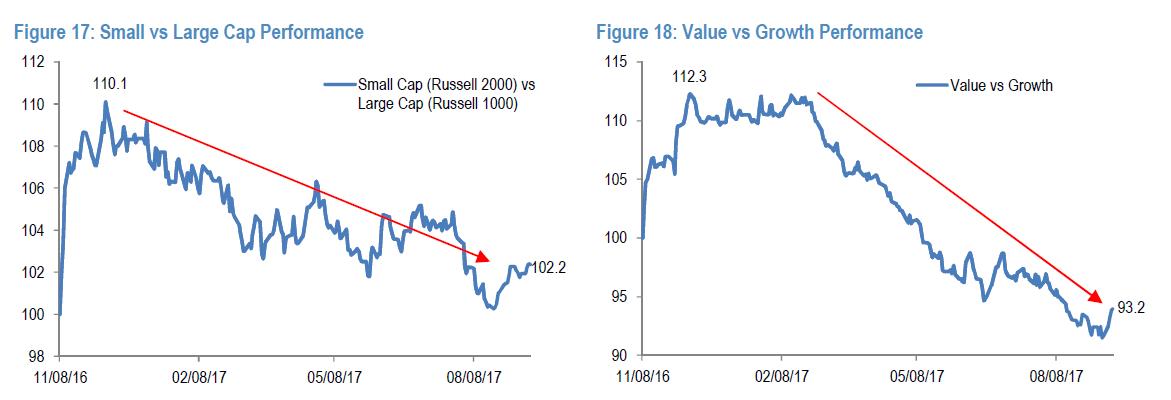
The disparity between small cap value and large cap growth returns in recent years has been well documented. JPMorgan's US Equity Strategy team did an excellent job illustrating some of the post-election dynamics at play that were influential factors on the Fund's returns.
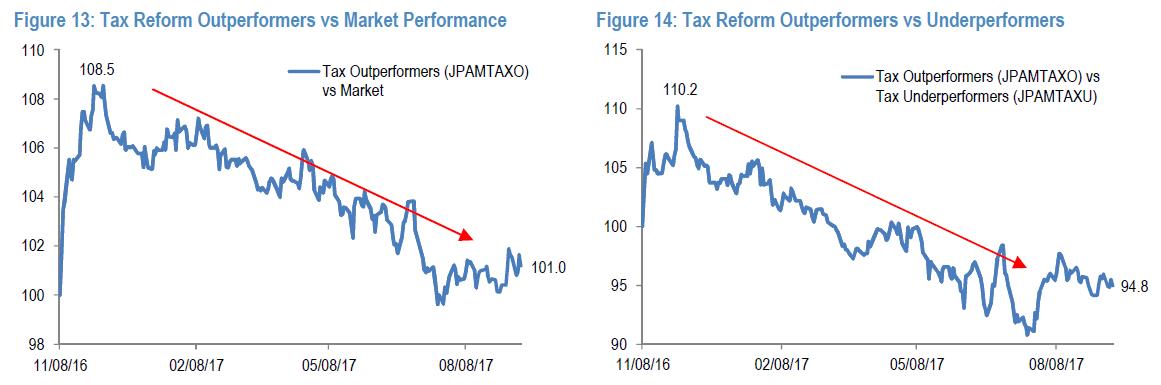
We believe the post-election market reaction had significant and outsized impacts on the Fund's returns (both positive in the weeks after, and negative for most of the fiscal year). As you can observe from the charts above, all the perceived benefits from corporate tax reform were erased through the end of 2017 (and then some).
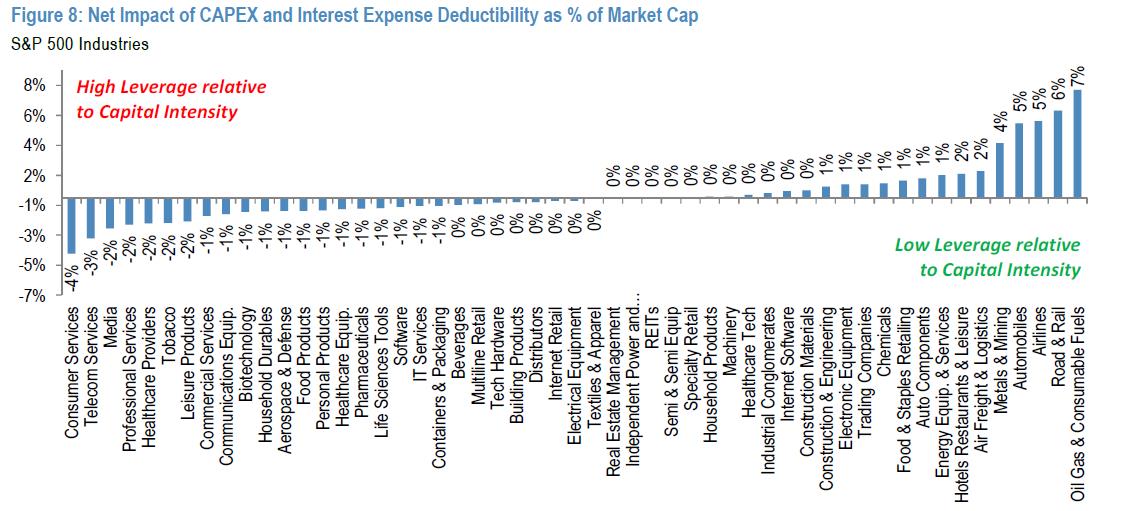
Following the November 2016 election, JPMorgan's team has done an excellent job quantifying the impact that some of the specific proposals of the new administration would have on small caps in general, on asset heavy industries that are well represented in the Fund's long portfolio, and across sectors and industries, as seen below.
Why This Matters
Treasury Secretary Mnuchin recently remarked, "There is no question that the rally in the stock market has baked into it reasonably high expectations of us getting tax cuts and tax reform done. To the extent we get the tax deal done, the stock market will go up higher. But there's no question in my mind that if we don't get it done you're going to see a reversal of a significant amount of these gains."1
_________________________________
1 https://www.politico.com/story/2017/10/18/mnuchin-tax-bill-markets-tank-243890
Therein lies the conundrum. On the surface (broad market indices), it would be reasonable to reach the same conclusion as Secretary Mnuchin, which also happens to be the consensus point of view. However, the empirical evidence highlighted above, as well as our proprietary research, paints a very different picture, leading to a very different conclusion.
According to research on Small Caps, the Industries that stood to benefit the most from the new Administration were Regional Banks, Oil & Gas Producers and Service, Chemicals, Industrial Metals, Capital Goods Manufacturers and Transportation. Within that group of approximately 750 small cap stocks, the majority saw their share prices decline markedly from the post-election rally (1-month post). Several of these companies, and other mid-cap names, have been long portfolio holdings of the Fund as well.
As the final details of Tax Cuts and Jobs Act of 2017 came together in early November and signed into law in late December, the stock prices of those same companies that performed so well in the weeks and months after the election began to rise once again. This dynamic persisted throughout the first half of 2018 and have positive impacts on the Fund's portfolio and overall returns.
Concluding Remarks
Effective May 14, 2018, Crow Point Partners, LLC ("Crow Point") replaced the Fund's prior investment adviser, Goodwood Advisors, LLC ("Goodwood"), and Cold Creek Capital, Inc. ("Cold Creek") also began serving as the Fund's sub-advisor.
We look forward to serving you as your investment advisor going forward.
Respectfully,
From the Crow Point/Cold Creek Team
(RCCPG0718001)
| Crow Point Growth Fund | | | | | | | | | | | | | |
| | | | | | | | | | | | | | | | | | | | |
| Performance Update - Institutional Class Shares | | | | | | | | | | | | |
| (Unaudited) | | | | | | | | | | | | | | |
| | | | | | | | | | | | | | | | | | | | |
| For the period from July 16, 2014 (Date of Initial Public Investment) through May 31, 2018 | | |
| | | | | | | | | | | | | | | | | | | | |
| Comparison of the Change in Value of a $100,000 Investment | | | | | | | | |
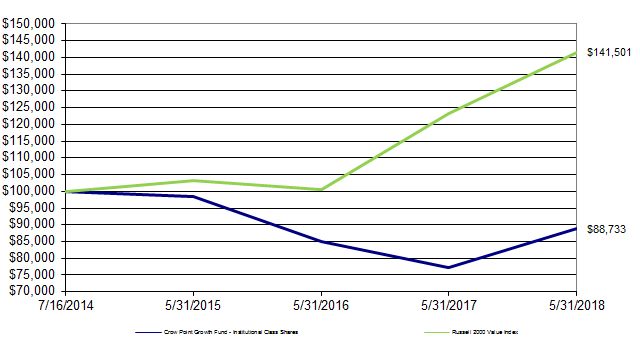
| This graph assumes an initial investment of $100,000 at July 16, 2014 (Date of Initial Public Investment). All dividends and distributions are reinvested. This graph depicts the performance of the Crow Point Growth Fund - Institutional Class Shares versus the Russell 2000 Value Index. It is important to note that the Fund is a professionally managed mutual fund while the index is not available for investment and is unmanaged. The comparison is shown for illustrative purposes only. |
| | | | | | | | | | | | | | | | | | | | |
| | Average Annual Total Returns | |
| | | | | | | | | | | | | | | | | | Gross | |
| | | As of | | | | | | | One | | Since | | Inception | | Expense | |
| | | May 31, 2018 | | | | | | Year | | Inception | | Date | | Ratio* | |
| | | Crow Point Growth Fund | | | | | 14.95% | | -3.04% | | 07/16/14 | | 3.06% | |
| | | Russell 2000 Value Index | | | | | 16.35% | | 9.37% | | N/A | | N/A | |
| | | | | | | | | | | | | | | | | | | | |
| * The gross expense ratio shown is from the Fund's prospectus dated September 28, 2017. | | | | |
| | | | | | | | | | | | | | | | | | | | |
| Performance quoted above represents past performance, which is no guarantee of future results. Investment return and principal value will fluctuate so that shares, when redeemed, may be worth more or less than their original cost. Current performance may be lower or higher than the performance data quoted. An investor may obtain performance data, current to the most recent month-end, by visiting goodwood-funds.com. |
| | | | | | | | | | | | | | | | | | | | |
| The graph and table do not reflect the deduction of taxes that a shareholder would pay on Fund distributions or the redemption of Fund shares. Average annual total returns are historical in nature and measure net investment income and capital gain or loss from portfolio investments assuming reinvestment of distributions. |
| | | | | | | | | | | | | | | | | | | | |
| | | | | | | | | | | | | | | | | | | | |
| Crow Point Growth Fund | | | | | | |
| | | | | | | | | | |
| Schedule of Investments | | | | | | |
| | | | | | | | | | |
| As of May 31, 2018 | | | | | | |
| | | | | | | | Shares | | Value (Note 1) |
| | | | | | | | | | |
| COMMON STOCKS - 91.19% | | | | | | |
| | | | | | | | | | |
| | Consumer Discretionary - 13.10% | | | | | | |
| | * | Boot Barn Holdings, Inc. | | | | 13,745 | | $ | 325,482 |
| | * | Cooper-Standard Holdings, Inc. | | | | 1,598 | | 198,472 |
| | * | Five Below, Inc. | | | | 3,836 | | 271,243 |
| | * | IMAX Corp. | | | | | 11,508 | | 240,517 |
| | * | Installed Building Products, Inc. | | | | 4,795 | | 290,817 |
| | * | TopBuild Corp. | | | | 4,443 | | 372,990 |
| | | World Wrestling Entertainment, Inc. | | | 6,393 | | 370,091 |
| | | | | | | | | | 2,069,612 |
| | Consumer Staples - 1.37% | | | | | | |
| | * | elf Beauty, Inc. | | | | 11,508 | | 216,926 |
| | | | | | | | | | |
| | Energy - 4.75% | | | | | | | |
| | * | Abraxas Petroleum Corp. | | | | 81,192 | | 219,218 |
| | * | Navigator Holdings Ltd. | | | | 21,685 | | 246,125 |
| | * | Whiting Petroleum Corp. | | | | 5,434 | | 284,850 |
| | | | | | | | | | 750,193 |
| | Financials - 3.91% | | | | | | |
| | * | Allegiance Bancshares, Inc. | | | | 4,987 | | 217,184 |
| | * | Equity Bancshares, Inc. | | | | 5,114 | | 203,588 |
| | * | Veritex Holdings, Inc. | | | | 6,393 | | 196,521 |
| | | | | | | | | | 617,293 |
| | Health Care - 29.38% | | | | | | |
| | * | BrainStorm Cell Therapeutics, Inc. | | | 22,376 | | 111,880 |
| | * | Corcept Therapeutics, Inc. | | | | 17,500 | | 323,750 |
| | * | CytoSorbents Corp. | | | | 38,359 | | 433,457 |
| | * | Dynavax Technologies Corp. | | | | 25,573 | | 404,053 |
| | * | Exact Sciences Corp. | | | | 7,160 | | 426,306 |
| | * | Flexion Therapeutics, Inc. | | | | 7,352 | | 199,313 |
| | * | HTG Molecular Diagnostics, Inc. | | | | 15,260 | | 58,446 |
| | * | Immune Design Corp. | | | | 31,965 | | 143,842 |
| | * | Intra-Cellular Therapies, Inc. | | | | 9,590 | | 223,255 |
| | * | iRhythm Technologies, Inc. | | | | 3,197 | | 243,068 |
| | * | Myriad Genetics, Inc. | | | | 5,754 | | 210,078 |
| | * | Neurocrine Biosciences, Inc. | | | | 5,434 | | 523,077 |
| | * | Nevro Corp. | | | | | 2,183 | | 171,780 |
| | * | Novocure Ltd. | | | | 12,786 | | 402,120 |
| | * | PolarityTE, Inc. | | | | 8,630 | | 220,065 |
| | * | Selecta Biosciences, Inc. | | | | 18,541 | | 221,936 |
| | * | Teladoc, Inc. | | | | 6,393 | | 325,404 |
| | | | | | | | | | 4,641,830 |
| | | | | | | | | | |
| | | | | | | | | | |
| | | | | | | | | | |
| | | | | | | | | | (Continued) |
| Crow Point Growth Fund | | | | | | |
| | | | | | | | | | |
| Schedule of Investments - Continued | | | | | | |
| | | | | | | | | | |
| As of May 31, 2018 | | | | | | |
| | | | | | | | Shares | | Value (Note 1) |
| | | | | | | | | | |
| COMMON STOCKS - Continued | | | | | | |
| | | | | | | | | | |
| | Industrials - 8.16% | | | | | | |
| | | Apogee Enterprises, Inc. | | | | 3,836 | | $ | 167,441 |
| | * | Dycom Industries, Inc. | | | | 3,197 | | 297,832 |
| | * | Eye Novia, Inc. | | | | 6,393 | | 50,760 |
| | | Interface, Inc. | | | | 8,950 | | 203,165 |
| | * | Quanta Services, Inc. | | | | 6,393 | | 230,212 |
| | * | Spirit Airlines, Inc. | | | | 3,836 | | 140,743 |
| | | Watsco, Inc. | | | | | 1,087 | | 200,030 |
| | | | | | | | | | 1,290,183 |
| | Information Technology - 27.58% | | | | | | |
| | * | Box, Inc. | | | | | 15,343 | | 394,008 |
| | * | CEVA, Inc. | | | | | 4,155 | | 140,023 |
| | * | CyberArk Software Ltd. | | | | 4,859 | | 295,670 |
| | * | Electro Scientific Industries, Inc. | | | | 11,508 | | 225,787 |
| | * | Euronet Worldwide, Inc. | | | | 2,557 | | 214,302 |
| | * | HubSpot, Inc. | | | | 2,557 | | 309,908 |
| | * | Integrated Device Technology, Inc. | | | 8,311 | | 276,258 |
| | | Lumentum Holdings, Inc. | | | | 6,393 | | 375,589 |
| | * | New Relic, Inc. | | | | 4,795 | | 487,124 |
| | * | Nutanix, Inc. | | | | | 5,115 | | 273,397 |
| | * | Quotient Technology, Inc. | | | | 18,602 | | 249,267 |
| | * | Rapid7, Inc. | | | | | 9,589 | | 303,684 |
| | | RingCentral, Inc. | | | | 5,261 | | 398,521 |
| | * | Twilio, Inc. | | | | | 7,672 | | 414,058 |
| | | | | | | | | | 4,357,596 |
| | Materials - 2.94% | | | | | | |
| | * | Ferro Corp. | | | | | 10,868 | | 222,359 |
| | | Ingevity Corp. | | | | 3,197 | | 243,420 |
| | | | | | | | | | 465,779 |
| | | | | | | | | | |
| | | Total Common Stocks (Cost $13,330,127) | | | | | 14,409,412 |
| | | | | | | | | | |
| | | | | Contracts | Exercise | | Expiration | Notional | |
| CALL OPTIONS PURCHASED - 0.01% | (a) | Price | | Date | Value | |
| * | American Outdoor Brands Corp. | 2,000 | $ | 15.00 | | 6/15/2018 | $ | 2,518,000 | 1,000 |
| | | | | | | | | | |
| | | Total Call Options Purchased (Cost $13,326) | | | | | 1,000 |
| | | | | | | | | | |
| U.S. TREASURY BILL - 3.16% | Principal | Yield | | Maturity Date | | |
| | * | United States Treasury Bill | $ | 500,000 | 1.660% | | 6/14/2018 | | 499,712 |
| | | | | | | | | | |
| | | Total U.S. Treasury Bill (Cost $499,707) | | | | | 499,712 |
| | | | | | | | | | |
| SHORT-TERM INVESTMENT - 1.08% | | | | Shares | | |
| | *§ | Money Market Fiduciary Portfolio, 0.01% | | | 170,272 | | 170,272 |
| | | | | | | | | | |
| | | Total Short-Term Investment (Cost $170,272) | | | | | 170,272 |
| | | | | | | | | | |
| | | | | | | | | | (Continued) |
| Crow Point Growth Fund | | | | | | |
| | | | | | | | | | |
| Schedule of Investments - Continued | | | | | | |
| | | | | | | | | | |
| As of May 31, 2018 | | | | | | |
| | | | | | | | | | Value (Note 1) |
| | | | | | | | | | |
| Total Value of Investments (Cost $14,013,432) - 95.44% | | | | $ | 15,080,396 |
| | | | | | | | | | |
| Other Assets Less Liabilities - 4.56% | | | | | | 719,966 |
| | | | | | | | | | |
| | Net Assets - 100.00% | | | | | | $15,800,362 |
| | | | | | | | | | |
| | * | Non-income producing investment | | | | | |
| | § | Represents 7 day effective yield | | | | | | |
| | (a) | Each contract is equivalent to 100 shares of the underlying common stock. | | |
| | | | | | | | | | |
| | | | | | | | | | |
| | | | | | | | | | |
| | | | | | | | | | |
| | | | | | | | | | |
| | | | Summary of Investments | % of Net | | | | |
| | | | by Sector | | Assets | | Value | | |
| | | | Assets | | | | | | |
| | | | Consumer Discretionary | 13.10% | $ | 2,069,612 | | |
| | | | Consumer Staples | | 1.37% | | 216,926 | | |
| | | | Energy | | 4.75% | | 750,193 | | |
| | | | Financials | | 3.91% | | 617,293 | | |
| | | | Health Care | | 29.38% | | 4,641,830 | | |
| | | | Industrials | | 8.16% | | 1,290,183 | | |
| | | | Information Technology | 27.58% | | 4,357,596 | | |
| | | | Materials | | 2.94% | | 465,779 | | |
| | | | Call Options Purchased | 0.01% | | 1,000 | | |
| | | | U.S. Treasury Bill | | 3.16% | | 499,712 | | |
| | | | Short-Term Investment | 1.08% | | 170,272 | | |
| | | | Other Assets Less Liabilities | 4.56% | | 719,966 | | |
| | | | Total Net Assets | | 100.00% | $ | 15,800,362 | | |
| | | | | | | | | | |
| | | | | | | | | | |
| | | | | | | | | | |
| | | | | | | | | | |
| See Notes to Financial Statements | | | | | | |
| Crow Point Growth Fund | | |
| | | | |
| Statement of Assets and Liabilities | | |
| | | | |
| As of May 31, 2018 | | |
| | | | |
| Assets: | | |
| Investments, at value (cost $14,013,432) | $ | 15,080,396 |
| Cash | | 9,040 |
| Receivables: | | |
| | Fund shares sold | | 787,659 |
| | Dividends and interest | | 449 |
| | Due from Advisor | | 5,760 |
| Prepaid expenses: | | |
| | Registration and filing expenses | | 8,537 |
| | Fund accounting fees | | 400 |
| | | | |
| Total assets | | 15,892,241 |
| | | | |
| Liabilities: | | |
| Due to broker | | 68,260 |
| Accrued expenses: | | |
| | Professional fees | | 14,888 |
| | Custody fees | | 2,922 |
| | Administration fees | | 2,127 |
| | Miscellaneous expenses | | 1,465 |
| | Trustee fees and meeting expenses | | 1,337 |
| | Shareholder fulfillment fees | | 751 |
| | Interest expense | | 129 |
| | | | |
| Total liabilities | | 91,879 |
| | | | |
| Net Assets | $ | 15,800,362 |
| | | | |
| Net Assets Consist of: | | |
| Paid in capital | $ | 17,588,621 |
| Accumulated net investment loss | | (205,150) |
| Accumulated net realized loss on investments, securites sold short, and options written | | (2,650,073) |
| Net unrealized appreciation on investments | | 1,066,964 |
| | | | |
| Total Net Assets | $ | 15,800,362 |
| | | | |
| Institutional Class Shares outstanding, no par value (unlimited authorized shares) | | 1,817,734 |
| | Net Assets | $ | 15,800,362 |
| | Net Asset Value, Redemption Price, and Maximum Offering Price Per Share | $ | 8.69 |
| | | | |
| | | | |
| | | | |
| See Notes to Financial Statements | | |
| | | | |
| Crow Point Growth Fund | | |
| | | | |
| Statement of Operations | | |
| | | | |
| For the fiscal year ended May 31, 2018 | | |
| | | | |
| Investment Income: | | |
| Dividends (net of withholding taxes of $2,815) | $ | 243,921 |
| Interest | | 28,344 |
| | | | |
| | Total Investment Income | | 272,265 |
| | | | |
| Expenses: | | |
| Interest expense | | 402,886 |
Advisory fees (note 2) | | 247,857 |
| Dividends on securities sold short | | 92,514 |
| Registration & filing expenses | | 44,129 |
Fund accounting fees (note 2) | | 34,494 |
| Professional fees | | 30,214 |
Transfer agent fees (note 2) | | 26,500 |
Administration fees (note 2) | | 23,999 |
| Security pricing fees | | 15,102 |
Custody fees (note 2) | | 12,959 |
| Shareholder fulfillment fees | | 12,201 |
Compliance fees (note 2) | | 9,167 |
| Trustee fees and meeting expenses | | 8,059 |
Distribution and service fees - Advisor Class Shares (note 4)(a) | | 6,548 |
Miscellaneous expenses (note 2) | | 4,200 |
| Insurance fees | | 3,619 |
| | | | |
| Total Expenses | | 974,448 |
| | | | |
Fees waived and reimbursed by the Advisor (note 2) | | (133,134) |
| | | | |
| Net Expenses | | 841,314 |
| | | | |
| Net Investment Loss | | (569,049) |
| | | | |
| Realized and Unrealized Gain on Investments: | | |
| | | | |
| Net realized gain from investments | | 1,354,493 |
| Net realized loss on securities sold short | | (1,106,507) |
| Net realized gain on options written | | 130,704 |
| | Total net realized gain | | 378,690 |
| | | | |
| Net change in unrealized appreciation on investments | | 2,360,325 |
| Net change in unrealized appreciation on securities sold short | | 61,878 |
| Net change in unrealized depreciation on options written | | (3,332) |
| | Total net change in unrealized appreciation | | 2,418,871 |
| | | | |
| Net Realized and Unrealized Gain on Investments | | 2,797,561 |
| | | | |
| Net Increase in Net Assets Resulting from Operations | $ | 2,228,512 |
| | | | |
| (a) | The Advisor Class Shares liquidated as of April 23, 2018. | | |
| | | | |
| See Notes to Financial Statements | | |
| Crow Point Growth Fund | | | | | | | |
| | | | | | | | | | | | |
| Statements of Changes in Net Assets | | | | | | |
| | | | | | | | | | | | |
| For the fiscal years ended May 31, | | | | 2018 | | 2017 |
| | | | | | | | | | | | |
| Operations: | | | | | | | | |
| Net investment loss | | | | $ | (569,049) | $ | (311,017) |
| Net realized gain (loss) on investment transactions | | | 378,690 | | (1,814,208) |
| Net change in unrealized appreciation (depreciation) on investments | | 2,418,871 | | (571,136) |
| | | | | | | | | | | | |
| Net Increase (Decrease) in Net Assets Resulting from Operations | | 2,228,512 | | (2,696,361) |
| | | | | | | | | | | | |
| Beneficial Interest Transactions: | | | | | | | |
| Shares sold | | | | | | 11,059,004 | | 14,085,876 |
| Reinvested dividends and distributions | | | | - | | - |
| Shares repurchased | | | | | (19,820,918) | | (6,955,393) |
| | | | | | | | | | | | |
| Increase (Decrease) from Beneficial Interest Transactions | | | (8,761,914) | | 7,130,483 |
| | | | | | | | | | | | |
| Net Increase (Decrease) in Net Assets | | | | (6,533,402) | | 4,434,122 |
| | | | | | | | | | | | |
| Net Assets: | | | | | | | | |
| Beginning of Year | | | | | 22,333,764 | | 17,899,642 |
| End of Year | | | | | $ | 15,800,362 | $ | 22,333,764 |
| | | | | | | | | | | | |
| Accumulated Net Investment Loss | | | | $ | (205,150) | $ | (126,291) |
| | | | | | | | | | | | |
| Share Information: | | 2018 | | 2017 |
| | Advisor Class Shares (a) | | Shares | Amount | | Shares | | Amount |
| | | Shares sold | | 42,889 | $ | 343,772 | | 584,433 | | $ | 5,233,288 |
| | | Reinvested dividends and distributions | - | - | | - | | - |
| | | Shares repurchased | | (725,204) | (5,868,687) | | (479,402) | | (4,020,667) |
| | Net Increase (Decrease) in Shares of | | | | | | |
| | Beneficial Interest | | (682,315) | (5,524,915) | | 105,031 | | 1,212,621 |
| | | | | | | | | | | | |
| Share Information: | | | | | | | |
| | Institutional Class Shares | | Shares | Amount | | Shares | Amount |
| | | Shares sold | | 1,318,471 | $ | 10,715,232 | | 1,053,532 | | $ | 8,852,588 |
| | | Reinvested dividends and distributions | - | - | | - | | - |
| | | Shares repurchased | | (1,750,674) | (13,952,231) | | (354,736) | | (2,934,726) |
| | Net Increase (Decrease) in Shares of | | | | | | |
| | Beneficial Interest | | (432,203) | (3,236,999) | | 698,796 | | 5,917,862 |
| | | | | | | | | | | | |
| (a) | The Advisor Class Shares liquidated as of April 23, 2018. | | | | |
| | | | | | | | | | | | |
| | | | | | | | | | | | |
| | | | | | | | | | | | |
| | | | | | | | | | | | |
| See Notes to Financial Statements | | | | | | | |
| Crow Point Growth Fund | | | | |
| | | | | | | | | |
| Statement of Cash Flows | | | | |
| | | | | | | | | |
| For the fiscal year ended May 31, 2018 | | | | |
| | | | | | | | | |
| Cash flows from operating activities: | | | | |
| | Net increase in net assets resulting from operations | | $ | 2,228,512 |
| | Adjustments to reconcile net increase in net assets resulting | | | |
| | | from operations to net cash provided by operating activities: | | | |
| | | | | | | | | |
| | | Purchases of investments in securities | | | | (71,001,922) |
| | | Purchases to cover securities sold short | | | | (48,022,694) |
| | | Purchases to cover options written | | | | (2,171,133) |
| | | Proceeds from sale of investments in securities | | | 88,901,376 |
| | | Proceeds from securities sold short | | | | 36,293,426 |
| | | Proceeds from options written | | | | 2,211,855 |
| | | Amortization | | | | (28,344) |
| | | Net realized gain from investments in securities | | | (378,690) |
| | | Change in net unrealized appreciation on investments in securities | | (2,418,871) |
| | | Decrease in deposits with broker | | | | 3,792,739 |
| | | Decrease in dividend and interest receivable | | | 28,204 |
| | | Increase in due from Advisor | | | | (7,043) |
| | | Decrease in prepaid expenses | | | | 11,592 |
| | | Decrease in payable for dividends on securities sold short | | | (7,945) |
| | | Increase in accrued expenses | | | | 2,309 |
| | | Decrease in accrued interest expenses | | | | (15,426) |
| | Net cash provided by operating activities | | | | 9,417,945 |
| | | | | | | | | |
| Cash flows from financing activities: | | | | |
| | | | | | | | | |
| | Capital contributions | | | | 10,412,236 |
| | Capital withdrawals | | | | (19,821,141) |
| | Net cash used in financing activities | | | | (9,408,905) |
| | | | | | | | | |
| | Net increase in cash and cash equivalents | | | | 9,040 |
| | | | | | | | | |
| Cash & Cash Equivalents: | | | | |
| | | | | | | | | |
| | Beginning of year | | | | - |
| | | | | | | | | |
| | Ending of year | | | | $ | 9,040 |
| | | | | | | | | |
| | | | | | | | | |
| | Supplemental Disclosure of Cash Flow Information | | | |
| | | Cash paid during the year for interest | | | $ | 418,312 |
| | | | | | | | | |
| | | | | | | | | |
| | | | | | | | | |
| | | | | | | | | |
| | | | | | | | | |
| See Notes to Financial Statements | | | | |
| Crow Point Growth Fund | | | | | | | | | |
| | | | | | | | | | | | | |
| Financial Highlights | | | | | | | | | |
| | | | | | | | | | | | | |
| For a share outstanding during the | | Institutional Class Shares |
| fiscal years or period ended May 31, | | 2018 | | 2017 | | 2016 | | 2015 | (e) |
| | | | | | | | | | | | | |
| Net Asset Value, Beginning of Period | | $ | 7.56 | | 8.33 | | $ | 9.70 | | $ | 10.00 | |
| | | | | | | | | | | | | |
| Loss from Investment Operations | | | | | | | | | |
| Net investment loss (f) | | (0.22) | | (0.11) | | (0.05) | | (0.09) | |
| Net realized and unrealized gain (loss) | | | | | | | | | |
| | on investments | | 1.35 | | (0.66) | | (1.28) | | (0.07) | |
| | | | | | | | | | | | | |
| Total from Investment Operations | | 1.13 | | (0.77) | | (1.33) | | (0.16) | |
| | | | | | | | | | | | | |
| Less Distributions: | | | | | | | | | |
| From net investment income | | - | | - | | - | | - | |
| From net realized gains | | - | | - | | (0.04) | | (0.14) | |
| | | | | | | | | | | | | |
| Total Distributions | | - | | - | | (0.04) | | (0.14) | |
| | | | | | | | | | | | | |
| Net Asset Value, End of Period | | $ | 8.69 | | $ | 7.56 | | $ | 8.33 | | $ | 9.70 | |
| | | | | | | | | | | | | |
| Total Return (c) | | 14.95% | | (9.24)% | | (13.71)% | | (1.43)% | (b) |
| | | | | | | | | | | | | |
| Net Assets, End of Period (in thousands) | | $ | 15,800 | | 17,015 | | $ | 12,927 | | $ | 3,293 | |
| | | | | | | | | | | | | |
| Ratios of: | | | | | | | | | | |
| Interest and Dividend Expenses to Average Net Assets | 2.49% | | 0.84% | | 0.12% | | - | |
| Gross Expenses to Average Net Assets (d)(h) | | 4.84% | | 3.07% | | 1.83% | | 1.70% | (a) |
| Net Expenses to Average Net Assets (d)(g)(h) | | 1.68% | | 1.69% | | 1.71% | | 1.70% | (a) |
| Net Expenses to Average Net Assets (d)(h) | | 4.17% | | 2.53% | | 1.83% | | 1.70% | (a) |
| Net Investment Loss to Average Net Assets (h) | | (2.81)% | | (1.36)% | | (0.55)% | | (1.02)% | (a) |
| | | | | | | | | | | | | |
| Portfolio turnover rate | | 263.61% | | 438.73% | | 580.62% | | 335.07% | (b) |
| | | | | | | | | | | | | |
| | | | | | | | | | | | | |
| | | | | | | | | | | | | |
| | | | | | | | | | | | | |
| | | | | | | | | | | | | |
| | | | | | | | | | | | | |
| | | | | | | | | | | | | |
| (a) | Annualized. | | | | | | | | | |
| (b) | Not annualized. | | | | | | | | | |
| (c) | Includes adjustments in accordance with accounting principles generally accepted in the United States of America and, consequently, the net asset value for financial reporting purposes and the returns based upon those net asset values may differ from the net asset values and returns for shareholder transactions. |
| (d) | The expense ratios listed reflect total expenses prior to any waivers and reimbursements (gross expense ratio) and after any waivers and reimbursements (net expense ratio). |
| (e) | For the period from July 16, 2014 (Date of Initial Public Investment) through May 31, 2015. | | | |
| (f) | Calculated using the average shares method. | | | | | | | | | |
| (g) | Excluding interest and dividend expense. | | | | | | | | | |
| (h) | Recognition of the Fund's net investment income is affected by the timing of dividend declarations of underlying funds. The expenses of the underlying funds are excluded from the Fund's expense ratio. |
| | | |
| | | | | | | | | | | | | |
| | | | | | | | | | | | | |
| | | | | | | | | | | | | |
| | | | | | | | | | | | | |
| See Notes to Financial Statements | | | | | | | | | |
Crow Point Growth Fund
Notes to Financial Statements
As of May 31, 2018
1. Organization and Significant Accounting Policies
The Crow Point Growth Fund ("Fund"), formerly known as the Goodwood SMID Long/Short Fund, is a series of the Starboard Investment Trust ("Trust"). The Trust is organized as a Delaware statutory trust and is registered under the Investment Company Act of 1940, as amended (the "1940 Act"), as an open-end management investment company. The Fund is a separate diversified series of the Trust.
The Fund's investment sub-advisor seeks to achieve the Fund's investment objective of capital appreciation by investing primarily in a portfolio of common stocks that it believes have above-average future growth potential relative to their peers, using risk adjusted metrics as a comparative baseline.
The Fund currently has an unlimited number of authorized shares of one class of shares – Institutional Class. The Date of Initial Public Investment for the Institutional Class Shares was July 16, 2014. Previously the Fund's shares were divided into two classes - Institutional Class Shares and Advisor Class Shares. Each class of shares had equal rights as to assets of the Fund, and the classes were identical except that the Advisor Class Shares were subject to distribution and service fees, which are further discussed in Note 4. Income, expenses (other than distribution and service fees), and realized and unrealized gains or losses on investments were allocated to each class of shares based upon its relative net assets. All classes had equal voting privileges, except where otherwise required by law or when the Trustees determine that the matter to be voted on affects only the interests of the shareholders of a particular class. The Date of Initial Public Investment for the Advisor Class Shares was January 4, 2010.
Through a written consent dated February 20, 2018, the Board of Trustees (the "Board" or "Trustees") approved the liquidation of the Advisor Class Shares and the discontinuation of all agreements associated with the Advisor Class Shares effective April 23, 2018. Investors in the Advisor Class Shares fully liquidated as of April 23, 2018.
The following is a summary of significant accounting policies consistently followed by the Fund. The policies are in conformity with accounting principles generally accepted in the United States of America ("GAAP"). The Fund follows the accounting and reporting guidance in the Financial Accounting Standards Board ("FASB") Accounting Standards Codification 946 "Financial Services – Investment Companies," and Financial Accounting Standards Update ("ASU") 2013-08.
Investment Valuation
The Fund's investments in securities are carried at fair value. Securities listed on an exchange or quoted on a national market system are valued at the last sales price as of 4:00 p.m. Eastern Time. Securities traded in the NASDAQ over-the-counter market are generally valued at the NASDAQ Official Closing Price. Price information on listed securities is taken from the composite exchange listing for securities traded on multiple exchanges. Other securities traded in the over-the-counter market and listed securities for which no sale was reported on that date are valued at the most recent bid price. Securities and assets for which representative market quotations are not readily available (e.g., if the exchange on which the portfolio security is principally traded closes early or if trading of the particular portfolio security is halted during the day and does not resume prior to the Fund's net asset value calculation) or which cannot be accurately valued using the Fund's normal pricing procedures are valued at fair value as determined in good faith under policies approved by the Board of Trustees (the "Trustees"). A portfolio security's "fair value" price may differ from the price next available for that portfolio security using the Fund's normal pricing procedures. Instruments with maturities of 60 days or less are valued at amortized cost, which approximates market value. Money market securities are highly liquid financial instruments with very short maturities that are valued at their respective net asset values.
Option Valuation
Options are valued at the mean of the last quoted bid and ask prices as of 4:00 p.m. Eastern Time (the "Valuation Time"). Options will be valued on the basis of prices provided by pricing services when such prices are reasonably believed to reflect the market value of such options and may include the use of composite or National Best Bid/Offer (NBBO) pricing information provided by the pricing services. If there is an ask price but no bid price at the Valuation Time, the option shall be priced at the mean of zero and the ask price at the Valuation Time. An option should be valued using fair value pricing when (i) a reliable last quoted ask price at the Valuation Time is not readily available or (ii) the Fund's investment advisor or Fund management does not believe the prices provided by the pricing services reflect the market value of such option.
(Continued)
Crow Point Growth Fund
Notes to Financial Statements
As of May 31, 2018
Fair Value Measurement
Various inputs are used in determining the value of the Fund's investments. These inputs are summarized in the three broad levels listed below:
Level 1: quoted prices in active markets for identical securities
Level 2: other significant observable inputs (including quoted prices for similar securities and identical securities in inactive markets, interest rates, credit risk, etc.)
Level 3: significant unobservable inputs (including the Fund's own assumptions in determining fair value of investments)
The availability of observable inputs can vary from security to security and is affected by a wide variety of factors, including, for example, the type of security, whether the security is new and not yet established in the marketplace, the liquidity of markets, and other characteristics particular to the security. To the extent that valuation is based on models or inputs that are less observable or unobservable in the market, the determination of fair value requires more judgment. Accordingly, the degree of judgment exercised in determining fair value is greatest for instruments categorized in Level 3.
The inputs used to measure fair value may fall into different levels of the fair value hierarchy. In such cases, for disclosure purposes, the level in the fair value hierarchy within which the fair value measurement falls in its entirety, is determined based on the lowest level input that is significant to the fair value measurement in its entirety.
The inputs or methodology used for valuing securities are not necessarily an indication of the risk associated with investing in those securities. The following table summarizes the inputs as of May 31, 2018 for the Fund's assets measured at fair value:
| | | |
| Investments (a) | | Total | | Level 1 | | Level 2 | | Level 3 |
| Assets | | | | | | | | |
| Common Stocks* | $ | 14,409,412 | $ | 14,409,412 | $ | - | $ | - |
| Call Options Purchased | | 1,000 | | - | | 1,000 | | - |
| U.S. Treasury Bill | | 499,712 | | - | | 499,712 | | - |
| Short-Term Investment | | 170,272 | | 170,272 | | - | | - |
| Total Assets | $ | 15,080,396 | $ | 14,579,684 | $ | 500,712 | $ | - |
| | | | | | | | | |
* Please refer to the Schedule of Investments for a breakdown by sector.
(a) The Fund had no significant transfers into or out of Level 1, 2, or 3 during the fiscal year ended May 31, 2018. The Fund did not hold any Level 3 securities during the year. It is the Fund's policy to recognize transfers at the end of the reporting period.
Securities Sold Short
The Fund may sell a security short to increase investment returns. The Fund may also sell a security short in anticipation of a decline in the market value of a security. A short sale is a transaction in which the Fund sells a security that it does not own. To complete the transaction, the Fund must borrow the security in order to deliver it to the buyer. The Fund must replace the borrowed security by purchasing it at market price at the time of replacement; the price may be higher or lower than the price at which the Fund sold the security. The Fund incurs a loss from a short sale if the price of the security increases between the date of the short sale and the date on which the Fund replaces the borrowed security. The Fund realizes a profit if the price of the security declines between those dates.
Until the Fund replaces the borrowed security, the Fund will maintain on its books and records cash and long securities to sufficiently cover its short position on a daily basis. The collateral for the securities sold short includes securities held long as shown on the Schedule of Investments. Dividends on securities sold short are recorded as an expense on the Fund's Statement of Operations. The total dividend on securities sold short expense for the fiscal year ended May 31, 2018 was $92,514.
(Continued)
Crow Point Growth Fund
Notes to Financial Statements
As of May 31, 2018
Purchased Options
When the Fund purchases an option, an amount equal to the premium paid by the Fund is recorded as an investment and is subsequently adjusted to the current value of the option purchased. If an option expires on the stipulated expiration date or if the Fund enters into a closing sale transaction, a gain or loss is realized. If a call option is exercised, the cost of the security acquired is increased by the premium paid for the call. If a put option is exercised, a gain or loss is realized from the sale of the underlying security, and the proceeds from such sale are decreased by the premium originally paid. Purchased options are non-income producing securities.
Option Writing
When the Fund writes an option, an amount equal to the premium received by the Fund is recorded as a liability and is subsequently adjusted to the current fair value of the option written. Premiums received from writing options that expire unexercised are treated by the Fund on the expiration date as realized gains from options written. The difference between the premium and the amount paid on effecting a closing purchase transaction, including brokerage commissions, is also treated as a realized gain or loss (depending on if the premium is less than the amount paid for the closing purchase transaction). If a call option is exercised, the premium is added to the proceeds from the sale of the underlying security in determining whether the Fund has realized a gain or loss. If a put option is exercised, the premium reduces the cost basis of the securities purchased by the Fund. The Fund, as the writer of an option, bears the market risk of an unfavorable change in the price of the security underlying the written option. Written options are non-income producing securities.
Derivative Financial Instruments
The Fund may invest in derivative financial instruments (derivatives) in order to manage risk or gain exposure to various other investments or markets. Derivatives may contain various risks including the potential inability of the counterparty to fulfill their obligations under the terms of the contract, the potential for an illiquid secondary market, and the potential for market movements which may expose the Fund to gains or losses in excess of the amounts shown on the Statement of Assets and Liabilities.
The derivative instruments outstanding as of May 31, 2018 are disclosed below and the amounts of realized and changes in unrealized gains and losses on derivative instruments during the year as disclosed below serve as indicators of the volume of derivative activity for the Fund.
The following table sets forth the effect of the derivative instruments on the Statement of Assets and Liabilities as of May 31, 2018:
Derivative Type | Location | | Value |
| Equity Contracts – purchased options | Assets-Investments, at value | | $ 1,000 |
The following table sets forth the effect of the derivative instruments on the Statement of Operations for the fiscal year ended May 31, 2018:
| Derivative Type | Location | Gains/Losses |
| Equity Contracts – purchased options | Net realized loss from investments | $ | (1,406,997) |
| Equity Contracts – written options | Net realized gain from options written | $ | 130,704 |
| | | |
| Equity Contracts – purchased options | Net change in unrealized appreciation on investments | $ | 329,097 |
| Equity Contracts – written options | Net change in unrealized depreciation on options written | $ | (3,332) |
| | | |
(Continued)
Crow Point Growth Fund
Notes to Financial Statements
As of May 31, 2018
Investment Transactions and Investment Income
Investment transactions are accounted for as of the date purchased or sold (trade date). Dividend income is recorded on the ex-dividend date. Certain dividends from foreign securities will be recorded as soon as the Fund is informed of the dividend if such information is obtained subsequent to the ex-dividend date. Interest income is recorded on the accrual basis and includes amortization of discounts and premiums. Gains and losses are determined on the identified cost basis, which is the same basis used for federal income tax purposes.
Expenses
The Fund bears expenses incurred specifically on its behalf as well as a portion of general expenses, which are allocated according to methods reviewed annually by the Trustees.
Distributions
The Fund may declare and distribute dividends from net investment income (if any) annually. Distributions from capital gains (if any) are generally declared and distributed annually. Dividends and distributions to shareholders are recorded on ex-date.
Estimates
The preparation of financial statements in conformity with GAAP requires management to make estimates and assumptions that affect the reported amounts of assets and liabilities and disclosure of contingent assets and liabilities at the date of the financial statements and the reported amounts of increases and decreases in the net assets from operations during the reported period. Actual results could differ from those estimates.
Federal Income Taxes
No provision for income taxes is included in the accompanying financial statements, as the Fund intends to distribute to shareholders all taxable investment income and realized gains and otherwise comply with Subchapter M of the Internal Revenue Code applicable to regulated investment companies.
2. Transactions with Related Parties & Service Providers
Advisor
For the period from June 1, 2017 through May 13, 2018, the Fund paid a monthly fee to Goodwood Advisors, LLC, the former advisor, calculated at the annual rate of 1.25% of the Fund's average daily net assets. For the period from June 1, 2017 through May 13, 2018, $242,676 in advisory fees were incurred, of which $123,332 in advisory fees were waived by Goodwood Advisors, LLC.
Goodwood Advisors, LLC had also entered into a contractual agreement (the "Expense Limitation Agreement") with the Trust, on behalf of the Fund, under which it had agreed to waive or reduce its fees and to assume other expenses of the Fund, if necessary, in amounts that limit the Fund's total operating expenses (exclusive of interest, dividends on securities sold short, taxes, brokerage commissions, borrowing costs, fees and expenses of other investment companies in which the Fund invests, and other expenditures which are capitalized in accordance with generally accepted accounting principles, other extraordinary expenses not incurred in the ordinary course of the Fund's business, and amounts, if any, payable under a Rule 12b-1 distribution plan) to not more than 1.70% of the average daily net assets of the Fund. The former advisor cannot recoup any amounts previously waived or reimbursed.
For the period from May 14, 2018 through May 31, 2018, the Fund paid a monthly fee to Crow Point Partners, LLC (the "Advisor"), calculated at the annual rate of 0.84% of the Fund's average daily net assets. For the period from May 14, 2018 through May 31, 2018, $5,181 in advisory fees were incurred, all of which were waived by the Advisor and $4,621 were reimbursed by the Advisor to the Fund.
The Advisor also entered into a contractual agreement (the "Expense Limitation Agreement") with the Trust, on behalf of the Fund, under which it had agreed to waive or reduce its fees and to assume other expenses of the Fund, if necessary, in amounts that limit the Fund's total operating expenses (exclusive those expenses and other expenditures that are capitalized in accordance with generally accepted accounting principles, acquired fund fees and expenses, other extraordinary expenses not incurred in the ordinary course of the Fund's business, and amounts, if any, payable pursuant to a plan adopted in accordance with Rule 12b-1 under the Investment Company Act of 1940) to not more than 1.35% of the average daily net assets of the Fund. The current term of the Expense Limitation Agreement is until October 1, 2019 and will continue year-to-year thereafter. The Advisor cannot recoup any amounts previously waived or reimbursed.
(Continued)
Crow Point Growth Fund
Notes to Financial Statements
As of May 31, 2018
Sub-Advisor
As of May 14, 2018, the Advisor engaged Cold Creek Capital, Inc. (the "Sub-Advisor") to be responsible for management of the Fund's investment portfolio according to the Fund's investment objective, policies, and restrictions. The Sub-Advisor is subject to the authority of the Board of Trustees and oversight by the Advisor. The Sub-Advisor is paid directly by the Advisor.
Administrator
The Fund pays a monthly fee to the Fund's administrator, The Nottingham Company ("the Administrator"), based upon the average daily net assets of the Fund and calculated at the annual rates as shown in the schedule below which is subject to a minimum of $2,000 per month. The Administrator also receives a fee to procure and pay the Fund's custodian, additional compensation for fund accounting and recordkeeping services, and additional compensation for certain costs involved with the daily valuation of securities and as reimbursement for out-of-pocket expenses. The Administrator also receives a miscellaneous compensation fee for peer group, comparative analysis, and compliance support totaling $350 per month. As of May 31, 2018, the Administrator received $4,200 in miscellaneous expenses.
A breakdown of the fees is provided in the following table:
| Administration Fees* | Custody Fees* | Fund Accounting Fees (minimum monthly) | Fund Accounting Fees (asset- based fee) | Blue Sky Administration Fees (annual) |
Average Net Assets | Annual Rate | Average Net Assets | Annual Rate |
| First $100 million | 0.100% | First $200 million | 0.020% | $2,250 | 0.01% | $150 per state |
| Next $150 million | 0.080% | Over $200 million | 0.009% | $500/additional class | | |
| Next $250 million | 0.060% | | | | | |
| Next $500 million | 0.050% | *Minimum monthly fees of $2,000 and $417 for Administration and Custody, respectively. |
| Next $1 billion | 0.040% |
| Over $2 billion | 0.035% |
The Fund incurred $23,999 in administration fees, $12,959 in custody fees, and $34,494 in fund accounting fees for the fiscal year ended May 31, 2018.
Compliance Services
Cipperman Compliance Services, LLC provides services as the Trust's Chief Compliance Officer. Cipperman Compliance Services, LLC is entitled to receive customary fees from the Fund for their services pursuant to the Compliance Services agreement with the Fund.
Transfer Agent
Nottingham Shareholder Services, LLC ("Transfer Agent") serves as transfer, dividend paying, and shareholder servicing agent for the Fund. For its services, the Transfer Agent is entitled to receive compensation from the Fund pursuant to the Transfer Agent's fee arrangements with the Fund. The Fund paid the Transfer Agent $26,500 in fees for the fiscal year ended May 31, 2018.
(Continued)
Crow Point Growth Fund
Notes to Financial Statements
As of May 31, 2018
Distributor
Capital Investment Group, Inc. (the "Distributor") serves as the Fund's principal underwriter and distributor. For its services, the Distributor is entitled to receive compensation from the Fund pursuant to the Distributor's fee arrangements with the Fund.
3. Trustees and Officers
The Board of Trustees is responsible for the management and supervision of the Fund. The Trustees approve all significant agreements between the Trust, on behalf of the Fund, and those companies that furnish services to the Fund; review performance of the Advisor and the Fund; and oversee activities of the Fund. Officers of the Trust and Trustees who are interested persons of the Trust or the Advisor will receive no salary or fees from the Trust. Trustees who are not "interested persons" of the Trust or the Advisor within the meaning of the 1940 Act (the "Independent Trustees") receive $2,000 each year from each Fund. The Trust will reimburse each Trustee and officer of the Trust for his or her travel and other expenses relating to attendance of Board meetings. Additional fees may also be incurred during the year as special meetings are necessary in addition to the regularly scheduled meetings of the Board of Trustees.
Certain officers of the Trust may also be officers of the Administrator.
4. Distribution and Service Fees
The Trustees, including a majority of the Independent Trustees, adopted a distribution plan pursuant to Rule 12b-1 of the 1940 Act (the "Plan"). The 1940 Act regulates the manner in which a regulated investment company may assume expenses of distributing and promoting the sales of its shares and servicing of its shareholder accounts. The Plan provided that the Advisor Class Shares may incur certain expenses, which may not exceed 0.25% per annum of the average daily net assets of the Fund's Advisor Class Shares for each year elapsed subsequent to adoption of the Plan, for payment to the Distributor and others for items such as advertising expenses, selling expenses, commissions, travel or other expenses reasonably intended to result in sales of shares of the Advisor Class or support servicing of shareholder accounts. The Advisor Class Shares liquidated as of April 23, 2018, and the Plan was terminated. For the fiscal year ended May 31, 2018, $6,548 in fees were incurred by the Advisor Class Shares of the Fund.
5. Purchases and Sales of Investment Securities
For the fiscal year ended May 31, 2018, the aggregate cost of purchases and proceeds from sales of investment securities (excluding short-term securities) were as follows:
| Purchases of Securities | | Proceeds from Sales of Securities |
| $52,221,896 | | $64,916,471 |
There were no long-term purchases or sales of U.S Government Obligations during the fiscal year ended May 31, 2018.
6. Federal Income Tax
Distributions are determined in accordance with Federal income tax regulations, which differ from GAAP, and, therefore, may differ significantly in amount or character from net investment income and realized gains for financial reporting purposes. Financial reporting records are adjusted for permanent book/tax differences to reflect tax character but are not adjusted for temporary differences.
(Continued)
Crow Point Growth Fund
Notes to Financial Statements
As of May 31, 2018
Reclassifications relate primarily to differing book/tax treatment of ordinary net investment losses and partnership adjustments. For the year ended May 31, 2018, the following reclassifications were necessary:
| Accumulated Net Investment Loss | $ 490,190 |
| Accumulated Net Realized Loss on Investments | 25,700 |
| Paid in Capital | (515,890) |
Management reviewed the Fund's tax positions on federal income tax returns for the open tax years May 31, 2015 through May 31, 2018 and determined that the Fund does not have a liability for uncertain tax positions. The Fund recognizes interest and penalties, if any, related to unrecognized tax benefits as income tax expense in the Statement of Operations. During the fiscal year ended May 31, 2018, the Fund did not incur any interest or penalties.
There were no distributions from net investment income or long-term capital gains during the fiscal years ended May 31, 2017 and May 31, 2018.
At May 31, 2018, the tax-basis cost of investments and components of distributable earnings were as follows:
| Cost of Investments | $ | 14,220,932 |
| | | |
| Gross Unrealized Appreciation | $ | 1,268,407 |
| Gross Unrealized Depreciation | | (408,943) |
| Net Unrealized Appreciation | | 859,464 |
| | | |
| Capital Loss Carryforward | | (2,442,573) |
| Late-Year Losses | | (205,150) |
| | | |
| Accumulated Deficit | $ | (1,788,259) |
| | | | | | |
The difference between components of distributable earnings on a tax basis and the amounts reflected in the Statement of Assets and Liabilities are primarily due to wash sale losses.
The Fund has a capital loss carryforward of $2,442,573, all of which is short-term in nature and has no expiration.
For tax purposes, the current late year losses of $205,150 were realized during the period from January 1, 2018 through May 31, 2018. These losses will be recognized for tax purposes on the first business day of the Fund's next fiscal year, June 1, 2018.
7. Principal Risks
Investments in the Fund are subject to investment risks, including the possible loss of some or the entire principal amount invested. There can be no assurance that the Fund will be successful in meeting its investment objective. Generally, the Fund will be subject to the following principal risks:
Portfolio Turnover Risk
The Advisor will sell portfolio securities when it is in the interests of the Fund and its shareholders to do so without regard to the length of time they have been held. As portfolio turnover may involve paying brokerage commissions and other transaction costs, there could be additional expenses for the Fund. High rates of portfolio turnover may also result in the realization of short-term capital gains and losses. Any distributions resulting from such gains will be considered ordinary income for federal income tax purposes.
(Continued)
Crow Point Growth Fund
Notes to Financial Statements
As of May 31, 2018
Small-Cap and Mid-Cap Securities Risk
The Fund may invest in securities of small-cap and mid-cap companies, which involves greater volatility than investing in larger and more established companies. Small-cap and mid-cap companies can be subject to more abrupt or erratic share price changes than larger, more established companies. Securities of these types of companies have limited market liquidity, and their prices may be more volatile. You should expect that the value of the Fund's shares will be more volatile than a fund that invests exclusively in large-capitalization companies.
Option Risk
Option transactions in which the Fund expects to engage involve the specific risks described below: the Fund, as writer of an option, may be assigned an exercise at any time during the option period; disruptions in the markets for underlying instruments could result in losses on the Fund's investments in options; imperfect or no correlation between the option and the securities being hedged; the insolvency of a broker used by the Fund could present risks for the Fund; and market imposed restrictions may prohibit the exercise of certain options. In addition, the option activities of the Fund may affect its portfolio turnover rate and the amount of brokerage commissions paid by the Fund.
8. Concentration of Risk
As of May 31, 2018, the percentage of net assets invested in the Health Care sector was 29.38%. As of May 31, 2018, the percentage of net assets invested in the Information Technology sector was 27.58%.
At various times, the Fund may have cash, cash collateral, and due from broker balances that exceed federally insured limits. It is the opinion of management that the solvency of the financial institutions are not of a particular concern at the time.
9. Borrowings
The Fund established a borrowing agreement with Interactive Brokers, LLC for investment purposes subject to the limitations of the 1940 Act for borrowings by registered investment companies.
Interest is based on the Federal Funds rate plus 1.50% on the first $100,000, the Federal Funds rate plus 1.00% on the next $900,000, the Federal Funds rate plus 0.50% on the next $2 million, and the Federal Funds rate plus 0.30% on amounts exceeding $3 million. The average borrowing during the fiscal year was $2,036,687, and the average interest rate during the year was 2.52%.
Interest expense is charged directly to the Fund based upon actual amounts borrowed by the Fund. The Fund had $68,260 in borrowings as of the fiscal year ended May 31, 2018. Total interest expense for the year was $402,886 as reflected in the Statement of Operations. The interest expense is inclusive of interest on securities sold short, options, and margin deficit balances in the Fund.
10. Commitments and Contingencies
Under the Trust's organizational documents, its officers and Trustees are indemnified against certain liabilities arising out of the performance of their duties to the Fund. In addition, in the normal course of business, the Trust entered into contracts with its service providers, on behalf of the Fund, and others that provide for general indemnifications. The Fund's maximum exposure under these arrangements is unknown, as this would involve future claims that may be made against the Fund. The Fund expects risk of loss to be remote.
11. Subsequent Events
In accordance with GAAP, management has evaluated the need for disclosures and/or adjustments resulting from subsequent events through the date of issuance of these financial statements. This evaluation did not result in any subsequent events that necessitated disclosures and/or adjustments.
REPORT OF INDEPENDENT REGISTERED PUBLIC ACCOUNTING FIRM
To the Board of Trustees of Starboard Investment Trust
and the Shareholders of Crow Point Growth Fund
Opinion on the Financial Statements
We have audited the accompanying statement of assets and liabilities of Crow Point Growth Fund (formerly, Goodwood SMID Long/Short Fund), a series of shares of beneficial interest in Starboard Investment Trust (the "Fund"), including the schedule of investments, as of May 31, 2018, and the related statements of operations and cash flows for the year then ended, the statements of changes in net assets for each of the years in the two-year period then ended and the financial highlights for each of the years in the three-year period then ended and for the period July 16, 2014 (Date of Initial Public Investment) through May 31, 2015, and the related notes (collectively referred to as the "financial statements"). In our opinion, the financial statements present fairly, in all material respects, the financial position of the Fund as of May 31, 2018, and the results of its operations and cash flows for the year then ended, the changes in its net assets for each of the years in the two-year period then ended and its financial highlights for each of the years in the three-year period then ended and for the period July 16, 2014 (Date of Initial Public Investment) through May 31, 2015, in conformity with accounting principles generally accepted in the United States of America.
Basis for Opinion
These financial statements are the responsibility of the Fund's management. Our responsibility is to express an opinion on the Fund's financial statements based on our audits. We are a public accounting firm registered with the Public Company Accounting Oversight Board (United States) ("PCAOB") and are required to be independent with respect to the Fund in accordance with the U.S. federal securities law and the applicable rules and regulations of the Securities and Exchange Commission and the PCAOB.
We conducted our audits in accordance with the standards of the PCAOB. Those standards require that we plan and perform the audits to obtain reasonable assurance about whether the financial statements are free of material misstatement, whether due to error or fraud. The Fund is not required to have, nor were we engaged to perform, an audit of its internal control over financial reporting. As part of our audits we are required to obtain an understanding of internal control over financial reporting but not for the purpose of expressing an opinion on the effectiveness of the Fund's internal control over financial reporting. Accordingly, we express no such opinion.
Our audits included performing procedures to assess the risk of material misstatement of the financial statements, whether due to error or fraud, and performing procedures that respond to those risks. Such procedures include examining, on a test basis, evidence regarding the amounts and disclosures in the financial statements. Our procedures included confirmation of securities owned as of May 31, 2018 by correspondence with the custodian and broker. Our audits also included evaluating the accounting principles used and significant estimates made by management, as well as evaluating the overall presentation of the financial statements. We believe that our audits provide a reasonable basis for our opinion.
BBD, LLP
We have served as the auditor of one or more of the Funds in the Starboard Investment Trust since 2012.
Philadelphia, Pennsylvania
July 30, 2018
Crow Point Growth Fund
Additional Information
(Unaudited)
As of May 31, 2018
1. Proxy Voting Policies and Voting Record
A copy of the Trust's Proxy Voting and Disclosure Policy is included as Appendix B to the Fund's Statement of Additional Information and are available, without charge, upon request, by calling 800-773-3863, and on the website of the Securities and Exchange Commission ("SEC") at sec.gov. Information regarding how the Fund voted proxies relating to portfolio securities during the most recent 12-month period ended June 30, is available (1) without charge, upon request, by calling the Fund at the number above and (2) on the SEC's website at sec.gov.
2. Quarterly Portfolio Holdings
The Fund files its complete schedule of portfolio holdings with the SEC for the first and third quarters of each fiscal year on Form N-Q. The Fund's Forms N-Q are available on the SEC's website at sec.gov. You may review and make copies at the SEC's Public Reference Room in Washington, D.C. Information on the operation of the Public Reference Room may be obtained by calling the SEC at 800-SEC-0330. You may also obtain copies without charge, upon request, by calling the Fund at 800-773-3863.
3. Tax Information
We are required to advise you within 60 days of the Fund's fiscal year-end regarding the federal tax status of certain distributions received by shareholders during each fiscal year. The following information is provided for the Fund's fiscal year ended May 31, 2018.
During the fiscal year ended May 31, 2018, the Fund paid no income or long-term capital gain distributions.
Dividend and distributions received by retirement plans such as IRAs, Keogh-type plans and 403(b) plans need not be reported as taxable income. However, many retirement plans may need this information for their annual information meeting.
4. Schedule of Shareholder Expenses
As a shareholder of the Fund, you incur two types of costs: (1) transaction costs, including reinvested dividends or other distributions; and (2) ongoing costs, including management fees; distribution [and/or service] (12b-1) fees; and other Fund expenses. This Example is intended to help you understand your ongoing costs (in dollars) of investing in the Fund and to compare these costs with the ongoing costs of investing in other mutual funds.
The Example is based on an investment of $1,000 invested at the beginning of the period and held for the entire period from December 1, 2017 through May 31, 2018.
Actual Expenses – The first line of the table below provides information about actual account values and actual expenses. You may use the information in this line, together with the amount you invested, to estimate the expenses that you paid over the period. Simply divide your account value by $1,000 (e.g., an $8,600 account value divided by $1,000 = 8.6), then multiply the result by the number in the first line under the heading entitled "Expenses Paid During Period" to estimate the expenses you paid on your account during this period.
Hypothetical Example for Comparison Purposes – The second line of the table below provides information about hypothetical account values and hypothetical expenses based on the Fund's actual expense ratio and an assumed rate of return of 5% per year before expenses, which is not the Fund's actual return. The hypothetical account values and expenses may not be used to estimate the actual ending account balance or expenses you paid for the period. You may use this information to compare the ongoing costs of investing in the Fund and other funds. To do so, compare this 5% hypothetical example with the 5% hypothetical examples that appear in the shareholder reports of the other funds.
Please note that the expenses shown in the table are meant to highlight your ongoing costs only and do not reflect any transactional costs, such as sales charges (loads), redemption fees, or exchange fees. Therefore, the second line of the table is useful in comparing ongoing costs only, and will not help you determine the relative total costs of owning different funds. In addition, if these transactional costs were included, your costs would have been higher.
(Continued)
Pursuant to the requirements of the Securities Exchange Act of 1934 and the Investment Company Act of 1940, the registrant has duly caused this report to be signed on its behalf by the undersigned, thereunto duly authorized.
Pursuant to the requirements of the Securities Exchange Act of 1934 and the Investment Company Act of 1940, this report has been signed below by the following persons on behalf of the registrant and in the capacities and on the dates indicated.