UNITED STATES
SECURITIES AND EXCHANGE COMMISSION
Washington, D.C. 20549
Form N-CSR
CERTIFIED SHAREHOLDER REPORT OF REGISTERED MANAGEMENT
INVESTMENT COMPANIES
Investment Company Act File Number 811-22321
MAINSTAY FUNDS TRUST
(Exact name of Registrant as specified in charter)
51 Madison Avenue, New York, NY 10010
(Address of principal executive offices) (Zip code)
J. Kevin Gao, Esq.
30 Hudson Street
Jersey City, New Jersey 07302
(Name and address of agent for service)
Registrant’s telephone number, including area code: (212) 576-7000
Date of fiscal year end: April 30
(MainStay CBRE Global Infrastructure Fund, MainStay CBRE Real Estate Fund, MainStay Conservative ETF Allocation Fund, MainStay Defensive ETF Allocation Fund, MainStay Equity ETF Allocation Fund, MainStay Growth ETF Allocation Fund, MainStay Moderate ETF Allocation Fund, MainStay ESG Multi-Asset Allocation Fund, MainStay MacKay Strategic Municipal Allocation Fund and MainStay MacKay Short Term Municipal Fund)
Date of reporting period: April 30, 2022
FORM N-CSR
The information presented in this Form N-CSR relates solely to the MainStay CBRE Global Infrastructure Fund, MainStay CBRE Real Estate Fund, MainStay Conservative ETF Allocation Fund, MainStay Defensive ETF Allocation Fund, MainStay Equity ETF Allocation Fund, MainStay Growth ETF Allocation Fund, MainStay Moderate ETF Allocation Fund, MainStay ESG Multi-Asset Allocation Fund, and MainStay MacKay Strategic Municipal Allocation Fund, each a series of the Registrant.
Item 1. Reports to Stockholders.
MainStay CBRE Global Infrastructure Fund
Message from the President and Annual ReportApril 30, 2022
Sign up for e-delivery of your shareholder reports. For full details on e-delivery, including who can participate and what you can receive via e-delivery,
please log in to newyorklifeinvestments.com/accounts.
| | | | Not Insured by Any Government Agency |
This page intentionally left blank
Message from the President
The 12-month reporting period ended April 30, 2022, started on a generally positive note. Despite a new wave of COVID-19 infections that disrupted life and commerce, financial markets were buoyed during the spring and summer of 2021 by economic recovery and the widespread availability of vaccines. Most global economies expanded, exceeding pre-pandemic levels, as businesses reopened and supportive government policies bore fruit. As the period progressed, however, inflation began to creep up in response to government stimulus and accommodative monetary policies. Rising prices were further aggravated by wage increases, pandemic-related supply-chain bottlenecks and commodity price spikes. Bond prices slid as interest rates rose, and equity markets faltered. Market sentiment turned increasingly negative in the first quarter of 2022 as aggressive Russian rhetoric regarding Ukraine culminated in Russia’s invasion of its neighbor – a development that exacerbated global inflationary pressures while increasing investor uncertainty. Domestic supply shortages, international trade imbalances and rising inflation caused U.S. GDP (gross domestic product) to contract for the first time since the height of the pandemic, although consumer spending, a primary driver of U.S. economic growth, remained strong. Prices for petroleum surged to multi-year highs, while many key agricultural chemicals and industrial metals reached record territory.
Despite the market decline that greeted the first four months of 2022, the S&P 500® Index, a widely regarded benchmark of market performance, remained in modestly positive territory for the 12-month reporting period. Some market sectors benefited from the prevailing conditions, with energy stocks soaring and value-oriented shares broadly gaining ground. In addition to energy, leading sectors included utilities and consumer staples. On the other hand, the information technology, financials and consumer discretionary sectors were subject to particularly sharp losses. Small- and mid-cap stocks underperformed, as they often do during times of heightened uncertainty and financial stress. International stocks trended lower, with some emerging markets,
including Russia and China, suffering particularly steep losses, while others, such as India and Indonesia, gained ground. Fixed-income markets saw most bond prices fall as central banks contemplated significant interest rate rises to combat higher-than-previously-expected inflation rates late in the reporting period. However, floating-rate instruments, which feature variable interest rates that allow investors to benefit from a rising rate environment, bucked the downward trend.
Today, despite the continuing impact of COVID-19, most of the world appears intent on a return to post-pandemic normalcy. Instead, the focus of global political and economic attention has increasingly turned to the war in Ukraine and the impact of rising inflation. Together, Russia and Ukraine account for a substantial share of the world’s supply of food, fossil fuels and raw materials production. Accordingly, the timing and outcome of this conflict will undoubtedly play a major role in global economic developments over the coming months and, possibly, years. The actions of central banks, as they raise rates to fight inflation while trying to limit the risks of recession, are likely to further affect global markets and economies.
As a MainStay investor, you can depend on us to carefully watch developments that may affect your Fund, taking considered and appropriate action to help you stay on financial track in the midst of uncertain times. As always, we remain dedicated to providing you with the disciplined investment tools you have come to expect from us over the years. Thank you for continuing to place your trust in our team.
Sincerely,
Kirk C. Lehneis
President
The opinions expressed are as of the date of this report and are subject to change. There is no guarantee that any forecast made will come to pass. This material does not constitute investment advice and is not intended as an endorsement of any specific investment. Past performance is no guarantee of future results.
Not part of the Annual Report
Investors should refer to the Fund’s Summary Prospectus and/or Prospectus and consider the Fund’s investment objectives, strategies, risks, charges and expenses carefully before investing. The Summary Prospectus and/or Prospectus contain this and other information about the Fund. You may obtain copies of the Fund’s Summary Prospectus, Prospectus and Statement of Additional Information, which includes information about MainStay Funds Trust's Trustees, free of charge, upon request, by calling toll-free 800-624-6782, by writing to NYLIFE Distributors LLC, Attn: MainStay Marketing Department, 30 Hudson Street, Jersey City, NJ 07302 or by sending an e-mail to MainStayShareholderServices@nylim.com. These documents are also available via the MainStay Funds’ website at newyorklifeinvestments.com. Please read the Fund’s Summary Prospectus and/or Prospectus carefully before investing.
Investment and Performance Comparison (Unaudited)
Performance data quoted represents past performance. Past performance is no guarantee of future results. Because of market volatility and other factors, current performance may be lower or higher than the figures shown. Investment return and principal value will fluctuate, and as a result, when shares are redeemed, they may be worth more or less than their original cost. The graph below depicts the historical performance of Class I shares of the Fund. Performance will vary from class to class based on differences in class-specific expenses and sales charges. For performance information current to the most recent month-end, please call 800-624-6782 or visit newyorklifeinvestments.com.
The performance table and graph do not reflect the deduction of taxes that a shareholder would pay on distributions or Fund share redemptions. Total returns reflect maximum applicable sales charges as indicated in the table below, if any, changes in share price, and reinvestment of dividend and capital gain distributions. The graph assumes the initial investment amount shown below and reflects the deduction of all sales charges that would have applied for the period of investment. Performance figures may reflect certain fee waivers and/or expense limitations, without which total returns may have been lower. For more information on share classes and current fee waivers and/or expense limitations (if any), please refer to the Notes to Financial Statements.
Average Annual Total Returns for the Year-Ended April 30, 2022 |
| | | | | | | |
| Maximum 5.5% Initial Sales Charge | | | | | | |
| | | | | | | |
| Maximum 5% Initial Sales Charge | | | | | | |
| | | | | | | |
| | | | | | | |
| if Redeemed Within One Year of Purchase | | | | | | |
| | | | | | | |
| | | | | | | |
| Effective at the close of business on February 21, 2020, the Fund changed its fiscal and tax year end from October 31 to April 30. |
| The gross expense ratios presented reflect the Fund’s “Total Annual Fund Operating Expenses” from the most recent Prospectus, as supplemented, and may differ from other expense ratios disclosed in this report. |
| Performance figures for Class A shares, Class C shares and Class I shares reflect the historical performance of the then-existing Class A shares, Class C shares and Class I shares, respectively, of the Voya CBRE Global Infrastructure Fund (the predecessor to the Fund, which was subject to a different fee structure) for periods prior to February 21, 2020. The MainStay CBRE Global Infrastructure Fund commenced operations on February 24, 2020. |
| Prior to June 30, 2020, the maximum initial sales charge was 5.5%, which is reflected in the applicable average annual total return figures shown. |
The footnotes on the next page are an integral part of the table and graph and should be carefully read in conjunction with them.
| | | |
FTSE Global Core Infrastructure 50/50 Index (Net)1 | | | |
Morningstar Infrastructure Category Average2 | | | |
| Returns for indices reflect no deductions for fees, expenses or taxes, except for foreign withholding taxes where applicable. |
| The FTSE Global Core Infrastructure 50/50 Index (Net) is the Fund’s primary broad-based securities market index for comparison purposes. The FTSE Global Core Infrastructure 50/50 Index (Net) gives participants an industry-defined interpretation of infrastructure and adjusts the exposure to certain infrastructure sub-sectors. Results assume reinvestment of all dividends and capital gains. An investment cannot be made directly in an index. |
| The Morningstar Infrastructure Category Average is representative of funds that invest more than 60% of their assets in stocks of companies engaged in infrastructure activities. Industries considered to be part of the infrastructure sector include: oil & gas midstream; waste management; airports; integrated shipping; railroads; shipping & ports; trucking; engineering & construction; infrastructure operations; and the utilities sector. Results are based on average total returns of similar funds with all dividends and capital gain distributions reinvested. |
The footnotes on the preceding page are an integral part of the table and graph and should be carefully read in conjunction with them.
| MainStay CBRE Global Infrastructure Fund |
Cost in Dollars of a $1,000 Investment in MainStay CBRE Global Infrastructure Fund (Unaudited)
The example below is intended to describe the fees and expenses borne by shareholders during the six-month period from November 1, 2021 to April 30, 2022, and the impact of those costs on your investment.
Example
As a shareholder of the Fund you incur two types of costs: (1) transaction costs, including exchange fees and sales charges (loads) on purchases (as applicable), and (2) ongoing costs, including management fees, distribution and/or service (12b-1) fees and other Fund expenses (as applicable). This example is intended to help you understand your ongoing costs (in dollars) of investing in the Fund and to compare these costs with the ongoing costs of investing in other mutual funds. The example is based on an investment of $1,000 made at the beginning of the six-month period and held for the entire period from November 1, 2021 to April 30, 2022.
This example illustrates your Fund’s ongoing costs in two ways:
Actual Expenses
The second and third data columns in the table below provide information about actual account values and actual expenses. You may use the information in these columns, together with the amount you invested, to estimate the expenses that you paid during the six months ended April 30, 2022. Simply divide your account value by $1,000 (for example, an
$8,600 account value divided by $1,000 = 8.6), then multiply the result by the number under the heading entitled “Expenses Paid During Period” to estimate the expenses you paid on your account during this period.
Hypothetical Example for Comparison Purposes
The fourth and fifth data columns in the table below provide information about hypothetical account values and hypothetical expenses based on the Fund’s actual expense ratio and an assumed rate of return of 5% per year before expenses, which is not the Fund’s actual return. The hypothetical account values and expenses may not be used to estimate the actual ending account balances or expenses you paid for the six-month period shown. You may use this information to compare the ongoing costs of investing in the Fund with the ongoing costs of investing in other mutual funds. To do so, compare this 5% hypothetical example with the 5% hypothetical examples that appear in the shareholder reports of the other mutual funds.
Please note that the expenses shown in the table are meant to highlight your ongoing costs only and do not reflect any transactional costs, such as exchange fees or sales charges (loads). Therefore, the fourth and fifth data columns of the table are useful in comparing ongoing costs only and will not help you determine the relative total costs of owning different funds. In addition, if these transactional costs were included, your costs would have been higher.
| Beginning
Account
Value
11/1/21 | Ending Account
Value (Based
on Actual
Returns and
Expenses)
4/30/22 | | Ending Account
Value (Based
on Hypothetical
5% Annualized
Return and
Actual Expenses)
4/30/22 | | |
| | | | | | |
| | | | | | |
| | | | | | |
| | | | | | |
| | | | | | |
| Expenses are equal to the Fund’s annualized expense ratio of each class multiplied by the average account value over the period, divided by 365 and multiplied by 181 (to reflect the six-month period). The table above represents the actual expenses incurred during the six-month period. In addition to the fees and expenses which the Fund bears directly, it also indirectly bears a pro rata share of the fees and expenses of the underlying funds in which it invests. Such indirect expenses are not included in the above-reported expense figures. |
| Expenses are equal to the Fund's annualized expense ratio to reflect the six-month period. |
Country Composition as of April 30, 2022 (Unaudited) | |
| |
| |
| |
| |
Other Assets, Less Liabilities | |
| |
See Portfolio of Investments beginning on page 11 for specific holdings within these categories. The Fund's holdings are subject to change.
Top Ten Holdings and/or Issuers Held as of April 30, 2022 (excluding short-term investments) (Unaudited)
| American Electric Power Co., Inc. |
| |
| |
| |
| |
| |
| Crown Castle International Corp. |
| |
| |
| |
| MainStay CBRE Global Infrastructure Fund |
Portfolio Management Discussion and Analysis (Unaudited)
Questions answered by portfolio managers Jeremy Anagnos, CFA, Joseph P. Smith, CFA, Daniel Foley, CFA, and Hinds Howard of CBRE Investment Management Listed Real Assets LLC.
How did MainStay CBRE Global Infrastructure Fund perform relative to its benchmark and peer group during the 12 months ended April 30, 2022?
For the 12 months ended April 30, 2022, Class I shares of MainStay CBRE Global Infrastructure Fund returned 4.19%, underperforming the 6.62% return of the Fund’s primary benchmark, the FTSE Global Core Infrastructure 50/50 Index (Net) (the “Index”). Over the same period, Class I shares outperformed the 3.29% return of the Morningstar Infrastructure Category Average.1
Were there any changes to the Fund during the reporting period?
Effective December 31, 2021, T. Ritson Ferguson no longer serves as a portfolio manager for the Fund.
What factors affected the Fund’s relative performance during the reporting period?
The Fund underperformed the Index primarily due to negative stock selection, while sector allocation proved neutral. The negative impact of stock selection was focused in the utilities and transportation sectors in Continental Europe. Concerns surrounding supply-chain issues for materials, as well as higher development costs, put pressure on European integrated utility holdings with large renewable development pipelines. Transportation stocks in the region were split into two broad categories: those viewed as likely merger and acquisition (“M&A”) candidates, which performed well, and the rest of the group, which proved vulnerable to continuing pandemic-related uncertainty – despite recovering fundamentals. The Fund held only one of the positions considered an M&A target and was underweight exposure to that name. Positive stock selection in the North American midstream, utilities and transportation sectors helped offset some of the negative performance in Europe. In particular, the Fund held overweight exposure to midstream stocks benefiting from natural gas exports, a theme that gained momentum as the energy crisis in Europe accelerated due to Russia’s war in Ukraine. Utility positioning benefited from avoiding expensive water utilities and holding overweight exposure to electric utilities where growth outlooks were stable. The Fund also benefited from positive stock selection in emerging markets, selling its relatively small positions in Grupo Aeroportuario del
Sureste Mexican airport and Chinese gas utility China Resources Gas Group at opportune times.
During the reporting period, which sectors and subsectors were the strongest positive contributors to the Fund’s relative performance and which sectors and subsectors were particularly weak?
The strongest positive contributions to the Fund’s performance relative to the Index came from the North American midstream and utilities sectors. (Contributions take weightings and total returns into account.) The midstream sector had the strongest positive return across all infrastructure sectors during the reporting period; the Fund’s positioning within the sector drove returns even higher. Midstream stocks benefited from improved capital decision-making across the energy complex, as companies favored balance sheet repair over new investment with their increased cash flows. The utility sector outperformed as well. The Fund benefited from strong positioning as it favored reasonably valued electric utilities with growth outlooks underpinned by improving regulation, while it avoided expensive water utilities and other utilities with deteriorating regulatory profiles.
As noted above, the weakest contributors to the Fund’s relative performance were the transportation and utilities sectors in Continental Europe. The Fund held significantly overweight exposure to integrated utilities with global renewable development pipelines. These stocks underperformed sharply based on concerns regarding supply-chain issues and cost inflation. Transportation stocks in the region remained volatile as their outlook was negatively affected by the various COVID-19 waves that led to travel restrictions, limiting their recovery.
During the reporting period, which individual stocks made the strongest positive contributions to the Fund’s absolute performance and which stocks detracted the most?
The holdings making the largest positive contributions to absolute performance during the reporting period included midstream company Cheniere Energy and diversified utility Exelon. Cheniere benefited from sharply rising global liquid natural gas prices that improved the outlook for the company’s assets. Exelon benefited from a positive regulatory outcome in Illinois that supported its non-carbon emitting nuclear power plants, as well as a spin-off of their nuclear business that unlocked the value of those assets.
1.
See page 5 for other share class returns, which may be higher or lower than Class I share returns. See page 6 for more information on benchmark and peer group returns.
The two stocks that detracted most from the Fund’s absolute performance were Italy-based utility Enel and U.S.-based utility The AES Corporation. Enel stock price was hurt by rising power prices and related political risk that threatened to undermine integrated utilities in Europe, in addition to fears of rising inflation and supply-chain disruptions taking a toll on returns from the company’s renewable development pipeline. AES, a global renewable developer, was also negatively affected as a result of concerns about renewable returns being compressed by inflation and rising competition.
What were some of the Fund’s largest purchases and sales during the reporting period?
The Fund’s largest purchases during the reporting period included new positions in WEC Energy Group and The Williams Companies. WEC, a Wisconsin based regulated utility operating in a supportive regulatory environment, has a highly regarded management team with a solid track record. We view it as a premium company trading in-line with the average utility. Oil & gas midstream player Williams stands to benefit from the positive outlook for natural gas demand globally, combined with an attractive relative valuation for the company.
The Fund’s largest sales during the reporting period included its entire positions in railroad company Kansas City Southern and in utility Alliant Energy. We sold the Fund’s holdings in Kansas City Southern following multiple rounds of bids from strategic buyers that left the company’s valuation less attractive and also raised concerns over the outlook for the business relative to market expectations in the wake of its acquisition. We sold the Fund’s position in Alliant Energy in light of the company’s emphasis on solar investment as part of its growth plan. Solar investment faces potential delays and tariffs from Asia, increasing Alliant’s risk profile.
How did the Fund’s subsector weightings change during the reporting period?
Relative to the FTSE Global Core Infrastructure 50/50 Index, the Fund increased its midstream sector exposure on an improved outlook and increased prices of Fund holdings. The Fund increased its U.S. utility exposure to benefit from attractive valuations of electric utilities with stable growth. The Fund also increased its transportation sector exposure in Europe and Asia, reflecting an improving outlook for air and toll road traffic, combined with attractive valuations. Conversely, the Fund reduced its exposure to European utilities due to rising political risk stemming from higher energy costs. Finally, the Fund reduced its UK water utility exposure as a result of less attractive valuations in the wake of strong performance.
How was the Fund positioned at the end of the reporting period?
As of April 30, 2022, the Fund remains positioned to benefit from long-term growth in renewable development, which translates into a preference for integrated utilities over regulated utilities. The Fund is also poised to benefit from exposure to long-term data growth through a preference for communications infrastructure exposure. Within transports, we prefer toll roads and rails over airport stocks. The Fund continues to hold underweight exposure to emerging markets due to ongoing regulatory and policy challenges that can lead to excessive volatility and negative returns.
The opinions expressed are those of the portfolio managers as of the date of this report and are subject to change. There is no guarantee that any forecasts will come to pass. This material does not constitute investment advice and is not intended as an endorsement of any specific investment.
| MainStay CBRE Global Infrastructure Fund |
Portfolio of Investments April 30, 2022†
| | |
|
|
Atlas Arteria Ltd. (Transportation) | | |
Aurizon Holdings Ltd. (Transportation) | | |
NEXTDC Ltd. (Communications) (a) | | |
Transurban Group (Transportation) | | |
| | |
|
Canadian National Railway Co. (Transportation) | | |
Enbridge, Inc. (Midstream / Pipelines) | | |
Pembina Pipeline Corp. (Midstream / Pipelines) | | |
| | |
|
Guangdong Investment Ltd. (Utilities) | | |
|
Eiffage SA (Transportation) | | |
| | |
Vinci SA (Transportation) | | |
| | |
|
Fraport AG Frankfurt Airport Services Worldwide (Transportation) (a) | | |
|
| | |
Infrastrutture Wireless Italiane SpA (Communications) | | |
Terna - Rete Elettrica Nazionale (Utilities) | | |
| | |
|
Central Japan Railway Co. (Transportation) | | |
West Japan Railway Co. (Transportation) | | |
| | |
|
Promotora y Operadora de Infraestructura SAB de CV (Transportation) | | |
| | |
|
|
Infratil Ltd. (Diversified) | | |
|
EDP - Energias de Portugal SA (Utilities) | | |
|
Aena SME SA (Transportation) (a) | | |
Cellnex Telecom SA (Communications) | | |
Ferrovial SA (Transportation) | | |
| | |
|
National Grid plc (Utilities) | | |
|
AES Corp. (The) (Utilities) | | |
| | |
American Electric Power Co., Inc. (Utilities) | | |
American Tower Corp. (Communications) | | |
Cheniere Energy, Inc. (Midstream / Pipelines) | | |
CMS Energy Corp. (Utilities) | | |
Constellation Energy Corp. (Utilities) | | |
Crown Castle International Corp. (Communications) | | |
Dominion Energy, Inc. (Utilities) | | |
| | |
FirstEnergy Corp. (Utilities) | | |
Legacy Reserves, Inc. (Midstream / Pipelines) (a)(b)(c)(d) | | |
Legacy Reserves, Inc. (Midstream / Pipelines) (a)(b)(c)(d) | | |
NextEra Energy, Inc. (Utilities) | | |
NiSource, Inc. (Utilities) | | |
Norfolk Southern Corp. (Transportation) | | |
OGE Energy Corp. (Utilities) | | |
ONEOK, Inc. (Midstream / Pipelines) | | |
| | |
Public Service Enterprise Group, Inc. (Utilities) | | |
Sempra Energy (Utilities) | | |
Southwest Gas Holdings, Inc. (Utilities) | | |
Targa Resources Corp. (Midstream / Pipelines) | | |
Union Pacific Corp. (Transportation) | | |
The notes to the financial statements are an integral part of, and should be read in conjunction with, the financial statements.
Portfolio of Investments April 30, 2022† (continued)
| | |
Common Stocks (continued) |
United States (continued) |
WEC Energy Group, Inc. (Utilities) | | |
Williams Cos., Inc. (The) (Midstream / Pipelines) | | |
| | |
Total Common Stocks
(Cost $1,558,487,493) | | |
Short-Term Investment 3.5% |
Affiliated Investment Company 3.5% |
|
MainStay U.S. Government Liquidity Fund, 0.397% (e) | | |
Total Short-Term Investment
(Cost $57,455,344) | | |
Total Investments
(Cost $1,615,942,837) | | |
Other Assets, Less Liabilities | | |
| | |
| Percentages indicated are based on Fund net assets. |
| Non-income producing security. |
| Fair valued security—Represents fair value as measured in good faith under procedures approved by the Board of Trustees. As of April 30, 2022, the total market value was $215,141, which represented less than one-tenth of a percent of the Fund’s net assets. |
| Illiquid security—As of April 30, 2022, the total market value deemed illiquid under procedures approved by the Board of Trustees was $215,141, which represented less than one-tenth of a percent of the Fund’s net assets.(Unaudited) |
| Security in which significant unobservable inputs (Level 3) were used in determining fair value. |
| Current yield as of April 30, 2022. |
Investments in Affiliates (in 000's)
Investments in issuers considered to be affiliate(s) of the Fund during the year ended April 30, 2022 for purposes of Section 2(a)(3) of the Investment Company Act of 1940, as amended, were as follows:
Affiliated Investment Companies | | | | Net
Realized
Gain/(Loss)
on Sales | Change in
Unrealized
Appreciation/
(Depreciation) | | | | |
MainStay U.S. Government Liquidity Fund | | | | | | | | | |
The notes to the financial statements are an integral part of, and should be read in conjunction with, the financial statements.
| MainStay CBRE Global Infrastructure Fund |
The following is a summary of the fair valuations according to the inputs used as of April 30, 2022, for valuing the Fund’s assets:
| Quoted
Prices in
Active
Markets for
Identical
Assets
(Level 1) | Significant
Other
Observable
Inputs
(Level 2) | Significant
Unobservable
Inputs
(Level 3) | |
| | | | |
Investments in Securities (a) | | | | |
| | | | |
| | | | |
| | | | |
| | | | |
| | | | |
| | | | |
| | | | |
| | | | |
| | | | |
| | | | |
| | | | |
| | | | |
| | | | |
| | | | |
Affiliated Investment Company | | | | |
Total Investments in Securities | | | | |
| For a complete listing of investments and their industries, see the Portfolio of Investments. |
The table below sets forth the diversification of the Fund’s investments by sector.
Sector Diversification
| | |
| | |
| | |
| | |
| | |
| | |
| | |
| | |
Other Assets, Less Liabilities | | |
| | |
| Percentages indicated are based on Portfolio net assets. |
The notes to the financial statements are an integral part of, and should be read in conjunction with, the financial statements.
Statement of Assets and Liabilities as of April 30, 2022
|
Investment in unaffiliated securities, at value
(identified cost $1,558,487,493) | |
Investment in affiliated investment companies, at value
(identified cost $57,455,344) | |
Cash denominated in foreign currencies
(identified cost $1,026,995) | |
| |
| |
Investment securities sold | |
| |
| |
| |
| |
|
| |
Investment securities purchased | |
| |
| |
| |
Transfer agent (See Note 3) | |
| |
NYLIFE Distributors (See Note 3) | |
| |
Shareholder communication | |
| |
| |
| |
| |
Composition of Net Assets |
Shares of beneficial interest outstanding (par value of $.001 per share) unlimited number of shares authorized | |
Additional paid-in-capital | |
| |
Total distributable earnings (loss) | |
| |
| |
Net assets applicable to outstanding shares | |
Shares of beneficial interest outstanding | |
Net asset value per share outstanding | |
Maximum sales charge (5.50% of offering price) | |
Maximum offering price per share outstanding | |
| |
Net assets applicable to outstanding shares | |
Shares of beneficial interest outstanding | |
Net asset value per share outstanding | |
Maximum sales charge (5.00% of offering price) | |
Maximum offering price per share outstanding | |
| |
Net assets applicable to outstanding shares | |
Shares of beneficial interest outstanding | |
Net asset value and offering price per share outstanding | |
| |
Net assets applicable to outstanding shares | |
Shares of beneficial interest outstanding | |
Net asset value and offering price per share outstanding | |
| |
Net assets applicable to outstanding shares | |
Shares of beneficial interest outstanding | |
Net asset value and offering price per share outstanding | |
The notes to the financial statements are an integral part of, and should be read in conjunction with, the financial statements.
| MainStay CBRE Global Infrastructure Fund |
Statement of Operations for the year ended April 30, 2022
|
| |
Dividends-unaffiliated (net of foreign tax withholding of $1,928,535) | |
| |
| |
| |
| |
| |
| |
Transfer agent (See Note 3) | |
Distribution/Service—Class A (See Note 3) | |
Distribution/Service—Investor Class (See Note 3) | |
Distribution/Service—Class C (See Note 3) | |
| |
| |
| |
Shareholder communication | |
| |
| |
Total expenses before waiver/reimbursement | |
Expense waiver/reimbursement from Manager (See Note 3) | |
| |
Net investment income (loss) | |
Realized and Unrealized Gain (Loss) |
Net realized gain (loss) on: | |
Unaffiliated investment transactions | |
Foreign currency transactions | |
| |
Net change in unrealized appreciation (depreciation) on: | |
| |
Translation of other assets and liabilities in foreign currencies | |
Net change in unrealized appreciation (depreciation) | |
Net realized and unrealized gain (loss) | |
Net increase (decrease) in net assets resulting from operations | |
The notes to the financial statements are an integral part of, and should be read in conjunction with, the financial statements.
Statements of Changes in Net Assets
for the years ended April 30, 2022 and April 30, 2021
| | |
Increase (Decrease) in Net Assets |
| | |
Net investment income (loss) | | |
| | |
Net change in unrealized appreciation (depreciation) | | |
Net increase (decrease) in net assets resulting from operations | | |
Distributions to shareholders: | | |
| | |
| | |
| | |
| | |
| | |
Total distributions to shareholders | | |
Capital share transactions: | | |
Net proceeds from sales of shares | | |
Net asset value of shares issued in connection with the acquisition of MainStay Cushing Energy Income Fund | | |
Net asset value of shares issued in connection with the acquisition of MainStay Cushing Renaissance Advantage Fund | | |
Net asset value of shares issued to shareholders in reinvestment of distributions | | |
| | |
Increase (decrease) in net assets derived from capital share transactions | | |
Net increase (decrease) in net assets | | |
|
| | |
| | |
The notes to the financial statements are an integral part of, and should be read in conjunction with, the financial statements.
| MainStay CBRE Global Infrastructure Fund |
Financial Highlights selected per share data and ratios
| | November 1,
2019
through
April 30, | |
| | | | | | |
Net asset value at beginning of period | | | | | | |
Net investment income (loss) | | | | | | |
Net realized and unrealized gain (loss) | | | | | | |
Total from investment operations | | | | | | |
| | | | | | |
From net investment income | | | | | | |
From net realized gain on investments | | | | | | |
| | | | | | |
| | | | | | |
Net asset value at end of period | | | | | | |
Total investment return (b) | | | | | | |
Ratios (to average net assets)/Supplemental Data: | | | | | | |
Net investment income (loss) | | | | | | |
| | | | | | |
Expenses (before waiver/reimbursement) | | | | | | |
| | | | | | |
Net assets at end of period (in 000's) | | | | | | |
| The Fund changed its fiscal year end from October 31 to April 30. |
| |
| Per share data based on average shares outstanding during the period. |
| Total investment return is calculated exclusive of sales charges and assumes the reinvestment of dividends and distributions. For periods of less than one year, total return is not annualized. |
| In addition to the fees and expenses which the Fund bears directly, it also indirectly bears a pro-rata share of the fees and expenses of the underlying funds in which it invests. Such indirect expenses are not included in the above expense ratios. |
| Net of interest expense of less than 0.01%. |
The notes to the financial statements are an integral part of, and should be read in conjunction with, the financial statements.
Financial Highlights selected per share data and ratios
| | February 24, 2020^ through
April 30, |
| | | |
Net asset value at beginning of period | | | |
Net investment income (loss) (a) | | | |
Net realized and unrealized gain (loss) | | | |
Total from investment operations | | | |
| | | |
From net investment income | | | |
| | | |
| | | |
Net asset value at end of period | | | |
Total investment return (b) | | | |
Ratios (to average net assets)/Supplemental Data: | | | |
Net investment income (loss) | | | |
| | | |
Expenses (before waiver/reimbursement) (c) | | | |
| | | |
Net assets at end of period (in 000's) | | | |
| |
| Less than one cent per share. |
| |
| Per share data based on average shares outstanding during the period. |
| Total investment return is calculated exclusive of sales charges and assumes the reinvestment of dividends and distributions. For periods of less than one year, total return is not annualized. |
| In addition to the fees and expenses which the Fund bears directly, it also indirectly bears a pro-rata share of the fees and expenses of the underlying funds in which it invests. Such indirect expenses are not included in the above expense ratios. |
The notes to the financial statements are an integral part of, and should be read in conjunction with, the financial statements.
| MainStay CBRE Global Infrastructure Fund |
Financial Highlights selected per share data and ratios
| | November 1,
2019
through
April 30,
| February 28,
2019^
through
October 31, |
| | | |
Net asset value at beginning of period | | | | |
Net investment income (loss) (a) | | | | |
Net realized and unrealized gain (loss) | | | | |
Total from investment operations | | | | |
| | | | |
From net investment income | | | | |
From net realized gain on investments | | | | |
| | | | |
| | | | |
Net asset value at end of period | | | | |
Total investment return (b) | | | | |
Ratios (to average net assets)/Supplemental Data: | | | | |
Net investment income (loss) | | | | |
| | | | |
Expenses (before waiver/reimbursement) | | | | |
| | | | |
Net assets at end of period (in 000’s) | | | | |
| The Fund changed its fiscal year end from October 31 to April 30. |
| |
| |
| Per share data based on average shares outstanding during the period. |
| Total investment return is calculated exclusive of sales charges and assumes the reinvestment of dividends and distributions. For periods of less than one year, total return is not annualized. |
| In addition to the fees and expenses which the Fund bears directly, it also indirectly bears a pro-rata share of the fees and expenses of the underlying funds in which it invests. Such indirect expenses are not included in the above expense ratios. |
| Net of interest expense of less than 0.01%. |
The notes to the financial statements are an integral part of, and should be read in conjunction with, the financial statements.
Financial Highlights selected per share data and ratios
| | November 1,
2019
through
April 30,
| |
| | | | | |
Net asset value at beginning of period | | | | | | |
Net investment income (loss) | | | | | | |
Net realized and unrealized gain (loss) | | | | | | |
Total from investment operations | | | | | | |
| | | | | | |
From net investment income | | | | | | |
From net realized gain on investments | | | | | | |
| | | | | | |
| | | | | | |
Net asset value at end of period | | | | | | |
Total investment return (b) | | | | | | |
Ratios (to average net assets)/Supplemental Data: | | | | | | |
Net investment income (loss) | | | | | | |
| | | | | | |
Expenses (before waiver/reimbursement) | | | | | | |
| | | | | | |
Net assets at end of period (in 000's) | | | | | | |
| The Fund changed its fiscal year end from October 31 to April 30. |
| |
| Per share data based on average shares outstanding during the period. |
| Total investment return is calculated exclusive of sales charges and assumes the reinvestment of dividends and distributions. Class I shares are not subject to sales charges. For periods of less than one year, total return is not annualized. |
| In addition to the fees and expenses which the Fund bears directly, it also indirectly bears a pro-rata share of the fees and expenses of the underlying funds in which it invests. Such indirect expenses are not included in the above expense ratios. |
| Net of interest expense of less than 0.01%. |
The notes to the financial statements are an integral part of, and should be read in conjunction with, the financial statements.
| MainStay CBRE Global Infrastructure Fund |
Financial Highlights selected per share data and ratios
| | February 24, 2020^ through
April 30, |
| | | |
Net asset value at beginning of period | | | |
Net investment income (loss) (a) | | | |
Net realized and unrealized gain (loss) | | | |
Total from investment operations | | | |
| | | |
From net investment income | | | |
| | | |
| | | |
Net asset value at end of period | | | |
Total investment return (b) | | | |
Ratios (to average net assets)/Supplemental Data: | | | |
Net investment income (loss) | | | |
| | | |
Expenses (before waiver/reimbursement) (c) | | | |
| | | |
Net assets at end of period (in 000's) | | | |
| |
| |
| Per share data based on average shares outstanding during the period. |
| Total investment return is calculated exclusive of sales charges and assumes the reinvestment of dividends and distributions. Class R6 shares are not subject to sales charges. For periods of less than one year, total return is not annualized. |
| In addition to the fees and expenses which the Fund bears directly, it also indirectly bears a pro-rata share of the fees and expenses of the underlying funds in which it invests. Such indirect expenses are not included in the above expense ratios. |
The notes to the financial statements are an integral part of, and should be read in conjunction with, the financial statements.
Notes to Financial Statements
Note 1-Organization and Business
MainStay Funds Trust (the “Trust”) was organized as a Delaware statutory trust on April 28, 2009. The Trust is registered under the Investment Company Act of 1940, as amended (the “1940 Act”), as an open-end management investment company, and is comprised of thirty-three funds (collectively referred to as the “Funds”). These financial statements and notes relate to the MainStay CBRE Global Infrastructure Fund (the "Fund"), a “diversified” fund, as that term is defined in the 1940 Act, as interpreted or modified by regulatory authorities having jurisdiction, from time to time.
The following table lists the Fund's share classes that have been registered and commenced operations:
| SIMPLE Class shares were registered for sale effective as of August 31, 2020 but have not yet commenced operations. |
Class A and Investor Class shares are offered at net asset value (“NAV”) per share plus an initial sales charge. No initial sales charge applies to investments of $1 million or more (and certain other qualified purchases) in Class A and Investor Class shares. However, a contingent deferred sales charge (“CDSC”) of 1.00% may be imposed on certain redemptions made within 18 months of the date of purchase on shares that were purchased without an initial sales charge. Class C shares are offered at NAV without an initial sales charge, although a 1.00% CDSC may be imposed on certain redemptions of such shares made within one year of the date of purchase of Class C shares. Class I and Class R6 shares are offered at NAV without a sales charge. SIMPLE Class shares are expected to be offered at NAV without a sales charge if such shares are offered in the future. In addition, depending upon eligibility, Class C shares convert to either Class A or Investor Class shares at the end of the calendar quarter eight years after the date they were purchased. Additionally, Investor Class shares may convert automatically to Class A shares. Under certain circumstances and as may be permitted by the Trust’s multiple class plan pursuant to Rule 18f-3 under the 1940 Act, specified share classes of the Fund may be converted to one or more other share classes of the Fund as disclosed in the capital share transactions within these Notes. The classes of shares have the same voting (except for issues that relate solely to one class), dividend, liquidation and other rights, and the same terms and conditions, except that under distribution plans pursuant to Rule 12b-1 under the 1940 Act, Class C shares are subject to higher distribution and/or service fees than Class A, Investor Class and SIMPLE Class shares. Class I and Class R6 shares are not subject to a distribution and/or service fee.
The Fund's investment objective is to seek total return.
Note 2–Significant Accounting Policies
The Fund is an investment company and accordingly follows the investment company accounting and reporting guidance of the Financial Accounting Standards Board (“FASB”) Accounting Standards Codification Topic 946 Financial Services—Investment Companies. The Fund prepares its financial statements in accordance with generally accepted accounting principles (“GAAP”) in the United States of America and follows the significant accounting policies described below.
(A) Securities Valuation. Investments are usually valued as of the close of regular trading on the New York Stock Exchange (the "Exchange") (usually 4:00 p.m. Eastern time) on each day the Fund is open for business ("valuation date").
The Board of Trustees of the Trust (the "Board") adopted procedures establishing methodologies for the valuation of the Fund's securities and other assets and delegated the responsibility for valuation determinations under those procedures to the Valuation Committee of the Trust (the “Valuation Committee”). The procedures state that, subject to the oversight of the Board and unless otherwise noted, the responsibility for the day-to-day valuation of portfolio assets (including fair value measurements for the Fund's assets and liabilities) rests with New York Life Investment Management LLC (“New York Life Investments” or the "Manager"), aided to whatever extent necessary by the Subadvisor (as defined in Note 3(A)). To assess the appropriateness of security valuations, the Manager, the Subadvisor or the Fund's third-party service provider, who is subject to oversight by the Manager, regularly compares prior day prices, prices on comparable securities and the sale prices to the prior and current day prices and challenges prices with changes exceeding certain tolerance levels with third-party pricing services or broker sources.
The Board authorized the Valuation Committee to appoint a Valuation Subcommittee (the “Subcommittee”) to establish the prices of securities for which market quotations are not readily available or the prices of which are not otherwise readily determinable under the procedures. The Subcommittee meets (in person, via electronic mail or via teleconference) on an as-needed basis. The Valuation Committee meets to ensure that actions taken by the Subcommittee were appropriate.
For those securities valued through either a standardized fair valuation methodology or a fair valuation measurement, the Subcommittee deals with such valuation and the Valuation Committee reviews and affirms, if appropriate, the reasonableness of the valuation based on such methodologies and measurements on a regular basis after considering information that is reasonably available and deemed relevant by the Valuation Committee. Any action taken by the Subcommittee with respect to the valuation of a portfolio security or other asset is submitted for review and ratification (if appropriate) to the Valuation Committee and the Board at the next regularly scheduled meeting.
"Fair value" is defined as the price the Fund would reasonably expect to receive upon selling an asset or liability in an orderly transaction to an independent buyer in the principal or most advantageous market for the
| MainStay CBRE Global Infrastructure Fund |
asset or liability. Fair value measurements are determined within a framework that establishes a three-tier hierarchy that maximizes the use of observable market data and minimizes the use of unobservable inputs to establish a classification of fair value measurements for disclosure purposes. "Inputs" refer broadly to the assumptions that market participants would use in pricing the asset or liability, including assumptions about risk, such as the risk inherent in a particular valuation technique used to measure fair value using a pricing model and/or the risk inherent in the inputs for the valuation technique. Inputs may be observable or unobservable. Observable inputs reflect the assumptions market participants would use in pricing the asset or liability based on market data obtained from sources independent of the Fund. Unobservable inputs reflect the Fund’s own assumptions about the assumptions market participants would use in pricing the asset or liability based on the information available. The inputs or methodology used for valuing assets or liabilities may not be an indication of the risks associated with investing in those assets or liabilities. The three-tier hierarchy of inputs is summarized below.
• Level 1—quoted prices in active markets for an identical asset or liability
• Level 2—other significant observable inputs (including quoted prices for a similar asset or liability in active markets, interest rates and yield curves, prepayment speeds, credit risk, etc.)
• Level 3—significant unobservable inputs (including the Fund's own assumptions about the assumptions that market participants would use in measuring fair value of an asset or liability)
The level of an asset or liability within the fair value hierarchy is based on the lowest level of an input, both individually and in the aggregate, that is significant to the fair value measurement. The aggregate value by input level of the Fund’s assets and liabilities as of April 30, 2022, is included at the end of the Portfolio of Investments.
The Fund may use third-party vendor evaluations, whose prices may be derived from one or more of the following standard inputs, among others:
| |
| • Reference data (corporate actions or material event notices) |
| • Monthly payment information |
• Industry and economic events | |
An asset or liability for which market values cannot be measured using the methodologies described above is valued by methods deemed reasonable in good faith by the Valuation Committee, following the procedures established by the Board, to represent fair value. Under these procedures, the Fund generally uses a market-based approach which may use related or comparable assets or liabilities, recent transactions, market multiples, book values and other relevant information. The Fund may also use an income-based valuation approach in which the anticipated future cash flows of the asset or liability are discounted to calculate fair value. Discounts may also be applied due to the nature
and/or duration of any restrictions on the disposition of the asset or liability. Fair value represents a good faith approximation of the value of a security. Fair value determinations involve the consideration of a number of subjective factors, an analysis of applicable facts and circumstances and the exercise of judgment. As a result, it is possible that the fair value for a security determined in good faith in accordance with the Fund's valuation procedures may differ from valuations for the same security determined by other funds using their own valuation procedures. Although the Fund's valuation procedures are designed to value a security at the price the Fund may reasonably expect to receive upon the security's sale in an orderly transaction, there can be no assurance that any fair value determination thereunder would, in fact, approximate the amount that the Fund would actually realize upon the sale of the security or the price at which the security would trade if a reliable market price were readily available. During the year ended April 30, 2022, there were no material changes to the fair value methodologies.
Securities which may be valued in this manner include, but are not limited to: (i) a security for which trading has been halted or suspended; (ii) a debt security that has recently gone into default and for which there is not a current market quotation; (iii) a security of an issuer that has entered into a restructuring; (iv) a security that has been delisted from a national exchange; (v) a security for which the market price is not readily available from a third-party pricing source or, if so provided, does not, in the opinion of the Manager or the Subadvisor, reflect the security's market value; (vi) a security subject to trading collars for which no or limited trading takes place; and (vii) a security whose principal market has been temporarily closed at a time when, under normal conditions, it would be open. Securities valued in this manner are generally categorized as Level 3 in the hierarchy. Securities that were fair valued in such a manner as of April 30, 2022, are shown in the Portfolio of Investments.
Certain securities held by the Fund may principally trade in foreign markets. Events may occur between the time the foreign markets close and the time at which the Fund's NAVs are calculated. These events may include, but are not limited to, situations relating to a single issuer in a market sector, significant fluctuations in U.S. or foreign markets, natural disasters, armed conflicts, governmental actions or other developments not tied directly to the securities markets. Should the Manager or the Subadvisor conclude that such events may have affected the accuracy of the last price of such securities reported on the local foreign market, the Subcommittee may, pursuant to procedures adopted by the Board, adjust the value of the local price to reflect the estimated impact on the price of such securities as a result of such events. In this instance, securities are generally categorized as Level 3 in the hierarchy. Additionally, certain foreign equity securities are also fair valued whenever the movement of a particular index exceeds certain thresholds. In such cases, the securities are fair valued by applying factors provided by a third-party vendor in accordance with valuation procedures adopted by the Board and are generally categorized as Level 2 in the hierarchy. Securities that were fair valued in such a manner as of April 30, 2022, are shown in the Portfolio of Investments.
Notes to Financial Statements (continued)
If the principal market of certain foreign equity securities is closed in observance of a local foreign holiday, these securities are valued using the last closing price of regular trading on the relevant exchange and fair valued by applying factors provided by a third-party vendor in accordance with valuation procedures adopted by the Board. These securities are generally categorized as Level 2 in the hierarchy. Securities that were fair valued in such a manner as of April 30, 2022, are shown in the Portfolio of Investments.
Equity securities are valued at the last quoted sales prices as of the close of regular trading on the relevant exchange on each valuation date. Securities that are not traded on the valuation date are valued at the mean of the last quoted bid and ask prices. Prices are normally taken from the principal market in which each security trades. These securities are generally categorized as Level 1 in the hierarchy.
Investments in mutual funds, including money market funds, are valued at their respective NAVs at the close of business each day on the valuation date. These securities are generally categorized as Level 1 in the hierarchy.
Temporary cash investments acquired in excess of 60 days to maturity at the time of purchase are valued using the latest bid prices or using valuations based on a matrix system (which considers such factors as security prices, yields, maturities and ratings), both as furnished by independent pricing services. Temporary cash investments that mature in 60 days or less at the time of purchase ("Short-Term Investments") are valued using the amortized cost method of valuation, unless the use of such method would be inappropriate. The amortized cost method involves valuing a security at its cost on the date of purchase and thereafter assuming a constant amortization to maturity of the difference between such cost and the value on maturity date. Amortized cost approximates the current fair value of a security. Securities valued using the amortized cost method are not valued using quoted prices in an active market and are generally categorized as Level 2 in the hierarchy.
The information above is not intended to reflect an exhaustive list of the methodologies that may be used to value portfolio investments. The valuation procedures permit the use of a variety of valuation methodologies in connection with valuing portfolio investments. The methodology used for a specific type of investment may vary based on the market data available or other considerations. The methodologies summarized above may not represent the specific means by which portfolio investments are valued on any particular business day.
A portfolio investment may be classified as an illiquid investment under the Trust's written liquidity risk management program and related procedures (“Liquidity Program”). Illiquidity of an investment might prevent the sale of such investment at a time when the Manager or the Subadvisor might wish to sell, and these investments could have the effect of decreasing the overall level of the Fund's liquidity. Further, the lack of an established secondary market may make it more difficult to value illiquid investments, requiring the Fund to rely on judgments that may be somewhat subjective in measuring value, which could vary materially from the amount that the Fund could realize upon disposition.
Difficulty in selling illiquid investments may result in a loss or may be costly to the Fund. An illiquid investment is any investment that the Manager or Subadvisor reasonably expects cannot be sold or disposed of in current market conditions in seven calendar days or less without the sale or disposition significantly changing the market value of the investment. The liquidity classification of each investment will be made using information obtained after reasonable inquiry and taking into account, among other things, relevant market, trading and investment-specific considerations in accordance with the Liquidity Program. Illiquid investments are often valued in accordance with methods deemed by the Board in good faith to be reasonable and appropriate to accurately reflect their fair value. The liquidity of the Fund's investments was determined as of April 30, 2022, and can change at any time. Illiquid investments as of April 30, 2022, are shown in the Portfolio of Investments.
(B) Income Taxes. The Fund's policy is to comply with the requirements of the Internal Revenue Code of 1986, as amended (the “Internal Revenue Code”), applicable to regulated investment companies and to distribute all of its taxable income to the shareholders of the Fund within the allowable time limits.
The Manager evaluates the Fund’s tax positions to determine if the tax positions taken meet the minimum recognition threshold in connection with accounting for uncertainties in income tax positions taken or expected to be taken for the purposes of measuring and recognizing tax liabilities in the financial statements. Recognition of tax benefits of an uncertain tax position is permitted only to the extent the position is “more likely than not” to be sustained assuming examination by taxing authorities. The Manager analyzed the Fund's tax positions taken on federal, state and local income tax returns for all open tax years (for up to three tax years) and has concluded that no provisions for federal, state and local income tax are required in the Fund's financial statements. The Fund's federal, state and local income tax and federal excise tax returns for tax years for which the applicable statutes of limitations have not expired are subject to examination by the Internal Revenue Service and state and local departments of revenue.
(C) Foreign Taxes. The Fund may be subject to foreign taxes on income and other transaction-based taxes imposed by certain countries in which it invests. A portion of the taxes on gains on investments or currency purchases/repatriation may be reclaimable. The Fund will accrue such taxes and reclaims as applicable, based upon its current interpretation of tax rules and regulations that exist in the markets in which it invests.
The Fund may be subject to taxation on realized capital gains, repatriation proceeds and other transaction-based taxes imposed by certain countries in which it invests. The Fund will accrue such taxes as applicable based upon its current interpretation of tax rules and regulations that exist in the market in which it invests. Capital gains taxes relating to positions still held are reflected as a liability in the Statement of Assets and Liabilities, as well as an adjustment to the Fund's net unrealized appreciation (depreciation). Taxes related to capital gains realized, if any, are reflected
| MainStay CBRE Global Infrastructure Fund |
as part of net realized gain (loss) in the Statement of Operations. Changes in tax liabilities related to capital gains taxes on unrealized investment gains, if any, are reflected as part of the change in net unrealized appreciation (depreciation) on investments in the Statement of Operations. Transaction-based charges are generally assessed as a percentage of the transaction amount.
(D) Dividends and Distributions to Shareholders. Dividends and distributions are recorded on the ex-dividend date. The Fund intends to declare and pay dividends from net investment income, if any, at least quarterly and distributions from net realized capital and currency gains, if any, at least annually. Unless a shareholder elects otherwise, all dividends and distributions are reinvested at NAV in the same class of shares of the Fund. Dividends and distributions to shareholders are determined in accordance with federal income tax regulations and may differ from determinations using GAAP.
(E) Security Transactions and Investment Income. The Fund records security transactions on the trade date. Realized gains and losses on security transactions are determined using the identified cost method. Dividend income is recognized on the ex-dividend date, net of any foreign tax withheld at the source, and interest income is accrued as earned using the effective interest rate method. Distributions received from real estate investment trusts may be classified as dividends, capital gains and/or return of capital.
The Fund may also invest up to 25% of its net assets in master limited partnerships.
Investment income and realized and unrealized gains and losses on investments of the Fund are allocated pro rata to the separate classes of shares based upon their relative net assets on the date the income is earned or realized and unrealized gains and losses are incurred.
(F) Expenses. Expenses of the Trust are allocated to the individual Funds in proportion to the net assets of the respective Funds when the expenses are incurred, except where direct allocations of expenses can be made. Expenses (other than transfer agent expenses and fees incurred under the shareholder services plans and/or the distribution plans further discussed in Note 3(B)) are allocated to separate classes of shares pro rata based upon their relative net assets on the date the expenses are incurred. The expenses borne by the Fund, including those of related parties to the Fund, are shown in the Statement of Operations.
Additionally, the Fund may invest in mutual funds, which are subject to management fees and other fees that may cause the costs of investing in mutual funds to be greater than the costs of owning the underlying securities directly. These indirect expenses of mutual funds are not included in the amounts shown as expenses in the Statement of Operations or in the expense ratios included in the Financial Highlights.
(G) Use of Estimates. In preparing financial statements in conformity with GAAP, the Manager makes estimates and assumptions that affect the reported amounts and disclosures in the financial statements. Actual results could differ from those estimates and assumptions.
(H) Foreign Currency Transactions. The Fund's books and records are maintained in U.S. dollars. Prices of securities denominated in foreign currency amounts are translated into U.S. dollars at the mean between the buying and selling rates last quoted by any major U.S. bank at the following dates:
(i) market value of investment securities, other assets and liabilities— at the valuation date; and
(ii) purchases and sales of investment securities, income and expenses—at the date of such transactions.
The assets and liabilities that are denominated in foreign currency amounts are presented at the exchange rates and market values at the close of the period. The realized and unrealized changes in net assets arising from fluctuations in exchange rates and market prices of securities are not separately presented.
Net realized gain (loss) on foreign currency transactions represents net currency gains or losses realized as a result of differences between the amounts of securities sale proceeds or purchase cost, dividends, interest and withholding taxes as recorded on the Fund's books, and the U.S. dollar equivalent amount actually received or paid. Net currency gains or losses from valuing such foreign currency denominated assets and liabilities, other than investments at valuation date exchange rates, are reflected in unrealized foreign exchange gains or losses.
(I) Securities Lending. In order to realize additional income, the Fund may engage in securities lending, subject to the limitations set forth in the 1940 Act and relevant guidance by the staff of the Securities and Exchange Commission (“SEC”). If the Fund engages in securities lending, the Fund will lend through its custodian, JPMorgan Chase Bank, N.A., ("JPMorgan"), acting as securities lending agent on behalf of the Fund. Under the current arrangement, JPMorgan will manage the Fund's collateral in accordance with the securities lending agency agreement between the Fund and JPMorgan, and indemnify the Fund against counterparty risk. The loans will be collateralized by cash (which may be invested in a money market fund) and/or non-cash collateral (which may include U.S. Treasury securities and/or U.S. government agency securities issued or guaranteed by the United States government or its agencies or instrumentalities) at least equal at all times to the market value of the securities loaned. The Fund bears the risk of delay in recovery of, or loss of rights in, the securities loaned. The Fund may also record a realized gain or loss on securities deemed sold due to a borrower’s inability to return securities on loan. The Fund bears the risk of any loss on investment of cash collateral. The Fund will receive compensation for lending its securities in the form of fees or it will retain a portion of interest earned on the investment of any cash collateral. The Fund will also continue to receive interest and dividends on the securities loaned and any gain or loss in the market price of the securities loaned that may occur during the term of the loan will be for the account of the Fund. Income earned from securities lending activities, if any, is reflected in the Statement of Operations. As of April 30, 2022, the Fund did not have any portfolio securities on loan.
Notes to Financial Statements (continued)
(J) Foreign Securities Risk. The Fund invests in foreign securities, which carry certain risks that are in addition to the usual risks inherent in domestic securities. These risks include those resulting from currency fluctuations, future adverse political or economic developments and possible imposition of currency exchange blockages or other foreign governmental laws or restrictions. These risks are likely to be greater in emerging markets than in developed markets. The ability of issuers of debt securities held by the Fund to meet their obligations may be affected by, among other things, economic or political developments in a specific country, industry or region.
(K) Indemnifications. Under the Trust’s organizational documents, its officers and trustees are indemnified against certain liabilities that may arise out of performance of their duties to the Trust. Additionally, in the normal course of business, the Fund enters into contracts with third-party service providers that contain a variety of representations and warranties and that may provide general indemnifications. The Fund's maximum exposure under these arrangements is unknown, as this would involve future claims that may be made against the Fund that have not yet occurred. The Manager believes that the risk of loss in connection with these potential indemnification obligations is remote. However, there can be no assurance that material liabilities related to such obligations will not arise in the future, which could adversely impact the Fund.
Note 3–Fees and Related Party Transactions
(A) Manager and Subadvisor. New York Life Investments, a registered investment adviser and an indirect, wholly-owned subsidiary of New York Life Insurance Company ("New York Life"), serves as the Fund's Manager pursuant to an Amended and Restated Management Agreement ("Management Agreement"). The Manager provides offices, conducts clerical, recordkeeping and bookkeeping services and keeps most of the financial and accounting records required to be maintained by the Fund. Except for the portion of salaries and expenses that are the responsibility of the Fund, the Manager pays the salaries and expenses of all personnel affiliated with the Fund and certain operational expenses of the Fund. During a portion of the year ended April 30, 2022, the Fund reimbursed New York Life Investments in an amount equal to the portion of the compensation of the Chief Compliance Officer attributable to the Fund. CBRE Investment Management Listed Real Assets LLC ("CBRE" or the "Subadvisor"), a registered investment adviser, serves as Subadvisor to the Fund and is responsible for the day-to-day portfolio management of the Fund. Pursuant to the terms of a Subadvisory Agreement ("Subadvisory Agreement") between New York Life Investments and CBRE, New York Life Investments pays for the services of the Subadvisor.
Pursuant to the Management Agreement, the Fund pays the Manager a monthly fee for the services performed and the facilities furnished at an annual rate of 0.85% of the Fund's average daily net assets.
New York Life Investments has contractually agreed to waive fees and/or reimburse expenses so that Total Annual Fund Operating Expenses (excluding taxes, interest, litigation, extraordinary expenses, brokerage and other transaction expenses relating to the purchase or sale of
portfolio investments and acquired (underlying) fund fees and expenses) do not exceed the following percentages of average daily net assets: Class A, 1.33%; Investor Class, 1.45%; Class C, 2.08%; Class I, 0.97%; and Class R6, 0.95%. This agreement will remain in effect until August 31, 2022, and shall renew automatically for one-year terms unless New York Life Investments provides written notice of termination prior to the start of the next term or upon approval of the Board.
During the year ended April 30, 2022, New York Life Investments earned fees from the Fund in the amount of $7,733,788 and waived fees and/or reimbursed expenses, including the waiver/reimbursement of certain class specific expenses in the amount of $322,113 and paid the Subadvisor fees in the amount of $3,705,837.
JPMorgan provides sub-administration and sub-accounting services to the Fund pursuant to an agreement with New York Life Investments. These services include calculating the daily NAVs of the Fund, maintaining the general ledger and sub-ledger accounts for the calculation of the Fund's NAVs, and assisting New York Life Investments in conducting various aspects of the Fund's administrative operations. For providing these services to the Fund, JPMorgan is compensated by New York Life Investments.
Pursuant to an agreement between the Trust and New York Life Investments, New York Life Investments is responsible for providing or procuring certain regulatory reporting services for the Fund. The Fund will reimburse New York Life Investments for the actual costs incurred by New York Life Investments in connection with providing or procuring these services for the Fund.
(B) Distribution and Service Fees. The Trust, on behalf of the Fund, has entered into a distribution agreement with NYLIFE Distributors LLC (the “Distributor”), an affiliate of New York Life Investments. The Fund has adopted distribution plans (the “Plans”) in accordance with the provisions of Rule 12b-1 under the 1940 Act.
Pursuant to the Class A and Investor Class Plans, the Distributor receives a monthly fee from the Class A and Investor Class shares at an annual rate of 0.25% of the average daily net assets of the Class A and Investor Class shares for distribution and/or service activities as designated by the Distributor. Pursuant to the Class C Plan, Class C shares pay the Distributor a monthly distribution fee at an annual rate of 0.75% of the average daily net assets of the Class C shares, along with a service fee at an annual rate of 0.25% of the average daily net assets of the Class C shares, for a total 12b-1 fee of 1.00%. Class I and Class R6 shares are not subject to a distribution and/or service fee.
The Plans provide that the distribution and service fees are payable to the Distributor regardless of the amounts actually expended by the Distributor for distribution of the Fund's shares and service activities.
(C) Sales Charges. The Fund was advised by the Distributor that the amount of initial sales charges retained on sales of Class A and Investor Class shares during the year ended April 30, 2022, were $60,515 and $1,042, respectively.
| MainStay CBRE Global Infrastructure Fund |
The Fund was also advised that the Distributor retained CDSCs on redemptions of Class C shares during the year ended April 30, 2022, of $8,077.
(D) Transfer, Dividend Disbursing and Shareholder Servicing Agent. NYLIM Service Company LLC, an affiliate of New York Life Investments, is the Fund's transfer, dividend disbursing and shareholder servicing agent pursuant to an agreement between NYLIM Service Company LLC and the Trust. NYLIM Service Company LLC has entered into an agreement with DST Asset Manager Solutions, Inc. ("DST"), pursuant to which DST performs certain transfer agent services on behalf of NYLIM Service Company LLC. New York Life Investments has contractually agreed to limit the transfer agency expenses charged to the Fund’s share classes to a maximum of 0.35% of that share class’s average daily net assets on an annual basis after deducting any applicable Fund or class-level expense reimbursement or small account fees. This agreement will remain in effect until August 31, 2022, and shall renew automatically for one-year terms unless New York Life Investments provides written notice of termination prior to the start of the next term or upon approval of the Board. During the year ended April 30, 2022, transfer agent expenses incurred by the Fund and any reimbursements, pursuant to the aforementioned Transfer Agency expense limitation agreement, were as follows:
(E) Small Account Fee. Shareholders with small accounts adversely impact the cost of providing transfer agency services. In an effort to reduce total transfer agency expenses, the Fund has implemented a small account fee on certain types of accounts. As described in the Fund's prospectus, certain shareholders with an account balance of less than $1,000 ($5,000 for Class A share accounts) are charged an annual per account fee of $20 (assessed semi-annually), the proceeds from which offset transfer agent fees as reflected in the Statement of Operations. This small account fee will not apply to certain types of accounts as described further in the Fund’s prospectus.
(F) Capital. As of April 30, 2022, New York Life and its affiliates beneficially held shares of the Fund with the values and percentages of net assets as follows:
Note 4-Federal Income Tax
As of April 30, 2022, the cost and unrealized appreciation (depreciation) of the Fund’s investment portfolio, including applicable derivative contracts and other financial instruments, as determined on a federal income tax basis, were as follows:
| | Gross
Unrealized
Appreciation | Gross
Unrealized
(Depreciation) | Net
Unrealized
Appreciation/
(Depreciation) |
| | | | |
| Accumulated
Capital
and Other
Gain (Loss) | Other
Temporary
Differences | Unrealized
Appreciation
(Depreciation) | Total
Accumulated
Gain (Loss) |
| | | | |
The difference between book-basis and tax-basis unrealized appreciation (depreciation) is primarily due to wash sale adjustments and real estate investment trusts (REITs). The other temporary differences are primarily due to Swiss reclaim.
As of April 30, 2022, for federal income tax purposes, capital loss carryforwards of $210,581,712, as shown in the table below, were available to the extent provided by the regulations to offset future realized gains of the Fund. Accordingly, no capital gains distributions are expected to be paid to shareholders until net gains have been realized in excess of such amounts.
Capital Loss
Available Through | Short-Term
Capital Loss
Amounts (000’s) | Long-Term
Capital Loss
Amounts (000’s) |
| | |
The Fund utilized $5,272,880 of capital loss carryforwards during the year ended April 30, 2022. Availability of a certain amount of the loss carryforwards, which were acquired in a merger with MainStay Cushing Renaissance Advantage Fund and MainStay Cushing Energy Income Fund, may be limited in a given year under Section 381-384 of the Internal Revenue Code.
During the years ended April 30, 2022 and April 30, 2021, the tax character of distributions paid as reflected in the Statements of Changes in Net Assets was as follows:
Note 5–Custodian
JPMorgan is the custodian of cash and securities held by the Fund. Custodial fees are charged to the Fund based on the Fund's net assets and/or the market value of securities held by the Fund and the number of certain transactions incurred by the Fund.
Notes to Financial Statements (continued)
Note 6–Line of Credit
The Fund and certain other funds managed by New York Life Investments maintain a line of credit with a syndicate of banks in order to secure a source of funds for temporary purposes to meet unanticipated or excessive redemption requests.
Effective July 27, 2021, under the credit agreement (the “Credit Agreement”), the aggregate commitment amount is $600,000,000 with an additional uncommitted amount of $100,000,000. The commitment fee is an annual rate of 0.15% of the average commitment amount payable quarterly, regardless of usage, to JPMorgan, who serves as the agent to the syndicate. The commitment fee is allocated among the Fund and certain other funds managed by New York Life Investments based upon their respective net assets and other factors. Interest on any revolving credit loan is charged based upon the Federal Funds Rate or the one-month London Interbank Offered Rate (“LIBOR”), whichever is higher. The Credit Agreement expires on July 26, 2022, although the Fund, certain other funds managed by New York Life Investments and the syndicate of banks may renew the Credit Agreement for an additional year on the same or different terms or enter into a credit agreement with a different syndicate of banks. During the year ended April 30, 2022, there were no borrowings made or outstanding with respect to the Fund under the Credit Agreement.
Note 7–Interfund Lending Program
Pursuant to an exemptive order issued by the SEC, the Fund, along with certain other funds managed by New York Life Investments, may participate in an interfund lending program. The interfund lending program provides an alternative credit facility that permits the Fund and certain other funds managed by New York Life Investments to lend or borrow money for temporary purposes directly to or from one another, subject to the conditions of the exemptive order. During the year ended April 30, 2022, there were no interfund loans made or outstanding with respect to the Fund.
Note 8–Purchases and Sales of Securities (in 000’s)
During the year ended April 30, 2022, purchases and sales of securities, other than short-term securities, were $1,373,105 and $286,471, respectively.
Note 9–Capital Share Transactions
Transactions in capital shares for the years ended April 30, 2022 and April 30, 2021, were as follows:
| | |
Year ended April 30, 2022: | | |
| | |
Shares issued to shareholders in reinvestment of distributions | | |
| | |
Net increase (decrease) in shares outstanding before conversion | | |
Shares converted into Class A (See Note 1) | | |
Shares converted from Class A (See Note 1) | | |
| | |
Year ended April 30, 2021: | | |
| | |
Shares issued in connection with the acquisition of MainStay Cushing Energy Income Fund | | |
Shares issued in connection with the acquisition of MainStay Cushing Renaissance Advantage Fund | | |
Shares issued to shareholders in reinvestment of distributions | | |
| | |
Net increase (decrease) in shares outstanding before conversion | | |
Shares converted into Class A (See Note 1) | | |
| | |
|
| MainStay CBRE Global Infrastructure Fund |
| | |
Year ended April 30, 2022: | | |
| | |
Shares issued to shareholders in reinvestment of distributions | | |
| | |
Net increase (decrease) in shares outstanding before conversion | | |
Shares converted into Investor Class (See Note 1) | | |
Shares converted from Investor Class (See Note 1) | | |
| | |
Year ended April 30, 2021: | | |
| | |
Shares issued in connection with the acquisition of MainStay Cushing Energy Income Fund | | |
Shares issued in connection with the acquisition of MainStay Cushing Renaissance Advantage Fund | | |
Shares issued to shareholders in reinvestment of distributions | | |
| | |
Net increase (decrease) in shares outstanding before conversion | | |
Shares converted into Investor Class (See Note 1) | | |
Shares converted from Investor Class (See Note 1) | | |
| | |
|
| | |
Year ended April 30, 2022: | | |
| | |
Shares issued to shareholders in reinvestment of distributions | | |
| | |
Net increase (decrease) in shares outstanding before conversion | | |
Shares converted from Class C (See Note 1) | | |
| | |
Year ended April 30, 2021: | | |
| | |
Shares issued in connection with the acquisition of MainStay Cushing Energy Income Fund | | |
Shares issued in connection with the acquisition of MainStay Cushing Renaissance Advantage Fund | | |
Shares issued to shareholders in reinvestment of distributions | | |
| | |
Net increase (decrease) in shares outstanding before conversion | | |
Shares converted from Class C (See Note 1) | | |
| | |
|
| | |
Year ended April 30, 2022: | | |
| | |
Shares issued to shareholders in reinvestment of distributions | | |
| | |
Net increase (decrease) in shares outstanding before conversion | | |
Shares converted into Class I (See Note 1) | | |
| | |
Year ended April 30, 2021: | | |
| | |
Shares issued in connection with the acquisition of MainStay Cushing Energy Income Fund | | |
Shares issued in connection with the acquisition of MainStay Cushing Renaissance Advantage Fund | | |
Shares issued to shareholders in reinvestment of distributions | | |
| | |
| | |
|
Notes to Financial Statements (continued)
| | |
Year ended April 30, 2022: | | |
| | |
Shares issued to shareholders in reinvestment of distributions | | |
| | |
| | |
Year ended April 30, 2021: | | |
| | |
Shares issued to shareholders in reinvestment of distributions | | |
| | |
| | |
Note 10–Other Matters
An outbreak of COVID-19, first detected in December 2019, has developed into a global pandemic and has resulted in travel restrictions, closure of international borders, certain businesses and securities markets, restrictions on securities trading activities, prolonged quarantines, supply chain disruptions, and lower consumer demand, as well as general concern and uncertainty. The continued impact of COVID-19 and related variants is uncertain and could further adversely affect the global economy, national economies, individual issuers and capital markets in unforeseeable ways and result in a substantial and extended economic downturn. Developments that disrupt global economies and financial markets, such as COVID-19, may magnify factors that affect the Fund's performance.
Note 11–Subsequent Events
In connection with the preparation of the financial statements of the Fund as of and for the year ended April 30, 2022, events and transactions subsequent to April 30, 2022, through the date the financial statements were issued have been evaluated by the Manager for possible adjustment and/or disclosure. No subsequent events requiring financial statement adjustment or disclosure have been identified.
| MainStay CBRE Global Infrastructure Fund |
Report of Independent Registered Public Accounting Firm
To the Shareholders of the Fund and Board of Trustees
MainStay Funds Trust:
Opinion on the Financial Statements
We have audited the accompanying statement of assets and liabilities of MainStay CBRE Global Infrastructure Fund (the Fund), one of the funds constituting MainStay Funds Trust, including the portfolio of investments, as of April 30, 2022, the related statement of operations for the year then ended, the statements of changes in net assets for each of the years in the two year period then ended, and the related notes (collectively, the financial statements) and the financial highlights for each of the years in the two-year period ended April 30, 2022, the period November 1, 2019 or February 24, 2020 (commencement of operations, as applicable) through April 30, 2020, and each of the years or periods in the three-year period ended October 31, 2019. In our opinion, the financial statements and financial highlights present fairly, in all material respects, the financial position of the Fund as of April 30, 2022, the results of its operations for the year then ended, the changes in its net assets for each of the years in the two year period then ended, and the financial highlights for each of the years in the two-year period ended April 30, 2022, the period November 1, 2019 or February 24, 2020 (commencement of operations, as applicable) through April 30, 2020, and each of the years or periods in the three-year period ended October 31, 2019, in conformity with U.S. generally accepted accounting principles.
Basis for Opinion
These financial statements and financial highlights are the responsibility of the Fund's management. Our responsibility is to express an opinion on these financial statements and financial highlights based on our audits. We are a public accounting firm registered with the Public Company Accounting Oversight Board (United States) (PCAOB) and are required to be independent with respect to the Fund in accordance with the U.S. federal securities laws and the applicable rules and regulations of the Securities and Exchange Commission and the PCAOB.
We conducted our audits in accordance with the standards of the PCAOB. Those standards require that we plan and perform the audit to obtain reasonable assurance about whether the financial statements and financial highlights are free of material misstatement, whether due to error or fraud. Our audits included performing procedures to assess the risks of material misstatement of the financial statements and financial highlights, whether due to error or fraud, and performing procedures that respond to those risks. Such procedures included examining, on a test basis, evidence regarding the amounts and disclosures in the financial statements and financial highlights. Such procedures also included confirmation of securities owned as of April 30, 2022, by correspondence with custodians, the transfer agent, and brokers or by other appropriate auditing procedures when replies from brokers were not received. Our audits also included evaluating the accounting principles used and significant estimates made by management, as well as evaluating the overall presentation of the financial statements and financial highlights. We believe that our audits provide a reasonable basis for our opinion.
We have served as the auditor of one or more New York Life Investment Management investment companies since 2003.
Philadelphia, Pennsylvania
June 27, 2022
Board Consideration and Approval of Management Agreement and Subadvisory Agreement (Unaudited)
The continuation of the Management Agreement with respect to the MainStay CBRE Global Infrastructure Fund (“Fund”) and New York Life Investment Management LLC (“New York Life Investments”) and the Subadvisory Agreement between New York Life Investments and CBRE Investment Management Listed Real Assets LLC (“CBRE”) with respect to the Fund (together, “Advisory Agreements”), following an initial term of up to two years, is subject to annual review and approval by the Board of Trustees of MainStay Funds Trust (“Board” of the “Trust”) in accordance with Section 15 of the Investment Company Act of 1940, as amended (“1940 Act”). At its December 8–9, 2021 meeting, the Board, including the Trustees who are not an “interested person” (as such term is defined in the 1940 Act) of the Trust (“Independent Trustees”) voting separately, unanimously approved the continuation of each of the Advisory Agreements for a one-year period.
In reaching the decision to approve the continuation of each of the Advisory Agreements, the Board considered information and materials furnished by New York Life Investments and CBRE in connection with an annual contract review process undertaken by the Board that took place at meetings of the Board and its Contracts Committee during September 2021 through December 2021, including information and materials furnished by New York Life Investments and CBRE in response to requests prepared on behalf of the Board, and in consultation with the Independent Trustees, by independent legal counsel to the Independent Trustees, which encompassed a variety of topics, including those summarized below. Information and materials requested by and furnished to the Board for consideration in connection with the contract review process included, among other items, reports on the Fund and “peer funds” prepared by Institutional Shareholder Services Inc. (“ISS”), an independent third-party service provider engaged by the Board to report objectively on the Fund’s investment performance, management fee and total expenses. The Board also considered information on the fees charged to other investment advisory clients of New York Life Investments and/or CBRE that follow investment strategies similar to those of the Fund, if any, and, when applicable, the rationale for any differences in the Fund’s management and subadvisory fees and the fees charged to those other investment advisory clients. In addition, the Board considered information regarding the legal standards and fiduciary obligations applicable to its consideration of the continuation of each of the Advisory Agreements. The contract review process, including the structure and format for information and materials provided to the Board, has been developed in consultation with the Board. The Independent Trustees also met in executive sessions with their independent legal counsel and, for portions thereof, with senior management of New York Life Investments.
The Board’s deliberations with respect to the continuation of each of the Advisory Agreements reflect a year-long process, and the Board also took into account information furnished to the Board and its Committees throughout the year, as deemed relevant and appropriate by the Trustees, including, among other items, reports on investment performance of the Fund and investment-related matters for the Fund as well as presentations from New York Life Investments and CBRE personnel. In addition, the Board took into account other information received from New
York Life Investments throughout the year, including, among other items, periodic reports on legal and compliance matters, risk management, portfolio turnover, brokerage commissions and non-advisory services provided to the Fund by New York Life Investments, as deemed relevant and appropriate by the Trustees.
In addition to information provided to the Board throughout the year, the Board received information in connection with its June 2021 meeting provided specifically in response to requests prepared on behalf of the Board, and in consultation with the Independent Trustees, by independent legal counsel to the Independent Trustees regarding the Fund’s distribution arrangements. In addition, the Board received information regarding the Fund’s asset levels, share purchase and redemption activity and the payment of Rule 12b-1 and/or other fees by the applicable share classes of the Fund, among other information.
In considering the continuation of each of the Advisory Agreements, the Trustees reviewed and evaluated the information and factors they believed to reasonably be necessary and appropriate in light of legal advice furnished to them by independent legal counsel to the Independent Trustees and through the exercise of their own business judgment. Although individual Trustees may have weighed certain factors or information differently and the Board did not consider any single factor or information controlling in reaching its decision, the factors considered by the Board are described in greater detail below and include, among other factors: (i) the nature, extent and quality of the services provided to the Fund by New York Life Investments and CBRE; (ii) the qualifications of the portfolio managers of the Fund and the historical investment performance of the Fund, New York Life Investments and CBRE; (iii) the costs of the services provided, and profits realized, by New York Life Investments and CBRE with respect to their relationships with the Fund; (iv) the extent to which economies of scale have been realized or may be realized if the Fund grows and the extent to which economies of scale have benefited or may benefit the Fund’s shareholders; and (v) the reasonableness of the Fund’s management and subadvisory fees and total ordinary operating expenses. Although the Board recognized that comparisons between the Fund’s fees and expenses and those of other funds are imprecise given different terms of agreements, variations in fund strategies and other factors, the Board considered the reasonableness of the Fund’s management fee and total ordinary operating expenses as compared to the peer funds identified by ISS. Throughout their considerations, the Trustees acknowledged the commitment of New York Life Investments and its affiliates to serve the MainStay Group of Funds, as well as their capacity, experience, resources, financial stability and reputations. The Trustees also acknowledged the entrepreneurial and other risks assumed by New York Life Investments in sponsoring and managing the Fund.
The Trustees noted that, throughout the year, the Trustees are afforded an opportunity to ask questions of, and request additional information or materials from, New York Life Investments and CBRE. The Board’s decision with respect to each of the Advisory Agreements may have also been based, in part, on the Board’s knowledge of New York Life Investments and CBRE resulting from, among other things, the Board’s
| MainStay CBRE Global Infrastructure Fund |
consideration of each of the Advisory Agreements in prior years, the advisory agreements for other funds in the MainStay Group of Funds, the Board’s review throughout the year of the performance and operations of other funds in the MainStay Group of Funds and each Trustee’s business judgment and industry experience. In addition to considering the above-referenced factors, the Board observed that in the marketplace there are a range of investment options available to investors and that the Fund’s shareholders, having had the opportunity to consider other investment options, have chosen to invest in the Fund.
The factors that figured prominently in the Board’s decision to approve the continuation of each of the Advisory Agreements during its December 8–9, 2021 meeting are summarized in more detail below.
Nature, Extent and Quality of Services Provided by New York Life Investments and CBRE
The Board examined the nature, extent and quality of the services that New York Life Investments provides to the Fund. The Board evaluated New York Life Investments’ experience and capabilities in serving as manager of the Fund and considered that the Fund operates in a “manager-of-managers” structure. The Board also considered New York Life Investments’ responsibilities and services provided pursuant to this structure, including evaluating the performance of CBRE, making recommendations to the Board as to whether the Subadvisory Agreement should be renewed, modified or terminated and periodically reporting to the Board regarding the results of New York Life Investments’ evaluation and monitoring functions. The Board noted that New York Life Investments manages other mutual funds, serves a variety of other investment advisory clients, including other pooled investment vehicles, and has experience overseeing mutual fund service providers, including subadvisors. The Board considered the experience of senior personnel at New York Life Investments providing management and administrative and other non-advisory services to the Fund as well as New York Life Investments’ reputation and financial condition. The Board observed that New York Life Investments devotes significant resources and time to providing management and non-advisory services to the Fund, including New York Life Investments’ supervision and due diligence reviews of CBRE and ongoing analysis of, and interactions with, CBRE with respect to, among other things, the Fund’s investment performance and risks as well as CBRE’s investment capabilities and subadvisory services with respect to the Fund.
The Board also considered the range of services that New York Life Investments provides to the Fund under the terms of the Management Agreement, including: (i) fund accounting and ongoing supervisory services provided by New York Life Investments’ Fund Administration and Accounting Group; (ii) investment supervisory and analytical services provided by New York Life Investments’ Investment Consulting Group; (iii) compliance services provided by the Trust’s Chief Compliance Officer as well as New York Life Investments’ compliance department, including supervision and implementation of the Fund’s compliance program; (iv) legal services provided by New York Life Investments’ Office of the General Counsel; and (v) risk management monitoring and analysis by
compliance and investment personnel. The Board noted that New York Life Investments provides certain other non-advisory services to the Fund. In addition, the Board considered New York Life Investments’ willingness to invest in personnel and other resources, such as cyber security, information security and business continuity planning, designed to benefit the Fund and noted that New York Life Investments is responsible for compensating the Trust’s officers. The Board recognized that New York Life Investments has provided an increasingly broad array of non-advisory services to the MainStay Group of Funds as a result of regulatory and other developments. The Board considered benefits to the Fund’s shareholders from the Fund being part of the MainStay Group of Funds, including the privilege of exchanging investments between the same class of shares of funds in the MainStay Group of Funds, including without the imposition of a sales charge (if any).
The Board also examined the range, and the nature, extent and quality, of the investment advisory services that CBRE provides to the Fund and considered the terms of each of the Advisory Agreements. The Board evaluated CBRE’s experience and performance in serving as subadvisor to the Fund and advising other portfolios and CBRE’s track record and experience in providing investment advisory services, the experience of investment advisory, senior management and administrative personnel at CBRE and New York Life Investments’ and CBRE’s overall resources, legal and compliance environment, capabilities, reputation and history. In addition to information provided in connection with quarterly meetings with the Trust’s Chief Compliance Officer, the Board considered information regarding the compliance policies and procedures of New York Life Investments and CBRE and acknowledged their commitment to further developing and strengthening compliance programs relating to the Fund. The Board reviewed CBRE’s ability to attract and retain qualified investment professionals and willingness to invest in personnel to service and support the Fund. In this regard, the Board considered the qualifications and experience of the Fund’s portfolio managers, the number of accounts managed by the portfolio managers and the method for compensating the portfolio managers.
In addition, the Board considered information provided by New York Life Investments and CBRE regarding the operations of their respective business continuity plans in response to the ongoing COVID-19 pandemic, including the remote working environment.
Based on these considerations, the Board concluded that the Fund would likely continue to benefit from the nature, extent and quality of these services.
Investment Performance
In evaluating the Fund’s investment performance, the Board considered investment performance results over various periods in light of the Fund’s investment objective, strategies and risks. The Board considered investment reports on, and analysis of, the Fund’s performance provided to the Board throughout the year. These reports include, among other items, information on the Fund’s gross and net returns, the Fund’s investment performance compared to relevant investment categories and
Board Consideration and Approval of Management Agreement and Subadvisory Agreement (Unaudited) (continued)
the Fund’s benchmark, the Fund’s risk-adjusted investment performance and the Fund’s investment performance as compared to peer funds, as appropriate, as well as portfolio attribution information and commentary on the effect of market conditions. The Board also considered information provided by ISS showing the investment performance of the Fund as compared to peer funds.
The Board also gave weight to its discussions with senior management at New York Life Investments concerning the Fund’s investment performance attributable to CBRE as well as discussions between the Fund’s portfolio management team and the members of the Board’s Investment Committee, which generally occur on an annual basis. In addition, the Board considered any specific actions that New York Life Investments or CBRE had taken, or had agreed to take, to seek to enhance Fund investment performance and the results of those actions.
Based on these considerations, the Board concluded that its review of the Fund’s investment performance and related information supported a determination to approve the continuation of each of the Advisory Agreements.
Costs of the Services Provided, and Profits Realized, by New York Life Investments and CBRE
The Board considered the costs of the services provided under each of the Advisory Agreements. The Board also considered the profits realized by New York Life Investments and its affiliates and CBRE due to their relationships with the Fund. The Board considered that CBRE’s subadvisory fee had been negotiated at arm’s-length by New York Life Investments and that this fee is paid by New York Life Investments, not the Fund, and the relevance of CBRE’s profitability was considered by the Trustees in that context. On this basis, the Board primarily considered the costs and profitability for New York Life Investments and its affiliates with respect to the Fund.
In addition, the Board acknowledged the difficulty in obtaining reliable comparative data about mutual fund managers’ profitability because such information generally is not publicly available and may be impacted by numerous factors, including the structure of a fund manager’s organization, the types of funds it manages, the methodology used to allocate certain fixed costs to specific funds and the manager’s capital structure and costs of capital.
In evaluating the costs of the services provided by New York Life Investments and CBRE and profits realized by New York Life Investments and its affiliates and CBRE, the Board considered, among other factors, New York Life Investments’ and its affiliates’ and CBRE’s continuing investments in, or willingness to invest in, personnel and other resources to support and further enhance the management of the Fund, and that New York Life Investments is responsible for paying the subadvisory fee for the Fund. The Board also considered the financial resources of New York Life Investments and CBRE and acknowledged that New York Life Investments and CBRE must be in a position to attract and retain experienced professional personnel and to maintain a strong financial position for New York Life Investments and CBRE to continue to provide
high-quality services to the Fund. The Board recognized that the Fund benefits from the allocation of certain fixed costs among the funds in the MainStay Group of Funds, among other expected benefits resulting from its relationship with New York Life Investments.
The Board considered information regarding New York Life Investments’ methodology for calculating profitability and allocating costs provided by New York Life Investments in connection with the fund profitability analysis presented to the Board. The Board previously engaged an independent consultant to review the methods used to allocate costs among the funds in the MainStay Group of Funds. The Board noted that the independent consultant had concluded that New York Life Investments’ methods for allocating costs and procedures for estimating overall profitability of the relationship with the funds in the MainStay Group of Funds are reasonable and that New York Life Investments continued to use the same method of calculating profit and allocating costs since the independent consultant’s review. The Board recognized the difficulty in calculating and evaluating a manager’s profitability with respect to the Fund and noted that other profitability methodologies may also be reasonable.
The Board also considered certain fall-out benefits that may be realized by New York Life Investments and its affiliates due to their relationships with the Fund, including reputational and other indirect benefits. The Board recognized, for example, the benefits to CBRE from legally permitted “soft-dollar” arrangements by which brokers provide research and other services to CBRE in exchange for commissions paid by the Fund with respect to trades in the Fund’s portfolio securities. In this regard, the Board also requested and considered information from New York Life Investments concerning other material business relationships between CBRE and its affiliates and New York Life Investments and its affiliates and considered the existence of a strategic partnership between New York Life Investments and CBRE that relates to certain current and future products that represents a conflict of interest associated with New York Life Investments’ recommendation to approve the Subadvisory Agreement. In addition, the Board considered its review of a money market fund advised by New York Life Investments and an affiliated subadvisor that serves as an investment option for the Fund, including the potential rationale for and costs associated with investments in this money market fund by the Fund, if any, and considered information from New York Life Investments that the nature and type of specific investment advisory services provided to this money market fund are distinct from, or in addition to, the investment advisory services provided to the Fund.
The Board observed that, in addition to fees earned by New York Life Investments for managing the Fund, New York Life Investments’ affiliates also earn revenues from serving the Fund in various other capacities, including as the Fund’s transfer agent and distributor. The Board considered information about these other revenues and their impact on the profitability of the relationship with the Fund to New York Life Investments and its affiliates. The Board noted that, although it assessed the overall profitability of the Fund to New York Life Investments and its affiliates as part of the contract review process, when considering the reasonableness of the fee paid to New York Life Investments under the
| MainStay CBRE Global Infrastructure Fund |
Management Agreement, the Board considered the profitability of New York Life Investments’ relationship with the Fund on a pre-tax basis and without regard to distribution expenses incurred by New York Life Investments from its own resources.
After evaluating the information deemed relevant by the Trustees, the Board concluded that any profits realized by New York Life Investments and its affiliates due to their relationships with the Fund were not excessive. With respect to CBRE, the Board considered that any profits realized by CBRE due to its relationship with the Fund are the result of arm’s-length negotiations between New York Life Investments and CBRE, acknowledging that any such profits are based on the subadvisory fee paid to CBRE by New York Life Investments, not the Fund.
Management and Subadvisory Fees and Total Ordinary Operating Expenses
The Board evaluated the reasonableness of the fee paid under each of the Advisory Agreements and the Fund’s total ordinary operating expenses. The Board primarily considered the reasonableness of the management fee paid by the Fund to New York Life Investments because the subadvisory fee paid to CBRE is paid by New York Life Investments, not the Fund. The Board also considered the reasonableness of the subadvisory fee paid by New York Life Investments and the amount of the management fee retained by New York Life Investments.
In assessing the reasonableness of the Fund’s fees and expenses, the Board primarily considered comparative data provided by ISS on the fees and expenses charged by similar mutual funds managed by other investment advisers. In addition, the Board considered information provided by New York Life Investments and CBRE on fees charged to other investment advisory clients, including institutional separate accounts and/or other funds that follow investment strategies similar to those of the Fund, if any. The Board considered the similarities and differences in the contractual management fee schedules of the Fund and those of the similarly-managed accounts and/or funds, taking into account the rationale for any differences in fee schedules. The Board also took into account explanations provided by New York Life Investments about the more extensive scope of services provided to registered investment companies, such as the Fund, as compared with other investment advisory clients. Additionally, the Board considered the impact of voluntary waivers and expense limitation arrangements on the Fund’s net management fee and expenses. The Board also considered that in proposing fees for the Fund, New York Life Investments considers the competitive marketplace for mutual funds. The Board considered its discussions with representatives from New York Life Investments regarding the management fee paid by the Fund.
The Board took into account information from New York Life Investments regarding the reasonableness of the Fund’s transfer agent fee schedule, including industry data demonstrating that the fees that NYLIM Service Company LLC, an affiliate of New York Life Investments and the Fund’s transfer agent, charges the Fund are within the range of fees charged by transfer agents to other mutual funds. In addition, the Board considered
NYLIM Service Company LLC’s profitability in connection with the transfer agent services it provides to the Fund. The Board also took into account information received from NYLIM Service Company LLC regarding the sub-transfer agency payments it made to intermediaries in connection with the provision of sub-transfer agency services to the Fund.
The Board considered the extent to which transfer agent fees comprised total expenses of the Fund. The Board acknowledged the role that the MainStay Group of Funds historically has played in serving the investment needs of New York Life Insurance Company customers, who often maintain smaller account balances than other shareholders of funds, and the impact of small accounts on the expense ratios of Fund share classes. The Board also recognized measures that it and New York Life Investments have taken to mitigate the effect of small accounts on the expense ratios of Fund share classes, including through the imposition of an expense limitation on net transfer agency expenses. The Board also considered that NYLIM Service Company LLC had waived its contractual cost of living adjustments during the seven years prior to 2021.
Based on the factors outlined above, the Board concluded that the Fund’s management fee and total ordinary operating expenses were within a range that is competitive and support a conclusion that these fees and expenses are reasonable.
Economies of Scale
The Board considered information regarding economies of scale, including whether the Fund’s expense structure permits economies of scale to be appropriately shared with the Fund’s shareholders. The Board also considered a report from New York Life Investments, previously prepared at the request of the Board, that addressed economies of scale, including with respect to the mutual fund business generally, and the various ways in which the benefits of economies of scale may be shared with the funds in the MainStay Group of Funds. Although the Board recognized the difficulty of determining economies of scale with precision, the Board acknowledged that economies of scale may be shared with the Fund in a number of ways, including, for example, through the imposition of fee breakpoints, initially setting management fee rates at scale or making additional investments to enhance services. The Board reviewed information from New York Life Investments showing how the Fund’s management fee schedule compared to fee schedules of other funds and accounts managed by New York Life Investments. The Board also reviewed information from ISS showing how the Fund’s management fee schedule compared with fees paid for similar services by peer funds at varying asset levels.
Based on this information, the Board concluded that economies of scale are appropriately reflected for the benefit of the Fund’s shareholders through the Fund’s expense structure and other methods to share benefits from economies of scale.
Board Consideration and Approval of Management Agreement and Subadvisory Agreement (Unaudited) (continued)
Conclusion
On the basis of the information and factors summarized above, among other information and factors deemed relevant by the Trustees, and the evaluation thereof, the Board, including the Independent Trustees voting separately, unanimously voted to approve the continuation of each of the Advisory Agreements.
| MainStay CBRE Global Infrastructure Fund |
Discussion of the Operation and Effectiveness of the Fund's Liquidity Risk Management Program (Unaudited)
In compliance with Rule 22e-4 under the Investment Company Act of 1940, as amended (the “Liquidity Rule”), the Fund has adopted and implemented a liquidity risk management program (the “Program”), which New York Life Investment Management LLC believes is reasonably designed to assess and manage the Fund's liquidity risk (the risk that the Fund could not meet requests to redeem shares issued by the Fund without significant dilution of remaining investors’ interests in the Fund). The Board of Trustees of MainStay Funds Trust (the "Board") designated New York Life Investment Management LLC as administrator of the Program (the “Administrator”). The Administrator has established a Liquidity Risk Management Committee to assist the Administrator in the implementation and day-to-day administration of the Program and to otherwise support the Administrator in fulfilling its responsibilities under the Program.
At a meeting of the Board held on March 9, 2022, the Administrator provided the Board with a written report addressing the Program’s operation and assessing its adequacy and effectiveness of implementation for the period from January 1, 2021 through December 31, 2021 (the "Review Period"), as required under the Liquidity Rule. The report noted that the Administrator concluded that (i) the Program operated effectively to assess and manage the Fund's liquidity risk, (ii) the Program has been adequately and effectively implemented to monitor and, as applicable, respond to the Fund's liquidity developments and (iii) the Fund's investment strategy continues to be appropriate for an open-end fund. In addition, the report summarized the operation of the Program and the information and factors considered by the Administrator in its assessment of the Program’s implementation, such as the liquidity risk assessment framework and the liquidity classification methodologies, and discussed notable events that impacted liquidity risk during the Review Period.
In accordance with the Program, the Fund's liquidity risk is assessed no less frequently than annually taking into consideration certain factors, as applicable, such as (i) investment strategy and liquidity of portfolio investments, (ii) short-term and long-term cash flow projections and (iii) holdings of cash and cash equivalents, as well as borrowing arrangements and other funding sources. Certain factors are considered under both normal and reasonably foreseeable stressed conditions.
Each Fund portfolio investment is classified into one of four liquidity categories. The classification is based on a determination of the number of days it is reasonably expected to take to convert the investment into cash, or sell or dispose of the investment, in current market conditions without significantly changing the market value of the investment. The Administrator has delegated liquidity classification determinations to the Fund’s subadvisor, subject to appropriate oversight by the Administrator, and liquidity classification determinations are made by taking into account the Fund's reasonably anticipated trade size, various market, trading and investment-specific considerations, as well as market depth, and, in certain cases, third-party vendor data.
The Liquidity Rule requires funds that do not primarily hold assets that are highly liquid investments to adopt a minimum amount of net assets that must be invested in highly liquid investments that are assets (an “HLIM”). In addition, the Liquidity Rule limits a fund's investments in illiquid investments. Specifically, the Liquidity Rule prohibits acquisition of illiquid investments if doing so would result in a fund holding more than 15% of its net assets in illiquid investments that are assets. The Program includes provisions reasonably designed to determine, periodically review and comply with the HLIM requirement, as applicable, and to comply with the 15% limit on illiquid investments.
There can be no assurance that the Program will achieve its objectives under all circumstances in the future. Please refer to the Fund's prospectus for more information regarding the Fund's exposure to liquidity risk and other risks to which it may be subject.
Federal Income Tax
Information (Unaudited)
The Fund is required under the Internal Revenue Code to advise shareholders in a written statement as to the federal tax status of dividends paid by the Fund during such fiscal years.
For the fiscal year ended April 30, 2022, the Fund designated approximately $14,816,842 under the Internal Revenue Code as qualified dividend income eligible for reduced tax rates.
The dividends paid by the Fund during the fiscal year ended April 30, 2022 should be multiplied by 41.59% to arrive at the amount eligible for the corporate dividend-received deduction.
In February 2023, shareholders will receive an IRS Form 1099-DIV or substitute Form 1099, which will show the federal tax status of the distributions received by shareholders in calendar year 2022. The amounts that will be reported on such 1099-DIV or substitute Form 1099 will be the amounts you are to use on your federal income tax return and will differ from the amounts which we must report for the Fund's fiscal year ended April 30, 2022.
Proxy Voting Policies and Procedures and Proxy Voting Record
The Fund is required to file with the SEC its proxy voting record for the 12-month period ending June 30 on Form N-PX. A description of the policies and procedures that are used to vote proxies relating to portfolio securities of the Fund is available free of charge upon request by calling 800-624-6782 or visiting the SEC’s website at www.sec.gov. The most recent Form N-PX or proxy voting record is available free of charge upon request by calling 800-624-6782; visiting newyorklifeinvestments.com; or visiting the SEC’s website at www.sec.gov.
Shareholder Reports and Quarterly Portfolio Disclosure
The Fund is required to file its complete schedule of portfolio holdings with the SEC 60 days after its first and third fiscal quarter on Form N-PORT. The Fund's holdings report is available free of charge upon request by calling New York Life Investments at 800-624-6782.
| MainStay CBRE Global Infrastructure Fund |
Board of Trustees and Officers (Unaudited)
The Trustees and officers of the Fund are listed below. The Board oversees the MainStay Group of Funds (which consists of MainStay Funds and MainStay Funds Trust), MainStay VP Funds Trust, MainStay MacKay DefinedTerm Municipal Opportunities Fund, MainStay CBRE Global Infrastructure Megatrends Fund, the Manager and the Subadvisors, and elects the officers of the Funds who are responsible for the day-to-day operations of the Fund. Information pertaining to the Trustees and officers is set forth below. Each Trustee serves until his or her successor is elected and qualified or until his or her resignation, death or removal. Under the Board’s retirement policy, unless an exception is made, a
Trustee must tender his or her resignation by the end of the calendar year during which he or she reaches the age of 75. Mr. Nolan reached the age of 75 during the calendar year 2021. Accordingly, Mr. Nolan retired at the end of calendar year 2021, at which time, Ms. Hammond became a Trustee of the Funds. Officers are elected annually by the Board. The business address of each Trustee and officer listed below is 51 Madison Avenue, New York, New York 10010. A majority of the Trustees are not “interested persons” (as defined by the 1940 Act and rules adopted by the SEC thereunder) of the Fund (“Independent Trustees”).
| | Term of Office,
Position(s) Held and
Length of Service | Principal Occupation(s)
During Past Five Years | Number of
Portfolios in
Fund Complex
Overseen by
Trustee | Other Directorships
Held by Trustee |
| | | | | |
| | MainStay Funds: Trustee
since 2017;
MainStay Funds Trust:
Trustee since 2017 | Senior Vice President of New York Life since joining in 2010, Member of the Executive Management Committee since 2017, Chief Executive Officer, New York Life Investment Management Holdings LLC & New York Life Investment Management LLC since 2015. Senior Managing Director and Co-President of New York Life Investment Management LLC from January 2014 to May 2015. Previously held positions of increasing responsibility, including head of NYLIM International, Alternative Growth Businesses, and Institutional investments since joining New York Life in 2010 | | MainStay VP Funds Trust:
Trustee since 2017 (31 portfolios);
MainStay MacKay DefinedTerm Municipal Opportunities Fund: Trustee
since 2017;
MainStay CBRE Global Infrastructure Megatrends Fund: Trustee
since March 2021; and
Turtle Beach Corporation: Director since April 2021 |
*
This Trustee is considered to be an “interested person” of the MainStay Group of Funds, MainStay VP Funds Trust, MainStay CBRE Global Infrastructure Megatrends Fund and MainStay MacKay DefinedTerm Municipal Opportunities Fund, within the meaning of the 1940 Act because of her affiliation with New York Life Insurance Company, New York Life Investment Management LLC, Candriam Belgium S.A., Candriam Luxembourg S.C.A., IndexIQ Advisors LLC, MacKay Shields LLC, NYL Investors LLC, NYLIFE Securities LLC and/or NYLIFE Distributors LLC, as described in detail above in the column entitled “Principal Occupation(s) During Past Five Years.”
Board of Trustees and Officers (Unaudited) (continued)
| | Term of Office,
Position(s) Held and
Length of Service | Principal Occupation(s)
During Past Five Years | Number of
Portfolios in
Fund Complex
Overseen by
Trustee | Other Directorships
Held by Trustee |
| | | | | |
| | MainStay Funds: Trustee since 2016, Advisory Board Member (June 2015 to December 2015);
MainStay Funds Trust: Trustee since 2016, Advisory Board Member (June 2015 to December 2015) | Founder and CEO, DanCourt Management, LLC since 1999 | | MainStay VP Funds Trust: Trustee since 2016, Advisory Board Member (June 2015 to December 2015) (31 portfolios);
MainStay MacKay DefinedTerm Municipal Opportunities Fund: Trustee since 2016, Advisory Board Member (June 2015 to December 2015);
MainStay CBRE Global Infrastructure Megatrends Fund: Trustee since June 2021; VanEck Vectors Group of Exchange-Traded Funds: Independent Chairman of the Board of Trustees since 2008 and Trustee since 2006 (56 portfolios); and Berea College of Kentucky: Trustee since 2009, Chair of the Investment Committee since 2018 |
| | MainStay Funds: Chairman since 2017 and Trustee since 2007;
MainStay Funds Trust: Chairman since 2017 and Trustee since 1990** | President, Strategic Management Advisors LLC since 1990 | | MainStay VP Funds Trust: Chairman since January 2017 and Trustee since 2007 (31 portfolios)***;
MainStay MacKay DefinedTerm Municipal Opportunities Fund: Chairman since 2017 and Trustee since 2011;
MainStay CBRE Global Infrastructure Megatrends Fund: Trustee since June 2021; and Legg Mason Partners Funds: Trustee since 1991 (45 portfolios) |
| | MainStay Funds: Trustee since 2006;
MainStay Funds Trust: Trustee since 2007** | Retired; Partner, Ernst & Young LLP (2002 to 2003); Partner, Arthur Andersen LLP (1989 to 2002); Consultant to the MainStay Funds Audit and Compliance Committee (2004 to 2006) | | MainStay VP Funds Trust: Trustee since 2007 (31 portfolios)***;
MainStay MacKay DefinedTerm Municipal Opportunities Fund: Trustee since 2011; and
MainStay CBRE Global Infrastructure Megatrends Fund: Trustee since June 2021 |
| Richard H. Nolan, Jr.
1946**** | MainStay Funds: Trustee since 2007;
MainStay Funds Trust: Trustee since 2007** | Managing Director, ICC Capital Management since 2004; President—Shields/Alliance, Alliance Capital Management (1994 to 2004) | | MainStay VP Funds Trust: Trustee since 2006 (31 portfolios)***;
MainStay MacKay DefinedTerm Municipal Opportunities Fund: Trustee since 2011; and
MainStay CBRE Global Infrastructure Megatrends Fund: Trustee since June 2021 |
| MainStay CBRE Global Infrastructure Fund |
| | Term of Office, Position(s) Held and Length of Service | Principal Occupation(s) During Past Five Years | Number of Portfolios in Fund Complex Overseen by Trustee | Other Directorships Held by Trustee |
| | | | | |
| | MainStay Funds: Trustee since December 2021, Advisory Board Member (June 2021 to December 2021);
MainStay Funds Trust:
Trustee since December 2021, Advisory Board Member (June 2021 to December 2021)
| Retired, Managing Director, Devonshire Investors (2007 to 2013); Senior Vice President, Fidelity Management & Research Co. (2005 to 2007); Senior Vice President and Corporate Treasurer, FMR Corp. (2003 to 2005); Chief Operating Officer, Fidelity Investments Japan (2001 to 2003) | | MainStay VP Funds Trust: Trustee since December 2021, Advisory Board Member (June 2021 to December 2021) (31 Portfolios);
MainStay MacKay DefinedTerm Municipal Opportunities Fund: Trustee since December 2021, Advisory Board Member (June 2021 to December 2021);
MainStay CBRE Global Infrastructure Megatrends Fund: Trustee since December 2021, Advisory Board Member (June 2021 to December 2021);
Two Harbors Investment Corp.: Member since 2018, Chair of the Special Committee since 2019;
Rhode Island School of Design: Director and Chair of the Finance Committee since 2015; and
Blue Cross Blue Shield of Rhode Island: Director since 2019 |
| | MainStay Funds: Trustee since 2016, Advisory Board Member (June 2015 to December 2015);
MainStay Funds Trust: Trustee since 2016, Advisory Board Member (June 2015 to December 2015) | Founder and Chief Executive Officer, CapShift Advisors LLC since 2018; President, Fidelity Management & Research Company (2009 to 2014); President and Chief Investment Officer, Geode Capital Management, LLC (2001 to 2009) | | MainStay VP Funds Trust: Trustee since 2016, Advisory Board Member (June 2015 to December 2015) (31 portfolios);
MainStay MacKay DefinedTerm Municipal Opportunities Fund: Trustee since 2016, Advisory Board Member (June 2015 to December 2015);
MainStay CBRE Global Infrastructure Megatrends Fund: Trustee since June 2021; Partners in Health: Trustee since 2019; Allstate Corporation: Director since 2015; and MSCI, Inc.: Director since 2017 |
| | MainStay Funds: Trustee since 1994;
MainStay Funds Trust: Trustee since 2007** | Chairman and Chief Executive Officer, Somerset & Company (financial advisory firm) since 2004; Managing Director, The Carlyle Group (private investment firm) (2002 to 2004); Senior Managing Director, Partner and Board Member, Groupe Arnault S.A. (private investment firm) (1999 to 2002)
| | MainStay VP Funds Trust: Trustee since 2007 (31 portfolios)***;
MainStay MacKay DefinedTerm Municipal Opportunities Fund: Trustee since 2011; and MainStay CBRE Global Infrastructure Megatrends Fund; Trustee since June 2021 |
**
Includes prior service as a Director/Trustee of certain predecessor entities to MainStay Funds Trust.
***
Includes prior service as a Director of MainStay VP Series Fund, Inc., the predecessor to MainStay VP Funds Trust.
****
Pursuant to the Board's retirement policy, Mr. Nolan retired from the Board effective December 31, 2021.
Board of Trustees and Officers (Unaudited) (continued)
| | Position(s) Held and
Length of Service | Principal Occupation(s)
During Past Five Years | |
| | | | |
| | President, MainStay Funds, MainStay Funds Trust since 2017 | Chief Operating Officer and Senior Managing Director since 2016, New York Life Investment Management LLC and New York Life Investment Management Holdings LLC; Member of the Board of Managers (since 2017) and Senior Managing Director (since 2018), NYLIFE Distributors LLC; Chairman of the Board and Senior Managing Director, NYLIM Service Company LLC since 2017; Trustee, President and Principal Executive Officer of IndexIQ Trust, IndexIQ ETF Trust and IndexIQ Active ETF Trust since January 2018; President, MainStay MacKay DefinedTerm Municipal Opportunities Fund and MainStay VP Funds Trust since 2017** and MainStay CBRE Global Infrastructure Megatrends Fund since 2021; Senior Managing Director, Global Product Development (2015 to 2016); Managing Director, Product Development (2010 to 2015), New York Life Investment Management LLC | |
| | Treasurer and Principal Financial and Accounting Officer, MainStay Funds since 2007, MainStay Funds Trust since 2009 | Managing Director, New York Life Investment Management LLC since 2007; Treasurer and Principal Financial and Accounting Officer, MainStay MacKay DefinedTerm Municipal Opportunities Fund since 2011, MainStay VP Funds Trust since 2007** and MainStay CBRE Global Infrastructure Megatrends Fund since 2021; and Assistant Treasurer, New York Life Investment Management Holdings LLC (2008 to 2012) | |
| | Secretary and Chief Legal Officer, MainStay Funds and MainStay Funds Trust since 2010 | Managing Director and Associate General Counsel, New York Life Investment Management LLC since 2010; Secretary and Chief Legal Officer, MainStay MacKay DefinedTerm Municipal Opportunities Fund since 2011, MainStay VP Funds Trust since 2010** and MainStay CBRE Global Infrastructure Megatrends Fund since 2021 | |
| | Vice President— Administration, MainStay Funds since 2005, MainStay Funds Trust since 2009 | Managing Director, New York Life Investment Management LLC (including predecessor advisory organizations) since 2000; Member of the Board of Directors, New York Life Trust Company since 2009; Vice President—Administration, MainStay MacKay DefinedTerm Municipal Opportunities Fund since 2011, MainStay VP Funds Trust since 2005** and MainStay CBRE Global Infrastructure Megatrends Fund since 2021 | |
| | Vice President and Chief Compliance Officer, MainStay Funds and MainStay Funds Trust since 2021 and 2014 to 2020 | Vice President and Chief Compliance Officer, New York Life Investments Alternatives LLC and New York Life Investment Management Holdings LLC (since 2020); Vice President (since 2018) and Chief Compliance Officer (since 2016), New York Life Investment Management LLC; Vice President and Chief Compliance Officer, IndexIQ Advisors LLC, IndexIQ Holdings Inc., IndexIQ LLC and IndexIQ Trust (since 2017); Director and Associate General Counsel (2011 to 2014) and Vice President and Assistant General Counsel (2010 to 2011), New York Life Investment Management LLC; Vice President and Chief Compliance Officer, MainStay VP Funds Trust and MainStay MacKay DefinedTerm Municipal Opportunities Fund (since June 2021 and 2014 to 2020) and MainStay CBRE Global Infrastructure Megatrends Fund (since 2021); Assistant Secretary, MainStay Funds, MainStay Funds Trust and MainStay VP Funds Trust (2010 to 2014)**, MainStay MacKay DefinedTerm Municipal Opportunities Fund (2011 to 2014) | |
*
The officers listed above are considered to be “interested persons” of the MainStay Group of Funds, MainStay VP Funds Trust, MainStay CBRE Global Infrastructure Megatrends Fund and MainStay MacKay DefinedTerm Municipal Opportunities Fund within the meaning of the 1940 Act because of their affiliation with the MainStay Group of Funds, New York Life Insurance Company and/or its affiliates, including New York Life Investment Management LLC, NYLIM Service Company LLC, NYLIFE Securities LLC and/or NYLIFE Distributors LLC, as described in detail in the column captioned “Principal Occupation(s) During Past Five Years.” Officers are elected annually by the Board.
**
Includes prior service as an Officer of MainStay VP Series Fund, Inc., the predecessor to MainStay VP Funds Trust.
Officers of the Trust (Who are not Trustees)*
| MainStay CBRE Global Infrastructure Fund |
Equity
U.S. Equity
MainStay Epoch U.S. Equity Yield Fund
MainStay S&P 500 Index Fund1
MainStay Winslow Large Cap Growth Fund
MainStay WMC Enduring Capital Fund
MainStay WMC Growth Fund
MainStay WMC Small Companies Fund
MainStay WMC Value Fund
International Equity
MainStay Epoch International Choice Fund
MainStay MacKay International Equity Fund
MainStay WMC International Research Equity Fund
Emerging Markets Equity
MainStay Candriam Emerging Markets Equity Fund
Global Equity
MainStay Epoch Capital Growth Fund
MainStay Epoch Global Equity Yield Fund
Fixed Income
Taxable Income
MainStay Candriam Emerging Markets Debt Fund
MainStay Floating Rate Fund
MainStay MacKay High Yield Corporate Bond Fund
MainStay MacKay Short Duration High Yield Fund
MainStay MacKay Strategic Bond Fund
MainStay MacKay Total Return Bond Fund
MainStay MacKay U.S. Infrastructure Bond Fund
MainStay Short Term Bond Fund
Tax-Exempt Income
MainStay MacKay California Tax Free Opportunities Fund2
MainStay MacKay High Yield Municipal Bond Fund
MainStay MacKay New York Tax Free Opportunities Fund3
MainStay MacKay Short Term Municipal Fund
MainStay MacKay Strategic Municipal Allocation Fund4
MainStay MacKay Tax Free Bond Fund
Money Market
MainStay Money Market Fund
Mixed Asset
MainStay Balanced Fund
MainStay Income Builder Fund
MainStay MacKay Convertible Fund
Speciality
MainStay CBRE Global Infrastructure Fund
MainStay CBRE Real Estate Fund
MainStay Cushing MLP Premier Fund
Asset Allocation
MainStay Conservative Allocation Fund
MainStay Conservative ETF Allocation Fund
MainStay Defensive ETF Allocation Fund
MainStay Equity Allocation Fund
MainStay Equity ETF Allocation Fund
MainStay ESG Multi-Asset Allocation Fund
MainStay Growth Allocation Fund
MainStay Growth ETF Allocation Fund
MainStay Moderate Allocation Fund
MainStay Moderate ETF Allocation Fund
Manager
New York Life Investment Management LLC
New York, New York
Subadvisors
Candriam Belgium S.A.5
Brussels, Belgium
Candriam Luxembourg S.C.A.5
Strassen, Luxembourg
CBRE Investment Management Listed Real Assets LLC
Radnor, Pennsylvania
Cushing Asset Management, LP
Dallas, Texas
Epoch Investment Partners, Inc.
New York, New York
MacKay Shields LLC5
New York, New York
NYL Investors LLC5
New York, New York
Wellington Management Company LLP
Boston, Massachusetts
Winslow Capital Management, LLC
Minneapolis, Minnesota
Legal Counsel
Dechert LLP
Washington, District of Columbia
Independent Registered Public Accounting Firm
KPMG LLP
Philadelphia, Pennsylvania
Distributor
NYLIFE Distributors LLC5
Jersey City, New Jersey
Custodian
JPMorgan Chase Bank, N.A.
New York, New York
1. Prior to February 28, 2022, the Fund's name was MainStay MacKay S&P 500 Index Fund.
2. This Fund is registered for sale in AZ, CA, NV, OR, TX, UT, WA and MI (Class A and Class I shares only), and CO, FL, GA, HI, ID, MA, MD, NH, NJ and NY (Class I shares only).
3. This Fund is registered for sale in CA, CT, DE, FL, MA, NJ, NY and VT.
4. Prior to November 30, 2021, the Fund's name was MainStay MacKay Intermediate Tax Free Bond Fund.
5. An affiliate of New York Life Investment Management LLC.
Not part of the Annual Report
For more information
800-624-6782
newyorklifeinvestments.com
“New York Life Investments” is both a service mark, and the common trade name, of certain investment advisors affiliated with New York Life Insurance Company. The MainStay Funds® are managed by New York Life Investment Management LLC and distributed by NYLIFE Distributors LLC, 30 Hudson Street, Jersey City, NJ 07302, a wholly owned subsidiary of New York Life Insurance Company. NYLIFE Distributors LLC is a Member FINRA/SIPC.
©2022 NYLIFE Distributors LLC. All rights reserved.
1856714MS086-22
MSCBGI11-06/22
(NYLIM) NL479
MainStay CBRE Real Estate Fund
Message from the President and Annual ReportApril 30, 2022
Sign up for e-delivery of your shareholder reports. For full details on e-delivery, including who can participate and what you can receive via e-delivery,
please log in to newyorklifeinvestments.com/accounts.
| | | | Not Insured by Any Government Agency |
This page intentionally left blank
Message from the President
The 12-month reporting period ended April 30, 2022, started on a generally positive note. Despite a new wave of COVID-19 infections that disrupted life and commerce, financial markets were buoyed during the spring and summer of 2021 by economic recovery and the widespread availability of vaccines. Most global economies expanded, exceeding pre-pandemic levels, as businesses reopened and supportive government policies bore fruit. As the period progressed, however, inflation began to creep up in response to government stimulus and accommodative monetary policies. Rising prices were further aggravated by wage increases, pandemic-related supply-chain bottlenecks and commodity price spikes. Bond prices slid as interest rates rose, and equity markets faltered. Market sentiment turned increasingly negative in the first quarter of 2022 as aggressive Russian rhetoric regarding Ukraine culminated in Russia’s invasion of its neighbor – a development that exacerbated global inflationary pressures while increasing investor uncertainty. Domestic supply shortages, international trade imbalances and rising inflation caused U.S. GDP (gross domestic product) to contract for the first time since the height of the pandemic, although consumer spending, a primary driver of U.S. economic growth, remained strong. Prices for petroleum surged to multi-year highs, while many key agricultural chemicals and industrial metals reached record territory.
Despite the market decline that greeted the first four months of 2022, the S&P 500® Index, a widely regarded benchmark of market performance, remained in modestly positive territory for the 12-month reporting period. Some market sectors benefited from the prevailing conditions, with energy stocks soaring and value-oriented shares broadly gaining ground. In addition to energy, leading sectors included utilities and consumer staples. On the other hand, the information technology, financials and consumer discretionary sectors were subject to particularly sharp losses. Small- and mid-cap stocks underperformed, as they often do during times of heightened uncertainty and financial stress. International stocks trended lower, with some emerging markets,
including Russia and China, suffering particularly steep losses, while others, such as India and Indonesia, gained ground. Fixed-income markets saw most bond prices fall as central banks contemplated significant interest rate rises to combat higher-than-previously-expected inflation rates late in the reporting period. However, floating-rate instruments, which feature variable interest rates that allow investors to benefit from a rising rate environment, bucked the downward trend.
Today, despite the continuing impact of COVID-19, most of the world appears intent on a return to post-pandemic normalcy. Instead, the focus of global political and economic attention has increasingly turned to the war in Ukraine and the impact of rising inflation. Together, Russia and Ukraine account for a substantial share of the world’s supply of food, fossil fuels and raw materials production. Accordingly, the timing and outcome of this conflict will undoubtedly play a major role in global economic developments over the coming months and, possibly, years. The actions of central banks, as they raise rates to fight inflation while trying to limit the risks of recession, are likely to further affect global markets and economies.
As a MainStay investor, you can depend on us to carefully watch developments that may affect your Fund, taking considered and appropriate action to help you stay on financial track in the midst of uncertain times. As always, we remain dedicated to providing you with the disciplined investment tools you have come to expect from us over the years. Thank you for continuing to place your trust in our team.
Sincerely,
Kirk C. Lehneis
President
The opinions expressed are as of the date of this report and are subject to change. There is no guarantee that any forecast made will come to pass. This material does not constitute investment advice and is not intended as an endorsement of any specific investment. Past performance is no guarantee of future results.
Not part of the Annual Report
Investors should refer to the Fund’s Summary Prospectus and/or Prospectus and consider the Fund’s investment objectives, strategies, risks, charges and expenses carefully before investing. The Summary Prospectus and/or Prospectus contain this and other information about the Fund. You may obtain copies of the Fund’s Summary Prospectus, Prospectus and Statement of Additional Information, which includes information about MainStay Funds Trust's Trustees, free of charge, upon request, by calling toll-free 800-624-6782, by writing to NYLIFE Distributors LLC, Attn: MainStay Marketing Department, 30 Hudson Street, Jersey City, NJ 07302 or by sending an e-mail to MainStayShareholderServices@nylim.com. These documents are also available via the MainStay Funds’ website at newyorklifeinvestments.com. Please read the Fund’s Summary Prospectus and/or Prospectus carefully before investing.
Investment and Performance Comparison (Unaudited)
Performance data quoted represents past performance. Past performance is no guarantee of future results. Because of market volatility and other factors, current performance may be lower or higher than the figures shown. Investment return and principal value will fluctuate, and as a result, when shares are redeemed, they may be worth more or less than their original cost. The graph below depicts the historical performance of Class I shares of the Fund. Performance will vary from class to class based on differences in class-specific expenses and sales charges. For performance information current to the most recent month-end, please call 800-624-6782 or visit newyorklifeinvestments.com.
The performance table and graph do not reflect the deduction of taxes that a shareholder would pay on distributions or Fund share redemptions. Total returns reflect maximum applicable sales charges as indicated in the table below, if any, changes in share price, and reinvestment of dividend and capital gain distributions. The graph assumes the initial investment amount shown below and reflects the deduction of all sales charges that would have applied for the period of investment. Performance figures may reflect certain fee waivers and/or expense limitations, without which total returns may have been lower. For more information on share classes and current fee waivers and/or expense limitations (if any), please refer to the Notes to Financial Statements.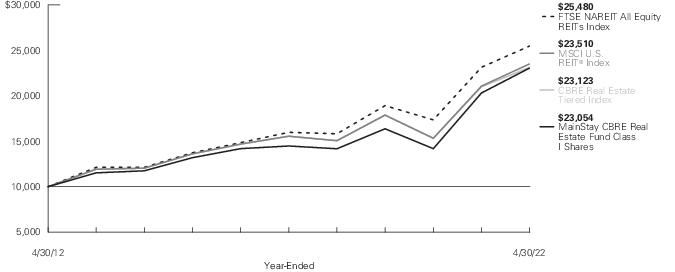
Average Annual Total Returns for the Year-Ended April 30, 2022 |
| | | | | | Ten Years
or Since
Inception | |
| Maximum 5.5% Initial Sales Charge | | | | | | |
| | | | | | | |
| Maximum 5% Initial Sales Charge | | | | | | |
| | | | | | | |
| | | | | | | |
| If Redeemed Within One Year of Purchase | | | | | | |
| | | | | | | |
| | | | | | | |
| | | | | | | |
| Effective at the close of business on February 21, 2020, the Fund changed its fiscal and tax year end from October 31 to April 30. |
| The gross expense ratios presented reflect the Fund’s “Total Annual Fund Operating Expenses” from the most recent Prospectus, as supplemented, and may differ from other expense ratios disclosed in this report. |
| Performance figures for Class A shares, Class C shares, Class I shares, Class R3 shares and Class R6 shares, reflect the historical performance of the then-existing Class A shares, Class C shares, Class I shares, Class R and Class R6 shares of the Voya Real Estate Fund (the predecessor to the Fund, which was subject to a different fee structure) for periods prior to February 21, 2020. |
| Prior to June 30, 2020, the maximum initial sales charge was 5.5%, which is reflected in the applicable average annual total return figures shown. |
The footnotes on the next page are an integral part of the table and graph and should be carefully read in conjunction with them.
| | | |
FTSE NAREIT All Equity REITs Index1 | | | |
CBRE Real Estate Tiered Index2 | | | |
| | | |
Morningstar Real Estate Category Average4 | | | |
| Returns for indices reflect no deductions for fees, expenses or taxes, except for foreign withholding taxes where applicable. |
| The Fund has selected the FTSE NAREIT All Equity REITs Index as its primary benchmark. The FTSE NAREIT All Equity REITs Index is a free-float adjusted, market capitalization-weighted index of U.S. equity REITs. Constituents of the index include all tax-qualified REITs with more than 50 percent of total assets in qualifying real estate assets other than mortgages secured by real property. |
| The Fund has selected a tiered benchmark as its secondary benchmark. The returns for the tiered benchmark represent the returns of the MSCI U.S. REIT® Index prior to January 1, 2021 and the returns of the FTSE NAREIT All Equity REITs Index thereafter. |
| The MSCI U.S. REIT® Index is a free float-adjusted market capitalization weighted index that is comprised of equity real estate investment trusts. Results assume reinvestment of all dividends and capital gains. An investment cannot be made directly in an index. |
| The Morningstar Real Estate Category Average is representative of funds that invest primarily in real estate investment trusts of various types. REITs are companies that develop and manage real estate properties. There are several different types of REITs, including apartment, factory-outlet, healthcare, hotel, industrial, mortgage, office, and shopping center REITs. Some portfolios in this category also invest in real estate operating companies. Results are based on average total returns of similar funds with all dividends and capital gain distributions reinvested. |
The footnotes on the preceding page are an integral part of the table and graph and should be carefully read in conjunction with them.
| MainStay CBRE Real Estate Fund |
Cost in Dollars of a $1,000 Investment in MainStay CBRE Real Estate Fund (Unaudited)
The example below is intended to describe the fees and expenses borne by shareholders during the six-month period from November 1, 2021 to April 30, 2022, and the impact of those costs on your investment.
Example
As a shareholder of the Fund you incur two types of costs: (1) transaction costs, including exchange fees and sales charges (loads) on purchases (as applicable), and (2) ongoing costs, including management fees, distribution and/or service (12b-1) fees and other Fund expenses (as applicable). This example is intended to help you understand your ongoing costs (in dollars) of investing in the Fund and to compare these costs with the ongoing costs of investing in other mutual funds. The example is based on an investment of $1,000 made at the beginning of the six-month period and held for the entire period from November 1, 2021 to April 30, 2022.
This example illustrates your Fund’s ongoing costs in two ways:
Actual Expenses
The second and third data columns in the table below provide information about actual account values and actual expenses. You may use the information in these columns, together with the amount you invested, to estimate the expenses that you paid during the six months ended April 30, 2022. Simply divide your account value by $1,000 (for example, an
$8,600 account value divided by $1,000 = 8.6), then multiply the result by the number under the heading entitled “Expenses Paid During Period” to estimate the expenses you paid on your account during this period.
Hypothetical Example for Comparison Purposes
The fourth and fifth data columns in the table below provide information about hypothetical account values and hypothetical expenses based on the Fund’s actual expense ratio and an assumed rate of return of 5% per year before expenses, which is not the Fund’s actual return. The hypothetical account values and expenses may not be used to estimate the actual ending account balances or expenses you paid for the six-month period shown. You may use this information to compare the ongoing costs of investing in the Fund with the ongoing costs of investing in other mutual funds. To do so, compare this 5% hypothetical example with the 5% hypothetical examples that appear in the shareholder reports of the other mutual funds.
Please note that the expenses shown in the table are meant to highlight your ongoing costs only and do not reflect any transactional costs, such as exchange fees or sales charges (loads). Therefore, the fourth and fifth data columns of the table are useful in comparing ongoing costs only and will not help you determine the relative total costs of owning different funds. In addition, if these transactional costs were included, your costs would have been higher.
| Beginning
Account
Value
11/1/21 | Ending Account
Value (Based
on Actual
Returns and
Expenses)
4/30/22 | | Ending Account
Value (Based
on Hypothetical
5% Annualized
Return and
Actual Expenses)
4/30/22 | | |
| | | | | | |
| | | | | | |
| | | | | | |
| | | | | | |
| | | | | | |
| | | | | | |
| Expenses are equal to the Fund’s annualized expense ratio of each class multiplied by the average account value over the period, divided by 365 and multiplied by 181 (to reflect the six-month period). The table above represents the actual expenses incurred during the six-month period. In addition to the fees and expenses which the Fund bears directly, it also indirectly bears a pro rata share of the fees and expenses of the underlying funds in which it invests. Such indirect expenses are not included in the above-reported expense figures. |
| Expenses are equal to the Fund's annualized expense ratio to reflect the six-month period. |
Sector Composition as of April 30, 2022 (Unaudited) | |
| |
Community Shopping Centers | |
| |
| |
Other Assets, Less Liabilities | |
| |
See Portfolio of Investments beginning on page 10 for specific holdings within these categories. The Fund's holdings are subject to change.
Top Ten Holdings and/or Issuers Held as of April 30, 2022 (excluding short-term investments) (Unaudited)
| Crown Castle International Corp. |
| |
| |
| |
| Extra Space Storage, Inc. |
| |
| |
| |
| Simon Property Group, Inc. |
| |
| MainStay CBRE Real Estate Fund |
Portfolio Management Discussion and Analysis (Unaudited)
Questions answered by portfolio managers Joseph P. Smith, CFA, Jonathan Miniman, CFA, and Kenneth S. Weinberg, CFA, of CBRE Investment Management Listed Real Assets LLC.
How did MainStay CBRE Real Estate Fund perform relative to its benchmarks and peer group during the 12 months ended April 30, 2022?
For the 12 months ended April 30, 2022, Class I shares of MainStay CBRE Real Estate Fund returned 13.51%, outperforming the 10.12% return of the Fund’s primary benchmark, the FTSE Nareit All Equity REITs Index; the 10.12% return of the CBRE Real Estate Tiered Index, which is the Fund’s secondary benchmark; and the 11.58% return of MSCI U.S. REIT® Index, which is an additional benchmark of the Fund. Over the same period, Class I shares outperformed the 8.06% return of the Morningstar Real Estate Category Average.1
Were there any changes to the Fund during the reporting period?
Effective December 31, 2021, T. Ritson Ferguson no longer serves as a portfolio manager for the Fund.
What factors affected the Fund’s relative performance during the reporting period?
During the reporting period, the Fund’s performance benefited from both positive stock selection and positive property sector allocation; stock selection accounted for the greater part of the Fund’s outperformance relative to the FTSE Nareit All Equity REITs Index.
During the reporting period, which sectors were the strongest positive contributors to the Fund’s relative performance and which sectors were particularly weak?
From a sector allocation perspective, the strongest positive contributions to the Fund’s relative performance came from net leased properties, industrial properties and data centers. (Contributions take weightings and total returns into account.) The most significantly underperforming sectors included towers, hotels and shopping centers.
During the reporting period, which individual stocks made the strongest positive contributions to the Fund’s absolute performance and which stocks detracted the most?
The strongest positive contributors to the Fund’s absolute performance during the reporting period included holdings in diversified commercial property REIT Vereit, which benefited from merger and acquisition activity; self-storage REIT ExtraSpace Storage, which saw accelerating storage revenue and profit; and apartment REIT Camden Property Trust, which experienced accelerating apartment revenue and profit. The Fund’s
weakest-performing holdings included tower REIT American Tower, which lost ground on lowered earnings forecasts; and senior housing REIT Ventas, which underperformed on challenging senior housing operating news.
What were some of the Fund’s largest purchases and sales during the reporting period?
The Fund’s largest purchases during the reporting period included shares in data center REIT Equinix and residential housing REIT Sun Communities. In our opinion, Equinix offered an attractive combination of growth and value, while Sun Communities featured an accelerating revenue and profit outlook. The Fund’s largest sales during the same period included holdings in industrial REITs Duke Realty and Prologis. Both sales reflected our opinion that the stocks had rich valuations in the wake of strong performance.
How did the Fund’s sector weightings change during the reporting period?
During the reporting period, the Fund increased its exposure most substantially to the residential and data center sectors– both areas where we see attractive relative valuations combined with accelerating earnings potential. During the same period, the Fund reduced its exposure most substantially to the industrial and shopping center sectors due to prior outperformance, over-valuation and what we see as moderating earnings growth outlooks.
How was the Fund positioned at the end of the reporting period?
As of April 30, 2022, the Fund held overweight positions relative to the FTSE Nareit All Equity REITs Index in the self-storage, mall and residential sectors. As of the same date, the Fund held relatively underweight positions in the data center, health care and office sectors.
1.
See page 5 for other share class returns, which may be higher or lower than Class I share returns. See page 6 for more information on benchmark and peer group returns.
The opinions expressed are those of the portfolio managers as of the date of this report and are subject to change. There is no guarantee that any forecasts will come to pass. This material does not constitute investment advice and is not intended as an endorsement of any specific investment.
Portfolio of Investments April 30, 2022†
| | |
|
Community Shopping Centers 1.7% |
| | |
Retail Opportunity Investments Corp. | | |
| | |
|
Simon Property Group, Inc. | | |
Healthcare Facilities 7.8% |
Alexandria Real Estate Equities, Inc. | | |
Healthcare Realty Trust, Inc. (a) | | |
Healthcare Trust of America, Inc., Class A | | |
| | |
| | |
| | |
|
DiamondRock Hospitality Co. (b) | | |
Park Hotels & Resorts, Inc. | | |
Sunstone Hotel Investors, Inc. (b) | | |
Xenia Hotels & Resorts, Inc. (b) | | |
| | |
Industrial Properties 10.7% |
| | |
Rexford Industrial Realty, Inc. | | |
| | |
Net Lease Properties 11.5% |
Four Corners Property Trust, Inc. | | |
Gaming and Leisure Properties, Inc. | | |
National Retail Properties, Inc. | | |
| | |
Spirit Realty Capital, Inc. | | |
| | |
| | |
| | |
|
Highwoods Properties, Inc. | | |
Hudson Pacific Properties, Inc. | | |
| | |
Piedmont Office Realty Trust, Inc., Class A | | |
| | |
|
Apartment Income REIT Corp. | | |
AvalonBay Communities, Inc. | | |
| | |
| | |
|
|
Essex Property Trust, Inc. | | |
Independence Realty Trust, Inc. | | |
| | |
NexPoint Residential Trust, Inc. | | |
| | |
| | |
| | |
Self Storage Property 10.9% |
| | |
Extra Space Storage, Inc. | | |
| | |
| | |
Technology Datacenters 6.6% |
| | |
|
| | |
Crown Castle International Corp. | | |
| | |
|
| | |
Total Common Stocks
(Cost $383,155,295) | | |
Short-Term Investments 1.3% |
Affiliated Investment Company 0.5% |
MainStay U.S. Government Liquidity Fund, 0.397% (c) | | |
Unaffiliated Investment Company 0.8% |
Invesco Government & Agency Portfolio, 0.419% (c)(d) | | |
Total Short-Term Investments
(Cost $6,028,548) | | |
Total Investments
(Cost $389,183,843) | | |
Other Assets, Less Liabilities | | |
| | |
The notes to the financial statements are an integral part of, and should be read in conjunction with, the financial statements.
| MainStay CBRE Real Estate Fund |
| Percentages indicated are based on Fund net assets. |
| All or a portion of this security was held on loan. As of April 30, 2022, the aggregate market value of securities on loan was $3,633,974. The Fund received cash collateral with a value of $3,790,981. (See Note 2(H)) |
| Non-income producing security. |
| Current yield as of April 30, 2022. |
| Represents a security purchased with cash collateral received for securities on loan. |
Investments in Affiliates (in 000's)
Investments in issuers considered to be affiliate(s) of the Fund during the year ended April 30, 2022 for purposes of Section 2(a)(3) of the Investment Company Act of 1940, as amended, were as follows:
Affiliated Investment Companies | | | | Net
Realized
Gain/(Loss)
on Sales | Change in
Unrealized
Appreciation/
(Depreciation) | | | | |
MainStay U.S. Government Liquidity Fund | | | | | | | | | |
|
REIT—Real Estate Investment Trust |
The following is a summary of the fair valuations according to the inputs used as of April 30, 2022, for valuing the Fund’s assets:
| Quoted
Prices in
Active
Markets for
Identical
Assets
(Level 1) | Significant
Other
Observable
Inputs
(Level 2) | Significant
Unobservable
Inputs
(Level 3) | |
| | | | |
Investments in Securities (a) | | | | |
| | | | |
| | | | |
Affiliated Investment Company | | | | |
Unaffiliated Investment Company | | | | |
Total Short-Term Investments | | | | |
Total Investments in Securities | | | | |
| For a complete listing of investments and their industries, see the Portfolio of Investments. |
The notes to the financial statements are an integral part of, and should be read in conjunction with, the financial statements.
Statement of Assets and Liabilities as of April 30, 2022
|
Investment in unaffiliated securities, at value
(identified cost $386,946,276) including securities on loan of $3,633,974 | |
Investment in affiliated investment companies, at value
(identified cost $2,237,567) | |
| |
| |
| |
Investment securities sold | |
| |
| |
| |
|
Cash collateral received for securities on loan | |
| |
| |
| |
Transfer agent (See Note 3) | |
Shareholder communication | |
| |
NYLIFE Distributors (See Note 3) | |
| |
| |
| |
| |
| |
Composition of Net Assets |
Shares of beneficial interest outstanding (par value of $.001 per share) unlimited number of shares authorized | |
Additional paid-in-capital | |
| |
Total distributable earnings (loss) | |
| |
| |
Net assets applicable to outstanding shares | |
Shares of beneficial interest outstanding | |
Net asset value per share outstanding | |
Maximum sales charge (5.50% of offering price) | |
Maximum offering price per share outstanding | |
| |
Net assets applicable to outstanding shares | |
Shares of beneficial interest outstanding | |
Net asset value per share outstanding | |
Maximum sales charge (5.00% of offering price) | |
Maximum offering price per share outstanding | |
| |
Net assets applicable to outstanding shares | |
Shares of beneficial interest outstanding | |
Net asset value and offering price per share outstanding | |
| |
Net assets applicable to outstanding shares | |
Shares of beneficial interest outstanding | |
Net asset value and offering price per share outstanding | |
| |
Net assets applicable to outstanding shares | |
Shares of beneficial interest outstanding | |
Net asset value and offering price per share outstanding | |
| |
Net assets applicable to outstanding shares | |
Shares of beneficial interest outstanding | |
Net asset value and offering price per share outstanding | |
The notes to the financial statements are an integral part of, and should be read in conjunction with, the financial statements.
| MainStay CBRE Real Estate Fund |
Statement of Operations for the year ended April 30, 2022
|
| |
Dividends-unaffiliated (net of foreign tax withholding of $1,208) | |
| |
| |
| |
| |
| |
Transfer agent (See Note 3) | |
Distribution/Service—Class A (See Note 3) | |
Distribution/Service—Investor Class (See Note 3) | |
Distribution/Service—Class C (See Note 3) | |
Distribution/Service—Class R3 (See Note 3) | |
| |
| |
Shareholder communication | |
| |
| |
Shareholder service (See Note 3) | |
| |
Total expenses before waiver/reimbursement | |
Expense waiver/reimbursement from Manager (See Note 3) | |
| |
Net investment income (loss) | |
Realized and Unrealized Gain (Loss) |
Net realized gain (loss) on: | |
Unaffiliated investment transactions | |
Foreign currency transactions | |
| |
Net change in unrealized appreciation (depreciation) on: | |
| |
Translation of other assets and liabilities in foreign currencies | |
Net change in unrealized appreciation (depreciation) | |
Net realized and unrealized gain (loss) | |
Net increase (decrease) in net assets resulting from operations | |
The notes to the financial statements are an integral part of, and should be read in conjunction with, the financial statements.
Statements of Changes in Net Assets
for the years ended April 30, 2022 and April 30, 2021
| | |
Increase (Decrease) in Net Assets |
| | |
Net investment income (loss) | | |
| | |
Net change in unrealized appreciation (depreciation) | | |
Net increase (decrease) in net assets resulting from operations | | |
Distributions to shareholders: | | |
| | |
| | |
| | |
| | |
| | |
| | |
| | |
Distributions to shareholders from return of capital: | | |
| | |
| | |
| | |
| | |
| | |
| | |
| | |
Total distributions to shareholders | | |
Capital share transactions: | | |
Net proceeds from sales of shares | | |
Net asset value of shares issued to shareholders in reinvestment of distributions | | |
| | |
Increase (decrease) in net assets derived from capital share transactions | | |
Net increase (decrease) in net assets | | |
|
| | |
| | |
The notes to the financial statements are an integral part of, and should be read in conjunction with, the financial statements.
| MainStay CBRE Real Estate Fund |
Financial Highlights selected per share data and ratios
| | June 1,
2019
through
April 30,
| |
| | | | | |
Net asset value at beginning of period | | | | | | |
Net investment income (loss) (a) | | | | | | |
Net realized and unrealized gain (loss) | | | | | | |
Total from investment operations | | | | | | |
| | | | | | |
From net investment income | | | | | | |
From net realized gain on investments | | | | | | |
| | | | | | |
| | | | | | |
Net asset value at end of period | | | | | | |
Total investment return (b) | | | | | | |
Ratios (to average net assets)/Supplemental Data: | | | | | | |
Net investment income (loss) | | | | | | |
| | | | | | |
Expenses (before waiver/reimbursement) | | | | | | |
| | | | | | |
Net assets at end of period (in 000's) | | | | | | |
| The Fund changed its fiscal year end from May 31 to April 30. |
| |
| Per share data based on average shares outstanding during the period. |
| Total investment return is calculated exclusive of sales charges and assumes the reinvestment of dividends and distributions. For periods of less than one year, total return is not annualized. |
| In addition to the fees and expenses which the Fund bears directly, it also indirectly bears a pro-rata share of the fees and expenses of the underlying funds in which it invests. Such indirect expenses are not included in the above expense ratios. |
| Net of interest expense of less than 0.01%. |
The notes to the financial statements are an integral part of, and should be read in conjunction with, the financial statements.
Financial Highlights selected per share data and ratios
| | February 24, 2020^ through
April 30,
2020 |
| | |
Net asset value at beginning of period | | | |
Net investment income (loss) (a) | | | |
Net realized and unrealized gain (loss) | | | |
Total from investment operations | | | |
| | | |
From net investment income | | | |
From net realized gain on investments | | | |
| | | |
| | | |
Net asset value at end of period | | | |
Total investment return (b) | | | |
Ratios (to average net assets)/Supplemental Data: | | | |
Net investment income (loss) | | | |
| | | |
Expenses (before waiver/reimbursement) (c) | | | |
| | | |
Net assets at end of period (in 000's) | | | |
| |
| |
| Per share data based on average shares outstanding during the period. |
| Total investment return is calculated exclusive of sales charges and assumes the reinvestment of dividends and distributions. For periods of less than one year, total return is not annualized. |
| In addition to the fees and expenses which the Fund bears directly, it also indirectly bears a pro-rata share of the fees and expenses of the underlying funds in which it invests. Such indirect expenses are not included in the above expense ratios. |
The notes to the financial statements are an integral part of, and should be read in conjunction with, the financial statements.
| MainStay CBRE Real Estate Fund |
Financial Highlights selected per share data and ratios
| | June 1,
2019
through
April 30,
| |
| | | | | |
Net asset value at beginning of period | | | | | | |
Net investment income (loss) | | | | | | |
Net realized and unrealized gain (loss) | | | | | | |
Total from investment operations | | | | | | |
| | | | | | |
From net investment income | | | | | | |
From net realized gain on investments | | | | | | |
| | | | | | |
| | | | | | |
Net asset value at end of period | | | | | | |
Total investment return (b) | | | | | | |
Ratios (to average net assets)/Supplemental Data: | | | | | | |
Net investment income (loss) | | | | | | |
| | | | | | |
Expenses (before waiver/reimbursement) | | | | | | |
| | | | | | |
Net assets at end of period (in 000's) | | | | | | |
| The Fund changed its fiscal year end from May 31 to April 30. |
| |
| Per share data based on average shares outstanding during the period. |
| Total investment return is calculated exclusive of sales charges and assumes the reinvestment of dividends and distributions. For periods of less than one year, total return is not annualized. |
| In addition to the fees and expenses which the Fund bears directly, it also indirectly bears a pro-rata share of the fees and expenses of the underlying funds in which it invests. Such indirect expenses are not included in the above expense ratios. |
| Net of interest expense of less than 0.01%. |
The notes to the financial statements are an integral part of, and should be read in conjunction with, the financial statements.
Financial Highlights selected per share data and ratios
| | June 1,
2019
through
April 30,
| |
| | | | | |
Net asset value at beginning of period | | | | | | |
Net investment income (loss) (a) | | | | | | |
Net realized and unrealized gain (loss) | | | | | | |
Total from investment operations | | | | | | |
| | | | | | |
From net investment income | | | | | | |
From net realized gain on investments | | | | | | |
| | | | | | |
| | | | | | |
Net asset value at end of period | | | | | | |
Total investment return (b) | | | | | | |
Ratios (to average net assets)/Supplemental Data: | | | | | | |
Net investment income (loss) | | | | | | |
| | | | | | |
Expenses (before waiver/reimbursement) | | | | | | |
| | | | | | |
Net assets at end of period (in 000's) | | | | | | |
| The Fund changed its fiscal year end from May 31 to April 30. |
| |
| Per share data based on average shares outstanding during the period. |
| Total investment return is calculated exclusive of sales charges and assumes the reinvestment of dividends and distributions. Class I shares are not subject to sales charges. For periods of less than one year, total return is not annualized. |
| In addition to the fees and expenses which the Fund bears directly, it also indirectly bears a pro-rata share of the fees and expenses of the underlying funds in which it invests. Such indirect expenses are not included in the above expense ratios. |
| Net of interest expense of less than 0.01%. |
The notes to the financial statements are an integral part of, and should be read in conjunction with, the financial statements.
| MainStay CBRE Real Estate Fund |
Financial Highlights selected per share data and ratios
| | June 1,
2019
through
April 30,
| |
| | | | | |
Net asset value at beginning of period | | | | | | |
Net investment income (loss) | | | | | | |
Net realized and unrealized gain (loss) | | | | | | |
Total from investment operations | | | | | | |
| | | | | | |
From net investment income | | | | | | |
From net realized gain on investments | | | | | | |
| | | | | | |
| | | | | | |
Net asset value at end of period | | | | | | |
Total investment return (b) | | | | | | |
Ratios (to average net assets)/Supplemental Data: | | | | | | |
Net investment income (loss) | | | | | | |
| | | | | | |
Expenses (before waiver/reimbursement) | | | | | | |
| | | | | | |
Net assets at end of period (in 000's) | | | | | | |
| The Fund changed its fiscal year end from May 31 to April 30. |
| |
| Per share data based on average shares outstanding during the period. |
| Total investment return is calculated exclusive of sales charges and assumes the reinvestment of dividends and distributions. Class R3 shares are not subject to sales charges. For periods of less than one year, total return is not annualized. |
| In addition to the fees and expenses which the Fund bears directly, it also indirectly bears a pro-rata share of the fees and expenses of the underlying funds in which it invests. Such indirect expenses are not included in the above expense ratios. |
| Net of interest expense of less than 0.01%. |
The notes to the financial statements are an integral part of, and should be read in conjunction with, the financial statements.
Financial Highlights selected per share data and ratios
| | June 1,
2019
through
April 30,
| |
| | | | | |
Net asset value at beginning of period | | | | | | |
Net investment income (loss) | | | | | | |
Net realized and unrealized gain (loss) | | | | | | |
Total from investment operations | | | | | | |
| | | | | | |
From net investment income | | | | | | |
From net realized gain on investments | | | | | | |
| | | | | | |
| | | | | | |
Net asset value at end of period | | | | | | |
Total investment return (b) | | | | | | |
Ratios (to average net assets)/Supplemental Data: | | | | | | |
Net investment income (loss) | | | | | | |
| | | | | | |
Expenses (before waiver/reimbursement) | | | | | | |
| | | | | | |
Net assets at end of period (in 000's) | | | | | | |
| The Fund changed its fiscal year end from May 31 to April 30. |
| Less than one cent per share. |
| |
| Per share data based on average shares outstanding during the period. |
| Total investment return is calculated exclusive of sales charges and assumes the reinvestment of dividends and distributions. Class R6 shares are not subject to sales charges. For periods of less than one year, total return is not annualized. |
| In addition to the fees and expenses which the Fund bears directly, it also indirectly bears a pro-rata share of the fees and expenses of the underlying funds in which it invests. Such indirect expenses are not included in the above expense ratios. |
| Net of interest expense of less than 0.01%. |
The notes to the financial statements are an integral part of, and should be read in conjunction with, the financial statements.
| MainStay CBRE Real Estate Fund |
Notes to Financial Statements
Note 1-Organization and Business
MainStay Funds Trust (the “Trust”) was organized as a Delaware statutory trust on April 28, 2009. The Trust is registered under the Investment Company Act of 1940, as amended (the “1940 Act”), as an open-end management investment company, and is comprised of thirty-three funds (collectively referred to as the “Funds”). These financial statements and notes relate to the MainStay CBRE Real Estate Fund (the "Fund"), a “non-diversified” fund, as that term is defined in the 1940 Act, as interpreted or modified by regulatory authorities having jurisdiction, from time to time.
The following table lists the Fund's share classes that have been registered and commenced operations:
| SIMPLE Class shares were registered for sale effective as of August 31, 2020 but have not yet commenced operations. |
Class A and Investor Class shares are offered at net asset value (“NAV”) per share plus an initial sales charge. No initial sales charge applies to investments of $1 million or more (and certain other qualified purchases) in Class A and Investor Class shares. A contingent deferred sales charge (“CDSC”) of 1.00% may be imposed on certain redemptions of Class A and Investor Class shares made within 18 months of the date of purchase on shares that were purchased without an initial sales charge. Class C shares are offered at NAV without an initial sales charge, although a 1.00% CDSC may be imposed on certain redemptions of such shares made within one year of the date of purchase of Class C shares. Class I, Class R3 and Class R6 shares are offered at NAV without a sales charge. SIMPLE Class shares are expected to be offered at NAV without a sales charge if such shares are offered in the future. In addition, depending upon eligibility, Class C shares convert to either Class A or Investor Class shares at the end of the calendar quarter eight years after the date they were purchased. Additionally, as disclosed in the Fund’s prospectus, Class A shares may convert automatically to Investor Class shares and Investor Class shares may convert automatically to Class A shares. Under certain circumstances and as may be permitted by the Trust’s multiple class plan pursuant to Rule 18f-3 under the 1940 Act, specified share classes of the Fund may be converted to one or more other share classes of the Fund as disclosed in the capital share transactions. See Note 9 for additional information. The six classes of shares have the same voting (except for issues that relate solely to one class), dividend, liquidation and other rights, and the same terms and conditions, except that under distribution plans pursuant to Rule 12b-1 under the 1940 Act, Class C shares are subject to higher distribution and/or service fees than Class A,
Investor Class and Class R3 shares. Class I and Class R6 shares are not subject to a distribution and/or service fee.
The Fund's investment objective is to seek total return.
Note 2–Significant Accounting Policies
The Fund is an investment company and accordingly follows the investment company accounting and reporting guidance of the Financial Accounting Standards Board (“FASB”) Accounting Standards Codification Topic 946 Financial Services—Investment Companies. The Fund prepares its financial statements in accordance with generally accepted accounting principles (“GAAP”) in the United States of America and follows the significant accounting policies described below.
(A) Securities Valuation. Investments are usually valued as of the close of regular trading on the New York Stock Exchange (the "Exchange") (usually 4:00 p.m. Eastern time) on each day the Fund is open for business ("valuation date").
The Board of Trustees of the Trust (the "Board") adopted procedures establishing methodologies for the valuation of the Fund's securities and other assets and delegated the responsibility for valuation determinations under those procedures to the Valuation Committee of the Trust (the “Valuation Committee”). The procedures state that, subject to the oversight of the Board and unless otherwise noted, the responsibility for the day-to-day valuation of portfolio assets (including fair value measurements for the Fund's assets and liabilities) rests with New York Life Investment Management LLC (“New York Life Investments” or the "Manager"), aided to whatever extent necessary by the Subadvisor (as defined in Note 3(A)). To assess the appropriateness of security valuations, the Manager, the Subadvisor or the Fund's third-party service provider, who is subject to oversight by the Manager, regularly compares prior day prices, prices on comparable securities and the sale prices to the prior and current day prices and challenges prices with changes exceeding certain tolerance levels with third-party pricing services or broker sources.
The Board authorized the Valuation Committee to appoint a Valuation Subcommittee (the “Subcommittee”) to establish the prices of securities for which market quotations are not readily available or the prices of which are not otherwise readily determinable under the procedures. The Subcommittee meets (in person, via electronic mail or via teleconference) on an as-needed basis. The Valuation Committee meets to ensure that actions taken by the Subcommittee were appropriate.
For those securities valued through either a standardized fair valuation methodology or a fair valuation measurement, the Subcommittee deals with such valuation and the Valuation Committee reviews and affirms, if appropriate, the reasonableness of the valuation based on such methodologies and measurements on a regular basis after considering information that is reasonably available and deemed relevant by the Valuation Committee. Any action taken by the Subcommittee with respect to the valuation of a portfolio security or other asset is submitted for
Notes to Financial Statements (continued)
review and ratification (if appropriate) to the Valuation Committee and the Board at the next regularly scheduled meeting.
"Fair value" is defined as the price the Fund would reasonably expect to receive upon selling an asset or liability in an orderly transaction to an independent buyer in the principal or most advantageous market for the asset or liability. Fair value measurements are determined within a framework that establishes a three-tier hierarchy that maximizes the use of observable market data and minimizes the use of unobservable inputs to establish a classification of fair value measurements for disclosure purposes. "Inputs" refer broadly to the assumptions that market participants would use in pricing the asset or liability, including assumptions about risk, such as the risk inherent in a particular valuation technique used to measure fair value using a pricing model and/or the risk inherent in the inputs for the valuation technique. Inputs may be observable or unobservable. Observable inputs reflect the assumptions market participants would use in pricing the asset or liability based on market data obtained from sources independent of the Fund. Unobservable inputs reflect the Fund’s own assumptions about the assumptions market participants would use in pricing the asset or liability based on the information available. The inputs or methodology used for valuing assets or liabilities may not be an indication of the risks associated with investing in those assets or liabilities. The three-tier hierarchy of inputs is summarized below.
• Level 1—quoted prices in active markets for an identical asset or liability
• Level 2—other significant observable inputs (including quoted prices for a similar asset or liability in active markets, interest rates and yield curves, prepayment speeds, credit risk, etc.)
• Level 3—significant unobservable inputs (including the Fund's own assumptions about the assumptions that market participants would use in measuring fair value of an asset or liability)
The level of an asset or liability within the fair value hierarchy is based on the lowest level of an input, both individually and in the aggregate, that is significant to the fair value measurement. The aggregate value by input level of the Fund’s assets and liabilities as of April 30, 2022, is included at the end of the Portfolio of Investments.
The Fund may use third-party vendor evaluations, whose prices may be derived from one or more of the following standard inputs, among others:
| |
| • Reference data (corporate actions or material event notices) |
| • Monthly payment information |
• Industry and economic events | |
An asset or liability for which market values cannot be measured using the methodologies described above is valued by methods deemed reasonable in good faith by the Valuation Committee, following the procedures established by the Board, to represent fair value. Under these procedures, the Fund generally uses a market-based approach which
may use related or comparable assets or liabilities, recent transactions, market multiples, book values and other relevant information. The Fund may also use an income-based valuation approach in which the anticipated future cash flows of the asset or liability are discounted to calculate fair value. Discounts may also be applied due to the nature and/or duration of any restrictions on the disposition of the asset or liability. Fair value represents a good faith approximation of the value of a security. Fair value determinations involve the consideration of a number of subjective factors, an analysis of applicable facts and circumstances and the exercise of judgment. As a result, it is possible that the fair value for a security determined in good faith in accordance with the Fund's valuation procedures may differ from valuations for the same security determined by other funds using their own valuation procedures. Although the Fund's valuation procedures are designed to value a security at the price the Fund may reasonably expect to receive upon the security's sale in an orderly transaction, there can be no assurance that any fair value determination thereunder would, in fact, approximate the amount that the Fund would actually realize upon the sale of the security or the price at which the security would trade if a reliable market price were readily available. During the year ended April 30, 2022, there were no material changes to the fair value methodologies.
Securities which may be valued in this manner include, but are not limited to: (i) a security for which trading has been halted or suspended; (ii) a debt security that has recently gone into default and for which there is not a current market quotation; (iii) a security of an issuer that has entered into a restructuring; (iv) a security that has been delisted from a national exchange; (v) a security for which the market price is not readily available from a third-party pricing source or, if so provided, does not, in the opinion of the Manager or the Subadvisor, reflect the security's market value; (vi) a security subject to trading collars for which no or limited trading takes place; and (vii) a security whose principal market has been temporarily closed at a time when, under normal conditions, it would be open. Securities valued in this manner are generally categorized as Level 3 in the hierarchy. No securities held by the Fund as of April 30, 2022, were fair valued in such a manner.
Equity securities are valued at the last quoted sales prices as of the close of regular trading on the relevant exchange on each valuation date. Securities that are not traded on the valuation date are valued at the mean of the last quoted bid and ask prices. Prices are normally taken from the principal market in which each security trades. These securities are generally categorized as Level 1 in the hierarchy.
Investments in mutual funds, including money market funds, are valued at their respective NAVs at the close of business each day on the valuation date. These securities are generally categorized as Level 1 in the hierarchy.
Temporary cash investments acquired in excess of 60 days to maturity at the time of purchase are valued using the latest bid prices or using valuations based on a matrix system (which considers such factors as security prices, yields, maturities and ratings), both as furnished by independent pricing services. Temporary cash investments that mature in
| MainStay CBRE Real Estate Fund |
60 days or less at the time of purchase ("Short-Term Investments") are valued using the amortized cost method of valuation, unless the use of such method would be inappropriate. The amortized cost method involves valuing a security at its cost on the date of purchase and thereafter assuming a constant amortization to maturity of the difference between such cost and the value on maturity date. Amortized cost approximates the current fair value of a security. Securities valued using the amortized cost method are not valued using quoted prices in an active market and are generally categorized as Level 2 in the hierarchy.
The information above is not intended to reflect an exhaustive list of the methodologies that may be used to value portfolio investments. The valuation procedures permit the use of a variety of valuation methodologies in connection with valuing portfolio investments. The methodology used for a specific type of investment may vary based on the market data available or other considerations. The methodologies summarized above may not represent the specific means by which portfolio investments are valued on any particular business day.
(B) Income Taxes. The Fund's policy is to comply with the requirements of the Internal Revenue Code of 1986, as amended (the “Internal Revenue Code”), applicable to regulated investment companies and to distribute all of its taxable income to the shareholders of the Fund within the allowable time limits.
The Manager evaluates the Fund’s tax positions to determine if the tax positions taken meet the minimum recognition threshold in connection with accounting for uncertainties in income tax positions taken or expected to be taken for the purposes of measuring and recognizing tax liabilities in the financial statements. Recognition of tax benefits of an uncertain tax position is permitted only to the extent the position is “more likely than not” to be sustained assuming examination by taxing authorities. The Manager analyzed the Fund's tax positions taken on federal, state and local income tax returns for all open tax years (for up to three tax years) and has concluded that no provisions for federal, state and local income tax are required in the Fund's financial statements. The Fund's federal, state and local income tax and federal excise tax returns for tax years for which the applicable statutes of limitations have not expired are subject to examination by the Internal Revenue Service and state and local departments of revenue.
(C) Dividends and Distributions to Shareholders. Dividends and distributions are recorded on the ex-dividend date. The Fund intends to declare and pay dividends from net investment income, if any, at least quarterly and distributions from net realized capital and currency gains, if any, at least annually. Unless a shareholder elects otherwise, all dividends and distributions are reinvested at NAV in the same class of shares of the Fund. Dividends and distributions to shareholders are determined in accordance with federal income tax regulations and may differ from determinations using GAAP.
(D) Security Transactions and Investment Income. The Fund records security transactions on the trade date. Realized gains and losses on security transactions are determined using the identified cost method.
Dividend income is recognized on the ex-dividend date, net of any foreign tax withheld at the source, and interest income is accrued as earned using the effective interest rate method. Distributions received from real estate investment trusts may be classified as dividends, capital gains and/or return of capital.
Investment income and realized and unrealized gains and losses on investments of the Fund are allocated pro rata to the separate classes of shares based upon their relative net assets on the date the income is earned or realized and unrealized gains and losses are incurred.
(E) Expenses. Expenses of the Trust are allocated to the individual Funds in proportion to the net assets of the respective Funds when the expenses are incurred, except where direct allocations of expenses can be made. Expenses (other than transfer agent expenses and fees incurred under the shareholder services plans and/or the distribution plans further discussed in Note 3(B)) are allocated to separate classes of shares pro rata based upon their relative net assets on the date the expenses are incurred. The expenses borne by the Fund, including those of related parties to the Fund, are shown in the Statement of Operations.
Additionally, the Fund may invest in mutual funds, which are subject to management fees and other fees that may cause the costs of investing in mutual funds to be greater than the costs of owning the underlying securities directly. These indirect expenses of mutual funds are not included in the amounts shown as expenses in the Statement of Operations or in the expense ratios included in the Financial Highlights.
(F) Use of Estimates. In preparing financial statements in conformity with GAAP, the Manager makes estimates and assumptions that affect the reported amounts and disclosures in the financial statements. Actual results could differ from those estimates and assumptions.
(G) Foreign Currency Transactions. The Fund's books and records are maintained in U.S. dollars. Prices of securities denominated in foreign currency amounts are translated into U.S. dollars at the mean between the buying and selling rates last quoted by any major U.S. bank at the following dates:
(i) market value of investment securities, other assets and liabilities— at the valuation date; and
(ii) purchases and sales of investment securities, income and expenses—at the date of such transactions.
The assets and liabilities that are denominated in foreign currency amounts are presented at the exchange rates and market values at the close of the period. The realized and unrealized changes in net assets arising from fluctuations in exchange rates and market prices of securities are not separately presented.
Net realized gain (loss) on foreign currency transactions represents net currency gains or losses realized as a result of differences between the amounts of securities sale proceeds or purchase cost, dividends, interest and withholding taxes as recorded on the Fund's books, and the U.S. dollar equivalent amount actually received or paid. Net currency gains or
Notes to Financial Statements (continued)
losses from valuing such foreign currency denominated assets and liabilities, other than investments at valuation date exchange rates, are reflected in unrealized foreign exchange gains or losses.
(H) Securities Lending. In order to realize additional income, the Fund may engage in securities lending, subject to the limitations set forth in the 1940 Act and relevant guidance by the staff of the Securities and Exchange Commission (“SEC”). If the Fund engages in securities lending, the Fund will lend through its custodian, JPMorgan Chase Bank, N.A., ("JPMorgan"), acting as securities lending agent on behalf of the Fund. Under the current arrangement, JPMorgan will manage the Fund's collateral in accordance with the securities lending agency agreement between the Fund and JPMorgan, and indemnify the Fund against counterparty risk. The loans will be collateralized by cash (which may be invested in a money market fund) and/or non-cash collateral (which may include U.S. Treasury securities and/or U.S. government agency securities issued or guaranteed by the United States government or its agencies or instrumentalities) at least equal at all times to the market value of the securities loaned. The Fund bears the risk of delay in recovery of, or loss of rights in, the securities loaned. The Fund may also record a realized gain or loss on securities deemed sold due to a borrower’s inability to return securities on loan. The Fund bears the risk of any loss on investment of cash collateral. The Fund will receive compensation for lending its securities in the form of fees or it will retain a portion of interest earned on the investment of any cash collateral. The Fund will also continue to receive interest and dividends on the securities loaned and any gain or loss in the market price of the securities loaned that may occur during the term of the loan will be for the account of the Fund. Income earned from securities lending activities, if any, is reflected in the Statement of Operations. Securities on loan as of April 30, 2022, are shown in the Portfolio of Investments.
(I) Real Estate Investments. The Fund’s investments in the real estate sector have many of the same risks as direct ownership of real estate, including the risk that the value of real estate could decline due to a variety of factors that affect the real estate market generally. These risks include, among others, declines in the value of real estate, changes in local and general economic conditions, supply and demand, interest rates, changes in zoning laws, overbuilding, extended vacancies of properties, regulatory limitations on rents, losses due to environmental liabilities, property taxes and operating expenses. The Fund’s investments in real estate companies are particularly sensitive to economic downturns.
(J) Indemnifications. Under the Trust’s organizational documents, its officers and trustees are indemnified against certain liabilities that may arise out of performance of their duties to the Trust. Additionally, in the normal course of business, the Fund enters into contracts with third-party service providers that contain a variety of representations and warranties and that may provide general indemnifications. The Fund's maximum exposure under these arrangements is unknown, as this would involve future claims that may be made against the Fund that have not yet occurred. The Manager believes that the risk of loss in connection with
these potential indemnification obligations is remote. However, there can be no assurance that material liabilities related to such obligations will not arise in the future, which could adversely impact the Fund.
Note 3–Fees and Related Party Transactions
(A) Manager and Subadvisor. New York Life Investments, a registered investment adviser and an indirect, wholly-owned subsidiary of New York Life Insurance Company ("New York Life"), serves as the Fund's Manager pursuant to an Amended and Restated Management Agreement ("Management Agreement"). The Manager provides offices, conducts clerical, recordkeeping and bookkeeping services and keeps most of the financial and accounting records required to be maintained by the Fund. Except for the portion of salaries and expenses that are the responsibility of the Fund, the Manager pays the salaries and expenses of all personnel affiliated with the Fund and certain operational expenses of the Fund. During a portion of the year ended April 30, 2022, the Fund reimbursed New York Life Investments in an amount equal to the portion of the compensation of the Chief Compliance Officer attributable to the Fund. CBRE Investment Management Listed Real Assets LLC ("CBRE" or the "Subadvisor"), a registered investment adviser, serves as Subadvisor to the Fund and is responsible for the day-to-day portfolio management of the Fund. Pursuant to the terms of a Subadvisory Agreement ("Subadvisory Agreement") between New York Life Investments and CBRE, New York Life Investments pays for the services of the Subadvisor.
Pursuant to the Management Agreement, the Fund pays the Manager a monthly fee for the services performed and the facilities furnished at an annual rate of 0.75% of the Fund's average daily net assets.
New York Life Investments has contractually agreed to waive fees and/or reimburse expenses so that Total Annual Fund Operating Expenses (excluding taxes, interest, litigation, extraordinary expenses, brokerage and other transaction expenses relating to the purchase or sale of portfolio investments and acquired (underlying) fund fees and expenses) do not exceed the following percentages of average daily net assets: Class A, 1.18%; Investor Class, 1.35%; Class C, 1.93%; Class I, 0.83%; Class R3, 1.43% and Class R6, 0.74%. This agreement will remain in effect until August 31, 2022, and shall renew automatically for one-year terms unless New York Life Investments provides written notice of termination prior to the start of the next term or upon approval of the Board.
During the year ended April 30, 2022, New York Life Investments earned fees from the Fund in the amount of $3,420,784 and waived fees and/or reimbursed expenses, including the waiver/reimbursement of certain class specific expenses in the amount of $770,498 and paid the Subadvisor fees in the amount of $1,325,143.
JPMorgan provides sub-administration and sub-accounting services to the Fund pursuant to an agreement with New York Life Investments. These services include calculating the daily NAVs of the Fund, maintaining the general ledger and sub-ledger accounts for the calculation of the Fund's NAVs, and assisting New York Life Investments
| MainStay CBRE Real Estate Fund |
in conducting various aspects of the Fund's administrative operations. For providing these services to the Fund, JPMorgan is compensated by New York Life Investments.
Pursuant to an agreement between the Trust and New York Life Investments, New York Life Investments is responsible for providing or procuring certain regulatory reporting services for the Fund. The Fund will reimburse New York Life Investments for the actual costs incurred by New York Life Investments in connection with providing or procuring these services for the Fund.
(B) Distribution and Service Fees. The Trust, on behalf of the Fund, has entered into a distribution agreement with NYLIFE Distributors LLC (the “Distributor”), an affiliate of New York Life Investments. The Fund has adopted distribution plans (the “Plans”) in accordance with the provisions of Rule 12b-1 under the 1940 Act.
Pursuant to the Class A and Investor Class Plans, the Distributor receives a monthly fee from the Class A and Investor Class shares at an annual rate of 0.25% of the average daily net assets of the Class A and Investor Class shares for distribution and/or service activities as designated by the Distributor. Pursuant to the Class C Plan, Class C shares pay the Distributor a monthly distribution fee at an annual rate of 0.75% of the average daily net assets of the Class C shares along with a service fee at an annual rate of 0.25% of the average daily net assets of the Class C shares, for a total 12b-1 fee of 1.00%. Pursuant to the Class R3 Plan, Class R3 shares pay the Distributor a monthly distribution fee at an annual rate of 0.25% of the average daily net assets of the Class R3 shares along with a service fee at an annual rate of 0.25% of the average daily net assets of the Class R3 shares, for a total 12b-1 fee of 0.50%. Class I and Class R6 shares are not subject to a distribution and/or service fee.
The Plans provide that the distribution and service fees are payable to the Distributor regardless of the amounts actually expended by the Distributor for distribution of the Fund's shares and service activities.
In accordance with the Shareholder Services Plans for the Class R3 shares, the Manager has agreed to provide, through its affiliates or independent third parties, various shareholder and administrative support services to shareholders of the Class R3 shares. For its services, the Manager, its affiliates or independent third-party service providers are entitled to a shareholder service fee accrued daily and paid monthly at an annual rate of 0.10% of the average daily net assets of the Class R3 shares. This is in addition to any fees paid under the Class R3 Plan.
During the year ended April 30, 2022, shareholder service fees incurred by the Fund were as follows:
(C) Sales Charges. The Fund was advised by the Distributor that the amount of initial sales charges retained on sales of Class A shares during the year ended April 30, 2022, were $11,130.
The Fund was also advised that the Distributor retained CDSCs on redemptions of Class A and Class C shares during the year ended April 30, 2022, of $1,376 and $171, respectively.
(D) Transfer, Dividend Disbursing and Shareholder Servicing Agent. NYLIM Service Company LLC, an affiliate of New York Life Investments, is the Fund's transfer, dividend disbursing and shareholder servicing agent pursuant to an agreement between NYLIM Service Company LLC and the Trust. NYLIM Service Company LLC has entered into an agreement with DST Asset Manager Solutions, Inc. ("DST"), pursuant to which DST performs certain transfer agent services on behalf of NYLIM Service Company LLC. New York Life Investments has contractually agreed to limit the transfer agency expenses charged to the Fund’s share classes to a maximum of 0.35% of that share class’s average daily net assets on an annual basis after deducting any applicable Fund or class-level expense reimbursement or small account fees. This agreement will remain in effect until August 31, 2022, and shall renew automatically for one-year terms unless New York Life Investments provides written notice of termination prior to the start of the next term or upon approval of the Board. During the year ended April 30, 2022, transfer agent expenses incurred by the Fund and any reimbursements, pursuant to the aforementioned Transfer Agency expense limitation agreement, were as follows:
(E) Small Account Fee. Shareholders with small accounts adversely impact the cost of providing transfer agency services. In an effort to reduce total transfer agency expenses, the Fund has implemented a small account fee on certain types of accounts. As described in the Fund's prospectus, certain shareholders with an account balance of less than $1,000 ($5,000 for Class A share accounts) are charged an annual per account fee of $20 (assessed semi-annually), the proceeds from which offset transfer agent fees as reflected in the Statement of Operations. This small account fee will not apply to certain types of accounts as described further in the Fund’s prospectus.
Notes to Financial Statements (continued)
Note 4-Federal Income Tax
As of April 30, 2022, the cost and unrealized appreciation (depreciation) of the Fund’s investment portfolio, including applicable derivative contracts and other financial instruments, as determined on a federal income tax basis, were as follows:
| | Gross
Unrealized
Appreciation | Gross
Unrealized
(Depreciation) | Net
Unrealized
Appreciation/
(Depreciation) |
| | | | |
As of April 30, 2022, the components of accumulated gain (loss) on a tax basis were as follows:
| Accumulated
Capital
and Other
Gain (Loss) | Other
Temporary
Differences | Unrealized
Appreciation
(Depreciation) | Total
Accumulated
Gain (Loss) |
| | | | |
The difference between book-basis and tax-basis unrealized appreciation (depreciation) is primarily due to wash sale adjustments. The other temporary differences are primarily due to Swiss reclaim.
The Fund utilized $4,075,359 of capital loss carryforwards during the year ended April 30, 2022.
During the years ended April 30, 2022 and April 30, 2021, the tax character of distributions paid as reflected in the Statements of Changes in Net Assets was as follows:
Note 5–Custodian
JPMorgan is the custodian of cash and securities held by the Fund. Custodial fees are charged to the Fund based on the Fund's net assets and/or the market value of securities held by the Fund and the number of certain transactions incurred by the Fund.
Note 6–Line of Credit
The Fund and certain other funds managed by New York Life Investments maintain a line of credit with a syndicate of banks in order to secure a source of funds for temporary purposes to meet unanticipated or excessive redemption requests.
Effective July 27, 2021, under the credit agreement (the “Credit Agreement”), the aggregate commitment amount is $600,000,000 with an additional uncommitted amount of $100,000,000. The commitment
fee is an annual rate of 0.15% of the average commitment amount payable quarterly, regardless of usage, to JPMorgan, who serves as the agent to the syndicate. The commitment fee is allocated among the Fund and certain other funds managed by New York Life Investments based upon their respective net assets and other factors. Interest on any revolving credit loan is charged based upon the Federal Funds Rate or the one-month London Interbank Offered Rate ("LIBOR"), whichever is higher. The Credit Agreement expires on July 26, 2022, although the Fund, certain other funds managed by New York Life Investments and the syndicate of banks may renew the Credit Agreement for an additional year on the same or different terms or enter into a credit agreement with a different syndicate of banks. Prior to July 27, 2021, the aggregate commitment amount and the commitment fee were the same as those under the current Credit Agreement. During the year ended April 30, 2022, there were no borrowings made or outstanding with respect to the Fund under the Credit Agreement.
Note 7–Interfund Lending Program
Pursuant to an exemptive order issued by the SEC, the Fund, along with certain other funds managed by New York Life Investments, may participate in an interfund lending program. The interfund lending program provides an alternative credit facility that permits the Fund and certain other funds managed by New York Life Investments to lend or borrow money for temporary purposes directly to or from one another, subject to the conditions of the exemptive order. During the year ended April 30, 2022, there were no interfund loans made or outstanding with respect to the Fund.
Note 8–Purchases and Sales of Securities (in 000’s)
During the year ended April 30, 2022, purchases and sales of securities, other than short-term securities, were $331,696 and $314,748, respectively.
Note 9–Capital Share Transactions
Transactions in capital shares for the years ended April 30, 2022 and April 30, 2021, were as follows:
| MainStay CBRE Real Estate Fund |
| | |
Year ended April 30, 2022: | | |
| | |
Shares issued to shareholders in reinvestment of distributions | | |
| | |
Net increase (decrease) in shares outstanding before conversion | | |
Shares converted into Class A (See Note 1) | | |
Shares converted from Class A (See Note 1) | | |
| | |
Year ended April 30, 2021: | | |
| | |
Shares issued to shareholders in reinvestment of distributions | | |
| | |
Net increase (decrease) in shares outstanding before conversion | | |
Shares converted into Class A (See Note 1) | | |
Shares converted from Class A (See Note 1) | | |
| | |
|
| | |
Year ended April 30, 2022: | | |
| | |
Shares issued to shareholders in reinvestment of distributions | | |
| | |
Net increase (decrease) in shares outstanding before conversion | | |
Shares converted into Investor Class (See Note 1) | | |
Shares converted from Investor Class (See Note 1) | | |
| | |
Year ended April 30, 2021: | | |
| | |
Shares issued to shareholders in reinvestment of distributions | | |
| | |
Net increase (decrease) in shares outstanding before conversion | | |
Shares converted into Investor Class (See Note 1) | | |
Shares converted from Investor Class (See Note 1) | | |
| | |
|
| | |
Year ended April 30, 2022: | | |
| | |
Shares issued to shareholders in reinvestment of distributions | | |
| | |
Net increase (decrease) in shares outstanding before conversion | | |
Shares converted from Class C (See Note 1) | | |
| | |
Year ended April 30, 2021: | | |
| | |
Shares issued to shareholders in reinvestment of distributions | | |
| | |
Net increase (decrease) in shares outstanding before conversion | | |
Shares converted from Class C (See Note 1) | | |
| | |
|
| | |
Year ended April 30, 2022: | | |
| | |
Shares issued to shareholders in reinvestment of distributions | | |
| | |
Net increase (decrease) in shares outstanding before conversion | | |
Shares converted into Class I (See Note 1) | | |
Shares converted from Class I (See Note 1) | | |
| | |
Year ended April 30, 2021: | | |
| | |
Shares issued to shareholders in reinvestment of distributions | | |
| | |
Net increase (decrease) in shares outstanding before conversion | | |
Shares converted into Class I (See Note 1) | | |
| | |
|
Notes to Financial Statements (continued)
| | |
Year ended April 30, 2022: | | |
| | |
Shares issued to shareholders in reinvestment of distributions | | |
| | |
Net increase (decrease) in shares outstanding before conversion | | |
Shares converted from Class R3 (See Note 1) | | |
| | |
Year ended April 30, 2021: | | |
| | |
Shares issued to shareholders in reinvestment of distributions | | |
| | |
Net increase (decrease) in shares outstanding before conversion | | |
Shares converted from Class R3 (See Note 1) | | |
| | |
|
| | |
Year ended April 30, 2022: | | |
| | |
Shares issued to shareholders in reinvestment of distributions | | |
| | |
Net increase (decrease) in shares outstanding before conversion | | |
Shares converted into Class R6 (See Note 1) | | |
| | |
Year ended April 30, 2021: | | |
| | |
Shares issued to shareholders in reinvestment of distributions | | |
| | |
| | |
Note 10–Other Matters
An outbreak of COVID-19, first detected in December 2019, has developed into a global pandemic and has resulted in travel restrictions, closure of international borders, certain businesses and securities markets, restrictions on securities trading activities, prolonged quarantines, supply chain disruptions, and lower consumer demand, as well as general concern and uncertainty. The continued impact of COVID-19 and related variants is uncertain and could further adversely affect the global economy, national economies, individual issuers and capital markets in unforeseeable ways and result in a substantial and extended economic downturn. Developments that disrupt global economies and financial markets, such as COVID-19, may magnify factors that affect the Fund's performance.
Note 11–Subsequent Events
In connection with the preparation of the financial statements of the Fund as of and for the year ended April 30, 2022, events and transactions subsequent to April 30, 2022, through the date the financial statements were issued have been evaluated by the Manager for possible adjustment and/or disclosure. No subsequent events requiring financial statement adjustment or disclosure have been identified.
| MainStay CBRE Real Estate Fund |
Report of Independent Registered Public Accounting Firm
To the Shareholders of the Fund and Board of Trustees
MainStay Funds Trust:
Opinion on the Financial Statements
We have audited the accompanying statement of assets and liabilities of MainStay CBRE Real Estate Fund (the Fund), one of the funds constituting MainStay Funds Trust, including the portfolio of investments, as of April 30, 2022, the related statement of operations for the year then ended, the statements of changes in net assets for each of the years in the two year period then ended, and the related notes (collectively, the financial statements) and the financial highlights for each of the years in the two-year period ended April 30, 2022, the period June 1, 2019 through April 30, 2020, and each of the years or periods in the three-year period ended May 31, 2019. In our opinion, the financial statements and financial highlights present fairly, in all material respects, the financial position of the Fund as of April 30, 2022, the results of its operations for the year then ended, the changes in its net assets for each of the years in the two year period then ended, and the financial highlights for each of the years in the two-year period ended April 30, 2022, the period June 1, 2019 through April 30, 2020, and each of the years or periods in the three-year period ended May 31, 2019, in conformity with U.S. generally accepted accounting principles.
Basis for Opinion
These financial statements and financial highlights are the responsibility of the Fund's management. Our responsibility is to express an opinion on these financial statements and financial highlights based on our audits. We are a public accounting firm registered with the Public Company Accounting Oversight Board (United States) (PCAOB) and are required to be independent with respect to the Fund in accordance with the U.S. federal securities laws and the applicable rules and regulations of the Securities and Exchange Commission and the PCAOB.
We conducted our audits in accordance with the standards of the PCAOB. Those standards require that we plan and perform the audit to obtain reasonable assurance about whether the financial statements and financial highlights are free of material misstatement, whether due to error or fraud. Our audits included performing procedures to assess the risks of material misstatement of the financial statements and financial highlights, whether due to error or fraud, and performing procedures that respond to those risks. Such procedures included examining, on a test basis, evidence regarding the amounts and disclosures in the financial statements and financial highlights. Such procedures also included confirmation of securities owned as of April 30, 2022, by correspondence with the custodian and the transfer agent. Our audits also included evaluating the accounting principles used and significant estimates made by management, as well as evaluating the overall presentation of the financial statements and financial highlights. We believe that our audits provide a reasonable basis for our opinion.
We have served as the auditor of one or more New York Life Investment Management investment companies since 2003.
Philadelphia, Pennsylvania
June 27, 2022
Board Consideration and Approval of Management Agreement and Subadvisory Agreement (Unaudited)
The continuation of the Management Agreement with respect to the MainStay CBRE Real Estate Fund (“Fund”) and New York Life Investment Management LLC (“New York Life Investments”) and the Subadvisory Agreement between New York Life Investments and CBRE Investment Management Listed Real Assets LLC (“CBRE”) with respect to the Fund (together, “Advisory Agreements”), following an initial term of up to two years, is subject to annual review and approval by the Board of Trustees of MainStay Funds Trust (“Board” of the “Trust”) in accordance with Section 15 of the Investment Company Act of 1940, as amended (“1940 Act”). At its December 8–9, 2021 meeting, the Board, including the Trustees who are not an “interested person” (as such term is defined in the 1940 Act) of the Trust (“Independent Trustees”) voting separately, unanimously approved the continuation of each of the Advisory Agreements for a one-year period.
In reaching the decision to approve the continuation of each of the Advisory Agreements, the Board considered information and materials furnished by New York Life Investments and CBRE in connection with an annual contract review process undertaken by the Board that took place at meetings of the Board and its Contracts Committee during September 2021 through December 2021, including information and materials furnished by New York Life Investments and CBRE in response to requests prepared on behalf of the Board, and in consultation with the Independent Trustees, by independent legal counsel to the Independent Trustees, which encompassed a variety of topics, including those summarized below. Information and materials requested by and furnished to the Board for consideration in connection with the contract review process included, among other items, reports on the Fund and “peer funds” prepared by Institutional Shareholder Services Inc. (“ISS”), an independent third-party service provider engaged by the Board to report objectively on the Fund’s investment performance, management fee and total expenses. The Board also considered information on the fees charged to other investment advisory clients of New York Life Investments and/or CBRE that follow investment strategies similar to those of the Fund, if any, and, when applicable, the rationale for any differences in the Fund’s management and subadvisory fees and the fees charged to those other investment advisory clients. In addition, the Board considered information regarding the legal standards and fiduciary obligations applicable to its consideration of the continuation of each of the Advisory Agreements. The contract review process, including the structure and format for information and materials provided to the Board, has been developed in consultation with the Board. The Independent Trustees also met in executive sessions with their independent legal counsel and, for portions thereof, with senior management of New York Life Investments.
The Board’s deliberations with respect to the continuation of each of the Advisory Agreements reflect a year-long process, and the Board also took into account information furnished to the Board and its Committees throughout the year, as deemed relevant and appropriate by the Trustees, including, among other items, reports on investment performance of the Fund and investment-related matters for the Fund as well as presentations from New York Life Investments and CBRE personnel. In addition, the Board took into account other information received from New
York Life Investments throughout the year, including, among other items, periodic reports on legal and compliance matters, risk management, portfolio turnover, brokerage commissions and non-advisory services provided to the Fund by New York Life Investments, as deemed relevant and appropriate by the Trustees.
In addition to information provided to the Board throughout the year, the Board received information in connection with its June 2021 meeting provided specifically in response to requests prepared on behalf of the Board, and in consultation with the Independent Trustees, by independent legal counsel to the Independent Trustees regarding the Fund’s distribution arrangements. In addition, the Board received information regarding the Fund’s asset levels, share purchase and redemption activity and the payment of Rule 12b-1 and/or other fees by the applicable share classes of the Fund, among other information.
In considering the continuation of each of the Advisory Agreements, the Trustees reviewed and evaluated the information and factors they believed to reasonably be necessary and appropriate in light of legal advice furnished to them by independent legal counsel to the Independent Trustees and through the exercise of their own business judgment. Although individual Trustees may have weighed certain factors or information differently and the Board did not consider any single factor or information controlling in reaching its decision, the factors considered by the Board are described in greater detail below and include, among other factors: (i) the nature, extent and quality of the services provided to the Fund by New York Life Investments and CBRE; (ii) the qualifications of the portfolio managers of the Fund and the historical investment performance of the Fund, New York Life Investments and CBRE; (iii) the costs of the services provided, and profits realized, by New York Life Investments and CBRE with respect to their relationships with the Fund; (iv) the extent to which economies of scale have been realized or may be realized if the Fund grows and the extent to which economies of scale have benefited or may benefit the Fund’s shareholders; and (v) the reasonableness of the Fund’s management and subadvisory fees and total ordinary operating expenses. Although the Board recognized that comparisons between the Fund’s fees and expenses and those of other funds are imprecise given different terms of agreements, variations in fund strategies and other factors, the Board considered the reasonableness of the Fund’s management fee and total ordinary operating expenses as compared to the peer funds identified by ISS. Throughout their considerations, the Trustees acknowledged the commitment of New York Life Investments and its affiliates to serve the MainStay Group of Funds, as well as their capacity, experience, resources, financial stability and reputations. The Trustees also acknowledged the entrepreneurial and other risks assumed by New York Life Investments in sponsoring and managing the Fund.
The Trustees noted that, throughout the year, the Trustees are afforded an opportunity to ask questions of, and request additional information or materials from, New York Life Investments and CBRE. The Board’s decision with respect to each of the Advisory Agreements may have also been based, in part, on the Board’s knowledge of New York Life Investments and CBRE resulting from, among other things, the Board’s
| MainStay CBRE Real Estate Fund |
consideration of each of the Advisory Agreements in prior years, the advisory agreements for other funds in the MainStay Group of Funds, the Board’s review throughout the year of the performance and operations of other funds in the MainStay Group of Funds and each Trustee’s business judgment and industry experience. In addition to considering the above-referenced factors, the Board observed that in the marketplace there are a range of investment options available to investors and that the Fund’s shareholders, having had the opportunity to consider other investment options, have chosen to invest in the Fund.
The factors that figured prominently in the Board’s decision to approve the continuation of each of the Advisory Agreements during its December 8–9, 2021 meeting are summarized in more detail below.
Nature, Extent and Quality of Services Provided by New York Life Investments and CBRE
The Board examined the nature, extent and quality of the services that New York Life Investments provides to the Fund. The Board evaluated New York Life Investments’ experience and capabilities in serving as manager of the Fund and considered that the Fund operates in a “manager-of-managers” structure. The Board also considered New York Life Investments’ responsibilities and services provided pursuant to this structure, including evaluating the performance of CBRE, making recommendations to the Board as to whether the Subadvisory Agreement should be renewed, modified or terminated and periodically reporting to the Board regarding the results of New York Life Investments’ evaluation and monitoring functions. The Board noted that New York Life Investments manages other mutual funds, serves a variety of other investment advisory clients, including other pooled investment vehicles, and has experience overseeing mutual fund service providers, including subadvisors. The Board considered the experience of senior personnel at New York Life Investments providing management and administrative and other non-advisory services to the Fund as well as New York Life Investments’ reputation and financial condition. The Board observed that New York Life Investments devotes significant resources and time to providing management and non-advisory services to the Fund, including New York Life Investments’ supervision and due diligence reviews of CBRE and ongoing analysis of, and interactions with, CBRE with respect to, among other things, the Fund’s investment performance and risks as well as CBRE’s investment capabilities and subadvisory services with respect to the Fund.
The Board also considered the range of services that New York Life Investments provides to the Fund under the terms of the Management Agreement, including: (i) fund accounting and ongoing supervisory services provided by New York Life Investments’ Fund Administration and Accounting Group; (ii) investment supervisory and analytical services provided by New York Life Investments’ Investment Consulting Group; (iii) compliance services provided by the Trust’s Chief Compliance Officer as well as New York Life Investments’ compliance department, including supervision and implementation of the Fund’s compliance program; (iv) legal services provided by New York Life Investments’ Office of the General Counsel; and (v) risk management monitoring and analysis by
compliance and investment personnel. The Board noted that New York Life Investments provides certain other non-advisory services to the Fund. In addition, the Board considered New York Life Investments’ willingness to invest in personnel and other resources, such as cyber security, information security and business continuity planning, designed to benefit the Fund and noted that New York Life Investments is responsible for compensating the Trust’s officers. The Board recognized that New York Life Investments has provided an increasingly broad array of non-advisory services to the MainStay Group of Funds as a result of regulatory and other developments. The Board considered benefits to the Fund’s shareholders from the Fund being part of the MainStay Group of Funds, including the privilege of exchanging investments between the same class of shares of funds in the MainStay Group of Funds, including without the imposition of a sales charge (if any).
The Board also examined the range, and the nature, extent and quality, of the investment advisory services that CBRE provides to the Fund and considered the terms of each of the Advisory Agreements. The Board evaluated CBRE’s experience and performance in serving as subadvisor to the Fund and advising other portfolios and CBRE’s track record and experience in providing investment advisory services, the experience of investment advisory, senior management and administrative personnel at CBRE and New York Life Investments’ and CBRE’s overall resources, legal and compliance environment, capabilities, reputation and history. In addition to information provided in connection with quarterly meetings with the Trust’s Chief Compliance Officer, the Board considered information regarding the compliance policies and procedures of New York Life Investments and CBRE and acknowledged their commitment to further developing and strengthening compliance programs relating to the Fund. The Board reviewed CBRE’s ability to attract and retain qualified investment professionals and willingness to invest in personnel to service and support the Fund. In this regard, the Board considered the qualifications and experience of the Fund’s portfolio managers, the number of accounts managed by the portfolio managers and the method for compensating the portfolio managers.
In addition, the Board considered information provided by New York Life Investments and CBRE regarding the operations of their respective business continuity plans in response to the ongoing COVID-19 pandemic, including the remote working environment.
Based on these considerations, the Board concluded that the Fund would likely continue to benefit from the nature, extent and quality of these services.
Investment Performance
In evaluating the Fund’s investment performance, the Board considered investment performance results over various periods in light of the Fund’s investment objective, strategies and risks. The Board considered investment reports on, and analysis of, the Fund’s performance provided to the Board throughout the year. These reports include, among other items, information on the Fund’s gross and net returns, the Fund’s investment performance compared to relevant investment categories and
Board Consideration and Approval of Management Agreement and Subadvisory Agreement (Unaudited) (continued)
the Fund’s benchmarks, the Fund’s risk-adjusted investment performance and the Fund’s investment performance as compared to peer funds, as appropriate, as well as portfolio attribution information and commentary on the effect of market conditions. The Board also considered information provided by ISS showing the investment performance of the Fund as compared to peer funds.
The Board also gave weight to its discussions with senior management at New York Life Investments concerning the Fund’s investment performance attributable to CBRE as well as discussions between the Fund’s portfolio management team and the members of the Board’s Investment Committee, which generally occur on an annual basis. In addition, the Board considered any specific actions that New York Life Investments or CBRE had taken, or had agreed to take, to seek to enhance Fund investment performance and the results of those actions.
Based on these considerations, the Board concluded that its review of the Fund’s investment performance and related information supported a determination to approve the continuation of each of the Advisory Agreements.
Costs of the Services Provided, and Profits Realized, by New York Life Investments and CBRE
The Board considered the costs of the services provided under each of the Advisory Agreements. The Board also considered the profits realized by New York Life Investments and its affiliates and CBRE due to their relationships with the Fund. The Board considered that CBRE’s subadvisory fee had been negotiated at arm’s-length by New York Life Investments and that this fee is paid by New York Life Investments, not the Fund, and the relevance of CBRE’s profitability was considered by the Trustees in that context. On this basis, the Board primarily considered the costs and profitability for New York Life Investments and its affiliates with respect to the Fund.
In addition, the Board acknowledged the difficulty in obtaining reliable comparative data about mutual fund managers’ profitability because such information generally is not publicly available and may be impacted by numerous factors, including the structure of a fund manager’s organization, the types of funds it manages, the methodology used to allocate certain fixed costs to specific funds and the manager’s capital structure and costs of capital.
In evaluating the costs of the services provided by New York Life Investments and CBRE and profits realized by New York Life Investments and its affiliates and CBRE, the Board considered, among other factors, New York Life Investments’ and its affiliates’ and CBRE’s continuing investments in, or willingness to invest in, personnel and other resources to support and further enhance the management of the Fund, and that New York Life Investments is responsible for paying the subadvisory fee for the Fund. The Board also considered the financial resources of New York Life Investments and CBRE and acknowledged that New York Life Investments and CBRE must be in a position to attract and retain experienced professional personnel and to maintain a strong financial position for New York Life Investments and CBRE to continue to provide
high-quality services to the Fund. The Board recognized that the Fund benefits from the allocation of certain fixed costs among the funds in the MainStay Group of Funds, among other expected benefits resulting from its relationship with New York Life Investments.
The Board considered information regarding New York Life Investments’ methodology for calculating profitability and allocating costs provided by New York Life Investments in connection with the fund profitability analysis presented to the Board. The Board previously engaged an independent consultant to review the methods used to allocate costs among the funds in the MainStay Group of Funds. The Board noted that the independent consultant had concluded that New York Life Investments’ methods for allocating costs and procedures for estimating overall profitability of the relationship with the funds in the MainStay Group of Funds are reasonable and that New York Life Investments continued to use the same method of calculating profit and allocating costs since the independent consultant’s review. The Board recognized the difficulty in calculating and evaluating a manager’s profitability with respect to the Fund and noted that other profitability methodologies may also be reasonable.
The Board also considered certain fall-out benefits that may be realized by New York Life Investments and its affiliates due to their relationships with the Fund, including reputational and other indirect benefits. The Board recognized, for example, the benefits to CBRE from legally permitted “soft-dollar” arrangements by which brokers provide research and other services to CBRE in exchange for commissions paid by the Fund with respect to trades in the Fund’s portfolio securities. In this regard, the Board also requested and considered information from New York Life Investments concerning other material business relationships between CBRE and its affiliates and New York Life Investments and its affiliates and considered the existence of a strategic partnership between New York Life Investments and CBRE that relates to certain current and future products that represents a conflict of interest associated with New York Life Investments’ recommendation to approve the Subadvisory Agreement. In addition, the Board considered its review of a money market fund advised by New York Life Investments and an affiliated subadvisor that serves as an investment option for the Fund, including the potential rationale for and costs associated with investments in this money market fund by the Fund, if any, and considered information from New York Life Investments that the nature and type of specific investment advisory services provided to this money market fund are distinct from, or in addition to, the investment advisory services provided to the Fund.
The Board observed that, in addition to fees earned by New York Life Investments for managing the Fund, New York Life Investments’ affiliates also earn revenues from serving the Fund in various other capacities, including as the Fund’s transfer agent and distributor. The Board considered information about these other revenues and their impact on the profitability of the relationship with the Fund to New York Life Investments and its affiliates. The Board noted that, although it assessed the overall profitability of the Fund to New York Life Investments and its affiliates as part of the contract review process, when considering the reasonableness of the fee paid to New York Life Investments under the
| MainStay CBRE Real Estate Fund |
Management Agreement, the Board considered the profitability of New York Life Investments’ relationship with the Fund on a pre-tax basis and without regard to distribution expenses incurred by New York Life Investments from its own resources.
After evaluating the information deemed relevant by the Trustees, the Board concluded that any profits realized by New York Life Investments and its affiliates due to their relationships with the Fund were not excessive. With respect to CBRE, the Board considered that any profits realized by CBRE due to its relationship with the Fund are the result of arm’s-length negotiations between New York Life Investments and CBRE, acknowledging that any such profits are based on the subadvisory fee paid to CBRE by New York Life Investments, not the Fund.
Management and Subadvisory Fees and Total Ordinary Operating Expenses
The Board evaluated the reasonableness of the fee paid under each of the Advisory Agreements and the Fund’s total ordinary operating expenses. The Board primarily considered the reasonableness of the management fee paid by the Fund to New York Life Investments because the subadvisory fee paid to CBRE is paid by New York Life Investments, not the Fund. The Board also considered the reasonableness of the subadvisory fee paid by New York Life Investments and the amount of the management fee retained by New York Life Investments.
In assessing the reasonableness of the Fund’s fees and expenses, the Board primarily considered comparative data provided by ISS on the fees and expenses charged by similar mutual funds managed by other investment advisers. In addition, the Board considered information provided by New York Life Investments and CBRE on fees charged to other investment advisory clients, including institutional separate accounts and/or other funds that follow investment strategies similar to those of the Fund, if any. The Board considered the similarities and differences in the contractual management fee schedules of the Fund and those of the similarly-managed accounts and/or funds, taking into account the rationale for any differences in fee schedules. The Board also took into account explanations provided by New York Life Investments about the more extensive scope of services provided to registered investment companies, such as the Fund, as compared with other investment advisory clients. Additionally, the Board considered the impact of voluntary waivers and expense limitation arrangements on the Fund’s net management fee and expenses. The Board also considered that in proposing fees for the Fund, New York Life Investments considers the competitive marketplace for mutual funds.
The Board took into account information from New York Life Investments regarding the reasonableness of the Fund’s transfer agent fee schedule, including industry data demonstrating that the fees that NYLIM Service Company LLC, an affiliate of New York Life Investments and the Fund’s transfer agent, charges the Fund are within the range of fees charged by transfer agents to other mutual funds. In addition, the Board considered NYLIM Service Company LLC’s profitability in connection with the transfer agent services it provides to the Fund. The Board also took into account
information received from NYLIM Service Company LLC regarding the sub-transfer agency payments it made to intermediaries in connection with the provision of sub-transfer agency services to the Fund.
The Board considered the extent to which transfer agent fees comprised total expenses of the Fund. The Board acknowledged the role that the MainStay Group of Funds historically has played in serving the investment needs of New York Life Insurance Company customers, who often maintain smaller account balances than other shareholders of funds, and the impact of small accounts on the expense ratios of Fund share classes. The Board also recognized measures that it and New York Life Investments have taken to mitigate the effect of small accounts on the expense ratios of Fund share classes, including through the imposition of an expense limitation on net transfer agency expenses. The Board also considered that NYLIM Service Company LLC had waived its contractual cost of living adjustments during the seven years prior to 2021.
Based on the factors outlined above, the Board concluded that the Fund’s management fee and total ordinary operating expenses were within a range that is competitive and support a conclusion that these fees and expenses are reasonable.
Economies of Scale
The Board considered information regarding economies of scale, including whether the Fund’s expense structure permits economies of scale to be appropriately shared with the Fund’s shareholders. The Board also considered a report from New York Life Investments, previously prepared at the request of the Board, that addressed economies of scale, including with respect to the mutual fund business generally, and the various ways in which the benefits of economies of scale may be shared with the funds in the MainStay Group of Funds. Although the Board recognized the difficulty of determining economies of scale with precision, the Board acknowledged that economies of scale may be shared with the Fund in a number of ways, including, for example, through the imposition of fee breakpoints, initially setting management fee rates at scale or making additional investments to enhance services. The Board reviewed information from New York Life Investments showing how the Fund’s management fee schedule compared to fee schedules of other funds and accounts managed by New York Life Investments. The Board also reviewed information from ISS showing how the Fund’s management fee schedule compared with fees paid for similar services by peer funds at varying asset levels.
Based on this information, the Board concluded that economies of scale are appropriately reflected for the benefit of the Fund’s shareholders through the Fund’s expense structure and other methods to share benefits from economies of scale.
Board Consideration and Approval of Management Agreement and Subadvisory Agreement (Unaudited) (continued)
Conclusion
On the basis of the information and factors summarized above, among other information and factors deemed relevant by the Trustees, and the evaluation thereof, the Board, including the Independent Trustees voting separately, unanimously voted to approve the continuation of each of the Advisory Agreements.
| MainStay CBRE Real Estate Fund |
Discussion of the Operation and Effectiveness of the Fund's Liquidity Risk Management Program (Unaudited)
In compliance with Rule 22e-4 under the Investment Company Act of 1940, as amended (the “Liquidity Rule”), the Fund has adopted and implemented a liquidity risk management program (the “Program”), which New York Life Investment Management LLC believes is reasonably designed to assess and manage the Fund's liquidity risk (the risk that the Fund could not meet requests to redeem shares issued by the Fund without significant dilution of remaining investors’ interests in the Fund). The Board of Trustees of MainStay Funds Trust (the "Board") designated New York Life Investment Management LLC as administrator of the Program (the “Administrator”). The Administrator has established a Liquidity Risk Management Committee to assist the Administrator in the implementation and day-to-day administration of the Program and to otherwise support the Administrator in fulfilling its responsibilities under the Program.
At a meeting of the Board held on March 9, 2022, the Administrator provided the Board with a written report addressing the Program’s operation and assessing its adequacy and effectiveness of implementation for the period from January 1, 2021 through December 31, 2021 (the "Review Period"), as required under the Liquidity Rule. The report noted that the Administrator concluded that (i) the Program operated effectively to assess and manage the Fund's liquidity risk, (ii) the Program has been adequately and effectively implemented to monitor and, as applicable, respond to the Fund's liquidity developments and (iii) the Fund's investment strategy continues to be appropriate for an open-end fund. In addition, the report summarized the operation of the Program and the information and factors considered by the Administrator in its assessment of the Program’s implementation, such as the liquidity risk assessment framework and the liquidity classification methodologies, and discussed notable events that impacted liquidity risk during the Review Period.
In accordance with the Program, the Fund's liquidity risk is assessed no less frequently than annually taking into consideration certain factors, as applicable, such as (i) investment strategy and liquidity of portfolio investments, (ii) short-term and long-term cash flow projections and (iii) holdings of cash and cash equivalents, as well as borrowing arrangements and other funding sources. Certain factors are considered under both normal and reasonably foreseeable stressed conditions.
Each Fund portfolio investment is classified into one of four liquidity categories. The classification is based on a determination of the number of days it is reasonably expected to take to convert the investment into cash, or sell or dispose of the investment, in current market conditions without significantly changing the market value of the investment. The Administrator has delegated liquidity classification determinations to the Fund’s subadvisor, subject to appropriate oversight by the Administrator, and liquidity classification determinations are made by taking into account the Fund's reasonably anticipated trade size, various market, trading and investment-specific considerations, as well as market depth, and, in certain cases, third-party vendor data.
The Liquidity Rule requires funds that do not primarily hold assets that are highly liquid investments to adopt a minimum amount of net assets that must be invested in highly liquid investments that are assets (an “HLIM”). In addition, the Liquidity Rule limits a fund's investments in illiquid investments. Specifically, the Liquidity Rule prohibits acquisition of illiquid investments if doing so would result in a fund holding more than 15% of its net assets in illiquid investments that are assets. The Program includes provisions reasonably designed to determine, periodically review and comply with the HLIM requirement, as applicable, and to comply with the 15% limit on illiquid investments.
There can be no assurance that the Program will achieve its objectives under all circumstances in the future. Please refer to the Fund's prospectus for more information regarding the Fund's exposure to liquidity risk and other risks to which it may be subject.
Federal Income Tax
Information (Unaudited)
The Fund is required under the Internal Revenue Code to advise shareholders in a written statement as to the federal tax status of dividends paid by the Fund during such fiscal years.
Accordingly, the Fund paid $5,532,113 as long term capital gain distributions.
For the fiscal year ended April 30, 2022, the Fund designated approximately $2,308 under the Internal Revenue Code as qualified dividend income eligible for reduced tax rates.
In February 2023, shareholders will receive an IRS Form 1099-DIV or substitute Form 1099, which will show the federal tax status of the distributions received by shareholders in calendar year 2022. The amounts that will be reported on such 1099-DIV or substitute Form 1099 will be the amounts you are to use on your federal income tax return and will differ from the amounts which we must report for the Fund's fiscal year ended April 30, 2022.
Proxy Voting Policies and Procedures and Proxy Voting Record
The Fund is required to file with the SEC its proxy voting record for the 12-month period ending June 30 on Form N-PX. A description of the policies and procedures that are used to vote proxies relating to portfolio securities of the Fund is available free of charge upon request by calling 800-624-6782 or visiting the SEC’s website at www.sec.gov. The most recent Form N-PX or proxy voting record is available free of charge upon request by calling 800-624-6782; visiting newyorklifeinvestments.com; or visiting the SEC’s website at www.sec.gov.
Shareholder Reports and Quarterly Portfolio Disclosure
The Fund is required to file its complete schedule of portfolio holdings with the SEC 60 days after its first and third fiscal quarter on Form N-PORT. The Fund's holdings report is available free of charge upon request by calling New York Life Investments at 800-624-6782.
| MainStay CBRE Real Estate Fund |
Board of Trustees and Officers (Unaudited)
The Trustees and officers of the Fund are listed below. The Board oversees the MainStay Group of Funds (which consists of MainStay Funds and MainStay Funds Trust), MainStay VP Funds Trust, MainStay MacKay DefinedTerm Municipal Opportunities Fund, MainStay CBRE Global Infrastructure Megatrends Fund, the Manager and the Subadvisors, and elects the officers of the Funds who are responsible for the day-to-day operations of the Fund. Information pertaining to the Trustees and officers is set forth below. Each Trustee serves until his or her successor is elected and qualified or until his or her resignation, death or removal. Under the Board’s retirement policy, unless an exception is made, a
Trustee must tender his or her resignation by the end of the calendar year during which he or she reaches the age of 75. Mr. Nolan reached the age of 75 during the calendar year 2021. Accordingly, Mr. Nolan retired at the end of calendar year 2021, at which time, Ms. Hammond became a Trustee of the Funds. Officers are elected annually by the Board. The business address of each Trustee and officer listed below is 51 Madison Avenue, New York, New York 10010. A majority of the Trustees are not “interested persons” (as defined by the 1940 Act and rules adopted by the SEC thereunder) of the Fund (“Independent Trustees”).
| | Term of Office,
Position(s) Held and
Length of Service | Principal Occupation(s)
During Past Five Years | Number of
Portfolios in
Fund Complex
Overseen by
Trustee | Other Directorships
Held by Trustee |
| | | | | |
| | MainStay Funds: Trustee
since 2017;
MainStay Funds Trust:
Trustee since 2017 | Senior Vice President of New York Life since joining in 2010, Member of the Executive Management Committee since 2017, Chief Executive Officer, New York Life Investment Management Holdings LLC & New York Life Investment Management LLC since 2015. Senior Managing Director and Co-President of New York Life Investment Management LLC from January 2014 to May 2015. Previously held positions of increasing responsibility, including head of NYLIM International, Alternative Growth Businesses, and Institutional investments since joining New York Life in 2010 | | MainStay VP Funds Trust:
Trustee since 2017 (31 portfolios);
MainStay MacKay DefinedTerm Municipal Opportunities Fund: Trustee
since 2017;
MainStay CBRE Global Infrastructure Megatrends Fund: Trustee
since March 2021; and
Turtle Beach Corporation: Director since April 2021 |
*
This Trustee is considered to be an “interested person” of the MainStay Group of Funds, MainStay VP Funds Trust, MainStay CBRE Global Infrastructure Megatrends Fund and MainStay MacKay DefinedTerm Municipal Opportunities Fund, within the meaning of the 1940 Act because of her affiliation with New York Life Insurance Company, New York Life Investment Management LLC, Candriam Belgium S.A., Candriam Luxembourg S.C.A., IndexIQ Advisors LLC, MacKay Shields LLC, NYL Investors LLC, NYLIFE Securities LLC and/or NYLIFE Distributors LLC, as described in detail above in the column entitled “Principal Occupation(s) During Past Five Years.”
Board of Trustees and Officers (Unaudited) (continued)
| | Term of Office,
Position(s) Held and
Length of Service | Principal Occupation(s)
During Past Five Years | Number of
Portfolios in
Fund Complex
Overseen by
Trustee | Other Directorships
Held by Trustee |
| | | | | |
| | MainStay Funds: Trustee since 2016, Advisory Board Member (June 2015 to December 2015);
MainStay Funds Trust: Trustee since 2016, Advisory Board Member (June 2015 to December 2015) | Founder and CEO, DanCourt Management, LLC since 1999 | | MainStay VP Funds Trust: Trustee since 2016, Advisory Board Member (June 2015 to December 2015) (31 portfolios);
MainStay MacKay DefinedTerm Municipal Opportunities Fund: Trustee since 2016, Advisory Board Member (June 2015 to December 2015);
MainStay CBRE Global Infrastructure Megatrends Fund: Trustee since June 2021; VanEck Vectors Group of Exchange-Traded Funds: Independent Chairman of the Board of Trustees since 2008 and Trustee since 2006 (56 portfolios); and Berea College of Kentucky: Trustee since 2009, Chair of the Investment Committee since 2018 |
| | MainStay Funds: Chairman since 2017 and Trustee since 2007;
MainStay Funds Trust: Chairman since 2017 and Trustee since 1990** | President, Strategic Management Advisors LLC since 1990 | | MainStay VP Funds Trust: Chairman since January 2017 and Trustee since 2007 (31 portfolios)***;
MainStay MacKay DefinedTerm Municipal Opportunities Fund: Chairman since 2017 and Trustee since 2011;
MainStay CBRE Global Infrastructure Megatrends Fund: Trustee since June 2021; and Legg Mason Partners Funds: Trustee since 1991 (45 portfolios) |
| | MainStay Funds: Trustee since 2006;
MainStay Funds Trust: Trustee since 2007** | Retired; Partner, Ernst & Young LLP (2002 to 2003); Partner, Arthur Andersen LLP (1989 to 2002); Consultant to the MainStay Funds Audit and Compliance Committee (2004 to 2006) | | MainStay VP Funds Trust: Trustee since 2007 (31 portfolios)***;
MainStay MacKay DefinedTerm Municipal Opportunities Fund: Trustee since 2011; and
MainStay CBRE Global Infrastructure Megatrends Fund: Trustee since June 2021 |
| Richard H. Nolan, Jr.
1946**** | MainStay Funds: Trustee since 2007;
MainStay Funds Trust: Trustee since 2007** | Managing Director, ICC Capital Management since 2004; President—Shields/Alliance, Alliance Capital Management (1994 to 2004) | | MainStay VP Funds Trust: Trustee since 2006 (31 portfolios)***;
MainStay MacKay DefinedTerm Municipal Opportunities Fund: Trustee since 2011; and
MainStay CBRE Global Infrastructure Megatrends Fund: Trustee since June 2021 |
| MainStay CBRE Real Estate Fund |
| | Term of Office, Position(s) Held and Length of Service | Principal Occupation(s) During Past Five Years | Number of Portfolios in Fund Complex Overseen by Trustee | Other Directorships Held by Trustee |
| | | | | |
| | MainStay Funds: Trustee since December 2021, Advisory Board Member (June 2021 to December 2021);
MainStay Funds Trust:
Trustee since December 2021, Advisory Board Member (June 2021 to December 2021)
| Retired, Managing Director, Devonshire Investors (2007 to 2013); Senior Vice President, Fidelity Management & Research Co. (2005 to 2007); Senior Vice President and Corporate Treasurer, FMR Corp. (2003 to 2005); Chief Operating Officer, Fidelity Investments Japan (2001 to 2003) | | MainStay VP Funds Trust: Trustee since December 2021, Advisory Board Member (June 2021 to December 2021) (31 Portfolios);
MainStay MacKay DefinedTerm Municipal Opportunities Fund: Trustee since December 2021, Advisory Board Member (June 2021 to December 2021);
MainStay CBRE Global Infrastructure Megatrends Fund: Trustee since December 2021, Advisory Board Member (June 2021 to December 2021);
Two Harbors Investment Corp.: Member since 2018, Chair of the Special Committee since 2019;
Rhode Island School of Design: Director and Chair of the Finance Committee since 2015; and
Blue Cross Blue Shield of Rhode Island: Director since 2019 |
| | MainStay Funds: Trustee since 2016, Advisory Board Member (June 2015 to December 2015);
MainStay Funds Trust: Trustee since 2016, Advisory Board Member (June 2015 to December 2015) | Founder and Chief Executive Officer, CapShift Advisors LLC since 2018; President, Fidelity Management & Research Company (2009 to 2014); President and Chief Investment Officer, Geode Capital Management, LLC (2001 to 2009) | | MainStay VP Funds Trust: Trustee since 2016, Advisory Board Member (June 2015 to December 2015) (31 portfolios);
MainStay MacKay DefinedTerm Municipal Opportunities Fund: Trustee since 2016, Advisory Board Member (June 2015 to December 2015);
MainStay CBRE Global Infrastructure Megatrends Fund: Trustee since June 2021; Partners in Health: Trustee since 2019; Allstate Corporation: Director since 2015; and MSCI, Inc.: Director since 2017 |
| | MainStay Funds: Trustee since 1994;
MainStay Funds Trust: Trustee since 2007** | Chairman and Chief Executive Officer, Somerset & Company (financial advisory firm) since 2004; Managing Director, The Carlyle Group (private investment firm) (2002 to 2004); Senior Managing Director, Partner and Board Member, Groupe Arnault S.A. (private investment firm) (1999 to 2002)
| | MainStay VP Funds Trust: Trustee since 2007 (31 portfolios)***;
MainStay MacKay DefinedTerm Municipal Opportunities Fund: Trustee since 2011; and MainStay CBRE Global Infrastructure Megatrends Fund; Trustee since June 2021 |
**
Includes prior service as a Director/Trustee of certain predecessor entities to MainStay Funds Trust.
***
Includes prior service as a Director of MainStay VP Series Fund, Inc., the predecessor to MainStay VP Funds Trust.
****
Pursuant to the Board's retirement policy, Mr. Nolan retired from the Board effective December 31, 2021.
Board of Trustees and Officers (Unaudited) (continued)
| | Position(s) Held and
Length of Service | Principal Occupation(s)
During Past Five Years | |
| | | | |
| | President, MainStay Funds, MainStay Funds Trust since 2017 | Chief Operating Officer and Senior Managing Director since 2016, New York Life Investment Management LLC and New York Life Investment Management Holdings LLC; Member of the Board of Managers (since 2017) and Senior Managing Director (since 2018), NYLIFE Distributors LLC; Chairman of the Board and Senior Managing Director, NYLIM Service Company LLC since 2017; Trustee, President and Principal Executive Officer of IndexIQ Trust, IndexIQ ETF Trust and IndexIQ Active ETF Trust since January 2018; President, MainStay MacKay DefinedTerm Municipal Opportunities Fund and MainStay VP Funds Trust since 2017** and MainStay CBRE Global Infrastructure Megatrends Fund since 2021; Senior Managing Director, Global Product Development (2015 to 2016); Managing Director, Product Development (2010 to 2015), New York Life Investment Management LLC | |
| | Treasurer and Principal Financial and Accounting Officer, MainStay Funds since 2007, MainStay Funds Trust since 2009 | Managing Director, New York Life Investment Management LLC since 2007; Treasurer and Principal Financial and Accounting Officer, MainStay MacKay DefinedTerm Municipal Opportunities Fund since 2011, MainStay VP Funds Trust since 2007** and MainStay CBRE Global Infrastructure Megatrends Fund since 2021; and Assistant Treasurer, New York Life Investment Management Holdings LLC (2008 to 2012) | |
| | Secretary and Chief Legal Officer, MainStay Funds and MainStay Funds Trust since 2010 | Managing Director and Associate General Counsel, New York Life Investment Management LLC since 2010; Secretary and Chief Legal Officer, MainStay MacKay DefinedTerm Municipal Opportunities Fund since 2011, MainStay VP Funds Trust since 2010** and MainStay CBRE Global Infrastructure Megatrends Fund since 2021 | |
| | Vice President— Administration, MainStay Funds since 2005, MainStay Funds Trust since 2009 | Managing Director, New York Life Investment Management LLC (including predecessor advisory organizations) since 2000; Member of the Board of Directors, New York Life Trust Company since 2009; Vice President—Administration, MainStay MacKay DefinedTerm Municipal Opportunities Fund since 2011, MainStay VP Funds Trust since 2005** and MainStay CBRE Global Infrastructure Megatrends Fund since 2021 | |
| | Vice President and Chief Compliance Officer, MainStay Funds and MainStay Funds Trust since 2021 and 2014 to 2020 | Vice President and Chief Compliance Officer, New York Life Investments Alternatives LLC and New York Life Investment Management Holdings LLC (since 2020); Vice President (since 2018) and Chief Compliance Officer (since 2016), New York Life Investment Management LLC; Vice President and Chief Compliance Officer, IndexIQ Advisors LLC, IndexIQ Holdings Inc., IndexIQ LLC and IndexIQ Trust (since 2017); Director and Associate General Counsel (2011 to 2014) and Vice President and Assistant General Counsel (2010 to 2011), New York Life Investment Management LLC; Vice President and Chief Compliance Officer, MainStay VP Funds Trust and MainStay MacKay DefinedTerm Municipal Opportunities Fund (since June 2021 and 2014 to 2020) and MainStay CBRE Global Infrastructure Megatrends Fund (since 2021); Assistant Secretary, MainStay Funds, MainStay Funds Trust and MainStay VP Funds Trust (2010 to 2014)**, MainStay MacKay DefinedTerm Municipal Opportunities Fund (2011 to 2014) | |
*
The officers listed above are considered to be “interested persons” of the MainStay Group of Funds, MainStay VP Funds Trust, MainStay CBRE Global Infrastructure Megatrends Fund and MainStay MacKay DefinedTerm Municipal Opportunities Fund within the meaning of the 1940 Act because of their affiliation with the MainStay Group of Funds, New York Life Insurance Company and/or its affiliates, including New York Life Investment Management LLC, NYLIM Service Company LLC, NYLIFE Securities LLC and/or NYLIFE Distributors LLC, as described in detail in the column captioned “Principal Occupation(s) During Past Five Years.” Officers are elected annually by the Board.
**
Includes prior service as an Officer of MainStay VP Series Fund, Inc., the predecessor to MainStay VP Funds Trust.
Officers of the Trust (Who are not Trustees)*
| MainStay CBRE Real Estate Fund |
This page intentionally left blank.
This page intentionally left blank.
Equity
U.S. Equity
MainStay Epoch U.S. Equity Yield Fund
MainStay S&P 500 Index Fund1
MainStay Winslow Large Cap Growth Fund
MainStay WMC Enduring Capital Fund
MainStay WMC Growth Fund
MainStay WMC Small Companies Fund
MainStay WMC Value Fund
International Equity
MainStay Epoch International Choice Fund
MainStay MacKay International Equity Fund
MainStay WMC International Research Equity Fund
Emerging Markets Equity
MainStay Candriam Emerging Markets Equity Fund
Global Equity
MainStay Epoch Capital Growth Fund
MainStay Epoch Global Equity Yield Fund
Fixed Income
Taxable Income
MainStay Candriam Emerging Markets Debt Fund
MainStay Floating Rate Fund
MainStay MacKay High Yield Corporate Bond Fund
MainStay MacKay Short Duration High Yield Fund
MainStay MacKay Strategic Bond Fund
MainStay MacKay Total Return Bond Fund
MainStay MacKay U.S. Infrastructure Bond Fund
MainStay Short Term Bond Fund
Tax-Exempt Income
MainStay MacKay California Tax Free Opportunities Fund2
MainStay MacKay High Yield Municipal Bond Fund
MainStay MacKay New York Tax Free Opportunities Fund3
MainStay MacKay Short Term Municipal Fund
MainStay MacKay Strategic Municipal Allocation Fund4
MainStay MacKay Tax Free Bond Fund
Money Market
MainStay Money Market Fund
Mixed Asset
MainStay Balanced Fund
MainStay Income Builder Fund
MainStay MacKay Convertible Fund
Speciality
MainStay CBRE Global Infrastructure Fund
MainStay CBRE Real Estate Fund
MainStay Cushing MLP Premier Fund
Asset Allocation
MainStay Conservative Allocation Fund
MainStay Conservative ETF Allocation Fund
MainStay Defensive ETF Allocation Fund
MainStay Equity Allocation Fund
MainStay Equity ETF Allocation Fund
MainStay ESG Multi-Asset Allocation Fund
MainStay Growth Allocation Fund
MainStay Growth ETF Allocation Fund
MainStay Moderate Allocation Fund
MainStay Moderate ETF Allocation Fund
Manager
New York Life Investment Management LLC
New York, New York
Subadvisors
Candriam Belgium S.A.5
Brussels, Belgium
Candriam Luxembourg S.C.A.5
Strassen, Luxembourg
CBRE Investment Management Listed Real Assets LLC
Radnor, Pennsylvania
Cushing Asset Management, LP
Dallas, Texas
Epoch Investment Partners, Inc.
New York, New York
MacKay Shields LLC5
New York, New York
NYL Investors LLC5
New York, New York
Wellington Management Company LLP
Boston, Massachusetts
Winslow Capital Management, LLC
Minneapolis, Minnesota
Legal Counsel
Dechert LLP
Washington, District of Columbia
Independent Registered Public Accounting Firm
KPMG LLP
Philadelphia, Pennsylvania
Distributor
NYLIFE Distributors LLC5
Jersey City, New Jersey
Custodian
JPMorgan Chase Bank, N.A.
New York, New York
1. Prior to February 28, 2022, the Fund's name was MainStay MacKay S&P 500 Index Fund.
2. This Fund is registered for sale in AZ, CA, NV, OR, TX, UT, WA and MI (Class A and Class I shares only), and CO, FL, GA, HI, ID, MA, MD, NH, NJ and NY (Class I shares only).
3. This Fund is registered for sale in CA, CT, DE, FL, MA, NJ, NY and VT.
4. Prior to November 30, 2021, the Fund's name was MainStay MacKay Intermediate Tax Free Bond Fund.
5. An affiliate of New York Life Investment Management LLC.
Not part of the Annual Report
For more information
800-624-6782
newyorklifeinvestments.com
“New York Life Investments” is both a service mark, and the common trade name, of certain investment advisors affiliated with New York Life Insurance Company. The MainStay Funds® are managed by New York Life Investment Management LLC and distributed by NYLIFE Distributors LLC, 30 Hudson Street, Jersey City, NJ 07302, a wholly owned subsidiary of New York Life Insurance Company. NYLIFE Distributors LLC is a Member FINRA/SIPC.
©2022 NYLIFE Distributors LLC. All rights reserved.
1856716MS086-22
MSCBRE11-06/22
(NYLIM) NL480
MainStay ETF Asset Allocation Funds
Message from the President and Annual ReportApril 30, 2022
MainStay Defensive ETF Allocation Fund |
MainStay Conservative ETF Allocation Fund |
MainStay Moderate ETF Allocation Fund |
MainStay Growth ETF Allocation Fund |
MainStay Equity ETF Allocation Fund |
MainStay ESG Multi-Asset Allocation Fund |
Sign up for e-delivery of your shareholder reports. For full details on e-delivery, including who can participate and what you can receive via e-delivery,
please log in to newyorklifeinvestments.com/accounts.
| | | | Not Insured by Any Government Agency |
This page intentionally left blank
Message from the President
The 12-month reporting period ended April 30, 2022, started on a generally positive note. Despite a new wave of COVID-19 infections that disrupted life and commerce, financial markets were buoyed during the spring and summer of 2021 by economic recovery and the widespread availability of vaccines. Most global economies expanded, exceeding pre-pandemic levels, as businesses reopened and supportive government policies bore fruit. As the period progressed, however, inflation began to creep up in response to government stimulus and accommodative monetary policies. Rising prices were further aggravated by wage increases, pandemic-related supply-chain bottlenecks and commodity price spikes. Bond prices slid as interest rates rose, and equity markets faltered. Market sentiment turned increasingly negative in the first quarter of 2022 as aggressive Russian rhetoric regarding Ukraine culminated in Russia’s invasion of its neighbor – a development that exacerbated global inflationary pressures while increasing investor uncertainty. Domestic supply shortages, international trade imbalances and rising inflation caused U.S. GDP (gross domestic product) to contract for the first time since the height of the pandemic, although consumer spending, a primary driver of U.S. economic growth, remained strong. Prices for petroleum surged to multi-year highs, while many key agricultural chemicals and industrial metals reached record territory.
Despite the market decline that greeted the first four months of 2022, the S&P 500® Index, a widely regarded benchmark of market performance, remained in modestly positive territory for the 12-month reporting period. Some market sectors benefited from the prevailing conditions, with energy stocks soaring and value-oriented shares broadly gaining ground. In addition to energy, leading sectors included utilities and consumer staples. On the other hand, the information technology, financials and consumer discretionary sectors were subject to particularly sharp losses. Small- and mid-cap stocks underperformed, as they often do during times of heightened uncertainty and financial stress. International stocks trended lower, with some emerging markets,
including Russia and China, suffering particularly steep losses, while others, such as India and Indonesia, gained ground. Fixed-income markets saw most bond prices fall as central banks contemplated significant interest rate rises to combat higher-than-previously-expected inflation rates late in the reporting period. However, floating-rate instruments, which feature variable interest rates that allow investors to benefit from a rising rate environment, bucked the downward trend.
Today, despite the continuing impact of COVID-19, most of the world appears intent on a return to post-pandemic normalcy. Instead, the focus of global political and economic attention has increasingly turned to the war in Ukraine and the impact of rising inflation. Together, Russia and Ukraine account for a substantial share of the world’s supply of food, fossil fuels and raw materials production. Accordingly, the timing and outcome of this conflict will undoubtedly play a major role in global economic developments over the coming months and, possibly, years. The actions of central banks, as they raise rates to fight inflation while trying to limit the risks of recession, are likely to further affect global markets and economies.
As a MainStay investor, you can depend on us to carefully watch developments that may affect your Fund, taking considered and appropriate action to help you stay on financial track in the midst of uncertain times. As always, we remain dedicated to providing you with the disciplined investment tools you have come to expect from us over the years. Thank you for continuing to place your trust in our team.
Sincerely,
Kirk C. Lehneis
President
The opinions expressed are as of the date of this report and are subject to change. There is no guarantee that any forecast made will come to pass. This material does not constitute investment advice and is not intended as an endorsement of any specific investment. Past performance is no guarantee of future results.
Not part of the Annual Report
Investors should refer to each Fund’s Summary Prospectus and/or Prospectus and consider each Fund’s investment objectives, strategies, risks, charges and expenses carefully before investing. The Summary Prospectus and/or Prospectus contain this and other information about each Fund. You may obtain copies of each Fund’s Summary Prospectus, Prospectus and Statement of Additional Information, which includes information about MainStay Funds Trust's Trustees, free of charge, upon request, by calling toll-free 800-624-6782, by writing to NYLIFE Distributors LLC, Attn: MainStay Marketing Department, 30 Hudson Street, Jersey City, NJ 07302 or by sending an e-mail to MainStayShareholderServices@nylim.com. These documents are also available via the MainStay Funds’ website at newyorklifeinvestments.com. Please read each Fund’s Summary Prospectus and/or Prospectus carefully before investing.
MainStay Defensive ETF Allocation Fund
Investment and Performance Comparison (Unaudited)
Performance data quoted represents past performance. Past performance is no guarantee of future results. Because of market volatility and other factors, current performance may be lower or higher than the figures shown. Investment return and principal value will fluctuate, and as a result, when shares are redeemed, they may be worth more or less than their original cost. The graph below depicts the historical performance of Class I shares of the Fund. Performance will vary from class to class based on differences in class-specific expenses and sales charges. For performance information current to the most recent month-end, please call 800-624-6782 or visit newyorklifeinvestments.com.
The performance table and graph do not reflect the deduction of taxes that a shareholder would pay on distributions or Fund share redemptions. Total returns reflect maximum applicable sales charges as indicated in the table below, if any, changes in share price, and reinvestment of dividend and capital gain distributions. The graph assumes the initial investment amount shown below and reflects the deduction of all sales charges that would have applied for the period of investment. Performance figures may reflect certain fee waivers and/or expense limitations, without which total returns may have been lower. For more information on share classes and current fee waivers and/or expense limitations (if any), please refer to the Notes to Financial Statements.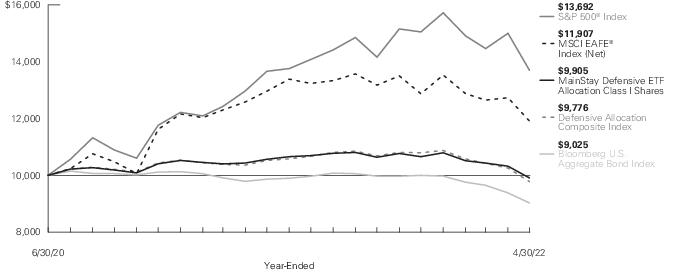
Average Annual Total Returns for the Year-Ended April 30, 2022 |
| | | | | | |
| Maximum 3% Initial Sales Charge | | | | | |
| | | | | | |
| | | | | | |
| if redeemed Within One Year of Purchase | | | | | |
| | | | | | |
| | | | | | |
| | | | | | |
| The gross expense ratios presented reflect the Fund’s “Total Annual Fund Operating Expenses” from the most recent Prospectus, as supplemented, and may differ from other expense ratios disclosed in this report. |
The footnotes on the next page are an integral part of the table and graph and should be carefully read in conjunction with them.
| | |
| | |
| | |
Bloomberg U.S. Aggregate Bond Index3 | | |
Defensive Allocation Composite Index4 | | |
Morningstar Allocation - 15% to 30% Equity Category Average5 | | |
| Returns for indices reflect no deductions for fees, expenses or taxes, except for foreign withholding taxes where applicable. |
| The S&P 500® Index is the Fund’s primary broad-based securities market index for comparison purposes. S&P 500® is a trademark of The McGraw-Hill Companies, Inc. The S&P 500® Index is widely regarded as the standard index for measuring large-cap U.S. stock market performance. Results assume reinvestment of all dividends and capital gains. An investment cannot be made directly in an index. |
| The MSCI EAFE® Index (Net) is the Fund's secondary benchmark. The MSCI EAFE® Index (Net) consists of international stocks representing the developed world outside of North America. Results assume reinvestment of all dividends and capital gains. An investment cannot be made directly in an index. |
| The Fund has selected the Bloomberg U.S. Aggregate Bond Index as an additional benchmark. The Bloomberg U.S. Aggregate Bond Index is a broad-based benchmark that measures the performance of the investment grade, U.S. dollar-denominated, fixed-rate taxable bond market, including Treasurys, government-related and corporate securities, mortgage-backed securities (agency fixed-rate and hybrid adjustable rate mortgage pass-throughs), asset-backed securities, and commercial mortgage-backed securities. Results assume reinvestment of all dividends and capital gains. An investment cannot be made directly in an index. |
| The Fund has selected the Defensive Allocation Composite Index as an additional benchmark. The Defensive Allocation Composite Index consists of the S&P 500® Index, the MSCI EAFE® Index (Net) and the Bloomberg U.S. Aggregate Bond Index weighted 15%, 5% and 80%, respectively. Results assume reinvestment of all dividends and capital gains. An investment cannot be made directly in an index. |
| The Morningstar Allocation – 15% to 30% Equity Category Average is representative of funds that seek to provide both income and capital appreciation by investing in multiple asset classes, including stocks, bonds, and cash. These portfolios are dominated by domestic holdings and have equity exposures between 15% and 30%. Results are based on average total returns of similar funds with all dividends and capital gain distributions reinvested. |
The footnotes on the preceding page are an integral part of the table and graph and should be carefully read in conjunction with them.
| MainStay Defensive ETF Allocation Fund |
Cost in Dollars of a $1,000 Investment in MainStay Defensive ETF Allocation Fund (Unaudited)
The example below is intended to describe the fees and expenses borne by shareholders during the six-month period from November 1, 2021 to April 30, 2022, and the impact of those costs on your investment.
Example
As a shareholder of the Fund you incur two types of costs: (1) transaction costs, including exchange fees and sales charges (loads) on purchases (as applicable), and (2) ongoing costs, including management fees, distribution and/or service (12b-1) fees and other Fund expenses (as applicable). This example is intended to help you understand your ongoing costs (in dollars) of investing in the Fund and to compare these costs with the ongoing costs of investing in other mutual funds. The example is based on an investment of $1,000 made at the beginning of the six-month period and held for the entire period from November 1, 2021 to April 30, 2022.
This example illustrates your Fund’s ongoing costs in two ways:
Actual Expenses
The second and third data columns in the table below provide information about actual account values and actual expenses. You may use the information in these columns, together with the amount you invested, to estimate the expenses that you paid during the six months ended April 30, 2022. Simply divide your account value by $1,000 (for example, an
$8,600 account value divided by $1,000 = 8.6), then multiply the result by the number under the heading entitled “Expenses Paid During Period” to estimate the expenses you paid on your account during this period.
Hypothetical Example for Comparison Purposes
The fourth and fifth data columns in the table below provide information about hypothetical account values and hypothetical expenses based on the Fund’s actual expense ratio and an assumed rate of return of 5% per year before expenses, which is not the Fund’s actual return. The hypothetical account values and expenses may not be used to estimate the actual ending account balances or expenses you paid for the six-month period shown. You may use this information to compare the ongoing costs of investing in the Fund with the ongoing costs of investing in other mutual funds. To do so, compare this 5% hypothetical example with the 5% hypothetical examples that appear in the shareholder reports of the other mutual funds.
Please note that the expenses shown in the table are meant to highlight your ongoing costs only and do not reflect any transactional costs, such as exchange fees or sales charges (loads). Therefore, the fourth and fifth data columns of the table are useful in comparing ongoing costs only and will not help you determine the relative total costs of owning different funds. In addition, if these transactional costs were included, your costs would have been higher.
| Beginning
Account
Value
11/1/21 | Ending Account
Value (Based
on Actual
Returns and
Expenses)
4/30/22 | | Ending Account
Value (Based
on Hypothetical
5% Annualized
Return and
Actual Expenses)
4/30/22 | | |
| | | | | | |
| | | | | | |
| | | | | | |
| | | | | | |
| | | | | | |
| Expenses are equal to the Fund’s annualized expense ratio of each class multiplied by the average account value over the period, divided by 365 and multiplied by 181 (to reflect the six-month period). The table above represents the actual expenses incurred during the six-month period. In addition to the fees and expenses which the Fund bears directly, it also indirectly bears a pro rata share of the fees and expenses of the underlying funds in which it invests. Such indirect expenses are not included in the above-reported expense figures. |
| Expenses are equal to the Fund's annualized expense ratio to reflect the six-month period. |
Asset Diversification as of April 30, 2022 (Unaudited) | |
| |
| |
Other Assets, Less Liabilities | |
See Portfolio of Investments beginning on page 12 for specific holdings within these categories. The Fund’s holdings are subject to change.
| MainStay Defensive ETF Allocation Fund |
Portfolio Management Discussion and Analysis (Unaudited)
Questions answered by portfolio managers Jae S. Yoon, CFA, Jonathan Swaney, Poul Kristensen, CFA, and Amit Soni, CFA, of New York Life Investment Management LLC, the Fund’s Manager.
How did MainStay Defensive ETF Allocation Fund perform relative to its benchmarks and peer group during the 12 months ended April 30, 2022?
For the 12 months ended April 30, 2022, Class I shares of MainStay Defensive ETF Allocation Fund returned −6.25%, underperforming the 0.21% return of the Fund’s primary benchmark, the S&P 500® Index, and outperforming the −8.15% return of the MSCI EAFE® Index (Net), which is the Fund’s secondary benchmark. Over the same period, Class I shares of the Fund outperformed the −8.51% return of the Bloomberg U.S. Aggregate Bond Index, and the −7.11% return of the Defensive Allocation Composite Index, both of which are additional benchmarks of the Fund. For the 12 months ended April 30, 2022, Class I shares of the Fund underperformed the −5.02% return of the Morningstar Allocation—15% to 30% Equity Category Average.1
What factors affected the Fund’s relative performance during the reporting period?
The Fund is a “fund of funds" that seeks to achieve its investment objective by investing in unaffiliated, passively-managed, exchange-traded funds (“Underlying ETFs”). The Underlying ETFs may invest in U.S. equities, international equities and fixed-income instruments, making comparisons to any single index generally less suitable than a weighted combination of indices, which is a more useful yardstick by which to measure performance. During the reporting period, asset class policy was the primary determinant of the Fund's relative performance.
Fund management internally maintains a blend of indices that are taken into consideration when managing the Fund. During the reporting period, the performance of the Fund moderately outperformed that of the internally maintained blend of indices. The reporting period can be divided on a calendar year basis. The final eight months of 2021 saw sizable market returns, although the Fund struggled from a relative performance perspective as a tilt toward value proved premature and an overweight allocation to small-company stocks weighed on results. This reversed dramatically in 2022, with significant outperformance overshadowing the softer results from earlier in the reporting period primarily due to active positioning at the asset-class level in several areas. Key positive contributions came from:
• short duration2 within fixed income,
• an emphasis on value over growth within stocks and
• specific exposure to energy and gold miner equities.
(Contributions take weightings and total returns into account.)
A variety of factors, all of them interconnected, contributed to the success of those positions. Among the more dominant were:
• Inflation: Early in the reporting period, the U.S. Federal Reserve (the “Fed”) finally acknowledged that inflationary pressures extended beyond “transitory,” pandemic-related determinants. Stubbornly high readings brought forth aggressively tighter policy assumptions, hammering long-duration fixed-income and equity price multiples.
• COVID-19: Although now endemic, at least in most Western countries, the contagion continued to send ripples through the global economy. Lockdowns in China that contributed to persistent supply chain disruptions, and hence inflation, were the most obvious example of this.
• Ukraine: Due to the conflict itself, which massively curtailed production within Ukraine, as well as the sanctions that were imposed on Russia in retaliation, global stocks of energy, grains, industrial metals and gases, and other materials became increasingly strained, further exacerbating inflationary pressures.
• Labor supply: The size of the working-age population declined in 2021 for the first time in over 40 years and is expected to remain effectively stagnant over the next decade or two. Workers became scarce, increasing the likelihood of constrained production and wage growth over time, adding a little more fuel to the inflation fire.
How did you allocate the Fund’s assets during the reporting period and why?
Stock/bond blend: The Fund held slightly overweight exposure to equities during the reporting period, with the magnitude of that bias managed tactically in response to swings in pricing (adding on drawdowns and trimming on rallies). We expected that fixed income would struggle as the era of ultra-accommodative monetary policy came to an end, whereas equities would generally retain their value slightly better, with robust domestic demand supporting corporate earnings. Management of the Fund’s stock/bond mix added to performance.
Fixed income: We skewed the Fund’s holdings to favor shorter-maturity and lower-quality instruments that would be less sensitive to rising bond yields. This approach reflected our belief that inflationary pressures were somewhat structural in nature and likely to persist at elevated levels for the foreseeable future. Fixed-income positioning bolstered returns.
Geographic exposure: Prior to Russia’s invasion of Ukraine, the Fund’s geographic exposure reflected our positive expectations for non-U.S. developed markets generally, and Europe in particular,
1.
See page 5 for other share class returns, which may be higher or lower than Class I share returns. See page 6 for more information on benchmark and peer group returns.
2.
The yield curve is a line that plots the yields of various securities of similar quality—typically U.S. Treasury issues—across a range of maturities. The U.S. Treasury yield curve serves as a benchmark for other debt and is used in economic forecasting.
based on attractive valuations and the post-COVID-19 cyclical recovery we saw coming. Accordingly, the Fund tilted in that direction. War, sanctions, soaring local energy prices and looming recession changed the underlying picture. We responded by unwinding the Fund’s position and resetting geographic exposures to neutral, but not before performance was negatively affected.
Equity size: Small-company stocks were more heavily owned in the Fund than in the Defensive Allocation Composite Index. The thesis behind this positioning was based on the small-cap asset class’s attractive valuations, insulation from economic weakness abroad, less sensitivity to dollar strength and disproportionate exposure to domestic demand, which remained robust. Despite these presumed advantages, however, small-cap stocks underperformed the broader market, detracting from the Fund’s relative performance.
Equity style: We saw inflation, which undermines the value of more distant cash flows, as threatening to growth equities with high prices relative to current earnings. Accordingly, the Fund emphasized value stocks offering more attractive near-term cash flows. We placed a particular focus on the relatively defensive sectors of real estate, utilities, consumer staples and health care. While this position detracted from returns during the first eight months of the reporting period, it enhanced returns from January through April 2022 – more than offsetting earlier losses – for a combined positive effect.
Other sector exposures: The Fund maintained a small position in gold miners as a hedge against inflation and/or a monetary policy mistake, in addition to a small position in upstream energy producers as a commodity play to provide an additional inflation hedge. Both positions made disproportionate positive contributions to return as commodity prices rose.
How did the Fund’s allocations change over the course of the reporting period?
Equity exposure was added and then removed primarily through the use of the Vanguard Mega Cap ETF. Its allocation at the end of the reporting period was slightly higher than at the beginning, reflecting purchases as the market softened in late-April 2022. One of the larger shifts in Fund allocations during the reporting period was a reduction in holdings of Vanguard Mega Cap Value ETF, using the proceeds to fund purchases of Invesco S&P® Low Volatility ETF, SPDR® S&P® Oil & Gas Exploration & Production ETF and VanEck Oil Services ETF. While value strategies performed quite well, the tilt into more defensive sectors with low volatility and the focus on energy were more profitable. The Fund also added exposure to iShares® Core S&P Small-Cap ETF and Schwab® U.S. Small-Cap ETF in keeping with its migration down the capitalization spectrum. Late in the reporting period, the Fund established a position in iShares® 20+ Year Treasury Bond ETF, adding a little duration to the Fund’s bond position in light of dramatically rising rates. Lastly, the Fund reduced its allocation to
iShares® Core MSCI EAFE ETF, trimming exposure to developed international markets in the wake of Russia’s invasion of Ukraine.
During the reporting period, which Underlying Equity ETFs had the highest total returns and which Underlying Equity ETFs had the lowest total returns?
Of the Underlying Equity ETFs held for the entire reporting period, only Vanguard Mega Cap Value ETF and VanEck Gold Miners ETF generated positive returns. Those posting the most significant losses were Schwab® U.S. Small-Cap ETF and iShares® Core MSCI EAFE ETF.
Which Underlying Equity ETFs were the strongest positive contributors to the Fund’s performance and which Underlying Equity ETFs were particularly weak?
The Underlying Equity ETFs providing the highest total returns—Vanguard Mega Cap Value ETF and VanEck Gold Miners ETF—also produced the strongest positive contributions to performance, followed by SPDR® S&P® Oil & Gas Exploration & Production ETF. The most significant detractors were iShares® Core S&P Small-Cap ETF, iShares® Core MSCI EAFE ETF and Schwab® U.S. Small-Cap ETF.
During the reporting period, which Underlying Fixed-Income ETFs had the highest total returns and which Underlying Fixed-Income ETFs had the lowest total returns?
Invesco Senior Loan ETF generated a small positive return, while cash holdings were flat. All other Underlying Fixed-Income ETFs generated losses, with iShares® 0-5 Year High Yield Corporate Bond ETF posting the mildest declines. The largest losses came from iShares® Broad USD Investment Grade Corporate Bond ETF and Schwab® U.S. Aggregate Bond ETF.
Which Underlying Fixed-Income ETFs were the strongest positive contributors to the Fund’s performance and which Underlying Fixed-Income ETFs were particularly weak?
Invesco Senior Loan ETF made a very small positive contribution to performance, while cash holdings neither contributed nor detracted from returns. All other Underlying Fixed-Income ETFs generated losses, with Vanguard Short-Term Bond ETF detracting least. The most significant detractors from performance were Schwab® U.S. Aggregate Bond ETF, iShares® Core U.S. Aggregate Bond ETF and iShares® Broad USD Investment Grade Corporate Bond ETF.
How was the Fund positioned at the end of the reporting period?
As the market sold off in April 2022, we added to the Fund’s equity exposure, positioning the Fund with a modestly overweight
| MainStay Defensive ETF Allocation Fund |
allocation to equities as of April 30, 2022. We are fully cognizant of the many challenges facing stock prices (high inflation, rising rates, geopolitical conflict, supply chain disruptions and worker shortages), but we also perceive a supportive demand backdrop (robust corporate capital spending, solid household consumption, growing payrolls, healthy consumer sentiment and strong corporate balance sheets). The two appear in rough equilibrium, such that we expect a largely sideways market for the foreseeable future. Within that environment, we anticipate trading tactically on the Fund’s behalf, adding to equity holdings during periods of weakness and trimming them again as prices recover.
In terms of the Fund’s posture within asset classes, the positions described above remain intact as of April 30, 2022. The bias we expect to have the largest impact on active return is our preference for small-cap stocks. We believe that the large-cap space is potentially vulnerable to economic weakness abroad, a strong U.S. dollar, rich valuations and concentration in a relatively short list of very large companies (mega-cap technology). Small-cap stocks, in contrast, cater primarily to a financially healthy domestic clientele and have historically been more successful than larger companies in protecting real earnings amid high inflation.
Likewise, the Fund’s emphasis on value over growth stocks remains intact as of April 30, 2022 with a particular emphasis on what we perceive to be the defensive “RUSH” sectors: real estate, utilities, consumer staples and health care. The thesis rests primarily on the idea that inflation will prove persistent and jeopardize the high price multiples paid on fast-growing companies with current valuations that depend on distant earnings. We are also mindful of the economy’s progression in the business cycle and the possibility that a recession may not be very far away.
The Fund retains a position in gold miners as of April 30, 2022 reflecting our view that real interest rates are historically quite low. The Fund also maintains exposure to energy sector firms, as we envision sustained supply constraints keeping commodity prices elevated, preserving meaty profit margins for a couple of years to come.
Within fixed income, we have reduced the Fund’s short-duration posture as yields have climbed. As of April 30, 2022 the Fund’s duration is notably short of the benchmark. The Fund maintains a mild tilt toward credit as of April 30, 2022, as corporate fundamentals appear likely to remain sound for the foreseeable
future. We may increase the Fund’s high-yield bond exposure if we see credit spreads widen much beyond 400 basis points. (A basis point is one one-hundredth of a percentage point.)
None of Schwab Strategic Trust, Schwab® U.S. Small-Cap ETF, Schwab® U.S. Aggregate Bond ETF, or Charles Schwab Investment Management, Inc. make any representations regarding the advisability of investing in MainStay Defensive ETF Allocation Fund.
iShares® is a registered trademark of BlackRock (BlackRock, Inc. and its subsidiaries). Neither BlackRock nor the iShares® Funds make any representations regarding the advisability of investing in MainStay Defensive ETF Allocation Fund.
The opinions expressed are those of the portfolio managers as of the date of this report and are subject to change. There is no guarantee that any forecasts will come to pass. This material does not constitute investment advice and is not intended as an endorsement of any specific investment.
Portfolio of Investments April 30, 2022†
| | |
Investment Companies 97.9% |
|
Health Care Select Sector SPDR Fund | | |
Invesco S&P 500 Low Volatility ETF (a) | | |
iShares Core MSCI EAFE ETF | | |
iShares Core S&P Small-Cap ETF | | |
iShares Semiconductor ETF | | |
| | |
Schwab U.S. Small-Cap ETF | | |
SPDR S&P Oil & Gas Exploration & Production ETF | | |
| | |
VanEck Oil Services ETF (a) | | |
| | |
Vanguard Mega Cap Value ETF | | |
| | |
Total Equity Funds
(Cost $2,256,133) | | |
|
Invesco Senior Loan ETF (a) | | |
iShares 0-5 Year High Yield Corporate Bond ETF (a) | | |
iShares 20+ Year Treasury Bond ETF (a) | | |
iShares Broad USD High Yield Corporate Bond ETF (a) | | |
iShares Broad USD Investment Grade Corporate Bond ETF | | |
iShares Core U.S. Aggregate Bond ETF | | |
Schwab U.S. Aggregate Bond ETF | | |
Total Fixed Income Funds
(Cost $8,020,712) | | |
Total Investment Companies
(Cost $10,276,845) | | |
Short-Term Investments 19.4% |
Affiliated Investment Company 2.8% |
MainStay U.S. Government Liquidity Fund, 0.397% (b) | | |
Unaffiliated Investment Company 16.6% |
Invesco Government & Agency Portfolio, 0.419% (b)(c) | | |
Total Short-Term Investments
(Cost $1,906,172) | | |
Total Investments
(Cost $12,183,017) | | |
Other Assets, Less Liabilities | | |
| | |
The notes to the financial statements are an integral part of, and should be read in conjunction with, the financial statements.
| MainStay Defensive ETF Allocation Fund |
| Percentages indicated are based on Fund net assets. |
| All or a portion of this security was held on loan. As of April 30, 2022, the aggregate market value of securities on loan was $2,352,251; the total market value of collateral held by the Fund was $2,431,381. The market value of the collateral held included non-cash collateral in the form of U.S. Treasury securities with a value of $799,306. The Fund received cash collateral with a value of $1,632,075. (See Note 2(H)) |
| Current yield as of April 30, 2022. |
| Represents a security purchased with cash collateral received for securities on loan. |
Investments in Affiliates (in 000's)
Investments in issuers considered to be affiliate(s) of the Fund during the year ended April 30, 2022 for purposes of Section 2(a)(3) of the Investment Company Act of 1940, as amended, were as follows:
Affiliated Investment Companies | | | | Net
Realized
Gain/(Loss)
on Sales | Change in
Unrealized
Appreciation/
(Depreciation) | | | | |
MainStay U.S. Government Liquidity Fund | | | | | | | | | |
|
EAFE—Europe, Australasia and Far East |
|
MSCI—Morgan Stanley Capital International |
SPDR—Standard & Poor’s Depositary Receipt |
|
The following is a summary of the fair valuations according to the inputs used as of April 30, 2022, for valuing the Fund’s assets:
| Quoted
Prices in
Active
Markets for
Identical
Assets
(Level 1) | Significant
Other
Observable
Inputs
(Level 2) | Significant
Unobservable
Inputs
(Level 3) | |
| | | | |
Investments in Securities (a) | | | | |
| | | | |
| | | | |
| | | | |
Total Investment Companies | | | | |
| | | | |
Affiliated Investment Company | | | | |
Unaffiliated Investment Company | | | | |
Total Short-Term Investments | | | | |
Total Investments in Securities | | | | |
| For a complete listing of investments, see the Portfolio of Investments. |
The notes to the financial statements are an integral part of, and should be read in conjunction with, the financial statements.
Statement of Assets and Liabilities as of April 30, 2022
|
Investment in unaffiliated securities, at value
(identified cost $11,908,920) including securities on loan of $2,352,251 | |
Investment in affiliated investment companies, at value
(identified cost $274,097) | |
| |
Investment securities sold | |
| |
| |
| |
| |
| |
| |
|
Cash collateral received for securities on loan | |
| |
Investment securities purchased | |
| |
Shareholder communication | |
NYLIFE Distributors (See Note 3) | |
Transfer agent (See Note 3) | |
| |
| |
| |
| |
| |
Composition of Net Assets |
Shares of beneficial interest outstanding (par value of $.001 per share) unlimited number of shares authorized | |
Additional paid-in-capital | |
| |
Total distributable earnings (loss) | |
| |
| |
Net assets applicable to outstanding shares | |
Shares of beneficial interest outstanding | |
Net asset value per share outstanding | |
Maximum sales charge (3.00% of offering price) | |
Maximum offering price per share outstanding | |
| |
Net assets applicable to outstanding shares | |
Shares of beneficial interest outstanding | |
Net asset value and offering price per share outstanding | |
| |
Net assets applicable to outstanding shares | |
Shares of beneficial interest outstanding | |
Net asset value and offering price per share outstanding | |
| |
Net assets applicable to outstanding shares | |
Shares of beneficial interest outstanding | |
Net asset value and offering price per share outstanding | |
| |
Net assets applicable to outstanding shares | |
Shares of beneficial interest outstanding | |
Net asset value and offering price per share outstanding | |
The notes to the financial statements are an integral part of, and should be read in conjunction with, the financial statements.
| MainStay Defensive ETF Allocation Fund |
Statement of Operations for the year ended April 30, 2022
|
| |
| |
| |
| |
| |
| |
| |
| |
Distribution/Service—Class A (See Note 3) | |
Distribution/Service—Class C (See Note 3) | |
Distribution/Service—Class R3 (See Note 3) | |
Distribution/Service—SIMPLE Class (See Note 3) | |
| |
| |
| |
Shareholder communication | |
| |
Transfer agent (See Note 3) | |
Shareholder service (See Note 3) | |
| |
Total expenses before waiver/reimbursement | |
Expense waiver/reimbursement from Manager (See Note 3) | |
| |
Net investment income (loss) | |
Realized and Unrealized Gain (Loss) |
Net realized gain (loss) on unaffiliated investments | |
Net change in unrealized appreciation (depreciation) on unaffiliated investments | |
Net realized and unrealized gain (loss) | |
Net increase (decrease) in net assets resulting from operations | |
The notes to the financial statements are an integral part of, and should be read in conjunction with, the financial statements.
Statements of Changes in Net Assets
for the year ended April 30, 2022 and the period June 30, 2020 (inception date) throughApril 30, 2021
| | |
Increase (Decrease) in Net Assets |
| | |
Net investment income (loss) | | |
| | |
Net change in unrealized appreciation (depreciation) | | |
Net increase (decrease) in net assets resulting from operations | | |
Distributions to shareholders: | | |
| | |
| | |
| | |
| | |
| | |
Total distributions to shareholders | | |
Capital share transactions: | | |
Net proceeds from sales of shares | | |
Net asset value of shares issued to shareholders in reinvestment of distributions | | |
| | |
Increase (decrease) in net assets derived from capital share transactions | | |
Net increase (decrease) in net assets | | |
|
| | |
| | |
The notes to the financial statements are an integral part of, and should be read in conjunction with, the financial statements.
| MainStay Defensive ETF Allocation Fund |
Financial Highlights selected per share data and ratios
| | June 30, 2020^ through
April 30, |
| | |
Net asset value at beginning of year | | |
Net investment income (loss) (a) | | |
Net realized and unrealized gain (loss) | | |
Total from investment operations | | |
| | |
From net investment income | | |
From net realized gain on investments | | |
| | |
Net asset value at end of year | | |
Total investment return (b) | | |
Ratios (to average net assets)/Supplemental Data: | | |
Net investment income (loss) | | |
| | |
Expenses (before waiver/reimbursement) (c) | | |
| | |
Net assets at end of year (in 000’s) | | |
| |
| |
| Per share data based on average shares outstanding during the period. |
| Total investment return is calculated exclusive of sales charges and assumes the reinvestment of dividends and distributions. For periods of less than one year, total return is not annualized. |
| In addition to the fees and expenses which the Fund bears directly, it also indirectly bears a pro-rata share of the fees and expenses of the underlying funds in which it invests. Such indirect expenses are not included in the above expense ratios. |
The notes to the financial statements are an integral part of, and should be read in conjunction with, the financial statements.
Financial Highlights selected per share data and ratios
| | June 30, 2020^ through
April 30, |
| | |
Net asset value at beginning of year | | |
Net investment income (loss) (a) | | |
Net realized and unrealized gain (loss) | | |
Total from investment operations | | |
| | |
From net investment income | | |
From net realized gain on investments | | |
| | |
Net asset value at end of year | | |
Total investment return (b) | | |
Ratios (to average net assets)/Supplemental Data: | | |
Net investment income (loss) | | |
| | |
Expenses (before waiver/reimbursement) (c) | | |
| | |
Net assets at end of year (in 000’s) | | |
| |
| |
| Per share data based on average shares outstanding during the period. |
| Total investment return is calculated exclusive of sales charges and assumes the reinvestment of dividends and distributions. Class I shares are not subject to sales charges. For periods of less than one year, total return is not annualized. |
| In addition to the fees and expenses which the Fund bears directly, it also indirectly bears a pro-rata share of the fees and expenses of the underlying funds in which it invests. Such indirect expenses are not included in the above expense ratios. |
The notes to the financial statements are an integral part of, and should be read in conjunction with, the financial statements.
| MainStay Defensive ETF Allocation Fund |
Financial Highlights selected per share data and ratios
| | June 30, 2020^ through
April 30, |
| | |
Net asset value at beginning of year | | |
Net investment income (loss) (a) | | |
Net realized and unrealized gain (loss) | | |
Total from investment operations | | |
| | |
From net investment income | | |
From net realized gain on investments | | |
| | |
Net asset value at end of year | | |
Total investment return (b) | | |
Ratios (to average net assets)/Supplemental Data: | | |
Net investment income (loss) | | |
| | |
Expenses (before waiver/reimbursement) (c) | | |
| | |
Net assets at end of year (in 000’s) | | |
| |
| |
| Per share data based on average shares outstanding during the period. |
| Total investment return is calculated exclusive of sales charges and assumes the reinvestment of dividends and distributions. Class R3 shares are not subject to sales charges. For periods of less than one year, total return is not annualized. |
| In addition to the fees and expenses which the Fund bears directly, it also indirectly bears a pro-rata share of the fees and expenses of the underlying funds in which it invests. Such indirect expenses are not included in the above expense ratios. |
The notes to the financial statements are an integral part of, and should be read in conjunction with, the financial statements.
Financial Highlights selected per share data and ratios
| | August 31, 2020^ through
April 30, |
| | |
Net asset value at beginning of year | | |
Net investment income (loss) (a) | | |
Net realized and unrealized gain (loss) | | |
Total from investment operations | | |
| | |
From net investment income | | |
From net realized gain on investments | | |
| | |
Net asset value at end of year | | |
Total investment return (b) | | |
Ratios (to average net assets)/Supplemental Data: | | |
Net investment income (loss) | | |
| | |
Expenses (before waiver/reimbursement) (c) | | |
| | |
Net assets at end of year (in 000’s) | | |
| |
| |
| Per share data based on average shares outstanding during the period. |
| Total investment return is calculated exclusive of sales charges and assumes the reinvestment of dividends and distributions. SIMPLE Class shares are not subject to sales charges. For periods of less than one year, total return is not annualized. |
| In addition to the fees and expenses which the Fund bears directly, it also indirectly bears a pro-rata share of the fees and expenses of the underlying funds in which it invests. Such indirect expenses are not included in the above expense ratios. |
The notes to the financial statements are an integral part of, and should be read in conjunction with, the financial statements.
| MainStay Defensive ETF Allocation Fund |
MainStay Conservative ETF Allocation Fund
Investment and Performance Comparison (Unaudited)
Performance data quoted represents past performance. Past performance is no guarantee of future results. Because of market volatility and other factors, current performance may be lower or higher than the figures shown. Investment return and principal value will fluctuate, and as a result, when shares are redeemed, they may be worth more or less than their original cost. The graph below depicts the historical performance of Class I shares of the Fund. Performance will vary from class to class based on differences in class-specific expenses and sales charges. For performance information current to the most recent month-end, please call 800-624-6782 or visit newyorklifeinvestments.com.
The performance table and graph do not reflect the deduction of taxes that a shareholder would pay on distributions or Fund share redemptions. Total returns reflect maximum applicable sales charges as indicated in the table below, if any, changes in share price, and reinvestment of dividend and capital gain distributions. The graph assumes the initial investment amount shown below and reflects the deduction of all sales charges that would have applied for the period of investment. Performance figures may reflect certain fee waivers and/or expense limitations, without which total returns may have been lower. For more information on share classes and current fee waivers and/or expense limitations (if any), please refer to the Notes to Financial Statements.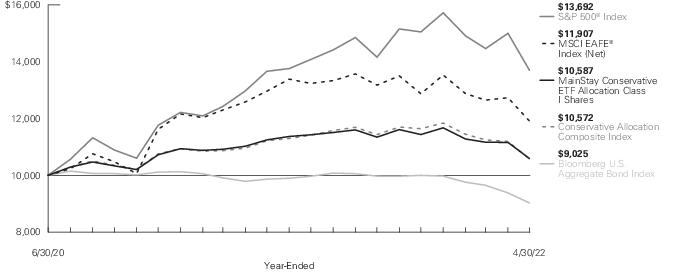
Average Annual Total Returns for the Year-Ended April 30, 2022 |
| | | | | | |
| Maximum 3% Initial Sales Charge | | | | | |
| | | | | | |
| | | | | | |
| if redeemed Within One Year of Purchase | | | | | |
| | | | | | |
| | | | | | |
| | | | | | |
| The gross expense ratios presented reflect the Fund’s “Total Annual Fund Operating Expenses” from the most recent Prospectus, as supplemented, and may differ from other expense ratios disclosed in this report. |
The footnotes on the next page are an integral part of the table and graph and should be carefully read in conjunction with them.
| | |
| | |
| | |
Bloomberg U.S. Aggregate Bond Index3 | | |
Conservative Allocation Composite Index4 | | |
Morningstar Allocation - 30% to 50% Equity Category Average5 | | |
| Returns for indices reflect no deductions for fees, expenses or taxes, except for foreign withholding taxes where applicable. |
| The S&P 500® Index is the Fund’s primary broad-based securities market index for comparison purposes. S&P 500® is a trademark of The McGraw-Hill Companies, Inc. The S&P 500® Index is widely regarded as the standard index for measuring large-cap U.S. stock market performance. Results assume reinvestment of all dividends and capital gains. An investment cannot be made directly in an index. |
| The MSCI EAFE® Index (Net) is the Fund's secondary benchmark. The MSCI EAFE® Index (Net) consists of international stocks representing the developed world outside of North America. Results assume reinvestment of all dividends and capital gains. An investment cannot be made directly in an index. |
| The Fund has selected the Bloomberg U.S. Aggregate Bond Index as an additional benchmark. The Bloomberg U.S. Aggregate Bond Index is a broad-based benchmark that measures the performance of the investment grade, U.S. dollar-denominated, fixed-rate taxable bond market, including Treasurys, government-related and corporate securities, mortgage-backed securities (agency fixed-rate and hybrid adjustable rate mortgage pass-throughs), asset-backed securities, and commercial mortgage-backed securities. Results assume reinvestment of all dividends and capital gains. An investment cannot be made directly in an index. |
| The Fund has selected the Conservative Allocation Composite Index as an additional benchmark. The Conservative Allocation Composite Index consists of the S&P 500® Index, the MSCI EAFE® Index (Net) and the Bloomberg U.S. Aggregate Bond Index weighted 30%, 10% and 60%, respectively. Results assume reinvestment of all dividends and capital gains. An investment cannot be made directly in an index. |
| The Morningstar Allocation – 30% to 50% Equity Category Average is representative of funds that seek to provide both income and capital appreciation by investing in multiple asset classes, including stocks, bonds, and cash. These portfolios are dominated by domestic holdings and have equity exposures between 30% and 50%. Results are based on average total returns of similar funds with all dividends and capital gain distributions reinvested. |
The footnotes on the preceding page are an integral part of the table and graph and should be carefully read in conjunction with them.
| MainStay Conservative ETF Allocation Fund |
Cost in Dollars of a $1,000 Investment in MainStay Conservative ETF Allocation Fund (Unaudited)
The example below is intended to describe the fees and expenses borne by shareholders during the six-month period from November 1, 2021 to April 30, 2022, and the impact of those costs on your investment.
Example
As a shareholder of the Fund you incur two types of costs: (1) transaction costs, including exchange fees and sales charges (loads) on purchases (as applicable), and (2) ongoing costs, including management fees, distribution and/or service (12b-1) fees and other Fund expenses (as applicable). This example is intended to help you understand your ongoing costs (in dollars) of investing in the Fund and to compare these costs with the ongoing costs of investing in other mutual funds. The example is based on an investment of $1,000 made at the beginning of the six-month period and held for the entire period from November 1, 2021 to April 30, 2022.
This example illustrates your Fund’s ongoing costs in two ways:
Actual Expenses
The second and third data columns in the table below provide information about actual account values and actual expenses. You may use the information in these columns, together with the amount you invested, to estimate the expenses that you paid during the six months ended April 30, 2022. Simply divide your account value by $1,000 (for example, an
$8,600 account value divided by $1,000 = 8.6), then multiply the result by the number under the heading entitled “Expenses Paid During Period” to estimate the expenses you paid on your account during this period.
Hypothetical Example for Comparison Purposes
The fourth and fifth data columns in the table below provide information about hypothetical account values and hypothetical expenses based on the Fund’s actual expense ratio and an assumed rate of return of 5% per year before expenses, which is not the Fund’s actual return. The hypothetical account values and expenses may not be used to estimate the actual ending account balances or expenses you paid for the six-month period shown. You may use this information to compare the ongoing costs of investing in the Fund with the ongoing costs of investing in other mutual funds. To do so, compare this 5% hypothetical example with the 5% hypothetical examples that appear in the shareholder reports of the other mutual funds.
Please note that the expenses shown in the table are meant to highlight your ongoing costs only and do not reflect any transactional costs, such as exchange fees or sales charges (loads). Therefore, the fourth and fifth data columns of the table are useful in comparing ongoing costs only and will not help you determine the relative total costs of owning different funds. In addition, if these transactional costs were included, your costs would have been higher.
| Beginning
Account
Value
11/1/21 | Ending Account
Value (Based
on Actual
Returns and
Expenses)
4/30/22 | | Ending Account
Value (Based
on Hypothetical
5% Annualized
Return and
Actual Expenses)
4/30/22 | | |
| | | | | | |
| | | | | | |
| | | | | | |
| | | | | | |
| | | | | | |
| Expenses are equal to the Fund’s annualized expense ratio of each class multiplied by the average account value over the period, divided by 365 and multiplied by 181 (to reflect the six-month period). The table above represents the actual expenses incurred during the six-month period. In addition to the fees and expenses which the Fund bears directly, it also indirectly bears a pro rata share of the fees and expenses of the underlying funds in which it invests. Such indirect expenses are not included in the above-reported expense figures. |
| Expenses are equal to the Fund's annualized expense ratio to reflect the six-month period. |
Asset Diversification as of April 30, 2022 (Unaudited) | |
| |
| |
Other Assets, Less Liabilities | |
See Portfolio of Investments beginning on page 28 for specific holdings within these categories. The Fund’s holdings are subject to change.
| MainStay Conservative ETF Allocation Fund |
Portfolio Management Discussion and Analysis (Unaudited)
Questions answered by portfolio managers Jae S. Yoon, CFA, Jonathan Swaney, Poul Kristensen, CFA, and Amit Soni, CFA, of New York Life Investment Management LLC, the Fund’s Manager.
How did MainStay Conservative ETF Allocation Fund perform relative to its benchmarks and peer group during the 12 months ended April 30, 2022?
For the 12 months ended April 30, 2022, Class I shares of MainStay Conservative ETF Allocation Fund returned −5.86%, underperforming the 0.21% return of the Fund’s primary benchmark, the S&P 500® Index, and outperforming the −8.15% return of the MSCI EAFE® Index (Net), which is the Fund’s secondary benchmark. Over the same period, Class I shares of the Fund outperformed the −8.51% return of the Bloomberg U.S. Aggregate Bond Index, and underperformed the −5.74% return of the Conservative Allocation Composite Index, both of which are additional benchmarks of the Fund. For the 12 months ended April 30, 2022, Class I shares of the Fund underperformed the −5.63% return of the Morningstar Allocation—30% to 50% Equity Category Average.1
What factors affected the Fund’s relative performance during the reporting period?
The Fund is a “fund of funds" that seeks to achieve its investment objective by investing in unaffiliated, passively-managed, exchange-traded funds (“Underlying ETFs”). The Underlying ETFs may invest in U.S. equities, international equities and fixed-income instruments, making comparisons to any single index generally less suitable than a weighted combination of indices, which is a more useful yardstick by which to measure performance. During the reporting period, asset class policy was the primary determinant of the Fund's relative performance.
Fund management internally maintains a blend of indices that are taken into consideration when managing the Fund. During the reporting period, the performance of the Fund moderately outperformed that of the internally maintained blend of indices. The reporting period can be divided on a calendar year basis. The final eight months of 2021 saw sizable market returns, although the Fund struggled from a relative performance perspective as a tilt toward value proved premature and an overweight allocation to small-company stocks weighed on results. This reversed dramatically in 2022, with significant outperformance overshadowing the softer results from earlier in the reporting period, primarily due to active positioning at the asset-class level in several areas. Key positive contributions came from:
• short duration2 within fixed income,
• an emphasis on value over growth within stocks and
• specific exposure to energy and gold miner equities.
(Contributions take weightings and total returns into account.)
A variety of factors, all of them interconnected, contributed to the success of those positions. Among the more dominant were:
• Inflation: Early in the reporting period, the U.S. Federal Reserve (the “Fed”) finally acknowledged that inflationary pressures extended beyond “transitory,” pandemic-related determinants. Stubbornly high readings brought forth aggressively tighter policy assumptions, hammering long-duration fixed-income and equity price multiples.
• COVID-19: Although now endemic, at least in most Western countries, the contagion continued to send ripples through the global economy. Lockdowns in China that contributed to persistent supply chain disruptions, and hence inflation, were the most obvious example of this.
• Ukraine: Due to the conflict itself, which massively curtailed production within Ukraine, as well as the sanctions that were imposed on Russia in retaliation, global stocks of energy, grains, industrial metals and gases, and other materials became increasingly strained, further exacerbating inflationary pressures.
• Labor supply: The size of the working-age population declined in 2021 for the first time in over 40 years and is expected to remain effectively stagnant over the next decade or two. Workers became scarce, increasing the likelihood of constrained production and wage growth over time, adding a little more fuel to the inflation fire.
How did you allocate the Fund’s assets during the reporting period and why?
Stock/bond blend: The Fund held slightly overweight exposure to equities during the reporting period, with the magnitude of that bias managed tactically in response to swings in pricing (adding on drawdowns and trimming on rallies). We expected that fixed income would struggle as the era of ultra-accommodative monetary policy came to an end, whereas equities would generally retain their value slightly better, with robust domestic demand supporting corporate earnings. Management of the Fund’s stock/bond mix added to performance.
Fixed income: We skewed the Fund’s holdings to favor shorter-maturity and lower-quality instruments that would be less sensitive to rising bond yields. This approach reflected our belief that inflationary pressures were somewhat structural in nature and likely to persist at elevated levels for the foreseeable future. Fixed-income positioning bolstered returns.
Geographic exposure: Prior to Russia’s invasion of Ukraine, the Fund’s geographic exposure reflected our positive expectations for non-U.S. developed markets generally, and Europe in particular,
1.
See page 21 for other share class returns, which may be higher or lower than Class I share returns. See page 22 for more information on benchmark and peer group returns.
2.
Duration is a measure of the price sensitivity of a fixed-income investment to changes in interest rates. Duration is expressed as a number of years and is considered a more accurate sensitivity gauge than average maturity.
based on attractive valuations and the post-COVID-19 cyclical recovery we saw coming. Accordingly, the Fund tilted in that direction. War, sanctions, soaring local energy prices and looming recession changed the underlying picture. We responded by unwinding the Fund’s position and resetting geographic exposures to neutral, but not before performance was negatively affected.
Equity size: Small-company stocks were more heavily owned in the Fund than in the Conservative Allocation Composite Index. The thesis behind this positioning was based on the small-cap asset class’s attractive valuations, insulation from economic weakness abroad, less sensitivity to dollar strength and disproportionate exposure to domestic demand, which remained robust. Despite these presumed advantages, however, small-cap stocks underperformed the broader market, detracting from the Fund’s relative performance.
Equity style: We saw inflation, which undermines the value of more distant cash flows, as threatening to growth equities with high prices relative to current earnings. Accordingly, the Fund emphasized value stocks offering more attractive near-term cash flows. We placed a particular focus on the relatively defensive sectors of real estate, utilities, consumer staples and health care. While this position detracted from returns during the first eight months of the reporting period, it enhanced returns from January through April 2022, more than offsetting earlier losses, for a combined positive effect.
Other sector exposures: The Fund maintained a small position in gold miners as a hedge against inflation and/or a monetary policy mistake, in addition to a small position in upstream energy producers as a commodity play to provide an additional inflation hedge. Both positions made disproportionate positive contributions to return as commodity prices rose.
How did the Fund’s allocations change over the course of the reporting period?
Equity exposure was added and then removed, primarily through the use of the Vanguard Mega Cap ETF. The equity allocation at the end of the reporting period was slightly higher than at the beginning, reflecting purchases as the market softened in late-April 2022. One of the larger shifts in Fund allocations during the reporting period was a reduction in holdings of Vanguard Mega Cap Value ETF, using the proceeds to fund purchases of Invesco S&P® Low Volatility ETF, SPDR® S&P® Oil & Gas Exploration & Production ETF and VanEck Oil Services ETF. While value strategies performed quite well, the tilt into more defensive sectors with low volatility, and the focus on energy were more profitable. The Fund also added exposure to iShares® Core S&P Small-Cap ETF and Schwab® U.S. Small-Cap ETF in keeping with its migration down the capitalization spectrum. Late in the
reporting period, the Fund established a position in iShares® 20+ Year Treasury Bond ETF, adding a little duration to the Fund’s bond position in light of dramatically rising rates. Lastly, the Fund reduced its allocation to iShares® Core MSCI EAFE ETF, trimming exposure to developed international markets in the wake of Russia’s invasion of Ukraine.
During the reporting period, which Underlying Equity ETFs had the highest total returns and which Underlying Equity ETFs had the lowest total returns?
Of the Underlying Equity ETFs held for the entire reporting period, only Vanguard Mega Cap Value ETF and VanEck Gold Miners ETF generated positive returns. Those posting the most significant losses were Schwab® U.S. Small-Cap ETF and iShares® Core MSCI EAFE ETF.
Which Underlying Equity ETFs were the strongest positive contributors to the Fund’s performance and which Underlying Equity ETFs were particularly weak?
The Underlying Equity ETFs providing the highest total returns—Vanguard Mega Cap Value ETF and VanEck Gold Miners ETF—also produced the strongest positive contributions to performance, followed by SPDR® S&P® Oil & Gas Exploration & Production ETF. The most significant detractors were iShares® Core S&P Small-Cap ETF, iShares® Core MSCI EAFE ETF and Schwab® U.S. Small-Cap ETF.
During the reporting period, which Underlying Fixed-Income ETFs had the highest total returns and which Underlying Fixed-Income ETFs had the lowest total returns?
Invesco Senior Loan ETF generated a small positive return, while cash holdings were flat. All other Underlying Fixed-Income ETFs generated losses, with iShares® 0-5 Year High Yield Corporate Bond ETF posting the mildest declines. The largest losses came from iShares® Broad USD Investment Grade Corporate Bond ETF and Schwab® U.S. Aggregate Bond ETF.
Which Underlying Fixed-Income ETFs were the strongest positive contributors to the Fund’s performance and which Underlying Fixed-Income ETFs were particularly weak?
Invesco Senior Loan ETF made a very small positive contribution to performance, while cash holdings neither contributed nor detracted from returns. All other Underlying Fixed-Income ETFs generated losses, with Vanguard Short-Term Bond ETF detracting least. The most significant detractors from performance were Schwab® U.S. Aggregate Bond ETF, iShares® Core U.S. Aggregate
| MainStay Conservative ETF Allocation Fund |
Bond ETF and iShares® Broad USD Investment Grade Corporate Bond ETF.
How was the Fund positioned at the end of the reporting period?
As the market sold off in April 2022, we added to the Fund’s equity exposure, positioning the Fund with a modestly overweight allocation to equities as of April 30, 2022. We are fully cognizant of the many challenges facing stock prices (high inflation, rising rates, geopolitical conflict, supply chain disruptions and worker shortages), but we also perceive a supportive demand backdrop (robust corporate capital spending, solid household consumption, growing payrolls, healthy consumer sentiment and strong corporate balance sheets). The two appear in rough equilibrium, such that we expect a largely sideways market for the foreseeable future. Within that environment, we anticipate trading tactically on the Fund’s behalf, adding to equity holdings during periods of weakness and trimming them again as prices recover.
In terms of the Fund’s posture within asset classes, the positions described above remain intact as of April 30, 2022. The bias we expect to have the largest impact on active return is our preference for small-cap stocks. We believe that the large-cap space is potentially vulnerable to economic weakness abroad, a strong U.S. dollar, rich valuations and concentration in a relatively short list of very large companies (mega-cap technology). Small-cap stocks, in contrast, cater primarily to a financially healthy domestic clientele and have historically been more successful than larger companies in protecting real earnings amid high inflation.
Likewise, the Fund’s emphasis on value over growth stocks remains intact as of April 30, 2022 with a particular emphasis on what we perceive to be the defensive “RUSH” sectors: real estate, utilities, consumer staples and health care. The thesis rests primarily on the idea that inflation will prove persistent and jeopardize the high price multiples paid on fast-growing companies with current valuations that depend on distant earnings. We are also mindful of the economy’s progression in the business cycle and the possibility that a recession may not be very far away.
The Fund retains a position in gold miners as of April 30, 2022, reflecting our view that real interest rates are historically quite low. The Fund also maintains exposure to energy sector firms as of April 30, 2022 as we envision sustained supply constraints
keeping commodity prices elevated, preserving meaty profit margins for a couple of years to come.
Within fixed income, we have reduced the Fund’s short-duration posture as yields have climbed. As of April 30, 2022, the Fund’s duration is notably short of the benchmark. The Fund maintains a mild tilt toward credit, as corporate fundamentals appear likely to remain sound for the foreseeable future. We may increase the Fund’s high-yield bond exposure if we see credit spreads widen much beyond 400 basis points. (A basis point is one one-hundredth of a percentage point.)
None of Schwab Strategic Trust, Schwab® U.S. Small-Cap ETF, Schwab® U.S. Aggregate Bond ETF, or Charles Schwab Investment Management, Inc. make any representations regarding the advisability of investing in MainStay Conservative ETF Allocation Fund.
iShares® is a registered trademark of BlackRock (BlackRock, Inc. and its subsidiaries). Neither BlackRock nor the iShares® Funds make any representations regarding the advisability of investing in MainStay Conservative ETF Allocation Fund.
The opinions expressed are those of the portfolio managers as of the date of this report and are subject to change. There is no guarantee that any forecasts will come to pass. This material does not constitute investment advice and is not intended as an endorsement of any specific investment.
Portfolio of Investments April 30, 2022†
| | |
Investment Companies 98.3% |
|
Health Care Select Sector SPDR Fund | | |
Invesco S&P 500 Low Volatility ETF (a) | | |
iShares Core MSCI EAFE ETF | | |
iShares Core MSCI Emerging Markets ETF | | |
iShares Core S&P Small-Cap ETF | | |
iShares Semiconductor ETF | | |
| | |
Schwab U.S. Small-Cap ETF | | |
SPDR S&P Oil & Gas Exploration & Production ETF (a) | | |
| | |
VanEck Oil Services ETF (a) | | |
| | |
Vanguard Mega Cap Value ETF (a) | | |
| | |
Total Equity Funds
(Cost $14,484,562) | | |
|
Invesco Senior Loan ETF (a) | | |
iShares 0-5 Year High Yield Corporate Bond ETF (a) | | |
iShares 20+ Year Treasury Bond ETF (a) | | |
iShares Broad USD High Yield Corporate Bond ETF (a) | | |
iShares Broad USD Investment Grade Corporate Bond ETF (a) | | |
iShares Core U.S. Aggregate Bond ETF | | |
Schwab U.S. Aggregate Bond ETF | | |
Total Fixed Income Funds
(Cost $20,808,092) | | |
Total Investment Companies
(Cost $35,292,654) | | |
Short-Term Investments 20.9% |
Affiliated Investment Company 2.7% |
MainStay U.S. Government Liquidity Fund, 0.397% (b) | | |
Unaffiliated Investment Companies 18.2% |
BlackRock Liquidity FedFund, 0.375% (b)(c) | | |
The notes to the financial statements are an integral part of, and should be read in conjunction with, the financial statements.
| MainStay Conservative ETF Allocation Fund |
| | |
Short-Term Investments (continued) |
Unaffiliated Investment Companies (continued) |
Invesco Government & Agency Portfolio, 0.419% (b)(c) | | |
Total Unaffiliated Investment Companies
(Cost $6,302,714) | | |
Total Short-Term Investments
(Cost $7,221,634) | | |
Total Investments
(Cost $42,514,288) | | |
Other Assets, Less Liabilities | | |
| | |
| Percentages indicated are based on Fund net assets. |
| All or a portion of this security was held on loan. As of April 30, 2022, the aggregate market value of securities on loan was $8,326,407; the total market value of collateral held by the Fund was $8,716,848. The market value of the collateral held included non-cash collateral in the form of U.S. Treasury securities with a value of $2,414,134. The Fund received cash collateral with a value of $6,302,714. (See Note 2(H)) |
| Current yield as of April 30, 2022. |
| Represents a security purchased with cash collateral received for securities on loan. |
Investments in Affiliates (in 000's)
Investments in issuers considered to be affiliate(s) of the Fund during the year ended April 30, 2022 for purposes of Section 2(a)(3) of the Investment Company Act of 1940, as amended, were as follows:
Affiliated Investment Companies | | | | Net
Realized
Gain/(Loss)
on Sales | Change in
Unrealized
Appreciation/
(Depreciation) | | | | |
MainStay U.S. Government Liquidity Fund | | | | | | | | | |
|
EAFE—Europe, Australasia and Far East |
|
MSCI—Morgan Stanley Capital International |
SPDR—Standard & Poor’s Depositary Receipt |
|
The notes to the financial statements are an integral part of, and should be read in conjunction with, the financial statements.
Portfolio of Investments April 30, 2022† (continued)
The following is a summary of the fair valuations according to the inputs used as of April 30, 2022, for valuing the Fund’s assets:
| Quoted
Prices in
Active
Markets for
Identical
Assets
(Level 1) | Significant
Other
Observable
Inputs
(Level 2) | Significant
Unobservable
Inputs
(Level 3) | |
| | | | |
Investments in Securities (a) | | | | |
| | | | |
| | | | |
| | | | |
Total Investment Companies | | | | |
| | | | |
Affiliated Investment Company | | | | |
Unaffiliated Investment Companies | | | | |
Total Short-Term Investments | | | | |
Total Investments in Securities | | | | |
| For a complete listing of investments, see the Portfolio of Investments. |
The notes to the financial statements are an integral part of, and should be read in conjunction with, the financial statements.
| MainStay Conservative ETF Allocation Fund |
Statement of Assets and Liabilities as of April 30, 2022
|
Investment in unaffiliated securities, at value
(identified cost $41,595,368) including securities on loan of $8,326,407 | |
Investment in affiliated investment companies, at value
(identified cost $918,920) | |
| |
| |
Investment securities sold | |
| |
| |
| |
| |
| |
| |
|
Cash collateral received for securities on loan | |
| |
Investment securities purchased | |
| |
NYLIFE Distributors (See Note 3) | |
| |
Transfer agent (See Note 3) | |
Shareholder communication | |
| |
| |
| |
| |
| |
Composition of Net Assets |
Shares of beneficial interest outstanding (par value of $.001 per share) unlimited number of shares authorized | |
Additional paid-in-capital | |
| |
Total distributable earnings (loss) | |
| |
| |
Net assets applicable to outstanding shares | |
Shares of beneficial interest outstanding | |
Net asset value per share outstanding | |
Maximum sales charge (3.00% of offering price) | |
Maximum offering price per share outstanding | |
| |
Net assets applicable to outstanding shares | |
Shares of beneficial interest outstanding | |
Net asset value and offering price per share outstanding | |
| |
Net assets applicable to outstanding shares | |
Shares of beneficial interest outstanding | |
Net asset value and offering price per share outstanding | |
| |
Net assets applicable to outstanding shares | |
Shares of beneficial interest outstanding | |
Net asset value and offering price per share outstanding | |
| |
Net assets applicable to outstanding shares | |
Shares of beneficial interest outstanding | |
Net asset value and offering price per share outstanding | |
The notes to the financial statements are an integral part of, and should be read in conjunction with, the financial statements.
Statement of Operations for the year ended April 30, 2022
|
| |
| |
| |
| |
| |
| |
Distribution/Service—Class A (See Note 3) | |
Distribution/Service—Class C (See Note 3) | |
Distribution/Service—Class R3 (See Note 3) | |
Distribution/Service—SIMPLE Class (See Note 3) | |
| |
| |
| |
| |
| |
Transfer agent (See Note 3) | |
Shareholder communication | |
| |
Shareholder service (See Note 3) | |
| |
Total expenses before waiver/reimbursement | |
Expense waiver/reimbursement from Manager (See Note 3) | |
| |
Net investment income (loss) | |
Realized and Unrealized Gain (Loss) |
Net realized gain (loss) on unaffiliated investments | |
Net change in unrealized appreciation (depreciation) on unaffiliated investments | |
Net realized and unrealized gain (loss) | |
Net increase (decrease) in net assets resulting from operations | |
The notes to the financial statements are an integral part of, and should be read in conjunction with, the financial statements.
| MainStay Conservative ETF Allocation Fund |
Statements of Changes in Net Assets
for the year ended April 30, 2022 and the period June 30, 2020 (inception date) throughApril 30, 2021
| | |
Increase (Decrease) in Net Assets |
| | |
Net investment income (loss) | | |
| | |
Net change in unrealized appreciation (depreciation) | | |
Net increase (decrease) in net assets resulting from operations | | |
Distributions to shareholders: | | |
| | |
| | |
| | |
| | |
| | |
Total distributions to shareholders | | |
Capital share transactions: | | |
Net proceeds from sales of shares | | |
Net asset value of shares issued to shareholders in reinvestment of distributions | | |
| | |
Increase (decrease) in net assets derived from capital share transactions | | |
Net increase (decrease) in net assets | | |
|
| | |
| | |
The notes to the financial statements are an integral part of, and should be read in conjunction with, the financial statements.
Financial Highlights selected per share data and ratios
| | June 30, 2020^ through
April 30, |
| | |
Net asset value at beginning of year | | |
Net investment income (loss) (a) | | |
Net realized and unrealized gain (loss) | | |
Total from investment operations | | |
| | |
From net investment income | | |
From net realized gain on investments | | |
| | |
Net asset value at end of year | | |
Total investment return (b) | | |
Ratios (to average net assets)/Supplemental Data: | | |
Net investment income (loss) | | |
| | |
Expenses (before waiver/reimbursement) (c) | | |
| | |
Net assets at end of year (in 000’s) | | |
| |
| |
| Per share data based on average shares outstanding during the period. |
| Total investment return is calculated exclusive of sales charges and assumes the reinvestment of dividends and distributions. For periods of less than one year, total return is not annualized. |
| In addition to the fees and expenses which the Fund bears directly, it also indirectly bears a pro-rata share of the fees and expenses of the underlying funds in which it invests. Such indirect expenses are not included in the above expense ratios. |
The notes to the financial statements are an integral part of, and should be read in conjunction with, the financial statements.
| MainStay Conservative ETF Allocation Fund |
Financial Highlights selected per share data and ratios
| | June 30, 2020^ through
April 30, |
| | |
Net asset value at beginning of year | | |
Net investment income (loss) (a) | | |
Net realized and unrealized gain (loss) | | |
Total from investment operations | | |
| | |
From net investment income | | |
From net realized gain on investments | | |
| | |
Net asset value at end of year | | |
Total investment return (b) | | |
Ratios (to average net assets)/Supplemental Data: | | |
Net investment income (loss) | | |
| | |
Expenses (before waiver/reimbursement) (c) | | |
| | |
Net assets at end of year (in 000’s) | | |
| |
| |
| Per share data based on average shares outstanding during the period. |
| Total investment return is calculated exclusive of sales charges and assumes the reinvestment of dividends and distributions. Class I shares are not subject to sales charges. For periods of less than one year, total return is not annualized. |
| In addition to the fees and expenses which the Fund bears directly, it also indirectly bears a pro-rata share of the fees and expenses of the underlying funds in which it invests. Such indirect expenses are not included in the above expense ratios. |
The notes to the financial statements are an integral part of, and should be read in conjunction with, the financial statements.
Financial Highlights selected per share data and ratios
| | June 30, 2020^ through
April 30, |
| | |
Net asset value at beginning of year | | |
Net investment income (loss) (a) | | |
Net realized and unrealized gain (loss) | | |
Total from investment operations | | |
| | |
From net investment income | | |
From net realized gain on investments | | |
| | |
Net asset value at end of year | | |
Total investment return (b) | | |
Ratios (to average net assets)/Supplemental Data: | | |
Net investment income (loss) | | |
| | |
Expenses (before waiver/reimbursement) (c) | | |
| | |
Net assets at end of year (in 000’s) | | |
| |
| |
| Per share data based on average shares outstanding during the period. |
| Total investment return is calculated exclusive of sales charges and assumes the reinvestment of dividends and distributions. Class R3 shares are not subject to sales charges. For periods of less than one year, total return is not annualized. |
| In addition to the fees and expenses which the Fund bears directly, it also indirectly bears a pro-rata share of the fees and expenses of the underlying funds in which it invests. Such indirect expenses are not included in the above expense ratios. |
The notes to the financial statements are an integral part of, and should be read in conjunction with, the financial statements.
| MainStay Conservative ETF Allocation Fund |
Financial Highlights selected per share data and ratios
| | August 31, 2020^ through
April 30, |
| | |
Net asset value at beginning of year | | |
Net investment income (loss) (a) | | |
Net realized and unrealized gain (loss) | | |
Total from investment operations | | |
| | |
From net investment income | | |
From net realized gain on investments | | |
| | |
Net asset value at end of year | | |
Total investment return (b) | | |
Ratios (to average net assets)/Supplemental Data: | | |
Net investment income (loss) | | |
| | |
Expenses (before waiver/reimbursement) (c) | | |
| | |
Net assets at end of year (in 000’s) | | |
| |
| |
| Per share data based on average shares outstanding during the period. |
| Total investment return is calculated exclusive of sales charges and assumes the reinvestment of dividends and distributions. SIMPLE Class shares are not subject to sales charges. For periods of less than one year, total return is not annualized. |
| In addition to the fees and expenses which the Fund bears directly, it also indirectly bears a pro-rata share of the fees and expenses of the underlying funds in which it invests. Such indirect expenses are not included in the above expense ratios. |
The notes to the financial statements are an integral part of, and should be read in conjunction with, the financial statements.
MainStay Moderate ETF Allocation Fund
Investment and Performance Comparison (Unaudited)
Performance data quoted represents past performance. Past performance is no guarantee of future results. Because of market volatility and other factors, current performance may be lower or higher than the figures shown. Investment return and principal value will fluctuate, and as a result, when shares are redeemed, they may be worth more or less than their original cost. The graph below depicts the historical performance of Class I shares of the Fund. Performance will vary from class to class based on differences in class-specific expenses and sales charges. For performance information current to the most recent month-end, please call 800-624-6782 or visit newyorklifeinvestments.com.
The performance table and graph do not reflect the deduction of taxes that a shareholder would pay on distributions or Fund share redemptions. Total returns reflect maximum applicable sales charges as indicated in the table below, if any, changes in share price, and reinvestment of dividend and capital gain distributions. The graph assumes the initial investment amount shown below and reflects the deduction of all sales charges that would have applied for the period of investment. Performance figures may reflect certain fee waivers and/or expense limitations, without which total returns may have been lower. For more information on share classes and current fee waivers and/or expense limitations (if any), please refer to the Notes to Financial Statements.
Average Annual Total Returns for the Year-Ended April 30, 2022 |
| | | | | | |
| Maximum 3% Initial Sales Charge | | | | | |
| | | | | | |
| | | | | | |
| if redeemed Within One Year of Purchase | | | | | |
| | | | | | |
| | | | | | |
| | | | | | |
| The gross expense ratios presented reflect the Fund’s “Total Annual Fund Operating Expenses” from the most recent Prospectus, as supplemented, and may differ from other expense ratios disclosed in this report. |
The footnotes on the next page are an integral part of the table and graph and should be carefully read in conjunction with them.
| MainStay Moderate ETF Allocation Fund |
| | |
| | |
| | |
Bloomberg U.S. Aggregate Bond Index3 | | |
Moderate Allocation Composite Index4 | | |
Morningstar Allocation-50% to 70% Equity Category Average5 | | |
| Returns for indices reflect no deductions for fees, expenses or taxes, except for foreign withholding taxes where applicable. |
| The S&P 500® Index is the Fund’s primary broad-based securities market index for comparison purposes. S&P 500® is a trademark of The McGraw-Hill Companies, Inc. The S&P 500® Index is widely regarded as the standard index for measuring large-cap U.S. stock market performance. Results assume reinvestment of all dividends and capital gains. An investment cannot be made directly in an index. |
| The MSCI EAFE® Index (Net) is the Fund's secondary benchmark. The MSCI EAFE® Index (Net) consists of international stocks representing the developed world outside of North America. Results assume reinvestment of all dividends and capital gains. An investment cannot be made directly in an index. |
| The Fund has selected the Bloomberg U.S. Aggregate Bond Index as an additional benchmark. The Bloomberg U.S. Aggregate Bond Index is a broad-based benchmark that measures the performance of the investment grade, U.S. dollar-denominated, fixed-rate taxable bond market, including Treasurys, government-related and corporate securities, mortgage-backed securities (agency fixed-rate and hybrid adjustable rate mortgage pass-throughs), asset-backed securities, and commercial mortgage-backed securities. Results assume reinvestment of all dividends and capital gains. An investment cannot be made directly in an index. |
| The Fund has selected the Moderate Allocation Composite Index as an additional benchmark. The Moderate Allocation Composite Index consists of the S&P 500® Index, the MSCI EAFE® Index (Net) and the Bloomberg U.S. Aggregate Bond Index weighted 45%, 15% and 40%, respectively. Results assume reinvestment of all dividends and capital gains. An investment cannot be made directly in an index. |
| The Morningstar Allocation – 50% to 70% Equity Category Average is representative of funds that seek to provide both income and capital appreciation by investing in multiple asset classes, including stocks, bonds, and cash. These portfolios are dominated by domestic holdings and have equity exposures between 50% and 70%. Results are based on average total returns of similar funds with all dividends and capital gain distributions reinvested. |
The footnotes on the preceding page are an integral part of the table and graph and should be carefully read in conjunction with them.
Cost in Dollars of a $1,000 Investment in MainStay Moderate ETF Allocation Fund (Unaudited)
The example below is intended to describe the fees and expenses borne by shareholders during the six-month period from November 1, 2021 to April 30, 2022, and the impact of those costs on your investment.
Example
As a shareholder of the Fund you incur two types of costs: (1) transaction costs, including exchange fees and sales charges (loads) on purchases (as applicable), and (2) ongoing costs, including management fees, distribution and/or service (12b-1) fees and other Fund expenses (as applicable). This example is intended to help you understand your ongoing costs (in dollars) of investing in the Fund and to compare these costs with the ongoing costs of investing in other mutual funds. The example is based on an investment of $1,000 made at the beginning of the six-month period and held for the entire period from November 1, 2021 to April 30, 2022.
This example illustrates your Fund’s ongoing costs in two ways:
Actual Expenses
The second and third data columns in the table below provide information about actual account values and actual expenses. You may use the information in these columns, together with the amount you invested, to estimate the expenses that you paid during the six months ended April 30, 2022. Simply divide your account value by $1,000 (for example, an
$8,600 account value divided by $1,000 = 8.6), then multiply the result by the number under the heading entitled “Expenses Paid During Period” to estimate the expenses you paid on your account during this period.
Hypothetical Example for Comparison Purposes
The fourth and fifth data columns in the table below provide information about hypothetical account values and hypothetical expenses based on the Fund’s actual expense ratio and an assumed rate of return of 5% per year before expenses, which is not the Fund’s actual return. The hypothetical account values and expenses may not be used to estimate the actual ending account balances or expenses you paid for the six-month period shown. You may use this information to compare the ongoing costs of investing in the Fund with the ongoing costs of investing in other mutual funds. To do so, compare this 5% hypothetical example with the 5% hypothetical examples that appear in the shareholder reports of the other mutual funds.
Please note that the expenses shown in the table are meant to highlight your ongoing costs only and do not reflect any transactional costs, such as exchange fees or sales charges (loads). Therefore, the fourth and fifth data columns of the table are useful in comparing ongoing costs only and will not help you determine the relative total costs of owning different funds. In addition, if these transactional costs were included, your costs would have been higher.
| Beginning
Account
Value
11/1/21 | Ending Account
Value (Based
on Actual
Returns and
Expenses)
4/30/22 | | Ending Account
Value (Based
on Hypothetical
5% Annualized
Return and
Actual Expenses)
4/30/22 | | |
| | | | | | |
| | | | | | |
| | | | | | |
| | | | | | |
| | | | | | |
| Expenses are equal to the Fund’s annualized expense ratio of each class multiplied by the average account value over the period, divided by 365 and multiplied by 181 (to reflect the six-month period). The table above represents the actual expenses incurred during the six-month period. In addition to the fees and expenses which the Fund bears directly, it also indirectly bears a pro rata share of the fees and expenses of the underlying funds in which it invests. Such indirect expenses are not included in the above-reported expense figures. |
| Expenses are equal to the Fund's annualized expense ratio to reflect the six-month period. |
| During the year ended April 30, 2022, the Fund had expense limitations on Total Annual Operating Expenses (See Note 3A) that were lower than the Net Expense Ratios during the six-month period. |
| MainStay Moderate ETF Allocation Fund |
Asset Diversification as of April 30, 2022 (Unaudited) | |
| |
| |
Other Assets, Less Liabilities | |
See Portfolio of Investments beginning on page 45 for specific holdings within these categories. The Fund’s holdings are subject to change.
Portfolio Management Discussion and Analysis (Unaudited)
Questions answered by portfolio managers Jae S. Yoon, CFA, Jonathan Swaney, Poul Kristensen, CFA, and Amit Soni, CFA, of New York Life Investment Management LLC, the Fund’s Manager.
How did MainStay Moderate ETF Allocation Fund perform relative to its benchmarks and peer group during the reporting period ended April 30, 2022?
For the 12 months ended April 30, 2022, Class I shares of MainStay Moderate ETF Allocation Fund returned −5.31%, underperforming the 0.21% return of the Fund’s primary benchmark, the S&P 500® Index, and outperforming the −8.15% return of the MSCI EAFE® Index, which is the Fund’s secondary benchmark. Over the same period, Class I shares of the Fund outperformed the −8.51% return of the Bloomberg U.S. Aggregate Bond Index, and underperformed the −4.42% return of the Moderate Allocation Composite Index, both of which are additional benchmarks of the Fund. For the 12 months ended April 30, 2022, Class I shares of the Fund underperformed the −4.42% return of the Morningstar Allocation—50% to 70% Equity Category Average.1
What factors affected the Fund’s relative performance during the reporting period?
The Fund is a “fund of funds" that seeks to achieve its investment objective by investing in unaffiliated, passively-managed, exchange-traded funds (“Underlying ETFs”). The Underlying ETFs may invest in U.S. equities, international equities and fixed-income instruments, making comparisons to any single index generally less suitable than a weighted combination of indices, which is a more useful yardstick by which to measure performance. During the reporting period, asset class policy was the primary determinant of the Fund's relative performance.
Fund management internally maintains a blend of indices that are taken into consideration when managing the Fund. During the reporting period, the performance of the Fund moderately outperformed that of the internally maintained blend of indices. The reporting period can be divided on a calendar year basis. The final eight months of 2021 saw sizable market returns, although the Fund struggled from a relative performance perspective as a tilt toward value proved premature and an overweight allocation to small-company stocks weighed on results. This reversed dramatically in 2022, with significant outperformance overshadowing the softer results from earlier in the reporting period, primarily due to active positioning at the asset-class level in several areas. Key positive contributions came from:
• short duration2 within fixed income,
• an emphasis on value over growth within stocks and
• specific exposure to energy and gold miner equities.
(Contributions take weightings and total returns into account.)
A variety of factors, all of them interconnected, contributed to the success of those positions. Among the more dominant were:
• Inflation: Early in the reporting period, the U.S. Federal Reserve (the “Fed”) finally acknowledged that inflationary pressures extended beyond “transitory,” pandemic-related determinants. Stubbornly high readings brought forth aggressively tighter policy assumptions, hammering long-duration fixed-income and equity price multiples.
• COVID-19: Although now endemic, at least in most Western countries, the contagion continued to send ripples through the global economy. Lockdowns in China that contributed to persistent supply chain disruptions, and hence inflation, were the most obvious example of this.
• Ukraine: Due to the conflict itself, which massively curtailed production within Ukraine, as well as the sanctions that were imposed on Russia in retaliation, global stocks of energy, grains, industrial metals and gases, and other materials became increasingly strained, further exacerbating inflationary pressures.
• Labor supply: The size of the working-age population declined in 2021 for the first time in over 40 years and is expected to remain effectively stagnant over the next decade or two. Workers became scarce, increasing the likelihood of constrained production and wage growth over time, adding a little more fuel to the inflation fire.
How did you allocate the Fund’s assets during the reporting period and why?
Stock/bond blend: The Fund held slightly overweight exposure to equities during the reporting period, with the magnitude of that bias managed tactically in response to swings in pricing (adding on drawdowns and trimming on rallies). We expected that fixed income would struggle as the era of ultra-accommodative monetary policy came to an end, whereas equities would generally retain their value slightly better, with robust domestic demand supporting corporate earnings. Management of the Fund’s stock/bond mix added to performance.
Fixed income: We skewed the Fund’s holdings to favor shorter-maturity and lower-quality instruments that would be less sensitive to rising bond yields. This approach reflected our belief that inflationary pressures were somewhat structural in nature and likely to persist at elevated levels for the foreseeable future. Fixed-income positioning bolstered returns.
Geographic exposure: Prior to Russia’s invasion of Ukraine, the Fund’s geographic exposure reflected our positive expectations for non-U.S. developed markets generally, and Europe in particular,
1.
See page 38 for other share class returns, which may be higher or lower than Class I share returns. See page 39 for more information on benchmark and peer group returns.
2.
Duration is a measure of the price sensitivity of a fixed-income investment to changes in interest rates. Duration is expressed as a number of years and is considered a more accurate sensitivity gauge than average maturity.
| MainStay Moderate ETF Allocation Fund |
based on attractive valuations and the post-COVID-19 cyclical recovery we saw coming. Accordingly, the Fund tilted in that direction. War, sanctions, soaring local energy prices and looming recession changed the underlying picture. We responded by unwinding the Fund’s position and resetting geographic exposures to neutral, but not before performance was negatively affected.
Equity size: Small-company stocks were more heavily owned in the Fund than in the Moderate Allocation Composite Index. The thesis behind this positioning was based on the small-cap asset class’s attractive valuations, insulation from economic weakness abroad, less sensitivity to dollar strength and disproportionate exposure to domestic demand, which remained robust. Despite these presumed advantages, however, small-cap stocks underperformed the broader market, detracting from the Fund’s relative performance.
Equity style: We saw inflation, which undermines the value of more distant cash flows, as threatening to growth equities with high prices relative to current earnings. Accordingly, the Fund emphasized value stocks offering more attractive near-term cash flows. We placed a particular focus on the relatively defensive sectors of real estate, utilities, consumer staples and health care. While this position detracted from returns during the first eight months of the reporting period, it enhanced returns from January through April 2022, – more than offsetting earlier losses – for a combined positive effect.
Other sector exposures: The Fund maintained a small position in gold miners as a hedge against inflation and/or a monetary policy mistake, in addition to a small position in upstream energy producers as a commodity play to provide an additional inflation hedge. Both positions made disproportionate positive contributions to return as commodity prices rose.
How did the Fund’s allocations change over the course of the reporting period?
Equity exposure was added and then removed primarily through the use of the Vanguard Mega Cap ETF. The equity allocation at the end of the reporting period was slightly higher than at the beginning, reflecting purchases as the market softened in late-April 2022. One of the larger shifts in Fund allocations during the reporting period was a reduction in holdings of Vanguard Mega Cap Value ETF, using the proceeds to fund purchases of Invesco S&P® Low Volatility ETF, SPDR® S&P® Oil & Gas Exploration & Production ETF and VanEck Oil Services ETF. While value strategies performed quite well, the tilt into more defensive sectors with low volatility and the focus on energy were more profitable. The Fund also added exposure to iShares® Core S&P Small-Cap ETF and Schwab® U.S. Small-Cap ETF in keeping with its migration down the capitalization spectrum. Late in the reporting period, the Fund established a position in iShares® 20+ Year Treasury Bond ETF, adding a little duration to the Fund’s bond position in light of dramatically rising rates. Lastly, the Fund
reduced its allocation to iShares® Core MSCI EAFE ETF, trimming exposure to developed international markets in the wake of Russia’s invasion of Ukraine.
During the reporting period, which Underlying Equity ETFs had the highest total returns and which Underlying Equity ETFs had the lowest total returns?
Of the Underlying Equity ETFs held for the entire reporting period, only Vanguard Mega Cap Value ETF and VanEck Gold Miners ETF generated positive returns. Those posting the most significant losses were Schwab® U.S. Small-Cap ETF and iShares® Core MSCI EAFE ETF.
Which Underlying Equity ETFs were the strongest positive contributors to the Fund’s performance and which Underlying Equity ETFs were particularly weak?
The Underlying Equity ETFs providing the highest total returns—Vanguard Mega Cap Value ETF and VanEck Gold Miners ETF—also produced the strongest positive contributions to performance, followed by SPDR® S&P® Oil & Gas Exploration & Production ETF. The most significant detractors were iShares® Core MSCI EAFE ETF, Schwab® U.S. Small-Cap ETF and Schwab® U.S. Mid-Cap ETF.
During the reporting period, which Underlying Fixed-Income ETFs had the highest total returns and which Underlying Fixed-Income ETFs had the lowest total returns?
Invesco Senior Loan ETF generated a small positive return, while cash holdings were flat. All other Underlying Fixed-Income ETFs generated losses, with iShares® 0-5 Year High Yield Corporate Bond ETF posting the mildest declines. The largest losses came from iShares® Broad USD Investment Grade Corporate Bond ETF and Schwab® U.S. Aggregate Bond ETF.
Which Underlying Fixed-Income ETFs were the strongest positive contributors to the Fund’s performance and which Underlying Fixed-Income ETFs were particularly weak?
Invesco Senior Loan ETF made a very small positive contribution to performance, while cash holdings neither contributed nor detracted from returns. All other Underlying Fixed-Income ETFs generated losses, with Vanguard Short-Term Bond ETF detracting least. The most significant detractors from performance were iShares® Broad USD Investment Grade Corporate Bond ETF and iShares® 0-5 Year High Yield Corporate Bond ETF.
How was the Fund positioned at the end of the reporting period?
As the market sold off in April 2022, we added to the Fund’s equity exposure, positioning the Fund with a modestly overweight
allocation to equities as of April 30, 2022. We are fully cognizant of the many challenges facing stock prices (high inflation, rising rates, geopolitical conflict, supply chain disruptions and worker shortages), but we also perceive a supportive demand backdrop (robust corporate capital spending, solid household consumption, growing payrolls, healthy consumer sentiment and strong corporate balance sheets). The two appear in rough equilibrium, such that we expect a largely sideways market for the foreseeable future. Within that environment, we anticipate trading tactically on the Fund’s behalf, adding to equity holdings during periods of weakness and trimming them again as prices recover.
In terms of the Fund’s posture within asset classes, the positions described above remain intact as of April 30, 2022. The bias we expect to have the largest impact on active return is our preference for small-cap stocks. We believe that the large-cap space is potentially vulnerable to economic weakness abroad, a strong U.S. dollar, rich valuations and concentration in a relatively short list of very large companies (mega-cap technology). Small-cap stocks, in contrast, cater primarily to a financially healthy domestic clientele and have historically been more successful than larger companies in protecting real earnings amid high inflation.
Likewise, the Fund’s emphasis on value over growth stocks remains intact as of April 30, 2022 with a particular emphasis on what we perceive to be the defensive “RUSH” sectors: real estate, utilities, consumer staples and health care. The thesis rests primarily on the idea that inflation will prove persistent and jeopardize the high price multiples paid on fast-growing companies with current valuations that depend on distant earnings. We are also mindful of the economy’s progression in the business cycle and the possibility that a recession may not be very far away.
The Fund retains a position in gold miners as of April 30, 2022 reflecting our view that real interest rates are historically quite low. The Fund also maintains exposure to energy sector firms as of April 30, 2022 as we envision sustained supply constraints keeping commodity prices elevated, preserving meaty profit margins for a couple of years to come.
Within fixed income, we have reduced the Fund’s short-duration posture as yields have climbed. As of April 30, 2022, the Fund’s duration is notably short of the benchmark. The Fund maintains a mild tilt toward credit, as corporate fundamentals appear likely to remain sound for the foreseeable future. We may increase the
Fund’s high-yield bond exposure if we see credit spreads widen much beyond 400 basis points. (A basis point is one one-hundredth of a percentage point.)
None of Schwab Strategic Trust, Schwab® U.S. Small-Cap ETF, Schwab® U.S. Mid-Cap ETF, Schwab® U.S. Aggregate Bond ETF, or Charles Schwab Investment Management, Inc. make any representations regarding the advisability of investing in MainStay Moderate ETF Allocation Fund.
iShares® is a registered trademark of BlackRock (BlackRock, Inc. and its subsidiaries). Neither BlackRock nor the iShares® Funds make any representations regarding the advisability of investing in MainStay Moderate ETF Allocation Fund.
The opinions expressed are those of the portfolio managers as of the date of this report and are subject to change. There is no guarantee that any forecasts will come to pass. This material does not constitute investment advice and is not intended as an endorsement of any specific investment.
| MainStay Moderate ETF Allocation Fund |
Portfolio of Investments April 30, 2022†
| | |
Investment Companies 98.5% |
|
Health Care Select Sector SPDR Fund | | |
Invesco S&P 500 Low Volatility ETF | | |
iShares Core MSCI EAFE ETF | | |
iShares Core MSCI Emerging Markets ETF | | |
iShares Core S&P Small-Cap ETF | | |
iShares Semiconductor ETF | | |
| | |
Schwab U.S. Small-Cap ETF | | |
SPDR S&P Oil & Gas Exploration & Production ETF (a) | | |
| | |
VanEck Oil Services ETF (a) | | |
| | |
Vanguard Mega Cap Value ETF | | |
| | |
Total Equity Funds
(Cost $56,204,853) | | |
|
Invesco Senior Loan ETF (a) | | |
iShares 0-5 Year High Yield Corporate Bond ETF (a) | | |
iShares 20+ Year Treasury Bond ETF (a) | | |
iShares Broad USD High Yield Corporate Bond ETF (a) | | |
iShares Broad USD Investment Grade Corporate Bond ETF (a) | | |
iShares Core U.S. Aggregate Bond ETF | | |
Schwab U.S. Aggregate Bond ETF (a) | | |
Total Fixed Income Funds
(Cost $34,952,752) | | |
Total Investment Companies
(Cost $91,157,605) | | |
Short-Term Investments 17.9% |
Affiliated Investment Company 2.5% |
MainStay U.S. Government Liquidity Fund, 0.397% (b) | | |
Unaffiliated Investment Companies 15.4% |
BlackRock Liquidity FedFund, 0.375% (b)(c) | | |
The notes to the financial statements are an integral part of, and should be read in conjunction with, the financial statements.
Portfolio of Investments April 30, 2022† (continued)
| | |
Short-Term Investments (continued) |
Unaffiliated Investment Companies (continued) |
Invesco Government & Agency Portfolio, 0.419% (b)(c) | | |
Total Unaffiliated Investment Companies
(Cost $14,010,023) | | |
Total Short-Term Investments
(Cost $16,269,572) | | |
Total Investments
(Cost $107,427,177) | | |
Other Assets, Less Liabilities | | |
| | |
| Percentages indicated are based on Fund net assets. |
| All or a portion of this security was held on loan. As of April 30, 2022, the aggregate market value of securities on loan was $15,292,025; the total market value of collateral held by the Fund was $15,834,428. The market value of the collateral held included non-cash collateral in the form of U.S. Treasury securities with a value of $1,824,405. The Fund received cash collateral with a value of $14,010,023. (See Note 2(H)) |
| Current yield as of April 30, 2022. |
| Represents a security purchased with cash collateral received for securities on loan. |
Investments in Affiliates (in 000's)
Investments in issuers considered to be affiliate(s) of the Fund during the year ended April 30, 2022 for purposes of Section 2(a)(3) of the Investment Company Act of 1940, as amended, were as follows:
Affiliated Investment Companies | | | | Net
Realized
Gain/(Loss)
on Sales | Change in
Unrealized
Appreciation/
(Depreciation) | | | | |
MainStay U.S. Government Liquidity Fund | | | | | | | | | |
|
EAFE—Europe, Australasia and Far East |
|
MSCI—Morgan Stanley Capital International |
SPDR—Standard & Poor’s Depositary Receipt |
|
The notes to the financial statements are an integral part of, and should be read in conjunction with, the financial statements.
| MainStay Moderate ETF Allocation Fund |
The following is a summary of the fair valuations according to the inputs used as of April 30, 2022, for valuing the Fund’s assets:
| Quoted
Prices in
Active
Markets for
Identical
Assets
(Level 1) | Significant
Other
Observable
Inputs
(Level 2) | Significant
Unobservable
Inputs
(Level 3) | |
| | | | |
Investments in Securities (a) | | | | |
| | | | |
| | | | |
| | | | |
Total Investment Companies | | | | |
| | | | |
Affiliated Investment Company | | | | |
Unaffiliated Investment Companies | | | | |
Total Short-Term Investments | | | | |
Total Investments in Securities | | | | |
| For a complete listing of investments, see the Portfolio of Investments. |
The notes to the financial statements are an integral part of, and should be read in conjunction with, the financial statements.
Statement of Assets and Liabilities as of April 30, 2022
|
Investment in unaffiliated securities, at value
(identified cost $105,167,628) including securities on loan of $15,292,025 | |
Investment in affiliated investment companies, at value
(identified cost $2,259,549) | |
| |
Investment securities sold | |
| |
| |
| |
| |
| |
|
Cash collateral received for securities on loan | |
| |
| |
Investment securities purchased | |
NYLIFE Distributors (See Note 3) | |
| |
Transfer agent (See Note 3) | |
| |
| |
| |
Shareholder communication | |
| |
| |
| |
| |
Composition of Net Assets |
Shares of beneficial interest outstanding (par value of $.001 per share) unlimited number of shares authorized | |
Additional paid-in-capital | |
| |
Total distributable earnings (loss) | |
| |
| |
Net assets applicable to outstanding shares | |
Shares of beneficial interest outstanding | |
Net asset value per share outstanding | |
Maximum sales charge (3.00% of offering price) | |
Maximum offering price per share outstanding | |
| |
Net assets applicable to outstanding shares | |
Shares of beneficial interest outstanding | |
Net asset value and offering price per share outstanding | |
| |
Net assets applicable to outstanding shares | |
Shares of beneficial interest outstanding | |
Net asset value and offering price per share outstanding | |
| |
Net assets applicable to outstanding shares | |
Shares of beneficial interest outstanding | |
Net asset value and offering price per share outstanding | |
| |
Net assets applicable to outstanding shares | |
Shares of beneficial interest outstanding | |
Net asset value and offering price per share outstanding | |
The notes to the financial statements are an integral part of, and should be read in conjunction with, the financial statements.
| MainStay Moderate ETF Allocation Fund |
Statement of Operations for the year ended April 30, 2022
|
| |
| |
| |
| |
| |
| |
Distribution/Service—Class A (See Note 3) | |
Distribution/Service—Class C (See Note 3) | |
Distribution/Service—Class R3 (See Note 3) | |
Distribution/Service—SIMPLE Class (See Note 3) | |
| |
| |
| |
Transfer agent (See Note 3) | |
| |
| |
Shareholder communication | |
| |
Shareholder service (See Note 3) | |
| |
Total expenses before waiver/reimbursement | |
Expense waiver/reimbursement from Manager (See Note 3) | |
| |
Net investment income (loss) | |
Realized and Unrealized Gain (Loss) |
Net realized gain (loss) on unaffiliated investments | |
Net change in unrealized appreciation (depreciation) on unaffiliated investments | |
Net realized and unrealized gain (loss) | |
Net increase (decrease) in net assets resulting from operations | |
The notes to the financial statements are an integral part of, and should be read in conjunction with, the financial statements.
Statements of Changes in Net Assets
for the year ended April 30, 2022 and the period June 30, 2020 (inception date) throughApril 30, 2021
| | |
Increase (Decrease) in Net Assets |
| | |
Net investment income (loss) | | |
| | |
Net change in unrealized appreciation (depreciation) | | |
Net increase (decrease) in net assets resulting from operations | | |
Distributions to shareholders: | | |
| | |
| | |
| | |
| | |
| | |
Total distributions to shareholders | | |
Capital share transactions: | | |
Net proceeds from sales of shares | | |
Net asset value of shares issued to shareholders in reinvestment of distributions | | |
| | |
Increase (decrease) in net assets derived from capital share transactions | | |
Net increase (decrease) in net assets | | |
|
| | |
| | |
The notes to the financial statements are an integral part of, and should be read in conjunction with, the financial statements.
| MainStay Moderate ETF Allocation Fund |
Financial Highlights selected per share data and ratios
| | June 30, 2020^ through
April 30, |
| | |
Net asset value at beginning of year | | |
Net investment income (loss) (a) | | |
Net realized and unrealized gain (loss) | | |
Total from investment operations | | |
| | |
From net investment income | | |
From net realized gain on investments | | |
| | |
Net asset value at end of year | | |
Total investment return (b) | | |
Ratios (to average net assets)/Supplemental Data: | | |
Net investment income (loss) | | |
| | |
Expenses (before waiver/reimbursement) (c) | | |
| | |
Net assets at end of year (in 000’s) | | |
| |
| |
| Per share data based on average shares outstanding during the period. |
| Total investment return is calculated exclusive of sales charges and assumes the reinvestment of dividends and distributions. For periods of less than one year, total return is not annualized. |
| In addition to the fees and expenses which the Fund bears directly, it also indirectly bears a pro-rata share of the fees and expenses of the underlying funds in which it invests. Such indirect expenses are not included in the above expense ratios. |
The notes to the financial statements are an integral part of, and should be read in conjunction with, the financial statements.
Financial Highlights selected per share data and ratios
| | June 30, 2020^ through
April 30, |
| | |
Net asset value at beginning of year | | |
Net investment income (loss) (a) | | |
Net realized and unrealized gain (loss) | | |
Total from investment operations | | |
| | |
From net investment income | | |
From net realized gain on investments | | |
| | |
Net asset value at end of year | | |
Total investment return (b) | | |
Ratios (to average net assets)/Supplemental Data: | | |
Net investment income (loss) | | |
| | |
Expenses (before waiver/reimbursement) (c) | | |
| | |
Net assets at end of year (in 000’s) | | |
| |
| |
| Per share data based on average shares outstanding during the period. |
| Total investment return is calculated exclusive of sales charges and assumes the reinvestment of dividends and distributions. Class I shares are not subject to sales charges. For periods of less than one year, total return is not annualized. |
| In addition to the fees and expenses which the Fund bears directly, it also indirectly bears a pro-rata share of the fees and expenses of the underlying funds in which it invests. Such indirect expenses are not included in the above expense ratios. |
The notes to the financial statements are an integral part of, and should be read in conjunction with, the financial statements.
| MainStay Moderate ETF Allocation Fund |
Financial Highlights selected per share data and ratios
| | June 30, 2020^ through
April 30, |
| | |
Net asset value at beginning of year | | |
Net investment income (loss) (a) | | |
Net realized and unrealized gain (loss) | | |
Total from investment operations | | |
| | |
From net investment income | | |
From net realized gain on investments | | |
| | |
Net asset value at end of year | | |
Total investment return (b) | | |
Ratios (to average net assets)/Supplemental Data: | | |
Net investment income (loss) | | |
| | |
Expenses (before waiver/reimbursement) (c) | | |
| | |
Net assets at end of year (in 000’s) | | |
| |
| |
| Per share data based on average shares outstanding during the period. |
| Total investment return is calculated exclusive of sales charges and assumes the reinvestment of dividends and distributions. Class R3 shares are not subject to sales charges. For periods of less than one year, total return is not annualized. |
| In addition to the fees and expenses which the Fund bears directly, it also indirectly bears a pro-rata share of the fees and expenses of the underlying funds in which it invests. Such indirect expenses are not included in the above expense ratios. |
The notes to the financial statements are an integral part of, and should be read in conjunction with, the financial statements.
Financial Highlights selected per share data and ratios
| | August 31, 2020^ through
April 30, |
| | |
Net asset value at beginning of year | | |
Net investment income (loss) (a) | | |
Net realized and unrealized gain (loss) | | |
Total from investment operations | | |
| | |
From net investment income | | |
From net realized gain on investments | | |
| | |
Net asset value at end of year | | |
Total investment return (b) | | |
Ratios (to average net assets)/Supplemental Data: | | |
Net investment income (loss) | | |
| | |
Expenses (before waiver/reimbursement) (c) | | |
| | |
Net assets at end of year (in 000’s) | | |
| |
| |
| Per share data based on average shares outstanding during the period. |
| Total investment return is calculated exclusive of sales charges and assumes the reinvestment of dividends and distributions. SIMPLE Class shares are not subject to sales charges. For periods of less than one year, total return is not annualized. |
| In addition to the fees and expenses which the Fund bears directly, it also indirectly bears a pro-rata share of the fees and expenses of the underlying funds in which it invests. Such indirect expenses are not included in the above expense ratios. |
The notes to the financial statements are an integral part of, and should be read in conjunction with, the financial statements.
| MainStay Moderate ETF Allocation Fund |
MainStay Growth ETF Allocation Fund
Investment and Performance Comparison (Unaudited)
Performance data quoted represents past performance. Past performance is no guarantee of future results. Because of market volatility and other factors, current performance may be lower or higher than the figures shown. Investment return and principal value will fluctuate, and as a result, when shares are redeemed, they may be worth more or less than their original cost. The graph below depicts the historical performance of Class I shares of the Fund. Performance will vary from class to class based on differences in class-specific expenses and sales charges. For performance information current to the most recent month-end, please call 800-624-6782 or visit newyorklifeinvestments.com.
The performance table and graph do not reflect the deduction of taxes that a shareholder would pay on distributions or Fund share redemptions. Total returns reflect maximum applicable sales charges as indicated in the table below, if any, changes in share price, and reinvestment of dividend and capital gain distributions. The graph assumes the initial investment amount shown below and reflects the deduction of all sales charges that would have applied for the period of investment. Performance figures may reflect certain fee waivers and/or expense limitations, without which total returns may have been lower. For more information on share classes and current fee waivers and/or expense limitations (if any), please refer to the Notes to Financial Statements.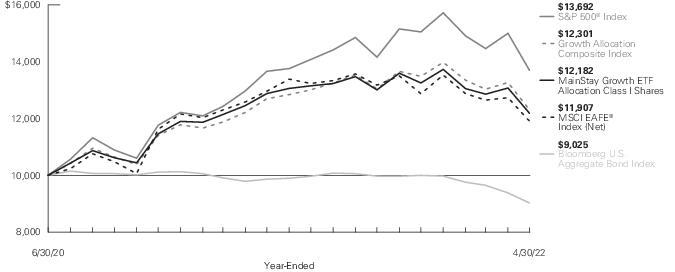
Average Annual Total Returns for the Year-Ended April 30, 2022 |
| | | | | | |
| Maximum 3% Initial Sales Charge | | | | | |
| | | | | | |
| | | | | | |
| if redeemed Within One Year of Purchase | | | | | |
| | | | | | |
| | | | | | |
| | | | | | |
| The gross expense ratios presented reflect the Fund’s “Total Annual Fund Operating Expenses” from the most recent Prospectus, as supplemented, and may differ from other expense ratios disclosed in this report. |
The footnotes on the next page are an integral part of the table and graph and should be carefully read in conjunction with them.
| | |
| | |
| | |
Bloomberg U.S. Aggregate Bond Index3 | | |
Growth Allocation Composite Index4 | | |
Morningstar Allocation-70% to 85% Equity Category Average5 | | |
| Returns for indices reflect no deductions for fees, expenses or taxes, except for foreign withholding taxes where applicable. |
| The S&P 500® Index is the Fund’s primary broad-based securities market index for comparison purposes. S&P 500® is a trademark of The McGraw-Hill Companies, Inc. The S&P 500® Index is widely regarded as the standard index for measuring large-cap U.S. stock market performance. Results assume reinvestment of all dividends and capital gains. An investment cannot be made directly in an index. |
| The MSCI EAFE® Index (Net) is the Fund's secondary benchmark. The MSCI EAFE® Index (Net) consists of international stocks representing the developed world outside of North America. Results assume reinvestment of all dividends and capital gains. An investment cannot be made directly in an index. |
| The Fund has selected the Bloomberg U.S. Aggregate Bond Index as an additional benchmark. The Bloomberg U.S. Aggregate Bond Index is a broad-based benchmark that measures the performance of the investment grade, U.S. dollar-denominated, fixed-rate taxable bond market, including Treasurys, government-related and corporate securities, mortgage-backed securities (agency fixed-rate and hybrid adjustable rate mortgage pass-throughs), asset-backed securities, and commercial mortgage-backed securities. Results assume reinvestment of all dividends and capital gains. An investment cannot be made directly in an index. |
| The Fund has selected the Growth Allocation Composite Index as an additional benchmark. The Growth Allocation Composite Index consists of the S&P 500® Index, the MSCI EAFE® Index (Net) and the Bloomberg U.S. Aggregate Bond Index weighted 60%, 20% and 20%, respectively. Results assume reinvestment of all dividends and capital gains. An investment cannot be made directly in an index. |
| The Morningstar Allocation – 70% to 85% Equity Category Average is representative of funds that seek to provide both income and capital appreciation by investing in multiple asset classes, including stocks, bonds, and cash. These portfolios are dominated by domestic holdings and have equity exposures between 70% and 85%. Results are based on average total returns of similar funds with all dividends and capital gain distributions reinvested. |
The footnotes on the preceding page are an integral part of the table and graph and should be carefully read in conjunction with them.
| MainStay Growth ETF Allocation Fund |
Cost in Dollars of a $1,000 Investment in MainStay Growth ETF Allocation Fund (Unaudited)
The example below is intended to describe the fees and expenses borne by shareholders during the six-month period from November 1, 2021 to April 30, 2022, and the impact of those costs on your investment.
Example
As a shareholder of the Fund you incur two types of costs: (1) transaction costs, including exchange fees and sales charges (loads) on purchases (as applicable), and (2) ongoing costs, including management fees, distribution and/or service (12b-1) fees and other Fund expenses (as applicable). This example is intended to help you understand your ongoing costs (in dollars) of investing in the Fund and to compare these costs with the ongoing costs of investing in other mutual funds. The example is based on an investment of $1,000 made at the beginning of the six-month period and held for the entire period from November 1, 2021 to April 30, 2022.
This example illustrates your Fund’s ongoing costs in two ways:
Actual Expenses
The second and third data columns in the table below provide information about actual account values and actual expenses. You may use the information in these columns, together with the amount you invested, to estimate the expenses that you paid during the six months ended April 30, 2022. Simply divide your account value by $1,000 (for example, an
$8,600 account value divided by $1,000 = 8.6), then multiply the result by the number under the heading entitled “Expenses Paid During Period” to estimate the expenses you paid on your account during this period.
Hypothetical Example for Comparison Purposes
The fourth and fifth data columns in the table below provide information about hypothetical account values and hypothetical expenses based on the Fund’s actual expense ratio and an assumed rate of return of 5% per year before expenses, which is not the Fund’s actual return. The hypothetical account values and expenses may not be used to estimate the actual ending account balances or expenses you paid for the six-month period shown. You may use this information to compare the ongoing costs of investing in the Fund with the ongoing costs of investing in other mutual funds. To do so, compare this 5% hypothetical example with the 5% hypothetical examples that appear in the shareholder reports of the other mutual funds.
Please note that the expenses shown in the table are meant to highlight your ongoing costs only and do not reflect any transactional costs, such as exchange fees or sales charges (loads). Therefore, the fourth and fifth data columns of the table are useful in comparing ongoing costs only and will not help you determine the relative total costs of owning different funds. In addition, if these transactional costs were included, your costs would have been higher.
| Beginning
Account
Value
11/1/21 | Ending Account
Value (Based
on Actual
Returns and
Expenses)
4/30/22 | | Ending Account
Value (Based
on Hypothetical
5% Annualized
Return and
Actual Expenses)
4/30/22 | | |
| | | | | | |
| | | | | | |
| | | | | | |
| | | | | | |
| | | | | | |
| Expenses are equal to the Fund’s annualized expense ratio of each class multiplied by the average account value over the period, divided by 365 and multiplied by 181 (to reflect the six-month period). The table above represents the actual expenses incurred during the six-month period. In addition to the fees and expenses which the Fund bears directly, it also indirectly bears a pro rata share of the fees and expenses of the underlying funds in which it invests. Such indirect expenses are not included in the above-reported expense figures. |
| Expenses are equal to the Fund's annualized expense ratio to reflect the six-month period. |
| During the year ended April 30, 2022, the Fund had expense limitations on Total Annual Operating Expenses (See Note 3A) that were lower than the Net Expense Ratios during the six-month period. |
Asset Diversification as of April 30, 2022 (Unaudited) | |
| |
| |
Other Assets, Less Liabilities | |
See Portfolio of Investments beginning on page 62 for specific holdings within these categories. The Fund’s holdings are subject to change.
| MainStay Growth ETF Allocation Fund |
Portfolio Management Discussion and Analysis (Unaudited)
Questions answered by portfolio managers Jae S. Yoon, CFA, Jonathan Swaney, Poul Kristensen, CFA, and Amit Soni, CFA, of New York Life Investment Management LLC, the Fund’s Manager.
How did MainStay Growth ETF Allocation Fund perform relative to its benchmarks and peer group during the 12 months ended April 30, 2022?
For the 12 months ended April 30, 2022, Class I shares of MainStay Growth ETF Allocation Fund returned −5.41%, underperforming the 0.21% return of the Fund’s primary benchmark, the S&P 500® Index, and outperforming the −8.15% return of the MSCI EAFE® Index (Net), which is the Fund’s secondary benchmark. Over the same period, Class I shares of the Fund outperformed the −8.51% return of the Bloomberg U.S. Aggregate Bond Index, and underperformed the −3.12% return of the Growth Allocation Composite Index, both of which are additional benchmarks of the Fund. For the 12 months ended April 30, 2022, Class I shares of the Fund outperformed the −5.43% return of the Morningstar Allocation—70% to 85% Equity Category Average.1
What factors affected the Fund’s relative performance during the reporting period?
The Fund is a “fund of funds" that seeks to achieve its investment objective by investing in unaffiliated, passively-managed, exchange-traded funds (“Underlying ETFs”). The Underlying ETFs may invest in U.S. equities, international equities and fixed-income instruments, making comparisons to any single index generally less suitable than a weighted combination of indices, which is a more useful yardstick by which to measure performance. During the reporting period, asset class policy was the primary determinant of the Fund's relative performance.
Fund management internally maintains a blend of indices that are taken into consideration when managing the Fund. During the reporting period, the performance of the Fund moderately outperformed that of the internally maintained blend of indices. The reporting period can be divided on a calendar year basis. The final eight months of 2021 saw sizable market returns, although the Fund struggled from a relative performance perspective as a tilt toward value proved premature and an overweight allocation to small-company stocks weighed on results. This reversed dramatically in 2022, with significant outperformance overshadowing the softer results from earlier in the reporting period primarily due to active positioning at the asset-class level in several areas. Key positive contributions came from:
• short duration2 within fixed income,
• an emphasis on value over growth within stocks and
• specific exposure to energy and gold miner equities.
(Contributions take weightings and total returns into account.)
A variety of factors, all of them interconnected, contributed to the success of those positions. Among the more dominant were:
• Inflation: Early in the reporting period, the U.S. Federal Reserve (the “Fed”) finally acknowledged that inflationary pressures extended beyond “transitory,” pandemic-related determinants. Stubbornly high readings brought forth aggressively tighter policy assumptions, hammering long-duration fixed-income and equity price multiples.
• COVID-19: Although now endemic, at least in most Western countries, the contagion continued to send ripples through the global economy. Lockdowns in China that contributed to persistent supply chain disruptions, and hence inflation, were the most obvious example of this.
• Ukraine: Due to the conflict itself, which massively curtailed production within Ukraine, as well as the sanctions that were imposed on Russia in retaliation, global stocks of energy, grains, industrial metals and gases, and other materials became increasingly strained, further exacerbating inflationary pressures.
• Labor supply: The size of the working-age population declined in 2021 for the first time in over 40 years and is expected to remain effectively stagnant over the next decade or two. Workers became scarce, increasing the likelihood of constrained production and wage growth over time, adding a little more fuel to the inflation fire.
How did you allocate the Fund’s assets during the reporting period and why?
Stock/bond blend: The Fund held slightly overweight exposure to equities during the reporting period, with the magnitude of that bias managed tactically in response to swings in pricing (adding on drawdowns and trimming on rallies). We expected that fixed income would struggle as the era of ultra-accommodative monetary policy came to an end, whereas equities would generally retain their value slightly better, with robust domestic demand supporting corporate earnings. Management of the Fund’s stock/bond mix added to performance.
Fixed income: We skewed the Fund’s holdings to favor shorter-maturity and lower-quality instruments that would be less sensitive to rising bond yields. This approach reflected our belief that inflationary pressures were somewhat structural in nature and likely to persist at elevated levels for the foreseeable future. Fixed-income positioning bolstered returns.
Geographic exposure: Prior to Russia’s invasion of Ukraine, the Fund’s geographic exposure reflected our positive expectations for non-U.S. developed markets generally, and Europe in particular,
1.
See page 55 for other share class returns, which may be higher or lower than Class I share returns. See page 56 for more information on benchmark and peer group returns.
2.
Duration is a measure of the price sensitivity of a fixed-income investment to changes in interest rates. Duration is expressed as a number of years and is considered a more accurate sensitivity gauge than average maturity.
based on attractive valuations and the post-COVID-19 cyclical recovery we saw coming. Accordingly, the Fund tilted in that direction. War, sanctions, soaring local energy prices and looming recession changed the underlying picture. We responded by unwinding the Fund’s position and resetting geographic exposures to neutral, but not before performance was negatively affected.
Equity size: Small-company stocks were more heavily owned in the Fund than in the Growth Allocation Composite Index. The thesis behind this positioning was based on the small-cap asset class’s attractive valuations, insulation from economic weakness abroad, less sensitivity to dollar strength and disproportionate exposure to domestic demand, which remained robust. Despite these presumed advantages, however, small-cap stocks underperformed the broader market, detracting from the Fund’s relative performance.
Equity style: We saw inflation, which undermines the value of more distant cash flows, as threatening to growth equities with high prices relative to current earnings. Accordingly, the Fund emphasized value stocks offering more attractive near-term cash flows. We placed a particular focus on the relatively defensive sectors of real estate, utilities, consumer staples and health care. While this position detracted from returns during the first eight months of the reporting period, it enhanced returns from January through April 2022 – more than offsetting earlier losses – for a combined positive effect.
Other sector exposures: The Fund maintained a small position in gold miners as a hedge against inflation and/or a monetary policy mistake, in addition to a small position in upstream energy producers as a commodity play to provide an additional inflation hedge. Both positions made disproportionate positive contributions to return as commodity prices rose.
How did the Fund’s allocations change over the course of the reporting period?
Equity exposure was added and then removed primarily through the use of the Vanguard Mega Cap ETF. The equity allocation at the end of the reporting period was slightly higher than at the beginning, reflecting purchases as the market softened in late-April 2022. One of the larger shifts in Fund allocations during the reporting period was a reduction in holdings of Vanguard Mega Cap Value ETF, using the proceeds to fund purchases of Invesco S&P® Low Volatility ETF, SPDR® S&P® Oil & Gas Exploration & Production ETF and VanEck Oil Services ETF. While value strategies performed quite well, the tilt into more defensive sectors with low volatility and the focus on energy were more profitable. The Fund also added exposure to iShares® Core S&P Small-Cap ETF and Schwab® U.S. Small-Cap ETF in keeping with its migration down the capitalization spectrum. Late in the reporting period, the Fund established a position in iShares® 20+ Year Treasury Bond ETF, adding a little duration to the Fund’s bond position in light of dramatically rising rates. Lastly, the Fund
reduced its allocation to iShares® Core MSCI EAFE ETF, trimming exposure to developed international markets in the wake of Russia’s invasion of Ukraine.
During the reporting period, which Underlying Equity ETFs had the highest total returns and which Underlying Equity ETFs had the lowest total returns?
Of the Underlying Equity ETFs held for the entire reporting period, only Vanguard Mega Cap Value ETF and VanEck Gold Miners ETF generated positive returns. Those posting the most significant losses were Schwab® U.S. Small-Cap ETF and iShares® Core MSCI EAFE ETF.
Which Underlying Equity ETFs were the strongest positive contributors to the Fund’s performance and which Underlying Equity ETFs were particularly weak?
The Underlying Equity ETFs providing the highest total returns—Vanguard Mega Cap Value ETF and VanEck Gold Miners ETF—also produced the strongest positive contributions to performance, followed by SPDR® S&P® Oil & Gas Exploration & Production ETF. The most significant detractors were iShares® Core MSCI EAFE ETF, Schwab® U.S. Small-Cap ETF and Schwab® U.S. Mid-Cap ETF.
During the reporting period, which Underlying Fixed-Income ETFs had the highest total returns and which Underlying Fixed-Income ETFs had the lowest total returns?
Invesco Senior Loan ETF generated a small positive return, while cash holdings were flat. All other Underlying Fixed-Income ETFs generated losses, with iShares® 0-5 Year High Yield Corporate Bond ETF posting the mildest declines. The largest losses came from iShares® Broad USD Investment Grade Corporate Bond ETF and Schwab® U.S. Aggregate Bond ETF.
Which Underlying Fixed-Income ETFs were the strongest positive contributors to the Fund’s performance and which Underlying Fixed-Income ETFs were particularly weak?
Invesco Senior Loan ETF made a very small positive contribution to performance, while cash holdings neither contributed nor detracted from returns. All other Underlying Fixed-Income ETFs generated losses, with Vanguard Short-Term Bond ETF detracting least. The most significant detractors from performance were iShares®Broad USD Investment Grade Corporate Bond ETF and iShares® 0-5 Year High Yield Corporate Bond ETF.
How was the Fund positioned at the end of the reporting period?
As the market sold off in April 2022, we added to the Fund’s equity exposure, positioning the Fund with a modestly overweight
| MainStay Growth ETF Allocation Fund |
allocation to equities as of April 30, 2022. We are fully cognizant of the many challenges facing stock prices (high inflation, rising rates, geopolitical conflict, supply chain disruptions and worker shortages), but we also perceive a supportive demand backdrop (robust corporate capital spending, solid household consumption, growing payrolls, healthy consumer sentiment and strong corporate balance sheets). The two appear in rough equilibrium, such that we expect a largely sideways market for the foreseeable future. Within that environment, we anticipate trading tactically on the Fund’s behalf, adding to equity holdings during periods of weakness and trimming them again as prices recover.
In terms of the Fund’s posture within asset classes, the positions described above remain intact as of April 30, 2022. The bias we expect to have the largest impact on active return is our preference for small-cap stocks. We believe that the large-cap space is potentially vulnerable to economic weakness abroad, a strong U.S. dollar, rich valuations and concentration in a relatively short list of very large companies (mega-cap technology). Small-cap stocks, in contrast, cater primarily to a financially healthy domestic clientele and have historically been more successful than larger companies in protecting real earnings amid high inflation.
Likewise, the Fund’s emphasis on value over growth stocks remains intact as of April 30, 2022 with a particular emphasis on what we perceive to be the defensive “RUSH” sectors: real estate, utilities, consumer staples and health care. The thesis rests primarily on the idea that inflation will prove persistent and jeopardize the high price multiples paid on fast-growing companies with current valuations that depend on distant earnings. We are also mindful of the economy’s progression in the business cycle and the possibility that a recession may not be very far away.
The Fund retains a position in gold miners as of April 30, 2022 reflecting our view that real interest rates are historically quite low. The Fund also maintains exposure to energy sector firms as of April 30, 2022 as we envision sustained supply constraints keeping commodity prices elevated, preserving meaty profit margins for a couple of years to come.
Within fixed income, we have reduced the Fund’s short-duration posture as yields have climbed. As of April 30, 2022, the Fund’s duration is notably short of the benchmark. The Fund maintains a mild tilt toward credit, as corporate fundamentals appear likely to remain sound for the foreseeable future. We may increase the
Fund’s high-yield bond exposure if we see credit spreads widen much beyond 400 basis points. (A basis point is one one-hundredth of a percentage point.)
None of Schwab Strategic Trust, Schwab® U.S. Small-Cap ETF, Schwab® U.S. Mid-Cap ETF, Schwab® U.S. Aggregate Bond ETF, or Charles Schwab Investment Management, Inc. make any representations regarding the advisability of investing in MainStay Growth ETF Allocation Fund.
iShares® is a registered trademark of BlackRock (BlackRock, Inc. and its subsidiaries). Neither BlackRock nor the iShares® Funds make any representations regarding the advisability of investing in MainStay Growth ETF Allocation Fund.
The opinions expressed are those of the portfolio managers as of the date of this report and are subject to change. There is no guarantee that any forecasts will come to pass. This material does not constitute investment advice and is not intended as an endorsement of any specific investment.
Portfolio of Investments April 30, 2022†
| | |
Investment Companies 98.3% |
|
Health Care Select Sector SPDR Fund | | |
Invesco S&P 500 Low Volatility ETF | | |
iShares Core MSCI EAFE ETF | | |
iShares Core MSCI Emerging Markets ETF | | |
iShares Core S&P Small-Cap ETF | | |
iShares Semiconductor ETF | | |
Schwab U.S. Mid-Cap ETF (a) | | |
Schwab U.S. Small-Cap ETF (a) | | |
SPDR S&P Oil & Gas Exploration & Production ETF (a) | | |
| | |
VanEck Oil Services ETF (a) | | |
| | |
Vanguard Mega Cap Value ETF | | |
| | |
Total Equity Funds
(Cost $47,556,716) | | |
|
Invesco Senior Loan ETF (a) | | |
iShares 0-5 Year High Yield Corporate Bond ETF (a) | | |
iShares 20+ Year Treasury Bond ETF (a) | | |
iShares Broad USD High Yield Corporate Bond ETF (a) | | |
iShares Broad USD Investment Grade Corporate Bond ETF | | |
iShares Core U.S. Aggregate Bond ETF | | |
Schwab U.S. Aggregate Bond ETF (a) | | |
Total Fixed Income Funds
(Cost $9,137,492) | | |
Total Investment Companies
(Cost $56,694,208) | | |
Short-Term Investments 13.4% |
Affiliated Investment Company 2.6% |
MainStay U.S. Government Liquidity Fund, 0.397% (b) | | |
Unaffiliated Investment Companies 10.8% |
BlackRock Liquidity FedFund, 0.375% (b)(c) | | |
The notes to the financial statements are an integral part of, and should be read in conjunction with, the financial statements.
| MainStay Growth ETF Allocation Fund |
| | |
Short-Term Investments (continued) |
Unaffiliated Investment Companies (continued) |
Invesco Government & Agency Portfolio, 0.419% (b)(c) | | |
Total Unaffiliated Investment Companies
(Cost $6,147,575) | | |
Total Short-Term Investments
(Cost $7,661,119) | | |
Total Investments
(Cost $64,355,327) | | |
Other Assets, Less Liabilities | | |
| | |
| Percentages indicated are based on Fund net assets. |
| All or a portion of this security was held on loan. As of April 30, 2022, the aggregate market value of securities on loan was $7,886,535; the total market value of collateral held by the Fund was $8,165,960. The market value of the collateral held included non-cash collateral in the form of U.S. Treasury securities with a value of $2,018,385. The Fund received cash collateral with a value of $6,147,575. (See Note 2(H)) |
| Current yield as of April 30, 2022. |
| Represents a security purchased with cash collateral received for securities on loan. |
Investments in Affiliates (in 000's)
Investments in issuers considered to be affiliate(s) of the Fund during the year ended April 30, 2022 for purposes of Section 2(a)(3) of the Investment Company Act of 1940, as amended, were as follows:
Affiliated Investment Companies | | | | Net
Realized
Gain/(Loss)
on Sales | Change in
Unrealized
Appreciation/
(Depreciation) | | | | |
MainStay U.S. Government Liquidity Fund | | | | | | | | | |
|
EAFE—Europe, Australasia and Far East |
|
MSCI—Morgan Stanley Capital International |
SPDR—Standard & Poor’s Depositary Receipt |
|
The notes to the financial statements are an integral part of, and should be read in conjunction with, the financial statements.
Portfolio of Investments April 30, 2022† (continued)
The following is a summary of the fair valuations according to the inputs used as of April 30, 2022, for valuing the Fund’s assets:
| Quoted
Prices in
Active
Markets for
Identical
Assets
(Level 1) | Significant
Other
Observable
Inputs
(Level 2) | Significant
Unobservable
Inputs
(Level 3) | |
| | | | |
Investments in Securities (a) | | | | |
| | | | |
| | | | |
| | | | |
Total Investment Companies | | | | |
| | | | |
Affiliated Investment Company | | | | |
Unaffiliated Investment Companies | | | | |
Total Short-Term Investments | | | | |
Total Investments in Securities | | | | |
| For a complete listing of investments, see the Portfolio of Investments. |
The notes to the financial statements are an integral part of, and should be read in conjunction with, the financial statements.
| MainStay Growth ETF Allocation Fund |
Statement of Assets and Liabilities as of April 30, 2022
|
Investment in unaffiliated securities, at value
(identified cost $62,841,783) including securities on loan of $7,886,535 | |
Investment in affiliated investment companies, at value
(identified cost $1,513,544) | |
| |
Investment securities sold | |
| |
| |
| |
| |
| |
| |
|
Cash collateral received for securities on loan | |
| |
| |
Investment securities purchased | |
Transfer agent (See Note 3) | |
NYLIFE Distributors (See Note 3) | |
| |
| |
Shareholder communication | |
| |
| |
| |
| |
| |
Composition of Net Assets |
Shares of beneficial interest outstanding (par value of $.001 per share) unlimited number of shares authorized | |
Additional paid-in-capital | |
| |
Total distributable earnings (loss) | |
| |
| |
Net assets applicable to outstanding shares | |
Shares of beneficial interest outstanding | |
Net asset value per share outstanding | |
Maximum sales charge (3.00% of offering price) | |
Maximum offering price per share outstanding | |
| |
Net assets applicable to outstanding shares | |
Shares of beneficial interest outstanding | |
Net asset value and offering price per share outstanding | |
| |
Net assets applicable to outstanding shares | |
Shares of beneficial interest outstanding | |
Net asset value and offering price per share outstanding | |
| |
Net assets applicable to outstanding shares | |
Shares of beneficial interest outstanding | |
Net asset value and offering price per share outstanding | |
| |
Net assets applicable to outstanding shares | |
Shares of beneficial interest outstanding | |
Net asset value and offering price per share outstanding | |
The notes to the financial statements are an integral part of, and should be read in conjunction with, the financial statements.
Statement of Operations for the year ended April 30, 2022
|
| |
| |
| |
| |
| |
| |
Distribution/Service—Class A (See Note 3) | |
Distribution/Service—Class C (See Note 3) | |
Distribution/Service—Class R3 (See Note 3) | |
Distribution/Service—SIMPLE Class (See Note 3) | |
| |
| |
Transfer agent (See Note 3) | |
| |
| |
| |
Shareholder communication | |
| |
Shareholder service (See Note 3) | |
| |
Total expenses before waiver/reimbursement | |
Expense waiver/reimbursement from Manager (See Note 3) | |
| |
Net investment income (loss) | |
Realized and Unrealized Gain (Loss) |
Net realized gain (loss) on unaffiliated investments | |
Net change in unrealized appreciation (depreciation) on unaffiliated investments | |
Net realized and unrealized gain (loss) | |
Net increase (decrease) in net assets resulting from operations | |
The notes to the financial statements are an integral part of, and should be read in conjunction with, the financial statements.
| MainStay Growth ETF Allocation Fund |
Statements of Changes in Net Assets
for the year ended April 30, 2022 and the period June 30, 2020 (inception date) throughApril 30, 2021
| | |
Increase (Decrease) in Net Assets |
| | |
Net investment income (loss) | | |
| | |
Net change in unrealized appreciation (depreciation) | | |
Net increase (decrease) in net assets resulting from operations | | |
Distributions to shareholders: | | |
| | |
| | |
| | |
| | |
| | |
Total distributions to shareholders | | |
Capital share transactions: | | |
Net proceeds from sales of shares | | |
Net asset value of shares issued to shareholders in reinvestment of distributions | | |
| | |
Increase (decrease) in net assets derived from capital share transactions | | |
Net increase (decrease) in net assets | | |
|
| | |
| | |
The notes to the financial statements are an integral part of, and should be read in conjunction with, the financial statements.
Financial Highlights selected per share data and ratios
| | June 30, 2020^ through
April 30, |
| | |
Net asset value at beginning of year | | |
Net investment income (loss) (a) | | |
Net realized and unrealized gain (loss) | | |
Total from investment operations | | |
| | |
From net investment income | | |
From net realized gain on investments | | |
| | |
Net asset value at end of year | | |
Total investment return (b) | | |
Ratios (to average net assets)/Supplemental Data: | | |
Net investment income (loss) | | |
| | |
Expenses (before waiver/reimbursement) (c) | | |
| | |
Net assets at end of year (in 000’s) | | |
| |
| |
| Per share data based on average shares outstanding during the period. |
| Total investment return is calculated exclusive of sales charges and assumes the reinvestment of dividends and distributions. For periods of less than one year, total return is not annualized. |
| In addition to the fees and expenses which the Fund bears directly, it also indirectly bears a pro-rata share of the fees and expenses of the underlying funds in which it invests. Such indirect expenses are not included in the above expense ratios. |
The notes to the financial statements are an integral part of, and should be read in conjunction with, the financial statements.
| MainStay Growth ETF Allocation Fund |
Financial Highlights selected per share data and ratios
| | June 30, 2020^ through
April 30, |
| | |
Net asset value at beginning of year | | |
Net investment income (loss) (a) | | |
Net realized and unrealized gain (loss) | | |
Total from investment operations | | |
| | |
From net investment income | | |
From net realized gain on investments | | |
| | |
Net asset value at end of year | | |
Total investment return (b) | | |
Ratios (to average net assets)/Supplemental Data: | | |
Net investment income (loss) | | |
| | |
Expenses (before waiver/reimbursement) (c) | | |
| | |
Net assets at end of year (in 000’s) | | |
| |
| |
| Per share data based on average shares outstanding during the period. |
| Total investment return is calculated exclusive of sales charges and assumes the reinvestment of dividends and distributions. Class I shares are not subject to sales charges. For periods of less than one year, total return is not annualized. |
| In addition to the fees and expenses which the Fund bears directly, it also indirectly bears a pro-rata share of the fees and expenses of the underlying funds in which it invests. Such indirect expenses are not included in the above expense ratios. |
The notes to the financial statements are an integral part of, and should be read in conjunction with, the financial statements.
Financial Highlights selected per share data and ratios
| | June 30, 2020^ through
April 30, |
| | |
Net asset value at beginning of year | | |
Net investment income (loss) (a) | | |
Net realized and unrealized gain (loss) | | |
Total from investment operations | | |
| | |
From net investment income | | |
From net realized gain on investments | | |
| | |
Net asset value at end of year | | |
Total investment return (b) | | |
Ratios (to average net assets)/Supplemental Data: | | |
Net investment income (loss) | | |
| | |
Expenses (before waiver/reimbursement) (c) | | |
| | |
Net assets at end of year (in 000’s) | | |
| |
| |
| Per share data based on average shares outstanding during the period. |
| Total investment return is calculated exclusive of sales charges and assumes the reinvestment of dividends and distributions. Class R3 shares are not subject to sales charges. For periods of less than one year, total return is not annualized. |
| In addition to the fees and expenses which the Fund bears directly, it also indirectly bears a pro-rata share of the fees and expenses of the underlying funds in which it invests. Such indirect expenses are not included in the above expense ratios. |
The notes to the financial statements are an integral part of, and should be read in conjunction with, the financial statements.
| MainStay Growth ETF Allocation Fund |
Financial Highlights selected per share data and ratios
| | August 31, 2020^ through
April 30, |
| | |
Net asset value at beginning of year | | |
Net investment income (loss) (a) | | |
Net realized and unrealized gain (loss) | | |
Total from investment operations | | |
| | |
From net investment income | | |
From net realized gain on investments | | |
| | |
Net asset value at end of year | | |
Total investment return (b) | | |
Ratios (to average net assets)/Supplemental Data: | | |
Net investment income (loss) | | |
| | |
Expenses (before waiver/reimbursement) (c) | | |
| | |
Net assets at end of year (in 000’s) | | |
| |
| |
| Per share data based on average shares outstanding during the period. |
| Total investment return is calculated exclusive of sales charges and assumes the reinvestment of dividends and distributions. SIMPLE Class shares are not subject to sales charges. For periods of less than one year, total return is not annualized. |
| In addition to the fees and expenses which the Fund bears directly, it also indirectly bears a pro-rata share of the fees and expenses of the underlying funds in which it invests. Such indirect expenses are not included in the above expense ratios. |
The notes to the financial statements are an integral part of, and should be read in conjunction with, the financial statements.
MainStay Equity ETF Allocation Fund
Investment and Performance Comparison (Unaudited)
Performance data quoted represents past performance. Past performance is no guarantee of future results. Because of market volatility and other factors, current performance may be lower or higher than the figures shown. Investment return and principal value will fluctuate, and as a result, when shares are redeemed, they may be worth more or less than their original cost. The graph below depicts the historical performance of Class I shares of the Fund. Performance will vary from class to class based on differences in class-specific expenses and sales charges. For performance information current to the most recent month-end, please call 800-624-6782 or visit newyorklifeinvestments.com.
The performance table and graph do not reflect the deduction of taxes that a shareholder would pay on distributions or Fund share redemptions. Total returns reflect maximum applicable sales charges as indicated in the table below, if any, changes in share price, and reinvestment of dividend and capital gain distributions. The graph assumes the initial investment amount shown below and reflects the deduction of all sales charges that would have applied for the period of investment. Performance figures may reflect certain fee waivers and/or expense limitations, without which total returns may have been lower. For more information on share classes and current fee waivers and/or expense limitations (if any), please refer to the Notes to Financial Statements.
Average Annual Total Returns for the Year-Ended April 30, 2022 |
| | | | | | |
| Maximum 3% Initial Sales Charge | | | | | |
| | | | | | |
| | | | | | |
| if redeemed Within One Year of Purchase | | | | | |
| | | | | | |
| | | | | | |
| | | | | | |
| The gross expense ratios presented reflect the Fund’s “Total Annual Fund Operating Expenses” from the most recent Prospectus, as supplemented, and may differ from other expense ratios disclosed in this report. |
The footnotes on the next page are an integral part of the table and graph and should be carefully read in conjunction with them.
| MainStay Equity ETF Allocation Fund |
| | |
| | |
| | |
Equity Allocation Composite Index3 | | |
Morningstar Allocation – 85%+ Equity Category Average4 | | |
| Returns for indices reflect no deductions for fees, expenses or taxes, except for foreign withholding taxes where applicable. |
| The S&P 500® Index is the Fund’s primary broad-based securities market index for comparison purposes. S&P 500® is a trademark of The McGraw-Hill Companies, Inc. The S&P 500® Index is widely regarded as the standard index for measuring large-cap U.S. stock market performance. Results assume reinvestment of all dividends and capital gains. An investment cannot be made directly in an index. |
| The MSCI EAFE® Index (Net) is the Fund's secondary benchmark. The MSCI EAFE® Index (Net) consists of international stocks representing the developed world outside of North America. Results assume reinvestment of all dividends and capital gains. An investment cannot be made directly in an index. |
| The Fund has selected the Equity Allocation Composite Index as an additional benchmark. The Equity Allocation Composite Index consists of the S&P 500® Index and the MSCI EAFE® Index (Net) weighted 75% and 25%, respectively. Results assume reinvestment of all dividends and capital gains. An investment cannot be made directly in an index. |
| The Morningstar Allocation – 85%+ Equity Category Average is representative of funds that seek to provide both income and capital appreciation by investing in multiple asset classes, including stocks, bonds, and cash. These portfolios are dominated by domestic holdings and have equity exposures of over 85%. These funds typically allocate at least 10% to equities of foreign companies and do not exclusively allocate between cash and equities. Results are based on average total returns of similar funds with all dividends and capital gain distributions reinvested. |
The footnotes on the preceding page are an integral part of the table and graph and should be carefully read in conjunction with them.
Cost in Dollars of a $1,000 Investment in MainStay Equity ETF Allocation Fund (Unaudited)
The example below is intended to describe the fees and expenses borne by shareholders during the six-month period from November 1, 2021 to April 30, 2022, and the impact of those costs on your investment.
Example
As a shareholder of the Fund you incur two types of costs: (1) transaction costs, including exchange fees and sales charges (loads) on purchases (as applicable), and (2) ongoing costs, including management fees, distribution and/or service (12b-1) fees and other Fund expenses (as applicable). This example is intended to help you understand your ongoing costs (in dollars) of investing in the Fund and to compare these costs with the ongoing costs of investing in other mutual funds. The example is based on an investment of $1,000 made at the beginning of the six-month period and held for the entire period from November 1, 2021 to April 30, 2022.
This example illustrates your Fund’s ongoing costs in two ways:
Actual Expenses
The second and third data columns in the table below provide information about actual account values and actual expenses. You may use the information in these columns, together with the amount you invested, to estimate the expenses that you paid during the six months ended April 30, 2022. Simply divide your account value by $1,000 (for example, an
$8,600 account value divided by $1,000 = 8.6), then multiply the result by the number under the heading entitled “Expenses Paid During Period” to estimate the expenses you paid on your account during this period.
Hypothetical Example for Comparison Purposes
The fourth and fifth data columns in the table below provide information about hypothetical account values and hypothetical expenses based on the Fund’s actual expense ratio and an assumed rate of return of 5% per year before expenses, which is not the Fund’s actual return. The hypothetical account values and expenses may not be used to estimate the actual ending account balances or expenses you paid for the six-month period shown. You may use this information to compare the ongoing costs of investing in the Fund with the ongoing costs of investing in other mutual funds. To do so, compare this 5% hypothetical example with the 5% hypothetical examples that appear in the shareholder reports of the other mutual funds.
Please note that the expenses shown in the table are meant to highlight your ongoing costs only and do not reflect any transactional costs, such as exchange fees or sales charges (loads). Therefore, the fourth and fifth data columns of the table are useful in comparing ongoing costs only and will not help you determine the relative total costs of owning different funds. In addition, if these transactional costs were included, your costs would have been higher.
| Beginning
Account
Value
11/1/21 | Ending Account
Value (Based
on Actual
Returns and
Expenses)
4/30/22 | | Ending Account
Value (Based
on Hypothetical
5% Annualized
Return and
Actual Expenses)
4/30/22 | | |
| | | | | | |
| | | | | | |
| | | | | | |
| | | | | | |
| | | | | | |
| Expenses are equal to the Fund’s annualized expense ratio of each class multiplied by the average account value over the period, divided by 365 and multiplied by 181 (to reflect the six-month period). The table above represents the actual expenses incurred during the six-month period. In addition to the fees and expenses which the Fund bears directly, it also indirectly bears a pro rata share of the fees and expenses of the underlying funds in which it invests. Such indirect expenses are not included in the above-reported expense figures. |
| Expenses are equal to the Fund's annualized expense ratio to reflect the six-month period. |
| MainStay Equity ETF Allocation Fund |
Asset Diversification as of April 30, 2022 (Unaudited) | |
| |
Other Assets, Less Liabilities | |
See Portfolio of Investments beginning on page 78 for specific holdings within these categories. The Fund’s holdings are subject to change.
Portfolio Management Discussion and Analysis (Unaudited)
Questions answered by portfolio managers Jae S. Yoon, CFA, Jonathan Swaney, Poul Kristensen, CFA, and Amit Soni, CFA, of New York Life Investment Management LLC, the Fund’s Manager.
How did MainStay Equity ETF Allocation Fund perform relative to its benchmarks and peer group during the 12 months ended April 30, 2022?
For the 12 months ended April 30, 2022, Class I shares of MainStay Equity ETF Allocation Fund returned −6.96%, underperforming the 0.21% return of the Fund’s primary benchmark, the S&P 500® Index, and outperforming the −8.15% return of the MSCI EAFE® Index (Net), which is the Fund’s secondary benchmark. Over the same period, Class I shares of the Fund underperformed the −1.87% return of the Equity Allocation Composite Index, which is an additional benchmark of the Fund, and outperformed the −8.07% return of the Morningstar Allocation—85%+ Equity Category Average.1
What factors affected the Fund’s relative performance during the reporting period?
The Fund is a “fund of funds" that seeks to achieve its investment objective by investing in unaffiliated passively-managed exchange-traded funds (“Underlying ETFs”). The Underlying ETFs may invest in U.S. equities and international equities that span a range of capitalizations and geographies, making comparisons to any single index generally less suitable than a weighted combination of indices, which is a more useful yardstick by which to measure performance. During the reporting period, asset class policy was the primary determinant of the Fund's relative performance.
Fund management internally maintains a blend of indices that are taken into consideration when managing the Fund. During the reporting period, the Fund underperformed the above-mentioned internally maintained blend of indices. The Fund’s performance can be divided on a calendar year basis. The final eight months of 2021 saw sizable market returns, although the Fund struggled from a relative performance perspective as a tilt toward value proved premature and an overweight allocation to small company stocks weighed on results. Those trends reversed in 2022, with strong relative returns offsetting much of the underperformance from earlier in the reporting period. The reversal was driven by the Fund’s active positioning, with its emphasis on value over growth and specific exposure to energy and gold miner equities being the most consequential.
A variety of factors, all of them interconnected, supported the success of those positions. Among the more dominant were:
• Inflation: Early in the reporting period, the U.S. Federal Reserve (the “Fed”) finally acknowledged that inflationary pressures extended beyond “transitory,” pandemic-related determinants. Stubbornly high readings brought forth aggressively tighter policy assumptions, hammering price multiples of growth-oriented equities heavily leveraged to future earnings potential.
• COVID-19: Although now endemic, at least in most Western countries, the contagion continued to send ripples through the global economy. Lockdowns in China that contributed to persistent supply chain disruptions, and hence inflation, were but the most obvious example of this.
• Ukraine: Due to the conflict itself, which massively curtailed production within Ukraine, as well as the sanctions that were imposed on Russia in retaliation, global stocks of energy, grains, industrial metals and gases, and other materials became increasingly strained, further exacerbating inflationary pressures.
• Labor supply: The size of the working-age population declined in 2021 for the first time in over 40 years and is expected to remain effectively stagnant over the next decade or two. Workers became scarce, increasing the likelihood of constrained production and wage growth over time, adding a little more fuel to the inflation fire.
How did you allocate the Fund’s assets during the reporting period and why?
Equity style: We saw inflation, which undermines the value of more distant cash flows, as threatening to growth equities with high prices relative to current earnings. Accordingly, the Fund emphasized value stocks that were offering more attractive near-term cash flows. We placed a particular focus on the relatively defensive sectors of real estate, utilities, staples and health care. While this positioning undermined relative returns in 2021, it made a positive contribution to returns in 2022, more than offsetting earlier losses. (Contributions take weightings and total returns into account.)
Equity size: Small-company stocks were more heavily represented in the Fund than the Equity Allocation Composite Index. The thesis behind this positioning was based on attractive small-company valuations, insulation from economic weakness abroad, less sensitivity to dollar strength, and disproportionate exposure to domestic demand, which remained robust. Despite these presumed advantages, however, small-cap stocks underperformed the broader market, detracting from the Fund’s relative performance.
Geographic exposure: Prior to Russia’s invasion of Ukraine, the Fund’s geographic exposure reflected our positive expectations for non-U.S. developed markets generally, and Europe in particular, based on attractive valuations and the post-COVID-19 cyclical recovery we saw coming. Accordingly, the Fund tilted in that direction. War, sanctions, soaring local energy prices and looming recession changed the underlying picture. We responded by unwinding the Fund’s position and resetting geographic exposures to neutral, but not before performance was negatively affected.
1.
See page 72 for other share class returns, which may be higher or lower than Class I share returns. See page 73 for more information on benchmark and peer group returns.
| MainStay Equity ETF Allocation Fund |
Energy exposure: The Fund maintained a small position in upstream energy producers as a commodity play to provide an additional inflation hedge. This position made a disproportionately strong contribution to the Fund’s returns as energy stocks soared on rising oil and gas prices.
How did the Fund’s allocations change over the course of the reporting period?
One of the Fund’s larger shifts was a reduction in holdings of Vanguard Mega Cap Value ETF. Proceeds were used to fund purchases of Invesco S&P® Low Volatility ETF, SPDR® S&P® Oil & Gas Exploration & Production ETF and VanEck Oil Services ETF. While value strategies performed quite well, the Fund’s tilt toward more defensive, low-volatility sectors and its focus on energy proved more profitable still. Purchases of Schwab® U.S. Small-Cap ETF and iShares® Core S&P Small-Cap ETF speak to the Fund’s migration down the capitalization spectrum during the reporting period, a move that detracted from relative returns. A reduction in the Fund’s allocation to iShares® Core MSCI EAFE ETF reflected our decision to trim exposure to developed international markets in the wake of Russia’s invasion of Ukraine, a move that enhanced relative performance.
During the reporting period, which Underlying ETFs had the highest total returns and which Underlying ETFs had the lowest total returns?
Of the Underlying ETFs held for the entire reporting period, Vanguard Mega Cap Value ETF and VanEck Gold Miners ETF were the only two to generate positive returns. Those that posted the most significant losses were Schwab® U.S. Small-Cap ETF and the iShares® Core MSCI EAFE ETF.
Which Underlying ETFs were the strongest positive contributors to the Fund’s performance and which Underlying ETFs were particularly weak?
The Underlying ETFs making the strongest positive contributions to the Fund’s return included Vanguard Mega Cap Value ETF and SPDR® S&P® Oil & Gas Exploration & Production ETF, with the latter position established only late in the reporting period. The most significant detractors were iShares® Core MSCI EAFE ETF and Schwab® U.S. Small-Cap ETF.
How was the Fund positioned at the end of the reporting period?
As of April 30, 2022, the positions described above remain intact. The bias we expect to have the largest impact on active return is our preference for small-cap stocks. We believe that the large-cap space is potentially vulnerable to economic weakness abroad, a strong U.S. dollar, rich valuations and concentration in a relatively short list of very large companies (mega-cap technology). Small-cap stocks, in contrast, cater primarily to a financially healthy domestic clientele and have historically been more successful than larger companies in protecting real earnings amid high inflation.
Likewise, the Fund’s emphasis on value over growth stocks remains intact as of April 30, 2022 with a particular emphasis on what we perceive to be the defensive “RUSH” sectors: real estate, utilities, consumer staples and health care. The thesis rests primarily on the idea that inflation will prove persistent and jeopardize the high price multiples paid on fast-growing companies with current valuations that depend on distant earnings. We are also mindful of the economy’s progression in the business cycle and the possibility that a recession may not be all that far away.
The Fund also maintains exposure to energy sector firms as of April 30, 2022 as we envision sustained supply constraints keeping commodity prices elevated, preserving meaty profit margins for a couple of years to come.
None of Schwab Strategic Trust, Schwab® U.S. Small-Cap ETF, or Charles Schwab Investment Management, Inc. make any representations regarding the advisability of investing in MainStay Equity ETF Allocation Fund.
iShares® is a registered trademark of BlackRock (BlackRock, Inc. and its subsidiaries). Neither BlackRock nor the iShares® Funds make any representations regarding the advisability of investing in MainStay Equity ETF Allocation Fund.
The opinions expressed are those of the portfolio managers as of the date of this report and are subject to change. There is no guarantee that any forecasts will come to pass. This material does not constitute investment advice and is not intended as an endorsement of any specific investment.
Portfolio of Investments April 30, 2022†
| | |
Investment Companies 99.3% |
|
Health Care Select Sector SPDR Fund | | |
Invesco S&P 500 Low Volatility ETF | | |
iShares Core MSCI EAFE ETF | | |
iShares Core MSCI Emerging Markets ETF | | |
iShares Core S&P Small-Cap ETF | | |
iShares Semiconductor ETF | | |
| | |
Schwab U.S. Small-Cap ETF (a) | | |
SPDR S&P Oil & Gas Exploration & Production ETF (a) | | |
| | |
VanEck Oil Services ETF (a) | | |
| | |
Vanguard Mega Cap Value ETF | | |
| | |
Total Investment Companies
(Cost $42,425,720) | | |
Short-Term Investments 4.1% |
Affiliated Investment Company 0.8% |
MainStay U.S. Government Liquidity Fund, 0.397% (b) | | |
Unaffiliated Investment Company 3.3% |
Invesco Government & Agency Portfolio, 0.419% (b)(c) | | |
Total Short-Term Investments
(Cost $1,720,350) | | |
Total Investments
(Cost $44,146,070) | | |
Other Assets, Less Liabilities | | |
| | |
| Percentages indicated are based on Fund net assets. |
| All or a portion of this security was held on loan. As of April 30, 2022, the aggregate market value of securities on loan was $1,311,277. The Fund received cash collateral with a value of $1,378,385. (See Note 2(H)) |
| Current yield as of April 30, 2022. |
| Represents a security purchased with cash collateral received for securities on loan. |
The notes to the financial statements are an integral part of, and should be read in conjunction with, the financial statements.
| MainStay Equity ETF Allocation Fund |
Investments in Affiliates (in 000's)
Investments in issuers considered to be affiliate(s) of the Fund during the year ended April 30, 2022 for purposes of Section 2(a)(3) of the Investment Company Act of 1940, as amended, were as follows:
Affiliated Investment Companies | | | | Net
Realized
Gain/(Loss)
on Sales | Change in
Unrealized
Appreciation/
(Depreciation) | | | | |
MainStay U.S. Government Liquidity Fund | | | | | | | | | |
|
EAFE—Europe, Australasia and Far East |
|
MSCI—Morgan Stanley Capital International |
SPDR—Standard & Poor’s Depositary Receipt |
The following is a summary of the fair valuations according to the inputs used as of April 30, 2022, for valuing the Fund’s assets:
| Quoted
Prices in
Active
Markets for
Identical
Assets
(Level 1) | Significant
Other
Observable
Inputs
(Level 2) | Significant
Unobservable
Inputs
(Level 3) | |
| | | | |
Investments in Securities (a) | | | | |
| | | | |
| | | | |
| | | | |
Affiliated Investment Company | | | | |
Unaffiliated Investment Company | | | | |
Total Short-Term Investments | | | | |
Total Investments in Securities | | | | |
| For a complete listing of investments, see the Portfolio of Investments. |
The notes to the financial statements are an integral part of, and should be read in conjunction with, the financial statements.
Statement of Assets and Liabilities as of April 30, 2022
|
Investment in unaffiliated securities, at value
(identified cost $43,804,105) including securities on loan of $1,311,277 | |
Investment in affiliated investment companies, at value
(identified cost $341,965) | |
| |
Investment securities sold | |
| |
| |
| |
| |
| |
| |
|
Cash collateral received for securities on loan | |
| |
Investment securities purchased | |
NYLIFE Distributors (See Note 3) | |
Transfer agent (See Note 3) | |
| |
| |
Shareholder communication | |
| |
| |
| |
| |
Composition of Net Assets |
Shares of beneficial interest outstanding (par value of $.001 per share) unlimited number of shares authorized | |
Additional paid-in-capital | |
| |
Total distributable earnings (loss) | |
| |
| |
Net assets applicable to outstanding shares | |
Shares of beneficial interest outstanding | |
Net asset value per share outstanding | |
Maximum sales charge (3.00% of offering price) | |
Maximum offering price per share outstanding | |
| |
Net assets applicable to outstanding shares | |
Shares of beneficial interest outstanding | |
Net asset value and offering price per share outstanding | |
| |
Net assets applicable to outstanding shares | |
Shares of beneficial interest outstanding | |
Net asset value and offering price per share outstanding | |
| |
Net assets applicable to outstanding shares | |
Shares of beneficial interest outstanding | |
Net asset value and offering price per share outstanding | |
| |
Net assets applicable to outstanding shares | |
Shares of beneficial interest outstanding | |
Net asset value and offering price per share outstanding | |
The notes to the financial statements are an integral part of, and should be read in conjunction with, the financial statements.
| MainStay Equity ETF Allocation Fund |
Statement of Operations for the year ended April 30, 2022
|
| |
| |
| |
| |
| |
| |
| |
Distribution/Service—Class A (See Note 3) | |
Distribution/Service—Class C (See Note 3) | |
Distribution/Service—Class R3 (See Note 3) | |
Distribution/Service—SIMPLE Class (See Note 3) | |
| |
| |
| |
Transfer agent (See Note 3) | |
| |
| |
Shareholder communication | |
Shareholder service (See Note 3) | |
| |
| |
Total expenses before waiver/reimbursement | |
Expense waiver/reimbursement from Manager (See Note 3) | |
| |
Net investment income (loss) | |
Realized and Unrealized Gain (Loss) |
Net realized gain (loss) on unaffiliated investments | |
Net change in unrealized appreciation (depreciation) on unaffiliated investments | |
Net realized and unrealized gain (loss) | |
Net increase (decrease) in net assets resulting from operations | |
The notes to the financial statements are an integral part of, and should be read in conjunction with, the financial statements.
Statements of Changes in Net Assets
for the year ended April 30, 2022 and the period June 30, 2020 (inception date) throughApril 30, 2021
| | |
Increase (Decrease) in Net Assets |
| | |
Net investment income (loss) | | |
| | |
Net change in unrealized appreciation (depreciation) | | |
Net increase (decrease) in net assets resulting from operations | | |
Distributions to shareholders: | | |
| | |
| | |
| | |
| | |
| | |
Total distributions to shareholders | | |
Capital share transactions: | | |
Net proceeds from sales of shares | | |
Net asset value of shares issued to shareholders in reinvestment of distributions | | |
| | |
Increase (decrease) in net assets derived from capital share transactions | | |
Net increase (decrease) in net assets | | |
|
| | |
| | |
The notes to the financial statements are an integral part of, and should be read in conjunction with, the financial statements.
| MainStay Equity ETF Allocation Fund |
Financial Highlights selected per share data and ratios
| | June 30, 2020^ through
April 30, |
| | |
Net asset value at beginning of period | | |
Net investment income (loss) (a) | | |
Net realized and unrealized gain (loss) | | |
Total from investment operations | | |
| | |
From net investment income | | |
From net realized gain on investments | | |
| | |
Net asset value at end of period | | |
Total investment return (b) | | |
Ratios (to average net assets)/Supplemental Data: | | |
Net investment income (loss) | | |
| | |
Expenses (before waiver/reimbursement) (c) | | |
| | |
Net assets at end of period (in 000’s) | | |
| |
| |
| Per share data based on average shares outstanding during the period. |
| Total investment return is calculated exclusive of sales charges and assumes the reinvestment of dividends and distributions. For periods of less than one year, total return is not annualized. |
| In addition to the fees and expenses which the Fund bears directly, it also indirectly bears a pro-rata share of the fees and expenses of the underlying funds in which it invests. Such indirect expenses are not included in the above expense ratios. |
The notes to the financial statements are an integral part of, and should be read in conjunction with, the financial statements.
Financial Highlights selected per share data and ratios
| | June 30, 2020^ through
April 30, |
| | |
Net asset value at beginning of period | | |
Net investment income (loss) (a) | | |
Net realized and unrealized gain (loss) | | |
Total from investment operations | | |
| | |
From net investment income | | |
From net realized gain on investments | | |
| | |
Net asset value at end of period | | |
Total investment return (b) | | |
Ratios (to average net assets)/Supplemental Data: | | |
Net investment income (loss) | | |
| | |
Expenses (before waiver/reimbursement) (c) | | |
| | |
Net assets at end of period (in 000’s) | | |
| |
| |
| Per share data based on average shares outstanding during the period. |
| Total investment return is calculated exclusive of sales charges and assumes the reinvestment of dividends and distributions. Class I shares are not subject to sales charges. For periods of less than one year, total return is not annualized. |
| In addition to the fees and expenses which the Fund bears directly, it also indirectly bears a pro-rata share of the fees and expenses of the underlying funds in which it invests. Such indirect expenses are not included in the above expense ratios. |
The notes to the financial statements are an integral part of, and should be read in conjunction with, the financial statements.
| MainStay Equity ETF Allocation Fund |
Financial Highlights selected per share data and ratios
| | June 30, 2020^ through
April 30, |
| | |
Net asset value at beginning of period | | |
Net investment income (loss) (a) | | |
Net realized and unrealized gain (loss) | | |
Total from investment operations | | |
| | |
From net investment income | | |
From net realized gain on investments | | |
| | |
Net asset value at end of period | | |
Total investment return (b) | | |
Ratios (to average net assets)/Supplemental Data: | | |
Net investment income (loss) | | |
| | |
Expenses (before waiver/reimbursement) (c) | | |
| | |
Net assets at end of period (in 000’s) | | |
| |
| |
| Per share data based on average shares outstanding during the period. |
| Total investment return is calculated exclusive of sales charges and assumes the reinvestment of dividends and distributions. Class R3 shares are not subject to sales charges. For periods of less than one year, total return is not annualized. |
| In addition to the fees and expenses which the Fund bears directly, it also indirectly bears a pro-rata share of the fees and expenses of the underlying funds in which it invests. Such indirect expenses are not included in the above expense ratios. |
The notes to the financial statements are an integral part of, and should be read in conjunction with, the financial statements.
Financial Highlights selected per share data and ratios
| | August 31, 2020^ through
April 30, |
| | |
Net asset value at beginning of period | | |
Net investment income (loss) (a) | | |
Net realized and unrealized gain (loss) | | |
Total from investment operations | | |
| | |
From net investment income | | |
From net realized gain on investments | | |
| | |
Net asset value at end of period | | |
Total investment return (b) | | |
Ratios (to average net assets)/Supplemental Data: | | |
Net investment income (loss) | | |
| | |
Expenses (before waiver/reimbursement) (c) | | |
| | |
Net assets at end of period (in 000’s) | | |
| |
| |
| Per share data based on average shares outstanding during the period. |
| Total investment return is calculated exclusive of sales charges and assumes the reinvestment of dividends and distributions. SIMPLE Class shares are not subject to sales charges. For periods of less than one year, total return is not annualized. |
| In addition to the fees and expenses which the Fund bears directly, it also indirectly bears a pro-rata share of the fees and expenses of the underlying funds in which it invests. Such indirect expenses are not included in the above expense ratios. |
The notes to the financial statements are an integral part of, and should be read in conjunction with, the financial statements.
| MainStay Equity ETF Allocation Fund |
MainStay ESG Multi-Asset Allocation Fund
Investment and Performance Comparison (Unaudited)
Performance data quoted represents past performance. Past performance is no guarantee of future results. Because of market volatility and other factors, current performance may be lower or higher than the figures shown. Investment return and principal value will fluctuate, and as a result, when shares are redeemed, they may be worth more or less than their original cost. The graph below depicts the historical performance of Class I shares of the Fund. Performance will vary from class to class based on differences in class-specific expenses and sales charges. For performance information current to the most recent month-end, please call 800-624-6782 or visit newyorklifeinvestments.com.
The performance table and graph do not reflect the deduction of taxes that a shareholder would pay on distributions or Fund share redemptions. Total returns reflect maximum applicable sales charges as indicated in the table below, if any, changes in share price, and reinvestment of dividend and capital gain distributions. The graph assumes the initial investment amount shown below and reflects the deduction of all sales charges that would have applied for the period of investment. Performance figures may reflect certain fee waivers and/or expense limitations, without which total returns may have been lower. For more information on share classes and current fee waivers and/or expense limitations (if any), please refer to the Notes to Financial Statements.
Average Annual Total Returns for the Period-Ended April 30, 2022 |
| | | | | |
| Maximum 3% Initial Sales Charge | | | | |
| | | | | |
| | | | | |
| if redeemed Within One Year of Purchase | | | | |
| | | | | |
| | | | | |
| | | | | |
| |
| The gross expense ratios presented reflect the Fund’s “Total Annual Fund Operating Expenses” from the most recent Prospectus, as supplemented, and may differ from other expense ratios disclosed in this report. |
The footnotes on the next page are an integral part of the table and graph and should be carefully read in conjunction with them.
| |
| |
| |
Bloomberg U.S. Aggregate Bond Index4 | |
Multi-Asset Allocation Composite Index5 | |
Morningstar Allocation - 50% to 70% Equity Category Average6 | |
| Returns for indices reflect no deductions for fees, expenses or taxes, except for foreign withholding taxes where applicable. |
| |
| The S&P 500® Index is the Fund’s primary broad-based securities market index for comparison purposes. S&P 500® is a trademark of The McGraw-Hill Companies, Inc. The S&P 500® Index is widely regarded as the standard index for measuring large-cap U.S. stock market performance. Results assume reinvestment of all dividends and capital gains. An investment cannot be made directly in an index. |
| The MSCI EAFE® Index (Net) is the Fund's secondary benchmark. The MSCI EAFE® Index (Net) consists of international stocks representing the developed world outside of North America. Results assume reinvestment of all dividends and capital gains. An investment cannot be made directly in an index. |
| The Fund has selected the Bloomberg U.S. Aggregate Bond Index as an additional benchmark. The Bloomberg U.S. Aggregate Bond Index is a broad-based benchmark that measures the performance of the investment grade, U.S. dollar-denominated, fixed-rate taxable bond market, including Treasurys, government-related and corporate securities, mortgage-backed securities (agency fixed-rate and hybrid adjustable rate mortgage pass-throughs), asset-backed securities, and commercial mortgage-backed securities. Results assume reinvestment of all dividends and capital gains. An investment cannot be made directly in an index. |
| The Fund has selected the Multi-Asset Allocation Composite Index as an additional benchmark. The Multi-Asset Allocation Composite Index consists of the S&P 500® Index, the MSCI EAFE® Index (Net) and the Bloomberg U.S. Aggregate Bond Index weighted 45%, 15% and 40%, respectively. Results assume reinvestment of all dividends and capital gains. An investment cannot be made directly in an index. |
| The Morningstar Allocation – 50% to 70% Equity Category Average is representative of funds that seek to provide both income and capital appreciation by investing in multiple asset classes, including stocks, bonds, and cash. These portfolios are dominated by domestic holdings and have equity exposures between 50% and 70%. Results are based on average total returns of similar funds with all dividends and capital gain distributions reinvested. |
The footnotes on the preceding page are an integral part of the table and graph and should be carefully read in conjunction with them.
| MainStay ESG Multi-Asset Allocation Fund |
Cost in Dollars of a $1,000 Investment in MainStay ESG Multi-Asset Allocation Fund (Unaudited)
The example below is intended to describe the fees and expenses borne by shareholders during the six-month period from November 1, 2021 to April 30, 2022, and the impact of those costs on your investment.
Example
As a shareholder of the Fund you incur two types of costs: (1) transaction costs, including exchange fees and sales charges (loads) on purchases (as applicable), and (2) ongoing costs, including management fees, distribution and/or service (12b-1) fees and other Fund expenses (as applicable). This example is intended to help you understand your ongoing costs (in dollars) of investing in the Fund and to compare these costs with the ongoing costs of investing in other mutual funds. The example is based on an investment of $1,000 made at the beginning of the six-month period and held for the entire period from November 1, 2021 to April 30, 2022.
This example illustrates your Fund’s ongoing costs in two ways:
Actual Expenses
The second and third data columns in the table below provide information about actual account values and actual expenses. You may use the information in these columns, together with the amount you invested, to estimate the expenses that you paid during the six months ended April 30, 2022. Simply divide your account value by $1,000 (for example, an
$8,600 account value divided by $1,000 = 8.6), then multiply the result by the number under the heading entitled “Expenses Paid During Period” to estimate the expenses you paid on your account during this period.
Hypothetical Example for Comparison Purposes
The fourth and fifth data columns in the table below provide information about hypothetical account values and hypothetical expenses based on the Fund’s actual expense ratio and an assumed rate of return of 5% per year before expenses, which is not the Fund’s actual return. The hypothetical account values and expenses may not be used to estimate the actual ending account balances or expenses you paid for the six-month period shown. You may use this information to compare the ongoing costs of investing in the Fund with the ongoing costs of investing in other mutual funds. To do so, compare this 5% hypothetical example with the 5% hypothetical examples that appear in the shareholder reports of the other mutual funds.
Please note that the expenses shown in the table are meant to highlight your ongoing costs only and do not reflect any transactional costs, such as exchange fees or sales charges (loads). Therefore, the fourth and fifth data columns of the table are useful in comparing ongoing costs only and will not help you determine the relative total costs of owning different funds. In addition, if these transactional costs were included, your costs would have been higher.
| Beginning
Account
Value
11/1/21 | Ending Account
Value (Based
on Actual
Returns and
Expenses)
4/30/22 | | Ending Account
Value (Based
on Hypothetical
5% Annualized
Return and
Actual Expenses)
4/30/22 | | |
| | | | | | |
| | | | | | |
| | | | | | |
| | | | | | |
| | | | | | |
| Expenses are equal to the Fund’s annualized expense ratio of each class multiplied by the average account value over the period, divided by 365 and multiplied by 181 (to reflect the since-inception period) . The table above represents the actual expenses incurred during the six-month period. In addition to the fees and expenses which the Fund bears directly, it also indirectly bears a pro rata share of the fees and expenses of the Underlying Funds in which it invests. Such indirect expenses are not included in the above-reported expense figures. |
| Expenses are equal to the Fund's annualized expense ratio to reflect the six-month period. |
Asset Diversification as of April 30, 2022 (Unaudited) Unaffiliated Investment Companies | |
Affiliated Investment Companies | |
| |
Other Assets, Less Liabilities | |
See Portfolio of Investments beginning on page 94 for specific holdings within these categories. The Fund’s holdings are subject to change.
| MainStay ESG Multi-Asset Allocation Fund |
Portfolio Management Discussion and Analysis (Unaudited)
Questions answered by portfolio managers Jae S. Yoon, CFA, Jonathan Swaney, Poul Kristensen, CFA, and Amit Soni, CFA, of New York Life Investment Management LLC, the Fund’s Manager.
How did MainStay ESG Multi-Asset Allocation Fund perform relative to its benchmarks and peer group during the reporting period from its inception on September 30, 2021 through April 30, 2022?
From September 30, 2021 through April 30, 2022, Class I shares of MainStay ESG Multi-Asset Allocation Fund returned −7.83%, underperforming the −3.32% return of the Fund’s primary benchmark, the S&P 500® Index, and outperforming the −9.63% return of the MSCI EAFE® Index (Net), which is the Fund’s secondary benchmark. Over the same period, Class I shares of the Fund outperformed the −9.49% return of the Bloomberg U.S. Aggregate Bond Index, and underperformed the −6.62% return of the Multi-Asset Allocation Composite Index, both of which are additional benchmarks of the Fund. From September 30, 2021 through April 30, 2022, Class I shares underperformed the −5.54% return of the Morningstar Allocation—50% to 70% Equity Category Average.1
What factors affected the Fund’s relative performance during the reporting period?
The Fund is a “fund of funds” that seeks to achieve its investment objective by investing in both unaffiliated and affiliated exchange-traded funds (“Underlying ETFs”) where the consideration of environmental, social and governance (“ESG”) factors is a significant part of the investment strategy and that meet the Fund’s overall investment criteria. The Underlying ETFs may invest in U.S. equities, international equities and fixed-income instruments, making comparisons to any single index generally less suitable than a weighted combination of indices, which is a more useful yardstick by which to measure performance. The most influential factor affecting returns for the Fund during the reporting period (versus the performance of a weighted combination of indices) is the net performance of the Underlying ETFs themselves, relative to their respective benchmarks. During the reporting period, asset class policy was the primary determinant of the Fund's relative performance.
Fund management internally maintains a blend of indices that are taken into consideration when managing the Fund. During the reporting period, the Fund’s performance trailed the performance of the internally maintained blend of indices. This was primarily due to initial trading costs and a market environment that was generally unfriendly to ESG strategies as traditional fossil fuel energy stocks led equity markets higher, while shares of innovative technology firms floundered.
On a brighter note, the Fund enjoyed strong performance at the asset-class level, driven by active positioning in several areas, including: management of the stock/bond blend; short duration2
positioning within fixed income; and an emphasis on value-oriented stocks over growth-oriented shares. A variety of factors, all of them interconnected, contributed to the success of those positions. Among the more dominant were:
• Inflation: Early in the reporting period, the U.S. Federal Reserve (the “Fed”) finally acknowledged that inflationary pressures extended beyond “transitory,” pandemic-related determinants. Stubbornly high readings brought forth aggressively tighter policy assumptions, hammering long-duration fixed-income and equity price multiples.
• COVID-19: Although now endemic, at least in most Western countries, the contagion continued to send ripples through the global economy. Lockdowns in China that contributed to persistent supply chain disruptions, and hence inflation, were the most obvious example of this.
• Ukraine: Due to the conflict itself, which massively curtailed production within Ukraine, as well as the sanctions that were imposed on Russia in retaliation, global stocks of energy, grains, industrial metals and gases, and other materials became increasingly strained, further exacerbating inflationary pressures.
• Labor supply: The size of the working-age population declined in 2021 for the first time in over 40 years and is expected to remain effectively stagnant over the next decade or two. Workers became scarce, increasing the likelihood of constrained production and wage growth over time, adding a little more fuel to the inflation fire.
How did you allocate the Fund’s assets during the reporting period and why?
Stock/bond blend: The Fund held slightly overweight exposure to equities during the reporting period, with the magnitude of that bias managed tactically in response to swings in pricing (adding on drawdowns and trimming on rallies). We expected that fixed income would struggle as the era of ultra-accommodative monetary policy came to an end, whereas equities would generally retain their value slightly better, with robust domestic demand supporting corporate earnings. Management of the Fund’s stock/bond mix added to performance.
Fixed income: We skewed the Fund’s holdings to favor shorter-maturity and lower-quality instruments that would be less sensitive to rising bond yields. This approach reflected our belief that inflationary pressures were somewhat structural in nature and likely to persist at elevated levels for the foreseeable future. Fixed-income positioning bolstered returns.
1.
See page 87 for other share class returns, which may be higher or lower than Class I share returns. See page 88 for more information on benchmark and peer group returns.
2.
Duration is a measure of the price sensitivity of a fixed-income investment to changes in interest rates. Duration is expressed as a number of years and is considered a more accurate sensitivity gauge than average maturity.
Equity style: We saw inflation, which undermines the value of more distant cash flows, as threatening to growth equities with high prices relative to current earnings. Accordingly, the Fund emphasized value stocks that were offering more attractive near-term cash flows. We placed a particular focus on the relatively defensive sectors of real estate, utilities, consumer staples and health care. Equity style positioning contributed positively to returns.
Equity size: Small-company stocks were more heavily owned in the Fund than in the Multi-Asset Allocation Composite Index. The thesis behind this positioning was based on attractive valuations, insulation from economic weakness abroad, less sensitivity to dollar strength, and disproportionate exposure to domestic demand, which remained robust. Despite these presumed advantages, however, small-cap stocks underperformed the broader market, detracting from the Fund’s relative performance.
Geographic exposure: Prior to Russia’s invasion of Ukraine, the Fund’s geographic exposure reflected our positive expectations for non-U.S. developed markets generally, and Europe in particular, based on attractive valuations and the post-COVID-19 cyclical recovery we saw coming. Accordingly, the Fund tilted in that direction. War, sanctions, soaring local energy prices and looming recession changed the underlying picture. We responded by unwinding the Fund’s position and resetting geographic exposures to neutral, but not before performance was negatively affected – although this effect was largely offset by the Fund’s underweight exposure to emerging markets for much of the reporting period.
How did the Fund’s allocations change over the course of the reporting period?
Most of the larger changes in the Fund’s allocations to Underlying ETFs arose from our ongoing efforts to find ETFs that delivered high ESG ratings while offering a low tracking error to their respective market segment, low cost and high liquidity. As a result of the expansion of the universe of available ESG strategies and shifts in the ratings of these strategies, several new ETFs came into the Fund while others were removed or significantly trimmed. Additions to the Fund included iShares® ESG Advanced Total USD Bond Market ETF, Vanguard ESG U.S. Corporate Bond ETF and the iShares® MSCI USA ESG Select ETF. Underlying ETFs that were removed or trimmed included iShares® ESG Aware U.S. Aggregate Bond ETF, iShares® ESG Aware USD Corporate Bond ETF and iShares® ESG Screened S&P 500.
Other changes arose from the tactical decisions regarding asset-class policy discussed above. Examples include an enlargement of the Fund’s allocation to Nuveen ESG Small-Cap ETF and a reduction in the Fund’s holdings of iShares® ESG Aware MSCI EAFE ETF.
During the reporting period, which Underlying Equity ETFs had the highest total returns and which Underlying Equity ETFs had the lowest total returns?
While none of the Underlying Equity ETFs generated positive returns, those producing the smallest losses included Nuveen ESG Large-Cap Value ETF and Nuveen ESG Mid-Cap Value ETF. At the other end of the spectrum, Nuveen ESG Large-Cap Growth ETF experienced the largest drawdown, followed by iShares® ESG MSCI EM Leaders ETF and iShares® ESG Advanced MSCI EAFE ETF.
Which Underlying Equity ETFs were the strongest contributors to the Fund’s performance and which Underlying Equity ETFs were particularly weak?
While no Underlying Equity ETFs generated positive returns over the reporting period, some contributed positively, due to fluctuations in the weight in which they were held. The strongest contributions, albeit still relatively modest, came from iShares® MSCI USA ESG Select ETF and Nuveen ESG Large-Cap Value ETF. (Contributions take weightings and total returns into account.) The most significant detractors from performance were iShares® ESG Aware MSCI EAFE ETF and Nuveen ESG Mid-Cap Growth ETF.
During the reporting period, which Underlying Fixed-Income ETFs had the highest total returns and which Underlying Fixed-Income ETFs had the lowest total returns?
Cash holdings earned a near-zero return, while all other fixed-income positions generated negative performance. Losses were smallest for iShares® ESG Aware 1-5 Year USD Corporate Bond ETF and Nuveen ESG High Yield Corporate Bond ETF. The most significant losses came from iShares® ESG Aware USD Corporate Bond ETF and iShares® ESG Aware U.S. Aggregate Bond ETF.
Which Underlying Fixed-Income ETFs were the strongest contributors to the Fund’s performance and which Underlying Fixed-Income ETFs were particularly weak?
All Underlying Fixed-Income ETFs contributed negatively to Fund performance, while cash had no impact. The ETFs that detracted the least were Nuveen ESG High Yield Corporate Bond ETF and iShares® ESG Aware 1-5 Year USD Corporate Bond ETF. The most significant detractors were iShares® ESG Aware U.S. Aggregate Bond ETF and the iShares® ESG Advanced High Yield ETF.
How was the Fund positioned at the end of the reporting period?
As the market sold off in April 2022, we added to the Fund’s equity allocations, positioning the Fund with modestly overweight exposure to equities as of April 30, 2022. We are fully cognizant of the many challenges facing stock prices (high inflation, rising
| MainStay ESG Multi-Asset Allocation Fund |
rates, geopolitical conflict, supply chain disruptions, worker shortages), but we also perceive a supportive demand backdrop (robust corporate capital spending, solid household consumption, growing payrolls, healthy consumer sentiment and strong corporate balance sheets). The two appear in rough equilibrium, such that we expect a largely sideways market for the foreseeable future. Within that environment we anticipate trading tactically on the Fund’s behalf, adding to equity holdings during periods of weakness and trimming them again as prices recover.
In terms of the Fund’s posture within asset classes, the positions described above remain intact as of April 30, 2022. The bias we expect to have the largest impact on active return is our preference for small-cap stocks. We believe that the large-cap space is potentially vulnerable to economic weakness abroad, a strong U.S. dollar, rich valuations and concentration in a relatively short list of very large companies (mega-cap technology). Small-cap stocks, in contrast, cater primarily to a financially healthy domestic clientele and have historically been more successful than larger companies in protecting real earnings amid high inflation.
Likewise, the Fund’s emphasis on value over growth stocks remains intact as of April 30, 2022. The thesis rests primarily on the idea that inflation will prove persistent and jeopardize the high price multiples paid on fast-growing companies with current valuations that depend on distant earnings. We are also mindful of the economy’s progression in the business cycle and the possibility that a recession may not be all that far away.
Within fixed income, we have reduced the Fund’s short-duration posture as yields have climbed. As of April 30, 2022, the Fund’s duration is notably short of the benchmark. The Fund maintains a mild tilt toward credit as of April 30, 2022 as corporate fundamentals appear likely to remain sound for the foreseeable future. We may increase the Fund’s high-yield bond exposure if we see credit spreads widen much beyond 400 basis points. (A basis point is one one-hundredth of a percentage point.)
iShares® is a registered trademark of BlackRock (BlackRock, Inc. and its subsidiaries). Neither BlackRock nor the iShares® Funds make any representations regarding the advisability of investing in MainStay ESG Multi-Asset Allocation Fund.
The opinions expressed are those of the portfolio as of the date of this report and are subject to change. There is no guarantee that any forecasts will come to pass. This material does not constitute investment advice and is not intended as an endorsement of any specific investment.
Portfolio of Investments April 30, 2022†
| | |
Affiliated Investment Companies 2.1% |
|
IQ Candriam ESG International Equity ETF | | |
IQ Candriam ESG U.S. Equity ETF | | |
Total Affiliated Investment Companies
(Cost $244,101) | | |
Unaffiliated Investment Companies 95.0% |
|
iShares ESG Advanced MSCI EAFE ETF | | |
iShares ESG Aware 1-5 Year USD Corporate Bond ETF | | |
iShares ESG Aware MSCI EM ETF | | |
iShares ESG Aware MSCI USA Small-Cap ETF | | |
iShares ESG Aware US Aggregate Bond ETF | | |
iShares ESG MSCI EM Leaders ETF | | |
iShares ESG Screened S&P 500 ETF | | |
iShares MSCI USA ESG Select ETF | | |
iShares Trust iShares ESG Advanced High Yield | | |
iShares Trust iShares ESG Aware MSCI EAFE ETF | | |
Nuveen ESG High Yield Corporate Bond ETF | | |
Nuveen ESG International Devel | | |
Nuveen ESG Large-Cap Value ETF | | |
Nuveen ESG Mid-Cap Growth ETF | | |
Nuveen ESG Mid-Cap Value ETF | | |
| | |
| | |
Xtrackers Emerging Markets Carbon Reduction and Climate Improvers ETF | | |
Total Equity Funds
(Cost $9,444,223) | | |
|
iShares ESG Advanced Total USD Bond Market ETF | | |
Nuveen ESG US Aggregate Bond ETF | | |
Vanguard ESG U.S. Corporate Bond ETF | | |
Total Fixed Income Funds
(Cost $1,357,497) | | |
Total Unaffiliated Investment Companies
(Cost $10,801,720) | | |
The notes to the financial statements are an integral part of, and should be read in conjunction with, the financial statements.
| MainStay ESG Multi-Asset Allocation Fund |
| | |
Short-Term Investment 3.5% |
Affiliated Investment Company 3.5% |
MainStay U.S. Government Liquidity Fund, 0.397% (a) | | |
Total Short-Term Investment
(Cost $362,253) | | |
Total Investments
(Cost $11,408,074) | | |
Other Assets, Less Liabilities | | |
| | |
| Percentages indicated are based on Fund net assets. |
| Current yield as of April 30, 2022. |
Investments in Affiliates (in 000's)
Investments in issuers considered to be affiliate(s) of the Fund during the year ended April 30, 2022 for purposes of Section 2(a)(3) of the Investment Company Act of 1940, as amended, were as follows:
Affiliated Investment Companies | | | | Net
Realized
Gain/(Loss)
on Sales | Change in
Unrealized
Appreciation/
(Depreciation) | | | | |
IQ Candriam ESG International Equity ETF | | | | | | | | | |
IQ Candriam ESG U.S. Equity ETF | | | | | | | | | |
MainStay U.S. Government Liquidity Fund | | | | | | | | | |
| | | | | | | | | |
|
EAFE—Europe, Australasia and Far East |
|
|
MSCI—Morgan Stanley Capital International |
SPDR—Standard & Poor’s Depositary Receipt |
|
The notes to the financial statements are an integral part of, and should be read in conjunction with, the financial statements.
Portfolio of Investments April 30, 2022† (continued)
The following is a summary of the fair valuations according to the inputs used as of April 30, 2022, for valuing the Fund’s assets:
| Quoted
Prices in
Active
Markets for
Identical
Assets
(Level 1) | Significant
Other
Observable
Inputs
(Level 2) | Significant
Unobservable
Inputs
(Level 3) | |
| | | | |
Investments in Securities (a) | | | | |
Affiliated Investment Companies | | | | |
| | | | |
Unaffiliated Investment Companies | | | | |
| | | | |
| | | | |
Total Unaffiliated Investment Companies | | | | |
| | | | |
Affiliated Investment Company | | | | |
Total Investments in Securities | | | | |
| For a complete listing of investments, see the Portfolio of Investments. |
The notes to the financial statements are an integral part of, and should be read in conjunction with, the financial statements.
| MainStay ESG Multi-Asset Allocation Fund |
Statement of Assets and Liabilities as of April 30, 2022
|
Investment in unaffiliated securities, at value
(identified cost $10,801,720) | |
Investment in affiliated investment companies, at value
(identified cost $606,354) | |
| |
Investment securities sold | |
| |
| |
| |
| |
| |
|
| |
Investment securities purchased | |
Transfer agent (See Note 3) | |
| |
| |
Shareholder communication | |
NYLIFE Distributors (See Note 3) | |
| |
| |
| |
| |
Composition of Net Assets |
Shares of beneficial interest outstanding (par value of $.001 per share) unlimited number of shares authorized | |
Additional paid-in-capital | |
| |
Total distributable earnings (loss) | |
| |
| |
Net assets applicable to outstanding shares | |
Shares of beneficial interest outstanding | |
Net asset value per share outstanding | |
Maximum sales charge (3.00% of offering price) | |
Maximum offering price per share outstanding | |
| |
Net assets applicable to outstanding shares | |
Shares of beneficial interest outstanding | |
Net asset value and offering price per share outstanding | |
| |
Net assets applicable to outstanding shares | |
Shares of beneficial interest outstanding | |
Net asset value and offering price per share outstanding | |
| |
Net assets applicable to outstanding shares | |
Shares of beneficial interest outstanding | |
Net asset value and offering price per share outstanding | |
| |
Net assets applicable to outstanding shares | |
Shares of beneficial interest outstanding | |
Net asset value and offering price per share outstanding | |
The notes to the financial statements are an integral part of, and should be read in conjunction with, the financial statements.
Statement of Operations for the period September 30, 2021 (inception date) through April 30, 2022
|
| |
| |
| |
| |
| |
| |
| |
| |
| |
Transfer agent (See Note 3) | |
| |
Distribution/Service—Class A (See Note 3) | |
Distribution/Service—Class C (See Note 3) | |
Distribution/Service—Class R3 (See Note 3) | |
Distribution/Service—SIMPLE Class (See Note 3) | |
Shareholder communication | |
| |
Shareholder service (See Note 3) | |
| |
Total expenses before waiver/reimbursement | |
Expense waiver/reimbursement from Manager (See Note 3) | |
| |
Net investment income (loss) | |
Realized and Unrealized Gain (Loss) |
Net realized gain (loss) on: | |
| |
| |
| |
Net change in unrealized appreciation (depreciation) on: | |
| |
| |
Net change in unrealized appreciation (depreciation) | |
Net realized and unrealized gain (loss) | |
Net increase (decrease) in net assets resulting from operations | |
The notes to the financial statements are an integral part of, and should be read in conjunction with, the financial statements.
| MainStay ESG Multi-Asset Allocation Fund |
Statements of Changes in Net Assets
for the period September 30, 2021 (inception date) through April 30, 2022
| |
Increase (Decrease) in Net Assets |
| |
Net investment income (loss) | |
| |
Net change in unrealized appreciation (depreciation) | |
Net increase (decrease) in net assets resulting from operations | |
Distributions to shareholders: | |
| |
| |
| |
| |
| |
Total distributions to shareholders | |
Capital share transactions: | |
Net proceeds from sales of shares | |
Net asset value of shares issued to shareholders in reinvestment of distributions | |
| |
Increase (decrease) in net assets derived from capital share transactions | |
Net increase (decrease) in net assets | |
|
| |
| |
The notes to the financial statements are an integral part of, and should be read in conjunction with, the financial statements.
Financial Highlights selected per share data and ratios
| September 30, 2021^ through
April 30, |
| |
Net asset value at beginning of period | |
Net investment income (loss) (a) | |
Net realized and unrealized gain (loss) | |
Total from investment operations | |
| |
From net investment income | |
From net realized gain on investments | |
Net asset value at end of period | |
Total investment return (b) | |
Ratios (to average net assets)/Supplemental Data: | |
Net investment income (loss)†† | |
| |
Expenses (before waiver/reimbursement)††(c) | |
| |
Net assets at end of period (in 000’s) | |
| |
| Less than one cent per share. |
| |
| Per share data based on average shares outstanding during the period. |
| Total investment return is calculated exclusive of sales charges and assumes the reinvestment of dividends and distributions. For periods of less than one year, total return is not annualized. |
| In addition to the fees and expenses which the Fund bears directly, it also indirectly bears a pro-rata share of the fees and expenses of the underlying funds in which it invests. Such indirect expenses are not included in the above expense ratios. |
| September 30, 2021 through
April 30, |
| |
Net asset value at beginning of period | |
Net investment income (loss) (a) | |
Net realized and unrealized gain (loss) | |
Total from investment operations | |
| |
From net investment income | |
From net realized gain on investments | |
Net asset value at end of period | |
Total investment return (b) | |
Ratios (to average net assets)/Supplemental Data: | |
Net investment income (loss)†† | |
| |
Expenses (before waiver/reimbursement)††(c) | |
| |
Net assets at end of period (in 000’s) | |
| Less than one cent per share. |
| |
| Per share data based on average shares outstanding during the period. |
| Total investment return is calculated exclusive of sales charges and assumes the reinvestment of dividends and distributions. For periods of less than one year, total return is not annualized. |
| In addition to the fees and expenses which the Fund bears directly, it also indirectly bears a pro-rata share of the fees and expenses of the underlying funds in which it invests. Such indirect expenses are not included in the above expense ratios. |
The notes to the financial statements are an integral part of, and should be read in conjunction with, the financial statements.
| MainStay ESG Multi-Asset Allocation Fund |
Financial Highlights selected per share data and ratios
| September 30, 2021 through
April 30, |
| |
Net asset value at beginning of period | |
Net investment income (loss) (a) | |
Net realized and unrealized gain (loss) | |
Total from investment operations | |
| |
From net investment income | |
From net realized gain on investments | |
Net asset value at end of period | |
Total investment return (b) | |
Ratios (to average net assets)/Supplemental Data: | |
Net investment income (loss)†† | |
| |
Expenses (before waiver/reimbursement)††(c) | |
| |
Net assets at end of period (in 000’s) | |
| Less than one cent per share. |
| |
| Per share data based on average shares outstanding during the period. |
| Total investment return is calculated exclusive of sales charges and assumes the reinvestment of dividends and distributions. For periods of less than one year, total return is not annualized. |
| In addition to the fees and expenses which the Fund bears directly, it also indirectly bears a pro-rata share of the fees and expenses of the underlying funds in which it invests. Such indirect expenses are not included in the above expense ratios. |
The notes to the financial statements are an integral part of, and should be read in conjunction with, the financial statements.
Financial Highlights selected per share data and ratios
| September 30, 2021 through
April 30, |
| |
Net asset value at beginning of period | |
Net investment income (loss) (a) | |
Net realized and unrealized gain (loss) | |
Total from investment operations | |
| |
From net investment income | |
From net realized gain on investments | |
Net asset value at end of period | |
Total investment return (b) | |
Ratios (to average net assets)/Supplemental Data: | |
Net investment income (loss)†† | |
| |
Expenses (before waiver/reimbursement)††(c) | |
| |
Net assets at end of period (in 000’s) | |
| Less than one cent per share. |
| |
| Per share data based on average shares outstanding during the period. |
| Total investment return is calculated exclusive of sales charges and assumes the reinvestment of dividends and distributions. For periods of less than one year, total return is not annualized. |
| In addition to the fees and expenses which the Fund bears directly, it also indirectly bears a pro-rata share of the fees and expenses of the underlying funds in which it invests. Such indirect expenses are not included in the above expense ratios. |
The notes to the financial statements are an integral part of, and should be read in conjunction with, the financial statements.
| MainStay ESG Multi-Asset Allocation Fund |
Notes to Financial Statements
Note 1-Organization and Business
MainStay Funds Trust (the “Trust”) was organized as a Delaware statutory trust on April 28, 2009. The Trust is registered under the Investment Company Act of 1940, as amended (the “1940 Act”), as an open-end management investment company, and is comprised of thirty-three funds (collectively referred to as the “Funds” and each individually, referred to as a “Fund"). These financial statements and notes relate to the MainStay Defensive ETF Allocation Fund, MainStay Conservative ETF Allocation Fund, MainStay Moderate ETF Allocation Fund, MainStay Growth ETF Allocation Fund, MainStay Equity ETF Allocation Fund and MainStay ESG Multi-Asset Allocation Fund (commenced operations September 30, 2021) (collectively referred to as the "ETF Allocation Funds" and each individually referred to as an "ETF Allocation Fund"). Each is a “diversified” fund, as that term is defined in the 1940 Act, as interpreted or modified by regulatory authorities having jurisdiction, from time to time.
The following table lists each ETF Allocation Fund's share classes that have been registered and commenced operations:
| Share Classes Commenced Operations1 |
MainStay Defensive ETF Allocation Fund | Class A, Class C, Class I, Class R3, SIMPLE Class |
MainStay Conservative ETF Allocation Fund | Class A, Class C, Class I, Class R3, SIMPLE Class |
MainStay Moderate ETF Allocation Fund | Class A, Class C, Class I, Class R3, SIMPLE Class |
MainStay Growth ETF Allocation Fund | Class A, Class C, Class I, Class R3, SIMPLE Class |
MainStay Equity ETF Allocation Fund | Class A, Class C, Class I, Class R3, SIMPLE Class |
MainStay ESG Multi-Asset Allocation Fund | Class A, Class C, Class I, Class R3, SIMPLE Class |
1.
For each ETF Allocation Fund, other than MainStay ESG Multi-Asset Allocation Fund, Investor Class and Class R6 shares were registered for sale as of June 30, 2020, but as of April 30, 2022 were not yet offered for sale. For MainStay ESG Multi-Asset Allocation Fund, Investor Class and Class R6 shares were registered for sale as of September 30, 2021, but as of April 30, 2022 were not yet offered for sale.
Class A shares are offered at net asset value (“NAV”) per share plus an initial sales charge. No initial sales charge applies to investments of $250,000 or more (and certain other qualified purchases) in Class A shares. However, a contingent deferred sales charge (“CDSC”) of 0.50% may be imposed on certain redemptions made within 18 months of the date of purchase on shares that were purchased without an initial sales charge. Class C shares are offered at NAV without an initial sales charge, although a CDSC of 1.00% may be imposed on certain redemptions of such shares made within one year of the date of purchase of Class C shares. Class I, Class R3 and SIMPLE Class shares are offered at NAV without a sales charge. Depending upon eligibility, Class C shares convert to Class A shares at the end of the calendar quarter eight years after the date they were purchased. SIMPLE Class shares convert to Class A shares, or Investor Class shares if you are not eligible to hold Class A shares, at the end of the calendar quarter, ten years after the date they were purchased. Share class conversions are based on the relevant NAVs of the two classes at the time of the conversion, and no sales load or
other charge is imposed. Under certain circumstances and as may be permitted by the Trust’s multiple class plan pursuant to Rule 18f-3 under the 1940 Act, specified share classes of an ETF Allocation Fund may be converted to one or more other share classes of the ETF Allocation Fund as disclosed in the capital share transactions within these Notes. The classes of shares have the same voting (except for issues that relate solely to one class), dividend, liquidation and other rights, and the same terms and conditions, except that under distribution plans pursuant to Rule 12b-1 under the 1940 Act, Class C shares are subject to higher distribution and/or service fees than Class A, Class R3 and SIMPLE Class shares. Class I shares are not subject to a distribution and/or service fee. Class R3 shares are subject to a shareholder service fee, which is in addition to fees paid under the distribution plans for Class R3 shares.
The investment objective for each of the ETF Allocation Funds is as follows:
The MainStay Defensive ETF Allocation Fund seeks current income.
The MainStay Conservative ETF Allocation Fund seeks current income and, secondarily, long-term growth of capital.
The MainStay Moderate ETF Allocation Fund seeks long-term growth of capital and, secondarily, current income.
The MainStay Growth ETF Allocation Fund seeks long-term growth of capital and, secondarily, current income.
The MainStay Equity ETF Allocation Fund seeks long-term growth of capital.
The MainStay ESG Multi-Asset Allocation Fund seeks long-term growth of capital and, secondarily, current income.
The ETF Allocation Funds are "funds-of-funds" that seek to achieve their investment objectives by investing in passively-managed exchange-traded funds (the “Underlying ETFs”).
Note 2–Significant Accounting Policies
The ETF Allocation Funds are investment companies and accordingly follow the investment company accounting and reporting guidance of the Financial Accounting Standards Board (“FASB”) Accounting Standards Codification Topic 946 Financial Services—Investment Companies. The ETF Allocation Funds prepare their financial statements in accordance with generally accepted accounting principles (“GAAP”) in the United States of America and follow the significant accounting policies described below.
(A) Securities Valuation. Investments are usually valued as of the close of regular trading on the New York Stock Exchange (the "Exchange") (usually 4:00 p.m. Eastern time) on each day the ETF Allocation Funds are open for business ("valuation date").
The Board of Trustees of the Trust (the "Board") adopted procedures establishing methodologies for the valuation of each ETF Allocation Fund's securities and other assets and delegated the responsibility for
Notes to Financial Statements (continued)
valuation determinations under those procedures to the Valuation Committee of the Trust (the “Valuation Committee”). The procedures state that, subject to the oversight of the Board and unless otherwise noted, the responsibility for the day-to-day valuation of portfolio assets (including fair value measurements for the ETF Allocation Funds' assets and liabilities) rests with New York Life Investment Management LLC (“New York Life Investments” or the "Manager"). To assess the appropriateness of security valuations, the Manager or the ETF Allocation Funds' third-party service provider, who is subject to oversight by the Manager, regularly compares prior day prices, prices on comparable securities and the sale prices to the prior and current day prices and challenges prices with changes exceeding certain tolerance levels with third-party pricing services or broker sources.
The Board authorized the Valuation Committee to appoint a Valuation Subcommittee (the “Subcommittee”) to establish the prices of securities for which market quotations are not readily available or the prices of which are not otherwise readily determinable under the procedures. The Subcommittee meets (in person, via electronic mail or via teleconference) on an as-needed basis. The Valuation Committee meets to ensure that actions taken by the Subcommittee were appropriate.
For those securities valued through either a standardized fair valuation methodology or a fair valuation measurement, the Subcommittee deals with such valuation and the Valuation Committee reviews and affirms, if appropriate, the reasonableness of the valuation based on such methodologies and measurements on a regular basis after considering information that is reasonably available and deemed relevant by the Valuation Committee. Any action taken by the Subcommittee with respect to the valuation of a portfolio security or other asset is submitted for review and ratification (if appropriate) to the Valuation Committee and the Board at the next regularly scheduled meeting.
"Fair value" is defined as the price an ETF Allocation Fund would reasonably expect to receive upon selling an asset or liability in an orderly transaction to an independent buyer in the principal or most advantageous market for the asset or liability. Fair value measurements are determined within a framework that establishes a three-tier hierarchy that maximizes the use of observable market data and minimizes the use of unobservable inputs to establish a classification of fair value measurements for disclosure purposes. "Inputs" refer broadly to the assumptions that market participants would use in pricing the asset or liability, including assumptions about risk, such as the risk inherent in a particular valuation technique used to measure fair value using a pricing model and/or the risk inherent in the inputs for the valuation technique. Inputs may be observable or unobservable. Observable inputs reflect the assumptions market participants would use in pricing the asset or liability based on market data obtained from sources independent of each ETF Allocation Fund. Unobservable inputs reflect each ETF Allocation Fund’s own assumptions about the assumptions market participants would use in pricing the asset or liability based on the information available. The inputs or methodology used for valuing assets or liabilities may not be an indication of the risks associated with investing in those assets or liabilities. The three-tier hierarchy of inputs is summarized below.
• Level 1—quoted prices in active markets for an identical asset or liability
• Level 2—other significant observable inputs (including quoted prices for a similar asset or liability in active markets, interest rates and yield curves, prepayment speeds, credit risk, etc.)
• Level 3—significant unobservable inputs (including each ETF Allocation Fund's own assumptions about the assumptions that market participants would use in measuring fair value of an asset or liability)
The level of an asset or liability within the fair value hierarchy is based on the lowest level of an input, both individually and in the aggregate, that is significant to the fair value measurement. The aggregate value by input level of each ETF Allocation Fund’s assets and liabilities as of April 30, 2022, is included at the end of each ETF Allocation Fund’s Portfolio of Investments.
Exchange-traded funds (“ETFs”) are valued at the last quoted sales prices as of the close of regular trading on the relevant exchange on each valuation date. Securities that are not traded on the valuation date are valued at the mean of the last quoted bid and ask prices. Prices are normally taken from the principal market in which each security trades. These securities are generally categorized as Level 1 in the hierarchy.
Investments in mutual funds, including money market funds, are valued at their respective NAVs at the close of business each day on the valuation date. These securities are generally categorized as Level 1 in the hierarchy.
Temporary cash investments acquired in excess of 60 days to maturity at the time of purchase are valued using the latest bid prices or using valuations based on a matrix system (which considers such factors as security prices, yields, maturities and ratings), both as furnished by independent pricing services. Temporary cash investments that mature in 60 days or less at the time of purchase ("Short-Term Investments") are valued using the amortized cost method of valuation, unless the use of such method would be inappropriate. The amortized cost method involves valuing a security at its cost on the date of purchase and thereafter assuming a constant amortization to maturity of the difference between such cost and the value on maturity date. Amortized cost approximates the current fair value of a security. Securities valued using the amortized cost method are not valued using quoted prices in an active market and are generally categorized as Level 2 in the hierarchy.
The information above is not intended to reflect an exhaustive list of the methodologies that may be used to value portfolio investments. The valuation procedures permit the use of a variety of valuation methodologies in connection with valuing portfolio investments. The methodology used for a specific type of investment may vary based on the market data available or other considerations. The methodologies summarized above may not represent the specific means by which portfolio investments are valued on any particular business day.
| Mainstay ETF Asset Allocation Funds |
(B) Income Taxes. Each ETF Allocation Fund is treated as a separate entity for federal income tax purposes. The ETF Allocation Funds' policy is to comply with the requirements of the Internal Revenue Code of 1986, as amended (the “Internal Revenue Code”), applicable to regulated investment companies and to distribute all of its taxable income to the shareholders of each ETF Allocation Fund within the allowable time limits. Therefore, no federal, state and local income tax provisions are required.
Management evaluates each ETF Allocation Fund’s tax positions to determine if the tax positions taken meet the minimum recognition threshold in connection with accounting for uncertainties in income tax positions taken or expected to be taken for the purposes of measuring and recognizing tax liabilities in the financial statements. Recognition of tax benefits of an uncertain tax position is permitted only to the extent the position is “more likely than not” to be sustained assuming examination by taxing authorities. Management has analyzed the ETF Allocation Funds' tax positions taken on federal, state and local income tax returns for all open tax years (for up to three tax years) and has concluded that no provisions for federal, state and local income tax are required in the ETF Allocation Funds' financial statements. The ETF Allocation Funds' federal, state and local income tax and federal excise tax returns for tax years for which the applicable statutes of limitations have not expired are subject to examination by the Internal Revenue Service and state and local departments of revenue.
(C) Dividends and Distributions to Shareholders. Dividends and distributions are recorded on the ex-dividend date. The MainStay Moderate ETF Allocation Fund, MainStay Growth ETF Allocation Fund and MainStay Equity ETF Allocation Fund and MainStay ESG Multi-Asset Allocation Fund each intends to declare and pay dividends from net investment income, if any, at least annually. The MainStay Conservative ETF Allocation Fund and MainStay Defensive ETF Allocation Fund each intends to declare and pay dividends from net investment income, if any, at least quarterly. Each MainStay ETF Allocation Fund declare and distribute capital gains, if any, at least annually. Unless a shareholder elects otherwise, all dividends and distributions are reinvested in the same class of shares of the respective ETF Allocation Fund at NAV. Dividends and distributions to shareholders are determined in accordance with federal income tax regulations and may differ from determinations using GAAP.
(D) Security Transactions and Investment Income. The ETF Allocation Funds record security transactions on the trade date. Realized gains and losses on security transactions are determined using the identified cost method. Dividends and distributions received by the ETF Allocation Funds from the Underlying ETFs are recorded on the ex-dividend date.
Investment income and realized and unrealized gains and losses on investments of the ETF Allocation Funds are allocated pro rata to the separate classes of shares based upon their relative net assets on the date the income is earned or realized and unrealized gains and losses are incurred.
(E) Expenses. Expenses of the Trust are allocated to the individual Funds in proportion to the net assets of the respective Funds when the expenses are incurred, except where direct allocations of expenses can be made. Expenses (other than transfer agent expenses and fees incurred under the shareholder services plans and/or the distribution plans further discussed in Note 3(B)) are allocated to separate classes of shares pro rata based upon their relative net assets on the date the expenses are incurred. The expenses borne by the ETF Allocation Funds, including those of related parties to the ETF Allocation Funds, are shown in the Statement of Operations.
In addition, the ETF Allocation Funds bear a pro rata share of the fees and expenses of the Underlying ETFs in which they invest. Because the Underlying ETFs have varied expense and fee levels and the ETF Allocation Funds may own different proportions of the Underlying ETFs at different times, the amount of fees and expenses incurred indirectly by each ETF Allocation Fund may vary. Shares of the Underlying ETFs are subject to management fees and other fees that may cause the costs of investing in Underlying ETFs to be greater than the costs of owning the underlying securities directly. These indirect expenses of the Underlying ETFs are not included in the amounts shown in the Statement of Operations or in the expense ratios included in the Financial Highlights.
(F) Offering Costs. Costs were incurred by the ETF Allocation Funds in connection with the commencement of the ETF Allocation Funds' operations. These costs are being amortized on a straight line basis over 12 months.
(G) Use of Estimates. In preparing financial statements in conformity with GAAP, the Manager makes estimates and assumptions that affect the reported amounts and disclosures in the financial statements. Actual results could differ from those estimates and assumptions.
(H) Securities Lending. In order to realize additional income, the ETF Allocation Funds may engage in securities lending, subject to the limitations set forth in the 1940 Act and relevant guidance by the staff of the Securities and Exchange Commission (“SEC”). If the ETF Allocation Funds engage in securities lending, the ETF Allocation Funds will lend through their custodian, JPMorgan Chase Bank, N.A., ("JPMorgan"), acting as securities lending agent on behalf of the ETF Allocation Funds. Under the current arrangement, JPMorgan will manage the ETF Allocation Funds' collateral in accordance with the securities lending agency agreement between the ETF Allocation Funds and JPMorgan, and indemnify the ETF Allocation Funds against counterparty risk. The loans will be collateralized by cash (which may be invested in a money market fund) and/or non-cash collateral (which may include U.S. Treasury securities and/or U.S. government agency securities issued or guaranteed by the United States government or its agencies or instrumentalities) at least equal at all times to the market value of the securities loaned. Non-cash collateral held at year end is segregated and cannot be transferred by the ETF Allocation Funds. The ETF Allocation Funds bear the risk of delay in recovery of, or loss of rights in, the securities loaned. The ETF Allocation Funds may also record a realized gain or loss on securities deemed sold due to a borrower’s inability to return securities on
Notes to Financial Statements (continued)
loan. The ETF Allocation Funds bear the risk of any loss on investment of cash collateral. The ETF Allocation Funds will receive compensation for lending its securities in the form of fees or it will retain a portion of interest earned on the investment of any cash collateral. The ETF Allocation Funds will also continue to receive interest and dividends on the securities loaned and any gain or loss in the market price of the securities loaned that may occur during the term of the loan will be for the account of the ETF Allocation Funds. Income earned from securities lending activities, if any, is reflected in the Statement of Operations. Securities on loan as of April 30, 2022, are shown in the Portfolio of Investments.
(I) Indemnifications. Under the Trust’s organizational documents, its officers and trustees are indemnified against certain liabilities that may arise out of performance of their duties to the Trust. Additionally, in the normal course of business, the ETF Allocation Funds enter into contracts with third-party service providers that contain a variety of representations and warranties and that may provide general indemnifications. The ETF Allocation Funds' maximum exposure under these arrangements is unknown, as this would involve future claims that may be made against the ETF Allocation Funds that have not yet occurred. The Manager believes that the risk of loss in connection with these potential indemnification obligations is remote. However, there can be no assurance that material liabilities related to such obligations will not arise in the future, which could adversely impact the ETF Allocation Funds.
Note 3–Fees and Related Party Transactions
(A) Manager. New York Life Investments, a registered investment adviser and an indirect, wholly-owned subsidiary of New York Life Insurance Company (“New York Life”), serves as the ETF Allocation Funds' Manager pursuant to an Amended and Restated Management Agreement (“Management Agreement”) and is responsible for the day-to-day portfolio management of the ETF Allocation Funds. The Manager provides offices, conducts clerical, recordkeeping and bookkeeping services, and keeps most of the financial and accounting records required to be maintained by the ETF Allocation Funds. Except for the portion of salaries and expenses that are the responsibility of the ETF Allocation Funds, the Manager pays the salaries and expenses of all personnel affiliated with the ETF Allocation Funds and certain operational expenses of the ETF Allocation Funds. During a portion on the year ended April 30, 2022, the ETF Allocation Funds reimbursed New York Life Investments in an amount equal to the portion of the compensation of the Chief Compliance Officer attributable to the ETF Allocation Funds.
Pursuant to the Management Agreement, each ETF Allocation Fund pays the Manager a monthly fee for the services performed and facilities furnished at an annual rate of 0.20% of each ETF Allocation Fund's average daily net assets.
| Mainstay ETF Asset Allocation Funds |
New York Life Investments has contractually agreed to waive fees and/or reimburse expenses so that Total Annual Fund Operating Expenses (excluding taxes, interest, litigation, extraordinary expenses, brokerage and other transaction expenses relating to the purchase and sale of portfolio investments, and acquired (underlying) fund fees and expenses) of a class do not exceed the following percentages of average daily net assets for each class:
| | | | | |
MainStay Defensive ETF Allocation Fund | | | | | |
MainStay Conservative ETF Allocation Fund | | | | | |
MainStay Moderate ETF Allocation Fund | | | | | |
MainStay Growth ETF Allocation Fund | | | | | |
MainStay Equity ETF Allocation Fund | | | | | |
MainStay ESG Multi-Asset Allocation Fund | | | | | |
This agreement will remain in effect until February 28, 2022, and shall renew automatically for one-year terms unless New York Life Investments provides written notice of termination prior to the start of the next term or upon approval of the Board.
During the period ended April 30, 2022, New York Life Investments earned fees from the ETF Allocation Funds and waived fees and/or reimbursed expenses as follows:
| | |
MainStay Defensive ETF Allocation Fund | | |
MainStay Conservative ETF Allocation Fund | | |
MainStay Moderate ETF Allocation Fund | | |
MainStay Growth ETF Allocation Fund | | |
MainStay Equity ETF Allocation Fund | | |
MainStay ESG Multi-Asset Allocation Fund | | |
JPMorgan provides sub-administration and sub-accounting services to the ETF Allocation Funds pursuant to an agreement with New York Life Investments. These services include calculating the daily NAVs of the ETF Allocation Funds, maintaining the general ledger and sub-ledger accounts for the calculation of the ETF Allocation Funds' respective NAVs, and assisting New York Life Investments in conducting various aspects of the ETF Allocation Funds' administrative operations. For providing these services to the ETF Allocation Funds, JPMorgan is compensated by New York Life Investments.
Pursuant to an agreement between the Trust and New York Life Investments, New York Life Investments is responsible for providing or procuring certain regulatory reporting services for the ETF Allocation Funds. The ETF Allocation Funds will reimburse New York Life Investments for the actual costs incurred by New York Life Investments in connection with providing or procuring these services for the ETF Allocation Funds.
(B) Distribution, Service and Shareholder Service Fees. The Trust, on behalf of the ETF Allocation Funds, has entered into a distribution agreement with NYLIFE Distributors LLC (the “Distributor”), an affiliate of New York Life Investments. The ETF Allocation Funds have adopted distribution plans (the “Plans”) in accordance with the provisions of Rule 12b-1 under the 1940 Act.
Pursuant to the Class A Plan, the Distributor receives a monthly fee from the Class A shares at an annual rate of 0.25% of the average daily net assets of the Class A shares for distribution and/or service activities as designated by the Distributor. Pursuant to the Class C Plan, Class C shares pay the Distributor a monthly distribution fee at an annual rate of 0.75% of the average daily net assets of the Class C shares, along with a service fee at an annual rate of 0.25% of the average daily net assets of the Class C shares, for a total 12b-1 fee of 1.00%. Pursuant to the Class R3 and SIMPLE Class Plans, Class R3 and SIMPLE Class shares pay the Distributor a monthly distribution fee at an annual rate of 0.25% of the average daily net assets of the Class R3 and SIMPLE Class shares, along with a service fee at an annual rate of 0.25% of the average daily net assets of the Class R3 and SIMPLE Class shares, for a total 12b-1 fee of 0.50%. Class I shares are not subject to a distribution and/or service fee.
The Plans provide that the distribution and service fees are payable to the Distributor regardless of the amounts actually expended by the Distributor for distribution of the ETF Allocation Funds' shares and service activities.
In accordance with the Shareholder Services Plans for the Class R3 shares, the Manager has agreed to provide, through its affiliates or independent third parties, various shareholder and administrative support services to shareholders of the Class R3 shares. For its services, the Manager, its affiliates or independent third-party service providers are entitled to a shareholder service fee accrued daily and paid monthly at an annual rate of 0.10% of the average daily net assets of the Class R3 shares. This is in addition to any fees paid under the Class R3 Plan.
During the year ended April 30, 2022, shareholder service fees incurred by the Fund were as follows:
MainStay Defensive ETF Allocation Fund |
| |
|
MainStay Conservative ETF Allocation Fund |
| |
|
Notes to Financial Statements (continued)
MainStay Moderate ETF Allocation Fund |
| |
|
MainStay Growth ETF Allocation Fund |
| |
|
MainStay Equity ETF Allocation Fund |
| |
|
MainStay ESG Multi-Asset Allocation Fund |
| |
(C) Sales Charges. The ETF Allocation Funds were advised by the Distributor that the amount of initial sales charges retained on sales of each class of shares during the year ended April 30, 2022, was as follows:
MainStay Defensive ETF Allocation Fund | |
| |
|
MainStay Conservative ETF Allocation Fund | |
| |
|
MainStay Moderate ETF Allocation Fund | |
| |
|
MainStay Growth ETF Allocation Fund | |
| |
|
MainStay Equity ETF Allocation Fund | |
| |
|
MainStay ESG Multi-Asset Allocation Fund | |
| |
The ETF Allocation Funds were also advised that the Distributor retained CDSCs on redemptions of Class A and Class C shares during the year ended April 30, 2022, as follows:
MainStay Defensive ETF Allocation Fund | |
| |
|
MainStay Conservative ETF Allocation Fund | |
| |
| |
|
MainStay Moderate ETF Allocation Fund | |
| |
| |
|
MainStay Growth ETF Allocation Fund | |
| |
|
MainStay Equity ETF Allocation Fund | |
| |
| |
(D) Transfer, Dividend Disbursing and Shareholder Servicing Agent. NYLIM Service Company LLC, an affiliate of New York Life Investments, is the ETF Allocation Funds' transfer, dividend disbursing and shareholder servicing agent pursuant to an agreement between NYLIM Service Company LLC and the Trust. NYLIM Service Company LLC has entered into an agreement with DST Asset Manager Solutions, Inc. ("DST"), pursuant to which DST performs certain transfer agent services on behalf of NYLIM Service Company LLC. New York Life Investments has contractually agreed to limit the transfer agency expenses charged to each of the Fund’s share classes to a maximum of 0.35% of that share class’s average daily net assets on an annual basis after deducting any applicable Fund or class-level expense reimbursement or small account fees. For each ETF Allocation Fund, other than MainStay ESG Multi-Asset Allocation Fund, this agreement will remain in effect until August 31, 2022, and shall renew automatically for one-year terms unless New York Life Investments provides written notice of termination prior to the start of the next term or upon approval of the Board. For the MainStay ESG Multi-Asset Allocation Fund, this agreement will remain in effect until September 30, 2022, and shall renew automatically for one-year terms unless New York Life Investments provides written notice of termination prior to the start of the next term or upon approval of the Board. During the year ended April 30, 2022, transfer agent expenses incurred by the ETF Allocation Funds and any reimbursements, pursuant to the aforementioned Transfer Agency expense limitation agreement, were as follows:
MainStay Defensive ETF Allocation Fund | | |
| | |
| | |
MainStay Conservative ETF Allocation Fund | | |
| | |
| | |
| | |
| | |
| | |
| Mainstay ETF Asset Allocation Funds |
MainStay Moderate ETF Allocation Fund | | |
| | |
| | |
| | |
| | |
| | |
MainStay Growth ETF Allocation Fund | | |
| | |
| | |
| | |
| | |
| | |
MainStay Equity ETF Allocation Fund | | |
| | |
| | |
| | |
| | |
| | |
MainStay ESG Multi-Asset Allocation Fund | | |
| | |
| | |
| | |
| | |
| | |
(E) Capital. As of April 30, 2022, New York Life and its affiliates beneficially held shares of the ETF Allocation Funds with the values and percentages of net assets as follows:
MainStay Defensive ETF Allocation Fund | | |
| | |
| | |
| | |
|
MainStay Conservative ETF Allocation Fund | | |
| | |
| | |
| | |
|
MainStay Moderate ETF Allocation Fund | | |
| | |
| | |
|
MainStay Growth ETF Allocation Fund | | |
| | |
| | |
| | |
|
MainStay Equity ETF Allocation Fund | | |
| | |
| | |
| | |
Note 4-Federal Income Tax
As of April 30, 2022, the cost and unrealized appreciation (depreciation) of each ETF Allocation Fund’s investment portfolio, including applicable derivative contracts and other financial instruments, as determined on a federal income tax basis, were as follows:
MainStay Defensive ETF Allocation Fund |
| | Gross
Unrealized
Appreciation | Gross
Unrealized
(Depreciation) | Net
Unrealized
Appreciation/
(Depreciation) |
| | | | |
MainStay Conservative ETF Allocation Fund |
| | Gross
Unrealized
Appreciation | Gross
Unrealized
(Depreciation) | Net
Unrealized
Appreciation/
(Depreciation) |
| | | | |
MainStay Moderate ETF Allocation Fund |
| | Gross
Unrealized
Appreciation | Gross
Unrealized
(Depreciation) | Net
Unrealized
Appreciation/
(Depreciation) |
| | | | |
MainStay Growth ETF Allocation Fund |
| | Gross
Unrealized
Appreciation | Gross
Unrealized
(Depreciation) | Net
Unrealized
Appreciation/
(Depreciation) |
| | | | |
Notes to Financial Statements (continued)
MainStay Equity ETF Allocation Fund |
| | Gross
Unrealized
Appreciation | Gross
Unrealized
(Depreciation) | Net
Unrealized
Appreciation/
(Depreciation) |
| | | | |
MainStay ESG Multi-Asset Allocation Fund |
| | Gross
Unrealized
Appreciation | Gross
Unrealized
(Depreciation) | Net
Unrealized
Appreciation/
(Depreciation) |
| | | | |
As of April 30, 2022, the components of accumulated gain (loss) on a tax basis were as follows:
| | Accumulated
Capital
and Other
Gain (Loss) | Other
Temporary
Differences | Unrealized
Appreciation
(Depreciation) | Total
Accumulated
Gain (Loss) |
MainStay Defensive ETF Allocation Fund | | | | | |
MainStay Conservative ETF Allocation Fund | | | | | |
MainStay Moderate ETF Allocation Fund | | | | | |
MainStay Growth ETF Allocation Fund | | | | | |
MainStay Equity ETF Allocation Fund | | | | | |
MainStay ESG Multi-Asset Allocation Fund | | | | | |
The difference between book-basis and tax-basis unrealized appreciation (depreciation) is primarily due to wash sales adjustments.
The following table discloses the current period reclassifications between total distributable earnings (loss) and additional paid-in capital arising from permanent differences; net assets as of April 30, 2022 were not affected.
| Total
Distributable
Earnings (Loss) | |
MainStay Defensive ETF Allocation Fund | | |
MainStay Conservative ETF Allocation Fund | | |
MainStay Moderate ETF Allocation Fund | | |
MainStay Growth ETF Allocation Fund | | |
MainStay Equity ETF Allocation Fund | | |
MainStay ESG Multi-Asset Allocation Fund | | |
As of April 30, 2022, for federal income tax purposes, capital loss carryforwards of $76,357, as shown in the table below, were available to the extent provided by the regulations to offset future realized gains of the MainStay ESG Multi-Asset Allocation Fund. Accordingly, no capital gains distributions are expected to be paid to shareholders until net gains have been realized in excess of such amounts.
Capital Loss
Available Through | Short-Term
Capital Loss
Amounts (000’s) | Long-Term
Capital Loss
Amounts (000’s) |
| | |
During the period ended April 30, 2022 the tax character of distributions paid as reflected in the Statements of Changes in Net Assets was as follows:
| | |
| | | | | |
MainStay Defensive ETF Allocation Fund | | | | | |
MainStay Conservative ETF Allocation Fund | | | | | |
MainStay Moderate ETF Allocation Fund | | | | | |
MainStay Growth ETF Allocation Fund | | | | | |
MainStay Equity ETF Allocation Fund | | | | | |
MainStay ESG Multi-Asset Allocation Fund | | | | | |
| Mainstay ETF Asset Allocation Funds |
Note 5–Custodian
JPMorgan is the custodian of cash and securities held by the ETF Allocation Funds. Custodial fees are charged to each ETF Allocation Fund based on each ETF Allocation Fund's net assets and/or the market value of securities held by each ETF Allocation Fund and the number of certain transactions incurred by each ETF Allocation Fund.
Note 6–Line of Credit
The ETF Allocation Funds, with the exception of MainStay ESG Multi-Asset Allocation Fund, and certain other funds managed by New York Life Investments maintain a line of credit with a syndicate of banks in order to secure a source of funds for temporary purposes to meet unanticipated or excessive redemption requests.
Effective July 27, 2021, under the credit agreement (the “Credit Agreement”), the aggregate commitment amount is $600,000,000 with an additional uncommitted amount of $100,000,000. The commitment fee is an annual rate of 0.15% of the average commitment amount payable quarterly, regardless of usage, to JPMorgan, who serves as the agent to the syndicate. The commitment fee is allocated among the ETF Allocation Funds, with the exception of MainStay ESG Multi-Asset Allocation Fund, and certain other funds managed by New York Life Investments based upon their respective net assets and other factors. Interest on any revolving credit loan is charged based upon the Federal Funds Rate or the one-month London Interbank Offered Rate ("LIBOR"), whichever is higher. The Credit Agreement expires on July 26, 2022, although the ETF Allocation Funds, certain other funds managed by New York Life Investments and the syndicate of banks may renew the Credit Agreement for an additional year on the same or different terms or enter into a credit agreement with a different syndicate of banks. Prior to July 27, 2021, the aggregate commitment amount and the commitment fee were the same as those under the current Credit Agreement. During the year ended April 30, 2022, there were no borrowings made or outstanding with respect to the ETF Allocation Funds under the Credit Agreement.
Note 7–Interfund Lending Program
Pursuant to an exemptive order issued by the SEC, the ETF Allocation Funds, along with certain other funds managed by New York Life Investments, may participate in an interfund lending program. The interfund lending program provides an alternative credit facility that permits the ETF Allocation Funds and certain other funds managed by New York Life Investments to lend or borrow money for temporary purposes directly to or from one another, subject to the conditions of the exemptive order. During the year ended April 30, 2022, there were no interfund loans made or outstanding with respect to the ETF Allocation Funds.
Note 8–Purchases and Sales of Securities (in 000’s)
During the year ended April 30, 2022, purchases and sales of securities were as follows:
| | |
MainStay Defensive ETF Allocation Fund | | |
MainStay Conservative ETF Allocation Fund | | |
MainStay Moderate ETF Allocation Fund | | |
MainStay Growth ETF Allocation Fund | | |
MainStay Equity ETF Allocation Fund | | |
MainStay ESG Multi-Asset Allocation Fund | | |
Note 9–Capital Share Transactions
Transactions in capital shares for the period ended April 30, 2022, were as follows:
MainStay Defensive ETF Allocation Fund
| | |
Year ended April 30, 2022: | | |
| | |
Shares issued to shareholders in reinvestment of distributions | | |
| | |
Net increase (decrease) in shares outstanding before conversion | | |
Shares converted into Class A (See Note 1) | | |
| | |
Year ended April 30, 2021:(a) | | |
| | |
Shares issued to shareholders in reinvestment of distributions | | |
| | |
| | |
|
| | |
Year ended April 30, 2022: | | |
| | |
Shares issued to shareholders in reinvestment of distributions | | |
| | |
Net increase (decrease) in shares outstanding before conversion | | |
Shares converted from Class C (See Note 1) | | |
| | |
Year ended April 30, 2021:(a) | | |
| | |
Shares issued to shareholders in reinvestment of distributions | | |
| | |
| | |
|
Notes to Financial Statements (continued)
| | |
Year ended April 30, 2022: | | |
Shares issued to shareholders in reinvestment of distributions | | |
| | |
| | |
Year ended April 30, 2021:(a) | | |
| | |
Shares issued to shareholders in reinvestment of distributions | | |
| | |
|
| | |
Year ended April 30, 2022: | | |
| | |
Shares issued to shareholders in reinvestment of distributions | | |
| | |
| | |
Year ended April 30, 2021:(a) | | |
| | |
Shares issued to shareholders in reinvestment of distributions | | |
| | |
|
| | |
Year ended April 30, 2022: | | |
| | |
Shares issued to shareholders in reinvestment of distributions | | |
| | |
| | |
Year ended April 30, 2021:(b) | | |
| | |
Shares issued to shareholders in reinvestment of distributions | | |
| | |
| The inception date of the class was June 30, 2020. |
| The inception date of the class was August 31, 2020. |
MainStay Conservative ETF Allocation Fund
| | |
Year ended April 30, 2022: | | |
| | |
Shares issued to shareholders in reinvestment of distributions | | |
| | |
Net increase (decrease) in shares outstanding before conversion | | |
Shares converted into Class A (See Note 1) | | |
| | |
Year ended April 30, 2021:(a) | | |
| | |
Shares issued to shareholders in reinvestment of distributions | | |
| | |
Net increase (decrease) in shares outstanding before conversion | | |
Shares converted into Class A (See Note 1) | | |
| | |
|
| | |
Year ended April 30, 2022: | | |
| | |
Shares issued to shareholders in reinvestment of distributions | | |
| | |
Net increase (decrease) in shares outstanding before conversion | | |
Shares converted from Class C (See Note 1) | | |
| | |
Year ended April 30, 2021:(a) | | |
| | |
Shares issued to shareholders in reinvestment of distributions | | |
| | |
Net increase (decrease) in shares outstanding before conversion | | |
Shares converted from Class C (See Note 1) | | |
| | |
|
| | |
Year ended April 30, 2022: | | |
Shares issued to shareholders in reinvestment of distributions | | |
| | |
| | |
Year ended April 30, 2021:(a) | | |
| | |
Shares issued to shareholders in reinvestment of distributions | | |
| | |
| | |
|
| Mainstay ETF Asset Allocation Funds |
| | |
Year ended April 30, 2022: | | |
| | |
Shares issued to shareholders in reinvestment of distributions | | |
| | |
Year ended April 30, 2021:(a) | | |
| | |
Shares issued to shareholders in reinvestment of distributions | | |
| | |
|
| | |
Year ended April 30, 2022: | | |
| | |
Shares issued to shareholders in reinvestment of distributions | | |
| | |
| | |
Year ended April 30, 2021:(b) | | |
| | |
Shares issued to shareholders in reinvestment of distributions | | |
| | |
| | |
| The inception date of the class was June 30, 2020. |
| The inception date of the class was August 31, 2020. |
MainStay Moderate ETF Allocation Fund
| | |
Year ended April 30, 2022: | | |
| | |
Shares issued to shareholders in reinvestment of distributions | | |
| | |
Net increase (decrease) in shares outstanding before conversion | | |
Shares converted into Class A (See Note 1) | | |
| | |
Year ended April 30, 2021:(a) | | |
| | |
Shares issued to shareholders in reinvestment of distributions | | |
| | |
Net increase (decrease) in shares outstanding before conversion | | |
Shares converted into Class A (See Note 1) | | |
| | |
|
| | |
Year ended April 30, 2022: | | |
| | |
Shares issued to shareholders in reinvestment of distributions | | |
| | |
Net increase (decrease) in shares outstanding before conversion | | |
Shares converted from Class C (See Note 1) | | |
| | |
Year ended April 30, 2021:(a) | | |
| | |
Shares issued to shareholders in reinvestment of distributions | | |
| | |
Net increase (decrease) in shares outstanding before conversion | | |
Shares converted from Class C (See Note 1) | | |
| | |
|
| | |
Year ended April 30, 2022: | | |
| | |
Shares issued to shareholders in reinvestment of distributions | | |
| | |
| | |
Year ended April 30, 2021:(a) | | |
| | |
Shares issued to shareholders in reinvestment of distributions | | |
| | |
| | |
|
| | |
Year ended April 30, 2022: | | |
| | |
Shares issued to shareholders in reinvestment of distributions | | |
| | |
| | |
Year ended April 30, 2021:(a) | | |
| | |
Shares issued to shareholders in reinvestment of distributions | | |
| | |
|
Notes to Financial Statements (continued)
| | |
Year ended April 30, 2022: | | |
| | |
Shares issued to shareholders in reinvestment of distributions | | |
| | |
| | |
Year ended April 30, 2021:(b) | | |
| | |
Shares issued to shareholders in reinvestment of distributions | | |
| | |
| | |
| The inception date of the class was June 30, 2020. |
| The inception date of the class was August 31, 2020. |
MainStay Growth ETF Allocation Fund
| | |
Year ended April 30, 2022: | | |
| | |
Shares issued to shareholders in reinvestment of distributions | | |
| | |
Net increase (decrease) in shares outstanding before conversion | | |
Shares converted into Class A (See Note 1) | | |
Shares converted from Class A (See Note 1) | | |
| | |
Year ended April 30, 2021:(a) | | |
| | |
Shares issued to shareholders in reinvestment of distributions | | |
| | |
Shares converted into Class A (See Note 1) | | |
Shares converted from Class A (See Note 1) | | |
| | |
|
| | |
Year ended April 30, 2022: | | |
| | |
Shares issued to shareholders in reinvestment of distributions | | |
| | |
Net increase (decrease) in shares outstanding before conversion | | |
Shares converted from Class C (See Note 1) | | |
| | |
Year ended April 30, 2021:(a) | | |
| | |
Shares issued to shareholders in reinvestment of distributions | | |
| | |
Shares converted from Class C (See Note 1) | | |
| | |
|
| | |
Year ended April 30, 2022: | | |
| | |
Shares issued to shareholders in reinvestment of distributions | | |
| | |
Year ended April 30, 2021:(a) | | |
| | |
Shares issued to shareholders in reinvestment of distributions | | |
| | |
| | |
|
| | |
Year ended April 30, 2022: | | |
| | |
Shares issued to shareholders in reinvestment of distributions | | |
| | |
Year ended April 30, 2021:(a) | | |
| | |
Shares issued to shareholders in reinvestment of distributions | | |
| | |
|
| Mainstay ETF Asset Allocation Funds |
| | |
Year ended April 30, 2022: | | |
| | |
Shares issued to shareholders in reinvestment of distributions | | |
| | |
Net increase (decrease) in shares outstanding before conversion | | |
Shares converted into SIMPLE Class (See Note 1) | | |
| | |
Year ended April 30, 2021:(b) | | |
| | |
Shares issued to shareholders in reinvestment of distributions | | |
| | |
Shares converted into SIMPLE Class (See Note 1) | | |
| | |
| The inception date of the class was June 30, 2020. |
| The inception date of the class was August 31, 2020. |
MainStay Equity ETF Allocation Fund
| | |
Year ended April 30, 2022: | | |
| | |
Shares issued to shareholders in reinvestment of distributions | | |
| | |
Net increase (decrease) in shares outstanding before conversion | | |
Shares converted into Class A (See Note 1) | | |
| | |
Year ended April 30, 2021:(a) | | |
| | |
Shares issued to shareholders in reinvestment of distributions | | |
| | |
Net increase (decrease) in shares outstanding before conversion | | |
Shares converted into Class A (See Note 1) | | |
| | |
|
| | |
Year ended April 30, 2022: | | |
| | |
Shares issued to shareholders in reinvestment of distributions | | |
| | |
Net increase (decrease) in shares outstanding before conversion | | |
Shares converted from Class C (See Note 1) | | |
| | |
Year ended April 30, 2021:(a) | | |
| | |
Shares issued to shareholders in reinvestment of distributions | | |
| | |
Net increase (decrease) in shares outstanding before conversion | | |
Shares converted from Class C (See Note 1) | | |
| | |
|
| | |
Year ended April 30, 2022: | | |
| | |
Shares issued to shareholders in reinvestment of distributions | | |
| | |
| | |
Year ended April 30, 2021:(a) | | |
| | |
Shares issued to shareholders in reinvestment of distributions | | |
| | |
|
| | |
Year ended April 30, 2022: | | |
| | |
Shares issued to shareholders in reinvestment of distributions | | |
| | |
| | |
Year ended April 30, 2021:(a) | | |
| | |
Shares issued to shareholders in reinvestment of distributions | | |
| | |
|
Notes to Financial Statements (continued)
| | |
Year ended April 30, 2022: | | |
| | |
Shares issued to shareholders in reinvestment of distributions | | |
| | |
| | |
Year ended April 30, 2021:(b) | | |
| | |
Shares issued to shareholders in reinvestment of distributions | | |
| | |
| | |
| The inception date of the class was June 30, 2020. |
| The inception date of the class was August 31, 2020. |
MainStay ESG Multi-Asset Allocation Fund
| | |
Period ended April 30, 2022: (a) | | |
| | |
Shares issued to shareholders in reinvestment of distributions | | |
| | |
| | |
|
| | |
Period ended April 30, 2022: (a) | | |
| | |
Shares issued to shareholders in reinvestment of distributions | | |
| | |
|
| | |
Period ended April 30, 2022: (a) | | |
| | |
Shares issued to shareholders in reinvestment of distributions | | |
| | |
|
| | |
Period ended April 30, 2022: (a) | | |
| | |
Shares issued to shareholders in reinvestment of distributions | | |
| | |
|
| | |
Period ended April 30, 2022: (a) | | |
| | |
Shares issued to shareholders in reinvestment of distributions | | |
| | |
| The inception date of the class was September 30, 2021. |
Note 10–Other Matters
An outbreak of COVID-19, first detected in December 2019, has developed into a global pandemic and has resulted in travel restrictions, closure of international borders, certain businesses and securities markets, restrictions on securities trading activities, prolonged quarantines, supply chain disruptions, and lower consumer demand, as well as general concern and uncertainty. The continued impact of COVID-19 and related variants is uncertain and could further adversely affect the global economy, national economies, individual issuers and capital markets in unforeseeable ways and result in a substantial and extended economic downturn. Developments that disrupt global economies and financial markets, such as COVID-19, may magnify factors that affect the ETF Allocation Funds' performance.
Note 11–Subsequent Events
In connection with the preparation of the financial statements of the ETF Allocation Funds as of and for the year ended April 30, 2022, events and transactions subsequent to April 30, 2022, through the date the financial statements were issued have been evaluated by the Manager for possible adjustment and/or disclosure. No subsequent events requiring financial statement adjustment or disclosure have been identified.
| Mainstay ETF Asset Allocation Funds |
Report of Independent Registered Public Accounting Firm
To the Shareholders of the Funds and Board of Trustees
MainStay Funds Trust:
Opinion on the Financial Statements
We have audited the accompanying statements of assets and liabilities of MainStay Defensive ETF Allocation Fund, MainStay Conservative ETF Allocation Fund, MainStay Moderate ETF Allocation Fund, MainStay Growth ETF Allocation Fund, MainStay Equity ETF Allocation Fund and MainStay ESG Multi-Asset Allocation Fund (the Funds), six of the funds constituting MainStay Funds Trust, including the portfolios of investments, as of April 30, 2022, the related statements of operations for the year then ended, except for MainStay ESG Multi-Asset Allocation Fund which is for the period from September 30, 2021 (commencement of operations) through April 30, 2022, the statements of changes in net assets for the year ended April 30, 2022 and the period June 30, 2020 (commencement of operations) through April 30, 2021, except for MainStay ESG Multi-Asset Allocation Fund which is for the period from September 30, 2021 through April 30, 2022, and the related notes (collectively, the financial statements) and the financial highlights for each of the years or periods in the two-year period then ended. In our opinion, the financial statements and financial highlights present fairly, in all material respects, the financial position of the Funds as of April 30, 2022, the results of their operations for the year then ended, except for MainStay ESG Multi-Asset Allocation Fund which is for the period from September 30, 2021 through April 30, 2022, the changes in their net assets for the year ended April 30, 2022 and the period June 30, 2020 through April 30, 2021, except for MainStay ESG Multi-Asset Allocation Fund which is for the period from September 30, 2021 through April 30, 2022, and the financial highlights for each of the years or periods presented therein, in conformity with U.S. generally accepted accounting principles.
Basis for Opinion
These financial statements and financial highlights are the responsibility of the Funds' management. Our responsibility is to express an opinion on these financial statements and financial highlights based on our audits. We are a public accounting firm registered with the Public Company Accounting Oversight Board (United States) (PCAOB) and are required to be independent with respect to the Funds in accordance with the U.S. federal securities laws and the applicable rules and regulations of the Securities and Exchange Commission and the PCAOB.
We conducted our audits in accordance with the standards of the PCAOB. Those standards require that we plan and perform the audit to obtain reasonable assurance about whether the financial statements and financial highlights are free of material misstatement, whether due to error or fraud. Our audits included performing procedures to assess the risks of material misstatement of the financial statements and financial highlights, whether due to error or fraud, and performing procedures that respond to those risks. Such procedures included examining, on a test basis, evidence regarding the amounts and disclosures in the financial statements and financial highlights. Such procedures also included confirmation of securities owned as of April 30, 2022, by correspondence with the custodian, the transfer agent, and brokers or by other appropriate auditing procedures when replies from brokers were not received. Our audits also included evaluating the accounting principles used and significant estimates made by management, as well as evaluating the overall presentation of the financial statements and financial highlights. We believe that our audits provide a reasonable basis for our opinion.
We have served as the auditor of one or more New York Life Investment Management investment companies since 2003.
Philadelphia, Pennsylvania
June 27, 2022
Board Consideration and Approval of Management Agreement (Unaudited)
The continuation of the Management Agreement with respect to the MainStay Conservative ETF Allocation Fund, MainStay Defensive ETF Allocation Fund, MainStay Equity ETF Allocation Fund, MainStay Growth ETF Allocation Fund and MainStay Moderate ETF Allocation Fund (“Funds”) and New York Life Investment Management LLC (“New York Life Investments”), following an initial term of up to two years, is subject to annual review and approval by the Board of Trustees of MainStay Funds Trust (“Board” of the “Trust”) in accordance with Section 15 of the Investment Company Act of 1940, as amended (“1940 Act”). At its December 8–9, 2021 meeting, the Board, including the Trustees who are not an “interested person” (as such term is defined in the 1940 Act) of the Trust (“Independent Trustees”) voting separately, unanimously approved the continuation of the Management Agreement for a one-year period.
In reaching the decision to approve the continuation of the Management Agreement, the Board considered information and materials furnished by New York Life Investments in connection with an annual contract review process undertaken by the Board that took place at meetings of the Board and its Contracts Committee during September 2021 through December 2021, including information and materials furnished by New York Life Investments in response to requests prepared on behalf of the Board, and in consultation with the Independent Trustees, by independent legal counsel to the Independent Trustees, which encompassed a variety of topics, including those summarized below. Information and materials requested by and furnished to the Board for consideration in connection with the contract review process included, among other items, reports on each Fund and “peer funds” prepared by Institutional Shareholder Services Inc. (“ISS”), an independent third-party service provider engaged by the Board to report objectively on each Fund’s investment performance, management fee and total expenses. The Board also considered information on the fees charged to other investment advisory clients of New York Life Investments that follow investment strategies similar to those of each Fund, if any, and, when applicable, the rationale for any differences in each Fund’s management fee and the fees charged to those other investment advisory clients. In addition, the Board considered information regarding the legal standards and fiduciary obligations applicable to its consideration of the continuation of the Management Agreement. The contract review process, including the structure and format for information and materials provided to the Board, has been developed in consultation with the Board. The Independent Trustees also met in executive sessions with their independent legal counsel and, for portions thereof, with senior management of New York Life Investments.
The Board’s deliberations with respect to the continuation of the Management Agreement reflect a year-long process, and the Board also took into account information furnished to the Board and its Committees throughout the year, as deemed relevant and appropriate by the Trustees, including, among other items, reports on investment performance of each Fund and investment-related matters for each Fund as well as presentations from New York Life Investments personnel. In addition, the Board took into account other information received from New York Life
Investments throughout the year, including, among other items, periodic reports on legal and compliance matters, risk management, portfolio turnover, brokerage commissions and non-advisory services provided to each Fund by New York Life Investments, as deemed relevant and appropriate by the Trustees.
In addition to information provided to the Board throughout the year, the Board received information in connection with its June 2021 meeting provided specifically in response to requests prepared on behalf of the Board, and in consultation with the Independent Trustees, by independent legal counsel to the Independent Trustees regarding each Fund’s distribution arrangements. In addition, the Board received information regarding each Fund’s asset levels, share purchase and redemption activity and the payment of Rule 12b-1 and/or other fees by the applicable share classes of each Fund, among other information.
In considering the continuation of the Management Agreement, the Trustees reviewed and evaluated the information and factors they believed to reasonably be necessary and appropriate in light of legal advice furnished to them by independent legal counsel to the Independent Trustees and through the exercise of their own business judgment. Although individual Trustees may have weighed certain factors or information differently and the Board did not consider any single factor or information controlling in reaching its decision, the factors considered by the Board are described in greater detail below and include, among other factors: (i) the nature, extent and quality of the services provided to each Fund by New York Life Investments; (ii) the qualifications of the portfolio managers of each Fund and the historical investment performance of each Fund and New York Life Investments; (iii) the costs of the services provided, and profits realized, by New York Life Investments with respect to its relationship with each Fund; (iv) the extent to which economies of scale have been realized or may be realized if each Fund grows and the extent to which economies of scale have benefited or may benefit each Fund’s shareholders; and (v) the reasonableness of each Fund’s management fee and total ordinary operating expenses. Although the Board recognized that comparisons between each Fund’s fees and expenses and those of other funds are imprecise given different terms of agreements, variations in fund strategies and other factors, the Board considered the reasonableness of each Fund’s management fee and total ordinary operating expenses as compared to the peer funds identified by ISS. Throughout their considerations, the Trustees acknowledged the commitment of New York Life Investments and its affiliates to serve the MainStay Group of Funds, as well as their capacity, experience, resources, financial stability and reputations. The Trustees also acknowledged the entrepreneurial and other risks assumed by New York Life Investments in sponsoring and managing each Fund.
The Trustees noted that, throughout the year, the Trustees are afforded an opportunity to ask questions of, and request additional information or materials from, New York Life Investments. The Board’s decision with respect to the Management Agreement may have also been based, in part, on the Board’s knowledge of New York Life Investments resulting from, among other things, the Board’s consideration of the Management
| Mainstay ETF Asset Allocation Funds |
Agreement in prior years, the advisory agreements for other funds in the MainStay Group of Funds, the Board’s review throughout the year of the performance and operations of other funds in the MainStay Group of Funds and each Trustee’s business judgment and industry experience. In addition to considering the above-referenced factors, the Board observed that in the marketplace there are a range of investment options available to investors and that each Fund’s shareholders, having had the opportunity to consider other investment options, have chosen to invest in the Fund.
The factors that figured prominently in the Board’s decision to approve the continuation of the Management Agreement during its December 8–9, 2021 meeting are summarized in more detail below. The Board considered on a Fund-by-Fund basis the factors and information deemed relevant and appropriate by the Trustees to evaluate the continuation of the Management Agreement, and the Board’s decision was made separately with respect to each Fund.
Nature, Extent and Quality of Services Provided by New York Life Investments
The Board examined the nature, extent and quality of the services that New York Life Investments provides to each Fund. The Board evaluated New York Life Investments’ experience and capabilities in serving as manager of each Fund. The Board noted that New York Life Investments manages other mutual funds, serves a variety of other investment advisory clients, including other pooled investment vehicles, and has experience overseeing mutual fund service providers. The Board considered the experience of senior personnel at New York Life Investments providing management and administrative and other non-advisory services to each Fund as well as New York Life Investments’ reputation and financial condition. The Board observed that New York Life Investments devotes significant resources and time to providing management and non-advisory services to each Fund.
The Board also considered the range of services that New York Life Investments provides to the Funds under the terms of the Management Agreement, including: (i) fund accounting and ongoing supervisory services provided by New York Life Investments’ Fund Administration and Accounting Group; (ii) investment supervisory and analytical services provided by New York Life Investments’ Investment Consulting Group; (iii) compliance services provided by the Trust’s Chief Compliance Officer as well as New York Life Investments’ compliance department, including supervision and implementation of the Funds’ compliance program; (iv) legal services provided by New York Life Investments’ Office of the General Counsel; and (v) risk management monitoring and analysis by compliance and investment personnel. The Board noted that New York Life Investments provides certain other non-advisory services to the Funds. In addition, the Board considered New York Life Investments’ willingness to invest in personnel and other resources, such as cyber security, information security and business continuity planning, designed to benefit the Funds and noted that New York Life Investments is responsible for compensating the Trust’s officers. The Board recognized that New York Life Investments has provided an increasingly broad array
of non-advisory services to the MainStay Group of Funds as a result of regulatory and other developments. The Board considered benefits to each Fund’s shareholders from the Fund being part of the MainStay Group of Funds, including the privilege of exchanging investments between the same class of shares of funds in the MainStay Group of Funds, including without the imposition of a sales charge (if any).
The Board also examined the range, and the nature, extent and quality, of the investment advisory services that New York Life Investments provides to each Fund and considered the terms of the Management Agreement. The Board evaluated New York Life Investments’ experience and performance in serving as investment adviser to the Funds and advising other portfolios and New York Life Investments’ track record and experience in providing investment advisory services, the experience of investment advisory, senior management and administrative personnel at New York Life Investments and New York Life Investments’ overall resources, legal and compliance environment, capabilities, reputation and history. In addition to information provided in connection with quarterly meetings with the Trust’s Chief Compliance Officer, the Board considered information regarding the compliance policies and procedures of New York Life Investments and acknowledged New York Life Investments’ commitment to further developing and strengthening compliance programs relating to the Funds. The Board reviewed New York Life Investments’ ability to attract and retain qualified investment professionals and willingness to invest in personnel to service and support the Funds. In this regard, the Board considered the qualifications and experience of each Fund’s portfolio managers, the number of accounts managed by the portfolio managers and the method for compensating the portfolio managers.
The Board considered the Funds’ investments in exchange-traded funds (“ETFs”) in excess of statutory limitations under the 1940 Act in reliance on exemptive relief issued to the ETFs, including the conditions of the applicable exemptive relief, and the Funds’ investing fund agreements with these ETFs in accordance with such relief. The Board concluded that the management fees charged to the Funds are for advisory services provided to the Funds that are in addition to, and not duplicative of, services provided to the underlying ETFs under their respective advisory contracts.
Because the Funds invest substantially all their assets in other funds, the Board considered information from New York Life Investments regarding the investment rationale and process for the allocation among and selection of the underlying funds in which the Funds invest.
In addition, the Board considered information provided by New York Life Investments regarding the operations of its business continuity plans in response to the ongoing COVID-19 pandemic, including the remote working environment.
Based on these considerations, the Board concluded that each Fund would likely continue to benefit from the nature, extent and quality of these services.
Board Consideration and Approval of Management Agreement (Unaudited) (continued)
Investment Performance
In evaluating each Fund’s investment performance, the Board considered investment performance results over various periods in light of each Fund’s investment objective, strategies and risks. The Board considered investment reports on, and analysis of, each Fund’s performance provided to the Board throughout the year. These reports include, among other items, information on each Fund’s gross and net returns, each Fund’s investment performance compared to relevant investment categories and each Fund’s benchmarks, each Fund’s risk-adjusted investment performance and each Fund’s investment performance as compared to peer funds, as appropriate, as well as portfolio attribution information and commentary on the effect of market conditions. The Board also considered information provided by ISS showing the investment performance of each Fund as compared to peer funds.
The Board also gave weight to its discussions with senior management at New York Life Investments concerning each Fund’s investment performance as well as discussions between each Fund’s portfolio management team and the members of the Board’s Investment Committee, which generally occur on an annual basis. In addition, the Board considered any specific actions that New York Life Investments had taken, or had agreed to take, to seek to enhance each Fund’s investment performance and the results of those actions. In considering the investment performance of the Funds, the Board noted that each of the MainStay Defensive ETF Allocation Fund, the MainStay Conservative ETF Allocation Fund and the MainStay Moderate ETF Allocation Fund underperformed its peer funds for the one-year period ended July 31, 2021. The Board considered its discussions with representatives from New York Life Investments regarding each of such Funds’ investment performance.
Based on these considerations, the Board concluded that its review of each Fund’s investment performance and related information supported a determination to approve the continuation of the Management Agreement.
Costs of the Services Provided, and Profits Realized, by New York Life Investments
The Board considered the costs of the services provided under the Management Agreement. The Board also considered the profits realized by New York Life Investments and its affiliates due to their relationships with the Funds.
In addition, the Board acknowledged the difficulty in obtaining reliable comparative data about mutual fund managers’ profitability because such information generally is not publicly available and may be impacted by numerous factors, including the structure of a fund manager’s organization, the types of funds it manages, the methodology used to allocate certain fixed costs to specific funds and the manager’s capital structure and costs of capital.
In evaluating the costs of the services provided by New York Life Investments and profits realized by New York Life Investments and its affiliates, the Board considered, among other factors, New York Life Investments’ and its affiliates’ continuing investments in, or willingness to invest in, personnel and other resources to support and further enhance the management of each Fund. The Board also considered the financial resources of New York Life Investments and acknowledged that New York Life Investments must be in a position to attract and retain experienced professional personnel and to maintain a strong financial position for New York Life Investments to continue to provide high-quality services to the Funds. The Board recognized that each Fund benefits from the allocation of certain fixed costs among the funds in the MainStay Group of Funds, among other expected benefits resulting from its relationship with New York Life Investments.
The Board considered information regarding New York Life Investments’ methodology for calculating profitability and allocating costs provided by New York Life Investments in connection with the fund profitability analysis presented to the Board. The Board previously engaged an independent consultant to review the methods used to allocate costs among the funds in the MainStay Group of Funds. The Board noted that the independent consultant had concluded that New York Life Investments’ methods for allocating costs and procedures for estimating overall profitability of the relationship with the funds in the MainStay Group of Funds are reasonable and that New York Life Investments continued to use the same method of calculating profit and allocating costs since the independent consultant’s review. The Board recognized the difficulty in calculating and evaluating a manager’s profitability with respect to each Fund and noted that other profitability methodologies may also be reasonable.
The Board also considered certain fall-out benefits that may be realized by New York Life Investments and its affiliates due to their relationships with each Fund, including reputational and other indirect benefits. In addition, the Board considered its review of a money market fund advised by New York Life Investments and an affiliated subadvisor that serves as an investment option for the Funds, including the potential rationale for and costs associated with investments in this money market fund by the Funds, if any, and considered information from New York Life Investments that the nature and type of specific investment advisory services provided to this money market fund are distinct from, or in addition to, the investment advisory services provided to the Funds.
The Board observed that, in addition to fees earned by New York Life Investments for managing each Fund, New York Life Investments’ affiliates also earn revenues from serving each Fund in various other capacities, including as each Fund’s transfer agent and distributor. The Board considered information about these other revenues and their impact on the profitability of the relationship with each Fund to New York Life Investments and its affiliates. The Board noted that, although it assessed the overall profitability of each Fund to New York Life Investments and its affiliates as part of the contract review process, when considering the reasonableness of the fee paid to New York Life Investments under the Management Agreement, the Board considered
| Mainstay ETF Asset Allocation Funds |
the profitability of New York Life Investments’ relationship with the Funds on a pre-tax basis and without regard to distribution expenses incurred by New York Life Investments from its own resources.
After evaluating the information deemed relevant by the Trustees, the Board concluded that any profits realized by New York Life Investments and its affiliates due to their relationships with each Fund were not excessive.
Management Fees and Total Ordinary Operating Expenses
The Board evaluated the reasonableness of the fee paid under the Management Agreement and each Fund’s total ordinary operating expenses.
In assessing the reasonableness of each Fund’s fees and expenses, the Board primarily considered comparative data provided by ISS on the fees and expenses charged by similar mutual funds managed by other investment advisers. In addition, the Board considered information provided by New York Life Investments on fees charged to other investment advisory clients, including institutional separate accounts and/or other funds that follow investment strategies similar to those of each Fund, if any. The Board considered the similarities and differences in the contractual management fee schedules of each Fund and these similarly-managed accounts and/or funds, taking into account the rationale for any differences in fee schedules. The Board also took into account explanations provided by New York Life Investments about the more extensive scope of services provided to registered investment companies, such as the Funds, as compared with other investment advisory clients. Additionally, the Board considered the impact of voluntary waivers and expense limitation arrangements on each Fund’s net management fee and expenses. The Board also considered that in proposing fees for each Fund, New York Life Investments considers the competitive marketplace for mutual funds.
The Board took into account information from New York Life Investments regarding the reasonableness of each Fund’s transfer agent fee schedule, including industry data demonstrating that the fees that NYLIM Service Company LLC, an affiliate of New York Life Investments and each Fund’s transfer agent, charges each Fund are within the range of fees charged by transfer agents to other mutual funds. In addition, the Board considered NYLIM Service Company LLC’s profitability in connection with the transfer agent services it provides to the Funds. The Board also took into account information received from NYLIM Service Company LLC regarding the sub-transfer agency payments it made to intermediaries in connection with the provision of sub-transfer agency services to the Funds.
The Board considered the extent to which transfer agent fees comprised total expenses of each Fund. The Board acknowledged the role that the MainStay Group of Funds historically has played in serving the investment needs of New York Life Insurance Company customers, who often maintain smaller account balances than other shareholders of funds, and the impact of small accounts on the expense ratios of Fund share classes. The Board also recognized measures that it and New York Life
Investments have taken to mitigate the effect of small accounts on the expense ratios of Fund share classes, including through the imposition of an expense limitation on net transfer agency expenses. The Board also considered that NYLIM Service Company LLC had waived its contractual cost of living adjustments during the seven years prior to 2021.
Based on the factors outlined above, the Board concluded that each Fund’s management fee and total ordinary operating expenses were within a range that is competitive and support a conclusion that these fees and expenses are reasonable.
Economies of Scale
The Board considered information regarding economies of scale, including whether each Fund’s expense structure permits economies of scale to be appropriately shared with each Fund’s shareholders. The Board also considered a report from New York Life Investments, previously prepared at the request of the Board, that addressed economies of scale, including with respect to the mutual fund business generally, and the various ways in which the benefits of economies of scale may be shared with the funds in the MainStay Group of Funds. Although the Board recognized the difficulty of determining economies of scale with precision, the Board acknowledged that economies of scale may be shared with each Fund in a number of ways, including, for example, through the imposition of fee breakpoints, initially setting management fee rates at scale or making additional investments to enhance services. The Board reviewed information from New York Life Investments showing how each Fund’s management fee schedule compared to fee schedules of other funds and accounts managed by New York Life Investments. The Board also reviewed information from ISS showing how each Fund’s management fee schedule compared with fees paid for similar services by peer funds at varying asset levels.
Based on this information, the Board concluded that economies of scale are appropriately reflected for the benefit of each Fund’s shareholders through each Fund’s expense structure and other methods to share benefits from economies of scale.
Conclusion
On the basis of the information and factors summarized above, among other information and factors deemed relevant by the Trustees, and the evaluation thereof, the Board, including the Independent Trustees voting separately, unanimously voted to approve the continuation of the Management Agreement.
Discussion of the Operation and Effectiveness of the ETF Allocation Funds' Liquidity Risk Management Program (Unaudited)
In compliance with Rule 22e-4 under the Investment Company Act of 1940, as amended (the “Liquidity Rule”), the ETF Allocation Funds have adopted and implemented a liquidity risk management program (the “Program”), which New York Life Investment Management LLC believes is reasonably designed to assess and manage the ETF Allocation Funds' liquidity risk (the risk that the ETF Allocation Funds could not meet requests to redeem shares issued by the ETF Allocation Funds without significant dilution of remaining investors’ interests in the ETF Allocation Funds). The Board of Trustees of MainStay Funds Trust (the "Board") designated New York Life Investment Management LLC as administrator of the Program (the “Administrator”). The Administrator has established a Liquidity Risk Management Committee to assist the Administrator in the implementation and day-to-day administration of the Program and to otherwise support the Administrator in fulfilling its responsibilities under the Program.
At a meeting of the Board held on March 9, 2022, the Administrator provided the Board with a written report addressing the Program’s operation and assessing its adequacy and effectiveness of implementation for the period from January 1, 2021 through December 31, 2021 (the "Review Period"), as required under the Liquidity Rule. The report noted that the Administrator concluded that (i) the Program operated effectively to assess and manage the ETF Allocation Funds' liquidity risk, (ii) the Program has been adequately and effectively implemented to monitor and, as applicable, respond to the ETF Allocation Funds' liquidity developments and (iii) the ETF Allocation Funds' investment strategy continues to be appropriate for an open-end fund. In addition, the report summarized the operation of the Program and the information and factors considered by the Administrator in its assessment of the Program’s implementation, such as the liquidity risk assessment framework and the liquidity classification methodologies, and discussed notable events that impacted liquidity risk during the Review Period.
In accordance with the Program, the ETF Allocation Funds' liquidity risk is assessed no less frequently than annually taking into consideration certain factors, as applicable, such as (i) investment strategy and liquidity of portfolio investments, (ii) short-term and long-term cash flow projections and (iii) holdings of cash and cash equivalents, as well as borrowing arrangements and other funding sources. Certain factors are considered under both normal and reasonably foreseeable stressed conditions.
Each ETF Allocation Fund's portfolio investment is classified into one of four liquidity categories. The classification is based on a determination of the number of days it is reasonably expected to take to convert the investment into cash, or sell or dispose of the investment, in current market conditions without significantly changing the market value of the investment. The Administrator's liquidity classification determinations are made by taking into account the ETF Allocation Funds' reasonably anticipated trade size, various market, trading and investment-specific considerations, as well as market depth, and, in certain cases, third-party vendor data.
The Liquidity Rule requires funds that do not primarily hold assets that are highly liquid investments to adopt a minimum amount of net assets that must be invested in highly liquid investments that are assets (an “HLIM”). In addition, the Liquidity Rule limits a fund's investments in illiquid investments. Specifically, the Liquidity Rule prohibits acquisition of illiquid investments if doing so would result in a fund holding more than 15% of its net assets in illiquid investments that are assets. The Program includes provisions reasonably designed to determine, periodically review and comply with the HLIM requirement, as applicable, and to comply with the 15% limit on illiquid investments.
There can be no assurance that the Program will achieve its objectives under all circumstances in the future. Please refer to the ETF Allocation Funds' prospectus for more information regarding the ETF Allocation Funds' exposure to liquidity risk and other risks to which it may be subject.
| Mainstay ETF Asset Allocation Funds |
Federal Income Tax
Information (Unaudited)
The ETF Allocation Funds are required under the Internal Revenue Code to advise shareholders in a written statement as to the federal tax status of dividends paid by the ETF Allocation Funds during such fiscal years.
Accordingly, the ETF Allocation Funds paid the following as long term capital gain distributions.
MainStay Defensive ETF Allocation Fund | |
MainStay Conservative ETF Allocation Fund | |
MainStay Moderate ETF Allocation Fund | |
MainStay Growth ETF Allocation Fund | |
MainStay Equity ETF Allocation Fund | |
MainStay ESG Multi-Asset Allocation Fund | |
For the fiscal period ended April 30, 2022, the ETF Allocation Funds designated approximately the following amounts under the Internal Revenue Code as qualified dividend income eligible for reduced tax rates.
| |
MainStay Defensive ETF Allocation Fund | |
MainStay Conservative ETF Allocation Fund | |
MainStay Moderate ETF Allocation Fund | |
MainStay Growth ETF Allocation Fund | |
MainStay Equity ETF Allocation Fund | |
MainStay ESG Multi-Asset Allocation Fund | |
The dividends paid by the following ETF Allocation Funds during the fiscal period ended April 30, 2022 which are not designated as capital gain distributions should be multiplied by the following percentages to arrive at the amount eligible for the corporate dividend received deduction.
| |
MainStay Defensive ETF Allocation Fund | |
MainStay Conservative ETF Allocation Fund | |
MainStay Moderate ETF Allocation Fund | |
MainStay Growth ETF Allocation Fund | |
MainStay Equity ETF Allocation Fund | |
MainStay ESG Multi-Asset Allocation Fund | |
The list of qualified Fund of Funds passing through foreign tax credits for the tax period ended April 30, 2022 is listed below.
| |
MainStay Defensive ETF Allocation Fund | |
MainStay Conservative ETF Allocation Fund | |
MainStay Moderate ETF Allocation Fund | |
MainStay Growth ETF Allocation Fund | |
MainStay Equity ETF Allocation Fund | |
MainStay ESG Multi-Asset Allocation Fund | |
In February 2023, shareholders will receive an IRS Form 1099-DIV or substitute Form 1099, which will show the federal tax status of the distributions received by shareholders in calendar year 2022. The amounts that will be reported on such 1099-DIV or substitute Form 1099 will be the amounts you are to use on your federal income tax return and will differ from the amounts which we must report for the ETF Allocation Funds' fiscal period ended April 30, 2022.
Proxy Voting Policies and Procedures and Proxy Voting Record
Each ETF Allocation Fund is required to file with the SEC its proxy voting record for the 12-month period ending June 30 on Form N-PX. A description of the policies and procedures that are used to vote proxies relating to portfolio securities of each ETF Allocation Fund is available free of charge upon request by calling 800-624-6782 or visiting the SEC’s website at www.sec.gov. The most recent Form N-PX or proxy voting record is available free of charge upon request by calling 800-624-6782; visiting newyorklifeinvestments.com; or visiting the SEC’s website at www.sec.gov.
Shareholder Reports and Quarterly Portfolio Disclosure
Each ETF Allocation Fund is required to file its complete schedule of portfolio holdings with the SEC 60 days after its first and third fiscal quarter on Form N-PORT. The ETF Allocation Funds' holdings report is available free of charge upon request by calling New York Life Investments at 800-624-6782.
Board of Trustees and Officers (Unaudited)
The Trustees and officers of the Funds are listed below. The Board oversees the MainStay Group of Funds (which consists of MainStay Funds and MainStay Funds Trust), MainStay VP Funds Trust, MainStay MacKay DefinedTerm Municipal Opportunities Fund, MainStay CBRE Global Infrastructure Megatrends Fund, the Manager and the Subadvisors, and elects the officers of the Funds who are responsible for the day-to-day operations of the Funds. Information pertaining to the Trustees and officers is set forth below. Each Trustee serves until his or her successor is elected and qualified or until his or her resignation, death or removal. Under the Board’s retirement policy, unless an exception is made, a
Trustee must tender his or her resignation by the end of the calendar year during which he or she reaches the age of 75. Mr. Nolan reached the age of 75 during the calendar year 2021. Accordingly, Mr. Nolan retired at the end of calendar year 2021, at which time, Ms. Hammond became a Trustee of the Funds. Officers are elected annually by the Board. The business address of each Trustee and officer listed below is 51 Madison Avenue, New York, New York 10010. A majority of the Trustees are not “interested persons” (as defined by the 1940 Act and rules adopted by the SEC thereunder) of the Funds (“Independent Trustees”).
| | Term of Office,
Position(s) Held and
Length of Service | Principal Occupation(s)
During Past Five Years | Number of
Portfolios in
Fund Complex
Overseen by
Trustee | Other Directorships
Held by Trustee |
| | | | | |
| | MainStay Funds: Trustee
since 2017;
MainStay Funds Trust:
Trustee since 2017 | Senior Vice President of New York Life since joining in 2010, Member of the Executive Management Committee since 2017, Chief Executive Officer, New York Life Investment Management Holdings LLC & New York Life Investment Management LLC since 2015. Senior Managing Director and Co-President of New York Life Investment Management LLC from January 2014 to May 2015. Previously held positions of increasing responsibility, including head of NYLIM International, Alternative Growth Businesses, and Institutional investments since joining New York Life in 2010 | | MainStay VP Funds Trust:
Trustee since 2017 (31 portfolios);
MainStay MacKay DefinedTerm Municipal Opportunities Fund: Trustee
since 2017;
MainStay CBRE Global Infrastructure Megatrends Fund: Trustee
since March 2021; and
Turtle Beach Corporation: Director since April 2021 |
*
This Trustee is considered to be an “interested person” of the MainStay Group of Funds, MainStay VP Funds Trust, MainStay CBRE Global Infrastructure Megatrends Fund and MainStay MacKay DefinedTerm Municipal Opportunities Fund, within the meaning of the 1940 Act because of her affiliation with New York Life Insurance Company, New York Life Investment Management LLC, Candriam Belgium S.A., Candriam Luxembourg S.C.A., IndexIQ Advisors LLC, MacKay Shields LLC, NYL Investors LLC, NYLIFE Securities LLC and/or NYLIFE Distributors LLC, as described in detail above in the column entitled “Principal Occupation(s) During Past Five Years.”
| Mainstay ETF Asset Allocation Funds |
| | Term of Office,
Position(s) Held and
Length of Service | Principal Occupation(s)
During Past Five Years | Number of
Portfolios in
Fund Complex
Overseen by
Trustee | Other Directorships
Held by Trustee |
| | | | | |
| | MainStay Funds: Trustee since 2016, Advisory Board Member (June 2015 to December 2015);
MainStay Funds Trust: Trustee since 2016, Advisory Board Member (June 2015 to December 2015) | Founder and CEO, DanCourt Management, LLC since 1999 | | MainStay VP Funds Trust: Trustee since 2016, Advisory Board Member (June 2015 to December 2015) (31 portfolios);
MainStay MacKay DefinedTerm Municipal Opportunities Fund: Trustee since 2016, Advisory Board Member (June 2015 to December 2015);
MainStay CBRE Global Infrastructure Megatrends Fund: Trustee since June 2021; VanEck Vectors Group of Exchange-Traded Funds: Independent Chairman of the Board of Trustees since 2008 and Trustee since 2006 (56 portfolios); and Berea College of Kentucky: Trustee since 2009, Chair of the Investment Committee since 2018 |
| | MainStay Funds: Chairman since 2017 and Trustee since 2007;
MainStay Funds Trust: Chairman since 2017 and Trustee since 1990** | President, Strategic Management Advisors LLC since 1990 | | MainStay VP Funds Trust: Chairman since January 2017 and Trustee since 2007 (31 portfolios)***;
MainStay MacKay DefinedTerm Municipal Opportunities Fund: Chairman since 2017 and Trustee since 2011;
MainStay CBRE Global Infrastructure Megatrends Fund: Trustee since June 2021; and Legg Mason Partners Funds: Trustee since 1991 (45 portfolios) |
| | MainStay Funds: Trustee since 2006;
MainStay Funds Trust: Trustee since 2007** | Retired; Partner, Ernst & Young LLP (2002 to 2003); Partner, Arthur Andersen LLP (1989 to 2002); Consultant to the MainStay Funds Audit and Compliance Committee (2004 to 2006) | | MainStay VP Funds Trust: Trustee since 2007 (31 portfolios)***;
MainStay MacKay DefinedTerm Municipal Opportunities Fund: Trustee since 2011; and
MainStay CBRE Global Infrastructure Megatrends Fund: Trustee since June 2021 |
| Richard H. Nolan, Jr.
1946**** | MainStay Funds: Trustee since 2007;
MainStay Funds Trust: Trustee since 2007** | Managing Director, ICC Capital Management since 2004; President—Shields/Alliance, Alliance Capital Management (1994 to 2004) | | MainStay VP Funds Trust: Trustee since 2006 (31 portfolios)***;
MainStay MacKay DefinedTerm Municipal Opportunities Fund: Trustee since 2011; and
MainStay CBRE Global Infrastructure Megatrends Fund: Trustee since June 2021 |
Board of Trustees and Officers (Unaudited) (continued)
| | Term of Office, Position(s) Held and Length of Service | Principal Occupation(s) During Past Five Years | Number of Portfolios in Fund Complex Overseen by Trustee | Other Directorships Held by Trustee |
| | | | | |
| | MainStay Funds: Trustee since December 2021, Advisory Board Member (June 2021 to December 2021);
MainStay Funds Trust:
Trustee since December 2021, Advisory Board Member (June 2021 to December 2021)
| Retired, Managing Director, Devonshire Investors (2007 to 2013); Senior Vice President, Fidelity Management & Research Co. (2005 to 2007); Senior Vice President and Corporate Treasurer, FMR Corp. (2003 to 2005); Chief Operating Officer, Fidelity Investments Japan (2001 to 2003) | | MainStay VP Funds Trust: Trustee since December 2021, Advisory Board Member (June 2021 to December 2021) (31 Portfolios);
MainStay MacKay DefinedTerm Municipal Opportunities Fund: Trustee since December 2021, Advisory Board Member (June 2021 to December 2021);
MainStay CBRE Global Infrastructure Megatrends Fund: Trustee since December 2021, Advisory Board Member (June 2021 to December 2021);
Two Harbors Investment Corp.: Member since 2018, Chair of the Special Committee since 2019;
Rhode Island School of Design: Director and Chair of the Finance Committee since 2015; and
Blue Cross Blue Shield of Rhode Island: Director since 2019 |
| | MainStay Funds: Trustee since 2016, Advisory Board Member (June 2015 to December 2015);
MainStay Funds Trust: Trustee since 2016, Advisory Board Member (June 2015 to December 2015) | Founder and Chief Executive Officer, CapShift Advisors LLC since 2018; President, Fidelity Management & Research Company (2009 to 2014); President and Chief Investment Officer, Geode Capital Management, LLC (2001 to 2009) | | MainStay VP Funds Trust: Trustee since 2016, Advisory Board Member (June 2015 to December 2015) (31 portfolios);
MainStay MacKay DefinedTerm Municipal Opportunities Fund: Trustee since 2016, Advisory Board Member (June 2015 to December 2015);
MainStay CBRE Global Infrastructure Megatrends Fund: Trustee since June 2021; Partners in Health: Trustee since 2019; Allstate Corporation: Director since 2015; and MSCI, Inc.: Director since 2017 |
| | MainStay Funds: Trustee since 1994;
MainStay Funds Trust: Trustee since 2007** | Chairman and Chief Executive Officer, Somerset & Company (financial advisory firm) since 2004; Managing Director, The Carlyle Group (private investment firm) (2002 to 2004); Senior Managing Director, Partner and Board Member, Groupe Arnault S.A. (private investment firm) (1999 to 2002)
| | MainStay VP Funds Trust: Trustee since 2007 (31 portfolios)***;
MainStay MacKay DefinedTerm Municipal Opportunities Fund: Trustee since 2011; and MainStay CBRE Global Infrastructure Megatrends Fund; Trustee since June 2021 |
**
Includes prior service as a Director/Trustee of certain predecessor entities to MainStay Funds Trust.
***
Includes prior service as a Director of MainStay VP Series Fund, Inc., the predecessor to MainStay VP Funds Trust.
****
Pursuant to the Board's retirement policy, Mr. Nolan retired from the Board effective December 31, 2021.
| Mainstay ETF Asset Allocation Funds |
| | Position(s) Held and
Length of Service | Principal Occupation(s)
During Past Five Years | |
| | | | |
| | President, MainStay Funds, MainStay Funds Trust since 2017 | Chief Operating Officer and Senior Managing Director since 2016, New York Life Investment Management LLC and New York Life Investment Management Holdings LLC; Member of the Board of Managers (since 2017) and Senior Managing Director (since 2018), NYLIFE Distributors LLC; Chairman of the Board and Senior Managing Director, NYLIM Service Company LLC since 2017; Trustee, President and Principal Executive Officer of IndexIQ Trust, IndexIQ ETF Trust and IndexIQ Active ETF Trust since January 2018; President, MainStay MacKay DefinedTerm Municipal Opportunities Fund and MainStay VP Funds Trust since 2017** and MainStay CBRE Global Infrastructure Megatrends Fund since 2021; Senior Managing Director, Global Product Development (2015 to 2016); Managing Director, Product Development (2010 to 2015), New York Life Investment Management LLC | |
| | Treasurer and Principal Financial and Accounting Officer, MainStay Funds since 2007, MainStay Funds Trust since 2009 | Managing Director, New York Life Investment Management LLC since 2007; Treasurer and Principal Financial and Accounting Officer, MainStay MacKay DefinedTerm Municipal Opportunities Fund since 2011, MainStay VP Funds Trust since 2007** and MainStay CBRE Global Infrastructure Megatrends Fund since 2021; and Assistant Treasurer, New York Life Investment Management Holdings LLC (2008 to 2012) | |
| | Secretary and Chief Legal Officer, MainStay Funds and MainStay Funds Trust since 2010 | Managing Director and Associate General Counsel, New York Life Investment Management LLC since 2010; Secretary and Chief Legal Officer, MainStay MacKay DefinedTerm Municipal Opportunities Fund since 2011, MainStay VP Funds Trust since 2010** and MainStay CBRE Global Infrastructure Megatrends Fund since 2021 | |
| | Vice President— Administration, MainStay Funds since 2005, MainStay Funds Trust since 2009 | Managing Director, New York Life Investment Management LLC (including predecessor advisory organizations) since 2000; Member of the Board of Directors, New York Life Trust Company since 2009; Vice President—Administration, MainStay MacKay DefinedTerm Municipal Opportunities Fund since 2011, MainStay VP Funds Trust since 2005** and MainStay CBRE Global Infrastructure Megatrends Fund since 2021 | |
| | Vice President and Chief Compliance Officer, MainStay Funds and MainStay Funds Trust since 2021 and 2014 to 2020 | Vice President and Chief Compliance Officer, New York Life Investments Alternatives LLC and New York Life Investment Management Holdings LLC (since 2020); Vice President (since 2018) and Chief Compliance Officer (since 2016), New York Life Investment Management LLC; Vice President and Chief Compliance Officer, IndexIQ Advisors LLC, IndexIQ Holdings Inc., IndexIQ LLC and IndexIQ Trust (since 2017); Director and Associate General Counsel (2011 to 2014) and Vice President and Assistant General Counsel (2010 to 2011), New York Life Investment Management LLC; Vice President and Chief Compliance Officer, MainStay VP Funds Trust and MainStay MacKay DefinedTerm Municipal Opportunities Fund (since June 2021 and 2014 to 2020) and MainStay CBRE Global Infrastructure Megatrends Fund (since 2021); Assistant Secretary, MainStay Funds, MainStay Funds Trust and MainStay VP Funds Trust (2010 to 2014)**, MainStay MacKay DefinedTerm Municipal Opportunities Fund (2011 to 2014) | |
*
The officers listed above are considered to be “interested persons” of the MainStay Group of Funds, MainStay VP Funds Trust, MainStay CBRE Global Infrastructure Megatrends Fund and MainStay MacKay DefinedTerm Municipal Opportunities Fund within the meaning of the 1940 Act because of their affiliation with the MainStay Group of Funds, New York Life Insurance Company and/or its affiliates, including New York Life Investment Management LLC, NYLIM Service Company LLC, NYLIFE Securities LLC and/or NYLIFE Distributors LLC, as described in detail in the column captioned “Principal Occupation(s) During Past Five Years.” Officers are elected annually by the Board.
**
Includes prior service as an Officer of MainStay VP Series Fund, Inc., the predecessor to MainStay VP Funds Trust.
Officers of the Trust (Who are not Trustees)*
This page intentionally left blank.
This page intentionally left blank.
This page intentionally left blank.
Equity
U.S. Equity
MainStay Epoch U.S. Equity Yield Fund
MainStay S&P 500 Index Fund1
MainStay Winslow Large Cap Growth Fund
MainStay WMC Enduring Capital Fund
MainStay WMC Growth Fund
MainStay WMC Small Companies Fund
MainStay WMC Value Fund
International Equity
MainStay Epoch International Choice Fund
MainStay MacKay International Equity Fund
MainStay WMC International Research Equity Fund
Emerging Markets Equity
MainStay Candriam Emerging Markets Equity Fund
Global Equity
MainStay Epoch Capital Growth Fund
MainStay Epoch Global Equity Yield Fund
Fixed Income
Taxable Income
MainStay Candriam Emerging Markets Debt Fund
MainStay Floating Rate Fund
MainStay MacKay High Yield Corporate Bond Fund
MainStay MacKay Short Duration High Yield Fund
MainStay MacKay Strategic Bond Fund
MainStay MacKay Total Return Bond Fund
MainStay MacKay U.S. Infrastructure Bond Fund
MainStay Short Term Bond Fund
Tax-Exempt Income
MainStay MacKay California Tax Free Opportunities Fund2
MainStay MacKay High Yield Municipal Bond Fund
MainStay MacKay New York Tax Free Opportunities Fund3
MainStay MacKay Short Term Municipal Fund
MainStay MacKay Strategic Municipal Allocation Fund4
MainStay MacKay Tax Free Bond Fund
Money Market
MainStay Money Market Fund
Mixed Asset
MainStay Balanced Fund
MainStay Income Builder Fund
MainStay MacKay Convertible Fund
Speciality
MainStay CBRE Global Infrastructure Fund
MainStay CBRE Real Estate Fund
MainStay Cushing MLP Premier Fund
Asset Allocation
MainStay Conservative Allocation Fund
MainStay Conservative ETF Allocation Fund
MainStay Defensive ETF Allocation Fund
MainStay Equity Allocation Fund
MainStay Equity ETF Allocation Fund
MainStay ESG Multi-Asset Allocation Fund
MainStay Growth Allocation Fund
MainStay Growth ETF Allocation Fund
MainStay Moderate Allocation Fund
MainStay Moderate ETF Allocation Fund
Manager
New York Life Investment Management LLC
New York, New York
Subadvisors
Candriam Belgium S.A.5
Brussels, Belgium
Candriam Luxembourg S.C.A.5
Strassen, Luxembourg
CBRE Investment Management Listed Real Assets LLC
Radnor, Pennsylvania
Cushing Asset Management, LP
Dallas, Texas
Epoch Investment Partners, Inc.
New York, New York
MacKay Shields LLC5
New York, New York
NYL Investors LLC5
New York, New York
Wellington Management Company LLP
Boston, Massachusetts
Winslow Capital Management, LLC
Minneapolis, Minnesota
Legal Counsel
Dechert LLP
Washington, District of Columbia
Independent Registered Public Accounting Firm
KPMG LLP
Philadelphia, Pennsylvania
Distributor
NYLIFE Distributors LLC5
Jersey City, New Jersey
Custodian
JPMorgan Chase Bank, N.A.
New York, New York
1. Prior to February 28, 2022, the Fund's name was MainStay MacKay S&P 500 Index Fund.
2. This Fund is registered for sale in AZ, CA, NV, OR, TX, UT, WA and MI (Class A and Class I shares only), and CO, FL, GA, HI, ID, MA, MD, NH, NJ and NY (Class I shares only).
3. This Fund is registered for sale in CA, CT, DE, FL, MA, NJ, NY and VT.
4. Prior to November 30, 2021, the Fund's name was MainStay MacKay Intermediate Tax Free Bond Fund.
5. An affiliate of New York Life Investment Management LLC.
Not part of the Annual Report
For more information
800-624-6782
newyorklifeinvestments.com
“New York Life Investments” is both a service mark, and the common trade name, of certain investment advisors affiliated with New York Life Insurance Company. The MainStay Funds® are managed by New York Life Investment Management LLC and distributed by NYLIFE Distributors LLC, 30 Hudson Street, Jersey City, NJ 07302, a wholly owned subsidiary of New York Life Insurance Company. NYLIFE Distributors LLC is a Member FINRA/SIPC.
©2022 NYLIFE Distributors LLC. All rights reserved.
1900828MS086-22
MSAAETF11-06/22
(NYLIM) NL486
MainStay MacKay Short Term Municipal Fund
Message from the President and Annual ReportApril 30, 2022
Sign up for e-delivery of your shareholder reports. For full details on e-delivery, including who can participate and what you can receive via e-delivery,
please log in to newyorklifeinvestments.com/accounts.
| | | | Not Insured by Any Government Agency |
This page intentionally left blank
Message from the President
The 12-month reporting period ended April 30, 2022, started on a generally positive note. Despite a new wave of COVID-19 infections that disrupted life and commerce, financial markets were buoyed during the spring and summer of 2021 by economic recovery and the widespread availability of vaccines. Most global economies expanded, exceeding pre-pandemic levels, as businesses reopened and supportive government policies bore fruit. As the period progressed, however, inflation began to creep up in response to government stimulus and accommodative monetary policies. Rising prices were further aggravated by wage increases, pandemic-related supply-chain bottlenecks and commodity price spikes. Bond prices slid as interest rates rose, and equity markets faltered. Market sentiment turned increasingly negative in the first quarter of 2022 as aggressive Russian rhetoric regarding Ukraine culminated in Russia’s invasion of its neighbor – a development that exacerbated global inflationary pressures while increasing investor uncertainty. Domestic supply shortages, international trade imbalances and rising inflation caused U.S. GDP (gross domestic product) to contract for the first time since the height of the pandemic, although consumer spending, a primary driver of U.S. economic growth, remained strong. Prices for petroleum surged to multi-year highs, while many key agricultural chemicals and industrial metals reached record territory.
Despite the market decline that greeted the first four months of 2022, the S&P 500® Index, a widely regarded benchmark of market performance, remained in modestly positive territory for the 12-month reporting period. Some market sectors benefited from the prevailing conditions, with energy stocks soaring and value-oriented shares broadly gaining ground. In addition to energy, leading sectors included utilities and consumer staples. On the other hand, the information technology, financials and consumer discretionary sectors were subject to particularly sharp losses. Small- and mid-cap stocks underperformed, as they often do during times of heightened uncertainty and financial stress. International stocks trended lower, with some emerging markets,
including Russia and China, suffering particularly steep losses, while others, such as India and Indonesia, gained ground. Fixed-income markets saw most bond prices fall as central banks contemplated significant interest rate rises to combat higher-than-previously-expected inflation rates late in the reporting period. However, floating-rate instruments, which feature variable interest rates that allow investors to benefit from a rising rate environment, bucked the downward trend.
Today, despite the continuing impact of COVID-19, most of the world appears intent on a return to post-pandemic normalcy. Instead, the focus of global political and economic attention has increasingly turned to the war in Ukraine and the impact of rising inflation. Together, Russia and Ukraine account for a substantial share of the world’s supply of food, fossil fuels and raw materials production. Accordingly, the timing and outcome of this conflict will undoubtedly play a major role in global economic developments over the coming months and, possibly, years. The actions of central banks, as they raise rates to fight inflation while trying to limit the risks of recession, are likely to further affect global markets and economies.
As a MainStay investor, you can depend on us to carefully watch developments that may affect your Fund, taking considered and appropriate action to help you stay on financial track in the midst of uncertain times. As always, we remain dedicated to providing you with the disciplined investment tools you have come to expect from us over the years. Thank you for continuing to place your trust in our team.
Sincerely,
Kirk C. Lehneis
President
The opinions expressed are as of the date of this report and are subject to change. There is no guarantee that any forecast made will come to pass. This material does not constitute investment advice and is not intended as an endorsement of any specific investment. Past performance is no guarantee of future results.
Not part of the Annual Report
Investors should refer to the Fund’s Summary Prospectus and/or Prospectus and consider the Fund’s investment objectives, strategies, risks, charges and expenses carefully before investing. The Summary Prospectus and/or Prospectus contain this and other information about the Fund. You may obtain copies of the Fund’s Summary Prospectus, Prospectus and Statement of Additional Information, which includes information about MainStay Funds Trust's Trustees, free of charge, upon request, by calling toll-free 800-624-6782, by writing to NYLIFE Distributors LLC, Attn: MainStay Marketing Department, 30 Hudson Street, Jersey City, NJ 07302 or by sending an e-mail to MainStayShareholderServices@nylim.com. These documents are also available via the MainStay Funds’ website at newyorklifeinvestments.com. Please read the Fund’s Summary Prospectus and/or Prospectus carefully before investing.
Investment and Performance Comparison (Unaudited)
Performance data quoted represents past performance. Past performance is no guarantee of future results. Because of market volatility and other factors, current performance may be lower or higher than the figures shown. Investment return and principal value will fluctuate, and as a result, when shares are redeemed, they may be worth more or less than their original cost. The graph below depicts the historical performance of Class I shares of the Fund. Performance will vary from class to class based on differences in class-specific expenses and sales charges. For performance information current to the most recent month-end, please call 800-624-6782 or visit newyorklifeinvestments.com.
The performance table and graph do not reflect the deduction of taxes that a shareholder would pay on distributions or Fund share redemptions. Total returns reflect maximum applicable sales charges as indicated in the table below, if any, changes in share price, and reinvestment of dividend and capital gain distributions. The graph assumes the initial investment amount shown below and reflects the deduction of all sales charges that would have applied for the period of investment. Performance figures may reflect certain fee waivers and/or expense limitations, without which total returns may have been lower. For more information on share classes and current fee waivers and/or expense limitations (if any), please refer to the Notes to Financial Statements.
Average Annual Total Returns for the Year-Ended April 30, 2022 |
| | | | | | Ten Years
or Since
Inception | |
| Maximum 1% Initial Sales Charge | | | | | | |
| | | | | | | |
| Maximum 2% Initial Sales Charge | | | | | | |
| | | | | | | |
Investor Class Shares3, 4 | Maximum .5% Initial Sales Charge | | | | | | |
| | | | | | | |
| | | | | | | |
| Effective June 1, 2015, the Fund changed, among other things, its investment objective and principal investment strategies. Effective May 22, 2018, the Fund made further changes to, among other things, its principal investment strategies. Effective February 28, 2019, the Fund further changed its investment objective. The performance information shown in this report reflects the Fund’s prior investment objectives and principal investment strategies, as applicable. |
| The gross expense ratios presented reflect the Fund’s “Total Annual Fund Operating Expenses” from the most recent Prospectus, as supplemented, and may differ from other expense ratios disclosed in this report. |
| Prior to June 1, 2015, the maximum initial sales charge was 3.00%, which is reflected in the applicable average annual total return figures shown. |
| From June 1, 2015 to June 30, 2020, the maximum initial sales charge was 1.0%, which is reflected in the applicable average annual total return figures shown. |
The footnotes on the next page are an integral part of the table and graph and should be carefully read in conjunction with them.
| | | |
Bloomberg 3-Year Municipal Bond Index1 | | | |
Morningstar Muni National Short Category Average2 | | | |
| Returns for indices reflect no deductions for fees, expenses or taxes, except for foreign withholding taxes where applicable. |
| The Bloomberg 3-Year Municipal Bond Index is the Fund's primary broad-based securities-market index for comparison purposes. The Barclays 3-Year Municipal Bond Index is considered representative of the broad-based market for investment grade, tax-exempt bonds with a maturity range of 2-4 years. Results assume reinvestment of all dividends and capital gains. An investment cannot be made directly into an index. |
| The Morningstar Muni National Short Category Average is representative of funds that invest in bonds issued by state and local governments to fund public projects. The income from these bonds is generally free from federal taxes and/or from state taxes in the issuing state. To lower risk, some of these portfolios spread their assets across many states and sectors. Other portfolios buy bonds from only one state in order to get the state-tax benefit. These portfolios have durations of less than 4.5 years. Results are based on average total returns of similar funds with all dividends and capital gain distributions reinvested. |
The footnotes on the preceding page are an integral part of the table and graph and should be carefully read in conjunction with them.
| MainStay MacKay Short Term Municipal Fund |
Cost in Dollars of a $1,000 Investment in MainStay MacKay Short Term Municipal Fund (Unaudited)
The example below is intended to describe the fees and expenses borne by shareholders during the six-month period from November 1, 2021 to April 30, 2022, and the impact of those costs on your investment.
Example
As a shareholder of the Fund you incur two types of costs: (1) transaction costs, including exchange fees and sales charges (loads) on purchases (as applicable), and (2) ongoing costs, including management fees, distribution and/or service (12b-1) fees and other Fund expenses (as applicable). This example is intended to help you understand your ongoing costs (in dollars) of investing in the Fund and to compare these costs with the ongoing costs of investing in other mutual funds. The example is based on an investment of $1,000 made at the beginning of the six-month period and held for the entire period from November 1, 2021 to April 30, 2022.
This example illustrates your Fund’s ongoing costs in two ways:
Actual Expenses
The second and third data columns in the table below provide information about actual account values and actual expenses. You may use the information in these columns, together with the amount you invested, to estimate the expenses that you paid during the six months ended April 30, 2022. Simply divide your account value by $1,000 (for example, an
$8,600 account value divided by $1,000 = 8.6), then multiply the result by the number under the heading entitled “Expenses Paid During Period” to estimate the expenses you paid on your account during this period.
Hypothetical Example for Comparison Purposes
The fourth and fifth data columns in the table below provide information about hypothetical account values and hypothetical expenses based on the Fund’s actual expense ratio and an assumed rate of return of 5% per year before expenses, which is not the Fund’s actual return. The hypothetical account values and expenses may not be used to estimate the actual ending account balances or expenses you paid for the six-month period shown. You may use this information to compare the ongoing costs of investing in the Fund with the ongoing costs of investing in other mutual funds. To do so, compare this 5% hypothetical example with the 5% hypothetical examples that appear in the shareholder reports of the other mutual funds.
Please note that the expenses shown in the table are meant to highlight your ongoing costs only and do not reflect any transactional costs, such as exchange fees or sales charges (loads). Therefore, the fourth and fifth data columns of the table are useful in comparing ongoing costs only and will not help you determine the relative total costs of owning different funds. In addition, if these transactional costs were included, your costs would have been higher.
| Beginning
Account
Value
11/1/21 | Ending Account
Value (Based
on Actual
Returns and
Expenses)
4/30/22 | | Ending Account
Value (Based
on Hypothetical
5% Annualized
Return and
Actual Expenses)
4/30/22 | | |
| | | | | | |
| | | | | | |
| | | | | | |
| | | | | | |
| Expenses are equal to the Fund’s annualized expense ratio of each class multiplied by the average account value over the period, divided by 365 and multiplied by 181 (to reflect the six-month period). The table above represents the actual expenses incurred during the six-month period. In addition to the fees and expenses which the Fund bears directly, it also indirectly bears a pro rata share of the fees and expenses of the underlying funds in which it invests. Such indirect expenses are not included in the above-reported expense figures. |
| Expenses are equal to the Fund's annualized expense ratio to reflect the six-month period. |
Portfolio Composition as of April 30, 2022 (Unaudited)
See Portfolio of Investments beginning on page 11 for specific holdings within these categories. The Fund's holdings are subject to change.
Top Ten Holdings and/or Issuers Held as of April 30, 2022 (excluding short-term investments) (Unaudited)
| Metropolitan Transportation Authority, 0.738%-5.25%, due 5/15/22–11/1/32 |
| State of Illinois, 4.00%-6.00%, due 5/1/22–11/1/28 |
| Black Belt Energy Gas District, 0.79%-4.00%, due 8/1/47–4/1/53 |
| Louisiana Stadium & Exposition District, 1.872%-5.00%, due 7/1/22–7/1/25 |
| New York Transportation Development Corp., 5.00%, due 1/1/23–12/1/29 |
| County of King WA, 0.67%, due 1/1/40 |
| Matching Fund Special Purpose Securitization Corp., 5.00%, due 10/1/25–10/1/26 |
| Illinois Finance Authority, 1.14%-5.00%, due 9/1/22–1/1/46 |
| Texas Municipal Gas Acquisition & Supply Corp. II, 1.235%, due 9/15/27 |
| Ohio Air Quality Development Authority, 2.10%-2.50%, due 10/1/28–11/1/42 |
| MainStay MacKay Short Term Municipal Fund |
Portfolio Management Discussion and Analysis (Unaudited)
Questions answered by portfolio managers John Loffredo, CFA, Robert DiMella, CFA, Michael Petty, David Dowden, Scott Sprauer, Frances Lewis and John Lawlor of MacKay Shields LLC, the Fund’s Subadvisor.
How did MainStay MacKay Short Term Municipal Fund perform relative to its benchmark and peer group during the 12 months ended April 30, 2022?
For the 12 months ended April 30, 2022, Class I shares of MainStay MacKay Short Term Municipal Fund returned −3.55%, outperforming the −4.50% return of the Fund’s benchmark, the Bloomberg 3-Year Municipal Bond Index (the Index). Over the same period, Class I shares underperformed the −3.35% return of the Morningstar Muni National Short Category Average.1
What factors affected the Fund’s relative performance during the reporting period?
During the reporting period, the Fund outperformed the Index due to yield curve2 positioning and security selections. The Fund’s underweight allocation to bonds rated AAA and AA also made a positive contribution to relative performance, as did underweight exposure to bonds from California and New York.3 (Contributions take weightings and total returns into account.) Conversely, holdings from Illinois offset some of these positive results.
During the reporting period, were there any market events that materially impacted the Fund’s performance or liquidity?
During the last four months of the reporting period, municipal bond yields rose sharply with rising interest rates. The market began to sell off due to higher inflation and the expectation, and subsequent confirmation, that the U.S. Federal Reserve would seek to tighten monetary conditions at a faster pace than previously expected. This contributed to a flattening of the municipal yield curve as short-term yields rose more than longer-term yields. The municipal market began to see record high outflows and this tighter liquidity, combined with the rise in rates, led to negative absolute performance across all sectors.
During the reporting period, how was the Fund’s performance materially affected by investments in derivatives?
The Fund’s performance was not materially affected by investments in derivatives during the reporting period.
What was the Fund’s duration4 strategy during the reporting period?
As relative value investors, the team aims to maintain the Fund’s duration within a neutral range relative to that of the Index. As of April 30, 2022, the Fund's modified duration to worst5 was 2.06 years while the benchmark’s modified duration to worst was 2.47 years.
During the reporting period, which sectors were the strongest positive contributors to the Fund’s relative performance and which sectors were particularly weak?
During the reporting period, holdings in the prerefunded/ETM (escrowed to maturity), state general obligation and special tax sectors helped relative performance. Conversely, holdings in the local general obligation and IDR/PCR (industry development revenue/pollution control revenue) sectors detracted from relative results.
What were some of the Fund’s largest purchases and sales during the reporting period?
As the Fund remains focused on diversification and liquidity, no individual purchase or sale would have been considered significant, although sector overweights or security structure, in their entirety, did have an impact.
How did the Fund’s sector weighting change during the reporting period?
During the reporting period, there were no material changes to the weightings in the Fund. At the margin, there were increases to the
1.
See page 5 for other share class returns, which may be higher or lower than Class I share returns. See page 6 for more information on benchmark and peer group returns.
2.
The yield curve is a line that plots the yields of various securities of similar quality—typically U.S. Treasury issues—across a range of maturities. The U.S. Treasury yield curve serves as a benchmark for other debt and is used in economic forecasting.
3.
An obligation rated ‘AAA’ has the highest rating assigned by Standard & Poor’s (“S&P”), and in the opinion of S&P, the obligor’s capacity to meet its financial commitment on the obligation is extremely strong. An obligation rated ‘AA’ by S&P is deemed by S&P to differ from the highest-rated obligations only to a small degree. In the opinion of S&P, the obligor's capacity to meet its financial commitment on the obligation is very strong. When applied to Fund holdings, ratings are based solely on the creditworthiness of the bonds in the portfolio and are not meant to represent the security or safety of the Fund.
4.
Duration is a measure of the price sensitivity of a fixed-income investment to changes in interest rates. Duration is expressed as a number of years and is considered a more accurate sensitivity gauge than average maturity.
5.
Modified duration is inversely related to the approximate percentage change in price for a given change in yield. Duration to worst is the duration of a bond computed using the bond’s nearest call date or maturity, whichever comes first. This measure ignores future cash flow fluctuations due to embedded optionality.
Fund’s exposure to the water/sewer and education sectors. From a geographic perspective, there was an increase in exposure to the states of Alabama and Washington. In addition, there was an increase in exposure to bonds rated BBB.6 Conversely, the Fund decreased its sector exposure to local general obligation, prerefunded/ETM and leasing, as well as to New York and New Jersey holdings.
How was the Fund positioned at the end of the reporting period?
As of April 30, 2022, the Fund held overweight positions relative to the Index in the local general obligation and IDR/PCR sectors, in addition to the states of Illinois and New Jersey. As of the same date, the Fund held underweight exposure to the states of California and New York, and to the prerefunded/ETM and state general obligation sectors.
6.
An obligation rated ‘BBB’ by S&P is deemed by S&P to exhibit adequate protection parameters. In the opinion of S&P, however, adverse economic conditions or changing circumstances are more likely to lead to a weakened capacity of the obligor to meet its financial commitment on the obligation. When applied to Fund holdings, ratings are based solely on the creditworthiness of the bonds in the portfolio and are not meant to represent the security or safety of the Fund.
The opinions expressed are those of the portfolio managers as of the date of this report and are subject to change. There is no guarantee that any forecasts will come to pass. This material does not constitute investment advice and is not intended as an endorsement of any specific investment.
| MainStay MacKay Short Term Municipal Fund |
Portfolio of Investments April 30, 2022†
| | |
|
Long-Term Municipal Bonds 78.8% |
|
Alabama Community College System, Enhancements Fee, Revenue Bonds | | |
| | |
| | |
| | |
| | |
| | |
| | |
| | |
| | |
Alabama Community College System, Revenue Bonds | | |
| | |
| | |
| | |
| | |
Alabama Community College System, Wallace State Community College-Hanceville, Revenue Bonds | | |
| | |
| | |
| | |
| | |
| | |
| | |
Alabama Federal Aid Highway Finance Authority, Revenue Bonds | | |
| | |
| | |
Baldwin County Board of Education, Revenue Bonds | | |
| | |
Birmingham Airport Authority, Revenue Bonds | | |
| | |
| | |
| | |
| | |
Black Belt Energy Gas District, Revenue Bonds (a) | | |
| | |
| | |
| | |
| | |
| | |
|
|
Black Belt Energy Gas District, Project No.5, Revenue Bonds | | |
| | |
| | |
Black Belt Energy Gas District, Project No. 4, Revenue Bonds | | |
| | |
| | |
Black Belt Energy Gas District, Gas Project No.6, Revenue Bonds | | |
| | |
| | |
Black Belt Energy Gas District, Project No.7, Revenue Bonds | | |
| | |
| | |
City of Bessemer AL, Limited General Obligation | | |
| | |
| | |
| | |
| | |
| | |
| | |
| | |
| | |
| | |
| | |
| | |
| | |
City of Birmingham AL, Unlimited General Obligation | | |
| | |
| | |
| | |
| | |
City of Phenix City AL, Water & Sewer, Revenue Bonds | | |
| | |
| | |
Coosa Valley Water Supply District, Inc., Revenue Bonds | | |
| | |
| | |
| | |
| | |
The notes to the financial statements are an integral part of, and should be read in conjunction with, the financial statements.
Portfolio of Investments April 30, 2022† (continued)
| | |
Long-Term Municipal Bonds (continued) |
|
County of Dallas AL, Unlimited General Obligation | | |
| | |
(zero coupon), due 5/1/22 | | |
| | |
(zero coupon), due 5/1/23 | | |
| | |
(zero coupon), due 5/1/24 | | |
| | |
(zero coupon), due 5/1/25 | | |
County of Lowndes AL, Unlimited General Obligation | | |
| | |
| | |
Greenville Waterworks & Sewer Board, Revenue Bonds | | |
| | |
| | |
Lower Alabama Gas District (The), Gas Project, Project No. 2, Revenue Bonds | | |
| | |
| | |
Montgomery County Public Facilities Authority, Warrants County Facilities Project, Revenue Bonds | | |
| | |
Prichard Water Works & Sewer Board, Revenue Bonds | | |
| | |
Southeast Alabama Gas Supply District, Project No. 1, Revenue Bonds | | |
| | |
| | |
Southeast Alabama Gas Supply District (The), Project No. 2, Revenue Bonds | | |
| | |
| | |
| | |
| | |
Southeast Energy Authority, A Cooperative District, Project No. 1, Revenue Bonds | | |
| | |
| | |
| | |
|
|
Southeast Energy Authority, A Cooperative District, Project No. 1, Revenue Bonds (continued) | | |
| | |
| | |
Special Care Facilities Financing Authority of the City of Pell City Alabama, Noland Health Services, Inc., Revenue Bonds | | |
| | |
| | |
| | |
| | |
| | |
| | |
| | |
| | |
| | |
| | |
University of West Alabama, Revenue Bonds | | |
| | |
| | |
| | |
| | |
| | |
| | |
| | |
| | |
| | |
|
Alaska Industrial Development & Export Authority, Tanana Chiefs Conference Project, Revenue Bonds | | |
| | |
| | |
Northern Tobacco Securitization Corp., Tobacco Settlement Asset-Backed, Revenue Bonds, Senior Lien | | |
| | |
| | |
State of Alaska International Airports System, Revenue Bonds (b) | | |
| | |
| | |
The notes to the financial statements are an integral part of, and should be read in conjunction with, the financial statements.
| MainStay MacKay Short Term Municipal Fund |
| | |
Long-Term Municipal Bonds (continued) |
|
State of Alaska International Airports System, Revenue Bonds (b) (continued) | | |
| | |
| | |
| | |
| | |
| | |
| | |
| | |
| | |
| | |
|
City of Phoenix AZ, Downtown Phoenix Student Housing LLC, Revenue Bonds | | |
| | |
County of Pima AZ, Sewer System, Revenue Bonds | | |
| | |
| | |
Maricopa County Industrial Development Authority, Paradise Schools Project, Revenue Bonds | | |
| | |
| | |
Maricopa County Unified School District No. 090 Saddle Mountain, Unlimited General Obligation | | |
| | |
| | |
Northern Arizona University, Revenue Bonds | | |
| | |
| | |
Salt River Project Agricultural Improvement & Power District, Salt River Project, Electric System, Revenue Bonds | | |
| | |
Sedona Wastewater Municipal Property Corp., Capital Appreciation, Revenue Bonds | | |
| | |
(zero coupon), due 7/1/24 | | |
| | |
| | |
|
|
Alma School District No. 30, Limited General Obligation | | |
Series A, Insured: State Aid Withholding | | |
| | |
Series A, Insured: State Aid Withholding | | |
| | |
Series A, Insured: State Aid Withholding | | |
| | |
City of Fort Smith AR, Water & Sewer, Revenue Bonds | | |
| | |
| | |
City of Fort Smith AR, Sales & Use Tax, Revenue Bonds | | |
| | |
City of West Memphis AR, Public Utility System, Revenue Bonds | | |
| | |
| | |
| | |
| | |
County of St. Francis AR, Revenue Bonds | | |
| | |
| | |
| | |
|
Alameda Unified School District-Alameda County, Unlimited General Obligation | | |
| | |
(zero coupon), due 8/1/26 | | |
Alta Loma School District, Unlimited General Obligation | | |
Series B, Insured: NATL-RE | | |
(zero coupon), due 8/1/25 | | |
Antelope Valley Union High School District, Capital Appreciation, Election 2002, Unlimited General Obligation | | |
Series C, Insured: NATL-RE | | |
(zero coupon), due 8/1/25 | | |
The notes to the financial statements are an integral part of, and should be read in conjunction with, the financial statements.
Portfolio of Investments April 30, 2022† (continued)
| | |
Long-Term Municipal Bonds (continued) |
|
California Community Choice Financing Authority, Clean Energy Project, Green Bond, Revenue Bonds | | |
| | |
| | |
| | |
| | |
| | |
| | |
California County Tobacco Securitization Agency, Tobacco Settlement, Revenue Bonds, Senior Lien | | |
| | |
| | |
| | |
| | |
California Educational Facilities Authority, Loyola Marymount University, Revenue Bonds | | |
Series A, Insured: NATL-RE | | |
(zero coupon), due 10/1/22 | | |
California Educational Facilities Authority, Art Center College of Design, Revenue Bonds | | |
| | |
| | |
California Health Facilities Financing Authority, Lundquist Institute For Biomedical Innovation, Revenue Bonds | | |
| | |
| | |
California Municipal Finance Authority, NCROC Paradise Valley Estates Project, Revenue Bonds | | |
Insured: California Mortgage Insurance | | |
| | |
California Municipal Finance Authority, CHF-Davis I LLC - West Village Student Housing Project, Revenue Bonds | | |
| | |
| | |
| | |
|
|
California Municipal Finance Authority, LINXS APM Project, Revenue Bonds, Senior Lien (b) | | |
| | |
| | |
California School Finance Authority, Kipp SoCal Public Schools Project, Revenue Bonds (c) | | |
| | |
| | |
| | |
| | |
California State Public Works Board, Various Capital Projects, Revenue Bonds | | |
| | |
| | |
California State Public Works Board, Department of State Hospitals, Revenue Bonds | | |
| | |
Central Basin Municipal Water District, Revenue Bonds | | |
| | |
| | |
| | |
| | |
| | |
| | |
| | |
| | |
Chino Basin Regional Financing Authority, Revenue Bonds | | |
| | |
| | |
City of Fresno CA, Airport, Revenue Bonds | | |
| | |
| | |
City of Los Angeles CA, Department of Airports, Revenue Bonds (b) | | |
| | |
| | |
| | |
| | |
The notes to the financial statements are an integral part of, and should be read in conjunction with, the financial statements.
| MainStay MacKay Short Term Municipal Fund |
| | |
Long-Term Municipal Bonds (continued) |
|
City of Los Angeles CA, Department of Airports, Revenue Bonds, Senior Lien | | |
| | |
| | |
City of Montebello CA, Revenue Bonds | | |
| | |
| | |
City of Palm Springs CA, Airport Passenger Facility Charge, Revenue Bonds (b) | | |
| | |
| | |
| | |
| | |
| | |
City of Sacramento CA, Transient Occupancy Tax, Revenue Bonds | | |
| | |
| | |
| | |
| | |
| | |
| | |
| | |
| | |
City of Sacramento CA, Airport System, Revenue Bonds | | |
| | |
| | |
City of Vernon CA, Electric System, Revenue Bonds | | |
| | |
| | |
Clovis Unified School District, Capital Appreciation, Election 2004, Unlimited General Obligation | | |
Series A, Insured: NATL-RE | | |
(zero coupon), due 8/1/24 | | |
El Camino Healthcare District, Capital Appreciation, Unlimited General Obligation | | |
| | |
(zero coupon), due 8/1/26 | | |
| | |
|
|
Empire Union School District, Community Facilities District No. 1987-1, Special Tax | | |
| | |
(zero coupon), due 10/1/22 | | |
Foothill-Eastern Transportation Corridor Agency, Revenue Bonds, Senior Lien | | |
| | |
(zero coupon), due 1/1/27 | | |
Fullerton Redevelopment Agency, Tax Allocation | | |
| | |
| | |
Golden West Schools Financing Authority, Revenue Bonds | | |
Series A, Insured: NATL-RE | | |
| | |
Grossmont Union High School District, Election 2004, Unlimited General Obligation | | |
| | |
(zero coupon), due 8/1/26 | | |
Independent Cities Finance Authority, Sales Tax, Revenue Bonds (c) | | |
| | |
| | |
| | |
| | |
| | |
| | |
| | |
| | |
Kern Community College District, Facilities Improvement District No. 1, Unlimited General Obligation | | |
(zero coupon), due 8/1/23 | | |
Lakeside Union School District, Unlimited General Obligation | | |
| | |
| | |
Los Angeles Department of Water & Power System, Revenue Bonds | | |
| | |
| | |
The notes to the financial statements are an integral part of, and should be read in conjunction with, the financial statements.
Portfolio of Investments April 30, 2022† (continued)
| | |
Long-Term Municipal Bonds (continued) |
|
Los Angeles Unified School District, Unlimited General Obligation | | |
| | |
| | |
Madera Unified School District, Capital Appreciation, Election 2002, Unlimited General Obligation | | |
| | |
(zero coupon), due 8/1/25 | | |
Mammoth Unified School District, Unlimited General Obligation | | |
| | |
(zero coupon), due 8/1/26 | | |
Manteca Unified School District, Capital Appreciation, Election 2004, Unlimited General Obligation | | |
| | |
(zero coupon), due 8/1/25 | | |
Marysville Joint Unified School District, Energy Effeciency Projects, Green Bond, Certificate of Participation | | |
| | |
| | |
| | |
| | |
| | |
| | |
| | |
| | |
Merced Irrigation District Financing Authority, Revenue Bonds | | |
| | |
| | |
Mount Diablo Unified School District, Capital Appreciation, Election 2010, Unlimited General Obligation | | |
| | |
(zero coupon), due 8/1/25 (d) | | |
Norman Y Mineta San Jose International Airport SJC, Revenue Bonds | | |
| | |
| | |
| | |
|
|
North Coast County Water District, Certificate of Participation | | |
| | |
| | |
| | |
| | |
| | |
| | |
| | |
| | |
| | |
| | |
North Orange County Community College District, Capital, Appreciation, Election 2002, Unlimited General Obligation | | |
| | |
(zero coupon), due 8/1/22 | | |
Oakland Unified School District, Unlimited General Obligation | | |
| | |
| | |
Ontario International Airport Authority, Revenue Bonds | | |
| | |
| | |
Peninsula Corridor Joint Powers Board, Revenue Bonds | | |
| | |
| | |
| | |
| | |
Pittsburg Successor Agency Redevelopment Agency, Tax Allocation | | |
| | |
| | |
Port of Oakland, Revenue Bonds, Senior Lien | | |
| | |
| | |
Ripon Redevelopment Agency, Tax Allocation | | |
| | |
| | |
The notes to the financial statements are an integral part of, and should be read in conjunction with, the financial statements.
| MainStay MacKay Short Term Municipal Fund |
| | |
Long-Term Municipal Bonds (continued) |
|
Riverside County Asset Leasing Corp., Riverside County Hospital Project, Revenue Bonds | | |
| | |
(zero coupon), due 6/1/25 | | |
Riverside County Public Financing Authority, Project Area No. 1 Desert Communities & Interstate 215 Corridor Project, Tax Allocation | | |
| | |
| | |
Sacramento City Financing Authority, Capital Appreciation, Tax Allocation | | |
| | |
(zero coupon), due 12/1/23 | | |
Sacramento City Unified School District, Unlimited General Obligation | | |
| | |
| | |
San Bernardino County Redevelopment Agency Successor Agency, Tax Allocation | | |
| | |
| | |
San Diego County Regional Airport Authority, Revenue Bonds, Senior Lien | | |
| | |
| | |
San Diego County Regional Airport Authority, Revenue Bonds | | |
| | |
| | |
San Francisco City & County Airport Commission, San Francisco International Airport, Revenue Bonds, Second Series | | |
| | |
| | |
San Francisco City & County Airport Comm-San Francisco International Airport, Airpport Special Facilities, SFO Fuel Co. LLC, Revenue Bonds | | |
| | |
| | |
|
|
San Joaquin Hills Transportation Corridor Agency, Toll Road, Revenue Bonds | | |
Series A, Insured: NATL-RE | | |
(zero coupon), due 1/15/25 | | |
San Mateo County Community College District, Election 2005, Unlimited General Obligation | | |
Series A, Insured: NATL-RE | | |
(zero coupon), due 9/1/24 | | |
San Mateo County Community College District, Capital Appreciation, Election 2005, Unlimited General Obligation | | |
Series A, Insured: NATL-RE | | |
(zero coupon), due 9/1/26 | | |
San Ysidro School District, Capital Appreciation, Election 1997, Unlimited General Obligation | | |
Series D, Insured: NATL-RE | | |
(zero coupon), due 8/1/22 | | |
Series D, Insured: NATL-RE | | |
(zero coupon), due 8/1/25 | | |
San Ysidro School District, Unlimited General Obligation | | |
| | |
| | |
Santa Cruz City Elementary School District, Capital Appreciation, Election 1998, Unlimited General Obligation | | |
| | |
(zero coupon), due 2/1/23 | | |
Santa Cruz County Redevelopment Successor Agency, Tax Allocation | | |
| | |
| | |
Saugus Union School District, Unlimited General Obligation | | |
| | |
(zero coupon), due 8/1/22 | | |
State of California, Unlimited General Obligation | | |
| | |
| | |
| | |
| | |
The notes to the financial statements are an integral part of, and should be read in conjunction with, the financial statements.
Portfolio of Investments April 30, 2022† (continued)
| | |
Long-Term Municipal Bonds (continued) |
|
State of California, Various Purpose, Unlimited General Obligation | | |
| | |
Tobacco Securitization Authority of Northern California, Sacramento County Tobacco Securitization Corp., Revenue Bonds, Senior Lien | | |
| | |
Transbay Joint Powers Authority, Green Bond, Tax Allocation, Senior Lien | | |
| | |
Tulare Union High School District, Capital Appreciation, Election of 2004, Unlimited General Obligation | | |
Series A, Insured: NATL-RE | | |
(zero coupon), due 8/1/26 | | |
Upper Lake Union High School District, Unlimited General Obligation | | |
Series A, Insured: NATL-RE | | |
(zero coupon), due 8/1/23 | | |
Vacaville Unified School District, Unlimited General Obligation | | |
| | |
| | |
Victor Elementary School District, Unlimited General Obligation | | |
Series B, Insured: NATL-RE | | |
(zero coupon), due 8/1/27 | | |
Vista Unified School District, Capital Appreciation, Unlimited General Obligation | | |
| | |
(zero coupon), due 8/1/26 | | |
Yuba City Unified School District, Capital Appreciation, Unlimited General Obligation | | |
| | |
(zero coupon), due 3/1/25 | | |
| | |
|
Arkansas River Power Authority, Revenue Bonds | | |
| | |
| | |
| | |
|
|
City & County of Denver CO, Revenue Bonds | | |
| | |
| | |
| | |
| | |
| | |
| | |
| | |
| | |
Colliers Hill Metropolitan District No. 2 CO, Limited General Obligation | | |
| | |
| | |
Colorado Educational & Cultural Facilities Authority, Johnson & Wales University Project, Revenue Bonds | | |
| | |
| | |
| | |
| | |
Colorado Educational & Cultural Facilities Authority, Westgate Community School Project, Revenue Bonds | | |
Series A, Insured: Moral Obligation | | |
| | |
Series A, Insured: Moral Obligation | | |
| | |
Series A, Insured: Moral Obligation | | |
| | |
Series A, Insured: Moral Obligation | | |
| | |
Series A, Insured: Moral Obligation | | |
| | |
Colorado Educational & Cultural Facilities Authority, Banning Lewis Ranch Academy Building Co. LLC, Revenue Bonds | | |
Series A, Insured: Moral Obligation | | |
| | |
Series A, Insured: Moral Obligation | | |
| | |
Series A, Insured: Moral Obligation | | |
| | |
Series A, Insured: Moral Obligation | | |
| | |
The notes to the financial statements are an integral part of, and should be read in conjunction with, the financial statements.
| MainStay MacKay Short Term Municipal Fund |
| | |
Long-Term Municipal Bonds (continued) |
|
Colorado School of Mines, Capital Appreciation, Revenue Bonds | | |
| | |
(zero coupon), due 12/1/25 | | |
Copperleaf Metropolitan District No. 2, Limited General Obligation | | |
| | |
| | |
| | |
| | |
Crystal Valley Metropolitan District No. 2, Limited General Obligation | | |
| | |
| | |
| | |
| | |
| | |
| | |
| | |
| | |
| | |
| | |
Dawson Ridge Metropolitan District No. 1, Limited General Obligation | | |
| | |
(zero coupon), due 10/1/22 | | |
Denver Urban Renewal Authority, Tax Allocation, Senior Lien | | |
| | |
| | |
E-470 Public Highway Authority, Revenue Bonds | | |
Series B, Insured: NATL-RE | | |
(zero coupon), due 9/1/26 | | |
Series A, Insured: NATL-RE | | |
(zero coupon), due 9/1/28 | | |
Eagle County Airport Terminal Corp., Revenue Bonds | | |
| | |
| | |
El Paso County School District No. 3 Widefield, Recreation Facility Project, Certificate of Participation | | |
| | |
| | |
| | |
|
|
Erie Commons Metropolitan District No. 2, Limited General Obligation, Senior Lien | | |
| | |
| | |
Erie Highlands Metropolitan District No. 1, Limited General Obligation | | |
| | |
| | |
Flying Horse Metropolitan District No. 2, Limited General Obligation | | |
| | |
| | |
| | |
| | |
Goldsmith Metropolitan District, Unlimited General Obligation | | |
| | |
| | |
| | |
| | |
| | |
| | |
| | |
| | |
Leyden Rock Metropolitan District, Limited General Obligation | | |
| | |
| | |
| | |
| | |
| | |
| | |
| | |
| | |
| | |
| | |
| | |
| | |
| | |
| | |
Morgan County Quality Water District, Revenue Bonds | | |
| | |
| | |
The notes to the financial statements are an integral part of, and should be read in conjunction with, the financial statements.
Portfolio of Investments April 30, 2022† (continued)
| | |
Long-Term Municipal Bonds (continued) |
|
North Pine Vistas Metropolitan District No. 3, Limited General Obligation, Senior Lien | | |
| | |
| | |
| | |
| | |
| | |
| | |
Poudre Tech Metropolitan District, Unlimited General Obligation | | |
| | |
| | |
| | |
| | |
| | |
| | |
| | |
| | |
Regional Transportation District, Denver Transit Partners Eagle P3 Project, Revenue Bonds | | |
| | |
| | |
| | |
| | |
| | |
Saddle Rock Metropolitan District, Unlimited General Obligation | | |
| | |
| | |
| | |
| | |
Sand Creek Metropolitan District, Limited General Obligation | | |
| | |
| | |
| | |
| | |
Triview Metropolitan District, Green Bond, Revenue Bonds | | |
| | |
| | |
| | |
| | |
| | |
| | |
| | |
|
|
Vauxmont Metropolitan District, Limited General Obligation | | |
| | |
| | |
| | |
|
City of Bridgeport CT, Unlimited General Obligation | | |
| | |
| | |
| | |
| | |
City of Hartford CT, Unlimited General Obligation | | |
Series A, Insured: State Guaranteed | | |
| | |
Series A, Insured: BAM State Guaranteed | | |
| | |
Series A, Insured: BAM State Guaranteed | | |
| | |
City of New Haven CT, Unlimited General Obligation | | |
| | |
| | |
| | |
| | |
City of West Haven CT, Unlimited General Obligation | | |
| | |
| | |
| | |
| | |
| | |
| | |
| | |
| | |
| | |
| | |
| | |
Connecticut State Higher Education Supplement Loan Authority, Chesla Loan Program, Revenue Bonds | | |
| | |
| | |
| | |
The notes to the financial statements are an integral part of, and should be read in conjunction with, the financial statements.
| MainStay MacKay Short Term Municipal Fund |
| | |
Long-Term Municipal Bonds (continued) |
|
Connecticut State Higher Education Supplement Loan Authority, Chesla Loan Program, Revenue Bonds (continued) | | |
| | |
| | |
| | |
| | |
Greater New Haven Water Pollution Control Authority, Revenue Bonds | | |
| | |
| | |
State of Connecticut, Unlimited General Obligation | | |
| | |
| | |
| | |
| | |
| | |
| | |
State of Connecticut, Transportation Infrastructure, Special Tax, Revenue Bonds | | |
| | |
| | |
Town of Fairfield CT, Unlimited General Obligation | | |
| | |
Town of Hamden CT, Unlimited General Obligation | | |
| | |
| | |
| | |
| | |
| | |
| | |
Town of Windham CT, Unlimited General Obligation | | |
| | |
| | |
| | |
| | |
| | |
| | |
|
|
Delaware Municipal Electric Corp. (The), Beasley Power Station Project, Revenue Bonds | | |
| | |
| | |
Delaware State Economic Development Authority, Newark Charter School, Inc. Project, Revenue Bonds | | |
| | |
| | |
| | |
| | |
| | |
| | |
Delaware State Health Facilities Authority, Bayhealth Medical Center Project, Revenue Bonds | | |
| | |
| | |
Delaware Transportation Authority, Revenue Bonds | | |
| | |
| | |
District of Columbia 0.5% |
District of Columbia, KIPP DC Project, Revenue Bonds | | |
| | |
District of Columbia, Association of American Medical Colleges, Revenue Bonds | | |
| | |
| | |
District of Columbia, Gallery Place Project, Tax Allocation | | |
| | |
District of Columbia, Friendship Public Charter School, Inc., Revenue Bonds | | |
| | |
| | |
Metropolitan Washington Airports Authority, Airport System, Revenue Bonds (b) | | |
| | |
| | |
| | |
The notes to the financial statements are an integral part of, and should be read in conjunction with, the financial statements.
Portfolio of Investments April 30, 2022† (continued)
| | |
Long-Term Municipal Bonds (continued) |
District of Columbia (continued) |
Metropolitan Washington Airports Authority, Airport System, Revenue Bonds (b) (continued) | | |
| | |
| | |
| | |
| | |
| | |
Metropolitan Washington Airports Authority Dulles Toll Road, Dulles Toll Road, Revenue Bonds, Senior Lien | | |
| | |
(zero coupon), due 10/1/23 | | |
| | |
|
Broward County, Water & Sewer Utility, Revenue Bonds | | |
| | |
| | |
Central Florida Expressway Authority, Revenue Bonds, Senior Lien | | |
| | |
| | |
Centre Lake Community Development District, Special Assessment | | |
| | |
City of Delray Beach FL, Revenue Bonds | | |
| | |
City of Gainesville FL, Revenue Bonds | | |
| | |
| | |
City of Jacksonville FL, Sales Tax, Revenue Bonds | | |
| | |
City of Lake Worth Beach FL, Revenue Bonds | | |
| | |
| | |
City of Orlando FL, Tourist Development Tax, Revenue Bonds, Senior Lien | | |
| | |
| | |
| | |
|
|
City of Palm Bay FL, Unlimited General Obligation | | |
| | |
| | |
| | |
| | |
City of Tampa FL, H Lee Moffitt Cancer Center Project, Revenue Bonds | | |
| | |
| | |
| | |
Clay County School Board, Certificate of Participation | | |
| | |
| | |
County of Broward FL, Airport System, Revenue Bonds | | |
| | |
| | |
County of Broward FL, Port Facilities, Revenue Bonds | | |
| | |
| | |
Series B, Insured: AGM-CR | | |
| | |
| | |
| | |
County of Miami-Dade FL, Aviation, Revenue Bonds | | |
| | |
| | |
| | |
| | |
| | |
| | |
| | |
| | |
County of Osceola FL, Transportation, Revenue Bonds | | |
| | |
| | |
County of St Lucie FL, Sales Tax, Revenue Bonds | | |
| | |
| | |
The notes to the financial statements are an integral part of, and should be read in conjunction with, the financial statements.
| MainStay MacKay Short Term Municipal Fund |
| | |
Long-Term Municipal Bonds (continued) |
|
Florida Municipal Power Agency, St. Lucie Project, Revenue Bonds | | |
| | |
| | |
Greater Orlando Aviation Authority, Revenue Bonds | | |
| | |
| | |
Greater Orlando Aviation Authority, Airport Facilities, Revenue Bonds (b) | | |
| | |
| | |
| | |
| | |
| | |
| | |
| | |
| | |
Herons Glen Recreation District, Special Assessment | | |
| | |
| | |
| | |
| | |
| | |
| | |
Hillsborough County Industrial Development Authority, Tampa General Hospital Project, Revenue Bonds | | |
| | |
| | |
| | |
| | |
Lakewood Ranch Stewardship District, Lakewood Center and NW Sector Projects, Special Assessment, Senior Lien | | |
| | |
| | |
| | |
| | |
| | |
|
|
Lee County Industrial Development Authority, Cypress Cove at Healthpark Florida, Inc. Memory Care Project, Revenue Bonds | | |
| | |
Miami-Dade County Expressway Authority, Revenue Bonds | | |
| | |
| | |
Orange County Convention Center, Revenue Bonds | | |
| | |
Orange County Health Facilities Authority, AdventHealth Obligated Group, Revenue Bonds | | |
| | |
| | |
St. Lucie County School Board, Certificate of Participation | | |
| | |
| | |
St. Lucie County School Board, Sales tax, Revenue Bonds | | |
| | |
| | |
State of Florida, Right-of-Way Acquisition and Bridge Construction, Unlimited General Obligation | | |
| | |
University of North Florida Financing Corp. (The), Housing Project, Revenue Bonds | | |
| | |
| | |
| | |
|
Atlanta Development Authority (The), Piedmont Ellis LLC, Revenue Bonds | | |
| | |
Brookhaven Development Authority, Children's Healthcare of Atlanta, Revenue Bonds | | |
| | |
The notes to the financial statements are an integral part of, and should be read in conjunction with, the financial statements.
Portfolio of Investments April 30, 2022† (continued)
| | |
Long-Term Municipal Bonds (continued) |
|
City of Cochran GA, Water & Sewer System, Revenue Bonds | | |
| | |
| | |
City of Dalton GA, Georgia Combined Utilities, Revenue Bonds | | |
| | |
| | |
| | |
County of Paulding GA, Water & Sewerage, Revenue Bonds | | |
| | |
Georgia State Road & Tollway Authority, Revenue Bonds | | |
Series B, Insured: State Guaranteed | | |
| | |
Main Street Natural Gas, Inc., Revenue Bonds | | |
| | |
| | |
| | |
| | |
| | |
| | |
Municipal Electric Authority of Georgia, Combined Cycle Project, Revenue Bonds | | |
| | |
| | |
Municipal Electric Authority of Georgia, Project One Subordinated Bonds, Revenue Bonds | | |
| | |
| | |
| | |
Municipal Electric Authority of Georgia, Plant Vogtle Units 3 & 4 Project, Revenue Bonds | | |
| | |
| | |
| | |
Private Colleges & Universities Authority, Savannah College of Art & Design, Revenue Bonds | | |
| | |
| | |
| | |
|
|
Private Colleges & Universities Authority, Savannah College of Art & Design, Revenue Bonds (continued) | | |
| | |
Private Colleges & Universities Authority, Mercer University Project, Revenue Bonds | | |
| | |
| | |
| | |
| | |
| | |
|
Antonio B Won Pat International Airport Authority, Revenue Bonds | | |
| | |
| | |
| | |
| | |
| | |
| | |
Guam Government Waterworks Authority, Revenue Bonds | | |
| | |
| | |
| | |
| | |
| | |
Guam Power Authority, Revenue Bonds | | |
| | |
| | |
| | |
| | |
Port Authority of Guam, Revenue Bonds | | |
| | |
| | |
| | |
|
State of Hawaii, Unlimited General Obligation | | |
| | |
| | |
The notes to the financial statements are an integral part of, and should be read in conjunction with, the financial statements.
| MainStay MacKay Short Term Municipal Fund |
| | |
Long-Term Municipal Bonds (continued) |
|
State of Hawaii Airports System, Certificate of Participation | | |
| | |
| | |
State of Hawaii Harbor System, Revenue Bonds (b) | | |
| | |
| | |
| | |
| | |
| | |
|
Idaho Health Facilities Authority, ADA County Coroner Project, Revenue Bonds | | |
| | |
| | |
| | |
| | |
|
Carol Stream Park District, Unlimited General Obligation | | |
| | |
| | |
| | |
| | |
| | |
| | |
Chicago Board of Education, Unlimited General Obligation | | |
Series A, Insured: NATL-RE | | |
(zero coupon), due 12/1/22 | | |
| | |
| | |
Chicago Board of Education, Capital Appreciation, School Reform, Unlimited General Obligation | | |
| | |
(zero coupon), due 12/1/23 | | |
Series A, Insured: NATL-RE | | |
(zero coupon), due 12/1/25 | | |
Chicago Midway International Airport, Revenue Bonds, Second Lien | | |
| | |
| | |
| | |
|
|
Chicago O'Hare International Airport, Revenue Bonds, Senior Lien | | |
| | |
| | |
| | |
| | |
| | |
| | |
| | |
| | |
Chicago O'Hare International Airport, Passenger Facility Charge, Revenue Bonds | | |
| | |
Chicago Park District, Limited General Obligation | | |
| | |
| | |
Chicago Park District, Unlimited General Obligation | | |
| | |
| | |
| | |
| | |
Chicago Transit Authority, 5337 State of Good Repair Formula Funds, Revenue Bonds | | |
| | |
| | |
Chicago Transit Authority, 5307 Urbanized Area Formula Funds, Revenue Bonds | | |
| | |
City of Berwyn IL, Unlimited General Obligation | | |
| | |
| | |
| | |
| | |
| | |
| | |
| | |
| | |
City of Canton IL, Alternative Revenue Source, Unlimited General Obligation | | |
| | |
| | |
The notes to the financial statements are an integral part of, and should be read in conjunction with, the financial statements.
Portfolio of Investments April 30, 2022† (continued)
| | |
Long-Term Municipal Bonds (continued) |
|
City of Canton IL, Alternative Revenue Source, Unlimited General Obligation (continued) | | |
| | |
| | |
City of Chicago Heights IL, Unlimited General Obligation | | |
| | |
| | |
| | |
| | |
| | |
| | |
City of Chicago IL, Unlimited General Obligation | | |
| | |
(zero coupon), due 1/1/25 | | |
| | |
| | |
| | |
| | |
| | |
City of Chicago IL, Revenue Bonds, Second Lien | | |
| | |
City of Chicago IL, Waterworks, Revenue Bonds, Second Lien | | |
| | |
| | |
| | |
| | |
| | |
| | |
| | |
| | |
City of Chicago IL, Wastewater Transmission, Revenue Bonds, Second Lien | | |
| | |
| | |
| | |
| | |
| | |
| | |
| | |
|
|
City of Chicago IL, Neighbourhoods Alive 21 Program, Unlimited General Obligation | | |
| | |
| | |
| | |
| | |
| | |
| | |
City of Country Club Hills IL, Unlimited General Obligation | | |
| | |
| | |
| | |
| | |
| | |
| | |
City of Galesburg IL, Knox College Project, Revenue Bonds | | |
| | |
| | |
| | |
| | |
| | |
| | |
| | |
| | |
| | |
| | |
City of Kankakee IL, Unlimited General Obligation | | |
| | |
| | |
City of Kankakee IL, Special Obligation, Unlimited General Obligation | | |
| | |
| | |
City of Moline IL, Unlimited General Obligation | | |
| | |
| | |
| | |
| | |
City of Monmouth IL, Unlimited General Obligation | | |
| | |
| | |
The notes to the financial statements are an integral part of, and should be read in conjunction with, the financial statements.
| MainStay MacKay Short Term Municipal Fund |
| | |
Long-Term Municipal Bonds (continued) |
|
City of Monmouth IL, Unlimited General Obligation (continued) | | |
| | |
| | |
| | |
| | |
City of Mount Vernon IL, Unlimited General Obligation | | |
| | |
| | |
City of Rock Island IL, Green Bond, Unlimited General Obligation | | |
| | |
| | |
| | |
| | |
| | |
| | |
| | |
| | |
City of Rock Island IL, Unlimited General Obligation | | |
| | |
| | |
| | |
| | |
| | |
| | |
City of Rockford IL, Unlimited General Obligation | | |
| | |
| | |
| | |
| | |
| | |
| | |
City of Rockford IL, Alternative Revenue Source, Unlimited General Obligation | | |
| | |
| | |
| | |
| | |
| | |
| | |
| | |
|
|
City of Springfield IL, Electric, Revenue Bonds, Senior Lien | | |
| | |
City of Sterling IL, Unlimited General Obligation | | |
| | |
| | |
| | |
| | |
| | |
| | |
| | |
| | |
City of Waukegan IL, Water & Sewer System, Revenue Bonds, First Lien | | |
| | |
| | |
| | |
| | |
| | |
| | |
City of Waukegan IL, Unlimited General Obligation | | |
| | |
| | |
| | |
| | |
| | |
| | |
Cook County Community Unit School District No. 401 Elmwood Park, Unlimited General Obligation | | |
| | |
Cook County School District No. 122 Ridgeland, Unlimited General Obligation | | |
| | |
| | |
Cook County School District No. 87 Berkeley, Unlimited General Obligation | | |
| | |
| | |
| | |
| | |
| | |
| | |
The notes to the financial statements are an integral part of, and should be read in conjunction with, the financial statements.
Portfolio of Investments April 30, 2022† (continued)
| | |
Long-Term Municipal Bonds (continued) |
|
Cook County School District No. 88 Bellwood, Limited General Obligation | | |
| | |
| | |
| | |
| | |
Cook County School District No. 94, Unlimited General Obligation | | |
| | |
| | |
| | |
| | |
| | |
| | |
| | |
| | |
Cook County Township High School District No. 220 Reavis, Unlimited General Obligation | | |
| | |
| | |
| | |
| | |
County of Sangamon IL, Limited General Obligation | | |
| | |
| | |
| | |
| | |
| | |
| | |
| | |
| | |
Crawford Hospital District, Unlimited General Obligation | | |
| | |
| | |
| | |
| | |
| | |
| | |
| | |
| | |
| | |
|
|
Darien-Woodridge Fire Protection District, Unlimited General Obligation | | |
| | |
| | |
| | |
| | |
| | |
| | |
Illinois Development Finance Authority, Regenct Park, Revenue Bonds | | |
(zero coupon), due 7/15/25 | | |
Illinois Finance Authority, Learn Charter School Project, Revenue Bonds | | |
| | |
| | |
| | |
| | |
| | |
Illinois Finance Authority, Centegra Healthcare Obligated Group, Revenue Bonds | | |
| | |
Illinois Finance Authority, Illinois Wesleyan University, Revenue Bonds | | |
| | |
Illinois Finance Authority, OSF Healthcare System, Revenue Bonds | | |
| | |
| | |
Illinois Finance Authority, Northwestern Memorial Healthcare, Revenue Bonds | | |
| | |
| | |
Illinois Finance Authority, Ann & Robert H Lurie Children's Hospital Obligated Group, Revenue Bonds | | |
| | |
Illinois Sports Facilities Authority (The), Revenue Bonds | | |
| | |
| | |
The notes to the financial statements are an integral part of, and should be read in conjunction with, the financial statements.
| MainStay MacKay Short Term Municipal Fund |
| | |
Long-Term Municipal Bonds (continued) |
|
Illinois State Toll Highway Authority, Revenue Bonds | | |
| | |
| | |
Kane County School District No. 129 West Aurora, Unlimited General Obligation | | |
| | |
| | |
Kane County School District No. 131 Aurora East Side, Unlimited General Obligation | | |
| | |
| | |
Kankakee County School District No. 111 Kankakee, Limited General Obligation | | |
| | |
| | |
| | |
| | |
Knox & Warren Counties Community Unit School District No. 205 Galesburg, Unlimited General Obligation | | |
| | |
| | |
| | |
| | |
| | |
| | |
| | |
| | |
| | |
| | |
| | |
| | |
La Salle County School District No. 141 Ottawa, Unlimited General Obligation | | |
| | |
| | |
Lake County Community Consolidated School District No. 3 Beach Park, Unlimited General Obligation | | |
| | |
| | |
| | |
|
|
Lake County Community Consolidated School District No. 3 Beach Park, Unlimited General Obligation (continued) | | |
| | |
| | |
Macon & De Witt Counties Community Unit School District No. 2, Unlimited General Obligation | | |
| | |
| | |
| | |
| | |
| | |
| | |
| | |
| | |
Macon County School District No. 61 Decatur, Unlimited General Obligation | | |
| | |
| | |
| | |
| | |
| | |
| | |
Macoupin County Community Unit School District No. 1 Carlinville, Limited General Obligation | | |
| | |
| | |
| | |
| | |
Madison-Macoupin Etc Counties Community College District No. 536, Revenue Bonds | | |
| | |
| | |
| | |
| | |
Madison-Macoupin Etc Counties Community College District No. 536, Lewis & Clark Community Project, Unlimited General Obligation | | |
| | |
The notes to the financial statements are an integral part of, and should be read in conjunction with, the financial statements.
Portfolio of Investments April 30, 2022† (continued)
| | |
Long-Term Municipal Bonds (continued) |
|
McHenry & Kane Counties Community Consolidated School District No. 158 Huntley, Unlimited General Obligation | | |
| | |
(zero coupon), due 1/1/24 | | |
McHenry County Consolidated School District No. 46 Prairie Grove, Unlimited General Obligation | | |
| | |
| | |
| | |
| | |
| | |
| | |
Metropolitan Pier & Exposition Authority, Revenue Bonds | | |
Series A, Insured: NATL-RE | | |
(zero coupon), due 12/15/22 | | |
Metropolitan Pier & Exposition Authority, McCormick Place Expansion Project, Revenue Bonds | | |
| | |
(zero coupon), due 12/15/23 | | |
Metropolitan Pier & Exposition Authority, Mccormick Place Expansion Project, Revenue Bonds | | |
| | |
Montgomery & Macoupin Counties Community Unit School District No. 12 Litchfield, Unlimited General Obligation | | |
| | |
| | |
| | |
| | |
| | |
| | |
| | |
| | |
| | |
| | |
Northern Illinois University, Revenue Bonds | | |
| | |
| | |
| | |
|
|
Northern Illinois University, Revenue Bonds (continued) | | |
| | |
| | |
Public Building Commission of Chicago, Revenue Bonds | | |
| | |
| | |
Railsplitter Tobacco Settlement Authority, Revenue Bonds | | |
| | |
| | |
Regional Transportation Authority, Revenue Bonds | | |
Series A, Insured: NATL-RE | | |
| | |
| | |
| | |
Rock Island County Metropolitan Airport Authority, Unlimited General Obligation | | |
| | |
| | |
| | |
| | |
Rock Island County School District No. 41 Rock Island, Unlimited General Obligation | | |
| | |
| | |
Saline County Community Unit School District No. 3 Harrisburg, Unlimited General Obligation | | |
| | |
| | |
Sangamon County School District No. 186 Springfield, Unlimited General Obligation | | |
| | |
| | |
| | |
| | |
| | |
| | |
| | |
| | |
The notes to the financial statements are an integral part of, and should be read in conjunction with, the financial statements.
| MainStay MacKay Short Term Municipal Fund |
| | |
Long-Term Municipal Bonds (continued) |
|
South Sangamon Water Commission, Alternative Revenue Source, Unlimited General Obligation | | |
| | |
| | |
| | |
| | |
| | |
| | |
Stark Knox Marshall Henry & Peoria Counties Community Unit School Dist No. 100, Unlimited General Obligation | | |
| | |
| | |
| | |
| | |
| | |
| | |
State of Illinois, Unlimited General Obligation | | |
| | |
| | |
| | |
| | |
| | |
| | |
| | |
| | |
| | |
| | |
| | |
| | |
| | |
| | |
| | |
| | |
| | |
| | |
| | |
| | |
| | |
State of Illinois, Revenue Bonds | | |
| | |
| | |
| | |
|
|
State of Illinois, Unlimited General Obligation, First Series | | |
| | |
| | |
Town of Cicero IL, Unlimited General Obligation | | |
| | |
| | |
Village of Antioch IL, Green Bond, Unlimited General Obligation | | |
| | |
| | |
| | |
| | |
| | |
| | |
| | |
| | |
Village of Brookfield IL, Unlimited General Obligation | | |
| | |
| | |
Village of Franklin Park IL, Revenue Bonds | | |
| | |
| | |
| | |
| | |
| | |
| | |
| | |
| | |
| | |
| | |
Village of McCook IL, Unlimited General Obligation | | |
| | |
| | |
Village of Park Forest IL, Green Bond, Unlimited General Obligation | | |
| | |
| | |
| | |
| | |
Village of Sauk Village IL, Unlimited General Obligation | | |
| | |
| | |
The notes to the financial statements are an integral part of, and should be read in conjunction with, the financial statements.
Portfolio of Investments April 30, 2022† (continued)
| | |
Long-Term Municipal Bonds (continued) |
|
Village of Sauk Village IL, Unlimited General Obligation (continued) | | |
| | |
| | |
Village of Stone Park IL, Unlimited General Obligation | | |
| | |
| | |
| | |
| | |
Village of Westchester IL, Unlimited General Obligation | | |
| | |
| | |
| | |
| | |
| | |
| | |
| | |
| | |
West Chicago Park District, Unlimited General Obligation | | |
| | |
| | |
| | |
| | |
| | |
| | |
Western Illinois University, Revenue Bonds | | |
| | |
| | |
| | |
| | |
White Oak Library District, Unlimited General Obligation | | |
| | |
Will County Community High School District No. 210 Lincoln-Way, Unlimited General Obligation | | |
| | |
(zero coupon), due 1/1/25 | | |
| | |
|
|
Winnebago-Boone Etc Counties Community College District No. 511, Rock Valley College, Unlimited General Obligation | | |
| | |
| | |
Woodford Lasalle Livingston Etc Counties Community Unit Sch Dist No. 6 Fieldcrest, Unlimited General Obligation | | |
| | |
| | |
| | |
| | |
| | |
| | |
| | |
| | |
| | |
| | |
| | |
| | |
| | |
| | |
| | |
|
City of Evansville IN, Medical School Project, Tax Allocation | | |
| | |
| | |
City of Goshen IN, Sewage Works, Revenue Bonds | | |
| | |
| | |
| | |
| | |
| | |
| | |
| | |
| | |
County of Johnson IN, Local Income Tax, Revenue Bonds | | |
Series A, Insured: State Intercept | | |
| | |
The notes to the financial statements are an integral part of, and should be read in conjunction with, the financial statements.
| MainStay MacKay Short Term Municipal Fund |
| | |
Long-Term Municipal Bonds (continued) |
|
Greater Jasper School Building Corp., Indiana Ad Valorem Property Tax, 1st Mortgage, Revenue Bonds | | |
| | |
| | |
Hammond Multi-School Building Corp., Property First Mortgage, Revenue Bonds | | |
| | |
| | |
Indiana Finance Authority, Indianapolis Power & Light Co., Revenue Bonds | | |
| | |
| | |
Indiana Finance Authority, BHI Senior Living, Inc., Revenue Bonds | | |
| | |
| | |
| | |
| | |
| | |
| | |
Indiana Finance Authority, Marian University Project, Revenue Bonds | | |
| | |
| | |
| | |
| | |
Indiana Finance Authority, University Health, Revenue Bonds | | |
| | |
| | |
Muncie Sanitary District, Revenue Bonds | | |
| | |
| | |
| | |
| | |
| | |
| | |
Terre Haute Sanitary District, Revenue Bonds | | |
| | |
| | |
| | |
| | |
| | |
|
|
Terre Haute Sanitary District, Revenue Bonds (continued) | | |
| | |
| | |
| | |
| | |
| | |
| | |
| | |
| | |
Town of Speedway IN Sewage Works, Revenue Bonds | | |
| | |
| | |
Wayne Township Metropolitan School District, Limited General Obligation | | |
| | |
| | |
| | |
| | |
| | |
|
Benton Etc Counties College Community School District, Sales Services & Use Tax, Revenue Bonds | | |
| | |
| | |
Camanche Community School District, Unlimited General Obligation | | |
| | |
| | |
| | |
| | |
| | |
| | |
City of Clinton IA, Unlimited General Obligation | | |
| | |
| | |
| | |
| | |
City of Coralville IA, Unlimited General Obligation | | |
| | |
| | |
The notes to the financial statements are an integral part of, and should be read in conjunction with, the financial statements.
Portfolio of Investments April 30, 2022† (continued)
| | |
Long-Term Municipal Bonds (continued) |
|
City of Coralville IA, Unlimited General Obligation (continued) | | |
| | |
| | |
City of New Hampton IA, Electric, Revenue Bonds | | |
| | |
| | |
| | |
| | |
| | |
| | |
City of Newton IA, Unlimited General Obligation | | |
| | |
| | |
Clinton Community School District, Unlimited General Obligation | | |
| | |
| | |
Collins-Maxwell Community School District Sales Services & Use Tax, Revenue Bonds | | |
| | |
| | |
| | |
| | |
| | |
| | |
| | |
| | |
Iowa Finance Authority, Renewable Natural Gas Project, Green Bond, Revenue Bonds | | |
| | |
Iowa Higher Education Loan Authority, University of Dubuque Project, Revenue Bonds | | |
| | |
| | |
| | |
Iowa Higher Education Loan Authority, Des Moines University Project, Revenue Bonds | | |
| | |
| | |
| | |
| | |
|
|
Iowa State University of Science & Technology, Revenue Bonds | | |
| | |
| | |
Iowa Student Loan Liquidity Corp., Revenue Bonds | | |
| | |
| | |
Lewis Central Community School District, Revenue Bonds | | |
| | |
| | |
| | |
| | |
PEFA, Inc., Revenue Bonds | | |
| | |
Sioux Center Community School District, Unlimited General Obligation | | |
| | |
| | |
Southern Iowa Rural Water Association, Capital Loan Notes, Revenue Bonds | | |
| | |
| | |
State of Iowa, Revenue Bonds | | |
| | |
University of Iowa (The), Recreational Facilities, Revenue Bonds | | |
| | |
| | |
Waterloo Community School District, Revenue Bonds | | |
| | |
| | |
| | |
| | |
| | |
| | |
| | |
| | |
| | |
The notes to the financial statements are an integral part of, and should be read in conjunction with, the financial statements.
| MainStay MacKay Short Term Municipal Fund |
| | |
Long-Term Municipal Bonds (continued) |
|
Chisholm Creek Utility Authority, Revenue Bonds | | |
| | |
| | |
Franklin County Unified School District No. 287 West Franklin, Unlimited General Obligation | | |
| | |
| | |
Kansas Development Finance Authority, Department of Commerce, Revenue Bonds | | |
| | |
Kansas Development Finance Authority, Pittsburg State University, Revenue Bonds | | |
| | |
| | |
Washburn University, Revenue Bonds | | |
| | |
| | |
| | |
|
City of Columbia KY, Lindsey Wilson College, Inc., Revenue Bonds | | |
| | |
| | |
| | |
City of Somerset KY, Unlimited General Obligation | | |
| | |
| | |
| | |
| | |
| | |
| | |
Kentucky Bond Development Corp., Lexington Center Corporation Project, Revenue Bonds | | |
| | |
Kentucky Economic Development Finance Authority, Next Generation Kentucky Information Highway Project, Revenue Bonds, Senior Lien | | |
| | |
| | |
|
|
Kentucky Public Energy Authority, Gas Supply, Revenue Bonds | | |
| | |
| | |
| | |
| | |
| | |
| | |
Kentucky State University, Kentucky State University Project, Certificate of Participation | | |
| | |
| | |
| | |
| | |
| | |
| | |
| | |
| | |
Murray Electric Plant Board, Revenue Bonds | | |
| | |
| | |
Paducah Electric Plant Board, Revenue Bonds | | |
| | |
| | |
Rural Water Financing Agency, Public Projects, Revenue Notes | | |
| | |
| | |
| | |
|
Calcasieu Parish School District No. 31, Unlimited General Obligation | | |
| | |
| | |
Cameron Parish School District No. 15, Unlimited General Obligation | | |
| | |
| | |
| | |
City of New Orleans LA, Sewerage Service, Revenue Bonds | | |
| | |
The notes to the financial statements are an integral part of, and should be read in conjunction with, the financial statements.
Portfolio of Investments April 30, 2022† (continued)
| | |
Long-Term Municipal Bonds (continued) |
|
City of Shreveport LA, Water & Sewer, Revenue Bonds | | |
| | |
| | |
Louisiana Local Government Environmental Facilities & Community Development Authority, City of Crowley Louisiana Project, Revenue Bonds | | |
| | |
| | |
| | |
| | |
Louisiana Local Government Environmental Facilities & Community Development Authority, University Facilities, Inc. Project, Revenue Bonds | | |
| | |
| | |
| | |
| | |
Louisiana Local Government Environmental Facilities & Community Development Authority, Innovative Student Facilities, Inc. Project, Revenue Bonds | | |
| | |
| | |
| | |
| | |
| | |
| | |
| | |
| | |
Louisiana Local Government Environmental Facilities & Community Development Authority, LCTS Act 391 Project, Revenue Bonds | | |
| | |
| | |
Louisiana Public Facilities Authority, Loyola University Project, Revenue Bonds | | |
| | |
| | |
| | |
|
|
Louisiana Stadium & Exposition District, Revenue Notes | | |
| | |
| | |
Louisiana Stadium & Exposition District, Revenue Bonds | | |
| | |
| | |
Louisiana Stadium & Exposition District, Revenue Bonds, Senior Lien | | |
| | |
| | |
| | |
| | |
| | |
| | |
| | |
| | |
Parish of Plaquemines LA, Revenue Bonds | | |
| | |
| | |
Rapides Parish Recreation District Ward No. 9, Unlimited General Obligation | | |
| | |
| | |
| | |
| | |
| | |
| | |
State of Louisiana, Gasoline & Fuels Tax, Revenue Bonds | | |
| | |
| | |
| | |
|
Finance Authority of Maine, Supplemental Education Loan Program, Revenue Bonds (b) | | |
| | |
| | |
| | |
| | |
| | |
| | |
The notes to the financial statements are an integral part of, and should be read in conjunction with, the financial statements.
| MainStay MacKay Short Term Municipal Fund |
| | |
Long-Term Municipal Bonds (continued) |
|
Finance Authority of Maine, Supplemental Education Loan Program, Revenue Bonds (b) (continued) | | |
| | |
| | |
Maine Health & Higher Educational Facilities Authority, Eastern Maine Medical Center, Revenue Bonds | | |
Series A, Insured: AGM-State Intercept | | |
| | |
| | |
|
County of Baltimore MD, Certificate of Participation | | |
| | |
County of Frederick MD, Urbana Community Development Authority, Special Tax, Senior Lien | | |
| | |
| | |
| | |
| | |
Maryland Economic Development Corp., Terminal Project, Revenue Bonds | | |
| | |
| | |
| | |
| | |
| | |
Maryland Economic Development Corp., University of Maryland, College Park Projects, Revenue Bonds | | |
| | |
| | |
Maryland Health & Higher Educational Facilities Authority, Johns Hopkins University Issue, Revenue Bonds | | |
| | |
| | |
| | |
|
|
Maryland Health & Higher Educational Facilities Authority, Stevenson University, Inc. Project, Revenue Bonds | | |
| | |
| | |
Maryland State Transportation Authority, Passenger Facily Charge, Revenue Bonds | | |
| | |
St. Mary's College of Maryland, Academic Fees and Auxiliary Facility Fees, Revenue Bonds | | |
| | |
| | |
State of Maryland, Unlimited General Obligation | | |
| | |
| | |
State of Maryland, Unlimited General Obligation, Second Series | | |
| | |
| | |
| | |
|
City of Fall River MA, Qualified Municipal Purpose Loan, Limited General Obligation | | |
Insured: State Aid Withholding | | |
| | |
Insured: State Aid Withholding | | |
| | |
Commonwealth of Massachusetts, Revenue Bonds | | |
| | |
| | |
Massachusetts Bay Transportation Authority Assessment, Revenue Bonds | | |
| | |
| | |
Massachusetts Bay Transportation Authority Sales Tax, Revenue Bonds | | |
| | |
(zero coupon), due 7/1/22 | | |
The notes to the financial statements are an integral part of, and should be read in conjunction with, the financial statements.
Portfolio of Investments April 30, 2022† (continued)
| | |
Long-Term Municipal Bonds (continued) |
Massachusetts (continued) |
Massachusetts Clean Energy Cooperative Corp., Green Bond, Revenue Bonds | | |
| | |
Massachusetts Development Finance Agency, Northeastern University Issue, Revenue Bonds | | |
| | |
| | |
Massachusetts Development Finance Agency, South Shore Hospital Issue, Revenue Bonds | | |
| | |
| | |
Massachusetts Educational Financing Authority, Revenue Bonds | | |
| | |
| | |
Massachusetts Educational Financing Authority, Revenue Bonds, Senior Lien | | |
| | |
| | |
Massachusetts Educational Financing Authority, Educational Loan, Revenue Bonds (b) | | |
| | |
| | |
| | |
| | |
| | |
| | |
Massachusetts School Building Authority, Sales Tax, Revenue Bonds, Senior Lien | | |
| | |
| | |
Massachusetts State College Building Authority, Capital Appreciation, Revenue Bonds | | |
Series A, Insured: NATL-RE | | |
(zero coupon), due 5/1/23 | | |
Massachusetts State College Building Authority, Revenue Bonds | | |
Series A, Insured: State Intercept | | |
| | |
| | |
|
Massachusetts (continued) |
Southfield Redevelopment Authority, Revenue Bonds | | |
| | |
| | |
| | |
| | |
| | |
| | |
| | |
| | |
Town of Douglas MA, MUNI Purpose Loan, Limited General Obligation | | |
| | |
| | |
|
Allen Park Public School District, Unlimited General Obligation | | |
| | |
| | |
Allendale Public School District, Unlimited General Obligation | | |
| | |
| | |
Caledonia Community Schools, Unlimited General Obligation | | |
| | |
| | |
City of Dearborn Heights MI, Capital Improvement, Limited General Obligation | | |
| | |
| | |
City of Manistee MI, Limited General Obligation | | |
| | |
| | |
| | |
| | |
City of Marquette MI, Limited General Obligation | | |
| | |
| | |
| | |
| | |
The notes to the financial statements are an integral part of, and should be read in conjunction with, the financial statements.
| MainStay MacKay Short Term Municipal Fund |
| | |
Long-Term Municipal Bonds (continued) |
|
City of Port Huron MI, Water Supply System, Revenue Bonds | | |
| | |
| | |
| | |
| | |
| | |
| | |
City of Saginaw MI, Water Supply System, Revenue Bonds | | |
| | |
| | |
| | |
| | |
City of Taylor MI, Michigan Transportation, Limited General Obligation | | |
| | |
| | |
| | |
| | |
County of Genesee MI, Revenue Bonds | | |
| | |
| | |
| | |
| | |
| | |
| | |
County of Genesee MI, Water Supply System, Limited General Obligation | | |
| | |
| | |
Detroit City School District, Unlimited General Obligation | | |
Series A, Insured: Q-SBLF | | |
| | |
Fitzgerald Public School District, Unlimited General Obligation | | |
| | |
| | |
Flint Public Library, Unlimited General Obligation | | |
| | |
| | |
| | |
|
|
Jackson County Intermediate School District, School Building and Site Bonds, Limited General Obligation | | |
| | |
| | |
| | |
| | |
| | |
| | |
Lake Superior State University, Revenue Bonds | | |
| | |
| | |
| | |
| | |
Michigan Finance Authority, Revenue Bonds, Senior Lien | | |
| | |
| | |
Michigan Finance Authority, Energy Conservation Local Project, Revenue Bonds | | |
| | |
| | |
| | |
| | |
| | |
| | |
| | |
| | |
| | |
| | |
Michigan Finance Authority, Tobacco Settlement Asset-Backed, Revenue Bonds, Senior Lien | | |
| | |
| | |
| | |
| | |
Michigan Finance Authority, Kettering University Project, Revenue Bonds | | |
| | |
| | |
| | |
| | |
The notes to the financial statements are an integral part of, and should be read in conjunction with, the financial statements.
Portfolio of Investments April 30, 2022† (continued)
| | |
Long-Term Municipal Bonds (continued) |
|
Michigan Finance Authority, County of Wayne Criminal Center Justice Project, Revenue Bonds, Senior Lien | | |
| | |
Michigan Finance Authority, Student Loan Program, Revenue Bonds | | |
| | |
| | |
Michigan Strategic Fund, State of Michigan Department of Technology Management & Budget, Revenue Bonds | | |
| | |
Royal Oak Hospital Finance Authority, Beaumont Health, Revenue Bonds | | |
| | |
Saginaw City School District, Unlimited General Obligation | | |
| | |
| | |
| | |
| | |
South Huron Valley Utility Authority, Revenue Bonds | | |
| | |
| | |
| | |
| | |
| | |
| | |
| | |
| | |
Universal Academy, Michigan Public School Academy, Revenue Bonds | | |
| | |
Wayne County Airport Authority, Detroit Metropolitan Wayne County Airport, Revenue Bonds | | |
| | |
| | |
Wayne County Airport Authority, Revenue Bonds | | |
| | |
| | |
| | |
| | |
|
|
Becker Independent School District No. 726, Unlimited General Obligation | | |
Series A, Insured: SD CRED PROG | | |
| | |
Duluth Independent School District No. 709, Certificate of Participation | | |
Series A, Insured: SD CRED PROG | | |
| | |
Kenyon Wanamingo Independent School District No. 2172, Unlimited General Obligation | | |
Series A, Insured: SD CRED PROG | | |
| | |
Minneapolis-St. Paul Metropolitan Airports Commission, Revenue Bonds | | |
| | |
| | |
Minnesota Office of Higher Education, Supplemental Student Loan Program, Revenue Bonds | | |
| | |
Minnesota Rural Water Finance Authority, Inc., Public Projects Construction Notes, Revenue Bonds | | |
| | |
State of Minnesota, Unlimited General Obligation | | |
| | |
| | |
| | |
|
City of Jackson MS, Unlimited General Obligation | | |
| | |
| | |
| | |
Mississippi Development Bank, Hinds County School District Project, Revenue Bonds | | |
| | |
The notes to the financial statements are an integral part of, and should be read in conjunction with, the financial statements.
| MainStay MacKay Short Term Municipal Fund |
| | |
Long-Term Municipal Bonds (continued) |
|
Mississippi Development Bank, Municipal Energy Agency of Mississippi Power Supply Refunding Project, Revenue Bonds | | |
| | |
| | |
| | |
| | |
Mississippi Development Bank, Madison County Highway Project, Revenue Bonds | | |
| | |
| | |
State of Mississippi, Gaming Tax, Revenue Bonds | | |
| | |
| | |
West Rankin Utility Authority, Revenue Bonds | | |
| | |
| | |
| | |
|
City of Kansas City MO, Main Streetcar Extension Project, Revenue Bonds | | |
| | |
| | |
| | |
| | |
| | |
| | |
City of St Louis MO, Unlimited General Obligation | | |
| | |
| | |
Health & Educational Facilities Authority of the State of Missouri, Lake Regional Health System, Revenue Bonds | | |
| | |
| | |
| | |
| | |
| | |
|
|
Hickman Mills C-1 School District, MO Direct Deposit Program, Unlimited General Obligation | | |
Insured: State Aid Direct Deposit | | |
| | |
Kansas City Municipal Assistance Corp., Capital Appreciation, Revenue Bonds | | |
| | |
(zero coupon), due 4/15/23 | | |
Lincoln University, Auxiliary System, Revenue Bonds | | |
| | |
| | |
| | |
| | |
| | |
|
Gallatin County School District No. 72 Ophir, Unlimited General Obligation | | |
| | |
| | |
| | |
| | |
| | |
| | |
| | |
| | |
Montana Facility Finance Authority, Kalispell Regional Medical Center, Revenue Bonds | | |
| | |
State of Montana, Unlimited General Obligation | | |
| | |
| | |
| | |
| | |
| | |
|
Ashland-Greenwood Public Schools, Unlimited General Obligation | | |
| | |
| | |
| | |
| | |
The notes to the financial statements are an integral part of, and should be read in conjunction with, the financial statements.
Portfolio of Investments April 30, 2022† (continued)
| | |
Long-Term Municipal Bonds (continued) |
|
Ashland-Greenwood Public Schools, Unlimited General Obligation (continued) | | |
| | |
| | |
| | |
| | |
Central Plains Energy Project, Nebraska Gas Project No. 4, Revenue Bonds | | |
| | |
Central Plains Energy Project, Nebraska Gas Project No. 3, Revenue Bonds | | |
| | |
Cheyenne County School District No. 1, Unlimited General Obligation | | |
| | |
| | |
| | |
| | |
City of Grand Island NE, Combined Utility System, Revenue Bonds | | |
| | |
| | |
| | |
| | |
| | |
| | |
Lincoln Airport Authority, Revenue Bonds | | |
| | |
| | |
| | |
| | |
| | |
Omaha Airport Authority, Revenue Bonds | | |
| | |
| | |
University of Nebraska Facilities Corp., UNMC Utiity Improvement Project, Revenue Bonds | | |
| | |
| | |
| | |
|
|
Clark County School District, Limited General Obligation | | |
| | |
| | |
| | |
| | |
| | |
| | |
| | |
| | |
| | |
| | |
| | |
| | |
| | |
| | |
Las Vegas Convention & Visitors Authority, Revenue Bonds | | |
| | |
| | |
| | |
| | |
| | |
Las Vegas Valley Water District, Limited General Obligation | | |
| | |
| | |
State of Nevada, Limited General Obligation | | |
| | |
| | |
Washoe County School District, School Improvement Bonds, Limited General Obligation | | |
| | |
| | |
| | |
| | |
| | |
|
New Hampshire Business Finance Authority, Pennichuck Water Works, Inc. Project, Revenue Bonds | | |
| | |
The notes to the financial statements are an integral part of, and should be read in conjunction with, the financial statements.
| MainStay MacKay Short Term Municipal Fund |
| | |
Long-Term Municipal Bonds (continued) |
|
Atlantic City Board of Education, Unlimited General Obligation | | |
Insured: AGM SCH BD RES FD | | |
| | |
Borough of Wenonah NJ, Unlimited General Obligation | | |
| | |
| | |
| | |
| | |
Buena Regional School District, County of Atlantic, New Jersey School Energy Savings, Unlimited General Obligation | | |
| | |
| | |
Camden County Improvement Authority (The), Rowan University Project, Revenue Bonds | | |
| | |
| | |
Casino Reinvestment Development Authority, Inc., Revenue Bonds | | |
| | |
| | |
City of Bridgeton NJ, General Improvement and Water\Sewer Utility Bonds, Unlimited General Obligation | | |
| | |
| | |
| | |
| | |
| | |
| | |
City of East Orange NJ, Unlimited General Obligation | | |
Series B, Insured: AGM State Aid Withholding | | |
| | |
City of Millville NJ, Unlimited General Obligation | | |
| | |
| | |
| | |
|
|
City of Newark NJ, Unlimited General Obligation | | |
Series B, Insured: SCH BD RES FD | | |
| | |
Series A, Insured: AGM State Aid Withholding | | |
| | |
Series A, Insured: AGM State Aid Withholding | | |
| | |
Series B, Insured: AGM SCH BD RES FD | | |
| | |
Series C, Insured: AGM State Aid Withholding | | |
| | |
Series A, Insured: AGM State Aid Withholding | | |
| | |
Series B, Insured: AGM SCH BD RES FD | | |
| | |
Series A, Insured: AGM State Aid Withholding | | |
| | |
City of Orange Township NJ, Unlimited General Obligation | | |
Insured: AGM State Aid Withholding | | |
| | |
City of Perth Amboy NJ, Unlimited General Obligation | | |
| | |
| | |
| | |
| | |
| | |
| | |
| | |
| | |
City of Trenton NJ, Unlimited General Obligation | | |
Insured: AGM State Aid Withholding | | |
| | |
City of Union City NJ, Unlimited General Obligation | | |
Insured: AGM State Aid Withholding | | |
| | |
The notes to the financial statements are an integral part of, and should be read in conjunction with, the financial statements.
Portfolio of Investments April 30, 2022† (continued)
| | |
Long-Term Municipal Bonds (continued) |
|
City of Union City NJ, Unlimited General Obligation (continued) | | |
Insured: AGM State Aid Withholding | | |
| | |
Essex County Improvement Authority, North Star Academy Charter School Project, Revenue Bonds (c) | | |
| | |
| | |
| | |
| | |
| | |
| | |
| | |
Garden State Preservation Trust, Revenue Bonds | | |
| | |
(zero coupon), due 11/1/22 | | |
| | |
| | |
Garden State Preservation Trust, Capital Appreciation, Revenue Bonds | | |
| | |
(zero coupon), due 11/1/23 | | |
Gloucester County Improvement Authority (The), Revenue Bonds | | |
| | |
| | |
Greater Egg Harbor Regional High School District, Unlimited General Obligation | | |
Insured: AGM SCH BD RES FD | | |
| | |
Manchester Township Board of Education, Unlimited General Obligation | | |
Insured: BAM SCH BD RES FD | | |
| | |
Morris-Union Jointure Commission, Certificate of Participation | | |
| | |
| | |
New Brunswick Parking Authority, Revenue Bonds | | |
Series B, Insured: MUN GOVT GTD | | |
| | |
| | |
|
|
New Brunswick Parking Authority, Revenue Bonds (continued) | | |
Series B, Insured: BAM MUN GOVT GTD | | |
| | |
Series B, Insured: BAM MUN GOVT GTD | | |
| | |
New Jersey Economic Development Authority, New Jersey-American Water Co., Inc., Revenue Bonds | | |
| | |
| | |
New Jersey Economic Development Authority, School Facilities Construction, Revenue Bonds | | |
| | |
| | |
| | |
| | |
| | |
| | |
New Jersey Economic Development Authority, Facilities Construction, Revenue Bonds | | |
| | |
| | |
New Jersey Economic Development Authority, Motor Vehicle Surcharge, Revenue Bonds | | |
| | |
| | |
| | |
| | |
New Jersey Economic Development Authority, Cigarette Tax, Revenue Bonds | | |
| | |
New Jersey Economic Development Authority, New Jersey Transit Corp., Revenue Bonds | | |
| | |
| | |
The notes to the financial statements are an integral part of, and should be read in conjunction with, the financial statements.
| MainStay MacKay Short Term Municipal Fund |
| | |
Long-Term Municipal Bonds (continued) |
|
New Jersey Economic Development Authority, State of New Jersey Motor Vehicle Surcharge, Revenue Bonds | | |
| | |
| | |
New Jersey Economic Development Authority, School Facility Surcharge, Revenue Bonds | | |
Series N-1, Insured: NATL-RE | | |
| | |
New Jersey Educational Facilities Authority, Stockton University, Revenue Bonds | | |
| | |
| | |
New Jersey Higher Education Student Assistance Authority, Revenue Bonds | | |
| | |
| | |
New Jersey Higher Education Student Assistance Authority, Revenue Bonds, Senior Lien | | |
| | |
| | |
New Jersey Transportation Trust Fund Authority, Capital Appreciation, Revenue Bonds | | |
| | |
(zero coupon), due 12/15/24 | | |
Series C, Insured: AGC-ICC AMBAC | | |
(zero coupon), due 12/15/24 | | |
Series C, Insured: AGC-ICC AMBAC | | |
(zero coupon), due 12/15/25 | | |
| | |
(zero coupon), due 12/15/27 | | |
New Jersey Transportation Trust Fund Authority, Transportation System, Revenue Bonds | | |
| | |
(zero coupon), due 12/15/24 | | |
Series A, Insured: NATL-RE | | |
| | |
| | |
|
|
New Jersey Transportation Trust Fund Authority, Capital Appreciation, Transportation System, Revenue Bonds | | |
| | |
(zero coupon), due 12/15/25 | | |
New Jersey Transportation Trust Fund Authority, Transportation Program Notes, Revenue Bonds | | |
| | |
| | |
New Jersey Transportation Trust Fund Authority, Highway Reimbursement Notes, Revenue Bonds | | |
| | |
| | |
| | |
| | |
New Jersey Transportation Trust Fund Authority, Transportation Program, Revenue Bonds | | |
| | |
| | |
Newark Board of Education, School Energy Saving, Unlimited General Obligation | | |
Insured: BAM SCH BD RES FD | | |
| | |
Insured: BAM SCH BD RES FD | | |
| | |
Insured: BAM SCH BD RES FD | | |
| | |
Insured: BAM SCH BD RES FD | | |
| | |
Passaic Valley Sewerage Commission, Revenue Bonds | | |
| | |
| | |
| | |
| | |
| | |
| | |
Plainfield Board of Education, Unlimited General Obligation | | |
Insured: BAM SCH BD RES FD | | |
| | |
Insured: BAM SCH BD RES FD | | |
| | |
The notes to the financial statements are an integral part of, and should be read in conjunction with, the financial statements.
Portfolio of Investments April 30, 2022† (continued)
| | |
Long-Term Municipal Bonds (continued) |
|
Plumsted Township School District, Unlimited General Obligation | | |
Insured: AGM SCH BD RES FD | | |
| | |
Insured: AGM SCH BD RES FD | | |
| | |
Salem County Improvement Authority, Finlaw State Office Building Project, Revenue Bonds | | |
Insured: AGM MUN GOVT GTD | | |
| | |
Insured: AGM MUN GOVT GTD | | |
| | |
Insured: AGM MUN GOVT GTD | | |
| | |
Insured: AGM MUN GOVT GTD | | |
| | |
South Jersey Transportation Authority, Revenue Bonds | | |
| | |
| | |
| | |
| | |
| | |
| | |
| | |
| | |
State of New Jersey, Various Purpose, Unlimited General Obligation | | |
| | |
| | |
State of New Jersey, Unlimited General Obligation | | |
| | |
Tobacco Settlement Financing Corp., Revenue Bonds | | |
| | |
| | |
| | |
| | |
Township of Belleville NJ, General Improvement, Water Utility, Unlimited General Obligation | | |
| | |
| | |
| | |
|
|
Township of Haddon NJ, Unlimited General Obligation | | |
| | |
| | |
Township of Irvington NJ, Unlimited General Obligation | | |
| | |
| | |
Township of Lower NJ, Unlimited General Obligation | | |
| | |
| | |
Union Township Board of Education, Green Bond, Unlimited General Obligation | | |
Insured: BAM State Aid Withholding | | |
| | |
Insured: BAM State Aid Withholding | | |
| | |
Insured: BAM State Aid Withholding | | |
| | |
Washington Borough Board of Education, Unlimited General Obligation | | |
| | |
| | |
| | |
|
Albuquerque Municipal School District No. 12, Unlimited General Obligation | | |
Insured: State Aid Withholding | | |
| | |
County of Colfax NM, Tax Receipts, Revenue Bonds | | |
| | |
| | |
| | |
| | |
| | |
| | |
New Mexico Municipal Energy Acquisition Authority, Revenue Bonds | | |
| | |
| | |
The notes to the financial statements are an integral part of, and should be read in conjunction with, the financial statements.
| MainStay MacKay Short Term Municipal Fund |
| | |
Long-Term Municipal Bonds (continued) |
|
Village of Los Ranchos de Albuquerque NM, Albuquerque Academy Project, Revenue Bonds | | |
| | |
| | |
| | |
| | |
| | |
|
Albany County Airport Authority, Revenue Bonds | | |
| | |
| | |
| | |
| | |
| | |
| | |
| | |
| | |
Amherst Development Corp., UBF Faculty-Student Housing Corp., Revenue Bonds | | |
| | |
| | |
| | |
| | |
| | |
| | |
| | |
| | |
Brookfield Central School District, Unlimited General Obligation | | |
Insured: AGM State Aid Withholding | | |
| | |
Broome County Local Development Corp., United Health Services Hospitals, Revenue Bonds | | |
| | |
| | |
| | |
| | |
Camden Central School District, Unlimited General Obligation | | |
Insured: State Aid Withholding | | |
| | |
| | |
|
|
Camden Central School District, Unlimited General Obligation (continued) | | |
Insured: BAM State Aid Withholding | | |
| | |
City of Elmira City NY, Public Improvement, Limited General Obligation | | |
| | |
| | |
| | |
| | |
| | |
| | |
| | |
| | |
City of New York NY, Unlimited General Obligation | | |
| | |
| | |
| | |
| | |
City of Olean NY, Limited General Obligation | | |
| | |
| | |
City of Yonkers NY, Limited General Obligation | | |
| | |
| | |
| | |
| | |
County of Rockland NY, Public Improvement, Limited General Obligation | | |
| | |
| | |
County of Suffolk NY, Limited General Obligation | | |
| | |
| | |
| | |
| | |
| | |
| | |
The notes to the financial statements are an integral part of, and should be read in conjunction with, the financial statements.
Portfolio of Investments April 30, 2022† (continued)
| | |
Long-Term Municipal Bonds (continued) |
|
County of Suffolk NY, Public Improvement, Limited General Obligation | | |
| | |
| | |
Dutchess County Local Development Corp., Health Quest Systems, Revenue Bonds | | |
| | |
| | |
Erie County Industrial Development Agency (The), City School District Buffalo Project, Revenue Bonds | | |
Series A, Insured: State Aid Withholding | | |
| | |
Genesee Valley Central School District, Unlimited General Obligation | | |
Insured: AGM State Aid Withholding | | |
| | |
Insured: AGM State Aid Withholding | | |
| | |
Long Island Power Authority, Electric System, Revenue Bonds | | |
| | |
(zero coupon), due 6/1/23 | | |
Metropolitan Transportation Authority, Revenue Bonds | | |
| | |
| | |
| | |
| | |
| | |
| | |
| | |
| | |
| | |
| | |
| | |
| | |
| | |
| | |
| | |
| | |
| | |
|
|
Metropolitan Transportation Authority, Green Bond, Revenue Bonds | | |
| | |
| | |
Metropolitan Transportation Authority, Dedicated Tax Fund, Green Bond, Revenue Bonds | | |
| | |
| | |
Monroe County Industrial Development Corp., Rochester Regional Health Project, Revenue Bonds | | |
| | |
| | |
Mount Vernon City School District, Unlimited General Obligation | | |
Insured: State Aid Withholding | | |
| | |
Nassau County Local Economic Assistance Corp., Winthrop-University Association Project, Revenue Bonds | | |
| | |
New York City Industrial Development Agency, Queens Baseball Stadium Project, Revenue Bonds | | |
| | |
| | |
| | |
| | |
New York City Industrial Development Agency, Yankee Stadium Project, Revenue Bonds | | |
| | |
| | |
New York Convention Center Development Corp., Hotel Unit Fee, Revenue Bonds | | |
| | |
New York State Dormitory Authority, Interagency Coumcil Pooled Loan Program, Revenue Bonds | | |
| | |
| | |
The notes to the financial statements are an integral part of, and should be read in conjunction with, the financial statements.
| MainStay MacKay Short Term Municipal Fund |
| | |
Long-Term Municipal Bonds (continued) |
|
New York State Dormitory Authority, St Joseph's College, Revenue Bonds | | |
| | |
| | |
| | |
| | |
New York State Dormitory Authority, School District Revenue Financing Program, Revenue Bonds | | |
Insured: AGM State Aid Withholding | | |
| | |
Series C, Insured: State Aid Withholding | | |
| | |
New York State Dormitory Authority, Revenue Bonds | | |
Series A, Insured: State Aid Withholding | | |
| | |
New York State Dormitory Authority, Frodham University, Revenue Bonds | | |
| | |
New York State Dormitory Authority, Montefiore Obligated Group, Revenue Bonds | | |
| | |
New York State Dormitory Authority, General Purpose, Revenue Bonds | | |
| | |
| | |
New York State Energy Research & Development Authority, Green Bond, Revenue Bonds | | |
| | |
| | |
| | |
| | |
New York State Environmental Facilities Corp., Green Bond, Revenue Bonds | | |
| | |
| | |
|
|
New York Transportation Development Corp., Delta Air Lines, Inc. Laguardia Airport Terminals C&D Redevelopment Project, Revenue Bonds | | |
| | |
New York Transportation Development Corp., Terminal One Group Association LP, Revenue Bonds | | |
| | |
New York Transportation Development Corp., John F. kennedy International Airport Project, Revenue Bonds | | |
| | |
| | |
| | |
| | |
New York Transportation Development Corp., Terminal 4 JFK International Airport Project, Revenue Bonds (b) | | |
| | |
| | |
Niagara Falls City School District, Certificate of Participation | | |
| | |
| | |
| | |
| | |
| | |
| | |
Niagara Falls City School District, Unlimited General Obligation | | |
Insured: BAM State Aid Withholding | | |
| | |
Niagara Frontier Transportation Authority, Revenue Bonds | | |
| | |
Niagara Frontier Transportation Authority, Buffalo Niagara International Airport, Revenue Bonds | | |
| | |
| | |
The notes to the financial statements are an integral part of, and should be read in conjunction with, the financial statements.
Portfolio of Investments April 30, 2022† (continued)
| | |
Long-Term Municipal Bonds (continued) |
|
Onondaga Civic Development Corp., Upstate Properties Development, Inc. Project, Revenue Bonds | | |
| | |
| | |
| | |
| | |
Port Authority of New York & New Jersey, Revenue Bonds | | |
| | |
| | |
| | |
| | |
| | |
| | |
| | |
| | |
| | |
Suffolk County Economic Development Corp., Catholic Health Services of Long Island Obligated Group, Revenue Bonds | | |
| | |
| | |
Suffolk Tobacco Asset Securitization Corp., Tobacco Settlement, Asset Backed, Revenue Bonds | | |
| | |
| | |
Syracuse Regional Airport Authority, Revenue Bonds (b) | | |
| | |
| | |
| | |
Town of Oyster Bay NY, Limited General Obligation | | |
| | |
| | |
| | |
| | |
| | |
| | |
| | |
| | |
| | |
| | |
| | |
|
|
Town of Oyster Bay NY, Limited General Obligation (continued) | | |
| | |
| | |
Town of Poughkeepsie NY, Library Purpose, Limited General Obligation | | |
| | |
| | |
Whitesboro Central School District, Unlimited General Obligation | | |
Insured: AGM State Aid Withholding | | |
| | |
| | |
|
County of Cabarrus NC, Installment Financing Program, Revenue Bonds | | |
| | |
County of Guilford NC, Unlimited General Obligation | | |
| | |
North Carolina Capital Facilities Finance Agency, Campbell University, Revenue Bonds | | |
| | |
| | |
North Carolina Capital Facilities Finance Agency, High Point University, Revenue Bonds | | |
| | |
| | |
| | |
| | |
| | |
| | |
North Carolina Turnpike Authority, Revenue Bonds | | |
| | |
| | |
North Carolina Turnpike Authority, Triangle Expressway System, Revenue Bonds, Senior Lien | | |
| | |
The notes to the financial statements are an integral part of, and should be read in conjunction with, the financial statements.
| MainStay MacKay Short Term Municipal Fund |
| | |
Long-Term Municipal Bonds (continued) |
North Carolina (continued) |
Winston-Salem State University, Student Housing Project, Revenue Bonds | | |
| | |
| | |
| | |
|
City of Grand Forks ND, Altru Health System Obligated Group, Revenue Bonds | | |
| | |
| | |
| | |
| | |
University of North Dakota, Certificate of Participation | | |
| | |
| | |
| | |
|
Akron Bath Copley Joint Township Hospital District, Summa Health System Obligated Group, Revenue Bonds | | |
| | |
| | |
Bethel Local School District, School Facilities, Certificate of Participation | | |
| | |
| | |
| | |
| | |
| | |
| | |
Buckeye Tobacco Settlement Financing Authority, Revenue Bonds, Senior Lien | | |
| | |
| | |
City of Cleveland OH, Airport System, Revenue Bonds | | |
| | |
| | |
| | |
|
|
City of Cleveland OH, Airport System, Revenue Bonds (continued) | | |
| | |
| | |
City of Dayton OH, Airport, Revenue Bonds (b) | | |
| | |
| | |
| | |
| | |
City of Lorain OH, Limited General Obligation | | |
| | |
| | |
| | |
| | |
| | |
| | |
City of Middleburg Heights OH, Southwest General Health Center Project, Revenue Bonds | | |
| | |
| | |
| | |
| | |
| | |
City of Sharonville OH, Revenue Bonds | | |
| | |
| | |
| | |
| | |
| | |
| | |
| | |
| | |
Cleveland-Cuyahoga County Port Authority, Cleveland Museum of Natural History Project, Revenue Bonds | | |
| | |
| | |
| | |
| | |
Cloverleaf Local School District, Certificate of Participation | | |
| | |
| | |
The notes to the financial statements are an integral part of, and should be read in conjunction with, the financial statements.
Portfolio of Investments April 30, 2022† (continued)
| | |
Long-Term Municipal Bonds (continued) |
|
Cloverleaf Local School District, Certificate of Participation (continued) | | |
| | |
| | |
| | |
| | |
Conotton Valley Union Local School District, School Facilities Project, Certificate of Participation | | |
| | |
| | |
Hillsdale Local School District, School Facilities Project, Certificate of Participation | | |
| | |
| | |
| | |
| | |
Lancaster Port Authority, Revenue Bonds | | |
| | |
| | |
Ohio Higher Educational Facility Commission, Revenue Bonds | | |
| | |
State of Ohio, University Hospitals Health System, Inc., Revenue Bonds | | |
| | |
| | |
State of Ohio, Premier Health Partners Obligated Group, Revenue Bonds | | |
| | |
| | |
| | |
Triway Local School District, Certificate of Participation | | |
| | |
| | |
| | |
|
Tulsa Airports Improvement Trust, Revenue Bonds (b) | | |
| | |
| | |
| | |
|
|
Tulsa Airports Improvement Trust, Revenue Bonds (b) (continued) | | |
| | |
| | |
| | |
|
Clackamas County School District No. 12 North Clackamas, Unlimited General Obligation | | |
Series B, Insured: School Bond Guaranty | | |
| | |
Columbia County School District No. 502, Unlimited General Obligation | | |
Insured: School Bond Guaranty | | |
(zero coupon), due 6/15/26 | | |
County of Yamhill OR, George Fox University Project, Revenue Bonds | | |
| | |
| | |
| | |
Salem-Keizer School District No. 24J, Limited General Obligation | | |
(zero coupon), due 6/15/23 | | |
(zero coupon), due 6/15/24 | | |
(zero coupon), due 6/15/25 | | |
Warm Springs Reservation Confederated Tribe, Pelton-Round Butte Project, Revenue Bonds (c) | | |
| | |
| | |
| | |
| | |
|
Albert Gallatin Area School District, Limited General Obligation | | |
Series A, Insured: AGM State Aid Withholding | | |
| | |
Series A, Insured: AGM State Aid Withholding | | |
| | |
Series A, Insured: AGM State Aid Withholding | | |
| | |
The notes to the financial statements are an integral part of, and should be read in conjunction with, the financial statements.
| MainStay MacKay Short Term Municipal Fund |
| | |
Long-Term Municipal Bonds (continued) |
|
Allegheny Valley Joint Sewage Authority, Green Bond, Revenue Bonds | | |
| | |
| | |
Bellwood-Antis School District, Limited General Obligation | | |
Series A, Insured: BAM State Aid Withholding | | |
| | |
Series AA, Insured: BAM State Aid Withholding | | |
| | |
Bethlehem Area School District, Limited General Obligation | | |
Series A, Insured: AGM State Aid Withholding | | |
| | |
Borough of Carnegie, Unlimited General Obligation | | |
| | |
| | |
| | |
| | |
Borough of Quakertown PA, Unlimited General Obligation | | |
| | |
| | |
| | |
| | |
Brownsville Area School District, Limited General Obligation | | |
Insured: AGM State Aid Withholding | | |
| | |
Butler Area Sewer Authority, Revenue Bonds | | |
| | |
| | |
Chichester School District, Capital Appreciation, Unlimited General Obligation | | |
Insured: NATL-RE State Aid Withholding | | |
(zero coupon), due 3/1/25 | | |
| | |
|
|
City of Allentown PA, Unlimited General Obligation | | |
| | |
| | |
| | |
| | |
| | |
| | |
| | |
| | |
City of Bethlehem PA, Unlimited General Obligation | | |
| | |
| | |
City of Lancaster PA, Limited General Obligation | | |
| | |
| | |
City of Philadelphia PA, Airport, Revenue Bonds (b) | | |
| | |
| | |
| | |
| | |
City of Pittston PA, Unlimited General Obligation | | |
| | |
| | |
| | |
| | |
| | |
| | |
| | |
| | |
City of Reading PA, Unlimited General Obligation | | |
| | |
| | |
City of Williamsport PA, Unlimited General Obligation | | |
| | |
| | |
| | |
| | |
Commonwealth Financing Authority, Tobacco Master Settlement Payment, Revenue Bonds | | |
| | |
The notes to the financial statements are an integral part of, and should be read in conjunction with, the financial statements.
Portfolio of Investments April 30, 2022† (continued)
| | |
Long-Term Municipal Bonds (continued) |
|
County of Lackawanna PA, Unlimited General Obligation | | |
| | |
| | |
County of Lawrence PA, Unlimited General Obligation | | |
| | |
| | |
County of Mercer PA, Unlimited General Obligation | | |
| | |
| | |
Deer Creek Drainage Basin Authority, Revenue Bonds | | |
| | |
| | |
| | |
| | |
Forest Hills School District, Limited General Obligation | | |
Insured: BAM State Aid Withholding | | |
| | |
Greencastle-Antrim School District, Limited General Obligation | | |
Insured: BAM State Aid Withholding | | |
| | |
Indiana County Industrial Development Authority, Foundation for Indiana University of Pennsylvania (The), Revenue Bonds | | |
| | |
| | |
| | |
| | |
Lancaster Higher Education Authority, Harrisburg Area Community College Project, Revenue Bonds | | |
| | |
| | |
Laurel Highlands School District, Limited General Obligation | | |
Insured: BAM State Aid Withholding | | |
| | |
Insured: BAM State Aid Withholding | | |
| | |
Insured: BAM State Aid Withholding | | |
| | |
| | |
|
|
Lycoming County Authority, Pennsylvania College of Technology Project, Revenue Bonds | | |
| | |
| | |
Mckeesport Area School District, Capital Appreciation, Unlimited General Obligation | | |
Series C, Insured: AMBAC State Aid Withholding | | |
(zero coupon), due 10/1/28 | | |
Milton Area School District, Limited General Obligation | | |
Insured: AGM State Aid Withholding | | |
| | |
Insured: AGM State Aid Withholding | | |
| | |
Insured: AGM State Aid Withholding | | |
| | |
Insured: AGM State Aid Withholding | | |
| | |
Mount Union Area School District, Limited General Obligation | | |
Insured: BAM State Aid Withholding | | |
| | |
Insured: BAM State Aid Withholding | | |
| | |
Municipality of Norristown PA, Unlimited General Obligation | | |
| | |
| | |
| | |
| | |
North Huntingdon Township Municipal Authority, Revenue Bonds | | |
| | |
| | |
| | |
| | |
Norwin School District, Limited General Obligation | | |
Insured: BAM State Aid Withholding | | |
| | |
Insured: BAM State Aid Withholding | | |
| | |
Insured: BAM State Aid Withholding | | |
| | |
The notes to the financial statements are an integral part of, and should be read in conjunction with, the financial statements.
| MainStay MacKay Short Term Municipal Fund |
| | |
Long-Term Municipal Bonds (continued) |
|
Panther Valley School District, Limited General Obligation | | |
Insured: BAM State Aid Withholding | | |
| | |
Insured: BAM State Aid Withholding | | |
| | |
Pennsylvania Economic Development Financing Authority, PPL Electric Utilities Corp., Revenue Bonds | | |
| | |
Pennsylvania Economic Development Financing Authority, Water & Wastewater, Revenue Bonds | | |
| | |
Pennsylvania Higher Educational Facilities Authority, Drexel University, Revenue Bonds | | |
| | |
Pennsylvania Turnpike Commission, Revenue Bonds | | |
| | |
| | |
Philadelphia Gas Works Co., Revenue Bonds | | |
| | |
| | |
Philadelphia Municipal Authority, Revenue Bonds | | |
| | |
| | |
Pittsburgh School District, Limited General Obligation | | |
Insured: AGM State Aid Withholding | | |
| | |
Pittsburgh Water & Sewer Authority, Revenue Bonds, First Lien | | |
| | |
| | |
Pottstown School District, Limited General Obligation | | |
Insured: BAM State Aid Withholding | | |
| | |
Insured: BAM State Aid Withholding | | |
| | |
Insured: BAM State Aid Withholding | | |
| | |
| | |
|
|
Riverside School District, Limited General Obligation | | |
Insured: BAM State Aid Withholding | | |
| | |
Insured: BAM State Aid Withholding | | |
| | |
School District of Philadelphia (The), Limited General Obligation | | |
Series F, Insured: BAM State Aid Withholding | | |
| | |
Series A, Insured: State Aid Withholding | | |
| | |
Shikellamy School District, Limited General Obligation | | |
Series A, Insured: BAM State Aid Withholding | | |
| | |
South Wayne County Water and Sewer Authority, Revenue Bonds | | |
| | |
| | |
| | |
| | |
Sports & Exhibition Authority of Pittsburgh and Allegheny County, Revenue Bonds | | |
| | |
| | |
State Public School Building Authority, Central Montgomery County Area Vocational Technical School, Revenue Bonds | | |
Insured: BAM State Aid Withholding | | |
| | |
State Public School Building Authority, Crawford County Career and Technical Center, Revenue Bonds | | |
Insured: BAM State Aid Withholding | | |
| | |
Insured: BAM State Aid Withholding | | |
| | |
Insured: BAM State Aid Withholding | | |
| | |
Insured: BAM State Aid Withholding | | |
| | |
The notes to the financial statements are an integral part of, and should be read in conjunction with, the financial statements.
Portfolio of Investments April 30, 2022† (continued)
| | |
Long-Term Municipal Bonds (continued) |
|
State Public School Building Authority, Northampton County Area Community College Foundation, Revenue Bonds | | |
Insured: BAM State Aid Withholding | | |
| | |
Insured: BAM State Aid Withholding | | |
| | |
State Public School Building Authority, Harrisburg School District, Revenue Bonds | | |
Insured: AGM State Aid Withholding | | |
| | |
Insured: AGM State Aid Withholding | | |
| | |
State Public School Building Authority, Community College of Allegheny County, Revenue Bonds | | |
| | |
| | |
United School District, Unlimited General Obligation | | |
Insured: AGM State Aid Withholding | | |
| | |
Insured: AGM State Aid Withholding | | |
| | |
Insured: AGM State Aid Withholding | | |
| | |
Unity Township Municipal Authority (The), Revenue Bonds | | |
| | |
| | |
Valley View School District, Limited General Obligation | | |
Series A, Insured: BAM State Aid Withholding | | |
| | |
Series B, Insured: BAM State Aid Withholding | | |
| | |
Waverly Township Municipal Authority, Revenue Bonds | | |
Insured: BAM State Aid Withholding | | |
| | |
| | |
|
|
West Cornwall Township Municipal Authority, Lebanon Valley Brethren Home Project, Revenue Bonds | | |
| | |
| | |
| | |
| | |
Westmoreland County Industrial Development Authority, Excela Health Project, Revenue Bonds | | |
| | |
| | |
| | |
| | |
| | |
| | |
Wilkinsburg-Penn Joint Water Authority (The), Green Bond, Revenue Bonds | | |
| | |
| | |
| | |
| | |
| | |
| | |
Woodland Hills School District, Limited General Obligation | | |
Series A, Insured: BAM State Aid Withholding | | |
| | |
York City Sewer Authority, Revenue Bonds | | |
Insured: AGM MUN GOVT GTD | | |
| | |
| | |
|
Puerto Rico Electric Power Authority, Revenue Bonds | | |
Series PP, Insured: NATL-RE | | |
| | |
Series SS, Insured: NATL-RE | | |
| | |
The notes to the financial statements are an integral part of, and should be read in conjunction with, the financial statements.
| MainStay MacKay Short Term Municipal Fund |
| | |
Long-Term Municipal Bonds (continued) |
|
Puerto Rico Industrial, Tourist, Educational, Medical and Environmental Control Facilities Financing Authority, Hospital Auxilio Mutuo Obligated Group, Revenue Bonds | | |
| | |
| | |
|
Providence Public Building Authority, Capital Improvement Projects, Revenue Bonds | | |
| | |
| | |
Rhode Island Health and Educational Building Corp., Rhode Island School of Design, Revenue Bonds | | |
| | |
| | |
| | |
Rhode Island Health and Educational Building Corp., Lifespan Obligated Group, Revenue Bonds | | |
| | |
Rhode Island Housing and Mortgage Finance Corp., Revenue Bonds (f) | | |
| | |
| | |
| | |
| | |
Rhode Island Student Loan Authority, Revenue Bonds, Senior Lien (b) | | |
| | |
| | |
| | |
| | |
Rhode Island Student Loan Authority, Revenue Bonds | | |
| | |
| | |
| | |
| | |
|
|
Greenville County School District, Building Equity Sooner, Revenue Bonds | | |
| | |
Piedmont Municipal Power Agency, Revenue Bonds | | |
| | |
| | |
South Carolina Ports Authority, Revenue Bonds | | |
| | |
South Carolina Public Service Authority, Revenue Bonds | | |
| | |
| | |
Williamsburg County Public Facilities Corp., Williamsburg County Project, Revenue Bonds | | |
| | |
| | |
| | |
| | |
| | |
| | |
| | |
| | |
| | |
|
County of Lawrence SD, Certificate of Participation | | |
| | |
| | |
| | |
| | |
| | |
| | |
| | |
| | |
| | |
| | |
South Dakota Health & Educational Facilities Authority, Sanford, Revenue Bonds | | |
| | |
The notes to the financial statements are an integral part of, and should be read in conjunction with, the financial statements.
Portfolio of Investments April 30, 2022† (continued)
| | |
Long-Term Municipal Bonds (continued) |
|
South Dakota Health & Educational Facilities Authority, Monument Health, Revenue Bonds | | |
| | |
| | |
Tri-Valley School District No. 49-6, Unlimited General Obligation | | |
| | |
| | |
| | |
| | |
| | |
| | |
| | |
|
County of Montgomery TN, Unlimited General Obligation | | |
| | |
| | |
Memphis-Shelby County Airport Authority, Revenue Bonds | | |
| | |
| | |
Metropolitan Government Nashville & Davidson County Health & Educational Facilities Board, Trevecca Nazarene University Project, Revenue Bonds | | |
| | |
| | |
| | |
| | |
| | |
| | |
| | |
| | |
| | |
| | |
Metropolitan Government Nashville & Davidson County Health & Educational Facilities Board, Belmont University, Revenue Bonds | | |
| | |
| | |
| | |
| | |
|
|
New Memphis Arena Public Building Authority, City of Memphis, Revenue Bonds | | |
(zero coupon), due 4/1/28 | | |
Tennessee Energy Acquisition Corp., Revenue Bonds | | |
| | |
| | |
| | |
|
Aledo Independent School District, Unlimited General Obligation | | |
| | |
(zero coupon), due 2/15/26 | | |
Allen Independent School District, Unlimited General Obligation | | |
| | |
| | |
Alvin Independent School District, Unlimited General Obligation | | |
Series A, Insured: PSF-GTD | | |
| | |
Arlington Higher Education Finance Corp., Harmony Public Schools, Revenue Bonds | | |
Series B, Insured: PSF-GTD | | |
| | |
Series C, Insured: PSF-GTD | | |
| | |
Arlington Higher Education Finance Corp., Uplift Education Project, Revenue Bonds | | |
Series A, Insured: PSF-GTD | | |
| | |
Series A, Insured: PSF-GTD | | |
| | |
Series A, Insured: PSF-GTD | | |
| | |
Series A, Insured: PSF-GTD | | |
| | |
Series A, Insured: PSF-GTD | | |
| | |
Series A, Insured: PSF-GTD | | |
| | |
Series A, Insured: PSF-GTD | | |
| | |
The notes to the financial statements are an integral part of, and should be read in conjunction with, the financial statements.
| MainStay MacKay Short Term Municipal Fund |
| | |
Long-Term Municipal Bonds (continued) |
|
Arlington Higher Education Finance Corp., Faith Family Academy Charter Schools, Revenue Bonds | | |
Series A, Insured: PSF-GTD | | |
| | |
Series A, Insured: PSF-GTD | | |
| | |
Series A, Insured: PSF-GTD | | |
| | |
Arlington Higher Education Finance Corp., Compass Academy Charter School, Inc., Revenue Bonds | | |
Series A, Insured: PSF-GTD | | |
| | |
Series A, Insured: PSF-GTD | | |
| | |
Arlington Higher Education Finance Corp., Great Hearts America - Texas, Revenue Bonds | | |
Series A, Insured: PSF-GTD | | |
| | |
Series A, Insured: PSF-GTD | | |
| | |
Series A, Insured: PSF-GTD | | |
| | |
Arlington Independent School District, Unlimited General Obligation | | |
Series A, Insured: PSF-GTD | | |
| | |
Belmont Fresh Water Supply District No. 1, Unlimited General Obligation | | |
| | |
| | |
Brazoria County Municipal Utility District No. 19, Unlimited General Obligation | | |
| | |
| | |
| | |
| | |
| | |
| | |
Brazos Higher Education Authority, Inc., Revenue Bonds | | |
| | |
| | |
| | |
|
|
Central Texas Regional Mobility Authority, Revenue Bonds, Senior Lien | | |
| | |
| | |
Central Texas Regional Mobility Authority, Revenue Bonds, Sub. Lien | | |
| | |
| | |
Central Texas Turnpike System, Revenue Bonds, First Tier | | |
Series A, Insured: BHAC-CR AMBAC | | |
(zero coupon), due 8/15/26 | | |
Central Texas Turnpike System, Revenue Bonds | | |
| | |
| | |
| | |
| | |
Central Texas Turnpike System, Capital Appreciation, Revenue Bonds, First Tier | | |
| | |
(zero coupon), due 8/15/29 | | |
Cibolo Canyons Special Improvement District, Valorem Tax Utility System, Limited General Obligation | | |
| | |
| | |
| | |
| | |
Cinco Southwest Municipal Utility District No. 1, Unlimited General Obligation | | |
| | |
| | |
| | |
| | |
City of Austin TX, Airport System, Revenue Bonds | | |
| | |
| | |
| | |
| | |
The notes to the financial statements are an integral part of, and should be read in conjunction with, the financial statements.
Portfolio of Investments April 30, 2022† (continued)
| | |
Long-Term Municipal Bonds (continued) |
|
City of Austin TX, Electric Utility, Revenue Bonds | | |
| | |
| | |
City of Bryan TX, Electric System, Revenue Bonds | | |
| | |
| | |
| | |
| | |
City of Dallas TX, Waterworks & Sewer System, Revenue Bonds | | |
| | |
| | |
City of Greenville TX, Limited General Obligation | | |
| | |
| | |
| | |
| | |
| | |
| | |
City of Houston TX, Hotel Occupancy Tax & Special Tax, Revenue Bonds | | |
Series B, Insured: AGM-CR AMBAC | | |
(zero coupon), due 9/1/22 | | |
| | |
| | |
| | |
| | |
| | |
| | |
| | |
City of Houston TX, Airport System, Revenue Bonds, Sub. Lien | | |
| | |
| | |
| | |
| | |
| | |
| | |
City of Laredo TX, International Toll Bridge System, Revenue Bonds | | |
| | |
| | |
| | |
|
|
City of Lewisville TX, Lewisville Castle Hills Public Improvement District No. 3 Project, Special Assessment | | |
| | |
| | |
City of Lockhart TX, Limited General Obligation | | |
| | |
| | |
City of Mission TX, Certificates of Obligation, Limited General Obligation | | |
| | |
| | |
| | |
| | |
| | |
| | |
City of Mission TX, Limited General Obligation | | |
| | |
| | |
| | |
| | |
| | |
| | |
City of Mount Pleasant TX, Limited General Obligation | | |
| | |
| | |
City of Mount Pleasant TX, Texas Combination Tax and Certificates of Obligation, Limited General Obligation | | |
| | |
| | |
| | |
| | |
| | |
| | |
| | |
| | |
City of Port Arthur TX, Limited General Obligation | | |
| | |
| | |
The notes to the financial statements are an integral part of, and should be read in conjunction with, the financial statements.
| MainStay MacKay Short Term Municipal Fund |
| | |
Long-Term Municipal Bonds (continued) |
|
City of Port Arthur TX, Certificates of Obligation, Limited General Obligation | | |
| | |
| | |
City of Rio Grande City TX, Certificates of Obligation, Limited General Obligation | | |
| | |
| | |
| | |
| | |
| | |
| | |
City of San Antonio TX, Electric & Gas Systems, Revenue Bonds | | |
| | |
| | |
City of Sugar Land TX, Waterworks & Sewer System, Revenue Bonds | | |
| | |
Clear Lake City Water Authority, Unlimited General Obligation | | |
| | |
Clifton Higher Education Finance Corp., International Leadership of Texas, Revenue Bonds | | |
| | |
| | |
| | |
| | |
Clifton Higher Education Finance Corp. TX, IDEA Public Schools, Revenue Bonds | | |
| | |
| | |
| | |
| | |
Collin County Water Control & Improvement District No. 3, Unlimited General Obligation | | |
| | |
| | |
| | |
| | |
| | |
| | |
| | |
|
|
Comal County Water Control & Improvement District No. 6, Unlimited General Obligation | | |
| | |
| | |
| | |
| | |
| | |
| | |
| | |
| | |
| | |
| | |
| | |
| | |
Comal Independent School District, Unlimited General Obligation | | |
| | |
| | |
Corpus Christi Independent School District, Unlimited General Obligation | | |
| | |
(zero coupon), due 8/15/24 | | |
County of Harris TX, Limited General Obligation | | |
| | |
| | |
Dallas Area Rapid Transit, Revenue Bonds | | |
| | |
Dallas Fort Worth International Airport, Revenue Bonds | | |
| | |
| | |
| | |
| | |
| | |
| | |
Decatur Hospital Authority, Wise Health System, Revenue Bonds | | |
| | |
| | |
| | |
| | |
| | |
| | |
The notes to the financial statements are an integral part of, and should be read in conjunction with, the financial statements.
Portfolio of Investments April 30, 2022† (continued)
| | |
Long-Term Municipal Bonds (continued) |
|
Decatur Hospital Authority, Wise Health System, Revenue Bonds (continued) | | |
| | |
| | |
| | |
| | |
| | |
| | |
Denton County Municipal Utility District No. 6, Unlimited General Obligation | | |
| | |
| | |
| | |
| | |
| | |
| | |
| | |
| | |
| | |
| | |
| | |
| | |
DeSoto Independent School District, Unlimited General Obligation | | |
| | |
(zero coupon), due 8/15/26 | | |
Ector County Hospital District, Limited General Obligation | | |
| | |
| | |
| | |
| | |
Fort Bend County Levee Improvement District No. 15, Unlimited General Obligation | | |
| | |
| | |
Fort Bend County Municipal Utility District No. 134C, Unlimited General Obligation | | |
| | |
| | |
| | |
| | |
| | |
|
|
Fort Bend County Municipal Utility District No. 134C, Unlimited General Obligation (continued) | | |
| | |
| | |
| | |
| | |
Fort Bend County Municipal Utility District No. 169, Unlimited General Obligation | | |
| | |
| | |
Fort Bend County Municipal Utility District No. 194, Unlimited General Obligation | | |
| | |
| | |
| | |
| | |
| | |
| | |
Fort Bend County Municipal Utility District No. 206, Unlimited General Obligation | | |
| | |
| | |
| | |
| | |
| | |
| | |
Fort Bend County Municipal Utility District No. 48, Unlimited General Obligation | | |
| | |
| | |
| | |
| | |
| | |
| | |
Fort Bend County Municipal Utility District No. 57, Unlimited General Obligation | | |
| | |
| | |
| | |
| | |
| | |
| | |
The notes to the financial statements are an integral part of, and should be read in conjunction with, the financial statements.
| MainStay MacKay Short Term Municipal Fund |
| | |
Long-Term Municipal Bonds (continued) |
|
Fort Bend-Waller Counties Municipal Utility District No. 3, Unlimited General Obligation | | |
| | |
| | |
| | |
| | |
| | |
| | |
Galveston County Municipal Utility District No. 56, Unlimited General Obligation | | |
| | |
| | |
| | |
| | |
| | |
| | |
Gulfgate Redevelopment Authority, Tax Allocation | | |
| | |
| | |
| | |
| | |
Harris County Municipal Utility District No. 105, Unlimited General Obligation | | |
| | |
| | |
Harris County Municipal Utility District No. 196, Unlimited General Obligation | | |
| | |
| | |
Harris County Municipal Utility District No. 370, Unlimited General Obligation | | |
| | |
| | |
| | |
| | |
Harris County Municipal Utility District No. 423, Unlimited General Obligation | | |
| | |
| | |
| | |
|
|
Harris County Municipal Utility District No. 480, Unlimited General Obligation | | |
| | |
| | |
| | |
| | |
Harris County Municipal Utility District No. 489, Unlimited General Obligation | | |
| | |
| | |
| | |
| | |
Harris County Municipal Utility District No. 489, Green Bond, Unlimited General Obligation | | |
| | |
| | |
| | |
| | |
Harris County Municipal Utility District No. 50, Unlimited General Obligation | | |
| | |
| | |
| | |
| | |
| | |
| | |
| | |
| | |
Harris County Municipal Utility District No. 504, Unlimited General Obligation | | |
| | |
| | |
| | |
| | |
| | |
| | |
| | |
| | |
Harris County-Houston Sports Authority, Revenue Bonds, Senior Lien | | |
| | |
| | |
The notes to the financial statements are an integral part of, and should be read in conjunction with, the financial statements.
Portfolio of Investments April 30, 2022† (continued)
| | |
Long-Term Municipal Bonds (continued) |
|
Harris County-Houston Sports Authority, Revenue Bonds, Senior Lien (continued) | | |
| | |
| | |
| | |
| | |
Harris-Fort Bend Counties Municipal Utility District No. 3, Unlimited General Obligation | | |
| | |
| | |
| | |
| | |
| | |
| | |
Hidalgo County Drain District No. 1, Unlimited General Obligation | | |
| | |
Houston Higher Education Finance Corp., Houston Baptist University, Revenue Bonds | | |
| | |
| | |
| | |
Hunt Memorial Hospital District Charitable Health, Limited General Obligation | | |
| | |
| | |
| | |
| | |
Imperial Redevelopment District, Unlimited General Obligation | | |
| | |
| | |
| | |
| | |
| | |
| | |
| | |
| | |
| | |
| | |
| | |
| | |
| | |
|
|
Lazy Nine Municipal Utility District No. 1B, Unlimited General Obligation | | |
| | |
| | |
| | |
| | |
| | |
| | |
Leander Independent School District, Unlimited General Obligation | | |
Series D, Insured: PSF-GTD | | |
(zero coupon), due 8/15/24 | | |
Series D, Insured: PSF-GTD | | |
(zero coupon), due 8/15/40 | | |
Series C, Insured: PSF-GTD | | |
(zero coupon), due 8/15/43 | | |
Series C, Insured: PSF-GTD | | |
(zero coupon), due 8/15/45 | | |
Series C, Insured: PSF-GTD | | |
| | |
Lubbock-Cooper Independent School District, Unlimited General Obligation | | |
| | |
| | |
Mabank Independent School District, Unlimited General Obligation | | |
| | |
(zero coupon), due 8/15/26 | | |
Martin County Hospital District, Limited General Obligation | | |
| | |
| | |
| | |
| | |
Matagorda County Navigation District No. 1, Revenue Bonds | | |
| | |
| | |
Metropolitan Transit Authority of Harris County Sales & Use Tax, Revenue Bonds | | |
| | |
| | |
The notes to the financial statements are an integral part of, and should be read in conjunction with, the financial statements.
| MainStay MacKay Short Term Municipal Fund |
| | |
Long-Term Municipal Bonds (continued) |
|
Montgomery County Municipal Utility District No. 105, Unlimited General Obligation | | |
| | |
| | |
Montgomery County Municipal Utility District No. 132, Unlimited General Obligation | | |
| | |
| | |
Montgomery County Municipal Utility District No. 139, Unlimited General Obligation | | |
| | |
| | |
| | |
| | |
| | |
| | |
North Forest Municipal Utility District, Unlimited General Obligation | | |
| | |
| | |
North Fort Bend Water Authority, Revenue Bonds | | |
| | |
| | |
| | |
| | |
North Texas Municipal Water District, Sabine Creek Regional Wastewater Systems Project, Revenue Bonds | | |
| | |
| | |
Northwest Harris County Municipal Utility District No. 10, Green Bond, Unlimited General Obligation | | |
| | |
| | |
| | |
| | |
Northwest Harris County Municipal Utility District No. 19, Unlimited General Obligation | | |
| | |
| | |
| | |
|
|
Northwest Harris County Municipal Utility District No. 19, Unlimited General Obligation (continued) | | |
| | |
| | |
| | |
| | |
| | |
| | |
Northwest Independent School District, Capital Appreciation, Unlimited General Obligation | | |
| | |
(zero coupon), due 2/15/25 | | |
Northwest Independent School District, Unlimited General Obligation | | |
| | |
| | |
Pecan Grove Municipal Utility District, Unlimited General Obligation | | |
| | |
| | |
Port Arthur Independent School District, Unlimited General Obligation | | |
| | |
| | |
Remington Municipal Utility District No. 1, Unlimited General Obligation | | |
| | |
| | |
Sienna Municipal Utility District No. 4, Unlimited General Obligation | | |
| | |
| | |
| | |
| | |
| | |
| | |
Sonterra Municipal Utility District, Unlimited General Obligation | | |
| | |
| | |
| | |
| | |
| | |
| | |
The notes to the financial statements are an integral part of, and should be read in conjunction with, the financial statements.
Portfolio of Investments April 30, 2022† (continued)
| | |
Long-Term Municipal Bonds (continued) |
|
Sonterra Municipal Utility District, Unlimited General Obligation (continued) | | |
| | |
| | |
Southeast Williamson County Municipal Utility District No. 1, Unlimited General Obligation | | |
| | |
| | |
| | |
| | |
| | |
| | |
| | |
| | |
Southwest Houston Redevelopment Authority, Revenue Bonds | | |
| | |
| | |
| | |
| | |
| | |
| | |
Tarrant County Cultural Education Facilities Finance Corp., Hendrick Medical Center Project, Revenue Bonds | | |
| | |
| | |
| | |
| | |
| | |
| | |
Tarrant County Cultural Education Facilities Finance Corp., Methodist Hospitals of Dallas, Revenue Bonds | | |
| | |
Tarrant County Cultural Education Facilities Finance Corp., Buckner Retirement Services, Inc. Project, Revenue Bonds | | |
| | |
Texas Municipal Gas Acquisition & Supply Corp. III, Revenue Bonds | | |
| | |
| | |
|
|
Texas Municipal Power Agency, Transmission System, Revenue Bonds | | |
| | |
| | |
| | |
| | |
| | |
| | |
Texas Public Finance Authority, Revenue Bonds | | |
| | |
| | |
Timber Lane Utility District, Unlimited General Obligation | | |
| | |
| | |
| | |
| | |
Travis County Water Control & Improvement District, Unlimited General Obligation | | |
| | |
| | |
| | |
| | |
| | |
| | |
| | |
| | |
Trinity River Authority, Ten Mile Creek System, Revenue Bonds | | |
| | |
Tyler Independent School District, Unlimited General Obligation | | |
| | |
| | |
Viridian Municipal Management District, Unlimited General Obligation | | |
| | |
| | |
| | |
| | |
| | |
| | |
| | |
| | |
The notes to the financial statements are an integral part of, and should be read in conjunction with, the financial statements.
| MainStay MacKay Short Term Municipal Fund |
| | |
Long-Term Municipal Bonds (continued) |
|
Viridian Municipal Management District, Unlimited Tax Road Improvement, Unlimited General Obligation | | |
| | |
| | |
| | |
| | |
Williamson County Municipal Utility District No. 19, Unlimited General Obligation | | |
| | |
| | |
| | |
| | |
| | |
| | |
| | |
|
Matching Fund Special Purpose Securitization Corp., Revenue Bonds | | |
| | |
| | |
| | |
| | |
Virgin Islands Public Finance Authority, Gross Receipts Taxes Loan, Revenue Bonds | | |
| | |
| | |
| | |
| | |
| | |
|
City of Salt Lake City UT, Airport, Revenue Bonds (b) | | |
| | |
| | |
| | |
| | |
| | |
| | |
| | |
| | |
| | |
|
|
City of Salt Lake City UT, Airport, Revenue Bonds (b) (continued) | | |
| | |
| | |
Utah Charter School Finance Authority, North Star Academy Project, Revenue Bonds | | |
| | |
(zero coupon), due 4/15/25 | | |
Utah Charter School Finance Authority, Spectrum Academy Project, Revenue Bonds | | |
| | |
| | |
| | |
| | |
| | |
| | |
Utah Charter School Finance Authority, Revenue Bonds | | |
Series A, Insured: UT CSCE | | |
| | |
Series A, Insured: UT CSCE | | |
| | |
Utah Charter School Finance Authority, Summit Academy, Inc. Project, Revenue Bonds | | |
| | |
| | |
Utah Infrastructure Agency, Syracuse City Project, Revenue Bonds | | |
| | |
| | |
| | |
| | |
Utah Infrastructure Agency, Revenue Bonds | | |
| | |
| | |
| | |
| | |
| | |
Utah Transit Authority, Revenue Bonds | | |
| | |
| | |
| | |
The notes to the financial statements are an integral part of, and should be read in conjunction with, the financial statements.
Portfolio of Investments April 30, 2022† (continued)
| | |
Long-Term Municipal Bonds (continued) |
|
Vermont Student Assistance Corp., Revenue Bonds, Senior Lien (b) | | |
| | |
| | |
| | |
| | |
| | |
| | |
Vermont Student Assistance Corp., Revenue Bonds (b) | | |
| | |
| | |
| | |
| | |
| | |
|
Capital Region Airport Commission, Revenue Bonds | | |
| | |
| | |
Lynchburg Economic Development Authority, Centra Health Obligated Group, Revenue Bonds | | |
| | |
Norfolk Airport Authority, Revenue Bonds | | |
| | |
| | |
Rockingham County Economic Development Authority, Sunnyside Presbyterian Home, Revenue Bonds | | |
| | |
Spotsylvania County Economic Development Authority, Revenue Bonds | | |
| | |
Virginia Commonwealth Transportation Board, U.S. Roure 58 Corridor Program, Revenue Bonds | | |
| | |
| | |
| | |
|
|
Virginia Small Business Financing Authority, LifeSpire of Virginia, Revenue Bonds | | |
| | |
| | |
| | |
| | |
| | |
Virginia Small Business Financing Authority, National Senior Campuses, Inc. Obligated Group, Revenue Bonds | | |
| | |
| | |
| | |
|
Benton County School District No. 17 Kennewick, Unlimited General Obligation | | |
Insured: School Bond Guaranty | | |
| | |
Kittitas County School District No. 401 Ellensburg, Unlimited General Obligation | | |
Insured: School Bond Guaranty | | |
| | |
Northwest Open Access Network, Revenue Bonds | | |
| | |
| | |
Pend Oreille County Public Utility District No. 1 Box Canyon, Green Bond, Revenue Bonds | | |
| | |
Spokane Public Facilities District, Revenue Bonds | | |
| | |
| | |
State of Washington, Senior 520 Corridor Program, Revenue Bonds | | |
| | |
Washington Higher Education Facilities Authority, Whitman College Project, Revenue Bonds | | |
| | |
| | |
The notes to the financial statements are an integral part of, and should be read in conjunction with, the financial statements.
| MainStay MacKay Short Term Municipal Fund |
| | |
Long-Term Municipal Bonds (continued) |
|
Washington Higher Education Facilities Authority, Whitworth University Project, Revenue Bonds | | |
| | |
| | |
| | |
Washington Higher Education Facilities Authority, Seattle University Project, Revenue Bonds | | |
| | |
| | |
Washington State Convention Center Public Facilities District, Revenue Bonds | | |
| | |
| | |
|
City of Fairmont WV, Waterworks, Revenue Bonds | | |
| | |
| | |
| | |
| | |
City of Wheeling WV, Waterworks & Sewerage System, Revenue Bonds | | |
| | |
| | |
Morgantown Utility Board, Inc., Green Bond, Revenue Bonds | | |
| | |
| | |
West Virginia Commissioner of Highways, Surface Transportation Improvements, Revenue Bonds | | |
| | |
| | |
West Virginia Hospital Finance Authority, Cabell Huntington Hospital Obligated Group, Revenue Bonds | | |
| | |
| | |
| | |
|
|
City of Kaukauna WI, Electric System, Revenue Bonds | | |
| | |
| | |
| | |
| | |
City of Milwaukee WI, Unlimited General Obligation | | |
| | |
| | |
City of Racine WI, Waterworks System, Revenue Bonds | | |
| | |
| | |
Omro School District, Unlimited General Obligation | | |
| | |
| | |
| | |
| | |
Public Finance Authority, United Methodist Retirement Homes, Inc., Revenue Bonds | | |
| | |
| | |
| | |
| | |
| | |
| | |
Public Finance Authority, Northwest Nazarene University, Revenue Bonds | | |
| | |
Town of Manitowish Waters WI, Unlimited General Obligation | | |
| | |
| | |
| | |
| | |
| | |
| | |
Village of Fox Crossing WI, Waterworks System & Sewerage System, Revenue Bonds | | |
| | |
| | |
The notes to the financial statements are an integral part of, and should be read in conjunction with, the financial statements.
Portfolio of Investments April 30, 2022† (continued)
| | |
Long-Term Municipal Bonds (continued) |
|
Village of Mount Pleasant, Revenue Bonds | | |
| | |
| | |
| | |
|
County of Laramie WY, Cheyenne Regional Medical Center Project, Revenue Bonds | | |
| | |
| | |
| | |
| | |
| | |
Total Long-Term Municipal Bonds
(Cost $1,338,110,195) | | |
Short-Term Municipal Notes 17.0% |
|
Black Belt Energy Gas District, Gas Project No.7, Revenue Bonds | | |
| | |
| | |
Southeast Alabama Gas Supply District (The), Project No. 1, Revenue Bonds | | |
| | |
| | |
| | |
|
Arizona Health Facilities Authority, Banner Health, Revenue Bonds | | |
| | |
| | |
|
California Infrastructure and Economic Development Bank, Brightline West Passenger Rail Project, Revenue Bonds | | |
| | |
0.85%, due 1/1/50 (b)(c)(g) | | |
| | |
|
|
California Municipal Finance Authority, Waste Management, Inc. Project, Revenue Bonds | | |
0.70%, due 12/1/44 (b)(g) | | |
| | |
|
Bartow County Development Authority, Georgia Power Company Plant Bowen Project, Revenue Bonds | | |
| | |
Development Authority of Burke County (The), Georgia Power Co. Vogtle Project, Revenue Bonds | | |
| | |
Development Authority of Burke County (The), Georgia Power Co. Vogtle Project, Revenue Bonds, First Series | | |
| | |
Development Authority of Burke County (The), Georgia Power Company Plant Vogtle Project, Revenue Bonds | | |
| | |
| | |
|
Illinois Finance Authority, Presbyterian Homes Obligated Group, Revenue Bonds | | |
| | |
| | |
Illinois Finance Authority, Edward-Elmhurst Healthcare, Revenue Bonds | | |
| | |
| | |
|
Indiana Finance Authority, Fulcrum Centerpoint LLC, Revenue Bonds | | |
0.28%, due 12/15/45 (b)(g) | | |
Indiana Finance Authority, Deaconess Health System, Revenue Bonds | | |
| | |
| | |
The notes to the financial statements are an integral part of, and should be read in conjunction with, the financial statements.
| MainStay MacKay Short Term Municipal Fund |
| | |
Short-Term Municipal Notes (continued) |
|
Indiana Finance Authority, Indianapolis Power & Light Co., Revenue Bonds | | |
| | |
0.95%, due 12/1/38 (b)(g) | | |
| | |
|
Parish of St. John the Baptist LA, Marathon Oil Corp. Project, Revenue Bonds (g) | | |
| | |
| | |
| | |
| | |
|
City of Detroit MI, Water Sewage Disposal System, Revenue Bonds | | |
| | |
| | |
|
Montana Facility Finance Authority, Billings Clinic Obligated Group, Revenue Bonds | | |
| | |
|
County of Douglas NE, Creighton University, Revenue Bonds | | |
| | |
| | |
|
State of Nevada Department of Business & Industry, Republic Services, Inc., Revenue Bonds | | |
0.28%, due 12/1/26 (b)(c)(g) | | |
|
New Jersey Turnpike Authority, Revenue Bonds (g) | | |
| | |
| | |
| | |
|
|
New Jersey Turnpike Authority, Revenue Bonds (g) (continued) | | |
| | |
| | |
| | |
|
Metropolitan Transportation Authority, Revenue Bonds (g) | | |
Series D-2A-1, Insured: AGM | | |
| | |
Series D-2A-2, Insured: AGM | | |
| | |
Metropolitan Transportation Authority, Dedicated Tax Fund, Revenue Bonds | | |
| | |
| | |
New York City Housing Development Corp., Multi-Family Housing, Revenue Bonds | | |
Series F2, Insured: FHA 542(C) | | |
| | |
Triborough Bridge & Tunnel Authority, MTA Bridges & Tunnels, Revenue Bonds | | |
| | |
| | |
| | |
|
Ohio Air Quality Development Authority, American Electric Power Co. Project, Revenue Bonds (g) | | |
| | |
| | |
| | |
Ohio Higher Educational Facility Commission, Case Western Reserve University, Revenue Bonds | | |
| | |
| | |
State of Ohio, University Hospitals Health System, Inc., Revenue Bonds | | |
| | |
| | |
The notes to the financial statements are an integral part of, and should be read in conjunction with, the financial statements.
Portfolio of Investments April 30, 2022† (continued)
| | |
Short-Term Municipal Notes (continued) |
|
State of Ohio, Cleveland Clinic Health System Obligated Group, Revenue Bonds | | |
| | |
| | |
|
County of Allegheny PA, Unlimited General Obligation | | |
Series C-59B, Insured: AGM | | |
| | |
Lehigh County General Purpose Authority, Muhlenberg College Project, Revenue Bonds | | |
| | |
Lehigh County Industrial Development Authority, PPL Electric Utilities Corp., Revenue Bonds | | |
| | |
| | |
Pennsylvania Economic Development Financing Authority, Waste Management, Inc., Revenue Bonds | | |
| | |
| | |
Pennsylvania Higher Educational Facilities Authority, Indiana University, Revenue Bonds | | |
| | |
| | |
University of Pittsburgh-of the Commonwealth System of Higher Education, Revenue Bonds | | |
| | |
| | |
|
Rhode Island Health and Educational Building Corp., Bryant University, Revenue Bonds | | |
| | |
|
Patriots Energy Group Financing Agency, Revenue Bonds | | |
| | |
| | |
| | |
|
|
Harris County Cultural Education Facilities Finance Corp., Baylor College of Medicine, Revenue Bonds | | |
| | |
| | |
Texas Municipal Gas Acquisition & Supply Corp. II, Revenue Bonds | | |
| | |
| | |
| | |
|
Virginia Small Business Financing Authority, Capital Beltway Express LLC, Revenue Bonds, Sub. Lien | | |
2.00%, due 12/31/23 (d)(g) | | |
|
County of King WA, Sewer, Revenue Bonds, Junior Lien | | |
| | |
| | |
Washington Health Care Facilities Authority, Fred Hutchinson Cancer Research Center, Revenue Bonds | | |
| | |
| | |
Total Short-Term Municipal Notes
(Cost $282,362,735) | | |
Total Municipal Bonds
(Cost $1,620,472,930) | | |
|
|
|
|
| | |
| | |
| | |
| | |
The notes to the financial statements are an integral part of, and should be read in conjunction with, the financial statements.
| MainStay MacKay Short Term Municipal Fund |
| | |
Corporate Bonds (continued) |
Healthcare-Services 0.0% ‡ |
Baptist Health Obligated Group | | |
| | |
| | |
Total Corporate Bonds
(Cost $1,975,000) | | |
Total Long-Term Bonds
(Cost $1,975,000) | | |
Total Investments
(Cost $1,622,447,930) | | |
Other Assets, Less Liabilities | | |
| | |
| Percentages indicated are based on Fund net assets. |
| Less than one-tenth of a percent. |
| Coupon rate may change based on changes of the underlying collateral or prepayments of principal. Rate shown was the rate in effect as of April 30, 2022. |
| Interest on these securities was subject to alternative minimum tax. |
| May be sold to institutional investors only under Rule 144A or securities offered pursuant to Section 4(a)(2) of the Securities Act of 1933, as amended. |
| Step coupon—Rate shown was the rate in effect as of April 30, 2022. |
| Floating rate—Rate shown was the rate in effect as of April 30, 2022. |
| Delayed delivery security. |
| Variable-rate demand notes (VRDNs)—Provide the right to sell the security at face value on either that day or within the rate-reset period. VRDNs will normally trade as if the maturity is the earlier put date, even though stated maturity is longer. The interest rate is reset on the put date at a stipulated daily, weekly, monthly, quarterly, or other specified time interval to reflect current market conditions. These securities do not indicate a reference rate and spread in their description. The maturity date shown is the final maturity. |
|
AGC—Assured Guaranty Corp. |
AGM—Assured Guaranty Municipal Corp. |
AMBAC—Ambac Assurance Corp. |
BAM—Build America Mutual Assurance Co. |
BHAC—Berkshire Hathaway Assurance Corp. |
|
FHA—Federal Housing Administration |
ICC—Insured Custody Certificates |
MUN GOVT GTD—Municipal Government Guaranteed |
NATL-RE—National Public Finance Guarantee Corp. |
PSF-GTD—Permanent School Fund Guaranteed |
Q-SBLF—Qualified School Board Loan Fund |
SD CRED PROG—School District Credit Enhancement Program |
UT CSCE—Utah Charter School Credit Enhancement Program |
The following is a summary of the fair valuations according to the inputs used as of April 30, 2022, for valuing the Fund’s assets:
| Quoted
Prices in
Active
Markets for
Identical
Assets
(Level 1) | Significant
Other
Observable
Inputs
(Level 2) | Significant
Unobservable
Inputs
(Level 3) | |
| | | | |
Investments in Securities (a) | | | | |
| | | | |
Long-Term Municipal Bonds | | | | |
Short-Term Municipal Notes | | | | |
| | | | |
| | | | |
| | | | |
| | | | |
Total Investments in Securities | | | | |
| For a complete listing of investments and their industries, see the Portfolio of Investments. |
The notes to the financial statements are an integral part of, and should be read in conjunction with, the financial statements.
Statement of Assets and Liabilities as of April 30, 2022
|
Investment in securities, at value
(identified cost $1,622,447,930) | |
| |
| |
Investment securities sold | |
| |
| |
| |
| |
|
| |
| |
Investment securities purchased | |
| |
| |
| |
NYLIFE Distributors (See Note 3) | |
Transfer agent (See Note 3) | |
Shareholder communication | |
| |
| |
| |
| |
| |
| |
Composition of Net Assets |
Shares of beneficial interest outstanding (par value of $.001 per share) unlimited number of shares authorized | |
Additional paid-in-capital | |
| |
Total distributable earnings (loss) | |
| |
| |
Net assets applicable to outstanding shares | |
Shares of beneficial interest outstanding | |
Net asset value per share outstanding | |
Maximum sales charge (1.00% of offering price) | |
Maximum offering price per share outstanding | |
| |
Net assets applicable to outstanding shares | |
Shares of beneficial interest outstanding | |
Net asset value and offering price per share outstanding | |
| |
Net assets applicable to outstanding shares | |
Shares of beneficial interest outstanding | |
Net asset value per share outstanding | |
Maximum sales charge (0.50% of offering price) | |
Maximum offering price per share outstanding | |
| |
Net assets applicable to outstanding shares | |
Shares of beneficial interest outstanding | |
Net asset value and offering price per share outstanding | |
The notes to the financial statements are an integral part of, and should be read in conjunction with, the financial statements.
| MainStay MacKay Short Term Municipal Fund |
Statement of Operations for the year ended April 30, 2022
|
| |
| |
| |
| |
Distribution/Service—Class A (See Note 3) | |
Distribution/Service—Class A2 (See Note 3) | |
Distribution/Service—Investor Class (See Note 3) | |
Transfer agent (See Note 3) | |
| |
| |
| |
Shareholder communication | |
| |
| |
Total expenses before waiver/reimbursement | |
Expense waiver/reimbursement from Manager (See Note 3) | |
| |
Net investment income (loss) | |
Realized and Unrealized Gain (Loss) |
Net realized gain (loss) on: | |
Unaffiliated investment transactions | |
| |
| |
Net change in unrealized appreciation (depreciation) on: | |
| |
| |
Net change in unrealized appreciation (depreciation) | |
Net realized and unrealized gain (loss) | |
Net increase (decrease) in net assets resulting from operations | |
The notes to the financial statements are an integral part of, and should be read in conjunction with, the financial statements.
Statements of Changes in Net Assets
for the years ended April 30, 2022 and April 30, 2021
| | |
Increase (Decrease) in Net Assets |
| | |
Net investment income (loss) | | |
| | |
Net change in unrealized appreciation (depreciation) | | |
Net increase (decrease) in net assets resulting from operations | | |
Distributions to shareholders: | | |
| | |
| | |
| | |
| | |
Total distributions to shareholders | | |
Capital share transactions: | | |
Net proceeds from sales of shares | | |
Net asset value of shares issued to shareholders in reinvestment of distributions | | |
| | |
Increase (decrease) in net assets derived from capital share transactions | | |
Net increase (decrease) in net assets | | |
|
| | |
| | |
The notes to the financial statements are an integral part of, and should be read in conjunction with, the financial statements.
| MainStay MacKay Short Term Municipal Fund |
Financial Highlights selected per share data and ratios
| |
| | | | | |
Net asset value at beginning of year | | | | | |
Net investment income (loss) (a) | | | | | |
Net realized and unrealized gain (loss) | | | | | |
Total from investment operations | | | | | |
| | | | | |
From net investment income | | | | | |
Net asset value at end of year | | | | | |
Total investment return (b) | | | | | |
Ratios (to average net assets)/Supplemental Data: | | | | | |
Net investment income (loss) | | | | | |
| | | | | |
Expenses (before waiver/reimbursement) | | | | | |
| | | | | |
Net assets at end of year (in 000’s) | | | | | |
| Per share data based on average shares outstanding during the year. |
| Total investment return is calculated exclusive of sales charges and assumes the reinvestment of dividends and distributions. For periods of less than one year, total return is not annualized. |
| Total investment return may reflect adjustments to conform to generally accepted accounting principles. |
| The portfolio turnover rate includes variable rate demand notes. |
| | September 30, 2020^ through
April 30,
2021 |
| |
Net asset value at beginning of period | | |
Net investment income (loss) (a) | | |
Net realized and unrealized gain (loss) | | |
Total from investment operations | | |
| | |
From net investment income | | |
Net asset value at end of period | | |
Total investment return (b) | | |
Ratios (to average net assets)/Supplemental Data: | | |
Net investment income (loss) | | |
| | |
Portfolio turnover rate (c) | | |
Net assets at end of period (in 000's) | | |
| Based on the net asset value of Class A as of September 30, 2020. |
| |
| |
| Per share data based on average shares outstanding during the period. |
| Total investment return is calculated exclusive of sales charges and assumes the reinvestment of dividends and distributions. For periods of less than one year, total return is not annualized. |
| The portfolio turnover rate includes variable rate demand notes. |
The notes to the financial statements are an integral part of, and should be read in conjunction with, the financial statements.
Financial Highlights selected per share data and ratios
| |
| | | | | |
Net asset value at beginning of year | | | | | |
Net investment income (loss) (a) | | | | | |
Net realized and unrealized gain (loss) | | | | | |
Total from investment operations | | | | | |
| | | | | |
From net investment income | | | | | |
Net asset value at end of year | | | | | |
Total investment return (b) | | | | | |
Ratios (to average net assets)/Supplemental Data: | | | | | |
Net investment income (loss) | | | | | |
| | | | | |
Expenses (before waiver/reimbursement) | | | | | |
| | | | | |
Net assets at end of year (in 000's) | | | | | |
| Per share data based on average shares outstanding during the year. |
| Total investment return is calculated exclusive of sales charges and assumes the reinvestment of dividends and distributions. For periods of less than one year, total return is not annualized. |
| The portfolio turnover rate includes variable rate demand notes. |
| |
| | | | | |
Net asset value at beginning of year | | | | | |
Net investment income (loss) (a) | | | | | |
Net realized and unrealized gain (loss) | | | | | |
Total from investment operations | | | | | |
| | | | | |
From net investment income | | | | | |
Net asset value at end of year | | | | | |
Total investment return (b) | | | | | |
Ratios (to average net assets)/Supplemental Data: | | | | | |
Net investment income (loss) | | | | | |
| | | | | |
Expenses (before waiver/reimbursement) | | | | | |
| | | | | |
Net assets at end of year (in 000’s) | | | | | |
| Per share data based on average shares outstanding during the year. |
| Total investment return is calculated exclusive of sales charges and assumes the reinvestment of dividends and distributions. For periods of less than one year, total return is not annualized. |
| The portfolio turnover rate includes variable rate demand notes. |
The notes to the financial statements are an integral part of, and should be read in conjunction with, the financial statements.
| MainStay MacKay Short Term Municipal Fund |
Notes to Financial Statements
Note 1-Organization and Business
MainStay Funds Trust (the “Trust”) was organized as a Delaware statutory trust on April 28, 2009. The Trust is registered under the Investment Company Act of 1940, as amended (the “1940 Act”), as an open-end management investment company, and is comprised of thirty-three funds (collectively referred to as the “Funds”). These financial statements and notes relate to the MainStay MacKay Short Term Municipal Fund (the "Fund"), a “diversified” fund, as that term is defined in the 1940 Act, as interpreted or modified by regulatory authorities having jurisdiction, from time to time.
The following table lists the Fund's share classes that have been registered and commenced operations:
| Class R6 shares were registered for sale effective as of February 28, 2017 and SIMPLE Class shares were registered for sale effective as of August 31, 2020 but have not yet commenced operations. |
Class A and Investor Class shares are offered at net asset value (“NAV”) per share plus an initial sales charge. No initial sales charge applies to investments of $250,000 or more (and certain other qualified purchases) in Class A and Investor Class shares. However, a contingent deferred sales charge (“CDSC”) of 0.50% may be imposed on certain redemptions made within 12 months of the date of purchase on shares that were purchased without an initial sales charge. Class A2 shares are offered at NAV without an initial sales charge, although a 0.50% CDSC may be imposed on certain redemptions of such shares made within one year of the date of purchase of Class A2 shares. Class I shares are offered at NAV without a sales charge. Class R6 shares are currently expected to be offered at NAV without a sales charge. SIMPLE Class shares are expected to be offered at NAV without a sales charge if such shares are offered in the future. Additionally, Investor Class shares may convert automatically to Class A shares. Under certain circumstances and as may be permitted by the Trust’s multiple class plan pursuant to Rule 18f-3 under the 1940 Act, specified share classes of the Fund may be converted to one or more other share classes of the Fund as disclosed in the capital share transactions within these Notes. The classes of shares have the same voting (except for issues that relate solely to one class), dividend, liquidation and other rights, and the same terms and conditions, except that under distribution plans pursuant to Rule 12b-1 under the 1940 Act, Class A, Investor Class and SIMPLE Class shares are subject to a distribution and/or service fee. Class I and Class R6 shares are not subject to a distribution and/or service fee.
The Fund's investment objective is to seek current income exempt from regular federal income tax.
Note 2–Significant Accounting Policies
The Fund is an investment company and accordingly follows the investment company accounting and reporting guidance of the Financial Accounting Standards Board (“FASB”) Accounting Standards Codification Topic 946 Financial Services—Investment Companies. The Fund prepares its financial statements in accordance with generally accepted accounting principles (“GAAP”) in the United States of America and follows the significant accounting policies described below.
(A) Securities Valuation. Investments are usually valued as of the close of regular trading on the New York Stock Exchange (the "Exchange") (usually 4:00 p.m. Eastern time) on each day the Fund is open for business ("valuation date").
The Board of Trustees of the Trust (the "Board") adopted procedures establishing methodologies for the valuation of the Fund's securities and other assets and delegated the responsibility for valuation determinations under those procedures to the Valuation Committee of the Trust (the “Valuation Committee”). The procedures state that, subject to the oversight of the Board and unless otherwise noted, the responsibility for the day-to-day valuation of portfolio assets (including fair value measurements for the Fund's assets and liabilities) rests with New York Life Investment Management LLC (“New York Life Investments” or the "Manager"), aided to whatever extent necessary by the Subadvisor (as defined in Note 3(A)). To assess the appropriateness of security valuations, the Manager, the Subadvisor or the Fund's third-party service provider, who is subject to oversight by the Manager, regularly compares prior day prices, prices on comparable securities and the sale prices to the prior and current day prices and challenges prices with changes exceeding certain tolerance levels with third-party pricing services or broker sources.
The Board authorized the Valuation Committee to appoint a Valuation Subcommittee (the “Subcommittee”) to establish the prices of securities for which market quotations are not readily available or the prices of which are not otherwise readily determinable under the procedures. The Subcommittee meets (in person, via electronic mail or via teleconference) on an as-needed basis. The Valuation Committee meets to ensure that actions taken by the Subcommittee were appropriate.
For those securities valued through either a standardized fair valuation methodology or a fair valuation measurement, the Subcommittee deals with such valuation and the Valuation Committee reviews and affirms, if appropriate, the reasonableness of the valuation based on such methodologies and measurements on a regular basis after considering information that is reasonably available and deemed relevant by the Valuation Committee. Any action taken by the Subcommittee with respect to the valuation of a portfolio security or other asset is submitted for review and ratification (if appropriate) to the Valuation Committee and the Board at the next regularly scheduled meeting.
"Fair value" is defined as the price the Fund would reasonably expect to receive upon selling an asset or liability in an orderly transaction to an independent buyer in the principal or most advantageous market for the
Notes to Financial Statements (continued)
asset or liability. Fair value measurements are determined within a framework that establishes a three-tier hierarchy that maximizes the use of observable market data and minimizes the use of unobservable inputs to establish a classification of fair value measurements for disclosure purposes. "Inputs" refer broadly to the assumptions that market participants would use in pricing the asset or liability, including assumptions about risk, such as the risk inherent in a particular valuation technique used to measure fair value using a pricing model and/or the risk inherent in the inputs for the valuation technique. Inputs may be observable or unobservable. Observable inputs reflect the assumptions market participants would use in pricing the asset or liability based on market data obtained from sources independent of the Fund. Unobservable inputs reflect the Fund’s own assumptions about the assumptions market participants would use in pricing the asset or liability based on the information available. The inputs or methodology used for valuing assets or liabilities may not be an indication of the risks associated with investing in those assets or liabilities. The three-tier hierarchy of inputs is summarized below.
• Level 1—quoted prices in active markets for an identical asset or liability
• Level 2—other significant observable inputs (including quoted prices for a similar asset or liability in active markets, interest rates and yield curves, prepayment speeds, credit risk, etc.)
• Level 3—significant unobservable inputs (including the Fund's own assumptions about the assumptions that market participants would use in measuring fair value of an asset or liability)
The level of an asset or liability within the fair value hierarchy is based on the lowest level of an input, both individually and in the aggregate, that is significant to the fair value measurement. The aggregate value by input level of the Fund’s assets and liabilities as of April 30, 2022, is included at the end of the Portfolio of Investments.
The Fund may use third-party vendor evaluations, whose prices may be derived from one or more of the following standard inputs, among others:
| |
| |
| |
| • Reference data (corporate actions or material event notices) |
• Industry and economic events | |
• Monthly payment information | |
An asset or liability for which market values cannot be measured using the methodologies described above is valued by methods deemed reasonable in good faith by the Valuation Committee, following the procedures established by the Board, to represent fair value. Under these procedures, the Fund generally uses a market-based approach which may use related or comparable assets or liabilities, recent transactions, market multiples, book values and other relevant information. The Fund may also use an income-based valuation approach in which the
anticipated future cash flows of the asset or liability are discounted to calculate fair value. Discounts may also be applied due to the nature and/or duration of any restrictions on the disposition of the asset or liability. Fair value represents a good faith approximation of the value of a security. Fair value determinations involve the consideration of a number of subjective factors, an analysis of applicable facts and circumstances and the exercise of judgment. As a result, it is possible that the fair value for a security determined in good faith in accordance with the Fund's valuation procedures may differ from valuations for the same security determined by other funds using their own valuation procedures. Although the Fund's valuation procedures are designed to value a security at the price the Fund may reasonably expect to receive upon the security's sale in an orderly transaction, there can be no assurance that any fair value determination thereunder would, in fact, approximate the amount that the Fund would actually realize upon the sale of the security or the price at which the security would trade if a reliable market price were readily available. During the year ended April 30, 2022, there were no material changes to the fair value methodologies.
Securities which may be valued in this manner include, but are not limited to: (i) a security for which trading has been halted or suspended; (ii) a debt security that has recently gone into default and for which there is not a current market quotation; (iii) a security of an issuer that has entered into a restructuring; (iv) a security that has been delisted from a national exchange; (v) a security for which the market price is not readily available from a third-party pricing source or, if so provided, does not, in the opinion of the Manager or the Subadvisor, reflect the security's market value; (vi) a security subject to trading collars for which no or limited trading takes place; and (vii) a security whose principal market has been temporarily closed at a time when, under normal conditions, it would be open. Securities valued in this manner are generally categorized as Level 3 in the hierarchy. No securities held by the Fund as of April 30, 2022, were fair valued in such a manner.
Municipal debt securities are valued at the evaluated mean prices supplied by a pricing agent or broker selected by the Manager, in consultation with the Subadvisor. The evaluations are market-based measurements processed through a pricing application and represents the pricing agent's good faith determination as to what a holder may receive in an orderly transaction under market conditions. The rules-based logic utilizes valuation techniques that reflect participants' assumptions and vary by asset class and per methodology, maximizing the use of relevant observable data including quoted prices for similar assets, benchmark yield curves and market corroborated inputs. The evaluated bid or mean prices are deemed by the Manager, in consultation with the Subadvisor, to be representative of market values, at the regular close of trading of the Exchange on each valuation date. Municipal debt securities purchased on a delayed delivery basis are marked to market daily until settlement at the forward settlement date. Municipal debt securities are generally categorized as Level 2 in the hierarchy.
The information above is not intended to reflect an exhaustive list of the methodologies that may be used to value portfolio investments. The valuation procedures permit the use of a variety of valuation
| MainStay MacKay Short Term Municipal Fund |
methodologies in connection with valuing portfolio investments. The methodology used for a specific type of investment may vary based on the market data available or other considerations. The methodologies summarized above may not represent the specific means by which portfolio investments are valued on any particular business day.
(B) Income Taxes. The Fund's policy is to comply with the requirements of the Internal Revenue Code of 1986, as amended (the “Internal Revenue Code”), applicable to regulated investment companies and to distribute all of its taxable income to the shareholders of the Fund within the allowable time limits.
The Manager evaluates the Fund’s tax positions to determine if the tax positions taken meet the minimum recognition threshold in connection with accounting for uncertainties in income tax positions taken or expected to be taken for the purposes of measuring and recognizing tax liabilities in the financial statements. Recognition of tax benefits of an uncertain tax position is permitted only to the extent the position is “more likely than not” to be sustained assuming examination by taxing authorities. The Manager analyzed the Fund's tax positions taken on federal, state and local income tax returns for all open tax years (for up to three tax years) and has concluded that no provisions for federal, state and local income tax are required in the Fund's financial statements. The Fund's federal, state and local income tax and federal excise tax returns for tax years for which the applicable statutes of limitations have not expired are subject to examination by the Internal Revenue Service and state and local departments of revenue.
(C) Dividends and Distributions to Shareholders. Dividends and distributions are recorded on the ex-dividend date. The Fund intends to declare dividends from net investment income, if any, daily and intends to pay them at least monthly and distributions from net realized capital and currency gains, if any, at least annually. Unless a shareholder elects otherwise, all dividends and distributions are reinvested at NAV in the same class of shares of the Fund. Dividends and distributions to shareholders are determined in accordance with federal income tax regulations and may differ from determinations using GAAP.
(D) Security Transactions and Investment Income. The Fund records security transactions on the trade date. Realized gains and losses on security transactions are determined using the identified cost method. Interest income is accrued as earned using the effective interest rate method. Distributions received from real estate investment trusts may be classified as dividends, capital gains and/or return of capital. Discounts and premiums on securities purchased, other than temporary cash investments that mature in 60 days or less at the time of purchase, for the Fund are accreted and amortized, respectively, on the effective interest rate method.
Investment income and realized and unrealized gains and losses on investments of the Fund are allocated pro rata to the separate classes of shares based upon their relative net assets on the date the income is earned or realized and unrealized gains and losses are incurred.
The Fund may place a debt security on non-accrual status and reduce related interest income by ceasing current accruals and writing off all or a portion of any interest receivables when the collection of all or a portion of such interest has become doubtful. A debt security is removed from non-accrual status when the issuer resumes interest payments or when collectability of interest is reasonably assured.
(E) Expenses. Expenses of the Trust are allocated to the individual Funds in proportion to the net assets of the respective Funds when the expenses are incurred, except where direct allocations of expenses can be made. Expenses (other than transfer agent expenses and fees incurred under the shareholder services plans and/or the distribution plans further discussed in Note 3(B)) are allocated to separate classes of shares pro rata based upon their relative net assets on the date the expenses are incurred. The expenses borne by the Fund, including those of related parties to the Fund, are shown in the Statement of Operations.
(F) Use of Estimates. In preparing financial statements in conformity with GAAP, the Manager makes estimates and assumptions that affect the reported amounts and disclosures in the financial statements. Actual results could differ from those estimates and assumptions.
(G) Futures Contracts. A futures contract is an agreement to purchase or sell a specified quantity of an underlying instrument at a specified future date and price, or to make or receive a cash payment based on the value of a financial instrument (e.g., foreign currency, interest rate, security or securities index). The Fund is subject to risks such as market price risk and/or interest rate risk in the normal course of investing in these contracts. Upon entering into a futures contract, the Fund is required to pledge to the broker or futures commission merchant an amount of cash and/or U.S. government securities equal to a certain percentage of the collateral amount, known as the “initial margin.” During the period the futures contract is open, changes in the value of the contract are recognized as unrealized appreciation or depreciation by marking to market such contract on a daily basis to reflect the market value of the contract at the end of each day’s trading. The Fund agrees to receive from or pay to the broker or futures commission merchant an amount of cash equal to the daily fluctuation in the value of the contract. Such receipts or payments are known as “variation margin.” When the futures contract is closed, the Fund records a realized gain or loss equal to the difference between the proceeds from (or cost of) the closing transaction and the Fund's basis in the contract.
The use of futures contracts involves, to varying degrees, elements of market risk in excess of the amount recognized in the Statement of Assets and Liabilities. The contract or notional amounts and variation margin reflect the extent of the Fund's involvement in open futures positions. There are several risks associated with the use of futures contracts as hedging techniques. There can be no assurance that a liquid market will exist at the time when the Fund seeks to close out a futures contract. If no liquid market exists, the Fund would remain obligated to meet margin requirements until the position is closed. Futures contracts may involve a small initial investment relative to the risk assumed, which could result in losses greater than if the Fund did not invest in futures
Notes to Financial Statements (continued)
contracts. Futures contracts may be more volatile than direct investments in the instrument underlying the futures and may not correlate to the underlying instrument, causing a given hedge not to achieve its objectives. The Fund's activities in futures contracts have minimal counterparty risk as they are conducted through regulated exchanges that guarantee the futures against default by the counterparty. In the event of a bankruptcy or insolvency of a futures commission merchant that holds margin on behalf of the Fund, the Fund may not be entitled to the return of the entire margin owed to the Fund, potentially resulting in a loss. The Fund may invest in futures contracts to seek enhanced returns or to reduce the risk of loss by hedging certain of its holdings. The Fund's investment in futures contracts and other derivatives may increase the volatility of the Fund's NAVs and may result in a loss to the Fund. As of April 30, 2022, the Fund did not hold any open futures contracts.
(H) Delayed Delivery Transactions. The Fund may purchase or sell securities on a delayed delivery basis. These transactions involve a commitment by the Fund to purchase or sell securities for a predetermined price or yield, with payment and delivery taking place beyond the customary settlement period. When delayed delivery purchases are outstanding, the Fund will designate liquid assets in an amount sufficient to meet the purchase price. When purchasing a security on a delayed delivery basis, the Fund assumes the rights and risks of ownership of the security, including the risk of price and yield fluctuations, and takes such fluctuations into account when determining its NAV. The Fund may dispose of or renegotiate a delayed delivery transaction after it is entered into, and may sell delayed delivery securities before they are delivered, which may result in a realized gain or loss. When the Fund has sold a security it owns on a delayed delivery basis, the Fund does not participate in future gains and losses with respect to the security. Delayed delivery transactions as of April 30, 2022, are shown in the Portfolio of Investments.
(I) Debt Securities Risk. The Fund's investments may include securities such as variable rate notes, floaters and mortgage-related and asset-backed securities. If expectations about changes in interest rates or assessments of an issuer's credit worthiness or market conditions are incorrect, investments in these types of securities could lose money for the Fund.
(J) Municipal Bond Risk. The Fund may invest more heavily in municipal bonds from certain cities, states, territories or regions than others, which may increase the Fund’s exposure to losses resulting from economic, political, regulatory occurrences, or declines in tax revenue impacting these particular cities, states, territories or regions. In addition, many state and municipal governments that issue securities are under significant economic and financial stress and may not be able to satisfy their obligations, and these events may be made worse due to economic challenges posed by COVID-19. The Fund may invest a substantial amount of its assets in municipal bonds whose interest is paid solely from revenues of similar projects, such as tobacco settlement bonds. If the Fund concentrates its investments in this manner, it assumes the legal
and economic risks relating to such projects and this may have a significant impact on the Fund’s investment performance.
Certain of the issuers in which the Fund may invest have recently experienced, or may experience, significant financial difficulties and repeated credit rating downgrades. On May 3, 2017, the Commonwealth of Puerto Rico (the "Commonwealth") began proceedings pursuant to the Puerto Rico Oversight, Management, and Economic Stability Act (“PROMESA”) to seek bankruptcy-type protections from approximately $74 billion in debt and approximately $48 billion in unfunded pension obligations. In addition, the economic downturn following the outbreak of COVID-19 and the resulting pressure on Puerto Rico’s budget have further contributed to its financial challenges. The federal government has passed certain relief packages, including the Coronavirus Aid, Relief, and Economic Security Act and the American Rescue Plan, which include an aggregate of more than $7 billion in disaster relief funds for the U.S. territories, including Puerto Rico. However, there can be no assurances that the federal funds allocated to the Commonwealth will be sufficient to address the economic challenges arising from COVID-19.
The Commonwealth concluded its Title III restructuring proceedings on behalf of itself and certain instrumentalities effective March 15th, 2022. Approximately 18.75 billion of claims related to debt guaranteed under Puerto Rico's constitution including the Commonwealth of Puerto Rico and Public Building Authority were restructured with issuance of $7.4 billion in new Puerto Rico General Obligation Bonds, $7.1 billion of cash, and $3.5 billion of new Contingent Value instruments. In addition the Commonwealth's exit from the restructuring proceedings resolved certain claims relating to the Commonwealth Employee Retirement System, Convention Center, Highway Authority, and Infrastructure Financing Authority. Several of Commonwealth's agencies are still under Title III restructuring proceedings including the Highway Authority and Electric Authority.
Puerto Rico’s debt restructuring process and other economic, political, social, environmental or health factors or developments could occur rapidly and may significantly affect the value of municipal securities of Puerto Rico. Due to the ongoing budget impact from COVID-19 on the Commonwealth’s finances, the Federal Oversight and Management Board for Puerto Rico or the Commonwealth itself could seek to revise or even terminate earlier agreements reached with certain creditors prior to the outbreak of COVID-19. Any agreement between the Federal Oversight and Management Board and creditors is subject to approval by the judge overseeing the Title III proceedings. The composition of the Federal Oversight and Management Board has changed during the recent period due to existing members either stepping down or being replaced following the expiration of a member's term. There is no assurance that board members will approve the restructuring agreements the prior board had negotiated.
The Fund’s vulnerability to potential losses associated with such developments may be reduced through investing in municipal securities that feature credit enhancements (such as bond insurance). The bond insurance provider pays both principal and interest when due to the bond
| MainStay MacKay Short Term Municipal Fund |
holder. The magnitude of Puerto Rico’s debt restructuring or other adverse economic developments could pose significant strains on the ability of municipal securities insurers to meet all future claims. As of April 30, 2022, 66.7% of the Puerto Rico municipal securities held by the Fund were insured.
(K) Indemnifications. Under the Trust’s organizational documents, its officers and trustees are indemnified against certain liabilities that may arise out of performance of their duties to the Trust. Additionally, in the normal course of business, the Fund enters into contracts with third-party service providers that contain a variety of representations and warranties and that may provide general indemnifications. The Fund's maximum exposure under these arrangements is unknown, as this would involve future claims that may be made against the Fund that have not yet occurred. The Manager believes that the risk of loss in connection with these potential indemnification obligations is remote. However, there can be no assurance that material liabilities related to such obligations will not arise in the future, which could adversely impact the Fund.
(L) Quantitative Disclosure of Derivative Holdings. The following tables show additional disclosures related to the Fund's derivative and hedging activities, including how such activities are accounted for and their effect on the Fund's financial positions, performance and cash flows.
The Fund entered into futures contracts to manage its exposure to the securities markets or to movements in interest rates and currency values.
The effect of derivative instruments on the Statement of Operations for the year ended April 30, 2022:
Net Realized Gain (Loss) from: | Interest
Rate
Contracts
Risk | |
| | |
Total Net Realized Gain (Loss) | | |
Net Change in Unrealized Appreciation (Depreciation) | Interest
Rate
Contracts
Risk | |
| | |
Total Net Change in Unrealized Appreciation (Depreciation) | | |
| |
Futures Contracts Short (a) | |
| Positions were open for eight months during the reporting period. |
Note 3–Fees and Related Party Transactions
(A) Manager and Subadvisor. New York Life Investments, a registered investment adviser and an indirect, wholly-owned subsidiary of New York Life Insurance Company ("New York Life"), serves as the Fund's Manager, pursuant to an Amended and Restated Management Agreement ("Management Agreement"). The Manager provides offices, conducts clerical, recordkeeping and bookkeeping services and keeps most of the financial and accounting records required to be maintained by the Fund. Except for the portion of salaries and expenses that are the responsibility of the Fund, the Manager pays the salaries and expenses of all personnel affiliated with the Fund and certain operational expenses of the Fund. During a portion of the year ended April 30, 2022, the Fund reimbursed New York Life Investments in an amount equal to the portion of the compensation of the Chief Compliance Officer attributable to the Fund. MacKay Shields LLC ("MacKay Shields" or the "Subadvisor"), a registered investment adviser and an indirect, wholly-owned subsidiary of New York Life, serves as Subadvisor to the Fund and is responsible for the day-to-day portfolio management of the Fund. Pursuant to the terms of an Amended and Restated Subadvisory Agreement ("Subadvisory Agreement") between New York Life Investments and MacKay Shields, New York Life Investments pays for the services of the Subadvisor.
Effective August 31, 2021, pursuant to the Management Agreement, the Fund pays the Manager a monthly fee for the services performed and the facilities furnished at an annual rate of the Fund’s average daily net assets as follows: 0.35% on assets up to $1 billion; and 0.33% on assets from $1 billion up to $5 billion; and 0.32% on assets over $5 billion. During the year ended April 30, 2022, the effective management fee rate was 0.34% of the Fund’s average daily net assets, exclusive of any applicable waivers/reimbursements.
Prior to August 31, 2021, pursuant to the Management Agreement, the Fund paid the Manager a monthly fee for the services performed and the facilities furnished at an annual rate of the Fund’s average daily net assets as follows: 0.35% on assets up to $1 billion; and 0.33% on assets over $1 billion.
New York Life Investments has contractually agreed to waive fees and/or reimburse expenses so that Total Annual Fund Operating Expenses (excluding taxes, interest, litigation, extraordinary expenses, brokerage and other transaction expenses relating to the purchase or sale of portfolio investments and acquired (underlying) fund fees and expenses) do not exceed the following percentages of daily net assets: Class A, 0.70%, Class A2, 0.70% and Class I, 0.40%. New York Life Investments will apply an equivalent waiver or reimbursement, in an equal number of basis points of the Class A shares waiver/reimbursement, to Investor Class shares. This agreement will remain in effect until August 31, 2022, and shall renew automatically for one-year terms unless New York Life Investments provides written notice of termination prior to the start of the next term or upon approval of the Board.
During the year ended April 30, 2022, New York Life Investments earned fees from the Fund in the amount of $6,814,529 and waived fees and/or
Notes to Financial Statements (continued)
reimbursed expenses in the amount of $293,455 and paid the Subadvisor fees of $3,260,814.
JPMorgan Chase Bank, N.A. ("JPMorgan") provides sub-administration and sub-accounting services to the Fund pursuant to an agreement with New York Life Investments. These services include calculating the daily NAVs of the Fund, maintaining the general ledger and sub-ledger accounts for the calculation of the Fund's NAVs, and assisting New York Life Investments in conducting various aspects of the Fund's administrative operations. For providing these services to the Fund, JPMorgan is compensated by New York Life Investments.
Pursuant to an agreement between the Trust and New York Life Investments, New York Life Investments is responsible for providing or procuring certain regulatory reporting services for the Fund. The Fund will reimburse New York Life Investments for the actual costs incurred by New York Life Investments in connection with providing or procuring these services for the Fund.
(B) Distribution and Service Fees. The Trust, on behalf of the Fund, has entered into a distribution agreement with NYLIFE Distributors LLC (the “Distributor”), an affiliate of New York Life Investments. The Fund has adopted distribution plans (the “Plans”) in accordance with the provisions of Rule 12b-1 under the 1940 Act.
Pursuant to the Class A, Class A2 and Investor Class Plans, the Distributor receives a monthly fee from Class A, Class A2 and Investor Class shares at an annual rate of 0.25% of the average daily net assets of the Class A, Class A2 and Investor Class shares for distribution and/or service activities as designated by the Distributor. Class I shares are not subject to a distribution and/or service fee.
The Plans provide that the distribution and service fees are payable to the Distributor regardless of the amounts actually expended by the Distributor for distribution of the Fund's shares and service activities.
(C) Sales Charges. The Fund was advised by the Distributor that the amount of initial sales charges retained on sales of Class A, Class A2 and Investor Class shares during the year ended April 30, 2022, were $7,962, $38 and $159, respectively.
The Fund was also advised that the Distributor retained CDSCs on redemptions of Class A and Class A2 shares during the year ended April 30, 2022, of $177,899 and $36,430.
(D) Transfer, Dividend Disbursing and Shareholder Servicing Agent. NYLIM Service Company LLC, an affiliate of New York Life Investments, is the Fund's transfer, dividend disbursing and shareholder servicing agent pursuant to an agreement between NYLIM Service Company LLC and the Trust. NYLIM Service Company LLC has entered into an agreement with DST Asset Manager Solutions, Inc. ("DST"), pursuant to which DST performs certain transfer agent services on behalf of NYLIM Service Company LLC. New York Life Investments has contractually agreed to limit the transfer agency expenses charged to the Fund’s share classes to a maximum of 0.35% of that share class’s average daily net assets on an annual basis after deducting any
applicable Fund or class-level expense reimbursement or small account fees. This agreement will remain in effect until August 31, 2022, and shall renew automatically for one-year terms unless New York Life Investments provides written notice of termination prior to the start of the next term or upon approval of the Board. During the year ended April 30, 2022, transfer agent expenses incurred by the Fund and any reimbursements, pursuant to the aforementioned Transfer Agency expense limitation agreement, were as follows:
(E) Small Account Fee. Shareholders with small accounts adversely impact the cost of providing transfer agency services. In an effort to reduce total transfer agency expenses, the Fund has implemented a small account fee on certain types of accounts. As described in the Fund's prospectus, certain shareholders with an account balance of less than $1,000 ($5,000 for Class A share accounts) are charged an annual per account fee of $20 (assessed semi-annually), the proceeds from which offset transfer agent fees as reflected in the Statement of Operations. This small account fee will not apply to certain types of accounts as described further in the Fund’s prospectus.
(F) Capital. As of April 30, 2022, New York Life and its affiliates beneficially held shares of the Fund with the values and percentages of net assets as follows:
| Less than one-tenth of a percent. |
Note 4-Federal Income Tax
As of April 30, 2022, the cost and unrealized appreciation (depreciation) of the Fund’s investment portfolio, including applicable derivative contracts and other financial instruments, as determined on a federal income tax basis, were as follows:
| | Gross
Unrealized
Appreciation | Gross
Unrealized
(Depreciation) | Net
Unrealized
Appreciation/
(Depreciation) |
| | | | |
| MainStay MacKay Short Term Municipal Fund |
As of April 30, 2022, the components of accumulated gain (loss) on a tax basis were as follows:
| Undistributed
Tax Exempt
Income | Accumulated
Capital
and Other
Gain (Loss) | Other
Temporary
Differences | Unrealized
Appreciation
(Depreciation) | Total
Accumulated
Gain (Loss) |
| | | | | |
The difference between book-basis and tax-basis unrealized appreciation (depreciation) is primarily due to premium amortization, and wash sale adjustments.
As of April 30, 2022, for federal income tax purposes, capital loss carryforwards of $12,402,555, as shown in the table below, were available to the extent provided by the regulations to offset future realized gains of the Fund. Accordingly, no capital gains distributions are expected to be paid to shareholders until net gains have been realized in excess of such amounts.
Capital Loss
Available Through | Short-Term
Capital Loss
Amounts (000’s) | Long-Term
Capital Loss
Amounts (000’s) |
| | |
During the years ended April 30, 2022 and April 30, 2021, the tax character of distributions paid as reflected in the Statements of Changes in Net Assets was as follows:
| | |
| | |
| | |
Exempt Interest Dividends | | |
| | |
Note 5–Custodian
JPMorgan is the custodian of cash and securities held by the Fund. Custodial fees are charged to the Fund based on the Fund's net assets and/or the market value of securities held by the Fund and the number of certain transactions incurred by the Fund.
Note 6–Line of Credit
The Fund and certain other funds managed by New York Life Investments maintain a line of credit with a syndicate of banks in order to secure a source of funds for temporary purposes to meet unanticipated or excessive redemption requests.
Effective July 27, 2021, under the credit agreement (the “Credit Agreement”), the aggregate commitment amount is $600,000,000 with an additional uncommitted amount of $100,000,000. The commitment fee is an annual rate of 0.15% of the average commitment amount payable quarterly, regardless of usage, to JPMorgan, who serves as the agent to the syndicate. The commitment fee is allocated among the Fund and certain other funds managed by New York Life Investments based upon their respective net assets and other factors. Interest on any
revolving credit loan is charged based upon the Federal Funds Rate or the one-month London Interbank Offered Rate ("LIBOR"), whichever is higher. The Credit Agreement expires on July 26, 2022, although the Fund, certain other funds managed by New York Life Investments and the syndicate of banks may renew the Credit Agreement for an additional year on the same or different terms or enter into a credit agreement with a different syndicate of banks. Prior to July 27, 2021, the aggregate commitment amount and the commitment fee were the same as those under the current Credit Agreement. During the year ended April 30, 2022, there were no borrowings made or outstanding with respect to the Fund under the Credit Agreement.
Note 7–Interfund Lending Program
Pursuant to an exemptive order issued by the SEC, the Fund, along with certain other funds managed by New York Life Investments, may participate in an interfund lending program. The interfund lending program provides an alternative credit facility that permits the Fund and certain other funds managed by New York Life Investments to lend or borrow money for temporary purposes directly to or from one another, subject to the conditions of the exemptive order. During the year ended April 30, 2022, there were no interfund loans made or outstanding with respect to the Fund.
Note 8–Purchases and Sales of Securities (in 000’s)
During the year ended April 30, 2022, purchases and sales of securities, other than short-term securities, were $1,124,740 and $1,294,440, respectively.
Note 9–Capital Share Transactions
Transactions in capital shares for the years ended April 30, 2022 and April 30, 2021, were as follows:
Notes to Financial Statements (continued)
| | |
Year ended April 30, 2022: | | |
| | |
Shares issued to shareholders in reinvestment of distributions | | |
| | |
Net increase (decrease) in shares outstanding before conversion | | |
Shares converted into Class A (See Note 1) | | |
Shares converted from Class A (See Note 1) | | |
| | |
Year ended April 30, 2021: | | |
| | |
Shares issued to shareholders in reinvestment of distributions | | |
| | |
Net increase (decrease) in shares outstanding before conversion | | |
Shares converted into Class A (See Note 1) | | |
Shares converted from Class A (See Note 1) | | |
| | |
|
| | |
Year ended April 30, 2022: | | |
| | |
Shares issued to shareholders in reinvestment of distributions | | |
| | |
| | |
Year ended April 30, 2021: | | |
| | |
Shares issued to shareholders in reinvestment of distributions | | |
| | |
| | |
|
| | |
Year ended April 30, 2022: | | |
| | |
Shares issued to shareholders in reinvestment of distributions | | |
| | |
Net increase (decrease) in shares outstanding before conversion | | |
Shares converted into Investor Class (See Note 1) | | |
Shares converted from Investor Class (See Note 1) | | |
| | |
Year ended April 30, 2021: | | |
| | |
Shares issued to shareholders in reinvestment of distributions | | |
| | |
Net increase (decrease) in shares outstanding before conversion | | |
Shares converted into Investor Class (See Note 1) | | |
Shares converted from Investor Class (See Note 1) | | |
| | |
|
| | |
Year ended April 30, 2022: | | |
| | |
Shares issued to shareholders in reinvestment of distributions | | |
| | |
| | |
Year ended April 30, 2021: | | |
| | |
Shares issued to shareholders in reinvestment of distributions | | |
| | |
| | |
Note 10–Other Matters
An outbreak of COVID-19, first detected in December 2019, has developed into a global pandemic and has resulted in travel restrictions, closure of international borders, certain businesses and securities markets, restrictions on securities trading activities, prolonged quarantines, supply chain disruptions, and lower consumer demand, as well as general concern and uncertainty. The continued impact of COVID-19 and related variants is uncertain and could further adversely affect the global economy, national economies, individual issuers and capital markets in unforeseeable ways and result in a substantial and extended economic downturn. Developments that disrupt global economies and financial markets, such as COVID-19, may magnify factors that affect the Fund's performance.
| MainStay MacKay Short Term Municipal Fund |
Note 11–Subsequent Events
In connection with the preparation of the financial statements of the Fund as of and for the year ended April 30, 2022, events and transactions subsequent to April 30, 2022, through the date the financial statements were issued have been evaluated by the Manager for possible adjustment and/or disclosure. No subsequent events requiring financial statement adjustment or disclosure have been identified, other than the following:
Effective May 2, 2022, Class R6 shares of the Fund are now available for purchase.
Report of Independent Registered Public Accounting Firm
To the Shareholders of the Fund and Board of Trustees
MainStay Funds Trust:
Opinion on the Financial Statements
We have audited the accompanying statement of assets and liabilities of MainStay MacKay Short Term Municipal Fund (the Fund), one of the funds constituting MainStay Funds Trust, including the portfolio of investments, as of April 30, 2022, the related statement of operations for the year then ended, the statements of changes in net assets for each of the years in the two year period then ended, and the related notes (collectively, the financial statements) and the financial highlights for each of the years or periods in the five year period then ended. In our opinion, the financial statements and financial highlights present fairly, in all material respects, the financial position of the Fund as of April 30, 2022, the results of its operations for the year then ended, the changes in its net assets for each of the years in the two year period then ended, and the financial highlights for each of the years or periods in the five year period then ended, in conformity with U.S. generally accepted accounting principles.
Basis for Opinion
These financial statements and financial highlights are the responsibility of the Fund's management. Our responsibility is to express an opinion on these financial statements and financial highlights based on our audits. We are a public accounting firm registered with the Public Company Accounting Oversight Board (United States) (PCAOB) and are required to be independent with respect to the Fund in accordance with the U.S. federal securities laws and the applicable rules and regulations of the Securities and Exchange Commission and the PCAOB.
We conducted our audits in accordance with the standards of the PCAOB. Those standards require that we plan and perform the audit to obtain reasonable assurance about whether the financial statements and financial highlights are free of material misstatement, whether due to error or fraud. Our audits included performing procedures to assess the risks of material misstatement of the financial statements and financial highlights, whether due to error or fraud, and performing procedures that respond to those risks. Such procedures included examining, on a test basis, evidence regarding the amounts and disclosures in the financial statements and financial highlights. Such procedures also included confirmation of securities owned as of April 30, 2022, by correspondence with the custodian and brokers or by other appropriate auditing procedures when replies from brokers were not received. Our audits also included evaluating the accounting principles used and significant estimates made by management, as well as evaluating the overall presentation of the financial statements and financial highlights. We believe that our audits provide a reasonable basis for our opinion.
We have served as the auditor of one or more New York Life Investment Management investment companies since 2003.
Philadelphia, Pennsylvania
June 27, 2022
| MainStay MacKay Short Term Municipal Fund |
Board Consideration and Approval of Management Agreement and Subadvisory Agreement (Unaudited)
The continuation of the Management Agreement with respect to the MainStay MacKay Short Term Municipal Fund (“Fund”) and New York Life Investment Management LLC (“New York Life Investments”) and the Subadvisory Agreement between New York Life Investments and MacKay Shields LLC (“MacKay”) with respect to the Fund (together, “Advisory Agreements”), following an initial term of up to two years, is subject to annual review and approval by the Board of Trustees of MainStay Funds Trust (“Board” of the “Trust”) in accordance with Section 15 of the Investment Company Act of 1940, as amended (“1940 Act”). At its December 8–9, 2021 meeting, the Board, including the Trustees who are not an “interested person” (as such term is defined in the 1940 Act) of the Trust (“Independent Trustees”) voting separately, unanimously approved the continuation of each of the Advisory Agreements for a one-year period.
In reaching the decision to approve the continuation of each of the Advisory Agreements, the Board considered information and materials furnished by New York Life Investments and MacKay in connection with an annual contract review process undertaken by the Board that took place at meetings of the Board and its Contracts Committee during September 2021 through December 2021, including information and materials furnished by New York Life Investments and MacKay in response to requests prepared on behalf of the Board, and in consultation with the Independent Trustees, by independent legal counsel to the Independent Trustees, which encompassed a variety of topics, including those summarized below. Information and materials requested by and furnished to the Board for consideration in connection with the contract review process included, among other items, reports on the Fund and “peer funds” prepared by Institutional Shareholder Services Inc. (“ISS”), an independent third-party service provider engaged by the Board to report objectively on the Fund’s investment performance, management fee and total expenses. The Board also considered information on the fees charged to other investment advisory clients of New York Life Investments and/or MacKay that follow investment strategies similar to those of the Fund, if any, and, when applicable, the rationale for any differences in the Fund’s management and subadvisory fees and the fees charged to those other investment advisory clients. In addition, the Board considered information regarding the legal standards and fiduciary obligations applicable to its consideration of the continuation of each of the Advisory Agreements. The contract review process, including the structure and format for information and materials provided to the Board, has been developed in consultation with the Board. The Independent Trustees also met in executive sessions with their independent legal counsel and, for portions thereof, with senior management of New York Life Investments.
The Board’s deliberations with respect to the continuation of each of the Advisory Agreements reflect a year-long process, and the Board also took into account information furnished to the Board and its Committees throughout the year, as deemed relevant and appropriate by the Trustees, including, among other items, reports on investment performance of the Fund and investment-related matters for the Fund as well as presentations from New York Life Investments and MacKay personnel. In
addition, the Board took into account other information received from New York Life Investments throughout the year, including, among other items, periodic reports on legal and compliance matters, risk management, portfolio turnover, brokerage commissions and non-advisory services provided to the Fund by New York Life Investments, as deemed relevant and appropriate by the Trustees.
In addition to information provided to the Board throughout the year, the Board received information in connection with its June 2021 meeting provided specifically in response to requests prepared on behalf of the Board, and in consultation with the Independent Trustees, by independent legal counsel to the Independent Trustees regarding the Fund’s distribution arrangements. In addition, the Board received information regarding the Fund’s asset levels, share purchase and redemption activity and the payment of Rule 12b-1 and/or other fees by the applicable share classes of the Fund, among other information.
In considering the continuation of each of the Advisory Agreements, the Trustees reviewed and evaluated the information and factors they believed to reasonably be necessary and appropriate in light of legal advice furnished to them by independent legal counsel to the Independent Trustees and through the exercise of their own business judgment. Although individual Trustees may have weighed certain factors or information differently and the Board did not consider any single factor or information controlling in reaching its decision, the factors considered by the Board are described in greater detail below and include, among other factors: (i) the nature, extent and quality of the services provided to the Fund by New York Life Investments and MacKay; (ii) the qualifications of the portfolio managers of the Fund and the historical investment performance of the Fund, New York Life Investments and MacKay; (iii) the costs of the services provided, and profits realized, by New York Life Investments and MacKay with respect to their relationships with the Fund; (iv) the extent to which economies of scale have been realized or may be realized if the Fund grows and the extent to which economies of scale have benefited or may benefit the Fund’s shareholders; and (v) the reasonableness of the Fund’s management and subadvisory fees and total ordinary operating expenses. Although the Board recognized that comparisons between the Fund’s fees and expenses and those of other funds are imprecise given different terms of agreements, variations in fund strategies and other factors, the Board considered the reasonableness of the Fund’s management fee and total ordinary operating expenses as compared to the peer funds identified by ISS. Throughout their considerations, the Trustees acknowledged the commitment of New York Life Investments and its affiliates to serve the MainStay Group of Funds, as well as their capacity, experience, resources, financial stability and reputations. The Trustees also acknowledged the entrepreneurial and other risks assumed by New York Life Investments in sponsoring and managing the Fund.
The Trustees noted that, throughout the year, the Trustees are afforded an opportunity to ask questions of, and request additional information or materials from, New York Life Investments and MacKay. The Board’s decision with respect to each of the Advisory Agreements may have also been based, in part, on the Board’s knowledge of New York Life
Board Consideration and Approval of Management Agreement and Subadvisory Agreement (Unaudited) (continued)
Investments and MacKay resulting from, among other things, the Board’s consideration of each of the Advisory Agreements in prior years, the advisory agreements for other funds in the MainStay Group of Funds, the Board’s review throughout the year of the performance and operations of other funds in the MainStay Group of Funds and each Trustee’s business judgment and industry experience. In addition to considering the above-referenced factors, the Board observed that in the marketplace there are a range of investment options available to investors and that the Fund’s shareholders, having had the opportunity to consider other investment options, have chosen to invest in the Fund.
The factors that figured prominently in the Board’s decision to approve the continuation of each of the Advisory Agreements during its December 8–9, 2021 meeting are summarized in more detail below.
Nature, Extent and Quality of Services Provided by New York Life Investments and MacKay
The Board examined the nature, extent and quality of the services that New York Life Investments provides to the Fund. The Board evaluated New York Life Investments’ experience and capabilities in serving as manager of the Fund and considered that the Fund operates in a “manager-of-managers” structure. The Board also considered New York Life Investments’ responsibilities and services provided pursuant to this structure, including evaluating the performance of MacKay, making recommendations to the Board as to whether the Subadvisory Agreement should be renewed, modified or terminated and periodically reporting to the Board regarding the results of New York Life Investments’ evaluation and monitoring functions. The Board noted that New York Life Investments manages other mutual funds, serves a variety of other investment advisory clients, including other pooled investment vehicles, and has experience overseeing mutual fund service providers, including subadvisors. The Board considered the experience of senior personnel at New York Life Investments providing management and administrative and other non-advisory services to the Fund as well as New York Life Investments’ reputation and financial condition. The Board observed that New York Life Investments devotes significant resources and time to providing management and non-advisory services to the Fund, including New York Life Investments’ supervision and due diligence reviews of MacKay and ongoing analysis of, and interactions with, MacKay with respect to, among other things, the Fund’s investment performance and risks as well as MacKay’s investment capabilities and subadvisory services with respect to the Fund.
The Board also considered the range of services that New York Life Investments provides to the Fund under the terms of the Management Agreement, including: (i) fund accounting and ongoing supervisory services provided by New York Life Investments’ Fund Administration and Accounting Group; (ii) investment supervisory and analytical services provided by New York Life Investments’ Investment Consulting Group; (iii) compliance services provided by the Trust’s Chief Compliance Officer as well as New York Life Investments’ compliance department, including supervision and implementation of the Fund’s compliance program; (iv) legal services provided by New York Life Investments’ Office of the
General Counsel; and (v) risk management monitoring and analysis by compliance and investment personnel. The Board noted that New York Life Investments provides certain other non-advisory services to the Fund. In addition, the Board considered New York Life Investments’ willingness to invest in personnel and other resources, such as cyber security, information security and business continuity planning, designed to benefit the Fund and noted that New York Life Investments is responsible for compensating the Trust’s officers. The Board recognized that New York Life Investments has provided an increasingly broad array of non-advisory services to the MainStay Group of Funds as a result of regulatory and other developments. The Board considered benefits to the Fund’s shareholders from the Fund being part of the MainStay Group of Funds, including the privilege of exchanging investments between the same class of shares of funds in the MainStay Group of Funds, including without the imposition of a sales charge (if any).
The Board also examined the range, and the nature, extent and quality, of the investment advisory services that MacKay provides to the Fund and considered the terms of each of the Advisory Agreements. The Board evaluated MacKay’s experience and performance in serving as subadvisor to the Fund and advising other portfolios and MacKay’s track record and experience in providing investment advisory services, the experience of investment advisory, senior management and administrative personnel at MacKay and New York Life Investments’ and MacKay’s overall resources, legal and compliance environment, capabilities, reputation and history. In addition to information provided in connection with quarterly meetings with the Trust’s Chief Compliance Officer, the Board considered information regarding the compliance policies and procedures of New York Life Investments and MacKay and acknowledged their commitment to further developing and strengthening compliance programs relating to the Fund. The Board reviewed MacKay’s ability to attract and retain qualified investment professionals and willingness to invest in personnel to service and support the Fund. In this regard, the Board considered the qualifications and experience of the Fund’s portfolio managers, the number of accounts managed by the portfolio managers and the method for compensating the portfolio managers.
In addition, the Board considered information provided by New York Life Investments and MacKay regarding the operations of their respective business continuity plans in response to the ongoing COVID-19 pandemic, including the remote working environment.
Based on these considerations, the Board concluded that the Fund would likely continue to benefit from the nature, extent and quality of these services.
Investment Performance
In evaluating the Fund’s investment performance, the Board considered investment performance results over various periods in light of the Fund’s investment objective, strategies and risks. The Board considered investment reports on, and analysis of, the Fund’s performance provided to the Board throughout the year. These reports include, among other items, information on the Fund’s gross and net returns, the Fund’s
| MainStay MacKay Short Term Municipal Fund |
investment performance compared to relevant investment categories and the Fund’s benchmark, the Fund’s risk-adjusted investment performance and the Fund’s investment performance as compared to peer funds, as appropriate, as well as portfolio attribution information and commentary on the effect of market conditions. The Board also considered information provided by ISS showing the investment performance of the Fund as compared to peer funds.
The Board also gave weight to its discussions with senior management at New York Life Investments concerning the Fund’s investment performance attributable to MacKay as well as discussions between the Fund’s portfolio management team and the members of the Board’s Investment Committee, which generally occur on an annual basis. In addition, the Board considered any specific actions that New York Life Investments or MacKay had taken, or had agreed to take, to seek to enhance Fund investment performance and the results of those actions.
Based on these considerations, the Board concluded that its review of the Fund’s investment performance and related information supported a determination to approve the continuation of each of the Advisory Agreements.
Costs of the Services Provided, and Profits Realized, by New York Life Investments and MacKay
The Board considered the costs of the services provided under each of the Advisory Agreements. The Board also considered the profits realized by New York Life Investments and its affiliates, including MacKay, due to their relationships with the Fund. Because MacKay is an affiliate of New York Life Investments whose subadvisory fee is paid by New York Life Investments, not the Fund, the Board considered cost and profitability information for New York Life Investments and MacKay in the aggregate.
In addition, the Board acknowledged the difficulty in obtaining reliable comparative data about mutual fund managers’ profitability because such information generally is not publicly available and may be impacted by numerous factors, including the structure of a fund manager’s organization, the types of funds it manages, the methodology used to allocate certain fixed costs to specific funds and the manager’s capital structure and costs of capital.
In evaluating the costs of the services provided by New York Life Investments and MacKay and profits realized by New York Life Investments and its affiliates, including MacKay, the Board considered, among other factors, New York Life Investments’ and its affiliates’ continuing investments in, or willingness to invest in, personnel and other resources to support and further enhance the management of the Fund, and that New York Life Investments is responsible for paying the subadvisory fee for the Fund. The Board also considered the financial resources of New York Life Investments and MacKay and acknowledged that New York Life Investments and MacKay must be in a position to attract and retain experienced professional personnel and to maintain a strong financial position for New York Life Investments and MacKay to continue to provide high-quality services to the Fund. The Board recognized that the Fund benefits from the allocation of certain fixed
costs among the funds in the MainStay Group of Funds, among other expected benefits resulting from its relationship with New York Life Investments.
The Board considered information regarding New York Life Investments’ methodology for calculating profitability and allocating costs provided by New York Life Investments in connection with the fund profitability analysis presented to the Board. The Board previously engaged an independent consultant to review the methods used to allocate costs among the funds in the MainStay Group of Funds. The Board noted that the independent consultant had concluded that New York Life Investments’ methods for allocating costs and procedures for estimating overall profitability of the relationship with the funds in the MainStay Group of Funds are reasonable and that New York Life Investments continued to use the same method of calculating profit and allocating costs since the independent consultant’s review. The Board recognized the difficulty in calculating and evaluating a manager’s profitability with respect to the Fund and noted that other profitability methodologies may also be reasonable.
The Board also considered certain fall-out benefits that may be realized by New York Life Investments and its affiliates due to their relationships with the Fund, including reputational and other indirect benefits. The Board recognized, for example, the benefits to MacKay from legally permitted “soft-dollar” arrangements by which brokers provide research and other services to MacKay in exchange for commissions paid by the Fund with respect to trades in the Fund’s portfolio securities. In addition, the Board considered its review of a money market fund advised by New York Life Investments and an affiliated subadvisor that serves as an investment option for the Fund, including the potential rationale for and costs associated with investments in this money market fund by the Fund, if any, and considered information from New York Life Investments that the nature and type of specific investment advisory services provided to this money market fund are distinct from, or in addition to, the investment advisory services provided to the Fund.
The Board observed that, in addition to fees earned by New York Life Investments for managing the Fund, New York Life Investments’ affiliates also earn revenues from serving the Fund in various other capacities, including as the Fund’s transfer agent and distributor. The Board considered information about these other revenues and their impact on the profitability of the relationship with the Fund to New York Life Investments and its affiliates. The Board noted that, although it assessed the overall profitability of the Fund to New York Life Investments and its affiliates as part of the contract review process, when considering the reasonableness of the fee paid to New York Life Investments under the Management Agreement, the Board considered the profitability of New York Life Investments’ relationship with the Fund on a pre-tax basis and without regard to distribution expenses incurred by New York Life Investments from its own resources.
Board Consideration and Approval of Management Agreement and Subadvisory Agreement (Unaudited) (continued)
After evaluating the information deemed relevant by the Trustees, the Board concluded that any profits realized by New York Life Investments and its affiliates, including MacKay, due to their relationships with the Fund were not excessive.
Management and Subadvisory Fees and Total Ordinary Operating Expenses
The Board evaluated the reasonableness of the fee paid under each of the Advisory Agreements and the Fund’s total ordinary operating expenses. The Board primarily considered the reasonableness of the management fee paid by the Fund to New York Life Investments because the subadvisory fee paid to MacKay is paid by New York Life Investments, not the Fund. The Board also considered the reasonableness of the subadvisory fee paid by New York Life Investments and the amount of the management fee retained by New York Life Investments.
In assessing the reasonableness of the Fund’s fees and expenses, the Board primarily considered comparative data provided by ISS on the fees and expenses charged by similar mutual funds managed by other investment advisers. In addition, the Board considered information provided by New York Life Investments and MacKay on fees charged to other investment advisory clients, including institutional separate accounts and/or other funds that follow investment strategies similar to those of the Fund, if any. The Board considered the similarities and differences in the contractual management fee schedules of the Fund and those of the similarly-managed accounts and/or funds, taking into account the rationale for any differences in fee schedules. The Board also took into account explanations provided by New York Life Investments about the more extensive scope of services provided to registered investment companies, such as the Fund, as compared with other investment advisory clients. Additionally, the Board considered the impact of contractual breakpoints, voluntary waivers and expense limitation arrangements on the Fund’s net management fee and expenses. The Board also considered that in proposing fees for the Fund, New York Life Investments considers the competitive marketplace for mutual funds.
The Board took into account information from New York Life Investments regarding the reasonableness of the Fund’s transfer agent fee schedule, including industry data demonstrating that the fees that NYLIM Service Company LLC, an affiliate of New York Life Investments and the Fund’s transfer agent, charges the Fund are within the range of fees charged by transfer agents to other mutual funds. In addition, the Board considered NYLIM Service Company LLC’s profitability in connection with the transfer agent services it provides to the Fund. The Board also took into account information received from NYLIM Service Company LLC regarding the sub-transfer agency payments it made to intermediaries in connection with the provision of sub-transfer agency services to the Fund.
The Board considered the extent to which transfer agent fees comprised total expenses of the Fund. The Board acknowledged the role that the MainStay Group of Funds historically has played in serving the investment needs of New York Life Insurance Company customers, who often maintain smaller account balances than other shareholders of funds, and
the impact of small accounts on the expense ratios of Fund share classes. The Board also recognized measures that it and New York Life Investments have taken to mitigate the effect of small accounts on the expense ratios of Fund share classes, including through the imposition of an expense limitation on net transfer agency expenses. The Board also considered that NYLIM Service Company LLC had waived its contractual cost of living adjustments during the seven years prior to 2021.
Based on the factors outlined above, the Board concluded that the Fund’s management fee and total ordinary operating expenses were within a range that is competitive and support a conclusion that these fees and expenses are reasonable.
Economies of Scale
The Board considered information regarding economies of scale, including whether the Fund’s expense structure permits economies of scale to be appropriately shared with the Fund’s shareholders. The Board also considered a report from New York Life Investments, previously prepared at the request of the Board, that addressed economies of scale, including with respect to the mutual fund business generally, and the various ways in which the benefits of economies of scale may be shared with the funds in the MainStay Group of Funds. Although the Board recognized the difficulty of determining economies of scale with precision, the Board acknowledged that economies of scale may be shared with the Fund in a number of ways, including, for example, through the imposition of fee breakpoints, initially setting management fee rates at scale or making additional investments to enhance services. The Board reviewed information from New York Life Investments showing how the Fund’s management fee schedule compared to fee schedules of other funds and accounts managed by New York Life Investments. The Board also reviewed information from ISS showing how the Fund’s management fee schedule compared with fees paid for similar services by peer funds at varying asset levels.
Based on this information, the Board concluded that economies of scale are appropriately reflected for the benefit of the Fund’s shareholders through the Fund’s expense structure and other methods to share benefits from economies of scale.
Conclusion
On the basis of the information and factors summarized above, among other information and factors deemed relevant by the Trustees, and the evaluation thereof, the Board, including the Independent Trustees voting separately, unanimously voted to approve the continuation of each of the Advisory Agreements.
| MainStay MacKay Short Term Municipal Fund |
Discussion of the Operation and Effectiveness of the Fund's Liquidity Risk Management Program (Unaudited)
In compliance with Rule 22e-4 under the Investment Company Act of 1940, as amended (the “Liquidity Rule”), the Fund has adopted and implemented a liquidity risk management program (the “Program”), which New York Life Investment Management LLC believes is reasonably designed to assess and manage the Fund's liquidity risk (the risk that the Fund could not meet requests to redeem shares issued by the Fund without significant dilution of remaining investors’ interests in the Fund). The Board of Trustees of MainStay Funds Trust (the "Board") designated New York Life Investment Management LLC as administrator of the Program (the “Administrator”). The Administrator has established a Liquidity Risk Management Committee to assist the Administrator in the implementation and day-to-day administration of the Program and to otherwise support the Administrator in fulfilling its responsibilities under the Program.
At a meeting of the Board held on March 9, 2022, the Administrator provided the Board with a written report addressing the Program’s operation and assessing its adequacy and effectiveness of implementation for the period from January 1, 2021 through December 31, 2021 (the "Review Period"), as required under the Liquidity Rule. The report noted that the Administrator concluded that (i) the Program operated effectively to assess and manage the Fund's liquidity risk, (ii) the Program has been adequately and effectively implemented to monitor and, as applicable, respond to the Fund's liquidity developments and (iii) the Fund's investment strategy continues to be appropriate for an open-end fund. In addition, the report summarized the operation of the Program and the information and factors considered by the Administrator in its assessment of the Program’s implementation, such as the liquidity risk assessment framework and the liquidity classification methodologies, and discussed notable events that impacted liquidity risk during the Review Period.
In accordance with the Program, the Fund's liquidity risk is assessed no less frequently than annually taking into consideration certain factors, as applicable, such as (i) investment strategy and liquidity of portfolio investments, (ii) short-term and long-term cash flow projections and (iii) holdings of cash and cash equivalents, as well as borrowing arrangements and other funding sources. Certain factors are considered under both normal and reasonably foreseeable stressed conditions.
Each Fund portfolio investment is classified into one of four liquidity categories. The classification is based on a determination of the number of days it is reasonably expected to take to convert the investment into cash, or sell or dispose of the investment, in current market conditions without significantly changing the market value of the investment. The Administrator has delegated liquidity classification determinations to the Fund’s subadvisor, subject to appropriate oversight by the Administrator, and liquidity classification determinations are made by taking into account the Fund's reasonably anticipated trade size, various market, trading and investment-specific considerations, as well as market depth, and, in certain cases, third-party vendor data.
The Liquidity Rule requires funds that do not primarily hold assets that are highly liquid investments to adopt a minimum amount of net assets that must be invested in highly liquid investments that are assets (an “HLIM”). In addition, the Liquidity Rule limits a fund's investments in illiquid investments. Specifically, the Liquidity Rule prohibits acquisition of illiquid investments if doing so would result in a fund holding more than 15% of its net assets in illiquid investments that are assets. The Program includes provisions reasonably designed to determine, periodically review and comply with the HLIM requirement, as applicable, and to comply with the 15% limit on illiquid investments.
There can be no assurance that the Program will achieve its objectives under all circumstances in the future. Please refer to the Fund's prospectus for more information regarding the Fund's exposure to liquidity risk and other risks to which it may be subject.
Federal Income Tax
Information (Unaudited)
The Fund is required under the Internal Revenue Code to advise shareholders in a written statement as to the federal tax status of dividends paid by the Fund during such fiscal years.
For Federal individual income tax purposes, the Fund designated 89.6% of the ordinary income dividends paid during its fiscal year ended April 30, 2022 as attributable to interest income from Tax Exempt Municipal Bonds. Such dividends are currently exempt from Federal income taxes under Section 103(a) of the Internal Revenue Code.
In February 2023, shareholders will receive an IRS Form 1099-DIV or substitute Form 1099, which will show the federal tax status of the distributions received by shareholders in calendar year 2022. The amounts that will be reported on such 1099-DIV or substitute Form 1099 will be the amounts you are to use on your federal income tax return and will differ from the amounts which we must report for the Fund's fiscal year ended April 30, 2022.
Proxy Voting Policies and Procedures and Proxy Voting Record
The Fund is required to file with the SEC its proxy voting record for the 12-month period ending June 30 on Form N-PX. A description of the policies and procedures that are used to vote proxies relating to portfolio securities of the Fund is available free of charge upon request by calling 800-624-6782 or visiting the SEC’s website at www.sec.gov. The most recent Form N-PX or proxy voting record is available free of charge upon request by calling 800-624-6782; visiting newyorklifeinvestments.com; or visiting the SEC’s website at www.sec.gov.
Shareholder Reports and Quarterly Portfolio Disclosure
The Fund is required to file its complete schedule of portfolio holdings with the SEC 60 days after its first and third fiscal quarter on Form N-PORT. The Fund's holdings report is available free of charge upon request by calling New York Life Investments at 800-624-6782.
| MainStay MacKay Short Term Municipal Fund |
Board of Trustees and Officers (Unaudited)
The Trustees and officers of the Fund are listed below. The Board oversees the MainStay Group of Funds (which consists of MainStay Funds and MainStay Funds Trust), MainStay VP Funds Trust, MainStay MacKay DefinedTerm Municipal Opportunities Fund, MainStay CBRE Global Infrastructure Megatrends Fund, the Manager and the Subadvisors, and elects the officers of the Funds who are responsible for the day-to-day operations of the Fund. Information pertaining to the Trustees and officers is set forth below. Each Trustee serves until his or her successor is elected and qualified or until his or her resignation, death or removal. Under the Board’s retirement policy, unless an exception is made, a
Trustee must tender his or her resignation by the end of the calendar year during which he or she reaches the age of 75. Mr. Nolan reached the age of 75 during the calendar year 2021. Accordingly, Mr. Nolan retired at the end of calendar year 2021, at which time, Ms. Hammond became a Trustee of the Funds. Officers are elected annually by the Board. The business address of each Trustee and officer listed below is 51 Madison Avenue, New York, New York 10010. A majority of the Trustees are not “interested persons” (as defined by the 1940 Act and rules adopted by the SEC thereunder) of the Fund (“Independent Trustees”).
| | Term of Office,
Position(s) Held and
Length of Service | Principal Occupation(s)
During Past Five Years | Number of
Portfolios in
Fund Complex
Overseen by
Trustee | Other Directorships
Held by Trustee |
| | | | | |
| | MainStay Funds: Trustee
since 2017;
MainStay Funds Trust:
Trustee since 2017 | Senior Vice President of New York Life since joining in 2010, Member of the Executive Management Committee since 2017, Chief Executive Officer, New York Life Investment Management Holdings LLC & New York Life Investment Management LLC since 2015. Senior Managing Director and Co-President of New York Life Investment Management LLC from January 2014 to May 2015. Previously held positions of increasing responsibility, including head of NYLIM International, Alternative Growth Businesses, and Institutional investments since joining New York Life in 2010 | | MainStay VP Funds Trust:
Trustee since 2017 (31 portfolios);
MainStay MacKay DefinedTerm Municipal Opportunities Fund: Trustee
since 2017;
MainStay CBRE Global Infrastructure Megatrends Fund: Trustee
since March 2021; and
Turtle Beach Corporation: Director since April 2021 |
*
This Trustee is considered to be an “interested person” of the MainStay Group of Funds, MainStay VP Funds Trust, MainStay CBRE Global Infrastructure Megatrends Fund and MainStay MacKay DefinedTerm Municipal Opportunities Fund, within the meaning of the 1940 Act because of her affiliation with New York Life Insurance Company, New York Life Investment Management LLC, Candriam Belgium S.A., Candriam Luxembourg S.C.A., IndexIQ Advisors LLC, MacKay Shields LLC, NYL Investors LLC, NYLIFE Securities LLC and/or NYLIFE Distributors LLC, as described in detail above in the column entitled “Principal Occupation(s) During Past Five Years.”
Board of Trustees and Officers (Unaudited) (continued)
| | Term of Office,
Position(s) Held and
Length of Service | Principal Occupation(s)
During Past Five Years | Number of
Portfolios in
Fund Complex
Overseen by
Trustee | Other Directorships
Held by Trustee |
| | | | | |
| | MainStay Funds: Trustee since 2016, Advisory Board Member (June 2015 to December 2015);
MainStay Funds Trust: Trustee since 2016, Advisory Board Member (June 2015 to December 2015) | Founder and CEO, DanCourt Management, LLC since 1999 | | MainStay VP Funds Trust: Trustee since 2016, Advisory Board Member (June 2015 to December 2015) (31 portfolios);
MainStay MacKay DefinedTerm Municipal Opportunities Fund: Trustee since 2016, Advisory Board Member (June 2015 to December 2015);
MainStay CBRE Global Infrastructure Megatrends Fund: Trustee since June 2021; VanEck Vectors Group of Exchange-Traded Funds: Independent Chairman of the Board of Trustees since 2008 and Trustee since 2006 (56 portfolios); and Berea College of Kentucky: Trustee since 2009, Chair of the Investment Committee since 2018 |
| | MainStay Funds: Chairman since 2017 and Trustee since 2007;
MainStay Funds Trust: Chairman since 2017 and Trustee since 1990** | President, Strategic Management Advisors LLC since 1990 | | MainStay VP Funds Trust: Chairman since January 2017 and Trustee since 2007 (31 portfolios)***;
MainStay MacKay DefinedTerm Municipal Opportunities Fund: Chairman since 2017 and Trustee since 2011;
MainStay CBRE Global Infrastructure Megatrends Fund: Trustee since June 2021; and Legg Mason Partners Funds: Trustee since 1991 (45 portfolios) |
| | MainStay Funds: Trustee since 2006;
MainStay Funds Trust: Trustee since 2007** | Retired; Partner, Ernst & Young LLP (2002 to 2003); Partner, Arthur Andersen LLP (1989 to 2002); Consultant to the MainStay Funds Audit and Compliance Committee (2004 to 2006) | | MainStay VP Funds Trust: Trustee since 2007 (31 portfolios)***;
MainStay MacKay DefinedTerm Municipal Opportunities Fund: Trustee since 2011; and
MainStay CBRE Global Infrastructure Megatrends Fund: Trustee since June 2021 |
| Richard H. Nolan, Jr.
1946**** | MainStay Funds: Trustee since 2007;
MainStay Funds Trust: Trustee since 2007** | Managing Director, ICC Capital Management since 2004; President—Shields/Alliance, Alliance Capital Management (1994 to 2004) | | MainStay VP Funds Trust: Trustee since 2006 (31 portfolios)***;
MainStay MacKay DefinedTerm Municipal Opportunities Fund: Trustee since 2011; and
MainStay CBRE Global Infrastructure Megatrends Fund: Trustee since June 2021 |
| MainStay MacKay Short Term Municipal Fund |
| | Term of Office, Position(s) Held and Length of Service | Principal Occupation(s) During Past Five Years | Number of Portfolios in Fund Complex Overseen by Trustee | Other Directorships Held by Trustee |
| | | | | |
| | MainStay Funds: Trustee since December 2021, Advisory Board Member (June 2021 to December 2021);
MainStay Funds Trust:
Trustee since December 2021, Advisory Board Member (June 2021 to December 2021)
| Retired, Managing Director, Devonshire Investors (2007 to 2013); Senior Vice President, Fidelity Management & Research Co. (2005 to 2007); Senior Vice President and Corporate Treasurer, FMR Corp. (2003 to 2005); Chief Operating Officer, Fidelity Investments Japan (2001 to 2003) | | MainStay VP Funds Trust: Trustee since December 2021, Advisory Board Member (June 2021 to December 2021) (31 Portfolios);
MainStay MacKay DefinedTerm Municipal Opportunities Fund: Trustee since December 2021, Advisory Board Member (June 2021 to December 2021);
MainStay CBRE Global Infrastructure Megatrends Fund: Trustee since December 2021, Advisory Board Member (June 2021 to December 2021);
Two Harbors Investment Corp.: Member since 2018, Chair of the Special Committee since 2019;
Rhode Island School of Design: Director and Chair of the Finance Committee since 2015; and
Blue Cross Blue Shield of Rhode Island: Director since 2019 |
| | MainStay Funds: Trustee since 2016, Advisory Board Member (June 2015 to December 2015);
MainStay Funds Trust: Trustee since 2016, Advisory Board Member (June 2015 to December 2015) | Founder and Chief Executive Officer, CapShift Advisors LLC since 2018; President, Fidelity Management & Research Company (2009 to 2014); President and Chief Investment Officer, Geode Capital Management, LLC (2001 to 2009) | | MainStay VP Funds Trust: Trustee since 2016, Advisory Board Member (June 2015 to December 2015) (31 portfolios);
MainStay MacKay DefinedTerm Municipal Opportunities Fund: Trustee since 2016, Advisory Board Member (June 2015 to December 2015);
MainStay CBRE Global Infrastructure Megatrends Fund: Trustee since June 2021; Partners in Health: Trustee since 2019; Allstate Corporation: Director since 2015; and MSCI, Inc.: Director since 2017 |
| | MainStay Funds: Trustee since 1994;
MainStay Funds Trust: Trustee since 2007** | Chairman and Chief Executive Officer, Somerset & Company (financial advisory firm) since 2004; Managing Director, The Carlyle Group (private investment firm) (2002 to 2004); Senior Managing Director, Partner and Board Member, Groupe Arnault S.A. (private investment firm) (1999 to 2002)
| | MainStay VP Funds Trust: Trustee since 2007 (31 portfolios)***;
MainStay MacKay DefinedTerm Municipal Opportunities Fund: Trustee since 2011; and MainStay CBRE Global Infrastructure Megatrends Fund; Trustee since June 2021 |
**
Includes prior service as a Director/Trustee of certain predecessor entities to MainStay Funds Trust.
***
Includes prior service as a Director of MainStay VP Series Fund, Inc., the predecessor to MainStay VP Funds Trust.
****
Pursuant to the Board's retirement policy, Mr. Nolan retired from the Board effective December 31, 2021.
Board of Trustees and Officers (Unaudited) (continued)
| | Position(s) Held and
Length of Service | Principal Occupation(s)
During Past Five Years | |
| | | | |
| | President, MainStay Funds, MainStay Funds Trust since 2017 | Chief Operating Officer and Senior Managing Director since 2016, New York Life Investment Management LLC and New York Life Investment Management Holdings LLC; Member of the Board of Managers (since 2017) and Senior Managing Director (since 2018), NYLIFE Distributors LLC; Chairman of the Board and Senior Managing Director, NYLIM Service Company LLC since 2017; Trustee, President and Principal Executive Officer of IndexIQ Trust, IndexIQ ETF Trust and IndexIQ Active ETF Trust since January 2018; President, MainStay MacKay DefinedTerm Municipal Opportunities Fund and MainStay VP Funds Trust since 2017** and MainStay CBRE Global Infrastructure Megatrends Fund since 2021; Senior Managing Director, Global Product Development (2015 to 2016); Managing Director, Product Development (2010 to 2015), New York Life Investment Management LLC | |
| | Treasurer and Principal Financial and Accounting Officer, MainStay Funds since 2007, MainStay Funds Trust since 2009 | Managing Director, New York Life Investment Management LLC since 2007; Treasurer and Principal Financial and Accounting Officer, MainStay MacKay DefinedTerm Municipal Opportunities Fund since 2011, MainStay VP Funds Trust since 2007** and MainStay CBRE Global Infrastructure Megatrends Fund since 2021; and Assistant Treasurer, New York Life Investment Management Holdings LLC (2008 to 2012) | |
| | Secretary and Chief Legal Officer, MainStay Funds and MainStay Funds Trust since 2010 | Managing Director and Associate General Counsel, New York Life Investment Management LLC since 2010; Secretary and Chief Legal Officer, MainStay MacKay DefinedTerm Municipal Opportunities Fund since 2011, MainStay VP Funds Trust since 2010** and MainStay CBRE Global Infrastructure Megatrends Fund since 2021 | |
| | Vice President— Administration, MainStay Funds since 2005, MainStay Funds Trust since 2009 | Managing Director, New York Life Investment Management LLC (including predecessor advisory organizations) since 2000; Member of the Board of Directors, New York Life Trust Company since 2009; Vice President—Administration, MainStay MacKay DefinedTerm Municipal Opportunities Fund since 2011, MainStay VP Funds Trust since 2005** and MainStay CBRE Global Infrastructure Megatrends Fund since 2021 | |
| | Vice President and Chief Compliance Officer, MainStay Funds and MainStay Funds Trust since 2021 and 2014 to 2020 | Vice President and Chief Compliance Officer, New York Life Investments Alternatives LLC and New York Life Investment Management Holdings LLC (since 2020); Vice President (since 2018) and Chief Compliance Officer (since 2016), New York Life Investment Management LLC; Vice President and Chief Compliance Officer, IndexIQ Advisors LLC, IndexIQ Holdings Inc., IndexIQ LLC and IndexIQ Trust (since 2017); Director and Associate General Counsel (2011 to 2014) and Vice President and Assistant General Counsel (2010 to 2011), New York Life Investment Management LLC; Vice President and Chief Compliance Officer, MainStay VP Funds Trust and MainStay MacKay DefinedTerm Municipal Opportunities Fund (since June 2021 and 2014 to 2020) and MainStay CBRE Global Infrastructure Megatrends Fund (since 2021); Assistant Secretary, MainStay Funds, MainStay Funds Trust and MainStay VP Funds Trust (2010 to 2014)**, MainStay MacKay DefinedTerm Municipal Opportunities Fund (2011 to 2014) | |
*
The officers listed above are considered to be “interested persons” of the MainStay Group of Funds, MainStay VP Funds Trust, MainStay CBRE Global Infrastructure Megatrends Fund and MainStay MacKay DefinedTerm Municipal Opportunities Fund within the meaning of the 1940 Act because of their affiliation with the MainStay Group of Funds, New York Life Insurance Company and/or its affiliates, including New York Life Investment Management LLC, NYLIM Service Company LLC, NYLIFE Securities LLC and/or NYLIFE Distributors LLC, as described in detail in the column captioned “Principal Occupation(s) During Past Five Years.” Officers are elected annually by the Board.
**
Includes prior service as an Officer of MainStay VP Series Fund, Inc., the predecessor to MainStay VP Funds Trust.
Officers of the Trust (Who are not Trustees)*
| MainStay MacKay Short Term Municipal Fund |
Equity
U.S. Equity
MainStay Epoch U.S. Equity Yield Fund
MainStay S&P 500 Index Fund1
MainStay Winslow Large Cap Growth Fund
MainStay WMC Enduring Capital Fund
MainStay WMC Growth Fund
MainStay WMC Small Companies Fund
MainStay WMC Value Fund
International Equity
MainStay Epoch International Choice Fund
MainStay MacKay International Equity Fund
MainStay WMC International Research Equity Fund
Emerging Markets Equity
MainStay Candriam Emerging Markets Equity Fund
Global Equity
MainStay Epoch Capital Growth Fund
MainStay Epoch Global Equity Yield Fund
Fixed Income
Taxable Income
MainStay Candriam Emerging Markets Debt Fund
MainStay Floating Rate Fund
MainStay MacKay High Yield Corporate Bond Fund
MainStay MacKay Short Duration High Yield Fund
MainStay MacKay Strategic Bond Fund
MainStay MacKay Total Return Bond Fund
MainStay MacKay U.S. Infrastructure Bond Fund
MainStay Short Term Bond Fund
Tax-Exempt Income
MainStay MacKay California Tax Free Opportunities Fund2
MainStay MacKay High Yield Municipal Bond Fund
MainStay MacKay New York Tax Free Opportunities Fund3
MainStay MacKay Short Term Municipal Fund
MainStay MacKay Strategic Municipal Allocation Fund4
MainStay MacKay Tax Free Bond Fund
Money Market
MainStay Money Market Fund
Mixed Asset
MainStay Balanced Fund
MainStay Income Builder Fund
MainStay MacKay Convertible Fund
Speciality
MainStay CBRE Global Infrastructure Fund
MainStay CBRE Real Estate Fund
MainStay Cushing MLP Premier Fund
Asset Allocation
MainStay Conservative Allocation Fund
MainStay Conservative ETF Allocation Fund
MainStay Defensive ETF Allocation Fund
MainStay Equity Allocation Fund
MainStay Equity ETF Allocation Fund
MainStay ESG Multi-Asset Allocation Fund
MainStay Growth Allocation Fund
MainStay Growth ETF Allocation Fund
MainStay Moderate Allocation Fund
MainStay Moderate ETF Allocation Fund
Manager
New York Life Investment Management LLC
New York, New York
Subadvisors
Candriam Belgium S.A.5
Brussels, Belgium
Candriam Luxembourg S.C.A.5
Strassen, Luxembourg
CBRE Investment Management Listed Real Assets LLC
Radnor, Pennsylvania
Cushing Asset Management, LP
Dallas, Texas
Epoch Investment Partners, Inc.
New York, New York
MacKay Shields LLC5
New York, New York
NYL Investors LLC5
New York, New York
Wellington Management Company LLP
Boston, Massachusetts
Winslow Capital Management, LLC
Minneapolis, Minnesota
Legal Counsel
Dechert LLP
Washington, District of Columbia
Independent Registered Public Accounting Firm
KPMG LLP
Philadelphia, Pennsylvania
Distributor
NYLIFE Distributors LLC5
Jersey City, New Jersey
Custodian
JPMorgan Chase Bank, N.A.
New York, New York
1. Prior to February 28, 2022, the Fund's name was MainStay MacKay S&P 500 Index Fund.
2. This Fund is registered for sale in AZ, CA, NV, OR, TX, UT, WA and MI (Class A and Class I shares only), and CO, FL, GA, HI, ID, MA, MD, NH, NJ and NY (Class I shares only).
3. This Fund is registered for sale in CA, CT, DE, FL, MA, NJ, NY and VT.
4. Prior to November 30, 2021, the Fund's name was MainStay MacKay Intermediate Tax Free Bond Fund.
5. An affiliate of New York Life Investment Management LLC.
Not part of the Annual Report
For more information
800-624-6782
newyorklifeinvestments.com
“New York Life Investments” is both a service mark, and the common trade name, of certain investment advisors affiliated with New York Life Insurance Company. The MainStay Funds® are managed by New York Life Investment Management LLC and distributed by NYLIFE Distributors LLC, 30 Hudson Street, Jersey City, NJ 07302, a wholly owned subsidiary of New York Life Insurance Company. NYLIFE Distributors LLC is a Member FINRA/SIPC.
©2022 NYLIFE Distributors LLC. All rights reserved.
1737605MS086-22
MSSTM11-06/22
(NYLIM) NL230
MainStay MacKay Strategic Municipal Allocation Fund
(formerly known as MainStay MacKay Intermediate Tax Free Bond Fund)
Message from the President and Annual ReportApril 30, 2022
Sign up for e-delivery of your shareholder reports. For full details on e-delivery, including who can participate and what you can receive via e-delivery,
please log in to newyorklifeinvestments.com/accounts.
| | | | Not Insured by Any Government Agency |
This page intentionally left blank
Message from the President
The 12-month reporting period ended April 30, 2022, started on a generally positive note. Despite a new wave of COVID-19 infections that disrupted life and commerce, financial markets were buoyed during the spring and summer of 2021 by economic recovery and the widespread availability of vaccines. Most global economies expanded, exceeding pre-pandemic levels, as businesses reopened and supportive government policies bore fruit. As the period progressed, however, inflation began to creep up in response to government stimulus and accommodative monetary policies. Rising prices were further aggravated by wage increases, pandemic-related supply-chain bottlenecks and commodity price spikes. Bond prices slid as interest rates rose, and equity markets faltered. Market sentiment turned increasingly negative in the first quarter of 2022 as aggressive Russian rhetoric regarding Ukraine culminated in Russia’s invasion of its neighbor – a development that exacerbated global inflationary pressures while increasing investor uncertainty. Domestic supply shortages, international trade imbalances and rising inflation caused U.S. GDP (gross domestic product) to contract for the first time since the height of the pandemic, although consumer spending, a primary driver of U.S. economic growth, remained strong. Prices for petroleum surged to multi-year highs, while many key agricultural chemicals and industrial metals reached record territory.
Despite the market decline that greeted the first four months of 2022, the S&P 500® Index, a widely regarded benchmark of market performance, remained in modestly positive territory for the 12-month reporting period. Some market sectors benefited from the prevailing conditions, with energy stocks soaring and value-oriented shares broadly gaining ground. In addition to energy, leading sectors included utilities and consumer staples. On the other hand, the information technology, financials and consumer discretionary sectors were subject to particularly sharp losses. Small- and mid-cap stocks underperformed, as they often do during times of heightened uncertainty and financial stress. International stocks trended lower, with some emerging markets,
including Russia and China, suffering particularly steep losses, while others, such as India and Indonesia, gained ground. Fixed-income markets saw most bond prices fall as central banks contemplated significant interest rate rises to combat higher-than-previously-expected inflation rates late in the reporting period. However, floating-rate instruments, which feature variable interest rates that allow investors to benefit from a rising rate environment, bucked the downward trend.
Today, despite the continuing impact of COVID-19, most of the world appears intent on a return to post-pandemic normalcy. Instead, the focus of global political and economic attention has increasingly turned to the war in Ukraine and the impact of rising inflation. Together, Russia and Ukraine account for a substantial share of the world’s supply of food, fossil fuels and raw materials production. Accordingly, the timing and outcome of this conflict will undoubtedly play a major role in global economic developments over the coming months and, possibly, years. The actions of central banks, as they raise rates to fight inflation while trying to limit the risks of recession, are likely to further affect global markets and economies.
As a MainStay investor, you can depend on us to carefully watch developments that may affect your Fund, taking considered and appropriate action to help you stay on financial track in the midst of uncertain times. As always, we remain dedicated to providing you with the disciplined investment tools you have come to expect from us over the years. Thank you for continuing to place your trust in our team.
Sincerely,
Kirk C. Lehneis
President
The opinions expressed are as of the date of this report and are subject to change. There is no guarantee that any forecast made will come to pass. This material does not constitute investment advice and is not intended as an endorsement of any specific investment. Past performance is no guarantee of future results.
Not part of the Annual Report
Investors should refer to the Fund’s Summary Prospectus and/or Prospectus and consider the Fund’s investment objectives, strategies, risks, charges and expenses carefully before investing. The Summary Prospectus and/or Prospectus contain this and other information about the Fund. You may obtain copies of the Fund’s Summary Prospectus, Prospectus and Statement of Additional Information, which includes information about MainStay Funds Trust's Trustees, free of charge, upon request, by calling toll-free 800-624-6782, by writing to NYLIFE Distributors LLC, Attn: MainStay Marketing Department, 30 Hudson Street, Jersey City, NJ 07302 or by sending an e-mail to MainStayShareholderServices@nylim.com. These documents are also available via the MainStay Funds’ website at newyorklifeinvestments.com. Please read the Fund’s Summary Prospectus and/or Prospectus carefully before investing.
Investment and Performance Comparison (Unaudited)
Performance data quoted represents past performance. Past performance is no guarantee of future results. Because of market volatility and other factors, current performance may be lower or higher than the figures shown. Investment return and principal value will fluctuate, and as a result, when shares are redeemed, they may be worth more or less than their original cost. The graph below depicts the historical performance of Class I shares of the Fund. Performance will vary from class to class based on differences in class-specific expenses and sales charges. For performance information current to the most recent month-end, please call 800-624-6782 or visit newyorklifeinvestments.com.
The performance table and graph do not reflect the deduction of taxes that a shareholder would pay on distributions or Fund share redemptions. Total returns reflect maximum applicable sales charges as indicated in the table below, if any, changes in share price, and reinvestment of dividend and capital gain distributions. The graph assumes the initial investment amount shown below and reflects the deduction of all sales charges that would have applied for the period of investment. Performance figures may reflect certain fee waivers and/or expense limitations, without which total returns may have been lower. For more information on share classes and current fee waivers and/or expense limitations (if any), please refer to the Notes to Financial Statements.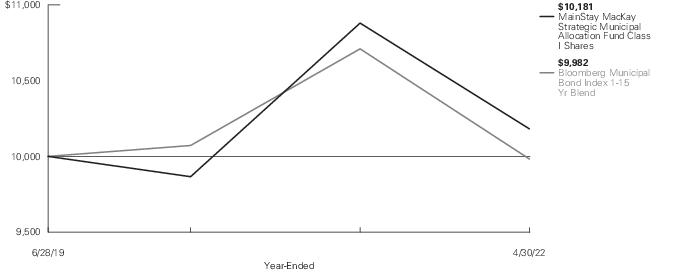
Average Annual Total Returns for the Year-Ended April 30, 2022 |
| | | | | | |
| Maximum 4.5% Initial Sales Charge | | | | | |
| | | | | | |
| Maximum 4% Initial Sales Charge | | | | | |
| | | | | | |
| | | | | | |
| if redeemed Within One Year of Purchase | | | | | |
| | | | | | |
| | | | | | |
| The gross expense ratios presented reflect the Fund’s “Total Annual Fund Operating Expenses” from the most recent Prospectus, as supplemented, and may differ from other expense ratios disclosed in this report. |
| Prior to June 30, 2020, the maximum initial sales charge was 4.5%, which is reflected in the applicable average annual total return figures shown. |
The footnotes on the next page are an integral part of the table and graph and should be carefully read in conjunction with them.
| | |
Bloomberg Municipal Bond Index 1-15 Yr Blend1 | | |
Morningstar Muni National Intermediate Category Average2 | | |
| Returns for indices reflect no deductions for fees, expenses or taxes, except for foreign withholding taxes where applicable. |
| The Bloomberg Municipal Bond Index 1-15 Yr Blend is the Fund's primary broad-based securities-market index for comparison purposes. Results assume reinvestment of all dividends and capital gains. An investment cannot be made directly into an index. |
| The Morningstar Municipal National Intermediate Category Average is representative of funds that invest in bonds issued by various state and local governments to fund public projects. The income from these bonds is generally free from federal taxes. To lower risk, these portfolios spread their assets across many states and sectors. These portfolios have durations of 4.0 to 6.0 years (or average maturities of five to 12 years). Results are based on average total returns of similar funds with all dividends and capital gain distributions reinvested. |
The footnotes on the preceding page are an integral part of the table and graph and should be carefully read in conjunction with them.
| MainStay MacKay Strategic Municipal Allocation Fund |
Cost in Dollars of a $1,000 Investment in MainStay MacKay Strategic Municipal Allocation Fund (Unaudited)
The example below is intended to describe the fees and expenses borne by shareholders during the six-month period from November 1, 2021 to April 30, 2022, and the impact of those costs on your investment.
Example
As a shareholder of the Fund you incur two types of costs: (1) transaction costs, including exchange fees and sales charges (loads) on purchases (as applicable), and (2) ongoing costs, including management fees, distribution and/or service (12b-1) fees and other Fund expenses (as applicable). This example is intended to help you understand your ongoing costs (in dollars) of investing in the Fund and to compare these costs with the ongoing costs of investing in other mutual funds. The example is based on an investment of $1,000 made at the beginning of the six-month period and held for the entire period from November 1, 2021 to April 30, 2022.
This example illustrates your Fund’s ongoing costs in two ways:
Actual Expenses
The second and third data columns in the table below provide information about actual account values and actual expenses. You may use the information in these columns, together with the amount you invested, to estimate the expenses that you paid during the six months ended April 30, 2022. Simply divide your account value by $1,000 (for example, an
$8,600 account value divided by $1,000 = 8.6), then multiply the result by the number under the heading entitled “Expenses Paid During Period” to estimate the expenses you paid on your account during this period.
Hypothetical Example for Comparison Purposes
The fourth and fifth data columns in the table below provide information about hypothetical account values and hypothetical expenses based on the Fund’s actual expense ratio and an assumed rate of return of 5% per year before expenses, which is not the Fund’s actual return. The hypothetical account values and expenses may not be used to estimate the actual ending account balances or expenses you paid for the six-month period shown. You may use this information to compare the ongoing costs of investing in the Fund with the ongoing costs of investing in other mutual funds. To do so, compare this 5% hypothetical example with the 5% hypothetical examples that appear in the shareholder reports of the other mutual funds.
Please note that the expenses shown in the table are meant to highlight your ongoing costs only and do not reflect any transactional costs, such as exchange fees or sales charges (loads). Therefore, the fourth and fifth data columns of the table are useful in comparing ongoing costs only and will not help you determine the relative total costs of owning different funds. In addition, if these transactional costs were included, your costs would have been higher.
| Beginning
Account
Value
11/1/21 | Ending Account
Value (Based
on Actual
Returns and
Expenses)
4/30/22 | | Ending Account
Value (Based
on Hypothetical
5% Annualized
Return and
Actual Expenses)
4/30/22 | | |
| | | | | | |
| | | | | | |
| | | | | | |
| | | | | | |
| | | | | | |
| Expenses are equal to the Fund’s annualized expense ratio of each class multiplied by the average account value over the period, divided by 365 and multiplied by 181 (to reflect the six-month period). The table above represents the actual expenses incurred during the six-month period. In addition to the fees and expenses which the Fund bears directly, it also indirectly bears a pro rata share of the fees and expenses of the underlying funds in which it invests. Such indirect expenses are not included in the above-reported expense figures. |
| Expenses are equal to the Fund's annualized expense ratio to reflect the six-month period. |
Portfolio Composition as of April 30, 2022 (Unaudited) | |
| |
| |
| |
| |
| |
| |
| |
| |
| |
| |
| |
| |
| |
| |
| |
| |
| |
Other Assets, Less Liabilities | |
| |
See Portfolio of Investments beginning on page 11 for specific holdings within these categories. The Fund's holdings are subject to change.
Top Ten Holdings and/or Issuers Held as of April 30, 2022 (excluding short-term investments) (Unaudited)
| Michigan Finance Authority, 4.00%-5.00%, due 2/1/27–6/1/34 |
| Illinois Finance Authority, 4.00%-5.00%, due 10/15/22–10/1/38 |
| California Municipal Finance Authority, 5.00%, due 5/15/26–5/15/36 |
| Minneapolis Special School District No. 1, 5.00%, due 2/1/28–2/1/31 |
| State of Illinois, 5.00%-5.50%, due 12/1/25–5/1/39 |
| Metropolitan Transportation Authority, 5.00%, due 11/15/29–11/15/42 |
| Cook County Township High School District No. 220 Reavis, 5.00%, due 12/1/29 |
| Florida Development Finance Corp., 5.00%, due 6/15/31–2/1/37 |
| City of Kansas City MO, 5.00%, due 9/1/25 |
| New York State Urban Development Corp., 3.00%-5.00%, due 3/15/36–3/15/40 |
| MainStay MacKay Strategic Municipal Allocation Fund |
Portfolio Management Discussion and Analysis (Unaudited)
Questions answered by portfolio managers John Loffredo, CFA, Robert DiMella, CFA, Michael Petty, David Dowden, Scott Sprauer, Frances Lewis, John Lawlor and Michael Denlinger, CFA, of MacKay Shields LLC, the Fund’s Subadvisor.
How did MainStay MacKay Strategic Municipal Allocation Fund perform relative to its benchmark and peer group during the 12 months ended April 30, 2022?
For the 12 months ended April 30, 2022, Class I shares of MainStay MacKay Strategic Municipal Allocation Fund returned −6.43%, outperforming the −6.80% return of the Fund’s benchmark, the Bloomberg Municipal Bond Index 1–15 Year Blend (the “Index”). Over the same period, Class I shares also outperformed the −7.32% return of the Morningstar Muni National Intermediate Category Average. 1
Were there any changes to the Fund during the reporting period?
At meetings held on September 28-29, 2021, the Board of Trustees of MainStay Funds Trust considered and approved changing the Fund’s name and modifying the Fund’s principal investment strategies and investment process. These changes were effective on November 30, 2021. For more information refer to the supplement dated September 30, 2021.
What factors affected the Fund’s relative performance during the reporting period?
During the reporting period, the Fund outperformed the Index due, in part, to security selection. The Fund’s underweight exposure to bonds rated AAA and AA also made a positive contribution to relative performance.2 (Contributions take weightings and total returns into account.) From a geographic perspective, holdings from the states of California and Massachusetts aided relative results. Conversely, bonds maturing 14 years and over detracted from relative returns.
During the reporting period, were there any market events that materially impacted the Fund’s performance or liquidity?
During the last four months of the reporting period, municipal bond yields rose sharply with rising interest rates. The market began to sell off due to higher inflation and the expectation, and
subsequent confirmation, that the U.S. Federal Reserve would seek to tighten monetary conditions at a faster pace than previous expected. This contributed to a flattening of the municipal yield curve3 as short-term yields rose more than longer-term yields. The municipal market began to see record high outflows and this tighter liquidity, combined with the rise in rates, led to negative absolute performance across all sectors.
During the reporting period, how was the Fund’s performance materially affected by investments in derivatives?
During the reporting period, the Fund held U.S. Treasury futures to hedge its duration4 relative to the Index. This position contributed positively to the performance of the Fund.
What was the Fund’s duration strategy during the reporting period?
As relative value investors, the team aims to maintain the Fund’s duration within a neutral range relative to that of the Index. As of October 31, 2021, the Fund's modified duration to worst5 was 4.33 years while the benchmark’s modified duration to worst was 4.17 years.
During the reporting period, which sectors were the strongest positive contributors to the Fund’s relative performance and which sectors were particularly weak?
Across sectors, the Fund’s positions in prerefunded/ETM (escrowed to maturity), state general obligation and industry development revenue/pollution control revenue bonds contributed positively to relative results. Meanwhile, positions in education and hospital detracted from relative performance.
What were some of the Fund’s largest purchases and sales during the reporting period?
The Fund remained focused on diversification and liquidity, so no individual purchase or sale would have been considered
1.
See page 5 for other share class returns, which may be higher or lower than Class I share returns. See page 6 for more information on benchmark and peer group returns.
2.
An obligation rated ‘AAA’ has the highest rating assigned by Standard & Poor’s (“S&P”), and in the opinion of S&P, the obligor’s capacity to meet its financial commitment on the obligation is extremely strong. An obligation rated ‘AA’ by S&P is deemed by S&P to differ from the highest-rated obligations only to a small degree. In the opinion of S&P, the obligor's capacity to meet its financial commitment on the obligation is very strong. When applied to Fund holdings, ratings are based solely on the creditworthiness of the bonds in the portfolio and are not meant to represent the security or safety of the Fund.
3.
Duration is a measure of the price sensitivity of a fixed-income investment to changes in interest rates. Duration is expressed as a number of years and is considered a more accurate sensitivity gauge than average maturity.
4.
Modified duration is inversely related to the approximate percentage change in price for a given change in yield. Duration to worst is the duration of a bond computed using the bond’s nearest call date or maturity, whichever comes first. This measure ignores future cash flow fluctuations due to embedded optionality.
5.
An obligation rated ‘BB’ by S&P to be less vulnerable to nonpayment than other speculative issues. In the opinion of S&P, however, the obligor faces major ongoing uncertainties or exposure to adverse business, financial or economic conditions which could lead to the obligor’s inadequate capacity to meet its financial commitment on the obligation. When applied to Fund holdings, ratings are based solely on the creditworthiness of the bonds in the portfolio and are not meant to represent the security or safety of the Fund.
significant, although sector overweights and security structure, in their entirety, did have an impact.
How did the Fund’s sector weighting change during the reporting period?
During the reporting period, there were no material changes to the weightings in the Fund. At the margin, the Fund increased sector exposure to leasing and education. From a geographic perspective, exposure to Michigan and Texas also increased. Exposure to credits rated AAA and AA rose as well.
Conversely, the Fund decreased sector exposure to transportation and special tax, along with state exposure to New Jersey and Illinois. Across the credit spectrum, the Fund decreased exposure to bonds rated A.6
How was the Fund positioned at the end of the reporting period?
As of April 30, 2022, the Fund held an overweight position relative to the Index in the education and hospital sectors, as well as holdings from the state of Illinois. As of the same date, the Fund held underweight exposure to the state general obligation and prerefunded/ETM sectors, and to holdings from California and New York.
6.
An obligation rated ‘BBB’ by S&P is deemed by S&P to exhibit adequate protection parameters. In the opinion of S&P, however, adverse economic conditions or changing circumstances are more likely to lead to a weakened capacity of the obligor to meet its financial commitment on the obligation. When applied to Fund holdings, ratings are based solely on the creditworthiness of the bonds in the portfolio and are not meant to represent the security or safety of the Fund.
The opinions expressed are those of the portfolio managers as of the date of this report and are subject to change. There is no guarantee that any forecasts will come to pass. This material does not constitute investment advice and is not intended as an endorsement of any specific investment.
| MainStay MacKay Strategic Municipal Allocation Fund |
Portfolio of Investments April 30, 2022†
| | |
|
Long-Term Municipal Bonds 87.5% |
|
Chilton County Health Care Authority, Sales Tax, Chilton County Hospital Project, Revenue Bonds | | |
| | |
| | |
Montgomery County Public Facilities Authority, Revenue Bonds | | |
| | |
| | |
Prichard Water Works & Sewer Board, Revenue Bonds | | |
| | |
| | |
|
Alaska Industrial Development & Export Authority, Interior Gas Utility Project, Revenue Bonds | | |
| | |
| | |
|
Arizona Industrial Development Authority, Ball Charter Schools Projet, Revenue Bonds | | |
| | |
Arizona Industrial Development Authority, Equitable School Revolving Fund LLC, Revenue Bonds | | |
| | |
| | |
| | |
|
California County Tobacco Securitization Agency, Tobacco Settlement, Revenue Bonds, Senior Lien | | |
| | |
| | |
California Health Facilities Financing Authority, Cedars-Sinai Medical Center, Revenue Bonds | | |
| | |
| | |
| | |
|
|
California Municipal Finance Authority, UCR North District Phase I Student Housing Project, Revenue Bonds | | |
| | |
| | |
California Municipal Finance Authority, CHF-Davis I LLC, West Village Student Housing Project, Revenue Bonds | | |
| | |
| | |
California Public Finance Authority, Enso Village Project, Revenue Bonds | | |
| | |
| | |
California School Finance Authority, Sonoma County Junior College District Project, Revenue Bonds | | |
| | |
| | |
California Statewide Communities Development Authority, Community Infrastructure Program, Special Assessment | | |
| | |
| | |
California Statewide Communities Development Authority, CHF-Irvine LLC, Revenue Bonds | | |
| | |
| | |
City of Los Angeles CA, Department of Airports, Revenue Bonds | | |
| | |
City of Vernon CA, Electric System, Revenue Bonds | | |
| | |
| | |
Coast Community College District, Election 2012, Unlimited General Obligation | | |
| | |
| | |
Hercules Redevelopment Agency Successor Agency, Tax Allocation | | |
| | |
| | |
The notes to the financial statements are an integral part of, and should be read in conjunction with, the financial statements.
Portfolio of Investments April 30, 2022† (continued)
| | |
Long-Term Municipal Bonds (continued) |
|
Merced City School District, Election 2014, Unlimited General Obligation | | |
| | |
| | |
Mount Diablo Unified School District, Unlimited General Obligation | | |
| | |
| | |
Ravenswood City School District, Election 2018, Unlimited General Obligation | | |
| | |
| | |
Riverside County Community Facilities District, No. 07-2, Special Tax | | |
| | |
| | |
Roseville Joint Union High School District, School Financing Project, Certificate of Participation | | |
| | |
| | |
State of California, Unlimited General Obligation | | |
| | |
| | |
|
Colorado Educational & Cultural Facilities Authority, Northeast Campus Project, Revenue Bonds | | |
Insured: Moral Obligation State Intercept | | |
| | |
Insured: Moral Obligation State Intercept | | |
| | |
Colorado Educational & Cultural Facilities Authority, New Vision Charter School, Revenue Bonds | | |
Series A, Insured: Moral Obligation | | |
| | |
Colorado Educational & Cultural Facilities Authority, Aspen View Academy Project, Revenue Bonds | | |
| | |
| | |
|
|
Colorado Health Facilities Authority, Aberdeen Ridge, Inc. Obligated Group, Revenue Bonds | | |
| | |
| | |
Colorado Health Facilities Authority, CommonSpirit Health Obligated Group, Revenue Bonds | | |
| | |
| | |
Colorado Health Facilities Authority, CommonSpirit Health, Revenue Bonds | | |
| | |
| | |
| | |
| | |
| | |
| | |
Crystal Valley Metropolitan District No. 2, Limited General Obligation | | |
| | |
| | |
Sierra Ridge Metropolitan District No. 2, Limited General Obligation | | |
| | |
| | |
| | |
|
University of Connecticut, Revenue Bonds | | |
| | |
| | |
|
CFM Community Development District, Capital Improvement, Special Assessment | | |
| | |
City of Pompano Beach FL, John Knox Village Projet, Revenue Bonds | | |
| | |
| | |
Cobblestone Community Development District, Assessment Area Two, Special Assessment | | |
| | |
| | |
The notes to the financial statements are an integral part of, and should be read in conjunction with, the financial statements.
| MainStay MacKay Strategic Municipal Allocation Fund |
| | |
Long-Term Municipal Bonds (continued) |
|
County of Osceola FL, Transportation, Revenue Bonds | | |
| | |
| | |
East Nassau Stewardship District, Special Assessment | | |
| | |
Florida Development Finance Corp., Mater Academy Project, Revenue Bonds | | |
| | |
| | |
Florida Development Finance Corp., UF Health Jacksonville Project, Revenue Bonds | | |
| | |
| | |
Florida Municipal Power Agency, Revenue Bonds | | |
| | |
| | |
Harbor Bay Community Development District, Special Assessment | | |
| | |
| | |
| | |
| | |
Hillsborough County Aviation Authority, Tampa International Airport, Revenue Bonds | | |
| | |
| | |
Laurel Road Community Development District, Special Assessment | | |
| | |
| | |
Miami Beach Health Facilities Authority, Mount Sinai Medical Center of Florida, Revenue Bonds | | |
| | |
| | |
Palm Coast Park Community Development District, Spring Lake Tracts 2 and 3, Special Assessment | | |
| | |
| | |
|
|
Pinellas County Industrial Development Authority, Drs Kiran & Pallavi Patel 2017 Foundation for Global Understanding, Inc. Project, Revenue Bonds | | |
| | |
Preston Cove Community Development District, Special Assessment | | |
| | |
Reunion East Community Development District, Series 2021 Project, Special Assessment | | |
| | |
Reunion West Community Development District, Special Assessment | | |
| | |
Rolling Hills Community Development District, Special Assessment | | |
| | |
| | |
State of Florida, Unlimited General Obligation | | |
| | |
| | |
Verano No. 3 Community Development District, Special Assessment | | |
| | |
Watergrass Community Development District II, Special Assessment | | |
| | |
Windward at Lakewood Ranch Community Development District, Phase 2 Project, Special Assessment | | |
| | |
| | |
|
Atlanta Urban Redevelopment Agency, BeltLine Special Service District, Revenue Bonds | | |
| | |
Brookhaven Development Authority, Children's Healthcare of Atlanta, Revenue Bonds | | |
| | |
The notes to the financial statements are an integral part of, and should be read in conjunction with, the financial statements.
Portfolio of Investments April 30, 2022† (continued)
| | |
Long-Term Municipal Bonds (continued) |
|
DeKalb Private Hospital Authority, Children's Healthcare of Atlanta, Revenue Bonds | | |
| | |
| | |
Municipal Electric Authority of Georgia, Revenue Bonds | | |
| | |
| | |
| | |
|
Guam Government Waterworks Authority, Water and Wastewater System, Revenue Bonds | | |
| | |
Guam Power Authority, Revenue Bonds | | |
| | |
| | |
Territory of Guam, Revenue Bonds | | |
| | |
| | |
Territory of Guam, Business Privilege Tax, Revenue Bonds | | |
| | |
| | |
| | |
|
Kauai County Community Facilities District, Kukui'ula Development Project, Special Tax | | |
| | |
|
Idaho Health Facilities Authority, Madison Memorial Hospital, Revenue Bonds | | |
| | |
Idaho Housing & Finance Association, Revenue Bonds | | |
| | |
| | |
| | |
| | |
|
|
Chicago Board of Education, Capital Appreciation, School Reform, Unlimited General Obligation | | |
Series A, Insured: NATL-RE | | |
(zero coupon), due 12/1/25 | | |
Chicago Board of Education, Unlimited General Obligation | | |
| | |
| | |
Chicago O'Hare International Airport, Revenue Bonds, Senior Lien | | |
| | |
| | |
| | |
| | |
Chicago Park District, Limited General Obligation | | |
| | |
| | |
| | |
| | |
City of Chicago IL, Wastewater Transmission Project, Revenue Bonds, Second Lien | | |
| | |
| | |
City of Chicago IL, Unlimited General Obligation | | |
| | |
| | |
| | |
| | |
Cook County Township High School District No. 220 Reavis, Unlimited General Obligation | | |
| | |
| | |
Illinois Finance Authority, Washington and Jane Smith Home (The), Revenue Bonds | | |
| | |
| | |
| | |
Illinois Finance Authority, Acero Charter Schools, Inc., Revenue Bonds | | |
| | |
The notes to the financial statements are an integral part of, and should be read in conjunction with, the financial statements.
| MainStay MacKay Strategic Municipal Allocation Fund |
| | |
Long-Term Municipal Bonds (continued) |
|
Illinois Finance Authority, University of Chicago (The), Revenue Bonds | | |
| | |
| | |
Illinois Finance Authority, Carle Foundation (The), Revenue Bonds | | |
| | |
| | |
Kankakee County School District No. 111 Kankakee, Limited General Obligation | | |
| | |
| | |
Lake County Consolidated High School District No. 120, Revenue Bonds | | |
| | |
Metropolitan Pier & Exposition Authority, Mccormick Place Expansion Project, Revenue Bonds | | |
| | |
Peoria County Community Unit School District No. 323, Unlimited General Obligation | | |
| | |
Regional Transportation Authority, Revenue Bonds | | |
Series A, Insured: NATL-RE | | |
| | |
Sales Tax Securitization Corp., Revenue Bonds, Second Lien | | |
| | |
| | |
Sangamon County School District No. 186 Springfield, Unlimited General Obligation | | |
| | |
| | |
Sangamon Logan & Menard Counties Community Unit School Dist No. 15 Williamsville, Unlimited General Obligation | | |
| | |
| | |
Southwestern Illinois Development Authority, Southwestern Illinois Flood Prevention District Council, Revenue Bonds | | |
| | |
| | |
|
|
State of Illinois, Unlimited General Obligation | | |
| | |
| | |
| | |
| | |
| | |
Village of Mundelein IL, Unlimited General Obligation | | |
| | |
| | |
Winnebago-Boone Etc Counties Community College District No. 511, Rock Valley College, Unlimited General Obligation | | |
| | |
| | |
| | |
|
Elkhart County Building Corp., Revenue Bonds | | |
Insured: BAM State Intercept | | |
| | |
Indiana Finance Authority, CWA Authority, Inc., Revenue Bonds, Second Lien | | |
| | |
| | |
Indiana Finance Authority, Revenue Bonds, Second Lien | | |
| | |
| | |
Muncie Sanitary District, Revenue Bonds | | |
| | |
| | |
| | |
|
Wyandotte County Unified School District No. 500, Kansas City, Unlimited General Obligation | | |
| | |
| | |
The notes to the financial statements are an integral part of, and should be read in conjunction with, the financial statements.
Portfolio of Investments April 30, 2022† (continued)
| | |
Long-Term Municipal Bonds (continued) |
|
City of Shreveport LA, Water & Sewer, Revenue Bonds | | |
| | |
| | |
Jefferson Parish Consolidated Sewerage District No. 1, Revenue Bonds | | |
| | |
| | |
Louisiana Public Facilities Authority, Loyola University Project, Revenue Bonds | | |
| | |
| | |
|
County of Frederick MD, Urbana Community Development Authority, Special Tax, Senior Lien | | |
| | |
| | |
State of Maryland, Unlimited General Obligation | | |
| | |
| | |
| | |
|
Calhoun County Hospital Finance Authority, Oaklawn Hospital, Revenue Bonds | | |
| | |
City of Saginaw MI, Water Supply System, Revenue Bonds | | |
| | |
| | |
| | |
| | |
Michigan Finance Authority, Lawrence Technological University, Revenue Bonds | | |
| | |
Michigan Finance Authority, Tobacco Settlement Asset-Backed, Revenue Bonds, Senior Lien | | |
| | |
| | |
Michigan Finance Authority, BHSH System Obligated Group, Revenue Bonds | | |
| | |
| | |
|
|
Michigan Finance Authority, Public Lighting Authority Local Project, Revenue Bonds | | |
| | |
Michigan Mathematics & Science Initiative, Revenue Bonds | | |
| | |
Summit Academy North, Michigan Public School Academy, Revenue Bonds | | |
| | |
Wayne-Westland Community Schools, Unlimited General Obligation | | |
| | |
| | |
Wyoming Public Schools, Unlimited General Obligation | | |
| | |
| | |
| | |
|
City of Independence MN, Global Academy Project, Revenue Bonds | | |
| | |
| | |
Minneapolis Special School District No. 1, School Building, Unlimited General Obligation | | |
Series B, Insured: SD CRED PROG | | |
| | |
Minneapolis Special School District No. 1, Long Term Facilities Maintenance, Unlimited General Obligation | | |
Series B, Insured: SD CRED PROG | | |
| | |
| | |
|
Mississippi Hospital Equipment & Facilities Authority, Forrest County General Hospital Project, Revenue Bonds | | |
| | |
|
City of Kansas City MO, Main Streetcar Extension Project, Revenue Bonds | | |
| | |
| | |
The notes to the financial statements are an integral part of, and should be read in conjunction with, the financial statements.
| MainStay MacKay Strategic Municipal Allocation Fund |
| | |
Long-Term Municipal Bonds (continued) |
|
City of St Louis MO, Airport, Revenue Bonds | | |
| | |
St. Louis School District, Unlimited General Obligation | | |
| | |
| | |
| | |
|
County of Gallatin MT, Bozeman Fiber Project, Revenue Bonds (a) | | |
| | |
| | |
| | |
| | |
Fergus County School District No. 1, Unlimited General Obligation | | |
| | |
| | |
| | |
|
Ashland-Greenwood Public Schools, Unlimited General Obligation | | |
| | |
| | |
Central Plains Energy Project, Nebraska Gas Project No. 4, Revenue Bonds | | |
| | |
Southeast Community College Area, Revenue Bonds | | |
| | |
| | |
| | |
|
City of Las Vegas NV, Special Improvement District No. 816, Special Assessment | | |
| | |
Henderson Local Improvement Districts, Special Assessment | | |
| | |
| | |
|
|
Las Vegas Convention & Visitors Authority, Convention Center Expansion, Revenue Bonds | | |
| | |
| | |
| | |
|
New Hampshire Business Finance Authority, Pennichuck Water Works, Inc. Project, Revenue Bonds | | |
| | |
| | |
|
Atlantic County Improvement Authority (The), Stockton University-Atlantic City Campus Phase II Project, Revenue Bonds | | |
| | |
| | |
Essex County Improvement Authority, North Star Academy Charter School Project, Revenue Bonds | | |
| | |
Passaic Valley Sewerage Commission, Revenue Bonds | | |
| | |
| | |
| | |
|
City of Santa Fe NM, El Castillo Retirement Residences Project, Revenue Bonds | | |
| | |
New Mexico Hospital Equipment Loan Council, La Vida Expansion Project, Revenue Bonds | | |
| | |
| | |
| | |
|
Albany Capital Resource Corp., Albany Leadership Charter High School For Girls Project, Revenue Bonds | | |
| | |
The notes to the financial statements are an integral part of, and should be read in conjunction with, the financial statements.
Portfolio of Investments April 30, 2022† (continued)
| | |
Long-Term Municipal Bonds (continued) |
|
City of Yonkers NY, Limited General Obligation | | |
Series B, Insured: BAM State Aid Withholding | | |
| | |
Hempstead Union Free School District, Unlimited General Obligation | | |
Series B, Insured: State Aid Withholding | | |
| | |
Hudson Yards Infrastructure Corp., Second Indenture, Revenue Bonds | | |
| | |
| | |
Metropolitan Transportation Authority, Green Bond, Revenue Bonds | | |
| | |
| | |
Metropolitan Transportation Authority, Revenue Bonds | | |
| | |
| | |
| | |
| | |
Monroe County Industrial Development Corp., Rochester Regional Health Project, Revenue Bonds | | |
| | |
New York City Municipal Water Finance Authority, New York City Water & Sewer System, Revenue Bonds | | |
| | |
| | |
New York City Transitional Finance Authority, Future Tax Secured, Revenue Bonds | | |
| | |
| | |
New York Liberty Development Corp., Bank of America Tower at One Bryant Park Project, Revenue Bonds | | |
| | |
New York Liberty Development Corp., 4 World Trade Center Project, Revenue Bonds | | |
| | |
| | |
| | |
|
|
New York Liberty Development Corp., Revenue Bonds | | |
| | |
| | |
New York State Dormitory Authority, State Personal Income Tax, Revenue Bonds | | |
| | |
| | |
New York State Thruway Authority, Revenue Bonds | | |
| | |
| | |
New York State Urban Development Corp., Personal Income Tax, Revenue Bonds | | |
| | |
| | |
| | |
| | |
New York Transportation Development Corp., John F. kennedy International Airport Project, Revenue Bonds | | |
| | |
Port Authority of New York & New Jersey, Revenue Bonds | | |
| | |
| | |
Triborough Bridge & Tunnel Authority, Revenue Bonds, Senior Lien | | |
| | |
| | |
| | |
|
North Carolina Medical Care Commission, Lutheran Services for the Aging, Revenue Bonds | | |
| | |
| | |
North Carolina Turnpike Authority, Triangle Expressway System, Revenue Bonds, Senior Lien | | |
| | |
| | |
|
City of Grand Forks ND, Altru Health System Obligated Group, Revenue Bonds | | |
| | |
The notes to the financial statements are an integral part of, and should be read in conjunction with, the financial statements.
| MainStay MacKay Strategic Municipal Allocation Fund |
| | |
Long-Term Municipal Bonds (continued) |
|
Akron Bath Copley Joint Township Hospital District, Children's Hospital Medical Center of Akron, Revenue Bonds | | |
| | |
| | |
Ohio Air Quality Development Authority, Ohio Valley Electric Corp. Project, Revenue Bonds | | |
| | |
Ohio Higher Educational Facility Commission, University Circle, Inc. Project, Revenue Bonds, Senior Lien | | |
| | |
State of Ohio, University Hospitals Health System, Inc., Revenue Bonds | | |
| | |
| | |
| | |
|
Bucks County Industrial Development Authority, Grand View Hospital Project, Revenue Bonds | | |
| | |
| | |
Chichester School District, Limited General Obligation | | |
Insured: AGM State Aid Withholding | | |
| | |
City of Philadelphia PA, Airport, Revenue Bonds | | |
| | |
| | |
Dauphin County General Authority, Harrisburg University of Science & Technology, Revenue Bonds | | |
| | |
Forest Hills School District, Limited General Obligation | | |
Insured: BAM State Aid Withholding | | |
| | |
Indiana County Industrial Development Authority, Foundation for Indiana University of Pennsylvania (The), Revenue Bonds | | |
| | |
| | |
| | |
|
|
Lancaster Industrial Development Authority, Landis Homes Retirement Community, Revenue Bonds | | |
| | |
North Pocono School District, Regional Wastewater, Limited General Obligation | | |
Series A, Insured: AGM State Aid Withholding | | |
| | |
Pennsylvania Turnpike Commission, Revenue Bonds | | |
| | |
| | |
Philadelphia Authority for Industrial Development, Philadelphia Performing Arts Charter School Project, Revenue Bonds | | |
| | |
Warrior Run School District, Limited General Obligation | | |
Insured: AGM State Aid Withholding | | |
| | |
| | |
|
Commonwealth of Puerto Rico, Unlimited General Obligation | | |
| | |
(zero coupon), due 7/1/24 | | |
| | |
(zero coupon), due 7/1/33 | | |
| | |
| | |
| | |
| | |
| | |
| | |
| | |
| | |
| | |
| | |
| | |
| | |
| | |
| | |
| | |
| | |
The notes to the financial statements are an integral part of, and should be read in conjunction with, the financial statements.
Portfolio of Investments April 30, 2022† (continued)
| | |
Long-Term Municipal Bonds (continued) |
|
Commonwealth of Puerto Rico, Unlimited General Obligation (continued) | | |
| | |
| | |
| | |
| | |
Commonwealth of Puerto Rico | | |
(zero coupon), due 11/1/43 | | |
Puerto Rico Commonwealth Aqueduct & Sewer Authority, Revenue Bonds, Senior Lien | | |
| | |
| | |
Puerto Rico Sales Tax Financing Corp., Revenue Bonds | | |
| | |
| | |
| | |
| | |
| | |
|
Providence Public Building Authority, Revenue Bonds | | |
| | |
| | |
Rhode Island Housing and Mortgage Finance Corp., Revenue Bonds | | |
| | |
| | |
| | |
|
South Carolina Public Service Authority, Revenue Bonds | | |
| | |
| | |
|
Arlington Higher Education Finance Corp., Wayside Schools, Revenue Bonds | | |
| | |
| | |
City of Houston TX, Hotel Occupancy Tax & Special Tax, Revenue Bonds | | |
| | |
| | |
|
|
City of San Antonio TX, Electric & Gas Systems, Revenue Bonds | | |
| | |
Clifton Higher Education Finance Corp., IDEA Public Schools, Revenue Bonds | | |
Series T, Insured: PSF-GTD | | |
| | |
Series T, Insured: PSF-GTD | | |
| | |
Dallas Fort Worth International Airport, Revenue Bonds | | |
| | |
| | |
Harris County Cultural Education Facilities Finance Corp., Texas Children's Hospital, Revenue Bonds | | |
| | |
| | |
Harris County Municipal Utility District No. 319, Unlimited General Obligation | | |
| | |
| | |
Lewisville Independent School District, Unlimited General Obligation | | |
| | |
| | |
Mesquite Independent School District, Unlimited General Obligation | | |
Series A, Insured: PSF-GTD | | |
| | |
New Hope Cultural Education Facilities Finance Corp., Jubilee Academic Center, Inc., Revenue Bonds (a) | | |
| | |
| | |
North Texas Tollway Authority, North Texas Tollway System, Revenue Bonds, Second Tier | | |
| | |
| | |
Texas Department of Housing & Community Affairs, Revenue Bonds | | |
| | |
| | |
Texas Municipal Gas Acquisition & Supply Corp. III, Revenue Bonds | | |
| | |
| | |
The notes to the financial statements are an integral part of, and should be read in conjunction with, the financial statements.
| MainStay MacKay Strategic Municipal Allocation Fund |
| | |
Long-Term Municipal Bonds (continued) |
|
Texas Private Activity Bond Surface Transportation Corp., LBJ Infrastructure Group LLC I-635 Managed Lanes Project, Revenue Bonds, Senior Lien | | |
| | |
| | |
|
Matching Fund Special Purpose Securitization Corp., Revenue Bonds | | |
| | |
| | |
Virgin Islands Public Finance Authority, Gross Receipts Taxes Loan, Revenue Bonds | | |
Series C, Insured: AGM-CR | | |
| | |
| | |
|
Intermountain Power Agency, Revenue Bonds (c) | | |
| | |
| | |
| | |
| | |
UIPA Crossroads Public Infrastructure District, Tax Allocation | | |
| | |
Utah Charter School Finance Authority, North Star Academy Project, Revenue Bonds | | |
| | |
| | |
Utah Charter School Finance Authority, Spectrum Academy Project, Revenue Bonds | | |
| | |
| | |
Utah Charter School Finance Authority, Summit Academy, Inc. Project, Revenue Bonds | | |
| | |
| | |
| | |
| | |
| | |
|
|
Utah Charter School Finance Authority, Summit Academy, Inc. Project, Revenue Bonds (continued) | | |
| | |
| | |
Utah Infrastructure Agency, Syracuse City Project, Revenue Bonds | | |
| | |
Utah Infrastructure Agency, Revenue Bonds | | |
| | |
| | |
| | |
Utah Transit Authority, Revenue Bonds | | |
| | |
| | |
| | |
|
Lewis County School District No. 226 Adna, Unlimited General Obligation | | |
Insured: School Bond Guaranty | | |
| | |
Washington State Convention Center Public Facilities District, Lodging Tax, Revenue Bonds | | |
| | |
| | |
Washington State Housing Finance Commission, Eliseo Project, Revenue Bonds | | |
| | |
| | |
Washington State Housing Finance Commission, Transforming Age Projects, Revenue Bonds | | |
| | |
| | |
|
Public Finance Authority, Roseman University of Health Sciences, Revenue Bonds | | |
| | |
Public Finance Authority, College Achieve Paterson Charter School Project, Revenue Bonds | | |
| | |
| | |
The notes to the financial statements are an integral part of, and should be read in conjunction with, the financial statements.
Portfolio of Investments April 30, 2022† (continued)
| | |
Long-Term Municipal Bonds (continued) |
|
Village of Mount Pleasant, Revenue Bonds | | |
| | |
| | |
Wisconsin Health & Educational Facilities Authority, Marshfield Clinic Health System, Inc., Revenue Bonds | | |
| | |
| | |
| | |
|
University of Wyoming, Revenue Bonds | | |
| | |
| | |
Total Long-Term Municipal Bonds
(Cost $90,861,493) | | |
Short-Term Municipal Notes 1.9% |
|
Black Belt Energy Gas District, Gas Project No.7, Revenue Bonds | | |
| | |
| | |
|
Metropolitan Water District of Southern California, Waterworks, Revenue Bonds | | |
| | |
| | |
| | |
|
|
County of King WA, Sewer, Revenue Bonds, Junior Lien | | |
| | |
| | |
Total Short-Term Municipal Notes
(Cost $1,855,000) | | |
Total Investments
(Cost $92,716,493) | | |
Other Assets, Less Liabilities | | |
| | |
| Percentages indicated are based on Fund net assets. |
| May be sold to institutional investors only under Rule 144A or securities offered pursuant to Section 4(a)(2) of the Securities Act of 1933, as amended. |
| Interest on these securities was subject to alternative minimum tax. |
| Delayed delivery security. |
| Coupon rate may change based on changes of the underlying collateral or prepayments of principal. Rate shown was the rate in effect as of April 30, 2022. |
| Variable-rate demand notes (VRDNs)—Provide the right to sell the security at face value on either that day or within the rate-reset period. VRDNs will normally trade as if the maturity is the earlier put date, even though stated maturity is longer. The interest rate is reset on the put date at a stipulated daily, weekly, monthly, quarterly, or other specified time interval to reflect current market conditions. These securities do not indicate a reference rate and spread in their description. The maturity date shown is the final maturity. |
Futures Contracts
As of April 30, 2022, the Fund held the following futures contracts1:
| | | | | |
| | | | | |
U.S. Treasury 5 Year Notes | | | | | |
U.S. Treasury 10 Year Notes | | | | | |
Net Unrealized Appreciation | | | | | |
| As of April 30, 2022, cash in the amount of $131,500 was on deposit with a broker or futures commission merchant for futures transactions. |
| Represents the difference between the value of the contracts at the time they were opened and the value as of April 30, 2022. |
|
AGM—Assured Guaranty Municipal Corp. |
BAM—Build America Mutual Assurance Co. |
The notes to the financial statements are an integral part of, and should be read in conjunction with, the financial statements.
| MainStay MacKay Strategic Municipal Allocation Fund |
CHF—Collegiate Housing Foundation |
|
GNMA—Government National Mortgage Association |
NATL-RE—National Public Finance Guarantee Corp. |
PSF-GTD—Permanent School Fund Guaranteed |
Q-SBLF—Qualified School Board Loan Fund |
SD CRED PROG—School District Credit Enhancement Program |
UT CSCE—Utah Charter School Credit Enhancement Program |
The following is a summary of the fair valuations according to the inputs used as of April 30, 2022, for valuing the Fund’s assets:
| Quoted
Prices in
Active
Markets for
Identical
Assets
(Level 1) | Significant
Other
Observable
Inputs
(Level 2) | Significant
Unobservable
Inputs
(Level 3) | |
| | | | |
Investments in Securities (a) | | | | |
| | | | |
Long-Term Municipal Bonds | | | | |
Short-Term Municipal Notes | | | | |
| | | | |
Other Financial Instruments | | | | |
| | | | |
Total Investments in Securities and Other Financial Instruments | | | | |
| For a complete listing of investments and their industries, see the Portfolio of Investments. |
| The value listed for these securities reflects unrealized appreciation (depreciation) as shown on the Portfolio of Investments. |
The notes to the financial statements are an integral part of, and should be read in conjunction with, the financial statements.
Statement of Assets and Liabilities as of April 30, 2022
|
Investment in securities, at value
(identified cost $92,716,493) | |
| |
Cash collateral on deposit at broker for futures contracts | |
| |
| |
| |
Investment securities sold | |
Variation margin on futures contracts | |
| |
| |
|
| |
Investment securities purchased | |
| |
| |
Shareholder communication | |
| |
Transfer agent (See Note 3) | |
| |
NYLIFE Distributors (See Note 3) | |
| |
| |
| |
| |
Composition of Net Assets |
Shares of beneficial interest outstanding (par value of $.001 per share) unlimited number of shares authorized | |
Additional paid-in-capital | |
| |
Total distributable earnings (loss) | |
| |
| |
Net assets applicable to outstanding shares | |
Shares of beneficial interest outstanding | |
Net asset value per share outstanding | |
Maximum sales charge (4.50% of offering price) | |
Maximum offering price per share outstanding | |
| |
Net assets applicable to outstanding shares | |
Shares of beneficial interest outstanding | |
Net asset value per share outstanding | |
Maximum sales charge (4.00% of offering price) | |
Maximum offering price per share outstanding | |
| |
Net assets applicable to outstanding shares | |
Shares of beneficial interest outstanding | |
Net asset value and offering price per share outstanding | |
| |
Net assets applicable to outstanding shares | |
Shares of beneficial interest outstanding | |
Net asset value and offering price per share outstanding | |
| |
Net assets applicable to outstanding shares | |
Shares of beneficial interest outstanding | |
Net asset value and offering price per share outstanding | |
The notes to the financial statements are an integral part of, and should be read in conjunction with, the financial statements.
| MainStay MacKay Strategic Municipal Allocation Fund |
Statement of Operations for the year ended April 30, 2022
|
| |
| |
| |
| |
| |
| |
| |
Transfer agent (See Note 3) | |
Shareholder communication | |
Distribution/Service—Class A (See Note 3) | |
Distribution/Service—Investor Class (See Note 3) | |
Distribution/Service—Class C (See Note 3) | |
| |
| |
Total expenses before waiver/reimbursement | |
Expense waiver/reimbursement from Manager (See Note 3) | |
| |
Net investment income (loss) | |
Realized and Unrealized Gain (Loss) |
Net realized gain (loss) on: | |
Unaffiliated investment transactions | |
| |
| |
Net change in unrealized appreciation (depreciation) on: | |
| |
| |
Net change in unrealized appreciation (depreciation) | |
Net realized and unrealized gain (loss) | |
Net increase (decrease) in net assets resulting from operations | |
The notes to the financial statements are an integral part of, and should be read in conjunction with, the financial statements.
Statements of Changes in Net Assets
for the years ended April 30, 2022 and April 30, 2021
| | |
Increase (Decrease) in Net Assets |
| | |
Net investment income (loss) | | |
| | |
Net change in unrealized appreciation (depreciation) | | |
Net increase (decrease) in net assets resulting from operations | | |
Distributions to shareholders: | | |
| | |
| | |
| | |
| | |
| | |
Total distributions to shareholders | | |
Capital share transactions: | | |
Net proceeds from sales of shares | | |
Net asset value of shares issued to shareholders in reinvestment of distributions | | |
| | |
Increase (decrease) in net assets derived from capital share transactions | | |
Net increase (decrease) in net assets | | |
|
| | |
| | |
The notes to the financial statements are an integral part of, and should be read in conjunction with, the financial statements.
| MainStay MacKay Strategic Municipal Allocation Fund |
Financial Highlights selected per share data and ratios
| | June 28, 2019^ through
April 30, |
| | | |
Net asset value at beginning of period | | | |
Net investment income (loss) | | | |
Net realized and unrealized gain (loss) | | | |
Total from investment operations | | | |
| | | |
From net investment income | | | |
From net realized gain on investments | | | |
| | | |
Net asset value at end of period | | | |
Total investment return (b) | | | |
Ratios (to average net assets)/Supplemental Data: | | | |
Net investment income (loss) | | | |
| | | |
Expenses (before waiver/reimbursement) | | | |
Portfolio turnover rate (c) | | | |
Net assets at end of period (in 000’s) | | | |
| |
| |
| Per share data based on average shares outstanding during the period. |
| Total investment return is calculated exclusive of sales charges and assumes the reinvestment of dividends and distributions. For periods of less than one year, total return is not annualized. |
| The portfolio turnover rate includes variable rate demand notes. |
| | June 28, 2019^ through
April 30, |
| | | |
Net asset value at beginning of period | | | |
Net investment income (loss) | | | |
Net realized and unrealized gain (loss) | | | |
Total from investment operations | | | |
| | | |
From net investment income | | | |
From net realized gain on investments | | | |
| | | |
Net asset value at end of period | | | |
Total investment return (b) | | | |
Ratios (to average net assets)/Supplemental Data: | | | |
Net investment income (loss) | | | |
| | | |
Expenses (before waiver/reimbursement) | | | |
Portfolio turnover rate (c) | | | |
Net assets at end of period (in 000's) | | | |
| |
| |
| Per share data based on average shares outstanding during the period. |
| Total investment return is calculated exclusive of sales charges and assumes the reinvestment of dividends and distributions. For periods of less than one year, total return is not annualized. |
| The portfolio turnover rate includes variable rate demand notes. |
The notes to the financial statements are an integral part of, and should be read in conjunction with, the financial statements.
Financial Highlights selected per share data and ratios
| | June 28, 2019^ through
April 30, |
| | | |
Net asset value at beginning of period | | | |
Net investment income (loss) | | | |
Net realized and unrealized gain (loss) | | | |
Total from investment operations | | | |
| | | |
From net investment income | | | |
From net realized gain on investments | | | |
| | | |
Net asset value at end of period | | | |
Total investment return (b) | | | |
Ratios (to average net assets)/Supplemental Data: | | | |
Net investment income (loss) | | | |
| | | |
Expenses (before waiver/reimbursement) | | | |
Portfolio turnover rate (c) | | | |
Net assets at end of period (in 000’s) | | | |
| |
| |
| Per share data based on average shares outstanding during the period. |
| Total investment return is calculated exclusive of sales charges and assumes the reinvestment of dividends and distributions. For periods of less than one year, total return is not annualized. |
| The portfolio turnover rate includes variable rate demand notes. |
| | June 28, 2019^ through
April 30, |
| | | |
Net asset value at beginning of period | | | |
Net investment income (loss) | | | |
Net realized and unrealized gain (loss) | | | |
Total from investment operations | | | |
| | | |
From net investment income | | | |
From net realized gain on investments | | | |
| | | |
Net asset value at end of period | | | |
Total investment return (b) | | | |
Ratios (to average net assets)/Supplemental Data: | | | |
Net investment income (loss) | | | |
| | | |
Expenses (before waiver/reimbursement) | | | |
Portfolio turnover rate (c) | | | |
Net assets at end of period (in 000’s) | | | |
| |
| |
| Per share data based on average shares outstanding during the period. |
| Total investment return is calculated exclusive of sales charges and assumes the reinvestment of dividends and distributions. Class I shares are not subject to sales charges. For periods of less than one year, total return is not annualized. |
| The portfolio turnover rate includes variable rate demand notes. |
The notes to the financial statements are an integral part of, and should be read in conjunction with, the financial statements.
| MainStay MacKay Strategic Municipal Allocation Fund |
Financial Highlights selected per share data and ratios
| | June 28, 2019^ through
April 30, |
| | | |
Net asset value at beginning of period | | | |
Net investment income (loss) | | | |
Net realized and unrealized gain (loss) | | | |
Total from investment operations | | | |
| | | |
From net investment income | | | |
From net realized gain on investments | | | |
| | | |
Net asset value at end of period | | | |
Total investment return (b) | | | |
Ratios (to average net assets)/Supplemental Data: | | | |
Net investment income (loss) | | | |
| | | |
Expenses (before waiver/reimbursement) | | | |
Portfolio turnover rate (c) | | | |
Net assets at end of period (in 000’s) | | | |
| |
| |
| Per share data based on average shares outstanding during the period. |
| Total investment return is calculated exclusive of sales charges and assumes the reinvestment of dividends and distributions. Class R6 shares are not subject to sales charges. For periods of less than one year, total return is not annualized. |
| The portfolio turnover rate includes variable rate demand notes. |
The notes to the financial statements are an integral part of, and should be read in conjunction with, the financial statements.
Notes to Financial Statements
Note 1-Organization and Business
MainStay Funds Trust (the “Trust”) was organized as a Delaware statutory trust on April 28, 2009. The Trust is registered under the Investment Company Act of 1940, as amended (the “1940 Act”), as an open-end management investment company, and is comprised of thirty-three funds (collectively referred to as the “Funds”). These financial statements and notes relate to the MainStay MacKay Strategic Municipal Allocation Fund (the "Fund"), a “diversified” fund, as that term is defined in the 1940 Act, as interpreted or modified by regulatory authorities having jurisdiction, from time to time.
The following table lists the Fund's share classes that have been registered and commenced operations:
| SIMPLE Class shares were registered for sale effective as of August 31, 2020 but have not yet commenced operations. |
Class A and Investor Class shares are offered at net asset value (“NAV”) per share plus an initial sales charge. No initial sales charge applies to investments of $250,000 or more (and certain other qualified purchases) in Class A and Investor Class shares. A contingent deferred sales charge (“CDSC”) of 1.00% may be imposed on certain redemptions of Class A and Investor Class shares made within 18 months of the date of purchase on shares that were purchased without an initial sales charge. Class C shares are offered at NAV without an initial sales charge, although a 1.00% CDSC may be imposed on certain redemptions of such shares made within one year of the date of purchase of Class C shares. Class I and Class R6 shares are offered at NAV without a sales charge. SIMPLE Class share are expected to be offered at NAV without a sales charge if such shares are offered in the future. Depending upon eligibility, Class C shares convert to either Class A or Investor Class shares at the end of the calendar quarter eight years after the date they were purchased. Additionally, as disclosed in the Fund’s prospectus, Class A shares may convert automatically to Investor Class shares and Investor Class shares may convert automatically to Class A shares. Under certain circum-stances and as may be permitted by the Trust’s multiple class plan pursuant to Rule 18f-3 under the 1940 Act, specified share classes of the Fund may be converted to one or more other share classes of the Fund as disclosed in the capital share transactions within these Notes. The classes of shares have the same voting (except for issues that relate solely to one class), dividend, liquidation and other rights, and the same terms and conditions, except that under distribution plans pursuant to Rule 12b-1 under the 1940 Act, Class C shares are subject to higher distribution and/or service fees than Class A and Investor Class shares. Class I and Class R6 shares are not subject to a distribution and/or service fee.
The Fund's investment objective is to seek current income exempt from regular federal income tax.
Note 2–Significant Accounting Policies
The Fund is an investment company and accordingly follows the investment company accounting and reporting guidance of the Financial Accounting Standards Board (“FASB”) Accounting Standards Codification Topic 946 Financial Services—Investment Companies. The Fund prepares its financial statements in accordance with generally accepted accounting principles (“GAAP”) in the United States of America and follows the significant accounting policies described below.
(A) Securities Valuation. Investments are usually valued as of the close of regular trading on the New York Stock Exchange (the "Exchange") (usually 4:00 p.m. Eastern time) on each day the Fund is open for business ("valuation date").
The Board of Trustees of the Trust (the "Board") adopted procedures establishing methodologies for the valuation of the Fund's securities and other assets and delegated the responsibility for valuation determinations under those procedures to the Valuation Committee of the Trust (the “Valuation Committee”). The procedures state that, subject to the oversight of the Board and unless otherwise noted, the responsibility for the day-to-day valuation of portfolio assets (including fair value measurements for the Fund's assets and liabilities) rests with New York Life Investment Management LLC (“New York Life Investments” or the "Manager"), aided to whatever extent necessary by the Subadvisor (as defined in Note 3(A)). To assess the appropriateness of security valuations, the Manager, the Subadvisor or the Fund's third-party service provider, who is subject to oversight by the Manager, regularly compares prior day prices, prices on comparable securities and the sale prices to the prior and current day prices and challenges prices with changes exceeding certain tolerance levels with third-party pricing services or broker sources.
The Board authorized the Valuation Committee to appoint a Valuation Subcommittee (the “Subcommittee”) to establish the prices of securities for which market quotations are not readily available or the prices of which are not otherwise readily determinable under the procedures. The Subcommittee meets (in person, via electronic mail or via teleconference) on an as-needed basis. The Valuation Committee meets to ensure that actions taken by the Subcommittee were appropriate.
For those securities valued through either a standardized fair valuation methodology or a fair valuation measurement, the Subcommittee deals with such valuation and the Valuation Committee reviews and affirms, if appropriate, the reasonableness of the valuation based on such methodologies and measurements on a regular basis after considering information that is reasonably available and deemed relevant by the Valuation Committee. Any action taken by the Subcommittee with respect to the valuation of a portfolio security or other asset is submitted for review and ratification (if appropriate) to the Valuation Committee and the Board at the next regularly scheduled meeting.
| MainStay MacKay Strategic Municipal Allocation Fund |
"Fair value" is defined as the price the Fund would reasonably expect to receive upon selling an asset or liability in an orderly transaction to an independent buyer in the principal or most advantageous market for the asset or liability. Fair value measurements are determined within a framework that establishes a three-tier hierarchy that maximizes the use of observable market data and minimizes the use of unobservable inputs to establish a classification of fair value measurements for disclosure purposes. "Inputs" refer broadly to the assumptions that market participants would use in pricing the asset or liability, including assumptions about risk, such as the risk inherent in a particular valuation technique used to measure fair value using a pricing model and/or the risk inherent in the inputs for the valuation technique. Inputs may be observable or unobservable. Observable inputs reflect the assumptions market participants would use in pricing the asset or liability based on market data obtained from sources independent of the Fund. Unobservable inputs reflect the Fund’s own assumptions about the assumptions market participants would use in pricing the asset or liability based on the information available. The inputs or methodology used for valuing assets or liabilities may not be an indication of the risks associated with investing in those assets or liabilities. The three-tier hierarchy of inputs is summarized below.
• Level 1—quoted prices in active markets for an identical asset or liability
• Level 2—other significant observable inputs (including quoted prices for a similar asset or liability in active markets, interest rates and yield curves, prepayment speeds, credit risk, etc.)
• Level 3—significant unobservable inputs (including the Fund's own assumptions about the assumptions that market participants would use in measuring fair value of an asset or liability)
The level of an asset or liability within the fair value hierarchy is based on the lowest level of an input, both individually and in the aggregate, that is significant to the fair value measurement. The aggregate value by input level of the Fund’s assets and liabilities as of April 30, 2022, is included at the end of the Portfolio of Investments.
The Fund may use third-party vendor evaluations, whose prices may be derived from one or more of the following standard inputs, among others:
| |
| |
| |
| • Reference data (corporate actions or material event notices) |
• Industry and economic events | |
• Monthly payment information | |
An asset or liability for which market values cannot be measured using the methodologies described above is valued by methods deemed reasonable in good faith by the Valuation Committee, following the procedures established by the Board, to represent fair value. Under these procedures, the Fund generally uses a market-based approach which
may use related or comparable assets or liabilities, recent transactions, market multiples, book values and other relevant information. The Fund may also use an income-based valuation approach in which the anticipated future cash flows of the asset or liability are discounted to calculate fair value. Discounts may also be applied due to the nature and/or duration of any restrictions on the disposition of the asset or liability. Fair value represents a good faith approximation of the value of a security. Fair value determinations involve the consideration of a number of subjective factors, an analysis of applicable facts and circumstances and the exercise of judgment. As a result, it is possible that the fair value for a security determined in good faith in accordance with the Fund's valuation procedures may differ from valuations for the same security determined by other funds using their own valuation procedures. Although the Fund's valuation procedures are designed to value a security at the price the Fund may reasonably expect to receive upon the security's sale in an orderly transaction, there can be no assurance that any fair value determination thereunder would, in fact, approximate the amount that the Fund would actually realize upon the sale of the security or the price at which the security would trade if a reliable market price were readily available. During the year ended April 30, 2022, there were no material changes to the fair value methodologies.
Securities which may be valued in this manner include, but are not limited to: (i) a security for which trading has been halted or suspended; (ii) a debt security that has recently gone into default and for which there is not a current market quotation; (iii) a security of an issuer that has entered into a restructuring; (iv) a security that has been delisted from a national exchange; (v) a security for which the market price is not readily available from a third-party pricing source or, if so provided, does not, in the opinion of the Manager or the Subadvisor, reflect the security's market value; (vi) a security subject to trading collars for which no or limited trading takes place; and (vii) a security whose principal market has been temporarily closed at a time when, under normal conditions, it would be open. Securities valued in this manner are generally categorized as Level 3 in the hierarchy. No securities held by the Fund as of April 30, 2022, were fair valued in such a manner.
Futures contracts are valued at the last posted settlement price on the market where such futures are primarily traded. These securities are generally categorized as Level 1 in the hierarchy.
Municipal debt securities are valued at the evaluated mean prices supplied by a pricing agent or broker selected by the Manager, in consultation with the Subadvisor. The evaluations are market-based measurements processed through a pricing application and represents the pricing agent's good faith determination as to what a holder may receive in an orderly transaction under market conditions. The rules-based logic utilizes valuation techniques that reflect participants' assumptions and vary by asset class and per methodology, maximizing the use of relevant observable data including quoted prices for similar assets, benchmark yield curves and market corroborated inputs. The evaluated bid or mean prices are deemed by the Manager, in consultation with the Subadvisor, to be representative of market values, at the regular close of trading of the Exchange on each valuation date. Municipal debt
Notes to Financial Statements (continued)
securities purchased on a delayed delivery basis are marked to market daily until settlement at the forward settlement date. Municipal debt securities are generally categorized as Level 2 in the hierarchy.
The information above is not intended to reflect an exhaustive list of the methodologies that may be used to value portfolio investments. The valuation procedures permit the use of a variety of valuation methodologies in connection with valuing portfolio investments. The methodology used for a specific type of investment may vary based on the market data available or other considerations. The methodologies summarized above may not represent the specific means by which portfolio investments are valued on any particular business day.
(B) Income Taxes. The Fund's policy is to comply with the requirements of the Internal Revenue Code of 1986, as amended (the “Internal Revenue Code”), applicable to regulated investment companies and to distribute all of its taxable income to the shareholders of the Fund within the allowable time limits.
The Manager evaluates the Fund’s tax positions to determine if the tax positions taken meet the minimum recognition threshold in connection with accounting for uncertainties in income tax positions taken or expected to be taken for the purposes of measuring and recognizing tax liabilities in the financial statements. Recognition of tax benefits of an uncertain tax position is permitted only to the extent the position is “more likely than not” to be sustained assuming examination by taxing authorities. The Manager analyzed the Fund's tax positions taken on federal, state and local income tax returns for all open tax years (for up to three tax years) and has concluded that no provisions for federal, state and local income tax are required in the Fund's financial statements. The Fund's federal, state and local income tax and federal excise tax returns for tax years for which the applicable statutes of limitations have not expired are subject to examination by the Internal Revenue Service and state and local departments of revenue.
(C) Dividends and Distributions to Shareholders. Dividends and distributions are recorded on the ex-dividend date. The Fund intends to declare dividends from net investment income, if any, daily and intends to pay them at least monthly and declares and pays distributions from net realized capital gains, if any, at least annually. Unless a shareholder elects otherwise, all dividends and distributions are reinvested at NAV in the same class of shares of the Fund. Dividends and distributions to shareholders are determined in accordance with federal income tax regulations and may differ from determinations using GAAP.
(D) Security Transactions and Investment Income. The Fund records security transactions on the trade date. Realized gains and losses on security transactions are determined using the identified cost method. Interest income is accrued as earned using the effective interest rate method. Discounts and premiums on securities purchased, other than temporary cash investments that mature in 60 days or less at the time of purchase, for the Fund are accreted and amortized, respectively, on the effective interest rate method.
Investment income and realized and unrealized gains and losses on investments of the Fund are allocated pro rata to the separate classes of shares based upon their relative net assets on the date the income is earned or realized and unrealized gains and losses are incurred.
The Fund may place a debt security on non-accrual status and reduce related interest income by ceasing current accruals and writing off all or a portion of any interest receivables when the collection of all or a portion of such interest has become doubtful. A debt security is removed from non-accrual status when the issuer resumes interest payments or when collectability of interest is reasonably assured.
(E) Expenses. Expenses of the Trust are allocated to the individual Funds in proportion to the net assets of the respective Funds when the expenses are incurred, except where direct allocations of expenses can be made. Expenses (other than transfer agent expenses and fees incurred under the shareholder services plans and/or the distribution plans further discussed in Note 3(B)) are allocated to separate classes of shares pro rata based upon their relative net assets on the date the expenses are incurred. The expenses borne by the Fund, including those of related parties to the Fund, are shown in the Statement of Operations.
(F) Use of Estimates. In preparing financial statements in conformity with GAAP, the Manager makes estimates and assumptions that affect the reported amounts and disclosures in the financial statements. Actual results could differ from those estimates and assumptions.
(G) Futures Contracts. A futures contract is an agreement to purchase or sell a specified quantity of an underlying instrument at a specified future date and price, or to make or receive a cash payment based on the value of a financial instrument (e.g., foreign currency, interest rate, security or securities index). The Fund is subject to risks such as market price risk and/or interest rate risk in the normal course of investing in these contracts. Upon entering into a futures contract, the Fund is required to pledge to the broker or futures commission merchant an amount of cash and/or U.S. government securities equal to a certain percentage of the collateral amount, known as the “initial margin.” During the period the futures contract is open, changes in the value of the contract are recognized as unrealized appreciation or depreciation by marking to market such contract on a daily basis to reflect the market value of the contract at the end of each day’s trading. The Fund agrees to receive from or pay to the broker or futures commission merchant an amount of cash equal to the daily fluctuation in the value of the contract. Such receipts or payments are known as “variation margin.” When the futures contract is closed, the Fund records a realized gain or loss equal to the difference between the proceeds from (or cost of) the closing transaction and the Fund's basis in the contract.
The use of futures contracts involves, to varying degrees, elements of market risk in excess of the amount recognized in the Statement of Assets and Liabilities. The contract or notional amounts and variation margin reflect the extent of the Fund's involvement in open futures positions. There are several risks associated with the use of futures contracts as hedging techniques. There can be no assurance that a liquid
| MainStay MacKay Strategic Municipal Allocation Fund |
market will exist at the time when the Fund seeks to close out a futures contract. If no liquid market exists, the Fund would remain obligated to meet margin requirements until the position is closed. Futures contracts may involve a small initial investment relative to the risk assumed, which could result in losses greater than if the Fund did not invest in futures contracts. Futures contracts may be more volatile than direct investments in the instrument underlying the futures and may not correlate to the underlying instrument, causing a given hedge not to achieve its objectives. The Fund's activities in futures contracts have minimal counterparty risk as they are conducted through regulated exchanges that guarantee the futures against default by the counterparty. In the event of a bankruptcy or insolvency of a futures commission merchant that holds margin on behalf of the Fund, the Fund may not be entitled to the return of the entire margin owed to the Fund, potentially resulting in a loss. The Fund may invest in futures contracts to seek enhanced returns or to reduce the risk of loss by hedging certain of its holdings. The Fund's investment in futures contracts and other derivatives may increase the volatility of the Fund's NAVs and may result in a loss to the Fund. Open futures contracts as of April 30, 2022, are shown in the Portfolio of Investments.
(H) Delayed Delivery Transactions. The Fund may purchase or sell securities on a delayed delivery basis. These transactions involve a commitment by the Fund to purchase or sell securities for a predetermined price or yield, with payment and delivery taking place beyond the customary settlement period. When delayed delivery purchases are outstanding, the Fund will designate liquid assets in an amount sufficient to meet the purchase price. When purchasing a security on a delayed delivery basis, the Fund assumes the rights and risks of ownership of the security, including the risk of price and yield fluctuations, and takes such fluctuations into account when determining its NAV. The Fund may dispose of or renegotiate a delayed delivery transaction after it is entered into, and may sell delayed delivery securities before they are delivered, which may result in a realized gain or loss. When the Fund has sold a security it owns on a delayed delivery basis, the Fund does not participate in future gains and losses with respect to the security. Delayed delivery transactions as of April 30, 2022, are shown in the Portfolio of Investments.
(I) Municipal Bond Risk. The Fund may invest more heavily in municipal bonds from certain cities, states, territories or regions than others, which may increase the Fund’s exposure to losses resulting from economic, political, regulatory occurrences, or declines in tax revenue impacting these particular cities, states, territories or regions. In addition, many state and municipal governments that issue securities are under significant economic and financial stress and may not be able to satisfy their obligations, and these events may be made worse due to economic challenges posed by COVID-19. The Fund may invest a substantial amount of its assets in municipal bonds whose interest is paid solely from revenues of similar projects, such as tobacco settlement bonds. If the Fund concentrates its investments in this manner, it assumes the legal and economic risks relating to such projects and this may have a significant impact on the Fund’s investment performance.
Certain of the issuers in which the Fund may invest have recently experienced, or may experience, significant financial difficulties and repeated credit rating downgrades. On May 3, 2017, the Commonwealth of Puerto Rico (the "Commonwealth") began proceedings pursuant to the Puerto Rico Oversight, Management, and Economic Stability Act (“PROMESA”) to seek bankruptcy-type protections from approximately $74 billion in debt and approximately $48 billion in unfunded pension obligations. In addition, the economic downturn following the outbreak of COVID-19 and the resulting pressure on Puerto Rico’s budget have further contributed to its financial challenges. The federal government has passed certain relief packages, including the Coronavirus Aid, Relief, and Economic Security Act and the American Rescue Plan, which include an aggregate of more than $7 billion in disaster relief funds for the U.S. territories, including Puerto Rico. However, there can be no assurances that the federal funds allocated to the Commonwealth will be sufficient to address the economic challenges arising from COVID-19.
The Commonwealth concluded its Title III restructuring proceedings on behalf of itself and certain instrumentalities effective March 15th, 2022. Approximately 18.75 billion of claims related to debt guaranteed under Puerto Rico's constitution including the Commonwealth of Puerto Rico and Public Building Authority were restructured with issuance of $7.4 billion in new Puerto Rico General Obligation Bonds, $7.1 billion of cash, and $3.5 billion of new Contingent Value instruments. In addition the Commonwealth's exit from the restructuring proceedings resolved certain claims relating to the Commonwealth Employee Retirement System, Convention Center, Highway Authority, and Infrastructure Financing Authority. Several of Commonwealth's agencies are still under Title III restructuring proceedings including the Highway Authority and Electric Authority.
Puerto Rico’s debt restructuring process and other economic, political, social, environmental or health factors or developments could occur rapidly and may significantly affect the value of municipal securities of Puerto Rico. Due to the ongoing budget impact from COVID-19 on the Commonwealth’s finances, the Federal Oversight and Management Board for Puerto Rico or the Commonwealth itself could seek to revise or even terminate earlier agreements reached with certain creditors prior to the outbreak of COVID-19. Any agreement between the Federal Oversight and Management Board and creditors is subject to approval by the judge overseeing the Title III proceedings. The composition of the Federal Oversight and Management Board has changed during the recent period due to existing members either stepping down or being replaced following the expiration of a member's term. There is no assurance that board members will approve the restructuring agreements the prior board had negotiated.
The Fund’s vulnerability to potential losses associated with such developments may be reduced through investing in municipal securities that feature credit enhancements (such as bond insurance). The bond insurance provider pays both principal and interest when due to the bond holder. The magnitude of Puerto Rico’s debt restructuring or other adverse economic developments could pose significant strains on the ability of municipal securities insurers to meet all future claims. As of April
Notes to Financial Statements (continued)
30, 2022, none of the Puerto Rico municipal securities held by the Fund were insured.
(J) Indemnifications. Under the Trust’s organizational documents, its officers and trustees are indemnified against certain liabilities that may arise out of performance of their duties to the Trust. Additionally, in the normal course of business, the Fund enters into contracts with third-party service providers that contain a variety of representations and warranties and that may provide general indemnifications. The Fund's maximum exposure under these arrangements is unknown, as this would involve future claims that may be made against the Fund that have not yet occurred. The Manager believes that the risk of loss in connection with these potential indemnification obligations is remote. However, there can be no assurance that material liabilities related to such obligations will not arise in the future, which could adversely impact the Fund.
(K) Quantitative Disclosure of Derivative Holdings. The following tables show additional disclosures related to the Fund's derivative and hedging activities, including how such activities are accounted for and their effect on the Fund's financial positions, performance and cash flows.
The Fund entered into futures contracts to manage its exposure to the securities markets or to movements in interest rates and currency values.
Fair value of derivative instruments as of April 30, 2022:
| Interest
Rate
Contracts
Risk | |
Futures Contracts - Net Assets—Net unrealized appreciation on futures contracts (a) | | |
| | |
| Includes cumulative appreciation (depreciation) of futures contracts as reported in the Portfolio of Investments. Only current day’s variation margin is reported within the Statement of Assets and Liabilities. |
The effect of derivative instruments on the Statement of Operations for the year ended April 30, 2022:
Net Realized Gain (Loss) from: | Interest
Rate
Contracts
Risk | |
| | |
Total Net Realized Gain (Loss) | | |
Net Change in Unrealized Appreciation (Depreciation) | Interest
Rate
Contracts
Risk | |
| | |
Total Net Change in Unrealized Appreciation (Depreciation) | | |
Note 3–Fees and Related Party Transactions
(A) Manager and Subadvisor. New York Life Investments, a registered investment adviser and an indirect, wholly-owned subsidiary of New York Life Insurance Company ("New York Life"), serves as the Fund's Manager, pursuant to an Amended and Restated Management Agreement ("Management Agreement"). The Manager provides offices, conducts clerical, recordkeeping and bookkeeping services and keeps most of the financial and accounting records required to be maintained by the Fund. Except for the portion of salaries and expenses that are the responsibility of the Fund, the Manager pays the salaries and expenses of all personnel affiliated with the Fund and certain operational expenses of the Fund. During a portion of the year ended April 30, 2022, the Fund reimbursed New York Life Investments in an amount equal to the portion of the compensation of the Chief Compliance Officer attributable to the Fund. MacKay Shields LLC ("MacKay Shields" or the "Subadvisor"), a registered investment adviser and an indirect, wholly-owned subsidiary of New York Life, serves as Subadvisor to the Fund and is responsible for the day-to-day portfolio management of the Fund. Pursuant to the terms of an Amended and Restated Subadvisory Agreement ("Subadvisory Agreement") between New York Life Investments and MacKay Shields, New York Life Investments pays for the services of the Subadvisor.
Pursuant to the Management Agreement, the Fund pays the Manager a monthly fee for the services performed and the facilities furnished at an annual rate of 0.40% of the Fund's average daily net assets.
New York Life Investments has contractually agreed to waive fees and/or reimburse expenses so that Total Annual Fund Operating Expenses (excluding taxes, interest, litigation, extraordinary expenses, brokerage and other transaction expenses relating to the purchase or sale of portfolio investments and acquired (underlying) fund fees and expenses) do not exceed the following percentages of daily net assets: Class A, 0.77% and Class R6, 0.50%. New York Life Investments will apply an equivalent waiver or reimbursement, in an equal number of basis points of the Class A shares waiver/reimbursement, to Investor Class, Class C and Class I shares. This agreement will remain in effect until August 31, 2022, and shall renew automatically for one-year terms unless New York Life Investments provides written notice of termination prior to the start of the next term or upon approval of the Board.
During the year ended April 30, 2022, New York Life Investments earned fees from the Fund in the amount of $280,731 and waived fees and/or reimbursed expenses in the amount of $143,325 and paid the Subadvisor fees of $68,703.
JPMorgan Chase Bank, N.A. ("JPMorgan") provides sub-administration and sub-accounting services to the Fund pursuant to an agreement with New York Life Investments. These services include calculating the daily NAVs of the Fund, maintaining the general ledger and sub-ledger accounts for the calculation of the Fund's NAVs, and assisting New York
| MainStay MacKay Strategic Municipal Allocation Fund |
Life Investments in conducting various aspects of the Fund's administrative operations. For providing these services to the Fund, JPMorgan is compensated by New York Life Investments.
Pursuant to an agreement between the Trust and New York Life Investments, New York Life Investments is responsible for providing or procuring certain regulatory reporting services for the Fund. The Fund will reimburse New York Life Investments for the actual costs incurred by New York Life Investments in connection with providing or procuring these services for the Fund.
(B) Distribution and Service Fees. The Trust, on behalf of the Fund, has entered into a distribution agreement with NYLIFE Distributors LLC (the “Distributor”), an affiliate of New York Life Investments. The Fund has adopted distribution plans (the “Plans”) in accordance with the provisions of Rule 12b-1 under the 1940 Act.
Pursuant to the Class A and Investor Class Plans, the Distributor receives a monthly fee from the Class A and Investor Class shares at an annual rate of 0.25% of the average daily net assets of the Class A and Investor Class shares for distribution and/or service activities as designated by the Distributor. Pursuant to the Class C Plan, Class C shares pay the Distributor a monthly distribution fee at an annual rate of 0.25% of the average daily net assets of the Class C shares, along with a service fee at an annual rate of 0.25% of the average daily net assets of the Class C shares, for a total 12b-1 fee of 0.50%. Class I and Class R6 shares are not subject to a distribution and/or service fee.
The Plans provide that the distribution and service fees are payable to the Distributor regardless of the amounts actually expended by the Distributor for distribution of the Fund's shares and service activities.
(C) Sales Charges. The Fund was advised by the Distributor that the amount of initial sales charges retained on sales of Class A and Investor Class shares during the year ended April 30, 2022, were $1,517 and $136, respectively.
The Fund was also advised that the Distributor retained CDSCs on redemptions of Class C shares during the year ended April 30, 2022, of $99.
(D) Transfer, Dividend Disbursing and Shareholder Servicing Agent. NYLIM Service Company LLC, an affiliate of New York Life Investments, is the Fund's transfer, dividend disbursing and shareholder servicing agent pursuant to an agreement between NYLIM Service Company LLC and the Trust. NYLIM Service Company LLC has entered into an agreement with DST Asset Manager Solutions, Inc. ("DST"), pursuant to which DST performs certain transfer agent services on behalf of NYLIM Service Company LLC. New York Life Investments has contractually agreed to limit the transfer agency expenses charged to the Fund’s share classes to a maximum of 0.35% of that share class’s average daily net assets on an annual basis after deducting any applicable Fund or class-level expense reimbursement or small account fees. This agreement will remain in effect until August 31, 2022, and shall renew automatically for one-year terms unless New York Life
Investments provides written notice of termination prior to the start of the next term or upon approval of the Board. During the year ended April 30, 2022, transfer agent expenses incurred by the Fund and any reimbursements, pursuant to the aforementioned Transfer Agency expense limitation agreement, were as follows:
(E) Small Account Fee. Shareholders with small accounts adversely impact the cost of providing transfer agency services. In an effort to reduce total transfer agency expenses, the Fund has implemented a small account fee on certain types of accounts. As described in the Fund's prospectus, certain shareholders with an account balance of less than $1,000 ($5,000 for Class A share accounts) are charged an annual per account fee of $20 (assessed semi-annually), the proceeds from which offset transfer agent fees as reflected in the Statement of Operations. This small account fee will not apply to certain types of accounts as described further in the Fund’s prospectus.
(F) Capital. As of April 30, 2022, New York Life and its affiliates beneficially held shares of the Fund with the values and percentages of net assets as follows:
Note 4-Federal Income Tax
As of April 30, 2022, the cost and unrealized appreciation (depreciation) of the Fund’s investment portfolio, including applicable derivative contracts and other financial instruments, as determined on a federal income tax basis, were as follows:
| | Gross
Unrealized
Appreciation | Gross
Unrealized
(Depreciation) | Net
Unrealized
Appreciation/
(Depreciation) |
| | | | |
Notes to Financial Statements (continued)
As of April 30, 2022, the components of accumulated gain (loss) on a tax basis were as follows:
| Accumulated
Capital
and Other
Gain (Loss) | Unrealized
Appreciation
(Depreciation) | Total
Accumulated
Gain (Loss) |
| | | |
The difference between book-basis and tax-basis unrealized appreciation (depreciation) is primarily due to mark to market of futures contracts and premium amortization.
During the years ended April 30, 2022 and April 30, 2021, the tax character of distributions paid as reflected in the Statements of Changes in Net Assets was as follows:
| | |
| | |
| | |
| | |
Exempt Interest Dividends | | |
| | |
Note 5–Custodian
JPMorgan is the custodian of cash and securities held by the Fund. Custodial fees are charged to the Fund based on the Fund's net assets and/or the market value of securities held by the Fund and the number of certain transactions incurred by the Fund.
Note 6–Line of Credit
The Fund and certain other funds managed by New York Life Investments maintain a line of credit with a syndicate of banks in order to secure a source of funds for temporary purposes to meet unanticipated or excessive redemption requests.
Effective July 27, 2021, under the credit agreement (the “Credit Agreement”), the aggregate commitment amount is $600,000,000 with an additional uncommitted amount of $100,000,000. The commitment fee is an annual rate of 0.15% of the average commitment amount payable quarterly, regardless of usage, to JPMorgan, who serves as the agent to the syndicate. The commitment fee is allocated among the Fund and certain other funds managed by New York Life Investments based upon their respective net assets and other factors. Interest on any revolving credit loan is charged based upon the Federal Funds Rate or the one-month London Interbank Offered Rate ("LIBOR"), whichever is higher. The Credit Agreement expires on July 26, 2022, although the Fund, certain other funds managed by New York Life Investments and the syndicate of banks may renew the Credit Agreement for an additional year on the same or different terms or enter into a credit agreement with a different syndicate of banks. Prior to July 27, 2021, the aggregate commitment amount and the commitment fee were the same as those under the current Credit Agreement. During the year ended April 30,
2022, there were no borrowings made or outstanding with respect to the Fund under the Credit Agreement.
Note 7–Interfund Lending Program
Pursuant to an exemptive order issued by the SEC, the Fund, along with certain other funds managed by New York Life Investments, may participate in an interfund lending program. The interfund lending program provides an alternative credit facility that permits the Fund and certain other funds managed by New York Life Investments to lend or borrow money for temporary purposes directly to or from one another, subject to the conditions of the exemptive order. During the year ended April 30, 2022, there were no interfund loans made or outstanding with respect to the Fund.
Note 8–Purchases and Sales of Securities (in 000’s)
During the year ended April 30, 2022, purchases and sales of securities, other than short-term securities, were $59,145 and $21,178, respectively.
Note 9–Capital Share Transactions
Transactions in capital shares for the years ended April 30, 2022 and April 30, 2021, were as follows:
| | |
Year ended April 30, 2022: | | |
| | |
Shares issued to shareholders in reinvestment of distributions | | |
| | |
Net increase (decrease) in shares outstanding before conversion | | |
Shares converted into Class A (See Note 1) | | |
| | |
Year ended April 30, 2021: | | |
| | |
Shares issued to shareholders in reinvestment of distributions | | |
| | |
Net increase (decrease) in shares outstanding before conversion | | |
Shares converted into Class A (See Note 1) | | |
| | |
|
| MainStay MacKay Strategic Municipal Allocation Fund |
| | |
Year ended April 30, 2022: | | |
| | |
Shares issued to shareholders in reinvestment of distributions | | |
| | |
Net increase (decrease) in shares outstanding before conversion | | |
Shares converted from Investor Class (See Note 1) | | |
| | |
Year ended April 30, 2021: | | |
| | |
Shares issued to shareholders in reinvestment of distributions | | |
| | |
| | |
|
| | |
Year ended April 30, 2022: | | |
| | |
Shares issued to shareholders in reinvestment of distributions | | |
| | |
Net increase (decrease) in shares outstanding before conversion | | |
Shares converted from Class C (See Note 1) | | |
| | |
Year ended April 30, 2021: | | |
| | |
Shares issued to shareholders in reinvestment of distributions | | |
| | |
Net increase (decrease) in shares outstanding before conversion | | |
Shares converted from Class C (See Note 1) | | |
| | |
|
| | |
Year ended April 30, 2022: | | |
| | |
Shares issued to shareholders in reinvestment of distributions | | |
| | |
| | |
Year ended April 30, 2021: | | |
| | |
Shares issued to shareholders in reinvestment of distributions | | |
| | |
| | |
|
| | |
Year ended April 30, 2022: | | |
Shares issued to shareholders in reinvestment of distributions | | |
| | |
Year ended April 30, 2021: | | |
Shares issued to shareholders in reinvestment of distributions | | |
| | |
Note 10–Other Matters
An outbreak of COVID-19, first detected in December 2019, has developed into a global pandemic and has resulted in travel restrictions, closure of international borders, certain businesses and securities markets, restrictions on securities trading activities, prolonged quarantines, supply chain disruptions, and lower consumer demand, as well as general concern and uncertainty. The continued impact of COVID-19 and related variants is uncertain and could further adversely affect the global economy, national economies, individual issuers and capital markets in unforeseeable ways and result in a substantial and extended economic downturn. Developments that disrupt global economies and financial markets, such as COVID-19, may magnify factors that affect the Fund's performance.
Note 11–Subsequent Events
In connection with the preparation of the financial statements of the Fund as of and for the year ended April 30, 2022, events and transactions subsequent to April 30, 2022, through the date the financial statements were issued have been evaluated by the Manager for possible adjustment and/or disclosure. No subsequent events requiring financial statement adjustment or disclosure have been identified other than the following:
The Board considered and approved changing the Fund’s name and modifying the Fund’s principal investment strategies and investment process effective November 30, 2021. The new name will be MainStay MacKay Strategic Municipal Allocation Fund. For more information in regards to these changes, please see the supplement to the Fund's prospectus dated September 30, 2021.
Report of Independent Registered Public Accounting Firm
To the Shareholders of the Fund and Board of Trustees
MainStay Funds Trust:
Opinion on the Financial Statements
We have audited the accompanying statement of assets and liabilities of MainStay MacKay Strategic Municipal Allocation Fund (formerly, MainStay MacKay Intermediate Tax Free Bond Fund) (the Fund), one of the funds constituting MainStay Funds Trust, including the portfolio of investments, as of April 30, 2022, the related statement of operations for the year then ended, the statements of changes in net assets for each of the years in the two year period then ended, and the related notes (collectively, the financial statements) and the financial highlights for each of the years in the two-year period then ended and the period June 28, 2019 (commencement of operations) through April 30, 2020. In our opinion, the financial statements and financial highlights present fairly, in all material respects, the financial position of the Fund as of April 30, 2022, the results of its operations for the year then ended, the changes in its net assets for each of the years in the two-year period then ended, and the financial highlights for each of the years in the two-year period then ended and the period June 28, 2019 through April 30, 2020, in conformity with U.S. generally accepted accounting principles.
Basis for Opinion
These financial statements and financial highlights are the responsibility of the Fund's management. Our responsibility is to express an opinion on these financial statements and financial highlights based on our audits. We are a public accounting firm registered with the Public Company Accounting Oversight Board (United States) (PCAOB) and are required to be independent with respect to the Fund in accordance with the U.S. federal securities laws and the applicable rules and regulations of the Securities and Exchange Commission and the PCAOB.
We conducted our audits in accordance with the standards of the PCAOB. Those standards require that we plan and perform the audit to obtain reasonable assurance about whether the financial statements and financial highlights are free of material misstatement, whether due to error or fraud. Our audits included performing procedures to assess the risks of material misstatement of the financial statements and financial highlights, whether due to error or fraud, and performing procedures that respond to those risks. Such procedures included examining, on a test basis, evidence regarding the amounts and disclosures in the financial statements and financial highlights. Such procedures also included confirmation of securities owned as of April 30, 2022, by correspondence with the custodian and brokers or by other appropriate auditing procedures when replies from brokers were not received. Our audits also included evaluating the accounting principles used and significant estimates made by management, as well as evaluating the overall presentation of the financial statements and financial highlights. We believe that our audits provide a reasonable basis for our opinion.
We have served as the auditor of one or more New York Life Investment Management investment companies since 2003.
Philadelphia, Pennsylvania
June 27, 2022
| MainStay MacKay Strategic Municipal Allocation Fund |
Board Consideration and Approval of Management Agreement and Subadvisory Agreement (Unaudited)
The continuation of the Management Agreement with respect to the MainStay MacKay Strategic Municipal Allocation Fund (“Fund”) and New York Life Investment Management LLC (“New York Life Investments”) and the Subadvisory Agreement between New York Life Investments and MacKay Shields LLC (“MacKay”) with respect to the Fund (together, “Advisory Agreements”), following an initial term of up to two years, is subject to annual review and approval by the Board of Trustees of MainStay Funds Trust (“Board” of the “Trust”) in accordance with Section 15 of the Investment Company Act of 1940, as amended (“1940 Act”). At its December 8–9, 2021 meeting, the Board, including the Trustees who are not an “interested person” (as such term is defined in the 1940 Act) of the Trust (“Independent Trustees”) voting separately, unanimously approved the continuation of each of the Advisory Agreements for a one-year period.
In reaching the decision to approve the continuation of each of the Advisory Agreements, the Board considered information and materials furnished by New York Life Investments and MacKay in connection with an annual contract review process undertaken by the Board that took place at meetings of the Board and its Contracts Committee during September 2021 through December 2021, including information and materials furnished by New York Life Investments and MacKay in response to requests prepared on behalf of the Board, and in consultation with the Independent Trustees, by independent legal counsel to the Independent Trustees, which encompassed a variety of topics, including those summarized below. Information and materials requested by and furnished to the Board for consideration in connection with the contract review process included, among other items, reports on the Fund and “peer funds” prepared by Institutional Shareholder Services Inc. (“ISS”), an independent third-party service provider engaged by the Board to report objectively on the Fund’s investment performance, management fee and total expenses. The Board also considered information on the fees charged to other investment advisory clients of New York Life Investments and/or MacKay that follow investment strategies similar to those of the Fund, if any, and, when applicable, the rationale for any differences in the Fund’s management and subadvisory fees and the fees charged to those other investment advisory clients. In addition, the Board considered information regarding the legal standards and fiduciary obligations applicable to its consideration of the continuation of each of the Advisory Agreements. The contract review process, including the structure and format for information and materials provided to the Board, has been developed in consultation with the Board. The Independent Trustees also met in executive sessions with their independent legal counsel and, for portions thereof, with senior management of New York Life Investments.
The Board’s deliberations with respect to the continuation of each of the Advisory Agreements reflect a year-long process, and the Board also took into account information furnished to the Board and its Committees throughout the year, as deemed relevant and appropriate by the Trustees, including, among other items, reports on investment performance of the Fund and investment-related matters for the Fund as well as presentations from New York Life Investments and MacKay personnel. In
addition, the Board took into account other information received from New York Life Investments throughout the year, including, among other items, periodic reports on legal and compliance matters, risk management, portfolio turnover, brokerage commissions and non-advisory services provided to the Fund by New York Life Investments, as deemed relevant and appropriate by the Trustees.
In addition to information provided to the Board throughout the year, the Board received information in connection with its June 2021 meeting provided specifically in response to requests prepared on behalf of the Board, and in consultation with the Independent Trustees, by independent legal counsel to the Independent Trustees regarding the Fund’s distribution arrangements. In addition, the Board received information regarding the Fund’s asset levels, share purchase and redemption activity and the payment of Rule 12b-1 and/or other fees by the applicable share classes of the Fund, among other information.
In considering the continuation of each of the Advisory Agreements, the Trustees reviewed and evaluated the information and factors they believed to reasonably be necessary and appropriate in light of legal advice furnished to them by independent legal counsel to the Independent Trustees and through the exercise of their own business judgment. Although individual Trustees may have weighed certain factors or information differently and the Board did not consider any single factor or information controlling in reaching its decision, the factors considered by the Board are described in greater detail below and include, among other factors: (i) the nature, extent and quality of the services provided to the Fund by New York Life Investments and MacKay; (ii) the qualifications of the portfolio managers of the Fund and the historical investment performance of the Fund, New York Life Investments and MacKay; (iii) the costs of the services provided, and profits realized, by New York Life Investments and MacKay with respect to their relationships with the Fund; (iv) the extent to which economies of scale have been realized or may be realized if the Fund grows and the extent to which economies of scale have benefited or may benefit the Fund’s shareholders; and (v) the reasonableness of the Fund’s management and subadvisory fees and total ordinary operating expenses. Although the Board recognized that comparisons between the Fund’s fees and expenses and those of other funds are imprecise given different terms of agreements, variations in fund strategies and other factors, the Board considered the reasonableness of the Fund’s management fee and total ordinary operating expenses as compared to the peer funds identified by ISS. Throughout their considerations, the Trustees acknowledged the commitment of New York Life Investments and its affiliates to serve the MainStay Group of Funds, as well as their capacity, experience, resources, financial stability and reputations. The Trustees also acknowledged the entrepreneurial and other risks assumed by New York Life Investments in sponsoring and managing the Fund.
The Trustees noted that, throughout the year, the Trustees are afforded an opportunity to ask questions of, and request additional information or materials from, New York Life Investments and MacKay. The Board’s decision with respect to each of the Advisory Agreements may have also been based, in part, on the Board’s knowledge of New York Life
Board Consideration and Approval of Management Agreement and Subadvisory Agreement (Unaudited) (continued)
Investments and MacKay resulting from, among other things, the Board’s consideration of each of the Advisory Agreements in prior years, the advisory agreements for other funds in the MainStay Group of Funds, the Board’s review throughout the year of the performance and operations of other funds in the MainStay Group of Funds and each Trustee’s business judgment and industry experience. In addition to considering the above-referenced factors, the Board observed that in the marketplace there are a range of investment options available to investors and that the Fund’s shareholders, having had the opportunity to consider other investment options, have chosen to invest in the Fund.
The factors that figured prominently in the Board’s decision to approve the continuation of each of the Advisory Agreements during its December 8–9, 2021 meeting are summarized in more detail below.
Nature, Extent and Quality of Services Provided by New York Life Investments and MacKay
The Board examined the nature, extent and quality of the services that New York Life Investments provides to the Fund. The Board evaluated New York Life Investments’ experience and capabilities in serving as manager of the Fund and considered that the Fund operates in a “manager-of-managers” structure. The Board also considered New York Life Investments’ responsibilities and services provided pursuant to this structure, including evaluating the performance of MacKay, making recommendations to the Board as to whether the Subadvisory Agreement should be renewed, modified or terminated and periodically reporting to the Board regarding the results of New York Life Investments’ evaluation and monitoring functions. The Board noted that New York Life Investments manages other mutual funds, serves a variety of other investment advisory clients, including other pooled investment vehicles, and has experience overseeing mutual fund service providers, including subadvisors. The Board considered the experience of senior personnel at New York Life Investments providing management and administrative and other non-advisory services to the Fund as well as New York Life Investments’ reputation and financial condition. The Board observed that New York Life Investments devotes significant resources and time to providing management and non-advisory services to the Fund, including New York Life Investments’ supervision and due diligence reviews of MacKay and ongoing analysis of, and interactions with, MacKay with respect to, among other things, the Fund’s investment performance and risks as well as MacKay’s investment capabilities and subadvisory services with respect to the Fund.
The Board also considered the range of services that New York Life Investments provides to the Fund under the terms of the Management Agreement, including: (i) fund accounting and ongoing supervisory services provided by New York Life Investments’ Fund Administration and Accounting Group; (ii) investment supervisory and analytical services provided by New York Life Investments’ Investment Consulting Group; (iii) compliance services provided by the Trust’s Chief Compliance Officer as well as New York Life Investments’ compliance department, including supervision and implementation of the Fund’s compliance program; (iv) legal services provided by New York Life Investments’ Office of the
General Counsel; and (v) risk management monitoring and analysis by compliance and investment personnel. The Board noted that New York Life Investments provides certain other non-advisory services to the Fund. In addition, the Board considered New York Life Investments’ willingness to invest in personnel and other resources, such as cyber security, information security and business continuity planning, designed to benefit the Fund and noted that New York Life Investments is responsible for compensating the Trust’s officers. The Board recognized that New York Life Investments has provided an increasingly broad array of non-advisory services to the MainStay Group of Funds as a result of regulatory and other developments. The Board considered benefits to the Fund’s shareholders from the Fund being part of the MainStay Group of Funds, including the privilege of exchanging investments between the same class of shares of funds in the MainStay Group of Funds, including without the imposition of a sales charge (if any).
The Board also examined the range, and the nature, extent and quality, of the investment advisory services that MacKay provides to the Fund and considered the terms of each of the Advisory Agreements. The Board evaluated MacKay’s experience and performance in serving as subadvisor to the Fund and advising other portfolios and MacKay’s track record and experience in providing investment advisory services, the experience of investment advisory, senior management and administrative personnel at MacKay and New York Life Investments’ and MacKay’s overall resources, legal and compliance environment, capabilities, reputation and history. In addition to information provided in connection with quarterly meetings with the Trust’s Chief Compliance Officer, the Board considered information regarding the compliance policies and procedures of New York Life Investments and MacKay and acknowledged their commitment to further developing and strengthening compliance programs relating to the Fund. The Board reviewed MacKay’s ability to attract and retain qualified investment professionals and willingness to invest in personnel to service and support the Fund. In this regard, the Board considered the qualifications and experience of the Fund’s portfolio managers, the number of accounts managed by the portfolio managers and the method for compensating the portfolio managers.
In addition, the Board considered information provided by New York Life Investments and MacKay regarding the operations of their respective business continuity plans in response to the ongoing COVID-19 pandemic, including the remote working environment.
Based on these considerations, the Board concluded that the Fund would likely continue to benefit from the nature, extent and quality of these services.
Investment Performance
In evaluating the Fund’s investment performance, the Board considered investment performance results over various periods in light of the Fund’s investment objective, strategies and risks. The Board considered investment reports on, and analysis of, the Fund’s performance provided to the Board throughout the year. These reports include, among other items, information on the Fund’s gross and net returns, the Fund’s
| MainStay MacKay Strategic Municipal Allocation Fund |
investment performance compared to relevant investment categories and the Fund’s benchmark, the Fund’s risk-adjusted investment performance and the Fund’s investment performance as compared to peer funds, as appropriate, as well as portfolio attribution information and commentary on the effect of market conditions. The Board also considered information provided by ISS showing the investment performance of the Fund as compared to peer funds.
The Board also gave weight to its discussions with senior management at New York Life Investments concerning the Fund’s investment performance attributable to MacKay as well as discussions between the Fund’s portfolio management team and the members of the Board’s Investment Committee, which generally occur on an annual basis. In addition, the Board considered any specific actions that New York Life Investments or MacKay had taken, or had agreed to take, to seek to enhance Fund investment performance and the results of those actions.
Based on these considerations, the Board concluded that its review of the Fund’s investment performance and related information supported a determination to approve the continuation of each of the Advisory Agreements.
Costs of the Services Provided, and Profits Realized, by New York Life Investments and MacKay
The Board considered the costs of the services provided under each of the Advisory Agreements. The Board also considered the profits realized by New York Life Investments and its affiliates, including MacKay, due to their relationships with the Fund. Because MacKay is an affiliate of New York Life Investments whose subadvisory fee is paid by New York Life Investments, not the Fund, the Board considered cost and profitability information for New York Life Investments and MacKay in the aggregate.
In addition, the Board acknowledged the difficulty in obtaining reliable comparative data about mutual fund managers’ profitability because such information generally is not publicly available and may be impacted by numerous factors, including the structure of a fund manager’s organization, the types of funds it manages, the methodology used to allocate certain fixed costs to specific funds and the manager’s capital structure and costs of capital.
In evaluating the costs of the services provided by New York Life Investments and MacKay and profits realized by New York Life Investments and its affiliates, including MacKay, the Board considered, among other factors, New York Life Investments’ and its affiliates’ continuing investments in, or willingness to invest in, personnel and other resources to support and further enhance the management of the Fund, and that New York Life Investments is responsible for paying the subadvisory fee for the Fund. The Board also considered the financial resources of New York Life Investments and MacKay and acknowledged that New York Life Investments and MacKay must be in a position to attract and retain experienced professional personnel and to maintain a strong financial position for New York Life Investments and MacKay to continue to provide high-quality services to the Fund. The Board recognized that the Fund benefits from the allocation of certain fixed
costs among the funds in the MainStay Group of Funds, among other expected benefits resulting from its relationship with New York Life Investments.
The Board considered information regarding New York Life Investments’ methodology for calculating profitability and allocating costs provided by New York Life Investments in connection with the fund profitability analysis presented to the Board. The Board previously engaged an independent consultant to review the methods used to allocate costs among the funds in the MainStay Group of Funds. The Board noted that the independent consultant had concluded that New York Life Investments’ methods for allocating costs and procedures for estimating overall profitability of the relationship with the funds in the MainStay Group of Funds are reasonable and that New York Life Investments continued to use the same method of calculating profit and allocating costs since the independent consultant’s review. The Board recognized the difficulty in calculating and evaluating a manager’s profitability with respect to the Fund and noted that other profitability methodologies may also be reasonable.
The Board also considered certain fall-out benefits that may be realized by New York Life Investments and its affiliates due to their relationships with the Fund, including reputational and other indirect benefits. The Board recognized, for example, the benefits to MacKay from legally permitted “soft-dollar” arrangements by which brokers provide research and other services to MacKay in exchange for commissions paid by the Fund with respect to trades in the Fund’s portfolio securities. In addition, the Board considered its review of a money market fund advised by New York Life Investments and an affiliated subadvisor that serves as an investment option for the Fund, including the potential rationale for and costs associated with investments in this money market fund by the Fund, if any, and considered information from New York Life Investments that the nature and type of specific investment advisory services provided to this money market fund are distinct from, or in addition to, the investment advisory services provided to the Fund.
The Board observed that, in addition to fees earned by New York Life Investments for managing the Fund, New York Life Investments’ affiliates also earn revenues from serving the Fund in various other capacities, including as the Fund’s transfer agent and distributor. The Board considered information about these other revenues and their impact on the profitability of the relationship with the Fund to New York Life Investments and its affiliates. The Board noted that, although it assessed the overall profitability of the Fund to New York Life Investments and its affiliates as part of the contract review process, when considering the reasonableness of the fee paid to New York Life Investments under the Management Agreement, the Board considered the profitability of New York Life Investments’ relationship with the Fund on a pre-tax basis and without regard to distribution expenses incurred by New York Life Investments from its own resources.
Board Consideration and Approval of Management Agreement and Subadvisory Agreement (Unaudited) (continued)
After evaluating the information deemed relevant by the Trustees, the Board concluded that any profits realized by New York Life Investments and its affiliates, including MacKay, due to their relationships with the Fund were not excessive.
Management and Subadvisory Fees and Total Ordinary Operating Expenses
The Board evaluated the reasonableness of the fee paid under each of the Advisory Agreements and the Fund’s total ordinary operating expenses. The Board primarily considered the reasonableness of the management fee paid by the Fund to New York Life Investments because the subadvisory fee paid to MacKay is paid by New York Life Investments, not the Fund. The Board also considered the reasonableness of the subadvisory fee paid by New York Life Investments and the amount of the management fee retained by New York Life Investments.
In assessing the reasonableness of the Fund’s fees and expenses, the Board primarily considered comparative data provided by ISS on the fees and expenses charged by similar mutual funds managed by other investment advisers. In addition, the Board considered information provided by New York Life Investments and MacKay on fees charged to other investment advisory clients, including institutional separate accounts and/or other funds that follow investment strategies similar to those of the Fund, if any. The Board considered the similarities and differences in the contractual management fee schedules of the Fund and those of the similarly-managed accounts and/or funds, taking into account the rationale for any differences in fee schedules. The Board also took into account explanations provided by New York Life Investments about the more extensive scope of services provided to registered investment companies, such as the Fund, as compared with other investment advisory clients. Additionally, the Board considered the impact of voluntary waivers and expense limitation arrangements on the Fund’s net management fee and expenses. The Board also considered that in proposing fees for the Fund, New York Life Investments considers the competitive marketplace for mutual funds.
The Board took into account information from New York Life Investments regarding the reasonableness of the Fund’s transfer agent fee schedule, including industry data demonstrating that the fees that NYLIM Service Company LLC, an affiliate of New York Life Investments and the Fund’s transfer agent, charges the Fund are within the range of fees charged by transfer agents to other mutual funds. In addition, the Board considered NYLIM Service Company LLC’s profitability in connection with the transfer agent services it provides to the Fund. The Board also took into account information received from NYLIM Service Company LLC regarding the sub-transfer agency payments it made to intermediaries in connection with the provision of sub-transfer agency services to the Fund.
The Board considered the extent to which transfer agent fees comprised total expenses of the Fund. The Board acknowledged the role that the MainStay Group of Funds historically has played in serving the investment needs of New York Life Insurance Company customers, who often maintain smaller account balances than other shareholders of funds, and
the impact of small accounts on the expense ratios of Fund share classes. The Board also recognized measures that it and New York Life Investments have taken to mitigate the effect of small accounts on the expense ratios of Fund share classes, including through the imposition of an expense limitation on net transfer agency expenses. The Board also considered that NYLIM Service Company LLC had waived its contractual cost of living adjustments during the seven years prior to 2021.
Based on the factors outlined above, the Board concluded that the Fund’s management fee and total ordinary operating expenses were within a range that is competitive and support a conclusion that these fees and expenses are reasonable.
Economies of Scale
The Board considered information regarding economies of scale, including whether the Fund’s expense structure permits economies of scale to be appropriately shared with the Fund’s shareholders. The Board also considered a report from New York Life Investments, previously prepared at the request of the Board, that addressed economies of scale, including with respect to the mutual fund business generally, and the various ways in which the benefits of economies of scale may be shared with the funds in the MainStay Group of Funds. Although the Board recognized the difficulty of determining economies of scale with precision, the Board acknowledged that economies of scale may be shared with the Fund in a number of ways, including, for example, through the imposition of fee breakpoints, initially setting management fee rates at scale or making additional investments to enhance services. The Board reviewed information from New York Life Investments showing how the Fund’s management fee schedule compared to fee schedules of other funds and accounts managed by New York Life Investments. The Board also reviewed information from ISS showing how the Fund’s management fee schedule compared with fees paid for similar services by peer funds at varying asset levels.
Based on this information, the Board concluded that economies of scale are appropriately reflected for the benefit of the Fund’s shareholders through the Fund’s expense structure and other methods to share benefits from economies of scale.
Conclusion
On the basis of the information and factors summarized above, among other information and factors deemed relevant by the Trustees, and the evaluation thereof, the Board, including the Independent Trustees voting separately, unanimously voted to approve the continuation of each of the Advisory Agreements.
| MainStay MacKay Strategic Municipal Allocation Fund |
Discussion of the Operation and Effectiveness of the Fund's Liquidity Risk Management Program (Unaudited)
In compliance with Rule 22e-4 under the Investment Company Act of 1940, as amended (the “Liquidity Rule”), the Fund has adopted and implemented a liquidity risk management program (the “Program”), which New York Life Investment Management LLC believes is reasonably designed to assess and manage the Fund's liquidity risk (the risk that the Fund could not meet requests to redeem shares issued by the Fund without significant dilution of remaining investors’ interests in the Fund). The Board of Trustees of MainStay Funds Trust (the "Board") designated New York Life Investment Management LLC as administrator of the Program (the “Administrator”). The Administrator has established a Liquidity Risk Management Committee to assist the Administrator in the implementation and day-to-day administration of the Program and to otherwise support the Administrator in fulfilling its responsibilities under the Program.
At a meeting of the Board held on March 9, 2022, the Administrator provided the Board with a written report addressing the Program’s operation and assessing its adequacy and effectiveness of implementation for the period from January 1, 2021 through December 31, 2021 (the "Review Period"), as required under the Liquidity Rule. The report noted that the Administrator concluded that (i) the Program operated effectively to assess and manage the Fund's liquidity risk, (ii) the Program has been adequately and effectively implemented to monitor and, as applicable, respond to the Fund's liquidity developments and (iii) the Fund's investment strategy continues to be appropriate for an open-end fund. In addition, the report summarized the operation of the Program and the information and factors considered by the Administrator in its assessment of the Program’s implementation, such as the liquidity risk assessment framework and the liquidity classification methodologies, and discussed notable events that impacted liquidity risk during the Review Period.
In accordance with the Program, the Fund's liquidity risk is assessed no less frequently than annually taking into consideration certain factors, as applicable, such as (i) investment strategy and liquidity of portfolio investments, (ii) short-term and long-term cash flow projections and (iii) holdings of cash and cash equivalents, as well as borrowing arrangements and other funding sources. Certain factors are considered under both normal and reasonably foreseeable stressed conditions.
Each Fund portfolio investment is classified into one of four liquidity categories. The classification is based on a determination of the number of days it is reasonably expected to take to convert the investment into cash, or sell or dispose of the investment, in current market conditions without significantly changing the market value of the investment. The Administrator has delegated liquidity classification determinations to the Fund’s subadvisor, subject to appropriate oversight by the Administrator, and liquidity classification determinations are made by taking into account the Fund's reasonably anticipated trade size, various market, trading and investment-specific considerations, as well as market depth, and, in certain cases, third-party vendor data.
The Liquidity Rule requires funds that do not primarily hold assets that are highly liquid investments to adopt a minimum amount of net assets that must be invested in highly liquid investments that are assets (an “HLIM”). In addition, the Liquidity Rule limits a fund's investments in illiquid investments. Specifically, the Liquidity Rule prohibits acquisition of illiquid investments if doing so would result in a fund holding more than 15% of its net assets in illiquid investments that are assets. The Program includes provisions reasonably designed to determine, periodically review and comply with the HLIM requirement, as applicable, and to comply with the 15% limit on illiquid investments.
There can be no assurance that the Program will achieve its objectives under all circumstances in the future. Please refer to the Fund's prospectus for more information regarding the Fund's exposure to liquidity risk and other risks to which it may be subject.
Federal Income Tax
Information (Unaudited)
The Fund is required under the Internal Revenue Code to advise shareholders in a written statement as to the federal tax status of dividends paid by the Fund during such fiscal years.
For Federal individual income tax purposes, the Fund designated 98.7% of the ordinary income dividends paid during its fiscal year ended April 30, 2022 as attributable to interest income from Tax Exempt Municipal Bonds. Such dividends are currently exempt from Federal income taxes under Section 103(a) of the Internal Revenue Code.
In February 2023, shareholders will receive an IRS Form 1099-DIV or substitute Form 1099, which will show the federal tax status of the distributions received by shareholders in calendar year 2022. The amounts that will be reported on such 1099-DIV or substitute Form 1099 will be the amounts you are to use on your federal income tax return and will differ from the amounts which we must report for the Fund's fiscal year ended April 30, 2022.
Proxy Voting Policies and Procedures and Proxy Voting Record
The Fund is required to file with the SEC its proxy voting record for the 12-month period ending June 30 on Form N-PX. A description of the policies and procedures that are used to vote proxies relating to portfolio securities of the Fund is available free of charge upon request by calling 800-624-6782 or visiting the SEC’s website at www.sec.gov. The most recent Form N-PX or proxy voting record is available free of charge upon request by calling 800-624-6782; visiting newyorklifeinvestments.com; or visiting the SEC’s website at www.sec.gov.
Shareholder Reports and Quarterly Portfolio Disclosure
The Fund is required to file its complete schedule of portfolio holdings with the SEC 60 days after its first and third fiscal quarter on Form N-PORT. The Fund's holdings report is available free of charge upon request by calling New York Life Investments at 800-624-6782.
| MainStay MacKay Strategic Municipal Allocation Fund |
Board of Trustees and Officers (Unaudited)
The Trustees and officers of the Fund are listed below. The Board oversees the MainStay Group of Funds (which consists of MainStay Funds and MainStay Funds Trust), MainStay VP Funds Trust, MainStay MacKay DefinedTerm Municipal Opportunities Fund, MainStay CBRE Global Infrastructure Megatrends Fund, the Manager and the Subadvisors, and elects the officers of the Funds who are responsible for the day-to-day operations of the Fund. Information pertaining to the Trustees and officers is set forth below. Each Trustee serves until his or her successor is elected and qualified or until his or her resignation, death or removal. Under the Board’s retirement policy, unless an exception is made, a
Trustee must tender his or her resignation by the end of the calendar year during which he or she reaches the age of 75. Mr. Nolan reached the age of 75 during the calendar year 2021. Accordingly, Mr. Nolan retired at the end of calendar year 2021, at which time, Ms. Hammond became a Trustee of the Funds. Officers are elected annually by the Board. The business address of each Trustee and officer listed below is 51 Madison Avenue, New York, New York 10010. A majority of the Trustees are not “interested persons” (as defined by the 1940 Act and rules adopted by the SEC thereunder) of the Fund (“Independent Trustees”).
| | Term of Office,
Position(s) Held and
Length of Service | Principal Occupation(s)
During Past Five Years | Number of
Portfolios in
Fund Complex
Overseen by
Trustee | Other Directorships
Held by Trustee |
| | | | | |
| | MainStay Funds: Trustee
since 2017;
MainStay Funds Trust:
Trustee since 2017 | Senior Vice President of New York Life since joining in 2010, Member of the Executive Management Committee since 2017, Chief Executive Officer, New York Life Investment Management Holdings LLC & New York Life Investment Management LLC since 2015. Senior Managing Director and Co-President of New York Life Investment Management LLC from January 2014 to May 2015. Previously held positions of increasing responsibility, including head of NYLIM International, Alternative Growth Businesses, and Institutional investments since joining New York Life in 2010 | | MainStay VP Funds Trust:
Trustee since 2017 (31 portfolios);
MainStay MacKay DefinedTerm Municipal Opportunities Fund: Trustee
since 2017;
MainStay CBRE Global Infrastructure Megatrends Fund: Trustee
since March 2021; and
Turtle Beach Corporation: Director since April 2021 |
*
This Trustee is considered to be an “interested person” of the MainStay Group of Funds, MainStay VP Funds Trust, MainStay CBRE Global Infrastructure Megatrends Fund and MainStay MacKay DefinedTerm Municipal Opportunities Fund, within the meaning of the 1940 Act because of her affiliation with New York Life Insurance Company, New York Life Investment Management LLC, Candriam Belgium S.A., Candriam Luxembourg S.C.A., IndexIQ Advisors LLC, MacKay Shields LLC, NYL Investors LLC, NYLIFE Securities LLC and/or NYLIFE Distributors LLC, as described in detail above in the column entitled “Principal Occupation(s) During Past Five Years.”
Board of Trustees and Officers (Unaudited) (continued)
| | Term of Office,
Position(s) Held and
Length of Service | Principal Occupation(s)
During Past Five Years | Number of
Portfolios in
Fund Complex
Overseen by
Trustee | Other Directorships
Held by Trustee |
| | | | | |
| | MainStay Funds: Trustee since 2016, Advisory Board Member (June 2015 to December 2015);
MainStay Funds Trust: Trustee since 2016, Advisory Board Member (June 2015 to December 2015) | Founder and CEO, DanCourt Management, LLC since 1999 | | MainStay VP Funds Trust: Trustee since 2016, Advisory Board Member (June 2015 to December 2015) (31 portfolios);
MainStay MacKay DefinedTerm Municipal Opportunities Fund: Trustee since 2016, Advisory Board Member (June 2015 to December 2015);
MainStay CBRE Global Infrastructure Megatrends Fund: Trustee since June 2021; VanEck Vectors Group of Exchange-Traded Funds: Independent Chairman of the Board of Trustees since 2008 and Trustee since 2006 (56 portfolios); and Berea College of Kentucky: Trustee since 2009, Chair of the Investment Committee since 2018 |
| | MainStay Funds: Chairman since 2017 and Trustee since 2007;
MainStay Funds Trust: Chairman since 2017 and Trustee since 1990** | President, Strategic Management Advisors LLC since 1990 | | MainStay VP Funds Trust: Chairman since January 2017 and Trustee since 2007 (31 portfolios)***;
MainStay MacKay DefinedTerm Municipal Opportunities Fund: Chairman since 2017 and Trustee since 2011;
MainStay CBRE Global Infrastructure Megatrends Fund: Trustee since June 2021; and Legg Mason Partners Funds: Trustee since 1991 (45 portfolios) |
| | MainStay Funds: Trustee since 2006;
MainStay Funds Trust: Trustee since 2007** | Retired; Partner, Ernst & Young LLP (2002 to 2003); Partner, Arthur Andersen LLP (1989 to 2002); Consultant to the MainStay Funds Audit and Compliance Committee (2004 to 2006) | | MainStay VP Funds Trust: Trustee since 2007 (31 portfolios)***;
MainStay MacKay DefinedTerm Municipal Opportunities Fund: Trustee since 2011; and
MainStay CBRE Global Infrastructure Megatrends Fund: Trustee since June 2021 |
| Richard H. Nolan, Jr.
1946**** | MainStay Funds: Trustee since 2007;
MainStay Funds Trust: Trustee since 2007** | Managing Director, ICC Capital Management since 2004; President—Shields/Alliance, Alliance Capital Management (1994 to 2004) | | MainStay VP Funds Trust: Trustee since 2006 (31 portfolios)***;
MainStay MacKay DefinedTerm Municipal Opportunities Fund: Trustee since 2011; and
MainStay CBRE Global Infrastructure Megatrends Fund: Trustee since June 2021 |
| MainStay MacKay Strategic Municipal Allocation Fund |
| | Term of Office, Position(s) Held and Length of Service | Principal Occupation(s) During Past Five Years | Number of Portfolios in Fund Complex Overseen by Trustee | Other Directorships Held by Trustee |
| | | | | |
| | MainStay Funds: Trustee since December 2021, Advisory Board Member (June 2021 to December 2021);
MainStay Funds Trust:
Trustee since December 2021, Advisory Board Member (June 2021 to December 2021)
| Retired, Managing Director, Devonshire Investors (2007 to 2013); Senior Vice President, Fidelity Management & Research Co. (2005 to 2007); Senior Vice President and Corporate Treasurer, FMR Corp. (2003 to 2005); Chief Operating Officer, Fidelity Investments Japan (2001 to 2003) | | MainStay VP Funds Trust: Trustee since December 2021, Advisory Board Member (June 2021 to December 2021) (31 Portfolios);
MainStay MacKay DefinedTerm Municipal Opportunities Fund: Trustee since December 2021, Advisory Board Member (June 2021 to December 2021);
MainStay CBRE Global Infrastructure Megatrends Fund: Trustee since December 2021, Advisory Board Member (June 2021 to December 2021);
Two Harbors Investment Corp.: Member since 2018, Chair of the Special Committee since 2019;
Rhode Island School of Design: Director and Chair of the Finance Committee since 2015; and
Blue Cross Blue Shield of Rhode Island: Director since 2019 |
| | MainStay Funds: Trustee since 2016, Advisory Board Member (June 2015 to December 2015);
MainStay Funds Trust: Trustee since 2016, Advisory Board Member (June 2015 to December 2015) | Founder and Chief Executive Officer, CapShift Advisors LLC since 2018; President, Fidelity Management & Research Company (2009 to 2014); President and Chief Investment Officer, Geode Capital Management, LLC (2001 to 2009) | | MainStay VP Funds Trust: Trustee since 2016, Advisory Board Member (June 2015 to December 2015) (31 portfolios);
MainStay MacKay DefinedTerm Municipal Opportunities Fund: Trustee since 2016, Advisory Board Member (June 2015 to December 2015);
MainStay CBRE Global Infrastructure Megatrends Fund: Trustee since June 2021; Partners in Health: Trustee since 2019; Allstate Corporation: Director since 2015; and MSCI, Inc.: Director since 2017 |
| | MainStay Funds: Trustee since 1994;
MainStay Funds Trust: Trustee since 2007** | Chairman and Chief Executive Officer, Somerset & Company (financial advisory firm) since 2004; Managing Director, The Carlyle Group (private investment firm) (2002 to 2004); Senior Managing Director, Partner and Board Member, Groupe Arnault S.A. (private investment firm) (1999 to 2002)
| | MainStay VP Funds Trust: Trustee since 2007 (31 portfolios)***;
MainStay MacKay DefinedTerm Municipal Opportunities Fund: Trustee since 2011; and MainStay CBRE Global Infrastructure Megatrends Fund; Trustee since June 2021 |
**
Includes prior service as a Director/Trustee of certain predecessor entities to MainStay Funds Trust.
***
Includes prior service as a Director of MainStay VP Series Fund, Inc., the predecessor to MainStay VP Funds Trust.
****
Pursuant to the Board's retirement policy, Mr. Nolan retired from the Board effective December 31, 2021.
Board of Trustees and Officers (Unaudited) (continued)
| | Position(s) Held and
Length of Service | Principal Occupation(s)
During Past Five Years | |
| | | | |
| | President, MainStay Funds, MainStay Funds Trust since 2017 | Chief Operating Officer and Senior Managing Director since 2016, New York Life Investment Management LLC and New York Life Investment Management Holdings LLC; Member of the Board of Managers (since 2017) and Senior Managing Director (since 2018), NYLIFE Distributors LLC; Chairman of the Board and Senior Managing Director, NYLIM Service Company LLC since 2017; Trustee, President and Principal Executive Officer of IndexIQ Trust, IndexIQ ETF Trust and IndexIQ Active ETF Trust since January 2018; President, MainStay MacKay DefinedTerm Municipal Opportunities Fund and MainStay VP Funds Trust since 2017** and MainStay CBRE Global Infrastructure Megatrends Fund since 2021; Senior Managing Director, Global Product Development (2015 to 2016); Managing Director, Product Development (2010 to 2015), New York Life Investment Management LLC | |
| | Treasurer and Principal Financial and Accounting Officer, MainStay Funds since 2007, MainStay Funds Trust since 2009 | Managing Director, New York Life Investment Management LLC since 2007; Treasurer and Principal Financial and Accounting Officer, MainStay MacKay DefinedTerm Municipal Opportunities Fund since 2011, MainStay VP Funds Trust since 2007** and MainStay CBRE Global Infrastructure Megatrends Fund since 2021; and Assistant Treasurer, New York Life Investment Management Holdings LLC (2008 to 2012) | |
| | Secretary and Chief Legal Officer, MainStay Funds and MainStay Funds Trust since 2010 | Managing Director and Associate General Counsel, New York Life Investment Management LLC since 2010; Secretary and Chief Legal Officer, MainStay MacKay DefinedTerm Municipal Opportunities Fund since 2011, MainStay VP Funds Trust since 2010** and MainStay CBRE Global Infrastructure Megatrends Fund since 2021 | |
| | Vice President— Administration, MainStay Funds since 2005, MainStay Funds Trust since 2009 | Managing Director, New York Life Investment Management LLC (including predecessor advisory organizations) since 2000; Member of the Board of Directors, New York Life Trust Company since 2009; Vice President—Administration, MainStay MacKay DefinedTerm Municipal Opportunities Fund since 2011, MainStay VP Funds Trust since 2005** and MainStay CBRE Global Infrastructure Megatrends Fund since 2021 | |
| | Vice President and Chief Compliance Officer, MainStay Funds and MainStay Funds Trust since 2021 and 2014 to 2020 | Vice President and Chief Compliance Officer, New York Life Investments Alternatives LLC and New York Life Investment Management Holdings LLC (since 2020); Vice President (since 2018) and Chief Compliance Officer (since 2016), New York Life Investment Management LLC; Vice President and Chief Compliance Officer, IndexIQ Advisors LLC, IndexIQ Holdings Inc., IndexIQ LLC and IndexIQ Trust (since 2017); Director and Associate General Counsel (2011 to 2014) and Vice President and Assistant General Counsel (2010 to 2011), New York Life Investment Management LLC; Vice President and Chief Compliance Officer, MainStay VP Funds Trust and MainStay MacKay DefinedTerm Municipal Opportunities Fund (since June 2021 and 2014 to 2020) and MainStay CBRE Global Infrastructure Megatrends Fund (since 2021); Assistant Secretary, MainStay Funds, MainStay Funds Trust and MainStay VP Funds Trust (2010 to 2014)**, MainStay MacKay DefinedTerm Municipal Opportunities Fund (2011 to 2014) | |
*
The officers listed above are considered to be “interested persons” of the MainStay Group of Funds, MainStay VP Funds Trust, MainStay CBRE Global Infrastructure Megatrends Fund and MainStay MacKay DefinedTerm Municipal Opportunities Fund within the meaning of the 1940 Act because of their affiliation with the MainStay Group of Funds, New York Life Insurance Company and/or its affiliates, including New York Life Investment Management LLC, NYLIM Service Company LLC, NYLIFE Securities LLC and/or NYLIFE Distributors LLC, as described in detail in the column captioned “Principal Occupation(s) During Past Five Years.” Officers are elected annually by the Board.
**
Includes prior service as an Officer of MainStay VP Series Fund, Inc., the predecessor to MainStay VP Funds Trust.
Officers of the Trust (Who are not Trustees)*
| MainStay MacKay Strategic Municipal Allocation Fund |
This page intentionally left blank.
This page intentionally left blank.
Equity
U.S. Equity
MainStay Epoch U.S. Equity Yield Fund
MainStay S&P 500 Index Fund1
MainStay Winslow Large Cap Growth Fund
MainStay WMC Enduring Capital Fund
MainStay WMC Growth Fund
MainStay WMC Small Companies Fund
MainStay WMC Value Fund
International Equity
MainStay Epoch International Choice Fund
MainStay MacKay International Equity Fund
MainStay WMC International Research Equity Fund
Emerging Markets Equity
MainStay Candriam Emerging Markets Equity Fund
Global Equity
MainStay Epoch Capital Growth Fund
MainStay Epoch Global Equity Yield Fund
Fixed Income
Taxable Income
MainStay Candriam Emerging Markets Debt Fund
MainStay Floating Rate Fund
MainStay MacKay High Yield Corporate Bond Fund
MainStay MacKay Short Duration High Yield Fund
MainStay MacKay Strategic Bond Fund
MainStay MacKay Total Return Bond Fund
MainStay MacKay U.S. Infrastructure Bond Fund
MainStay Short Term Bond Fund
Tax-Exempt Income
MainStay MacKay California Tax Free Opportunities Fund2
MainStay MacKay High Yield Municipal Bond Fund
MainStay MacKay New York Tax Free Opportunities Fund3
MainStay MacKay Short Term Municipal Fund
MainStay MacKay Strategic Municipal Allocation Fund4
MainStay MacKay Tax Free Bond Fund
Money Market
MainStay Money Market Fund
Mixed Asset
MainStay Balanced Fund
MainStay Income Builder Fund
MainStay MacKay Convertible Fund
Speciality
MainStay CBRE Global Infrastructure Fund
MainStay CBRE Real Estate Fund
MainStay Cushing MLP Premier Fund
Asset Allocation
MainStay Conservative Allocation Fund
MainStay Conservative ETF Allocation Fund
MainStay Defensive ETF Allocation Fund
MainStay Equity Allocation Fund
MainStay Equity ETF Allocation Fund
MainStay ESG Multi-Asset Allocation Fund
MainStay Growth Allocation Fund
MainStay Growth ETF Allocation Fund
MainStay Moderate Allocation Fund
MainStay Moderate ETF Allocation Fund
Manager
New York Life Investment Management LLC
New York, New York
Subadvisors
Candriam Belgium S.A.5
Brussels, Belgium
Candriam Luxembourg S.C.A.5
Strassen, Luxembourg
CBRE Investment Management Listed Real Assets LLC
Radnor, Pennsylvania
Cushing Asset Management, LP
Dallas, Texas
Epoch Investment Partners, Inc.
New York, New York
MacKay Shields LLC5
New York, New York
NYL Investors LLC5
New York, New York
Wellington Management Company LLP
Boston, Massachusetts
Winslow Capital Management, LLC
Minneapolis, Minnesota
Legal Counsel
Dechert LLP
Washington, District of Columbia
Independent Registered Public Accounting Firm
KPMG LLP
Philadelphia, Pennsylvania
Distributor
NYLIFE Distributors LLC5
Jersey City, New Jersey
Custodian
JPMorgan Chase Bank, N.A.
New York, New York
1. Prior to February 28, 2022, the Fund's name was MainStay MacKay S&P 500 Index Fund.
2. This Fund is registered for sale in AZ, CA, NV, OR, TX, UT, WA and MI (Class A and Class I shares only), and CO, FL, GA, HI, ID, MA, MD, NH, NJ and NY (Class I shares only).
3. This Fund is registered for sale in CA, CT, DE, FL, MA, NJ, NY and VT.
4. Prior to November 30, 2021, the Fund's name was MainStay MacKay Intermediate Tax Free Bond Fund.
5. An affiliate of New York Life Investment Management LLC.
Not part of the Annual Report
For more information
800-624-6782
newyorklifeinvestments.com
“New York Life Investments” is both a service mark, and the common trade name, of certain investment advisors affiliated with New York Life Insurance Company. The MainStay Funds® are managed by New York Life Investment Management LLC and distributed by NYLIFE Distributors LLC, 30 Hudson Street, Jersey City, NJ 07302, a wholly owned subsidiary of New York Life Insurance Company. NYLIFE Distributors LLC is a Member FINRA/SIPC.
©2022 NYLIFE Distributors LLC. All rights reserved.
1859291MS086-22
MSMSMA11-06/22
(NYLIM) NL466
Item 2. Code of Ethics.
As of the end of the period covered by this report, the Registrant has adopted a code of ethics (the “Code”) that applies to the Registrant’s principal executive officer (“PEO”) and principal financial officer (“PFO”). A copy of the Code is filed herewith. The Registrant did not grant any waivers, including implicit waivers, from any provisions of the Code to the PEO or PFO during the period covered by this report.
| Item 3. | Audit Committee Financial Expert. |
The Board of Trustees has determined that the Registrant has three audit committee financial experts serving on its Audit Committee. The Audit Committee financial experts are Alan R. Latshaw, Karen Hammond and Susan B. Kerley. Mr. Latshaw, Ms. Hammond and Ms. Kerley are “independent” as defined by Item 3 of Form N-CSR.
| Item 4. | Principal Accountant Fees and Services. |
(a) Audit Fees
The aggregate fees billed for the fiscal year ended April 30, 2022 for professional services rendered by KPMG LLP (“KPMG”) for the audit of the Registrant’s annual financial statements or services that are normally provided by KPMG in connection with statutory and regulatory filings or engagements for that fiscal year were $370,400.
The aggregate fees billed for the fiscal year ended April 30, 2021 for professional services rendered by KPMG for the audit of the Registrant’s annual financial statements or services that are normally provided by KPMG in connection with statutory and regulatory filings or engagements for that fiscal year were $296,581.
(b) Audit-Related Fees
The aggregate fees billed for assurance and related services by KPMG that are reasonably related to the performance of the audit of the Registrant’s financial statements and are not reported under paragraph (a) of this Item were (i) $0 for the fiscal year ended April 30, 2022; and (ii) $0 for the fiscal year ended April 30, 2021.
(c) Tax Fees
The aggregate fees billed for professional services rendered by KPMG for tax compliance, tax advice, and tax planning were (i) $0 during the fiscal year ended April 30, 2022; and (ii) $0 during the fiscal year ended April 30, 2021. These services primarily included preparation of federal, state and local income tax returns and excise tax returns, as well as services relating to excise tax distribution requirements.
(d) All Other Fees
The aggregate fees billed for products and services provided by KPMG, other than the services reported in paragraphs (a) through (c) of this Item were (i) $0 during the fiscal year ended April 30, 2022; and (ii) $0 during the fiscal year ended April 30, 2021.
(e) Pre-Approval Policies and Procedures
| | (1) | The Registrant’s Audit Committee has adopted pre-approval policies and procedures (the “Procedures”) to govern the Committee’s pre-approval of (i) all audit services and permissible non-audit services to be provided to the Registrant by its independent accountant, and (ii) all permissible non-audit services to be provided by such independent accountant to the Registrant’s investment adviser and to any entity controlling, controlled by or under common control with the investment adviser that provides ongoing services to the Registrant (collectively, the “Service Affiliates”) if the services directly relate to the Registrant’s operations and financial reporting. In accordance with the Procedures, the Audit Committee is responsible for the engagement of the independent accountant to certify the Registrant’s financial statements for each fiscal year. With respect to the pre-approval of non-audit services provided to the Registrant and its Service Affiliates, the Procedures provide that the Audit Committee may annually pre-approve a list of the types of services that may be provided to the Registrant or its Service Affiliates, or the Audit Committee may pre-approve such services on a project-by-project basis as they arise. Unless a type of service has received general pre-approval, it will require specific pre-approval by the Audit Committee if it is to be provided by the independent accountant. The Procedures also permit the Audit Committee to delegate authority to one or more of its members to pre-approve any proposed non-audit services that have not been previously pre-approved by the Audit Committee, subject to the ratification by the full Audit Committee no later than its next scheduled meeting. To date, the Audit Committee has not delegated such authority. |
| | (2) | With respect to the services described in paragraphs (b) through (d) of this Item 4, no amount was approved by the Audit Committee pursuant to paragraph (c)(7)(i)(C) of Rule 2-01 of Regulation S-X. |
(f) There were no hours expended on KPMG’s engagement to audit the Registrant’s financial statements for the most recent fiscal year was attributable to work performed by persons other than KPMG’s full-time, permanent employees.
(g) All non-audit fees billed by KPMG for services rendered to the Registrant for the fiscal years ended April 30, 2022 and April 30, 2021 are disclosed in 4(b)-(d) above.
The aggregate non-audit fees billed by KPMG for services rendered to the Registrant’s investment adviser (not including any sub-adviser whose role is primarily portfolio management and is subcontracted with or overseen by another investment adviser), and any entity controlling, controlled by, or under common control with the adviser that provides ongoing services to the Registrant were approximately (i) $32,255 for the fiscal year ended April 30, 2022; and (ii) $72,995 for the fiscal year ended April 30, 2021.
(h) The Registrant’s Audit Committee has determined that the non-audit services rendered by KPMG for the fiscal year ended April 30, 2022 to the Registrant’s investment adviser and any entity controlling, controlled by, or under common control with the Registrant’s investment adviser that provides ongoing services to the Registrant that were not required to be pre-approved by the Audit Committee because they did not relate directly to the operations and financial reporting of the registrant were compatible with maintaining the respective independence of KPMG during the relevant time period.
| Item 5. | Audit Committee of Listed Registrants. |
Not applicable.
The Schedule of Investments is included as part of Item 1 of this report.
| Item 7. | Disclosure of Proxy Voting Policies and Procedures for Closed-End Management Investment Companies. |
Not applicable.
| Item 8. | Portfolio Managers of Closed-End Management Investment Companies. |
Not applicable.
| Item 9. | Purchases of Equity Securities by Closed-End Management Investment Company and Affiliated Purchasers. |
Not applicable.
| Item 10. | Submission of Matters to a Vote of Security Holders. |
Since the Registrant’s last response to this Item, there have been no material changes to the procedures by which shareholders may recommend nominees to the Registrant’s Board of Trustees.
| Item 11. | Controls and Procedures. |
(a) Based on an evaluation of the Registrant’s Disclosure Controls and Procedures (as defined in Rule 30a-3(c) under the Investment Company Act of 1940) (the “Disclosure Controls”), as of a date within 90 days prior to the filing date (the “Filing Date”) of this Form N-CSR (the “Report”), the Registrant’s principal executive officer and principal financial officer have concluded that the Disclosure Controls are reasonably designed to ensure that information required to be disclosed by the Registrant in the Report is recorded, processed, summarized and reported by the Filing Date, including ensuring that information required to be disclosed in the Report is accumulated and communicated to the Registrant’s management, including the Registrant’s principal executive officer and principal financial officer, as appropriate to allow timely decisions regarding required disclosure.
(b) There were no changes in the Registrant’s internal control over financial reporting (as defined in Rule 30a-3(d)) under the Investment Company Act of 1940 that occurred during the period covered by this report that has materially affected, or is reasonably likely to materially affect, the Registrant’s internal control over financial reporting.
| Item 12. | Disclosure of Securities Lending Activities for Closed-End Management Investment Companies. |
Not applicable.
SIGNATURES
Pursuant to the requirements of the Securities Exchange Act of 1934 and the Investment Company Act of 1940, the Registrant has duly caused this Report to be signed on its behalf by the undersigned, thereunto duly authorized.
MAINSTAY FUNDS TRUST
| | |
| |
| By: | | /s/ Kirk C. Lehneis |
| | Kirk C. Lehneis |
| | President and Principal Executive Officer |
| |
Date: | | July 6, 2022 |
Pursuant to the requirements of the Securities Exchange Act of 1934 and the Investment Company Act of 1940, this Report has been signed below by the following persons on behalf of the Registrant and in the capacities and on the dates indicated.
| | |
| |
| By: | | /s/ Kirk C. Lehneis |
| | Kirk C. Lehneis |
| | President and Principal Executive Officer |
| |
Date: | | July 6, 2022 |
| |
| By: | | /s/ Jack R. Benintende |
| | Jack R. Benintende |
| | Treasurer and Principal Financial and Accounting Officer |
| |
Date: | | July 6, 2022 |