UNITED STATES
SECURITIES AND EXCHANGE COMMISSION
Washington, D.C. 20549
Form N-CSR
CERTIFIED SHAREHOLDER REPORT OF REGISTERED MANAGEMENT
INVESTMENT COMPANIES
Investment Company Act File Number 811-22321
MAINSTAY FUNDS TRUST
(Exact name of Registrant as specified in charter)
51 Madison Avenue, New York, NY 10010
(Address of principal executive offices) (Zip code)
J. Kevin Gao, Esq.
30 Hudson Street
Jersey City, New Jersey 07302
(Name and address of agent for service)
Registrant’s telephone number, including area code: (212) 576-7000
Date of fiscal year end: April 30
(MainStay CBRE Global Infrastructure Fund, MainStay CBRE Real Estate Fund, MainStay Conservative ETF Allocation Fund, MainStay Defensive ETF Allocation Fund, MainStay Equity ETF Allocation Fund, MainStay Growth ETF Allocation Fund, MainStay Moderate ETF Allocation Fund, MainStay ESG Multi-Asset Allocation Fund, MainStay MacKay Strategic Municipal Allocation Fund and MainStay MacKay Short Term Municipal Fund)
Date of reporting period: April 30, 2023
FORM N-CSR
The information presented in this Form N-CSR relates solely to the MainStay CBRE Global Infrastructure Fund, MainStay CBRE Real Estate Fund, MainStay Conservative ETF Allocation Fund, MainStay Defensive ETF Allocation Fund, MainStay Equity ETF Allocation Fund, MainStay Growth ETF Allocation Fund, MainStay Moderate ETF Allocation Fund, MainStay ESG Multi-Asset Allocation Fund, and MainStay MacKay Strategic Municipal Allocation Fund, each a series of the Registrant.
Item 1. Reports to Stockholders.
MainStay CBRE Global Infrastructure Fund
Message from the President and Annual Report
April 30, 2023
Sign up for e-delivery of your shareholder reports. For full details on e-delivery, including who can participate and what you can receive via e-delivery,
please log in to newyorklifeinvestments.com/accounts.
| Not FDIC/NCUA Insured | Not a Deposit | May Lose Value | No Bank Guarantee | Not Insured by Any Government Agency |
This page intentionally left blank
Message from the President
Despite high levels of volatility and sharp, short-term shifts in value, broadly based stock and bond indices saw relatively modest overall changes during the 12-month reporting period ended April 30, 2023. A deeply challenging investment environment during the last eight months of 2022, driven by increasing inflationary pressures and aggressive monetary efforts to curb them, was followed by a more positive, but uneven, economic and monetary backdrop during the first four months of 2023.
In April 2022, before the start of the reporting period, U.S. inflation stood at an annualized rate of 8.3%, up from 4.2% a year earlier. The U.S. Federal Reserve (the “Fed”), had begun to take steps to curb inflation, raising the federal funds rate from near zero in March 2022. Eight separate rate hikes during the reporting period brought the benchmark rate up to 4.75–5.00% in March 2023. Inflation seemed to respond, easing steadily from a peak of 9.1% in June 2022 to 4.9% in April 2023. Although further interest rate increases are expected in 2023, by the end of the reporting period, it appeared that the Fed might be nearing the end of the current rate-hike cycle. Economic growth, although slower, remained positive, supported by historically high levels of employment and robust consumer spending. International economies experienced similar trends, with more modest central bank interest-rate hikes curbing inflation to a degree.
Equity market behavior during the reporting period reflected the arc of monetary policy and economic developments. From May through early October 2022, as inflation raged and interest-rate increases accelerated, investors shied away from perceived risk, favoring relatively defensive and value-oriented sectors over growth-oriented sectors. The S&P 500® Index, a widely regarded benchmark of U.S. market performance, declined by more than 13% during this time, while international stocks suffered even sharper losses. These trends reversed from mid-October 2022 through the end of the reporting period, as inflationary pressures eased and markets began to anticipate an end to rising interest rates. Between mid-October 2022 and April 30, 2023, the S&P 500® Index regained all the ground it lost earlier, ending in modestly positive territory. International developed-markets stocks bounced back even stronger, prompted by surprisingly robust economic resilience in Europe and further bolstered by China’s
reopening after the government rescinded its “zero-COVID-19” policy and eased regulatory restrictions on key industries. The declining value of the U.S. dollar relative to other currencies also enhanced international market equity performance. Emerging markets generally lagged their developed-markets counterparts while outperforming U.S. markets.
Fixed-income markets followed a similar pattern of retreat and recovery. Bond prices trended sharply downward early in the reporting period, as yields rose along with interest rates. Short-term yields rose faster than long-term yields, producing a yield curve inversion—with long-term rates lower than short-term rates—that persisted from July through the end of the reporting period. However, market sentiment improved in the second half of the reporting period as inflationary pressures eased. As the Fed decreased the magnitude of rate increases, focus turned toward the possibility of eventual rate reductions and a potential ‘soft landing’ for the economy. On the negative side, a small number of high-profile, regional U.S. bank failures in March and April 2023 raised fears of possible wider banking industry contagion and future credit constraints.
While many market observers believe the Fed has neared the end of the current cycle of rate increases, the central bank’s rhetoric remains sharply focused on its target inflation rate of 2%. Only time will tell if the market’s favorable expectations prove well founded.
However the economic story unfolds in the months and years to come, we remain dedicated to providing you with the one-on-one philosophy and diversified, multi-boutique investment resources that set New York Life Investments apart. Thank you for trusting us to help you meet your investment needs.
Sincerely,
Kirk C. Lehneis
President
The opinions expressed are as of the date of this report and are subject to change. There is no guarantee that any forecast made will come to pass. This material does not constitute investment advice and is not intended as an endorsement of any specific investment. Past performance is no guarantee of future results.
Not part of the Annual Report
Investors should refer to the Fund’s Summary Prospectus and/or Prospectus and consider the Fund’s investment objectives, strategies, risks, charges and expenses carefully before investing. The Summary Prospectus and/or Prospectus contain this and other information about the Fund. You may obtain copies of the Fund’s Summary Prospectus, Prospectus and Statement of Additional Information, which includes information about the MainStay Funds Trust's Trustees, free of charge, upon request, by calling toll-free 800-624-6782, by writing to NYLIFE Distributors LLC, Attn: MainStay Marketing Department, 30 Hudson Street, Jersey City, NJ 07302 or by sending an e-mail to MainStayShareholderServices@nylim.com. These documents are also available via the MainStay Funds’ website at newyorklifeinvestments.com. Please read the Fund’s Summary Prospectus and/or Prospectus carefully before investing.
Investment and Performance Comparison (Unaudited)
Performance data quoted represents past performance. Past performance is no guarantee of future results. Because of market volatility and other factors, current performance may be lower or higher than the figures shown. Investment return and principal value will fluctuate, and as a result, when shares are redeemed, they may be worth more or less than their original cost. The graph below depicts the historical performance of Class I shares of the Fund. Performance will vary from class to class based on differences in class-specific expenses and sales charges. For performance information current to the most recent month-end, please call 800-624-6782 or visit newyorklifeinvestments.com.
The performance table and graph do not reflect the deduction of taxes that a shareholder would pay on distributions or Fund share redemptions. Total returns reflect maximum applicable sales charges as indicated in the table below, if any, changes in share price, and reinvestment of dividend and capital gain distributions. The graph assumes the initial investment amount shown below and reflects the deduction of all sales charges that would have applied for the period of investment. Performance figures may reflect certain fee waivers and/or expense limitations, without which total returns may have been lower. For more information on share classes and current fee waivers and/or expense limitations (if any), please refer to the Notes to Financial Statements.

| Average Annual Total Returns for the Year-Ended April 30, 2023 |
| Class | Sales Charge | | Inception
Date1 | One
Year | Five
Years | Since
Inception | Gross
Expense
Ratio2 |
| Class A Shares3 | Maximum 5.50% Initial Sales Charge | With sales charges | 10/16/2013 | -5.19% | 5.95% | 6.99% | 1.26% |
| | | Excluding sales charges | | 0.33 | 7.22 | 7.66 | 1.26 |
| Investor Class Shares4 | Maximum 5.00% Initial Sales Charge | With sales charges | 2/24/2020 | -4.68 | N/A | 0.77 | 1.31 |
| | | Excluding sales charges | | 0.34 | N/A | 2.57 | 1.31 |
| Class C Shares3 | Maximum 1.00% CDSC | With sales charges | 2/28/2019 | -1.39 | N/A | 5.84 | 2.06 |
| | if Redeemed Within One Year of Purchase | Excluding sales charges | | -0.42 | N/A | 5.84 | 2.06 |
| Class I Shares3 | No Sales Charge | | 6/28/2013 | 0.63 | 7.51 | 8.53 | 1.01 |
| Class R6 Shares | No Sales Charge | | 2/24/2020 | 0.78 | N/A | 3.00 | 0.91 |
| 1. | Effective at the close of business on February 21, 2020, the Fund changed its fiscal and tax year end from October 31 to April 30. |
| 2. | The gross expense ratios presented reflect the Fund’s “Total Annual Fund Operating Expenses” from the most recent Prospectus, as supplemented, and may differ from other expense ratios disclosed in this report. |
| 3. | Performance figures for Class A shares, Class C shares and Class I shares reflect the historical performance of the then-existing Class A shares, Class C shares and Class I shares, respectively, of the Voya CBRE Global Infrastructure Fund (the predecessor to the Fund, which was subject to a different fee structure) for periods prior to February 21, 2020. The MainStay CBRE Global Infrastructure Fund commenced operations on February 24, 2020. |
| 4. | Prior to June 30, 2020, the maximum initial sales charge was 5.50%, which is reflected in the applicable average annual total return figures shown. |
The footnotes on the next page are an integral part of the table and graph and should be carefully read in conjunction with them.
| Benchmark Performance* | One
Year | Five
Years | Since
Inception |
| FTSE Global Core Infrastructure 50/50 Index (Net)1 | -2.22% | 5.85% | 6.82% |
| Morningstar Infrastructure Category Average2 | -1.35 | 6.13 | 6.33 |
| * | Returns for indices reflect no deductions for fees, expenses or taxes, except for foreign withholding taxes where applicable. Results assume reinvestment of all dividends and capital gains. An investment cannot be made directly in an index. |
| 1. | The FTSE Global Core Infrastructure 50/50 Index (Net) is a market-capitalization-weighted index of worldwide infrastructure and infrastructure-related securities. Constituent weights are adjusted semi-annually according to three broad industry sectors: 50% utilities, 30% transportation, and a 20% mix of other sectors. |
| 2. | The Morningstar Infrastructure Category Average is representative of funds that invest more than 60% of their assets in stocks of companies engaged in infrastructure activities. Industries considered to be part of the infrastructure sector include: oil & gas midstream; waste management; airports; integrated shipping; railroads; shipping & ports; trucking; engineering & construction; infrastructure operations; and the utilities sector. Results are based on average total returns of similar funds with all dividends and capital gain distributions reinvested. |
The footnotes on the preceding page are an integral part of the table and graph and should be carefully read in conjunction with them.
| 6 | MainStay CBRE Global Infrastructure Fund |
Cost in Dollars of a $1,000 Investment in MainStay CBRE Global Infrastructure Fund (Unaudited)
The example below is intended to describe the fees and expenses borne by shareholders during the six-month period from November 1, 2022 to April 30, 2023, and the impact of those costs on your investment.
Example
As a shareholder of the Fund you incur two types of costs: (1) transaction costs, including exchange fees and sales charges (loads) on purchases (as applicable), and (2) ongoing costs, including management fees, distribution and/or service (12b-1) fees and other Fund expenses (as applicable). This example is intended to help you understand your ongoing costs (in dollars) of investing in the Fund and to compare these costs with the ongoing costs of investing in other mutual funds. The example is based on an investment of $1,000 made at the beginning of the six-month period and held for the entire period from November 1, 2022 to April 30, 2023.
This example illustrates your Fund’s ongoing costs in two ways:
Actual Expenses
The second and third data columns in the table below provide information about actual account values and actual expenses. You may use the information in these columns, together with the amount you invested, to estimate the expenses that you paid during the six months ended April 30, 2023. Simply divide your account value by $1,000 (for example, an
$8,600 account value divided by $1,000 = 8.6), then multiply the result by the number under the heading entitled “Expenses Paid During Period” to estimate the expenses you paid on your account during this period.
Hypothetical Example for Comparison Purposes
The fourth and fifth data columns in the table below provide information about hypothetical account values and hypothetical expenses based on the Fund’s actual expense ratio and an assumed rate of return of 5% per year before expenses, which is not the Fund’s actual return. The hypothetical account values and expenses may not be used to estimate the actual ending account balances or expenses you paid for the six-month period shown. You may use this information to compare the ongoing costs of investing in the Fund with the ongoing costs of investing in other mutual funds. To do so, compare this 5% hypothetical example with the 5% hypothetical examples that appear in the shareholder reports of the other mutual funds.
Please note that the expenses shown in the table are meant to highlight your ongoing costs only and do not reflect any transactional costs, such as exchange fees or sales charges (loads). Therefore, the fourth and fifth data columns of the table are useful in comparing ongoing costs only and will not help you determine the relative total costs of owning different funds. In addition, if these transactional costs were included, your costs would have been higher.
| Share Class | Beginning
Account
Value
11/1/22 | Ending Account
Value (Based
on Actual
Returns and
Expenses)
4/30/23 | Expenses
Paid
During
Period1 | Ending Account
Value (Based
on Hypothetical
5% Annualized
Return and
Actual Expenses)
4/30/23 | Expenses
Paid
During
Period1 | Net Expense
Ratio
During
Period2 |
| Class A Shares | $1,000.00 | $1,114.70 | $ 6.76 | $1,018.40 | $ 6.46 | 1.29% |
| Investor Class Shares | $1,000.00 | $1,115.60 | $ 6.82 | $1,018.35 | $ 6.51 | 1.30% |
| Class C Shares | $1,000.00 | $1,111.00 | $10.73 | $1,014.63 | $10.24 | 2.05% |
| Class I Shares | $1,000.00 | $1,116.30 | $ 5.09 | $1,019.98 | $ 4.86 | 0.97% |
| Class R6 Shares | $1,000.00 | $1,117.60 | $ 4.67 | $1,020.38 | $ 4.46 | 0.89% |
| 1. | Expenses are equal to the Fund’s annualized expense ratio of each class multiplied by the average account value over the period, divided by 365 and multiplied by 181 (to reflect the six-month period). The table above represents the actual expenses incurred during the six-month period. In addition to the fees and expenses which the Fund bears directly, it also indirectly bears a pro rata share of the fees and expenses of the underlying funds in which it invests. Such indirect expenses are not included in the above-reported expense figures. |
| 2. | Expenses are equal to the Fund's annualized expense ratio to reflect the six-month period. |
Country Composition as of April 30, 2023 (Unaudited)
| United States | 52.4% |
| Australia | 9.2 |
| Spain | 7.4 |
| Canada | 7.1 |
| France | 6.3 |
| United Kingdom | 5.2 |
| Japan | 4.3 |
| Italy | 3.4 |
| China | 2.6% |
| Portugal | 2.0 |
| Mexico | 1.3 |
| Hong Kong | 1.1 |
| New Zealand | 0.9 |
| Other Assets, Less Liabilities | –3.2 |
| | 100.0% |
See Portfolio of Investments beginning on page 11 for specific holdings within these categories. The Fund's holdings are subject to change.
Top Ten Holdings and/or Issuers Held as of April 30, 2023 (excluding short-term investments) (Unaudited)
| 1. | NextEra Energy, Inc. |
| 2. | Transurban Group |
| 3. | American Tower Corp. |
| 4. | Cellnex Telecom SA |
| 5. | WEC Energy Group, Inc. |
| 6. | Vinci SA |
| 7. | Enbridge, Inc. |
| 8. | National Grid plc |
| 9. | Aena SME SA |
| 10. | Ameren Corp. |
| 8 | MainStay CBRE Global Infrastructure Fund |
Portfolio Management Discussion and Analysis (Unaudited)
Questions answered by portfolio managers Jeremy Anagnos, CFA, Joseph P Smith, CFA, Daniel Foley, CFA, and Hinds Howard of CBRE Investment Management Listed Real Assets LLC.
How did MainStay CBRE Global Infrastructure Fund perform relative to its benchmark and peer group during the 12 months ended April 30, 2023?
For the 12 months ended April 30, 2023, Class I shares of MainStay CBRE Global Infrastructure Fund returned 0.63%, outperforming the −2.22% return of the Fund’s primary benchmark, the FTSE Global Core Infrastructure 50/50 Index (Net) (the “Index”). Over the same period, Class I shares also outperformed the −1.35% return of the Morningstar Infrastructure Category Average.1
What factors affected the Fund’s relative performance during the reporting period?
The Fund outperformed the Index, primarily due to positive stock selection, with sector allocation having a much smaller, but positive, impact. The Fund also outperformed across all developed markets and sectors. Emerging markets was the only meaningful detractor, largely as a result of the Fund's underweight exposure to this outperforming sector. Utility positioning benefited from exposure to renewable, development-oriented companies likely to profit from the U.S. Inflation Reduction Act passed during the reporting period. Ongoing energy security concerns benefited the Fund’s midstream holdings, as high demand for natural gas drove volumes through pipelines and LNG (liquid natural gas) export infrastructure. Global communications and transportation stock selections enhanced returns, helped by a mix of holdings across towers, data centers and toll roads. Overweight positioning in Europe bolstered returns, as the region avoided the worst-case scenarios envisioned at the peak of 2022’s energy crisis.
During the reporting period, which sectors and subsectors were the strongest positive contributors to the Fund’s relative performance and which sectors and subsectors were particularly weak?
The strongest positive contributions to the Fund’s performance relative to the Index came from the European transportation and North American utilities and midstream sectors. (Contributions take weightings and total returns into account.) Out-of-Index toll road holdings and overweight exposure to the subsector materially added to relative performance in the European transportation sector. The utility sector outperformed the broader, global infrastructure area; the Fund benefited from strong stock selection, driven by out-of-Index positions in direct beneficiaries of the Inflation Reduction Act, as well as underweight exposure to more bond-like regulated utilities that underperformed as a result of rising interest rates. Midstream holdings benefited from tight global commodity market conditions, which increased demand for U.S. hydrocarbons, especially LNG. Ongoing capital discipline across the energy complex continued to drive positive free cash
flow and led to leverage reduction, dividend growth and share buybacks.
The weakest contributors to relative performance included the emerging-markets transportation and utilities sectors. Emerging-markets transportation stocks outperformed significantly during the reporting period. However, the Fund’s underweight exposure to the sector was a drag on relative returns, despite strong individual stock selections. Emerging-markets utility exposure came in the form of two natural gas utilities and one water utility, all based in China. Continuing lockdowns and property market concerns in China led to extreme volatility among Chinese stocks; the Fund’s holdings were caught up in that volatility, underperforming the emerging-markets utilities group.
During the reporting period, which individual stocks made the strongest positive contributions to the Fund’s absolute performance and which stocks detracted the most?
The holdings making the largest positive contributions to absolute performance during the reporting period included France-based toll road builder and operator Vinci and U.S.-based utility AES. Vinci benefited from a recovery in traffic volumes across the European market. AES saw fresh support for utilities with exposure to the renewable development theme. AES is well positioned to gain from the passage of the U.S. Inflation Reduction Act; the act extended tax credits for renewable development to ten years and expanded the scope of tax credits to include battery storage, an area of global leadership for AES.
During the same period, positions in U.S.-based telecommunication tower REIT (real estate investment trust) Crown Castle and U.S.-based electric utility Dominion Energy detracted most from the Fund’s absolute performance. Crown Castle shares declined, together with shares of other global tower companies, in the face of rapidly rising interest rates. In addition, the company announced reduced growth expectations after a wireless carrier customer terminated leases following a merger. Dominion Energy shares weakened due to uncertainties raised by the company’s announcement that it would pursue a business review aiming to reset its regulatory structure in Virginia, and would also seek to raise capital via asset sales– viewed as ultimately dilutive to earnings.
What were some of the Fund’s largest purchases and sales during the reporting period?
During the reporting period, we added substantially to the Fund’s position in American Tower, one of the largest tower owners in the United States, which had underperformed and offered an attractive entry point in a sector with a positive outlook for growth
| 1. | See "Investment and Performance Comparison" for other share class returns, which may be higher or lower than Class I share returns, and for more information on benchmark and peer group returns. |
and some degree of inflation resilience. We also added substantially to the Fund’s position in Enbridge, a major Canadian pipeline company with a compelling valuation, and featuring a strong balance sheet as well as defensive midstream exposure.
The Fund’s largest sales during the reporting period involved partial positions in utility American Electric Power and midstream company Cheniere Energy, both based in the United States. We took profits in both positions as our investment thesis played out and rising stock prices made the companies’ valuations less attractive.
How did the Fund’s subsector weightings change during the reporting period?
We increased the Fund’s exposure to the communications sector in response to weakness and discounted valuations, and given the sector’s relatively low exposure to cyclical factors, which should position communications companies to continue producing strong operating results should the economy contract. We also added to the Fund’s positions in towers and data centers, and increased European transportation exposure in light of attractive valuations and fundamental improvement. Conversely, we reduced the Fund’s exposure to U.S. freight rail due to growing concerns that a recessionary environment could lead to challenging volume conditions and less flexibility in operating costs. In addition, we decreased the Fund’s midstream exposure following the sector’s significant outperformance and less compelling valuations, as well as concerns regarding demand-side risk and sensitivity to economic growth in a potentially recessionary environment.
How was the Fund positioned at the end of the reporting period?
As of April 30, 2023, the Fund remains positioned to benefit from long-term growth in renewable development, which translates into a preference for integrated utilities over regulated utilities. The Fund is also positioned to benefit from exposure to long-term data growth through a preference for communications infrastructure exposure. Within transports, we prefer leisure-exposed airports, toll roads and passenger rail stocks in Japan. The Fund continues to hold underweight exposure to emerging markets, due to ongoing regulatory and policy challenges that can lead to negative returns and excessive volatility.
The opinions expressed are those of the portfolio managers as of the date of this report and are subject to change. There is no guarantee that any forecasts will come to pass. This material does not constitute investment advice and is not intended as an endorsement of any specific investment.
| 10 | MainStay CBRE Global Infrastructure Fund |
Portfolio of Investments April 30, 2023†^
| | Shares | Value |
| Common Stocks 99.5% |
| Australia 9.2% |
| Atlas Arteria Ltd. (Transportation) | 12,349,139 | $ 53,441,121 |
| NEXTDC Ltd. (Communications) (a)(b) | 4,562,579 | 34,658,792 |
| Transurban Group (Transportation) | 10,743,680 | 106,565,305 |
| | | 194,665,218 |
| Canada 7.1% |
| Canadian National Railway Co. (Transportation) | 262,075 | 31,239,704 |
| Enbridge, Inc. (Midstream / Pipelines) | 2,011,334 | 79,972,368 |
| Pembina Pipeline Corp. (Midstream / Pipelines) | 1,159,185 | 38,158,948 |
| | | 149,371,020 |
| China 2.6% |
| China Resources Gas Group Ltd. (Utilities) | 5,839,200 | 18,411,037 |
| ENN Energy Holdings Ltd. (Utilities) | 1,242,957 | 16,942,972 |
| Guangdong Investment Ltd. (Utilities) | 20,652,829 | 19,732,882 |
| | | 55,086,891 |
| France 6.3% |
| Eiffage SA (Transportation) | 426,987 | 50,766,624 |
| Vinci SA (Transportation) | 654,751 | 80,948,948 |
| | | 131,715,572 |
| Hong Kong 1.1% |
| CK Infrastructure Holdings Ltd. (Utilities) | 4,111,518 | 23,360,749 |
| Italy 3.4% |
| Enel SpA (Utilities) | 8,572,739 | 58,557,621 |
| Infrastrutture Wireless Italiane SpA (Communications) | 921,265 | 12,785,712 |
| | | 71,343,333 |
| Japan 4.3% |
| Central Japan Railway Co. (Transportation) | 468,433 | 57,915,915 |
| West Japan Railway Co. (Transportation) | 768,713 | 33,237,831 |
| | | 91,153,746 |
| Mexico 1.3% |
| Grupo Aeroportuario del Pacifico SAB de CV, Class B (Transportation) | 1,585,576 | 28,210,457 |
| New Zealand 0.9% |
| Infratil Ltd. (Diversified) (c) | 3,236,300 | 19,112,682 |
| | Shares | Value |
| |
| Portugal 2.0% |
| EDP - Energias de Portugal SA (Utilities) | 7,440,227 | $ 40,991,931 |
| Spain 7.4% |
| Aena SME SA (Transportation) (a)(b) | 391,979 | 66,040,822 |
| Cellnex Telecom SA (Communications) | 2,142,227 | 90,101,045 |
| | | 156,141,867 |
| United Kingdom 5.2% |
| National Grid plc (Utilities) | 5,202,906 | 74,836,018 |
| Pennon Group plc (Utilities) | 942,919 | 10,191,115 |
| SSE plc (Utilities) | 1,104,844 | 25,513,921 |
| | | 110,541,054 |
| United States 48.7% |
| AES Corp. (The) (Utilities) | 1,301,732 | 30,798,979 |
| ALLETE, Inc. (Utilities) | 266,850 | 16,646,103 |
| Ameren Corp. (Utilities) | 738,596 | 65,712,886 |
| American Electric Power Co., Inc. (Utilities) | 396,161 | 36,613,200 |
| American Tower Corp. (Communications) | 506,432 | 103,509,637 |
| Cheniere Energy, Inc. (Midstream / Pipelines) | 248,768 | 38,061,504 |
| CMS Energy Corp. (Utilities) | 722,346 | 44,973,262 |
| Constellation Energy Corp. (Utilities) | 220,478 | 17,064,997 |
| Crown Castle, Inc. (Communications) | 408,071 | 50,229,459 |
| CSX Corp. (Transportation) | 1,073,385 | 32,888,516 |
| Equinix, Inc. (Communications) | 35,573 | 25,757,698 |
| FirstEnergy Corp. (Utilities) | 349,365 | 13,904,727 |
| Legacy Reserves, Inc. (Midstream / Pipelines) (a)(c)(d) | 5,055 | 21,433 |
| Legacy Reserves, Inc. (Midstream / Pipelines) (a)(c)(d) | 27,942 | 118,474 |
| NextEra Energy Partners LP (Utilities) | 235,867 | 13,564,711 |
| NextEra Energy, Inc. (Utilities) | 1,406,316 | 107,765,995 |
| NiSource, Inc. (Utilities) | 906,315 | 25,793,725 |
| OGE Energy Corp. (Utilities) | 822,803 | 30,888,025 |
| PG&E Corp. (Utilities) (a) | 619,495 | 10,599,559 |
| PPL Corp. (Utilities) | 1,865,701 | 53,582,933 |
| Public Service Enterprise Group, Inc. (Utilities) | 740,006 | 46,768,379 |
| Sempra Energy (Utilities) | 322,328 | 50,118,781 |
| Southern Co. (The) (Utilities) | 664,388 | 48,865,737 |
| Targa Resources Corp. (Midstream / Pipelines) | 351,213 | 26,527,118 |
| Union Pacific Corp. (Transportation) | 121,371 | 23,752,305 |
| WEC Energy Group, Inc. (Utilities) | 843,513 | 81,120,645 |
The notes to the financial statements are an integral part of, and should be read in conjunction with, the financial statements.
11
Portfolio of Investments April 30, 2023†^ (continued)
| | Shares | | Value |
| Common Stocks (continued) |
| United States (continued) |
| Xcel Energy, Inc. (Utilities) | 446,380 | | $ 31,206,426 |
| | | | 1,026,855,214 |
Total Common Stocks
(Cost $2,011,125,755) | | | 2,098,549,734 |
| Short-Term Investments 3.7% |
| Affiliated Investment Company 0.4% |
| United States 0.4% |
| MainStay U.S. Government Liquidity Fund, 3.98% (e) | 8,287,171 | | 8,287,171 |
| Unaffiliated Investment Company 3.3% |
| United States 3.3% |
| Invesco Government & Agency Portfolio, 4.857% (e)(f) | 68,615,749 | | 68,615,749 |
Total Short-Term Investments
(Cost $76,902,920) | | | 76,902,920 |
Total Investments
(Cost $2,088,028,675) | 103.2% | | 2,175,452,654 |
| Other Assets, Less Liabilities | (3.2) | | (67,189,699) |
| Net Assets | 100.0% | | $ 2,108,262,955 |
| † | Percentages indicated are based on Fund net assets. |
| ^ | Industry classifications may be different than those used for compliance monitoring purposes. |
| (a) | Non-income producing security. |
| (b) | All or a portion of this security was held on loan. As of April 30, 2023, the aggregate market value of securities on loan was $66,139,405; the total market value of collateral held by the Fund was $68,719,721. The market value of the collateral held included non-cash collateral in the form of U.S. Treasury securities with a value of $103,972. The Fund received cash collateral with a value of $68,615,749. (See Note 2(I)) |
| (c) | Illiquid security—As of April 30, 2023, the total market value deemed illiquid under procedures approved by the Board of Trustees was $19,252,589, which represented 0.9% of the Fund’s net assets. (Unaudited) |
| (d) | Security in which significant unobservable inputs (Level 3) were used in determining fair value. |
| (e) | Current yield as of April 30, 2023. |
| (f) | Represents a security purchased with cash collateral received for securities on loan. |
The notes to the financial statements are an integral part of, and should be read in conjunction with, the financial statements.
| 12 | MainStay CBRE Global Infrastructure Fund |
Investments in Affiliates (in 000's)
Investments in issuers considered to be affiliate(s) of the Fund during the year ended April 30, 2023 for purposes of Section 2(a)(3) of the Investment Company Act of 1940, as amended, were as follows:
| Affiliated Investment Companies | Value,
Beginning
of Year | Purchases
at Cost | Proceeds
from
Sales | Net
Realized
Gain/(Loss)
on Sales | Change in
Unrealized
Appreciation/
(Depreciation) | Value,
End of
Year | Dividend
Income | Other
Distributions | Shares
End of
Year |
| MainStay U.S. Government Liquidity Fund | $ 57,455 | $ 504,049 | $ (553,217) | $ — | $ — | $ 8,287 | $ 746 | $ — | 8,287 |
The following is a summary of the fair valuations according to the inputs used as of April 30, 2023, for valuing the Fund’s assets:
| Description | Quoted
Prices in
Active
Markets for
Identical
Assets
(Level 1) | | Significant
Other
Observable
Inputs
(Level 2) | | Significant
Unobservable
Inputs
(Level 3) | | Total |
| Asset Valuation Inputs | | | | | | | |
| Investments in Securities (a) | | | | | | | |
| Common Stocks | $ 2,098,409,827 | | $ — | | $ 139,907 | | $ 2,098,549,734 |
| Short-Term Investments | | | | | | | |
| Affiliated Investment Company | 8,287,171 | | — | | — | | 8,287,171 |
| Unaffiliated Investment Company | 68,615,749 | | — | | — | | 68,615,749 |
| Total Short-Term Investments | 76,902,920 | | — | | — | | 76,902,920 |
| Total Investments in Securities | $ 2,175,312,747 | | $ — | | $ 139,907 | | $ 2,175,452,654 |
| (a) | For a complete listing of investments and their industries, see the Portfolio of Investments. |
The notes to the financial statements are an integral part of, and should be read in conjunction with, the financial statements.
13
Portfolio of Investments April 30, 2023†^ (continued)
The table below sets forth the diversification of the Fund’s investments by sector.
Sector Diversification
| | Value | | Percent |
| Utilities | $1,014,527,316 | | 48.1% |
| Transportation | 565,007,548 | | 26.8 |
| Communications | 317,042,343 | | 15.0 |
| Midstream / Pipelines | 182,859,845 | | 8.7 |
| Diversified | 19,112,682 | | 0.9 |
| | 2,098,549,734 | | 99.5 |
| Short-Term Investments | 76,902,920 | | 3.7 |
| Other Assets, Less Liabilities | (67,189,699) | | (3.2) |
| Net Assets | $2,108,262,955 | | 100.0% |
| † | Percentages indicated are based on Fund net assets. |
| ^ | Industry classifications may be different than those used for compliance monitoring purposes. |
The notes to the financial statements are an integral part of, and should be read in conjunction with, the financial statements.
| 14 | MainStay CBRE Global Infrastructure Fund |
Statement of Assets and Liabilities as of April 30, 2023
| Assets |
Investment in unaffiliated securities, at value
(identified cost $2,079,741,504) including securities on loan of $66,139,405 | $2,167,165,483 |
Investment in affiliated investment companies, at value
(identified cost $8,287,171) | 8,287,171 |
Cash denominated in foreign currencies
(identified cost $121) | 121 |
| Receivables: | |
| Fund shares sold | 3,318,124 |
| Dividends | 3,260,110 |
| Investment securities sold | 3,744 |
| Securities lending | 2,518 |
| Other assets | 48,294 |
| Total assets | 2,182,085,565 |
| Liabilities |
| Cash collateral received for securities on loan | 68,615,749 |
| Due to custodian | 2,330 |
| Payables: | |
| Investment securities purchased | 2,717,080 |
| Manager (See Note 3) | 1,328,840 |
| Fund shares redeemed | 666,208 |
| Transfer agent (See Note 3) | 361,646 |
| Custodian | 44,615 |
| NYLIFE Distributors (See Note 3) | 38,091 |
| Professional fees | 26,020 |
| Shareholder communication | 20,934 |
| Trustees | 106 |
| Accrued expenses | 991 |
| Total liabilities | 73,822,610 |
| Net assets | $2,108,262,955 |
| Composition of Net Assets |
| Shares of beneficial interest outstanding (par value of $.001 per share) unlimited number of shares authorized | $ 164,541 |
| Additional paid-in-capital | 2,291,558,982 |
| | 2,291,723,523 |
| Total distributable earnings (loss) | (183,460,568) |
| Net assets | $2,108,262,955 |
| Class A | |
| Net assets applicable to outstanding shares | $ 102,258,183 |
| Shares of beneficial interest outstanding | 7,988,602 |
| Net asset value per share outstanding | $ 12.80 |
| Maximum sales charge (5.50% of offering price) | 0.74 |
| Maximum offering price per share outstanding | $ 13.54 |
| Investor Class | |
| Net assets applicable to outstanding shares | $ 2,338,114 |
| Shares of beneficial interest outstanding | 182,720 |
| Net asset value per share outstanding | $ 12.80 |
| Maximum sales charge (5.00% of offering price) | 0.67 |
| Maximum offering price per share outstanding | $ 13.47 |
| Class C | |
| Net assets applicable to outstanding shares | $ 20,400,615 |
| Shares of beneficial interest outstanding | 1,601,790 |
| Net asset value and offering price per share outstanding | $ 12.74 |
| Class I | |
| Net assets applicable to outstanding shares | $1,982,388,365 |
| Shares of beneficial interest outstanding | 154,699,425 |
| Net asset value and offering price per share outstanding | $ 12.81 |
| Class R6 | |
| Net assets applicable to outstanding shares | $ 877,678 |
| Shares of beneficial interest outstanding | 68,481 |
| Net asset value and offering price per share outstanding | $ 12.82 |
The notes to the financial statements are an integral part of, and should be read in conjunction with, the financial statements.
15
Statement of Operations for the year ended April 30, 2023
| Investment Income (Loss) |
| Income | |
| Dividends-unaffiliated (net of foreign tax withholding of $2,386,832) | $ 52,179,982 |
| Dividends-affiliated | 745,505 |
| Securities lending, net | 78,401 |
| Total income | 53,003,888 |
| Expenses | |
| Manager (See Note 3) | 16,311,801 |
| Transfer agent (See Note 3) | 2,423,254 |
| Distribution/Service—Class A (See Note 3) | 238,711 |
| Distribution/Service—Investor Class (See Note 3) | 5,840 |
| Distribution/Service—Class C (See Note 3) | 218,346 |
| Registration | 210,339 |
| Professional fees | 140,020 |
| Custodian | 136,018 |
| Shareholder communication | 123,823 |
| Trustees | 46,563 |
| Miscellaneous | 82,939 |
| Total expenses before waiver/reimbursement | 19,937,654 |
| Expense waiver/reimbursement from Manager (See Note 3) | (808,272) |
| Reimbursement from prior custodian(a) | (3,889) |
| Net expenses | 19,125,493 |
| Net investment income (loss) | 33,878,395 |
| Realized and Unrealized Gain (Loss) |
| Net realized gain (loss) on: | |
| Unaffiliated investment transactions | (54,235,303) |
| Foreign currency transactions | (256,719) |
| Net realized gain (loss) | (54,492,022) |
| Net change in unrealized appreciation (depreciation) on: | |
| Unaffiliated investments | 37,608,710 |
| Translation of other assets and liabilities in foreign currencies | 37,363 |
| Net change in unrealized appreciation (depreciation) | 37,646,073 |
| Net realized and unrealized gain (loss) | (16,845,949) |
| Net increase (decrease) in net assets resulting from operations | $ 17,032,446 |
| (a) | Represents a refund for overbilling of custody fees. |
The notes to the financial statements are an integral part of, and should be read in conjunction with, the financial statements.
| 16 | MainStay CBRE Global Infrastructure Fund |
Statements of Changes in Net Assets
for the years ended April 30, 2023 and April 30, 2022
| | 2023 | 2022 |
| Increase (Decrease) in Net Assets |
| Operations: | | |
| Net investment income (loss) | $ 33,878,395 | $ 18,549,262 |
| Net realized gain (loss) | (54,492,022) | 21,485,168 |
| Net change in unrealized appreciation (depreciation) | 37,646,073 | (14,049,896) |
| Net increase (decrease) in net assets resulting from operations | 17,032,446 | 25,984,534 |
| Distributions to shareholders: | | |
| Class A | (2,556,120) | (996,517) |
| Investor Class | (62,277) | (29,596) |
| Class C | (402,553) | (143,440) |
| Class I | (53,898,639) | (13,609,224) |
| Class R6 | (278,160) | (38,065) |
| Total distributions to shareholders | (57,197,749) | (14,816,842) |
| Capital share transactions: | | |
| Net proceeds from sales of shares | 1,009,200,139 | 1,274,898,463 |
| Net asset value of shares issued to shareholders in reinvestment of distributions | 39,221,114 | 13,281,784 |
| Cost of shares redeemed | (553,345,710) | (170,967,771) |
| Increase (decrease) in net assets derived from capital share transactions | 495,075,543 | 1,117,212,476 |
| Net increase (decrease) in net assets | 454,910,240 | 1,128,380,168 |
| Net Assets |
| Beginning of year | 1,653,352,715 | 524,972,547 |
| End of year | $2,108,262,955 | $1,653,352,715 |
The notes to the financial statements are an integral part of, and should be read in conjunction with, the financial statements.
17
Financial Highlights selected per share data and ratios
| | Year Ended April 30, | | November 1,
2019
through
April 30, | | Year Ended October 31, |
| Class A | 2023 | | 2022 | | 2021 | | 2020 # | | 2019 | | 2018 |
| Net asset value at beginning of period | $ 13.11 | | $ 12.81 | | $ 10.39 | | $ 11.99 | | $ 10.04 | | $ 11.40 |
| Net investment income (loss) | 0.19(a) | | 0.23(a) | | 0.16(a) | | 0.07(a) | | 0.16 | | 0.19 |
| Net realized and unrealized gain (loss) | (0.17) | | 0.26 | | 2.42 | | (1.30) | | 2.12 | | (0.51) |
| Total from investment operations | 0.02 | | 0.49 | | 2.58 | | (1.23) | | 2.28 | | (0.32) |
| Less distributions: | | | | | | | | | | | |
| From net investment income | (0.21) | | (0.19) | | (0.16) | | (0.06) | | (0.17) | | (0.25) |
| From net realized gain on investments | (0.12) | | — | | — | | (0.29) | | (0.16) | | (0.79) |
| Return of capital | — | | — | | — | | (0.02) | | — | | — |
| Total distributions | (0.33) | | (0.19) | | (0.16) | | (0.37) | | (0.33) | | (1.04) |
| Net asset value at end of period | $ 12.80 | | $ 13.11 | | $ 12.81 | | $ 10.39 | | $ 11.99 | | $ 10.04 |
| Total investment return (b) | 0.33% | | 3.91% | | 25.04% | | (10.57)% | | 23.24% | | (3.16)% |
| Ratios (to average net assets)/Supplemental Data: | | | | | | | | | | | |
| Net investment income (loss) | 1.50% | | 1.75% | | 1.35% | | 1.32%†† | | 1.51% | | 1.89% |
| Net expenses | 1.27%(c) | | 1.26%(c) | | 1.29%(c) | | 1.32%†† (c)(d) | | 1.35% | | 1.35% |
| Expenses (before waiver/reimbursement) | 1.27%(c) | | 1.26%(c) | | 1.35%(c) | | 1.54%†† (c)(d) | | 1.56% | | 1.83% |
| Portfolio turnover rate | 43% | | 32% | | 51% | | 49% | | 53% | | 61% |
| Net assets at end of period (in 000's) | $ 102,258 | | $ 88,715 | | $ 45,642 | | $ 11,237 | | $ 11,700 | | $ 1,787 |
| # | The Fund changed its fiscal year end from October 31 to April 30. |
| †† | Annualized. |
| (a) | Per share data based on average shares outstanding during the period. |
| (b) | Total investment return is calculated exclusive of sales charges and assumes the reinvestment of dividends and distributions. For periods of less than one year, total return is not annualized. |
| (c) | In addition to the fees and expenses which the Fund bears directly, it also indirectly bears a pro-rata share of the fees and expenses of the underlying funds in which it invests. Such indirect expenses are not included in the above expense ratios. |
| (d) | Net of interest expense of less than 0.01%. |
The notes to the financial statements are an integral part of, and should be read in conjunction with, the financial statements.
| 18 | MainStay CBRE Global Infrastructure Fund |
Financial Highlights selected per share data and ratios
| | Year Ended April 30, | | February 24, 2020^ through
April 30, |
| Investor Class | 2023 | | 2022 | | 2021 | | 2020 |
| Net asset value at beginning of period | $ 13.11 | | $ 12.80 | | $ 10.38 | | $ 12.50 |
| Net investment income (loss) (a) | 0.19 | | 0.23 | | 0.13 | | (0.00)‡ |
| Net realized and unrealized gain (loss) | (0.17) | | 0.26 | | 2.43 | | (2.08) |
| Total from investment operations | 0.02 | | 0.49 | | 2.56 | | (2.08) |
| Less distributions: | | | | | | | |
| From net investment income | (0.21) | | (0.18) | | (0.14) | | (0.03) |
| From net realized gain on investments | (0.12) | | — | | — | | — |
| Return of capital | — | | — | | — | | (0.01) |
| Total distributions | (0.33) | | (0.18) | | (0.14) | | (0.04) |
| Net asset value at end of period | $ 12.80 | | $ 13.11 | | $ 12.80 | | $ 10.38 |
| Total investment return (b) | 0.34% | | 3.85% | | 24.87% | | (16.66)% |
| Ratios (to average net assets)/Supplemental Data: | | | | | | | |
| Net investment income (loss) | 1.49% | | 1.77% | | 1.11% | | (0.12)%†† |
| Net expenses (c) | 1.29% | | 1.31% | | 1.45% | | 1.45%†† |
| Expenses (before waiver/reimbursement) (c) | 1.29% | | 1.31% | | 1.76% | | 1.67%†† |
| Portfolio turnover rate | 43% | | 32% | | 51% | | 49% |
| Net assets at end of period (in 000's) | $ 2,338 | | $ 2,430 | | $ 2,159 | | $ 106 |
| ^ | Inception date. |
| ‡ | Less than one cent per share. |
| †† | Annualized. |
| (a) | Per share data based on average shares outstanding during the period. |
| (b) | Total investment return is calculated exclusive of sales charges and assumes the reinvestment of dividends and distributions. For periods of less than one year, total return is not annualized. |
| (c) | In addition to the fees and expenses which the Fund bears directly, it also indirectly bears a pro-rata share of the fees and expenses of the underlying funds in which it invests. Such indirect expenses are not included in the above expense ratios. |
The notes to the financial statements are an integral part of, and should be read in conjunction with, the financial statements.
19
Financial Highlights selected per share data and ratios
| | Year Ended April 30, | | November 1,
2019
through
April 30,
2020# | | February 28,
2019^
through
October 31, |
| Class C | 2023 | | 2022 | | 2021 | | 2019 |
| Net asset value at beginning of period | $ 13.04 | | $ 12.75 | | $ 10.37 | | $ 11.96 | | $ 10.82 |
| Net investment income (loss) (a) | 0.09 | | 0.12 | | 0.06 | | 0.03 | | 0.04 |
| Net realized and unrealized gain (loss) | (0.16) | | 0.27 | | 2.42 | | (1.29) | | 1.22 |
| Total from investment operations | (0.07) | | 0.39 | | 2.48 | | (1.26) | | 1.26 |
| Less distributions: | | | | | | | | | |
| From net investment income | (0.11) | | (0.10) | | (0.10) | | (0.03) | | (0.12) |
| From net realized gain on investments | (0.12) | | — | | — | | (0.29) | | — |
| Return of capital | — | | — | | — | | (0.01) | | — |
| Total distributions | (0.23) | | (0.10) | | (0.10) | | (0.33) | | (0.12) |
| Net asset value at end of period | $ 12.74 | | $ 13.04 | | $ 12.75 | | $ 10.37 | | $ 11.96 |
| Total investment return (b) | (0.42)% | | 3.11% | | 24.04% | | (10.89)% | | 11.67% |
| Ratios (to average net assets)/Supplemental Data: | | | | | | | | | |
| Net investment income (loss) | 0.74% | | 0.89% | | 0.52% | | 0.58%†† | | 0.46%†† |
| Net expenses | 2.04%(c) | | 2.06%(c) | | 2.08%(c) | | 2.09%†† (c)(d) | | 2.10%†† |
| Expenses (before waiver/reimbursement) | 2.04%(c) | | 2.06%(c) | | 2.51%(c) | | 2.36%†† (c)(d) | | 2.31%†† |
| Portfolio turnover rate | 43% | | 32% | | 51% | | 49% | | 53% |
| Net assets at end of period (in 000’s) | $ 20,401 | | $ 24,119 | | $ 11,522 | | $ 992 | | $ 1,048 |
| # | The Fund changed its fiscal year end from October 31 to April 30. |
| ^ | Inception date. |
| †† | Annualized. |
| (a) | Per share data based on average shares outstanding during the period. |
| (b) | Total investment return is calculated exclusive of sales charges and assumes the reinvestment of dividends and distributions. For periods of less than one year, total return is not annualized. |
| (c) | In addition to the fees and expenses which the Fund bears directly, it also indirectly bears a pro-rata share of the fees and expenses of the underlying funds in which it invests. Such indirect expenses are not included in the above expense ratios. |
| (d) | Net of interest expense of less than 0.01%. |
The notes to the financial statements are an integral part of, and should be read in conjunction with, the financial statements.
| 20 | MainStay CBRE Global Infrastructure Fund |
Financial Highlights selected per share data and ratios
| | Year Ended April 30, | | November 1,
2019
through
April 30,
2020# | | Year Ended October 31, |
| Class I | 2023 | | 2022 | | 2021 | | 2019 | | 2018 |
| Net asset value at beginning of period | $ 13.12 | | $ 12.82 | | $ 10.39 | | $ 11.99 | | $ 10.04 | | $ 11.40 |
| Net investment income (loss) | 0.22(a) | | 0.27(a) | | 0.21(a) | | 0.09(a) | | 0.20 | | 0.23 |
| Net realized and unrealized gain (loss) | (0.16) | | 0.26 | | 2.41 | | (1.30) | | 2.11 | | (0.52) |
| Total from investment operations | 0.06 | | 0.53 | | 2.62 | | (1.21) | | 2.31 | | (0.29) |
| Less distributions: | | | | | | | | | | | |
| From net investment income | (0.25) | | (0.23) | | (0.19) | | (0.08) | | (0.20) | | (0.28) |
| From net realized gain on investments | (0.12) | | — | | — | | (0.29) | | (0.16) | | (0.79) |
| Return of capital | — | | — | | — | | (0.02) | | — | | — |
| Total distributions | (0.37) | | (0.23) | | (0.19) | | (0.39) | | (0.36) | | (1.07) |
| Net asset value at end of period | $ 12.81 | | $ 13.12 | | $ 12.82 | | $ 10.39 | | $ 11.99 | | $ 10.04 |
| Total investment return (b) | 0.63% | | 4.19% | | 25.46% | | (10.46)% | | 23.52% | | (2.88)% |
| Ratios (to average net assets)/Supplemental Data: | | | | | | | | | | | |
| Net investment income (loss) | 1.79% | | 2.09% | | 1.78% | | 1.59%†† | | 1.83% | | 2.14% |
| Net expenses | 0.97%(c) | | 0.97%(c) | | 0.97%(c) | | 1.05%†† (c)(d) | | 1.10% | | 1.10% |
| Expenses (before waiver/reimbursement) | 1.02%(c) | | 1.01%(c) | | 1.10%(c) | | 1.18%†† (c)(d) | | 1.14% | | 1.41% |
| Portfolio turnover rate | 43% | | 32% | | 51% | | 49% | | 53% | | 61% |
| Net assets at end of period (in 000's) | $ 1,982,388 | | $ 1,527,548 | | $ 465,299 | | $ 208,291 | | $ 225,176 | | $ 71,919 |
| # | The Fund changed its fiscal year end from October 31 to April 30. |
| †† | Annualized. |
| (a) | Per share data based on average shares outstanding during the period. |
| (b) | Total investment return is calculated exclusive of sales charges and assumes the reinvestment of dividends and distributions. Class I shares are not subject to sales charges. For periods of less than one year, total return is not annualized. |
| (c) | In addition to the fees and expenses which the Fund bears directly, it also indirectly bears a pro-rata share of the fees and expenses of the underlying funds in which it invests. Such indirect expenses are not included in the above expense ratios. |
| (d) | Net of interest expense of less than 0.01%. |
The notes to the financial statements are an integral part of, and should be read in conjunction with, the financial statements.
21
Financial Highlights selected per share data and ratios
| | Year Ended April 30, | | February 24, 2020^ through
April 30, |
| Class R6 | 2023 | | 2022 | | 2021 | | 2020 |
| Net asset value at beginning of period | $ 13.12 | | $ 12.82 | | $ 10.39 | | $ 12.51 |
| Net investment income (loss) (a) | 0.23 | | 0.35 | | 0.17 | | 0.02 |
| Net realized and unrealized gain (loss) | (0.15) | | 0.19 | | 2.45 | | (2.11) |
| Total from investment operations | 0.08 | | 0.54 | | 2.62 | | (2.09) |
| Less distributions: | | | | | | | |
| From net investment income | (0.26) | | (0.24) | | (0.19) | | (0.02) |
| From net realized gain on investments | (0.12) | | — | | — | | — |
| Return of capital | — | | — | | — | | (0.01) |
| Total distributions | (0.38) | | (0.24) | | (0.19) | | (0.03) |
| Net asset value at end of period | $ 12.82 | | $ 13.12 | | $ 12.82 | | $ 10.39 |
| Total investment return (b) | 0.78% | | 4.23% | | 25.50% | | (16.65)% |
| Ratios (to average net assets)/Supplemental Data: | | | | | | | |
| Net investment income (loss) | 1.80% | | 2.63% | | 1.47% | | 0.85%†† |
| Net expenses (c) | 0.89% | | 0.91% | | 0.95% | | 0.95%†† |
| Expenses (before waiver/reimbursement) (c) | 0.89% | | 0.91% | | 1.02% | | 1.13%†† |
| Portfolio turnover rate | 43% | | 32% | | 51% | | 49% |
| Net assets at end of period (in 000's) | $ 878 | | $ 10,541 | | $ 350 | | $ 21 |
| ^ | Inception date. |
| †† | Annualized. |
| (a) | Per share data based on average shares outstanding during the period. |
| (b) | Total investment return is calculated exclusive of sales charges and assumes the reinvestment of dividends and distributions. Class R6 shares are not subject to sales charges. For periods of less than one year, total return is not annualized. |
| (c) | In addition to the fees and expenses which the Fund bears directly, it also indirectly bears a pro-rata share of the fees and expenses of the underlying funds in which it invests. Such indirect expenses are not included in the above expense ratios. |
The notes to the financial statements are an integral part of, and should be read in conjunction with, the financial statements.
| 22 | MainStay CBRE Global Infrastructure Fund |
Notes to Financial Statements
Note 1-Organization and Business
MainStay Funds Trust (the “Trust”) was organized as a Delaware statutory trust on April 28, 2009. The Trust is registered under the Investment Company Act of 1940, as amended (the “1940 Act”), as an open-end management investment company, and is comprised of thirty-three funds (collectively referred to as the “Funds”). These financial statements and notes relate to the MainStay CBRE Global Infrastructure Fund (the "Fund"), a “diversified” fund, as that term is defined in the 1940 Act, as interpreted or modified by regulatory authorities having jurisdiction, from time to time.
The following table lists the Fund's share classes that have been registered and commenced operations:
| Class | Commenced Operations |
| Class A | October 16, 2013 |
| Investor Class | February 24, 2020 |
| Class C | February 28, 2019 |
| Class I | June 28, 2013 |
| Class R6 | February 24, 2020 |
| SIMPLE Class | N/A* |
| * | SIMPLE Class shares were registered for sale effective as of August 31, 2020 but have not yet commenced operations. |
Class A and Investor Class shares are offered at net asset value (“NAV”) per share plus an initial sales charge. No initial sales charge applies to investments of $1 million or more (and certain other qualified purchases) in Class A and Investor Class shares. However, a contingent deferred sales charge (“CDSC”) of 1.00% may be imposed on certain redemptions made within 18 months of the date of purchase on shares that were purchased without an initial sales charge. Class C shares are offered at NAV without an initial sales charge, although a 1.00% CDSC may be imposed on certain redemptions of such shares made within one year of the date of purchase of Class C shares. Class I and Class R6 shares are offered at NAV without a sales charge. SIMPLE Class shares are expected to be offered at NAV without a sales charge if such shares are offered in the future. In addition, depending upon eligibility, Class C shares convert to either Class A or Investor Class shares at the end of the calendar quarter eight years after the date they were purchased. Additionally, Investor Class shares may convert automatically to Class A shares. Under certain circumstances and as may be permitted by the Trust’s multiple class plan pursuant to Rule 18f-3 under the 1940 Act, specified share classes of the Fund may be converted to one or more other share classes of the Fund as disclosed in the capital share transactions within these Notes. The classes of shares have the same voting (except for issues that relate solely to one class), dividend, liquidation and other rights, and the same terms and conditions, except that under distribution plans pursuant to Rule 12b-1 under the 1940 Act, Class C shares are subject to higher distribution and/or service fees than Class A, Investor Class and SIMPLE Class shares. Class I and Class R6 shares are not subject to a distribution and/or service fee.
The Fund's investment objective is to seek total return.
Note 2–Significant Accounting Policies
The Fund is an investment company and accordingly follows the investment company accounting and reporting guidance of the Financial Accounting Standards Board (“FASB”) Accounting Standards Codification Topic 946 Financial Services—Investment Companies. The Fund prepares its financial statements in accordance with generally accepted accounting principles (“GAAP”) in the United States of America and follows the significant accounting policies described below.
(A) Securities Valuation. Investments are usually valued as of the close of regular trading on the New York Stock Exchange (the "Exchange") (usually 4:00 p.m. Eastern time) on each day the Fund is open for business ("valuation date").
Pursuant to Rule 2a-5 under the 1940 Act, the Board of Trustees of the Trust (the "Board") has designated New York Life Investment Management LLC (“New York Life Investments” or the "Manager") as its Valuation Designee (the "Valuation Designee"). The Valuation Designee is responsible for performing fair valuations relating to all investments in the Fund’s portfolio for which market quotations are not readily available; periodically assessing and managing material valuation risks; establishing and applying fair value methodologies; testing fair valuation methodologies; evaluating and overseeing pricing services; ensuring appropriate segregation of valuation and portfolio management functions; providing quarterly, annual and prompt reporting to the Board, as appropriate; identifying potential conflicts of interest; and maintaining appropriate records. The Valuation Designee has established a valuation committee ("Valuation Committee") to assist in carrying out the Valuation Designee’s responsibilities and establish prices of securities for which market quotations are not readily available. The Fund's and the Valuation Designee's policies and procedures ("Valuation Procedures") govern the Valuation Designee’s selection and application of methodologies for determining and calculating the fair value of Fund investments. The Valuation Designee may value the Fund's portfolio securities for which market quotations are not readily available and other Fund assets utilizing inputs from pricing services and other third-party sources. The Valuation Committee meets (in person, via electronic mail or via teleconference) on an ad-hoc basis to determine fair valuations and on a quarterly basis to review fair value events with respect to certain securities for which market quotations are not readily available, including valuation risks and back-testing results, and preview reports to the Board.
The Valuation Committee establishes prices of securities for which market quotations are not readily available based on such methodologies and measurements on a regular basis after considering information that is reasonably available and deemed relevant by the Valuation Committee. The Board shall oversee the Valuation Designee and review fair valuation materials on a prompt, quarterly and annual basis and approve proposed revisions to the Valuation Procedures.
Investments for which market quotations are not readily available are valued at fair value as determined in good faith pursuant to the Valuation Procedures. A market quotation is readily available only when that
Notes to Financial Statements (continued)
quotation is a quoted price (unadjusted) in active markets for identical investments that the Fund can access at the measurement date, provided that a quotation will not be readily available if it is not reliable. "Fair value" is defined as the price the Fund would reasonably expect to receive upon selling an asset or liability in an orderly transaction to an independent buyer in the principal or most advantageous market for the asset or liability. Fair value measurements are determined within a framework that establishes a three-tier hierarchy that maximizes the use of observable market data and minimizes the use of unobservable inputs to establish a classification of fair value measurements for disclosure purposes. "Inputs" refer broadly to the assumptions that market participants would use in pricing the asset or liability, including assumptions about risk, such as the risk inherent in a particular valuation technique used to measure fair value using a pricing model and/or the risk inherent in the inputs for the valuation technique. Inputs may be observable or unobservable. Observable inputs reflect the assumptions market participants would use in pricing the asset or liability based on market data obtained from sources independent of the Fund. Unobservable inputs reflect the Fund’s own assumptions about the assumptions market participants would use in pricing the asset or liability based on the information available. The inputs or methodology used for valuing assets or liabilities may not be an indication of the risks associated with investing in those assets or liabilities. The three-tier hierarchy of inputs is summarized below.
| • | Level 1—quoted prices (unadjusted) in active markets for an identical asset or liability |
| • | Level 2—other significant observable inputs (including quoted prices for a similar asset or liability in active markets, interest rates and yield curves, prepayment speeds, credit risk, etc.) |
| • | Level 3—significant unobservable inputs (including the Fund's own assumptions about the assumptions that market participants would use in measuring fair value of an asset or liability) |
The level of an asset or liability within the fair value hierarchy is based on the lowest level of an input, both individually and in the aggregate, that is significant to the fair value measurement. The aggregate value by input level of the Fund’s assets and liabilities as of April 30, 2023, is included at the end of the Portfolio of Investments.
The Fund may use third-party vendor evaluations, whose prices may be derived from one or more of the following standard inputs, among others:
| • Broker/dealer quotes | • Benchmark securities |
| • Two-sided markets | • Reference data (corporate actions or material event notices) |
| • Bids/offers | • Monthly payment information |
| • Industry and economic events | • Reported trades |
An asset or liability for which a market quotation is not readily available is valued by methods deemed reasonable in good faith by the Valuation Committee, following the Valuation Procedures to represent fair value. Under these procedures, the Valuation Designee generally uses a market-based approach which may use related or comparable assets or
liabilities, recent transactions, market multiples, book values and other relevant information. The Valuation Designee may also use an income-based valuation approach in which the anticipated future cash flows of the asset or liability are discounted to calculate fair value. Discounts may also be applied due to the nature and/or duration of any restrictions on the disposition of the asset or liability. Fair value represents a good faith approximation of the value of a security. Fair value determinations involve the consideration of a number of subjective factors, an analysis of applicable facts and circumstances and the exercise of judgment. As a result, it is possible that the fair value for a security determined in good faith in accordance with the Valuation Procedures may differ from valuations for the same security determined for other funds using their own valuation procedures. Although the Valuation Procedures are designed to value a security at the price the Fund may reasonably expect to receive upon the security's sale in an orderly transaction, there can be no assurance that any fair value determination thereunder would, in fact, approximate the amount that the Fund would actually realize upon the sale of the security or the price at which the security would trade if a reliable market price were readily available. During the year ended April 30, 2023, there were no material changes to the fair value methodologies.
Securities which may be valued in this manner include, but are not limited to: (i) a security for which trading has been halted or suspended or otherwise does not have a readily available market quotation on a given day; (ii) a debt security that has recently gone into default and for which there is not a current market quotation; (iii) a security of an issuer that has entered into a restructuring; (iv) a security that has been delisted from a national exchange; (v) a security subject to trading collars for which no or limited trading takes place; and (vi) a security whose principal market has been temporarily closed at a time when, under normal conditions, it would be open. Securities valued in this manner are generally categorized as Level 2 or 3 in the hierarchy.
Certain securities held by the Fund may principally trade in foreign markets. Events may occur between the time the foreign markets close and the time at which the Fund's NAVs are calculated. These events may include, but are not limited to, situations relating to a single issuer in a market sector, significant fluctuations in U.S. or foreign markets, natural disasters, armed conflicts, governmental actions or other developments not tied directly to the securities markets. Should the Valuation Designee conclude that such events may have affected the accuracy of the last price of such securities reported on the local foreign market, the Valuation Designee may, pursuant to the Valuation Procedures, adjust the value of the local price to reflect the estimated impact on the price of such securities as a result of such events. In this instance, securities are generally categorized as Level 3 in the hierarchy. Additionally, certain foreign equity securities are also fair valued whenever the movement of a particular index exceeds certain thresholds. In such cases, the securities are fair valued by applying factors provided by a third-party vendor in accordance with the Valuation Procedures and are generally categorized as Level 2 in the hierarchy. No foreign equity securities held by the Fund as of April 30, 2023 were fair valued in such a manner.
| 24 | MainStay CBRE Global Infrastructure Fund |
If the principal market of certain foreign equity securities is closed in observance of a local foreign holiday, these securities are valued using the last closing price of regular trading on the relevant exchange and fair valued by applying factors provided by a third-party vendor in accordance with the Valuation Procedures. These securities are generally categorized as Level 2 in the hierarchy. No securities held by the Fund as of April 30, 2023, were fair valued in such a manner.
Equity securities are valued at the last quoted sales prices as of the close of regular trading on the relevant exchange on each valuation date. Securities that are not traded on the valuation date are valued at the mean of the last quoted bid and ask prices. Prices are normally taken from the principal market in which each security trades. These securities are generally categorized as Level 1 in the hierarchy.
Investments in mutual funds, including money market funds, are valued at their respective NAVs at the close of business each day on the valuation date. These securities are generally categorized as Level 1 in the hierarchy.
Temporary cash investments acquired in excess of 60 days to maturity at the time of purchase are valued using the latest bid prices or using valuations based on a matrix system (which considers such factors as security prices, yields, maturities and ratings), both as furnished by independent pricing services. Temporary cash investments that mature in 60 days or less at the time of purchase ("Short-Term Investments") are valued using the amortized cost method of valuation, unless the use of such method would be inappropriate. The amortized cost method involves valuing a security at its cost on the date of purchase and thereafter assuming a constant amortization to maturity of the difference between such cost and the value on maturity date. Amortized cost approximates the current fair value of a security. Securities valued using the amortized cost method are not valued using quoted prices in an active market and are generally categorized as Level 2 in the hierarchy.
The information above is not intended to reflect an exhaustive list of the methodologies that may be used to value portfolio investments. The Valuation Procedures permit the use of a variety of valuation methodologies in connection with valuing portfolio investments. The methodology used for a specific type of investment may vary based on the market data available or other considerations. The methodologies summarized above may not represent the specific means by which portfolio investments are valued on any particular business day.
A portfolio investment may be classified as an illiquid investment under the Trust's written liquidity risk management program and related procedures (“Liquidity Program”). Illiquidity of an investment might prevent the sale of such investment at a time when the Manager or the Subadvisor might wish to sell, and these investments could have the effect of decreasing the overall level of the Fund's liquidity. Further, the lack of an established secondary market may make it more difficult to value illiquid investments, requiring the Fund to rely on judgments that may be somewhat subjective in measuring value, which could vary materially from the amount that the Fund could realize upon disposition. Difficulty in selling illiquid investments may result in a loss or may be
costly to the Fund. An illiquid investment is any investment that the Manager or Subadvisor reasonably expects cannot be sold or disposed of in current market conditions in seven calendar days or less without the sale or disposition significantly changing the market value of the investment. The liquidity classification of each investment will be made using information obtained after reasonable inquiry and taking into account, among other things, relevant market, trading and investment-specific considerations in accordance with the Liquidity Program. Illiquid investments are often fair valued in accordance with the Fund's procedures described above. The liquidity of the Fund's investments was determined as of April 30, 2023, and can change at any time. Illiquid investments as of April 30, 2023, are shown in the Portfolio of Investments.
(B) Income Taxes. The Fund's policy is to comply with the requirements of the Internal Revenue Code of 1986, as amended (the “Internal Revenue Code”), applicable to regulated investment companies and to distribute all of its taxable income to the shareholders of the Fund within the allowable time limits.
The Manager evaluates the Fund’s tax positions to determine if the tax positions taken meet the minimum recognition threshold in connection with accounting for uncertainties in income tax positions taken or expected to be taken for the purposes of measuring and recognizing tax liabilities in the financial statements. Recognition of tax benefits of an uncertain tax position is permitted only to the extent the position is “more likely than not” to be sustained assuming examination by taxing authorities. The Manager analyzed the Fund's tax positions taken on federal, state and local income tax returns for all open tax years (for up to three tax years) and has concluded that no provisions for federal, state and local income tax are required in the Fund's financial statements. The Fund's federal, state and local income tax and federal excise tax returns for tax years for which the applicable statutes of limitations have not expired are subject to examination by the Internal Revenue Service and state and local departments of revenue.
(C) Foreign Taxes. The Fund may be subject to foreign taxes on income and other transaction-based taxes imposed by certain countries in which it invests. A portion of the taxes on gains on investments or currency purchases/repatriation may be reclaimable. The Fund will accrue such taxes and reclaims as applicable, based upon its current interpretation of tax rules and regulations that exist in the markets in which it invests.
The Fund may be subject to taxation on realized capital gains, repatriation proceeds and other transaction-based taxes imposed by certain countries in which it invests. The Fund will accrue such taxes as applicable based upon its current interpretation of tax rules and regulations that exist in the market in which it invests. Capital gains taxes relating to positions still held are reflected as a liability in the Statement of Assets and Liabilities, as well as an adjustment to the Fund's net unrealized appreciation (depreciation). Taxes related to capital gains realized, if any, are reflected as part of net realized gain (loss) in the Statement of Operations. Changes in tax liabilities related to capital gains taxes on unrealized investment
Notes to Financial Statements (continued)
gains, if any, are reflected as part of the change in net unrealized appreciation (depreciation) on investments in the Statement of Operations. Transaction-based charges are generally assessed as a percentage of the transaction amount.
(D) Dividends and Distributions to Shareholders. Dividends and distributions are recorded on the ex-dividend date. The Fund intends to declare and pay dividends from net investment income, if any, at least quarterly and distributions from net realized capital and currency gains, if any, at least annually. Unless a shareholder elects otherwise, all dividends and distributions are reinvested at NAV in the same class of shares of the Fund. Dividends and distributions to shareholders are determined in accordance with federal income tax regulations and may differ from determinations using GAAP.
(E) Security Transactions and Investment Income. The Fund records security transactions on the trade date. Realized gains and losses on security transactions are determined using the identified cost method. Dividend income is recognized on the ex-dividend date, net of any foreign tax withheld at the source, and interest income is accrued as earned using the effective interest rate method. Distributions received from real estate investment trusts may be classified as dividends, capital gains and/or return of capital.
The Fund may also invest up to 25% of its net assets in master limited partnerships.
Investment income and realized and unrealized gains and losses on investments of the Fund are allocated pro rata to the separate classes of shares based upon their relative net assets on the date the income is earned or realized and unrealized gains and losses are incurred.
(F) Expenses. Expenses of the Trust are allocated to the individual Funds in proportion to the net assets of the respective Funds when the expenses are incurred, except where direct allocations of expenses can be made. Expenses (other than transfer agent expenses and fees incurred under the shareholder services plans and/or the distribution plans further discussed in Note 3(B)) are allocated to separate classes of shares pro rata based upon their relative net assets on the date the expenses are incurred. The expenses borne by the Fund, including those of related parties to the Fund, are shown in the Statement of Operations.
Additionally, the Fund may invest in mutual funds, which are subject to management fees and other fees that may cause the costs of investing in mutual funds to be greater than the costs of owning the underlying securities directly. These indirect expenses of mutual funds are not included in the amounts shown as expenses in the Statement of Operations or in the expense ratios included in the Financial Highlights.
(G) Use of Estimates. In preparing financial statements in conformity with GAAP, the Manager makes estimates and assumptions that affect the reported amounts and disclosures in the financial statements. Actual results could differ from those estimates and assumptions.
(H) Foreign Currency Transactions. The Fund's books and records are maintained in U.S. dollars. Prices of securities denominated in foreign currency amounts are translated into U.S. dollars at the mean between the buying and selling rates last quoted by any major U.S. bank at the following dates:
(i) market value of investment securities, other assets and liabilities— at the valuation date; and
(ii) purchases and sales of investment securities, income and expenses—at the date of such transactions.
The assets and liabilities that are denominated in foreign currency amounts are presented at the exchange rates and market values at the close of the period. The realized and unrealized changes in net assets arising from fluctuations in exchange rates and market prices of securities are not separately presented.
Net realized gain (loss) on foreign currency transactions represents net currency gains or losses realized as a result of differences between the amounts of securities sale proceeds or purchase cost, dividends, interest and withholding taxes as recorded on the Fund's books, and the U.S. dollar equivalent amount actually received or paid. Net currency gains or losses from valuing such foreign currency denominated assets and liabilities, other than investments at valuation date exchange rates, are reflected in unrealized foreign exchange gains or losses.
(I) Securities Lending. In order to realize additional income, the Fund may engage in securities lending, subject to the limitations set forth in the 1940 Act and relevant guidance by the staff of the Securities and Exchange Commission (“SEC”). If the Fund engages in securities lending, the Fund will lend through its custodian, JPMorgan Chase Bank, N.A., ("JPMorgan"), acting as securities lending agent on behalf of the Fund. Under the current arrangement, JPMorgan will manage the Fund's collateral in accordance with the securities lending agency agreement between the Fund and JPMorgan, and indemnify the Fund against counterparty risk. The loans will be collateralized by cash (which may be invested in a money market fund) and/or non-cash collateral (which may include U.S. Treasury securities and/or U.S. government agency securities issued or guaranteed by the United States government or its agencies or instrumentalities) at least equal at all times to the market value of the securities loaned. The Fund bears the risk of delay in recovery of, or loss of rights in, the securities loaned. The Fund may also record a realized gain or loss on securities deemed sold due to a borrower’s inability to return securities on loan. The Fund bears the risk of any loss on investment of cash collateral. The Fund will receive compensation for lending its securities in the form of fees or it will retain a portion of interest earned on the investment of any cash collateral. The Fund will also continue to receive interest and dividends on the securities loaned and any gain or loss in the market price of the securities loaned that may occur during the term of the loan will be for the account of the Fund. Income earned from securities lending activities, if any, is reflected in the Statement of Operations. Securities on loan as of April 30, 2023, are shown in the Portfolio of Investments.
| 26 | MainStay CBRE Global Infrastructure Fund |
(J) Foreign Securities Risk. The Fund may invest in foreign securities, which carry certain risks that are in addition to the usual risks inherent in domestic securities. Foreign regulatory regimes and securities markets can have less stringent investor protections and disclosure standards and less liquid trading markets than U.S. regulatory regimes and securities markets, and can experience political, social and economic developments that may affect the value of investments in foreign securities. These risks include those resulting from currency fluctuations, future adverse political or economic developments and possible imposition of currency exchange blockages or other foreign governmental laws or restrictions. Economic sanctions and other similar governmental actions or developments could, among other things, effectively restrict or eliminate the Fund's ability to purchase or sell certain foreign securities or groups of foreign securities, and thus may make the Fund's investments in such securities less liquid or more difficult to value. These risks are likely to be greater in emerging markets than in developed markets. The ability of issuers of debt securities held by the Fund to meet their obligations may be affected by, among other things, economic or political developments in a specific country, industry or region.
(K) Indemnifications. Under the Trust’s organizational documents, its officers and trustees are indemnified against certain liabilities that may arise out of performance of their duties to the Trust. Additionally, in the normal course of business, the Fund enters into contracts with third-party service providers that contain a variety of representations and warranties and that may provide general indemnifications. The Fund's maximum exposure under these arrangements is unknown, as this would involve future claims that may be made against the Fund that have not yet occurred. The Manager believes that the risk of loss in connection with these potential indemnification obligations is remote. However, there can be no assurance that material liabilities related to such obligations will not arise in the future, which could adversely impact the Fund.
Note 3–Fees and Related Party Transactions
(A) Manager and Subadvisor. New York Life Investments, a registered investment adviser and an indirect, wholly-owned subsidiary of New York Life Insurance Company ("New York Life"), serves as the Fund's Manager pursuant to an Amended and Restated Management Agreement ("Management Agreement"). The Manager provides offices, conducts clerical, recordkeeping and bookkeeping services and keeps most of the financial and accounting records required to be maintained by the Fund. Except for the portion of salaries and expenses that are the responsibility of the Fund, the Manager pays the salaries and expenses of all personnel affiliated with the Fund and certain operational expenses of the Fund. The Fund reimburses New York Life Investments in an amount equal to the portion of the compensation of the Chief Compliance Officer attributable to the Fund. CBRE Investment Management Listed Real Assets LLC ("CBRE" or the "Subadvisor"), a registered investment adviser, serves as the Subadvisor to the Fund and is responsible for the day-to-day portfolio management of the Fund. Pursuant to the terms of a Subadvisory Agreement ("Subadvisory Agreement") between New York Life
Investments and CBRE, New York Life Investments pays for the services of the Subadvisor.
Pursuant to the Management Agreement, the Fund pays the Manager a monthly fee for the services performed and the facilities furnished at an annual rate of 0.85% of the Fund's average daily net assets.
New York Life Investments has contractually agreed to waive fees and/or reimburse expenses so that Total Annual Fund Operating Expenses (excluding taxes, interest, litigation, extraordinary expenses, brokerage and other transaction expenses relating to the purchase or sale of portfolio investments and acquired (underlying) fund fees and expenses) do not exceed the following percentages of average daily net assets: Class A, 1.33%; Investor Class, 1.45%; Class C, 2.08%; Class I, 0.97%; and Class R6, 0.95%. This agreement will remain in effect until August 31, 2023, and shall renew automatically for one-year terms unless New York Life Investments provides written notice of termination prior to the start of the next term or upon approval of the Board.
During the year ended April 30, 2023, New York Life Investments earned fees from the Fund in the amount of $16,311,801 and waived fees and/or reimbursed expenses, including the waiver/reimbursement of certain class specific expenses in the amount of $808,272 and paid the Subadvisor fees in the amount of $7,751,763.
JPMorgan provides sub-administration and sub-accounting services to the Fund pursuant to an agreement with New York Life Investments. These services include calculating the daily NAVs of the Fund, maintaining the general ledger and sub-ledger accounts for the calculation of the Fund's NAVs, and assisting New York Life Investments in conducting various aspects of the Fund's administrative operations. For providing these services to the Fund, JPMorgan is compensated by New York Life Investments.
Pursuant to an agreement between the Trust and New York Life Investments, New York Life Investments is responsible for providing or procuring certain regulatory reporting services for the Fund. The Fund will reimburse New York Life Investments for the actual costs incurred by New York Life Investments in connection with providing or procuring these services for the Fund.
(B) Distribution and Service Fees. The Trust, on behalf of the Fund, has entered into a distribution agreement with NYLIFE Distributors LLC (the “Distributor”), an affiliate of New York Life Investments. The Fund has adopted distribution plans (the “Plans”) in accordance with the provisions of Rule 12b-1 under the 1940 Act.
Pursuant to the Class A and Investor Class Plans, the Distributor receives a monthly fee from the Class A and Investor Class shares at an annual rate of 0.25% of the average daily net assets of the Class A and Investor Class shares for distribution and/or service activities as designated by the Distributor. Pursuant to the Class C Plan, Class C shares pay the Distributor a monthly distribution fee at an annual rate of 0.75% of the average daily net assets of the Class C shares, along with a service fee at an annual rate of 0.25% of the average daily net assets of the Class C
Notes to Financial Statements (continued)
shares, for a total 12b-1 fee of 1.00%. Class I and Class R6 shares are not subject to a distribution and/or service fee.
The Plans provide that the distribution and service fees are payable to the Distributor regardless of the amounts actually expended by the Distributor for distribution of the Fund's shares and service activities.
(C) Sales Charges. The Fund was advised by the Distributor that the amount of initial sales charges retained on sales of Class A and Investor Class shares during the year ended April 30, 2023, were $32,146 and $358, respectively.
The Fund was also advised that the Distributor retained CDSCs on redemptions of Class A and Class C shares during the year ended April 30, 2023, of $5,629 and $3,027, respectively.
(D) Transfer, Dividend Disbursing and Shareholder Servicing Agent. NYLIM Service Company LLC, an affiliate of New York Life Investments, is the Fund's transfer, dividend disbursing and shareholder servicing agent pursuant to an agreement between NYLIM Service Company LLC and the Trust. NYLIM Service Company LLC has entered into an agreement with SS&C Global Investor & Distributor Solutions, Inc. ("SS&C"), pursuant to which SS&C performs certain transfer agent services on behalf of NYLIM Service Company LLC. New York Life Investments has contractually agreed to limit the transfer agency expenses charged to the Fund’s share classes to a maximum of 0.35% of that share class’s average daily net assets on an annual basis after deducting any applicable Fund or class-level expense reimbursement or small account fees. This agreement will remain in effect until August 31, 2023, and shall renew automatically for one-year terms unless New York Life Investments provides written notice of termination prior to the start of the next term or upon approval of the Board. During the year ended April 30, 2023, transfer agent expenses incurred by the Fund and any reimbursements, pursuant to the aforementioned Transfer Agency expense limitation agreement, were as follows:
| Class | Expense | Waived |
| Class A | $ 120,456 | $— |
| Investor Class | 3,453 | — |
| Class C | 32,275 | — |
| Class I | 2,266,752 | — |
| Class R6 | 318 | — |
(E) Small Account Fee. Shareholders with small accounts adversely impact the cost of providing transfer agency services. In an effort to reduce total transfer agency expenses, the Fund has implemented a small account fee on certain types of accounts. As described in the Fund's prospectus, certain shareholders with an account balance of less than $1,000 ($5,000 for Class A share accounts) are charged an annual per account fee of $20 (assessed semi-annually), the proceeds from which offset transfer agent fees as reflected in the Statement of Operations. This small account fee will not apply to certain types of accounts as described further in the Fund’s prospectus.
(F) Capital. As of April 30, 2023, New York Life and its affiliates beneficially held shares of the Fund with the values and percentages of net assets as follows:
Note 4-Federal Income Tax
As of April 30, 2023, the cost and unrealized appreciation (depreciation) of the Fund’s investment portfolio, including applicable derivative contracts and other financial instruments, as determined on a federal income tax basis, were as follows:
| | Federal Tax
Cost | Gross
Unrealized
Appreciation | Gross
Unrealized
(Depreciation) | Net
Unrealized
Appreciation/
(Depreciation) |
| Investments in Securities | $2,108,710,144 | $121,299,418 | $(54,556,908) | $66,742,510 |
As of April 30, 2023, the components of accumulated gain (loss) on a tax basis were as follows:
Ordinary
Income | Accumulated
Capital
and Other
Gain (Loss) | Other
Temporary
Differences | Unrealized
Appreciation
(Depreciation) | Total
Accumulated
Gain (Loss) |
| $1,319,642 | $(251,512,781) | $(5,344) | $66,737,915 | $(183,460,568) |
The difference between book-basis and tax-basis unrealized appreciation (depreciation) is primarily due to wash sale adjustments.
As of April 30, 2023, for federal income tax purposes, capital loss carryforwards of $251,512,781, as shown in the table below, were available to the extent provided by the regulations to offset future realized gains of the Fund. Accordingly, no capital gains distributions are expected to be paid to shareholders until net gains have been realized in excess of such amounts.
Total Capital Loss
Available Through | Short-Term
Capital Loss
Amounts (000’s) | Long-Term
Capital Loss
Amounts (000’s) |
| Unlimited | $156,815 | $94,698 |
During the years ended April 30, 2023 and April 30, 2022, the tax character of distributions paid as reflected in the Statements of Changes in Net Assets was as follows:
| | 2023 | 2022 |
| Distributions paid from: | | |
| Ordinary Income | $43,678,063 | $14,816,842 |
| Long-Term Capital Gains | 13,519,686 | — |
| Total | $57,197,749 | $14,816,842 |
| 28 | MainStay CBRE Global Infrastructure Fund |
Note 5–Custodian
JPMorgan is the custodian of cash and securities held by the Fund. Custodial fees are charged to the Fund based on the Fund's net assets and/or the market value of securities held by the Fund and the number of certain transactions incurred by the Fund.
Note 6–Line of Credit
The Fund and certain other funds managed by New York Life Investments maintain a line of credit with a syndicate of banks in order to secure a source of funds for temporary purposes to meet unanticipated or excessive redemption requests.
Effective July 26, 2022, under the credit agreement (the “Credit Agreement”), the aggregate commitment amount is $600,000,000 with an additional uncommitted amount of $100,000,000. The commitment fee is an annual rate of 0.15% of the average commitment amount payable quarterly, regardless of usage, to JPMorgan, who serves as the agent to the syndicate. The commitment fee is allocated among the Fund and certain other funds managed by New York Life Investments based upon their respective net assets and other factors. Interest on any revolving credit loan is charged based upon the Federal Funds Rate, Daily Simple Secured Overnight Financing Rate ("SOFR") + 0.10%, or the Overnight Bank Funding Rate, whichever is higher. The Credit Agreement expires on July 25, 2023, although the Fund, certain other funds managed by New York Life Investments and the syndicate of banks may renew the Credit Agreement for an additional year on the same or different terms or enter into a credit agreement with a different syndicate of banks. Prior to July 26, 2022, the aggregate commitment amount and the commitment fee were the same as those under the current Credit Agreement. During the year ended April 30, 2023, there were no borrowings made or outstanding with respect to the Fund under the Credit Agreement.
Note 7–Interfund Lending Program
Pursuant to an exemptive order issued by the SEC, the Fund, along with certain other funds managed by New York Life Investments, may participate in an interfund lending program. The interfund lending program provides an alternative credit facility that permits the Fund and certain other funds managed by New York Life Investments to lend or borrow money for temporary purposes directly to or from one another, subject to the conditions of the exemptive order. During the year ended April 30, 2023, there were no interfund loans made or outstanding with respect to the Fund.
Note 8–Purchases and Sales of Securities (in 000’s)
During the year ended April 30, 2023, purchases and sales of securities, other than short-term securities, were $1,318,703 and $808,926, respectively.
Note 9–Capital Share Transactions
Transactions in capital shares for the years ended April 30, 2023 and April 30, 2022, were as follows:
| Class A | Shares | Amount |
| Year ended April 30, 2023: | | |
| Shares sold | 2,929,490 | $ 37,054,021 |
| Shares issued to shareholders in reinvestment of distributions | 201,420 | 2,470,392 |
| Shares redeemed | (1,847,772) | (22,767,505) |
| Net increase (decrease) in shares outstanding before conversion | 1,283,138 | 16,756,908 |
| Shares converted into Class A (See Note 1) | 13,183 | 168,235 |
| Shares converted from Class A (See Note 1) | (73,115) | (935,517) |
| Net increase (decrease) | 1,223,206 | $ 15,989,626 |
| Year ended April 30, 2022: | | |
| Shares sold | 4,411,145 | $ 57,605,328 |
| Shares issued to shareholders in reinvestment of distributions | 75,944 | 975,716 |
| Shares redeemed | (1,226,961) | (16,049,703) |
| Net increase (decrease) in shares outstanding before conversion | 3,260,128 | 42,531,341 |
| Shares converted into Class A (See Note 1) | 21,293 | 278,101 |
| Shares converted from Class A (See Note 1) | (78,805) | (1,050,609) |
| Net increase (decrease) | 3,202,616 | $ 41,758,833 |
| |
| Investor Class | Shares | Amount |
| Year ended April 30, 2023: | | |
| Shares sold | 27,154 | $ 345,340 |
| Shares issued to shareholders in reinvestment of distributions | 4,981 | 61,132 |
| Shares redeemed | (33,754) | (421,376) |
| Net increase (decrease) in shares outstanding before conversion | (1,619) | (14,904) |
| Shares converted into Investor Class (See Note 1) | 7,674 | 95,996 |
| Shares converted from Investor Class (See Note 1) | (8,634) | (110,489) |
| Net increase (decrease) | (2,579) | $ (29,397) |
| Year ended April 30, 2022: | | |
| Shares sold | 50,651 | $ 678,517 |
| Shares issued to shareholders in reinvestment of distributions | 2,248 | 28,825 |
| Shares redeemed | (22,119) | (288,283) |
| Net increase (decrease) in shares outstanding before conversion | 30,780 | 419,059 |
| Shares converted into Investor Class (See Note 1) | 3,078 | 40,150 |
| Shares converted from Investor Class (See Note 1) | (17,270) | (225,640) |
| Net increase (decrease) | 16,588 | $ 233,569 |
| |
Notes to Financial Statements (continued)
| Class C | Shares | Amount |
| Year ended April 30, 2023: | | |
| Shares sold | 277,436 | $ 3,481,910 |
| Shares issued to shareholders in reinvestment of distributions | 32,416 | 398,277 |
| Shares redeemed | (547,298) | (6,677,519) |
| Net increase (decrease) in shares outstanding before conversion | (237,446) | (2,797,332) |
| Shares converted from Class C (See Note 1) | (10,193) | (127,321) |
| Net increase (decrease) | (247,639) | $ (2,924,653) |
| Year ended April 30, 2022: | | |
| Shares sold | 1,163,935 | $ 15,167,647 |
| Shares issued to shareholders in reinvestment of distributions | 11,316 | 142,471 |
| Shares redeemed | (222,223) | (2,883,848) |
| Net increase (decrease) in shares outstanding before conversion | 953,028 | 12,426,270 |
| Shares converted from Class C (See Note 1) | (7,157) | (92,611) |
| Net increase (decrease) | 945,871 | $ 12,333,659 |
| |
| Class I | Shares | Amount |
| Year ended April 30, 2023: | | |
| Shares sold | 76,586,421 | $ 967,256,332 |
| Shares issued to shareholders in reinvestment of distributions | 2,936,803 | 36,014,942 |
| Shares redeemed | (41,280,583) | (512,768,856) |
| Net increase (decrease) in shares outstanding before conversion | 38,242,641 | 490,502,418 |
| Shares converted into Class I (See Note 1) | 73,057 | 935,517 |
| Shares converted from Class I (See Note 1) | (2,086) | (26,421) |
| Net increase (decrease) | 38,313,612 | $ 491,411,514 |
| Year ended April 30, 2022: | | |
| Shares sold | 90,600,814 | $1,191,344,996 |
| Shares issued to shareholders in reinvestment of distributions | 936,782 | 12,096,707 |
| Shares redeemed | (11,518,740) | (151,517,719) |
| Net increase (decrease) in shares outstanding before conversion | 80,018,856 | 1,051,923,984 |
| Shares converted into Class I (See Note 1) | 78,742 | 1,050,609 |
| Net increase (decrease) | 80,097,598 | $1,052,974,593 |
| |
| Class R6 | Shares | Amount |
| Year ended April 30, 2023: | | |
| Shares sold | 83,285 | $ 1,062,536 |
| Shares issued to shareholders in reinvestment of distributions | 22,623 | 276,371 |
| Shares redeemed | (840,682) | (10,710,454) |
| Net increase (decrease) | (734,774) | $ (9,371,547) |
| Year ended April 30, 2022: | | |
| Shares sold | 790,403 | $ 10,101,975 |
| Shares issued to shareholders in reinvestment of distributions | 2,801 | 38,065 |
| Shares redeemed | (17,275) | (228,218) |
| Net increase (decrease) | 775,929 | $ 9,911,822 |
Note 10–Other Matters
As of the date of this report, interest rates in the United States and many parts of the world, including certain European countries, continue to ascend from historically low levels. Thus, the Fund currently faces a heightened level of risk associated with rising interest rates. This could be driven by a variety of factors, including but not limited to central bank monetary policies, changing inflation or real growth rates, general economic conditions, increasing bond issuances or reduced market demand for low yielding investments.
Social, political, economic and other conditions and events, such as war, natural disasters, health emergencies (e.g., epidemics and pandemics), terrorism, conflicts, social unrest, recessions, inflation, rapid interest rate changes and supply chain disruptions, may occur and could significantly impact the Fund, issuers, industries, governments and other systems, including the financial markets. Developments that disrupt global economies and financial markets, such as COVID-19, the conflict in Ukraine, and the failures of certain U.S. and non-U.S. banks, may magnify factors that affect the Fund's performance.
Note 11–Subsequent Events
In connection with the preparation of the financial statements of the Fund as of and for the year ended April 30, 2023, events and transactions subsequent to April 30, 2023, through the date the financial statements were issued have been evaluated by the Manager for possible adjustment and/or disclosure. No subsequent events requiring financial statement adjustment or disclosure have been identified.
| 30 | MainStay CBRE Global Infrastructure Fund |
Report of Independent Registered Public Accounting Firm
To the Shareholders of the Fund and Board of Trustees
MainStay Funds Trust:
Opinion on the Financial Statements
We have audited the accompanying statement of assets and liabilities of MainStay CBRE Global Infrastructure Fund (the Fund), one of the funds constituting MainStay Funds Trust, including the portfolio of investments, as of April 30, 2023, the related statement of operations for the year then ended, the statements of changes in net assets for each of the years in the two-year period then ended, and the related notes (collectively, the financial statements) and the financial highlights for each of the years in the three-year period ended April 30, 2023, the period from November 1, 2019 through April 30, 2020 or the period then ended, and each of the years or periods in the two-year period ended October 31, 2019. In our opinion, the financial statements and financial highlights present fairly, in all material respects, the financial position of the Fund as of April 30, 2023, the results of its operations for the year then ended, the changes in its net assets for each of the years in the two-year period then ended, and the financial highlights for each of the years in the three-year period ended April 30, 2023, the period from November 1, 2019 through April 30, 2020 or the period then ended, and each of the years or periods in the two-year period ended October 31, 2019, in conformity with U.S. generally accepted accounting principles.
Basis for Opinion
These financial statements and financial highlights are the responsibility of the Fund's management. Our responsibility is to express an opinion on these financial statements and financial highlights based on our audits. We are a public accounting firm registered with the Public Company Accounting Oversight Board (United States) (PCAOB) and are required to be independent with respect to the Fund in accordance with the U.S. federal securities laws and the applicable rules and regulations of the Securities and Exchange Commission and the PCAOB.
We conducted our audits in accordance with the standards of the PCAOB. Those standards require that we plan and perform the audit to obtain reasonable assurance about whether the financial statements and financial highlights are free of material misstatement, whether due to error or fraud. Our audits included performing procedures to assess the risks of material misstatement of the financial statements and financial highlights, whether due to error or fraud, and performing procedures that respond to those risks. Such procedures included examining, on a test basis, evidence regarding the amounts and disclosures in the financial statements and financial highlights. Such procedures also included confirmation of securities owned as of April 30, 2023, by correspondence with the custodians, transfer agent, and brokers; when replies were not received from brokers, we performed other auditing procedures. Our audits also included evaluating the accounting principles used and significant estimates made by management, as well as evaluating the overall presentation of the financial statements and financial highlights. We believe that our audits provide a reasonable basis for our opinion.

We have served as the auditor of one or more New York Life Investment Management investment companies since 2003.
Philadelphia, Pennsylvania
June 23, 2023
Board Consideration and Approval of Management Agreement and Subadvisory Agreement (Unaudited)
The continuation of the Management Agreement with respect to the MainStay CBRE Global Infrastructure Fund (“Fund”) and New York Life Investment Management LLC (“New York Life Investments”) and the Subadvisory Agreement between New York Life Investments and CBRE Investment Management Listed Real Assets LLC (“CBRE”) with respect to the Fund (together, “Advisory Agreements”) is subject to annual review and approval by the Board of Trustees of MainStay Funds Trust (“Board” of the “Trust”) in accordance with Section 15 of the Investment Company Act of 1940, as amended (“1940 Act”). At its December 6–7, 2022 meeting, the Board, which is comprised solely of Trustees who are not an “interested person” (as such term is defined in the 1940 Act) of the Trust (“Independent Trustees”), unanimously approved the continuation of each of the Advisory Agreements for a one-year period.
In reaching the decision to approve the continuation of each of the Advisory Agreements, the Board considered information and materials furnished by New York Life Investments and CBRE in connection with an annual contract review process undertaken by the Board that took place at meetings of the Board and its Contracts Committee during October 2022 through December 2022, including information and materials furnished by New York Life Investments and CBRE in response to requests prepared on behalf of the Board, and in consultation with the Board, by independent legal counsel to the Independent Trustees, which encompassed a variety of topics, including those summarized below. Information and materials requested by and furnished to the Board for consideration in connection with the contract review process included, among other items, reports on the Fund and “peer funds” prepared by Institutional Shareholder Services Inc. (“ISS”), an independent third-party service provider engaged by the Board to report objectively on the Fund’s investment performance, management fee and total expenses. The Board also considered information on the fees charged to other investment advisory clients of New York Life Investments and/or CBRE that follow investment strategies similar to those of the Fund, if any, and, when applicable, the rationale for any differences in the Fund’s management and subadvisory fees and the fees charged to those other investment advisory clients. In addition, the Board considered information regarding the legal standards and fiduciary obligations applicable to its consideration of the continuation of each of the Advisory Agreements. The contract review process, including the structure and format for information and materials provided to the Board, has been developed in consultation with the Board. The Independent Trustees also met in executive sessions with their independent legal counsel and, for portions thereof, with senior management of New York Life Investments.
The Board’s deliberations with respect to the continuation of each of the Advisory Agreements reflect a year-long process, and the Board also took into account information furnished to the Board and its Committees throughout the year, as deemed relevant and appropriate by the Trustees, including, among other items, reports on investment performance of the Fund and investment-related matters for the Fund as well as presentations from New York Life Investments and, generally annually, CBRE personnel. In addition, the Board took into account other information provided by New York Life Investments throughout the year,
including, among other items, periodic reports on legal and compliance matters, risk management, portfolio turnover, brokerage commissions and non-advisory services provided to the Fund by New York Life Investments, as deemed relevant and appropriate by the Trustees.
In addition to information provided to the Board throughout the year, the Board received information in connection with its June 2022 meeting provided specifically in response to requests prepared on behalf of the Board, and in consultation with the Board, by independent legal counsel to the Independent Trustees regarding the Fund’s distribution arrangements. In addition, the Board received information regarding the Fund’s asset levels, share purchase and redemption activity and the payment of Rule 12b-1 and/or certain other fees by the applicable share classes of the Fund, among other information.
In considering the continuation of each of the Advisory Agreements, the Trustees reviewed and evaluated the information and factors they believed to reasonably be necessary and appropriate in light of legal advice furnished to them by independent legal counsel to the Independent Trustees and through the exercise of their own business judgment. Although individual Trustees may have weighed certain factors or information differently and the Board did not consider any single factor or information controlling in reaching its decision, the factors that figured prominently in the Board’s consideration of the continuation of each of the Advisory Agreements are summarized in more detail below and include, among other factors: (i) the nature, extent and quality of the services provided to the Fund by New York Life Investments and CBRE; (ii) the qualifications of the portfolio managers of the Fund and the historical investment performance of the Fund, New York Life Investments and CBRE; (iii) the costs of the services provided, and profits realized, by New York Life Investments and CBRE with respect to their relationships with the Fund; (iv) the extent to which economies of scale have been realized or may be realized if the Fund grows and the extent to which any economies of scale have been shared, have benefited or may benefit the Fund’s shareholders; and (v) the reasonableness of the Fund’s management and subadvisory fees and total ordinary operating expenses. Although the Board recognized that comparisons between the Fund’s fees and expenses and those of other funds are imprecise given different terms of agreements, variations in fund strategies and other factors, the Board considered the reasonableness of the Fund’s management fee and total ordinary operating expenses as compared to the peer funds identified by ISS. Throughout their considerations, the Trustees acknowledged the commitment of New York Life Investments and its affiliates to serve the MainStay Group of Funds, as well as their capacity, experience, resources, financial stability and reputations. The Trustees also acknowledged the entrepreneurial and other risks assumed by New York Life Investments in sponsoring and managing the Fund. With respect to the Subadvisory Agreement, the Board took into account New York Life Investments’ recommendation to approve the continuation of the Subadvisory Agreement.
The Trustees noted that, throughout the year, the Trustees are afforded an opportunity to ask questions of, and request additional information or materials from, New York Life Investments and CBRE. The Board’s
| 32 | MainStay CBRE Global Infrastructure Fund |
decision with respect to each of the Advisory Agreements may have also been based, in part, on the Board’s knowledge of New York Life Investments and CBRE resulting from, among other things, the Board’s consideration of each of the Advisory Agreements in prior years, the advisory agreements for other funds in the MainStay Group of Funds, the Board’s review throughout the year of the performance and operations of other funds in the MainStay Group of Funds and each Trustee’s business judgment and industry experience. In addition to considering the above-referenced factors, the Board observed that in the marketplace there are a range of investment options available to investors and that the Fund’s shareholders, having had the opportunity to consider other investment options, have chosen to invest in the Fund.
The factors that figured prominently in the Board’s decision to approve the continuation of each of the Advisory Agreements during its December 6–7, 2022 meeting are summarized in more detail below.
Nature, Extent and Quality of Services Provided by New York Life Investments and CBRE
The Board examined the nature, extent and quality of the services that New York Life Investments provides to the Fund. The Board evaluated New York Life Investments’ experience and capabilities in serving as manager of the Fund and considered that the Fund operates in a “manager-of-managers” structure. The Board also considered New York Life Investments’ responsibilities and services provided pursuant to this structure, including overseeing the services provided by CBRE, evaluating the performance of CBRE, making recommendations to the Board as to whether the Subadvisory Agreement should be renewed, modified or terminated and periodically reporting to the Board regarding the results of New York Life Investments’ evaluation and monitoring functions. The Board noted that New York Life Investments manages other mutual funds, serves a variety of other investment advisory clients, including other pooled investment vehicles, and has experience overseeing mutual fund service providers, including subadvisors. The Board considered the experience of senior personnel at New York Life Investments providing management and administrative and other non-advisory services to the Fund. The Board observed that New York Life Investments devotes significant resources and time to providing management and administrative and other non-advisory services to the Fund, including New York Life Investments’ oversight and due diligence reviews of CBRE and ongoing analysis of, and interactions with, CBRE with respect to, among other things, the Fund’s investment performance and risks as well as CBRE’s investment capabilities and subadvisory services with respect to the Fund.
The Board also considered the range of services that New York Life Investments provides to the Fund under the terms of the Management Agreement, including: (i) fund accounting and ongoing supervisory services provided by New York Life Investments’ Fund Administration and Accounting Group; (ii) investment supervisory and analytical services provided by New York Life Investments’ Investment Consulting Group; (iii) compliance services provided by the Trust’s Chief Compliance Officer as well as New York Life Investments’ compliance department, including
supervision and implementation of the Fund’s compliance program; (iv) legal services provided by New York Life Investments’ Office of the General Counsel; and (v) risk management monitoring and analysis by compliance and investment personnel. In addition, the Board considered New York Life Investments’ willingness to invest in personnel and other resources, such as cyber security, information security and business continuity planning, designed to benefit the Fund and noted that New York Life Investments is responsible for compensating the Trust’s officers, except for a portion of the salary of the Trust’s Chief Compliance Officer. The Board recognized that New York Life Investments provides certain other non-advisory services to the Fund and has provided an increasingly broad array of non-advisory services to the MainStay Group of Funds as a result of regulatory and other developments, including in connection with the implementation of the MainStay Group of Funds’ derivatives risk management program and policies and procedures adopted pursuant to Rule 18f-4 under the 1940 Act. The Board considered benefits to the Fund’s shareholders from the Fund being part of the MainStay Group of Funds, including the ability to exchange investments between the same class of shares of funds in the MainStay Group of Funds, including without the imposition of a sales charge (if any).
The Board also examined the range, and the nature, extent and quality, of the investment advisory services that CBRE provides to the Fund and considered the terms of each of the Advisory Agreements. The Board evaluated CBRE’s experience and performance in serving as subadvisor to the Fund and advising other portfolios and CBRE’s track record and experience in providing investment advisory services as well as the experience of investment advisory, senior management and administrative personnel at CBRE. The Board considered New York Life Investments’ and CBRE’s overall resources, legal and compliance environment, capabilities, reputation, financial condition and history. In addition to information provided in connection with quarterly meetings with the Trust’s Chief Compliance Officer, the Board considered information regarding the compliance policies and procedures of New York Life Investments and CBRE and acknowledged their commitment to further developing and strengthening compliance programs relating to the Fund. The Board also considered CBRE’s ability to recruit and retain qualified investment professionals and willingness to invest in personnel and other resources to service and support the Fund. In this regard, the Board considered the qualifications and experience of the Fund’s portfolio managers, the number of accounts managed by the portfolio managers and the method for compensating the portfolio managers.
In addition, the Board considered information provided by New York Life Investments and CBRE regarding the operations of their respective business continuity plans in response to the COVID-19 pandemic and the continued remote work environment.
Based on these considerations, among others, the Board concluded that the Fund would likely continue to benefit from the nature, extent and quality of these services.
Board Consideration and Approval of Management Agreement and Subadvisory Agreement (Unaudited) (continued)
Investment Performance
In evaluating the Fund’s investment performance, the Board considered investment performance results over various periods in light of the Fund’s investment objective, strategies and risks. The Board considered investment reports on, and analysis of, the Fund’s performance provided to the Board throughout the year. These reports include, among other items, information on the Fund’s gross and net returns, the Fund’s investment performance compared to a relevant investment category and the Fund’s benchmark, the Fund’s risk-adjusted investment performance and the Fund’s investment performance as compared to peer funds, as appropriate, as well as portfolio attribution information and commentary on the effect of market conditions. The Board also considered information provided by ISS showing the investment performance of the Fund as compared to peer funds. In addition, the Board reviewed the methodology used by ISS to construct the group of peer funds for comparative purposes.
The Board also took into account its discussions with senior management at New York Life Investments concerning the Fund’s investment performance over various periods as well as discussions between the Fund’s portfolio management team and the members of the Board’s Investment Committee, which generally occur on an annual basis. In addition, the Board considered any specific actions that New York Life Investments or CBRE had taken, or had agreed to take, to seek to enhance Fund investment performance and the results of those actions.
Based on these considerations, among others, the Board concluded that its review of the Fund’s investment performance and related information supported a determination to approve the continuation of each of the Advisory Agreements.
Costs of the Services Provided, and Profits and Other Benefits Realized, by New York Life Investments and CBRE
The Board considered the costs of the services provided under each of the Advisory Agreements. The Board also considered the profits realized by New York Life Investments and its affiliates due to their relationships with the Fund as well as the MainStay Group of Funds. With respect to the profitability of CBRE’s relationship with the Fund, the Board considered information from New York Life Investments that CBRE’s subadvisory fee reflected an arm’s-length negotiation and that this fee is paid by New York Life Investments, not the Fund, and the relevance of CBRE’s profitability was considered by the Trustees in that context. On this basis, the Board primarily considered the costs and profitability for New York Life Investments and its affiliates with respect to the Fund.
In addition, the Board acknowledged the difficulty in obtaining reliable comparative data about mutual fund managers’ profitability because such information generally is not publicly available and may be impacted by numerous factors, including the structure of a fund manager’s organization, the types of funds it manages, the methodology used to allocate certain fixed costs to specific funds and the manager’s capital structure and costs of capital.
In evaluating the costs of the services provided by New York Life Investments and CBRE and profits realized by New York Life Investments and its affiliates and CBRE, the Board considered, among other factors, New York Life Investments’ and its affiliates’ and CBRE’s continuing investments in, or willingness to invest in, personnel and other resources to support and further enhance the management of the Fund, and that New York Life Investments is responsible for paying the subadvisory fee for the Fund. The Board also considered the financial resources of New York Life Investments and CBRE and acknowledged that New York Life Investments and CBRE must be in a position to recruit and retain experienced professional personnel and to maintain a strong financial position for New York Life Investments and CBRE to continue to provide high-quality services to the Fund. The Board recognized that the Fund benefits from the allocation of certain fixed costs among the funds in the MainStay Group of Funds, among other expected benefits resulting from its relationship with New York Life Investments.
The Board considered information regarding New York Life Investments’ methodology for calculating profitability and allocating costs provided by New York Life Investments in connection with the fund profitability analysis presented to the Board. The Board noted it had previously engaged an independent consultant to review the methods used to allocate costs among the funds in the MainStay Group of Funds. The Board also noted that the independent consultant had concluded that New York Life Investments’ methods for allocating costs and procedures for estimating overall profitability of the relationship with the funds in the MainStay Group of Funds are reasonable and that New York Life Investments continued to use the same method of calculating profit and allocating costs since the independent consultant’s review. The Board recognized the difficulty in calculating and evaluating a manager’s profitability with respect to the Fund and considered that other profitability methodologies may also be reasonable.
The Board also considered certain fall-out benefits that may be realized by New York Life Investments and its affiliates and CBRE and its affiliates due to their relationships with the Fund, including reputational and other indirect benefits. The Board recognized, for example, the benefits to CBRE from legally permitted “soft-dollar” arrangements by which brokers provide research and other services to CBRE in exchange for commissions paid by the Fund with respect to trades in the Fund’s portfolio securities. In this regard, the Board also requested and considered information from New York Life Investments concerning other material business relationships between CBRE and its affiliates and New York Life Investments and its affiliates and considered the existence of a strategic partnership between New York Life Investments and CBRE that relates to certain current and future products and represents a potential conflict of interest associated with New York Life Investments’ recommendation to approve the Subadvisory Agreement. In addition, the Board considered its review of the management agreement for a money market fund advised by New York Life Investments and an affiliated subadvisor that serves as an investment option for the Fund, including the potential rationale for and costs associated with investments in this money market fund by the Fund, if any, and considered information from
| 34 | MainStay CBRE Global Infrastructure Fund |
New York Life Investments that the nature and type of specific investment advisory services provided to this money market fund are distinct from, or in addition to, the investment advisory services provided to the Fund.
The Board observed that, in addition to fees earned by New York Life Investments under the Management Agreement for managing the Fund, New York Life Investments’ affiliates also earn revenues from serving the Fund in various other capacities, including as the Fund’s transfer agent and distributor. The Board considered information about these other revenues and their impact on the profitability of the relationship with the Fund to New York Life Investments and its affiliates. The Board noted that, although it assessed the overall profitability of the relationship with the Fund to New York Life Investments and its affiliates as part of the contract review process, when considering the reasonableness of the fee paid to New York Life Investments under the Management Agreement, the Board considered the profitability of New York Life Investments’ relationship with the Fund on a pre-tax basis and without regard to distribution expenses incurred by New York Life Investments from its own resources.
After evaluating the information deemed relevant by the Trustees, the Board concluded that any profits realized by New York Life Investments and its affiliates due to their relationships with the Fund were not excessive, other expected benefits that may accrue to New York Life Investments and its affiliates are reasonable and other expected benefits that may accrue to CBRE and its affiliates are consistent with those expected for a subadvisor to a mutual fund. With respect to CBRE, the Board considered that any profits realized by CBRE due to its relationship with the Fund are the result of arm’s-length negotiations between New York Life Investments and CBRE, acknowledging that any such profits are based on the subadvisory fee paid to CBRE by New York Life Investments, not the Fund.
Management and Subadvisory Fees and Total Ordinary Operating Expenses
The Board evaluated the reasonableness of the fee paid under each of the Advisory Agreements and the Fund’s total ordinary operating expenses. The Board primarily considered the reasonableness of the management fee paid by the Fund to New York Life Investments because the subadvisory fee paid to CBRE is paid by New York Life Investments, not the Fund. The Board also considered the reasonableness of the subadvisory fee paid by New York Life Investments and the amount of the management fee retained by New York Life Investments.
In assessing the reasonableness of the Fund’s fees and expenses, the Board primarily considered comparative data provided by ISS on the fees and expenses charged by similar mutual funds managed by other investment advisers. The Board reviewed the methodology used by ISS to construct the group of peer funds for comparative purposes. In addition, the Board considered information provided by New York Life Investments and CBRE on fees charged to other investment advisory clients, including institutional separate accounts and/or other funds that follow investment strategies similar to those of the Fund, if any. The Board considered the
contractual management fee schedules of the Fund as compared to those of such other investment advisory clients, taking into account the rationale for any differences in fee schedules. The Board also took into account information provided by New York Life Investments about the more extensive scope of services provided to registered investment companies, such as the Fund, as compared with other investment advisory clients. Additionally, the Board considered the impact of voluntary waivers and expense limitation arrangements on the Fund’s net management fee and expenses. The Board also considered that in proposing fees for the Fund, New York Life Investments considers the competitive marketplace for mutual funds. The Board considered its discussions with representatives from New York Life Investments regarding the management fee paid by the Fund. The Board noted that New York Life Investments proposed a management fee and subadvisory fee breakpoint for the Fund, effective August 28, 2023.
The Board took into account information from New York Life Investments, as provided in connection with the Board’s June 2022 meeting, regarding the reasonableness of the Fund’s transfer agent fee schedule, including industry data demonstrating that the fees that NYLIM Service Company LLC, an affiliate of New York Life Investments and the Fund’s transfer agent, charges the Fund are within the range of fees charged by transfer agents to other mutual funds. In addition, the Board considered NYLIM Service Company LLC’s profitability in connection with the transfer agent services it provides to the Fund. The Board also took into account information provided by NYLIM Service Company LLC regarding the sub-transfer agency payments it made to intermediaries in connection with the provision of sub-transfer agency services to the Fund.
The Board considered the extent to which transfer agent fees contributed to the total expenses of the Fund. The Board acknowledged the role that the MainStay Group of Funds historically has played in serving the investment needs of New York Life Insurance Company customers, who often maintain smaller account balances than other shareholders of funds, and the impact of small accounts on the expense ratios of Fund share classes. The Board also recognized measures that it and New York Life Investments have taken intended to mitigate the effect of small accounts on the expense ratios of Fund share classes, including through the imposition of an expense limitation on net transfer agency expenses. The Board also considered that NYLIM Service Company LLC had waived its contractual cost of living adjustments during the seven years prior to 2021.
Based on the factors outlined above, among other considerations, the Board concluded that the Fund’s management fee and total ordinary operating expenses are within a range that is competitive and support a conclusion that these fees and expenses are reasonable.
Economies of Scale
The Board considered information regarding economies of scale, including whether economies of scale may exist for the Fund and whether the Fund’s expense structure permits any economies of scale to be appropriately shared with the Fund’s shareholders. The Board also
Board Consideration and Approval of Management Agreement and Subadvisory Agreement (Unaudited) (continued)
considered a report from New York Life Investments, previously prepared at the request of the Board, that addressed economies of scale, including with respect to the mutual fund business generally, and the various ways in which the benefits of economies of scale may be shared with the funds in the MainStay Group of Funds. Although the Board recognized the difficulty of determining economies of scale with precision, the Board acknowledged that economies of scale may be shared with the Fund in a number of ways, including, for example, through the imposition of fee breakpoints, initially setting management fee rates at scale or making additional investments to enhance the services provided to the Fund. The Board reviewed information from New York Life Investments showing how the Fund’s management fee schedule compared to fee schedules of other funds and accounts managed by New York Life Investments. The Board also reviewed information from ISS showing how the Fund’s management fee schedule compared with fees paid for similar services by peer funds at varying asset levels.
Based on this information, the Board concluded that economies of scale are appropriately shared for the benefit of the Fund’s shareholders through the Fund’s expense structure and other methods to share benefits from economies of scale.
Conclusion
On the basis of the information and factors summarized above, among other information and factors deemed relevant by the Trustees, and the evaluation thereof, the Board unanimously voted to approve the continuation of each of the Advisory Agreements.
| 36 | MainStay CBRE Global Infrastructure Fund |
Discussion of the Operation and Effectiveness of the Fund's Liquidity Risk Management Program (Unaudited)
In compliance with Rule 22e-4 under the Investment Company Act of 1940, as amended (the “Liquidity Rule”), the Fund has adopted and implemented a liquidity risk management program (the “Program”), which New York Life Investment Management LLC believes is reasonably designed to assess and manage the Fund's liquidity risk. A Fund's liquidity risk is the risk that the Fund could not meet requests to redeem shares issued by the Fund without significant dilution of the remaining investors’ interests in the Fund. The Board of Trustees of MainStay Funds Trust (the "Board") previously approved the designation of New York Life Investment Management LLC as administrator of the Program (the “Administrator”). The Administrator has established a Liquidity Risk Management Committee to assist the Administrator in the implementation and day-to-day administration of the Program and to otherwise support the Administrator in fulfilling its responsibilities under the Program.
At a meeting of the Board held on February 28, 2023, the Administrator provided the Board with a written report addressing the Program’s operation and assessing the adequacy and effectiveness of its implementation for the period from January 1, 2022, through December 31, 2022 (the "Review Period"), as required under the Liquidity Rule. The report noted that the Administrator concluded that (i) the Program operated effectively to assess and manage the Fund's liquidity risk, (ii) the Program has been and continues to be adequately and effectively implemented to monitor and, as applicable, respond to the Fund's liquidity developments and (iii) the Fund's investment strategy continues to be appropriate for an open-end fund. In addition, the report summarized the operation of the Program and the information and factors considered by the Administrator in its assessment of the Program’s implementation, such as the liquidity risk assessment framework and the liquidity classification methodologies, and discussed notable geopolitical, market and other economic events that impacted liquidity risk during the Review Period.
In accordance with the Program, the Fund's liquidity risk is assessed no less frequently than annually taking into consideration certain factors, as applicable, such as (i) investment strategy and liquidity of portfolio investments, (ii) short-term and long-term cash flow projections, and (iii) holdings of cash and cash equivalents, as well as borrowing arrangements and other funding sources. Certain factors are considered under both normal and reasonably foreseeable stressed conditions.
Each Fund portfolio investment is classified into one of four liquidity categories. The classification is based on a determination of the number of days it is reasonably expected to take to convert the investment into cash, or sell or dispose of the investment, in current market conditions without significantly changing the market value of the investment. The Administrator has delegated liquidity classification determinations to the Fund’s subadvisor, subject to appropriate oversight by the Administrator, and liquidity classification determinations are made by taking into account the Fund's reasonably anticipated trade size, various market, trading and investment-specific considerations, as well as market depth, and, in certain cases, third-party vendor data.
The Liquidity Rule requires funds that do not primarily hold assets that are highly liquid investments to adopt a minimum amount of net assets that must be invested in highly liquid investments that are assets (an “HLIM”). In addition, the Liquidity Rule limits a fund's investments in illiquid investments. Specifically, the Liquidity Rule prohibits acquisition of illiquid investments if, immediately after acquisition, doing so would result in a fund holding more than 15% of its net assets in illiquid investments that are assets. The Program includes provisions reasonably designed to determine, periodically review and comply with the HLIM requirement, as applicable, and to comply with the 15% limit on illiquid investments.
There can be no assurance that the Program will achieve its objectives under all circumstances in the future. Please refer to the Fund's prospectus for more information regarding the Fund's exposure to liquidity risk and other risks to which it may be subject.
Federal Income Tax
Information (Unaudited)
The Fund is required under the Internal Revenue Code to advise shareholders in a written statement as to the federal tax status of dividends paid by the Fund during such fiscal years.
Accordingly, the Fund paid $13,519,686 as long term capital gain distributions.
For the fiscal year ended April 30, 2023, the Fund designated approximately $46,064,895 under the Internal Revenue Code as qualified dividend income eligible for reduced tax rates.
The dividends paid by the Fund during the fiscal year ended April 30, 2023 should be multiplied by 58.51% to arrive at the amount eligible for the corporate dividend-received deduction.
In February 2024, shareholders will receive an IRS Form 1099-DIV or substitute Form 1099, which will show the federal tax status of the distributions received by shareholders in calendar year 2023. The amounts that will be reported on such 1099-DIV or substitute Form 1099 will be the amounts you are to use on your federal income tax return and will differ from the amounts which we must report for the Fund's fiscal year ended April 30, 2023.
Proxy Voting Policies and Procedures and Proxy Voting Record
The Fund is required to file with the SEC its proxy voting record for the 12-month period ending June 30 on Form N-PX. A description of the policies and procedures that are used to vote proxies relating to portfolio securities of the Fund is available free of charge upon request by calling 800-624-6782 or visiting the SEC’s website at www.sec.gov. The most recent Form N-PX or proxy voting record is available free of charge upon request by calling 800-624-6782; visiting newyorklifeinvestments.com; or visiting the SEC’s website at www.sec.gov.
Shareholder Reports and Quarterly Portfolio Disclosure
The Fund is required to file its complete schedule of portfolio holdings with the SEC 60 days after its first and third fiscal quarter on Form N-PORT. The Fund's holdings report is available free of charge upon request by calling New York Life Investments at 800-624-6782.
| 38 | MainStay CBRE Global Infrastructure Fund |
Board of Trustees and Officers (Unaudited)
The Trustees and officers of the Fund are listed below. The Board oversees the MainStay Group of Funds (which consists of MainStay Funds and MainStay Funds Trust), MainStay VP Funds Trust, MainStay MacKay DefinedTerm Municipal Opportunities Fund, MainStay CBRE Global Infrastructure Megatrends Fund, the Manager and the Subadvisors, and elects the officers of the Funds who are responsible for the day-to-day operations of the Fund. Information pertaining to the Trustees and officers is set forth below. Each Trustee serves until his or her successor is elected and qualified or until his or her resignation, death or removal.
Under the Board’s retirement policy, unless an exception is made, a Trustee must tender his or her resignation by the end of the calendar year during which he or she reaches the age of 75. Officers are elected annually by the Board. The business address of each Trustee and officer listed below is 51 Madison Avenue, New York, New York 10010. A majority of the Trustees are not “interested persons” (as defined by the 1940 Act and rules adopted by the SEC thereunder) of the Fund (“Independent Trustees”).
| | Name and
Year of Birth | Term of Office,
Position(s) Held and
Length of Service | Principal Occupation(s)
During Past Five Years | Number of
Portfolios in
Fund Complex
Overseen by
Trustee | Other Directorships
Held by Trustee |
| | | | | | |
| | Naïm Abou-Jaoudé*
1966 | MainStay Funds: Trustee
since June 2023;
MainStay Funds Trust:
Trustee since June 2023 | Chief Executive Officer of New York Life Investment Management LLC since 2023. Previously, Abou-Jaoudé was the Chief Executive Officer of Candriam (an affiliate of New York Life Investment Management LLC) from 2007 to 2023. | 79 | MainStay VP Funds Trust:
Trustee since June 2023 (31 portfolios);
MainStay MacKay DefinedTerm Municipal Opportunities Fund: Trustee
since June 2023;
MainStay CBRE Global Infrastructure Megatrends Fund: Trustee
since June 2023; and
New York Life Investment Management International: Chair since 2015 |
| * | This Trustee is considered to be an “interested person” of the MainStay Group of Funds, MainStay VP Funds Trust, MainStay CBRE Global Infrastructure Megatrends Fund and MainStay MacKay DefinedTerm Municipal Opportunities Fund, within the meaning of the 1940 Act because of his affiliation with New York Life Insurance Company, New York Life Investment Management LLC, Candriam, IndexIQ Advisors LLC, MacKay Shields LLC, NYL Investors LLC, NYLIFE Securities LLC and/or NYLIFE Distributors LLC, as described in detail above in the column entitled “Principal Occupation(s) During Past Five Years.” |
| | |
Board of Trustees and Officers (Unaudited) (continued)
| | Name and
Year of Birth | Term of Office,
Position(s) Held and
Length of Service | Principal Occupation(s)
During Past Five Years | Number of
Portfolios in
Fund Complex
Overseen by
Trustee | Other Directorships
Held by Trustee |
| | | | | | |
| | David H. Chow
1957 | MainStay Funds: Trustee since January 2016, Advisory Board Member (June 2015 to December 2015);MainStay Funds Trust:
Trustee since January 2016, Advisory Board Member (June 2015 to December 2015) | Founder and CEO, DanCourt Management, LLC (since 1999) | 79 | MainStay VP Funds Trust: Trustee since January 2016, Advisory Board Member (June 2015 to December 2015) (31 portfolios);
MainStay MacKay DefinedTerm Municipal Opportunities Fund: Trustee since January 2016, Advisory Board Member (June 2015 to December 2015);
MainStay CBRE Global Infrastructure Megatrends Fund: Trustee since June 2021; VanEck Vectors Group of Exchange-Traded Funds: Trustee since 2006 and Independent Chairman of the Board of Trustees from 2008 to 2022 (57 portfolios); Berea College of Kentucky: Trustee since 2009, Chair of the Investment Committee since 2018 |
| | Karen Hammond
1956 | MainStay Funds: Trustee since December 2021, Advisory Board Member (June 2021 to December 2021);MainStay Funds Trust:
Trustee since December 2021, Advisory Board Member (June 2021 to December 2021)
| Retired, Managing Director, Devonshire Investors (2007 to 2013); Senior Vice President, Fidelity Management & Research Co. (2005 to 2007); Senior Vice President and Corporate Treasurer, FMR Corp. (2003 to 2005); Chief Operating Officer, Fidelity Investments Japan (2001 to 2003) | 79 | MainStay VP Funds Trust: Trustee since December 2021, Advisory Board Member (June 2021 to December 2021) (31 portfolios);
MainStay MacKay DefinedTerm Municipal Opportunities Fund: Trustee since December 2021, Advisory Board Member (June 2021 to December 2021);
MainStay CBRE Global Infrastructure Megatrends Fund: Trustee since December 2021, Advisory Board Member (June 2021 to December 2021);
Two Harbors Investment Corp.: Director since 2018;
Rhode Island State Investment Commission: Member since 2017; and
Blue Cross Blue Shield of Rhode Island: Director since 2019 |
| | Susan B. Kerley
1951 | MainStay Funds: Chairman since January 2017 and Trustee since 2007;MainStay Funds Trust:
Chairman since January 2017 and Trustee since 1990** | President, Strategic Management Advisors LLC (since 1990) | 79 | MainStay VP Funds Trust: Chairman since January 2017 and Trustee since 2007 (31 portfolios)*;
MainStay MacKay DefinedTerm Municipal Opportunities Fund: Chairman since January 2017 and Trustee since 2011;
MainStay CBRE Global Infrastructure Megatrends Fund: Trustee since June 2021; and Legg Mason Partners Funds: Trustee since 1991 (45 portfolios) |
| | Alan R. Latshaw
1951 | MainStay Funds: Trusteesince 2006;MainStay Funds Trust:
Trustee since 2007** | Retired; Partner, Ernst & Young LLP (2002 to 2003); Partner, Arthur Andersen LLP (1989 to 2002); Consultant to the MainStay Funds Audit and Compliance Committee (2004 to 2006) | 79 | MainStay VP Funds Trust: Trustee since 2007 (31 portfolios)*;
MainStay MacKay DefinedTerm Municipal Opportunities Fund: Trustee since 2011; and
MainStay CBRE Global Infrastructure Megatrends Fund: Trustee since June 2021 |
| 40 | MainStay CBRE Global Infrastructure Fund |
| | Name and
Year of Birth | Term of Office,
Position(s) Held and
Length of Service | Principal Occupation(s)
During Past Five Years | Number of
Portfolios in
Fund Complex
Overseen by
Trustee | Other Directorships
Held by Trustee |
| | | | | | |
| | Jacques P. Perold
1958 | MainStay Funds: Trustee since January 2016, Advisory Board Member (June 2015to December 2015);MainStay Funds Trust:
Trustee since January 2016, Advisory Board Member (June 2015 to December 2015) | Founder and Chief Executive Officer, CapShift Advisors LLC (since 2018); President, Fidelity Management & Research Company (2009 to 2014); President and Chief Investment Officer, Geode Capital Management, LLC (2001 to 2009) | 79 | MainStay VP Funds Trust: Trustee since January 2016, Advisory Board Member (June 2015 to December 2015) (31 portfolios);
MainStay MacKay DefinedTerm Municipal Opportunities Fund: Trustee since January 2016, Advisory Board Member (June 2015 to December 2015);
MainStay CBRE Global Infrastructure Megatrends Fund: Trustee since June 2021; Allstate Corporation: Director since 2015; and MSCI Inc.: Director since 2017 |
| | Richard S. Trutanic
1952 | MainStay Funds: Trustee since 1994;MainStay Funds Trust:
Trustee since 2007** | Chairman and Chief Executive Officer, Somerset & Company (financial advisory firm) (since 2004); Managing Director, The Carlyle Group (private investment firm) (2002 to 2004); Senior Managing Director, Partner and Board Member, Groupe Arnault S.A. (private investment firm) (1999 to 2002) | 79 | MainStay VP Funds Trust: Trustee since 2007 (31 portfolios)*;
MainStay MacKay DefinedTerm Municipal Opportunities Fund: Trustee since 2011; and MainStay CBRE Global Infrastructure Megatrends Fund: Trustee since June 2021 |
| * | Includes prior service as a Director of MainStay VP Series Fund, Inc., the predecessor to MainStay VP Funds Trust. |
| ** | Includes prior service as a Director/Trustee of certain predecessor entities to MainStay Funds Trust. |
Board of Trustees and Officers (Unaudited) (continued)
| | Name and
Year of Birth | Position(s) Held and
Length of Service | Principal Occupation(s)
During Past Five Years | |
| | | | | |
| | Kirk C. Lehneis
1974 | President, MainStay Funds, MainStay Funds Trust (since 2017) | Chief Operating Officer and Senior Managing Director (since 2016), New York Life Investment Management LLC and New York Life Investment Management Holdings LLC; Member of the Board of Managers (since 2017) and Senior Managing Director (since 2018), NYLIFE Distributors LLC; Chairman of the Board and Senior Managing Director, NYLIM Service Company LLC (since 2017); Trustee, President and Principal Executive Officer of IndexIQ Trust, IndexIQ ETF Trust and IndexIQ Active ETF Trust (since January 2018); President, MainStay CBRE Global Infrastructure Megatrends Fund (since 2021), MainStay MacKay DefinedTerm Municipal Opportunities Fund and MainStay VP Funds Trust (since 2017); Senior Managing Director, Global Product Development (2015-2016); Managing Director, Product Development (2010 to 2015), New York Life Investment Management LLC | |
| | Jack R. Benintende
1964 | Treasurer and Principal Financial and Accounting Officer, MainStay Funds (since 2007), MainStay Funds Trust (since 2009) | Managing Director, New York Life Investment Management LLC (since 2007); Treasurer and Principal Financial and Accounting Officer, MainStay CBRE Global Infrastructure Megatrends Fund (since 2021), MainStay MacKay DefinedTerm Municipal Opportunities Fund (since 2011) and MainStay VP Funds Trust (since 2007)**; and Assistant Treasurer, New York Life Investment Management Holdings LLC (2008 to 2012) | |
| | J. Kevin Gao
1967 | Secretary and Chief Legal Officer, MainStay Funds and MainStay Funds Trust (since 2010) | Managing Director and Associate General Counsel, New York Life Investment Management LLC (since 2010); Secretary and Chief Legal Officer, MainStay CBRE Global Infrastructure Megatrends Fund (since 2021), MainStay MacKay DefinedTerm Municipal Opportunities Fund (since 2011) and MainStay VP Funds Trust (since 2010)** | |
| | Scott T. Harrington
1959 | Vice President— Administration, MainStay Funds (since 2005), MainStay Funds Trust (since 2009) | Managing Director, New York Life Investment Management LLC (including predecessor advisory organizations) (since 2000); Member of the Board of Directors, New York Life Trust Company (since 2009); Vice President—Administration, MainStay CBRE Global Infrastructure Megatrends Fund (since 2021), MainStay MacKay DefinedTerm Municipal Opportunities Fund (since 2011) and MainStay VP Funds Trust (since 2005)** | |
| | Kevin M. Gleason
1967 | Vice President and Chief Compliance Officer, MainStay Funds and MainStay Funds Trust (since June 2022) | Vice President and Chief Compliance Officer, IndexIQ Trust, IndexIQ ETF Trust and Index IQ Active ETF Trust (since June 2022); Vice President and Chief Compliance Officer, MainStay CBRE Global Infrastructure Megatrends Fund, MainStay VP Funds Trust and MainStay MacKay DefinedTerm Municipal Opportunities Fund (since June 2022); Senior Vice President, Voya Investment Management and Chief Compliance Officer, Voya Family of Funds (2012-2022) | |
| * | The officers listed above are considered to be “interested persons” of the MainStay Group of Funds, MainStay VP Funds Trust, MainStay CBRE Global Infrastructure Megatrends Fund and MainStay MacKay DefinedTerm Municipal Opportunities Fund within the meaning of the 1940 Act because of their affiliation with the MainStay Group of Funds, New York Life Insurance Company and/or its affiliates, including New York Life Investment Management LLC, New York Life Insurance Company, NYLIM Service Company LLC, NYLIFE Securities LLC and/or NYLIFE Distributors LLC, as described in detail in the column captioned “Principal Occupation(s) During Past Five Years.” Officers are elected annually by the Board. |
| ** | Includes prior service as an Officer of MainStay VP Series Fund, Inc., the predecessor to MainStay VP Funds Trust. |
Officers of the Trust (Who are not Trustees)*
| 42 | MainStay CBRE Global Infrastructure Fund |
Equity
U.S. Equity
MainStay Epoch U.S. Equity Yield Fund
MainStay Fiera SMID Growth Fund
MainStay S&P 500 Index Fund
MainStay Winslow Large Cap Growth Fund
MainStay WMC Enduring Capital Fund
MainStay WMC Growth Fund
MainStay WMC Small Companies Fund
MainStay WMC Value Fund
International Equity
MainStay Epoch International Choice Fund
MainStay MacKay International Equity Fund
MainStay WMC International Research Equity Fund
Emerging Markets Equity
MainStay Candriam Emerging Markets Equity Fund
Global Equity
MainStay Epoch Capital Growth Fund
MainStay Epoch Global Equity Yield Fund
Fixed Income
Taxable Income
MainStay Candriam Emerging Markets Debt Fund
MainStay Floating Rate Fund
MainStay MacKay High Yield Corporate Bond Fund
MainStay MacKay Short Duration High Yield Fund
MainStay MacKay Strategic Bond Fund
MainStay MacKay Total Return Bond Fund
MainStay MacKay U.S. Infrastructure Bond Fund
MainStay Short Term Bond Fund
Tax-Exempt Income
MainStay MacKay California Tax Free Opportunities Fund1
MainStay MacKay High Yield Municipal Bond Fund
MainStay MacKay New York Tax Free Opportunities Fund2
MainStay MacKay Short Term Municipal Fund
MainStay MacKay Strategic Municipal Allocation Fund
MainStay MacKay Tax Free Bond Fund
Money Market
MainStay Money Market Fund
Mixed Asset
MainStay Balanced Fund
MainStay Income Builder Fund
MainStay MacKay Convertible Fund
Speciality
MainStay CBRE Global Infrastructure Fund
MainStay CBRE Real Estate Fund
MainStay Cushing MLP Premier Fund
Asset Allocation
MainStay Conservative Allocation Fund
MainStay Conservative ETF Allocation Fund
MainStay Defensive ETF Allocation Fund
MainStay Equity Allocation Fund
MainStay Equity ETF Allocation Fund
MainStay ESG Multi-Asset Allocation Fund
MainStay Growth Allocation Fund
MainStay Growth ETF Allocation Fund
MainStay Moderate Allocation Fund
MainStay Moderate ETF Allocation Fund
Manager
New York Life Investment Management LLC
New York, New York
Subadvisors
Candriam3
Strassen, Luxembourg
CBRE Investment Management Listed Real Assets LLC
Radnor, Pennsylvania
Cushing Asset Management, LP
Dallas, Texas
Epoch Investment Partners, Inc.
New York, New York
Fiera Capital Inc.
New York, New York
IndexIQ Advisors LLC3
New York, New York
MacKay Shields LLC3
New York, New York
NYL Investors LLC3
New York, New York
Wellington Management Company LLP
Boston, Massachusetts
Winslow Capital Management, LLC
Minneapolis, Minnesota
Legal Counsel
Dechert LLP
Washington, District of Columbia
Independent Registered Public Accounting Firm
KPMG LLP
Philadelphia, Pennsylvania
Distributor
NYLIFE Distributors LLC3
Jersey City, New Jersey
Custodian
JPMorgan Chase Bank, N.A.
New York, New York
1.
This Fund is registered for sale in AZ, CA, NV, OR, TX, UT, WA and MI (Class A and Class I shares only), and CO, FL, GA, HI, ID, MA, MD, NH, NJ and NY (Class I shares only).
| 2. | This Fund is registered for sale in CA, CT, DE, FL, MA, NJ, NY and VT. |
| 3. | An affiliate of New York Life Investment Management LLC. |
Not part of the Annual Report
For more information
800-624-6782
newyorklifeinvestments.com
“New York Life Investments” is both a service mark, and the common trade name, of certain investment advisors affiliated with New York Life Insurance Company. The MainStay Funds® are managed by New York Life Investment Management LLC and distributed by NYLIFE Distributors LLC, 30 Hudson Street, Jersey City, NJ 07302, a wholly owned subsidiary of New York Life Insurance Company. NYLIFE Distributors LLC is a Member FINRA/SIPC.
©2023 NYLIFE Distributors LLC. All rights reserved.
| 5022125MS043-23 | MSCBGI11-06/23 |
(NYLIM) NL479
MainStay CBRE Real Estate Fund
Message from the President and Annual Report
April 30, 2023
Sign up for e-delivery of your shareholder reports. For full details on e-delivery, including who can participate and what you can receive via e-delivery,
please log in to newyorklifeinvestments.com/accounts.
| Not FDIC/NCUA Insured | Not a Deposit | May Lose Value | No Bank Guarantee | Not Insured by Any Government Agency |
This page intentionally left blank
Message from the President
Despite high levels of volatility and sharp, short-term shifts in value, broadly based stock and bond indices saw relatively modest overall changes during the 12-month reporting period ended April 30, 2023. A deeply challenging investment environment during the last eight months of 2022, driven by increasing inflationary pressures and aggressive monetary efforts to curb them, was followed by a more positive, but uneven, economic and monetary backdrop during the first four months of 2023.
In April 2022, before the start of the reporting period, U.S. inflation stood at an annualized rate of 8.3%, up from 4.2% a year earlier. The U.S. Federal Reserve (the “Fed”), had begun to take steps to curb inflation, raising the federal funds rate from near zero in March 2022. Eight separate rate hikes during the reporting period brought the benchmark rate up to 4.75–5.00% in March 2023. Inflation seemed to respond, easing steadily from a peak of 9.1% in June 2022 to 4.9% in April 2023. Although further interest rate increases are expected in 2023, by the end of the reporting period, it appeared that the Fed might be nearing the end of the current rate-hike cycle. Economic growth, although slower, remained positive, supported by historically high levels of employment and robust consumer spending. International economies experienced similar trends, with more modest central bank interest-rate hikes curbing inflation to a degree.
Equity market behavior during the reporting period reflected the arc of monetary policy and economic developments. From May through early October 2022, as inflation raged and interest-rate increases accelerated, investors shied away from perceived risk, favoring relatively defensive and value-oriented sectors over growth-oriented sectors. The S&P 500® Index, a widely regarded benchmark of U.S. market performance, declined by more than 13% during this time, while international stocks suffered even sharper losses. These trends reversed from mid-October 2022 through the end of the reporting period, as inflationary pressures eased and markets began to anticipate an end to rising interest rates. Between mid-October 2022 and April 30, 2023, the S&P 500® Index regained all the ground it lost earlier, ending in modestly positive territory. International developed-markets stocks bounced back even stronger, prompted by surprisingly robust economic resilience in Europe and further bolstered by China’s
reopening after the government rescinded its “zero-COVID-19” policy and eased regulatory restrictions on key industries. The declining value of the U.S. dollar relative to other currencies also enhanced international market equity performance. Emerging markets generally lagged their developed-markets counterparts while outperforming U.S. markets.
Fixed-income markets followed a similar pattern of retreat and recovery. Bond prices trended sharply downward early in the reporting period, as yields rose along with interest rates. Short-term yields rose faster than long-term yields, producing a yield curve inversion—with long-term rates lower than short-term rates—that persisted from July through the end of the reporting period. However, market sentiment improved in the second half of the reporting period as inflationary pressures eased. As the Fed decreased the magnitude of rate increases, focus turned toward the possibility of eventual rate reductions and a potential ‘soft landing’ for the economy. On the negative side, a small number of high-profile, regional U.S. bank failures in March and April 2023 raised fears of possible wider banking industry contagion and future credit constraints.
While many market observers believe the Fed has neared the end of the current cycle of rate increases, the central bank’s rhetoric remains sharply focused on its target inflation rate of 2%. Only time will tell if the market’s favorable expectations prove well founded.
However the economic story unfolds in the months and years to come, we remain dedicated to providing you with the one-on-one philosophy and diversified, multi-boutique investment resources that set New York Life Investments apart. Thank you for trusting us to help you meet your investment needs.
Sincerely,
Kirk C. Lehneis
President
The opinions expressed are as of the date of this report and are subject to change. There is no guarantee that any forecast made will come to pass. This material does not constitute investment advice and is not intended as an endorsement of any specific investment. Past performance is no guarantee of future results.
Not part of the Annual Report
Investors should refer to the Fund’s Summary Prospectus and/or Prospectus and consider the Fund’s investment objectives, strategies, risks, charges and expenses carefully before investing. The Summary Prospectus and/or Prospectus contain this and other information about the Fund. You may obtain copies of the Fund’s Summary Prospectus, Prospectus and Statement of Additional Information, which includes information about the MainStay Funds Trust's Trustees, free of charge, upon request, by calling toll-free 800-624-6782, by writing to NYLIFE Distributors LLC, Attn: MainStay Marketing Department, 30 Hudson Street, Jersey City, NJ 07302 or by sending an e-mail to MainStayShareholderServices@nylim.com. These documents are also available via the MainStay Funds’ website at newyorklifeinvestments.com. Please read the Fund’s Summary Prospectus and/or Prospectus carefully before investing.
Investment and Performance Comparison (Unaudited)
Performance data quoted represents past performance. Past performance is no guarantee of future results. Because of market volatility and other factors, current performance may be lower or higher than the figures shown. Investment return and principal value will fluctuate, and as a result, when shares are redeemed, they may be worth more or less than their original cost. The graph below depicts the historical performance of Class I shares of the Fund. Performance will vary from class to class based on differences in class-specific expenses and sales charges. For performance information current to the most recent month-end, please call 800-624-6782 or visit newyorklifeinvestments.com.
The performance table and graph do not reflect the deduction of taxes that a shareholder would pay on distributions or Fund share redemptions. Total returns reflect maximum applicable sales charges as indicated in the table below, if any, changes in share price, and reinvestment of dividend and capital gain distributions. The graph assumes the initial investment amount shown below and reflects the deduction of all sales charges that would have applied for the period of investment. Performance figures may reflect certain fee waivers and/or expense limitations, without which total returns may have been lower. For more information on share classes and current fee waivers and/or expense limitations (if any), please refer to the Notes to Financial Statements.

| Average Annual Total Returns for the Year-Ended April 30, 2023 |
| Class | Sales Charge | | Inception
Date1 | One
Year | Five
Years | Ten Years
or Since
Inception | Gross
Expense
Ratio2 |
| Class A Shares3 | Maximum 5.50% Initial Sales Charge | With sales charges | 12/20/2002 | -21.51% | 4.65% | 4.31% | 1.30% |
| | | Excluding sales charges | | -16.94 | 5.90 | 4.93 | 1.30 |
| Investor Class Shares4 | Maximum 5.00% Initial Sales Charge | With sales charges | 2/24/2020 | -21.15 | N/A | -1.97 | 1.26 |
| | | Excluding sales charges | | -17.00 | N/A | -0.21 | 1.26 |
| Class C Shares3 | Maximum 1.00% CDSC | With sales charges | 1/17/2003 | -18.20 | 5.11 | 4.10 | 2.01 |
| | If Redeemed Within One Year of Purchase | Excluding sales charges | | -17.58 | 5.11 | 4.10 | 2.01 |
| Class I Shares3 | No Sales Charge | | 12/31/1996 | -16.68 | 6.27 | 5.24 | 1.05 |
| Class R3 Shares3 | No Sales Charge | | 8/5/2011 | -17.18 | 5.64 | 4.67 | 1.65 |
| Class R6 Shares3 | No Sales Charge | | 7/3/2014 | -16.52 | 6.37 | 5.41 | 0.84 |
| 1. | Effective at the close of business on February 21, 2020, the Fund changed its fiscal and tax year end from October 31 to April 30. |
| 2. | The gross expense ratios presented reflect the Fund’s “Total Annual Fund Operating Expenses” from the most recent Prospectus, as supplemented, and may differ from other expense ratios disclosed in this report. |
| 3. | Performance figures for Class A shares, Class C shares, Class I shares, Class R3 shares and Class R6 shares, reflect the historical performance of the then-existing Class A shares, Class C shares, Class I shares, Class R and Class R6 shares of the Voya Real Estate Fund (the predecessor to the Fund, which was subject to a different fee structure) for periods prior to February 21, 2020. |
| 4. | Prior to June 30, 2020, the maximum initial sales charge for Investor Class shares was 5.50%, which is reflected in the average annual total return figures shown. |
The footnotes on the next page are an integral part of the table and graph and should be carefully read in conjunction with them.
| Benchmark Performance* | One
Year | Five
Years | Ten
Years |
| FTSE NAREIT All Equity REITs Index1 | -16.09% | 6.20% | 5.83% |
| CBRE Real Estate Tiered Index2 | -16.09 | 5.20 | 4.99 |
| MSCI U.S. REIT® Index3 | -14.70 | 5.89 | 5.34 |
| Morningstar Real Estate Category Average4 | -15.73 | 4.81 | 4.76 |
| * | Returns for indices reflect no deductions for fees, expenses or taxes, except for foreign withholding taxes where applicable. Results assume reinvestment of all dividends and capital gains. An investment cannot be made directly in an index. |
| 1. | The Fund has selected the FTSE NAREIT All Equity REITs Index as its primary benchmark. The FTSE NAREIT All Equity REITs Index is a free-float adjusted, market capitalization-weighted index of U.S. equity REITs. Constituents of the index include all tax-qualified REITs with more than 50 percent of total assets in qualifying real estate assets other than mortgages secured by real property. |
| 2. | The Fund has selected a tiered benchmark as its secondary benchmark. The returns for the tiered benchmark represent the returns of the MSCI U.S. REIT® Index prior to January 1, 2021 and the returns of the FTSE NAREIT All Equity REITs Index thereafter. |
| 3. | The MSCI U.S. REIT® Index is a free float-adjusted market capitalization weighted index that is comprised of equity REITs. The MSCI U.S. REIT® Index is based on the MSCI USA Investable Market Index, its parent index, which captures the large, mid and small cap segments of the U.S. market. |
| 4. | The Morningstar Real Estate Category Average is representative of funds that invest primarily in real estate investment trusts of various types. REITs are companies that develop and manage real estate properties. There are several different types of REITs, including apartment, factory-outlet, healthcare, hotel, industrial, mortgage, office, and shopping center REITs. Some funds in this category also invest in real estate operating companies. Results are based on average total returns of similar funds with all dividends and capital gain distributions reinvested. |
The footnotes on the preceding page are an integral part of the table and graph and should be carefully read in conjunction with them.
| 6 | MainStay CBRE Real Estate Fund |
Cost in Dollars of a $1,000 Investment in MainStay CBRE Real Estate Fund (Unaudited)
The example below is intended to describe the fees and expenses borne by shareholders during the six-month period from November 1, 2022 to April 30, 2023, and the impact of those costs on your investment.
Example
As a shareholder of the Fund you incur two types of costs: (1) transaction costs, including exchange fees and sales charges (loads) on purchases (as applicable), and (2) ongoing costs, including management fees, distribution and/or service (12b-1) fees and other Fund expenses (as applicable). This example is intended to help you understand your ongoing costs (in dollars) of investing in the Fund and to compare these costs with the ongoing costs of investing in other mutual funds. The example is based on an investment of $1,000 made at the beginning of the six-month period and held for the entire period from November 1, 2022 to April 30, 2023.
This example illustrates your Fund’s ongoing costs in two ways:
Actual Expenses
The second and third data columns in the table below provide information about actual account values and actual expenses. You may use the information in these columns, together with the amount you invested, to estimate the expenses that you paid during the six months ended April 30, 2023. Simply divide your account value by $1,000 (for example, an
$8,600 account value divided by $1,000 = 8.6), then multiply the result by the number under the heading entitled “Expenses Paid During Period” to estimate the expenses you paid on your account during this period.
Hypothetical Example for Comparison Purposes
The fourth and fifth data columns in the table below provide information about hypothetical account values and hypothetical expenses based on the Fund’s actual expense ratio and an assumed rate of return of 5% per year before expenses, which is not the Fund’s actual return. The hypothetical account values and expenses may not be used to estimate the actual ending account balances or expenses you paid for the six-month period shown. You may use this information to compare the ongoing costs of investing in the Fund with the ongoing costs of investing in other mutual funds. To do so, compare this 5% hypothetical example with the 5% hypothetical examples that appear in the shareholder reports of the other mutual funds.
Please note that the expenses shown in the table are meant to highlight your ongoing costs only and do not reflect any transactional costs, such as exchange fees or sales charges (loads). Therefore, the fourth and fifth data columns of the table are useful in comparing ongoing costs only and will not help you determine the relative total costs of owning different funds. In addition, if these transactional costs were included, your costs would have been higher.
| Share Class | Beginning
Account
Value
11/1/22 | Ending Account
Value (Based
on Actual
Returns and
Expenses)
4/30/23 | Expenses
Paid
During
Period1 | Ending Account
Value (Based
on Hypothetical
5% Annualized
Return and
Actual Expenses)
4/30/23 | Expenses
Paid
During
Period1 | Net Expense
Ratio
During
Period2 |
| Class A Shares | $1,000.00 | $1,030.40 | $5.94 | $1,018.94 | $5.91 | 1.18% |
| Investor Class Shares | $1,000.00 | $1,030.20 | $6.14 | $1,018.75 | $6.11 | 1.22% |
| Class C Shares | $1,000.00 | $1,025.90 | $9.69 | $1,015.22 | $9.64 | 1.93% |
| Class I Shares | $1,000.00 | $1,032.00 | $4.18 | $1,020.68 | $4.16 | 0.83% |
| Class R3 Shares | $1,000.00 | $1,029.40 | $7.20 | $1,017.70 | $7.15 | 1.43% |
| Class R6 Shares | $1,000.00 | $1,033.50 | $3.73 | $1,021.13 | $3.71 | 0.74% |
| 1. | Expenses are equal to the Fund’s annualized expense ratio of each class multiplied by the average account value over the period, divided by 365 and multiplied by 181 (to reflect the six-month period). The table above represents the actual expenses incurred during the six-month period. In addition to the fees and expenses which the Fund bears directly, it also indirectly bears a pro rata share of the fees and expenses of the underlying funds in which it invests. Such indirect expenses are not included in the above-reported expense figures. |
| 2. | Expenses are equal to the Fund's annualized expense ratio to reflect the six-month period. |
Sector Composition as of April 30, 2023 (Unaudited)
| Residential | 19.3% |
| Industrial Properties | 12.8 |
| Technology Towers | 12.7 |
| Healthcare Facilities | 11.8 |
| Self Storage Property | 11.1 |
| Technology Datacenters | 10.1 |
| Net Lease Properties | 9.1 |
| Enclosed Malls | 5.3% |
| Hotels | 4.2 |
| Community Shopping Centers | 3.1 |
| Short–Term Investments | 0.2 |
| Other Assets, Less Liabilities | 0.3 |
| | 100.0% |
See Portfolio of Investments beginning on page 10 for specific holdings within these categories. The Fund's holdings are subject to change.
Top Ten Holdings and/or Issuers Held as of April 30, 2023 (excluding short-term investments) (Unaudited)
| 1. | Prologis, Inc. |
| 2. | Equinix, Inc. |
| 3. | American Tower Corp. |
| 4. | Crown Castle, Inc. |
| 5. | Simon Property Group, Inc. |
| 6. | Sun Communities, Inc. |
| 7. | Welltower, Inc. |
| 8. | CubeSmart |
| 9. | Alexandria Real Estate Equities, Inc. |
| 10. | Life Storage, Inc. |
| 8 | MainStay CBRE Real Estate Fund |
Portfolio Management Discussion and Analysis (Unaudited)
Questions answered by portfolio managers Joseph P. Smith, CFA, Jonathan Miniman, CFA, and Kenneth S. Weinberg, CFA, of CBRE Investment Management Listed Real Assets LLC.
How did MainStay CBRE Real Estate Fund perform relative to its benchmarks and peer group during the 12 months ended April 30, 2023?
For the 12 months ended April 30, 2023, Class I shares of MainStay CBRE Real Estate Fund returned −16.68%, underperforming the −16.09% return of the Fund’s primary benchmark, the FTSE Nareit All Equity REITs Index; the −16.09% return of the CBRE Real Estate Tiered Index, which is the Fund’s secondary benchmark; and the −14.70% return of MSCI U.S. REIT® Index, which is an additional benchmark of the Fund. Over the same period, Class I shares also underperformed the −15.73% return of the Morningstar Real Estate Category Average.1
What factors affected the Fund’s relative performance during the reporting period?
During the reporting period, the Fund’s performance relative to the FTSE Nareit All Equity REITs Index suffered due to disappointing stock selections, partly balanced by positive contributions from sector allocation. (Contributions take weightings and total returns into account.)
During the reporting period, which sectors were the strongest positive contributors to the Fund’s relative performance and which sectors were particularly weak?
The strongest positive contributions to the Fund’s relative performance from a sector allocation perspective came from office properties, industrial properties and towers. The weakest relative contributors to performance included net lease properties, residential properties and shopping centers.
During the reporting period, which individual stocks made the strongest positive contributions to the Fund’s absolute performance and which stocks detracted the most?
The strongest positive contributors to the Fund’s absolute performance during the reporting period included positions in Life Storage (storage) and CubeSmart Storage (storage). The Fund’s weakest-performing holdings included Piedmont Office (office), Tricon Residential (residential) and Park Hotels & Resorts (hotel & motel).
What were some of the Fund’s largest purchases and sales during the reporting period?
The Fund’s largest purchases during the reporting period included shares in health care facilities REIT HealthPeak Properties, which benefited from a combination of improving growth and reasonable
relative value; and life science REIT Alexandria Real Estate Equities, which gained ground on accelerating revenues and an improving profit outlook. The Fund’s largest sales during the same period included holdings in retail REIT Realty Income and tower REIT Crown Castle. Both sales reflected the stocks’ rich valuations in the wake of strong relative performance.
How did the Fund’s sector weightings change during the reporting period?
During the reporting period, the Fund increased its exposure most substantially to the health care and data center sectors; these are areas where we see attractive relative valuations combined with accelerating earnings potential. During the same period, the Fund reduced its exposure most substantially to the net lease sector, due to prior outperformance, overvaluation and moderating earnings growth outlooks. The Fund also reduced its exposure to the office sector, as a result of deteriorating fundamentals with no near-term sense of market stabilization.
How was the Fund positioned at the end of the reporting period?
As of April 30, 2023, the Fund held overweight positions relative to the FTSE Nareit All Equity REITs Index in the residential, storage and data centers sectors. As of the same date, the Fund held relatively underweight positions in the net lease, office and timber sectors.
| 1. | See "Investment and Performance Comparison" for other share class returns, which may be higher or lower than Class I share returns, and for more information on benchmark and peer group returns. |
The opinions expressed are those of the portfolio managers as of the date of this report and are subject to change. There is no guarantee that any forecasts will come to pass. This material does not constitute investment advice and is not intended as an endorsement of any specific investment.
Portfolio of Investments April 30, 2023†^
| | Shares | Value |
| Common Stocks 99.5% |
| Community Shopping Centers 3.1% |
| Brixmor Property Group, Inc. | 114,568 | $ 2,443,736 |
| Kite Realty Group Trust | 78,710 | 1,630,871 |
| Regency Centers Corp. | 59,416 | 3,649,925 |
| Retail Opportunity Investments Corp. | 129,768 | 1,690,877 |
| | | 9,415,409 |
| Enclosed Malls 5.3% |
| Macerich Co. (The) | 207,283 | 2,070,757 |
| Simon Property Group, Inc. | 126,826 | 14,371,922 |
| | | 16,442,679 |
| Healthcare Facilities 11.8% |
| Alexandria Real Estate Equities, Inc. | 94,839 | 11,777,107 |
| Healthpeak Properties, Inc. | 342,642 | 7,527,845 |
| Ventas, Inc. | 86,876 | 4,174,392 |
| Welltower, Inc. | 162,798 | 12,896,857 |
| | | 36,376,201 |
| Hotels 4.2% |
| DiamondRock Hospitality Co. | 420,020 | 3,406,362 |
| Hilton Worldwide Holdings, Inc. | 21,241 | 3,059,129 |
| Park Hotels & Resorts, Inc. | 314,986 | 3,795,581 |
| Sunstone Hotel Investors, Inc. | 289,886 | 2,762,614 |
| | | 13,023,686 |
| Industrial Properties 12.8% |
| Americold Realty Trust, Inc. | 137,999 | 4,083,390 |
| Prologis, Inc. | 214,685 | 26,889,296 |
| Rexford Industrial Realty, Inc. | 151,663 | 8,458,246 |
| | | 39,430,932 |
| Net Lease Properties 9.1% |
| Broadstone Net Lease, Inc. | 284,804 | 4,605,281 |
| EPR Properties | 69,002 | 2,895,324 |
| Four Corners Property Trust, Inc. | 117,307 | 2,992,502 |
| NETSTREIT Corp. | 246,241 | 4,486,511 |
| Spirit Realty Capital, Inc. | 113,286 | 4,356,979 |
| VICI Properties, Inc. | 260,878 | 8,854,199 |
| | | 28,190,796 |
| Residential 19.3% |
| Apartment Income REIT Corp. | 179,269 | 6,629,368 |
| Camden Property Trust | 70,009 | 7,704,490 |
| Essex Property Trust, Inc. | 27,005 | 5,933,809 |
| Independence Realty Trust, Inc. | 248,821 | 4,142,870 |
| | Shares | | Value |
| |
| Residential (continued) |
| Invitation Homes, Inc. | 220,819 | | $ 7,368,730 |
| NexPoint Residential Trust, Inc. | 46,585 | | 1,999,894 |
| Sun Communities, Inc. | 95,099 | | 13,212,104 |
| Tricon Residential, Inc. | 462,476 | | 3,713,682 |
| UDR, Inc. | 161,611 | | 6,679,383 |
| Veris Residential, Inc. (a) | 138,844 | | 2,270,099 |
| | | | 59,654,429 |
| Self Storage Property 11.1% |
| CubeSmart | 279,787 | | 12,727,510 |
| Life Storage, Inc. | 79,734 | | 10,714,655 |
| Public Storage | 36,237 | | 10,683,755 |
| | | | 34,125,920 |
| Technology Datacenters 10.1% |
| Digital Realty Trust, Inc. | 57,040 | | 5,655,516 |
| Equinix, Inc. | 35,348 | | 25,594,780 |
| | | | 31,250,296 |
| Technology Towers 12.7% |
| American Tower Corp. | 98,906 | | 20,215,397 |
| Crown Castle, Inc. | 154,639 | | 19,034,515 |
| | | | 39,249,912 |
Total Common Stocks
(Cost $285,826,653) | | | 307,160,260 |
| Short-Term Investment 0.2% |
| Affiliated Investment Company 0.2% |
| MainStay U.S. Government Liquidity Fund, 3.98% (b) | 474,344 | | 474,344 |
Total Short-Term Investment
(Cost $474,344) | | | 474,344 |
Total Investments
(Cost $286,300,997) | 99.7% | | 307,634,604 |
| Other Assets, Less Liabilities | 0.3 | | 1,074,285 |
| Net Assets | 100.0% | | $ 308,708,889 |
| † | Percentages indicated are based on Fund net assets. |
| ^ | Industry classifications may be different than those used for compliance monitoring purposes. |
| (a) | Non-income producing security. |
| (b) | Current yield as of April 30, 2023. |
The notes to the financial statements are an integral part of, and should be read in conjunction with, the financial statements.
| 10 | MainStay CBRE Real Estate Fund |
Investments in Affiliates (in 000's)
Investments in issuers considered to be affiliate(s) of the Fund during the year ended April 30, 2023 for purposes of Section 2(a)(3) of the Investment Company Act of 1940, as amended, were as follows:
| Affiliated Investment Companies | Value,
Beginning
of Year | Purchases
at Cost | Proceeds
from
Sales | Net
Realized
Gain/(Loss)
on Sales | Change in
Unrealized
Appreciation/
(Depreciation) | Value,
End of
Year | Dividend
Income | Other
Distributions | Shares
End of
Year |
| MainStay U.S. Government Liquidity Fund | $ 2,238 | $ 67,185 | $ (68,949) | $ — | $ — | $ 474 | $ 39 | $ — | 474 |
| Abbreviation(s): |
| REIT—Real Estate Investment Trust |
The following is a summary of the fair valuations according to the inputs used as of April 30, 2023, for valuing the Fund’s assets:
| Description | Quoted
Prices in
Active
Markets for
Identical
Assets
(Level 1) | | Significant
Other
Observable
Inputs
(Level 2) | | Significant
Unobservable
Inputs
(Level 3) | | Total |
| Asset Valuation Inputs | | | | | | | |
| Investments in Securities (a) | | | | | | | |
| Common Stocks | $ 307,160,260 | | $ — | | $ — | | $ 307,160,260 |
| Short-Term Investment | | | | | | | |
| Affiliated Investment Company | 474,344 | | — | | — | | 474,344 |
| Total Investments in Securities | $ 307,634,604 | | $ — | | $ — | | $ 307,634,604 |
| (a) | For a complete listing of investments and their industries, see the Portfolio of Investments. |
The notes to the financial statements are an integral part of, and should be read in conjunction with, the financial statements.
11
Statement of Assets and Liabilities as of April 30, 2023
| Assets |
Investment in unaffiliated securities, at value
(identified cost $285,826,653) | $307,160,260 |
Investment in affiliated investment companies, at value
(identified cost $474,344) | 474,344 |
| Receivables: | |
| Investment securities sold | 1,051,318 |
| Dividends | 271,856 |
| Fund shares sold | 198,802 |
| Other assets | 65,280 |
| Total assets | 309,221,860 |
| Liabilities |
| Payables: | |
| Manager (See Note 3) | 163,009 |
| Transfer agent (See Note 3) | 141,757 |
| Shareholder communication | 95,407 |
| Fund shares redeemed | 63,084 |
| NYLIFE Distributors (See Note 3) | 32,187 |
| Professional fees | 5,923 |
| Custodian | 5,138 |
| Trustees | 186 |
| Securities lending | 26 |
| Accrued expenses | 6,254 |
| Total liabilities | 512,971 |
| Net assets | $308,708,889 |
| Composition of Net Assets |
| Shares of beneficial interest outstanding (par value of $.001 per share) unlimited number of shares authorized | $ 35,025 |
| Additional paid-in-capital | 317,374,809 |
| | 317,409,834 |
| Total distributable earnings (loss) | (8,700,945) |
| Net assets | $308,708,889 |
| Class A | |
| Net assets applicable to outstanding shares | $137,275,931 |
| Shares of beneficial interest outstanding | 17,569,349 |
| Net asset value per share outstanding | $ 7.81 |
| Maximum sales charge (5.50% of offering price) | 0.45 |
| Maximum offering price per share outstanding | $ 8.26 |
| Investor Class | |
| Net assets applicable to outstanding shares | $ 195,374 |
| Shares of beneficial interest outstanding | 25,039 |
| Net asset value per share outstanding | $ 7.80 |
| Maximum sales charge (5.00% of offering price) | 0.41 |
| Maximum offering price per share outstanding | $ 8.21 |
| Class C | |
| Net assets applicable to outstanding shares | $ 3,963,486 |
| Shares of beneficial interest outstanding | 430,125 |
| Net asset value and offering price per share outstanding | $ 9.21 |
| Class I | |
| Net assets applicable to outstanding shares | $148,962,020 |
| Shares of beneficial interest outstanding | 15,101,874 |
| Net asset value and offering price per share outstanding | $ 9.86 |
| Class R3 | |
| Net assets applicable to outstanding shares | $ 1,509,597 |
| Shares of beneficial interest outstanding | 195,751 |
| Net asset value and offering price per share outstanding | $ 7.71 |
| Class R6 | |
| Net assets applicable to outstanding shares | $ 16,802,481 |
| Shares of beneficial interest outstanding | 1,703,217 |
| Net asset value and offering price per share outstanding | $ 9.87 |
The notes to the financial statements are an integral part of, and should be read in conjunction with, the financial statements.
| 12 | MainStay CBRE Real Estate Fund |
Statement of Operations for the year ended April 30, 2023
| Investment Income (Loss) |
| Income | |
| Dividends-unaffiliated (net of foreign tax withholding of $10,173) | $ 10,642,998 |
| Dividends-affiliated | 39,075 |
| Securities lending, net | 1,640 |
| Total income | 10,683,713 |
| Expenses | |
| Manager (See Note 3) | 2,699,863 |
| Transfer agent (See Note 3) | 958,382 |
| Distribution/Service—Class A (See Note 3) | 383,801 |
| Distribution/Service—Investor Class (See Note 3) | 484 |
| Distribution/Service—Class C (See Note 3) | 51,564 |
| Distribution/Service—Class R3 (See Note 3) | 9,679 |
| Registration | 92,762 |
| Shareholder communication | 70,625 |
| Professional fees | 39,895 |
| Custodian | 17,798 |
| Trustees | 8,618 |
| Shareholder service (See Note 3) | 1,936 |
| Miscellaneous | 11,432 |
| Total expenses before waiver/reimbursement | 4,346,839 |
| Expense waiver/reimbursement from Manager (See Note 3) | (768,869) |
| Reimbursement from prior custodian(a) | (670) |
| Net expenses | 3,577,300 |
| Net investment income (loss) | 7,106,413 |
| Realized and Unrealized Gain (Loss) |
| Net realized gain (loss) on: | |
| Unaffiliated investment transactions | (28,589,054) |
| Foreign currency transactions | (1,807) |
| Net realized gain (loss) | (28,590,861) |
| Net change in unrealized appreciation (depreciation) on: | |
| Unaffiliated investments | (56,030,101) |
| Translation of other assets and liabilities in foreign currencies | 680 |
| Net change in unrealized appreciation (depreciation) | (56,029,421) |
| Net realized and unrealized gain (loss) | (84,620,282) |
| Net increase (decrease) in net assets resulting from operations | $(77,513,869) |
| (a) | Represents a refund for overbilling of custody fees. |
The notes to the financial statements are an integral part of, and should be read in conjunction with, the financial statements.
13
Statements of Changes in Net Assets
for the years ended April 30, 2023 and April 30, 2022
| | 2023 | 2022 |
| Increase (Decrease) in Net Assets |
| Operations: | | |
| Net investment income (loss) | $ 7,106,413 | $ 5,229,744 |
| Net realized gain (loss) | (28,590,861) | 111,598,258 |
| Net change in unrealized appreciation (depreciation) | (56,029,421) | (62,634,172) |
| Net increase (decrease) in net assets resulting from operations | (77,513,869) | 54,193,830 |
| Distributions to shareholders: | | |
| Class A | (44,659,487) | (5,974,725) |
| Investor Class | (58,405) | (6,177) |
| Class C | (1,221,063) | (157,619) |
| Class I | (43,591,182) | (6,879,898) |
| Class R3 | (562,871) | (77,566) |
| Class R6 | (4,440,769) | (612,169) |
| | (94,533,777) | (13,708,154) |
| Distributions to shareholders from return of capital: | | |
| Class A | (872,279) | — |
| Investor Class | (1,141) | — |
| Class C | (23,850) | — |
| Class I | (851,413) | — |
| Class R3 | (10,994) | — |
| Class R6 | (86,736) | — |
| | (1,846,413) | — |
| Total distributions to shareholders | (96,380,190) | (13,708,154) |
| Capital share transactions: | | |
| Net proceeds from sales of shares | 48,489,555 | 107,349,432 |
| Net asset value of shares issued to shareholders in reinvestment of distributions | 90,519,704 | 12,708,131 |
| Cost of shares redeemed | (123,743,106) | (101,363,518) |
| Increase (decrease) in net assets derived from capital share transactions | 15,266,153 | 18,694,045 |
| Net increase (decrease) in net assets | (158,627,906) | 59,179,721 |
| Net Assets |
| Beginning of year | 467,336,795 | 408,157,074 |
| End of year | $ 308,708,889 | $ 467,336,795 |
The notes to the financial statements are an integral part of, and should be read in conjunction with, the financial statements.
| 14 | MainStay CBRE Real Estate Fund |
Financial Highlights selected per share data and ratios
| | Year Ended April 30, | | June 1,
2019
through
April 30,
2020# | | Year Ended May 31, |
| Class A | 2023 | | 2022 | | 2021 | | 2019 | | 2018 |
| Net asset value at beginning of period | $ 13.38 | | $ 12.20 | | $ 8.97 | | $ 12.32 | | $ 14.43 | | $ 17.81 |
| Net investment income (loss) (a) | 0.18 | | 0.13 | | 0.16 | | 0.18 | | 0.21 | | 0.28 |
| Net realized and unrealized gain (loss) | (2.45) | | 1.47 | | 3.59 | | (1.52) | | 1.29 | | (0.07) |
| Total from investment operations | (2.27) | | 1.60 | | 3.75 | | (1.34) | | 1.50 | | 0.21 |
| Less distributions: | | | | | | | | | | | |
| From net investment income | (0.39) | | (0.24) | | (0.20) | | (0.26) | | (0.21) | | (0.28) |
| From net realized gain on investments | (2.85) | | (0.18) | | — | | (1.32) | | (3.40) | | (3.31) |
| Return of capital | (0.06) | | — | | (0.32) | | (0.43) | | — | | — |
| Total distributions | (3.30) | | (0.42) | | (0.52) | | (2.01) | | (3.61) | | (3.59) |
| Net asset value at end of period | $ 7.81 | | $ 13.38 | | $ 12.20 | | $ 8.97 | | $ 12.32 | | $ 14.43 |
| Total investment return (b) | (16.94)% | | 13.06% | | 42.72% | | (13.80)% | | 12.73% | | 0.23% |
| Ratios (to average net assets)/Supplemental Data: | | | | | | | | | | | |
| Net investment income (loss) | 1.79% | | 0.96% | | 1.64% | | 1.69%†† | | 1.58% | | 1.69% |
| Net expenses | 1.18%(c) | | 1.18%(c) | | 1.18%(c) | | 1.17%†† (c)(d) | | 1.24% | | 1.29% |
| Expenses (before waiver/reimbursement) | 1.35%(c) | | 1.30%(c) | | 1.45%(c) | | 1.36%†† (c)(d) | | 1.31% | | 1.31% |
| Portfolio turnover rate | 65% | | 70% | | 93% | | 88% | | 82% | | 102% |
| Net assets at end of period (in 000's) | $ 137,276 | | $ 193,441 | | $ 177,328 | | $ 149,970 | | $ 89,037 | | $ 81,475 |
| # | The Fund changed its fiscal year end from May 31 to April 30. |
| †† | Annualized. |
| (a) | Per share data based on average shares outstanding during the period. |
| (b) | Total investment return is calculated exclusive of sales charges and assumes the reinvestment of dividends and distributions. For periods of less than one year, total return is not annualized. |
| (c) | In addition to the fees and expenses which the Fund bears directly, it also indirectly bears a pro-rata share of the fees and expenses of the underlying funds in which it invests. Such indirect expenses are not included in the above expense ratios. |
| (d) | Net of interest expense of less than 0.01%. |
The notes to the financial statements are an integral part of, and should be read in conjunction with, the financial statements.
15
Financial Highlights selected per share data and ratios
| | Year Ended April 30, | | February 24, 2020^ through
April 30,
2020 |
| Investor Class | 2023 | | 2022 | | 2021 | |
| Net asset value at beginning of period | $ 13.39 | | $ 12.19 | | $ 8.97 | | $ 12.17 |
| Net investment income (loss) (a) | 0.18 | | 0.13 | | 0.15 | | (0.04) |
| Net realized and unrealized gain (loss) | (2.46) | | 1.48 | | 3.58 | | (3.10) |
| Total from investment operations | (2.28) | | 1.61 | | 3.73 | | (3.14) |
| Less distributions: | | | | | | | |
| From net investment income | (0.40) | | (0.23) | | (0.20) | | (0.06) |
| From net realized gain on investments | (2.85) | | (0.18) | | — | | — |
| Return of capital | (0.06) | | — | | (0.31) | | — |
| Total distributions | (3.31) | | (0.41) | | (0.51) | | (0.06) |
| Net asset value at end of period | $ 7.80 | | $ 13.39 | | $ 12.19 | | $ 8.97 |
| Total investment return (b) | (17.00)% | | 13.15% | | 42.41% | | (25.74)% |
| Ratios (to average net assets)/Supplemental Data: | | | | | | | |
| Net investment income (loss) | 1.82% | | 0.98% | | 1.53% | | (2.55)%†† |
| Net expenses (c) | 1.21% | | 1.15% | | 1.26% | | 1.35%†† |
| Expenses (before waiver/reimbursement) (c) | 1.29% | | 1.26% | | 1.34% | | 1.56%†† |
| Portfolio turnover rate | 65% | | 70% | | 93% | | 88% |
| Net assets at end of period (in 000's) | $ 195 | | $ 227 | | $ 157 | | $ 103 |
| ^ | Inception date. |
| †† | Annualized. |
| (a) | Per share data based on average shares outstanding during the period. |
| (b) | Total investment return is calculated exclusive of sales charges and assumes the reinvestment of dividends and distributions. For periods of less than one year, total return is not annualized. |
| (c) | In addition to the fees and expenses which the Fund bears directly, it also indirectly bears a pro-rata share of the fees and expenses of the underlying funds in which it invests. Such indirect expenses are not included in the above expense ratios. |
The notes to the financial statements are an integral part of, and should be read in conjunction with, the financial statements.
| 16 | MainStay CBRE Real Estate Fund |
Financial Highlights selected per share data and ratios
| | Year Ended April 30, | | June 1,
2019
through
April 30,
2020# | | Year Ended May 31, |
| Class C | 2023 | | 2022 | | 2021 | | 2019 | | 2018 |
| Net asset value at beginning of period | $ 15.05 | | $ 13.66 | | $ 9.96 | | $ 13.47 | | $ 15.44 | | $ 18.80 |
| Net investment income (loss) | 0.12(a) | | 0.03(a) | | 0.07(a) | | 0.11(a) | | 0.11 | | 0.16(a) |
| Net realized and unrealized gain (loss) | (2.76) | | 1.66 | | 4.02 | | (1.71) | | 1.42 | | (0.08) |
| Total from investment operations | (2.64) | | 1.69 | | 4.09 | | (1.60) | | 1.53 | | 0.08 |
| Less distributions: | | | | | | | | | | | |
| From net investment income | (0.30) | | (0.12) | | (0.15) | | (0.18) | | (0.10) | | (0.13) |
| From net realized gain on investments | (2.85) | | (0.18) | | — | | (1.32) | | (3.40) | | (3.31) |
| Return of capital | (0.05) | | — | | (0.24) | | (0.41) | | — | | — |
| Total distributions | (3.20) | | (0.30) | | (0.39) | | (1.91) | | (3.50) | | (3.44) |
| Net asset value at end of period | $ 9.21 | | $ 15.05 | | $ 13.66 | | $ 9.96 | | $ 13.47 | | $ 15.44 |
| Total investment return (b) | (17.58)% | | 12.27% | | 41.65% | | (14.44)% | | 11.90% | | (0.50)% |
| Ratios (to average net assets)/Supplemental Data: | | | | | | | | | | | |
| Net investment income (loss) | 1.04% | | 0.22% | | 0.66% | | 1.00%†† | | 0.85% | | 0.90% |
| Net expenses | 1.93%(c) | | 1.91%(c) | | 1.93%(c) | | 1.92%†† (c)(d) | | 1.99% | | 2.04% |
| Expenses (before waiver/reimbursement) | 2.04%(c) | | 2.01%(c) | | 2.09%(c) | | 2.13%†† (c)(d) | | 2.06% | | 2.06% |
| Portfolio turnover rate | 65% | | 70% | | 93% | | 88% | | 82% | | 102% |
| Net assets at end of period (in 000's) | $ 3,963 | | $ 7,220 | | $ 10,202 | | $ 20,942 | | $ 11,216 | | $ 13,449 |
| # | The Fund changed its fiscal year end from May 31 to April 30. |
| †† | Annualized. |
| (a) | Per share data based on average shares outstanding during the period. |
| (b) | Total investment return is calculated exclusive of sales charges and assumes the reinvestment of dividends and distributions. For periods of less than one year, total return is not annualized. |
| (c) | In addition to the fees and expenses which the Fund bears directly, it also indirectly bears a pro-rata share of the fees and expenses of the underlying funds in which it invests. Such indirect expenses are not included in the above expense ratios. |
| (d) | Net of interest expense of less than 0.01%. |
The notes to the financial statements are an integral part of, and should be read in conjunction with, the financial statements.
17
Financial Highlights selected per share data and ratios
| | Year Ended April 30, | | June 1,
2019
through
April 30,
2020# | | Year Ended May 31, |
| Class I | 2023 | | 2022 | | 2021 | | 2019 | | 2018 |
| Net asset value at beginning of period | $ 15.85 | | $ 14.37 | | $ 10.49 | | $ 14.08 | | $ 15.99 | | $ 19.36 |
| Net investment income (loss) (a) | 0.26 | | 0.21 | | 0.22 | | 0.24 | | 0.30 | | 0.37 |
| Net realized and unrealized gain (loss) | (2.91) | | 1.74 | | 4.22 | | (1.79) | | 1.45 | | (0.09) |
| Total from investment operations | (2.65) | | 1.95 | | 4.44 | | (1.55) | | 1.75 | | 0.28 |
| Less distributions: | | | | | | | | | | | |
| From net investment income | (0.43) | | (0.29) | | (0.22) | | (0.28) | | (0.26) | | (0.34) |
| From net realized gain on investments | (2.85) | | (0.18) | | — | | (1.32) | | (3.40) | | (3.31) |
| Return of capital | (0.06) | | — | | (0.34) | | (0.44) | | — | | — |
| Total distributions | (3.34) | | (0.47) | | (0.56) | | (2.04) | | (3.66) | | (3.65) |
| Net asset value at end of period | $ 9.86 | | $ 15.85 | | $ 14.37 | | $ 10.49 | | $ 14.08 | | $ 15.99 |
| Total investment return (b) | (16.68)% | | 13.51% | | 43.19% | | (13.54)% | | 13.08% | | 0.63% |
| Ratios (to average net assets)/Supplemental Data: | | | | | | | | | | | |
| Net investment income (loss) | 2.13% | | 1.32% | | 1.92% | | 2.01%†† | | 1.95% | | 2.02% |
| Net expenses | 0.83%(c) | | 0.83%(c) | | 0.83%(c) | | 0.84%†† (c)(d) | | 0.91% | | 0.91% |
| Expenses (before waiver/reimbursement) | 1.10%(c) | | 1.05%(c) | | 1.20%(c) | | 1.04%†† (c)(d) | | 0.97% | | 0.92% |
| Portfolio turnover rate | 65% | | 70% | | 93% | | 88% | | 82% | | 102% |
| Net assets at end of period (in 000's) | $ 148,962 | | $ 241,719 | | $ 202,597 | | $ 232,730 | | $ 166,056 | | $ 311,814 |
| # | The Fund changed its fiscal year end from May 31 to April 30. |
| †† | Annualized. |
| (a) | Per share data based on average shares outstanding during the period. |
| (b) | Total investment return is calculated exclusive of sales charges and assumes the reinvestment of dividends and distributions. Class I shares are not subject to sales charges. For periods of less than one year, total return is not annualized. |
| (c) | In addition to the fees and expenses which the Fund bears directly, it also indirectly bears a pro-rata share of the fees and expenses of the underlying funds in which it invests. Such indirect expenses are not included in the above expense ratios. |
| (d) | Net of interest expense of less than 0.01%. |
The notes to the financial statements are an integral part of, and should be read in conjunction with, the financial statements.
| 18 | MainStay CBRE Real Estate Fund |
Financial Highlights selected per share data and ratios
| | Year Ended April 30, | | June 1,
2019
through
April 30,
2020# | | Year Ended May 31, |
| Class R3 | 2023 | | 2022 | | 2021 | | 2019 | | 2018 |
| Net asset value at beginning of period | $ 13.26 | | $ 12.09 | | $ 8.89 | | $ 12.23 | | $ 14.35 | | $ 17.73 |
| Net investment income (loss) | 0.15(a) | | 0.10(a) | | 0.11(a) | | 0.15(a) | | 0.18 | | 0.23(a) |
| Net realized and unrealized gain (loss) | (2.43) | | 1.46 | | 3.59 | | (1.51) | | 1.28 | | (0.06) |
| Total from investment operations | (2.28) | | 1.56 | | 3.70 | | (1.36) | | 1.46 | | 0.17 |
| Less distributions: | | | | | | | | | | | |
| From net investment income | (0.36) | | (0.21) | | (0.19) | | (0.23) | | (0.18) | | (0.24) |
| From net realized gain on investments | (2.85) | | (0.18) | | — | | (1.32) | | (3.40) | | (3.31) |
| Return of capital | (0.06) | | — | | (0.31) | | (0.43) | | — | | — |
| Total distributions | (3.27) | | (0.39) | | (0.50) | | (1.98) | | (3.58) | | (3.55) |
| Net asset value at end of period | $ 7.71 | | $ 13.26 | | $ 12.09 | | $ 8.89 | | $ 12.23 | | $ 14.35 |
| Total investment return (b) | (17.18)% | | 12.83% | | 42.47% | | (14.04)% | | 12.43% | | —% |
| Ratios (to average net assets)/Supplemental Data: | | | | | | | | | | | |
| Net investment income (loss) | 1.56% | | 0.72% | | 1.14% | | 1.42%†† | | 1.36% | | 1.43% |
| Net expenses | 1.43%(c) | | 1.43%(c) | | 1.43%(c) | | 1.42%†† (c)(d) | | 1.49% | | 1.54% |
| Expenses (before waiver/reimbursement) | 1.70%(c) | | 1.65%(c) | | 1.80%(c) | | 1.61%†† (c)(d) | | 1.56% | | 1.56% |
| Portfolio turnover rate | 65% | | 70% | | 93% | | 88% | | 82% | | 102% |
| Net assets at end of period (in 000's) | $ 1,510 | | $ 2,672 | | $ 2,298 | | $ 2,527 | | $ 2,454 | | $ 2,965 |
| # | The Fund changed its fiscal year end from May 31 to April 30. |
| †† | Annualized. |
| (a) | Per share data based on average shares outstanding during the period. |
| (b) | Total investment return is calculated exclusive of sales charges and assumes the reinvestment of dividends and distributions. Class R3 shares are not subject to sales charges. For periods of less than one year, total return is not annualized. |
| (c) | In addition to the fees and expenses which the Fund bears directly, it also indirectly bears a pro-rata share of the fees and expenses of the underlying funds in which it invests. Such indirect expenses are not included in the above expense ratios. |
| (d) | Net of interest expense of less than 0.01%. |
The notes to the financial statements are an integral part of, and should be read in conjunction with, the financial statements.
19
Financial Highlights selected per share data and ratios
| | Year Ended April 30, | | June 1,
2019
through
April 30,
2020# | | Year Ended May 31, |
| Class R6 | 2023 | | 2022 | | 2021 | | 2019 | | 2018 |
| Net asset value at beginning of period | $ 15.85 | | $ 14.37 | | $ 10.49 | | $ 14.09 | | $ 15.99 | | $ 19.36 |
| Net investment income (loss) | 0.27(a) | | 0.22(a) | | 0.09(a) | | 0.26(a) | | 0.32 | | 0.37(a) |
| Net realized and unrealized gain (loss) | (2.90) | | 1.74 | | 4.36 | | (1.80) | | 1.45 | | (0.08) |
| Total from investment operations | (2.63) | | 1.96 | | 4.45 | | (1.54) | | 1.77 | | 0.29 |
| Less distributions: | | | | | | | | | | | |
| From net investment income | (0.44) | | (0.30) | | (0.22) | | (0.30) | | (0.27) | | (0.35) |
| From net realized gain on investments | (2.85) | | (0.18) | | — | | (1.32) | | (3.40) | | (3.31) |
| Return of capital | (0.06) | | — | | (0.35) | | (0.44) | | — | | — |
| Total distributions | (3.35) | | (0.48) | | (0.57) | | (2.06) | | (3.67) | | (3.66) |
| Net asset value at end of period | $ 9.87 | | $ 15.85 | | $ 14.37 | | $ 10.49 | | $ 14.09 | | $ 15.99 |
| Total investment return (b) | (16.52)% | | 13.61% | | 43.35% | | (13.53)% | | 13.24% | | 0.69% |
| Ratios (to average net assets)/Supplemental Data: | | | | | | | | | | | |
| Net investment income (loss) | 2.23% | | 1.40% | | 0.80% | | 2.06%†† | | 2.05% | | 2.12% |
| Net expenses | 0.74%(c) | | 0.74%(c) | | 0.74%(c) | | 0.76%†† (c)(d) | | 0.83% | | 0.86% |
| Expenses (before waiver/reimbursement) | 0.82%(c) | | 0.84%(c) | | 0.84%(c) | | 0.88%†† (c)(d) | | 0.89% | | 0.86% |
| Portfolio turnover rate | 65% | | 70% | | 93% | | 88% | | 82% | | 102% |
| Net assets at end of period (in 000's) | $ 16,802 | | $ 22,058 | | $ 15,574 | | $ 56,250 | | $ 79,327 | | $ 79,646 |
| # | The Fund changed its fiscal year end from May 31 to April 30. |
| †† | Annualized. |
| (a) | Per share data based on average shares outstanding during the period. |
| (b) | Total investment return is calculated exclusive of sales charges and assumes the reinvestment of dividends and distributions. Class R6 shares are not subject to sales charges. For periods of less than one year, total return is not annualized. |
| (c) | In addition to the fees and expenses which the Fund bears directly, it also indirectly bears a pro-rata share of the fees and expenses of the underlying funds in which it invests. Such indirect expenses are not included in the above expense ratios. |
| (d) | Net of interest expense of less than 0.01%. |
The notes to the financial statements are an integral part of, and should be read in conjunction with, the financial statements.
| 20 | MainStay CBRE Real Estate Fund |
Notes to Financial Statements
Note 1-Organization and Business
MainStay Funds Trust (the “Trust”) was organized as a Delaware statutory trust on April 28, 2009. The Trust is registered under the Investment Company Act of 1940, as amended (the “1940 Act”), as an open-end management investment company, and is comprised of thirty-three funds (collectively referred to as the “Funds”). These financial statements and notes relate to the MainStay CBRE Real Estate Fund (the "Fund"), a “non-diversified” fund, as that term is defined in the 1940 Act, as interpreted or modified by regulatory authorities having jurisdiction, from time to time.
The following table lists the Fund's share classes that have been registered and commenced operations:
| Class | Commenced Operations |
| Class A | December 20, 2002 |
| Investor Class | February 24, 2020 |
| Class C | January 17, 2003 |
| Class I | December 31, 1996 |
| Class R3 | August 5, 2011 |
| Class R6 | July 3, 2014 |
| SIMPLE Class | N/A* |
| * | SIMPLE Class shares were registered for sale effective as of August 31, 2020 but have not yet commenced operations. |
Class A and Investor Class shares are offered at net asset value (“NAV”) per share plus an initial sales charge. No initial sales charge applies to investments of $1 million or more (and certain other qualified purchases) in Class A and Investor Class shares. A contingent deferred sales charge (“CDSC”) of 1.00% may be imposed on certain redemptions of Class A and Investor Class shares made within 18 months of the date of purchase on shares that were purchased without an initial sales charge. Class C shares are offered at NAV without an initial sales charge, although a 1.00% CDSC may be imposed on certain redemptions of such shares made within one year of the date of purchase of Class C shares. Class I, Class R3 and Class R6 shares are offered at NAV without a sales charge. SIMPLE Class shares are expected to be offered at NAV without a sales charge if such shares are offered in the future. In addition, depending upon eligibility, Class C shares convert to either Class A or Investor Class shares at the end of the calendar quarter eight years after the date they were purchased. Additionally, as disclosed in the Fund’s prospectus, Class A shares may convert automatically to Investor Class shares and Investor Class shares may convert automatically to Class A shares. Under certain circumstances and as may be permitted by the Trust’s multiple class plan pursuant to Rule 18f-3 under the 1940 Act, specified share classes of the Fund may be converted to one or more other share classes of the Fund as disclosed in the capital share transactions. See Note 9 for additional information. The six classes of shares have the same voting (except for issues that relate solely to one class), dividend, liquidation and other rights, and the same terms and conditions, except that under distribution plans pursuant to Rule 12b-1 under the 1940 Act, Class C shares are subject to higher distribution and/or service fees than Class A,
Investor Class and Class R3 shares. Class I and Class R6 shares are not subject to a distribution and/or service fee.
The Fund's investment objective is to seek total return.
Note 2–Significant Accounting Policies
The Fund is an investment company and accordingly follows the investment company accounting and reporting guidance of the Financial Accounting Standards Board (“FASB”) Accounting Standards Codification Topic 946 Financial Services—Investment Companies. The Fund prepares its financial statements in accordance with generally accepted accounting principles (“GAAP”) in the United States of America and follows the significant accounting policies described below.
(A) Securities Valuation. Investments are usually valued as of the close of regular trading on the New York Stock Exchange (the "Exchange") (usually 4:00 p.m. Eastern time) on each day the Fund is open for business ("valuation date").
Pursuant to Rule 2a-5 under the 1940 Act, the Board of Trustees of the Trust (the "Board") has designated New York Life Investment Management LLC (“New York Life Investments” or the "Manager") as its Valuation Designee (the "Valuation Designee"). The Valuation Designee is responsible for performing fair valuations relating to all investments in the Fund’s portfolio for which market quotations are not readily available; periodically assessing and managing material valuation risks; establishing and applying fair value methodologies; testing fair valuation methodologies; evaluating and overseeing pricing services; ensuring appropriate segregation of valuation and portfolio management functions; providing quarterly, annual and prompt reporting to the Board, as appropriate; identifying potential conflicts of interest; and maintaining appropriate records. The Valuation Designee has established a valuation committee ("Valuation Committee") to assist in carrying out the Valuation Designee’s responsibilities and establish prices of securities for which market quotations are not readily available. The Fund's and the Valuation Designee's policies and procedures ("Valuation Procedures") govern the Valuation Designee’s selection and application of methodologies for determining and calculating the fair value of Fund investments. The Valuation Designee may value the Fund's portfolio securities for which market quotations are not readily available and other Fund assets utilizing inputs from pricing services and other third-party sources. The Valuation Committee meets (in person, via electronic mail or via teleconference) on an ad-hoc basis to determine fair valuations and on a quarterly basis to review fair value events with respect to certain securities for which market quotations are not readily available, including valuation risks and back-testing results, and preview reports to the Board.
The Valuation Committee establishes prices of securities for which market quotations are not readily available based on such methodologies and measurements on a regular basis after considering information that is reasonably available and deemed relevant by the Valuation Committee. The Board shall oversee the Valuation Designee and review fair valuation
Notes to Financial Statements (continued)
materials on a prompt, quarterly and annual basis and approve proposed revisions to the Valuation Procedures.
Investments for which market quotations are not readily available are valued at fair value as determined in good faith pursuant to the Valuation Procedures. A market quotation is readily available only when that quotation is a quoted price (unadjusted) in active markets for identical investments that the Fund can access at the measurement date, provided that a quotation will not be readily available if it is not reliable. "Fair value" is defined as the price the Fund would reasonably expect to receive upon selling an asset or liability in an orderly transaction to an independent buyer in the principal or most advantageous market for the asset or liability. Fair value measurements are determined within a framework that establishes a three-tier hierarchy that maximizes the use of observable market data and minimizes the use of unobservable inputs to establish a classification of fair value measurements for disclosure purposes. "Inputs" refer broadly to the assumptions that market participants would use in pricing the asset or liability, including assumptions about risk, such as the risk inherent in a particular valuation technique used to measure fair value using a pricing model and/or the risk inherent in the inputs for the valuation technique. Inputs may be observable or unobservable. Observable inputs reflect the assumptions market participants would use in pricing the asset or liability based on market data obtained from sources independent of the Fund. Unobservable inputs reflect the Fund’s own assumptions about the assumptions market participants would use in pricing the asset or liability based on the information available. The inputs or methodology used for valuing assets or liabilities may not be an indication of the risks associated with investing in those assets or liabilities. The three-tier hierarchy of inputs is summarized below.
| • | Level 1—quoted prices (unadjusted) in active markets for an identical asset or liability |
| • | Level 2—other significant observable inputs (including quoted prices for a similar asset or liability in active markets, interest rates and yield curves, prepayment speeds, credit risk, etc.) |
| • | Level 3—significant unobservable inputs (including the Fund's own assumptions about the assumptions that market participants would use in measuring fair value of an asset or liability) |
The level of an asset or liability within the fair value hierarchy is based on the lowest level of an input, both individually and in the aggregate, that is significant to the fair value measurement. The aggregate value by input level of the Fund’s assets and liabilities as of April 30, 2023, is included at the end of the Portfolio of Investments.
The Fund may use third-party vendor evaluations, whose prices may be derived from one or more of the following standard inputs, among others:
| • Broker/dealer quotes | • Benchmark securities |
| • Two-sided markets | • Reference data (corporate actions or material event notices) |
| • Bids/offers | • Monthly payment information |
| • Industry and economic events | • Reported trades |
An asset or liability for which a market quotation is not readily available is valued by methods deemed reasonable in good faith by the Valuation Committee, following the Valuation Procedures to represent fair value. Under these procedures, the Valuation Designee generally uses a market-based approach which may use related or comparable assets or liabilities, recent transactions, market multiples, book values and other relevant information. The Valuation Designee may also use an income-based valuation approach in which the anticipated future cash flows of the asset or liability are discounted to calculate fair value. Discounts may also be applied due to the nature and/or duration of any restrictions on the disposition of the asset or liability. Fair value represents a good faith approximation of the value of a security. Fair value determinations involve the consideration of a number of subjective factors, an analysis of applicable facts and circumstances and the exercise of judgment. As a result, it is possible that the fair value for a security determined in good faith in accordance with the Valuation Procedures may differ from valuations for the same security determined for other funds using their own valuation procedures. Although the Valuation Procedures are designed to value a security at the price the Fund may reasonably expect to receive upon the security's sale in an orderly transaction, there can be no assurance that any fair value determination thereunder would, in fact, approximate the amount that the Fund would actually realize upon the sale of the security or the price at which the security would trade if a reliable market price were readily available. During the year ended April 30, 2023, there were no material changes to the fair value methodologies.
Securities which may be valued in this manner include, but are not limited to: (i) a security for which trading has been halted or suspended or otherwise does not have a readily available market quotation on a given day; (ii) a debt security that has recently gone into default and for which there is not a current market quotation; (iii) a security of an issuer that has entered into a restructuring; (iv) a security that has been delisted from a national exchange; (v) a security subject to trading collars for which no or limited trading takes place; and (vi) a security whose principal market has been temporarily closed at a time when, under normal conditions, it would be open. Securities valued in this manner are generally categorized as Level 2 or 3 in the hierarchy.
Equity securities are valued at the last quoted sales prices as of the close of regular trading on the relevant exchange on each valuation date. Securities that are not traded on the valuation date are valued at the mean of the last quoted bid and ask prices. Prices are normally taken from the principal market in which each security trades. These securities are generally categorized as Level 1 in the hierarchy.
Investments in mutual funds, including money market funds, are valued at their respective NAVs at the close of business each day on the valuation date. These securities are generally categorized as Level 1 in the hierarchy.
Temporary cash investments acquired in excess of 60 days to maturity at the time of purchase are valued using the latest bid prices or using valuations based on a matrix system (which considers such factors as
| 22 | MainStay CBRE Real Estate Fund |
security prices, yields, maturities and ratings), both as furnished by independent pricing services. Temporary cash investments that mature in 60 days or less at the time of purchase ("Short-Term Investments") are valued using the amortized cost method of valuation, unless the use of such method would be inappropriate. The amortized cost method involves valuing a security at its cost on the date of purchase and thereafter assuming a constant amortization to maturity of the difference between such cost and the value on maturity date. Amortized cost approximates the current fair value of a security. Securities valued using the amortized cost method are not valued using quoted prices in an active market and are generally categorized as Level 2 in the hierarchy.
The information above is not intended to reflect an exhaustive list of the methodologies that may be used to value portfolio investments. The Valuation Procedures permit the use of a variety of valuation methodologies in connection with valuing portfolio investments. The methodology used for a specific type of investment may vary based on the market data available or other considerations. The methodologies summarized above may not represent the specific means by which portfolio investments are valued on any particular business day.
(B) Income Taxes. The Fund's policy is to comply with the requirements of the Internal Revenue Code of 1986, as amended (the “Internal Revenue Code”), applicable to regulated investment companies and to distribute all of its taxable income to the shareholders of the Fund within the allowable time limits.
The Manager evaluates the Fund’s tax positions to determine if the tax positions taken meet the minimum recognition threshold in connection with accounting for uncertainties in income tax positions taken or expected to be taken for the purposes of measuring and recognizing tax liabilities in the financial statements. Recognition of tax benefits of an uncertain tax position is permitted only to the extent the position is “more likely than not” to be sustained assuming examination by taxing authorities. The Manager analyzed the Fund's tax positions taken on federal, state and local income tax returns for all open tax years (for up to three tax years) and has concluded that no provisions for federal, state and local income tax are required in the Fund's financial statements. The Fund's federal, state and local income tax and federal excise tax returns for tax years for which the applicable statutes of limitations have not expired are subject to examination by the Internal Revenue Service and state and local departments of revenue.
(C) Dividends and Distributions to Shareholders. Dividends and distributions are recorded on the ex-dividend date. The Fund intends to declare and pay dividends from net investment income, if any, at least quarterly and distributions from net realized capital and currency gains, if any, at least annually. Unless a shareholder elects otherwise, all dividends and distributions are reinvested at NAV in the same class of shares of the Fund. Dividends and distributions to shareholders are determined in accordance with federal income tax regulations and may differ from determinations using GAAP.
(D) Security Transactions and Investment Income. The Fund records security transactions on the trade date. Realized gains and losses on security transactions are determined using the identified cost method. Dividend income is recognized on the ex-dividend date, net of any foreign tax withheld at the source, and interest income is accrued as earned using the effective interest rate method. Distributions received from real estate investment trusts may be classified as dividends, capital gains and/or return of capital.
Investment income and realized and unrealized gains and losses on investments of the Fund are allocated pro rata to the separate classes of shares based upon their relative net assets on the date the income is earned or realized and unrealized gains and losses are incurred.
(E) Expenses. Expenses of the Trust are allocated to the individual Funds in proportion to the net assets of the respective Funds when the expenses are incurred, except where direct allocations of expenses can be made. Expenses (other than transfer agent expenses and fees incurred under the shareholder services plans and/or the distribution plans further discussed in Note 3(B)) are allocated to separate classes of shares pro rata based upon their relative net assets on the date the expenses are incurred. The expenses borne by the Fund, including those of related parties to the Fund, are shown in the Statement of Operations.
Additionally, the Fund may invest in mutual funds, which are subject to management fees and other fees that may cause the costs of investing in mutual funds to be greater than the costs of owning the underlying securities directly. These indirect expenses of mutual funds are not included in the amounts shown as expenses in the Statement of Operations or in the expense ratios included in the Financial Highlights.
(F) Use of Estimates. In preparing financial statements in conformity with GAAP, the Manager makes estimates and assumptions that affect the reported amounts and disclosures in the financial statements. Actual results could differ from those estimates and assumptions.
(G) Foreign Currency Transactions. The Fund's books and records are maintained in U.S. dollars. Prices of securities denominated in foreign currency amounts are translated into U.S. dollars at the mean between the buying and selling rates last quoted by any major U.S. bank at the following dates:
(i) market value of investment securities, other assets and liabilities— at the valuation date; and
(ii) purchases and sales of investment securities, income and expenses—at the date of such transactions.
The assets and liabilities that are denominated in foreign currency amounts are presented at the exchange rates and market values at the close of the period. The realized and unrealized changes in net assets arising from fluctuations in exchange rates and market prices of securities are not separately presented.
Net realized gain (loss) on foreign currency transactions represents net currency gains or losses realized as a result of differences between the
Notes to Financial Statements (continued)
amounts of securities sale proceeds or purchase cost, dividends, interest and withholding taxes as recorded on the Fund's books, and the U.S. dollar equivalent amount actually received or paid. Net currency gains or losses from valuing such foreign currency denominated assets and liabilities, other than investments at valuation date exchange rates, are reflected in unrealized foreign exchange gains or losses.
(H) Securities Lending. In order to realize additional income, the Fund may engage in securities lending, subject to the limitations set forth in the 1940 Act and relevant guidance by the staff of the Securities and Exchange Commission (“SEC”). If the Fund engages in securities lending, the Fund will lend through its custodian, JPMorgan Chase Bank, N.A., ("JPMorgan"), acting as securities lending agent on behalf of the Fund. Under the current arrangement, JPMorgan will manage the Fund's collateral in accordance with the securities lending agency agreement between the Fund and JPMorgan, and indemnify the Fund against counterparty risk. The loans will be collateralized by cash (which may be invested in a money market fund) and/or non-cash collateral (which may include U.S. Treasury securities and/or U.S. government agency securities issued or guaranteed by the United States government or its agencies or instrumentalities) at least equal at all times to the market value of the securities loaned. The Fund bears the risk of delay in recovery of, or loss of rights in, the securities loaned. The Fund may also record a realized gain or loss on securities deemed sold due to a borrower’s inability to return securities on loan. The Fund bears the risk of any loss on investment of cash collateral. The Fund will receive compensation for lending its securities in the form of fees or it will retain a portion of interest earned on the investment of any cash collateral. The Fund will also continue to receive interest and dividends on the securities loaned and any gain or loss in the market price of the securities loaned that may occur during the term of the loan will be for the account of the Fund. Income earned from securities lending activities, if any, is reflected in the Statement of Operations. As of April 30, 2023, the Fund did not have any portfolio securities on loan.
(I) Real Estate Investments. The Fund’s investments in the real estate sector have many of the same risks as direct ownership of real estate, including the risk that the value of real estate could decline due to a variety of factors that affect the real estate market generally. These risks include, among others, declines in the value of real estate, changes in local and general economic conditions, supply and demand, interest rates, changes in zoning laws, overbuilding, extended vacancies of properties, regulatory limitations on rents, losses due to environmental liabilities, property taxes and operating expenses. The Fund’s investments in real estate companies are particularly sensitive to economic downturns.
(J) Indemnifications. Under the Trust’s organizational documents, its officers and trustees are indemnified against certain liabilities that may arise out of performance of their duties to the Trust. Additionally, in the normal course of business, the Fund enters into contracts with third-party service providers that contain a variety of representations and warranties and that may provide general indemnifications. The Fund's maximum
exposure under these arrangements is unknown, as this would involve future claims that may be made against the Fund that have not yet occurred. The Manager believes that the risk of loss in connection with these potential indemnification obligations is remote. However, there can be no assurance that material liabilities related to such obligations will not arise in the future, which could adversely impact the Fund.
Note 3–Fees and Related Party Transactions
(A) Manager and Subadvisor. New York Life Investments, a registered investment adviser and an indirect, wholly-owned subsidiary of New York Life Insurance Company ("New York Life"), serves as the Fund's Manager pursuant to an Amended and Restated Management Agreement ("Management Agreement"). The Manager provides offices, conducts clerical, recordkeeping and bookkeeping services and keeps most of the financial and accounting records required to be maintained by the Fund. Except for the portion of salaries and expenses that are the responsibility of the Fund, the Manager pays the salaries and expenses of all personnel affiliated with the Fund and certain operational expenses of the Fund. The Fund reimburses New York Life Investments in an amount equal to the portion of the compensation of the Chief Compliance Officer attributable to the Fund. CBRE Investment Management Listed Real Assets LLC ("CBRE" or the "Subadvisor"), a registered investment adviser, serves as the Subadvisor to the Fund and is responsible for the day-to-day portfolio management of the Fund. Pursuant to the terms of a Subadvisory Agreement ("Subadvisory Agreement") between New York Life Investments and CBRE, New York Life Investments pays for the services of the Subadvisor.
Pursuant to the Management Agreement, the Fund pays the Manager a monthly fee for the services performed and the facilities furnished at an annual rate of 0.75% of the Fund's average daily net assets.
New York Life Investments has contractually agreed to waive fees and/or reimburse expenses so that Total Annual Fund Operating Expenses (excluding taxes, interest, litigation, extraordinary expenses, brokerage and other transaction expenses relating to the purchase or sale of portfolio investments and acquired (underlying) fund fees and expenses) do not exceed the following percentages of average daily net assets: Class A, 1.18%; Investor Class, 1.35%; Class C, 1.93%; Class I, 0.83%; Class R3, 1.43% and Class R6, 0.74%. This agreement will remain in effect until August 31, 2023, and shall renew automatically for one-year terms unless New York Life Investments provides written notice of termination prior to the start of the next term or upon approval of the Board.
During the year ended April 30, 2023, New York Life Investments earned fees from the Fund in the amount of $2,699,863 and waived fees and/or reimbursed expenses, including the waiver/reimbursement of certain class specific expenses in the amount of $768,869 and paid the Subadvisor fees in the amount of $965,497.
JPMorgan provides sub-administration and sub-accounting services to the Fund pursuant to an agreement with New York Life Investments.
| 24 | MainStay CBRE Real Estate Fund |
These services include calculating the daily NAVs of the Fund, maintaining the general ledger and sub-ledger accounts for the calculation of the Fund's NAVs, and assisting New York Life Investments in conducting various aspects of the Fund's administrative operations. For providing these services to the Fund, JPMorgan is compensated by New York Life Investments.
Pursuant to an agreement between the Trust and New York Life Investments, New York Life Investments is responsible for providing or procuring certain regulatory reporting services for the Fund. The Fund will reimburse New York Life Investments for the actual costs incurred by New York Life Investments in connection with providing or procuring these services for the Fund.
(B) Distribution and Service Fees. The Trust, on behalf of the Fund, has entered into a distribution agreement with NYLIFE Distributors LLC (the “Distributor”), an affiliate of New York Life Investments. The Fund has adopted distribution plans (the “Plans”) in accordance with the provisions of Rule 12b-1 under the 1940 Act.
Pursuant to the Class A and Investor Class Plans, the Distributor receives a monthly fee from the Class A and Investor Class shares at an annual rate of 0.25% of the average daily net assets of the Class A and Investor Class shares for distribution and/or service activities as designated by the Distributor. Pursuant to the Class C Plan, Class C shares pay the Distributor a monthly distribution fee at an annual rate of 0.75% of the average daily net assets of the Class C shares along with a service fee at an annual rate of 0.25% of the average daily net assets of the Class C shares, for a total 12b-1 fee of 1.00%. Pursuant to the Class R3 Plan, Class R3 shares pay the Distributor a monthly distribution fee at an annual rate of 0.25% of the average daily net assets of the Class R3 shares along with a service fee at an annual rate of 0.25% of the average daily net assets of the Class R3 shares, for a total 12b-1 fee of 0.50%. Class I and Class R6 shares are not subject to a distribution and/or service fee.
The Plans provide that the distribution and service fees are payable to the Distributor regardless of the amounts actually expended by the Distributor for distribution of the Fund's shares and service activities.
In accordance with the Shareholder Services Plans for the Class R3 shares, the Manager has agreed to provide, through its affiliates or independent third parties, various shareholder and administrative support services to shareholders of the Class R3 shares. For its services, the Manager, its affiliates or independent third-party service providers are entitled to a shareholder service fee accrued daily and paid monthly at an annual rate of 0.10% of the average daily net assets of the Class R3 shares. This is in addition to any fees paid under the Class R3 Plan.
During the year ended April 30, 2023, shareholder service fees incurred by the Fund were as follows:
(C) Sales Charges. The Fund was advised by the Distributor that the amount of initial sales charges retained on sales of Class A and Investor Class shares during the year ended April 30, 2023, were $3,846 and $84, respectively.
The Fund was also advised that the Distributor retained CDSCs on redemptions of Class A and Class C shares during the year ended April 30, 2023, of $440 and $710, respectively.
(D) Transfer, Dividend Disbursing and Shareholder Servicing Agent. NYLIM Service Company LLC, an affiliate of New York Life Investments, is the Fund's transfer, dividend disbursing and shareholder servicing agent pursuant to an agreement between NYLIM Service Company LLC and the Trust. NYLIM Service Company LLC has entered into an agreement with SS&C Global Investor & Distributor Solutions, Inc. ("SS&C"), pursuant to which SS&C performs certain transfer agent services on behalf of NYLIM Service Company LLC. New York Life Investments has contractually agreed to limit the transfer agency expenses charged to the Fund’s share classes to a maximum of 0.35% of that share class’s average daily net assets on an annual basis after deducting any applicable Fund or class-level expense reimbursement or small account fees. This agreement will remain in effect until August 31, 2023, and shall renew automatically for one-year terms unless New York Life Investments provides written notice of termination prior to the start of the next term or upon approval of the Board. During the year ended April 30, 2023, transfer agent expenses incurred by the Fund and any reimbursements, pursuant to the aforementioned Transfer Agency expense limitation agreement, were as follows:
| Class | Expense | Waived |
| Class A | $433,390 | $— |
| Investor Class | 426 | — |
| Class C | 11,290 | — |
| Class I | 507,131 | — |
| Class R3 | 5,425 | — |
| Class R6 | 720 | — |
(E) Small Account Fee. Shareholders with small accounts adversely impact the cost of providing transfer agency services. In an effort to reduce total transfer agency expenses, the Fund has implemented a small account fee on certain types of accounts. As described in the Fund's prospectus, certain shareholders with an account balance of less than $1,000 ($5,000 for Class A share accounts) are charged an annual per account fee of $20 (assessed semi-annually), the proceeds from which offset transfer agent fees as reflected in the Statement of Operations. This small account fee will not apply to certain types of accounts as described further in the Fund’s prospectus.
Notes to Financial Statements (continued)
Note 4-Federal Income Tax
As of April 30, 2023, the cost and unrealized appreciation (depreciation) of the Fund’s investment portfolio, including applicable derivative contracts and other financial instruments, as determined on a federal income tax basis, were as follows:
| | Federal Tax
Cost | Gross
Unrealized
Appreciation | Gross
Unrealized
(Depreciation) | Net
Unrealized
Appreciation/
(Depreciation) |
| Investments in Securities | $292,323,766 | $44,516,958 | $(29,206,120) | $15,310,838 |
As of April 30, 2023, the components of accumulated gain (loss) on a tax basis were as follows:
Ordinary
Income | Accumulated
Capital
and Other
Gain (Loss) | Other
Temporary
Differences | Unrealized
Appreciation
(Depreciation) | Total
Accumulated
Gain (Loss) |
| $— | $(23,910,636) | $(88,515) | $15,298,206 | $(8,700,945) |
The difference between book-basis and tax-basis unrealized appreciation (depreciation) is primarily due to wash sale adjustments.
The following table discloses the current year reclassifications between total distributable earnings (loss) and additional paid-in capital arising from permanent differences; net assets as of April 30, 2023 were not affected.
| | Total
Distributable
Earnings (Loss) | Additional
Paid-In
Capital |
| | $(9,673,038) | $9,673,038 |
The reclassifications for the Fund are primarily due to equalization.
As of April 30, 2023, for federal income tax purposes, capital loss carryforwards of $23,910,636, as shown in the table below, were available to the extent provided by the regulations to offset future realized gains of the Fund. Accordingly, no capital gains distributions are expected to be paid to shareholders until net gains have been realized in excess of such amounts.
Capital Loss
Available Through | Short-Term
Capital Loss
Amounts (000’s) | Long-Term
Capital Loss
Amounts (000’s) |
| Unlimited | $18,441 | $5,470 |
During the years ended April 30, 2023 and April 30, 2022, the tax character of distributions paid as reflected in the Statements of Changes in Net Assets was as follows:
| | 2023 | 2022 |
| Distributions paid from: | | |
| Ordinary Income | $25,991,405 | $ 8,176,041 |
| Long-Term Capital Gains | 68,542,372 | 5,532,113 |
| Return of Capital | 1,846,413 | — |
| Total | $96,380,190 | $13,708,154 |
Note 5–Custodian
JPMorgan is the custodian of cash and securities held by the Fund. Custodial fees are charged to the Fund based on the Fund's net assets and/or the market value of securities held by the Fund and the number of certain transactions incurred by the Fund.
Note 6–Line of Credit
The Fund and certain other funds managed by New York Life Investments maintain a line of credit with a syndicate of banks in order to secure a source of funds for temporary purposes to meet unanticipated or excessive redemption requests.
Effective July 26, 2022, under the credit agreement (the “Credit Agreement”), the aggregate commitment amount is $600,000,000 with an additional uncommitted amount of $100,000,000. The commitment fee is an annual rate of 0.15% of the average commitment amount payable quarterly, regardless of usage, to JPMorgan, who serves as the agent to the syndicate. The commitment fee is allocated among the Fund and certain other funds managed by New York Life Investments based upon their respective net assets and other factors. Interest on any revolving credit loan is charged based upon the Federal Funds Rate, Daily Simple Secured Overnight Financing Rate ("SOFR") + 0.10%, or the Overnight Bank Funding Rate, whichever is higher. The Credit Agreement expires on July 25, 2023, although the Fund, certain other funds managed by New York Life Investments and the syndicate of banks may renew the Credit Agreement for an additional year on the same or different terms or enter into a credit agreement with a different syndicate of banks. Prior to July 26, 2022, the aggregate commitment amount and the commitment fee were the same as those under the current Credit Agreement. During the year ended April 30, 2023, there were no borrowings made or outstanding with respect to the Fund under the Credit Agreement.
Note 7–Interfund Lending Program
Pursuant to an exemptive order issued by the SEC, the Fund, along with certain other funds managed by New York Life Investments, may participate in an interfund lending program. The interfund lending program provides an alternative credit facility that permits the Fund and certain other funds managed by New York Life Investments to lend or borrow money for temporary purposes directly to or from one another,
| 26 | MainStay CBRE Real Estate Fund |
subject to the conditions of the exemptive order. During the year ended April 30, 2023, there were no interfund loans made or outstanding with respect to the Fund.
Note 8–Purchases and Sales of Securities (in 000’s)
During the year ended April 30, 2023, purchases and sales of securities, other than short-term securities, were $234,429 and $300,165, respectively.
Note 9–Capital Share Transactions
Transactions in capital shares for the years ended April 30, 2023 and April 30, 2022, were as follows:
| Class A | Shares | Amount |
| Year ended April 30, 2023: | | |
| Shares sold | 1,243,603 | $ 11,821,300 |
| Shares issued to shareholders in reinvestment of distributions | 5,289,781 | 42,857,119 |
| Shares redeemed | (3,425,488) | (33,264,137) |
| Net increase (decrease) in shares outstanding before conversion | 3,107,896 | 21,414,282 |
| Shares converted into Class A (See Note 1) | 9,732 | 79,856 |
| Shares converted from Class A (See Note 1) | (2,339) | (25,965) |
| Net increase (decrease) | 3,115,289 | $ 21,468,173 |
| Year ended April 30, 2022: | | |
| Shares sold | 2,474,614 | $ 33,342,180 |
| Shares issued to shareholders in reinvestment of distributions | 407,302 | 5,603,692 |
| Shares redeemed | (2,975,753) | (39,795,668) |
| Net increase (decrease) in shares outstanding before conversion | (93,837) | (849,796) |
| Shares converted into Class A (See Note 1) | 11,379 | 146,928 |
| Shares converted from Class A (See Note 1) | (4,131) | (53,907) |
| Net increase (decrease) | (86,589) | $ (756,775) |
| |
| Investor Class | Shares | Amount |
| Year ended April 30, 2023: | | |
| Shares sold | 6,325 | $ 57,457 |
| Shares issued to shareholders in reinvestment of distributions | 7,375 | 59,541 |
| Shares redeemed | (4,721) | (46,914) |
| Net increase (decrease) in shares outstanding before conversion | 8,979 | 70,084 |
| Shares converted into Investor Class (See Note 1) | 2,617 | 25,834 |
| Shares converted from Investor Class (See Note 1) | (3,550) | (27,928) |
| Net increase (decrease) | 8,046 | $ 67,990 |
| Year ended April 30, 2022: | | |
| Shares sold | 4,933 | $ 66,875 |
| Shares issued to shareholders in reinvestment of distributions | 448 | 6,176 |
| Shares redeemed | (1,138) | (15,703) |
| Net increase (decrease) in shares outstanding before conversion | 4,243 | 57,348 |
| Shares converted into Investor Class (See Note 1) | 973 | 12,962 |
| Shares converted from Investor Class (See Note 1) | (1,093) | (13,822) |
| Net increase (decrease) | 4,123 | $ 56,488 |
| |
| Class C | Shares | Amount |
| Year ended April 30, 2023: | | |
| Shares sold | 20,628 | $ 222,355 |
| Shares issued to shareholders in reinvestment of distributions | 130,422 | 1,240,539 |
| Shares redeemed | (195,491) | (2,175,862) |
| Net increase (decrease) in shares outstanding before conversion | (44,441) | (712,968) |
| Shares converted from Class C (See Note 1) | (5,149) | (55,087) |
| Net increase (decrease) | (49,590) | $ (768,055) |
| Year ended April 30, 2022: | | |
| Shares sold | 51,919 | $ 789,439 |
| Shares issued to shareholders in reinvestment of distributions | 10,012 | 156,795 |
| Shares redeemed | (319,942) | (4,760,464) |
| Net increase (decrease) in shares outstanding before conversion | (258,011) | (3,814,230) |
| Shares converted from Class C (See Note 1) | (9,305) | (134,919) |
| Net increase (decrease) | (267,316) | $ (3,949,149) |
| |
Notes to Financial Statements (continued)
| Class I | Shares | Amount |
| Year ended April 30, 2023: | | |
| Shares sold | 2,603,780 | $ 31,441,943 |
| Shares issued to shareholders in reinvestment of distributions | 4,118,909 | 41,999,850 |
| Shares redeemed | (6,874,637) | (81,717,143) |
| Net increase (decrease) in shares outstanding before conversion | (151,948) | (8,275,350) |
| Shares converted into Class I (See Note 1) | 1,964 | 25,965 |
| Shares converted from Class I (See Note 1) | (1,470) | (14,318) |
| Net increase (decrease) | (151,454) | $ (8,263,703) |
| Year ended April 30, 2022: | | |
| Shares sold | 4,016,150 | $ 64,133,515 |
| Shares issued to shareholders in reinvestment of distributions | 390,452 | 6,333,075 |
| Shares redeemed | (3,151,388) | (50,417,941) |
| Net increase (decrease) in shares outstanding before conversion | 1,255,214 | 20,048,649 |
| Shares converted into Class I (See Note 1) | 3,502 | 53,907 |
| Shares converted from Class I (See Note 1) | (107,874) | (1,682,829) |
| Net increase (decrease) | 1,150,842 | $ 18,419,727 |
| |
| Class R3 | Shares | Amount |
| Year ended April 30, 2023: | | |
| Shares sold | 28,387 | $ 272,231 |
| Shares issued to shareholders in reinvestment of distributions | 67,696 | 542,324 |
| Shares redeemed | (100,863) | (989,931) |
| Net increase (decrease) in shares outstanding before conversion | (4,780) | (175,376) |
| Shares converted from Class R3 (See Note 1) | (997) | (8,357) |
| Net increase (decrease) | (5,777) | $ (183,733) |
| Year ended April 30, 2022: | | |
| Shares sold | 53,893 | $ 721,265 |
| Shares issued to shareholders in reinvestment of distributions | 5,408 | 73,969 |
| Shares redeemed | (47,089) | (640,654) |
| Net increase (decrease) in shares outstanding before conversion | 12,212 | 154,580 |
| Shares converted from Class R3 (See Note 1) | (850) | (11,149) |
| Net increase (decrease) | 11,362 | $ 143,431 |
| |
| Class R6 | Shares | Amount |
| Year ended April 30, 2023: | | |
| Shares sold | 400,769 | $ 4,674,269 |
| Shares issued to shareholders in reinvestment of distributions | 375,674 | 3,820,331 |
| Shares redeemed | (464,903) | (5,549,119) |
| Net increase (decrease) | 311,540 | $ 2,945,481 |
| Year ended April 30, 2022: | | |
| Shares sold | 522,511 | $ 8,296,158 |
| Shares issued to shareholders in reinvestment of distributions | 32,944 | 534,424 |
| Shares redeemed | (355,617) | (5,733,088) |
| Net increase (decrease) in shares outstanding before conversion | 199,838 | 3,097,494 |
| Shares converted into Class R6 (See Note 1) | 107,874 | 1,682,829 |
| Net increase (decrease) | 307,712 | $ 4,780,323 |
Note 10–Other Matters
As of the date of this report, interest rates in the United States and many parts of the world, including certain European countries, continue to ascend from historically low levels. Thus, the Fund currently faces a heightened level of risk associated with rising interest rates. This could be driven by a variety of factors, including but not limited to central bank monetary policies, changing inflation or real growth rates, general economic conditions, increasing bond issuances or reduced market demand for low yielding investments.
Social, political, economic and other conditions and events, such as war, natural disasters, health emergencies (e.g., epidemics and pandemics), terrorism, conflicts, social unrest, recessions, inflation, rapid interest rate changes and supply chain disruptions, may occur and could significantly impact the Fund, issuers, industries, governments and other systems, including the financial markets. Developments that disrupt global economies and financial markets, such as COVID-19, the conflict in Ukraine, and the failures of certain U.S. and non-U.S. banks, may magnify factors that affect the Fund's performance.
Note 11–Subsequent Events
In connection with the preparation of the financial statements of the Fund as of and for the year ended April 30, 2023, events and transactions subsequent to April 30, 2023, through the date the financial statements were issued have been evaluated by the Manager for possible adjustment and/or disclosure. No subsequent events requiring financial statement adjustment or disclosure have been identified.
| 28 | MainStay CBRE Real Estate Fund |
Report of Independent Registered Public Accounting Firm
To the Shareholders of the Fund and Board of Trustees
MainStay Funds Trust:
Opinion on the Financial Statements
We have audited the accompanying statement of assets and liabilities of MainStay CBRE Real Estate Fund (the Fund), one of the funds constituting MainStay Funds Trust, including the portfolio of investments, as of April 30, 2023, the related statement of operations for the year then ended, the statements of changes in net assets for each of the years in the two-year period then ended, and the related notes (collectively, the financial statements) and the financial highlights for each of the years in the three-year period ended April 30, 2023, the period from June 1, 2019 through April 30, 2020 or the period then ended, and each of the years in the two-year period ended May 31, 2019. In our opinion, the financial statements and financial highlights present fairly, in all material respects, the financial position of the Fund as of April 30, 2023, the results of its operations for the year then ended, the changes in its net assets for each of the years in the two-year period then ended, and the financial highlights for each of the years in the three-year period ended April 30, 2023, the period from June 1, 2019 through April 30, 2020 or the period then ended, and each of the years in the two-year period ended May 31, 2019, in conformity with U.S. generally accepted accounting principles.
Basis for Opinion
These financial statements and financial highlights are the responsibility of the Fund's management. Our responsibility is to express an opinion on these financial statements and financial highlights based on our audits. We are a public accounting firm registered with the Public Company Accounting Oversight Board (United States) (PCAOB) and are required to be independent with respect to the Fund in accordance with the U.S. federal securities laws and the applicable rules and regulations of the Securities and Exchange Commission and the PCAOB.
We conducted our audits in accordance with the standards of the PCAOB. Those standards require that we plan and perform the audit to obtain reasonable assurance about whether the financial statements and financial highlights are free of material misstatement, whether due to error or fraud. Our audits included performing procedures to assess the risks of material misstatement of the financial statements and financial highlights, whether due to error or fraud, and performing procedures that respond to those risks. Such procedures included examining, on a test basis, evidence regarding the amounts and disclosures in the financial statements and financial highlights. Such procedures also included confirmation of securities owned as of April 30, 2023, by correspondence with the custodian and the transfer agent. Our audits also included evaluating the accounting principles used and significant estimates made by management, as well as evaluating the overall presentation of the financial statements and financial highlights. We believe that our audits provide a reasonable basis for our opinion.

We have served as the auditor of one or more New York Life Investment Management investment companies since 2003.
Philadelphia, Pennsylvania
June 23, 2023
Board Consideration and Approval of Management Agreement and Subadvisory Agreement (Unaudited)
The continuation of the Management Agreement with respect to the MainStay CBRE Real Estate Fund (“Fund”) and New York Life Investment Management LLC (“New York Life Investments”) and the Subadvisory Agreement between New York Life Investments and CBRE Investment Management Listed Real Assets LLC (“CBRE”) with respect to the Fund (together, “Advisory Agreements”) is subject to annual review and approval by the Board of Trustees of MainStay Funds Trust (“Board” of the “Trust”) in accordance with Section 15 of the Investment Company Act of 1940, as amended (“1940 Act”). At its December 6–7, 2022 meeting, the Board, which is comprised solely of Trustees who are not an “interested person” (as such term is defined in the 1940 Act) of the Trust (“Independent Trustees”), unanimously approved the continuation of each of the Advisory Agreements for a one-year period.
In reaching the decision to approve the continuation of each of the Advisory Agreements, the Board considered information and materials furnished by New York Life Investments and CBRE in connection with an annual contract review process undertaken by the Board that took place at meetings of the Board and its Contracts Committee during October 2022 through December 2022, including information and materials furnished by New York Life Investments and CBRE in response to requests prepared on behalf of the Board, and in consultation with the Board, by independent legal counsel to the Independent Trustees, which encompassed a variety of topics, including those summarized below. Information and materials requested by and furnished to the Board for consideration in connection with the contract review process included, among other items, reports on the Fund and “peer funds” prepared by Institutional Shareholder Services Inc. (“ISS”), an independent third-party service provider engaged by the Board to report objectively on the Fund’s investment performance, management fee and total expenses. The Board also considered information on the fees charged to other investment advisory clients of New York Life Investments and/or CBRE that follow investment strategies similar to those of the Fund, if any, and, when applicable, the rationale for any differences in the Fund’s management and subadvisory fees and the fees charged to those other investment advisory clients. In addition, the Board considered information regarding the legal standards and fiduciary obligations applicable to its consideration of the continuation of each of the Advisory Agreements. The contract review process, including the structure and format for information and materials provided to the Board, has been developed in consultation with the Board. The Independent Trustees also met in executive sessions with their independent legal counsel and, for portions thereof, with senior management of New York Life Investments.
The Board’s deliberations with respect to the continuation of each of the Advisory Agreements reflect a year-long process, and the Board also took into account information furnished to the Board and its Committees throughout the year, as deemed relevant and appropriate by the Trustees, including, among other items, reports on investment performance of the Fund and investment-related matters for the Fund as well as presentations from New York Life Investments and, generally annually, CBRE personnel. In addition, the Board took into account other information provided by New York Life Investments throughout the year,
including, among other items, periodic reports on legal and compliance matters, risk management, portfolio turnover, brokerage commissions and non-advisory services provided to the Fund by New York Life Investments, as deemed relevant and appropriate by the Trustees.
In addition to information provided to the Board throughout the year, the Board received information in connection with its June 2022 meeting provided specifically in response to requests prepared on behalf of the Board, and in consultation with the Board, by independent legal counsel to the Independent Trustees regarding the Fund’s distribution arrangements. In addition, the Board received information regarding the Fund’s asset levels, share purchase and redemption activity and the payment of Rule 12b-1 and/or certain other fees by the applicable share classes of the Fund, among other information.
In considering the continuation of each of the Advisory Agreements, the Trustees reviewed and evaluated the information and factors they believed to reasonably be necessary and appropriate in light of legal advice furnished to them by independent legal counsel to the Independent Trustees and through the exercise of their own business judgment. Although individual Trustees may have weighed certain factors or information differently and the Board did not consider any single factor or information controlling in reaching its decision, the factors that figured prominently in the Board’s consideration of the continuation of each of the Advisory Agreements are summarized in more detail below and include, among other factors: (i) the nature, extent and quality of the services provided to the Fund by New York Life Investments and CBRE; (ii) the qualifications of the portfolio managers of the Fund and the historical investment performance of the Fund, New York Life Investments and CBRE; (iii) the costs of the services provided, and profits realized, by New York Life Investments and CBRE with respect to their relationships with the Fund; (iv) the extent to which economies of scale have been realized or may be realized if the Fund grows and the extent to which any economies of scale have been shared, have benefited or may benefit the Fund’s shareholders; and (v) the reasonableness of the Fund’s management and subadvisory fees and total ordinary operating expenses. Although the Board recognized that comparisons between the Fund’s fees and expenses and those of other funds are imprecise given different terms of agreements, variations in fund strategies and other factors, the Board considered the reasonableness of the Fund’s management fee and total ordinary operating expenses as compared to the peer funds identified by ISS. Throughout their considerations, the Trustees acknowledged the commitment of New York Life Investments and its affiliates to serve the MainStay Group of Funds, as well as their capacity, experience, resources, financial stability and reputations. The Trustees also acknowledged the entrepreneurial and other risks assumed by New York Life Investments in sponsoring and managing the Fund. With respect to the Subadvisory Agreement, the Board took into account New York Life Investments’ recommendation to approve the continuation of the Subadvisory Agreement.
The Trustees noted that, throughout the year, the Trustees are afforded an opportunity to ask questions of, and request additional information or materials from, New York Life Investments and CBRE. The Board’s
| 30 | MainStay CBRE Real Estate Fund |
decision with respect to each of the Advisory Agreements may have also been based, in part, on the Board’s knowledge of New York Life Investments and CBRE resulting from, among other things, the Board’s consideration of each of the Advisory Agreements in prior years, the advisory agreements for other funds in the MainStay Group of Funds, the Board’s review throughout the year of the performance and operations of other funds in the MainStay Group of Funds and each Trustee’s business judgment and industry experience. In addition to considering the above-referenced factors, the Board observed that in the marketplace there are a range of investment options available to investors and that the Fund’s shareholders, having had the opportunity to consider other investment options, have chosen to invest in the Fund.
The factors that figured prominently in the Board’s decision to approve the continuation of each of the Advisory Agreements during its December 6–7, 2022 meeting are summarized in more detail below.
Nature, Extent and Quality of Services Provided by New York Life Investments and CBRE
The Board examined the nature, extent and quality of the services that New York Life Investments provides to the Fund. The Board evaluated New York Life Investments’ experience and capabilities in serving as manager of the Fund and considered that the Fund operates in a “manager-of-managers” structure. The Board also considered New York Life Investments’ responsibilities and services provided pursuant to this structure, including overseeing the services provided by CBRE, evaluating the performance of CBRE, making recommendations to the Board as to whether the Subadvisory Agreement should be renewed, modified or terminated and periodically reporting to the Board regarding the results of New York Life Investments’ evaluation and monitoring functions. The Board noted that New York Life Investments manages other mutual funds, serves a variety of other investment advisory clients, including other pooled investment vehicles, and has experience overseeing mutual fund service providers, including subadvisors. The Board considered the experience of senior personnel at New York Life Investments providing management and administrative and other non-advisory services to the Fund. The Board observed that New York Life Investments devotes significant resources and time to providing management and administrative and other non-advisory services to the Fund, including New York Life Investments’ oversight and due diligence reviews of CBRE and ongoing analysis of, and interactions with, CBRE with respect to, among other things, the Fund’s investment performance and risks as well as CBRE’s investment capabilities and subadvisory services with respect to the Fund.
The Board also considered the range of services that New York Life Investments provides to the Fund under the terms of the Management Agreement, including: (i) fund accounting and ongoing supervisory services provided by New York Life Investments’ Fund Administration and Accounting Group; (ii) investment supervisory and analytical services provided by New York Life Investments’ Investment Consulting Group; (iii) compliance services provided by the Trust’s Chief Compliance Officer as well as New York Life Investments’ compliance department, including
supervision and implementation of the Fund’s compliance program; (iv) legal services provided by New York Life Investments’ Office of the General Counsel; and (v) risk management monitoring and analysis by compliance and investment personnel. In addition, the Board considered New York Life Investments’ willingness to invest in personnel and other resources, such as cyber security, information security and business continuity planning, designed to benefit the Fund and noted that New York Life Investments is responsible for compensating the Trust’s officers, except for a portion of the salary of the Trust’s Chief Compliance Officer. The Board recognized that New York Life Investments provides certain other non-advisory services to the Fund and has provided an increasingly broad array of non-advisory services to the MainStay Group of Funds as a result of regulatory and other developments, including in connection with the implementation of the MainStay Group of Funds’ derivatives risk management program and policies and procedures adopted pursuant to Rule 18f-4 under the 1940 Act. The Board considered benefits to the Fund’s shareholders from the Fund being part of the MainStay Group of Funds, including the ability to exchange investments between the same class of shares of funds in the MainStay Group of Funds, including without the imposition of a sales charge (if any).
The Board also examined the range, and the nature, extent and quality, of the investment advisory services that CBRE provides to the Fund and considered the terms of each of the Advisory Agreements. The Board evaluated CBRE’s experience and performance in serving as subadvisor to the Fund and advising other portfolios and CBRE’s track record and experience in providing investment advisory services as well as the experience of investment advisory, senior management and administrative personnel at CBRE. The Board considered New York Life Investments’ and CBRE’s overall resources, legal and compliance environment, capabilities, reputation, financial condition and history. In addition to information provided in connection with quarterly meetings with the Trust’s Chief Compliance Officer, the Board considered information regarding the compliance policies and procedures of New York Life Investments and CBRE and acknowledged their commitment to further developing and strengthening compliance programs relating to the Fund. The Board also considered CBRE’s ability to recruit and retain qualified investment professionals and willingness to invest in personnel and other resources to service and support the Fund. In this regard, the Board considered the qualifications and experience of the Fund’s portfolio managers, the number of accounts managed by the portfolio managers and the method for compensating the portfolio managers.
In addition, the Board considered information provided by New York Life Investments and CBRE regarding the operations of their respective business continuity plans in response to the COVID-19 pandemic and the continued remote work environment.
Based on these considerations, among others, the Board concluded that the Fund would likely continue to benefit from the nature, extent and quality of these services.
Board Consideration and Approval of Management Agreement and Subadvisory Agreement (Unaudited) (continued)
Investment Performance
In evaluating the Fund’s investment performance, the Board considered investment performance results over various periods in light of the Fund’s investment objective, strategies and risks. The Board considered investment reports on, and analysis of, the Fund’s performance provided to the Board throughout the year. These reports include, among other items, information on the Fund’s gross and net returns, the Fund’s investment performance compared to a relevant investment category and the Fund’s benchmarks, the Fund’s risk-adjusted investment performance and the Fund’s investment performance as compared to peer funds, as appropriate, as well as portfolio attribution information and commentary on the effect of market conditions. The Board also considered information provided by ISS showing the investment performance of the Fund as compared to peer funds. In addition, the Board reviewed the methodology used by ISS to construct the group of peer funds for comparative purposes.
The Board also took into account its discussions with senior management at New York Life Investments concerning the Fund’s investment performance over various periods as well as discussions between the Fund’s portfolio management team and the members of the Board’s Investment Committee, which generally occur on an annual basis. In addition, the Board considered any specific actions that New York Life Investments or CBRE had taken, or had agreed to take, to seek to enhance Fund investment performance and the results of those actions.
Based on these considerations, among others, the Board concluded that its review of the Fund’s investment performance and related information supported a determination to approve the continuation of each of the Advisory Agreements.
Costs of the Services Provided, and Profits and Other Benefits Realized, by New York Life Investments and CBRE
The Board considered the costs of the services provided under each of the Advisory Agreements. The Board also considered the profits realized by New York Life Investments and its affiliates due to their relationships with the Fund as well as the MainStay Group of Funds. With respect to the profitability of CBRE’s relationship with the Fund, the Board considered information from New York Life Investments that CBRE’s subadvisory fee reflected an arm’s-length negotiation and that this fee is paid by New York Life Investments, not the Fund, and the relevance of CBRE’s profitability was considered by the Trustees in that context. On this basis, the Board primarily considered the costs and profitability for New York Life Investments and its affiliates with respect to the Fund.
In addition, the Board acknowledged the difficulty in obtaining reliable comparative data about mutual fund managers’ profitability because such information generally is not publicly available and may be impacted by numerous factors, including the structure of a fund manager’s organization, the types of funds it manages, the methodology used to allocate certain fixed costs to specific funds and the manager’s capital structure and costs of capital.
In evaluating the costs of the services provided by New York Life Investments and CBRE and profits realized by New York Life Investments and its affiliates and CBRE, the Board considered, among other factors, New York Life Investments’ and its affiliates’ and CBRE’s continuing investments in, or willingness to invest in, personnel and other resources to support and further enhance the management of the Fund, and that New York Life Investments is responsible for paying the subadvisory fee for the Fund. The Board also considered the financial resources of New York Life Investments and CBRE and acknowledged that New York Life Investments and CBRE must be in a position to recruit and retain experienced professional personnel and to maintain a strong financial position for New York Life Investments and CBRE to continue to provide high-quality services to the Fund. The Board recognized that the Fund benefits from the allocation of certain fixed costs among the funds in the MainStay Group of Funds, among other expected benefits resulting from its relationship with New York Life Investments.
The Board considered information regarding New York Life Investments’ methodology for calculating profitability and allocating costs provided by New York Life Investments in connection with the fund profitability analysis presented to the Board. The Board noted it had previously engaged an independent consultant to review the methods used to allocate costs among the funds in the MainStay Group of Funds. The Board also noted that the independent consultant had concluded that New York Life Investments’ methods for allocating costs and procedures for estimating overall profitability of the relationship with the funds in the MainStay Group of Funds are reasonable and that New York Life Investments continued to use the same method of calculating profit and allocating costs since the independent consultant’s review. The Board recognized the difficulty in calculating and evaluating a manager’s profitability with respect to the Fund and considered that other profitability methodologies may also be reasonable.
The Board also considered certain fall-out benefits that may be realized by New York Life Investments and its affiliates and CBRE and its affiliates due to their relationships with the Fund, including reputational and other indirect benefits. The Board recognized, for example, the benefits to CBRE from legally permitted “soft-dollar” arrangements by which brokers provide research and other services to CBRE in exchange for commissions paid by the Fund with respect to trades in the Fund’s portfolio securities. In this regard, the Board also requested and considered information from New York Life Investments concerning other material business relationships between CBRE and its affiliates and New York Life Investments and its affiliates and considered the existence of a strategic partnership between New York Life Investments and CBRE that relates to certain current and future products and represents a potential conflict of interest associated with New York Life Investments’ recommendation to approve the Subadvisory Agreement. In addition, the Board considered its review of the management agreement for a money market fund advised by New York Life Investments and an affiliated subadvisor that serves as an investment option for the Fund, including the potential rationale for and costs associated with investments in this money market fund by the Fund, if any, and considered information from
| 32 | MainStay CBRE Real Estate Fund |
New York Life Investments that the nature and type of specific investment advisory services provided to this money market fund are distinct from, or in addition to, the investment advisory services provided to the Fund.
The Board observed that, in addition to fees earned by New York Life Investments under the Management Agreement for managing the Fund, New York Life Investments’ affiliates also earn revenues from serving the Fund in various other capacities, including as the Fund’s transfer agent and distributor. The Board considered information about these other revenues and their impact on the profitability of the relationship with the Fund to New York Life Investments and its affiliates. The Board noted that, although it assessed the overall profitability of the relationship with the Fund to New York Life Investments and its affiliates as part of the contract review process, when considering the reasonableness of the fee paid to New York Life Investments under the Management Agreement, the Board considered the profitability of New York Life Investments’ relationship with the Fund on a pre-tax basis and without regard to distribution expenses incurred by New York Life Investments from its own resources.
After evaluating the information deemed relevant by the Trustees, the Board concluded that any profits realized by New York Life Investments and its affiliates due to their relationships with the Fund were not excessive, other expected benefits that may accrue to New York Life Investments and its affiliates are reasonable and other expected benefits that may accrue to CBRE and its affiliates are consistent with those expected for a subadvisor to a mutual fund. With respect to CBRE, the Board considered that any profits realized by CBRE due to its relationship with the Fund are the result of arm’s-length negotiations between New York Life Investments and CBRE, acknowledging that any such profits are based on the subadvisory fee paid to CBRE by New York Life Investments, not the Fund.
Management and Subadvisory Fees and Total Ordinary Operating Expenses
The Board evaluated the reasonableness of the fee paid under each of the Advisory Agreements and the Fund’s total ordinary operating expenses. The Board primarily considered the reasonableness of the management fee paid by the Fund to New York Life Investments because the subadvisory fee paid to CBRE is paid by New York Life Investments, not the Fund. The Board also considered the reasonableness of the subadvisory fee paid by New York Life Investments and the amount of the management fee retained by New York Life Investments.
In assessing the reasonableness of the Fund’s fees and expenses, the Board primarily considered comparative data provided by ISS on the fees and expenses charged by similar mutual funds managed by other investment advisers. The Board reviewed the methodology used by ISS to construct the group of peer funds for comparative purposes. In addition, the Board considered information provided by New York Life Investments and CBRE on fees charged to other investment advisory clients, including institutional separate accounts and/or other funds that follow investment strategies similar to those of the Fund, if any. The Board considered the contractual management fee schedules of the Fund as compared to those
of such other investment advisory clients, taking into account the rationale for any differences in fee schedules. The Board also took into account information provided by New York Life Investments about the more extensive scope of services provided to registered investment companies, such as the Fund, as compared with other investment advisory clients. Additionally, the Board considered the impact of voluntary waivers and expense limitation arrangements on the Fund’s net management fee and expenses. The Board also considered that in proposing fees for the Fund, New York Life Investments considers the competitive marketplace for mutual funds.
The Board took into account information from New York Life Investments, as provided in connection with the Board’s June 2022 meeting, regarding the reasonableness of the Fund’s transfer agent fee schedule, including industry data demonstrating that the fees that NYLIM Service Company LLC, an affiliate of New York Life Investments and the Fund’s transfer agent, charges the Fund are within the range of fees charged by transfer agents to other mutual funds. In addition, the Board considered NYLIM Service Company LLC’s profitability in connection with the transfer agent services it provides to the Fund. The Board also took into account information provided by NYLIM Service Company LLC regarding the sub-transfer agency payments it made to intermediaries in connection with the provision of sub-transfer agency services to the Fund.
The Board considered the extent to which transfer agent fees contributed to the total expenses of the Fund. The Board acknowledged the role that the MainStay Group of Funds historically has played in serving the investment needs of New York Life Insurance Company customers, who often maintain smaller account balances than other shareholders of funds, and the impact of small accounts on the expense ratios of Fund share classes. The Board also recognized measures that it and New York Life Investments have taken intended to mitigate the effect of small accounts on the expense ratios of Fund share classes, including through the imposition of an expense limitation on net transfer agency expenses. The Board also considered that NYLIM Service Company LLC had waived its contractual cost of living adjustments during the seven years prior to 2021.
Based on the factors outlined above, among other considerations, the Board concluded that the Fund’s management fee and total ordinary operating expenses are within a range that is competitive and support a conclusion that these fees and expenses are reasonable.
Economies of Scale
The Board considered information regarding economies of scale, including whether economies of scale may exist for the Fund and whether the Fund’s expense structure permits any economies of scale to be appropriately shared with the Fund’s shareholders. The Board also considered a report from New York Life Investments, previously prepared at the request of the Board, that addressed economies of scale, including with respect to the mutual fund business generally, and the various ways in which the benefits of economies of scale may be shared with the funds in the MainStay Group of Funds. Although the Board recognized the
Board Consideration and Approval of Management Agreement and Subadvisory Agreement (Unaudited) (continued)
difficulty of determining economies of scale with precision, the Board acknowledged that economies of scale may be shared with the Fund in a number of ways, including, for example, through the imposition of fee breakpoints, initially setting management fee rates at scale or making additional investments to enhance the services provided to the Fund. The Board reviewed information from New York Life Investments showing how the Fund’s management fee schedule compared to fee schedules of other funds and accounts managed by New York Life Investments. The Board also reviewed information from ISS showing how the Fund’s management fee schedule compared with fees paid for similar services by peer funds at varying asset levels.
Based on this information, the Board concluded that economies of scale are appropriately shared for the benefit of the Fund’s shareholders through the Fund’s expense structure and other methods to share benefits from economies of scale.
Conclusion
On the basis of the information and factors summarized above, among other information and factors deemed relevant by the Trustees, and the evaluation thereof, the Board unanimously voted to approve the continuation of each of the Advisory Agreements.
| 34 | MainStay CBRE Real Estate Fund |
Discussion of the Operation and Effectiveness of the Fund's Liquidity Risk Management Program (Unaudited)
In compliance with Rule 22e-4 under the Investment Company Act of 1940, as amended (the “Liquidity Rule”), the Fund has adopted and implemented a liquidity risk management program (the “Program”), which New York Life Investment Management LLC believes is reasonably designed to assess and manage the Fund's liquidity risk. A Fund's liquidity risk is the risk that the Fund could not meet requests to redeem shares issued by the Fund without significant dilution of the remaining investors’ interests in the Fund. The Board of Trustees of MainStay Funds Trust (the "Board") previously approved the designation of New York Life Investment Management LLC as administrator of the Program (the “Administrator”). The Administrator has established a Liquidity Risk Management Committee to assist the Administrator in the implementation and day-to-day administration of the Program and to otherwise support the Administrator in fulfilling its responsibilities under the Program.
At a meeting of the Board held on February 28, 2023, the Administrator provided the Board with a written report addressing the Program’s operation and assessing the adequacy and effectiveness of its implementation for the period from January 1, 2022, through December 31, 2022 (the "Review Period"), as required under the Liquidity Rule. The report noted that the Administrator concluded that (i) the Program operated effectively to assess and manage the Fund's liquidity risk, (ii) the Program has been and continues to be adequately and effectively implemented to monitor and, as applicable, respond to the Fund's liquidity developments and (iii) the Fund's investment strategy continues to be appropriate for an open-end fund. In addition, the report summarized the operation of the Program and the information and factors considered by the Administrator in its assessment of the Program’s implementation, such as the liquidity risk assessment framework and the liquidity classification methodologies, and discussed notable geopolitical, market and other economic events that impacted liquidity risk during the Review Period.
In accordance with the Program, the Fund's liquidity risk is assessed no less frequently than annually taking into consideration certain factors, as applicable, such as (i) investment strategy and liquidity of portfolio investments, (ii) short-term and long-term cash flow projections, and (iii) holdings of cash and cash equivalents, as well as borrowing arrangements and other funding sources. Certain factors are considered under both normal and reasonably foreseeable stressed conditions.
Each Fund portfolio investment is classified into one of four liquidity categories. The classification is based on a determination of the number of days it is reasonably expected to take to convert the investment into cash, or sell or dispose of the investment, in current market conditions without significantly changing the market value of the investment. The Administrator has delegated liquidity classification determinations to the Fund’s subadvisor, subject to appropriate oversight by the Administrator, and liquidity classification determinations are made by taking into account the Fund's reasonably anticipated trade size, various market, trading and investment-specific considerations, as well as market depth, and, in certain cases, third-party vendor data.
The Liquidity Rule requires funds that do not primarily hold assets that are highly liquid investments to adopt a minimum amount of net assets that must be invested in highly liquid investments that are assets (an “HLIM”). In addition, the Liquidity Rule limits a fund's investments in illiquid investments. Specifically, the Liquidity Rule prohibits acquisition of illiquid investments if, immediately after acquisition, doing so would result in a fund holding more than 15% of its net assets in illiquid investments that are assets. The Program includes provisions reasonably designed to determine, periodically review and comply with the HLIM requirement, as applicable, and to comply with the 15% limit on illiquid investments.
There can be no assurance that the Program will achieve its objectives under all circumstances in the future. Please refer to the Fund's prospectus for more information regarding the Fund's exposure to liquidity risk and other risks to which it may be subject.
Federal Income Tax
Information (Unaudited)
The Fund is required under the Internal Revenue Code to advise shareholders in a written statement as to the federal tax status of dividends paid by the Fund during such fiscal years.
Accordingly, the Fund paid $68,542,592 as long term capital gain distributions.
The dividends paid by the Fund during the fiscal year ended April 30, 2023 should be multiplied by 0.01% to arrive at the amount eligible for the corporate dividend-received deduction.
In February 2024, shareholders will receive an IRS Form 1099-DIV or substitute Form 1099, which will show the federal tax status of the distributions received by shareholders in calendar year 2023. The amounts that will be reported on such 1099-DIV or substitute Form 1099 will be the amounts you are to use on your federal income tax return and will differ from the amounts which we must report for the Fund's fiscal year ended April 30, 2023.
Proxy Voting Policies and Procedures and Proxy Voting Record
The Fund is required to file with the SEC its proxy voting record for the 12-month period ending June 30 on Form N-PX. A description of the policies and procedures that are used to vote proxies relating to portfolio securities of the Fund is available free of charge upon request by calling 800-624-6782 or visiting the SEC’s website at www.sec.gov. The most recent Form N-PX or proxy voting record is available free of charge upon request by calling 800-624-6782; visiting newyorklifeinvestments.com; or visiting the SEC’s website at www.sec.gov.
Shareholder Reports and Quarterly Portfolio Disclosure
The Fund is required to file its complete schedule of portfolio holdings with the SEC 60 days after its first and third fiscal quarter on Form N-PORT. The Fund's holdings report is available free of charge upon request by calling New York Life Investments at 800-624-6782.
| 36 | MainStay CBRE Real Estate Fund |
Board of Trustees and Officers (Unaudited)
The Trustees and officers of the Fund are listed below. The Board oversees the MainStay Group of Funds (which consists of MainStay Funds and MainStay Funds Trust), MainStay VP Funds Trust, MainStay MacKay DefinedTerm Municipal Opportunities Fund, MainStay CBRE Global Infrastructure Megatrends Fund, the Manager and the Subadvisors, and elects the officers of the Funds who are responsible for the day-to-day operations of the Fund. Information pertaining to the Trustees and officers is set forth below. Each Trustee serves until his or her successor is elected and qualified or until his or her resignation, death or removal.
Under the Board’s retirement policy, unless an exception is made, a Trustee must tender his or her resignation by the end of the calendar year during which he or she reaches the age of 75. Officers are elected annually by the Board. The business address of each Trustee and officer listed below is 51 Madison Avenue, New York, New York 10010. A majority of the Trustees are not “interested persons” (as defined by the 1940 Act and rules adopted by the SEC thereunder) of the Fund (“Independent Trustees”).
| | Name and
Year of Birth | Term of Office,
Position(s) Held and
Length of Service | Principal Occupation(s)
During Past Five Years | Number of
Portfolios in
Fund Complex
Overseen by
Trustee | Other Directorships
Held by Trustee |
| | | | | | |
| | Naïm Abou-Jaoudé*
1966 | MainStay Funds: Trustee
since June 2023;
MainStay Funds Trust:
Trustee since June 2023 | Chief Executive Officer of New York Life Investment Management LLC since 2023. Previously, Abou-Jaoudé was the Chief Executive Officer of Candriam (an affiliate of New York Life Investment Management LLC) from 2007 to 2023. | 79 | MainStay VP Funds Trust:
Trustee since June 2023 (31 portfolios);
MainStay MacKay DefinedTerm Municipal Opportunities Fund: Trustee
since June 2023;
MainStay CBRE Global Infrastructure Megatrends Fund: Trustee
since June 2023; and
New York Life Investment Management International: Chair since 2015 |
| * | This Trustee is considered to be an “interested person” of the MainStay Group of Funds, MainStay VP Funds Trust, MainStay CBRE Global Infrastructure Megatrends Fund and MainStay MacKay DefinedTerm Municipal Opportunities Fund, within the meaning of the 1940 Act because of his affiliation with New York Life Insurance Company, New York Life Investment Management LLC, Candriam, IndexIQ Advisors LLC, MacKay Shields LLC, NYL Investors LLC, NYLIFE Securities LLC and/or NYLIFE Distributors LLC, as described in detail above in the column entitled “Principal Occupation(s) During Past Five Years.” |
| | |
Board of Trustees and Officers (Unaudited) (continued)
| | Name and
Year of Birth | Term of Office,
Position(s) Held and
Length of Service | Principal Occupation(s)
During Past Five Years | Number of
Portfolios in
Fund Complex
Overseen by
Trustee | Other Directorships
Held by Trustee |
| | | | | | |
| | David H. Chow
1957 | MainStay Funds: Trustee since January 2016, Advisory Board Member (June 2015 to December 2015);MainStay Funds Trust:
Trustee since January 2016, Advisory Board Member (June 2015 to December 2015) | Founder and CEO, DanCourt Management, LLC (since 1999) | 79 | MainStay VP Funds Trust: Trustee since January 2016, Advisory Board Member (June 2015 to December 2015) (31 portfolios);
MainStay MacKay DefinedTerm Municipal Opportunities Fund: Trustee since January 2016, Advisory Board Member (June 2015 to December 2015);
MainStay CBRE Global Infrastructure Megatrends Fund: Trustee since June 2021; VanEck Vectors Group of Exchange-Traded Funds: Trustee since 2006 and Independent Chairman of the Board of Trustees from 2008 to 2022 (57 portfolios); Berea College of Kentucky: Trustee since 2009, Chair of the Investment Committee since 2018 |
| | Karen Hammond
1956 | MainStay Funds: Trustee since December 2021, Advisory Board Member (June 2021 to December 2021);MainStay Funds Trust:
Trustee since December 2021, Advisory Board Member (June 2021 to December 2021)
| Retired, Managing Director, Devonshire Investors (2007 to 2013); Senior Vice President, Fidelity Management & Research Co. (2005 to 2007); Senior Vice President and Corporate Treasurer, FMR Corp. (2003 to 2005); Chief Operating Officer, Fidelity Investments Japan (2001 to 2003) | 79 | MainStay VP Funds Trust: Trustee since December 2021, Advisory Board Member (June 2021 to December 2021) (31 portfolios);
MainStay MacKay DefinedTerm Municipal Opportunities Fund: Trustee since December 2021, Advisory Board Member (June 2021 to December 2021);
MainStay CBRE Global Infrastructure Megatrends Fund: Trustee since December 2021, Advisory Board Member (June 2021 to December 2021);
Two Harbors Investment Corp.: Director since 2018;
Rhode Island State Investment Commission: Member since 2017; and
Blue Cross Blue Shield of Rhode Island: Director since 2019 |
| | Susan B. Kerley
1951 | MainStay Funds: Chairman since January 2017 and Trustee since 2007;MainStay Funds Trust:
Chairman since January 2017 and Trustee since 1990** | President, Strategic Management Advisors LLC (since 1990) | 79 | MainStay VP Funds Trust: Chairman since January 2017 and Trustee since 2007 (31 portfolios)*;
MainStay MacKay DefinedTerm Municipal Opportunities Fund: Chairman since January 2017 and Trustee since 2011;
MainStay CBRE Global Infrastructure Megatrends Fund: Trustee since June 2021; and Legg Mason Partners Funds: Trustee since 1991 (45 portfolios) |
| | Alan R. Latshaw
1951 | MainStay Funds: Trusteesince 2006;MainStay Funds Trust:
Trustee since 2007** | Retired; Partner, Ernst & Young LLP (2002 to 2003); Partner, Arthur Andersen LLP (1989 to 2002); Consultant to the MainStay Funds Audit and Compliance Committee (2004 to 2006) | 79 | MainStay VP Funds Trust: Trustee since 2007 (31 portfolios)*;
MainStay MacKay DefinedTerm Municipal Opportunities Fund: Trustee since 2011; and
MainStay CBRE Global Infrastructure Megatrends Fund: Trustee since June 2021 |
| 38 | MainStay CBRE Real Estate Fund |
| | Name and
Year of Birth | Term of Office,
Position(s) Held and
Length of Service | Principal Occupation(s)
During Past Five Years | Number of
Portfolios in
Fund Complex
Overseen by
Trustee | Other Directorships
Held by Trustee |
| | | | | | |
| | Jacques P. Perold
1958 | MainStay Funds: Trustee since January 2016, Advisory Board Member (June 2015to December 2015);MainStay Funds Trust:
Trustee since January 2016, Advisory Board Member (June 2015 to December 2015) | Founder and Chief Executive Officer, CapShift Advisors LLC (since 2018); President, Fidelity Management & Research Company (2009 to 2014); President and Chief Investment Officer, Geode Capital Management, LLC (2001 to 2009) | 79 | MainStay VP Funds Trust: Trustee since January 2016, Advisory Board Member (June 2015 to December 2015) (31 portfolios);
MainStay MacKay DefinedTerm Municipal Opportunities Fund: Trustee since January 2016, Advisory Board Member (June 2015 to December 2015);
MainStay CBRE Global Infrastructure Megatrends Fund: Trustee since June 2021; Allstate Corporation: Director since 2015; and MSCI Inc.: Director since 2017 |
| | Richard S. Trutanic
1952 | MainStay Funds: Trustee since 1994;MainStay Funds Trust:
Trustee since 2007** | Chairman and Chief Executive Officer, Somerset & Company (financial advisory firm) (since 2004); Managing Director, The Carlyle Group (private investment firm) (2002 to 2004); Senior Managing Director, Partner and Board Member, Groupe Arnault S.A. (private investment firm) (1999 to 2002) | 79 | MainStay VP Funds Trust: Trustee since 2007 (31 portfolios)*;
MainStay MacKay DefinedTerm Municipal Opportunities Fund: Trustee since 2011; and MainStay CBRE Global Infrastructure Megatrends Fund: Trustee since June 2021 |
| * | Includes prior service as a Director of MainStay VP Series Fund, Inc., the predecessor to MainStay VP Funds Trust. |
| ** | Includes prior service as a Director/Trustee of certain predecessor entities to MainStay Funds Trust. |
Board of Trustees and Officers (Unaudited) (continued)
| | Name and
Year of Birth | Position(s) Held and
Length of Service | Principal Occupation(s)
During Past Five Years | |
| | | | | |
| | Kirk C. Lehneis
1974 | President, MainStay Funds, MainStay Funds Trust (since 2017) | Chief Operating Officer and Senior Managing Director (since 2016), New York Life Investment Management LLC and New York Life Investment Management Holdings LLC; Member of the Board of Managers (since 2017) and Senior Managing Director (since 2018), NYLIFE Distributors LLC; Chairman of the Board and Senior Managing Director, NYLIM Service Company LLC (since 2017); Trustee, President and Principal Executive Officer of IndexIQ Trust, IndexIQ ETF Trust and IndexIQ Active ETF Trust (since January 2018); President, MainStay CBRE Global Infrastructure Megatrends Fund (since 2021), MainStay MacKay DefinedTerm Municipal Opportunities Fund and MainStay VP Funds Trust (since 2017); Senior Managing Director, Global Product Development (2015-2016); Managing Director, Product Development (2010 to 2015), New York Life Investment Management LLC | |
| | Jack R. Benintende
1964 | Treasurer and Principal Financial and Accounting Officer, MainStay Funds (since 2007), MainStay Funds Trust (since 2009) | Managing Director, New York Life Investment Management LLC (since 2007); Treasurer and Principal Financial and Accounting Officer, MainStay CBRE Global Infrastructure Megatrends Fund (since 2021), MainStay MacKay DefinedTerm Municipal Opportunities Fund (since 2011) and MainStay VP Funds Trust (since 2007)**; and Assistant Treasurer, New York Life Investment Management Holdings LLC (2008 to 2012) | |
| | J. Kevin Gao
1967 | Secretary and Chief Legal Officer, MainStay Funds and MainStay Funds Trust (since 2010) | Managing Director and Associate General Counsel, New York Life Investment Management LLC (since 2010); Secretary and Chief Legal Officer, MainStay CBRE Global Infrastructure Megatrends Fund (since 2021), MainStay MacKay DefinedTerm Municipal Opportunities Fund (since 2011) and MainStay VP Funds Trust (since 2010)** | |
| | Scott T. Harrington
1959 | Vice President— Administration, MainStay Funds (since 2005), MainStay Funds Trust (since 2009) | Managing Director, New York Life Investment Management LLC (including predecessor advisory organizations) (since 2000); Member of the Board of Directors, New York Life Trust Company (since 2009); Vice President—Administration, MainStay CBRE Global Infrastructure Megatrends Fund (since 2021), MainStay MacKay DefinedTerm Municipal Opportunities Fund (since 2011) and MainStay VP Funds Trust (since 2005)** | |
| | Kevin M. Gleason
1967 | Vice President and Chief Compliance Officer, MainStay Funds and MainStay Funds Trust (since June 2022) | Vice President and Chief Compliance Officer, IndexIQ Trust, IndexIQ ETF Trust and Index IQ Active ETF Trust (since June 2022); Vice President and Chief Compliance Officer, MainStay CBRE Global Infrastructure Megatrends Fund, MainStay VP Funds Trust and MainStay MacKay DefinedTerm Municipal Opportunities Fund (since June 2022); Senior Vice President, Voya Investment Management and Chief Compliance Officer, Voya Family of Funds (2012-2022) | |
| * | The officers listed above are considered to be “interested persons” of the MainStay Group of Funds, MainStay VP Funds Trust, MainStay CBRE Global Infrastructure Megatrends Fund and MainStay MacKay DefinedTerm Municipal Opportunities Fund within the meaning of the 1940 Act because of their affiliation with the MainStay Group of Funds, New York Life Insurance Company and/or its affiliates, including New York Life Investment Management LLC, New York Life Insurance Company, NYLIM Service Company LLC, NYLIFE Securities LLC and/or NYLIFE Distributors LLC, as described in detail in the column captioned “Principal Occupation(s) During Past Five Years.” Officers are elected annually by the Board. |
| ** | Includes prior service as an Officer of MainStay VP Series Fund, Inc., the predecessor to MainStay VP Funds Trust. |
Officers of the Trust (Who are not Trustees)*
| 40 | MainStay CBRE Real Estate Fund |
This page intentionally left blank.
This page intentionally left blank.
Equity
U.S. Equity
MainStay Epoch U.S. Equity Yield Fund
MainStay Fiera SMID Growth Fund
MainStay S&P 500 Index Fund
MainStay Winslow Large Cap Growth Fund
MainStay WMC Enduring Capital Fund
MainStay WMC Growth Fund
MainStay WMC Small Companies Fund
MainStay WMC Value Fund
International Equity
MainStay Epoch International Choice Fund
MainStay MacKay International Equity Fund
MainStay WMC International Research Equity Fund
Emerging Markets Equity
MainStay Candriam Emerging Markets Equity Fund
Global Equity
MainStay Epoch Capital Growth Fund
MainStay Epoch Global Equity Yield Fund
Fixed Income
Taxable Income
MainStay Candriam Emerging Markets Debt Fund
MainStay Floating Rate Fund
MainStay MacKay High Yield Corporate Bond Fund
MainStay MacKay Short Duration High Yield Fund
MainStay MacKay Strategic Bond Fund
MainStay MacKay Total Return Bond Fund
MainStay MacKay U.S. Infrastructure Bond Fund
MainStay Short Term Bond Fund
Tax-Exempt Income
MainStay MacKay California Tax Free Opportunities Fund1
MainStay MacKay High Yield Municipal Bond Fund
MainStay MacKay New York Tax Free Opportunities Fund2
MainStay MacKay Short Term Municipal Fund
MainStay MacKay Strategic Municipal Allocation Fund
MainStay MacKay Tax Free Bond Fund
Money Market
MainStay Money Market Fund
Mixed Asset
MainStay Balanced Fund
MainStay Income Builder Fund
MainStay MacKay Convertible Fund
Speciality
MainStay CBRE Global Infrastructure Fund
MainStay CBRE Real Estate Fund
MainStay Cushing MLP Premier Fund
Asset Allocation
MainStay Conservative Allocation Fund
MainStay Conservative ETF Allocation Fund
MainStay Defensive ETF Allocation Fund
MainStay Equity Allocation Fund
MainStay Equity ETF Allocation Fund
MainStay ESG Multi-Asset Allocation Fund
MainStay Growth Allocation Fund
MainStay Growth ETF Allocation Fund
MainStay Moderate Allocation Fund
MainStay Moderate ETF Allocation Fund
Manager
New York Life Investment Management LLC
New York, New York
Subadvisors
Candriam3
Strassen, Luxembourg
CBRE Investment Management Listed Real Assets LLC
Radnor, Pennsylvania
Cushing Asset Management, LP
Dallas, Texas
Epoch Investment Partners, Inc.
New York, New York
Fiera Capital Inc.
New York, New York
IndexIQ Advisors LLC3
New York, New York
MacKay Shields LLC3
New York, New York
NYL Investors LLC3
New York, New York
Wellington Management Company LLP
Boston, Massachusetts
Winslow Capital Management, LLC
Minneapolis, Minnesota
Legal Counsel
Dechert LLP
Washington, District of Columbia
Independent Registered Public Accounting Firm
KPMG LLP
Philadelphia, Pennsylvania
Distributor
NYLIFE Distributors LLC3
Jersey City, New Jersey
Custodian
JPMorgan Chase Bank, N.A.
New York, New York
1.
This Fund is registered for sale in AZ, CA, NV, OR, TX, UT, WA and MI (Class A and Class I shares only), and CO, FL, GA, HI, ID, MA, MD, NH, NJ and NY (Class I shares only).
| 2. | This Fund is registered for sale in CA, CT, DE, FL, MA, NJ, NY and VT. |
| 3. | An affiliate of New York Life Investment Management LLC. |
Not part of the Annual Report
For more information
800-624-6782
newyorklifeinvestments.com
“New York Life Investments” is both a service mark, and the common trade name, of certain investment advisors affiliated with New York Life Insurance Company. The MainStay Funds® are managed by New York Life Investment Management LLC and distributed by NYLIFE Distributors LLC, 30 Hudson Street, Jersey City, NJ 07302, a wholly owned subsidiary of New York Life Insurance Company. NYLIFE Distributors LLC is a Member FINRA/SIPC.
©2023 NYLIFE Distributors LLC. All rights reserved.
| 5022127MS043-23 | MSCBRE11-06/23 |
(NYLIM) NL480
MainStay MacKay Short Term Municipal Fund
Message from the President and Annual Report
April 30, 2023
Sign up for e-delivery of your shareholder reports. For full details on e-delivery, including who can participate and what you can receive via e-delivery,
please log in to newyorklifeinvestments.com/accounts.
| Not FDIC/NCUA Insured | Not a Deposit | May Lose Value | No Bank Guarantee | Not Insured by Any Government Agency |
This page intentionally left blank
Message from the President
Despite high levels of volatility and sharp, short-term shifts in value, broadly based stock and bond indices saw relatively modest overall changes during the 12-month reporting period ended April 30, 2023. A deeply challenging investment environment during the last eight months of 2022, driven by increasing inflationary pressures and aggressive monetary efforts to curb them, was followed by a more positive, but uneven, economic and monetary backdrop during the first four months of 2023.
In April 2022, before the start of the reporting period, U.S. inflation stood at an annualized rate of 8.3%, up from 4.2% a year earlier. The U.S. Federal Reserve (the “Fed”), had begun to take steps to curb inflation, raising the federal funds rate from near zero in March 2022. Eight separate rate hikes during the reporting period brought the benchmark rate up to 4.75–5.00% in March 2023. Inflation seemed to respond, easing steadily from a peak of 9.1% in June 2022 to 4.9% in April 2023. Although further interest rate increases are expected in 2023, by the end of the reporting period, it appeared that the Fed might be nearing the end of the current rate-hike cycle. Economic growth, although slower, remained positive, supported by historically high levels of employment and robust consumer spending. International economies experienced similar trends, with more modest central bank interest-rate hikes curbing inflation to a degree.
Equity market behavior during the reporting period reflected the arc of monetary policy and economic developments. From May through early October 2022, as inflation raged and interest-rate increases accelerated, investors shied away from perceived risk, favoring relatively defensive and value-oriented sectors over growth-oriented sectors. The S&P 500® Index, a widely regarded benchmark of U.S. market performance, declined by more than 13% during this time, while international stocks suffered even sharper losses. These trends reversed from mid-October 2022 through the end of the reporting period, as inflationary pressures eased and markets began to anticipate an end to rising interest rates. Between mid-October 2022 and April 30, 2023, the S&P 500® Index regained all the ground it lost earlier, ending in modestly positive territory. International developed-markets stocks bounced back even stronger, prompted by surprisingly robust economic resilience in Europe and further bolstered by China’s
reopening after the government rescinded its “zero-COVID-19” policy and eased regulatory restrictions on key industries. The declining value of the U.S. dollar relative to other currencies also enhanced international market equity performance. Emerging markets generally lagged their developed-markets counterparts while outperforming U.S. markets.
Fixed-income markets followed a similar pattern of retreat and recovery. Bond prices trended sharply downward early in the reporting period, as yields rose along with interest rates. Short-term yields rose faster than long-term yields, producing a yield curve inversion—with long-term rates lower than short-term rates—that persisted from July through the end of the reporting period. However, market sentiment improved in the second half of the reporting period as inflationary pressures eased. As the Fed decreased the magnitude of rate increases, focus turned toward the possibility of eventual rate reductions and a potential ‘soft landing’ for the economy. On the negative side, a small number of high-profile, regional U.S. bank failures in March and April 2023 raised fears of possible wider banking industry contagion and future credit constraints.
While many market observers believe the Fed has neared the end of the current cycle of rate increases, the central bank’s rhetoric remains sharply focused on its target inflation rate of 2%. Only time will tell if the market’s favorable expectations prove well founded.
However the economic story unfolds in the months and years to come, we remain dedicated to providing you with the one-on-one philosophy and diversified, multi-boutique investment resources that set New York Life Investments apart. Thank you for trusting us to help you meet your investment needs.
Sincerely,
Kirk C. Lehneis
President
The opinions expressed are as of the date of this report and are subject to change. There is no guarantee that any forecast made will come to pass. This material does not constitute investment advice and is not intended as an endorsement of any specific investment. Past performance is no guarantee of future results.
Not part of the Annual Report
Investors should refer to the Fund’s Summary Prospectus and/or Prospectus and consider the Fund’s investment objectives, strategies, risks, charges and expenses carefully before investing. The Summary Prospectus and/or Prospectus contain this and other information about the Fund. You may obtain copies of the Fund’s Summary Prospectus, Prospectus and Statement of Additional Information, which includes information about the MainStay Funds Trust's Trustees, free of charge, upon request, by calling toll-free 800-624-6782, by writing to NYLIFE Distributors LLC, Attn: MainStay Marketing Department, 30 Hudson Street, Jersey City, NJ 07302 or by sending an e-mail to MainStayShareholderServices@nylim.com. These documents are also available via the MainStay Funds’ website at newyorklifeinvestments.com. Please read the Fund’s Summary Prospectus and/or Prospectus carefully before investing.
Investment and Performance Comparison (Unaudited)
Performance data quoted represents past performance. Past performance is no guarantee of future results. Because of market volatility and other factors, current performance may be lower or higher than the figures shown. Investment return and principal value will fluctuate, and as a result, when shares are redeemed, they may be worth more or less than their original cost. The graph below depicts the historical performance of Class I shares of the Fund. Performance will vary from class to class based on differences in class-specific expenses and sales charges. For performance information current to the most recent month-end, please call 800-624-6782 or visit newyorklifeinvestments.com.
The performance table and graph do not reflect the deduction of taxes that a shareholder would pay on distributions or Fund share redemptions. Total returns reflect maximum applicable sales charges as indicated in the table below, if any, changes in share price, and reinvestment of dividend and capital gain distributions. The graph assumes the initial investment amount shown below and reflects the deduction of all sales charges that would have applied for the period of investment. Performance figures may reflect certain fee waivers and/or expense limitations, without which total returns may have been lower. For more information on share classes and current fee waivers and/or expense limitations (if any), please refer to the Notes to Financial Statements.
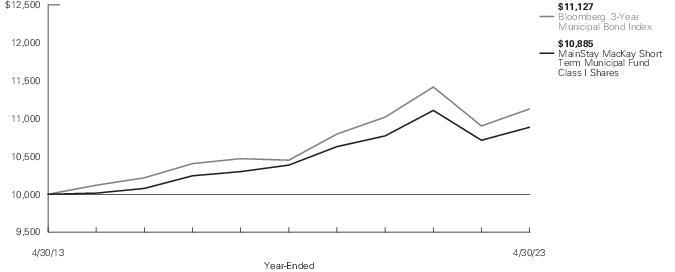
| Average Annual Total Returns for the Year-Ended April 30, 2023 |
| Class | Sales Charge | | Inception
Date1 | One
Year | Five
Years | Ten Years
or Since
Inception | Gross
Expense
Ratio2 |
| Class A Shares | Maximum 1.00% Initial Sales Charge | With sales charges | 1/2/2004 | 0.31% | 0.44% | 0.27% | 0.67% |
| | | Excluding sales charges | | 1.32 | 0.64 | 0.58 | 0.67 |
| Class A2 Shares | Maximum 2.00% Initial Sales Charge | With sales charges | 9/30/2020 | -0.71 | N/A | -1.46 | 0.67 |
| | | Excluding sales charges | | 1.32 | N/A | -0.69 | 0.67 |
| Investor Class Shares3, 4 | Maximum 0.50% Initial Sales Charge | With sales charges | 2/28/2008 | 0.48 | 0.09 | -0.11 | 1.24 |
| | | Excluding sales charges | | 0.99 | 0.29 | 0.20 | 1.24 |
| Class I Shares | No Sales Charge | | 1/2/1991 | 1.60 | 0.94 | 0.85 | 0.42 |
| Class R6 Shares | No Sales Charge | | 5/2/2022 | N/A | N/A | 1.60 | 0.40 |
| 1. | Effective June 1, 2015, the Fund changed, among other things, its investment objective and principal investment strategies. Effective May 22, 2018, the Fund made further changes to, among other things, its principal investment strategies. Effective February 28, 2019, the Fund further changed its investment objective. The performance information shown in this report reflects the Fund’s prior investment objectives and principal investment strategies, as applicable. |
| 2. | The gross expense ratios presented reflect the Fund’s “Total Annual Fund Operating Expenses” from the most recent Prospectus, as supplemented, and may differ from other expense ratios disclosed in this report. |
| 3. | Prior to June 1, 2015, the maximum initial sales charge was 3.00%, which is reflected in the average annual total return figures shown. |
| 4. | From June 1, 2015 to June 30, 2020, the maximum initial sales charge was 1.00%, which is reflected in the applicable average annual total return figures shown. |
The footnotes on the next page are an integral part of the table and graph and should be carefully read in conjunction with them.
| Benchmark Performance* | One
Year | Five
Years | Ten
Years |
| Bloomberg 3-Year Municipal Bond Index1 | 2.06% | 1.26% | 1.07% |
| Morningstar Muni National Short Category Average2 | 1.86 | 1.05 | 0.82 |
| * | Returns for indices reflect no deductions for fees, expenses or taxes, except for foreign withholding taxes where applicable. Results assume reinvestment of all dividends and capital gains. An investment cannot be made directly in an index. |
| 1. | The Bloomberg 3-Year Municipal Bond Index is the Fund's primary broad-based securities-market index for comparison purposes. The Bloomberg 3-Year Municipal Bond Index is considered representative of the broad market for investment grade, tax-exempt bonds with a maturity range of 2-4 years. |
| 2. | The Morningstar Muni National Short Category Average is representative of funds that invest in bonds issued by state and local governments to fund public projects. The income from these bonds is generally free from federal taxes and/or from state taxes in the issuing state. To lower risk, some of these funds spread their assets across many states and sectors. Other funds buy bonds from only one state in order to get the state-tax benefit. These funds have durations of less than 4.5 years. Results are based on average total returns of similar funds with all dividends and capital gain distributions reinvested. |
The footnotes on the preceding page are an integral part of the table and graph and should be carefully read in conjunction with them.
| 6 | MainStay MacKay Short Term Municipal Fund |
Cost in Dollars of a $1,000 Investment in MainStay MacKay Short Term Municipal Fund (Unaudited)
The example below is intended to describe the fees and expenses borne by shareholders during the six-month period from November 1, 2022 to April 30, 2023, and the impact of those costs on your investment.
Example
As a shareholder of the Fund you incur two types of costs: (1) transaction costs, including exchange fees and sales charges (loads) on purchases (as applicable), and (2) ongoing costs, including management fees, distribution and/or service (12b-1) fees and other Fund expenses (as applicable). This example is intended to help you understand your ongoing costs (in dollars) of investing in the Fund and to compare these costs with the ongoing costs of investing in other mutual funds. The example is based on an investment of $1,000 made at the beginning of the six-month period and held for the entire period from November 1, 2022 to April 30, 2023.
This example illustrates your Fund’s ongoing costs in two ways:
Actual Expenses
The second and third data columns in the table below provide information about actual account values and actual expenses. You may use the information in these columns, together with the amount you invested, to estimate the expenses that you paid during the six months ended April 30, 2023. Simply divide your account value by $1,000 (for example, an
$8,600 account value divided by $1,000 = 8.6), then multiply the result by the number under the heading entitled “Expenses Paid During Period” to estimate the expenses you paid on your account during this period.
Hypothetical Example for Comparison Purposes
The fourth and fifth data columns in the table below provide information about hypothetical account values and hypothetical expenses based on the Fund’s actual expense ratio and an assumed rate of return of 5% per year before expenses, which is not the Fund’s actual return. The hypothetical account values and expenses may not be used to estimate the actual ending account balances or expenses you paid for the six-month period shown. You may use this information to compare the ongoing costs of investing in the Fund with the ongoing costs of investing in other mutual funds. To do so, compare this 5% hypothetical example with the 5% hypothetical examples that appear in the shareholder reports of the other mutual funds.
Please note that the expenses shown in the table are meant to highlight your ongoing costs only and do not reflect any transactional costs, such as exchange fees or sales charges (loads). Therefore, the fourth and fifth data columns of the table are useful in comparing ongoing costs only and will not help you determine the relative total costs of owning different funds. In addition, if these transactional costs were included, your costs would have been higher.
| Share Class | Beginning
Account
Value
11/1/22 | Ending Account
Value (Based
on Actual
Returns and
Expenses)
4/30/23 | Expenses
Paid
During
Period1 | Ending Account
Value (Based
on Hypothetical
5% Annualized
Return and
Actual Expenses)
4/30/23 | Expenses
Paid
During
Period1 | Net Expense
Ratio
During
Period2 |
| Class A Shares | $1,000.00 | $1,029.30 | $3.47 | $1,021.37 | $3.46 | 0.69% |
| Class A2 Shares | $1,000.00 | $1,028.20 | $3.47 | $1,021.37 | $3.46 | 0.69% |
| Investor Class Shares | $1,000.00 | $1,026.50 | $5.07 | $1,019.79 | $5.06 | 1.01% |
| Class I Shares | $1,000.00 | $1,030.80 | $2.01 | $1,022.81 | $2.01 | 0.40% |
| Class R6 Shares | $1,000.00 | $1,029.70 | $2.01 | $1,022.81 | $2.01 | 0.40% |
| 1. | Expenses are equal to the Fund’s annualized expense ratio of each class multiplied by the average account value over the period, divided by 365 and multiplied by 181 (to reflect the six-month period). The table above represents the actual expenses incurred during the six-month period. In addition to the fees and expenses which the Fund bears directly, it also indirectly bears a pro rata share of the fees and expenses of the underlying funds in which it invests. Such indirect expenses are not included in the above-reported expense figures. |
| 2. | Expenses are equal to the Fund's annualized expense ratio to reflect the six-month period. |
Portfolio Composition as of April 30, 2023 (Unaudited)
See Portfolio of Investments beginning on page 11 for specific holdings within these categories. The Fund's holdings are subject to change.
Top Ten Holdings and/or Issuers Held as of April 30, 2023 (excluding short-term investments) (Unaudited)
| 1. | Black Belt Energy Gas District, 4.00%-5.50%, due 12/1/23–11/1/53 |
| 2. | State of Illinois, 5.00%-6.00%, due 10/1/23–11/1/29 |
| 3. | City of Chicago, (zero coupon)-5.25%, due 1/1/24–1/1/30 |
| 4. | Matching Fund Special Purpose Securitization Corp., 5.00%, due 10/1/25–10/1/26 |
| 5. | New Jersey Transportation Trust Fund Authority, (zero coupon)-5.00%, due 6/15/24–6/15/30 |
| 6. | Louisiana Stadium & Exposition District, 1.872%-5.00%, due 7/3/23 |
| 7. | Arizona Health Facilities Authority, 4.11%-5.00%, due 12/1/26–1/1/46 |
| 8. | County of King, 0.625%-4.09%, due 12/1/29–1/1/40 |
| 9. | Texas Municipal Gas Acquisition & Supply Corp. II, 3.902%, due 9/15/27 |
| 10. | Louisiana Local Government Environmental Facilities & Community Development Authority, 3.615%-5.081%, due 2/1/29–6/1/31 |
| 8 | MainStay MacKay Short Term Municipal Fund |
Portfolio Management Discussion and Analysis (Unaudited)
Questions answered by portfolio managers John Loffredo, CFA, Robert DiMella, CFA, Michael Petty, David Dowden, Scott Sprauer, Frances Lewis and John Lawlor of MacKay Shields LLC, the Fund’s Subadvisor.
How did MainStay MacKay Short Term Municipal Fund perform relative to its benchmark and peer group during the 12 months ended April 30, 2023?
For the 12 months ended April 30, 2023, Class I shares of MainStay MacKay Short Term Municipal Fund returned 1.60%, underperforming the 2.06% return of the Fund’s benchmark, the Bloomberg 3-Year Municipal Bond Index (the “Index”). Over the same period, Class I shares also underperformed the 1.86% return of the Morningstar Muni National Short Category Average.1
What factors affected the Fund’s relative performance during the reporting period?
During the reporting period, the Fund underperformed the Index partially due to underweight exposure to 5+% coupon bonds. In addition, underweight exposure to bonds maturing between 3 and 4 years weakened relative performance. From a ratings perspective, an underweight allocation to AA-rated2 bonds also detracted from the relative performance. Across the geographic landscape, underweight exposure to California holdings detracted on a relative basis, although overweight exposure to holdings from Alabama and Illinois helped offset some of these results.
During the reporting period, were there any market events that materially impacted the Fund’s performance or liquidity?
The U.S. Federal Reserve’s hawkish stance against inflation had a negative impact on performance as interest rates increased dramatically during the first half of the reporting period, producing an inverted Treasury yield curve.3
During the reporting period, how was the Fund’s performance materially affected by investments in derivatives?
The Fund’s performance was not materially affected by investments in derivatives during the reporting period.
What was the Fund’s duration4 strategy during the reporting period?
As relative value investors, the management team aims to keep the Fund’s duration within a neutral range relative to that of the Index. As of October 31, 2023, the Fund's modified duration to worst5 was 1.88 years while the Index’s modified duration to worst was 2.42 years.
During the reporting period, which sectors were the strongest positive contributors to the Fund’s relative performance and which sectors were particularly weak?
Across sectors, overweight exposure and security selection in the IDR/PCR (industry development revenue/pollution control revenue) and special tax sectors made positive contributions to relative results. (Contributions take weightings and total returns into account.) Underweight exposure and security selection in the state general obligation sector detracted, as did overweight exposure to the education sector.
What were some of the Fund’s largest purchases and sales during the reporting period?
As the Fund remains focused on diversification and liquidity, no individual purchase or sale would have been considered significant, although sector overweights and security structure, in their entirety, did have an impact.
How did the Fund’s sector weighting change during the reporting period?
During the reporting period, there were no material changes to the weightings in the Fund. There were small increases in the Fund’s exposure to the state general obligation and housing sectors, and
| 1. | See "Investment and Performance Comparison" for other share class returns, which may be higher or lower than Class I share returns, and for more information on benchmark and peer group returns. |
| 2. | An obligation rated ‘AA’ by Standard & Poor’s (“S&P”) is deemed by S&P to differ from the highest-rated obligations only to a small degree. In the opinion of S&P, the obligor's capacity to meet its financial commitment on the obligation is very strong. When applied to Fund holdings, ratings are based solely on the creditworthiness of the bonds in the portfolio and are not meant to represent the security or safety of the Fund. |
| 3. | The yield curve is a line that plots the yields of various securities of similar quality—typically U.S. Treasury issues—across a range of maturities. The U.S. Treasury yield curve serves as a benchmark for other debt and is used in economic forecasting. |
| 4. | Duration is a measure of the price sensitivity of a fixed-income investment to changes in interest rates. Duration is expressed as a number of years and is considered a more accurate sensitivity gauge than average maturity. |
| 5. | Modified duration is inversely related to the approximate percentage change in price for a given change in yield. Duration to worst is the duration of a bond computed using the bond’s nearest call date or maturity, whichever comes first. This measure ignores future cash flow fluctuations due to embedded optionality. |
to bonds rated AAA.6 We increased the Fund’s exposure to high quality municipal credits as they were in relatively strong financial condition and were available at much higher yields. Conversely, there were small reductions in sector exposures to education and local general obligations.
How was the Fund positioned at the end of the reporting period?
As of April 30, 2023, the Fund held overweight positions relative to the Index in the IDR/PCR, and housing sectors, and to bonds rated A.7 From a geographic perspective, the Fund held overweight exposure to bonds from Illinois and New Jersey. As of the same date, the Fund held underweight exposure to the prerefunded/ETM (escrowed to maturity) and state general obligation sectors, bonds from New York and AA-rated bonds.
| 6. | An obligation rated `AAA' has the highest rating assigned by S&P, and in the opinion of S&P, the obligor's capacity to meet its financial commitment on the obligation is extremely strong. When applied to Fund holdings, ratings are based solely on the creditworthiness of the bonds in the portfolio and are not meant to represent the security or safety of the Fund. |
| 7. | An obligation rated `A' by S&P is deemed by S&P to be somewhat more susceptible to the adverse effects of changes in circumstances and economic conditions than obligations in higher-rated categories. In the opinion of S&P, however, the obligor's capacity to meet its financial commitment on the obligation is still strong. When applied to Fund holdings, ratings are based solely on the creditworthiness of the bonds in the portfolio and are not meant to represent the security or safety of the Fund. |
The opinions expressed are those of the portfolio managers as of the date of this report and are subject to change. There is no guarantee that any forecasts will come to pass. This material does not constitute investment advice and is not intended as an endorsement of any specific investment.
| 10 | MainStay MacKay Short Term Municipal Fund |
Portfolio of Investments April 30, 2023†^
| | Principal
Amount | Value |
| Municipal Bonds 99.3% |
| Long-Term Municipal Bonds 78.1% |
| Alabama 4.4% |
| Black Belt Energy Gas District, Gas Project No.6, Revenue Bonds | | |
| Series B | | |
| 4.00%, due 10/1/52 (a) | $ 13,500,000 | $ 13,465,337 |
| Black Belt Energy Gas District, Revenue Bonds | | |
| Series B-1 | | |
| 4.00%, due 4/1/53 (a) | 3,920,000 | 3,905,704 |
| Series C-1 | | |
| 5.25%, due 12/1/23 | 530,000 | 533,447 |
| Series C-1 | | |
| 5.25%, due 6/1/25 | 615,000 | 630,685 |
| Series C-1 | | |
| 5.25%, due 12/1/25 | 880,000 | 908,103 |
| Series F | | |
| 5.50%, due 11/1/53 (a) | 10,000,000 | 10,650,905 |
| Southeast Alabama Gas Supply District, Project No. 1, Revenue Bonds | | |
| Series A | | |
| 5.00%, due 4/1/24 | 1,500,000 | 1,516,487 |
| Southeast Energy Authority, A Cooperative District, Project No. 4, Revenue Bonds | | |
| Series B-1 | | |
| 5.00%, due 5/1/53 (a) | 1,870,000 | 1,949,476 |
| Southeast Energy Authority, A Cooperative District, Project No. 3, Revenue Bonds | | |
| Series A-1 | | |
| 5.50%, due 1/1/53 (a) | 10,000,000 | 10,809,566 |
| State of Alabama, Unlimited General Obligation | | |
| Series A | | |
| 3.00%, due 8/1/26 | 5,000,000 | 5,006,470 |
| | | 49,376,180 |
| Alaska 0.9% |
| Northern Tobacco Securitization Corp., Tobacco Settlement Asset-Backed, Revenue Bonds, Senior Lien | | |
| Series B1, Class 2 | | |
| 0.50%, due 6/1/31 | 105,000 | 104,763 |
| | Principal
Amount | Value |
| |
| Alaska (continued) |
| State of Alaska, International Airports System, Revenue Bonds (b) | | |
| Series C | | |
| 5.00%, due 10/1/27 | $ 3,030,000 | $ 3,238,277 |
| Series C | | |
| 5.00%, due 10/1/30 | 5,570,000 | 6,186,431 |
| | | 9,529,471 |
| Arizona 0.6% |
| Arizona Health Facilities Authority, Scottsdale Lincoln Hospital Project, Revenue Bonds | | |
| Series A | | |
| 5.00%, due 12/1/26 | 2,590,000 | 2,665,323 |
| City of Phoenix Civic Improvement Corp., Airport, Revenue Bonds, Junior Lien | | |
| Series B | | |
| 5.00%, due 7/1/26 (b) | 3,500,000 | 3,681,293 |
| | | 6,346,616 |
| Arkansas 0.1% |
| City of Fort Smith, Water & Sewer, Revenue Bonds | | |
| 3.00%, due 10/1/25 | 1,400,000 | 1,396,704 |
| California 4.0% |
| Antelope Valley Community College District, Unlimited General Obligation | | |
| (zero coupon), due 8/1/33 | 2,250,000 | 1,486,648 |
| (zero coupon), due 8/1/35 | 3,990,000 | 2,405,755 |
| Chula Vista Elementary School District, Revenue Bonds | | |
| (zero coupon), due 8/1/23 | 4,140,000 | 4,105,665 |
| Compton Community College District, Election of 2002, Unlimited General Obligation | | |
| Series D, Insured: BAM | | |
| (zero coupon), due 8/1/36 | 2,825,000 | 1,182,302 |
| Los Angeles Unified School District, Unlimited General Obligation | | |
| Series C | | |
| 5.00%, due 7/1/23 | 2,000,000 | 2,006,012 |
| Pasadena Unified School District, Unlimited General Obligation | | |
| Series B | | |
| 2.00%, due 8/1/25 | 1,490,000 | 1,451,854 |
The notes to the financial statements are an integral part of, and should be read in conjunction with, the financial statements.
11
Portfolio of Investments April 30, 2023†^ (continued)
| | Principal
Amount | Value |
| Long-Term Municipal Bonds (continued) |
| California (continued) |
| Regents of the University of California Medical Center, Revenue Bonds | | |
| Series J | | |
| 5.00%, due 5/15/43 | $ 2,435,000 | $ 2,436,547 |
| San Diego Public Facilities Financing Authority, Water Utility, Revenue Bonds | | |
| Series B | | |
| 1.903%, due 8/1/26 | 4,640,000 | 4,319,032 |
| San Diego Unified School District, Unlimited General Obligation | | |
| Series G | | |
| (zero coupon), due 7/1/33 | 4,235,000 | 2,509,407 |
| San Joaquin Hills Transportation Corridor Agency, Revenue Bonds, Junior Lien | | |
| (zero coupon), due 1/1/24 | 1,515,000 | 1,482,478 |
| Santa Maria Joint Union High School District, Unlimited General Obligation | | |
| (zero coupon), due 8/1/37 | 2,350,000 | 1,113,355 |
| State of California, Various Purpose, Unlimited General Obligation | | |
| 1.75%, due 11/1/30 | 1,375,000 | 1,156,493 |
| 5.00%, due 10/1/26 | 4,850,000 | 5,227,790 |
| Tobacco Securitization Authority of Southern California, San Diego County Tobacco Asset Securitization Corp., Asset-Backed, Revenue Bonds | | |
| Series A, Class 1 | | |
| 5.00%, due 6/1/24 | 1,710,000 | 1,739,540 |
| Torrance Unified School District, Election of 2008, Unlimited General Obligation | | |
| (zero coupon), due 8/1/27 | 2,500,000 | 2,084,366 |
| (zero coupon), due 8/1/28 | 2,500,000 | 1,981,687 |
| (zero coupon), due 8/1/29 | 4,500,000 | 3,380,575 |
| (zero coupon), due 8/1/30 | 1,500,000 | 1,065,563 |
| Victor Valley Union High School District, Unlimited General Obligation | | |
| Series B | | |
| (zero coupon), due 8/1/49 | 14,715,000 | 3,266,505 |
| | | 44,401,574 |
| | Principal
Amount | Value |
| |
| Colorado 0.6% |
| Adams 12 Five Star Schools, Unlimited General Obligation | | |
| Series B, Insured: State Aid Withholding | | |
| 5.00%, due 12/15/30 | $ 1,675,000 | $ 1,799,548 |
| Colorado Bridge Enterprise, Colorado High Performance Transportation Enterprise, Revenue Bonds | | |
| 4.00%, due 12/31/26 (b) | 3,950,000 | 4,010,994 |
| Colorado Health Facilities Authority, United Community and Housing Development Corp., Revenue Bonds | | |
| Series B | | |
| (zero coupon), due 7/15/24 | 1,050,000 | 1,009,101 |
| | | 6,819,643 |
| Connecticut 1.1% |
| City of Hartford, Unlimited General Obligation | | |
| Series B, Insured: AGM State Guaranteed | | |
| 5.00%, due 10/1/24 | 1,380,000 | 1,417,014 |
| State of Connecticut, Unlimited General Obligation | | |
| Series A | | |
| 0.508%, due 6/1/24 | 1,000,000 | 955,378 |
| Series D | | |
| 5.00%, due 8/15/24 | 5,120,000 | 5,249,095 |
| Series A | | |
| 5.73%, due 3/15/24 | 5,000,000 | 5,021,574 |
| | | 12,643,061 |
| Delaware 0.1% |
| State of Delaware, Unlimited General Obligation | | |
| Series B | | |
| 5.00%, due 7/1/26 | 1,205,000 | 1,233,560 |
| District of Columbia 1.1% |
| District of Columbia, Gallery Place Project, Tax Allocation | | |
| 5.00%, due 6/1/27 | 1,720,000 | 1,720,881 |
| Metropolitan Washington Airports Authority, Revenue Bonds (b) | | |
| Series A | | |
| 5.00%, due 10/1/27 | 2,160,000 | 2,325,948 |
The notes to the financial statements are an integral part of, and should be read in conjunction with, the financial statements.
| 12 | MainStay MacKay Short Term Municipal Fund |
| | Principal
Amount | Value |
| Long-Term Municipal Bonds (continued) |
| District of Columbia (continued) |
Metropolitan Washington Airports Authority, Revenue Bonds (b)
(continued) | | |
| Series A | | |
| 5.00%, due 10/1/28 | $ 1,020,000 | $ 1,114,233 |
| Metropolitan Washington Airports Authority Aviation, Revenue Bonds (b) | | |
| Series A | | |
| 5.00%, due 10/1/25 | 2,000,000 | 2,009,566 |
| Series A | | |
| 5.00%, due 10/1/27 | 2,700,000 | 2,907,435 |
| Washington Metropolitan Area Transit Authority Dedicated, Revenue Bonds | | |
| Series A | | |
| 5.00%, due 7/15/24 | 750,000 | 766,587 |
| Series A | | |
| 5.00%, due 7/15/25 | 1,055,000 | 1,104,416 |
| | | 11,949,066 |
| Florida 3.3% |
| City of Hialeah, Revenue Bonds | | |
| Series B, Insured: AGM | | |
| 5.00%, due 12/1/31 | 1,340,000 | 1,395,366 |
| City of Tampa, Water & Wastewater System, Revenue Bonds | | |
| Series B | | |
| 1.141%, due 10/1/27 | 4,000,000 | 3,517,963 |
| County of Broward, Port Facilities, Revenue Bonds | | |
| 5.00%, due 9/1/26 | 835,000 | 878,829 |
| 5.00%, due 9/1/27 | 1,995,000 | 2,129,970 |
| County of Monroe, Airport, Revenue Bonds | | |
| Series 202 | | |
| 5.00%, due 10/1/27 (b) | 200,000 | 211,641 |
| County of Pasco, State of Florida Cigarette Tax Revenue, Revenue Bonds | | |
| Series A, Insured: AGM | | |
| 5.25%, due 9/1/25 | 1,680,000 | 1,760,840 |
| Series A, Insured: AGM | | |
| 5.25%, due 9/1/26 | 1,875,000 | 2,006,416 |
| Series A, Insured: AGM | | |
| 5.25%, due 9/1/27 | 2,000,000 | 2,180,613 |
| | Principal
Amount | Value |
| |
| Florida (continued) |
| Greater Orlando Aviation Authority, Airport Facilities, Revenue Bonds | | |
| Series A | | |
| 5.00%, due 10/1/23 (b) | $ 8,895,000 | $ 8,939,628 |
| Greater Orlando Aviation Authority, Revenue Bonds | | |
| Series A | | |
| 5.00%, due 10/1/26 (b) | 4,225,000 | 4,464,774 |
| Miami-Dade County Expressway Authority, Revenue Bonds | | |
| Series B, Insured: BAM | | |
| 5.00%, due 7/1/26 | 5,000,000 | 5,089,125 |
| Tampa Bay Water, Revenue Bonds | | |
| Series A | | |
| 5.00%, due 10/1/27 | 2,250,000 | 2,357,203 |
| Village Community Development District No. 12, Special Assessment | | |
| 3.25%, due 5/1/26 | 1,435,000 | 1,415,576 |
| | | 36,347,944 |
| Georgia 0.3% |
| Main Street Natural Gas, Inc., Revenue Bonds | | |
| Series A | | |
| 4.00%, due 4/1/48 (a) | 2,500,000 | 2,501,940 |
| Municipal Electric Authority of Georgia, Project One Subordinated Bonds, Revenue Bonds | | |
| Series A | | |
| 5.00%, due 1/1/26 | 970,000 | 1,013,630 |
| | | 3,515,570 |
| Guam 0.4% |
| Antonio B Won Pat International Airport Authority, Revenue Bonds | | |
| Series C | | |
| 6.25%, due 10/1/34 (b) | 395,000 | 399,200 |
| Guam Government Waterworks Authority, Water and Wastewater System, Revenue Bonds | | |
| 5.00%, due 7/1/24 | 400,000 | 403,935 |
| Guam Power Authority, Revenue Bonds | | |
| Series A | | |
| 5.00%, due 10/1/23 | 1,000,000 | 1,003,292 |
The notes to the financial statements are an integral part of, and should be read in conjunction with, the financial statements.
13
Portfolio of Investments April 30, 2023†^ (continued)
| | Principal
Amount | Value |
| Long-Term Municipal Bonds (continued) |
| Guam (continued) |
| Guam Power Authority, Revenue Bonds (continued) | | |
| Series A | | |
| 5.00%, due 10/1/25 | $ 2,500,000 | $ 2,571,998 |
| | | 4,378,425 |
| Hawaii 0.5% |
| State of Hawaii, Unlimited General Obligation | | |
| Series EY | | |
| 5.00%, due 10/1/27 | 4,155,000 | 4,375,811 |
| State of Hawaii, Airports System, Revenue Bonds | | |
| Series A | | |
| 5.00%, due 7/1/28 (b) | 1,000,000 | 1,082,228 |
| | | 5,458,039 |
| Illinois 7.6% |
| Chicago O'Hare International Airport, Passenger Facility Charge, Revenue Bonds | | |
| 5.00%, due 1/1/25 (b) | 835,000 | 835,877 |
| Chicago O'Hare International Airport, General, Revenue Bonds, Senior Lien | | |
| Series C | | |
| 5.00%, due 1/1/25 (b) | 1,000,000 | 1,023,662 |
| Chicago O'Hare International Airport, Revenue Bonds | | |
| Series A | | |
| 5.00%, due 1/1/28 (b) | 1,525,000 | 1,555,576 |
| City of Calumet City, Unlimited General Obligation | | |
| Series A, Insured: AGM | | |
| 5.50%, due 3/1/26 | 610,000 | 649,046 |
| Series A, Insured: AGM | | |
| 5.50%, due 3/1/27 | 640,000 | 694,647 |
| Series A, Insured: AGM | | |
| 5.50%, due 3/1/28 | 675,000 | 746,510 |
| City of Chicago, Wastewater Transmission Project, Revenue Bonds | | |
| Series A, Insured: NATL-RE | | |
| (zero coupon), due 1/1/26 | 2,090,000 | 1,900,366 |
| Series A, Insured: NATL-RE | | |
| (zero coupon), due 1/1/27 | 12,120,000 | 10,647,053 |
| | Principal
Amount | Value |
| |
| Illinois (continued) |
| City of Chicago, Wastewater Transmission Project, Revenue Bonds, Second Lien | | |
| 5.00%, due 1/1/26 | $ 1,130,000 | $ 1,134,027 |
| City of Chicago, Neighbourhoods Alive 21 Program, Unlimited General Obligation | | |
| Series 2002B | | |
| 5.00%, due 1/1/24 | 150,000 | 151,289 |
| Series 2002B | | |
| 5.00%, due 1/1/26 | 170,000 | 173,271 |
| Series 2002B | | |
| 5.25%, due 1/1/28 | 150,000 | 153,330 |
| City of Chicago, Unlimited General Obligation | | |
| Series C | | |
| 5.00%, due 1/1/24 | 3,520,000 | 3,550,254 |
| Series A | | |
| 5.00%, due 1/1/26 | 405,000 | 407,579 |
| Series A | | |
| 5.00%, due 1/1/30 | 1,000,000 | 1,079,533 |
| 5.25%, due 1/1/28 | 925,000 | 945,537 |
| Series A | | |
| 5.25%, due 1/1/30 | 500,000 | 502,928 |
| City of Chicago, Waterworks, Revenue Bonds, Second Lien | | |
| 5.00%, due 11/1/24 | 250,000 | 250,286 |
| Insured: AGM-CR | | |
| 5.00%, due 11/1/25 | 400,000 | 408,924 |
| Cook County Township High School District No. 225, Unlimited General Obligation | | |
| 5.00%, due 12/1/26 | 1,180,000 | 1,272,485 |
| Illinois Finance Authority, Clean Water Program, Revenue Bonds | | |
| 4.00%, due 7/1/26 | 2,100,000 | 2,164,622 |
| Illinois Housing Development Authority, Revenue Bonds | | |
| Series G, Insured: GNMA / FNMA / FHLMC | | |
| 5.50%, due 4/1/24 | 555,000 | 566,231 |
| Series G, Insured: GNMA / FNMA / FHLMC | | |
| 5.50%, due 10/1/26 | 275,000 | 296,772 |
| Series G, Insured: GNMA / FNMA / FHLMC | | |
| 5.50%, due 4/1/27 | 275,000 | 300,353 |
The notes to the financial statements are an integral part of, and should be read in conjunction with, the financial statements.
| 14 | MainStay MacKay Short Term Municipal Fund |
| | Principal
Amount | Value |
| Long-Term Municipal Bonds (continued) |
| Illinois (continued) |
Illinois Housing Development Authority, Revenue Bonds
(continued) | | |
| Series G, Insured: GNMA / FNMA / FHLMC | | |
| 5.50%, due 10/1/27 | $ 285,000 | $ 314,460 |
| Illinois State University, Auxiliary Facilities System, Revenue Bonds | | |
| Insured: AGM | | |
| 5.00%, due 4/1/24 | 2,360,000 | 2,391,890 |
| Kane & DeKalb Counties Community Unit School District No. 302, Unlimited General Obligation | | |
| Series B, Insured: AGC | | |
| (zero coupon), due 2/1/27 | 475,000 | 416,822 |
| Metropolitan Pier & Exposition Authority, McCormick Place Expansion Project, Revenue Bonds | | |
| Insured: NATL-RE | | |
| (zero coupon), due 12/15/23 | 175,000 | 170,808 |
| Regional Transportation Authority, Revenue Bonds | | |
| Series A, Insured: NATL-RE | | |
| 6.00%, due 7/1/23 | 1,145,000 | 1,149,352 |
| Sales Tax Securitization Corp., Revenue Bonds | | |
| Series A | | |
| 5.00%, due 1/1/24 | 2,000,000 | 2,021,588 |
| Southern Illinois University, Housing & Auxiliary Facilities System, Revenue Bonds | | |
| Series B, Insured: BAM | | |
| 5.00%, due 4/1/26 | 1,175,000 | 1,209,842 |
| State of Illinois, Unlimited General Obligation | | |
| Series D | | |
| 5.00%, due 11/1/24 | 10,000,000 | 10,209,734 |
| Series D | | |
| 5.00%, due 11/1/25 | 5,000,000 | 5,186,100 |
| Series A | | |
| 5.00%, due 12/1/26 | 1,980,000 | 2,092,226 |
| Series A | | |
| 5.00%, due 3/1/27 | 525,000 | 557,132 |
| Series A | | |
| 5.00%, due 3/1/29 | 3,745,000 | 4,092,220 |
| 5.00%, due 10/1/29 | 800,000 | 880,348 |
| | Principal
Amount | Value |
| |
| Illinois (continued) |
| State of Illinois, Unlimited General Obligation (continued) | | |
| Series C | | |
| 5.00%, due 11/1/29 | $ 5,920,000 | $ 6,338,959 |
| Series A | | |
| 5.25%, due 10/1/23 | 10,000,000 | 9,994,921 |
| State of Illinois, Unlimited General Obligation, First Series | | |
| Insured: NATL-RE | | |
| 6.00%, due 11/1/26 | 4,115,000 | 4,334,383 |
| Upper Illinois River Valley Development Authority, Morris Hospital Obligated Group, Revenue Bonds | | |
| 5.00%, due 12/1/27 | 1,145,000 | 1,208,179 |
| Village of Lakewood, Unlimited General Obligation | | |
| Insured: AMBAC | | |
| 5.50%, due 12/1/26 | 915,000 | 948,802 |
| | | 84,927,924 |
| Indiana 1.5% |
| Avon Community School Building Corp., Limited General Obligation | | |
| Insured: State Intercept | | |
| 4.00%, due 7/15/23 | 1,230,000 | 1,230,364 |
| Insured: State Intercept | | |
| 4.00%, due 1/15/24 | 2,635,000 | 2,639,570 |
| Center Grove Community School Corp., Limited General Obligation | | |
| Insured: State Intercept | | |
| 5.00%, due 7/1/23 | 2,830,000 | 2,834,278 |
| Greater Clark Building Corp., Revenue Bonds | | |
| Insured: State Intercept | | |
| 5.00%, due 7/15/26 | 1,190,000 | 1,262,226 |
| Indiana Finance Authority, Indianapolis Power & Light Co., Revenue Bonds | | |
| Series A | | |
| 1.40%, due 8/1/29 (a) | 4,095,000 | 3,615,908 |
| Indiana Finance Authority, BHI Senior Living, Inc., Revenue Bonds | | |
| Series B | | |
| 2.45%, due 11/15/25 | 355,000 | 331,634 |
| Series B | | |
| 2.52%, due 11/15/26 | 515,000 | 471,108 |
| Series B | | |
| 2.92%, due 11/15/27 | 655,000 | 594,971 |
The notes to the financial statements are an integral part of, and should be read in conjunction with, the financial statements.
15
Portfolio of Investments April 30, 2023†^ (continued)
| | Principal
Amount | Value |
| Long-Term Municipal Bonds (continued) |
| Indiana (continued) |
| Indianapolis Local Public Improvement Bond Bank, Revenue Bonds (b) | | |
| Series D | | |
| 5.00%, due 1/1/26 | $ 2,495,000 | $ 2,587,823 |
| Series D | | |
| 5.00%, due 1/1/29 | 1,480,000 | 1,491,208 |
| | | 17,059,090 |
| Iowa 0.4% |
| Cedar Falls Community School District, Unlimited General Obligation | | |
| Insured: AGM | | |
| 4.00%, due 6/1/25 | 2,540,000 | 2,592,243 |
| Iowa Finance Authority, Renewable Natural Gas Project, Green Bond, Revenue Bonds | | |
| 1.50%, due 1/1/42 (a)(b) | 2,000,000 | 1,961,122 |
| | | 4,553,365 |
| Kentucky 1.3% |
| Kentucky Economic Development Finance Authority, Next Generation Information Highway Project, Revenue Bonds, Senior Lien | | |
| Series A | | |
| 5.00%, due 7/1/27 | 4,245,000 | 4,304,934 |
| Kentucky Public Energy Authority, Gas Supply, Revenue Bonds (a) | | |
| Series A | | |
| 4.00%, due 4/1/48 | 6,500,000 | 6,506,353 |
| Series C | | |
| 4.00%, due 2/1/50 | 1,190,000 | 1,191,754 |
| Rural Water Financing Agency, Public Projects, Revenue Notes | | |
| Series A | | |
| 0.40%, due 5/1/23 | 2,000,000 | 2,000,000 |
| | | 14,003,041 |
| Louisiana 3.6% |
| Jefferson Sales Tax District, Revenue Bonds | | |
| Series A, Insured: AGM | | |
| 5.00%, due 12/1/26 | 1,500,000 | 1,607,490 |
| | Principal
Amount | Value |
| |
| Louisiana (continued) |
| Louisiana Local Government Environmental Facilities & Community Development Authority, Utilities Restoration Corp. Project, Revenue Bonds | | |
| Series A | | |
| 3.615%, due 2/1/29 | $ 3,784,644 | $ 3,705,878 |
| 5.081%, due 6/1/31 | 11,500,000 | 11,605,433 |
| Louisiana Stadium & Exposition District, Revenue Notes | | |
| Series A | | |
| 1.872%, due 7/3/23 (c) | 7,000,000 | 6,943,111 |
| Louisiana Stadium & Exposition District, Revenue Bonds | | |
| 5.00%, due 7/3/23 | 10,500,000 | 10,511,254 |
| State of Louisiana, Unlimited General Obligation | | |
| Series A | | |
| 4.00%, due 5/1/33 | 3,920,000 | 3,999,280 |
| Tobacco Settlement Financing Corp., Revenue Bonds | | |
| Series A | | |
| 5.00%, due 5/15/23 | 2,000,000 | 2,001,323 |
| | | 40,373,769 |
| Maine 0.1% |
| Finance Authority of Maine, Supplemental Education Loan Program, Revenue Bonds | | |
| Series A-1, Insured: AGM | | |
| 5.00%, due 12/1/28 (b) | 1,000,000 | 1,073,991 |
| Maine Health & Higher Educational Facilities Authority, Northern Light Health Obligated Group, Revenue Bonds | | |
| Series C, Insured: AGM State Aid Withholding | | |
| 5.00%, due 7/1/26 | 200,000 | 212,215 |
| Series C, Insured: AGM State Aid Withholding | | |
| 5.00%, due 7/1/27 | 200,000 | 216,744 |
| | | 1,502,950 |
| Maryland 1.2% |
| City of Baltimore, Wastewater Project, Revenue Bonds | | |
| Series A | | |
| 1.338%, due 7/1/27 | 1,850,000 | 1,639,137 |
The notes to the financial statements are an integral part of, and should be read in conjunction with, the financial statements.
| 16 | MainStay MacKay Short Term Municipal Fund |
| | Principal
Amount | Value |
| Long-Term Municipal Bonds (continued) |
| Maryland (continued) |
| County of Baltimore, Unlimited General Obligation | | |
| 3.50%, due 8/1/28 | $ 9,575,000 | $ 9,679,828 |
| County of Harford, Unlimited General Obligation | | |
| Series A | | |
| 3.00%, due 2/1/28 | 1,160,000 | 1,159,151 |
| Maryland Economic Development Corp., Terminal Project, Revenue Bonds | | |
| 3.70%, due 6/1/25 | 1,000,000 | 961,783 |
| | | 13,439,899 |
| Massachusetts 1.2% |
| Commonwealth of Massachusetts, COVID-19 Recovery Assessment, Revenue Bonds | | |
| Series A | | |
| 3.68%, due 1/15/27 | 7,000,000 | 6,873,757 |
| Commonwealth of Massachusetts, Revenue Bonds | | |
| Insured: NATL-RE | | |
| 5.50%, due 1/1/25 | 1,439,000 | 1,490,716 |
| Massachusetts Educational Financing Authority, Revenue Bonds | | |
| 5.00%, due 1/1/27 (b) | 3,000,000 | 3,058,802 |
| Massachusetts Housing Finance Agency, Revenue Bonds | | |
| Series B-2 | | |
| 0.80%, due 12/1/25 | 1,820,000 | 1,661,585 |
| | | 13,084,860 |
| Michigan 1.0% |
| Allen Park Public School District, Unlimited General Obligation | | |
| Insured: Q-SBLF | | |
| 5.00%, due 5/1/24 | 630,000 | 640,665 |
| Great Lakes Water Authority, Water Supply System, Revenue Bonds, Second Lien | | |
| Series A | | |
| 5.00%, due 7/1/24 | 2,425,000 | 2,470,732 |
| Michigan Finance Authority, Revenue Bonds, Senior Lien | | |
| Series A-1 | | |
| 2.326%, due 6/1/30 | 3,982,286 | 3,814,524 |
| | Principal
Amount | Value |
| |
| Michigan (continued) |
| Michigan State Housing Development Authority, Revenue Bonds | | |
| Series A | | |
| 3.25%, due 6/1/29 | $ 1,000,000 | $ 994,205 |
| Series A | | |
| 3.30%, due 12/1/29 | 1,000,000 | 994,449 |
| Series A | | |
| 3.35%, due 6/1/30 | 1,780,000 | 1,770,680 |
| | | 10,685,255 |
| Minnesota 2.5% |
| Centennial Independent School District No. 12, Unlimited General Obligation | | |
| Series A, Insured: SD CRED PROG | | |
| (zero coupon), due 2/1/33 | 1,500,000 | 1,032,899 |
| City of St. Paul, Unlimited General Obligation | | |
| Series B | | |
| 0.50%, due 3/1/24 | 3,850,000 | 3,725,310 |
| Metropolitan Council, Unlimited General Obligation | | |
| Series C | | |
| 3.50%, due 3/1/30 | 5,000,000 | 5,041,941 |
| Shakopee Independent School District No. 720, Unlimited General Obligation | | |
| Series C, Insured: SD CRED PROG | | |
| (zero coupon), due 2/1/29 | 5,155,000 | 4,225,245 |
| Southern Minnesota Municipal Power Agency, Capital Appreciation, Revenue Bonds | | |
| Series A, Insured: NATL-RE | | |
| (zero coupon), due 1/1/25 | 2,250,000 | 2,124,810 |
| State of Minnesota, Unlimited General Obligation | | |
| Series D | | |
| 5.00%, due 10/1/25 | 4,810,000 | 5,059,857 |
| Series A | | |
| 5.00%, due 8/1/26 | 5,520,000 | 5,654,893 |
| Watertown-Mayer Independent School District No. 111, Unlimited General Obligation | | |
| Series A, Insured: SD CRED PROG | | |
| (zero coupon), due 2/1/29 | 1,000,000 | 828,020 |
| | | 27,692,975 |
The notes to the financial statements are an integral part of, and should be read in conjunction with, the financial statements.
17
Portfolio of Investments April 30, 2023†^ (continued)
| | Principal
Amount | Value |
| Long-Term Municipal Bonds (continued) |
| Missouri 0.1% |
| City of Kansas City, Main Streetcar Extension Project, Revenue Bonds | | |
| Series C | | |
| 5.00%, due 9/1/28 | $ 675,000 | $ 744,656 |
| Nebraska 0.7% |
| Central Plains Energy Project, Revenue Bonds | | |
| 2.50%, due 12/1/49 (a) | 1,550,000 | 1,497,073 |
| Gretna Public Schools, Unlimited General Obligation | | |
| Series B | | |
| 5.00%, due 12/15/27 | 6,000,000 | 6,320,234 |
| | | 7,817,307 |
| Nevada 0.8% |
| Clark County School District, Limited General Obligation | | |
| Series D | | |
| 5.00%, due 6/15/23 | 1,355,000 | 1,357,689 |
| Series A, Insured: AGM | | |
| 5.00%, due 6/15/25 | 3,780,000 | 3,949,620 |
| County of Clark, Department of Aviation, Revenue Bonds, Sub. Lien | | |
| Series A-1 | | |
| 5.00%, due 7/1/24 (b) | 2,250,000 | 2,286,238 |
| Las Vegas Convention & Visitors Authority, Revenue Bonds | | |
| Series C | | |
| 5.00%, due 7/1/25 | 1,050,000 | 1,092,591 |
| | | 8,686,138 |
| New Jersey 7.8% |
| Borough of Ringwood, Unlimited General Obligation | | |
| 5.75%, due 4/5/24 | 6,871,000 | 7,006,517 |
| City of Jersey City, Unlimited General Obligation | | |
| Series A | | |
| 5.00%, due 10/26/23 | 13,500,000 | 13,607,931 |
| City of Millville, Unlimited General Obligation | | |
| Insured: AGM | | |
| 3.00%, due 11/1/23 | 250,000 | 249,869 |
| County of Morris, Unlimited General Obligation | | |
| 2.00%, due 2/1/25 | 2,830,000 | 2,760,131 |
| | Principal
Amount | Value |
| |
| New Jersey (continued) |
| Essex County Improvement Authority, North Star Academy Charter School of Newark, Inc., Revenue Bonds | | |
| 3.00%, due 8/1/25 (c) | $ 700,000 | $ 648,838 |
| Hanover Park Regional High School District, Unlimited General Obligation | | |
| Insured: SCH BD RES FD | | |
| 3.00%, due 3/15/26 | 1,660,000 | 1,669,694 |
| New Jersey Economic Development Authority, Revenue Bonds | | |
| Series RRR | | |
| 5.00%, due 3/1/28 | 5,000,000 | 5,439,474 |
| New Jersey Economic Development Authority, State of New Jersey Motor Vehicle Surcharge, Revenue Bonds | | |
| Series A, Insured: BAM | | |
| 5.00%, due 7/1/28 | 6,885,000 | 7,446,263 |
| New Jersey Educational Facilities Authority, Trustees of Princeton University (The), Revenue Bonds | | |
| Series A | | |
| 5.00%, due 7/1/26 | 8,220,000 | 8,411,023 |
| New Jersey Higher Education Student Assistance Authority, Revenue Bonds, Senior Lien | | |
| Series B | | |
| 5.00%, due 12/1/24 (b) | 1,210,000 | 1,232,118 |
| New Jersey Housing & Mortgage Finance Agency, Amity Heights Apartments, Revenue Bonds | | |
| Series A, Insured: HUD Sector 8 | | |
| 3.50%, due 7/1/25 (a) | 10,067,000 | 10,001,949 |
| New Jersey Transportation Trust Fund Authority, Transportation System, Revenue Bonds | | |
| Series C, Insured: AMBAC | | |
| (zero coupon), due 12/15/24 | 1,130,000 | 1,068,710 |
| Insured: AMBAC | | |
| (zero coupon), due 12/15/26 | 1,000,000 | 887,223 |
| Series A | | |
| 5.00%, due 6/15/24 | 1,100,000 | 1,118,121 |
| Series D | | |
| 5.00%, due 12/15/24 | 960,000 | 984,986 |
The notes to the financial statements are an integral part of, and should be read in conjunction with, the financial statements.
| 18 | MainStay MacKay Short Term Municipal Fund |
| | Principal
Amount | Value |
| Long-Term Municipal Bonds (continued) |
| New Jersey (continued) |
| New Jersey Transportation Trust Fund Authority, Revenue Bonds | | |
| Series A-1 | | |
| 5.00%, due 6/15/27 | $ 10,000,000 | $ 10,564,831 |
| New Jersey Transportation Trust Fund Authority, Highway Reimbursement Notes, Revenue Bonds | | |
| Series A | | |
| 5.00%, due 6/15/30 | 4,610,000 | 4,870,665 |
| Sayreville School District, Unlimited General Obligation | | |
| Insured: BAM SCH BD RES FD | | |
| 3.00%, due 1/15/25 | 1,365,000 | 1,362,305 |
| State of New Jersey, Unlimited General Obligation | | |
| 2.00%, due 6/1/25 | 3,000,000 | 2,901,032 |
| 5.00%, due 6/1/26 | 1,000,000 | 1,046,564 |
| Tobacco Settlement Financing Corp., Revenue Bonds | | |
| Series A | | |
| 5.00%, due 6/1/23 | 2,945,000 | 2,948,957 |
| | | 86,227,201 |
| New Mexico 0.9% |
| New Mexico Municipal Energy Acquisition Authority, Revenue Bonds | | |
| Series A | | |
| 5.00%, due 11/1/39 (a) | 9,490,000 | 9,723,502 |
| New York 5.2% |
| City of New York, Unlimited General Obligation | | |
| Series B-2 | | |
| 2.90%, due 10/1/27 | 8,600,000 | 8,107,954 |
| Series D | | |
| 5.00%, due 8/1/25 | 3,000,000 | 3,139,014 |
| East Islip Union Free School District, Limited General Obligation | | |
| Insured: State Aid Withholding | | |
| 5.00%, due 6/29/23 | 10,500,000 | 10,521,418 |
| East Ramapo Central School District, Unlimited General Obligation | | |
| Series A, Insured: State Aid Withholding | | |
| 3.00%, due 5/31/23 | 6,660,000 | 6,657,313 |
| | Principal
Amount | Value |
| |
| New York (continued) |
| Metropolitan Transportation Authority, Green Bond, Revenue Bonds | | |
| Series B | | |
| 5.00%, due 11/15/23 | $ 1,245,000 | $ 1,252,967 |
| New York City Industrial Development Agency, Yankee Stadium Project, Revenue Bonds | | |
| Insured: NATL-RE | | |
| 6.896%, due 3/1/24 (d) | 500,000 | 508,957 |
| New York State Energy Research & Development Authority, New York State Electric & Gas Corp., Revenue Bonds | | |
| Series D | | |
| 3.50%, due 10/1/29 | 4,400,000 | 4,329,090 |
| New York State Housing Finance Agency, Revenue Bonds | | |
| Series A, Insured: SONYMA HUD Sector 8 | | |
| 0.75%, due 11/1/25 | 960,000 | 878,039 |
| Series E | | |
| 0.95%, due 5/1/25 | 5,050,000 | 4,729,374 |
| New York State Urban Development Corp., Personal Income Tax, Revenue Bonds | | |
| Series B | | |
| 3.32%, due 3/15/29 | 3,000,000 | 2,826,643 |
| New York Transportation Development Corp., Terminal 4 John F. Kennedy International Airport Project, Revenue Bonds (b) | | |
| Insured: AGM-CR | | |
| 5.00%, due 12/1/26 | 5,000,000 | 5,338,969 |
| Insured: AGM-CR | | |
| 5.00%, due 12/1/29 | 4,000,000 | 4,407,998 |
| 5.00%, due 12/1/30 | 1,000,000 | 1,091,810 |
| Suffolk Tobacco Asset Securitization Corp., Tobacco Settlement, Asset Backed, Revenue Bonds | | |
| Series B-1 | | |
| 0.45%, due 6/1/31 | 425,000 | 422,107 |
| Town of Oyster Bay, Limited General Obligation | | |
| Insured: AGM | | |
| 4.00%, due 3/1/25 | 2,295,000 | 2,339,971 |
The notes to the financial statements are an integral part of, and should be read in conjunction with, the financial statements.
19
Portfolio of Investments April 30, 2023†^ (continued)
| | Principal
Amount | Value |
| Long-Term Municipal Bonds (continued) |
| New York (continued) |
| Village of Johnson City, Limited General Obligation | | |
| Series C | | |
| 5.25%, due 9/29/23 | $ 1,550,000 | $ 1,550,748 |
| | | 58,102,372 |
| North Carolina 1.9% |
| County of Guilford, Unlimited General Obligation | | |
| 5.00%, due 3/1/26 | 500,000 | 532,554 |
| Greater Asheville Regional Airport Authority, Revenue Bonds | | |
| Insured: AGM | | |
| 5.00%, due 7/1/28 | 1,000,000 | 1,070,930 |
| Insured: AGM | | |
| 5.00%, due 7/1/29 | 1,165,000 | 1,264,852 |
| Insured: AGM | | |
| 5.00%, due 7/1/30 | 1,100,000 | 1,208,031 |
| North Carolina Turnpike Authority, Triangle Expressway System, Revenue Bonds, Senior Lien | | |
| 5.00%, due 2/1/24 | 10,000,000 | 10,136,085 |
| Raleigh Durham Airport Authority, Revenue Bonds | | |
| Series A | | |
| 5.00%, due 5/1/28 (b) | 1,205,000 | 1,306,966 |
| State of North Carolina, Unlimited General Obligation | | |
| Series B | | |
| 4.00%, due 6/1/29 | 5,000,000 | 5,221,591 |
| | | 20,741,009 |
| Ohio 3.0% |
| American Municipal Power, Inc., Prairie State Energy Campus Project, Revenue Bonds | | |
| Series B | | |
| 5.00%, due 2/15/25 | 5,710,000 | 5,904,701 |
| City of Dayton, Airport, Revenue Bonds | | |
| Series A, Insured: AGM | | |
| 5.00%, due 12/1/23 (b) | 1,155,000 | 1,155,994 |
| County of Lorain, Limited General Obligation | | |
| 4.125%, due 5/2/24 | 4,450,000 | 4,460,314 |
| County of Lucas, Revenue Notes | | |
| 5.25%, due 10/13/23 | 12,130,000 | 12,106,354 |
| | Principal
Amount | Value |
| |
| Ohio (continued) |
| Ohio Air Quality Development Authority, Ohio Valley Electric Corp. Project, Revenue Bonds | | |
| Series A | | |
| 2.875%, due 2/1/26 | $ 1,000,000 | $ 946,272 |
| Ohio Turnpike & Infrastructure Commission, Revenue Bonds, Junior Lien | | |
| Series A | | |
| 5.00%, due 2/15/26 | 2,000,000 | 2,122,375 |
| State of Ohio, Unlimited General Obligation | | |
| Series B | | |
| 5.00%, due 8/1/24 | 4,000,000 | 4,099,730 |
| Series A | | |
| 5.00%, due 5/1/25 | 1,665,000 | 1,738,262 |
| Series A | | |
| 5.00%, due 5/1/26 | 1,000,000 | 1,067,178 |
| | | 33,601,180 |
| Oregon 1.2% |
| Port of Morrow, Bonneville Cooperation Project, Revenue Bonds | | |
| 2.179%, due 9/1/24 | 5,770,000 | 5,564,464 |
| Salem-Keizer School District No. 24J, Unlimited General Obligation | | |
| Series B, Insured: School Bond Guaranty | | |
| (zero coupon), due 6/15/25 | 6,300,000 | 5,908,153 |
| Series B, Insured: School Bond Guaranty | | |
| (zero coupon), due 6/15/26 | 2,335,000 | 2,130,659 |
| | | 13,603,276 |
| Pennsylvania 2.1% |
| Chichester School District, Unlimited General Obligation | | |
| Insured: NATL-RE State Aid Withholding | | |
| (zero coupon), due 3/1/27 | 1,000,000 | 882,611 |
| City of Philadelphia, Airport, Revenue Bonds | | |
| 5.00%, due 7/1/25 (b) | 1,750,000 | 1,797,658 |
| Coatesville School District, Limited General Obligation | | |
| Insured: AGM State Aid Withholding | | |
| 5.00%, due 8/1/24 | 625,000 | 639,268 |
The notes to the financial statements are an integral part of, and should be read in conjunction with, the financial statements.
| 20 | MainStay MacKay Short Term Municipal Fund |
| | Principal
Amount | Value |
| Long-Term Municipal Bonds (continued) |
| Pennsylvania (continued) |
| Commonwealth of Pennsylvania, Certificate of Participation | | |
| Insured: AGM | | |
| 5.00%, due 11/1/24 | $ 1,660,000 | $ 1,706,521 |
| Geisinger Authority, Geisinger Health System Obligated Group, Revenue Bonds | | |
| Series B | | |
| 5.00%, due 4/1/43 (a) | 1,625,000 | 1,706,340 |
| Indiana County Industrial Development Authority, Foundation for Indiana University of Pennsylvania (The), Revenue Bonds | | |
| Insured: BAM | | |
| 5.00%, due 5/1/23 | 110,000 | 110,000 |
| Insured: BAM | | |
| 5.00%, due 5/1/24 | 110,000 | 111,311 |
| Montgomery County Industrial Development Authority, Albert Einstein Healthcare Network, Revenue Bonds | | |
| Series A | | |
| 5.25%, due 1/15/45 | 11,385,000 | 11,796,938 |
| Reading School District, Limited General Obligation | | |
| Series C, Insured: BAM State Aid Withholding | | |
| 5.00%, due 4/1/24 | 3,325,000 | 3,371,130 |
| Sports & Exhibition Authority of Pittsburgh and Allegheny County, Revenue Bonds | | |
| Insured: AGM | | |
| 4.00%, due 2/1/25 | 1,630,000 | 1,647,235 |
| | | 23,769,012 |
| Puerto Rico 0.1% |
| Puerto Rico Housing Finance Authority, El Mirador LLC, Revenue Bonds | | |
| Series B, Insured: HUD Sector 8 | | |
| 5.00%, due 3/1/27 (a) | 1,500,000 | 1,570,457 |
| | Principal
Amount | Value |
| |
| Rhode Island 0.3% |
| Rhode Island Health and Educational Building Corp., City of Providence, Revenue Bonds | | |
| Series D, Insured: BAM State Aid Withholding | | |
| 5.00%, due 5/15/26 | $ 1,100,000 | $ 1,171,665 |
| Rhode Island Housing and Mortgage Finance Corp., Revenue Bonds | | |
| Series 77A | | |
| 5.00%, due 4/1/26 | 1,000,000 | 1,052,931 |
| Series 77A | | |
| 5.00%, due 10/1/26 | 1,180,000 | 1,255,217 |
| | | 3,479,813 |
| South Carolina 0.4% |
| City of Anderson, Water & Sewer, Revenue Bonds | | |
| 5.00%, due 7/1/26 | 1,325,000 | 1,416,687 |
| Greenville Housing Authority, Gordon Street Affordable LP, Revenue Bonds | | |
| Insured: FHA 221(D4) | | |
| 5.00%, due 10/1/26 (a) | 1,000,000 | 1,029,498 |
| South Carolina Public Service Authority, Revenue Bonds | | |
| Series A, Insured: AGM-CR | | |
| 5.00%, due 12/1/27 | 1,670,000 | 1,765,055 |
| | | 4,211,240 |
| Tennessee 0.9% |
| County of Knox, Unlimited General Obligation | | |
| Series B | | |
| 2.375%, due 6/1/29 | 1,000,000 | 945,084 |
| State of Tennessee, Unlimited General Obligation | | |
| Series B | | |
| 1.725%, due 11/1/32 | 1,400,000 | 1,139,377 |
| Tennessee Energy Acquisition Corp., Revenue Bonds | | |
| 4.00%, due 11/1/49 (a) | 7,650,000 | 7,652,751 |
| | | 9,737,212 |
| Texas 6.6% |
| Alamito Public Facility Corp., EP WH Cien Palmas LLC, Revenue Bonds | | |
| Insured: HUD Sector 8 FHA 221(D4) | | |
| 3.50%, due 9/1/25 (a) | 3,500,000 | 3,478,725 |
The notes to the financial statements are an integral part of, and should be read in conjunction with, the financial statements.
21
Portfolio of Investments April 30, 2023†^ (continued)
| | Principal
Amount | Value |
| Long-Term Municipal Bonds (continued) |
| Texas (continued) |
| Central Texas Regional Mobility Authority, Revenue Bonds, Sub. Lien | | |
| 5.00%, due 1/1/27 | $ 10,655,000 | $ 11,208,004 |
| Central Texas Turnpike System, Revenue Bonds | | |
| Series C | | |
| 5.00%, due 8/15/24 | 775,000 | 788,539 |
| City of Austin, Airport System, Revenue Bonds | | |
| 5.00%, due 11/15/25 (b) | 1,630,000 | 1,691,180 |
| City of Austin, Water & Wastewater System, Revenue Bonds | | |
| 5.00%, due 11/15/26 | 3,000,000 | 3,240,241 |
| City of Dallas Housing Finance Corp. Multi-family Housing, Highpoint at Wynnewood, Revenue Bonds | | |
| 3.50%, due 2/1/44 (a) | 2,900,000 | 2,880,349 |
| City of Houston, Hotel Occupancy Tax & Special Tax, Revenue Bonds | | |
| 5.00%, due 9/1/23 | 1,005,000 | 1,010,107 |
| 5.00%, due 9/1/24 | 3,180,000 | 3,248,809 |
| 5.00%, due 9/1/25 | 1,000,000 | 1,016,409 |
| 5.00%, due 9/1/25 | 1,520,000 | 1,586,755 |
| City of Houston, Combined Utility System, Revenue Bonds, First Lien | | |
| Series B | | |
| 5.00%, due 11/15/26 | 2,000,000 | 2,149,648 |
| City of San Antonio, Electric & Gas Systems, Revenue Bonds | | |
| 5.00%, due 2/1/26 | 2,000,000 | 2,116,007 |
| Cypress-Fairbanks Independent School District, Unlimited General Obligation | | |
| Series A, Insured: PSF-GTD | | |
| 5.00%, due 2/15/26 | 1,000,000 | 1,058,150 |
| Dallas Area Rapid Transit, Revenue Bonds | | |
| Series A | | |
| 5.00%, due 12/1/26 | 2,500,000 | 2,575,567 |
| Dallas College, Unlimited General Obligation | | |
| 3.00%, due 2/15/28 | 4,150,000 | 4,181,946 |
| Decatur Hospital Authority, Wise Health System, Revenue Bonds | | |
| Series B | | |
| 5.00%, due 9/1/28 | 845,000 | 836,151 |
| | Principal
Amount | Value |
| |
| Texas (continued) |
Decatur Hospital Authority, Wise Health System, Revenue Bonds
(continued) | | |
| Series B | | |
| 5.00%, due 9/1/29 | $ 1,070,000 | $ 1,056,512 |
| Ennis Independent School District, Unlimited General Obligation | | |
| Insured: PSF-GTD | | |
| (zero coupon), due 8/15/26 | 1,385,000 | 1,245,526 |
| Insured: PSF-GTD | | |
| (zero coupon), due 8/25/30 | 800,000 | 633,422 |
| Fort Bend County Municipal Utility District No. 134B, Unlimited General Obligation | | |
| Insured: AGM | | |
| 6.50%, due 3/1/27 | 390,000 | 437,427 |
| Harris County Municipal Utility District No. 171, Unlimited General Obligation | | |
| Insured: BAM | | |
| 7.00%, due 12/1/26 | 930,000 | 1,046,326 |
| Insured: BAM | | |
| 7.00%, due 12/1/27 | 800,000 | 927,830 |
| Harris County Municipal Utility District No. 489, Unlimited General Obligation | | |
| Insured: BAM | | |
| 6.00%, due 9/1/24 | 680,000 | 704,388 |
| Insured: BAM | | |
| 6.00%, due 9/1/25 | 980,000 | 1,041,736 |
| Insured: BAM | | |
| 6.00%, due 9/1/26 | 980,000 | 1,068,230 |
| Harris County Water Control & Improvement District No. 158, Unlimited General Obligation | | |
| Insured: BAM | | |
| 7.00%, due 9/1/25 | 310,000 | 334,623 |
| Insured: BAM | | |
| 7.00%, due 9/1/26 | 325,000 | 362,497 |
| McKinney Independent School District, Unlimited General Obligation | | |
| Insured: PSF-GTD | | |
| 3.75%, due 2/15/29 | 2,840,000 | 2,872,821 |
| North Harris County Regional Water Authority, Revenue Bonds, Senior Lien | | |
| 5.00%, due 12/15/26 | 1,315,000 | 1,416,068 |
The notes to the financial statements are an integral part of, and should be read in conjunction with, the financial statements.
| 22 | MainStay MacKay Short Term Municipal Fund |
| | Principal
Amount | Value |
| Long-Term Municipal Bonds (continued) |
| Texas (continued) |
| Pasadena Independent School District, Unlimited General Obligation | | |
| Insured: PSF-GTD | | |
| 5.00%, due 2/15/25 | $ 3,120,000 | $ 3,239,090 |
| San Antonio Housing Trust Public Facility Corp., Country Club Village LP, Revenue Bonds | | |
| 4.00%, due 8/1/26 (a) | 2,500,000 | 2,525,903 |
| State of Texas, Unlimited General Obligation | | |
| 2.326%, due 10/1/29 | 3,000,000 | 2,676,534 |
| Texas Natural Gas Securitization Finance Corp., Revenue Bonds | | |
| Series A-1 | | |
| 5.102%, due 4/1/35 | 5,000,000 | 5,254,389 |
| Texas Public Finance Authority, Financing System-Texas Southern University, Revenue Bonds | | |
| Insured: BAM | | |
| 5.00%, due 5/1/24 | 1,055,000 | 1,069,229 |
| Texas Water Development Board, State Water Implementation Revenue Fund for Texas, Revenue Bonds | | |
| 5.00%, due 4/15/27 | 2,680,000 | 2,878,680 |
| | | 73,857,818 |
| U.S. Virgin Islands 1.8% |
| Matching Fund Special Purpose Securitization Corp., Revenue Bonds | | |
| Series A | | |
| 5.00%, due 10/1/25 | 3,850,000 | 3,911,024 |
| Series A | | |
| 5.00%, due 10/1/26 | 15,430,000 | 15,731,289 |
| Virgin Islands Public Finance Authority, Gross Receipts Taxes Loan, Revenue Bonds | | |
| Insured: NATL-RE | | |
| 5.00%, due 10/1/24 | 395,000 | 399,136 |
| | | 20,041,449 |
| | Principal
Amount | Value |
| |
| Utah 0.4% |
| State of Utah, Build America Bonds, Unlimited General Obligation | | |
| Series B | | |
| 3.539%, due 7/1/25 | $ 2,855,519 | $ 2,821,244 |
| Utah Infrastructure Agency, Telecommunication, Revenue Bonds | | |
| 5.00%, due 10/15/26 | 1,265,000 | 1,292,092 |
| Utah Telecommunication Open Infrastructure Agency, Revenue Bonds | | |
| 5.00%, due 6/1/23 | 250,000 | 250,306 |
| 5.00%, due 6/1/24 | 300,000 | 305,216 |
| | | 4,668,858 |
| Virginia 0.6% |
| City of Suffolk, Unlimited General Obligation | | |
| Insured: State Aid Withholding | | |
| 4.00%, due 2/1/36 | 5,085,000 | 5,120,361 |
| Virginia College Building Authority, Revenue Bonds | | |
| Series A, Insured: State Intercept | | |
| 3.00%, due 9/1/25 | 1,365,000 | 1,361,247 |
| | | 6,481,608 |
| Washington 3.0% |
| City of Seattle, Drainage & Wastewater, Revenue Bonds | | |
| 5.00%, due 5/1/27 | 2,540,000 | 2,588,015 |
| County of King, Limited General Obligation | | |
| Series A | | |
| 4.00%, due 12/1/29 | 1,000,000 | 1,031,811 |
| King County School District No. 405, Bellevue, Unlimited General Obligation | | |
| Insured: School Bond Guaranty | | |
| 4.00%, due 12/1/32 | 4,000,000 | 4,083,749 |
| King County School District No. 411, Unlimited General Obligation | | |
| Insured: School Bond Guaranty | | |
| 3.00%, due 12/1/30 | 1,800,000 | 1,812,935 |
| Port of Seattle, Revenue Bonds | | |
| Series C | | |
| 5.00%, due 4/1/24 (b) | 3,360,000 | 3,397,838 |
| Series B | | |
| 5.00%, due 3/1/25 | 1,500,000 | 1,537,393 |
The notes to the financial statements are an integral part of, and should be read in conjunction with, the financial statements.
23
Portfolio of Investments April 30, 2023†^ (continued)
| | Principal
Amount | Value |
| Long-Term Municipal Bonds (continued) |
| Washington (continued) |
| Port of Seattle, Revenue Bonds, First Lien | | |
| Series B | | |
| 5.00%, due 10/1/25 (b) | $ 4,000,000 | $ 4,146,087 |
| Seattle Housing Authority, Revenue Bonds | | |
| 1.00%, due 6/1/26 | 895,000 | 821,248 |
| State of Washington, Unlimited General Obligation | | |
| Series F, Insured: AMBAC | | |
| (zero coupon), due 12/1/26 | 2,000,000 | 1,796,554 |
| State of Washington, Various Purpose, Unlimited General Obligation | | |
| Series R-2015A | | |
| 5.00%, due 7/1/24 | 2,000,000 | 2,043,936 |
| Series R-2015A | | |
| 5.00%, due 7/1/25 | 10,000,000 | 10,217,372 |
| | | 33,476,938 |
| Wisconsin 2.4% |
| City of Milwaukee, Unlimited General Obligation | | |
| Series N-3, Insured: BAM | | |
| 5.00%, due 4/1/27 | 5,840,000 | 6,249,000 |
| Series N-4, Insured: BAM | | |
| 5.00%, due 4/1/27 | 815,000 | 872,078 |
| Series N-3, Insured: BAM | | |
| 5.00%, due 4/1/30 | 1,000,000 | 1,127,769 |
| County of Waushara, Revenue Notes | | |
| Series A | | |
| 4.75%, due 12/1/23 | 3,600,000 | 3,611,303 |
| Public Finance Authority, Northwest Nazarene University, Revenue Bonds | | |
| 5.00%, due 10/1/25 | 500,000 | 511,151 |
| Racine Unified School District, Revenue Bonds | | |
| Series B | | |
| 4.125%, due 4/1/25 (e) | 4,500,000 | 4,510,271 |
| State of Wisconsin, Unlimited General Obligation | | |
| Series 1 | | |
| 5.00%, due 11/1/30 | 6,860,000 | 7,515,528 |
| | Principal
Amount | Value |
| |
| Wisconsin (continued) |
| Village of Mount Pleasant, Revenue Bonds | | |
| Series A, Insured: BAM | | |
| 3.00%, due 3/1/27 | $ 2,450,000 | $ 2,435,910 |
| | | 26,833,010 |
| Wyoming 0.1% |
| Consolidated Municipalities Electric Power Systems, Joint Powers Board, Revenue Bonds | | |
| 5.00%, due 6/1/23 | 500,000 | 500,620 |
Total Long-Term Municipal Bonds
(Cost $866,142,961) | | 868,593,657 |
| Short-Term Municipal Notes 21.2% |
| Alabama 1.8% |
| Alabama Housing Finance Authority, Capstone at Kinsey Cove LP, Revenue Bonds | | |
| Series A | | |
| 3.875%, due 12/1/23 (f) | 1,000,000 | 999,101 |
| Black Belt Energy Gas District, Gas Project No.7, Revenue Bonds | | |
| Series C-2 | | |
| 4.21%, due 10/1/52 (f) | 16,500,000 | 15,907,738 |
| Southeast Alabama Gas Supply District (The), Project No. 1, Revenue Bonds | | |
| Series C | | |
| 4.51%, due 4/1/49 (f) | 3,000,000 | 2,990,851 |
| | | 19,897,690 |
| Arizona 1.3% |
| Arizona Health Facilities Authority, Banner Health, Revenue Bonds | | |
| Series B | | |
| 4.11%, due 1/1/46 (f) | 15,000,000 | 14,692,206 |
| California 1.8% |
| California Infrastructure & Economic Development Bank, Brightline West Passenger Rail Project, Revenue Bonds | | |
| Series A | | |
| 3.65%, due 1/1/50 (b)(c)(f) | 10,000,000 | 9,978,623 |
The notes to the financial statements are an integral part of, and should be read in conjunction with, the financial statements.
| 24 | MainStay MacKay Short Term Municipal Fund |
| | Principal
Amount | Value |
| Short-Term Municipal Notes (continued) |
| California (continued) |
| California Municipal Finance Authority, Waste Management, Inc., Revenue Bonds | | |
| Series A | | |
| 4.125%, due 10/1/41 (b)(f) | $ 5,000,000 | $ 5,036,371 |
| California Pollution Control Financing Authority, Waste Management Project, Revenue Bonds | | |
| Series A | | |
| 2.50%, due 11/1/38 (f) | 5,500,000 | 5,448,145 |
| | | 20,463,139 |
| Connecticut 0.6% |
| Connecticut State Health & Educational Facilities Authority, Yale University, Revenue Bonds | | |
| Series A | | |
| 0.375%, due 7/1/35 (f) | 7,125,000 | 6,852,166 |
| District of Columbia 0.4% |
| District of Columbia Housing Finance Agency, Cascade Park Apartments II Project, Revenue Bonds | | |
| 0.70%, due 8/1/42 (f) | 4,500,000 | 4,289,801 |
| Georgia 0.3% |
| Bartow County Development Authority, Georgia Power Company Plant Bowen Project, Revenue Bonds | | |
| 1.80%, due 9/1/29 (f) | 2,800,000 | 2,377,009 |
| Development Authority of Burke County (The), Georgia Power Co. Vogtle Project, Revenue Bonds | | |
| 2.15%, due 10/1/32 (f) | 1,000,000 | 977,740 |
| | | 3,354,749 |
| Illinois 0.3% |
| Illinois Finance Authority, American Water Capital Corp., Revenue Bonds | | |
| 2.45%, due 10/1/39 (f) | 2,250,000 | 2,047,862 |
| | Principal
Amount | Value |
| |
| Illinois (continued) |
| Illinois Finance Authority, Presbyterian Homes Obligated Group, Revenue Bonds | | |
| Series B | | |
| 4.56%, due 5/1/42 (f) | $ 1,125,000 | $ 1,095,849 |
| | | 3,143,711 |
| Indiana 0.6% |
| Indiana Finance Authority, Republic Services, Inc., Revenue Bonds (f) | | |
| Series B | | |
| 3.65%, due 5/1/28 | 2,500,000 | 2,499,700 |
| Series A | | |
| 4.00%, due 5/1/34 (b) | 2,500,000 | 2,499,690 |
| Indiana Finance Authority, Deaconess Health System, Revenue Bonds | | |
| Series B | | |
| 4.16%, due 3/1/39 (f) | 1,845,000 | 1,802,457 |
| | | 6,801,847 |
| Kansas 0.9% |
| City of Wichita, Wichita Senior Housing, Revenue Bonds | | |
| Series IV, Insured: FHA 221(D4) | | |
| 0.51%, due 11/1/25 (f) | 10,300,000 | 9,708,434 |
| Louisiana 0.3% |
| Parish of St. John the Baptist LA, Marathon Oil Corp. Project, Revenue Bonds | | |
| Series B-2 | | |
| 2.375%, due 6/1/37 (f) | 3,525,000 | 3,336,158 |
| Michigan 1.1% |
| City of Detroit, Water Sewage Disposal System, Revenue Bonds | | |
| Series D, Insured: AGM | | |
| 4.068%, due 7/1/32 (f) | 13,500,000 | 12,584,042 |
| New Jersey 0.5% |
| New Jersey Turnpike Authority, Revenue Bonds (f) | | |
| Series C-4 | | |
| 4.093%, due 1/1/24 | 3,200,000 | 3,198,376 |
| Series D-1 | | |
| 4.093%, due 1/1/24 | 2,600,000 | 2,598,680 |
| | | 5,797,056 |
The notes to the financial statements are an integral part of, and should be read in conjunction with, the financial statements.
25
Portfolio of Investments April 30, 2023†^ (continued)
| | Principal
Amount | Value |
| Short-Term Municipal Notes (continued) |
| New York 2.0% |
| Metropolitan Transportation Authority, Revenue Bonds | | |
| Series D-2A-2, Insured: AGM | | |
| 4.016%, due 11/1/32 (f) | $ 10,875,000 | $ 10,616,350 |
| New York City Transitional Finance Authority, Future Tax Secured, Revenue Bonds | | |
| Series A4 | | |
| 3.75%, due 11/1/29 (f) | 7,000,000 | 7,000,000 |
| Triborough Bridge & Tunnel Authority, MTA Bridges & Tunnels, Revenue Bonds | | |
| Series B-4A | | |
| 3.596%, due 1/1/32 (f) | 4,405,000 | 4,367,909 |
| | | 21,984,259 |
| North Carolina 0.3% |
| Charlotte-Mecklenburg Hospital Authority (The), Atrium Health Obligated Group, Revenue Bonds | | |
| Series G | | |
| 3.80%, due 1/15/48 (f) | 3,000,000 | 3,000,000 |
| Ohio 1.0% |
| Ohio Air Quality Development Authority, American Electric Power Co. Project, Revenue Bonds (b)(f) | | |
| Series C | | |
| 2.10%, due 12/1/27 | 2,210,000 | 2,131,788 |
| 2.10%, due 7/1/28 | 5,000,000 | 4,823,050 |
| Ohio Higher Educational Facility Commission, Case Western Reserve University, Revenue Bonds | | |
| Series B | | |
| 4.09%, due 12/1/42 (f) | 3,995,000 | 3,839,976 |
| State of Ohio, Cleveland Clinic Health System Obligated Group, Revenue Bonds | | |
| 4.26%, due 1/1/52 (f) | 120,000 | 119,995 |
| | | 10,914,809 |
| Pennsylvania 2.3% |
| Lehigh County General Purpose Authority, Muhlenberg College Project, Revenue Bonds | | |
| 4.44%, due 11/1/37 (f) | 12,445,000 | 12,431,750 |
| | Principal
Amount | Value |
| |
| Pennsylvania (continued) |
| Pennsylvania Economic Development Financing Authority, Waste Management, Inc., Revenue Bonds | | |
| Series A | | |
| 4.26%, due 6/1/41 (b)(f) | $ 9,000,000 | $ 8,810,677 |
| Pennsylvania Higher Educational Facilities Authority, Indiana University, Revenue Bonds | | |
| Series A, Insured: AGC | | |
| 4.068%, due 7/1/27 (f) | 2,230,000 | 2,193,863 |
| University of Pittsburgh-of the Commonwealth System of Higher Education, Revenue Bonds | | |
| 4.22%, due 2/15/24 (f) | 2,000,000 | 2,000,168 |
| | | 25,436,458 |
| South Carolina 1.5% |
| Patriots Energy Group Financing Agency, Revenue Bonds | | |
| Series B | | |
| 4.108%, due 10/1/48 (f) | 2,180,000 | 2,183,792 |
| South Carolina Jobs-Economic Development Authority, Holcim US, Inc., Revenue Bonds | | |
| 4.85%, due 12/1/33 (f) | 15,000,000 | 15,000,000 |
| | | 17,183,792 |
| Texas 2.7% |
| Alamito Public Facility Corp., EP Jackie Robinson LP, Revenue Bonds | | |
| Insured: HUD Sector 8 | | |
| 4.375%, due 3/1/41 (f) | 2,000,000 | 1,999,965 |
| Capital Area Housing Finance Corp., Grand Avenue Flats Ltd., Revenue Bonds | | |
| 0.29%, due 8/1/39 (f) | 13,000,000 | 12,328,936 |
| Texas Municipal Gas Acquisition & Supply Corp. II, Revenue Bonds | | |
| Series C | | |
| 3.902%, due 9/15/27 (f) | 15,775,000 | 15,553,306 |
| | | 29,882,207 |
| Washington 1.4% |
| County of King, Sewer, Revenue Bonds, Junior Lien (f) | | |
| Series A | | |
| 0.625%, due 1/1/32 | 5,845,000 | 5,717,888 |
The notes to the financial statements are an integral part of, and should be read in conjunction with, the financial statements.
| 26 | MainStay MacKay Short Term Municipal Fund |
| | Principal
Amount | | Value |
| Short-Term Municipal Notes (continued) |
| Washington (continued) |
| County of King, Sewer, Revenue Bonds, Junior Lien (f) (continued) | | | |
| Series A | | | |
| 4.09%, due 1/1/40 | $ 10,000,000 | | $ 9,742,917 |
| | | | 15,460,805 |
| Wisconsin 0.1% |
| Wisconsin Housing & Economic Development Authority, Revenue Bonds | | | |
| Series B, Insured: HUD Sector 8 | | | |
| 0.50%, due 11/1/50 (f) | 750,000 | | 706,817 |
Total Short-Term Municipal Notes
(Cost $238,720,488) | | | 235,490,146 |
Total Municipal Bonds
(Cost $1,104,863,449) | | | 1,104,083,803 |
| |
| Long-Term Bonds 0.4% |
| Corporate Bond 0.4% |
| Commercial Services 0.4% |
| J Paul Getty Trust (The) | | | |
| Series 2021 | | | |
| 0.391%, due 1/1/24 | 5,000,000 | | 4,847,964 |
Total Long-Term Bonds
(Cost $4,851,349) | | | 4,847,964 |
Total Investments
(Cost $1,109,714,798) | 99.7% | | 1,108,931,767 |
| Other Assets, Less Liabilities | 0.3 | | 3,119,244 |
| Net Assets | 100.0% | | $ 1,112,051,011 |
| † | Percentages indicated are based on Fund net assets. |
| ^ | Industry classifications may be different than those used for compliance monitoring purposes. |
| (a) | Coupon rate may change based on changes of the underlying collateral or prepayments of principal. Rate shown was the rate in effect as of April 30, 2023. |
| (b) | Interest on these securities was subject to alternative minimum tax. |
| (c) | May be sold to institutional investors only under Rule 144A or securities offered pursuant to Section 4(a)(2) of the Securities Act of 1933, as amended. |
| (d) | Floating rate—Rate shown was the rate in effect as of April 30, 2023. |
| (e) | Delayed delivery security. |
| (f) | Variable-rate demand notes (VRDNs)—Provide the right to sell the security at face value on either that day or within the rate-reset period. VRDNs will normally trade as if the maturity is the earlier put date, even though stated maturity is longer. The interest rate is reset on the put date at a stipulated daily, weekly, monthly, quarterly, or other specified time interval to reflect current market conditions. These securities do not indicate a reference rate and spread in their description. The maturity date shown is the final maturity. |
| Abbreviation(s): |
| AGC—Assured Guaranty Corp. |
| AGM—Assured Guaranty Municipal Corp. |
| AMBAC—Ambac Assurance Corp. |
| BAM—Build America Mutual Assurance Co. |
| CR—Custodial Receipts |
| FHA—Federal Housing Administration |
| FHLMC—Federal Home Loan Mortgage Corp. |
| FNMA—Federal National Mortgage Association |
| GNMA—Government National Mortgage Association |
| HUD—Housing and Urban Development |
| NATL-RE—National Public Finance Guarantee Corp. |
| PSF-GTD—Permanent School Fund Guaranteed |
| Q-SBLF—Qualified School Board Loan Fund |
| SD CRED PROG—School District Credit Enhancement Program |
| SONYMA—State of New York Mortgage Agency |
The notes to the financial statements are an integral part of, and should be read in conjunction with, the financial statements.
27
Portfolio of Investments April 30, 2023†^ (continued)
The following is a summary of the fair valuations according to the inputs used as of April 30, 2023, for valuing the Fund’s assets:
| Description | Quoted
Prices in
Active
Markets for
Identical
Assets
(Level 1) | | Significant
Other
Observable
Inputs
(Level 2) | | Significant
Unobservable
Inputs
(Level 3) | | Total |
| Asset Valuation Inputs | | | | | | | |
| Investments in Securities (a) | | | | | | | |
| Municipal Bonds | | | | | | | |
| Long-Term Municipal Bonds | $ — | | $ 868,593,657 | | $ — | | $ 868,593,657 |
| Short-Term Municipal Notes | — | | 235,490,146 | | — | | 235,490,146 |
| Total Municipal Bonds | — | | 1,104,083,803 | | — | | 1,104,083,803 |
| Long-Term Bonds | | | | | | | |
| Corporate Bond | — | | 4,847,964 | | — | | 4,847,964 |
| Total Investments in Securities | $ — | | $ 1,108,931,767 | | $ — | | $ 1,108,931,767 |
| (a) | For a complete listing of investments and their industries, see the Portfolio of Investments. |
The notes to the financial statements are an integral part of, and should be read in conjunction with, the financial statements.
| 28 | MainStay MacKay Short Term Municipal Fund |
Statement of Assets and Liabilities as of April 30, 2023
| Assets |
Investment in securities, at value
(identified cost $1,109,714,798) | $1,108,931,767 |
| Cash | 9,954,233 |
| Receivables: | |
| Interest | 11,000,304 |
| Fund shares sold | 1,904,998 |
| Investment securities sold | 1,814,632 |
| Other assets | 15,190 |
| Total assets | 1,133,621,124 |
| Liabilities |
| Payables: | |
| Investment securities purchased | 16,380,573 |
| Fund shares redeemed | 3,479,795 |
| Manager (See Note 3) | 301,600 |
| Custodian | 107,345 |
| NYLIFE Distributors (See Note 3) | 75,997 |
| Transfer agent (See Note 3) | 69,241 |
| Shareholder communication | 31,782 |
| Professional fees | 13,482 |
| Trustees | 1,149 |
| Accrued expenses | 12,013 |
| Distributions payable | 1,097,136 |
| Total liabilities | 21,570,113 |
| Net assets | $1,112,051,011 |
| Composition of Net Assets |
| Shares of beneficial interest outstanding (par value of $.001 per share) unlimited number of shares authorized | $ 120,107 |
| Additional paid-in-capital | 1,189,110,658 |
| | 1,189,230,765 |
| Total distributable earnings (loss) | (77,179,754) |
| Net assets | $1,112,051,011 |
| Class A | |
| Net assets applicable to outstanding shares | $306,828,276 |
| Shares of beneficial interest outstanding | 33,138,172 |
| Net asset value per share outstanding | $ 9.26 |
| Maximum sales charge (1.00% of offering price) | 0.09 |
| Maximum offering price per share outstanding | $ 9.35 |
| Class A2 | |
| Net assets applicable to outstanding shares | $ 54,325,768 |
| Shares of beneficial interest outstanding | 5,860,037 |
| Net asset value per share outstanding | $ 9.27 |
| Maximum sales charge (2.00% of offering price) | 0.19 |
| Maximum offering price per share outstanding | $ 9.46 |
| Investor Class | |
| Net assets applicable to outstanding shares | $ 2,511,193 |
| Shares of beneficial interest outstanding | 270,471 |
| Net asset value per share outstanding | $ 9.28 |
| Maximum sales charge (0.50% of offering price) | 0.05 |
| Maximum offering price per share outstanding | $ 9.33 |
| Class I | |
| Net assets applicable to outstanding shares | $663,174,882 |
| Shares of beneficial interest outstanding | 71,627,988 |
| Net asset value and offering price per share outstanding | $ 9.26 |
| Class R6 | |
| Net assets applicable to outstanding shares | $ 85,210,892 |
| Shares of beneficial interest outstanding | 9,209,949 |
| Net asset value and offering price per share outstanding | $ 9.25 |
The notes to the financial statements are an integral part of, and should be read in conjunction with, the financial statements.
29
Statement of Operations for the year ended April 30, 2023
| Investment Income (Loss) |
| Income | |
| Interest | $ 32,193,048 |
| Expenses | |
| Manager (See Note 3) | 4,799,723 |
| Distribution/Service—Class A (See Note 3) | 935,547 |
| Distribution/Service—Class A2 (See Note 3) | 190,927 |
| Distribution/Service—Investor Class (See Note 3) | 6,840 |
| Transfer agent (See Note 3) | 423,800 |
| Custodian | 330,841 |
| Registration | 154,870 |
| Professional fees | 152,217 |
| Shareholder communication | 48,693 |
| Trustees | 34,625 |
| Miscellaneous | 56,357 |
| Total expenses before waiver/reimbursement | 7,134,440 |
| Expense waiver/reimbursement from Manager (See Note 3) | (272,071) |
| Reimbursement from prior custodian(a) | (2,332) |
| Net expenses | 6,860,037 |
| Net investment income (loss) | 25,333,011 |
| Realized and Unrealized Gain (Loss) |
| Net realized gain (loss) on investments | (59,327,437) |
| Net change in unrealized appreciation (depreciation) on investments | 51,945,156 |
| Net realized and unrealized gain (loss) | (7,382,281) |
| Net increase (decrease) in net assets resulting from operations | $ 17,950,730 |
| (a) | Represents a refund for overbilling of custody fees. |
The notes to the financial statements are an integral part of, and should be read in conjunction with, the financial statements.
| 30 | MainStay MacKay Short Term Municipal Fund |
Statements of Changes in Net Assets
for the years ended April 30, 2023 and April 30, 2022
| | 2023 | 2022 |
| Increase (Decrease) in Net Assets |
| Operations: | | |
| Net investment income (loss) | $ 25,333,011 | $ 11,016,224 |
| Net realized gain (loss) | (59,327,437) | (9,580,898) |
| Net change in unrealized appreciation (depreciation) | 51,945,156 | (72,063,429) |
| Net increase (decrease) in net assets resulting from operations | 17,950,730 | (70,628,103) |
| Distributions to shareholders: | | |
| Class A | (6,648,263) | (2,489,358) |
| Class A2 | (1,288,784) | (604,316) |
| Investor Class | (40,583) | (7,453) |
| Class I | (17,108,080) | (11,061,272) |
| Class R6 | (1,910,732) | — |
| Total distributions to shareholders | (26,996,442) | (14,162,399) |
| Capital share transactions: | | |
| Net proceeds from sales of shares | 876,229,496 | 1,461,111,895 |
| Net asset value of shares issued to shareholders in reinvestment of distributions | 16,530,565 | 9,157,948 |
| Cost of shares redeemed | (1,409,052,393) | (1,744,044,217) |
| Increase (decrease) in net assets derived from capital share transactions | (516,292,332) | (273,774,374) |
| Net increase (decrease) in net assets | (525,338,044) | (358,564,876) |
| Net Assets |
| Beginning of year | 1,637,389,055 | 1,995,953,931 |
| End of year | $ 1,112,051,011 | $ 1,637,389,055 |
The notes to the financial statements are an integral part of, and should be read in conjunction with, the financial statements.
31
Financial Highlights selected per share data and ratios
| | Year Ended April 30, |
| Class A | 2023 | | 2022 | | 2021 | | 2020 | | 2019 |
| Net asset value at beginning of year | $ 9.31 | | $ 9.73 | | $ 9.54 | | $ 9.58 | | $ 9.51 |
| Net investment income (loss) (a) | 0.15 | | 0.04 | | 0.06 | | 0.13 | | 0.12 |
| Net realized and unrealized gain (loss) | (0.03) | | (0.41) | | 0.21 | | (0.03) | | 0.07 |
| Total from investment operations | 0.12 | | (0.37) | | 0.27 | | 0.10 | | 0.19 |
| Less distributions: | | | | | | | | | |
| From net investment income | (0.17) | | (0.05) | | (0.08) | | (0.14) | | (0.12) |
| Net asset value at end of year | $ 9.26 | | $ 9.31 | | $ 9.73 | | $ 9.54 | | $ 9.58 |
| Total investment return (b) | 1.32% | | (3.81)% | | 2.85% | | 1.05% | | 2.04%(c) |
| Ratios (to average net assets)/Supplemental Data: | | | | | | | | | |
| Net investment income (loss) | 1.66% | | 0.36% | | 0.63% | | 1.30% | | 1.28% |
| Net expenses | 0.68% | | 0.67% | | 0.65% | | 0.69% | | 0.71% |
| Expenses (before waiver/reimbursement) | 0.68% | | 0.67% | | 0.65% | | 0.70% | | 0.71% |
| Portfolio turnover rate | 99%(d) | | 62%(d) | | 28%(d) | | 94%(d) | | 96% |
| Net assets at end of year (in 000’s) | $ 306,828 | | $ 409,722 | | $ 503,769 | | $ 152,614 | | $ 113,023 |
| (a) | Per share data based on average shares outstanding during the year. |
| (b) | Total investment return is calculated exclusive of sales charges and assumes the reinvestment of dividends and distributions. For periods of less than one year, total return is not annualized. |
| (c) | Total investment return may reflect adjustments to conform to generally accepted accounting principles. |
| (d) | The portfolio turnover rate includes variable rate demand notes. |
| | Year Ended April 30, | | September 30, 2020^ through
April 30,
2021 |
| Class A2 | 2023 | | 2022 | |
| Net asset value at beginning of period | $ 9.32 | | $ 9.75 | | $ 9.70** |
| Net investment income (loss) (a) | 0.15 | | 0.03 | | 0.02 |
| Net realized and unrealized gain (loss) | (0.03) | | (0.41) | | 0.07 |
| Total from investment operations | 0.12 | | (0.38) | | 0.09 |
| Less distributions: | | | | | |
| From net investment income | (0.17) | | (0.05) | | (0.04) |
| Net asset value at end of period | $ 9.27 | | $ 9.32 | | $ 9.75 |
| Total investment return (b) | 1.32% | | (3.91)% | | 0.90% |
| Ratios (to average net assets)/Supplemental Data: | | | | | |
| Net investment income (loss) | 1.57% | | 0.36% | | 0.40%†† |
| Net expenses | 0.68% | | 0.67% | | 0.65%†† |
| Portfolio turnover rate (c) | 99% | | 62% | | 28% |
| Net assets at end of period (in 000's) | $ 54,326 | | $ 98,890 | | $ 88,248 |
| ** | Based on the net asset value of Class A as of September 30, 2020. |
| ^ | Inception date. |
| †† | Annualized. |
| (a) | Per share data based on average shares outstanding during the period. |
| (b) | Total investment return is calculated exclusive of sales charges and assumes the reinvestment of dividends and distributions. For periods of less than one year, total return is not annualized. |
| (c) | The portfolio turnover rate includes variable rate demand notes. |
The notes to the financial statements are an integral part of, and should be read in conjunction with, the financial statements.
| 32 | MainStay MacKay Short Term Municipal Fund |
Financial Highlights selected per share data and ratios
| | Year Ended April 30, |
| Investor Class | 2023 | | 2022 | | 2021 | | 2020 | | 2019 |
| Net asset value at beginning of year | $ 9.33 | | $ 9.76 | | $ 9.57 | | $ 9.61 | | $ 9.54 |
| Net investment income (loss) (a) | 0.13 | | 0.01 | | 0.04 | | 0.09 | | 0.08 |
| Net realized and unrealized gain (loss) | (0.04) | | (0.42) | | 0.20 | | (0.02) | | 0.07 |
| Total from investment operations | 0.09 | | (0.41) | | 0.24 | | 0.07 | | 0.15 |
| Less distributions: | | | | | | | | | |
| From net investment income | (0.14) | | (0.02) | | (0.05) | | (0.11) | | (0.08) |
| Net asset value at end of year | $ 9.28 | | $ 9.33 | | $ 9.76 | | $ 9.57 | | $ 9.61 |
| Total investment return (b) | 0.99% | | (4.19)% | | 2.64% | | 0.61% | | 1.56% |
| Ratios (to average net assets)/Supplemental Data: | | | | | | | | | |
| Net investment income (loss) | 1.37% | | 0.06% | | 0.41% | | 0.98% | | 0.81% |
| Net expenses | 1.00% | | 0.99% | | 0.98% | | 1.09% | | 1.18% |
| Expenses (before waiver/reimbursement) | 1.30% | | 1.24% | | 1.25% | | 1.28% | | 1.30% |
| Portfolio turnover rate | 99%(c) | | 62%(c) | | 28%(c) | | 94%(c) | | 96% |
| Net assets at end of year (in 000's) | $ 2,511 | | $ 2,884 | | $ 3,608 | | $ 4,158 | | $ 3,834 |
| (a) | Per share data based on average shares outstanding during the year. |
| (b) | Total investment return is calculated exclusive of sales charges and assumes the reinvestment of dividends and distributions. For periods of less than one year, total return is not annualized. |
| (c) | The portfolio turnover rate includes variable rate demand notes. |
| | Year Ended April 30, |
| Class I | 2023 | | 2022 | | 2021 | | 2020 | | 2019 |
| Net asset value at beginning of year | $ 9.31 | | $ 9.73 | | $ 9.54 | | $ 9.58 | | $ 9.51 |
| Net investment income (loss) (a) | 0.18 | | 0.06 | | 0.09 | | 0.15 | | 0.15 |
| Net realized and unrealized gain (loss) | (0.03) | | (0.40) | | 0.21 | | (0.02) | | 0.07 |
| Total from investment operations | 0.15 | | (0.34) | | 0.30 | | 0.13 | | 0.22 |
| Less distributions: | | | | | | | | | |
| From net investment income | (0.20) | | (0.08) | | (0.11) | | (0.17) | | (0.15) |
| Net asset value at end of year | $ 9.26 | | $ 9.31 | | $ 9.73 | | $ 9.54 | | $ 9.58 |
| Total investment return (b) | 1.60% | | (3.55)% | | 3.12% | | 1.34% | | 2.34% |
| Ratios (to average net assets)/Supplemental Data: | | | | | | | | | |
| Net investment income (loss) | 1.89% | | 0.63% | | 0.89% | | 1.58% | | 1.61% |
| Net expenses | 0.40% | | 0.40% | | 0.40% | | 0.40% | | 0.40% |
| Expenses (before waiver/reimbursement) | 0.43% | | 0.42% | | 0.40% | | 0.45% | | 0.45% |
| Portfolio turnover rate | 99%(c) | | 62%(c) | | 28%(c) | | 94%(c) | | 96% |
| Net assets at end of year (in 000’s) | $ 663,175 | | $ 1,125,893 | | $ 1,400,328 | | $ 412,193 | | $ 337,116 |
| (a) | Per share data based on average shares outstanding during the year. |
| (b) | Total investment return is calculated exclusive of sales charges and assumes the reinvestment of dividends and distributions. For periods of less than one year, total return is not annualized. |
| (c) | The portfolio turnover rate includes variable rate demand notes. |
The notes to the financial statements are an integral part of, and should be read in conjunction with, the financial statements.
33
Financial Highlights selected per share data and ratios
| | May 2, 2022^ through
April 30, |
| Class R6 | 2023 |
| Net asset value at beginning of period | $ 9.30** |
| Net investment income (loss) (a) | 0.18 |
| Net realized and unrealized gain (loss) | (0.03) |
| Total from investment operations | 0.15 |
| Less distributions: | |
| From net investment income | (0.20) |
| Net asset value at end of period | $ 9.25 |
| Total investment return (b) | 1.60% |
| Ratios (to average net assets)/Supplemental Data: | |
| Net investment income (loss) | 2.00%†† |
| Net expenses (c) | 0.40%†† |
| Portfolio turnover rate (d) | 99% |
| Net assets at end of period (in 000’s) | $ 85,211 |
| ** | Based on the net asset value of Class I as of May 2, 2022. |
| ^ | Inception date. |
| †† | Annualized. |
| (a) | Per share data based on average shares outstanding during the period. |
| (b) | Total investment return is calculated exclusive of sales charges and assumes the reinvestment of dividends and distributions. For periods of less than one year, total return is not annualized. |
| (c) | Expense waiver/reimbursement less than 0.01%. |
| (d) | The portfolio turnover rate includes variable rate demand notes. |
The notes to the financial statements are an integral part of, and should be read in conjunction with, the financial statements.
| 34 | MainStay MacKay Short Term Municipal Fund |
Notes to Financial Statements
Note 1-Organization and Business
MainStay Funds Trust (the “Trust”) was organized as a Delaware statutory trust on April 28, 2009. The Trust is registered under the Investment Company Act of 1940, as amended (the “1940 Act”), as an open-end management investment company, and is comprised of thirty-three funds (collectively referred to as the “Funds”). These financial statements and notes relate to the MainStay MacKay Short Term Municipal Fund (the "Fund"), a “diversified” fund, as that term is defined in the 1940 Act, as interpreted or modified by regulatory authorities having jurisdiction, from time to time.
The following table lists the Fund's share classes that have been registered and commenced operations:
| Class | Commenced Operations |
| Class A | January 2, 2004 |
| Class A2 | September 30, 2020 |
| Investor Class | February 28, 2008 |
| Class I | January 2, 1991 |
| Class R6 | May 2, 2022 |
| SIMPLE Class | N/A* |
| * | SIMPLE Class shares were registered for sale effective as of August 31, 2020 but have not yet commenced operations. |
Class A and Investor Class shares are offered at net asset value (“NAV”) per share plus an initial sales charge. No initial sales charge applies to investments of $250,000 or more (and certain other qualified purchases) in Class A and Investor Class shares. However, a contingent deferred sales charge (“CDSC”) of 0.50% may be imposed on certain redemptions made within 12 months of the date of purchase on shares that were purchased without an initial sales charge. Class A2 shares are offered at NAV without an initial sales charge, although a 0.50% CDSC may be imposed on certain redemptions of such shares made within one year of the date of purchase of Class A2 shares. Class I shares are offered at NAV without a sales charge. Class R6 shares are currently expected to be offered at NAV without a sales charge. SIMPLE Class shares are expected to be offered at NAV without a sales charge if such shares are offered in the future. Additionally, Investor Class shares may convert automatically to Class A shares. Under certain circumstances and as may be permitted by the Trust’s multiple class plan pursuant to Rule 18f-3 under the 1940 Act, specified share classes of the Fund may be converted to one or more other share classes of the Fund as disclosed in the capital share transactions within these Notes. The classes of shares have the same voting (except for issues that relate solely to one class), dividend, liquidation and other rights, and the same terms and conditions, except that under distribution plans pursuant to Rule 12b-1 under the 1940 Act, Class A, Investor Class and SIMPLE Class shares are subject to a distribution and/or service fee. Class I and Class R6 shares are not subject to a distribution and/or service fee.
The Fund's investment objective is to seek current income exempt from regular federal income tax.
Note 2–Significant Accounting Policies
The Fund is an investment company and accordingly follows the investment company accounting and reporting guidance of the Financial Accounting Standards Board (“FASB”) Accounting Standards Codification Topic 946 Financial Services—Investment Companies. The Fund prepares its financial statements in accordance with generally accepted accounting principles (“GAAP”) in the United States of America and follows the significant accounting policies described below.
(A) Securities Valuation. Investments are usually valued as of the close of regular trading on the New York Stock Exchange (the "Exchange") (usually 4:00 p.m. Eastern time) on each day the Fund is open for business ("valuation date").
Pursuant to Rule 2a-5 under the 1940 Act, the Board of Trustees of the Trust (the "Board") has designated New York Life Investment Management LLC (“New York Life Investments” or the "Manager") as its Valuation Designee (the "Valuation Designee"). The Valuation Designee is responsible for performing fair valuations relating to all investments in the Fund’s portfolio for which market quotations are not readily available; periodically assessing and managing material valuation risks; establishing and applying fair value methodologies; testing fair valuation methodologies; evaluating and overseeing pricing services; ensuring appropriate segregation of valuation and portfolio management functions; providing quarterly, annual and prompt reporting to the Board, as appropriate; identifying potential conflicts of interest; and maintaining appropriate records. The Valuation Designee has established a valuation committee ("Valuation Committee") to assist in carrying out the Valuation Designee’s responsibilities and establish prices of securities for which market quotations are not readily available. The Fund's and the Valuation Designee's policies and procedures ("Valuation Procedures") govern the Valuation Designee’s selection and application of methodologies for determining and calculating the fair value of Fund investments. The Valuation Designee may value the Fund's portfolio securities for which market quotations are not readily available and other Fund assets utilizing inputs from pricing services and other third-party sources. The Valuation Committee meets (in person, via electronic mail or via teleconference) on an ad-hoc basis to determine fair valuations and on a quarterly basis to review fair value events with respect to certain securities for which market quotations are not readily available, including valuation risks and back-testing results, and preview reports to the Board.
The Valuation Committee establishes prices of securities for which market quotations are not readily available based on such methodologies and measurements on a regular basis after considering information that is reasonably available and deemed relevant by the Valuation Committee. The Board shall oversee the Valuation Designee and review fair valuation materials on a prompt, quarterly and annual basis and approve proposed revisions to the Valuation Procedures.
Investments for which market quotations are not readily available are valued at fair value as determined in good faith pursuant to the Valuation Procedures. A market quotation is readily available only when that
Notes to Financial Statements (continued)
quotation is a quoted price (unadjusted) in active markets for identical investments that the Fund can access at the measurement date, provided that a quotation will not be readily available if it is not reliable. "Fair value" is defined as the price the Fund would reasonably expect to receive upon selling an asset or liability in an orderly transaction to an independent buyer in the principal or most advantageous market for the asset or liability. Fair value measurements are determined within a framework that establishes a three-tier hierarchy that maximizes the use of observable market data and minimizes the use of unobservable inputs to establish a classification of fair value measurements for disclosure purposes. "Inputs" refer broadly to the assumptions that market participants would use in pricing the asset or liability, including assumptions about risk, such as the risk inherent in a particular valuation technique used to measure fair value using a pricing model and/or the risk inherent in the inputs for the valuation technique. Inputs may be observable or unobservable. Observable inputs reflect the assumptions market participants would use in pricing the asset or liability based on market data obtained from sources independent of the Fund. Unobservable inputs reflect the Fund’s own assumptions about the assumptions market participants would use in pricing the asset or liability based on the information available. The inputs or methodology used for valuing assets or liabilities may not be an indication of the risks associated with investing in those assets or liabilities. The three-tier hierarchy of inputs is summarized below.
| • | Level 1—quoted prices (unadjusted) in active markets for an identical asset or liability |
| • | Level 2—other significant observable inputs (including quoted prices for a similar asset or liability in active markets, interest rates and yield curves, prepayment speeds, credit risk, etc.) |
| • | Level 3—significant unobservable inputs (including the Fund's own assumptions about the assumptions that market participants would use in measuring fair value of an asset or liability) |
The level of an asset or liability within the fair value hierarchy is based on the lowest level of an input, both individually and in the aggregate, that is significant to the fair value measurement. The aggregate value by input level of the Fund’s assets and liabilities as of April 30, 2023, is included at the end of the Portfolio of Investments.
The Fund may use third-party vendor evaluations, whose prices may be derived from one or more of the following standard inputs, among others:
| • Benchmark yields | • Reported trades |
| • Broker/dealer quotes | • Issuer spreads |
| • Two-sided markets | • Benchmark securities |
| • Bids/offers | • Reference data (corporate actions or material event notices) |
| • Industry and economic events | • Comparable bonds |
| • Monthly payment information | |
An asset or liability for which a market quotation is not readily available is valued by methods deemed reasonable in good faith by the Valuation Committee, following the Valuation Procedures to represent fair value.
Under these procedures, the Valuation Designee generally uses a market-based approach which may use related or comparable assets or liabilities, recent transactions, market multiples, book values and other relevant information. The Valuation Designee may also use an income-based valuation approach in which the anticipated future cash flows of the asset or liability are discounted to calculate fair value. Discounts may also be applied due to the nature and/or duration of any restrictions on the disposition of the asset or liability. Fair value represents a good faith approximation of the value of a security. Fair value determinations involve the consideration of a number of subjective factors, an analysis of applicable facts and circumstances and the exercise of judgment. As a result, it is possible that the fair value for a security determined in good faith in accordance with the Valuation Procedures may differ from valuations for the same security determined for other funds using their own valuation procedures. Although the Valuation Procedures are designed to value a security at the price the Fund may reasonably expect to receive upon the security's sale in an orderly transaction, there can be no assurance that any fair value determination thereunder would, in fact, approximate the amount that the Fund would actually realize upon the sale of the security or the price at which the security would trade if a reliable market price were readily available. During the year ended April 30, 2023, there were no material changes to the fair value methodologies.
Securities which may be valued in this manner include, but are not limited to: (i) a security for which trading has been halted or suspended or otherwise does not have a readily available market quotation on a given day; (ii) a debt security that has recently gone into default and for which there is not a current market quotation; (iii) a security of an issuer that has entered into a restructuring; (iv) a security that has been delisted from a national exchange; (v) a security subject to trading collars for which no or limited trading takes place; and (vi) a security whose principal market has been temporarily closed at a time when, under normal conditions, it would be open. Securities valued in this manner are generally categorized as Level 2 or 3 in the hierarchy.
Municipal debt securities are valued at the evaluated mean prices supplied by a pricing agent or broker selected by the Valuation Designee, in consultation with the Subadvisor. The evaluations are market-based measurements processed through a pricing application and represents the pricing agent's good faith determination as to what a holder may receive in an orderly transaction under market conditions. The rules-based logic utilizes valuation techniques that reflect participants' assumptions and vary by asset class and per methodology, maximizing the use of relevant observable data including quoted prices for similar assets, benchmark yield curves and market corroborated inputs. The evaluated bid or mean prices are deemed by the Valuation Designee, in consultation with the Subadvisor, to be representative of market values, at the regular close of trading of the Exchange on each valuation date. Municipal debt securities purchased on a delayed delivery basis are marked to market daily until settlement at the forward settlement date. Municipal debt securities are generally categorized as Level 2 in the hierarchy.
| 36 | MainStay MacKay Short Term Municipal Fund |
The information above is not intended to reflect an exhaustive list of the methodologies that may be used to value portfolio investments. The Valuation Procedures permit the use of a variety of valuation methodologies in connection with valuing portfolio investments. The methodology used for a specific type of investment may vary based on the market data available or other considerations. The methodologies summarized above may not represent the specific means by which portfolio investments are valued on any particular business day.
(B) Income Taxes. The Fund's policy is to comply with the requirements of the Internal Revenue Code of 1986, as amended (the “Internal Revenue Code”), applicable to regulated investment companies and to distribute all of its taxable income to the shareholders of the Fund within the allowable time limits.
The Manager evaluates the Fund’s tax positions to determine if the tax positions taken meet the minimum recognition threshold in connection with accounting for uncertainties in income tax positions taken or expected to be taken for the purposes of measuring and recognizing tax liabilities in the financial statements. Recognition of tax benefits of an uncertain tax position is permitted only to the extent the position is “more likely than not” to be sustained assuming examination by taxing authorities. The Manager analyzed the Fund's tax positions taken on federal, state and local income tax returns for all open tax years (for up to three tax years) and has concluded that no provisions for federal, state and local income tax are required in the Fund's financial statements. The Fund's federal, state and local income tax and federal excise tax returns for tax years for which the applicable statutes of limitations have not expired are subject to examination by the Internal Revenue Service and state and local departments of revenue.
(C) Dividends and Distributions to Shareholders. Dividends and distributions are recorded on the ex-dividend date. The Fund intends to declare dividends from net investment income, if any, daily and intends to pay them at least monthly and distributions from net realized capital and currency gains, if any, at least annually. Unless a shareholder elects otherwise, all dividends and distributions are reinvested at NAV in the same class of shares of the Fund. Dividends and distributions to shareholders are determined in accordance with federal income tax regulations and may differ from determinations using GAAP.
(D) Security Transactions and Investment Income. The Fund records security transactions on the trade date. Realized gains and losses on security transactions are determined using the identified cost method. Interest income is accrued as earned using the effective interest rate method. Discounts and premiums on securities purchased, other than temporary cash investments that mature in 60 days or less at the time of purchase, for the Fund are accreted and amortized, respectively, on the effective interest rate method.
Investment income and realized and unrealized gains and losses on investments of the Fund are allocated pro rata to the separate classes of shares based upon their relative net assets on the date the income is earned or realized and unrealized gains and losses are incurred.
The Fund may place a debt security on non-accrual status and reduce related interest income by ceasing current accruals and writing off all or a portion of any interest receivables when the collection of all or a portion of such interest has become doubtful. A debt security is removed from non-accrual status when the issuer resumes interest payments or when collectability of interest is reasonably assured.
(E) Expenses. Expenses of the Trust are allocated to the individual Funds in proportion to the net assets of the respective Funds when the expenses are incurred, except where direct allocations of expenses can be made. Expenses (other than transfer agent expenses and fees incurred under the shareholder services plans and/or the distribution plans further discussed in Note 3(B)) are allocated to separate classes of shares pro rata based upon their relative net assets on the date the expenses are incurred. The expenses borne by the Fund, including those of related parties to the Fund, are shown in the Statement of Operations.
(F) Use of Estimates. In preparing financial statements in conformity with GAAP, the Manager makes estimates and assumptions that affect the reported amounts and disclosures in the financial statements. Actual results could differ from those estimates and assumptions.
(G) Delayed Delivery Transactions. The Fund may purchase or sell securities on a delayed delivery basis. These transactions involve a commitment by the Fund to purchase or sell securities for a predetermined price or yield, with payment and delivery taking place beyond the customary settlement period. When delayed delivery purchases are outstanding, the Fund will designate liquid assets in an amount sufficient to meet the purchase price. When purchasing a security on a delayed delivery basis, the Fund assumes the rights and risks of ownership of the security, including the risk of price and yield fluctuations, and takes such fluctuations into account when determining its NAV. The Fund may dispose of or renegotiate a delayed delivery transaction after it is entered into, and may sell delayed delivery securities before they are delivered, which may result in a realized gain or loss. When the Fund has sold a security it owns on a delayed delivery basis, the Fund does not participate in future gains and losses with respect to the security. Delayed delivery transactions as of April 30, 2023, are shown in the Portfolio of Investments.
(H) Debt Securities Risk. The Fund's investments may include securities such as variable rate notes, floaters and mortgage-related and asset-backed securities. If expectations about changes in interest rates or assessments of an issuer's credit worthiness or market conditions are incorrect, investments in these types of securities could lose money for the Fund.
(I) Municipal Bond Risk. The Fund may invest more heavily in municipal bonds from certain cities, states, territories or regions than others, which may increase the Fund’s exposure to losses resulting from economic, political, regulatory occurrences, or declines in tax revenue impacting these particular cities, states, territories or regions. In addition, many state and municipal governments that issue securities are under significant economic and financial stress and may not be able to satisfy
Notes to Financial Statements (continued)
their obligations, and these events may be made worse due to economic challenges posed by COVID-19. The Fund may invest a substantial amount of its assets in municipal bonds whose interest is paid solely from revenues of similar projects, such as tobacco settlement bonds. If the Fund concentrates its investments in this manner, it assumes the legal and economic risks relating to such projects and this may have a significant impact on the Fund’s investment performance.
Certain of the issuers in which the Fund may invest have recently experienced, or may experience, significant financial difficulties and repeated credit rating downgrades. On May 3, 2017, the Commonwealth of Puerto Rico (the "Commonwealth") began proceedings pursuant to the Puerto Rico Oversight, Management, and Economic Stability Act (“PROMESA”) to seek bankruptcy-type protections from approximately $74 billion in debt and approximately $48 billion in unfunded pension obligations. In addition, the economic downturn following the outbreak of COVID-19 and the resulting pressure on Puerto Rico’s budget have further contributed to its financial challenges. The federal government has passed certain relief packages, including the Coronavirus Aid, Relief, and Economic Security Act and the American Rescue Plan, which included an aggregate of more than $7 billion in disaster relief funds for the U.S. territories, including Puerto Rico. However, there can be no assurances that the federal funds allocated to the Commonwealth will be sufficient to address the long-term economic challenges that arose from COVID-19.
The Commonwealth concluded its Title III restructuring proceedings on behalf of itself and certain instrumentalities effective March 15, 2022. Approximately $18.75 billion of claims related to debt guaranteed under Puerto Rico's constitution including the Commonwealth of Puerto Rico in new Puerto Rico General Obligation Bonds, $7.1 billion of cash, and $3.5 billion of new Contingent Value instruments. In addition, the Commonwealth's exit from the restructuring proceedings resolved certain claims relating to the Commonwealth Employee Retirement System, Convention Center, Highway Authority, and Infrastructure Financing Authority. Two of the Commonwealth's agencies are still under Title III restructuring proceedings including the Puerto Rico Electric Power Authority (PREPA) and the Puerto Rico Industrial Development Authority (PRIDCO).
Puerto Rico’s debt restructuring process and other economic, political, social, environmental or health factors or developments could occur rapidly and may significantly affect the value of municipal securities of Puerto Rico. Any agreement between the Federal Oversight and Management Board and creditors is subject to approval by the judge overseeing the Title III proceedings. The composition of the Federal Oversight and Management Board is subject to change every three years due to existing members either stepping down or being replaced following the expiration of a member's term. There is no assurance that board members will approve the restructuring agreements that a prior board negotiated.
As of May 30, 2023 the Puerto Rico Electric Power Authority (PREPA) remains in Title III Bankruptcy after nearly 6 years. A significant number of net revenue bond creditors, the Oversight Board, and the
Commonwealth have been unable to reach a consensual resolution on PREPA’s debt restructuring following the termination of the previous 2019 PREPA Restructuring Support Agreement by the Commonwealth of Puerto Rico in March of 2022. Further bankruptcy litigation has ensued between the Oversight Board and a group of net revenue bond creditors over the security provisions of PREPA’s 8.3bln of net revenue bonds resulting in a ruling from Judge Swain that PREPA’s net revenue bonds are unsecured. The Ad Hoc group of net revenue bond creditors and bond insurer Assured Guaranty have informed Judge Swain they will seek to appeal her decision absent a consensual resolution in the case. The Oversight Board has reached plan confirmation support from at least one creditor class, the ~700mm of claims relating to fuel line lenders. In addition, the Oversight Board reached a settlement agreement with bond insurer National Public Finance Guaranty regarding ~876mm of PREPA’s net revenue bond claims or~11% of PREPA’s net revenue bond claims.
If a settlement agreement cannot be reached between a majority of net revenue bond holders and the Oversight Board, Judge Swain could approve a cram-down plan or dismiss the bankruptcy case entirely. A cram-down plan could significantly reduce recoveries. Furthermore, a dismissal of the case would result in further litigation in local PR courts with guaranty of additional recovery.
The Fund’s vulnerability to potential losses associated with such developments may be reduced through investing in municipal securities that feature credit enhancements (such as bond insurance). The bond insurance provider pays both principal and interest when due to the bond holder. The magnitude of Puerto Rico’s debt restructuring or other adverse economic developments could pose significant strains on the ability of municipal securities insurers to meet all future claims. As of April 30, 2023, 100.0% of the Puerto Rico municipal securities held by the Fund were insured.
(J) Indemnifications. Under the Trust’s organizational documents, its officers and trustees are indemnified against certain liabilities that may arise out of performance of their duties to the Trust. Additionally, in the normal course of business, the Fund enters into contracts with third-party service providers that contain a variety of representations and warranties and that may provide general indemnifications. The Fund's maximum exposure under these arrangements is unknown, as this would involve future claims that may be made against the Fund that have not yet occurred. The Manager believes that the risk of loss in connection with these potential indemnification obligations is remote. However, there can be no assurance that material liabilities related to such obligations will not arise in the future, which could adversely impact the Fund.
Note 3–Fees and Related Party Transactions
(A) Manager and Subadvisor. New York Life Investments, a registered investment adviser and an indirect, wholly-owned subsidiary of New York Life Insurance Company ("New York Life"), serves as the Fund's Manager, pursuant to an Amended and Restated Management Agreement ("Management Agreement"). The Manager provides offices, conducts clerical, recordkeeping and bookkeeping services and keeps most of the
| 38 | MainStay MacKay Short Term Municipal Fund |
financial and accounting records required to be maintained by the Fund. Except for the portion of salaries and expenses that are the responsibility of the Fund, the Manager pays the salaries and expenses of all personnel affiliated with the Fund and certain operational expenses of the Fund. The Fund reimburses New York Life Investments in an amount equal to the portion of the compensation of the Chief Compliance Officer attributable to the Fund. MacKay Shields LLC ("MacKay Shields" or the "Subadvisor"), a registered investment adviser and an indirect, wholly-owned subsidiary of New York Life, serves as the Subadvisor to the Fund and is responsible for the day-to-day portfolio management of the Fund. Pursuant to the terms of an Amended and Restated Subadvisory Agreement ("Subadvisory Agreement") between New York Life Investments and MacKay Shields, New York Life Investments pays for the services of the Subadvisor.
Pursuant to the Management Agreement, the Fund pays the Manager a monthly fee for the services performed and the facilities furnished at an annual rate of the Fund’s average daily net assets as follows: 0.35% on assets up to $ 1 billion; and 0.33% on assets from $1 billion up to $5 billion; and 0.32% on assets over $5 billion. During the year ended April 30, 2023, the effective management fee rate was 0.34% of the Fund’s average daily net assets, exclusive of any applicable waivers/reimbursements.
New York Life Investments has contractually agreed to waive fees and/or reimburse expenses so that Total Annual Fund Operating Expenses (excluding taxes, interest, litigation, extraordinary expenses, brokerage and other transaction expenses relating to the purchase or sale of portfolio investments and acquired (underlying) fund fees and expenses) do not exceed the following percentages of daily net assets: Class A, 0.70%, Class A2, 0.70% and Class I, 0.40%. New York Life Investments will apply an equivalent waiver or reimbursement, in an equal number of basis points of the Class A shares waiver/reimbursement, to Investor Class shares. In addition, New York Life Investments has also contractually agreed to waive fees and/or reimburse expenses so that Total Annual Fund Operating Expenses (excluding taxes, interest, litigation, extraordinary expenses, brokerage and other transaction expenses relating to the purchase or sale of portfolio investments, and acquired (underlying) fund fees and expenses) for Class R6 shares do not exceed those of Class I. This agreement will remain in effect until August 31, 2023, and shall renew automatically for one-year terms unless New York Life Investments provides written notice of termination prior to the start of the next term or upon approval of the Board.
During the year ended April 30, 2023, New York Life Investments earned fees from the Fund in the amount of $4,799,723 and waived fees and/or reimbursed expenses in the amount of $272,071 and paid the Subadvisor fees of $2,263,826.
JPMorgan Chase Bank, N.A. ("JPMorgan") provides sub-administration and sub-accounting services to the Fund pursuant to an agreement with New York Life Investments. These services include calculating the daily NAVs of the Fund, maintaining the general ledger and sub-ledger accounts for the calculation of the Fund's NAVs, and assisting New York
Life Investments in conducting various aspects of the Fund's administrative operations. For providing these services to the Fund, JPMorgan is compensated by New York Life Investments.
Pursuant to an agreement between the Trust and New York Life Investments, New York Life Investments is responsible for providing or procuring certain regulatory reporting services for the Fund. The Fund will reimburse New York Life Investments for the actual costs incurred by New York Life Investments in connection with providing or procuring these services for the Fund.
(B) Distribution and Service Fees. The Trust, on behalf of the Fund, has entered into a distribution agreement with NYLIFE Distributors LLC (the “Distributor”), an affiliate of New York Life Investments. The Fund has adopted distribution plans (the “Plans”) in accordance with the provisions of Rule 12b-1 under the 1940 Act.
Pursuant to the Class A, Class A2 and Investor Class Plans, the Distributor receives a monthly fee from Class A, Class A2 and Investor Class shares at an annual rate of 0.25% of the average daily net assets of the Class A, Class A2 and Investor Class shares for distribution and/or service activities as designated by the Distributor. Class I shares are not subject to a distribution and/or service fee.
The Plans provide that the distribution and service fees are payable to the Distributor regardless of the amounts actually expended by the Distributor for distribution of the Fund's shares and service activities.
(C) Sales Charges. The Fund was advised by the Distributor that the amount of initial sales charges retained on sales of Investor Class shares during the year ended April 30, 2023, was $204.
The Fund was also advised that the Distributor retained CDSCs on redemptions of Class A, Investor Class and Class A2 shares during the year ended April 30, 2023, of $127,152, $1,974 and $10,747.
(D) Transfer, Dividend Disbursing and Shareholder Servicing Agent. NYLIM Service Company LLC, an affiliate of New York Life Investments, is the Fund's transfer, dividend disbursing and shareholder servicing agent pursuant to an agreement between NYLIM Service Company LLC and the Trust. NYLIM Service Company LLC has entered into an agreement with SS&C Global Investor & Distribution Solutions, Inc. ("SS&C"), pursuant to which SS&C performs certain transfer agent services on behalf of NYLIM Service Company LLC. New York Life Investments has contractually agreed to limit the transfer agency expenses charged to the Fund’s share classes to a maximum of 0.35% of that share class’s average daily net assets on an annual basis after deducting any applicable Fund or class-level expense reimbursement or small account fees. This agreement will remain in effect until August 31, 2023, and shall renew automatically for one-year terms unless New York Life Investments provides written notice of termination prior to the start of the next term or upon approval of the Board. During the year ended April 30, 2023, transfer agent expenses incurred by the Fund and any
Notes to Financial Statements (continued)
reimbursements, pursuant to the aforementioned Transfer Agency expense limitation agreement, were as follows:
| Class | Expense | Waived |
| Class A | $116,321 | $ — |
| Class A2 | 23,463 | — |
| Investor Class | 17,806 | (8,165) |
| Class I | 262,579 | — |
| Class R6 | 3,631 | — |
(E) Small Account Fee. Shareholders with small accounts adversely impact the cost of providing transfer agency services. In an effort to reduce total transfer agency expenses, the Fund has implemented a small account fee on certain types of accounts. As described in the Fund's prospectus, certain shareholders with an account balance of less than $1,000 ($5,000 for Class A share accounts) are charged an annual per account fee of $20 (assessed semi-annually), the proceeds from which offset transfer agent fees as reflected in the Statement of Operations. This small account fee will not apply to certain types of accounts as described further in the Fund’s prospectus.
(F) Capital. As of April 30, 2023, New York Life and its affiliates beneficially held shares of the Fund with the values and percentages of net assets as follows:
| Class A | $16,023,627 | 5.2% |
| Class A2 | 24,500 | 0.0‡ |
| Class R6 | 25,334 | 0.0‡ |
| ‡ | Less than one-tenth of a percent. |
Note 4-Federal Income Tax
As of April 30, 2023, the cost and unrealized appreciation (depreciation) of the Fund’s investment portfolio, including applicable derivative contracts and other financial instruments, as determined on a federal income tax basis, were as follows:
| | Federal Tax
Cost | Gross
Unrealized
Appreciation | Gross
Unrealized
(Depreciation) | Net
Unrealized
Appreciation/
(Depreciation) |
| Investments in Securities | $1,110,742,136 | $6,626,922 | $(8,437,291) | $(1,810,369) |
As of April 30, 2023, the components of accumulated gain (loss) on a tax basis were as follows:
Ordinary
Income | Undistributed
Tax Exempt
Income | Accumulated
Capital
and Other
Gain (Loss) | Other
Temporary
Differences | Unrealized
Appreciation
(Depreciation) | Total
Accumulated
Gain (Loss) |
| $— | $1,076,158 | $(75,348,407) | $(1,097,136) | $(1,810,369) | $(77,179,754) |
The difference between book-basis and tax-basis unrealized appreciation (depreciation) is primarily due to premium amortization adjustments. The other temporary differences are primarily due to dividends payable.
As of April 30, 2023, for federal income tax purposes, capital loss carryforwards of $75,348,407, as shown in the table below, were available to the extent provided by the regulations to offset future realized gains of the Fund. Accordingly, no capital gains distributions are expected to be paid to shareholders until net gains have been realized in excess of such amounts.
Capital Loss
Available Through | Short-Term
Capital Loss
Amounts (000’s) | Long-Term
Capital Loss
Amounts (000’s) |
| Unlimited | $29,217 | $46,131 |
During the years ended April 30, 2023 and April 30, 2022, the tax character of distributions paid as reflected in the Statements of Changes in Net Assets was as follows:
| | 2023 | 2022 |
| Distributions paid from: | | |
| Ordinary Income | $ 2,442,564 | $ 1,474,609 |
| Exempt Interest Dividends | 24,553,878 | 12,687,790 |
| Total | $26,996,442 | $14,162,399 |
Note 5–Custodian
JPMorgan is the custodian of cash and securities held by the Fund. Custodial fees are charged to the Fund based on the Fund's net assets and/or the market value of securities held by the Fund and the number of certain transactions incurred by the Fund.
Note 6–Line of Credit
The Fund and certain other funds managed by New York Life Investments maintain a line of credit with a syndicate of banks in order to secure a source of funds for temporary purposes to meet unanticipated or excessive redemption requests.
Effective July 26, 2022, under the credit agreement (the “Credit Agreement”), the aggregate commitment amount is $600,000,000 with an additional uncommitted amount of $100,000,000. The commitment fee is an annual rate of 0.15% of the average commitment amount payable quarterly, regardless of usage, to JPMorgan, who serves as the agent to the syndicate. The commitment fee is allocated among the Fund and certain other funds managed by New York Life Investments based upon their respective net assets and other factors. Interest on any revolving credit loan is charged based upon the Federal Funds Rate, Daily Simple Secured Overnight Financing Rate ("SOFR") + 0.10%, or the Overnight Bank Funding Rate, whichever is higher. The Credit Agreement expires on July 25, 2023, although the Fund, certain other funds managed by New York Life Investments and the syndicate of banks may renew the Credit Agreement for an additional year on the same or different terms or enter into a credit agreement with a different syndicate of banks. Prior to July 26, 2022, the aggregate commitment amount and
| 40 | MainStay MacKay Short Term Municipal Fund |
the commitment fee were the same as those under the current Credit Agreement. During the year ended April 30, 2023, there were no borrowings made or outstanding with respect to the Fund under the Credit Agreement.
Note 7–Interfund Lending Program
Pursuant to an exemptive order issued by the SEC, the Fund, along with certain other funds managed by New York Life Investments, may participate in an interfund lending program. The interfund lending program provides an alternative credit facility that permits the Fund and certain other funds managed by New York Life Investments to lend or borrow money for temporary purposes directly to or from one another, subject to the conditions of the exemptive order. During the year ended April 30, 2023, there were no interfund loans made or outstanding with respect to the Fund.
Note 8–Purchases and Sales of Securities (in 000’s)
During the year ended April 30, 2023, purchases and sales of securities, other than short-term securities, were $1,282,732 and $1,763,171, respectively.
Note 9–Capital Share Transactions
Transactions in capital shares for the years ended April 30, 2023 and April 30, 2022, were as follows:
| Class A | Shares | Amount |
| Year ended April 30, 2023: | | |
| Shares sold | 14,755,906 | $ 136,977,313 |
| Shares issued to shareholders in reinvestment of distributions | 417,462 | 3,867,588 |
| Shares redeemed | (26,092,382) | (241,951,367) |
| Net increase (decrease) in shares outstanding before conversion | (10,919,014) | (101,106,466) |
| Shares converted into Class A (See Note 1) | 112,523 | 1,047,020 |
| Shares converted from Class A (See Note 1) | (66,834) | (614,825) |
| Net increase (decrease) | (10,873,325) | $ (100,674,271) |
| Year ended April 30, 2022: | | |
| Shares sold | 25,468,868 | $ 246,761,379 |
| Shares issued to shareholders in reinvestment of distributions | 157,184 | 1,513,215 |
| Shares redeemed | (33,406,373) | (322,275,514) |
| Net increase (decrease) in shares outstanding before conversion | (7,780,321) | (74,000,920) |
| Shares converted into Class A (See Note 1) | 41,919 | 402,782 |
| Shares converted from Class A (See Note 1) | (261) | (2,536) |
| Net increase (decrease) | (7,738,663) | $ (73,600,674) |
| |
| Class A2 | Shares | Amount |
| Year ended April 30, 2023: | | |
| Shares sold | 1,728,867 | $ 16,042,719 |
| Shares issued to shareholders in reinvestment of distributions | 138,904 | 1,288,714 |
| Shares redeemed | (6,577,094) | (60,995,488) |
| Net increase (decrease) in shares outstanding before conversion | (4,709,323) | (43,664,055) |
| Shares converted from Class A2 (See Note 1) | (41,230) | (384,679) |
| Net increase (decrease) | (4,750,553) | $ (44,048,734) |
| Year ended April 30, 2022: | | |
| Shares sold | 8,256,657 | $ 80,252,982 |
| Shares issued to shareholders in reinvestment of distributions | 62,731 | 604,025 |
| Shares redeemed | (6,763,650) | (64,920,522) |
| Net increase (decrease) | 1,555,738 | $ 15,936,485 |
| |
| Investor Class | Shares | Amount |
| Year ended April 30, 2023: | | |
| Shares sold | 97,897 | $ 913,758 |
| Shares issued to shareholders in reinvestment of distributions | 4,211 | 39,108 |
| Shares redeemed | (104,885) | (974,735) |
| Net increase (decrease) in shares outstanding before conversion | (2,777) | (21,869) |
| Shares converted into Investor Class (See Note 1) | 114 | 1,056 |
| Shares converted from Investor Class (See Note 1) | (35,836) | (333,994) |
| Net increase (decrease) | (38,499) | $ (354,807) |
| Year ended April 30, 2022: | | |
| Shares sold | 125,760 | $ 1,214,335 |
| Shares issued to shareholders in reinvestment of distributions | 750 | 7,255 |
| Shares redeemed | (145,542) | (1,409,867) |
| Net increase (decrease) in shares outstanding before conversion | (19,032) | (188,277) |
| Shares converted into Investor Class (See Note 1) | 261 | 2,536 |
| Shares converted from Investor Class (See Note 1) | (41,789) | (402,782) |
| Net increase (decrease) | (60,560) | $ (588,523) |
| |
Notes to Financial Statements (continued)
| Class I | Shares | Amount |
| Year ended April 30, 2023: | | |
| Shares sold | 70,614,891 | $ 654,927,375 |
| Shares issued to shareholders in reinvestment of distributions | 1,213,482 | 11,244,993 |
| Shares redeemed | (109,796,158) | (1,017,816,790) |
| Net increase (decrease) in shares outstanding before conversion | (37,967,785) | (351,644,422) |
| Shares converted into Class I (See Note 1) | 66,720 | 613,769 |
| Shares converted from Class I (See Note 1) | (11,419,110) | (105,855,146) |
| Net increase (decrease) | (49,320,175) | $ (456,885,799) |
| Year ended April 30, 2022: | | |
| Shares sold | 117,202,202 | $ 1,132,883,199 |
| Shares issued to shareholders in reinvestment of distributions | 730,370 | 7,033,453 |
| Shares redeemed | (140,847,545) | (1,355,438,314) |
| Net increase (decrease) | (22,914,973) | $ (215,521,662) |
| |
| Class R6(a) | Shares | Amount |
| Period ended April 30, 2023: | | |
| Shares sold | 7,275,651 | $ 67,368,331 |
| Shares issued to shareholders in reinvestment of distributions | 9,739 | 90,162 |
| Shares redeemed | (9,471,562) | (87,314,013) |
| Net increase (decrease) in shares outstanding before conversion | (2,186,172) | (19,855,520) |
| Shares converted into Class R6 (See Note 1) | 11,431,231 | 105,853,196 |
| Shares converted from Class R6 (See Note 1) | (35,110) | (326,397) |
| Net increase (decrease) | 9,209,949 | $ 85,671,279 |
| (a) | The inception of the class was May 2, 2022. |
Note 10–Other Matters
As of the date of this report, interest rates in the United States and many parts of the world, including certain European countries, continue to ascend from historically low levels. Thus, the Fund currently faces a heightened level of risk associated with rising interest rates. This could be driven by a variety of factors, including but not limited to central bank monetary policies, changing inflation or real growth rates, general economic conditions, increasing bond issuances or reduced market demand for low yielding investments.
Social, political, economic and other conditions and events, such as war, natural disasters, health emergencies (e.g., epidemics and pandemics), terrorism, conflicts, social unrest, recessions, inflation, rapid interest rate changes and supply chain disruptions, may occur and could significantly impact the Fund, issuers, industries, governments and other systems, including the financial markets. Developments that disrupt global economies and financial markets, such as COVID-19, the conflict in
Ukraine, and the failures of certain U.S. and non-U.S. banks, may magnify factors that affect the Fund's performance.
Note 11–Subsequent Events
In connection with the preparation of the financial statements of the Fund as of and for the year ended April 30, 2023, events and transactions subsequent to April 30, 2023, through the date the financial statements were issued have been evaluated by the Manager for possible adjustment and/or disclosure. No subsequent events requiring financial statement adjustment or disclosure have been identified, other than the following:
At meetings held on December 6-7, 2022, the Board of Trustees of MainStay Funds Trust approved the change of the Fund's fiscal year end from April 30th to October 31st effective May 1, 2023.
| 42 | MainStay MacKay Short Term Municipal Fund |
Report of Independent Registered Public Accounting Firm
To the Shareholders of the Fund and Board of Trustees
MainStay Funds Trust:
Opinion on the Financial Statements
We have audited the accompanying statement of assets and liabilities of MainStay MacKay Short Term Municipal Fund (the Fund), one of the funds constituting MainStay Funds Trust, including the portfolio of investments, as of April 30, 2023, the related statement of operations for the year then ended, the statements of changes in net assets for each of the years in the two-year period then ended, and the related notes (collectively, the financial statements) and the financial highlights for each of the years or periods in the five-year period then ended. In our opinion, the financial statements and financial highlights present fairly, in all material respects, the financial position of the Fund as of April 30, 2023, the results of its operations for the year then ended, the changes in its net assets for each of the years in the two-year period then ended, and the financial highlights for each of the years or periods in the five-year period then ended, in conformity with U.S. generally accepted accounting principles.
Basis for Opinion
These financial statements and financial highlights are the responsibility of the Fund's management. Our responsibility is to express an opinion on these financial statements and financial highlights based on our audits. We are a public accounting firm registered with the Public Company Accounting Oversight Board (United States) (PCAOB) and are required to be independent with respect to the Fund in accordance with the U.S. federal securities laws and the applicable rules and regulations of the Securities and Exchange Commission and the PCAOB.
We conducted our audits in accordance with the standards of the PCAOB. Those standards require that we plan and perform the audit to obtain reasonable assurance about whether the financial statements and financial highlights are free of material misstatement, whether due to error or fraud. Our audits included performing procedures to assess the risks of material misstatement of the financial statements and financial highlights, whether due to error or fraud, and performing procedures that respond to those risks. Such procedures included examining, on a test basis, evidence regarding the amounts and disclosures in the financial statements and financial highlights. Such procedures also included confirmation of securities owned as of April 30, 2023, by correspondence with the custodian and brokers; when replies were not received from brokers, we performed other auditing procedures. Our audits also included evaluating the accounting principles used and significant estimates made by management, as well as evaluating the overall presentation of the financial statements and financial highlights. We believe that our audits provide a reasonable basis for our opinion.

We have served as the auditor of one or more New York Life Investment Management investment companies since 2003.
Philadelphia, Pennsylvania
June 23, 2023
Board Consideration and Approval of Management Agreement and Subadvisory Agreement (Unaudited)
Board Consideration and Approval of Management Agreement and Subadvisory Agreement
The continuation of the Management Agreement with respect to the MainStay MacKay Short Term Municipal Fund (“Fund”) and New York Life Investment Management LLC (“New York Life Investments”) and the Subadvisory Agreement between New York Life Investments and MacKay Shields LLC (“MacKay”) with respect to the Fund (together, “Advisory Agreements”) is subject to annual review and approval by the Board of Trustees of MainStay Funds Trust (“Board” of the “Trust”) in accordance with Section 15 of the Investment Company Act of 1940, as amended (“1940 Act”). At its December 6–7, 2022 meeting, the Board, which is comprised solely of Trustees who are not an “interested person” (as such term is defined in the 1940 Act) of the Trust (“Independent Trustees”), unanimously approved the continuation of each of the Advisory Agreements for a one-year period.
In reaching the decision to approve the continuation of each of the Advisory Agreements, the Board considered information and materials furnished by New York Life Investments and MacKay in connection with an annual contract review process undertaken by the Board that took place at meetings of the Board and its Contracts Committee during October 2022 through December 2022, including information and materials furnished by New York Life Investments and MacKay in response to requests prepared on behalf of the Board, and in consultation with the Board, by independent legal counsel to the Independent Trustees, which encompassed a variety of topics, including those summarized below. Information and materials requested by and furnished to the Board for consideration in connection with the contract review process included, among other items, reports on the Fund and “peer funds” prepared by Institutional Shareholder Services Inc. (“ISS”), an independent third-party service provider engaged by the Board to report objectively on the Fund’s investment performance, management fee and total expenses. The Board also considered information on the fees charged to other investment advisory clients of New York Life Investments and/or MacKay that follow investment strategies similar to those of the Fund, if any, and, when applicable, the rationale for any differences in the Fund’s management and subadvisory fees and the fees charged to those other investment advisory clients. In addition, the Board considered information regarding the legal standards and fiduciary obligations applicable to its consideration of the continuation of each of the Advisory Agreements. The contract review process, including the structure and format for information and materials provided to the Board, has been developed in consultation with the Board. The Independent Trustees also met in executive sessions with their independent legal counsel and, for portions thereof, with senior management of New York Life Investments.
The Board’s deliberations with respect to the continuation of each of the Advisory Agreements reflect a year-long process, and the Board also took into account information furnished to the Board and its Committees throughout the year, as deemed relevant and appropriate by the Trustees, including, among other items, reports on investment performance of the Fund and investment-related matters for the Fund as well as
presentations from New York Life Investments and, generally annually, MacKay personnel. In addition, the Board took into account other information provided by New York Life Investments throughout the year, including, among other items, periodic reports on legal and compliance matters, risk management, portfolio turnover, brokerage commissions and non-advisory services provided to the Fund by New York Life Investments, as deemed relevant and appropriate by the Trustees.
In addition to information provided to the Board throughout the year, the Board received information in connection with its June 2022 meeting provided specifically in response to requests prepared on behalf of the Board, and in consultation with the Board, by independent legal counsel to the Independent Trustees regarding the Fund’s distribution arrangements. In addition, the Board received information regarding the Fund’s asset levels, share purchase and redemption activity and the payment of Rule 12b-1 and/or certain other fees by the applicable share classes of the Fund, among other information.
In considering the continuation of each of the Advisory Agreements, the Trustees reviewed and evaluated the information and factors they believed to reasonably be necessary and appropriate in light of legal advice furnished to them by independent legal counsel to the Independent Trustees and through the exercise of their own business judgment. Although individual Trustees may have weighed certain factors or information differently and the Board did not consider any single factor or information controlling in reaching its decision, the factors that figured prominently in the Board’s consideration of the continuation of each of the Advisory Agreements are summarized in more detail below and include, among other factors: (i) the nature, extent and quality of the services provided to the Fund by New York Life Investments and MacKay; (ii) the qualifications of the portfolio managers of the Fund and the historical investment performance of the Fund, New York Life Investments and MacKay; (iii) the costs of the services provided, and profits realized, by New York Life Investments and MacKay with respect to their relationships with the Fund; (iv) the extent to which economies of scale have been realized or may be realized if the Fund grows and the extent to which any economies of scale have been shared, have benefited or may benefit the Fund’s shareholders; and (v) the reasonableness of the Fund’s management and subadvisory fees and total ordinary operating expenses. Although the Board recognized that comparisons between the Fund’s fees and expenses and those of other funds are imprecise given different terms of agreements, variations in fund strategies and other factors, the Board considered the reasonableness of the Fund’s management fee and total ordinary operating expenses as compared to the peer funds identified by ISS. Throughout their considerations, the Trustees acknowledged the commitment of New York Life Investments and its affiliates to serve the MainStay Group of Funds, as well as their capacity, experience, resources, financial stability and reputations. The Trustees also acknowledged the entrepreneurial and other risks assumed by New York Life Investments in sponsoring and managing the Fund. With respect to the Subadvisory Agreement, the Board took into account New York Life Investments’ recommendation to approve the continuation of the Subadvisory Agreement.
| 44 | MainStay MacKay Short Term Municipal Fund |
The Trustees noted that, throughout the year, the Trustees are afforded an opportunity to ask questions of, and request additional information or materials from, New York Life Investments and MacKay. The Board’s decision with respect to each of the Advisory Agreements may have also been based, in part, on the Board’s knowledge of New York Life Investments and MacKay resulting from, among other things, the Board’s consideration of each of the Advisory Agreements in prior years, the advisory agreements for other funds in the MainStay Group of Funds, the Board’s review throughout the year of the performance and operations of other funds in the MainStay Group of Funds and each Trustee’s business judgment and industry experience. In addition to considering the above-referenced factors, the Board observed that in the marketplace there are a range of investment options available to investors and that the Fund’s shareholders, having had the opportunity to consider other investment options, have chosen to invest in the Fund.
The factors that figured prominently in the Board’s decision to approve the continuation of each of the Advisory Agreements during its December 6–7, 2022 meeting are summarized in more detail below.
Nature, Extent and Quality of Services Provided by New York Life Investments and MacKay
The Board examined the nature, extent and quality of the services that New York Life Investments provides to the Fund. The Board evaluated New York Life Investments’ experience and capabilities in serving as manager of the Fund and considered that the Fund operates in a “manager-of-managers” structure. The Board also considered New York Life Investments’ responsibilities and services provided pursuant to this structure, including overseeing the services provided by MacKay, evaluating the performance of MacKay, making recommendations to the Board as to whether the Subadvisory Agreement should be renewed, modified or terminated and periodically reporting to the Board regarding the results of New York Life Investments’ evaluation and monitoring functions. The Board noted that New York Life Investments manages other mutual funds, serves a variety of other investment advisory clients, including other pooled investment vehicles, and has experience overseeing mutual fund service providers, including subadvisors. The Board considered the experience of senior personnel at New York Life Investments providing management and administrative and other non-advisory services to the Fund. The Board observed that New York Life Investments devotes significant resources and time to providing management and administrative and other non-advisory services to the Fund, including New York Life Investments’ oversight and due diligence reviews of MacKay and ongoing analysis of, and interactions with, MacKay with respect to, among other things, the Fund’s investment performance and risks as well as MacKay’s investment capabilities and subadvisory services with respect to the Fund.
The Board also considered the range of services that New York Life Investments provides to the Fund under the terms of the Management Agreement, including: (i) fund accounting and ongoing supervisory services provided by New York Life Investments’ Fund Administration and Accounting Group; (ii) investment supervisory and analytical services
provided by New York Life Investments’ Investment Consulting Group; (iii) compliance services provided by the Trust’s Chief Compliance Officer as well as New York Life Investments’ compliance department, including supervision and implementation of the Fund’s compliance program; (iv) legal services provided by New York Life Investments’ Office of the General Counsel; and (v) risk management monitoring and analysis by compliance and investment personnel. In addition, the Board considered New York Life Investments’ willingness to invest in personnel and other resources, such as cyber security, information security and business continuity planning, designed to benefit the Fund and noted that New York Life Investments is responsible for compensating the Trust’s officers, except for a portion of the salary of the Trust’s Chief Compliance Officer. The Board recognized that New York Life Investments provides certain other non-advisory services to the Fund and has provided an increasingly broad array of non-advisory services to the MainStay Group of Funds as a result of regulatory and other developments, including in connection with the implementation of the MainStay Group of Funds’ derivatives risk management program and policies and procedures adopted pursuant to Rule 18f-4 under the 1940 Act. The Board considered benefits to the Fund’s shareholders from the Fund being part of the MainStay Group of Funds, including the ability to exchange investments between the same class of shares of funds in the MainStay Group of Funds, including without the imposition of a sales charge (if any).
The Board also examined the range, and the nature, extent and quality, of the investment advisory services that MacKay provides to the Fund and considered the terms of each of the Advisory Agreements. The Board evaluated MacKay’s experience and performance in serving as subadvisor to the Fund and advising other portfolios and MacKay’s track record and experience in providing investment advisory services as well as the experience of investment advisory, senior management and administrative personnel at MacKay. The Board considered New York Life Investments’ and MacKay’s overall resources, legal and compliance environment, capabilities, reputation, financial condition and history. In addition to information provided in connection with quarterly meetings with the Trust’s Chief Compliance Officer, the Board considered information regarding the compliance policies and procedures of New York Life Investments and MacKay and acknowledged their commitment to further developing and strengthening compliance programs relating to the Fund. The Board also considered MacKay’s ability to recruit and retain qualified investment professionals and willingness to invest in personnel and other resources to service and support the Fund. In this regard, the Board considered the qualifications and experience of the Fund’s portfolio managers, the number of accounts managed by the portfolio managers and the method for compensating the portfolio managers.
In addition, the Board considered information provided by New York Life Investments and MacKay regarding the operations of their respective business continuity plans in response to the COVID-19 pandemic and the continued remote work environment.
Based on these considerations, among others, the Board concluded that the Fund would likely continue to benefit from the nature, extent and quality of these services.
Board Consideration and Approval of Management Agreement and Subadvisory Agreement (Unaudited) (continued)
Investment Performance
In evaluating the Fund’s investment performance, the Board considered investment performance results over various periods in light of the Fund’s investment objective, strategies and risks. The Board considered investment reports on, and analysis of, the Fund’s performance provided to the Board throughout the year. These reports include, among other items, information on the Fund’s gross and net returns, the Fund’s investment performance compared to a relevant investment category and the Fund’s benchmark, the Fund’s risk-adjusted investment performance and the Fund’s investment performance as compared to peer funds, as appropriate, as well as portfolio attribution information and commentary on the effect of market conditions. The Board also considered information provided by ISS showing the investment performance of the Fund as compared to peer funds. In addition, the Board reviewed the methodology used by ISS to construct the group of peer funds for comparative purposes.
The Board also took into account its discussions with senior management at New York Life Investments concerning the Fund’s investment performance over various periods as well as discussions between the Fund’s portfolio management team and the members of the Board’s Investment Committee, which generally occur on an annual basis. In addition, the Board considered any specific actions that New York Life Investments or MacKay had taken, or had agreed to take, to seek to enhance Fund investment performance and the results of those actions.
Based on these considerations, among others, the Board concluded that its review of the Fund’s investment performance and related information supported a determination to approve the continuation of each of the Advisory Agreements.
Costs of the Services Provided, and Profits and Other Benefits Realized, by New York Life Investments and MacKay
The Board considered the costs of the services provided under each of the Advisory Agreements. The Board also considered the profits realized by New York Life Investments and its affiliates, including MacKay, due to their relationships with the Fund as well as the MainStay Group of Funds. Because MacKay is an affiliate of New York Life Investments whose subadvisory fee is paid by New York Life Investments, not the Fund, the Board considered cost and profitability information for New York Life Investments and MacKay in the aggregate.
In addition, the Board acknowledged the difficulty in obtaining reliable comparative data about mutual fund managers’ profitability because such information generally is not publicly available and may be impacted by numerous factors, including the structure of a fund manager’s organization, the types of funds it manages, the methodology used to allocate certain fixed costs to specific funds and the manager’s capital structure and costs of capital.
In evaluating the costs of the services provided by New York Life Investments and MacKay and profits realized by New York Life Investments and its affiliates, including MacKay, the Board considered,
among other factors, New York Life Investments’ and its affiliates’, including MacKay’s, continuing investments in, or willingness to invest in, personnel and other resources to support and further enhance the management of the Fund, and that New York Life Investments is responsible for paying the subadvisory fee for the Fund. The Board also considered the financial resources of New York Life Investments and MacKay and acknowledged that New York Life Investments and MacKay must be in a position to recruit and retain experienced professional personnel and to maintain a strong financial position for New York Life Investments and MacKay to continue to provide high-quality services to the Fund. The Board recognized that the Fund benefits from the allocation of certain fixed costs among the funds in the MainStay Group of Funds, among other expected benefits resulting from its relationship with New York Life Investments.
The Board considered information regarding New York Life Investments’ methodology for calculating profitability and allocating costs provided by New York Life Investments in connection with the fund profitability analysis presented to the Board. The Board noted it had previously engaged an independent consultant to review the methods used to allocate costs among the funds in the MainStay Group of Funds. The Board also noted that the independent consultant had concluded that New York Life Investments’ methods for allocating costs and procedures for estimating overall profitability of the relationship with the funds in the MainStay Group of Funds are reasonable and that New York Life Investments continued to use the same method of calculating profit and allocating costs since the independent consultant’s review. The Board recognized the difficulty in calculating and evaluating a manager’s profitability with respect to the Fund and considered that other profitability methodologies may also be reasonable.
The Board also considered certain fall-out benefits that may be realized by New York Life Investments and its affiliates, including MacKay, due to their relationships with the Fund, including reputational and other indirect benefits. The Board recognized, for example, the benefits to MacKay from legally permitted “soft-dollar” arrangements by which brokers provide research and other services to MacKay in exchange for commissions paid by the Fund with respect to trades in the Fund’s portfolio securities. In addition, the Board considered its review of the management agreement for a money market fund advised by New York Life Investments and an affiliated subadvisor that serves as an investment option for the Fund, including the potential rationale for and costs associated with investments in this money market fund by the Fund, if any, and considered information from New York Life Investments that the nature and type of specific investment advisory services provided to this money market fund are distinct from, or in addition to, the investment advisory services provided to the Fund.
The Board observed that, in addition to fees earned by New York Life Investments under the Management Agreement for managing the Fund, New York Life Investments’ affiliates also earn revenues from serving the Fund in various other capacities, including as the Fund’s transfer agent and distributor. The Board considered information about these other revenues and their impact on the profitability of the relationship with the
| 46 | MainStay MacKay Short Term Municipal Fund |
Fund to New York Life Investments and its affiliates. The Board noted that, although it assessed the overall profitability of the relationship with the Fund to New York Life Investments and its affiliates as part of the contract review process, when considering the reasonableness of the fee paid to New York Life Investments under the Management Agreement, the Board considered the profitability of New York Life Investments’ relationship with the Fund on a pre-tax basis and without regard to distribution expenses incurred by New York Life Investments from its own resources.
After evaluating the information deemed relevant by the Trustees, the Board concluded that any profits realized by New York Life Investments and its affiliates, including MacKay, due to their relationships with the Fund were not excessive and other expected benefits that may accrue to New York Life Investments and its affiliates, including MacKay, are reasonable.
Management and Subadvisory Fees and Total Ordinary Operating Expenses
The Board evaluated the reasonableness of the fee paid under each of the Advisory Agreements and the Fund’s total ordinary operating expenses. The Board primarily considered the reasonableness of the management fee paid by the Fund to New York Life Investments because the subadvisory fee paid to MacKay is paid by New York Life Investments, not the Fund. The Board also considered the reasonableness of the subadvisory fee paid by New York Life Investments and the amount of the management fee retained by New York Life Investments.
In assessing the reasonableness of the Fund’s fees and expenses, the Board primarily considered comparative data provided by ISS on the fees and expenses charged by similar mutual funds managed by other investment advisers. The Board reviewed the methodology used by ISS to construct the group of peer funds for comparative purposes. In addition, the Board considered information provided by New York Life Investments and MacKay on fees charged to other investment advisory clients, including institutional separate accounts and/or other funds that follow investment strategies similar to those of the Fund, if any. The Board considered the contractual management fee schedules of the Fund as compared to those of such other investment advisory clients, taking into account the rationale for any differences in fee schedules. The Board also took into account information provided by New York Life Investments about the more extensive scope of services provided to registered investment companies, such as the Fund, as compared with other investment advisory clients. Additionally, the Board considered the impact of contractual breakpoints, voluntary waivers and expense limitation arrangements on the Fund’s net management fee and expenses. The Board also considered that in proposing fees for the Fund, New York Life Investments considers the competitive marketplace for mutual funds.
The Board took into account information from New York Life Investments, as provided in connection with the Board’s June 2022 meeting, regarding the reasonableness of the Fund’s transfer agent fee schedule, including
industry data demonstrating that the fees that NYLIM Service Company LLC, an affiliate of New York Life Investments and the Fund’s transfer agent, charges the Fund are within the range of fees charged by transfer agents to other mutual funds. In addition, the Board considered NYLIM Service Company LLC’s profitability in connection with the transfer agent services it provides to the Fund. The Board also took into account information provided by NYLIM Service Company LLC regarding the sub-transfer agency payments it made to intermediaries in connection with the provision of sub-transfer agency services to the Fund.
The Board considered the extent to which transfer agent fees contributed to the total expenses of the Fund. The Board acknowledged the role that the MainStay Group of Funds historically has played in serving the investment needs of New York Life Insurance Company customers, who often maintain smaller account balances than other shareholders of funds, and the impact of small accounts on the expense ratios of Fund share classes. The Board also recognized measures that it and New York Life Investments have taken intended to mitigate the effect of small accounts on the expense ratios of Fund share classes, including through the imposition of an expense limitation on net transfer agency expenses. The Board also considered that NYLIM Service Company LLC had waived its contractual cost of living adjustments during the seven years prior to 2021.
Based on the factors outlined above, among other considerations, the Board concluded that the Fund’s management fee and total ordinary operating expenses are within a range that is competitive and support a conclusion that these fees and expenses are reasonable.
Economies of Scale
The Board considered information regarding economies of scale, including whether economies of scale may exist for the Fund and whether the Fund’s expense structure permits any economies of scale to be appropriately shared with the Fund’s shareholders. The Board also considered a report from New York Life Investments, previously prepared at the request of the Board, that addressed economies of scale, including with respect to the mutual fund business generally, and the various ways in which the benefits of economies of scale may be shared with the funds in the MainStay Group of Funds. Although the Board recognized the difficulty of determining economies of scale with precision, the Board acknowledged that economies of scale may be shared with the Fund in a number of ways, including, for example, through the imposition of fee breakpoints, initially setting management fee rates at scale or making additional investments to enhance the services provided to the Fund. The Board reviewed information from New York Life Investments showing how the Fund’s management fee schedule compared to fee schedules of other funds and accounts managed by New York Life Investments. The Board also reviewed information from ISS showing how the Fund’s management fee schedule compared with fees paid for similar services by peer funds at varying asset levels.
Board Consideration and Approval of Management Agreement and Subadvisory Agreement (Unaudited) (continued)
Based on this information, the Board concluded that economies of scale are appropriately shared for the benefit of the Fund’s shareholders through the Fund’s expense structure and other methods to share benefits from economies of scale.
Conclusion
On the basis of the information and factors summarized above, among other information and factors deemed relevant by the Trustees, and the evaluation thereof, the Board unanimously voted to approve the continuation of each of the Advisory Agreements.
| 48 | MainStay MacKay Short Term Municipal Fund |
Discussion of the Operation and Effectiveness of the Fund's Liquidity Risk Management Program (Unaudited)
In compliance with Rule 22e-4 under the Investment Company Act of 1940, as amended (the “Liquidity Rule”), the Fund has adopted and implemented a liquidity risk management program (the “Program”), which New York Life Investment Management LLC believes is reasonably designed to assess and manage the Fund's liquidity risk. A Fund's liquidity risk is the risk that the Fund could not meet requests to redeem shares issued by the Fund without significant dilution of the remaining investors’ interests in the Fund. The Board of Trustees of MainStay Funds Trust (the "Board") previously approved the designation of New York Life Investment Management LLC as administrator of the Program (the “Administrator”). The Administrator has established a Liquidity Risk Management Committee to assist the Administrator in the implementation and day-to-day administration of the Program and to otherwise support the Administrator in fulfilling its responsibilities under the Program.
At a meeting of the Board held on February 28, 2023, the Administrator provided the Board with a written report addressing the Program’s operation and assessing the adequacy and effectiveness of its implementation for the period from January 1, 2022, through December 31, 2022 (the "Review Period"), as required under the Liquidity Rule. The report noted that the Administrator concluded that (i) the Program operated effectively to assess and manage the Fund's liquidity risk, (ii) the Program has been and continues to be adequately and effectively implemented to monitor and, as applicable, respond to the Fund's liquidity developments and (iii) the Fund's investment strategy continues to be appropriate for an open-end fund. In addition, the report summarized the operation of the Program and the information and factors considered by the Administrator in its assessment of the Program’s implementation, such as the liquidity risk assessment framework and the liquidity classification methodologies, and discussed notable geopolitical, market and other economic events that impacted liquidity risk during the Review Period.
In accordance with the Program, the Fund's liquidity risk is assessed no less frequently than annually taking into consideration certain factors, as applicable, such as (i) investment strategy and liquidity of portfolio investments, (ii) short-term and long-term cash flow projections, and (iii) holdings of cash and cash equivalents, as well as borrowing arrangements and other funding sources. Certain factors are considered under both normal and reasonably foreseeable stressed conditions.
Each Fund portfolio investment is classified into one of four liquidity categories. The classification is based on a determination of the number of days it is reasonably expected to take to convert the investment into cash, or sell or dispose of the investment, in current market conditions without significantly changing the market value of the investment. The Administrator has delegated liquidity classification determinations to the Fund’s subadvisor, subject to appropriate oversight by the Administrator, and liquidity classification determinations are made by taking into account the Fund's reasonably anticipated trade size, various market, trading and investment-specific considerations, as well as market depth, and, in certain cases, third-party vendor data.
The Liquidity Rule requires funds that do not primarily hold assets that are highly liquid investments to adopt a minimum amount of net assets that must be invested in highly liquid investments that are assets (an “HLIM”). In addition, the Liquidity Rule limits a fund's investments in illiquid investments. Specifically, the Liquidity Rule prohibits acquisition of illiquid investments if, immediately after acquisition, doing so would result in a fund holding more than 15% of its net assets in illiquid investments that are assets. The Program includes provisions reasonably designed to determine, periodically review and comply with the HLIM requirement, as applicable, and to comply with the 15% limit on illiquid investments.
There can be no assurance that the Program will achieve its objectives under all circumstances in the future. Please refer to the Fund's prospectus for more information regarding the Fund's exposure to liquidity risk and other risks to which it may be subject.
Federal Income Tax
Information (Unaudited)
The Fund is required under the Internal Revenue Code to advise shareholders in a written statement as to the federal tax status of dividends paid by the Fund during such fiscal years.
For Federal individual income tax purposes, the Fund designated 91.0% of the ordinary income dividends paid during its fiscal year ended April 30, 2023 as attributable to interest income from Tax Exempt Municipal Bonds. Such dividends are currently exempt from Federal income taxes under Section 103(a) of the Internal Revenue Code.
In February 2024, shareholders will receive an IRS Form 1099-DIV or substitute Form 1099, which will show the federal tax status of the distributions received by shareholders in calendar year 2023. The amounts that will be reported on such 1099-DIV or substitute Form 1099 will be the amounts you are to use on your federal income tax return and will differ from the amounts which we must report for the Fund's fiscal year ended April 30, 2023.
Proxy Voting Policies and Procedures and Proxy Voting Record
The Fund is required to file with the SEC its proxy voting record for the 12-month period ending June 30 on Form N-PX. A description of the policies and procedures that are used to vote proxies relating to portfolio securities of the Fund is available free of charge upon request by calling 800-624-6782 or visiting the SEC’s website at www.sec.gov. The most recent Form N-PX or proxy voting record is available free of charge upon request by calling 800-624-6782; visiting newyorklifeinvestments.com; or visiting the SEC’s website at www.sec.gov.
Shareholder Reports and Quarterly Portfolio Disclosure
The Fund is required to file its complete schedule of portfolio holdings with the SEC 60 days after its first and third fiscal quarter on Form N-PORT. The Fund's holdings report is available free of charge upon request by calling New York Life Investments at 800-624-6782.
| 50 | MainStay MacKay Short Term Municipal Fund |
Board of Trustees and Officers (Unaudited)
The Trustees and officers of the Fund are listed below. The Board oversees the MainStay Group of Funds (which consists of MainStay Funds and MainStay Funds Trust), MainStay VP Funds Trust, MainStay MacKay DefinedTerm Municipal Opportunities Fund, MainStay CBRE Global Infrastructure Megatrends Fund, the Manager and the Subadvisors, and elects the officers of the Funds who are responsible for the day-to-day operations of the Fund. Information pertaining to the Trustees and officers is set forth below. Each Trustee serves until his or her successor is elected and qualified or until his or her resignation, death or removal.
Under the Board’s retirement policy, unless an exception is made, a Trustee must tender his or her resignation by the end of the calendar year during which he or she reaches the age of 75. Officers are elected annually by the Board. The business address of each Trustee and officer listed below is 51 Madison Avenue, New York, New York 10010. A majority of the Trustees are not “interested persons” (as defined by the 1940 Act and rules adopted by the SEC thereunder) of the Fund (“Independent Trustees”).
| | Name and
Year of Birth | Term of Office,
Position(s) Held and
Length of Service | Principal Occupation(s)
During Past Five Years | Number of
Portfolios in
Fund Complex
Overseen by
Trustee | Other Directorships
Held by Trustee |
| | | | | | |
| | Naïm Abou-Jaoudé*
1966 | MainStay Funds: Trustee
since June 2023;
MainStay Funds Trust:
Trustee since June 2023 | Chief Executive Officer of New York Life Investment Management LLC since 2023. Previously, Abou-Jaoudé was the Chief Executive Officer of Candriam (an affiliate of New York Life Investment Management LLC) from 2007 to 2023. | 79 | MainStay VP Funds Trust:
Trustee since June 2023 (31 portfolios);
MainStay MacKay DefinedTerm Municipal Opportunities Fund: Trustee
since June 2023;
MainStay CBRE Global Infrastructure Megatrends Fund: Trustee
since June 2023; and
New York Life Investment Management International: Chair since 2015 |
| * | This Trustee is considered to be an “interested person” of the MainStay Group of Funds, MainStay VP Funds Trust, MainStay CBRE Global Infrastructure Megatrends Fund and MainStay MacKay DefinedTerm Municipal Opportunities Fund, within the meaning of the 1940 Act because of his affiliation with New York Life Insurance Company, New York Life Investment Management LLC, Candriam, IndexIQ Advisors LLC, MacKay Shields LLC, NYL Investors LLC, NYLIFE Securities LLC and/or NYLIFE Distributors LLC, as described in detail above in the column entitled “Principal Occupation(s) During Past Five Years.” |
| | |
Board of Trustees and Officers (Unaudited) (continued)
| | Name and
Year of Birth | Term of Office,
Position(s) Held and
Length of Service | Principal Occupation(s)
During Past Five Years | Number of
Portfolios in
Fund Complex
Overseen by
Trustee | Other Directorships
Held by Trustee |
| | | | | | |
| | David H. Chow
1957 | MainStay Funds: Trustee since January 2016, Advisory Board Member (June 2015 to December 2015);MainStay Funds Trust:
Trustee since January 2016, Advisory Board Member (June 2015 to December 2015) | Founder and CEO, DanCourt Management, LLC (since 1999) | 79 | MainStay VP Funds Trust: Trustee since January 2016, Advisory Board Member (June 2015 to December 2015) (31 portfolios);
MainStay MacKay DefinedTerm Municipal Opportunities Fund: Trustee since January 2016, Advisory Board Member (June 2015 to December 2015);
MainStay CBRE Global Infrastructure Megatrends Fund: Trustee since June 2021; VanEck Vectors Group of Exchange-Traded Funds: Trustee since 2006 and Independent Chairman of the Board of Trustees from 2008 to 2022 (57 portfolios); Berea College of Kentucky: Trustee since 2009, Chair of the Investment Committee since 2018 |
| | Karen Hammond
1956 | MainStay Funds: Trustee since December 2021, Advisory Board Member (June 2021 to December 2021);MainStay Funds Trust:
Trustee since December 2021, Advisory Board Member (June 2021 to December 2021)
| Retired, Managing Director, Devonshire Investors (2007 to 2013); Senior Vice President, Fidelity Management & Research Co. (2005 to 2007); Senior Vice President and Corporate Treasurer, FMR Corp. (2003 to 2005); Chief Operating Officer, Fidelity Investments Japan (2001 to 2003) | 79 | MainStay VP Funds Trust: Trustee since December 2021, Advisory Board Member (June 2021 to December 2021) (31 portfolios);
MainStay MacKay DefinedTerm Municipal Opportunities Fund: Trustee since December 2021, Advisory Board Member (June 2021 to December 2021);
MainStay CBRE Global Infrastructure Megatrends Fund: Trustee since December 2021, Advisory Board Member (June 2021 to December 2021);
Two Harbors Investment Corp.: Director since 2018;
Rhode Island State Investment Commission: Member since 2017; and
Blue Cross Blue Shield of Rhode Island: Director since 2019 |
| | Susan B. Kerley
1951 | MainStay Funds: Chairman since January 2017 and Trustee since 2007;MainStay Funds Trust:
Chairman since January 2017 and Trustee since 1990** | President, Strategic Management Advisors LLC (since 1990) | 79 | MainStay VP Funds Trust: Chairman since January 2017 and Trustee since 2007 (31 portfolios)*;
MainStay MacKay DefinedTerm Municipal Opportunities Fund: Chairman since January 2017 and Trustee since 2011;
MainStay CBRE Global Infrastructure Megatrends Fund: Trustee since June 2021; and Legg Mason Partners Funds: Trustee since 1991 (45 portfolios) |
| | Alan R. Latshaw
1951 | MainStay Funds: Trusteesince 2006;MainStay Funds Trust:
Trustee since 2007** | Retired; Partner, Ernst & Young LLP (2002 to 2003); Partner, Arthur Andersen LLP (1989 to 2002); Consultant to the MainStay Funds Audit and Compliance Committee (2004 to 2006) | 79 | MainStay VP Funds Trust: Trustee since 2007 (31 portfolios)*;
MainStay MacKay DefinedTerm Municipal Opportunities Fund: Trustee since 2011; and
MainStay CBRE Global Infrastructure Megatrends Fund: Trustee since June 2021 |
| 52 | MainStay MacKay Short Term Municipal Fund |
| | Name and
Year of Birth | Term of Office,
Position(s) Held and
Length of Service | Principal Occupation(s)
During Past Five Years | Number of
Portfolios in
Fund Complex
Overseen by
Trustee | Other Directorships
Held by Trustee |
| | | | | | |
| | Jacques P. Perold
1958 | MainStay Funds: Trustee since January 2016, Advisory Board Member (June 2015to December 2015);MainStay Funds Trust:
Trustee since January 2016, Advisory Board Member (June 2015 to December 2015) | Founder and Chief Executive Officer, CapShift Advisors LLC (since 2018); President, Fidelity Management & Research Company (2009 to 2014); President and Chief Investment Officer, Geode Capital Management, LLC (2001 to 2009) | 79 | MainStay VP Funds Trust: Trustee since January 2016, Advisory Board Member (June 2015 to December 2015) (31 portfolios);
MainStay MacKay DefinedTerm Municipal Opportunities Fund: Trustee since January 2016, Advisory Board Member (June 2015 to December 2015);
MainStay CBRE Global Infrastructure Megatrends Fund: Trustee since June 2021; Allstate Corporation: Director since 2015; and MSCI Inc.: Director since 2017 |
| | Richard S. Trutanic
1952 | MainStay Funds: Trustee since 1994;MainStay Funds Trust:
Trustee since 2007** | Chairman and Chief Executive Officer, Somerset & Company (financial advisory firm) (since 2004); Managing Director, The Carlyle Group (private investment firm) (2002 to 2004); Senior Managing Director, Partner and Board Member, Groupe Arnault S.A. (private investment firm) (1999 to 2002) | 79 | MainStay VP Funds Trust: Trustee since 2007 (31 portfolios)*;
MainStay MacKay DefinedTerm Municipal Opportunities Fund: Trustee since 2011; and MainStay CBRE Global Infrastructure Megatrends Fund: Trustee since June 2021 |
| * | Includes prior service as a Director of MainStay VP Series Fund, Inc., the predecessor to MainStay VP Funds Trust. |
| ** | Includes prior service as a Director/Trustee of certain predecessor entities to MainStay Funds Trust. |
Board of Trustees and Officers (Unaudited) (continued)
| | Name and
Year of Birth | Position(s) Held and
Length of Service | Principal Occupation(s)
During Past Five Years | |
| | | | | |
| | Kirk C. Lehneis
1974 | President, MainStay Funds, MainStay Funds Trust (since 2017) | Chief Operating Officer and Senior Managing Director (since 2016), New York Life Investment Management LLC and New York Life Investment Management Holdings LLC; Member of the Board of Managers (since 2017) and Senior Managing Director (since 2018), NYLIFE Distributors LLC; Chairman of the Board and Senior Managing Director, NYLIM Service Company LLC (since 2017); Trustee, President and Principal Executive Officer of IndexIQ Trust, IndexIQ ETF Trust and IndexIQ Active ETF Trust (since January 2018); President, MainStay CBRE Global Infrastructure Megatrends Fund (since 2021), MainStay MacKay DefinedTerm Municipal Opportunities Fund and MainStay VP Funds Trust (since 2017); Senior Managing Director, Global Product Development (2015-2016); Managing Director, Product Development (2010 to 2015), New York Life Investment Management LLC | |
| | Jack R. Benintende
1964 | Treasurer and Principal Financial and Accounting Officer, MainStay Funds (since 2007), MainStay Funds Trust (since 2009) | Managing Director, New York Life Investment Management LLC (since 2007); Treasurer and Principal Financial and Accounting Officer, MainStay CBRE Global Infrastructure Megatrends Fund (since 2021), MainStay MacKay DefinedTerm Municipal Opportunities Fund (since 2011) and MainStay VP Funds Trust (since 2007)**; and Assistant Treasurer, New York Life Investment Management Holdings LLC (2008 to 2012) | |
| | J. Kevin Gao
1967 | Secretary and Chief Legal Officer, MainStay Funds and MainStay Funds Trust (since 2010) | Managing Director and Associate General Counsel, New York Life Investment Management LLC (since 2010); Secretary and Chief Legal Officer, MainStay CBRE Global Infrastructure Megatrends Fund (since 2021), MainStay MacKay DefinedTerm Municipal Opportunities Fund (since 2011) and MainStay VP Funds Trust (since 2010)** | |
| | Scott T. Harrington
1959 | Vice President— Administration, MainStay Funds (since 2005), MainStay Funds Trust (since 2009) | Managing Director, New York Life Investment Management LLC (including predecessor advisory organizations) (since 2000); Member of the Board of Directors, New York Life Trust Company (since 2009); Vice President—Administration, MainStay CBRE Global Infrastructure Megatrends Fund (since 2021), MainStay MacKay DefinedTerm Municipal Opportunities Fund (since 2011) and MainStay VP Funds Trust (since 2005)** | |
| | Kevin M. Gleason
1967 | Vice President and Chief Compliance Officer, MainStay Funds and MainStay Funds Trust (since June 2022) | Vice President and Chief Compliance Officer, IndexIQ Trust, IndexIQ ETF Trust and Index IQ Active ETF Trust (since June 2022); Vice President and Chief Compliance Officer, MainStay CBRE Global Infrastructure Megatrends Fund, MainStay VP Funds Trust and MainStay MacKay DefinedTerm Municipal Opportunities Fund (since June 2022); Senior Vice President, Voya Investment Management and Chief Compliance Officer, Voya Family of Funds (2012-2022) | |
| * | The officers listed above are considered to be “interested persons” of the MainStay Group of Funds, MainStay VP Funds Trust, MainStay CBRE Global Infrastructure Megatrends Fund and MainStay MacKay DefinedTerm Municipal Opportunities Fund within the meaning of the 1940 Act because of their affiliation with the MainStay Group of Funds, New York Life Insurance Company and/or its affiliates, including New York Life Investment Management LLC, New York Life Insurance Company, NYLIM Service Company LLC, NYLIFE Securities LLC and/or NYLIFE Distributors LLC, as described in detail in the column captioned “Principal Occupation(s) During Past Five Years.” Officers are elected annually by the Board. |
| ** | Includes prior service as an Officer of MainStay VP Series Fund, Inc., the predecessor to MainStay VP Funds Trust. |
Officers of the Trust (Who are not Trustees)*
| 54 | MainStay MacKay Short Term Municipal Fund |
Equity
U.S. Equity
MainStay Epoch U.S. Equity Yield Fund
MainStay Fiera SMID Growth Fund
MainStay S&P 500 Index Fund
MainStay Winslow Large Cap Growth Fund
MainStay WMC Enduring Capital Fund
MainStay WMC Growth Fund
MainStay WMC Small Companies Fund
MainStay WMC Value Fund
International Equity
MainStay Epoch International Choice Fund
MainStay MacKay International Equity Fund
MainStay WMC International Research Equity Fund
Emerging Markets Equity
MainStay Candriam Emerging Markets Equity Fund
Global Equity
MainStay Epoch Capital Growth Fund
MainStay Epoch Global Equity Yield Fund
Fixed Income
Taxable Income
MainStay Candriam Emerging Markets Debt Fund
MainStay Floating Rate Fund
MainStay MacKay High Yield Corporate Bond Fund
MainStay MacKay Short Duration High Yield Fund
MainStay MacKay Strategic Bond Fund
MainStay MacKay Total Return Bond Fund
MainStay MacKay U.S. Infrastructure Bond Fund
MainStay Short Term Bond Fund
Tax-Exempt Income
MainStay MacKay California Tax Free Opportunities Fund1
MainStay MacKay High Yield Municipal Bond Fund
MainStay MacKay New York Tax Free Opportunities Fund2
MainStay MacKay Short Term Municipal Fund
MainStay MacKay Strategic Municipal Allocation Fund
MainStay MacKay Tax Free Bond Fund
Money Market
MainStay Money Market Fund
Mixed Asset
MainStay Balanced Fund
MainStay Income Builder Fund
MainStay MacKay Convertible Fund
Speciality
MainStay CBRE Global Infrastructure Fund
MainStay CBRE Real Estate Fund
MainStay Cushing MLP Premier Fund
Asset Allocation
MainStay Conservative Allocation Fund
MainStay Conservative ETF Allocation Fund
MainStay Defensive ETF Allocation Fund
MainStay Equity Allocation Fund
MainStay Equity ETF Allocation Fund
MainStay ESG Multi-Asset Allocation Fund
MainStay Growth Allocation Fund
MainStay Growth ETF Allocation Fund
MainStay Moderate Allocation Fund
MainStay Moderate ETF Allocation Fund
Manager
New York Life Investment Management LLC
New York, New York
Subadvisors
Candriam3
Strassen, Luxembourg
CBRE Investment Management Listed Real Assets LLC
Radnor, Pennsylvania
Cushing Asset Management, LP
Dallas, Texas
Epoch Investment Partners, Inc.
New York, New York
Fiera Capital Inc.
New York, New York
IndexIQ Advisors LLC3
New York, New York
MacKay Shields LLC3
New York, New York
NYL Investors LLC3
New York, New York
Wellington Management Company LLP
Boston, Massachusetts
Winslow Capital Management, LLC
Minneapolis, Minnesota
Legal Counsel
Dechert LLP
Washington, District of Columbia
Independent Registered Public Accounting Firm
KPMG LLP
Philadelphia, Pennsylvania
Distributor
NYLIFE Distributors LLC3
Jersey City, New Jersey
Custodian
JPMorgan Chase Bank, N.A.
New York, New York
1.
This Fund is registered for sale in AZ, CA, NV, OR, TX, UT, WA and MI (Class A and Class I shares only), and CO, FL, GA, HI, ID, MA, MD, NH, NJ and NY (Class I shares only).
| 2. | This Fund is registered for sale in CA, CT, DE, FL, MA, NJ, NY and VT. |
| 3. | An affiliate of New York Life Investment Management LLC. |
Not part of the Annual Report
For more information
800-624-6782
newyorklifeinvestments.com
“New York Life Investments” is both a service mark, and the common trade name, of certain investment advisors affiliated with New York Life Insurance Company. The MainStay Funds® are managed by New York Life Investment Management LLC and distributed by NYLIFE Distributors LLC, 30 Hudson Street, Jersey City, NJ 07302, a wholly owned subsidiary of New York Life Insurance Company. NYLIFE Distributors LLC is a Member FINRA/SIPC.
©2023 NYLIFE Distributors LLC. All rights reserved.
| 5022215MS043-23 | MSSTM11-06/23 |
(NYLIM) NL230
MainStay MacKay Strategic Municipal Allocation Fund
Message from the President and Annual Report
April 30, 2023
Sign up for e-delivery of your shareholder reports. For full details on e-delivery, including who can participate and what you can receive via e-delivery,
please log in to newyorklifeinvestments.com/accounts.
| Not FDIC/NCUA Insured | Not a Deposit | May Lose Value | No Bank Guarantee | Not Insured by Any Government Agency |
This page intentionally left blank
Message from the President
Despite high levels of volatility and sharp, short-term shifts in value, broadly based stock and bond indices saw relatively modest overall changes during the 12-month reporting period ended April 30, 2023. A deeply challenging investment environment during the last eight months of 2022, driven by increasing inflationary pressures and aggressive monetary efforts to curb them, was followed by a more positive, but uneven, economic and monetary backdrop during the first four months of 2023.
In April 2022, before the start of the reporting period, U.S. inflation stood at an annualized rate of 8.3%, up from 4.2% a year earlier. The U.S. Federal Reserve (the “Fed”), had begun to take steps to curb inflation, raising the federal funds rate from near zero in March 2022. Eight separate rate hikes during the reporting period brought the benchmark rate up to 4.75–5.00% in March 2023. Inflation seemed to respond, easing steadily from a peak of 9.1% in June 2022 to 4.9% in April 2023. Although further interest rate increases are expected in 2023, by the end of the reporting period, it appeared that the Fed might be nearing the end of the current rate-hike cycle. Economic growth, although slower, remained positive, supported by historically high levels of employment and robust consumer spending. International economies experienced similar trends, with more modest central bank interest-rate hikes curbing inflation to a degree.
Equity market behavior during the reporting period reflected the arc of monetary policy and economic developments. From May through early October 2022, as inflation raged and interest-rate increases accelerated, investors shied away from perceived risk, favoring relatively defensive and value-oriented sectors over growth-oriented sectors. The S&P 500® Index, a widely regarded benchmark of U.S. market performance, declined by more than 13% during this time, while international stocks suffered even sharper losses. These trends reversed from mid-October 2022 through the end of the reporting period, as inflationary pressures eased and markets began to anticipate an end to rising interest rates. Between mid-October 2022 and April 30, 2023, the S&P 500® Index regained all the ground it lost earlier, ending in modestly positive territory. International developed-markets stocks bounced back even stronger, prompted by surprisingly robust economic resilience in Europe and further bolstered by China’s
reopening after the government rescinded its “zero-COVID-19” policy and eased regulatory restrictions on key industries. The declining value of the U.S. dollar relative to other currencies also enhanced international market equity performance. Emerging markets generally lagged their developed-markets counterparts while outperforming U.S. markets.
Fixed-income markets followed a similar pattern of retreat and recovery. Bond prices trended sharply downward early in the reporting period, as yields rose along with interest rates. Short-term yields rose faster than long-term yields, producing a yield curve inversion—with long-term rates lower than short-term rates—that persisted from July through the end of the reporting period. However, market sentiment improved in the second half of the reporting period as inflationary pressures eased. As the Fed decreased the magnitude of rate increases, focus turned toward the possibility of eventual rate reductions and a potential ‘soft landing’ for the economy. On the negative side, a small number of high-profile, regional U.S. bank failures in March and April 2023 raised fears of possible wider banking industry contagion and future credit constraints.
While many market observers believe the Fed has neared the end of the current cycle of rate increases, the central bank’s rhetoric remains sharply focused on its target inflation rate of 2%. Only time will tell if the market’s favorable expectations prove well founded.
However the economic story unfolds in the months and years to come, we remain dedicated to providing you with the one-on-one philosophy and diversified, multi-boutique investment resources that set New York Life Investments apart. Thank you for trusting us to help you meet your investment needs.
Sincerely,
Kirk C. Lehneis
President
The opinions expressed are as of the date of this report and are subject to change. There is no guarantee that any forecast made will come to pass. This material does not constitute investment advice and is not intended as an endorsement of any specific investment. Past performance is no guarantee of future results.
Not part of the Annual Report
Investors should refer to the Fund’s Summary Prospectus and/or Prospectus and consider the Fund’s investment objectives, strategies, risks, charges and expenses carefully before investing. The Summary Prospectus and/or Prospectus contain this and other information about the Fund. You may obtain copies of the Fund’s Summary Prospectus, Prospectus and Statement of Additional Information, which includes information about the MainStay Funds Trust's Trustees, free of charge, upon request, by calling toll-free 800-624-6782, by writing to NYLIFE Distributors LLC, Attn: MainStay Marketing Department, 30 Hudson Street, Jersey City, NJ 07302 or by sending an e-mail to MainStayShareholderServices@nylim.com. These documents are also available via the MainStay Funds’ website at newyorklifeinvestments.com. Please read the Fund’s Summary Prospectus and/or Prospectus carefully before investing.
Investment and Performance Comparison (Unaudited)
Performance data quoted represents past performance. Past performance is no guarantee of future results. Because of market volatility and other factors, current performance may be lower or higher than the figures shown. Investment return and principal value will fluctuate, and as a result, when shares are redeemed, they may be worth more or less than their original cost. The graph below depicts the historical performance of Class I shares of the Fund. Performance will vary from class to class based on differences in class-specific expenses and sales charges. For performance information current to the most recent month-end, please call 800-624-6782 or visit newyorklifeinvestments.com.
The performance table and graph do not reflect the deduction of taxes that a shareholder would pay on distributions or Fund share redemptions. Total returns reflect maximum applicable sales charges as indicated in the table below, if any, changes in share price, and reinvestment of dividend and capital gain distributions. The graph assumes the initial investment amount shown below and reflects the deduction of all sales charges that would have applied for the period of investment. Performance figures may reflect certain fee waivers and/or expense limitations, without which total returns may have been lower. For more information on share classes and current fee waivers and/or expense limitations (if any), please refer to the Notes to Financial Statements.

| Average Annual Total Returns for the Year-Ended April 30, 2023 |
| Class | Sales Charge | | Inception
Date | One
Year | Since
Inception | Gross
Expense
Ratio1 |
| Class A Shares2 | Maximum 3.00% Initial Sales Charge | With sales charges | 6/28/2019 | -1.90% | -0.15% | 0.97% |
| | | Excluding sales charges | | 2.73 | 1.05 | 0.97 |
| Investor Class Shares3, 4 | Maximum 2.50% Initial Sales Charge | With sales charges | 6/28/2019 | -1.53 | -0.35 | 1.17 |
| | | Excluding sales charges | | 2.58 | 0.85 | 1.17 |
| Class C Shares | Maximum 1.00% CDSC | With sales charges | 6/28/2019 | 1.31 | 0.57 | 1.42 |
| | if Redeemed Within 18 months of Purchase | Excluding sales charges | | 2.31 | 0.57 | 1.42 |
| Class C2 Shares | Maximum 1.00% CDSC | With sales charges | 12/13/2022 | N/A | 0.29 | 1.57 |
| | if Redeemed Within One Year of Purchase | Excluding sales charges | | N/A | 1.29 | 1.57 |
| Class I Shares | No Sales Charge | | 6/28/2019 | 2.99 | 1.24 | 0.71 |
| Class R6 Shares | No Sales Charge | | 6/28/2019 | 3.01 | 1.26 | 0.70 |
| 1. | The gross expense ratios presented reflect the Fund’s “Total Annual Fund Operating Expenses” from the most recent Prospectus, as supplemented, and may differ from other expense ratios disclosed in this report. |
| 2. | Prior to August 10, 2022, the maximum initial sales charge was 4.50%, which is reflected in the applicable average annual total return figures shown. |
| 3. | Prior to June 30, 2020, the maximum initial sales charge was 4.50%, which is reflected in the applicable average annual total return figures shown. |
| 4. | Prior to August 10, 2022, the maximum initial sales charge was 4.00%, which is reflected in the applicable average annual total return figures shown. |
The footnotes on the next page are an integral part of the table and graph and should be carefully read in conjunction with them.
| Benchmark Performance* | One
Year | Since
Inception |
| Bloomberg Municipal Bond Index 1-15 Yr Blend1 | 3.50% | 0.85% |
| Morningstar Muni National Intermediate Category Average2 | 2.23 | 0.39 |
| * | Returns for indices reflect no deductions for fees, expenses or taxes, except for foreign withholding taxes where applicable. Results assume reinvestment of all dividends and capital gains. An investment cannot be made directly in an index. |
| 1. | The Bloomberg Municipal Bond Index 1-15 Yr Blend is the Fund's primary broad-based securities-market index for comparison purposes. The index has four main sectors: state and local general obligations, revenue bonds, and insured bonds. |
| 2. | The Morningstar Municipal National Intermediate Category Average is representative of funds that invest in bonds issued by various state and local governments to fund public projects. The income from these bonds is generally free from federal taxes. To lower risk, these funds spread their assets across many states and sectors. These funds have durations of 4.0 to 6.0 years (or average maturities of five to 12 years). Results are based on average total returns of similar funds with all dividends and capital gain distributions reinvested. |
The footnotes on the preceding page are an integral part of the table and graph and should be carefully read in conjunction with them.
| 6 | MainStay MacKay Strategic Municipal Allocation Fund |
Cost in Dollars of a $1,000 Investment in MainStay MacKay Strategic Municipal Allocation Fund (Unaudited)
The example below is intended to describe the fees and expenses borne by shareholders during the six-month period from November 1, 2022 to April 30, 2023, and the impact of those costs on your investment.
Example
As a shareholder of the Fund you incur two types of costs: (1) transaction costs, including exchange fees and sales charges (loads) on purchases (as applicable), and (2) ongoing costs, including management fees, distribution and/or service (12b-1) fees and other Fund expenses (as applicable). This example is intended to help you understand your ongoing costs (in dollars) of investing in the Fund and to compare these costs with the ongoing costs of investing in other mutual funds. The example is based on an investment of $1,000 made at the beginning of the six-month period and held for the entire period from November 1, 2022 to April 30, 2023.
This example illustrates your Fund’s ongoing costs in two ways:
Actual Expenses
The second and third data columns in the table below provide information about actual account values and actual expenses. You may use the information in these columns, together with the amount you invested, to estimate the expenses that you paid during the six months ended April 30, 2023. Simply divide your account value by $1,000 (for example, an
$8,600 account value divided by $1,000 = 8.6), then multiply the result by the number under the heading entitled “Expenses Paid During Period” to estimate the expenses you paid on your account during this period.
Hypothetical Example for Comparison Purposes
The fourth and fifth data columns in the table below provide information about hypothetical account values and hypothetical expenses based on the Fund’s actual expense ratio and an assumed rate of return of 5% per year before expenses, which is not the Fund’s actual return. The hypothetical account values and expenses may not be used to estimate the actual ending account balances or expenses you paid for the six-month period shown. You may use this information to compare the ongoing costs of investing in the Fund with the ongoing costs of investing in other mutual funds. To do so, compare this 5% hypothetical example with the 5% hypothetical examples that appear in the shareholder reports of the other mutual funds.
Please note that the expenses shown in the table are meant to highlight your ongoing costs only and do not reflect any transactional costs, such as exchange fees or sales charges (loads). Therefore, the fourth and fifth data columns of the table are useful in comparing ongoing costs only and will not help you determine the relative total costs of owning different funds. In addition, if these transactional costs were included, your costs would have been higher.
| Share Class | Beginning
Account
Value
11/1/22 | Ending Account
Value (Based
on Actual
Returns and
Expenses)
4/30/23 | Expenses
Paid
During
Period1 | Ending Account
Value (Based
on Hypothetical
5% Annualized
Return and
Actual Expenses)
4/30/23 | Expenses
Paid
During
Period | Net Expense
Ratio
During
Period2 |
| Class A Shares | $1,000.00 | $1,066.20 | $3.94 | $1,020.98 | $3.86 | 0.77% |
| Investor Class Shares | $1,000.00 | $1,065.50 | $4.76 | $1,020.18 | $4.66 | 0.93% |
| Class C Shares | $1,000.00 | $1,064.20 | $6.04 | $1,018.94 | $5.91 | 1.18% |
| Class C2 Shares 3, 4 | $1,000.00 | $1,012.90 | $5.10 | $1,013.84 | $5.10 | 1.34% |
| Class I Shares | $1,000.00 | $1,066.50 | $2.66 | $1,022.22 | $2.61 | 0.52% |
| Class R6 Shares | $1,000.00 | $1,067.80 | $2.56 | $1,022.32 | $2.51 | 0.50% |
| 1. | Expenses are equal to the Fund’s annualized expense ratio of each class multiplied by the average account value over the period, divided by 365 and multiplied by 181 (to reflect the six-month period) and 138 days for Class C2 (to reflect the since-inception period). The table above represents the actual expenses incurred during the six-month period. In addition to the fees and expenses which the Fund bears directly, it also indirectly bears a pro rata share of the fees and expenses of the underlying funds in which it invests. Such indirect expenses are not included in the above-reported expense figures. |
| 2. | Expenses are equal to the Fund's annualized expense ratio to reflect the six-month period. |
| 3. | The inception date was December 13, 2022. |
| 4. | Expenses paid during the period reflect ongoing costs for the period from inception through April 30, 2023. Had these shares been offered for the full six-month period ended April 30, 2023, and had the Fund provided a hypothetical 5% annualized return, expenses paid during the period would have been $5.11 for Class C2 shares and the ending account value would have been $1,019.74 for Class C2 shares. |
Portfolio Composition as of April 30, 2023 (Unaudited)
| New York | 11.2% |
| Texas | 9.9 |
| California | 9.8 |
| Illinois | 8.4 |
| Florida | 7.0 |
| Alabama | 4.8 |
| Colorado | 3.9 |
| New Jersey | 3.9 |
| Pennsylvania | 3.3 |
| Georgia | 3.1 |
| Connecticut | 2.6 |
| Ohio | 2.6 |
| Indiana | 2.2 |
| Louisiana | 2.1 |
| Utah | 2.0 |
| Michigan | 2.0 |
| Tennessee | 1.9 |
| Wisconsin | 1.6 |
| Guam | 1.4 |
| Puerto Rico | 1.3 |
| Kentucky | 1.2 |
| Washington | 1.2 |
| North Carolina | 1.2 |
| Massachusetts | 1.0 |
| Nebraska | 0.9 |
| Missouri | 0.9% |
| U.S. Virgin Islands | 0.8 |
| Vermont | 0.8 |
| Rhode Island | 0.6 |
| South Carolina | 0.6 |
| Arizona | 0.5 |
| Maryland | 0.5 |
| West Virginia | 0.5 |
| Maine | 0.3 |
| Virginia | 0.3 |
| District of Columbia | 0.3 |
| Oregon | 0.3 |
| Mississippi | 0.2 |
| New Mexico | 0.2 |
| Montana | 0.2 |
| South Dakota | 0.2 |
| Idaho | 0.1 |
| New Hampshire | 0.1 |
| Alaska | 0.1 |
| Minnesota | 0.1 |
| North Dakota | 0.1 |
| Hawaii | 0.0‡ |
| Other Assets, Less Liabilities | 1.8 |
| | 100.0% |
| ‡ | Less than one–tenth of a percent. |
See Portfolio of Investments beginning on page 11 for specific holdings within these categories. The Fund's holdings are subject to change.
Top Ten Holdings and/or Issuers Held as of April 30, 2023 (excluding short-term investments) (Unaudited)
| 1. | Black Belt Energy Gas District, 4.00%-5.50%, due 12/1/26–11/1/53 |
| 2. | New York City Transitional Finance Authority, 3.75%-5.00%, due 11/1/29–5/1/42 |
| 3. | New Jersey Economic Development Authority, 4.914%-5.625%, due 3/1/24–11/1/44 |
| 4. | Main Street Natural Gas, Inc., 4.00%, due 4/1/48–8/1/49 |
| 5. | State of Louisiana, 5.00%, due 5/1/40 |
| 6. | San Joaquin Hills Transportation Corridor Agency, 5.25%, due 1/15/44–1/15/49 |
| 7. | County of Miami-Dade, 5.00%, due 10/1/33 |
| 8. | County of Parker, 5.00%, due 2/15/42 |
| 9. | State of Connecticut, 2.00%-5.77%, due 7/1/23–3/15/25 |
| 10. | Metropolitan Transportation Authority, 5.00%, due 11/15/29–11/15/42 |
| 8 | MainStay MacKay Strategic Municipal Allocation Fund |
Portfolio Management Discussion and Analysis (Unaudited)
Questions answered by portfolio managers John Loffredo, CFA, Robert DiMella, CFA, Michael Petty, David Dowden, Scott Sprauer, Frances Lewis, John Lawlor and Michael Denlinger, CFA, of MacKay Shields LLC, the Fund’s Subadvisor.
How did MainStay MacKay Strategic Municipal Allocation Fund perform relative to its benchmark and peer group during the 12 months ended April 30, 2023?
For the 12 months ended April 30, 2023, Class I shares of MainStay MacKay Strategic Municipal Allocation Fund returned 2.99%, underperforming the 3.50% return of the Fund’s benchmark, the Bloomberg Municipal Bond Index 1–15 Year Blend (the “Index”). Over the same period, Class I shares outperformed the 2.23% return of the Morningstar Muni National Intermediate Category Average.1
What factors affected the Fund’s relative performance during the reporting period?
During the reporting period, the Fund underperformed the Index partly due to underweight exposure to bonds maturing between one and 15 years. Overweight exposure to bonds maturing beyond 15 years made a positive contribution to relative performance. (Contributions take weightings and total returns into account.) The Fund’s underweight exposure to higher-quality, higher-rated bonds also detracted from relative returns. From a geographic perspective, overweight exposure to holdings from Illinois enhanced relative results, while underweight exposure to California bonds offset some of those gains.
During the reporting period, were there any market events that materially impacted the Fund’s performance or liquidity?
During the reporting period, the U.S. Federal Reserve’s hawkish stance against inflation had a negative impact on performance, as interest rates increased dramatically during the first half of the reporting period, resulting in an inverted U.S. Treasury yield curve.2
During the reporting period, how was the Fund’s performance materially affected by investments in derivatives?
During the reporting period, the Fund held U.S. Treasury futures to hedge the duration3 relative to the Index. This position did not materially impact performance.
What was the Fund’s duration strategy during the reporting period?
As relative value investors, we aim to keep the Fund’s duration within a neutral range relative to that of the Index. At the end of the reporting period, the Fund's modified duration to worst4 was 3.57 years while the modified duration to worst of the Index was 4.18 years.
During the reporting period, which sectors were the strongest positive contributors to the Fund’s relative performance and which sectors were particularly weak?
Relative to the Index, the Fund’s overweight exposure to the local general obligation and electric sectors contributed positively to relative results. Meanwhile, underweight exposure to state general obligation and education weakened relative performance.
What were some of the Fund’s largest purchases and sales during the reporting period?
As the Fund remained focused on diversification and liquidity, no individual purchase or sale would have been considered significant, although sector overweights and security structure, in their entirety, did have an impact.
How did the Fund’s sector weighting change during the reporting period?
During the reporting period, there were no material changes to the weightings in the Fund. At the margin, the Fund increased sector exposure to state general obligations and transportation. From a ratings perspective, there was an increased credit exposure to
| 1. | See "Investment and Performance Comparison" for other share class returns, which may be higher or lower than Class I share returns, and for more information on benchmark and peer group returns. |
| 2. | The yield curve is a line that plots the yields of various securities of similar quality—typically U.S. Treasury issues—across a range of maturities. The U.S. Treasury yield curve serves as a benchmark for other debt and is used in economic forecasting. |
| 3. | Duration is a measure of the price sensitivity of a fixed-income investment to changes in interest rates. Duration is expressed as a number of years and is considered a more accurate sensitivity gauge than average maturity. |
| 4. | Modified duration is inversely related to the approximate percentage change in price for a given change in yield. Duration to worst is the duration of a bond computed using the bond’s nearest call date or maturity, whichever comes first. This measure ignores future cash flow fluctuations due to embedded optionality. |
AAA-rated5 bonds, as they are in a relatively strong financial condition and were available at much higher yields. In addition, we increased the Fund’s exposure to bonds maturing beyond 17 years, where municipal yields were more attractive. Conversely, the Fund decreased sector exposure to hospital and education, and to 4+% coupon bonds.
How was the Fund positioned at the end of the reporting period?
As of April 30, 2023, the Fund held overweight positions relative to the Index in the transportation, special tax and housing sectors, and holdings from the state of Illinois. As of the same date, the Fund held underweight exposure to the state general obligation and prerefunded/ETM (escrowed to maturity) sectors, as well as the states of California and New York. The Fund also held overweight exposure to bonds beyond 17 years, and underweight exposure to bonds maturing between 1 and 10 years.
| 5. | An obligation rated ‘AAA’ by Standard & Poor’s (“S&P”) has the highest rating assigned by S&P, and in the opinion of S&P, the obligor’s capacity to meet its financial commitment on the obligation is extremely strong. When applied to Fund holdings, ratings are based solely on the creditworthiness of the bonds in the portfolio and are not meant to represent the security or safety of the Fund. |
The opinions expressed are those of the portfolio managers as of the date of this report and are subject to change. There is no guarantee that any forecasts will come to pass. This material does not constitute investment advice and is not intended as an endorsement of any specific investment.
| 10 | MainStay MacKay Strategic Municipal Allocation Fund |
Portfolio of Investments April 30, 2023†^
| | Principal
Amount | Value |
| Municipal Bonds 98.2% |
| Long-Term Municipal Bonds 93.8% |
| Alabama 4.2% |
| Alabama Housing Finance Authority, ECG Dry Creek LP, Revenue Bonds | | |
| Series H | | |
| 5.00%, due 6/1/26 (a) | $ 500,000 | $ 511,686 |
| Black Belt Energy Gas District, Gas Project No.4, Revenue Bonds | | |
| Series A-1 | | |
| 4.00%, due 12/1/49 (a) | 1,480,000 | 1,482,311 |
| Black Belt Energy Gas District, Gas Project No.6, Revenue Bonds | | |
| Series B | | |
| 4.00%, due 10/1/52 (a) | 1,760,000 | 1,755,481 |
| Black Belt Energy Gas District, Revenue Bonds | | |
| Series B-1 | | |
| 4.00%, due 4/1/53 (a) | 640,000 | 637,666 |
| Series C-1 | | |
| 5.25%, due 12/1/26 | 1,850,000 | 1,932,734 |
| Series F | | |
| 5.50%, due 11/1/53 (a) | 1,600,000 | 1,704,145 |
| County of Jefferson, Sewer, Revenue Bonds, Sub. Lien | | |
| Series D | | |
| 6.00%, due 10/1/42 | 3,000,000 | 3,172,750 |
| Prichard Water Works & Sewer Board, Revenue Bonds | | |
| 2.375%, due 11/1/28 | 205,000 | 115,124 |
| Southeast Energy Authority, A Cooperative District, Project No. 4, Revenue Bonds | | |
| Series B-1 | | |
| 5.00%, due 5/1/53 (a) | 760,000 | 792,300 |
| Southeast Energy Authority, A Cooperative District, Project No. 3, Revenue Bonds | | |
| Series A-1 | | |
| 5.50%, due 1/1/53 (a) | 1,600,000 | 1,729,531 |
| State of Alabama, Unlimited General Obligation | | |
| Series A | | |
| 3.00%, due 8/1/26 | 1,000,000 | 1,001,294 |
| | | 14,835,022 |
| | Principal
Amount | Value |
| |
| Alaska 0.1% |
| Alaska Industrial Development & Export Authority, Interior Gas Utility Project, Revenue Bonds | | |
| Series A | | |
| 5.00%, due 6/1/28 | $ 250,000 | $ 256,511 |
| Arizona 0.5% |
| Arizona Industrial Development Authority, Ball Charter Schools Projet, Revenue Bonds | | |
| 2.65%, due 7/1/26 | 90,000 | 86,208 |
| City of Mesa, Utility System, Revenue Bonds | | |
| Series A, Insured: BAM | | |
| 5.00%, due 7/1/30 | 1,050,000 | 1,206,032 |
| Glendale Industrial Development Authority, Royal Oaks Life Care Community, Revenue Bonds | | |
| 4.00%, due 5/15/28 | 620,000 | 582,158 |
| | | 1,874,398 |
| California 8.6% |
| California Community Choice Financing Authority, Clean Energy Project, Revenue Bonds | | |
| Series C | | |
| 5.25%, due 1/1/54 (a) | 1,225,000 | 1,279,713 |
| California Municipal Finance Authority, LINXS APM Project, Revenue Bonds, Senior Lien | | |
| Series A | | |
| 5.00%, due 12/31/31 (b) | 1,240,000 | 1,320,234 |
| California Municipal Finance Authority, Palomar Health Obligated Group, Certificate of Participation | | |
| Series A, Insured: AGM | | |
| 5.25%, due 11/1/36 | 1,300,000 | 1,452,491 |
| California Public Finance Authority, Enso Village Project, Revenue Bonds | | |
| Series B-3 | | |
| 2.125%, due 11/15/27 (c) | 250,000 | 237,717 |
| California School Finance Authority, Classical Academies Oceanside Project, Revenue Bonds | | |
| Series A | | |
| 4.00%, due 10/1/27 (c) | 500,000 | 503,293 |
The notes to the financial statements are an integral part of, and should be read in conjunction with, the financial statements.
11
Portfolio of Investments April 30, 2023†^ (continued)
| | Principal
Amount | Value |
| Long-Term Municipal Bonds (continued) |
| California (continued) |
| California School Finance Authority, Sonoma County Junior College District Project, Revenue Bonds | | |
| Series A | | |
| 4.00%, due 11/1/41 (c) | $ 240,000 | $ 197,807 |
| California Statewide Communities Development Authority, Community Infrastructure Program, Special Assessment | | |
| Series A | | |
| 4.00%, due 9/2/26 | 260,000 | 258,466 |
| City of Long Beach, Airport System, Revenue Bonds | | |
| Series A, Insured: AGM | | |
| 5.00%, due 6/1/31 | 250,000 | 298,972 |
| City of San Jose, Unlimited General Obligation | | |
| Series A-1 | | |
| 5.00%, due 9/1/41 | 1,500,000 | 1,636,018 |
| City of San Mateo, Community Facilities District No. 2008-1, Special Tax | | |
| Insured: BAM | | |
| 5.25%, due 9/1/35 | 1,000,000 | 1,139,390 |
| City of Vernon, Electric System, Revenue Bonds | | |
| Series A | | |
| 5.00%, due 10/1/27 | 250,000 | 264,656 |
| Compton Community College District, Election of 2002, Unlimited General Obligation | | |
| Series D, Insured: BAM | | |
| (zero coupon), due 8/1/38 | 1,000,000 | 362,775 |
| Corona Community Facilities District, Community Facilities District No. 2018-2, Special Tax | | |
| Series A | | |
| 5.00%, due 9/1/29 | 100,000 | 108,653 |
| County of Los Angeles Community Facilities District No. 2021-01, Improvement Area No. 1, Special Tax | | |
| 5.00%, due 9/1/27 | 100,000 | 106,724 |
| 5.00%, due 9/1/30 | 175,000 | 190,018 |
| 5.00%, due 9/1/32 | 175,000 | 191,538 |
| County of Sacramento, Airport System, Revenue Bonds | | |
| 5.00%, due 7/1/41 | 1,000,000 | 1,041,225 |
| | Principal
Amount | Value |
| |
| California (continued) |
| Foothill-De Anza Community College District, Unlimited General Obligation | | |
| Series B, Insured: NATL-RE FGIC | | |
| (zero coupon), due 8/1/29 | $ 1,045,000 | $ 872,720 |
| Hercules Redevelopment Agency Successor Agency, Tax Allocation | | |
| Series A, Insured: AGM | | |
| 5.00%, due 8/1/37 | 500,000 | 565,136 |
| Kern Community College District, Unlimited General Obligation | | |
| Series D | | |
| 5.25%, due 8/1/37 | 1,500,000 | 1,762,833 |
| Madera Unified School District, Unlimited General Obligation | | |
| 4.00%, due 8/1/44 | 100,000 | 100,068 |
| Oakland Unified School District, Election of 2020, Unlimited General Obligation | | |
| Series A, Insured: BAM | | |
| 4.00%, due 8/1/46 | 500,000 | 494,059 |
| Sacramento City Financing Authority, Capital Appreciation, Tax Allocation | | |
| Insured: NATL-RE | | |
| (zero coupon), due 12/1/23 | 735,000 | 720,208 |
| San Diego County Regional Airport Authority, Revenue Bonds | | |
| Series B | | |
| 5.00%, due 7/1/33 (b) | 4,500,000 | 5,028,140 |
| San Diego Unified School District, Unlimited General Obligation | | |
| Series I | | |
| 5.00%, due 7/1/47 | 1,000,000 | 1,061,823 |
| San Joaquin Hills Transportation Corridor Agency, Revenue Bonds, Junior Lien | | |
| Series B | | |
| 5.25%, due 1/15/44 | 5,000,000 | 5,090,111 |
| Series B | | |
| 5.25%, due 1/15/49 | 1,500,000 | 1,523,682 |
| Southern California Public Power Authority, Southern Transmissional System Renewal Project, Revenue Bonds | | |
| Series A-1 | | |
| 5.00%, due 7/1/40 (d) | 1,000,000 | 1,147,371 |
| University of California, Revenue Bonds | | |
| Series BN | | |
| 5.50%, due 5/15/40 | 1,400,000 | 1,687,888 |
| | | 30,643,729 |
The notes to the financial statements are an integral part of, and should be read in conjunction with, the financial statements.
| 12 | MainStay MacKay Strategic Municipal Allocation Fund |
| | Principal
Amount | Value |
| Long-Term Municipal Bonds (continued) |
| Colorado 3.9% |
| Arapahoe County School District No. 6 Littleton, Unlimited General Obligation | | |
| Insured: State Aid Withholding | | |
| 5.50%, due 12/1/43 | $ 750,000 | $ 839,545 |
| Arkansas River Power Authority, Revenue Bonds | | |
| Series A | | |
| 5.00%, due 10/1/38 | 2,000,000 | 2,035,637 |
| City & County of Denver, Pledged Excise Tax, Revenue Bonds | | |
| Series A | | |
| 5.00%, due 8/1/42 | 1,000,000 | 1,039,644 |
| City & County of Denver, Airport System, Revenue Bonds | | |
| Series D | | |
| 5.75%, due 11/15/41 (b) | 1,715,000 | 1,973,310 |
| City of Colorado Springs, Utilities System, Revenue Bonds | | |
| 5.00%, due 11/15/40 | 3,000,000 | 3,105,219 |
| Colorado Health Facilities Authority, Aberdeen Ridge, Inc. Obligated Group, Revenue Bonds | | |
| Series B-3 | | |
| 2.125%, due 5/15/28 | 250,000 | 226,458 |
| Colorado Health Facilities Authority, CommonSpirit Health, Revenue Bonds | | |
| Series A-1 | | |
| 4.00%, due 8/1/44 | 250,000 | 235,319 |
| Series A-1 | | |
| 5.00%, due 8/1/35 | 180,000 | 191,964 |
| Series A | | |
| 5.25%, due 11/1/37 | 1,450,000 | 1,589,931 |
| Fiddlers Business Improvement District, Unlimited General Obligation | | |
| 5.00%, due 12/1/32 (c) | 200,000 | 202,676 |
| Ground Water Management Subdistrict of Central Colorado, Water Conservancy District, Limited General Obligation | | |
| Insured: BAM | | |
| 4.00%, due 12/1/40 | 250,000 | 249,072 |
| VDW Metropolitan District No. 2, Limited General Obligation | | |
| Series A-2, Insured: BAM | | |
| 4.00%, due 12/1/45 | 580,000 | 555,443 |
| | Principal
Amount | Value |
| |
| Colorado (continued) |
| Weld County School District No. RE-2, Unlimited General Obligation | | |
| Insured: State Aid Withholding | | |
| 5.00%, due 12/1/36 | $ 1,425,000 | $ 1,591,344 |
| | | 13,835,562 |
| Connecticut 2.6% |
| Hartford Stadium Authority, Stadium Authority Lease, Revenue Bonds | | |
| Series A | | |
| 5.00%, due 2/1/36 | 230,000 | 230,822 |
| State of Connecticut, Unlimited General Obligation | | |
| Series A | | |
| 2.00%, due 7/1/23 | 1,605,000 | 1,596,726 |
| Series A | | |
| 3.13%, due 1/15/24 | 4,000,000 | 3,953,178 |
| Series A | | |
| 5.77%, due 3/15/25 | 500,000 | 508,612 |
| State of Connecticut, Special Tax, Revenue Bonds | | |
| 4.00%, due 5/1/36 | 1,040,000 | 1,085,543 |
| State of Connecticut, Transportation Infrastructure, Revenue Bonds | | |
| Series A | | |
| 5.25%, due 7/1/40 | 1,500,000 | 1,733,566 |
| | | 9,108,447 |
| District of Columbia 0.3% |
| District of Columbia, Unlimited General Obligation | | |
| Series C | | |
| 5.00%, due 6/1/38 | 1,000,000 | 1,014,086 |
| Florida 7.0% |
| CFM Community Development District, Capital Improvement, Special Assessment | | |
| 2.875%, due 5/1/31 | 100,000 | 86,656 |
| City of Gainesville, Utilities System, Revenue Bonds | | |
| Series A | | |
| 5.00%, due 10/1/47 | 635,000 | 675,238 |
| City of Palmetto, Renaissance Arts and Education, Inc., Revenue Bonds | | |
| Series A | | |
| 4.25%, due 6/1/27 | 160,000 | 160,438 |
The notes to the financial statements are an integral part of, and should be read in conjunction with, the financial statements.
13
Portfolio of Investments April 30, 2023†^ (continued)
| | Principal
Amount | Value |
| Long-Term Municipal Bonds (continued) |
| Florida (continued) |
City of Palmetto, Renaissance Arts and Education, Inc., Revenue Bonds
(continued) | | |
| Series A | | |
| 5.00%, due 6/1/32 | $ 100,000 | $ 105,172 |
| City of Pompano Beach, John Knox Village Projet, Revenue Bonds | | |
| Series B-2 | | |
| 1.45%, due 1/1/27 | 250,000 | 220,001 |
| City of West Palm Beach, Utility System, Revenue Bonds | | |
| Series A | | |
| 5.00%, due 10/1/42 | 2,500,000 | 2,645,594 |
| Cobblestone Community Development District, Assessment Area Two, Special Assessment | | |
| Series 2 | | |
| 3.40%, due 5/1/27 (c) | 160,000 | 153,479 |
| Collier County Educational Facilities Authority, Ave Maria University, Inc., Revenue Bonds | | |
| 5.00%, due 6/1/29 | 1,065,000 | 1,115,165 |
| County of Miami-Dade, Aviation, Revenue Bonds | | |
| Series A | | |
| 5.00%, due 10/1/33 (b) | 6,500,000 | 6,587,566 |
| County of Miami-Dade, Transit System, Revenue Bonds | | |
| 5.00%, due 7/1/43 | 2,300,000 | 2,541,834 |
| County of Pasco, State of Florida Cigarette Tax Revenue, Revenue Bonds | | |
| Series A, Insured: AGM | | |
| 5.50%, due 9/1/37 | 2,040,000 | 2,341,011 |
| Florida Development Finance Corp., Mater Academy Project, Revenue Bonds | | |
| Series A | | |
| 5.00%, due 6/15/31 | 515,000 | 533,230 |
| Fort Pierce Utilities Authority, Revenue Bonds | | |
| Series A, Insured: AGM | | |
| 5.00%, due 10/1/30 | 350,000 | 401,870 |
| Series A, Insured: AGM | | |
| 5.00%, due 10/1/32 | 150,000 | 175,852 |
| Series A, Insured: AGM | | |
| 5.00%, due 10/1/34 | 325,000 | 378,600 |
| | Principal
Amount | Value |
| |
| Florida (continued) |
| Harbor Bay Community Development District, Special Assessment | | |
| Series A-1 | | |
| 3.10%, due 5/1/24 | $ 280,000 | $ 276,500 |
| Series A-2 | | |
| 3.10%, due 5/1/24 | 185,000 | 182,688 |
| Hilltop Point Community Development District, Assessment Area One, Special Assessment | | |
| Series 1 | | |
| 4.60%, due 5/1/27 | 100,000 | 99,280 |
| Hilltop Point Community Development District, Assessment Area Two, Special Assessment | | |
| Series 2 | | |
| 4.75%, due 5/1/27 | 200,000 | 198,994 |
| Laurel Road Community Development District, Special Assessment | | |
| Series A2 | | |
| 3.125%, due 5/1/31 | 235,000 | 207,244 |
| Palm Coast Park Community Development District, Spring Lake Tracts 2 and 3, Special Assessment | | |
| 2.40%, due 5/1/26 | 100,000 | 94,089 |
| Palm Coast Park Community Development District, Sawmill Branch Phase 2, Special Assessment | | |
| 4.15%, due 5/1/27 | 400,000 | 396,731 |
| Pinellas County Industrial Development Authority, Drs Kiran & Pallavi Patel 2017 Foundation for Global Understanding, Inc. Project, Revenue Bonds | | |
| 5.00%, due 7/1/29 | 500,000 | 512,067 |
| Preston Cove Community Development District, Special Assessment | | |
| 3.25%, due 5/1/27 | 170,000 | 162,149 |
| Reunion East Community Development District, Series 2021 Project, Special Assessment | | |
| 2.85%, due 5/1/31 | 100,000 | 86,806 |
| Reunion West Community Development District, Special Assessment | | |
| 3.00%, due 5/1/36 | 100,000 | 81,808 |
| Rolling Hills Community Development District, Special Assessment | | |
| Series A-2 | | |
| 3.65%, due 5/1/32 | 200,000 | 180,898 |
The notes to the financial statements are an integral part of, and should be read in conjunction with, the financial statements.
| 14 | MainStay MacKay Strategic Municipal Allocation Fund |
| | Principal
Amount | Value |
| Long-Term Municipal Bonds (continued) |
| Florida (continued) |
| Seminole Improvement District, Revenue Bonds | | |
| 5.00%, due 10/1/32 | $ 250,000 | $ 250,775 |
| Southshore Bay Community Development District, District Assessment Area One, Special Assessment | | |
| 3.00%, due 5/1/33 (c) | 395,000 | 333,120 |
| Sunbridge Stewardship District, Weslyn Park Project Assessment, Special Assessment | | |
| 4.60%, due 5/1/32 | 460,000 | 448,749 |
| Tampa Bay Water, Revenue Bonds | | |
| 5.00%, due 10/1/40 | 1,580,000 | 1,793,060 |
| Verano No. 3 Community Development District, Special Assessment | | |
| 2.375%, due 5/1/26 | 40,000 | 37,764 |
| Village Community Development District No. 13, Special Assessment | | |
| 2.85%, due 5/1/36 | 1,495,000 | 1,188,015 |
| Watergrass Community Development District II, Special Assessment | | |
| 2.50%, due 5/1/31 | 100,000 | 84,200 |
| Windward at Lakewood Ranch Community Development District, Phase 2 Project, Special Assessment | | |
| 3.625%, due 5/1/32 | 135,000 | 122,238 |
| Wiregrass II Community Development District, Assessment Area Two, Special Assessment | | |
| 4.80%, due 5/1/32 | 100,000 | 98,751 |
| | | 24,957,632 |
| Georgia 3.1% |
| Atlanta Urban Redevelopment Agency, Atlanta BeltLine Special Service District, Revenue Bonds | | |
| Insured: BAM | | |
| 2.875%, due 7/1/31 (c) | 500,000 | 468,537 |
| City of Atlanta, Department of Aviation, Revenue Bonds | | |
| Series B | | |
| 5.00%, due 7/1/34 (b) | 450,000 | 507,827 |
| DeKalb Private Hospital Authority, Children's Healthcare of Atlanta, Revenue Bonds | | |
| Series B | | |
| 4.00%, due 7/1/38 | 820,000 | 832,359 |
| | Principal
Amount | Value |
| |
| Georgia (continued) |
| Main Street Natural Gas, Inc., Revenue Bonds (a) | | |
| Series A | | |
| 4.00%, due 4/1/48 | $ 4,750,000 | $ 4,753,686 |
| Series B | | |
| 4.00%, due 8/1/49 | 2,000,000 | 2,010,159 |
| Municipal Electric Authority of Georgia, Revenue Bonds | | |
| Series A | | |
| 5.00%, due 1/1/38 | 500,000 | 527,597 |
| Walton County Water & Sewer Authority, Walton-Hard Labor Creek Reservoir Water Treatment Facility Project, Revenue Bonds | | |
| 5.25%, due 2/1/47 | 1,700,000 | 1,925,430 |
| | | 11,025,595 |
| Guam 1.4% |
| Guam Government Waterworks Authority, Water and Wastewater System, Revenue Bonds | | |
| 5.25%, due 7/1/24 | 590,000 | 591,093 |
| Guam Power Authority, Revenue Bonds | | |
| Series A | | |
| 5.00%, due 10/1/34 | 500,000 | 546,359 |
| Territory of Guam, Business Privilege Tax, Revenue Bonds | | |
| Series F | | |
| 4.00%, due 1/1/36 | 400,000 | 390,013 |
| Series D | | |
| 5.00%, due 11/15/27 | 365,000 | 373,691 |
| Territory of Guam, Revenue Bonds | | |
| Series F | | |
| 4.00%, due 1/1/42 | 335,000 | 301,737 |
| Territory of Guam, Section 30, Revenue Bonds | | |
| Series A | | |
| 5.00%, due 12/1/32 | 1,000,000 | 1,037,819 |
| Series A | | |
| 5.00%, due 12/1/34 | 1,750,000 | 1,806,175 |
| | | 5,046,887 |
| Hawaii 0.0% ‡ |
| Kauai County Community Facilities District, Kukui'ula Development Project, Special Tax | | |
| 4.00%, due 5/15/26 | 80,000 | 79,547 |
The notes to the financial statements are an integral part of, and should be read in conjunction with, the financial statements.
15
Portfolio of Investments April 30, 2023†^ (continued)
| | Principal
Amount | Value |
| Long-Term Municipal Bonds (continued) |
| Idaho 0.1% |
| Idaho Health Facilities Authority, Madison Memorial Hospital, Revenue Bonds | | |
| 5.00%, due 9/1/37 | $ 370,000 | $ 372,392 |
| Illinois 8.4% |
| Chicago Board of Education, Unlimited General Obligation | | |
| Series B | | |
| 5.00%, due 12/1/31 | 1,000,000 | 1,049,459 |
| Series A | | |
| 5.00%, due 12/1/33 | 500,000 | 523,291 |
| Series B | | |
| 5.00%, due 12/1/33 | 500,000 | 501,192 |
| Series A | | |
| 5.00%, due 12/1/37 | 1,085,000 | 1,108,001 |
| Series C | | |
| 5.25%, due 12/1/39 | 1,000,000 | 1,005,611 |
| Chicago Board of Education, Dedicated Capital Improvement, Revenue Bonds | | |
| 6.00%, due 4/1/46 | 1,000,000 | 1,051,405 |
| Chicago O'Hare International Airport, General, Revenue Bonds, Senior Lien | | |
| Series D | | |
| 5.00%, due 1/1/36 | 1,000,000 | 1,138,739 |
| Series D | | |
| 5.00%, due 1/1/37 | 1,000,000 | 1,124,743 |
| Series B | | |
| 5.00%, due 1/1/39 | 1,350,000 | 1,452,417 |
| City of Chicago, Unlimited General Obligation | | |
| Series A | | |
| 4.00%, due 1/1/36 | 500,000 | 482,716 |
| Series A | | |
| 5.00%, due 1/1/32 | 1,500,000 | 1,623,895 |
| Series A | | |
| 6.00%, due 1/1/38 | 2,500,000 | 2,662,536 |
| City of Chicago, Wastewater Transmission Project, Revenue Bonds, Second Lien | | |
| Series A, Insured: AGM | | |
| 5.25%, due 1/1/42 | 450,000 | 465,530 |
| City of Joliet, Rock Run Crossing Project, Unlimited General Obligation | | |
| Insured: BAM | | |
| 5.50%, due 12/15/42 | 2,000,000 | 2,271,429 |
| | Principal
Amount | Value |
| |
| Illinois (continued) |
| Illinois Finance Authority, Washington and Jane Smith Home (The), Revenue Bonds | | |
| 4.00%, due 10/15/23 | $ 205,000 | $ 204,174 |
| 4.00%, due 10/15/24 | 215,000 | 211,871 |
| Illinois Finance Authority, Acero Charter Schools, Inc., Revenue Bonds | | |
| 4.00%, due 10/1/33 (c) | 250,000 | 227,606 |
| Illinois Finance Authority, Carle Foundation, Revenue Bonds | | |
| Series A | | |
| 5.00%, due 8/15/33 | 250,000 | 287,001 |
| Illinois Municipal Electric Agency, Revenue Bonds | | |
| Series A | | |
| 4.00%, due 2/1/34 | 1,500,000 | 1,518,906 |
| Illinois Sports Facilities Authority (The), Revenue Bonds | | |
| 5.00%, due 6/15/30 | 1,000,000 | 1,025,949 |
| Illinois State Toll Highway Authority, Revenue Bonds, Senior Lien | | |
| Series B | | |
| 5.00%, due 1/1/37 | 400,000 | 404,227 |
| Lake County Consolidated High School District No. 120 Mundelein, Limited General Obligation | | |
| Series A | | |
| 5.50%, due 12/1/38 | 825,000 | 931,532 |
| Metropolitan Pier & Exposition Authority, McCormick Place Expansion Project, Revenue Bonds | | |
| Series B, Insured: NATL-RE | | |
| 5.70%, due 6/15/23 | 820,000 | 821,453 |
| Sales Tax Securitization Corp., Revenue Bonds, Second Lien | | |
| Series A, Insured: BAM | | |
| 5.00%, due 1/1/37 | 1,285,000 | 1,393,851 |
| Sangamon & Morgan Counties Community Unit School District No. 16 New Berlin, Unlimited General Obligation | | |
| Series A, Insured: AGM | | |
| 5.50%, due 12/1/36 | 350,000 | 402,058 |
| State of Illinois, Unlimited General Obligation | | |
| Series A | | |
| 5.00%, due 12/1/26 | 500,000 | 528,340 |
The notes to the financial statements are an integral part of, and should be read in conjunction with, the financial statements.
| 16 | MainStay MacKay Strategic Municipal Allocation Fund |
| | Principal
Amount | Value |
| Long-Term Municipal Bonds (continued) |
| Illinois (continued) |
| State of Illinois, Unlimited General Obligation (continued) | | |
| Series D | | |
| 5.00%, due 11/1/28 | $ 1,000,000 | $ 1,073,966 |
| 5.00%, due 2/1/39 | 1,370,000 | 1,376,176 |
| 5.50%, due 5/1/39 | 500,000 | 547,661 |
| Village of Mundelein, Unlimited General Obligation | | |
| Insured: AGM | | |
| 4.00%, due 12/15/39 | 250,000 | 252,825 |
| Will County School District No. 114, Manhattan, Unlimited General Obligation | | |
| Insured: BAM | | |
| 5.25%, due 1/1/39 | 175,000 | 197,767 |
| Insured: BAM | | |
| 5.50%, due 1/1/43 | 1,825,000 | 2,075,509 |
| | | 29,941,836 |
| Indiana 1.9% |
| Center Grove Community School Corp., Limited General Obligation | | |
| Insured: State Intercept | | |
| 5.00%, due 1/1/24 | 1,500,000 | 1,510,871 |
| City of Bloomington, Waterworks, Revenue Bonds | | |
| Insured: BAM | | |
| 5.00%, due 7/1/30 | 225,000 | 259,227 |
| Insured: BAM | | |
| 5.00%, due 7/1/31 | 250,000 | 287,085 |
| Insured: BAM | | |
| 5.00%, due 7/1/32 | 300,000 | 344,229 |
| Insured: BAM | | |
| 5.00%, due 7/1/36 | 1,495,000 | 1,678,467 |
| Indiana Finance Authority, Indianapolis Power & Light Co., Revenue Bonds | | |
| Series A | | |
| 1.40%, due 8/1/29 (a) | 250,000 | 220,751 |
| Indiana Finance Authority, CWA Authority, Inc., Revenue Bonds | | |
| Series A | | |
| 5.00%, due 10/1/41 | 1,000,000 | 1,045,875 |
| | Principal
Amount | Value |
| |
| Indiana (continued) |
| Indiana Housing & Community Development Authority, Revenue Bonds | | |
| Insured: FHA 223(F) | | |
| 5.00%, due 10/1/26 (a) | $ 1,500,000 | $ 1,537,621 |
| | | 6,884,126 |
| Kentucky 1.2% |
| Kentucky Bond Development Corp., Revenue Bonds | | |
| Insured: BAM | | |
| 5.00%, due 9/1/38 | 1,000,000 | 1,098,455 |
| Kentucky Economic Development Finance Authority, Next Generation Information Highway Project, Revenue Bonds, Senior Lien | | |
| Series A | | |
| 5.00%, due 1/1/45 | 535,000 | 529,529 |
| Kentucky Public Energy Authority, Gas Supply, Revenue Bonds | | |
| Series C | | |
| 4.00%, due 2/1/50 (a) | 2,600,000 | 2,603,833 |
| | | 4,231,817 |
| Louisiana 2.1% |
| Jefferson Parish Consolidated Sewerage District No. 1, Revenue Bonds | | |
| Insured: BAM | | |
| 4.00%, due 2/1/42 | 260,000 | 257,898 |
| State of Louisiana, Unlimited General Obligation | | |
| Series A | | |
| 5.00%, due 3/1/38 | 390,000 | 441,925 |
| State of Louisiana, Gasoline & Fuels Tax, Revenue Bonds, Second Lien | | |
| 5.00%, due 5/1/40 | 6,250,000 | 6,631,654 |
| | | 7,331,477 |
| Maine 0.3% |
| Maine Health & Higher Educational Facilities Authority, Northern Light Health Obligated Group, Revenue Bonds | | |
| Series C, Insured: AGM State Aid Withholding | | |
| 5.50%, due 7/1/38 | 1,000,000 | 1,143,500 |
The notes to the financial statements are an integral part of, and should be read in conjunction with, the financial statements.
17
Portfolio of Investments April 30, 2023†^ (continued)
| | Principal
Amount | Value |
| Long-Term Municipal Bonds (continued) |
| Maryland 0.5% |
| City of Baltimore, Harbor Point Project, Revenue Bonds | | |
| 4.50%, due 6/1/33 | $ 100,000 | $ 98,406 |
| Maryland Community Development Administration, Revenue Bonds | | |
| Series A, Insured: GNMA / FNMA / FHLMC | | |
| 5.00%, due 9/1/42 | 1,000,000 | 1,039,208 |
| Maryland Economic Development Corp., Morgan View & Thurgood Marshall Student Housing, Revenue Bonds | | |
| Series A | | |
| 5.25%, due 7/1/32 | 465,000 | 514,088 |
| State of Maryland, Unlimited General Obligation | | |
| Series A | | |
| 5.00%, due 3/15/32 | 225,000 | 261,592 |
| | | 1,913,294 |
| Massachusetts 1.0% |
| Commonwealth of Massachusetts, COVID-19 Recovery Assessment, Revenue Bonds | | |
| Series A | | |
| 3.564%, due 7/15/23 | 2,000,000 | 1,994,801 |
| Massachusetts Development Finance Agency, Provident Commonwealth Education Resources, Inc., Revenue Bonds | | |
| 5.00%, due 10/1/30 | 1,200,000 | 1,225,595 |
| 5.00%, due 10/1/34 | 500,000 | 507,821 |
| | | 3,728,217 |
| Michigan 2.0% |
| Calhoun County Hospital Finance Authority, Oaklawn Hospital, Revenue Bonds | | |
| 5.00%, due 2/15/28 | 240,000 | 249,773 |
| City of Detroit, Unlimited General Obligation | | |
| 5.00%, due 4/1/34 | 275,000 | 289,215 |
| Great Lakes Water Authority, Sewage Disposal System, Revenue Bonds, Second Lien | | |
| Series C | | |
| 5.00%, due 7/1/36 | 1,000,000 | 1,051,019 |
| | Principal
Amount | Value |
| |
| Michigan (continued) |
| Michigan Finance Authority, Tobacco Settlement Asset-Backed, Revenue Bonds, Senior Lien | | |
| Series A, Class 1 | | |
| 4.00%, due 6/1/34 | $ 500,000 | $ 509,724 |
| Michigan Finance Authority, BHSH System Obligated Group, Revenue Bonds | | |
| 5.00%, due 4/15/29 | 1,000,000 | 1,122,273 |
| Michigan Finance Authority, Public Lighting Authority Local Project, Revenue Bonds | | |
| 5.00%, due 7/1/31 | 100,000 | 101,158 |
| Michigan Finance Authority, Beaumont Health Obligated Group, Revenue Bonds | | |
| 5.00%, due 11/1/44 | 1,000,000 | 1,016,905 |
| Michigan Finance Authority, Universal Learning Academy, Revenue Bonds | | |
| 6.00%, due 11/1/32 | 500,000 | 516,743 |
| Richmond Community Schools, School Building and Site, Unlimited General Obligation | | |
| Series I, Insured: Q-SBLF | | |
| 4.00%, due 5/1/36 | 750,000 | 781,816 |
| State of Michigan, Unlimited General Obligation | | |
| Series A | | |
| 3.625%, due 5/15/24 | 1,000,000 | 985,038 |
| Summit Academy North, Michigan Public School Academy, Revenue Bonds | | |
| 2.25%, due 11/1/26 | 205,000 | 187,671 |
| Wyoming Public Schools, Unlimited General Obligation | | |
| Series III, Insured: AGM | | |
| 4.00%, due 5/1/41 | 500,000 | 497,825 |
| | | 7,309,160 |
| Minnesota 0.1% |
| City of Independence, Global Academy Project, Revenue Bonds | | |
| Series A | | |
| 4.00%, due 7/1/41 | 280,000 | 227,549 |
The notes to the financial statements are an integral part of, and should be read in conjunction with, the financial statements.
| 18 | MainStay MacKay Strategic Municipal Allocation Fund |
| | Principal
Amount | Value |
| Long-Term Municipal Bonds (continued) |
| Mississippi 0.2% |
| Mississippi Hospital Equipment & Facilities Authority, Forrest County General Hospital Project, Revenue Bonds | | |
| 5.00%, due 1/1/34 | $ 810,000 | $ 884,087 |
| Missouri 0.9% |
| Hickman Mills C-1 School District, Unlimited General Obligation | | |
| Series C-1, Insured: BAM | | |
| 5.75%, due 3/1/42 | 2,000,000 | 2,271,798 |
| Wright City R-II School District, Unlimited General Obligation | | |
| Insured: AGM | | |
| 6.00%, due 3/1/30 | 350,000 | 421,255 |
| Insured: AGM | | |
| 6.00%, due 3/1/32 | 415,000 | 520,997 |
| | | 3,214,050 |
| Montana 0.2% |
| County of Gallatin, Bozeman Fiber Project, Revenue Bonds (c) | | |
| Series A | | |
| 4.00%, due 10/15/32 | 300,000 | 280,933 |
| Series A | | |
| 4.00%, due 10/15/36 | 300,000 | 265,099 |
| | | 546,032 |
| Nebraska 0.9% |
| Central Plains Energy, Nebraska Gas Project No. 4, Revenue Bonds | | |
| Series A | | |
| 5.00%, due 3/1/50 (a) | 1,500,000 | 1,511,078 |
| Omaha Public Power District Nebraska City Station Unit 2, Revenue Bonds | | |
| Series A | | |
| 5.25%, due 2/1/42 | 1,500,000 | 1,532,635 |
| | | 3,043,713 |
| New Hampshire 0.1% |
| New Hampshire Business Finance Authority, Pennichuck Water Works, Inc. Project, Revenue Bonds | | |
| Series A | | |
| 4.00%, due 4/1/30 (b) | 495,000 | 508,347 |
| | Principal
Amount | Value |
| |
| New Jersey 3.9% |
| Essex County Improvement Authority, North Star Academy Charter School of Newark, Inc., Revenue Bonds | | |
| 4.00%, due 7/15/30 (c) | $ 250,000 | $ 251,173 |
| New Jersey Economic Development Authority, Revenue Bonds | | |
| Series A | | |
| 4.914%, due 3/1/24 | 1,000,000 | 996,021 |
| New Jersey Economic Development Authority, School Facilities Construction, Revenue Bonds | | |
| Series UU | | |
| 5.00%, due 6/15/40 | 470,000 | 479,809 |
| Series WW | | |
| 5.25%, due 6/15/33 | 2,500,000 | 2,628,321 |
| New Jersey Economic Development Authority, New Jersey Transit Transportation Project, Revenue Bonds | | |
| 5.00%, due 11/1/44 | 3,000,000 | 3,168,581 |
| New Jersey Economic Development Authority, Continental Airlines, Inc. Project, Revenue Bonds | | |
| Series B | | |
| 5.625%, due 11/15/30 (b) | 250,000 | 253,726 |
| New Jersey Housing & Mortgage Finance Agency, Amity Heights Apartments, Revenue Bonds | | |
| Series A, Insured: HUD Sector 8 | | |
| 3.50%, due 7/1/25 (a) | 2,000,000 | 1,987,076 |
| New Jersey Transportation Trust Fund Authority, Revenue Bonds | | |
| Series CC | | |
| 5.25%, due 6/15/32 | 2,000,000 | 2,334,093 |
| New Jersey Turnpike Authority, Revenue Bonds | | |
| Series B | | |
| 5.00%, due 1/1/42 | 1,000,000 | 1,120,156 |
| State of New Jersey, Unlimited General Obligation | | |
| 5.00%, due 6/1/39 | 500,000 | 547,408 |
| | | 13,766,364 |
| New Mexico 0.2% |
| New Mexico Hospital Equipment Loan Council, La Vida Expansion Project, Revenue Bonds | | |
| Series C | | |
| 2.25%, due 7/1/23 | 555,000 | 551,951 |
The notes to the financial statements are an integral part of, and should be read in conjunction with, the financial statements.
19
Portfolio of Investments April 30, 2023†^ (continued)
| | Principal
Amount | Value |
| Long-Term Municipal Bonds (continued) |
| New York 9.2% |
| Albany Capital Resource Corp., Albany Leadership Charter High School For Girls Project, Revenue Bonds | | |
| 4.00%, due 6/1/29 | $ 360,000 | $ 342,037 |
| Build NYC Resource Corp., New York Law School, Revenue Bonds | | |
| 5.00%, due 7/1/23 | 500,000 | 500,350 |
| City of New York, Unlimited General Obligation | | |
| Series F-1 | | |
| 5.00%, due 6/1/35 | 1,000,000 | 1,037,581 |
| Series B-1 | | |
| 5.25%, due 10/1/47 | 1,500,000 | 1,685,369 |
| County of Nassau, Limited General Obligation | | |
| Series A, Insured: AGM-CR | | |
| 5.00%, due 1/1/26 | 1,000,000 | 1,062,340 |
| Hudson Yards Infrastructure Corp., Second Indenture, Revenue Bonds | | |
| Series A, Insured: AGM | | |
| 4.00%, due 2/15/47 | 540,000 | 528,272 |
| Long Island Power Authority, Electric System, Revenue Bonds | | |
| Series A | | |
| 5.00%, due 9/1/39 | 1,000,000 | 1,013,289 |
| Metropolitan Transportation Authority, Green Bond, Revenue Bonds | | |
| Series A1 | | |
| 5.00%, due 11/15/29 | 500,000 | 518,925 |
| Series A-1 | | |
| 5.00%, due 11/15/32 | 1,295,000 | 1,338,889 |
| Metropolitan Transportation Authority, Dedicated Tax Fund, Revenue Bonds | | |
| Series B-1 | | |
| 5.00%, due 11/15/36 | 3,000,000 | 3,175,264 |
| Metropolitan Transportation Authority, Revenue Bonds | | |
| Series C | | |
| 5.00%, due 11/15/38 | 250,000 | 250,472 |
| Series C | | |
| 5.00%, due 11/15/42 | 500,000 | 500,943 |
| New York City Municipal Water Finance Authority, Water & Sewer System Second General Resolution, Revenue Bonds | | |
| 5.00%, due 6/15/39 | 1,000,000 | 1,030,285 |
| 5.00%, due 6/15/49 | 305,000 | 323,842 |
| | Principal
Amount | Value |
| |
| New York (continued) |
| New York City Transitional Finance Authority, Future Tax Secured, Revenue Bonds | | |
| Series F-1 | | |
| 5.00%, due 5/1/42 | $ 750,000 | $ 794,448 |
| New York Liberty Development Corp., Bank of America Tower at One Bryant Park Project, Revenue Bonds | | |
| 2.45%, due 9/15/69 | 500,000 | 452,303 |
| New York Liberty Development Corp., Green Bond, Revenue Bonds | | |
| Series A, Insured: AGM-CR | | |
| 2.75%, due 11/15/41 | 370,000 | 288,212 |
| New York Liberty Development Corp., 1 World Trade Center, Revenue Bonds | | |
| Insured: BAM | | |
| 4.00%, due 2/15/43 | 1,500,000 | 1,485,473 |
| New York Liberty Development Corp., 3 World Trade Center LLC, Revenue Bonds | | |
| Class 1 | | |
| 5.00%, due 11/15/44 (c) | 1,250,000 | 1,214,657 |
| New York State Dormitory Authority, State Personal Income Tax, Revenue Bonds | | |
| Series E | | |
| 3.00%, due 3/15/41 | 250,000 | 210,742 |
| Series E | | |
| 4.00%, due 3/15/45 | 1,950,000 | 1,925,283 |
| New York State Dormitory Authority, Personal Income Tax, Revenue Bonds | | |
| Series C | | |
| 5.00%, due 3/15/41 | 750,000 | 758,464 |
| New York State Dormitory Authority, Sales tax, Revenue Bonds | | |
| Series E-3 | | |
| 5.00%, due 3/15/41 | 1,500,000 | 1,620,044 |
| New York State Thruway Authority, Revenue Bonds, Junior Lien | | |
| Series A | | |
| 5.00%, due 1/1/41 | 1,000,000 | 1,035,657 |
| New York State Urban Development Corp., Personal Income Tax, Revenue Bonds | | |
| Series A | | |
| 4.00%, due 3/15/38 | 250,000 | 253,446 |
The notes to the financial statements are an integral part of, and should be read in conjunction with, the financial statements.
| 20 | MainStay MacKay Strategic Municipal Allocation Fund |
| | Principal
Amount | Value |
| Long-Term Municipal Bonds (continued) |
| New York (continued) |
| New York Transportation Development Corp., John F. kennedy International Airport Project, Revenue Bonds | | |
| 5.00%, due 12/1/25 (b) | $ 1,400,000 | $ 1,439,666 |
| New York Transportation Development Corp., LaGuardia Airport Terminal B Redevelopment Project, Revenue Bonds | | |
| 5.00%, due 7/1/46 (b) | 3,000,000 | 2,980,680 |
| Port Authority of New York & New Jersey, Consolidated 218th, Revenue Bonds | | |
| Series 218 | | |
| 4.00%, due 11/1/37 (b) | 380,000 | 378,442 |
| Port Authority of New York & New Jersey, Consolidated 234th, Revenue Bonds | | |
| Series 234 | | |
| 5.00%, due 8/1/38 (b) | 3,500,000 | 3,840,926 |
| Triborough Bridge & Tunnel Authority, Payroll Mobility Tax, Revenue Bonds, Senior Lien | | |
| Series A-2, Insured: AGM-CR | | |
| 2.00%, due 5/15/45 (a) | 250,000 | 231,573 |
| Triborough Bridge & Tunnel Authority, MTA Bridges & Tunnels, Revenue Bonds | | |
| Series B-3 | | |
| 5.00%, due 11/15/38 | 640,000 | 666,235 |
| | | 32,884,109 |
| North Carolina 1.2% |
| Greater Asheville Regional Airport Authority, Revenue Bonds | | |
| Series A, Insured: AGM | | |
| 5.00%, due 7/1/30 (b) | 1,500,000 | 1,648,012 |
| Insured: AGM | | |
| 5.25%, due 7/1/40 | 500,000 | 548,105 |
| Insured: AGM | | |
| 5.25%, due 7/1/43 | 500,000 | 541,640 |
| North Carolina Turnpike Authority, Triangle Expressway System, Revenue Bonds, Senior Lien | | |
| Insured: AGM | | |
| 5.00%, due 1/1/36 | 1,545,000 | 1,664,165 |
| | | 4,401,922 |
| | Principal
Amount | Value |
| |
| North Dakota 0.1% |
| City of Grand Forks, Altru Health System, Revenue Bonds | | |
| 4.00%, due 12/1/37 | $ 310,000 | $ 285,002 |
| Ohio 2.6% |
| American Municipal Power, Inc., Hydroelectric Projects, Revenue Bonds | | |
| Series A | | |
| 5.00%, due 2/15/41 | 3,000,000 | 3,075,489 |
| City of Toledo, Various Purpose Improvement, Limited General Obligation | | |
| Insured: AGM | | |
| 5.25%, due 12/1/35 | 1,000,000 | 1,159,556 |
| Insured: AGM | | |
| 5.25%, due 12/1/37 | 750,000 | 854,480 |
| City of Upper Arlington, Various Purpose, Limited General Obligation | | |
| 5.75%, due 12/1/38 | 700,000 | 742,337 |
| Cloverleaf Local School District, Certificate of Participation | | |
| Insured: BAM | | |
| 5.375%, due 12/1/37 | 750,000 | 817,384 |
| Euclid City School District, Unlimited General Obligation | | |
| Series A, Insured: SD CRED PROG | | |
| 5.25%, due 1/15/44 | 2,000,000 | 2,062,455 |
| Forest Hills Local School District, Unlimited General Obligation | | |
| 5.00%, due 12/1/44 | 490,000 | 496,851 |
| Ohio Air Quality Development Authority, Ohio Valley Electric Corp. Project, Revenue Bonds | | |
| 2.875%, due 2/1/26 | 250,000 | 236,568 |
| | | 9,445,120 |
| Oregon 0.3% |
| State of Oregon, Unlimited General Obligation | | |
| Series F | | |
| 5.00%, due 5/1/35 | 1,195,000 | 1,234,856 |
| Pennsylvania 3.3% |
| Allentown Neighborhood Improvement Zone Development Authority, Revenue Bonds | | |
| 6.00%, due 5/1/42 (c) | 500,000 | 510,169 |
The notes to the financial statements are an integral part of, and should be read in conjunction with, the financial statements.
21
Portfolio of Investments April 30, 2023†^ (continued)
| | Principal
Amount | Value |
| Long-Term Municipal Bonds (continued) |
| Pennsylvania (continued) |
| Bucks County Industrial Development Authority, Grand View Hospital Project, Revenue Bonds | | |
| 5.00%, due 7/1/34 | $ 300,000 | $ 292,255 |
| 5.00%, due 7/1/35 | 300,000 | 290,643 |
| Chester County Industrial Development Authority, Collegium Charter School, Revenue Bonds | | |
| 5.00%, due 10/15/32 (c) | 250,000 | 246,296 |
| Dauphin County General Authority, Harrisburg University Science Technology Project (The), Revenue Bonds (c) | | |
| 4.25%, due 10/15/26 | 100,000 | 96,846 |
| 5.00%, due 10/15/30 | 1,000,000 | 976,293 |
| Indiana County Industrial Development Authority, Foundation for Indiana University of Pennsylvania (The), Revenue Bonds | | |
| Insured: BAM | | |
| 5.00%, due 5/1/29 | 250,000 | 273,294 |
| Lancaster Industrial Development Authority, Landis Homes Retirement Community, Revenue Bonds | | |
| 4.00%, due 7/1/37 | 100,000 | 84,577 |
| Pennsylvania Economic Development Financing Authority, Penndot Major Bridges Project, Revenue Bonds (b) | | |
| 5.25%, due 6/30/35 | 1,800,000 | 2,000,893 |
| 5.50%, due 6/30/37 | 250,000 | 278,406 |
| 5.50%, due 6/30/38 | 500,000 | 554,529 |
| Pennsylvania Housing Finance Agency, Revenue Bonds | | |
| Series A-141 | | |
| 5.75%, due 10/1/53 | 660,000 | 713,388 |
| Pennsylvania Turnpike Commission, Revenue Bonds | | |
| Series B | | |
| 4.00%, due 12/1/42 | 250,000 | 245,602 |
| Series A-1 | | |
| 5.00%, due 12/1/41 | 1,000,000 | 1,040,808 |
| Series A | | |
| 5.50%, due 12/1/46 | 1,155,000 | 1,209,202 |
| | Principal
Amount | Value |
| |
| Pennsylvania (continued) |
| Philadelphia Authority for Industrial Development, Philadelphia Performing Arts Charter School Project, Revenue Bonds | | |
| 5.00%, due 6/15/30 (c) | $ 435,000 | $ 452,080 |
| Pittsburgh Water & Sewer Authority, Revenue Bonds, First Lien | | |
| Series A, Insured: AGM | | |
| 5.00%, due 9/1/35 | 1,200,000 | 1,375,454 |
| West Shore School District, Limited General Obligation | | |
| Insured: State Aid Withholding | | |
| 5.00%, due 11/15/43 | 1,000,000 | 1,047,940 |
| | | 11,688,675 |
| Puerto Rico 1.3% |
| Commonwealth of Puerto Rico | | |
| (zero coupon), due 11/1/43 | 98,097 | 46,228 |
| Commonwealth of Puerto Rico, Unlimited General Obligation | | |
| Series A-1 | | |
| 4.00%, due 7/1/35 | 518,717 | 465,261 |
| Series A-1 | | |
| 5.625%, due 7/1/27 | 625,000 | 652,109 |
| Series A-1 | | |
| 5.75%, due 7/1/31 | 265,000 | 284,224 |
| Puerto Rico Commonwealth Aqueduct & Sewer Authority, Revenue Bonds | | |
| Series B | | |
| 5.00%, due 7/1/28 (c) | 1,000,000 | 1,017,219 |
| Puerto Rico Commonwealth Aqueduct & Sewer Authority, Revenue Bonds, Senior Lien | | |
| Series A | | |
| 5.00%, due 7/1/33 (c) | 1,000,000 | 1,003,456 |
| Puerto Rico Housing Finance Authority, El Mirador LLC, Revenue Bonds | | |
| Series B, Insured: HUD Sector 8 | | |
| 5.00%, due 3/1/27 (a) | 750,000 | 785,228 |
| Puerto Rico Sales Tax Financing Corp., Revenue Bonds | | |
| Series A-2 | | |
| 4.329%, due 7/1/40 | 500,000 | 466,154 |
| | | 4,719,879 |
The notes to the financial statements are an integral part of, and should be read in conjunction with, the financial statements.
| 22 | MainStay MacKay Strategic Municipal Allocation Fund |
| | Principal
Amount | Value |
| Long-Term Municipal Bonds (continued) |
| Rhode Island 0.6% |
| Rhode Island Health and Educational Building Corp., Public Schools Financing Program, Revenue Bonds | | |
| Series F | | |
| 5.50%, due 5/15/47 | $ 1,500,000 | $ 1,679,564 |
| Rhode Island Housing and Mortgage Finance Corp., Revenue Bonds | | |
| Series 77A | | |
| 5.00%, due 4/1/27 | 555,000 | 594,504 |
| | | 2,274,068 |
| South Carolina 0.6% |
| City of Spartanburg, Water System, Revenue Bonds | | |
| Series A | | |
| 5.00%, due 12/1/34 | 1,000,000 | 1,052,917 |
| Greenville Housing Authority, Gordon Street Affordable LP, Revenue Bonds | | |
| Insured: FHA 221(D4) | | |
| 5.00%, due 10/1/26 (a) | 1,000,000 | 1,029,498 |
| | | 2,082,415 |
| South Dakota 0.2% |
| Baltic School District No. 49-1, Unlimited General Obligation | | |
| Insured: AGM | | |
| 4.50%, due 12/1/40 | 575,000 | 599,535 |
| Tennessee 1.9% |
| Health Educational and Housing Facility Board of the City of Memphis (The), Strategies LP, Revenue Bonds | | |
| Insured: HUD Sector 8 FHA 221(D4) | | |
| 5.00%, due 7/1/27 (a) | 500,000 | 518,880 |
| Health Educational and Housing Facility Board of the City of Memphis (The), Strategies II LP, Revenue Bonds | | |
| Insured: HUD Sector 8 FHA 221(D4) | | |
| 5.00%, due 7/1/27 (a) | 500,000 | 519,031 |
| Metropolitan Government Nashville & Davidson County Health & Educational Facilities Board, 619 at Old Stone Bridge Crossings LP, Revenue Bonds | | |
| Series B | | |
| 4.00%, due 4/1/26 (a) | 1,511,000 | 1,518,839 |
| | Principal
Amount | Value |
| |
| Tennessee (continued) |
| Metropolitan Nashville Airport Authority (The), Revenue Bonds | | |
| Series B | | |
| 5.00%, due 7/1/36 (b) | $ 3,500,000 | $ 3,766,201 |
| Tennessee Energy Acquisition Corp., Revenue Bonds | | |
| Series B | | |
| 5.625%, due 9/1/26 | 500,000 | 518,896 |
| | | 6,841,847 |
| Texas 9.8% |
| Alamito Public Facility Corp., EP WH Mesa Franklin LLC, Revenue Bonds | | |
| Insured: FHA 221(D4) | | |
| 3.50%, due 9/1/25 (a) | 1,003,000 | 996,903 |
| Alamito Public Facility Corp., EP WH Cien Palmas LLC, Revenue Bonds | | |
| Insured: HUD Sector 8 FHA 221(D4) | | |
| 3.50%, due 9/1/25 (a) | 1,008,000 | 1,001,873 |
| Allen Independent School District, Unlimited General Obligation | | |
| Insured: PSF-GTD | | |
| 5.00%, due 2/15/35 | 2,000,000 | 2,105,857 |
| Barbers Hill Independent School District, Unlimited General Obligation | | |
| Insured: PSF-GTD | | |
| 4.00%, due 2/15/41 | 1,000,000 | 1,004,957 |
| Belmont Fresh Water Supply District No. 1, Unlimited General Obligation | | |
| Insured: BAM | | |
| 5.00%, due 3/1/30 | 440,000 | 482,325 |
| Central Texas Regional Mobility Authority, Revenue Bonds | | |
| (zero coupon), due 1/1/27 | 1,900,000 | 1,666,092 |
| City of Arlington, Special Tax, Special Tax, Senior Lien | | |
| Series A, Insured: AGM | | |
| 5.00%, due 2/15/43 | 250,000 | 262,670 |
| City of Georgetown, Utility System, Revenue Bonds | | |
| Insured: AGM | | |
| 5.00%, due 8/15/28 | 1,035,000 | 1,148,336 |
| City of Houston, Hotel Occupancy Tax & Special Tax, Revenue Bonds | | |
| 5.00%, due 9/1/28 | 365,000 | 402,476 |
| County of Parker, Unlimited General Obligation | | |
| 5.00%, due 2/15/42 | 6,000,000 | 6,276,835 |
The notes to the financial statements are an integral part of, and should be read in conjunction with, the financial statements.
23
Portfolio of Investments April 30, 2023†^ (continued)
| | Principal
Amount | Value |
| Long-Term Municipal Bonds (continued) |
| Texas (continued) |
| Dallas Fort Worth International Airport, Revenue Bonds | | |
| Series A | | |
| 4.00%, due 11/1/46 | $ 250,000 | $ 244,885 |
| Series B | | |
| 5.00%, due 11/1/36 | 1,000,000 | 1,144,726 |
| Dallas Independent School District, Unlimited General Obligation | | |
| Insured: PSF-GTD | | |
| 5.00%, due 2/15/48 | 845,000 | 931,575 |
| Forney Independent School District, Unlimited General Obligation | | |
| Insured: BAM | | |
| (zero coupon), due 8/15/41 | 255,000 | 83,120 |
| Harris County Municipal Utility District No. 423, Unlimited General Obligation | | |
| Series A, Insured: BAM | | |
| 7.25%, due 4/1/26 | 300,000 | 332,779 |
| Series A, Insured: BAM | | |
| 7.25%, due 4/1/27 | 300,000 | 344,401 |
| Harris County Toll Road, Revenue Bonds, Senior Lien | | |
| 5.00%, due 8/15/43 | 2,290,000 | 2,421,451 |
| Houston Higher Education Finance Corp., KIPP, Inc., Revenue Bonds | | |
| Series A, Insured: PSF-GTD | | |
| 4.00%, due 2/15/39 | 1,000,000 | 974,824 |
| Midlothian Independent School District, Unlimited General Obligation | | |
| Insured: PSF-GTD | | |
| 5.00%, due 2/15/43 | 3,460,000 | 3,644,913 |
| New Hope Cultural Education Facilities Finance Corp., Jubilee Academic Center, Inc., Revenue Bonds | | |
| 4.00%, due 8/15/29 (c) | 795,000 | 749,239 |
| New Hope Cultural Education Facilities Finance Corp., Outlook at Windhaven Forefront Living, Revenue Bonds | | |
| Series B-3 | | |
| 4.25%, due 10/1/26 | 1,100,000 | 1,081,117 |
| North Texas Tollway Authority, Revenue Bonds | | |
| Series B | | |
| 5.00%, due 1/1/45 | 1,000,000 | 1,018,344 |
| | Principal
Amount | Value |
| |
| Texas (continued) |
| North Texas Tollway Authority, Revenue Bonds, First Tier | | |
| Series A | | |
| 5.25%, due 1/1/38 | $ 1,000,000 | $ 1,134,298 |
| Sabine-Neches Navigation District, Waterway Project, Limited General Obligation | | |
| 5.25%, due 2/15/39 | 1,500,000 | 1,688,314 |
| State of Texas, Unlimited General Obligation | | |
| Series A | | |
| 5.00%, due 10/1/32 | 1,500,000 | 1,569,683 |
| Series A | | |
| 5.00%, due 4/1/37 | 750,000 | 781,400 |
| Texas Department of Housing & Community Affairs, Revenue Bonds | | |
| Series A, Insured: GNMA | | |
| 3.50%, due 7/1/52 | 635,000 | 625,968 |
| Texas Private Activity Bond Surface Transportation Corp., Blueridge Transportation Group LLC, Revenue Bonds, Senior Lien | | |
| 5.00%, due 12/31/45 (b) | 1,000,000 | 1,003,443 |
| | | 35,122,804 |
| U.S. Virgin Islands 0.8% |
| Matching Fund Special Purpose Securitization Corp., Revenue Bonds | | |
| Series A | | |
| 5.00%, due 10/1/26 | 860,000 | 876,793 |
| Series A | | |
| 5.00%, due 10/1/30 | 2,000,000 | 2,035,860 |
| Virgin Islands Public Finance Authority, Gross Receipts Taxes Loan, Revenue Bonds | | |
| Series C, Insured: AGM-CR | | |
| 5.00%, due 10/1/30 | 100,000 | 100,072 |
| | | 3,012,725 |
| Utah 2.0% |
| Central Utah Water Conservancy District, Revenue Bonds | | |
| Series B | | |
| 4.00%, due 10/1/39 | 1,000,000 | 1,011,260 |
| Intermountain Power Agency, Revenue Bonds | | |
| Series A | | |
| 5.00%, due 7/1/41 | 880,000 | 979,077 |
The notes to the financial statements are an integral part of, and should be read in conjunction with, the financial statements.
| 24 | MainStay MacKay Strategic Municipal Allocation Fund |
| | Principal
Amount | Value |
| Long-Term Municipal Bonds (continued) |
| Utah (continued) |
| State of Utah, Build America Bonds, Unlimited General Obligation | | |
| Series B | | |
| 3.539%, due 7/1/25 | $ 3,138,135 | $ 3,100,467 |
| UIPA Crossroads Public Infrastructure District, Tax Allocation | | |
| 4.125%, due 6/1/41 (c) | 500,000 | 434,818 |
| Utah Charter School Finance Authority, Spectrum Academy Project, Revenue Bonds | | |
| Insured: BAM UT CSCE | | |
| 4.00%, due 4/15/40 | 250,000 | 239,001 |
| Utah Charter School Finance Authority, Summit Academy, Inc. Project, Revenue Bonds | | |
| Insured: UT CSCE | | |
| 5.00%, due 4/15/28 | 200,000 | 214,852 |
| Insured: UT CSCE | | |
| 5.00%, due 4/15/29 | 185,000 | 201,365 |
| Utah Infrastructure Agency, Revenue Bonds | | |
| 4.00%, due 10/15/35 | 700,000 | 647,634 |
| Series A | | |
| 5.00%, due 10/15/28 | 460,000 | 473,880 |
| | | 7,302,354 |
| Vermont 0.8% |
| University of Vermont and State Agricultural College, Revenue Bonds | | |
| 5.00%, due 10/1/40 | 1,500,000 | 1,535,535 |
| Vermont Student Assistance Corp., Revenue Bonds | | |
| Series A | | |
| 5.00%, due 6/15/23 (b) | 1,250,000 | 1,251,222 |
| | | 2,786,757 |
| Virginia 0.3% |
| James City County Economic Development Authority, Blaine Landing Phase II LP, Revenue Bonds | | |
| Insured: FHA 221(D4) | | |
| 5.00%, due 2/1/26 (a) | 1,000,000 | 1,018,595 |
| | Principal
Amount | Value |
| |
| Washington 1.0% |
| State of Washington, Unlimited General Obligation | | |
| Series D | | |
| 5.00%, due 2/1/35 | $ 500,000 | $ 506,211 |
| Series A | | |
| 5.00%, due 6/1/38 | 1,000,000 | 1,119,709 |
| Series A | | |
| 5.00%, due 8/1/42 | 655,000 | 716,525 |
| Washington State Convention Center Public Facilities District, Lodging Tax, Revenue Bonds | | |
| Series B | | |
| 4.00%, due 7/1/36 | 1,000,000 | 959,585 |
| Washington State Housing Finance Commission, Eliseo Project, Revenue Bonds | | |
| Series B-2 | | |
| 2.125%, due 7/1/27 (c) | 250,000 | 224,409 |
| | | 3,526,439 |
| West Virginia 0.5% |
| State of West Virginia, Unlimited General Obligation | | |
| Series A | | |
| 5.00%, due 12/1/35 | 470,000 | 527,319 |
| West Virginia Hospital Finance Authority, Charleston Area Medical Center, Inc. Obligated Group, Revenue Bonds | | |
| Series A | | |
| 5.00%, due 9/1/39 | 1,125,000 | 1,143,817 |
| | | 1,671,136 |
| Wisconsin 1.6% |
| County of Waushara, Revenue Notes | | |
| Series A | | |
| 4.75%, due 12/1/23 | 1,000,000 | 1,003,140 |
| Public Finance Authority, Revenue Bonds | | |
| 4.00%, due 4/1/32 (c) | 215,000 | 204,738 |
| Public Finance Authority, University of Kansas, Revenue Bonds | | |
| 5.00%, due 3/1/41 | 3,400,000 | 3,476,423 |
| Racine Unified School District, Revenue Notes | | |
| 4.00%, due 8/9/23 | 1,000,000 | 1,000,122 |
| | | 5,684,423 |
Total Long-Term Municipal Bonds
(Cost $330,071,741) | | 334,857,989 |
The notes to the financial statements are an integral part of, and should be read in conjunction with, the financial statements.
25
Portfolio of Investments April 30, 2023†^ (continued)
| | Principal
Amount | Value |
| Short-Term Municipal Notes 4.4% |
| Alabama 0.6% |
| Alabama Housing Finance Authority, Capstone at Kinsey Cove LP, Revenue Bonds | | |
| Series A | | |
| 3.875%, due 12/1/23 (e) | $ 1,500,000 | $ 1,498,652 |
| Black Belt Energy Gas District, Gas Project No.7, Revenue Bonds | | |
| Series C-2 | | |
| 4.21%, due 10/1/52 (e) | 700,000 | 674,874 |
| | | 2,173,526 |
| California 1.2% |
| Bay Area Toll Authority, Revenue Bonds | | |
| Series A | | |
| 3.10%, due 4/1/55 (e) | 2,200,000 | 2,200,000 |
| California Municipal Finance Authority, Waste Management, Inc., Revenue Bonds | | |
| Series A | | |
| 4.125%, due 10/1/41 (b)(e) | 1,500,000 | 1,510,911 |
| Metropolitan Water District of Southern California, Waterworks, Revenue Bonds | | |
| Series E | | |
| 4.00%, due 7/1/37 (e) | 500,000 | 498,332 |
| | | 4,209,243 |
| Indiana 0.3% |
| Indiana Finance Authority, Republic Services, Inc., Revenue Bonds | | |
| Series B | | |
| 3.65%, due 5/1/28 (e) | 1,000,000 | 999,880 |
| New York 2.0% |
| New York City Housing Development Corp., Multi-Family Housing, Sustainable Neighborhood, Revenue Bonds | | |
| Series F-2A, Insured: FHA 542(C) | | |
| 3.40%, due 11/1/62 (e) | 500,000 | 499,289 |
| New York City Transitional Finance Authority, Future Tax Secured, Revenue Bonds (e) | | |
| Series A4 | | |
| 3.75%, due 11/1/29 | 6,000,000 | 6,000,000 |
| | Principal
Amount | | Value |
| |
| New York (continued) |
| New York City Transitional Finance Authority, Future Tax Secured, Revenue Bonds (e) (continued) | | | |
| Series A-4 | | | |
| 3.75%, due 8/1/39 | $ 800,000 | | $ 800,000 |
| | | | 7,299,289 |
| Texas 0.1% |
| Alamito Public Facility Corp., EP Jackie Robinson LP, Revenue Bonds | | | |
| Insured: HUD Sector 8 | | | |
| 4.375%, due 3/1/41 (e) | 500,000 | | 499,991 |
| Washington 0.2% |
| County of King, Sewer, Revenue Bonds, Junior Lien | | | |
| Series A | | | |
| 4.09%, due 1/1/40 (e) | 655,000 | | 638,161 |
Total Short-Term Municipal Notes
(Cost $15,855,000) | | | 15,820,090 |
Total Investments
(Cost $345,926,741) | 98.2% | | 350,678,079 |
| Other Assets, Less Liabilities | 1.8 | | 6,402,362 |
| Net Assets | 100.0% | | $ 357,080,441 |
| † | Percentages indicated are based on Fund net assets. |
| ^ | Industry classifications may be different than those used for compliance monitoring purposes. |
| ‡ | Less than one-tenth of a percent. |
| (a) | Coupon rate may change based on changes of the underlying collateral or prepayments of principal. Rate shown was the rate in effect as of April 30, 2023. |
| (b) | Interest on these securities was subject to alternative minimum tax. |
| (c) | May be sold to institutional investors only under Rule 144A or securities offered pursuant to Section 4(a)(2) of the Securities Act of 1933, as amended. |
| (d) | Delayed delivery security. |
| (e) | Variable-rate demand notes (VRDNs)—Provide the right to sell the security at face value on either that day or within the rate-reset period. VRDNs will normally trade as if the maturity is the earlier put date, even though stated maturity is longer. The interest rate is reset on the put date at a stipulated daily, weekly, monthly, quarterly, or other specified time interval to reflect current market conditions. These securities do not indicate a reference rate and spread in their description. The maturity date shown is the final maturity. |
The notes to the financial statements are an integral part of, and should be read in conjunction with, the financial statements.
| 26 | MainStay MacKay Strategic Municipal Allocation Fund |
Futures Contracts
As of April 30, 2023, the Fund held the following futures contracts1:
| Type | Number of
Contracts | Expiration
Date | Value at
Trade Date | Current
Notional
Amount | Unrealized
Appreciation
(Depreciation)2 |
| Short Contracts | | | | | |
| U.S. Treasury 10 Year Ultra Bonds | (290) | June 2023 | $ (33,920,270) | $ (35,221,406) | $ (1,301,136) |
| 1. | As of April 30, 2023, cash in the amount of $899,000 was on deposit with a broker or futures commission merchant for futures transactions. |
| 2. | Represents the difference between the value of the contracts at the time they were opened and the value as of April 30, 2023. |
| Abbreviation(s): |
| AGM—Assured Guaranty Municipal Corp. |
| BAM—Build America Mutual Assurance Co. |
| CR—Custodial Receipts |
| FGIC—Financial Guaranty Insurance Company |
| FHA—Federal Housing Administration |
| FHLMC—Federal Home Loan Mortgage Corp. |
| FNMA—Federal National Mortgage Association |
| GNMA—Government National Mortgage Association |
| HUD—Housing and Urban Development |
| NATL-RE—National Public Finance Guarantee Corp. |
| PSF-GTD—Permanent School Fund Guaranteed |
| Q-SBLF—Qualified School Board Loan Fund |
| SD CRED PROG—School District Credit Enhancement Program |
| UT CSCE—Utah Charter School Credit Enhancement Program |
The following is a summary of the fair valuations according to the inputs used as of April 30, 2023, for valuing the Fund’s assets and liabilities:
| Description | Quoted
Prices in
Active
Markets for
Identical
Assets
(Level 1) | | Significant
Other
Observable
Inputs
(Level 2) | | Significant
Unobservable
Inputs
(Level 3) | | Total |
| Asset Valuation Inputs | | | | | | | |
| Investments in Securities (a) | | | | | | | |
| Municipal Bonds | | | | | | | |
| Long-Term Municipal Bonds | $ — | | $ 334,857,989 | | $ — | | $ 334,857,989 |
| Short-Term Municipal Notes | — | | 15,820,090 | | — | | 15,820,090 |
| Total Municipal Bonds | — | | 350,678,079 | | — | | 350,678,079 |
| Total Investments in Securities | $ — | | $ 350,678,079 | | $ — | | $ 350,678,079 |
| Liability Valuation Inputs | | | | | | | |
| Other Financial Instruments | | | | | | | |
| Futures Contracts (b) | $ (1,301,136) | | $ — | | $ — | | $ (1,301,136) |
| (a) | For a complete listing of investments and their industries, see the Portfolio of Investments. |
| (b) | The value listed for these securities reflects unrealized appreciation (depreciation) as shown on the Portfolio of Investments. |
The notes to the financial statements are an integral part of, and should be read in conjunction with, the financial statements.
27
Statement of Assets and Liabilities as of April 30, 2023
| Assets |
Investment in securities, at value
(identified cost $345,926,741) | $350,678,079 |
| Cash | 2,254,936 |
| Cash collateral on deposit at broker for futures contracts | 899,000 |
| Receivables: | |
| Interest | 4,590,083 |
| Fund shares sold | 1,372,824 |
| Investment securities sold | 991,280 |
| Other assets | 98,038 |
| Total assets | 360,884,240 |
| Liabilities |
| Payables: | |
| Investment securities purchased | 2,747,630 |
| Fund shares redeemed | 673,912 |
| Variation margin on futures contracts | 217,499 |
| Manager (See Note 3) | 93,624 |
| Custodian | 23,997 |
| Transfer agent (See Note 3) | 18,784 |
| Shareholder communication | 15,732 |
| NYLIFE Distributors (See Note 3) | 9,693 |
| Professional fees | 459 |
| Accrued expenses | 2,286 |
| Distributions payable | 183 |
| Total liabilities | 3,803,799 |
| Net assets | $357,080,441 |
| Composition of Net Assets |
| Shares of beneficial interest outstanding (par value of $.001 per share) unlimited number of shares authorized | $ 37,767 |
| Additional paid-in-capital | 361,159,620 |
| | 361,197,387 |
| Total distributable earnings (loss) | (4,116,946) |
| Net assets | $357,080,441 |
| Class A | |
| Net assets applicable to outstanding shares | $ 43,202,809 |
| Shares of beneficial interest outstanding | 4,562,843 |
| Net asset value per share outstanding | $ 9.47 |
| Maximum sales charge (3.00% of offering price) | 0.29 |
| Maximum offering price per share outstanding | $ 9.76 |
| Investor Class | |
| Net assets applicable to outstanding shares | $ 99,511 |
| Shares of beneficial interest outstanding | 10,521 |
| Net asset value per share outstanding | $ 9.46 |
| Maximum sales charge (2.50% of offering price) | 0.24 |
| Maximum offering price per share outstanding | $ 9.70 |
| Class C | |
| Net assets applicable to outstanding shares | $ 3,291,493 |
| Shares of beneficial interest outstanding | 348,251 |
| Net asset value and offering price per share outstanding | $ 9.45 |
| Class C2 | |
| Net assets applicable to outstanding shares | $ 214,212 |
| Shares of beneficial interest outstanding | 22,657 |
| Net asset value and offering price per share outstanding | $ 9.45 |
| Class I | |
| Net assets applicable to outstanding shares | $310,246,184 |
| Shares of beneficial interest outstanding | 32,819,459 |
| Net asset value and offering price per share outstanding | $ 9.45 |
| Class R6 | |
| Net assets applicable to outstanding shares | $ 26,232 |
| Shares of beneficial interest outstanding | 2,775 |
| Net asset value and offering price per share outstanding | $ 9.45 |
The notes to the financial statements are an integral part of, and should be read in conjunction with, the financial statements.
| 28 | MainStay MacKay Strategic Municipal Allocation Fund |
Statement of Operations for the year ended April 30, 2023
| Investment Income (Loss) |
| Income | |
| Interest | $ 7,200,859 |
| Expenses | |
| Manager (See Note 3) | 839,511 |
| Registration | 125,861 |
| Transfer agent (See Note 3) | 103,820 |
| Professional fees | 76,071 |
| Custodian | 67,847 |
| Distribution/Service—Class A (See Note 3) | 47,557 |
| Distribution/Service—Investor Class (See Note 3) | 322 |
| Distribution/Service—Class C (See Note 3) | 8,620 |
| Distribution/Service—Class C2 (See Note 3) | 348 |
| Shareholder communication | 17,528 |
| Trustees | 4,259 |
| Miscellaneous | 9,660 |
| Total expenses before waiver/reimbursement | 1,301,404 |
| Expense waiver/reimbursement from Manager (See Note 3) | (153,643) |
| Reimbursement from prior custodian(a) | (597) |
| Net expenses | 1,147,164 |
| Net investment income (loss) | 6,053,695 |
| Realized and Unrealized Gain (Loss) |
| Net realized gain (loss) on: | |
| Unaffiliated investment transactions | (8,103,792) |
| Futures transactions | 2,229,229 |
| Net realized gain (loss) | (5,874,563) |
| Net change in unrealized appreciation (depreciation) on: | |
| Unaffiliated investments | 9,869,490 |
| Futures contracts | (1,835,660) |
| Net change in unrealized appreciation (depreciation) | 8,033,830 |
| Net realized and unrealized gain (loss) | 2,159,267 |
| Net increase (decrease) in net assets resulting from operations | $ 8,212,962 |
| (a) | Represents a refund for overbilling of custody fees. |
The notes to the financial statements are an integral part of, and should be read in conjunction with, the financial statements.
29
Statements of Changes in Net Assets
for the years ended April 30, 2023 and April 30, 2022
| | 2023 | 2022 |
| Increase (Decrease) in Net Assets |
| Operations: | | |
| Net investment income (loss) | $ 6,053,695 | $ 1,039,155 |
| Net realized gain (loss) | (5,874,563) | 417,800 |
| Net change in unrealized appreciation (depreciation) | 8,033,830 | (7,062,471) |
| Net increase (decrease) in net assets resulting from operations | 8,212,962 | (5,605,516) |
| Distributions to shareholders: | | |
| Class A | (630,063) | (32,170) |
| Investor Class | (3,510) | (1,324) |
| Class C | (50,794) | (5,882) |
| Class C2 | (1,515) | — |
| Class I | (6,462,197) | (1,888,346) |
| Class R6 | (842) | (768) |
| Total distributions to shareholders | (7,148,921) | (1,928,490) |
| Capital share transactions: | | |
| Net proceeds from sales of shares | 434,866,901 | 58,605,291 |
| Net asset value of shares issued to shareholders in reinvestment of distributions | 7,136,822 | 1,927,984 |
| Cost of shares redeemed | (183,989,524) | (16,807,791) |
| Increase (decrease) in net assets derived from capital share transactions | 258,014,199 | 43,725,484 |
| Net increase (decrease) in net assets | 259,078,240 | 36,191,478 |
| Net Assets |
| Beginning of year | 98,002,201 | 61,810,723 |
| End of year | $ 357,080,441 | $ 98,002,201 |
The notes to the financial statements are an integral part of, and should be read in conjunction with, the financial statements.
| 30 | MainStay MacKay Strategic Municipal Allocation Fund |
Financial Highlights selected per share data and ratios
| | Year Ended April 30, | | June 28, 2019^ through
April 30, |
| Class A | 2023 | | 2022 | | 2021 | | 2020 |
| Net asset value at beginning of period | $ 9.50 | | $ 10.43 | | $ 9.65 | | $ 10.00 |
| Net investment income (loss) | 0.26(a) | | 0.12(a) | | 0.15(a) | | 0.14 |
| Net realized and unrealized gain (loss) | (0.01) | | (0.78) | | 0.82 | | (0.29) |
| Total from investment operations | 0.25 | | (0.66) | | 0.97 | | (0.15) |
| Less distributions: | | | | | | | |
| From net investment income | (0.26) | | (0.17) | | (0.19) | | (0.14) |
| From net realized gain on investments | (0.02) | | (0.10) | | — | | (0.06) |
| Total distributions | (0.28) | | (0.27) | | (0.19) | | (0.20) |
| Net asset value at end of period | $ 9.47 | | $ 9.50 | | $ 10.43 | | $ 9.65 |
| Total investment return (b) | 2.73% | | (6.54)% | | 10.02% | | (1.44)% |
| Ratios (to average net assets)/Supplemental Data: | | | | | | | |
| Net investment income (loss) | 2.78% | | 1.22% | | 1.47% | | 1.39%†† |
| Net expenses | 0.77% | | 0.77% | | 0.72% | | 0.77%†† |
| Expenses (before waiver/reimbursement) | 0.84% | | 0.97% | | 0.98% | | 1.12%†† |
| Portfolio turnover rate (c) | 81% | | 32% | | 66% | | 108% |
| Net assets at end of period (in 000’s) | $ 43,203 | | $ 5,246 | | $ 454 | | $ 136 |
| ^ | Inception date. |
| †† | Annualized. |
| (a) | Per share data based on average shares outstanding during the period. |
| (b) | Total investment return is calculated exclusive of sales charges and assumes the reinvestment of dividends and distributions. For periods of less than one year, total return is not annualized. |
| (c) | The portfolio turnover rate includes variable rate demand notes. |
| | Year Ended April 30, | | June 28, 2019^ through
April 30, |
| Investor Class | 2023 | | 2022 | | 2021 | | 2020 |
| Net asset value at beginning of period | $ 9.49 | | $ 10.41 | | $ 9.65 | | $ 10.00 |
| Net investment income (loss) | 0.21(a) | | 0.11(a) | | 0.13(a) | | 0.14 |
| Net realized and unrealized gain (loss) | 0.03 | | (0.79) | | 0.80 | | (0.29) |
| Total from investment operations | 0.24 | | (0.68) | | 0.93 | | (0.15) |
| Less distributions: | | | | | | | |
| From net investment income | (0.25) | | (0.14) | | (0.17) | | (0.14) |
| From net realized gain on investments | (0.02) | | (0.10) | | — | | (0.06) |
| Total distributions | (0.27) | | (0.24) | | (0.17) | | (0.20) |
| Net asset value at end of period | $ 9.46 | | $ 9.49 | | $ 10.41 | | $ 9.65 |
| Total investment return (b) | 2.58% | | (6.69)% | | 9.65% | | (1.56)% |
| Ratios (to average net assets)/Supplemental Data: | | | | | | | |
| Net investment income (loss) | 2.23% | | 1.04% | | 1.23% | | 1.30%†† |
| Net expenses | 0.92% | | 0.97% | | 0.98% | | 0.79%†† |
| Expenses (before waiver/reimbursement) | 0.99% | | 1.17% | | 1.24% | | 1.14%†† |
| Portfolio turnover rate (c) | 81% | | 32% | | 66% | | 108% |
| Net assets at end of period (in 000's) | $ 100 | | $ 46 | | $ 33 | | $ 34 |
| ^ | Inception date. |
| †† | Annualized. |
| (a) | Per share data based on average shares outstanding during the period. |
| (b) | Total investment return is calculated exclusive of sales charges and assumes the reinvestment of dividends and distributions. For periods of less than one year, total return is not annualized. |
| (c) | The portfolio turnover rate includes variable rate demand notes. |
The notes to the financial statements are an integral part of, and should be read in conjunction with, the financial statements.
31
Financial Highlights selected per share data and ratios
| | Year Ended April 30, | | June 28, 2019^ through
April 30, |
| Class C | 2023 | | 2022 | | 2021 | | 2020 |
| Net asset value at beginning of period | $ 9.48 | | $ 10.42 | | $ 9.65 | | $ 10.00 |
| Net investment income (loss) | 0.22(a) | | 0.08(a) | | 0.10(a) | | 0.12 |
| Net realized and unrealized gain (loss) | (0.01) | | (0.80) | | 0.81 | | (0.29) |
| Total from investment operations | 0.21 | | (0.72) | | 0.91 | | (0.17) |
| Less distributions: | | | | | | | |
| From net investment income | (0.22) | | (0.12) | | (0.14) | | (0.12) |
| From net realized gain on investments | (0.02) | | (0.10) | | — | | (0.06) |
| Total distributions | (0.24) | | (0.22) | | (0.14) | | (0.18) |
| Net asset value at end of period | $ 9.45 | | $ 9.48 | | $ 10.42 | | $ 9.65 |
| Total investment return (b) | 2.31% | | (7.12)% | | 9.49% | | (1.76)% |
| Ratios (to average net assets)/Supplemental Data: | | | | | | | |
| Net investment income (loss) | 2.34% | | 0.76% | | 0.97% | | 1.11%†† |
| Net expenses | 1.18% | | 1.22% | | 1.23% | | 1.03%†† |
| Expenses (before waiver/reimbursement) | 1.25% | | 1.42% | | 1.49% | | 1.38%†† |
| Portfolio turnover rate (c) | 81% | | 32% | | 66% | | 108% |
| Net assets at end of period (in 000’s) | $ 3,291 | | $ 558 | | $ 113 | | $ 79 |
| ^ | Inception date. |
| †† | Annualized. |
| (a) | Per share data based on average shares outstanding during the period. |
| (b) | Total investment return is calculated exclusive of sales charges and assumes the reinvestment of dividends and distributions. For periods of less than one year, total return is not annualized. |
| (c) | The portfolio turnover rate includes variable rate demand notes. |
| | December 13, 2022^ through
April 30, |
| Class C2 | 2023 |
| Net asset value at beginning of period | $ 9.43* |
| Net investment income (loss) (a) | 0.09 |
| Net realized and unrealized gain (loss) | 0.03 |
| Total from investment operations | 0.12 |
| Less distributions: | |
| From net investment income | (0.10) |
| Net asset value at end of period | $ 9.45 |
| Total investment return (b) | 1.29% |
| Ratios (to average net assets)/Supplemental Data: | |
| Net investment income (loss) | 2.49%†† |
| Net expenses | 1.34%†† |
| Expenses (before waiver/reimbursement) | 1.41%†† |
| Portfolio turnover rate (c) | 81% |
| Net assets at end of period (in 000’s) | $ 214 |
| * | Based on the net asset value of Class C as of December 13, 2022. |
| ^ | Inception date. |
| †† | Annualized. |
| (a) | Per share data based on average shares outstanding during the period. |
| (b) | Total investment return is calculated exclusive of sales charges and assumes the reinvestment of dividends and distributions. For periods of less than one year, total return is not annualized. |
| (c) | The portfolio turnover rate includes variable rate demand notes. |
The notes to the financial statements are an integral part of, and should be read in conjunction with, the financial statements.
| 32 | MainStay MacKay Strategic Municipal Allocation Fund |
Financial Highlights selected per share data and ratios
| | Year Ended April 30, | | June 28, 2019^ through
April 30, |
| Class I | 2023 | | 2022 | | 2021 | | 2020 |
| Net asset value at beginning of period | $ 9.48 | | $ 10.42 | | $ 9.65 | | $ 10.00 |
| Net investment income (loss) | 0.27(a) | | 0.15(a) | | 0.18(a) | | 0.16 |
| Net realized and unrealized gain (loss) | 0.00‡ | | (0.80) | | 0.81 | | (0.29) |
| Total from investment operations | 0.27 | | (0.65) | | 0.99 | | (0.13) |
| Less distributions: | | | | | | | |
| From net investment income | (0.28) | | (0.19) | | (0.22) | | (0.16) |
| From net realized gain on investments | (0.02) | | (0.10) | | — | | (0.06) |
| Total distributions | (0.30) | | (0.29) | | (0.22) | | (0.22) |
| Net asset value at end of period | $ 9.45 | | $ 9.48 | | $ 10.42 | | $ 9.65 |
| Total investment return (b) | 2.99% | | (6.43)% | | 10.28% | | (1.35)% |
| Ratios (to average net assets)/Supplemental Data: | | | | | | | |
| Net investment income (loss) | 2.90% | | 1.49% | | 1.72% | | 1.57%†† |
| Net expenses | 0.52% | | 0.51% | | 0.50% | | 0.53%†† |
| Expenses (before waiver/reimbursement) | 0.59% | | 0.71% | | 0.76% | | 0.88%†† |
| Portfolio turnover rate (c) | 81% | | 32% | | 66% | | 108% |
| Net assets at end of period (in 000’s) | $ 310,246 | | $ 92,126 | | $ 61,183 | | $ 51,059 |
| ^ | Inception date. |
| ‡ | Less than one cent per share. |
| †† | Annualized. |
| (a) | Per share data based on average shares outstanding during the period. |
| (b) | Total investment return is calculated exclusive of sales charges and assumes the reinvestment of dividends and distributions. Class I shares are not subject to sales charges. For periods of less than one year, total return is not annualized. |
| (c) | The portfolio turnover rate includes variable rate demand notes. |
The notes to the financial statements are an integral part of, and should be read in conjunction with, the financial statements.
33
Financial Highlights selected per share data and ratios
| | Year Ended April 30, | | June 28, 2019^ through
April 30, |
| Class R6 | 2023 | | 2022 | | 2021 | | 2020 |
| Net asset value at beginning of period | $ 9.48 | | $ 10.42 | | $ 9.65 | | $ 10.00 |
| Net investment income (loss) | 0.26(a) | | 0.16(a) | | 0.18(a) | | 0.17 |
| Net realized and unrealized gain (loss) | 0.02 | | (0.80) | | 0.81 | | (0.29) |
| Total from investment operations | 0.28 | | (0.64) | | 0.99 | | (0.12) |
| Less distributions: | | | | | | | |
| From net investment income | (0.29) | | (0.20) | | (0.22) | | (0.17) |
| From net realized gain on investments | (0.02) | | (0.10) | | — | | (0.06) |
| Total distributions | (0.31) | | (0.30) | | (0.22) | | (0.23) |
| Net asset value at end of period | $ 9.45 | | $ 9.48 | | $ 10.42 | | $ 9.65 |
| Total investment return (b) | 3.01% | | (6.41)% | | 10.28% | | (1.32)% |
| Ratios (to average net assets)/Supplemental Data: | | | | | | | |
| Net investment income (loss) | 2.75% | | 1.51% | | 1.72% | | 1.60%†† |
| Net expenses | 0.50% | | 0.50% | | 0.50% | | 0.50%†† |
| Expenses (before waiver/reimbursement) | 0.55% | | 0.70% | | 0.77% | | 0.86%†† |
| Portfolio turnover rate (c) | 81% | | 32% | | 66% | | 108% |
| Net assets at end of period (in 000’s) | $ 26 | | $ 25 | | $ 27 | | $ 25 |
| ^ | Inception date. |
| †† | Annualized. |
| (a) | Per share data based on average shares outstanding during the period. |
| (b) | Total investment return is calculated exclusive of sales charges and assumes the reinvestment of dividends and distributions. Class R6 shares are not subject to sales charges. For periods of less than one year, total return is not annualized. |
| (c) | The portfolio turnover rate includes variable rate demand notes. |
The notes to the financial statements are an integral part of, and should be read in conjunction with, the financial statements.
| 34 | MainStay MacKay Strategic Municipal Allocation Fund |
Notes to Financial Statements
Note 1-Organization and Business
MainStay Funds Trust (the “Trust”) was organized as a Delaware statutory trust on April 28, 2009. The Trust is registered under the Investment Company Act of 1940, as amended (the “1940 Act”), as an open-end management investment company, and is comprised of thirty-three funds (collectively referred to as the “Funds”). These financial statements and notes relate to the MainStay MacKay Strategic Municipal Allocation Fund (the "Fund"), a “diversified” fund, as that term is defined in the 1940 Act, as interpreted or modified by regulatory authorities having jurisdiction, from time to time.
The following table lists the Fund's share classes that have been registered and commenced operations:
| Class | Commenced Operations |
| Class A | June 28, 2019 |
| Investor Class | June 28, 2019 |
| Class C | June 28, 2019 |
| Class C2 | December 13, 2022 |
| Class I | June 28, 2019 |
| Class R6 | June 28, 2019 |
| SIMPLE Class | N/A* |
| * | SIMPLE Class shares were registered for sale effective as of August 31, 2020 but have not yet commenced operations. |
Class A and Investor Class shares are offered at net asset value (“NAV”) per share plus an initial sales charge. No initial sales charge applies to investments of $250,000 or more (and certain other qualified purchases) in Class A and Investor Class shares. A contingent deferred sales charge (“CDSC”) of 1.00% may be imposed on certain redemptions of Class A and Investor Class shares made within 18 months of the date of purchase on shares that were purchased without an initial sales charge. Class C and Class C2 shares are offered at NAV without an initial sales charge, although a 1.00% CDSC may be imposed on certain redemptions of such shares made within one year of the date of purchase of Class C and Class C2 shares. Class I and Class R6 shares are offered at NAV without a sales charge. SIMPLE Class share are expected to be offered at NAV without a sales charge if such shares are offered in the future. In addition, depending upon eligibility, Class C and Class C2 shares convert to either Class A or Investor Class shares at the end of the calendar quarter eight years after the date they were purchased. Additionally, Investor Class shares may convert automatically to Class A shares based on a shareholder’s account balance as described in the Fund’s prospectus. Under certain circumstances and as may be permitted by the Trust’s multiple class plan pursuant to Rule 18f-3 under the 1940 Act, specified share classes of the Fund may be converted to one or more other share classes of the Fund as disclosed in the capital share transactions within these Notes. The classes of shares have the same voting (except for issues that relate solely to one class), dividend, liquidation and other rights, and the same terms and conditions, except that under distribution plans pursuant to Rule 12b-1 under the 1940 Act, Class C, Class C2 and SIMPLE Class shares are subject to higher
distribution and/or service fees than Class A and Investor Class shares. Class I and Class R6 shares are not subject to a distribution and/or service fee.
The Fund's investment objective is to seek current income exempt from regular federal income tax.
Note 2–Significant Accounting Policies
The Fund is an investment company and accordingly follows the investment company accounting and reporting guidance of the Financial Accounting Standards Board (“FASB”) Accounting Standards Codification Topic 946 Financial Services—Investment Companies. The Fund prepares its financial statements in accordance with generally accepted accounting principles (“GAAP”) in the United States of America and follows the significant accounting policies described below.
(A) Securities Valuation. Investments are usually valued as of the close of regular trading on the New York Stock Exchange (the "Exchange") (usually 4:00 p.m. Eastern time) on each day the Fund is open for business ("valuation date").
Pursuant to Rule 2a-5 under the 1940 Act, the Board of Trustees of the Trust (the "Board") has designated New York Life Investment Management LLC (“New York Life Investments” or the "Manager") as its Valuation Designee (the "Valuation Designee"). The Valuation Designee is responsible for performing fair valuations relating to all investments in the Fund’s portfolio for which market quotations are not readily available; periodically assessing and managing material valuation risks; establishing and applying fair value methodologies; testing fair valuation methodologies; evaluating and overseeing pricing services; ensuring appropriate segregation of valuation and portfolio management functions; providing quarterly, annual and prompt reporting to the Board, as appropriate; identifying potential conflicts of interest; and maintaining appropriate records. The Valuation Designee has established a valuation committee ("Valuation Committee") to assist in carrying out the Valuation Designee’s responsibilities and establish prices of securities for which market quotations are not readily available. The Fund's and the Valuation Designee's policies and procedures ("Valuation Procedures") govern the Valuation Designee’s selection and application of methodologies for determining and calculating the fair value of Fund investments. The Valuation Designee may value the Fund's portfolio securities for which market quotations are not readily available and other Fund assets utilizing inputs from pricing services and other third-party sources. The Valuation Committee meets (in person, via electronic mail or via teleconference) on an ad-hoc basis to determine fair valuations and on a quarterly basis to review fair value events with respect to certain securities for which market quotations are not readily available, including valuation risks and back-testing results, and preview reports to the Board.
The Valuation Committee establishes prices of securities for which market quotations are not readily available based on such methodologies and measurements on a regular basis after considering information that is reasonably available and deemed relevant by the Valuation Committee.
Notes to Financial Statements (continued)
The Board shall oversee the Valuation Designee and review fair valuation materials on a prompt, quarterly and annual basis and approve proposed revisions to the Valuation Procedures.
Investments for which market quotations are not readily available are valued at fair value as determined in good faith pursuant to the Valuation Procedures. A market quotation is readily available only when that quotation is a quoted price (unadjusted) in active markets for identical investments that the Fund can access at the measurement date, provided that a quotation will not be readily available if it is not reliable. "Fair value" is defined as the price the Fund would reasonably expect to receive upon selling an asset or liability in an orderly transaction to an independent buyer in the principal or most advantageous market for the asset or liability. Fair value measurements are determined within a framework that establishes a three-tier hierarchy that maximizes the use of observable market data and minimizes the use of unobservable inputs to establish a classification of fair value measurements for disclosure purposes. "Inputs" refer broadly to the assumptions that market participants would use in pricing the asset or liability, including assumptions about risk, such as the risk inherent in a particular valuation technique used to measure fair value using a pricing model and/or the risk inherent in the inputs for the valuation technique. Inputs may be observable or unobservable. Observable inputs reflect the assumptions market participants would use in pricing the asset or liability based on market data obtained from sources independent of the Fund. Unobservable inputs reflect the Fund’s own assumptions about the assumptions market participants would use in pricing the asset or liability based on the information available. The inputs or methodology used for valuing assets or liabilities may not be an indication of the risks associated with investing in those assets or liabilities. The three-tier hierarchy of inputs is summarized below.
| • | Level 1—quoted prices (unadjusted) in active markets for an identical asset or liability |
| • | Level 2—other significant observable inputs (including quoted prices for a similar asset or liability in active markets, interest rates and yield curves, prepayment speeds, credit risk, etc.) |
| • | Level 3—significant unobservable inputs (including the Fund's own assumptions about the assumptions that market participants would use in measuring fair value of an asset or liability) |
The level of an asset or liability within the fair value hierarchy is based on the lowest level of an input, both individually and in the aggregate, that is significant to the fair value measurement. The aggregate value by input level of the Fund’s assets and liabilities as of April 30, 2023, is included at the end of the Portfolio of Investments.
The Fund may use third-party vendor evaluations, whose prices may be derived from one or more of the following standard inputs, among others:
| • Benchmark yields | • Reported trades |
| • Broker/dealer quotes | • Issuer spreads |
| • Two-sided markets | • Benchmark securities |
| • Bids/offers | • Reference data (corporate actions or material event notices) |
| • Industry and economic events | • Comparable bonds |
| • Monthly payment information | |
An asset or liability for which a market quotation is not readily available is valued by methods deemed reasonable in good faith by the Valuation Committee, following the Valuation Procedures to represent fair value. Under these procedures, the Valuation Designee generally uses a market-based approach which may use related or comparable assets or liabilities, recent transactions, market multiples, book values and other relevant information. The Valuation Designee may also use an income-based valuation approach in which the anticipated future cash flows of the asset or liability are discounted to calculate fair value. Discounts may also be applied due to the nature and/or duration of any restrictions on the disposition of the asset or liability. Fair value represents a good faith approximation of the value of a security. Fair value determinations involve the consideration of a number of subjective factors, an analysis of applicable facts and circumstances and the exercise of judgment. As a result, it is possible that the fair value for a security determined in good faith in accordance with the Valuation Procedures may differ from valuations for the same security determined for other funds using their own valuation procedures. Although the Valuation Procedures are designed to value a security at the price the Fund may reasonably expect to receive upon the security's sale in an orderly transaction, there can be no assurance that any fair value determination thereunder would, in fact, approximate the amount that the Fund would actually realize upon the sale of the security or the price at which the security would trade if a reliable market price were readily available. During the year ended April 30, 2023, there were no material changes to the fair value methodologies.
Securities which may be valued in this manner include, but are not limited to: (i) a security for which trading has been halted or suspended or otherwise does not have a readily available market quotation on a given day; (ii) a debt security that has recently gone into default and for which there is not a current market quotation; (iii) a security of an issuer that has entered into a restructuring; (iv) a security that has been delisted from a national exchange; (v) a security subject to trading collars for which no or limited trading takes place; and (vi) a security whose principal market has been temporarily closed at a time when, under normal conditions, it would be open. Securities valued in this manner are generally categorized as Level 2 or 3 in the hierarchy.
Futures contracts are valued at the last posted settlement price on the market where such futures are primarily traded. These securities are generally categorized as Level 1 in the hierarchy.
| 36 | MainStay MacKay Strategic Municipal Allocation Fund |
Municipal debt securities are valued at the evaluated mean prices supplied by a pricing agent or broker selected by the Valuation Designee, in consultation with the Subadvisor. The evaluations are market-based measurements processed through a pricing application and represents the pricing agent's good faith determination as to what a holder may receive in an orderly transaction under market conditions. The rules-based logic utilizes valuation techniques that reflect participants' assumptions and vary by asset class and per methodology, maximizing the use of relevant observable data including quoted prices for similar assets, benchmark yield curves and market corroborated inputs. The evaluated bid or mean prices are deemed by the Valuation Designee, in consultation with the Subadvisor, to be representative of market values, at the regular close of trading of the Exchange on each valuation date. Municipal debt securities purchased on a delayed delivery basis are marked to market daily until settlement at the forward settlement date. Municipal debt securities are generally categorized as Level 2 in the hierarchy.
The information above is not intended to reflect an exhaustive list of the methodologies that may be used to value portfolio investments. The Valuation Procedures permit the use of a variety of valuation methodologies in connection with valuing portfolio investments. The methodology used for a specific type of investment may vary based on the market data available or other considerations. The methodologies summarized above may not represent the specific means by which portfolio investments are valued on any particular business day.
(B) Income Taxes. The Fund's policy is to comply with the requirements of the Internal Revenue Code of 1986, as amended (the “Internal Revenue Code”), applicable to regulated investment companies and to distribute all of its taxable income to the shareholders of the Fund within the allowable time limits.
The Manager evaluates the Fund’s tax positions to determine if the tax positions taken meet the minimum recognition threshold in connection with accounting for uncertainties in income tax positions taken or expected to be taken for the purposes of measuring and recognizing tax liabilities in the financial statements. Recognition of tax benefits of an uncertain tax position is permitted only to the extent the position is “more likely than not” to be sustained assuming examination by taxing authorities. The Manager analyzed the Fund's tax positions taken on federal, state and local income tax returns for all open tax years (for up to three tax years) and has concluded that no provisions for federal, state and local income tax are required in the Fund's financial statements. The Fund's federal, state and local income tax and federal excise tax returns for tax years for which the applicable statutes of limitations have not expired are subject to examination by the Internal Revenue Service and state and local departments of revenue.
(C) Dividends and Distributions to Shareholders. Dividends and distributions are recorded on the ex-dividend date. The Fund intends to declare dividends from net investment income, if any, daily and intends to pay them at least monthly and declares and pays distributions from net realized capital gains, if any, at least annually. Unless a shareholder elects
otherwise, all dividends and distributions are reinvested at NAV in the same class of shares of the Fund. Dividends and distributions to shareholders are determined in accordance with federal income tax regulations and may differ from determinations using GAAP.
(D) Security Transactions and Investment Income. The Fund records security transactions on the trade date. Realized gains and losses on security transactions are determined using the identified cost method. Interest income is accrued as earned using the effective interest rate method. Discounts and premiums on securities purchased, other than temporary cash investments that mature in 60 days or less at the time of purchase, for the Fund are accreted and amortized, respectively, on the effective interest rate method.
Investment income and realized and unrealized gains and losses on investments of the Fund are allocated pro rata to the separate classes of shares based upon their relative net assets on the date the income is earned or realized and unrealized gains and losses are incurred.
The Fund may place a debt security on non-accrual status and reduce related interest income by ceasing current accruals and writing off all or a portion of any interest receivables when the collection of all or a portion of such interest has become doubtful. A debt security is removed from non-accrual status when the issuer resumes interest payments or when collectability of interest is reasonably assured.
(E) Expenses. Expenses of the Trust are allocated to the individual Funds in proportion to the net assets of the respective Funds when the expenses are incurred, except where direct allocations of expenses can be made. Expenses (other than transfer agent expenses and fees incurred under the shareholder services plans and/or the distribution plans further discussed in Note 3(B)) are allocated to separate classes of shares pro rata based upon their relative net assets on the date the expenses are incurred. The expenses borne by the Fund, including those of related parties to the Fund, are shown in the Statement of Operations.
(F) Use of Estimates. In preparing financial statements in conformity with GAAP, the Manager makes estimates and assumptions that affect the reported amounts and disclosures in the financial statements. Actual results could differ from those estimates and assumptions.
(G) Futures Contracts. A futures contract is an agreement to purchase or sell a specified quantity of an underlying instrument at a specified future date and price, or to make or receive a cash payment based on the value of a financial instrument (e.g., foreign currency, interest rate, security or securities index). The Fund is subject to risks such as market price risk, leverage risk, liquidity risk, counterparty risk, operational risk, legal risk and/or interest rate risk in the normal course of investing in these contracts. Upon entering into a futures contract, the Fund is required to pledge to the broker or futures commission merchant an amount of cash and/or U.S. government securities equal to a certain percentage of the collateral amount, known as the “initial margin.” During the period the futures contract is open, changes in the value of the contract are recognized as unrealized appreciation or depreciation by marking to market such contract on a daily basis to reflect the market
Notes to Financial Statements (continued)
value of the contract at the end of each day’s trading. The Fund agrees to receive from or pay to the broker or futures commission merchant an amount of cash equal to the daily fluctuation in the value of the contract. Such receipts or payments are known as “variation margin.” When the futures contract is closed, the Fund records a realized gain or loss equal to the difference between the proceeds from (or cost of) the closing transaction and the Fund's basis in the contract.
The use of futures contracts involves, to varying degrees, elements of market risk in excess of the amount recognized in the Statement of Assets and Liabilities. The contract or notional amounts and variation margin reflect the extent of the Fund's involvement in open futures positions. There are several risks associated with the use of futures contracts as hedging techniques. There can be no assurance that a liquid market will exist at the time when the Fund seeks to close out a futures contract. If no liquid market exists, the Fund would remain obligated to meet margin requirements until the position is closed. Futures contracts may involve a small initial investment relative to the risk assumed, which could result in losses greater than if the Fund did not invest in futures contracts. Futures contracts may be more volatile than direct investments in the instrument underlying the futures and may not correlate to the underlying instrument, causing a given hedge not to achieve its objectives. The Fund's activities in futures contracts have minimal counterparty risk as they are conducted through regulated exchanges that guarantee the futures against default by the counterparty. In the event of a bankruptcy or insolvency of a futures commission merchant that holds margin on behalf of the Fund, the Fund may not be entitled to the return of the entire margin owed to the Fund, potentially resulting in a loss. The Fund may invest in futures contracts to seek enhanced returns or to reduce the risk of loss by hedging certain of its holdings. The Fund's investment in futures contracts and other derivatives may increase the volatility of the Fund's NAVs and may result in a loss to the Fund. Open futures contracts as of April 30, 2023, are shown in the Portfolio of Investments.
(H) Delayed Delivery Transactions. The Fund may purchase or sell securities on a delayed delivery basis. These transactions involve a commitment by the Fund to purchase or sell securities for a predetermined price or yield, with payment and delivery taking place beyond the customary settlement period. When delayed delivery purchases are outstanding, the Fund will designate liquid assets in an amount sufficient to meet the purchase price. When purchasing a security on a delayed delivery basis, the Fund assumes the rights and risks of ownership of the security, including the risk of price and yield fluctuations, and takes such fluctuations into account when determining its NAV. The Fund may dispose of or renegotiate a delayed delivery transaction after it is entered into, and may sell delayed delivery securities before they are delivered, which may result in a realized gain or loss. When the Fund has sold a security it owns on a delayed delivery basis, the Fund does not participate in future gains and losses with respect to the security. Delayed delivery transactions as of April 30, 2023, are shown in the Portfolio of Investments.
(I) Municipal Bond Risk. The Fund may invest more heavily in municipal bonds from certain cities, states, territories or regions than others, which may increase the Fund’s exposure to losses resulting from economic, political, regulatory occurrences, or declines in tax revenue impacting these particular cities, states, territories or regions. In addition, many state and municipal governments that issue securities are under significant economic and financial stress and may not be able to satisfy their obligations, and these events may be made worse due to economic challenges posed by COVID-19. The Fund may invest a substantial amount of its assets in municipal bonds whose interest is paid solely from revenues of similar projects, such as tobacco settlement bonds. If the Fund concentrates its investments in this manner, it assumes the legal and economic risks relating to such projects and this may have a significant impact on the Fund’s investment performance.
Certain of the issuers in which the Fund may invest have recently experienced, or may experience, significant financial difficulties and repeated credit rating downgrades. On May 3, 2017, the Commonwealth of Puerto Rico (the "Commonwealth") began proceedings pursuant to the Puerto Rico Oversight, Management, and Economic Stability Act (“PROMESA”) to seek bankruptcy-type protections from approximately $74 billion in debt and approximately $48 billion in unfunded pension obligations. In addition, the economic downturn following the outbreak of COVID-19 and the resulting pressure on Puerto Rico’s budget have further contributed to its financial challenges. The federal government has passed certain relief packages, including the Coronavirus Aid, Relief, and Economic Security Act and the American Rescue Plan, which included an aggregate of more than $7 billion in disaster relief funds for the U.S. territories, including Puerto Rico. However, there can be no assurances that the federal funds allocated to the Commonwealth will be sufficient to address the long-term economic challenges that arose from COVID-19.
The Commonwealth concluded its Title III restructuring proceedings on behalf of itself and certain instrumentalities effective March 15, 2022. Approximately $18.75 billion of claims related to debt guaranteed under Puerto Rico's constitution including the Commonwealth of Puerto Rico in new Puerto Rico General Obligation Bonds, $7.1 billion of cash, and $3.5 billion of new Contingent Value instruments. In addition, the Commonwealth's exit from the restructuring proceedings resolved certain claims relating to the Commonwealth Employee Retirement System, Convention Center, Highway Authority, and Infrastructure Financing Authority. Two of the Commonwealth's agencies are still under Title III restructuring proceedings including the Puerto Rico Electric Power Authority (PREPA) and the Puerto Rico Industrial Development Authority (PRIDCO).
Puerto Rico’s debt restructuring process and other economic, political, social, environmental or health factors or developments could occur rapidly and may significantly affect the value of municipal securities of Puerto Rico. Any agreement between the Federal Oversight and Management Board and creditors is subject to approval by the judge overseeing the Title III proceedings. The composition of the Federal Oversight and Management Board is subject to change every three years
| 38 | MainStay MacKay Strategic Municipal Allocation Fund |
due to existing members either stepping down or being replaced following the expiration of a member's term. There is no assurance that board members will approve the restructuring agreements that a prior board negotiated.
As of May 30, 2023 the Puerto Rico Electric Power Authority (PREPA) remains in Title III Bankruptcy after nearly 6 years. A significant number of net revenue bond creditors, the Oversight Board, and the Commonwealth have been unable to reach a consensual resolution on PREPA’s debt restructuring following the termination of the previous 2019 PREPA Restructuring Support Agreement by the Commonwealth of Puerto Rico in March of 2022. Further bankruptcy litigation has ensued between the Oversight Board and a group of net revenue bond creditors over the security provisions of PREPA’s 8.3bln of net revenue bonds resulting in a ruling from Judge Swain that PREPA’s net revenue bonds are unsecured. The Ad Hoc group of net revenue bond creditors and bond insurer Assured Guaranty have informed Judge Swain they will seek to appeal her decision absent a consensual resolution in the case. The Oversight Board has reached plan confirmation support from at least one creditor class, the ~700mm of claims relating to fuel line lenders. In addition, the Oversight Board reached a settlement agreement with bond insurer National Public Finance Guaranty regarding ~876mm of PREPA’s net revenue bond claims or~11% of PREPA’s net revenue bond claims.
If a settlement agreement cannot be reached between a majority of net revenue bond holders and the Oversight Board, Judge Swain could approve a cram-down plan or dismiss the bankruptcy case entirely. A cram-down plan could significantly reduce recoveries. Furthermore, a dismissal of the case would result in further litigation in local PR courts with guaranty of additional recovery.
The Fund’s vulnerability to potential losses associated with such developments may be reduced through investing in municipal securities that feature credit enhancements (such as bond insurance). The bond insurance provider pays both principal and interest when due to the bond holder. The magnitude of Puerto Rico’s debt restructuring or other adverse economic developments could pose significant strains on the ability of municipal securities insurers to meet all future claims. As of April 30, 2023, 12.5% of the Puerto Rico municipal securities held by the Fund were insured.
(J) Indemnifications. Under the Trust’s organizational documents, its officers and trustees are indemnified against certain liabilities that may arise out of performance of their duties to the Trust. Additionally, in the normal course of business, the Fund enters into contracts with third-party service providers that contain a variety of representations and warranties and that may provide general indemnifications. The Fund's maximum exposure under these arrangements is unknown, as this would involve future claims that may be made against the Fund that have not yet occurred. The Manager believes that the risk of loss in connection with these potential indemnification obligations is remote. However, there can be no assurance that material liabilities related to such obligations will not arise in the future, which could adversely impact the Fund.
(K) Quantitative Disclosure of Derivative Holdings. The following tables show additional disclosures related to the Fund's derivative and hedging activities, including how such activities are accounted for and their effect on the Fund's financial positions, performance and cash flows.
The Fund entered into futures contracts to manage its exposure to the securities markets or to movements in interest rates and currency values.
Fair value of derivative instruments as of April 30, 2023:
| Liability Derivatives | Interest
Rate
Contracts
Risk | Total |
| Futures Contracts - Net Assets—Net unrealized depreciation on futures contracts (a) | $(1,301,136) | $(1,301,136) |
| Total Fair Value | $(1,301,136) | $(1,301,136) |
| (a) | Includes cumulative appreciation (depreciation) of futures contracts as reported in the Portfolio of Investments. Only current day’s variation margin is reported within the Statement of Assets and Liabilities. |
The effect of derivative instruments on the Statement of Operations for the year ended April 30, 2023:
| Net Realized Gain (Loss) from: | Interest
Rate
Contracts
Risk | Total |
| Futures Contracts | $2,229,229 | $2,229,229 |
| Total Net Realized Gain (Loss) | $2,229,229 | $2,229,229 |
| Net Change in Unrealized Appreciation (Depreciation) | Interest
Rate
Contracts
Risk | Total |
| Futures Contracts | $(1,835,660) | $(1,835,660) |
| Total Net Change in Unrealized Appreciation (Depreciation) | $(1,835,660) | $(1,835,660) |
| Average Notional Amount | Total |
| Futures Contracts Short | $(22,486,810) |
Note 3–Fees and Related Party Transactions
(A) Manager and Subadvisor. New York Life Investments, a registered investment adviser and an indirect, wholly-owned subsidiary of New York Life Insurance Company ("New York Life"), serves as the Fund's Manager, pursuant to an Amended and Restated Management Agreement ("Management Agreement"). The Manager provides offices, conducts clerical, recordkeeping and bookkeeping services and keeps most of the financial and accounting records required to be maintained by the Fund. Except for the portion of salaries and expenses that are the responsibility of the Fund, the Manager pays the salaries and expenses of all personnel affiliated with the Fund and certain operational expenses of the Fund. The
Notes to Financial Statements (continued)
Fund reimburses New York Life Investments in an amount equal to the portion of the compensation of the Chief Compliance Officer attributable to the Fund. MacKay Shields LLC ("MacKay Shields" or the "Subadvisor"), a registered investment adviser and an indirect, wholly-owned subsidiary of New York Life, serves as the Subadvisor to the Fund and is responsible for the day-to-day portfolio management of the Fund. Pursuant to the terms of an Amended and Restated Subadvisory Agreement ("Subadvisory Agreement") between New York Life Investments and MacKay Shields, New York Life Investments pays for the services of the Subadvisor.
Pursuant to the Management Agreement, the Fund pays the Manager a monthly fee for the services performed and the facilities furnished at an annual rate of 0.40% of the Fund's average daily net assets.
New York Life Investments has contractually agreed to waive fees and/or reimburse expenses so that Total Annual Fund Operating Expenses (excluding taxes, interest, litigation, extraordinary expenses, brokerage and other transaction expenses relating to the purchase or sale of portfolio investments and acquired (underlying) fund fees and expenses) do not exceed the following percentages of daily net assets: Class A, 0.77% and Class R6, 0.50%. New York Life Investments will apply an equivalent waiver or reimbursement, in an equal number of basis points of the Class A shares waiver/reimbursement, to Investor Class, Class C, Class C2 and Class I shares. This agreement will remain in effect until August 31, 2024, and shall renew automatically for one-year terms unless New York Life Investments provides written notice of termination prior to the start of the next term or upon approval of the Board.
During the year ended April 30, 2023, New York Life Investments earned fees from the Fund in the amount of $839,511 and waived fees and/or reimbursed expenses in the amount of $153,643 and paid the Subadvisor fees of $342,934.
JPMorgan Chase Bank, N.A. ("JPMorgan") provides sub-administration and sub-accounting services to the Fund pursuant to an agreement with New York Life Investments. These services include calculating the daily NAVs of the Fund, maintaining the general ledger and sub-ledger accounts for the calculation of the Fund's NAVs, and assisting New York Life Investments in conducting various aspects of the Fund's administrative operations. For providing these services to the Fund, JPMorgan is compensated by New York Life Investments.
Pursuant to an agreement between the Trust and New York Life Investments, New York Life Investments is responsible for providing or procuring certain regulatory reporting services for the Fund. The Fund will reimburse New York Life Investments for the actual costs incurred by New York Life Investments in connection with providing or procuring these services for the Fund.
(B) Distribution and Service Fees. The Trust, on behalf of the Fund, has entered into a distribution agreement with NYLIFE Distributors LLC (the “Distributor”), an affiliate of New York Life Investments. The Fund has adopted distribution plans (the “Plans”) in accordance with the provisions of Rule 12b-1 under the 1940 Act.
Pursuant to the Class A and Investor Class Plans, the Distributor receives a monthly fee from the Class A and Investor Class shares at an annual rate of 0.25% of the average daily net assets of the Class A and Investor Class shares for distribution and/or service activities as designated by the Distributor. Pursuant to the Class C Plan, Class C shares pay the Distributor a monthly distribution fee at an annual rate of 0.25% of the average daily net assets of the Class C shares, along with a service fee at an annual rate of 0.25% of the average daily net assets of the Class C shares, for a total 12b-1 fee of 0.50%. Pursuant to the Class C2 Plan, Class C2 shares pay the Distributor a monthly distribution fee at an annual rate of 0.40% of the average daily net assets of the Class C2 shares, along with a service fee at an annual rate of 0.25% of the average daily net assets of the Class C2 shares, for a total 12b-1 fee of 0.65%. Class I and Class R6 shares are not subject to a distribution and/or service fee.
The Plans provide that the distribution and service fees are payable to the Distributor regardless of the amounts actually expended by the Distributor for distribution of the Fund's shares and service activities.
(C) Sales Charges. The Fund was advised by the Distributor that the amount of initial sales charges retained on sales of Class A and Investor Class shares during the year ended April 30, 2023, were $1,362 and $32, respectively.
The Fund was also advised that the Distributor retained CDSCs on redemptions of Class A, Investor Class and Class C shares during the year ended April 30, 2023, of $7,525, $99 and $966, respectively.
(D) Transfer, Dividend Disbursing and Shareholder Servicing Agent. NYLIM Service Company LLC, an affiliate of New York Life Investments, is the Fund's transfer, dividend disbursing and shareholder servicing agent pursuant to an agreement between NYLIM Service Company LLC and the Trust. NYLIM Service Company LLC has entered into an agreement with SS&C Global Investor & Distribution Solutions, Inc. ("SS&C"), pursuant to which SS&C performs certain transfer agent services on behalf of NYLIM Service Company LLC. New York Life Investments has contractually agreed to limit the transfer agency expenses charged to the Fund’s share classes to a maximum of 0.35% of that share class’s average daily net assets on an annual basis after deducting any applicable Fund or class-level expense reimbursement or small account fees. This agreement will remain in effect until August 31, 2023, and shall renew automatically for one-year terms unless New York Life Investments provides written notice of termination prior to the start of the next term or upon approval of the Board. During the year ended April 30, 2023, transfer agent expenses incurred by the Fund and any
| 40 | MainStay MacKay Strategic Municipal Allocation Fund |
reimbursements, pursuant to the aforementioned Transfer Agency expense limitation agreement, were as follows:
| Class | Expense | Waived |
| Class A | $ 9,676 | $— |
| Investor Class | 251 | — |
| Class C | 3,636 | — |
| Class C2 | 119 | — |
| Class I | 90,138 | — |
| Class R6 | — | — |
(E) Small Account Fee. Shareholders with small accounts adversely impact the cost of providing transfer agency services. In an effort to reduce total transfer agency expenses, the Fund has implemented a small account fee on certain types of accounts. As described in the Fund's prospectus, certain shareholders with an account balance of less than $1,000 ($5,000 for Class A share accounts) are charged an annual per account fee of $20 (assessed semi-annually), the proceeds from which offset transfer agent fees as reflected in the Statement of Operations. This small account fee will not apply to certain types of accounts as described further in the Fund’s prospectus.
(F) Capital. As of April 30, 2023, New York Life and its affiliates beneficially held shares of the Fund with the values and percentages of net assets as follows:
| Class A | $25,948 | 0.1% |
| Investor Class | 25,760 | 25.9 |
| Class C | 25,489 | 0.8 |
| Class C2 | 25,262 | 11.8 |
| Class R6 | 26,148 | 99.7 |
Note 4-Federal Income Tax
As of April 30, 2023, the cost and unrealized appreciation (depreciation) of the Fund’s investment portfolio, including applicable derivative contracts and other financial instruments, as determined on a federal income tax basis, were as follows:
| | Federal Tax
Cost | Gross
Unrealized
Appreciation | Gross
Unrealized
(Depreciation) | Net
Unrealized
Appreciation/
(Depreciation) |
| Investments in Securities | $346,621,794 | $6,876,603 | $(2,820,318) | $4,056,285 |
As of April 30, 2023, the components of accumulated gain (loss) on a tax basis were as follows:
Ordinary
Income | Undistributed
Tax Exempt
Income | Accumulated
Capital
and Other
Gain (Loss) | Other
Temporary
Differences | Unrealized
Appreciation
(Depreciation) | Total
Accumulated
Gain (Loss) |
| $— | $2,409 | $(8,175,457) | $(183) | $4,056,285 | $(4,116,946) |
The difference between book-basis and tax-basis unrealized appreciation (depreciation) is primarily due to due to mark to market of futures contracts and premium amortization.
As of April 30, 2023, for federal income tax purposes, capital loss carryforwards of $8,175,457, as shown in the table below, were available to the extent provided by the regulations to offset future realized gains of the Fund. Accordingly, no capital gains distributions are expected to be paid to shareholders until net gains have been realized in excess of such amounts.
Capital Loss
Available Through | Short-Term
Capital Loss
Amounts (000’s) | Long-Term
Capital Loss
Amounts (000’s) |
| Unlimited | $4,755 | $3,420 |
During the years ended April 30, 2023 and April 30, 2022, the tax character of distributions paid as reflected in the Statements of Changes in Net Assets was as follows:
| | 2023 | 2022 |
| Distributions paid from: | | |
| Ordinary Income | $ 288,952 | $ 17,770 |
| Long-Term Capital Gains | 365,818 | 594,960 |
| Exempt Interest Dividends | 6,494,151 | 1,315,760 |
| Total | $7,148,921 | $1,928,490 |
Note 5–Custodian
JPMorgan is the custodian of cash and securities held by the Fund. Custodial fees are charged to the Fund based on the Fund's net assets and/or the market value of securities held by the Fund and the number of certain transactions incurred by the Fund.
Note 6–Line of Credit
The Fund and certain other funds managed by New York Life Investments maintain a line of credit with a syndicate of banks in order to secure a source of funds for temporary purposes to meet unanticipated or excessive redemption requests.
Effective July 26, 2022, under the credit agreement (the “Credit Agreement”), the aggregate commitment amount is $600,000,000 with an additional uncommitted amount of $100,000,000. The commitment fee is an annual rate of 0.15% of the average commitment amount payable quarterly, regardless of usage, to JPMorgan, who serves as the agent to the syndicate. The commitment fee is allocated among the Fund and certain other funds managed by New York Life Investments based upon their respective net assets and other factors. Interest on any revolving credit loan is charged based upon the Federal Funds Rate, Daily Simple Secured Overnight Financing Rate ("SOFR") + 0.10%, or the Overnight Bank Funding Rate, whichever is higher. The Credit Agreement expires on July 25, 2023, although the Fund, certain other funds managed by New York Life Investments and the syndicate of banks may renew the Credit Agreement for an additional year on the same or different terms or enter into a credit agreement with a different syndicate
Notes to Financial Statements (continued)
of banks. Prior to July 26, 2022, the aggregate commitment amount and the commitment fee were the same as those under the current Credit Agreement. During the year ended April 30, 2023, there were no borrowings made or outstanding with respect to the Fund under the Credit Agreement.
Note 7–Interfund Lending Program
Pursuant to an exemptive order issued by the SEC, the Fund, along with certain other funds managed by New York Life Investments, may participate in an interfund lending program. The interfund lending program provides an alternative credit facility that permits the Fund and certain other funds managed by New York Life Investments to lend or borrow money for temporary purposes directly to or from one another, subject to the conditions of the exemptive order. During the year ended April 30, 2023, there were no interfund loans made or outstanding with respect to the Fund.
Note 8–Purchases and Sales of Securities (in 000’s)
During the year ended April 30, 2023, purchases and sales of securities, other than short-term securities, were $409,814 and $160,451, respectively.
Note 9–Capital Share Transactions
Transactions in capital shares for the years ended April 30, 2023 and April 30, 2022, were as follows:
| Class A | Shares | Amount |
| Year ended April 30, 2023: | | |
| Shares sold | 4,521,934 | $ 42,589,581 |
| Shares issued to shareholders in reinvestment of distributions | 66,760 | 629,178 |
| Shares redeemed | (595,824) | (5,610,827) |
| Net increase (decrease) in shares outstanding before conversion | 3,992,870 | 37,607,932 |
| Shares converted into Class A (See Note 1) | 17,915 | 166,839 |
| Net increase (decrease) | 4,010,785 | $ 37,774,771 |
| Year ended April 30, 2022: | | |
| Shares sold | 627,789 | $ 6,160,870 |
| Shares issued to shareholders in reinvestment of distributions | 3,108 | 31,706 |
| Shares redeemed | (123,551) | (1,239,097) |
| Net increase (decrease) in shares outstanding before conversion | 507,346 | 4,953,479 |
| Shares converted into Class A (See Note 1) | 1,148 | 11,409 |
| Net increase (decrease) | 508,494 | $ 4,964,888 |
| |
| Investor Class | Shares | Amount |
| Year ended April 30, 2023: | | |
| Shares sold | 51,856 | $ 492,143 |
| Shares issued to shareholders in reinvestment of distributions | 345 | 3,235 |
| Shares redeemed | (28,623) | (267,552) |
| Net increase (decrease) in shares outstanding before conversion | 23,578 | 227,826 |
| Shares converted from Investor Class (See Note 1) | (17,939) | (166,839) |
| Net increase (decrease) | 5,639 | $ 60,987 |
| Year ended April 30, 2022: | | |
| Shares sold | 7,351 | $ 75,661 |
| Shares issued to shareholders in reinvestment of distributions | 128 | 1,306 |
| Shares redeemed | (5,527) | (54,397) |
| Net increase (decrease) in shares outstanding before conversion | 1,952 | 22,570 |
| Shares converted from Investor Class (See Note 1) | (269) | (2,812) |
| Net increase (decrease) | 1,683 | $ 19,758 |
| |
| Class C | Shares | Amount |
| Year ended April 30, 2023: | | |
| Shares sold | 330,090 | $ 3,098,482 |
| Shares issued to shareholders in reinvestment of distributions | 5,401 | 50,790 |
| Shares redeemed | (46,116) | (431,464) |
| Net increase (decrease) | 289,375 | $ 2,717,808 |
| Year ended April 30, 2022: | | |
| Shares sold | 67,637 | $ 681,825 |
| Shares issued to shareholders in reinvestment of distributions | 577 | 5,875 |
| Shares redeemed | (19,293) | (192,733) |
| Net increase (decrease) in shares outstanding before conversion | 48,921 | 494,967 |
| Shares converted from Class C (See Note 1) | (882) | (8,597) |
| Net increase (decrease) | 48,039 | $ 486,370 |
| |
| Class C2(a) | Shares | Amount |
| Period ended April 30, 2023: | | |
| Shares sold | 22,951 | $ 215,964 |
| Shares issued to shareholders in reinvestment of distributions | 160 | 1,515 |
| Shares redeemed | (454) | (4,320) |
| Net increase (decrease) | 22,657 | $ 213,159 |
| |
| 42 | MainStay MacKay Strategic Municipal Allocation Fund |
| Class I | Shares | Amount |
| Year ended April 30, 2023: | | |
| Shares sold | 41,397,550 | $ 388,470,731 |
| Shares issued to shareholders in reinvestment of distributions | 686,149 | 6,451,262 |
| Shares redeemed | (18,977,575) | (177,675,361) |
| Net increase (decrease) | 23,106,124 | $ 217,246,632 |
| Year ended April 30, 2022: | | |
| Shares sold | 5,207,450 | $ 51,686,935 |
| Shares issued to shareholders in reinvestment of distributions | 184,680 | 1,888,329 |
| Shares redeemed | (1,552,936) | (15,321,564) |
| Net increase (decrease) | 3,839,194 | $ 38,253,700 |
| |
| Class R6 | Shares | Amount |
| Year ended April 30, 2023: | | |
| Shares issued to shareholders in reinvestment of distributions | 89 | $ 842 |
| Net increase (decrease) | 89 | $ 842 |
| Year ended April 30, 2022: | | |
| Shares issued to shareholders in reinvestment of distributions | 75 | $ 768 |
| Net increase (decrease) | 75 | $ 768 |
| (a) | The inception of the class was December 13, 2023. |
Note 10–Other Matters
As of the date of this report, interest rates in the United States and many parts of the world, including certain European countries, continue to ascend from historically low levels. Thus, the Fund currently faces a heightened level of risk associated with rising interest rates. This could be driven by a variety of factors, including but not limited to central bank monetary policies, changing inflation or real growth rates, general economic conditions, increasing bond issuances or reduced market demand for low yielding investments.
Social, political, economic and other conditions and events, such as war, natural disasters, health emergencies (e.g., epidemics and pandemics), terrorism, conflicts, social unrest, recessions, inflation, rapid interest rate changes and supply chain disruptions, may occur and could significantly impact the Fund, issuers, industries, governments and other systems, including the financial markets. Developments that disrupt global economies and financial markets, such as COVID-19, the conflict in Ukraine, and the failures of certain U.S. and non-U.S. banks, may magnify factors that affect the Fund's performance.
Note 11–Subsequent Events
In connection with the preparation of the financial statements of the Fund as of and for the year ended April 30, 2023, events and transactions subsequent to April 30, 2023, through the date the financial statements were issued have been evaluated by the Manager for possible adjustment
and/or disclosure. No subsequent events requiring financial statement adjustment or disclosure have been identified, other than the following:
At meetings held on December 6-7, 2022, the Board of Trustees of MainStay Funds Trust approved the change of the Fund's fiscal year end from April 30th to October 31st effective May 1, 2023.
Report of Independent Registered Public Accounting Firm
To the Shareholders of the Fund and Board of Trustees
MainStay Funds Trust:
Opinion on the Financial Statements
We have audited the accompanying statement of assets and liabilities of MainStay MacKay Strategic Municipal Allocation Fund (the Fund), one of the funds constituting MainStay Funds Trust, including the portfolio of investments, as of April 30, 2023, the related statement of operations for the year then ended, the statements of changes in net assets for each of the years in the two-year period then ended, and the related notes (collectively, the financial statements) and the financial highlights for each of the years or periods in the three-year period then ended and the period June 28, 2019 (commencement of operations) through April 30, 2020. In our opinion, the financial statements and financial highlights present fairly, in all material respects, the financial position of the Fund as of April 30, 2023, the results of its operations for the year then ended, the changes in its net assets for each of the years in the two-year period then ended, and the financial highlights for each of the years or periods in the three-year period then ended and the period June 28, 2019 through April 30, 2020, in conformity with U.S. generally accepted accounting principles.
Basis for Opinion
These financial statements and financial highlights are the responsibility of the Fund's management. Our responsibility is to express an opinion on these financial statements and financial highlights based on our audits. We are a public accounting firm registered with the Public Company Accounting Oversight Board (United States) (PCAOB) and are required to be independent with respect to the Fund in accordance with the U.S. federal securities laws and the applicable rules and regulations of the Securities and Exchange Commission and the PCAOB.
We conducted our audits in accordance with the standards of the PCAOB. Those standards require that we plan and perform the audit to obtain reasonable assurance about whether the financial statements and financial highlights are free of material misstatement, whether due to error or fraud. Our audits included performing procedures to assess the risks of material misstatement of the financial statements and financial highlights, whether due to error or fraud, and performing procedures that respond to those risks. Such procedures included examining, on a test basis, evidence regarding the amounts and disclosures in the financial statements and financial highlights. Such procedures also included confirmation of securities owned as of April 30, 2023, by correspondence with the custodian and brokers; when replies were not received from brokers, we performed other auditing procedures. Our audits also included evaluating the accounting principles used and significant estimates made by management, as well as evaluating the overall presentation of the financial statements and financial highlights. We believe that our audits provide a reasonable basis for our opinion.

We have served as the auditor of one or more New York Life Investment Management investment companies since 2003.
Philadelphia, Pennsylvania
June 23, 2023
| 44 | MainStay MacKay Strategic Municipal Allocation Fund |
Board Consideration and Approval of Management Agreement and Subadvisory Agreement (Unaudited)
The continuation of the Management Agreement with respect to the MainStay MacKay Strategic Municipal Allocation Fund (“Fund”) and New York Life Investment Management LLC (“New York Life Investments”) and the Subadvisory Agreement between New York Life Investments and MacKay Shields LLC (“MacKay”) with respect to the Fund (together, “Advisory Agreements”) is subject to annual review and approval by the Board of Trustees of MainStay Funds Trust (“Board” of the “Trust”) in accordance with Section 15 of the Investment Company Act of 1940, as amended (“1940 Act”). At its December 6–7, 2022 meeting, the Board, which is comprised solely of Trustees who are not an “interested person” (as such term is defined in the 1940 Act) of the Trust (“Independent Trustees”), unanimously approved the continuation of each of the Advisory Agreements for a one-year period.
In reaching the decision to approve the continuation of each of the Advisory Agreements, the Board considered information and materials furnished by New York Life Investments and MacKay in connection with an annual contract review process undertaken by the Board that took place at meetings of the Board and its Contracts Committee during October 2022 through December 2022, including information and materials furnished by New York Life Investments and MacKay in response to requests prepared on behalf of the Board, and in consultation with the Board, by independent legal counsel to the Independent Trustees, which encompassed a variety of topics, including those summarized below. Information and materials requested by and furnished to the Board for consideration in connection with the contract review process included, among other items, reports on the Fund and “peer funds” prepared by Institutional Shareholder Services Inc. (“ISS”), an independent third-party service provider engaged by the Board to report objectively on the Fund’s investment performance, management fee and total expenses. The Board also considered information on the fees charged to other investment advisory clients of New York Life Investments and/or MacKay that follow investment strategies similar to those of the Fund, if any, and, when applicable, the rationale for any differences in the Fund’s management and subadvisory fees and the fees charged to those other investment advisory clients. In addition, the Board considered information regarding the legal standards and fiduciary obligations applicable to its consideration of the continuation of each of the Advisory Agreements. The contract review process, including the structure and format for information and materials provided to the Board, has been developed in consultation with the Board. The Independent Trustees also met in executive sessions with their independent legal counsel and, for portions thereof, with senior management of New York Life Investments.
The Board’s deliberations with respect to the continuation of each of the Advisory Agreements reflect a year-long process, and the Board also took into account information furnished to the Board and its Committees throughout the year, as deemed relevant and appropriate by the Trustees, including, among other items, reports on investment performance of the Fund and investment-related matters for the Fund as well as presentations from New York Life Investments and, generally annually, MacKay personnel. In addition, the Board took into account other information provided by New York Life Investments throughout the year,
including, among other items, periodic reports on legal and compliance matters, risk management, portfolio turnover, brokerage commissions and non-advisory services provided to the Fund by New York Life Investments, as deemed relevant and appropriate by the Trustees.
In addition to information provided to the Board throughout the year, the Board received information in connection with its June 2022 meeting provided specifically in response to requests prepared on behalf of the Board, and in consultation with the Board, by independent legal counsel to the Independent Trustees regarding the Fund’s distribution arrangements. In addition, the Board received information regarding the Fund’s asset levels, share purchase and redemption activity and the payment of Rule 12b-1 and/or certain other fees by the applicable share classes of the Fund, among other information.
In considering the continuation of each of the Advisory Agreements, the Trustees reviewed and evaluated the information and factors they believed to reasonably be necessary and appropriate in light of legal advice furnished to them by independent legal counsel to the Independent Trustees and through the exercise of their own business judgment. Although individual Trustees may have weighed certain factors or information differently and the Board did not consider any single factor or information controlling in reaching its decision, the factors that figured prominently in the Board’s consideration of the continuation of each of the Advisory Agreements are summarized in more detail below and include, among other factors: (i) the nature, extent and quality of the services provided to the Fund by New York Life Investments and MacKay; (ii) the qualifications of the portfolio managers of the Fund and the historical investment performance of the Fund, New York Life Investments and MacKay; (iii) the costs of the services provided, and profits realized, by New York Life Investments and MacKay with respect to their relationships with the Fund; (iv) the extent to which economies of scale have been realized or may be realized if the Fund grows and the extent to which any economies of scale have been shared, have benefited or may benefit the Fund’s shareholders; and (v) the reasonableness of the Fund’s management and subadvisory fees and total ordinary operating expenses. Although the Board recognized that comparisons between the Fund’s fees and expenses and those of other funds are imprecise given different terms of agreements, variations in fund strategies and other factors, the Board considered the reasonableness of the Fund’s management fee and total ordinary operating expenses as compared to the peer funds identified by ISS. Throughout their considerations, the Trustees acknowledged the commitment of New York Life Investments and its affiliates to serve the MainStay Group of Funds, as well as their capacity, experience, resources, financial stability and reputations. The Trustees also acknowledged the entrepreneurial and other risks assumed by New York Life Investments in sponsoring and managing the Fund. With respect to the Subadvisory Agreement, the Board took into account New York Life Investments’ recommendation to approve the continuation of the Subadvisory Agreement.
The Trustees noted that, throughout the year, the Trustees are afforded an opportunity to ask questions of, and request additional information or materials from, New York Life Investments and MacKay. The Board’s
Board Consideration and Approval of Management Agreement and Subadvisory Agreement (Unaudited) (continued)
decision with respect to each of the Advisory Agreements may have also been based, in part, on the Board’s knowledge of New York Life Investments and MacKay resulting from, among other things, the Board’s consideration of each of the Advisory Agreements in prior years, the advisory agreements for other funds in the MainStay Group of Funds, the Board’s review throughout the year of the performance and operations of other funds in the MainStay Group of Funds and each Trustee’s business judgment and industry experience. In addition to considering the above-referenced factors, the Board observed that in the marketplace there are a range of investment options available to investors and that the Fund’s shareholders, having had the opportunity to consider other investment options, have chosen to invest in the Fund.
The factors that figured prominently in the Board’s decision to approve the continuation of each of the Advisory Agreements during its December 6–7, 2022 meeting are summarized in more detail below.
Nature, Extent and Quality of Services Provided by New York Life Investments and MacKay
The Board examined the nature, extent and quality of the services that New York Life Investments provides to the Fund. The Board evaluated New York Life Investments’ experience and capabilities in serving as manager of the Fund and considered that the Fund operates in a “manager-of-managers” structure. The Board also considered New York Life Investments’ responsibilities and services provided pursuant to this structure, including overseeing the services provided by MacKay, evaluating the performance of MacKay, making recommendations to the Board as to whether the Subadvisory Agreement should be renewed, modified or terminated and periodically reporting to the Board regarding the results of New York Life Investments’ evaluation and monitoring functions. The Board noted that New York Life Investments manages other mutual funds, serves a variety of other investment advisory clients, including other pooled investment vehicles, and has experience overseeing mutual fund service providers, including subadvisors. The Board considered the experience of senior personnel at New York Life Investments providing management and administrative and other non-advisory services to the Fund. The Board observed that New York Life Investments devotes significant resources and time to providing management and administrative and other non-advisory services to the Fund, including New York Life Investments’ oversight and due diligence reviews of MacKay and ongoing analysis of, and interactions with, MacKay with respect to, among other things, the Fund’s investment performance and risks as well as MacKay’s investment capabilities and subadvisory services with respect to the Fund.
The Board also considered the range of services that New York Life Investments provides to the Fund under the terms of the Management Agreement, including: (i) fund accounting and ongoing supervisory services provided by New York Life Investments’ Fund Administration and Accounting Group; (ii) investment supervisory and analytical services provided by New York Life Investments’ Investment Consulting Group; (iii) compliance services provided by the Trust’s Chief Compliance Officer as well as New York Life Investments’ compliance department, including
supervision and implementation of the Fund’s compliance program; (iv) legal services provided by New York Life Investments’ Office of the General Counsel; and (v) risk management monitoring and analysis by compliance and investment personnel. In addition, the Board considered New York Life Investments’ willingness to invest in personnel and other resources, such as cyber security, information security and business continuity planning, designed to benefit the Fund and noted that New York Life Investments is responsible for compensating the Trust’s officers, except for a portion of the salary of the Trust’s Chief Compliance Officer. The Board recognized that New York Life Investments provides certain other non-advisory services to the Fund and has provided an increasingly broad array of non-advisory services to the MainStay Group of Funds as a result of regulatory and other developments, including in connection with the implementation of the MainStay Group of Funds’ derivatives risk management program and policies and procedures adopted pursuant to Rule 18f-4 under the 1940 Act. The Board considered benefits to the Fund’s shareholders from the Fund being part of the MainStay Group of Funds, including the ability to exchange investments between the same class of shares of funds in the MainStay Group of Funds, including without the imposition of a sales charge (if any).
The Board also examined the range, and the nature, extent and quality, of the investment advisory services that MacKay provides to the Fund and considered the terms of each of the Advisory Agreements. The Board evaluated MacKay’s experience and performance in serving as subadvisor to the Fund and advising other portfolios and MacKay’s track record and experience in providing investment advisory services as well as the experience of investment advisory, senior management and administrative personnel at MacKay. The Board considered New York Life Investments’ and MacKay’s overall resources, legal and compliance environment, capabilities, reputation, financial condition and history. In addition to information provided in connection with quarterly meetings with the Trust’s Chief Compliance Officer, the Board considered information regarding the compliance policies and procedures of New York Life Investments and MacKay and acknowledged their commitment to further developing and strengthening compliance programs relating to the Fund. The Board also considered MacKay’s ability to recruit and retain qualified investment professionals and willingness to invest in personnel and other resources to service and support the Fund. In this regard, the Board considered the qualifications and experience of the Fund’s portfolio managers, the number of accounts managed by the portfolio managers and the method for compensating the portfolio managers.
In addition, the Board considered information provided by New York Life Investments and MacKay regarding the operations of their respective business continuity plans in response to the COVID-19 pandemic and the continued remote work environment.
Based on these considerations, among others, the Board concluded that the Fund would likely continue to benefit from the nature, extent and quality of these services.
| 46 | MainStay MacKay Strategic Municipal Allocation Fund |
Investment Performance
In evaluating the Fund’s investment performance, the Board considered investment performance results over various periods in light of the Fund’s investment objective, strategies and risks. The Board considered investment reports on, and analysis of, the Fund’s performance provided to the Board throughout the year. These reports include, among other items, information on the Fund’s gross and net returns, the Fund’s investment performance compared to a relevant investment category and the Fund’s benchmark, the Fund’s risk-adjusted investment performance and the Fund’s investment performance as compared to peer funds, as appropriate, as well as portfolio attribution information and commentary on the effect of market conditions. The Board also considered information provided by ISS showing the investment performance of the Fund as compared to peer funds. In addition, the Board reviewed the methodology used by ISS to construct the group of peer funds for comparative purposes.
The Board also took into account its discussions with senior management at New York Life Investments concerning the Fund’s investment performance over various periods as well as discussions between the Fund’s portfolio management team and the members of the Board’s Investment Committee, which generally occur on an annual basis. In addition, the Board considered any specific actions that New York Life Investments or MacKay had taken, or had agreed to take, to seek to enhance Fund investment performance and the results of those actions.
Based on these considerations, among others, the Board concluded that its review of the Fund’s investment performance and related information supported a determination to approve the continuation of each of the Advisory Agreements.
Costs of the Services Provided, and Profits and Other Benefits Realized, by New York Life Investments and MacKay
The Board considered the costs of the services provided under each of the Advisory Agreements. The Board also considered the profits realized by New York Life Investments and its affiliates, including MacKay, due to their relationships with the Fund as well as the MainStay Group of Funds. Because MacKay is an affiliate of New York Life Investments whose subadvisory fee is paid by New York Life Investments, not the Fund, the Board considered cost and profitability information for New York Life Investments and MacKay in the aggregate.
In addition, the Board acknowledged the difficulty in obtaining reliable comparative data about mutual fund managers’ profitability because such information generally is not publicly available and may be impacted by numerous factors, including the structure of a fund manager’s organization, the types of funds it manages, the methodology used to allocate certain fixed costs to specific funds and the manager’s capital structure and costs of capital.
In evaluating the costs of the services provided by New York Life Investments and MacKay and profits realized by New York Life Investments and its affiliates, including MacKay, the Board considered,
among other factors, New York Life Investments’ and its affiliates’, including MacKay’s, continuing investments in, or willingness to invest in, personnel and other resources to support and further enhance the management of the Fund, and that New York Life Investments is responsible for paying the subadvisory fee for the Fund. The Board also considered the financial resources of New York Life Investments and MacKay and acknowledged that New York Life Investments and MacKay must be in a position to recruit and retain experienced professional personnel and to maintain a strong financial position for New York Life Investments and MacKay to continue to provide high-quality services to the Fund. The Board recognized that the Fund benefits from the allocation of certain fixed costs among the funds in the MainStay Group of Funds, among other expected benefits resulting from its relationship with New York Life Investments.
The Board considered information regarding New York Life Investments’ methodology for calculating profitability and allocating costs provided by New York Life Investments in connection with the fund profitability analysis presented to the Board. The Board noted it had previously engaged an independent consultant to review the methods used to allocate costs among the funds in the MainStay Group of Funds. The Board also noted that the independent consultant had concluded that New York Life Investments’ methods for allocating costs and procedures for estimating overall profitability of the relationship with the funds in the MainStay Group of Funds are reasonable and that New York Life Investments continued to use the same method of calculating profit and allocating costs since the independent consultant’s review. The Board recognized the difficulty in calculating and evaluating a manager’s profitability with respect to the Fund and considered that other profitability methodologies may also be reasonable.
The Board also considered certain fall-out benefits that may be realized by New York Life Investments and its affiliates, including MacKay, due to their relationships with the Fund, including reputational and other indirect benefits. The Board recognized, for example, the benefits to MacKay from legally permitted “soft-dollar” arrangements by which brokers provide research and other services to MacKay in exchange for commissions paid by the Fund with respect to trades in the Fund’s portfolio securities. In addition, the Board considered its review of the management agreement for a money market fund advised by New York Life Investments and an affiliated subadvisor that serves as an investment option for the Fund, including the potential rationale for and costs associated with investments in this money market fund by the Fund, if any, and considered information from New York Life Investments that the nature and type of specific investment advisory services provided to this money market fund are distinct from, or in addition to, the investment advisory services provided to the Fund.
The Board observed that, in addition to fees earned by New York Life Investments under the Management Agreement for managing the Fund, New York Life Investments’ affiliates also earn revenues from serving the Fund in various other capacities, including as the Fund’s transfer agent and distributor. The Board considered information about these other revenues and their impact on the profitability of the relationship with the
Board Consideration and Approval of Management Agreement and Subadvisory Agreement (Unaudited) (continued)
Fund to New York Life Investments and its affiliates. The Board noted that, although it assessed the overall profitability of the relationship with the Fund to New York Life Investments and its affiliates as part of the contract review process, when considering the reasonableness of the fee paid to New York Life Investments under the Management Agreement, the Board considered the profitability of New York Life Investments’ relationship with the Fund on a pre-tax basis and without regard to distribution expenses incurred by New York Life Investments from its own resources.
After evaluating the information deemed relevant by the Trustees, the Board concluded that any profits realized by New York Life Investments and its affiliates, including MacKay, due to their relationships with the Fund were not excessive and other expected benefits that may accrue to New York Life Investments and its affiliates, including MacKay, are reasonable.
Management and Subadvisory Fees and Total Ordinary Operating Expenses
The Board evaluated the reasonableness of the fee paid under each of the Advisory Agreements and the Fund’s total ordinary operating expenses. The Board primarily considered the reasonableness of the management fee paid by the Fund to New York Life Investments because the subadvisory fee paid to MacKay is paid by New York Life Investments, not the Fund. The Board also considered the reasonableness of the subadvisory fee paid by New York Life Investments and the amount of the management fee retained by New York Life Investments.
In assessing the reasonableness of the Fund’s fees and expenses, the Board primarily considered comparative data provided by ISS on the fees and expenses charged by similar mutual funds managed by other investment advisers. The Board reviewed the methodology used by ISS to construct the group of peer funds for comparative purposes. In addition, the Board considered information provided by New York Life Investments and MacKay on fees charged to other investment advisory clients, including institutional separate accounts and/or other funds that follow investment strategies similar to those of the Fund, if any. The Board considered the contractual management fee schedules of the Fund as compared to those of such other investment advisory clients, taking into account the rationale for any differences in fee schedules. The Board also took into account information provided by New York Life Investments about the more extensive scope of services provided to registered investment companies, such as the Fund, as compared with other investment advisory clients. Additionally, the Board considered the impact of voluntary waivers and expense limitation arrangements on the Fund’s net management fee and expenses. The Board also considered that in proposing fees for the Fund, New York Life Investments considers the competitive marketplace for mutual funds.
The Board took into account information from New York Life Investments, as provided in connection with the Board’s June 2022 meeting, regarding the reasonableness of the Fund’s transfer agent fee schedule, including industry data demonstrating that the fees that NYLIM Service Company LLC, an affiliate of New York Life Investments and the Fund’s
transfer agent, charges the Fund are within the range of fees charged by transfer agents to other mutual funds. In addition, the Board considered NYLIM Service Company LLC’s profitability in connection with the transfer agent services it provides to the Fund. The Board also took into account information provided by NYLIM Service Company LLC regarding the sub-transfer agency payments it made to intermediaries in connection with the provision of sub-transfer agency services to the Fund.
The Board considered the extent to which transfer agent fees contributed to the total expenses of the Fund. The Board acknowledged the role that the MainStay Group of Funds historically has played in serving the investment needs of New York Life Insurance Company customers, who often maintain smaller account balances than other shareholders of funds, and the impact of small accounts on the expense ratios of Fund share classes. The Board also recognized measures that it and New York Life Investments have taken intended to mitigate the effect of small accounts on the expense ratios of Fund share classes, including through the imposition of an expense limitation on net transfer agency expenses. The Board also considered that NYLIM Service Company LLC had waived its contractual cost of living adjustments during the seven years prior to 2021.
Based on the factors outlined above, among other considerations, the Board concluded that the Fund’s management fee and total ordinary operating expenses are within a range that is competitive and support a conclusion that these fees and expenses are reasonable.
Economies of Scale
The Board considered information regarding economies of scale, including whether economies of scale may exist for the Fund and whether the Fund’s expense structure permits any economies of scale to be appropriately shared with the Fund’s shareholders. The Board also considered a report from New York Life Investments, previously prepared at the request of the Board, that addressed economies of scale, including with respect to the mutual fund business generally, and the various ways in which the benefits of economies of scale may be shared with the funds in the MainStay Group of Funds. Although the Board recognized the difficulty of determining economies of scale with precision, the Board acknowledged that economies of scale may be shared with the Fund in a number of ways, including, for example, through the imposition of fee breakpoints, initially setting management fee rates at scale or making additional investments to enhance the services provided to the Fund. The Board reviewed information from New York Life Investments showing how the Fund’s management fee schedule compared to fee schedules of other funds and accounts managed by New York Life Investments. The Board also reviewed information from ISS showing how the Fund’s management fee schedule compared with fees paid for similar services by peer funds at varying asset levels.
Based on this information, the Board concluded that economies of scale are appropriately shared for the benefit of the Fund’s shareholders through the Fund’s expense structure and other methods to share benefits from economies of scale.
| 48 | MainStay MacKay Strategic Municipal Allocation Fund |
Conclusion
On the basis of the information and factors summarized above, among other information and factors deemed relevant by the Trustees, and the evaluation thereof, the Board unanimously voted to approve the continuation of each of the Advisory Agreements.
Discussion of the Operation and Effectiveness of the Fund's Liquidity Risk Management Program (Unaudited)
In compliance with Rule 22e-4 under the Investment Company Act of 1940, as amended (the “Liquidity Rule”), the Fund has adopted and implemented a liquidity risk management program (the “Program”), which New York Life Investment Management LLC believes is reasonably designed to assess and manage the Fund's liquidity risk. A Fund's liquidity risk is the risk that the Fund could not meet requests to redeem shares issued by the Fund without significant dilution of the remaining investors’ interests in the Fund. The Board of Trustees of MainStay Funds Trust (the "Board") previously approved the designation of New York Life Investment Management LLC as administrator of the Program (the “Administrator”). The Administrator has established a Liquidity Risk Management Committee to assist the Administrator in the implementation and day-to-day administration of the Program and to otherwise support the Administrator in fulfilling its responsibilities under the Program.
At a meeting of the Board held on February 28, 2023, the Administrator provided the Board with a written report addressing the Program’s operation and assessing the adequacy and effectiveness of its implementation for the period from January 1, 2022, through December 31, 2022 (the "Review Period"), as required under the Liquidity Rule. The report noted that the Administrator concluded that (i) the Program operated effectively to assess and manage the Fund's liquidity risk, (ii) the Program has been and continues to be adequately and effectively implemented to monitor and, as applicable, respond to the Fund's liquidity developments and (iii) the Fund's investment strategy continues to be appropriate for an open-end fund. In addition, the report summarized the operation of the Program and the information and factors considered by the Administrator in its assessment of the Program’s implementation, such as the liquidity risk assessment framework and the liquidity classification methodologies, and discussed notable geopolitical, market and other economic events that impacted liquidity risk during the Review Period.
In accordance with the Program, the Fund's liquidity risk is assessed no less frequently than annually taking into consideration certain factors, as applicable, such as (i) investment strategy and liquidity of portfolio investments, (ii) short-term and long-term cash flow projections, and (iii) holdings of cash and cash equivalents, as well as borrowing arrangements and other funding sources. Certain factors are considered under both normal and reasonably foreseeable stressed conditions.
Each Fund portfolio investment is classified into one of four liquidity categories. The classification is based on a determination of the number of days it is reasonably expected to take to convert the investment into cash, or sell or dispose of the investment, in current market conditions without significantly changing the market value of the investment. The Administrator has delegated liquidity classification determinations to the Fund’s subadvisor, subject to appropriate oversight by the Administrator, and liquidity classification determinations are made by taking into account the Fund's reasonably anticipated trade size, various market, trading and investment-specific considerations, as well as market depth, and, in certain cases, third-party vendor data.
The Liquidity Rule requires funds that do not primarily hold assets that are highly liquid investments to adopt a minimum amount of net assets that must be invested in highly liquid investments that are assets (an “HLIM”). In addition, the Liquidity Rule limits a fund's investments in illiquid investments. Specifically, the Liquidity Rule prohibits acquisition of illiquid investments if, immediately after acquisition, doing so would result in a fund holding more than 15% of its net assets in illiquid investments that are assets. The Program includes provisions reasonably designed to determine, periodically review and comply with the HLIM requirement, as applicable, and to comply with the 15% limit on illiquid investments.
There can be no assurance that the Program will achieve its objectives under all circumstances in the future. Please refer to the Fund's prospectus for more information regarding the Fund's exposure to liquidity risk and other risks to which it may be subject.
| 50 | MainStay MacKay Strategic Municipal Allocation Fund |
Federal Income Tax
Information (Unaudited)
The Fund is required under the Internal Revenue Code to advise shareholders in a written statement as to the federal tax status of dividends paid by the Fund during such fiscal years. Accordingly, the Fund paid $365,818 as long term capital gain distributions.
For Federal individual income tax purposes, the Fund designated 95.7% of the ordinary income dividends paid during its fiscal year ended April 30, 2023 as attributable to interest income from Tax Exempt Municipal Bonds. Such dividends are currently exempt from Federal income taxes under Section 103(a) of the Internal Revenue Code.
In February 2024, shareholders will receive an IRS Form 1099-DIV or substitute Form 1099, which will show the federal tax status of the distributions received by shareholders in calendar year 2023. The amounts that will be reported on such 1099-DIV or substitute Form 1099 will be the amounts you are to use on your federal income tax return and will differ from the amounts which we must report for the Fund's fiscal year ended April 30, 2023.
Proxy Voting Policies and Procedures and Proxy Voting Record
The Fund is required to file with the SEC its proxy voting record for the 12-month period ending June 30 on Form N-PX. A description of the policies and procedures that are used to vote proxies relating to portfolio securities of the Fund is available free of charge upon request by calling 800-624-6782 or visiting the SEC’s website at www.sec.gov. The most recent Form N-PX or proxy voting record is available free of charge upon request by calling 800-624-6782; visiting newyorklifeinvestments.com; or visiting the SEC’s website at www.sec.gov.
Shareholder Reports and Quarterly Portfolio Disclosure
The Fund is required to file its complete schedule of portfolio holdings with the SEC 60 days after its first and third fiscal quarter on Form N-PORT. The Fund's holdings report is available free of charge upon request by calling New York Life Investments at 800-624-6782.
Board of Trustees and Officers (Unaudited)
The Trustees and officers of the Fund are listed below. The Board oversees the MainStay Group of Funds (which consists of MainStay Funds and MainStay Funds Trust), MainStay VP Funds Trust, MainStay MacKay DefinedTerm Municipal Opportunities Fund, MainStay CBRE Global Infrastructure Megatrends Fund, the Manager and the Subadvisors, and elects the officers of the Funds who are responsible for the day-to-day operations of the Fund. Information pertaining to the Trustees and officers is set forth below. Each Trustee serves until his or her successor is elected and qualified or until his or her resignation, death or removal.
Under the Board’s retirement policy, unless an exception is made, a Trustee must tender his or her resignation by the end of the calendar year during which he or she reaches the age of 75. Officers are elected annually by the Board. The business address of each Trustee and officer listed below is 51 Madison Avenue, New York, New York 10010. A majority of the Trustees are not “interested persons” (as defined by the 1940 Act and rules adopted by the SEC thereunder) of the Fund (“Independent Trustees”).
| | Name and
Year of Birth | Term of Office,
Position(s) Held and
Length of Service | Principal Occupation(s)
During Past Five Years | Number of
Portfolios in
Fund Complex
Overseen by
Trustee | Other Directorships
Held by Trustee |
| | | | | | |
| | Naïm Abou-Jaoudé*
1966 | MainStay Funds: Trustee
since June 2023;
MainStay Funds Trust:
Trustee since June 2023 | Chief Executive Officer of New York Life Investment Management LLC since 2023. Previously, Abou-Jaoudé was the Chief Executive Officer of Candriam (an affiliate of New York Life Investment Management LLC) from 2007 to 2023. | 79 | MainStay VP Funds Trust:
Trustee since June 2023 (31 portfolios);
MainStay MacKay DefinedTerm Municipal Opportunities Fund: Trustee
since June 2023;
MainStay CBRE Global Infrastructure Megatrends Fund: Trustee
since June 2023; and
New York Life Investment Management International: Chair since 2015 |
| * | This Trustee is considered to be an “interested person” of the MainStay Group of Funds, MainStay VP Funds Trust, MainStay CBRE Global Infrastructure Megatrends Fund and MainStay MacKay DefinedTerm Municipal Opportunities Fund, within the meaning of the 1940 Act because of his affiliation with New York Life Insurance Company, New York Life Investment Management LLC, Candriam, IndexIQ Advisors LLC, MacKay Shields LLC, NYL Investors LLC, NYLIFE Securities LLC and/or NYLIFE Distributors LLC, as described in detail above in the column entitled “Principal Occupation(s) During Past Five Years.” |
| | |
| 52 | MainStay MacKay Strategic Municipal Allocation Fund |
| | Name and
Year of Birth | Term of Office,
Position(s) Held and
Length of Service | Principal Occupation(s)
During Past Five Years | Number of
Portfolios in
Fund Complex
Overseen by
Trustee | Other Directorships
Held by Trustee |
| | | | | | |
| | David H. Chow
1957 | MainStay Funds: Trustee since January 2016, Advisory Board Member (June 2015 to December 2015);MainStay Funds Trust:
Trustee since January 2016, Advisory Board Member (June 2015 to December 2015) | Founder and CEO, DanCourt Management, LLC (since 1999) | 79 | MainStay VP Funds Trust: Trustee since January 2016, Advisory Board Member (June 2015 to December 2015) (31 portfolios);
MainStay MacKay DefinedTerm Municipal Opportunities Fund: Trustee since January 2016, Advisory Board Member (June 2015 to December 2015);
MainStay CBRE Global Infrastructure Megatrends Fund: Trustee since June 2021; VanEck Vectors Group of Exchange-Traded Funds: Trustee since 2006 and Independent Chairman of the Board of Trustees from 2008 to 2022 (57 portfolios); Berea College of Kentucky: Trustee since 2009, Chair of the Investment Committee since 2018 |
| | Karen Hammond
1956 | MainStay Funds: Trustee since December 2021, Advisory Board Member (June 2021 to December 2021);MainStay Funds Trust:
Trustee since December 2021, Advisory Board Member (June 2021 to December 2021)
| Retired, Managing Director, Devonshire Investors (2007 to 2013); Senior Vice President, Fidelity Management & Research Co. (2005 to 2007); Senior Vice President and Corporate Treasurer, FMR Corp. (2003 to 2005); Chief Operating Officer, Fidelity Investments Japan (2001 to 2003) | 79 | MainStay VP Funds Trust: Trustee since December 2021, Advisory Board Member (June 2021 to December 2021) (31 portfolios);
MainStay MacKay DefinedTerm Municipal Opportunities Fund: Trustee since December 2021, Advisory Board Member (June 2021 to December 2021);
MainStay CBRE Global Infrastructure Megatrends Fund: Trustee since December 2021, Advisory Board Member (June 2021 to December 2021);
Two Harbors Investment Corp.: Director since 2018;
Rhode Island State Investment Commission: Member since 2017; and
Blue Cross Blue Shield of Rhode Island: Director since 2019 |
| | Susan B. Kerley
1951 | MainStay Funds: Chairman since January 2017 and Trustee since 2007;MainStay Funds Trust:
Chairman since January 2017 and Trustee since 1990** | President, Strategic Management Advisors LLC (since 1990) | 79 | MainStay VP Funds Trust: Chairman since January 2017 and Trustee since 2007 (31 portfolios)*;
MainStay MacKay DefinedTerm Municipal Opportunities Fund: Chairman since January 2017 and Trustee since 2011;
MainStay CBRE Global Infrastructure Megatrends Fund: Trustee since June 2021; and Legg Mason Partners Funds: Trustee since 1991 (45 portfolios) |
| | Alan R. Latshaw
1951 | MainStay Funds: Trusteesince 2006;MainStay Funds Trust:
Trustee since 2007** | Retired; Partner, Ernst & Young LLP (2002 to 2003); Partner, Arthur Andersen LLP (1989 to 2002); Consultant to the MainStay Funds Audit and Compliance Committee (2004 to 2006) | 79 | MainStay VP Funds Trust: Trustee since 2007 (31 portfolios)*;
MainStay MacKay DefinedTerm Municipal Opportunities Fund: Trustee since 2011; and
MainStay CBRE Global Infrastructure Megatrends Fund: Trustee since June 2021 |
Board of Trustees and Officers (Unaudited) (continued)
| | Name and
Year of Birth | Term of Office,
Position(s) Held and
Length of Service | Principal Occupation(s)
During Past Five Years | Number of
Portfolios in
Fund Complex
Overseen by
Trustee | Other Directorships
Held by Trustee |
| | | | | | |
| | Jacques P. Perold
1958 | MainStay Funds: Trustee since January 2016, Advisory Board Member (June 2015to December 2015);MainStay Funds Trust:
Trustee since January 2016, Advisory Board Member (June 2015 to December 2015) | Founder and Chief Executive Officer, CapShift Advisors LLC (since 2018); President, Fidelity Management & Research Company (2009 to 2014); President and Chief Investment Officer, Geode Capital Management, LLC (2001 to 2009) | 79 | MainStay VP Funds Trust: Trustee since January 2016, Advisory Board Member (June 2015 to December 2015) (31 portfolios);
MainStay MacKay DefinedTerm Municipal Opportunities Fund: Trustee since January 2016, Advisory Board Member (June 2015 to December 2015);
MainStay CBRE Global Infrastructure Megatrends Fund: Trustee since June 2021; Allstate Corporation: Director since 2015; and MSCI Inc.: Director since 2017 |
| | Richard S. Trutanic
1952 | MainStay Funds: Trustee since 1994;MainStay Funds Trust:
Trustee since 2007** | Chairman and Chief Executive Officer, Somerset & Company (financial advisory firm) (since 2004); Managing Director, The Carlyle Group (private investment firm) (2002 to 2004); Senior Managing Director, Partner and Board Member, Groupe Arnault S.A. (private investment firm) (1999 to 2002) | 79 | MainStay VP Funds Trust: Trustee since 2007 (31 portfolios)*;
MainStay MacKay DefinedTerm Municipal Opportunities Fund: Trustee since 2011; and MainStay CBRE Global Infrastructure Megatrends Fund: Trustee since June 2021 |
| * | Includes prior service as a Director of MainStay VP Series Fund, Inc., the predecessor to MainStay VP Funds Trust. |
| ** | Includes prior service as a Director/Trustee of certain predecessor entities to MainStay Funds Trust. |
| 54 | MainStay MacKay Strategic Municipal Allocation Fund |
| | Name and
Year of Birth | Position(s) Held and
Length of Service | Principal Occupation(s)
During Past Five Years | |
| | | | | |
| | Kirk C. Lehneis
1974 | President, MainStay Funds, MainStay Funds Trust (since 2017) | Chief Operating Officer and Senior Managing Director (since 2016), New York Life Investment Management LLC and New York Life Investment Management Holdings LLC; Member of the Board of Managers (since 2017) and Senior Managing Director (since 2018), NYLIFE Distributors LLC; Chairman of the Board and Senior Managing Director, NYLIM Service Company LLC (since 2017); Trustee, President and Principal Executive Officer of IndexIQ Trust, IndexIQ ETF Trust and IndexIQ Active ETF Trust (since January 2018); President, MainStay CBRE Global Infrastructure Megatrends Fund (since 2021), MainStay MacKay DefinedTerm Municipal Opportunities Fund and MainStay VP Funds Trust (since 2017); Senior Managing Director, Global Product Development (2015-2016); Managing Director, Product Development (2010 to 2015), New York Life Investment Management LLC | |
| | Jack R. Benintende
1964 | Treasurer and Principal Financial and Accounting Officer, MainStay Funds (since 2007), MainStay Funds Trust (since 2009) | Managing Director, New York Life Investment Management LLC (since 2007); Treasurer and Principal Financial and Accounting Officer, MainStay CBRE Global Infrastructure Megatrends Fund (since 2021), MainStay MacKay DefinedTerm Municipal Opportunities Fund (since 2011) and MainStay VP Funds Trust (since 2007)**; and Assistant Treasurer, New York Life Investment Management Holdings LLC (2008 to 2012) | |
| | J. Kevin Gao
1967 | Secretary and Chief Legal Officer, MainStay Funds and MainStay Funds Trust (since 2010) | Managing Director and Associate General Counsel, New York Life Investment Management LLC (since 2010); Secretary and Chief Legal Officer, MainStay CBRE Global Infrastructure Megatrends Fund (since 2021), MainStay MacKay DefinedTerm Municipal Opportunities Fund (since 2011) and MainStay VP Funds Trust (since 2010)** | |
| | Scott T. Harrington
1959 | Vice President— Administration, MainStay Funds (since 2005), MainStay Funds Trust (since 2009) | Managing Director, New York Life Investment Management LLC (including predecessor advisory organizations) (since 2000); Member of the Board of Directors, New York Life Trust Company (since 2009); Vice President—Administration, MainStay CBRE Global Infrastructure Megatrends Fund (since 2021), MainStay MacKay DefinedTerm Municipal Opportunities Fund (since 2011) and MainStay VP Funds Trust (since 2005)** | |
| | Kevin M. Gleason
1967 | Vice President and Chief Compliance Officer, MainStay Funds and MainStay Funds Trust (since June 2022) | Vice President and Chief Compliance Officer, IndexIQ Trust, IndexIQ ETF Trust and Index IQ Active ETF Trust (since June 2022); Vice President and Chief Compliance Officer, MainStay CBRE Global Infrastructure Megatrends Fund, MainStay VP Funds Trust and MainStay MacKay DefinedTerm Municipal Opportunities Fund (since June 2022); Senior Vice President, Voya Investment Management and Chief Compliance Officer, Voya Family of Funds (2012-2022) | |
| * | The officers listed above are considered to be “interested persons” of the MainStay Group of Funds, MainStay VP Funds Trust, MainStay CBRE Global Infrastructure Megatrends Fund and MainStay MacKay DefinedTerm Municipal Opportunities Fund within the meaning of the 1940 Act because of their affiliation with the MainStay Group of Funds, New York Life Insurance Company and/or its affiliates, including New York Life Investment Management LLC, New York Life Insurance Company, NYLIM Service Company LLC, NYLIFE Securities LLC and/or NYLIFE Distributors LLC, as described in detail in the column captioned “Principal Occupation(s) During Past Five Years.” Officers are elected annually by the Board. |
| ** | Includes prior service as an Officer of MainStay VP Series Fund, Inc., the predecessor to MainStay VP Funds Trust. |
Officers of the Trust (Who are not Trustees)*
This page intentionally left blank.
This page intentionally left blank.
This page intentionally left blank.
Equity
U.S. Equity
MainStay Epoch U.S. Equity Yield Fund
MainStay Fiera SMID Growth Fund
MainStay S&P 500 Index Fund
MainStay Winslow Large Cap Growth Fund
MainStay WMC Enduring Capital Fund
MainStay WMC Growth Fund
MainStay WMC Small Companies Fund
MainStay WMC Value Fund
International Equity
MainStay Epoch International Choice Fund
MainStay MacKay International Equity Fund
MainStay WMC International Research Equity Fund
Emerging Markets Equity
MainStay Candriam Emerging Markets Equity Fund
Global Equity
MainStay Epoch Capital Growth Fund
MainStay Epoch Global Equity Yield Fund
Fixed Income
Taxable Income
MainStay Candriam Emerging Markets Debt Fund
MainStay Floating Rate Fund
MainStay MacKay High Yield Corporate Bond Fund
MainStay MacKay Short Duration High Yield Fund
MainStay MacKay Strategic Bond Fund
MainStay MacKay Total Return Bond Fund
MainStay MacKay U.S. Infrastructure Bond Fund
MainStay Short Term Bond Fund
Tax-Exempt Income
MainStay MacKay California Tax Free Opportunities Fund1
MainStay MacKay High Yield Municipal Bond Fund
MainStay MacKay New York Tax Free Opportunities Fund2
MainStay MacKay Short Term Municipal Fund
MainStay MacKay Strategic Municipal Allocation Fund
MainStay MacKay Tax Free Bond Fund
Money Market
MainStay Money Market Fund
Mixed Asset
MainStay Balanced Fund
MainStay Income Builder Fund
MainStay MacKay Convertible Fund
Speciality
MainStay CBRE Global Infrastructure Fund
MainStay CBRE Real Estate Fund
MainStay Cushing MLP Premier Fund
Asset Allocation
MainStay Conservative Allocation Fund
MainStay Conservative ETF Allocation Fund
MainStay Defensive ETF Allocation Fund
MainStay Equity Allocation Fund
MainStay Equity ETF Allocation Fund
MainStay ESG Multi-Asset Allocation Fund
MainStay Growth Allocation Fund
MainStay Growth ETF Allocation Fund
MainStay Moderate Allocation Fund
MainStay Moderate ETF Allocation Fund
Manager
New York Life Investment Management LLC
New York, New York
Subadvisors
Candriam3
Strassen, Luxembourg
CBRE Investment Management Listed Real Assets LLC
Radnor, Pennsylvania
Cushing Asset Management, LP
Dallas, Texas
Epoch Investment Partners, Inc.
New York, New York
Fiera Capital Inc.
New York, New York
IndexIQ Advisors LLC3
New York, New York
MacKay Shields LLC3
New York, New York
NYL Investors LLC3
New York, New York
Wellington Management Company LLP
Boston, Massachusetts
Winslow Capital Management, LLC
Minneapolis, Minnesota
Legal Counsel
Dechert LLP
Washington, District of Columbia
Independent Registered Public Accounting Firm
KPMG LLP
Philadelphia, Pennsylvania
Distributor
NYLIFE Distributors LLC3
Jersey City, New Jersey
Custodian
JPMorgan Chase Bank, N.A.
New York, New York
1.
This Fund is registered for sale in AZ, CA, NV, OR, TX, UT, WA and MI (Class A and Class I shares only), and CO, FL, GA, HI, ID, MA, MD, NH, NJ and NY (Class I shares only).
| 2. | This Fund is registered for sale in CA, CT, DE, FL, MA, NJ, NY and VT. |
| 3. | An affiliate of New York Life Investment Management LLC. |
Not part of the Annual Report
For more information
800-624-6782
newyorklifeinvestments.com
“New York Life Investments” is both a service mark, and the common trade name, of certain investment advisors affiliated with New York Life Insurance Company. The MainStay Funds® are managed by New York Life Investment Management LLC and distributed by NYLIFE Distributors LLC, 30 Hudson Street, Jersey City, NJ 07302, a wholly owned subsidiary of New York Life Insurance Company. NYLIFE Distributors LLC is a Member FINRA/SIPC.
©2023 NYLIFE Distributors LLC. All rights reserved.
| 5022210MS043-23 | MSMSMA11-06/23 |
(NYLIM) NL466
MainStay ETF Asset Allocation Funds
Message from the President and Annual Report
April 30, 2023
| MainStay Defensive ETF Allocation Fund |
| MainStay Conservative ETF Allocation Fund |
| MainStay Moderate ETF Allocation Fund |
| MainStay Growth ETF Allocation Fund |
| MainStay Equity ETF Allocation Fund |
| MainStay ESG Multi-Asset Allocation Fund |
Sign up for e-delivery of your shareholder reports. For full details on e-delivery, including who can participate and what you can receive via e-delivery,
please log in to newyorklifeinvestments.com/accounts.
| Not FDIC/NCUA Insured | Not a Deposit | May Lose Value | No Bank Guarantee | Not Insured by Any Government Agency |
This page intentionally left blank
Message from the President
Despite high levels of volatility and sharp, short-term shifts in value, broadly based stock and bond indices saw relatively modest overall changes during the 12-month reporting period ended April 30, 2023.A deeply challenging investment environment during the last eight months of 2022, driven by increasing inflationary pressures and aggressive monetary efforts to curb them, was followed by a more positive, but uneven, economic and monetary backdrop during the first four months of 2023.
In April 2022, before the start of the reporting period, U.S. inflation stood at an annualized rate of 8.3%, up from 4.2% a year earlier. The U.S. Federal Reserve (the “Fed”), had begun to take steps to curb inflation, raising the federal funds rate from near zero in March 2022. Eight separate rate hikes during the reporting period brought the benchmark rate up to 4.75–5.00% in March 2023. Inflation seemed to respond, easing steadily from a peak of 9.1% in June 2022 to 4.9% in April 2023. Although further interest rate increases are expected in 2023, by the end of the reporting period, it appeared that the Fed might be nearing the end of the current rate-hike cycle. Economic growth, although slower, remained positive, supported by historically high levels of employment and robust consumer spending. International economies experienced similar trends, with more modest central bank interest-rate hikes curbing inflation to a degree.
Equity market behavior during the reporting period reflected the arc of monetary policy and economic developments. From May through early October 2022, as inflation raged and interest-rate increases accelerated, investors shied away from perceived risk, favoring relatively defensive and value-oriented sectors over growth-oriented sectors. The S&P 500® Index, a widely regarded benchmark of U.S. market performance, declined by more than 13% during this time, while international stocks suffered even sharper losses. These trends reversed from mid-October 2022 through the end of the reporting period, as inflationary pressures eased and markets began to anticipate an end to rising interest rates. Between mid-October 2022 and April 30, 2023, the S&P 500® Index regained all the ground it lost earlier, ending in modestly positive territory. International developed-markets stocks bounced back even stronger, prompted by surprisingly robust economic resilience in Europe and further bolstered by China’s
reopening after the government rescinded its “zero-COVID-19” policy and eased regulatory restrictions on key industries. The declining value of the U.S. dollar relative to other currencies also enhanced international market equity performance. Emerging markets generally lagged their developed-markets counterparts while outperforming U.S. markets.
Fixed-income markets followed a similar pattern of retreat and recovery. Bond prices trended sharply downward early in the reporting period, as yields rose along with interest rates. Short-term yields rose faster than long-term yields, producing a yield curve inversion—with long-term rates lower than short-term rates—that persisted from July through the end of the reporting period. However, market sentiment improved in the second half of the reporting period as inflationary pressures eased. As the Fed decreased the magnitude of rate increases, focus turned toward the possibility of eventual rate reductions and a potential ‘soft landing’ for the economy. On the negative side, a small number of high-profile, regional U.S. bank failures in March and April 2023 raised fears of possible wider banking industry contagion and future credit constraints.
While many market observers believe the Fed has neared the end of the current cycle of rate increases, the central bank’s rhetoric remains sharply focused on its target inflation rate of 2%. Only time will tell if the market’s favorable expectations prove well founded.
However the economic story unfolds in the months and years to come, we remain dedicated to providing you with the one-on-one philosophy and diversified, multi-boutique investment resources that set New York Life Investments apart. Thank you for trusting us to help you meet your investment needs.
Sincerely,
Kirk C. Lehneis
President
The opinions expressed are as of the date of this report and are subject to change. There is no guarantee that any forecast made will come to pass. This material does not constitute investment advice and is not intended as an endorsement of any specific investment. Past performance is no guarantee of future results.
Not part of the Annual Report
Investors should refer to each Fund’s Summary Prospectus and/or Prospectus and consider each Fund’s investment objectives, strategies, risks, charges and expenses carefully before investing. The Summary Prospectus and/or Prospectus contain this and other information about each Fund. You may obtain copies of each Fund’s Summary Prospectus, Prospectus and Statement of Additional Information, which includes information about the MainStay Funds Trust's Trustees, free of charge, upon request, by calling toll-free 800-624-6782, by writing to NYLIFE Distributors LLC, Attn: MainStay Marketing Department, 30 Hudson Street, Jersey City, NJ 07302 or by sending an e-mail to MainStayShareholderServices@nylim.com. These documents are also available via the MainStay Funds’ website at newyorklifeinvestments.com. Please read each Fund’s Summary Prospectus and/or Prospectus carefully before investing.
MainStay Defensive ETF Allocation Fund
Investment and Performance Comparison (Unaudited)
Performance data quoted represents past performance. Past performance is no guarantee of future results. Because of market volatility and other factors, current performance may be lower or higher than the figures shown. Investment return and principal value will fluctuate, and as a result, when shares are redeemed, they may be worth more or less than their original cost. The graph below depicts the historical performance of Class I shares of the Fund. Performance will vary from class to class based on differences in class-specific expenses and sales charges. For performance information current to the most recent month-end, please call 800-624-6782 or visit newyorklifeinvestments.com.
The performance table and graph do not reflect the deduction of taxes that a shareholder would pay on distributions or Fund share redemptions. Total returns reflect maximum applicable sales charges as indicated in the table below, if any, changes in share price, and reinvestment of dividend and capital gain distributions. The graph assumes the initial investment amount shown below and reflects the deduction of all sales charges that would have applied for the period of investment. Performance figures may reflect certain fee waivers and/or expense limitations, without which total returns may have been lower. For more information on share classes and current fee waivers and/or expense limitations (if any), please refer to the Notes to Financial Statements.

| Average Annual Total Returns for the Year-Ended April 30, 2023 |
| Class | Sales Charge | | Inception
Date | One
Year | Since
Inception | Gross
Expense
Ratio1 |
| Class A Shares | Maximum 3.00% Initial Sales Charge | With sales charges | 6/30/2020 | -2.28% | -1.32% | 1.89% |
| | | Excluding sales charges | | 0.74 | -0.26 | 1.89 |
| Class C Shares | Maximum 1.00% CDSC | With sales charges | 6/30/2020 | -1.00 | -1.00 | 2.74 |
| | if redeemed Within One Year of Purchase | Excluding sales charges | | -0.02 | -1.00 | 2.74 |
| Class I Shares | No Sales Charge | | 6/30/2020 | 1.00 | 0.01 | 1.64 |
| Class R3 Shares | No Sales Charge | | 6/30/2020 | 0.36 | -0.62 | 2.24 |
| SIMPLE Class Shares | No Sales Charge | | 8/31/2020 | 0.47 | -1.48 | 2.24 |
| 1. | The gross expense ratios presented reflect the Fund’s “Total Annual Fund Operating Expenses” from the most recent Prospectus, as supplemented, and may differ from other expense ratios disclosed in this report. |
The footnotes on the next page are an integral part of the table and graph and should be carefully read in conjunction with them.
| Benchmark Performance* | One
Year | Since
Inception |
| Bloomberg U.S. Aggregate Bond Index1 | -0.43% | -3.70% |
| S&P 500® Index2 | 2.66 | 12.77 |
| MSCI EAFE® Index (Net)3 | 8.42 | 9.43 |
| Defensive Allocation Composite Index4 | 0.66 | -0.57 |
| Morningstar Conservative Allocation Category Average5 | -0.27 | 1.41 |
| * | Returns for indices reflect no deductions for fees, expenses or taxes, except for foreign withholding taxes where applicable. Results assume reinvestment of all dividends and capital gains. An investment cannot be made directly in an index. |
| 1. | The Fund has selected the Bloomberg U.S. Aggregate Bond Index as the primary broad-based securities market index for comparison purposes. The Bloomberg U.S. Aggregate Bond Index is a broad-based benchmark that measures the investment grade, U.S. dollar-denominated, fixed-rate taxable bond market, including Treasuries, government-related and corporate securities, mortgage-backed securities (agency fixed-rate and hybrid adjustable rate mortgage pass-throughs), asset-backed securities and commercial mortgage-backed securities. |
| 2. | The S&P 500® Index is the Fund's secondary benchmark. The S&P 500® Index is widely regarded as the standard index for measuring large-cap U.S. stock market performance. |
| 3. | The Fund has selected the MSCI EAFE® Index (Net) as an additional benchmark. The MSCI EAFE® Index (Net) consists of international stocks representing the developed world outside of North America. |
| 4. | The Fund has selected the Defensive Allocation Composite Index as an additional benchmark. The Defensive Allocation Index consists of the S&P 500® Index, the MSCI EAFE® Index and the Bloomberg U.S. Aggregate Bond Index weighted 15%, 5% and 80%, respectively. |
| 5. | The Morningstar Conservative Allocation Category Average is representative of funds in allocation categories that seek to provide both income and capital appreciation by primarily investing in multiple asset classes, including stocks, bonds, and cash. These conservative strategies prioritize preservation of capital over appreciation. They typically expect volatility similar to a strategic equity exposure between 15% and 30%. Results are based on average total returns of similar funds with all dividends and capital gain distributions reinvested. |
The footnotes on the preceding page are an integral part of the table and graph and should be carefully read in conjunction with them.
| 6 | MainStay Defensive ETF Allocation Fund |
Cost in Dollars of a $1,000 Investment in MainStay Defensive ETF Allocation Fund (Unaudited)
The example below is intended to describe the fees and expenses borne by shareholders during the six-month period from November 1, 2022 to April 30, 2023, and the impact of those costs on your investment.
Example
As a shareholder of the Fund you incur two types of costs: (1) transaction costs, including exchange fees and sales charges (loads) on purchases (as applicable), and (2) ongoing costs, including management fees, distribution and/or service (12b-1) fees and other Fund expenses (as applicable). This example is intended to help you understand your ongoing costs (in dollars) of investing in the Fund and to compare these costs with the ongoing costs of investing in other mutual funds. The example is based on an investment of $1,000 made at the beginning of the six-month period and held for the entire period from November 1, 2022 to April 30, 2023.
This example illustrates your Fund’s ongoing costs in two ways:
Actual Expenses
The second and third data columns in the table below provide information about actual account values and actual expenses. You may use the information in these columns, together with the amount you invested, to estimate the expenses that you paid during the six months ended April 30, 2023. Simply divide your account value by $1,000 (for example, an
$8,600 account value divided by $1,000 = 8.6), then multiply the result by the number under the heading entitled “Expenses Paid During Period” to estimate the expenses you paid on your account during this period.
Hypothetical Example for Comparison Purposes
The fourth and fifth data columns in the table below provide information about hypothetical account values and hypothetical expenses based on the Fund’s actual expense ratio and an assumed rate of return of 5% per year before expenses, which is not the Fund’s actual return. The hypothetical account values and expenses may not be used to estimate the actual ending account balances or expenses you paid for the six-month period shown. You may use this information to compare the ongoing costs of investing in the Fund with the ongoing costs of investing in other mutual funds. To do so, compare this 5% hypothetical example with the 5% hypothetical examples that appear in the shareholder reports of the other mutual funds.
Please note that the expenses shown in the table are meant to highlight your ongoing costs only and do not reflect any transactional costs, such as exchange fees or sales charges (loads). Therefore, the fourth and fifth data columns of the table are useful in comparing ongoing costs only and will not help you determine the relative total costs of owning different funds. In addition, if these transactional costs were included, your costs would have been higher.
| Share Class | Beginning
Account
Value
11/1/22 | Ending Account
Value (Based
on Actual
Returns and
Expenses)
4/30/23 | Expenses
Paid
During
Period1 | Ending Account
Value (Based
on Hypothetical
5% Annualized
Return and
Actual Expenses)
4/30/23 | Expenses
Paid
During
Period1 | Net Expense
Ratio
During
Period2 |
| Class A Shares | $1,000.00 | $1,056.90 | $4.08 | $1,020.83 | $4.01 | 0.80% |
| Class C Shares | $1,000.00 | $1,053.10 | $7.89 | $1,017.11 | $7.75 | 1.55% |
| Class I Shares | $1,000.00 | $1,059.40 | $2.81 | $1,022.07 | $2.76 | 0.55% |
| Class R3 Shares | $1,000.00 | $1,055.20 | $5.86 | $1,019.09 | $5.76 | 1.15% |
| SIMPLE Class Shares | $1,000.00 | $1,055.50 | $5.35 | $1,019.59 | $5.26 | 1.05% |
| 1. | Expenses are equal to the Fund’s annualized expense ratio of each class multiplied by the average account value over the period, divided by 365 and multiplied by 181 (to reflect the six-month period). The table above represents the actual expenses incurred during the six-month period. In addition to the fees and expenses which the Fund bears directly, it also indirectly bears a pro rata share of the fees and expenses of the underlying funds in which it invests. Such indirect expenses are not included in the above-reported expense figures. |
| 2. | Expenses are equal to the Fund's annualized expense ratio to reflect the six-month period. |
Asset Diversification as of April 30, 2023 (Unaudited)
| Equity Funds | 18.0 % |
| Fixed Income Funds | 72.8 |
| Short-Term Investments | 25.9 |
| Other Assets, Less Liabilities | (16.7) |
See Portfolio of Investments beginning on page 12 for specific holdings within these categories. The Fund’s holdings are subject to change.
| 8 | MainStay Defensive ETF Allocation Fund |
Portfolio Management Discussion and Analysis (Unaudited)
Questions answered by portfolio managers Jae S. Yoon, CFA, Jonathan Swaney, Poul Kristensen, CFA, and Amit Soni, CFA, of New York Life Investment Management LLC, the Fund’s Manager.
How did MainStay Defensive ETF Allocation Fund perform relative to its benchmarks and peer group during the 12 months ended April 30, 2023?
For the 12 months ended April 30, 2023, Class I shares of MainStay Defensive ETF Allocation Fund returned 1.00%, outperforming the −0.43% return of the Fund’s primary benchmark, the Bloomberg U.S. Aggregate Bond Index (the "Index"), and underperforming the 2.66% return of the S&P 500® Index, which is the Fund’s secondary benchmark. Over the same period, Class I shares of the Fund underperformed the 8.42% return of the MSCI EAFE® Index (Net), and outperformed the 0.66% return of the Defensive Allocation Composite Index, both of which are additional benchmarks of the Fund. For the six months ended October 31, 2022, Class I shares of the Fund outperformed the −0.27% return of the Morningstar Conservative Allocation Average.1
What factors affected the Fund’s relative performance during the reporting period?
The Fund is a “fund of funds" that seeks to achieve its investment objective by investing in unaffiliated, passively-managed, exchange-traded funds (“Underlying ETFs”). The Underlying ETFs may invest in U.S. equities, international equities and fixed-income instruments, making comparisons to any single index generally less suitable than a weighted combination of indices, which is a more useful yardstick by which to measure performance. During the reporting period, asset class policy was the primary determinant of the Fund’s relative performance.
Fund management internally maintains a blend of indices that are taken into consideration when managing the Fund. During the reporting period, the Fund modestly underperformed the internally maintained blend of indices, primarily due to asset class policy decisions. Management of the Fund’s stock/bond blend itself was not the issue, as positive returns were generated in the process of controlling the blend. The allocation was held near neutral for much of the reporting period, although capital was added to equities during periods of pricing softness and removed again as the market recovered. This tactical “buy the dip, sell the rally” practice boosted returns at the margin.
Rather, the issue was within asset classes. A persistent bias toward small-cap names, expressed through exposure to the S&P SmallCap 600™ Index,2 detracted materially from relative performance. While relative valuations for small-cap stocks were much more attractive than the historical norm, smaller companies are significantly more sensitive to changes in bank financing conditions than larger companies that can issue
bonds. Fast-rising costs on bank loans, coupled with concerns about future credit availability in the wake of the bank crisis that emerged in March and April 2023, weighed heavily on the smaller end of the capitalization spectrum. In contrast, mega-cap technology and technology-related companies—including Microsoft, Apple, Tesla, Meta Platforms and Amazon.com—performed well.
Significantly underweight exposure to non-U.S. developed markets also detracted materially from relative performance. In our estimation, Europe was particularly vulnerable to disruption, owing largely to the Russian invasion of Ukraine and the accompanying strain on energy supplies. An unusually mild winter, however, granted a reprieve, and these markets ultimately performed quite well.
Exposure to gold miners further detracted from relative performance. The price of bullion rose over the course of the reporting period, but companies that extract gold fared less well, possibly due to rising extraction costs (particularly labor) and currency effects.
On the upside, maintaining a large cash position within the fixed-income portion of the Fund made a substantial positive contribution to performance, as bond yields climbed. (Contributions take weightings and total returns into account.) Similarly, skewing high yield bond holdings to favor shorter-duration3 instruments boosted returns at the margin.
Even within equities, the news was not universally negative. Exposure to energy stocks, for example, proved helpful as gains in the first half of the reporting period more than offset the underperformance experienced during the second half. We believe energy remains a compelling strategic opportunity, particularly among producers and firms that provide extraction services.
How did you allocate the Fund’s assets during the reporting period and why?
Stock/bond blend: Equity exposure within the Fund was held relatively close to neutral during the reporting period, with the exception of a modest bias favoring stocks that we implemented tactically in response to swings in pricing (adding on drawdowns and trimming on rallies). We are generally reluctant to position the Fund with underweight equity exposure, since stocks tend to perform well over time and anticipating drawdowns is challenging. The opposite is less true. We are happy to lean into equities when we believe they are well-supported fundamentally or when a correction has run further than we believe appropriate. This strategy worked well during the reporting period, producing a
| 1. | See "Investment and Performance Comparison" for other share class returns, which may be higher or lower than Class I share returns, and for more information on benchmark and peer group returns. |
| 2. | The S&P SmallCap 600™ Index covers roughly the small-cap range of American stocks, using a capitalization-weighted index. Capitalization range is from $850 million to $3.7 billion. |
| 3. | Duration is a measure of the price sensitivity of a fixed-income investment to changes in interest rates. Duration is expressed as a number of years and is considered a more accurate sensitivity gauge than average maturity. |
modestly positive contribution to performance. The policy stance shifted slightly in 2023, however, when the Fund adopted a small underweight position in equities following a sharp rally in January. We increased this underweight posture later in the reporting period as turmoil among banks increased the likelihood of a near-term recession.
Duration: Believing inflationary pressures to be at least partially structural in nature and likely to persist at elevated levels for the foreseeable future, we skewed the Fund’s fixed-income holdings to favor shorter-maturity instruments less sensitive to rising bond yields, although duration was added as yields rose. Over the latter half of the reporting period, duration was slightly shorter than that of the Bloomberg U.S. Aggregate Bond Index.
Equity style: In the same way that inflation threatens long-duration bonds, equities with values disproportionately reflected in more distant cash flows (i.e., growth stocks with high prices relative to current earnings) are likewise vulnerable. Accordingly, the Fund remained tilted to emphasize value stocks that offered more attractive near-term cash flows, placing particular focus on traditionally defensive sectors: real estate, utilities, consumer staples and (most of all) health care. While this positioning made a modest, positive contribution to the Fund’s return during the first half of the reporting period, the opposite was true during the second half, as market performance was dominated by a handful of large, high-growth companies, including NVDIA, Tesla, Apple and others.
Equity size: Small-company stocks were more heavily represented in the Fund than in the Index. The thesis behind this positioning was based on attractive small-cap valuations, insulation from economic weakness abroad, less sensitivity to dollar strength and disproportionate exposure to domestic demand, which remained robust. This stance was helpful for much of the reporting period, but reversed abruptly in the spring of 2023 as small companies, which tend to be heavily dependent on bank financing, proved vulnerable to the aggressive, tightening lending standards implemented during the bank crisis mentioned above.
Geographic exposure: Following Russia’s invasion of Ukraine and the energy crisis that ensued, the Fund maintained underweight exposure to developed international markets. However, non-U.S. developed markets fared well during the reporting period, benefiting from both an unusually mild winter that reduced the strain on energy reserves, and the reopening of China following the end of the country’s zero-COVID-19 restrictions.
Energy: The Fund maintained exposure to upstream energy producers and oilfield/gas field service providers as a commodity play to provide an additional inflation hedge. These holdings also positioned the Fund to take advantage of opportunities for
domestic producers to benefit as Western nations revisit energy policy to source supplies from stable and friendly jurisdictions rather than autocratic petrostates that present national security risks. While the Fund’s position was small, it had a disproportionately positive impact on performance as oil and gas prices soared during the first half of the reporting period, although some of those gains were later reversed.
How did the Fund’s allocations change over the course of the reporting period?
The Fund’s cash position saw the largest allocation increase, as we trimmed both equity and fixed income positions. Allocations to full-duration investment-grade bonds also increased through additional exposure to iShares® Core U.S. Aggregate Bond ETF, Schwab U.S. Aggregate Bond ETF and iShares® Broad USD Investment Grade Corporate Bond ETF. The Fund also added several new holdings. The Fund established a stake in iShares® Core S&P® Mid-Cap ETF, reflecting our favorable view of the mid-cap asset class’s attractive relative valuations and reduced sensitivity to bank lending conditions compared to the small cap universe; the position also offset a reduction in the Fund’s position in Schwab U.S. Mid-Cap ETF. The Fund took a position in The Materials Select Sector SPDR® Fund as a hedge against stubborn inflation, protection against a potentially weakening dollar and as a way to benefit from supply-chain reengineering and the desire of manufacturers to source raw materials from more friendly, reliable geographies. The Fund also initiated a position in iShares® MSCI Japan ETF, since we viewed Japanese equity valuations as attractive, export conditions as favorable and we believe the Japanese yen is likely to appreciate should the country’s central bank further relax, or even abandon, its existing yield curve4 control policy. These positions were funded in large part from Vanguard Mega Cap ETF.
A reduced position in iShares® Core MSCI EAFE ETF reflected the Fund’s shift away from non-U.S. developed equity markets. We trimmed holdings of Schwab U.S. Small-Cap ETF in response to the ongoing bank crisis. Sales of iShares® 0–5 Year High Yield Corp Bond ETF and Invesco Senior Loan ETF were prompted by our strategy of shifting Fund assets away from lower-credit-quality fixed-income instruments in preparation for a potentially fast-approaching recession.
During the reporting period, which Underlying Equity ETFs had the highest total returns and which Underlying Equity ETFs had the lowest total returns?
The Fund’s top-performing Underlying Equity ETFs that were held for the entire reporting period included iShares® Core MSCI EAFE ETF, VanEck Oil Services ETF and Health Care Select SPDR® Fund. The lowest total returns were seen in iShares® Core S&P®
| 4. | The yield curve is a line that plots the yields of various securities of similar quality—typically U.S. Treasury issues—across a range of maturities. The U.S. Treasury yield curve serves as a benchmark for other debt and is used in economic forecasting. |
| 10 | MainStay Defensive ETF Allocation Fund |
Small-Cap ETF, Vanguard Mid-Cap ETF and Schwab U.S. Mid-Cap ETF.
Which Underlying Equity ETFs were the strongest positive contributors to the Fund’s performance and which Underlying Equity ETFs were particularly weak?
Contribution to return is a function not only of Underlying ETF performance and average allocation, but also the variation in that allocation across time. The Underlying Equity ETFs making the largest positive contributions to return—Vanguard Mega Cap ETF, VanEck Oil Services ETF and SPDR® S&P® Oil & Gas Exploration & Production ETF—were neither the highest-returning funds nor the largest positions. The most significant detractors were iShares® Core MSCI EAFE ETF, VanEck Gold Miners ETF and iShares® Core MSCI Emerging Markets ETF.
During the reporting period, which Underlying Fixed-Income ETFs had the highest total returns and which Underlying Fixed-Income ETFs had the lowest total returns?
The Underlying Fixed-Income ETFs posting the highest total returns included iShares® 0–5 Year High Yield Corporate Bond ETF, Invesco Senior Loan ETF and iShares® Broad USD High Yield Corporate Bond ETF. The only two Underlying Fixed-Income ETFs to experience losses were iShares® Core U.S. Aggregate Bond ETF and Schwab U.S. Aggregate Bond ETF.
Which Underlying Fixed-Income ETFs were the strongest positive contributors to the Fund’s performance and which Underlying Fixed-Income ETFs were particularly weak?
The Underlying Fixed-Income ETFs making the largest contributions to return were Invesco Senior Loan ETF, iShares® 0–5 Year High Yield Corporate Bond ETF and iShares® Broad USD Investment Grade Corporate Bond ETF. The only Underlying Fixed-Income ETFs to detract from absolute performance was iShares® 20+ Year Treasury Bond ETF, which was used for duration management. The smallest positive contributions came from Vanguard Short-Term Bond ETF and Schwab U.S. Aggregate Bond ETF.
How was the Fund positioned at the end of the reporting period?
As of April 30, 2023, we believe a near-term recession looks highly probable. Our opinion is based on a wide range of variables, including, but not limited to, the shape of the yield curve, trends in business surveys, a decline in money supply, tightening credit conditions and the steady drawdown of savings accumulated during the pandemic. We expect corporate profits to decline over the next several quarters, eventually driving stock prices lower while pushing credit spreads out. Accordingly, we continue to position the Fund defensively.
The Fund’s defensive posture begins at the top of the portfolio, with a modest tilt away from equities. We generally avoid underweight equity allocations, as they usually stand on the wrong side of history—stocks rise more often than not. However, we firmly believe that current valuations are rich given the daunting array of risks the economy and the markets face, including an historically extreme rise in rates, the looming debt ceiling, the unresolved bank crisis and geopolitical uncertainty, to name a few. We maintain that caution is the better part of valor under these circumstances.
Defensive positioning is clearly visible within asset classes as well. On the equity side, the Fund favors sectors—such as consumer staples, utilities and healthcare—that have generally exhibited lower volatility and retained their value better during drawdowns. Additionally, the Fund’s bias toward historically higher-beta, small-cap stocks, in place for the past several quarters, has been effectively removed. Within fixed income, the Fund now has a below-Index-weight position in bank loans, and holdings of high yield bonds are skewed to favor lower-duration instruments, which tend to exhibit less volatility and smaller losses than longer maturity bonds.
Energy stocks tend to be more cyclical. The Fund’s overweight allocation to the sector may seem inconsistent with the otherwise cautious posture of the portfolio, although relative valuation is attractive, and we believe supply/demand dynamics will prove supportive of pricing over time for both the underlying commodities and the stock prices of companies involved in the production, processing and distribution of these resources.
None of Schwab Strategic Trust, Schwab® U.S. Aggregate Bond ETF, Schwab U.S. Mid-Cap ETF, Schwab U.S. Small Cap ETF or Charles Schwab Investment Management, Inc. make any representations regarding the advisability of investing in MainStay Defensive ETF Allocation Fund.
iShares® is a registered trademark of BlackRock (BlackRock, Inc. and its subsidiaries). Neither BlackRock nor the iShares® Funds make any representations regarding the advisability of investing in MainStay Defensive ETF Allocation Fund.
The opinions expressed are those of the portfolio managers as of the date of this report and are subject to change. There is no guarantee that any forecasts will come to pass. This material does not constitute investment advice and is not intended as an endorsement of any specific investment.
Portfolio of Investments April 30, 2023†^
| | Shares | | Value |
| Investment Companies 90.8% |
| Equity Funds 18.0% |
| Health Care Select Sector SPDR Fund | 771 | | $ 102,952 |
| Invesco S&P 500 Low Volatility ETF | 1,616 | | 103,327 |
| iShares Core MSCI EAFE ETF | 2,260 | | 155,420 |
| iShares Core S&P Mid-Cap ETF | 771 | | 191,362 |
| iShares Core S&P Small-Cap ETF | 5,008 | | 470,752 |
| iShares MSCI Japan ETF | 1,783 | | 104,912 |
| Materials Select Sector SPDR Fund | 1,265 | | 101,896 |
| Schwab U.S. Mid-Cap ETF | 680 | | 45,839 |
| SPDR S&P Oil & Gas Exploration & Production ETF (a) | 833 | | 105,883 |
| VanEck Oil Services ETF (a) | 179 | | 49,069 |
| Vanguard Mega Cap ETF (a) | 1,092 | | 159,246 |
| Vanguard Mega Cap Value ETF | 994 | | 102,302 |
| Vanguard Mid-Cap ETF | 860 | | 179,989 |
Total Equity Funds
(Cost $1,843,029) | | | 1,872,949 |
| Fixed Income Funds 72.8% |
| Invesco Senior Loan ETF (a) | 44,560 | | 930,413 |
| iShares 0-5 Year High Yield Corporate Bond ETF (a) | 16,289 | | 676,808 |
| iShares Broad USD High Yield Corporate Bond ETF | 10,403 | | 368,682 |
| iShares Broad USD Investment Grade Corporate Bond ETF | 21,712 | | 1,104,924 |
| iShares Core U.S. Aggregate Bond ETF | 21,995 | | 2,198,620 |
| Schwab U.S. Aggregate Bond ETF | 46,741 | | 2,199,632 |
| Vanguard Short-Term Bond ETF | 1,366 | | 104,690 |
Total Fixed Income Funds
(Cost $8,138,158) | | | 7,583,769 |
Total Investment Companies
(Cost $9,981,187) | | | 9,456,718 |
| Short-Term Investments 25.9% |
| Affiliated Investment Company 9.0% |
| MainStay U.S. Government Liquidity Fund, 3.98% (b) | 935,146 | | 935,146 |
| Unaffiliated Investment Company 16.9% |
| Invesco Government & Agency Portfolio, 4.857% (b)(c) | 1,754,877 | | 1,754,877 |
Total Short-Term Investments
(Cost $2,690,023) | | | 2,690,023 |
Total Investments
(Cost $12,671,210) | 116.7% | | 12,146,741 |
| Other Assets, Less Liabilities | (16.7) | | (1,735,133) |
| Net Assets | 100.0% | | $ 10,411,608 |
The notes to the financial statements are an integral part of, and should be read in conjunction with, the financial statements.
| 12 | MainStay Defensive ETF Allocation Fund |
| † | Percentages indicated are based on Fund net assets. |
| ^ | Industry classifications may be different than those used for compliance monitoring purposes. |
| (a) | All or a portion of this security was held on loan. As of April 30, 2023, the aggregate market value of securities on loan was $1,717,982. The Fund received cash collateral with a value of $1,754,877. (See Note 2(G)) |
| (b) | Current yield as of April 30, 2023. |
| (c) | Represents a security purchased with cash collateral received for securities on loan. |
Investments in Affiliates (in 000's)
Investments in issuers considered to be affiliate(s) of the Fund during the year ended April 30, 2023 for purposes of Section 2(a)(3) of the Investment Company Act of 1940, as amended, were as follows:
| Affiliated Investment Companies | Value,
Beginning
of Year | Purchases
at Cost | Proceeds
from
Sales | Net
Realized
Gain/(Loss)
on Sales | Change in
Unrealized
Appreciation/
(Depreciation) | Value,
End of
Year | Dividend
Income | Other
Distributions | Shares
End of
Year |
| MainStay U.S. Government Liquidity Fund | $ 274 | $ 5,714 | $ (5,053) | $ — | $ — | $ 935 | $ 18 | $ — | 935 |
| Abbreviation(s): |
| EAFE—Europe, Australasia and Far East |
| ETF—Exchange-Traded Fund |
| MSCI—Morgan Stanley Capital International |
| SPDR—Standard & Poor’s Depositary Receipt |
| USD—United States Dollar |
The following is a summary of the fair valuations according to the inputs used as of April 30, 2023, for valuing the Fund’s assets:
| Description | Quoted
Prices in
Active
Markets for
Identical
Assets
(Level 1) | | Significant
Other
Observable
Inputs
(Level 2) | | Significant
Unobservable
Inputs
(Level 3) | | Total |
| Asset Valuation Inputs | | | | | | | |
| Investments in Securities (a) | | | | | | | |
| Investment Companies | | | | | | | |
| Equity Funds | $ 1,872,949 | | $ — | | $ — | | $ 1,872,949 |
| Fixed Income Funds | 7,583,769 | | — | | — | | 7,583,769 |
| Total Investment Companies | 9,456,718 | | — | | — | | 9,456,718 |
| Short-Term Investments | | | | | | | |
| Affiliated Investment Company | 935,146 | | — | | — | | 935,146 |
| Unaffiliated Investment Company | 1,754,877 | | — | | — | | 1,754,877 |
| Total Short-Term Investments | 2,690,023 | | — | | — | | 2,690,023 |
| Total Investments in Securities | $ 12,146,741 | | $ — | | $ — | | $ 12,146,741 |
| (a) | For a complete listing of investments, see the Portfolio of Investments. |
The notes to the financial statements are an integral part of, and should be read in conjunction with, the financial statements.
13
Statement of Assets and Liabilities as of April 30, 2023
| Assets |
Investment in unaffiliated securities, at value
(identified cost $11,736,064) including securities on loan of $1,717,982 | $11,211,595 |
Investment in affiliated investment companies, at value
(identified cost $935,146) | 935,146 |
| Receivables: | |
| Manager (See Note 3) | 9,517 |
| Fund shares sold | 5,119 |
| Securities lending | 3,128 |
| Dividends | 2,972 |
| Other assets | 16,853 |
| Total assets | 12,184,330 |
| Liabilities |
| Cash collateral received for securities on loan | 1,754,877 |
| Payables: | |
| Shareholder communication | 5,892 |
| Custodian | 5,267 |
| NYLIFE Distributors (See Note 3) | 2,436 |
| Fund shares redeemed | 2,000 |
| Transfer agent (See Note 3) | 1,710 |
| Professional fees | 78 |
| Trustees | 47 |
| Accrued expenses | 415 |
| Total liabilities | 1,772,722 |
| Net assets | $10,411,608 |
| Composition of Net Assets |
| Shares of beneficial interest outstanding (par value of $.001 per share) unlimited number of shares authorized | $ 1,128 |
| Additional paid-in-capital | 11,371,284 |
| | 11,372,412 |
| Total distributable earnings (loss) | (960,804) |
| Net assets | $10,411,608 |
| Class A | |
| Net assets applicable to outstanding shares | $9,400,293 |
| Shares of beneficial interest outstanding | 1,018,801 |
| Net asset value per share outstanding | $ 9.23 |
| Maximum sales charge (3.00% of offering price) | 0.29 |
| Maximum offering price per share outstanding | $ 9.52 |
| Class C | |
| Net assets applicable to outstanding shares | $ 228,760 |
| Shares of beneficial interest outstanding | 24,811 |
| Net asset value and offering price per share outstanding | $ 9.22 |
| Class I | |
| Net assets applicable to outstanding shares | $ 41,118 |
| Shares of beneficial interest outstanding | 4,456 |
| Net asset value and offering price per share outstanding | $ 9.23 |
| Class R3 | |
| Net assets applicable to outstanding shares | $ 75,734 |
| Shares of beneficial interest outstanding | 8,212 |
| Net asset value and offering price per share outstanding | $ 9.22 |
| SIMPLE Class | |
| Net assets applicable to outstanding shares | $ 665,703 |
| Shares of beneficial interest outstanding | 72,139 |
| Net asset value and offering price per share outstanding | $ 9.23 |
The notes to the financial statements are an integral part of, and should be read in conjunction with, the financial statements.
| 14 | MainStay Defensive ETF Allocation Fund |
Statement of Operations for the year ended April 30, 2023
| Investment Income (Loss) |
| Income | |
| Dividends-unaffiliated | $ 320,465 |
| Securities lending, net | 40,066 |
| Dividends-affiliated | 17,794 |
| Total income | 378,325 |
| Expenses | |
| Registration | 89,683 |
| Professional fees | 31,247 |
| Distribution/Service—Class A (See Note 3) | 23,433 |
| Distribution/Service—Class C (See Note 3) | 1,600 |
| Distribution/Service—Class R3 (See Note 3) | 220 |
| Distribution/Service—SIMPLE Class (See Note 3) | 2,255 |
| Manager (See Note 3) | 20,134 |
| Custodian | 17,358 |
| Transfer agent (See Note 3) | 8,330 |
| Shareholder communication | 3,673 |
| Trustees | 48 |
| Shareholder service (See Note 3) | 44 |
| Miscellaneous | 4,311 |
| Total expenses before waiver/reimbursement | 202,336 |
| Expense waiver/reimbursement from Manager (See Note 3) | (119,414) |
| Reimbursement from prior custodian(a) | (21) |
| Net expenses | 82,901 |
| Net investment income (loss) | 295,424 |
| Realized and Unrealized Gain (Loss) |
| Net realized gain (loss) on unaffiliated investments | (350,565) |
| Net change in unrealized appreciation (depreciation) on unaffiliated investments | 138,487 |
| Net realized and unrealized gain (loss) | (212,078) |
| Net increase (decrease) in net assets resulting from operations | $ 83,346 |
| (a) | Represents a refund for overbilling of custody fees. |
The notes to the financial statements are an integral part of, and should be read in conjunction with, the financial statements.
15
Statements of Changes in Net Assets
for the years ended April 30, 2023 and April 30, 2022
| | 2023 | 2022 |
| Increase (Decrease) in Net Assets |
| Operations: | | |
| Net investment income (loss) | $ 295,424 | $ 169,523 |
| Net realized gain (loss) | (350,565) | 29,411 |
| Net change in unrealized appreciation (depreciation) | 138,487 | (878,389) |
| Net increase (decrease) in net assets resulting from operations | 83,346 | (679,455) |
| Distributions to shareholders: | | |
| Class A | (337,870) | (248,280) |
| Class C | (5,491) | (2,845) |
| Class I | (1,493) | (1,116) |
| Class R3 | (1,517) | (758) |
| SIMPLE Class | (16,132) | (3,645) |
| Total distributions to shareholders | (362,503) | (256,644) |
| Capital share transactions: | | |
| Net proceeds from sales of shares | 3,467,813 | 5,073,474 |
| Net asset value of shares issued to shareholders in reinvestment of distributions | 361,248 | 254,651 |
| Cost of shares redeemed | (2,959,484) | (5,451,399) |
| Increase (decrease) in net assets derived from capital share transactions | 869,577 | (123,274) |
| Net increase (decrease) in net assets | 590,420 | (1,059,373) |
| Net Assets |
| Beginning of year | 9,821,188 | 10,880,561 |
| End of year | $10,411,608 | $ 9,821,188 |
The notes to the financial statements are an integral part of, and should be read in conjunction with, the financial statements.
| 16 | MainStay Defensive ETF Allocation Fund |
Financial Highlights selected per share data and ratios
| | Year Ended April 30, | | June 30, 2020^ through
April 30, |
| Class A | 2023 | | 2022 | | 2021 |
| Net asset value at beginning of year | $ 9.50 | | $ 10.44 | | $ 10.00 |
| Net investment income (loss) (a) | 0.27 | | 0.18 | | 0.13 |
| Net realized and unrealized gain (loss) | (0.21) | | (0.84) | | 0.41 |
| Total from investment operations | 0.06 | | (0.66) | | 0.54 |
| Less distributions: | | | | | |
| From net investment income | (0.26) | | (0.19) | | (0.10) |
| From net realized gain on investments | (0.07) | | (0.09) | | — |
| Total distributions | (0.33) | | (0.28) | | (0.10) |
| Net asset value at end of year | $ 9.23 | | $ 9.50 | | $ 10.44 |
| Total investment return (b) | 0.74% | | (6.49)% | | 5.38% |
| Ratios (to average net assets)/Supplemental Data: | | | | | |
| Net investment income (loss) | 2.96% | | 1.79% | | 1.45%†† |
| Net expenses (c) | 0.80% | | 0.80% | | 0.80%†† |
| Expenses (before waiver/reimbursement) (c) | 1.98% | | 1.75% | | 2.36%†† |
| Portfolio turnover rate | 64% | | 79% | | 69% |
| Net assets at end of year (in 000’s) | $ 9,400 | | $ 9,366 | | $ 8,572 |
| ^ | Inception date. |
| †† | Annualized. |
| (a) | Per share data based on average shares outstanding during the period. |
| (b) | Total investment return is calculated exclusive of sales charges and assumes the reinvestment of dividends and distributions. For periods of less than one year, total return is not annualized. |
| (c) | In addition to the fees and expenses which the Fund bears directly, it also indirectly bears a pro-rata share of the fees and expenses of the underlying funds in which it invests. Such indirect expenses are not included in the above expense ratios. |
| | Year Ended April 30, | | June 30, 2020^ through
April 30, |
| Class C | 2023 | | 2022 | | 2021 |
| Net asset value at beginning of year | $ 9.49 | | $ 10.44 | | $ 10.00 |
| Net investment income (loss) (a) | 0.21 | | 0.11 | | 0.06 |
| Net realized and unrealized gain (loss) | (0.22) | | (0.85) | | 0.43 |
| Total from investment operations | (0.01) | | (0.74) | | 0.49 |
| Less distributions: | | | | | |
| From net investment income | (0.19) | | (0.12) | | (0.05) |
| From net realized gain on investments | (0.07) | | (0.09) | | — |
| Total distributions | (0.26) | | (0.21) | | (0.05) |
| Net asset value at end of year | $ 9.22 | | $ 9.49 | | $ 10.44 |
| Total investment return (b) | (0.02)% | | (7.28)% | | 4.85% |
| Ratios (to average net assets)/Supplemental Data: | | | | | |
| Net investment income (loss) | 2.32% | | 1.07% | | 0.74%†† |
| Net expenses (c) | 1.55% | | 1.55% | | 1.55%†† |
| Expenses (before waiver/reimbursement) (c) | 2.83% | | 2.60% | | 3.13%†† |
| Portfolio turnover rate | 64% | | 79% | | 69% |
| Net assets at end of year (in 000’s) | $ 229 | | $ 117 | | $ 162 |
| ^ | Inception date. |
| †† | Annualized. |
| (a) | Per share data based on average shares outstanding during the period. |
| (b) | Total investment return is calculated exclusive of sales charges and assumes the reinvestment of dividends and distributions. For periods of less than one year, total return is not annualized. |
| (c) | In addition to the fees and expenses which the Fund bears directly, it also indirectly bears a pro-rata share of the fees and expenses of the underlying funds in which it invests. Such indirect expenses are not included in the above expense ratios. |
The notes to the financial statements are an integral part of, and should be read in conjunction with, the financial statements.
17
Financial Highlights selected per share data and ratios
| | Year Ended April 30, | | June 30, 2020^ through
April 30, |
| Class I | 2023 | | 2022 | | 2021 |
| Net asset value at beginning of year | $ 9.50 | | $ 10.44 | | $ 10.00 |
| Net investment income (loss) (a) | 0.30 | | 0.24 | | 0.16 |
| Net realized and unrealized gain (loss) | (0.22) | | (0.87) | | 0.40 |
| Total from investment operations | 0.08 | | (0.63) | | 0.56 |
| Less distributions: | | | | | |
| From net investment income | (0.28) | | (0.22) | | (0.12) |
| From net realized gain on investments | (0.07) | | (0.09) | | — |
| Total distributions | (0.35) | | (0.31) | | (0.12) |
| Net asset value at end of year | $ 9.23 | | $ 9.50 | | $ 10.44 |
| Total investment return (b) | 1.00% | | (6.25)% | | 5.65% |
| Ratios (to average net assets)/Supplemental Data: | | | | | |
| Net investment income (loss) | 3.24% | | 2.33% | | 1.82%†† |
| Net expenses (c) | 0.55% | | 0.55% | | 0.55%†† |
| Expenses (before waiver/reimbursement) (c) | 1.73% | | 1.50% | | 2.11%†† |
| Portfolio turnover rate | 64% | | 79% | | 69% |
| Net assets at end of year (in 000’s) | $ 41 | | $ 35 | | $ 2,040 |
| ^ | Inception date. |
| †† | Annualized. |
| (a) | Per share data based on average shares outstanding during the period. |
| (b) | Total investment return is calculated exclusive of sales charges and assumes the reinvestment of dividends and distributions. Class I shares are not subject to sales charges. For periods of less than one year, total return is not annualized. |
| (c) | In addition to the fees and expenses which the Fund bears directly, it also indirectly bears a pro-rata share of the fees and expenses of the underlying funds in which it invests. Such indirect expenses are not included in the above expense ratios. |
The notes to the financial statements are an integral part of, and should be read in conjunction with, the financial statements.
| 18 | MainStay Defensive ETF Allocation Fund |
Financial Highlights selected per share data and ratios
| | Year Ended April 30, | | June 30, 2020^ through
April 30, |
| Class R3 | 2023 | | 2022 | | 2021 |
| Net asset value at beginning of year | $ 9.49 | | $ 10.44 | | $ 10.00 |
| Net investment income (loss) (a) | 0.24 | | 0.15 | | 0.11 |
| Net realized and unrealized gain (loss) | (0.22) | | (0.85) | | 0.41 |
| Total from investment operations | 0.02 | | (0.70) | | 0.52 |
| Less distributions: | | | | | |
| From net investment income | (0.22) | | (0.16) | | (0.08) |
| From net realized gain on investments | (0.07) | | (0.09) | | — |
| Total distributions | (0.29) | | (0.25) | | (0.08) |
| Net asset value at end of year | $ 9.22 | | $ 9.49 | | $ 10.44 |
| Total investment return (b) | 0.36% | | (6.91)% | | 5.18% |
| Ratios (to average net assets)/Supplemental Data: | | | | | |
| Net investment income (loss) | 2.58% | | 1.45% | | 1.22%†† |
| Net expenses (c) | 1.15% | | 1.15% | | 1.15%†† |
| Expenses (before waiver/reimbursement) (c) | 2.35% | | 2.10% | | 2.71%†† |
| Portfolio turnover rate | 64% | | 79% | | 69% |
| Net assets at end of year (in 000’s) | $ 76 | | $ 32 | | $ 26 |
| ^ | Inception date. |
| †† | Annualized. |
| (a) | Per share data based on average shares outstanding during the period. |
| (b) | Total investment return is calculated exclusive of sales charges and assumes the reinvestment of dividends and distributions. Class R3 shares are not subject to sales charges. For periods of less than one year, total return is not annualized. |
| (c) | In addition to the fees and expenses which the Fund bears directly, it also indirectly bears a pro-rata share of the fees and expenses of the underlying funds in which it invests. Such indirect expenses are not included in the above expense ratios. |
The notes to the financial statements are an integral part of, and should be read in conjunction with, the financial statements.
19
Financial Highlights selected per share data and ratios
| | Year Ended April 30, | | August 31, 2020^ through
April 30, |
| SIMPLE Class | 2023 | | 2022 | | 2021 |
| Net asset value at beginning of year | $ 9.50 | | $ 10.44 | | $ 10.26 |
| Net investment income (loss) (a) | 0.25 | | 0.15 | | 0.10 |
| Net realized and unrealized gain (loss) | (0.22) | | (0.83) | | 0.16 |
| Total from investment operations | 0.03 | | (0.68) | | 0.26 |
| Less distributions: | | | | | |
| From net investment income | (0.23) | | (0.17) | | (0.08) |
| From net realized gain on investments | (0.07) | | (0.09) | | — |
| Total distributions | (0.30) | | (0.26) | | (0.08) |
| Net asset value at end of year | $ 9.23 | | $ 9.50 | | $ 10.44 |
| Total investment return (b) | 0.47% | | (6.74)% | | 2.56% |
| Ratios (to average net assets)/Supplemental Data: | | | | | |
| Net investment income (loss) | 2.68% | | 1.45% | | 1.13%†† |
| Net expenses (c) | 1.05% | | 1.05% | | 1.05%†† |
| Expenses (before waiver/reimbursement) (c) | 2.32% | | 2.10% | | 2.63%†† |
| Portfolio turnover rate | 64% | | 79% | | 69% |
| Net assets at end of year (in 000’s) | $ 666 | | $ 271 | | $ 80 |
| ^ | Inception date. |
| †† | Annualized. |
| (a) | Per share data based on average shares outstanding during the period. |
| (b) | Total investment return is calculated exclusive of sales charges and assumes the reinvestment of dividends and distributions. SIMPLE Class shares are not subject to sales charges. For periods of less than one year, total return is not annualized. |
| (c) | In addition to the fees and expenses which the Fund bears directly, it also indirectly bears a pro-rata share of the fees and expenses of the underlying funds in which it invests. Such indirect expenses are not included in the above expense ratios. |
The notes to the financial statements are an integral part of, and should be read in conjunction with, the financial statements.
| 20 | MainStay Defensive ETF Allocation Fund |
MainStay Conservative ETF Allocation Fund
Investment and Performance Comparison (Unaudited)
Performance data quoted represents past performance. Past performance is no guarantee of future results. Because of market volatility and other factors, current performance may be lower or higher than the figures shown. Investment return and principal value will fluctuate, and as a result, when shares are redeemed, they may be worth more or less than their original cost. The graph below depicts the historical performance of Class I shares of the Fund. Performance will vary from class to class based on differences in class-specific expenses and sales charges. For performance information current to the most recent month-end, please call 800-624-6782 or visit newyorklifeinvestments.com.
The performance table and graph do not reflect the deduction of taxes that a shareholder would pay on distributions or Fund share redemptions. Total returns reflect maximum applicable sales charges as indicated in the table below, if any, changes in share price, and reinvestment of dividend and capital gain distributions. The graph assumes the initial investment amount shown below and reflects the deduction of all sales charges that would have applied for the period of investment. Performance figures may reflect certain fee waivers and/or expense limitations, without which total returns may have been lower. For more information on share classes and current fee waivers and/or expense limitations (if any), please refer to the Notes to Financial Statements.

| Average Annual Total Returns for the Year-Ended April 30, 2023 |
| Class | Sales Charge | | Inception
Date | One
Year | Since
Inception | Gross
Expense
Ratio1 |
| Class A Shares | Maximum 3.00% Initial Sales Charge | With sales charges | 6/30/2020 | -2.07% | 1.15% | 1.03% |
| | | Excluding sales charges | | 0.96 | 2.25 | 1.03 |
| Class C Shares | Maximum 1.00% CDSC | With sales charges | 6/30/2020 | -0.69 | 1.47 | 1.85 |
| | if redeemed Within One Year of Purchase | Excluding sales charges | | 0.29 | 1.47 | 1.85 |
| Class I Shares | No Sales Charge | | 6/30/2020 | 1.32 | 2.51 | 0.78 |
| Class R3 Shares | No Sales Charge | | 6/30/2020 | 0.60 | 1.87 | 1.38 |
| SIMPLE Class Shares | No Sales Charge | | 8/31/2020 | 0.72 | 0.42 | 1.35 |
| 1. | The gross expense ratios presented reflect the Fund’s “Total Annual Fund Operating Expenses” from the most recent Prospectus, as supplemented, and may differ from other expense ratios disclosed in this report. |
The footnotes on the next page are an integral part of the table and graph and should be carefully read in conjunction with them.
| Benchmark Performance* | One
Year | Since
Inception |
| Bloomberg U.S. Aggregate Bond Index1 | -0.43% | -3.70% |
| S&P 500® Index2 | 2.66 | 12.77 |
| MSCI EAFE® Index (Net)3 | 8.42 | 9.43 |
| Conservative Allocation Composite Index4 | 1.66 | 2.58 |
| Morningstar Moderately Conservative Allocation Category Average5 | -0.35 | 3.20 |
| * | Returns for indices reflect no deductions for fees, expenses or taxes, except for foreign withholding taxes where applicable. Results assume reinvestment of all dividends and capital gains. An investment cannot be made directly in an index. |
| 1. | The Fund has selected the Bloomberg U.S. Aggregate Bond Index as the primary broad-based securities market index for comparison purposes. The Bloomberg U.S. Aggregate Bond Index is a broad-based benchmark that measures the investment grade, U.S. dollar-denominated, fixed-rate taxable bond market, including Treasuries, government-related and corporate securities, mortgage-backed securities (agency fixed-rate and hybrid adjustable rate mortgage pass-throughs), asset-backed securities and commercial mortgage-backed securities. |
| 2. | The S&P 500® Index is the Fund's secondary benchmark. The S&P 500® Index is widely regarded as the standard index for measuring large-cap U.S. stock market performance. |
| 3. | The Fund has selected the MSCI EAFE® Index (Net) as an additional benchmark. The MSCI EAFE® Index (Net) consists of international stocks representing the developed world outside of North America. |
| 4. | The Fund has selected the Conservative Allocation Composite Index as an additional benchmark. The Conservative Allocation Composite Index consists of the S&P 500® Index, the MSCI EAFE® Index (Net) and the Bloomberg U.S. Aggregate Bond Index weighted 30%, 10% and 60%, respectively. |
| 5. | The Morningstar Moderately Conservative Allocation Category Average is a representative of funds in allocation categories that seek to provide both income and capital appreciation by primarily investing in multiple asset classes, including stocks, bonds, and cash. These moderately conservative strategies prioritize preservation of capital over appreciation. They typically expect volatility similar to a strategic equity exposure between 30% and 50%. Results are based on average total returns of similar funds with all dividends and capital gain distributions reinvested. |
The footnotes on the preceding page are an integral part of the table and graph and should be carefully read in conjunction with them.
| 22 | MainStay Conservative ETF Allocation Fund |
Cost in Dollars of a $1,000 Investment in MainStay Conservative ETF Allocation Fund (Unaudited)
The example below is intended to describe the fees and expenses borne by shareholders during the six-month period from November 1, 2022 to April 30, 2023, and the impact of those costs on your investment.
Example
As a shareholder of the Fund you incur two types of costs: (1) transaction costs, including exchange fees and sales charges (loads) on purchases (as applicable), and (2) ongoing costs, including management fees, distribution and/or service (12b-1) fees and other Fund expenses (as applicable). This example is intended to help you understand your ongoing costs (in dollars) of investing in the Fund and to compare these costs with the ongoing costs of investing in other mutual funds. The example is based on an investment of $1,000 made at the beginning of the six-month period and held for the entire period from November 1, 2022 to April 30, 2023.
This example illustrates your Fund’s ongoing costs in two ways:
Actual Expenses
The second and third data columns in the table below provide information about actual account values and actual expenses. You may use the information in these columns, together with the amount you invested, to estimate the expenses that you paid during the six months ended April 30, 2023. Simply divide your account value by $1,000 (for example, an
$8,600 account value divided by $1,000 = 8.6), then multiply the result by the number under the heading entitled “Expenses Paid During Period” to estimate the expenses you paid on your account during this period.
Hypothetical Example for Comparison Purposes
The fourth and fifth data columns in the table below provide information about hypothetical account values and hypothetical expenses based on the Fund’s actual expense ratio and an assumed rate of return of 5% per year before expenses, which is not the Fund’s actual return. The hypothetical account values and expenses may not be used to estimate the actual ending account balances or expenses you paid for the six-month period shown. You may use this information to compare the ongoing costs of investing in the Fund with the ongoing costs of investing in other mutual funds. To do so, compare this 5% hypothetical example with the 5% hypothetical examples that appear in the shareholder reports of the other mutual funds.
Please note that the expenses shown in the table are meant to highlight your ongoing costs only and do not reflect any transactional costs, such as exchange fees or sales charges (loads). Therefore, the fourth and fifth data columns of the table are useful in comparing ongoing costs only and will not help you determine the relative total costs of owning different funds. In addition, if these transactional costs were included, your costs would have been higher.
| Share Class | Beginning
Account
Value
11/1/22 | Ending Account
Value (Based
on Actual
Returns and
Expenses)
4/30/23 | Expenses
Paid
During
Period1 | Ending Account
Value (Based
on Hypothetical
5% Annualized
Return and
Actual Expenses)
4/30/23 | Expenses
Paid
During
Period1 | Net Expense
Ratio
During
Period2 |
| Class A Shares | $1,000.00 | $1,063.40 | $4.09 | $1,020.83 | $4.01 | 0.80% |
| Class C Shares | $1,000.00 | $1,059.60 | $7.92 | $1,017.11 | $7.75 | 1.55% |
| Class I Shares | $1,000.00 | $1,065.90 | $2.82 | $1,022.07 | $2.76 | 0.55% |
| Class R3 Shares | $1,000.00 | $1,061.70 | $5.88 | $1,019.09 | $5.76 | 1.15% |
| SIMPLE Class Shares | $1,000.00 | $1,062.20 | $5.37 | $1,019.59 | $5.26 | 1.05% |
| 1. | Expenses are equal to the Fund’s annualized expense ratio of each class multiplied by the average account value over the period, divided by 365 and multiplied by 181 (to reflect the six-month period). The table above represents the actual expenses incurred during the six-month period. In addition to the fees and expenses which the Fund bears directly, it also indirectly bears a pro rata share of the fees and expenses of the underlying funds in which it invests. Such indirect expenses are not included in the above-reported expense figures. |
| 2. | Expenses are equal to the Fund's annualized expense ratio to reflect the six-month period. |
Asset Diversification as of April 30, 2023 (Unaudited)
| Equity Funds | 37.9 % |
| Fixed Income Funds | 52.7 |
| Short-Term Investments | 20.8 |
| Other Assets, Less Liabilities | (11.4) |
See Portfolio of Investments beginning on page 28 for specific holdings within these categories. The Fund’s holdings are subject to change.
| 24 | MainStay Conservative ETF Allocation Fund |
Portfolio Management Discussion and Analysis (Unaudited)
Questions answered by portfolio managers Jae S. Yoon, CFA, Jonathan Swaney, Poul Kristensen, CFA, and Amit Soni, CFA, of New York Life Investment Management LLC, the Fund’s Manager.
How did MainStay Conservative ETF Allocation Fund perform relative to its benchmarks and peer group during the 12 months ended April 30, 2023?
For the 12 months ended April 30, 2023, Class I shares of MainStay Conservative ETF Allocation Fund returned 1.32%, outperforming the −0.43% return of the Fund’s primary benchmark, the Bloomberg U.S. Aggregate Bond Index (the “Index”), and underperforming the 2.66% return of the S&P 500® Index, which is the Fund’s secondary benchmark. Over the same period, Class I shares the Fund underperformed the 8.42% return of the MSCI EAFE® Index (Net), and the 1.66% return of the Conservative Allocation Composite Index, both of which are additional benchmarks of the Fund. For the 12 months ended April 30, 2023, Class I shares of the Fund outperformed the −0.35% return of the Morningstar Moderately Conservative Allocation Category Average.1
What factors affected the Fund’s relative performance during the reporting period?
The Fund is a “fund of funds" that seeks to achieve its investment objective by investing in unaffiliated, passively-managed, exchange-traded funds (“Underlying ETFs”). The Underlying ETFs may invest in U.S. equities, international equities and fixed-income instruments, making comparisons to any single index generally less suitable than a weighted combination of indices, which is a more useful yardstick by which to measure performance. During the reporting period, asset class policy was the primary determinant of the Fund’s relative performance.
Fund management internally maintains a blend of indices that are taken into consideration when managing the Fund. During the reporting period, the Fund modestly underperformed the internally maintained blend of indices, primarily due to asset class policy decisions. Management of the Fund’s stock/bond blend itself was not the issue, as positive returns were generated in the process of controlling the blend. The allocation was held near neutral for much of the reporting period, although capital was added to equities during periods of pricing softness and removed again as the market recovered. This tactical “buy the dip, sell the rally” practice boosted returns at the margin.
Rather, the issue was within asset classes. A persistent bias toward small-cap names, expressed through exposure to the S&P SmallCap 600™ Index,2 detracted materially from relative performance. While relative valuations for small-cap stocks were much more attractive than the historical norm, smaller companies are significantly more sensitive to changes in bank financing conditions than larger companies that can issue bonds. Fast-rising costs on bank loans, coupled with concerns about future credit availability in the wake of the bank crisis that emerged in March and April 2023, weighed heavily on the smaller end of the capitalization spectrum. In contrast, mega-cap technology and technology-related companies—including
Microsoft, Apple, Tesla, Meta Platforms and Amazon.com—performed well.
Significantly underweight exposure to non-U.S. developed markets also detracted materially from relative performance. In our estimation, Europe was particularly vulnerable to disruption, owing largely to the Russian invasion of Ukraine and the accompanying strain on energy supplies. An unusally mild winter, however, granted a reprieve, and these markets ultimately performed quite well.
Exposure to gold miners further detracted from relative performance. The price of bullion rose over the course of the reporting period, but companies that extract gold fared less well, possibly due to rising extraction costs (particularly labor) and currency effects.
On the upside, maintaining a large cash position within the fixed-income portion of the Fund made a substantial positive contribution to performance, as bond yields climbed. (Contributions take weightings and total returns into account.) Similarly, skewing high yield bond holdings to favor shorter-duration3 instruments boosted returns at the margin.
Even within equities, the news was not universally negative. Exposure to energy stocks, for example, proved helpful as gains in the first half of the reporting period more than offset the underperformance experienced during the second half. We believe energy remains a compelling strategic opportunity, particularly among producers and firms that provide extraction services.
How did you allocate the Fund’s assets during the reporting period and why?
Stock/bond blend: Equity exposure within the Fund was held relatively close to neutral during the reporting period, with the exception of a modest bias favoring stocks that we implemented tactically in response to swings in pricing (adding on drawdowns and trimming on rallies). We are generally reluctant to position the Fund with underweight equity exposure, since stocks tend to perform well over time, and anticipating drawdowns is challenging. The opposite is less true. We are happy to lean into equities when we believe they are well-supported fundamentally or when a correction has run further than we believe appropriate. This strategy worked well during the reporting period, producing a modestly positive contribution to performance. The policy stance shifted slightly in 2023, however, when the Fund adopted a small underweight position in equities following a sharp rally in January. We increased this underweight posture later in the reporting period as turmoil among banks increased the likelihood of a near-term recession.
Duration: Believing inflationary pressures to be at least partially structural in nature and likely to persist at elevated levels for the foreseeable future, we skewed the Fund’s fixed-income holdings to favor shorter-maturity instruments less sensitive to rising bond
| 1. | See "Investment and Performance Comparison" for other share class returns, which may be higher or lower than Class I share returns, and for more information on benchmark and peer group returns. |
| 2. | The S&P SmallCap 600™ Index covers roughly the small-cap range of American stocks, using a capitalization-weighted index. Capitalization range is from $850 million to $3.7 billion. |
| 3. | Duration is a measure of the price sensitivity of a fixed-income investment to changes in interest rates. Duration is expressed as a number of years and is considered a more accurate sensitivity gauge than average maturity. |
yields, although duration was added as yields rose. Over the latter half of the reporting period, duration was slightly shorter than that of the Bloomberg U.S. Aggregate Bond Index.
Equity style: In the same way that inflation threatens long-duration bonds, equities with values disproportionately reflected in more distant cash flows (i.e., growth stocks with high prices relative to current earnings) are likewise vulnerable. Accordingly, the Fund remained tilted to emphasize value stocks that offered more attractive near-term cash flows, placing particular focus on traditionally defensive sectors: real estate, utilities, consumer staples and (most of all) health care. While this positioning made a modest, positive contribution to the Fund’s return during the first half of the reporting period, the opposite was true during the second half; market performance was dominated by a handful of large, high-growth companies, including NVDIA, Tesla, Apple and others.
Equity size: Small-company stocks were more heavily represented in the Fund than in the Index. The thesis behind this positioning was based on attractive small-cap valuations, insulation from economic weakness abroad, less sensitivity to dollar strength, and disproportionate exposure to domestic demand which remained robust. This stance was helpful for much of the reporting period, but reversed abruptly in the spring of 2023 as small companies, which tend to be heavily dependent on bank financing, proved vulnerable to the aggressive, tightening lending standards implemented during the bank crisis mentioned above.
Geographic exposure: Following Russia’s invasion of Ukraine and the energy crisis that ensued, the Fund maintained underweight exposure to developed international markets. However, non-U.S. developed markets fared well during the reporting period, benefiting from both an unusually mild winter that reduced the strain on energy reserves, and the reopening of China following the end of the country’s ‘zero-COVID-19’ restrictions.
Gold miners: The Fund maintained a varying position in gold miners as a hedge against inflation and/or a monetary policy mistake. With month-over-month readings on inflation starting to improve, the Fed aggressively tightened monetary policy, driving input costs for energy and labor sharply higher while creating an unfavorable environment for miners. As a consequence, the Fund’s gold mining position detracted significantly from relative performance.
Energy: Similar to gold miners, the Fund maintained exposure to upstream energy producers and oilfield/gas field service providers as a commodity play to provide an additional inflation hedge. These holdings also positioned the Fund to take advantage of opportunities for domestic producers to benefit as Western nations revisit energy policy to source supplies from stable and friendly jurisdictions rather than autocratic petrostates that present national security risks. While the Fund’s position was small, it had a disproportionately positive impact on performance as oil and gas prices soared during the first half of the reporting period, although some of those gains were later reversed.
How did the Fund’s allocations change over the course of the reporting period?
The Fund’s cash position saw the largest allocation increase, as we trimmed both equity and fixed income positions. Allocations to full-duration investment-grade bonds also increased through additional exposure to iShares® Core U.S. Aggregate Bond ETF, Schwab U.S. Aggregate Bond ETF and iShares® Broad USD Investment Grade Corporate Bond ETF. The Fund also added several new holdings. The Fund established a stake in iShares® Core S&P® Mid-Cap ETF, reflecting our favorable view of the mid-cap asset class’s attractive relative valuations and reduced sensitivity to bank lending conditions compared to the small cap universe; the position also offset a reduction in the Fund’s position in Schwab U.S. Mid-Cap ETF. The Fund took a position in The Materials Select Sector SPDR® Fund as a hedge against stubborn inflation, protection against a potentially weakening dollar and as a way to benefit from supply-chain reengineering and the desire of manufacturers to source raw materials from more friendly, reliable geographies. The Fund also initiated a position in iShares® MSCI Japan ETF, since we viewed Japanese equity valuations as attractive, export conditions as favorable and we believe the Japanese yen is likely to appreciate should the country’s central bank further relax, or even abandon, its existing yield curve4 control policy. These positions were funded in large part from Vanguard Mega Cap ETF.
A reduced position in iShares® Core MSCI EAFE ETF reflected the Fund’s shift away from non-U.S. developed equity markets. We trimmed holdings of Schwab U.S. Small-Cap ETF in response to the ongoing bank crisis. Sales of iShares® 0–5 Year High Yield Corp Bond ETF and Invesco Senior Loan ETF were prompted by our strategy of shifting Fund assets away from lower-credit-quality fixed-income instruments in preparation for a potentially fast-approaching recession.
During the reporting period, which Underlying Equity ETFs had the highest total returns and which Underlying Equity ETFs had the lowest total returns?
The Fund’s top-performing Underlying Equity ETFs that were held for the entire reporting period included iShares® Core MSCI EAFE ETF, VanEck Oil Services ETF and Health Care Select SPDR® Fund. The lowest total returns were seen in iShares® Core S&P® Small-Cap ETF, Schwab U.S. Small-Cap ETF and Vanguard Mid-Cap ETF.
Which Underlying Equity ETFs were the strongest positive contributors to the Fund’s performance and which Underlying Equity ETFs were particularly weak?
Contribution to return is a function not only of Underlying ETF performance and average allocation, but also the variation in that allocation across time. The Underlying Equity ETFs making the largest positive contributions to return included Vanguard Mega Cap ETF, iShares® Core MSCI EAFE ETF and VanEck Oil Services ETF. The most significant detractors were Vanguard Mid-Cap ETF, iShares® Core MSCI Emerging Markets ETF and VanEck Gold Miners ETF.
| 4. | The yield curve is a line that plots the yields of various securities of similar quality—typically U.S. Treasury issues—across a range of maturities. The U.S. Treasury yield curve serves as a benchmark for other debt and is used in economic forecasting. |
| 26 | MainStay Conservative ETF Allocation Fund |
During the reporting period, which Underlying Fixed-Income ETFs had the highest total returns and which Underlying Fixed-Income ETFs had the lowest total returns?
The Underlying Fixed-Income ETFs posting the highest total returns included iShares® 0–5 Year High Yield Corporate Bond ETF, Invesco Senior Loan ETF and iShares® Broad USD High Yield Corporate Bond ETF. The only two Underlying Fixed-Income ETFs to experience losses were iShares® Core U.S. Aggregate Bond ETF and Schwab U.S. Aggregate Bond ETF.
Which Underlying Fixed-Income ETFs were the strongest positive contributors to the Fund’s performance and which Underlying Fixed-Income ETFs were particularly weak?
The Underlying Fixed-Income ETFs making the largest contributions to return were Invesco Senior Loan ETF, iShares® 0–5 Year High Yield Corporate Bond ETF and iShares® Broad USD Investment Grade Corporate Bond ETF. The only Underlying Fixed-Income ETFs to detract from absolute performance was iShares® 20+ Year Treasury Bond ETF, which was used for duration management. The smallest positive contributions came from Vanguard Short-Term Bond ETF and Schwab U.S. Aggregate Bond ETF.
How was the Fund positioned at the end of the reporting period?
As of April 30, 2023, we believe a near-term recession looks highly probable. Our opinion is based on a wide range of variables, including, but not limited to, the shape of the yield curve, trends in business surveys, a decline in money supply, tightening credit conditions, and the steady drawdown of savings accumulated during the pandemic. We expect corporate profits to decline over the next several quarters, eventually driving stock prices lower while pushing credit spreads out. Accordingly, we continue to position the Fund defensively.
The Fund’s defensive posture begins at the top of the portfolio, with a modest tilt away from equities. We generally avoid underweight equity allocations, as they usually stand on the wrong side of history—stocks rise more often than not. However, we firmly believe that current valuations are rich given the daunting array of risks the economy and the markets face, including an historically extreme rise in rates, the looming debt ceiling, the unresolved bank crisis and geopolitical uncertainty, to name a few. We maintain that caution is the better part of valor under these circumstances.
Defensive positioning is clearly visible within asset classes as well. On the equity side, the Fund favors sectors—such as consumer staples, utilities and healthcare—that have generally exhibited
lower volatility and retained their value better during drawdowns. Additionally, the Fund’s bias toward historically higher-beta, small-cap stocks, in place for the past several quarters, has been effectively removed. Within fixed income, the Fund now has a below-Index-weight position in bank loans, and holdings of high yield bonds are skewed to favor lower-duration instruments, which tend to exhibit less volatility and smaller losses than longer maturity bonds.
Energy stocks tend to be more cyclical. The Fund’s overweight allocation to the sector may seem inconsistent with the otherwise cautious posture of the portfolio, although relative valuation is attractive, and we believe supply/demand dynamics will prove supportive of pricing over time for both the underlying commodities and the stock prices of companies involved in the production, processing and distribution of these resources.
None of Schwab Strategic Trust, Schwab® U.S. Aggregate Bond ETF, Schwab U.S. Mid-Cap ETF, Schwab U.S. Small Cap ETF or Charles Schwab Investment Management, Inc. make any representations regarding the advisability of investing in MainStay Conservative ETF Allocation Fund.
iShares® is a registered trademark of BlackRock (BlackRock, Inc. and its subsidiaries). Neither BlackRock nor the iShares® Funds make any representations regarding the advisability of investing in MainStay Conservative ETF Allocation Fund.
The opinions expressed are those of the portfolio managers as of the date of this report and are subject to change. There is no guarantee that any forecasts will come to pass. This material does not constitute investment advice and is not intended as an endorsement of any specific investment.
Portfolio of Investments April 30, 2023†^
| | Shares | | Value |
| Investment Companies 90.6% |
| Equity Funds 37.9% |
| Health Care Select Sector SPDR Fund | 2,829 | | $ 377,756 |
| Invesco S&P 500 Low Volatility ETF | 6,026 | | 385,302 |
| iShares Core MSCI EAFE ETF | 33,589 | | 2,309,916 |
| iShares Core S&P Mid-Cap ETF | 4,140 | | 1,027,548 |
| iShares Core S&P Small-Cap ETF | 20,507 | | 1,927,658 |
| iShares MSCI Japan ETF | 6,492 | | 381,989 |
| Materials Select Sector SPDR Fund (a) | 4,709 | | 379,310 |
| Schwab U.S. Mid-Cap ETF | 4,933 | | 332,534 |
| Schwab U.S. Small-Cap ETF | 18,508 | | 762,160 |
| SPDR S&P Oil & Gas Exploration & Production ETF (a) | 3,024 | | 384,381 |
| VanEck Oil Services ETF (a) | 667 | | 182,845 |
| Vanguard Mega Cap ETF | 26,886 | | 3,920,785 |
| Vanguard Mega Cap Value ETF | 9,385 | | 965,904 |
| Vanguard Mid-Cap ETF | 6,359 | | 1,330,875 |
Total Equity Funds
(Cost $13,573,448) | | | 14,668,963 |
| Fixed Income Funds 52.7% |
| Invesco Senior Loan ETF (a) | 119,995 | | 2,505,496 |
| iShares 0-5 Year High Yield Corporate Bond ETF (a) | 41,788 | | 1,736,291 |
| iShares Broad USD High Yield Corporate Bond ETF | 32,696 | | 1,158,746 |
| iShares Broad USD Investment Grade Corporate Bond ETF (a) | 57,400 | | 2,921,086 |
| iShares Core U.S. Aggregate Bond ETF | 58,438 | | 5,841,462 |
| Schwab U.S. Aggregate Bond ETF | 124,133 | | 5,841,699 |
| Vanguard Short-Term Bond ETF (a) | 5,038 | | 386,112 |
Total Fixed Income Funds
(Cost $21,857,090) | | | 20,390,892 |
Total Investment Companies
(Cost $35,430,538) | | | 35,059,855 |
| Short-Term Investments 20.8% |
| Affiliated Investment Company 9.4% |
| MainStay U.S. Government Liquidity Fund, 3.98% (b) | 3,634,122 | | 3,634,122 |
| Unaffiliated Investment Company 11.4% |
| Invesco Government & Agency Portfolio, 4.857% (b)(c) | 4,396,289 | | 4,396,289 |
Total Short-Term Investments
(Cost $8,030,411) | | | 8,030,411 |
Total Investments
(Cost $43,460,949) | 111.4% | | 43,090,266 |
| Other Assets, Less Liabilities | (11.4) | | (4,407,412) |
| Net Assets | 100.0% | | $ 38,682,854 |
The notes to the financial statements are an integral part of, and should be read in conjunction with, the financial statements.
| 28 | MainStay Conservative ETF Allocation Fund |
| † | Percentages indicated are based on Fund net assets. |
| ^ | Industry classifications may be different than those used for compliance monitoring purposes. |
| (a) | All or a portion of this security was held on loan. As of April 30, 2023, the aggregate market value of securities on loan was $4,309,641. The Fund received cash collateral with a value of $4,396,289. (See Note 2(G)) |
| (b) | Current yield as of April 30, 2023. |
| (c) | Represents a security purchased with cash collateral received for securities on loan. |
Investments in Affiliates (in 000's)
Investments in issuers considered to be affiliate(s) of the Fund during the year ended April 30, 2023 for purposes of Section 2(a)(3) of the Investment Company Act of 1940, as amended, were as follows:
| Affiliated Investment Companies | Value,
Beginning
of Year | Purchases
at Cost | Proceeds
from
Sales | Net
Realized
Gain/(Loss)
on Sales | Change in
Unrealized
Appreciation/
(Depreciation) | Value,
End of
Year | Dividend
Income | Other
Distributions | Shares
End of
Year |
| MainStay U.S. Government Liquidity Fund | $ 919 | $ 15,281 | $ (12,566) | $ — | $ — | $ 3,634 | $ 62 | $ — | 3,634 |
| Abbreviation(s): |
| EAFE—Europe, Australasia and Far East |
| ETF—Exchange-Traded Fund |
| MSCI—Morgan Stanley Capital International |
| SPDR—Standard & Poor’s Depositary Receipt |
| USD—United States Dollar |
The following is a summary of the fair valuations according to the inputs used as of April 30, 2023, for valuing the Fund’s assets:
| Description | Quoted
Prices in
Active
Markets for
Identical
Assets
(Level 1) | | Significant
Other
Observable
Inputs
(Level 2) | | Significant
Unobservable
Inputs
(Level 3) | | Total |
| Asset Valuation Inputs | | | | | | | |
| Investments in Securities (a) | | | | | | | |
| Investment Companies | | | | | | | |
| Equity Funds | $ 14,668,963 | | $ — | | $ — | | $ 14,668,963 |
| Fixed Income Funds | 20,390,892 | | — | | — | | 20,390,892 |
| Total Investment Companies | 35,059,855 | | — | | — | | 35,059,855 |
| Short-Term Investments | | | | | | | |
| Affiliated Investment Company | 3,634,122 | | — | | — | | 3,634,122 |
| Unaffiliated Investment Company | 4,396,289 | | — | | — | | 4,396,289 |
| Total Short-Term Investments | 8,030,411 | | — | | — | | 8,030,411 |
| Total Investments in Securities | $ 43,090,266 | | $ — | | $ — | | $ 43,090,266 |
| (a) | For a complete listing of investments, see the Portfolio of Investments. |
The notes to the financial statements are an integral part of, and should be read in conjunction with, the financial statements.
29
Statement of Assets and Liabilities as of April 30, 2023
| Assets |
Investment in unaffiliated securities, at value
(identified cost $39,826,827) including securities on loan of $4,309,641 | $39,456,144 |
Investment in affiliated investment companies, at value
(identified cost $3,634,122) | 3,634,122 |
| Receivables: | |
| Fund shares sold | 25,660 |
| Dividends | 10,910 |
| Securities lending | 8,186 |
| Manager (See Note 3) | 131 |
| Other assets | 17,131 |
| Total assets | 43,152,284 |
| Liabilities |
| Cash collateral received for securities on loan | 4,396,289 |
| Due to custodian | 72 |
| Payables: | |
| Investment securities purchased | 30,983 |
| Fund shares redeemed | 16,799 |
| NYLIFE Distributors (See Note 3) | 8,614 |
| Transfer agent (See Note 3) | 6,248 |
| Custodian | 5,540 |
| Shareholder communication | 4,579 |
| Professional fees | 276 |
| Accrued expenses | 30 |
| Total liabilities | 4,469,430 |
| Net assets | $38,682,854 |
| Composition of Net Assets |
| Shares of beneficial interest outstanding (par value of $.001 per share) unlimited number of shares authorized | $ 3,860 |
| Additional paid-in-capital | 40,963,864 |
| | 40,967,724 |
| Total distributable earnings (loss) | (2,284,870) |
| Net assets | $38,682,854 |
| Class A | |
| Net assets applicable to outstanding shares | $35,480,956 |
| Shares of beneficial interest outstanding | 3,539,719 |
| Net asset value per share outstanding | $ 10.02 |
| Maximum sales charge (3.00% of offering price) | 0.31 |
| Maximum offering price per share outstanding | $ 10.33 |
| Class C | |
| Net assets applicable to outstanding shares | $ 368,667 |
| Shares of beneficial interest outstanding | 36,865 |
| Net asset value and offering price per share outstanding | $ 10.00 |
| Class I | |
| Net assets applicable to outstanding shares | $ 33,769 |
| Shares of beneficial interest outstanding | 3,375 |
| Net asset value and offering price per share outstanding | $ 10.01 |
| Class R3 | |
| Net assets applicable to outstanding shares | $ 432,904 |
| Shares of beneficial interest outstanding | 43,252 |
| Net asset value and offering price per share outstanding | $ 10.01 |
| SIMPLE Class | |
| Net assets applicable to outstanding shares | $ 2,366,558 |
| Shares of beneficial interest outstanding | 236,392 |
| Net asset value and offering price per share outstanding | $ 10.01 |
The notes to the financial statements are an integral part of, and should be read in conjunction with, the financial statements.
| 30 | MainStay Conservative ETF Allocation Fund |
Statement of Operations for the year ended April 30, 2023
| Investment Income (Loss) |
| Income | |
| Dividends-unaffiliated | $ 1,007,843 |
| Securities lending, net | 122,510 |
| Dividends-affiliated | 62,216 |
| Total income | 1,192,569 |
| Expenses | |
| Distribution/Service—Class A (See Note 3) | 82,957 |
| Distribution/Service—Class C (See Note 3) | 3,803 |
| Distribution/Service—Class R3 (See Note 3) | 1,698 |
| Distribution/Service—SIMPLE Class (See Note 3) | 8,012 |
| Registration | 89,154 |
| Manager (See Note 3) | 71,076 |
| Professional fees | 33,005 |
| Transfer agent (See Note 3) | 29,956 |
| Custodian | 18,225 |
| Shareholder communication | 6,716 |
| Trustees | 856 |
| Shareholder service (See Note 3) | 340 |
| Miscellaneous | 4,890 |
| Total expenses before waiver/reimbursement | 350,688 |
| Expense waiver/reimbursement from Manager (See Note 3) | (58,419) |
| Reimbursement from prior custodian(a) | (72) |
| Net expenses | 292,197 |
| Net investment income (loss) | 900,372 |
| Realized and Unrealized Gain (Loss) |
| Net realized gain (loss) on unaffiliated investments | (1,445,003) |
| Net change in unrealized appreciation (depreciation) on unaffiliated investments | 985,170 |
| Net realized and unrealized gain (loss) | (459,833) |
| Net increase (decrease) in net assets resulting from operations | $ 440,539 |
| (a) | Represents a refund for overbilling of custody fees. |
The notes to the financial statements are an integral part of, and should be read in conjunction with, the financial statements.
31
Statements of Changes in Net Assets
for the years ended April 30, 2023 and April 30, 2022
| | 2023 | 2022 |
| Increase (Decrease) in Net Assets |
| Operations: | | |
| Net investment income (loss) | $ 900,372 | $ 513,281 |
| Net realized gain (loss) | (1,445,003) | (90,363) |
| Net change in unrealized appreciation (depreciation) | 985,170 | (2,811,868) |
| Net increase (decrease) in net assets resulting from operations | 440,539 | (2,388,950) |
| Distributions to shareholders: | | |
| Class A | (961,007) | (713,856) |
| Class C | (7,847) | (6,834) |
| Class I | (1,028) | (1,541) |
| Class R3 | (9,791) | (1,667) |
| SIMPLE Class | (45,805) | (13,388) |
| Total distributions to shareholders | (1,025,478) | (737,286) |
| Capital share transactions: | | |
| Net proceeds from sales of shares | 10,453,424 | 19,899,906 |
| Net asset value of shares issued to shareholders in reinvestment of distributions | 1,017,247 | 727,750 |
| Cost of shares redeemed | (6,741,449) | (7,710,201) |
| Increase (decrease) in net assets derived from capital share transactions | 4,729,222 | 12,917,455 |
| Net increase (decrease) in net assets | 4,144,283 | 9,791,219 |
| Net Assets |
| Beginning of year | 34,538,571 | 24,747,352 |
| End of year | $38,682,854 | $34,538,571 |
The notes to the financial statements are an integral part of, and should be read in conjunction with, the financial statements.
| 32 | MainStay Conservative ETF Allocation Fund |
Financial Highlights selected per share data and ratios
| | Year Ended April 30, | | June 30, 2020^ through
April 30, |
| Class A | 2023 | | 2022 | | 2021 |
| Net asset value at beginning of year | $ 10.22 | | $ 11.13 | | $ 10.00 |
| Net investment income (loss) (a) | 0.25 | | 0.18 | | 0.11 |
| Net realized and unrealized gain (loss) | (0.16) | | (0.84) | | 1.12 |
| Total from investment operations | 0.09 | | (0.66) | | 1.23 |
| Less distributions: | | | | | |
| From net investment income | (0.25) | | (0.18) | | (0.09) |
| From net realized gain on investments | (0.04) | | (0.07) | | (0.01) |
| Total distributions | (0.29) | | (0.25) | | (0.10) |
| Net asset value at end of year | $ 10.02 | | $ 10.22 | | $ 11.13 |
| Total investment return (b) | 0.96% | | (6.09)% | | 12.33% |
| Ratios (to average net assets)/Supplemental Data: | | | | | |
| Net investment income (loss) | 2.56% | | 1.63% | | 1.25%†† |
| Net expenses (c) | 0.80% | | 0.80% | | 0.80%†† |
| Expenses (before waiver/reimbursement) (c) | 0.96% | | 0.91% | | 1.49%†† |
| Portfolio turnover rate | 65% | | 62% | | 56% |
| Net assets at end of year (in 000’s) | $ 35,481 | | $ 32,925 | | $ 23,951 |
| ^ | Inception date. |
| †† | Annualized. |
| (a) | Per share data based on average shares outstanding during the period. |
| (b) | Total investment return is calculated exclusive of sales charges and assumes the reinvestment of dividends and distributions. For periods of less than one year, total return is not annualized. |
| (c) | In addition to the fees and expenses which the Fund bears directly, it also indirectly bears a pro-rata share of the fees and expenses of the underlying funds in which it invests. Such indirect expenses are not included in the above expense ratios. |
| | Year Ended April 30, | | June 30, 2020^ through
April 30, |
| Class C | 2023 | | 2022 | | 2021 |
| Net asset value at beginning of year | $ 10.19 | | $ 11.10 | | $ 10.00 |
| Net investment income (loss) (a) | 0.18 | | 0.10 | | 0.05 |
| Net realized and unrealized gain (loss) | (0.16) | | (0.85) | | 1.10 |
| Total from investment operations | 0.02 | | (0.75) | | 1.15 |
| Less distributions: | | | | | |
| From net investment income | (0.17) | | (0.09) | | (0.04) |
| From net realized gain on investments | (0.04) | | (0.07) | | (0.01) |
| Total distributions | (0.21) | | (0.16) | | (0.05) |
| Net asset value at end of year | $ 10.00 | | $ 10.19 | | $ 11.10 |
| Total investment return (b) | 0.29% | | (6.81)% | | 11.51% |
| Ratios (to average net assets)/Supplemental Data: | | | | | |
| Net investment income (loss) | 1.81% | | 0.90% | | 0.58%†† |
| Net expenses (c) | 1.55% | | 1.55% | | 1.55%†† |
| Expenses (before waiver/reimbursement) (c) | 1.76% | | 1.73% | | 2.24%†† |
| Portfolio turnover rate | 65% | | 62% | | 56% |
| Net assets at end of year (in 000’s) | $ 369 | | $ 413 | | $ 472 |
| ^ | Inception date. |
| †† | Annualized. |
| (a) | Per share data based on average shares outstanding during the period. |
| (b) | Total investment return is calculated exclusive of sales charges and assumes the reinvestment of dividends and distributions. For periods of less than one year, total return is not annualized. |
| (c) | In addition to the fees and expenses which the Fund bears directly, it also indirectly bears a pro-rata share of the fees and expenses of the underlying funds in which it invests. Such indirect expenses are not included in the above expense ratios. |
The notes to the financial statements are an integral part of, and should be read in conjunction with, the financial statements.
33
Financial Highlights selected per share data and ratios
| | Year Ended April 30, | | June 30, 2020^ through
April 30, |
| Class I | 2023 | | 2022 | | 2021 |
| Net asset value at beginning of year | $ 10.20 | | $ 11.13 | | $ 10.00 |
| Net investment income (loss) (a) | 0.28 | | 0.21 | | 0.15 |
| Net realized and unrealized gain (loss) | (0.16) | | (0.85) | | 1.10 |
| Total from investment operations | 0.12 | | (0.64) | | 1.25 |
| Less distributions: | | | | | |
| From net investment income | (0.27) | | (0.22) | | (0.11) |
| From net realized gain on investments | (0.04) | | (0.07) | | (0.01) |
| Total distributions | (0.31) | | (0.29) | | (0.12) |
| Net asset value at end of year | $ 10.01 | | $ 10.20 | | $ 11.13 |
| Total investment return (b) | 1.32% | | (5.86)% | | 12.47% |
| Ratios (to average net assets)/Supplemental Data: | | | | | |
| Net investment income (loss) | 2.81% | | 1.89% | | 1.71%†† |
| Net expenses (c) | 0.55% | | 0.55% | | 0.55%†† |
| Expenses (before waiver/reimbursement) (c) | 0.71% | | 0.66% | | 1.24%†† |
| Portfolio turnover rate | 65% | | 62% | | 56% |
| Net assets at end of year (in 000’s) | $ 34 | | $ 33 | | $ 61 |
| ^ | Inception date. |
| †† | Annualized. |
| (a) | Per share data based on average shares outstanding during the period. |
| (b) | Total investment return is calculated exclusive of sales charges and assumes the reinvestment of dividends and distributions. Class I shares are not subject to sales charges. For periods of less than one year, total return is not annualized. |
| (c) | In addition to the fees and expenses which the Fund bears directly, it also indirectly bears a pro-rata share of the fees and expenses of the underlying funds in which it invests. Such indirect expenses are not included in the above expense ratios. |
The notes to the financial statements are an integral part of, and should be read in conjunction with, the financial statements.
| 34 | MainStay Conservative ETF Allocation Fund |
Financial Highlights selected per share data and ratios
| | Year Ended April 30, | | June 30, 2020^ through
April 30, |
| Class R3 | 2023 | | 2022 | | 2021 |
| Net asset value at beginning of year | $ 10.21 | | $ 11.12 | | $ 10.00 |
| Net investment income (loss) (a) | 0.21 | | 0.14 | | 0.07 |
| Net realized and unrealized gain (loss) | (0.16) | | (0.84) | | 1.12 |
| Total from investment operations | 0.05 | | (0.70) | | 1.19 |
| Less distributions: | | | | | |
| From net investment income | (0.21) | | (0.14) | | (0.06) |
| From net realized gain on investments | (0.04) | | (0.07) | | (0.01) |
| Total distributions | (0.25) | | (0.21) | | (0.07) |
| Net asset value at end of year | $ 10.01 | | $ 10.21 | | $ 11.12 |
| Total investment return (b) | 0.60% | | (6.42)% | | 11.96% |
| Ratios (to average net assets)/Supplemental Data: | | | | | |
| Net investment income (loss) | 2.13% | | 1.29% | | 0.79%†† |
| Net expenses (c) | 1.15% | | 1.15% | | 1.15%†† |
| Expenses (before waiver/reimbursement) (c) | 1.31% | | 1.26% | | 1.84%†† |
| Portfolio turnover rate | 65% | | 62% | | 56% |
| Net assets at end of year (in 000’s) | $ 433 | | $ 90 | | $ 68 |
| ^ | Inception date. |
| †† | Annualized. |
| (a) | Per share data based on average shares outstanding during the period. |
| (b) | Total investment return is calculated exclusive of sales charges and assumes the reinvestment of dividends and distributions. Class R3 shares are not subject to sales charges. For periods of less than one year, total return is not annualized. |
| (c) | In addition to the fees and expenses which the Fund bears directly, it also indirectly bears a pro-rata share of the fees and expenses of the underlying funds in which it invests. Such indirect expenses are not included in the above expense ratios. |
The notes to the financial statements are an integral part of, and should be read in conjunction with, the financial statements.
35
Financial Highlights selected per share data and ratios
| | Year Ended April 30, | | August 31, 2020^ through
April 30, |
| SIMPLE Class | 2023 | | 2022 | | 2021 |
| Net asset value at beginning of year | $ 10.21 | | $ 11.12 | | $ 10.46 |
| Net investment income (loss) (a) | 0.22 | | 0.14 | | 0.08 |
| Net realized and unrealized gain (loss) | (0.15) | | (0.82) | | 0.66 |
| Total from investment operations | 0.07 | | (0.68) | | 0.74 |
| Less distributions: | | | | | |
| From net investment income | (0.23) | | (0.16) | | (0.07) |
| From net realized gain on investments | (0.04) | | (0.07) | | (0.01) |
| Total distributions | (0.27) | | (0.23) | | (0.08) |
| Net asset value at end of year | $ 10.01 | | $ 10.21 | | $ 11.12 |
| Total investment return (b) | 0.72% | | (6.29)% | | 7.13% |
| Ratios (to average net assets)/Supplemental Data: | | | | | |
| Net investment income (loss) | 2.27% | | 1.30% | | 0.92%†† |
| Net expenses (c) | 1.05% | | 1.05% | | 1.05%†† |
| Expenses (before waiver/reimbursement) (c) | 1.27% | | 1.23% | | 1.74%†† |
| Portfolio turnover rate | 65% | | 62% | | 56% |
| Net assets at end of year (in 000’s) | $ 2,367 | | $ 1,077 | | $ 195 |
| ^ | Inception date. |
| †† | Annualized. |
| (a) | Per share data based on average shares outstanding during the period. |
| (b) | Total investment return is calculated exclusive of sales charges and assumes the reinvestment of dividends and distributions. SIMPLE Class shares are not subject to sales charges. For periods of less than one year, total return is not annualized. |
| (c) | In addition to the fees and expenses which the Fund bears directly, it also indirectly bears a pro-rata share of the fees and expenses of the underlying funds in which it invests. Such indirect expenses are not included in the above expense ratios. |
The notes to the financial statements are an integral part of, and should be read in conjunction with, the financial statements.
| 36 | MainStay Conservative ETF Allocation Fund |
MainStay Moderate ETF Allocation Fund
Investment and Performance Comparison (Unaudited)
Performance data quoted represents past performance. Past performance is no guarantee of future results. Because of market volatility and other factors, current performance may be lower or higher than the figures shown. Investment return and principal value will fluctuate, and as a result, when shares are redeemed, they may be worth more or less than their original cost. The graph below depicts the historical performance of Class I shares of the Fund. Performance will vary from class to class based on differences in class-specific expenses and sales charges. For performance information current to the most recent month-end, please call 800-624-6782 or visit newyorklifeinvestments.com.
The performance table and graph do not reflect the deduction of taxes that a shareholder would pay on distributions or Fund share redemptions. Total returns reflect maximum applicable sales charges as indicated in the table below, if any, changes in share price, and reinvestment of dividend and capital gain distributions. The graph assumes the initial investment amount shown below and reflects the deduction of all sales charges that would have applied for the period of investment. Performance figures may reflect certain fee waivers and/or expense limitations, without which total returns may have been lower. For more information on share classes and current fee waivers and/or expense limitations (if any), please refer to the Notes to Financial Statements.

| Average Annual Total Returns for the Year-Ended April 30, 2023 |
| Class | Sales Charge | | Inception
Date | One
Year | Since
Inception | Gross
Expense
Ratio1 |
| Class A Shares | Maximum 3.00% Initial Sales Charge | With sales charges | 6/30/2020 | -1.74% | 3.70% | 0.81% |
| | | Excluding sales charges | | 1.30 | 4.82 | 0.81 |
| Class C Shares | Maximum 1.00% CDSC | With sales charges | 6/30/2020 | -0.52 | 3.98 | 1.66 |
| | if redeemed Within One Year of Purchase | Excluding sales charges | | 0.48 | 3.98 | 1.66 |
| Class I Shares | No Sales Charge | | 6/30/2020 | 1.56 | 5.12 | 0.56 |
| Class R3 Shares | No Sales Charge | | 6/30/2020 | 0.94 | 4.48 | 1.16 |
| SIMPLE Class Shares | No Sales Charge | | 8/31/2020 | 0.97 | 2.28 | 1.16 |
| 1. | The gross expense ratios presented reflect the Fund’s “Total Annual Fund Operating Expenses” from the most recent Prospectus, as supplemented, and may differ from other expense ratios disclosed in this report. |
The footnotes on the next page are an integral part of the table and graph and should be carefully read in conjunction with them.
| Benchmark Performance* | One
Year | Since
Inception |
| S&P 500® Index1 | 2.66% | 12.77% |
| MSCI EAFE® Index (Net)2 | 8.42 | 9.43 |
| Bloomberg U.S. Aggregate Bond Index3 | -0.43 | -3.70 |
| Moderate Allocation Composite Index4 | 2.58 | 5.72 |
| Morningstar Moderate Allocation Category Average5 | -0.20 | 6.24 |
| * | Returns for indices reflect no deductions for fees, expenses or taxes, except for foreign withholding taxes where applicable. Results assume reinvestment of all dividends and capital gains. An investment cannot be made directly in an index. |
| 1. | The S&P 500® Index is the Fund’s primary broad-based securities market index for comparison purposes. S&P 500® is a trademark of The McGraw-Hill Companies, Inc. The S&P 500® Index is widely regarded as the standard index for measuring large-cap U.S. stock market performance. |
| 2. | The MSCI EAFE® Index (Net) is the Fund's secondary benchmark. The MSCI EAFE® Index (Net) consists of international stocks representing the developed world outside of North America. |
| 3. | The Fund has selected the Bloomberg U.S. Aggregate Bond Index as an additional benchmark. The Bloomberg U.S. Aggregate Bond Index is a broad-based benchmark that measures the performance of the investment grade, U.S. dollar-denominated, fixed-rate taxable bond market, including Treasuries, government-related and corporate securities, mortgage-backed securities (agency fixed-rate and hybrid adjustable rate mortgage pass-throughs), asset-backed securities, and commercial mortgage-backed securities. |
| 4. | The Fund has selected the Moderate Allocation Composite Index as an additional benchmark. The Moderate Allocation Composite Index consists of the S&P 500® Index, the MSCI EAFE® Index (Net) and the Bloomberg U.S. Aggregate Bond Index weighted 45%, 15% and 40%, respectively. |
| 5. | The Morningstar Moderate Allocation Category Average is representative of funds in allocation categories that seek to provide both income and capital appreciation by primarily investing in multiple asset classes, including stocks, bonds, and cash. These moderate strategies seek to balance preservation of capital with appreciation. They typically expect volatility similar to a strategic equity exposure between 50% and 70%. Results are based on average total returns of similar funds with all dividends and capital gain distributions reinvested. |
The footnotes on the preceding page are an integral part of the table and graph and should be carefully read in conjunction with them.
| 38 | MainStay Moderate ETF Allocation Fund |
Cost in Dollars of a $1,000 Investment in MainStay Moderate ETF Allocation Fund (Unaudited)
The example below is intended to describe the fees and expenses borne by shareholders during the six-month period from November 1, 2022 to April 30, 2023, and the impact of those costs on your investment.
Example
As a shareholder of the Fund you incur two types of costs: (1) transaction costs, including exchange fees and sales charges (loads) on purchases (as applicable), and (2) ongoing costs, including management fees, distribution and/or service (12b-1) fees and other Fund expenses (as applicable). This example is intended to help you understand your ongoing costs (in dollars) of investing in the Fund and to compare these costs with the ongoing costs of investing in other mutual funds. The example is based on an investment of $1,000 made at the beginning of the six-month period and held for the entire period from November 1, 2022 to April 30, 2023.
This example illustrates your Fund’s ongoing costs in two ways:
Actual Expenses
The second and third data columns in the table below provide information about actual account values and actual expenses. You may use the information in these columns, together with the amount you invested, to estimate the expenses that you paid during the six months ended April 30, 2023. Simply divide your account value by $1,000 (for example, an
$8,600 account value divided by $1,000 = 8.6), then multiply the result by the number under the heading entitled “Expenses Paid During Period” to estimate the expenses you paid on your account during this period.
Hypothetical Example for Comparison Purposes
The fourth and fifth data columns in the table below provide information about hypothetical account values and hypothetical expenses based on the Fund’s actual expense ratio and an assumed rate of return of 5% per year before expenses, which is not the Fund’s actual return. The hypothetical account values and expenses may not be used to estimate the actual ending account balances or expenses you paid for the six-month period shown. You may use this information to compare the ongoing costs of investing in the Fund with the ongoing costs of investing in other mutual funds. To do so, compare this 5% hypothetical example with the 5% hypothetical examples that appear in the shareholder reports of the other mutual funds.
Please note that the expenses shown in the table are meant to highlight your ongoing costs only and do not reflect any transactional costs, such as exchange fees or sales charges (loads). Therefore, the fourth and fifth data columns of the table are useful in comparing ongoing costs only and will not help you determine the relative total costs of owning different funds. In addition, if these transactional costs were included, your costs would have been higher.
| Share Class | Beginning
Account
Value
11/1/22 | Ending Account
Value (Based
on Actual
Returns and
Expenses)
4/30/23 | Expenses
Paid
During
Period1 | Ending Account
Value (Based
on Hypothetical
5% Annualized
Return and
Actual Expenses)
4/30/23 | Expenses
Paid
During
Period1 | Net Expense
Ratio
During
Period2 |
| Class A Shares | $1,000.00 | $1,072.10 | $3.65 | $1,021.27 | $3.56 | 0.71% |
| Class C Shares | $1,000.00 | $1,067.90 | $7.84 | $1,017.21 | $7.65 | 1.53% |
| Class I Shares | $1,000.00 | $1,073.80 | $2.37 | $1,022.51 | $2.31 | 0.46% |
| Class R3 Shares | $1,000.00 | $1,070.50 | $5.44 | $1,019.54 | $5.31 | 1.06% |
| SIMPLE Class Shares | $1,000.00 | $1,070.90 | $5.34 | $1,019.64 | $5.21 | 1.04% |
| 1. | Expenses are equal to the Fund’s annualized expense ratio of each class multiplied by the average account value over the period, divided by 365 and multiplied by 181 (to reflect the six-month period). The table above represents the actual expenses incurred during the six-month period. In addition to the fees and expenses which the Fund bears directly, it also indirectly bears a pro rata share of the fees and expenses of the underlying funds in which it invests. Such indirect expenses are not included in the above-reported expense figures. |
| 2. | Expenses are equal to the Fund's annualized expense ratio to reflect the six-month period. |
Asset Diversification as of April 30, 2023 (Unaudited)
| Equity Funds | 57.9 % |
| Fixed Income Funds | 32.8 |
| Short-Term Investments | 19.9 |
| Other Assets, Less Liabilities | (10.6) |
See Portfolio of Investments beginning on page 44 for specific holdings within these categories. The Fund’s holdings are subject to change.
| 40 | MainStay Moderate ETF Allocation Fund |
Portfolio Management Discussion and Analysis (Unaudited)
Questions answered by portfolio managers Jae S. Yoon, CFA, Jonathan Swaney, Poul Kristensen, CFA, and Amit Soni, CFA, of New York Life Investment Management LLC, the Fund’s Manager.
How did MainStay Moderate ETF Allocation Fund perform relative to its benchmarks and peer group during the 12 months ended April 30, 2023?
For the 12 months ended April 30, 2023, Class I shares of MainStay Moderate ETF Allocation Fund returned 1.56%, underperforming the 2.66% return of the Fund’s primary benchmark, the S&P 500® Index (the “Index”), and the 8.42% return of the MSCI EAFE® Index (Net), which is the Fund’s secondary benchmark. Over the same period, Class I shares of the Fund outperformed the −0.43% return of the Bloomberg U.S. Aggregate Bond Index, and underperformed the 2.58% return of the Moderate Allocation Composite Index, both of which are additional benchmarks of the Fund. For the 12 months ended April 30, 2023, Class I shares of the Fund outperformed the −0.20% return of the Morningstar Moderate Allocation Category Average.1
What factors affected the Fund’s relative performance during the reporting period?
The Fund is a “fund of funds" that seeks to achieve its investment objective by investing in unaffiliated, passively-managed, exchange-traded funds (“Underlying ETFs”). The Underlying ETFs may invest in U.S. equities, international equities and fixed-income instruments, making comparisons to any single index generally less suitable than a weighted combination of indices, which is a more useful yardstick by which to measure performance. During the reporting period, asset class policy was the primary determinant of the Fund’s relative performance.
Fund management internally maintains a blend of indices that are taken into consideration when managing the Fund. During the reporting period, the Fund modestly underperformed the internally maintained blend of indices, primarily due to asset class policy decisions. Management of the Fund’s stock/bond blend itself was not the issue, as positive returns were generated in the process of controlling the blend. The allocation was held near neutral for much of the reporting period, although capital was added to equities during periods of pricing softness and removed again as the market recovered. This tactical “buy the dip, sell the rally” practice boosted returns at the margin.
Rather, the issue was within asset classes. A persistent bias toward small-cap names, expressed through exposure to the S&P SmallCap 600™ Index,2 detracted materially from relative performance. While relative valuations for small-cap stocks were much more attractive than the historical norm, smaller companies are significantly more sensitive to changes in bank financing conditions than larger companies that can issue bonds.
Fast-rising costs on bank loans, coupled with concerns about future credit availability in the wake of the bank crisis that emerged in March and April 2023, weighed heavily on the small end of the capitalization spectrum. In contrast, mega-cap technology and technology-related companies—including Microsoft, Apple, Tesla, Meta Platforms and Amazon.com—performed well.
Significantly underweight exposure to non-U.S. developed markets also detracted materially from relative performance. In our estimation, Europe was particularly vulnerable to disruption, owing largely to the Russian invasion of Ukraine and the accompanying strain on energy supplies. An unusually mild winter, however, granted a reprieve, and these markets ultimately performed quite well.
Exposure to gold miners further detracted from relative performance. The price of bullion rose over the course of the reporting period, but companies that extract gold fared less well, possibly due to rising extraction costs (particularly labor) and currency effects.
On the upside, maintaining a large cash position within the fixed-income portion of the Fund made a substantial positive contribution to performance, as bond yields climbed. (Contributions take weightings and total returns into account.) Similarly, skewing high yield bond holdings to favor shorter-duration3 instruments boosted returns at the margin.
Even within equities, the news was not universally negative. Exposure to energy stocks, for example, proved helpful as gains in the first half of the reporting period more than offset the underperformance experienced during the second half. We believe energy remains a compelling strategic opportunity, particularly among producers and firms that provide extraction services.
How did you allocate the Fund’s assets during the reporting period and why?
Stock/bond blend: Equity exposure within the Fund was held relatively close to neutral during the reporting period, with the exception of a modest bias favoring stocks that we implemented tactically in response to swings in pricing (adding on drawdowns and trimming on rallies). We are generally reluctant to position the Fund with underweight equity exposure, since stocks tend to perform well over time and anticipating drawdowns is challenging. The opposite is less true. We are happy to lean into equities when we believe they are well-supported fundamentally or when a correction has run further than we believe appropriate. This strategy worked well during the reporting period, producing a
| 1. | See "Investment and Performance Comparison" for other share class returns, which may be higher or lower than Class I share returns, and for more information on benchmark and peer group returns. |
| 2. | The S&P SmallCap 600™ Index covers roughly the small-cap range of American stocks, using a capitalization-weighted index. Capitalization range is from $850 million to $3.7 billion. |
| 3. | Duration is a measure of the price sensitivity of a fixed-income investment to changes in interest rates. Duration is expressed as a number of years and is considered a more accurate sensitivity gauge than average maturity. |
modestly positive contribution to performance. The policy stance shifted slightly in 2023, however, when the Fund adopted a small underweight position in equities following a sharp rally in January. We increased this underweight posture later in the reporting period as turmoil among banks increased the likelihood of a near-term recession.
Duration: Believing inflationary pressures to be at least partially structural in nature and likely to persist at elevated levels for the foreseeable future, we skewed the Fund’s fixed-income holdings to favor shorter-maturity instruments less sensitive to rising bond yields, although duration was added as yields rose. Over the latter half of the reporting period, duration was slightly shorter than that of the Bloomberg U.S. Aggregate Bond Index.
Equity style: In the same way that inflation threatens long-duration bonds, equities with values disproportionately reflected in more distant cash flows (i.e., growth stocks with high prices relative to current earnings) are likewise vulnerable. Accordingly, the Fund remained tilted to emphasize value stocks that offered more attractive near-term cash flows, placing particular focus on traditionally defensive sectors: real estate, utilities, consumer staples and (most of all) health care. While this positioning made a modest, positive contribution to the Fund’s return during the first half of the reporting period, the opposite was true during the second half; market performance was dominated by a handful of large, high-growth companies, including NVDIA, Tesla, Apple and others.
Equity size: Small-company stocks were more heavily represented in the Fund than in the Index. The thesis behind this positioning was based on attractive small-cap valuations, insulation from economic weakness abroad, less sensitivity to dollar strength and disproportionate exposure to domestic demand, which remained robust. This stance was helpful for much of the reporting period, but reversed abruptly in the spring of 2023 as small companies, which tend to be heavily dependent on bank financing, proved vulnerable to the aggressive, tightening lending standards implemented during the bank crisis mentioned above.
Geographic exposure: Following Russia’s invasion of Ukraine and the energy crisis that ensued, the Fund maintained underweight exposure to developed international markets. However, non-U.S. developed markets fared well during the reporting period, benefiting from both an unusually mild winter that reduced the strain on energy reserves, and the reopening of China following the end of the country’s zero-COVID-19 restrictions.
Energy: The Fund maintained exposure to upstream energy producers and oilfield/gas field service providers as a commodity play to provide an additional inflation hedge. These holdings also positioned the Fund to take advantage of opportunities for
domestic producers to benefit as Western nations revisit energy policy to source supplies from stable and friendly jurisdictions rather than autocratic petrostates that present national security risks. While the Fund’s position was small, it had a disproportionately positive impact on performance as oil and gas prices soared during the first half of the reporting period, although some of those gains were later reversed.
How did the Fund’s allocations change over the course of the reporting period?
The Fund’s cash position saw the largest allocation increase, as we trimmed both equity and fixed income positions. Allocations to full-duration investment-grade bonds also increased through additional exposure to iShares® Core U.S. Aggregate Bond ETF, Schwab U.S. Aggregate Bond ETF and iShares® Broad USD Investment Grade Corporate Bond ETF. The Fund also added several new holdings. The Fund established a stake in iShares® Core S&P® Mid-Cap ETF, reflecting our favorable view of the mid-cap asset class’s attractive relative valuations and reduced sensitivity to bank lending conditions compared to the small cap universe; the position also offset a reduction in the Fund’s position in Schwab U.S. Mid-Cap ETF. The Fund took a position in The Materials Select Sector SPDR® Fund as a hedge against stubborn inflation, protection against a potentially weakening dollar and as a way to benefit from supply-chain reengineering and the desire of manufacturers to source raw materials from more friendly, reliable geographies. The Fund also initiated a position in iShares® MSCI Japan ETF, since we viewed Japanese equity valuations as attractive, export conditions as favorable and we believe the Japanese yen is likely to appreciate should the country’s central bank further relax, or even abandon, its existing yield curve4 control policy. These positions were funded in large part from Vanguard Mega Cap ETF.
A reduced position in iShares® Core MSCI EAFE ETF reflected the Fund’s shift away from non- U.S. developed equity markets. We trimmed holdings of Schwab U.S. Small-Cap ETF in response to the ongoing bank crisis. Sales of iShares® 0–5 Year High Yield Corp Bond ETF and Invesco Senior Loan ETF were prompted by our strategy of shifting Fund assets away from lower-credit-quality fixed-income instruments in preparation for a potentially fast-approaching recession.
During the reporting period, which Underlying Equity ETFs had the highest total returns and which Underlying Equity ETFs had the lowest total returns?
The Fund’s top-performing Underlying Equity ETFs that were held for the entire reporting period included iShares® Core MSCI EAFE ETF, VanEck Oil Services ETF and Health Care Select SPDR® Fund. The lowest total returns were seen in iShares® Core MSCI
| 4. | The yield curve is a line that plots the yields of various securities of similar quality—typically U.S. Treasury issues—across a range of maturities. The U.S. Treasury yield curve serves as a benchmark for other debt and is used in economic forecasting. |
| 42 | MainStay Moderate ETF Allocation Fund |
Emerging Markets ETF, iShares® Core S&P® Small-Cap ETF and Schwab U.S. Small-Cap ETF.
Which Underlying Equity ETFs were the strongest positive contributors to the Fund’s performance and which Underlying Equity ETFs were particularly weak?
Contribution to return is a function not only of Underlying ETF performance and average allocation, but also the variation in that allocation across time. The Underlying Equity ETFs making the largest positive contributions to return included Vanguard Mega Cap ETF, iShares® Core MSCI EAFE ETF and VanEck Oil Services ETF. The most significant detractors were iShares® Core MSCI Emerging Markets ETF, VanEck Gold Miners ETF and iShares® Core S&P® Small Cap ETF.
During the reporting period, which Underlying Fixed-Income ETFs had the highest total returns and which Underlying Fixed-Income ETFs had the lowest total returns?
The Underlying Fixed-Income ETFs posting the highest total returns included iShares® 0–5 Year High Yield Corporate Bond ETF, Invesco Senior Loan ETF and iShares® Broad USD High Yield Corporate Bond ETF. The only two Underlying Fixed-Income ETFs to experience losses were iShares® Core U.S. Aggregate Bond ETF and Schwab U.S. Aggregate Bond ETF.
Which Underlying Fixed-Income ETFs were the strongest positive contributors to the Fund’s performance and which Underlying Fixed-Income ETFs were particularly weak?
The Underlying Fixed-Income ETFs making the largest contributions to return were Invesco Senior Loan ETF, iShares® 0–5 Year High Yield Corporate Bond ETF and iShares® Broad USD Investment Grade Corporate Bond ETF. The only Underlying Fixed-Income ETFs to detract from absolute performance was iShares® 20+ Year Treasury Bond ETF, which was used for duration management. The smallest positive contributions came from Vanguard Short-Term Bond ETF and Schwab U.S. Aggregate Bond ETF.
How was the Fund positioned at the end of the reporting period?
As of April 30, 2023, we believe a near-term recession looks highly probable. Our opinion is based on a wide range of
variables, including, but not limited to, the shape of the yield curve, trends in business surveys, a decline in money supply, tightening credit conditions and the steady drawdown of savings accumulated during the pandemic. We expect corporate profits to decline over the next several quarters, eventually driving stock prices lower while pushing credit spreads out. Accordingly, we continue to position the Fund defensively.
The Fund’s defensive posture begins at the top of the portfolio, with a modest tilt away from equities. We generally avoid underweight equity allocations, as they usually stand on the wrong side of history—stocks rise more often than not. However, we firmly believe that current valuations are rich given the daunting array of risks the economy and the markets face, including an historically extreme rise in rates, the looming debt ceiling, the unresolved bank crisis and geopolitical uncertainty, to name a few. We maintain that caution is the better part of valor under these circumstances.
Defensive positioning is clearly visible within asset classes as well. On the equity side, the Fund favors sectors—such as consumer staples, utilities and healthcare—that have generally exhibited lower volatility and retained their value better during drawdowns. Additionally, the Fund’s bias toward historically higher-beta, small-cap stocks, in place for the past several quarters, has been effectively removed. Within fixed income, the Fund now has a below-Index-weight position in bank loans, and holdings of high yield bonds are skewed to favor lower-duration instruments, which tend to exhibit less volatility and smaller losses than longer maturity bonds.
Energy stocks tend to be more cyclical. The Fund’s overweight allocation to the sector may seem inconsistent with the otherwise cautious posture of the portfolio, although relative valuation is attractive, and we believe supply/demand dynamics will prove supportive of pricing over time for both the underlying commodities and the stock prices of companies involved in the production, processing and distribution of these resources.
None of Schwab Strategic Trust, Schwab® U.S. Aggregate Bond ETF, Schwab U.S. Mid-Cap ETF, Schwab U.S. Small Cap ETF or Charles Schwab Investment Management, Inc. make any representations regarding the advisability of investing in MainStay Moderate ETF Allocation Fund.
iShares® is a registered trademark of BlackRock (BlackRock, Inc. and its subsidiaries). Neither BlackRock nor the iShares® Funds make any representations regarding the advisability of investing in MainStay Moderate ETF Allocation Fund.
The opinions expressed are those of the portfolio managers as of the date of this report and are subject to change. There is no guarantee that any forecasts will come to pass. This material does not constitute investment advice and is not intended as an endorsement of any specific investment.
Portfolio of Investments April 30, 2023†^
| | Shares | Value |
| Investment Companies 90.7% |
| Equity Funds 57.9% |
| Health Care Select Sector SPDR Fund (a) | 7,760 | $ 1,036,193 |
| Invesco S&P 500 Low Volatility ETF | 16,277 | 1,040,751 |
| iShares Core MSCI EAFE ETF | 153,109 | 10,529,306 |
| iShares Core MSCI Emerging Markets ETF | 21,412 | 1,040,195 |
| iShares Core S&P Mid-Cap ETF | 14,024 | 3,480,757 |
| iShares Core S&P Small-Cap ETF | 55,166 | 5,185,604 |
| iShares MSCI Japan ETF | 17,820 | 1,048,529 |
| Materials Select Sector SPDR Fund | 12,914 | 1,040,223 |
| Schwab U.S. Mid-Cap ETF | 27,070 | 1,824,789 |
| Schwab U.S. Small-Cap ETF | 50,228 | 2,068,389 |
| SPDR S&P Oil & Gas Exploration & Production ETF (a) | 8,212 | 1,043,827 |
| VanEck Oil Services ETF (a) | 1,866 | 511,526 |
| Vanguard Mega Cap ETF | 145,424 | 21,207,182 |
| Vanguard Mega Cap Value ETF | 25,412 | 2,615,403 |
| Vanguard Mid-Cap ETF | 34,505 | 7,221,551 |
Total Equity Funds
(Cost $56,263,608) | | 60,894,225 |
| Fixed Income Funds 32.8% |
| Invesco Senior Loan ETF (a) | 199,574 | 4,167,105 |
| iShares 0-5 Year High Yield Corporate Bond ETF (a) | 63,363 | 2,632,733 |
| iShares Broad USD High Yield Corporate Bond ETF (a) | 74,443 | 2,638,260 |
| iShares Broad USD Investment Grade Corporate Bond ETF (a) | 94,713 | 4,819,945 |
| iShares Core U.S. Aggregate Bond ETF | 96,171 | 9,613,253 |
| Schwab U.S. Aggregate Bond ETF | 204,400 | 9,619,064 |
| Vanguard Short-Term Bond ETF | 13,691 | 1,049,278 |
Total Fixed Income Funds
(Cost $36,453,447) | | 34,539,638 |
Total Investment Companies
(Cost $92,717,055) | | 95,433,863 |
| Short-Term Investments 19.9% |
| Affiliated Investment Company 9.3% |
| MainStay U.S. Government Liquidity Fund, 3.98% (b) | 9,770,512 | 9,770,512 |
| Unaffiliated Investment Companies 10.6% |
| Goldman Sachs Financial Square Government Fund, 4.865% (b)(c) | 5,000,000 | 5,000,000 |
The notes to the financial statements are an integral part of, and should be read in conjunction with, the financial statements.
| 44 | MainStay Moderate ETF Allocation Fund |
| | Shares | | Value |
| Short-Term Investments (continued) |
| Unaffiliated Investment Companies (continued) |
| Invesco Government & Agency Portfolio, 4.857% (b)(c) | 6,243,074 | | $ 6,243,074 |
Total Unaffiliated Investment Companies
(Cost $11,243,074) | | | 11,243,074 |
Total Short-Term Investments
(Cost $21,013,586) | | | 21,013,586 |
Total Investments
(Cost $113,730,641) | 110.6% | | 116,447,449 |
| Other Assets, Less Liabilities | (10.6) | | (11,195,905) |
| Net Assets | 100.0% | | $ 105,251,544 |
| † | Percentages indicated are based on Fund net assets. |
| ^ | Industry classifications may be different than those used for compliance monitoring purposes. |
| (a) | All or a portion of this security was held on loan. As of April 30, 2023, the aggregate market value of securities on loan was $11,034,450. The Fund received cash collateral with a value of $11,243,074. (See Note 2(G)) |
| (b) | Current yield as of April 30, 2023. |
| (c) | Represents a security purchased with cash collateral received for securities on loan. |
Investments in Affiliates (in 000's)
Investments in issuers considered to be affiliate(s) of the Fund during the year ended April 30, 2023 for purposes of Section 2(a)(3) of the Investment Company Act of 1940, as amended, were as follows:
| Affiliated Investment Companies | Value,
Beginning
of Year | Purchases
at Cost | Proceeds
from
Sales | Net
Realized
Gain/(Loss)
on Sales | Change in
Unrealized
Appreciation/
(Depreciation) | Value,
End of
Year | Dividend
Income | Other
Distributions | Shares
End of
Year |
| MainStay U.S. Government Liquidity Fund | $ 2,260 | $ 33,773 | $ (26,262) | $ — | $ — | $ 9,771 | $ 170 | $ — | 9,771 |
| Abbreviation(s): |
| EAFE—Europe, Australasia and Far East |
| ETF—Exchange-Traded Fund |
| MSCI—Morgan Stanley Capital International |
| SPDR—Standard & Poor’s Depositary Receipt |
| USD—United States Dollar |
The notes to the financial statements are an integral part of, and should be read in conjunction with, the financial statements.
45
Portfolio of Investments April 30, 2023†^ (continued)
The following is a summary of the fair valuations according to the inputs used as of April 30, 2023, for valuing the Fund’s assets:
| Description | Quoted
Prices in
Active
Markets for
Identical
Assets
(Level 1) | | Significant
Other
Observable
Inputs
(Level 2) | | Significant
Unobservable
Inputs
(Level 3) | | Total |
| Asset Valuation Inputs | | | | | | | |
| Investments in Securities (a) | | | | | | | |
| Investment Companies | | | | | | | |
| Equity Funds | $ 60,894,225 | | $ — | | $ — | | $ 60,894,225 |
| Fixed Income Funds | 34,539,638 | | — | | — | | 34,539,638 |
| Total Investment Companies | 95,433,863 | | — | | — | | 95,433,863 |
| Short-Term Investments | | | | | | | |
| Affiliated Investment Company | 9,770,512 | | — | | — | | 9,770,512 |
| Unaffiliated Investment Companies | 11,243,074 | | — | | — | | 11,243,074 |
| Total Short-Term Investments | 21,013,586 | | — | | — | | 21,013,586 |
| Total Investments in Securities | $ 116,447,449 | | $ — | | $ — | | $ 116,447,449 |
| (a) | For a complete listing of investments, see the Portfolio of Investments. |
The notes to the financial statements are an integral part of, and should be read in conjunction with, the financial statements.
| 46 | MainStay Moderate ETF Allocation Fund |
Statement of Assets and Liabilities as of April 30, 2023
| Assets |
Investment in unaffiliated securities, at value
(identified cost $103,960,129) including securities on loan of $11,034,450 | $106,676,937 |
Investment in affiliated investment companies, at value
(identified cost $9,770,512) | 9,770,512 |
| Receivables: | |
| Fund shares sold | 165,058 |
| Dividends | 29,858 |
| Securities lending | 15,415 |
| Other assets | 18,649 |
| Total assets | 116,676,429 |
| Liabilities |
| Cash collateral received for securities on loan | 11,243,074 |
| Payables: | |
| Fund shares redeemed | 73,614 |
| Investment securities purchased | 40,915 |
| NYLIFE Distributors (See Note 3) | 23,489 |
| Transfer agent (See Note 3) | 17,401 |
| Manager (See Note 3) | 17,055 |
| Custodian | 5,854 |
| Shareholder communication | 2,765 |
| Professional fees | 718 |
| Total liabilities | 11,424,885 |
| Net assets | $105,251,544 |
| Composition of Net Assets |
| Shares of beneficial interest outstanding (par value of $.001 per share) unlimited number of shares authorized | $ 9,573 |
| Additional paid-in-capital | 107,967,669 |
| | 107,977,242 |
| Total distributable earnings (loss) | (2,725,698) |
| Net assets | $105,251,544 |
| Class A | |
| Net assets applicable to outstanding shares | $95,456,355 |
| Shares of beneficial interest outstanding | 8,679,911 |
| Net asset value per share outstanding | $ 11.00 |
| Maximum sales charge (3.00% of offering price) | 0.34 |
| Maximum offering price per share outstanding | $ 11.34 |
| Class C | |
| Net assets applicable to outstanding shares | $ 340,862 |
| Shares of beneficial interest outstanding | 31,126 |
| Net asset value and offering price per share outstanding | $ 10.95 |
| Class I | |
| Net assets applicable to outstanding shares | $ 73,843 |
| Shares of beneficial interest outstanding | 6,709 |
| Net asset value and offering price per share outstanding | $ 11.01 |
| Class R3 | |
| Net assets applicable to outstanding shares | $ 1,240,325 |
| Shares of beneficial interest outstanding | 112,962 |
| Net asset value and offering price per share outstanding | $ 10.98 |
| SIMPLE Class | |
| Net assets applicable to outstanding shares | $ 8,140,159 |
| Shares of beneficial interest outstanding | 741,981 |
| Net asset value and offering price per share outstanding | $ 10.97 |
The notes to the financial statements are an integral part of, and should be read in conjunction with, the financial statements.
47
Statement of Operations for the year ended April 30, 2023
| Investment Income (Loss) |
| Income | |
| Dividends-unaffiliated | $ 2,344,184 |
| Securities lending, net | 210,732 |
| Dividends-affiliated | 170,067 |
| Total income | 2,724,983 |
| Expenses | |
| Distribution/Service—Class A (See Note 3) | 219,395 |
| Distribution/Service—Class C (See Note 3) | 3,499 |
| Distribution/Service—Class R3 (See Note 3) | 6,053 |
| Distribution/Service—SIMPLE Class (See Note 3) | 26,081 |
| Manager (See Note 3) | 189,214 |
| Registration | 92,390 |
| Transfer agent (See Note 3) | 82,817 |
| Professional fees | 36,502 |
| Custodian | 19,096 |
| Shareholder communication | 10,119 |
| Trustees | 2,215 |
| Shareholder service (See Note 3) | 1,211 |
| Miscellaneous | 6,405 |
| Total expenses before waiver/reimbursement | 694,997 |
| Reimbursement from prior custodian(a) | (196) |
| Net expenses | 694,801 |
| Net investment income (loss) | 2,030,182 |
| Realized and Unrealized Gain (Loss) |
| Net realized gain (loss) on unaffiliated investments | (5,100,556) |
| Net change in unrealized appreciation (depreciation) on unaffiliated investments | 4,653,294 |
| Net realized and unrealized gain (loss) | (447,262) |
| Net increase (decrease) in net assets resulting from operations | $ 1,582,920 |
| (a) | Represents a refund for overbilling of custody fees. |
The notes to the financial statements are an integral part of, and should be read in conjunction with, the financial statements.
| 48 | MainStay Moderate ETF Allocation Fund |
Statements of Changes in Net Assets
for the years ended April 30, 2023 and April 30, 2022
| | 2023 | 2022 |
| Increase (Decrease) in Net Assets |
| Operations: | | |
| Net investment income (loss) | $ 2,030,182 | $ 1,203,799 |
| Net realized gain (loss) | (5,100,556) | (597,640) |
| Net change in unrealized appreciation (depreciation) | 4,653,294 | (6,742,990) |
| Net increase (decrease) in net assets resulting from operations | 1,582,920 | (6,136,831) |
| Distributions to shareholders: | | |
| Class A | (1,597,645) | (1,190,376) |
| Class C | (3,083) | (3,546) |
| Class I | (1,463) | (1,128) |
| Class R3 | (20,458) | (9,056) |
| SIMPLE Class | (88,538) | (22,031) |
| Total distributions to shareholders | (1,711,187) | (1,226,137) |
| Capital share transactions: | | |
| Net proceeds from sales of shares | 26,632,045 | 54,296,195 |
| Net asset value of shares issued to shareholders in reinvestment of distributions | 1,708,293 | 1,224,058 |
| Cost of shares redeemed | (13,571,395) | (13,327,228) |
| Increase (decrease) in net assets derived from capital share transactions | 14,768,943 | 42,193,025 |
| Net increase (decrease) in net assets | 14,640,676 | 34,830,057 |
| Net Assets |
| Beginning of year | 90,610,868 | 55,780,811 |
| End of year | $105,251,544 | $ 90,610,868 |
The notes to the financial statements are an integral part of, and should be read in conjunction with, the financial statements.
49
Financial Highlights selected per share data and ratios
| | Year Ended April 30, | | June 30, 2020^ through
April 30, |
| Class A | 2023 | | 2022 | | 2021 |
| Net asset value at beginning of year | $ 11.06 | | $ 11.88 | | $ 10.00 |
| Net investment income (loss) (a) | 0.23 | | 0.18 | | 0.10 |
| Net realized and unrealized gain (loss) | (0.10) | | (0.83) | | 1.85 |
| Total from investment operations | 0.13 | | (0.65) | | 1.95 |
| Less distributions: | | | | | |
| From net investment income | (0.17) | | (0.15) | | (0.06) |
| From net realized gain on investments | (0.02) | | (0.02) | | (0.01) |
| Total distributions | (0.19) | | (0.17) | | (0.07) |
| Net asset value at end of year | $ 11.00 | | $ 11.06 | | $ 11.88 |
| Total investment return (b) | 1.30% | | (5.60)% | | 19.50% |
| Ratios (to average net assets)/Supplemental Data: | | | | | |
| Net investment income (loss) | 2.17% | | 1.53% | | 1.02%†† |
| Net expenses (c) | 0.71% | | 0.70% | | 0.80%†† |
| Expenses (before waiver/reimbursement) (c) | 0.71% | | 0.70% | | 1.04%†† |
| Portfolio turnover rate | 63% | | 58% | | 45% |
| Net assets at end of year (in 000’s) | $ 95,456 | | $ 86,128 | | $ 54,345 |
| ^ | Inception date. |
| †† | Annualized. |
| (a) | Per share data based on average shares outstanding during the period. |
| (b) | Total investment return is calculated exclusive of sales charges and assumes the reinvestment of dividends and distributions. For periods of less than one year, total return is not annualized. |
| (c) | In addition to the fees and expenses which the Fund bears directly, it also indirectly bears a pro-rata share of the fees and expenses of the underlying funds in which it invests. Such indirect expenses are not included in the above expense ratios. |
| | Year Ended April 30, | | June 30, 2020^ through
April 30, |
| Class C | 2023 | | 2022 | | 2021 |
| Net asset value at beginning of year | $ 11.00 | | $ 11.83 | | $ 10.00 |
| Net investment income (loss) (a) | 0.15 | | 0.08 | | 0.03 |
| Net realized and unrealized gain (loss) | (0.10) | | (0.83) | | 1.85 |
| Total from investment operations | 0.05 | | (0.75) | | 1.88 |
| Less distributions: | | | | | |
| From net investment income | (0.08) | | (0.06) | | (0.04) |
| From net realized gain on investments | (0.02) | | (0.02) | | (0.01) |
| Total distributions | (0.10) | | (0.08) | | (0.05) |
| Net asset value at end of year | $ 10.95 | | $ 11.00 | | $ 11.83 |
| Total investment return (b) | 0.48% | | (6.44)% | | 18.82% |
| Ratios (to average net assets)/Supplemental Data: | | | | | |
| Net investment income (loss) | 1.37% | | 0.70% | | 0.29%†† |
| Net expenses (c) | 1.53% | | 1.54% | | 1.55%†† |
| Expenses (before waiver/reimbursement) (c) | 1.53% | | 1.54% | | 1.77%†† |
| Portfolio turnover rate | 63% | | 58% | | 45% |
| Net assets at end of year (in 000’s) | $ 341 | | $ 389 | | $ 506 |
| ^ | Inception date. |
| †† | Annualized. |
| (a) | Per share data based on average shares outstanding during the period. |
| (b) | Total investment return is calculated exclusive of sales charges and assumes the reinvestment of dividends and distributions. For periods of less than one year, total return is not annualized. |
| (c) | In addition to the fees and expenses which the Fund bears directly, it also indirectly bears a pro-rata share of the fees and expenses of the underlying funds in which it invests. Such indirect expenses are not included in the above expense ratios. |
The notes to the financial statements are an integral part of, and should be read in conjunction with, the financial statements.
| 50 | MainStay Moderate ETF Allocation Fund |
Financial Highlights selected per share data and ratios
| | Year Ended April 30, | | June 30, 2020^ through
April 30, |
| Class I | 2023 | | 2022 | | 2021 |
| Net asset value at beginning of year | $ 11.07 | | $ 11.87 | | $ 10.00 |
| Net investment income (loss) (a) | 0.27 | | 0.22 | | 0.13 |
| Net realized and unrealized gain (loss) | (0.11) | | (0.83) | | 1.84 |
| Total from investment operations | 0.16 | | (0.61) | | 1.97 |
| Less distributions: | | | | | |
| From net investment income | (0.20) | | (0.17) | | (0.09) |
| From net realized gain on investments | (0.02) | | (0.02) | | (0.01) |
| Total distributions | (0.22) | | (0.19) | | (0.10) |
| Net asset value at end of year | $ 11.01 | | $ 11.07 | | $ 11.87 |
| Total investment return (b) | 1.56% | | (5.31)% | | 19.79% |
| Ratios (to average net assets)/Supplemental Data: | | | | | |
| Net investment income (loss) | 2.52% | | 1.83% | | 1.40%†† |
| Net expenses (c) | 0.46% | | 0.45% | | 0.55%†† |
| Expenses (before waiver/reimbursement) (c) | 0.46% | | 0.45% | | 0.79%†† |
| Portfolio turnover rate | 63% | | 58% | | 45% |
| Net assets at end of year (in 000’s) | $ 74 | | $ 73 | | $ 52 |
| ^ | Inception date. |
| †† | Annualized. |
| (a) | Per share data based on average shares outstanding during the period. |
| (b) | Total investment return is calculated exclusive of sales charges and assumes the reinvestment of dividends and distributions. Class I shares are not subject to sales charges. For periods of less than one year, total return is not annualized. |
| (c) | In addition to the fees and expenses which the Fund bears directly, it also indirectly bears a pro-rata share of the fees and expenses of the underlying funds in which it invests. Such indirect expenses are not included in the above expense ratios. |
The notes to the financial statements are an integral part of, and should be read in conjunction with, the financial statements.
51
Financial Highlights selected per share data and ratios
| | Year Ended April 30, | | June 30, 2020^ through
April 30, |
| Class R3 | 2023 | | 2022 | | 2021 |
| Net asset value at beginning of year | $ 11.04 | | $ 11.86 | | $ 10.00 |
| Net investment income (loss) (a) | 0.20 | | 0.15 | | 0.07 |
| Net realized and unrealized gain (loss) | (0.10) | | (0.84) | | 1.85 |
| Total from investment operations | 0.10 | | (0.69) | | 1.92 |
| Less distributions: | | | | | |
| From net investment income | (0.14) | | (0.11) | | (0.05) |
| From net realized gain on investments | (0.02) | | (0.02) | | (0.01) |
| Total distributions | (0.16) | | (0.13) | | (0.06) |
| Net asset value at end of year | $ 10.98 | | $ 11.04 | | $ 11.86 |
| Total investment return (b) | 0.94% | | (5.92)% | | 19.22% |
| Ratios (to average net assets)/Supplemental Data: | | | | | |
| Net investment income (loss) | 1.83% | | 1.22% | | 0.76%†† |
| Net expenses (c) | 1.06% | | 1.05% | | 1.15%†† |
| Expenses (before waiver/reimbursement) (c) | 1.06% | | 1.05% | | 1.39%†† |
| Portfolio turnover rate | 63% | | 58% | | 45% |
| Net assets at end of year (in 000’s) | $ 1,240 | | $ 854 | | $ 403 |
| ^ | Inception date. |
| †† | Annualized. |
| (a) | Per share data based on average shares outstanding during the period. |
| (b) | Total investment return is calculated exclusive of sales charges and assumes the reinvestment of dividends and distributions. Class R3 shares are not subject to sales charges. For periods of less than one year, total return is not annualized. |
| (c) | In addition to the fees and expenses which the Fund bears directly, it also indirectly bears a pro-rata share of the fees and expenses of the underlying funds in which it invests. Such indirect expenses are not included in the above expense ratios. |
The notes to the financial statements are an integral part of, and should be read in conjunction with, the financial statements.
| 52 | MainStay Moderate ETF Allocation Fund |
Financial Highlights selected per share data and ratios
| | Year Ended April 30, | | August 31, 2020^ through
April 30, |
| SIMPLE Class | 2023 | | 2022 | | 2021 |
| Net asset value at beginning of year | $ 11.03 | | $ 11.85 | | $ 10.66 |
| Net investment income (loss) (a) | 0.19 | | 0.13 | | 0.06 |
| Net realized and unrealized gain (loss) | (0.09) | | (0.81) | | 1.19 |
| Total from investment operations | 0.10 | | (0.68) | | 1.25 |
| Less distributions: | | | | | |
| From net investment income | (0.14) | | (0.12) | | (0.05) |
| From net realized gain on investments | (0.02) | | (0.02) | | (0.01) |
| Total distributions | (0.16) | | (0.14) | | (0.06) |
| Net asset value at end of year | $ 10.97 | | $ 11.03 | | $ 11.85 |
| Total investment return (b) | 0.97% | | (5.89)% | | 11.75% |
| Ratios (to average net assets)/Supplemental Data: | | | | | |
| Net investment income (loss) | 1.78% | | 1.07% | | 0.62%†† |
| Net expenses (c) | 1.03% | | 1.05% | | 1.05%†† |
| Expenses (before waiver/reimbursement) (c) | 1.03% | | 1.05% | | 1.27%†† |
| Portfolio turnover rate | 63% | | 58% | | 45% |
| Net assets at end of year (in 000’s) | $ 8,140 | | $ 3,167 | | $ 475 |
| ^ | Inception date. |
| †† | Annualized. |
| (a) | Per share data based on average shares outstanding during the period. |
| (b) | Total investment return is calculated exclusive of sales charges and assumes the reinvestment of dividends and distributions. SIMPLE Class shares are not subject to sales charges. For periods of less than one year, total return is not annualized. |
| (c) | In addition to the fees and expenses which the Fund bears directly, it also indirectly bears a pro-rata share of the fees and expenses of the underlying funds in which it invests. Such indirect expenses are not included in the above expense ratios. |
The notes to the financial statements are an integral part of, and should be read in conjunction with, the financial statements.
53
MainStay Growth ETF Allocation Fund
Investment and Performance Comparison (Unaudited)
Performance data quoted represents past performance. Past performance is no guarantee of future results. Because of market volatility and other factors, current performance may be lower or higher than the figures shown. Investment return and principal value will fluctuate, and as a result, when shares are redeemed, they may be worth more or less than their original cost. The graph below depicts the historical performance of Class I shares of the Fund. Performance will vary from class to class based on differences in class-specific expenses and sales charges. For performance information current to the most recent month-end, please call 800-624-6782 or visit newyorklifeinvestments.com.
The performance table and graph do not reflect the deduction of taxes that a shareholder would pay on distributions or Fund share redemptions. Total returns reflect maximum applicable sales charges as indicated in the table below, if any, changes in share price, and reinvestment of dividend and capital gain distributions. The graph assumes the initial investment amount shown below and reflects the deduction of all sales charges that would have applied for the period of investment. Performance figures may reflect certain fee waivers and/or expense limitations, without which total returns may have been lower. For more information on share classes and current fee waivers and/or expense limitations (if any), please refer to the Notes to Financial Statements.

| Average Annual Total Returns for the Year-Ended April 30, 2023 |
| Class | Sales Charge | | Inception
Date | One
Year | Since
Inception | Gross
Expense
Ratio1 |
| Class A Shares | Maximum 3.00% Initial Sales Charge | With sales charges | 6/30/2020 | -1.72% | 6.39% | 0.96% |
| | | Excluding sales charges | | 1.32 | 7.54 | 0.96 |
| Class C Shares | Maximum 1.00% CDSC | With sales charges | 6/30/2020 | -0.46 | 6.71 | 1.75 |
| | if redeemed Within One Year of Purchase | Excluding sales charges | | 0.54 | 6.71 | 1.75 |
| Class I Shares | No Sales Charge | | 6/30/2020 | 1.58 | 7.81 | 0.71 |
| Class R3 Shares | No Sales Charge | | 6/30/2020 | 0.96 | 7.15 | 1.31 |
| SIMPLE Class Shares | No Sales Charge | | 8/31/2020 | 1.06 | 4.45 | 1.25 |
| 1. | The gross expense ratios presented reflect the Fund’s “Total Annual Fund Operating Expenses” from the most recent Prospectus, as supplemented, and may differ from other expense ratios disclosed in this report. |
The footnotes on the next page are an integral part of the table and graph and should be carefully read in conjunction with them.
| 54 | MainStay Growth ETF Allocation Fund |
| Benchmark Performance* | One
Year | Since
Inception |
| S&P 500® Index1 | 2.66% | 12.77% |
| MSCI EAFE® Index (Net)2 | 8.42 | 9.43 |
| Bloomberg U.S. Aggregate Bond Index3 | -0.43 | -3.70 |
| Growth Allocation Composite Index4 | 3.42 | 8.87 |
| Morningstar Moderately Aggressive Allocation Category Average5 | 0.44 | 7.78 |
| * | Returns for indices reflect no deductions for fees, expenses or taxes, except for foreign withholding taxes where applicable. Results assume reinvestment of all dividends and capital gains. An investment cannot be made directly in an index. |
| 1. | The S&P 500® Index is the Fund’s primary broad-based securities market index for comparison purposes. S&P 500® is a trademark of The McGraw-Hill Companies, Inc. The S&P 500® Index is widely regarded as the standard index for measuring large-cap U.S. stock market performance. |
| 2. | The MSCI EAFE® Index (Net) is the Fund's secondary benchmark. The MSCI EAFE® Index (Net) consists of international stocks representing the developed world outside of North America. |
| 3. | The Fund has selected the Bloomberg U.S. Aggregate Bond Index as an additional benchmark. The Bloomberg U.S. Aggregate Bond Index is a broad-based benchmark that measures the performance of the investment grade, U.S. dollar-denominated, fixed-rate taxable bond market, including Treasuries, government-related and corporate securities, mortgage-backed securities (agency fixed-rate and hybrid adjustable rate mortgage pass-throughs), asset-backed securities, and commercial mortgage-backed securities. |
| 4. | The Fund has selected the Growth Allocation Composite Index as an additional benchmark. The Growth Allocation Composite Index consists of the S&P 500® Index, the MSCI EAFE® Index and the Bloomberg U.S. Aggregate Bond Index weighted 60%, 20% and 20%, respectively. |
| 5. | The Morningstar Moderately Aggressive Allocation Category Average is representative of funds in allocation categories that seek to provide both income and capital appreciation by primarily investing in multiple asset classes, including stocks, bonds, and cash. These moderately aggressive strategies prioritize capital appreciation over preservation. They typically expect volatility similar to a strategic equity exposure between 70% and 85%. Results are based on average total returns of similar funds with all dividends and capital gain distributions reinvested. |
The footnotes on the preceding page are an integral part of the table and graph and should be carefully read in conjunction with them.
Cost in Dollars of a $1,000 Investment in MainStay Growth ETF Allocation Fund (Unaudited)
The example below is intended to describe the fees and expenses borne by shareholders during the six-month period from November 1, 2022 to April 30, 2023, and the impact of those costs on your investment.
Example
As a shareholder of the Fund you incur two types of costs: (1) transaction costs, including exchange fees and sales charges (loads) on purchases (as applicable), and (2) ongoing costs, including management fees, distribution and/or service (12b-1) fees and other Fund expenses (as applicable). This example is intended to help you understand your ongoing costs (in dollars) of investing in the Fund and to compare these costs with the ongoing costs of investing in other mutual funds. The example is based on an investment of $1,000 made at the beginning of the six-month period and held for the entire period from November 1, 2022 to April 30, 2023.
This example illustrates your Fund’s ongoing costs in two ways:
Actual Expenses
The second and third data columns in the table below provide information about actual account values and actual expenses. You may use the information in these columns, together with the amount you invested, to estimate the expenses that you paid during the six months ended April 30, 2023. Simply divide your account value by $1,000 (for example, an
$8,600 account value divided by $1,000 = 8.6), then multiply the result by the number under the heading entitled “Expenses Paid During Period” to estimate the expenses you paid on your account during this period.
Hypothetical Example for Comparison Purposes
The fourth and fifth data columns in the table below provide information about hypothetical account values and hypothetical expenses based on the Fund’s actual expense ratio and an assumed rate of return of 5% per year before expenses, which is not the Fund’s actual return. The hypothetical account values and expenses may not be used to estimate the actual ending account balances or expenses you paid for the six-month period shown. You may use this information to compare the ongoing costs of investing in the Fund with the ongoing costs of investing in other mutual funds. To do so, compare this 5% hypothetical example with the 5% hypothetical examples that appear in the shareholder reports of the other mutual funds.
Please note that the expenses shown in the table are meant to highlight your ongoing costs only and do not reflect any transactional costs, such as exchange fees or sales charges (loads). Therefore, the fourth and fifth data columns of the table are useful in comparing ongoing costs only and will not help you determine the relative total costs of owning different funds. In addition, if these transactional costs were included, your costs would have been higher.
| Share Class | Beginning
Account
Value
11/1/22 | Ending Account
Value (Based
on Actual
Returns and
Expenses)
4/30/23 | Expenses
Paid
During
Period1 | Ending Account
Value (Based
on Hypothetical
5% Annualized
Return and
Actual Expenses)
4/30/23 | Expenses
Paid
During
Period1 | Net Expense
Ratio
During
Period2 |
| Class A Shares | $1,000.00 | $1,073.50 | $4.11 | $1,020.83 | $4.01 | 0.80% |
| Class C Shares | $1,000.00 | $1,068.50 | $7.95 | $1,017.11 | $7.75 | 1.55% |
| Class I Shares | $1,000.00 | $1,074.50 | $2.83 | $1,022.07 | $2.76 | 0.55% |
| Class R3 Shares | $1,000.00 | $1,070.70 | $5.90 | $1,019.09 | $5.76 | 1.15% |
| SIMPLE Class Shares | $1,000.00 | $1,071.80 | $5.39 | $1,019.59 | $5.26 | 1.05% |
| 1. | Expenses are equal to the Fund’s annualized expense ratio of each class multiplied by the average account value over the period, divided by 365 and multiplied by 181 (to reflect the six-month period). The table above represents the actual expenses incurred during the six-month period. In addition to the fees and expenses which the Fund bears directly, it also indirectly bears a pro rata share of the fees and expenses of the underlying funds in which it invests. Such indirect expenses are not included in the above-reported expense figures. |
| 2. | Expenses are equal to the Fund's annualized expense ratio to reflect the six-month period. |
| 56 | MainStay Growth ETF Allocation Fund |
Asset Diversification as of April 30, 2023 (Unaudited)
| Equity Funds | 77.9 % |
| Fixed Income Funds | 12.7 |
| Short-Term Investments | 17.4 |
| Other Assets, Less Liabilities | (8.0) |
See Portfolio of Investments beginning on page 61 for specific holdings within these categories. The Fund’s holdings are subject to change.
Portfolio Management Discussion and Analysis (Unaudited)
Questions answered by portfolio managers Jae S. Yoon, CFA, Jonathan Swaney, Poul Kristensen, CFA, and Amit Soni, CFA, of New York Life Investment Management LLC, the Fund’s Manager.
How did MainStay Growth ETF Allocation Fund perform relative to its benchmarks and peer group during the 12 months ended April 30, 2023?
For the 12 months ended April 30, 2023, Class I shares of MainStay Growth ETF Allocation Fund returned 1.58%, underperforming the 2.66% return of the Fund’s primary benchmark, the S&P 500® Index (the “Index”), and the 8.42% return of the MSCI EAFE® Index (Net), which is the Fund’s secondary benchmark. Over the same period, Class I shares of the Fund outperformed the −0.43% return of the Bloomberg U.S. Aggregate Bond Index, and underperformed the 3.42% return of the Growth Allocation Composite Index, both of which are additional benchmarks of the Fund. For the 12 months ended April 30, 2023, Class I shares of the Fund outperformed the 0.44% return of the Morningstar Moderately Aggressive Allocation Category Average.1
What factors affected the Fund’s relative performance during the reporting period?
The Fund is a “fund of funds" that seeks to achieve its investment objective by investing in unaffiliated, passively-managed, exchange-traded funds (“Underlying ETFs”). The Underlying ETFs may invest in U.S. equities, international equities and fixed-income instruments, making comparisons to any single index generally less suitable than a weighted combination of indices, which is a more useful yardstick by which to measure performance. During the reporting period, asset class policy was the primary determinant of the Fund’s relative performance.
Fund management internally maintains a blend of indices that are taken into consideration when managing the Fund. During the reporting period, the Fund modestly underperformed the internally maintained blend of indices, primarily due to asset class policy decisions, although frictions between the Underlying ETFs that were held and the indices that comprise the Index also played a role. Management of the Fund’s stock/bond blend itself was not the issue, as positive returns were generated in the process of controlling the blend. The allocation was held near neutral for much of the reporting period, although capital was added to equities during periods of pricing softness and removed again as the market recovered. This tactical “buy the dip, sell the rally” practice boosted returns at the margin.
Rather, the issue was within asset classes. A persistent bias toward small-cap names, expressed through exposure to the S&P SmallCap 600™ Index,2 detracted materially from relative performance. While relative valuations for small-cap stocks were much more attractive than the historical norm, smaller companies
are significantly more sensitive to changes in bank financing conditions than larger companies that can issue bonds. Fast-rising costs on bank loans, coupled with concerns about future credit availability in the wake of the bank crisis that emerged in March and April 2023, weighed heavily on the smaller end of the capitalization spectrum. In contrast, mega-cap technology and technology-related companies—including Microsoft, Apple, Tesla, Meta Platforms and Amazon.com—performed well.
Significantly underweight exposure to non-U.S. developed markets also detracted materially from relative performance. In our estimation, Europe was particularly vulnerable to disruption, owing largely to the Russian invasion of Ukraine and the accompanying strain on energy supplies. An unusually mild winter, however, granted a reprieve, and these markets ultimately performed quite well.
Exposure to gold miners further detracted from relative performance. The price of bullion rose over the course of the reporting period, but companies that extract gold fared less well, possibly due to rising extraction costs (particularly labor) and currency effects.
On the upside, maintaining a large cash position within the fixed-income portion of the Fund made a substantial positive contribution to performance, as bond yields climbed. (Contributions take weightings and total returns into account.) Similarly, skewing high yield bond holdings to favor shorter-duration3 instruments boosted returns at the margin.
Even within equities, the news was not universally negative. Exposure to energy stocks, for example, proved helpful as gains in the first half of the reporting period more than offset the underperformance experienced during the second half. We believe energy remains a compelling strategic opportunity, particularly among producers and firms that provide extraction services.
How did you allocate the Fund’s assets during the reporting period and why?
Stock/bond blend: Equity exposure within the Fund was held relatively close to neutral during the reporting period, with the exception of a modest bias favoring stocks that we implemented tactically in response to swings in pricing (adding on drawdowns and trimming on rallies). We are generally reluctant to position the Fund with underweight equity exposure, since stocks tend to perform well over time and anticipating drawdowns is challenging. The opposite is less true. We are happy to lean into equities when we believe they are well-supported fundamentally or when a
| 1. | See "Investment and Performance Comparison" for other share class returns, which may be higher or lower than Class I share returns, and for more information on benchmark and peer group returns. |
| 2. | The S&P SmallCap 600™ Index covers roughly the small-cap range of American stocks, using a capitalization-weighted index. Capitalization range is from $850 million to $3.7 billion. |
| 3. | Duration is a measure of the price sensitivity of a fixed-income investment to changes in interest rates. Duration is expressed as a number of years and is considered a more accurate sensitivity gauge than average maturity. |
| 58 | MainStay Growth ETF Allocation Fund |
correction has run further than we believe appropriate. This strategy worked well during the reporting period, producing a modestly positive contribution to performance. The policy stance shifted slightly in 2023, however, when the Fund adopted a small underweight position in equities following a sharp rally in January. We increased this underweight posture later in the reporting period as turmoil among banks increased the likelihood of a near-term recession.
Duration: Believing inflationary pressures to be at least partially structural in nature and likely to persist at elevated levels for the foreseeable future, we skewed the Fund’s fixed-income holdings to favor shorter-maturity instruments less sensitive to rising bond yields, although duration was added as yields rose. Over the latter half of the reporting period, duration was slightly shorter than that of the Bloomberg U.S. Aggregate Bond Index.
Equity style: In the same way that inflation threatens long-duration bonds, equities with values disproportionately reflected in more distant cash flows (i.e., growth stocks with high prices relative to current earnings) are likewise vulnerable. Accordingly, the Fund remained tilted to emphasize value stocks that offered more attractive near-term cash flows, placing particular focus on traditionally defensive sectors: real estate, utilities, consumer staples and (most of all) health care. While this positioning made a modest, positive contribution to the Fund’s return during the first half of the reporting period, the opposite was true during the second half; market performance was dominated by a handful of large, high-growth companies, including NVDIA, Tesla, Apple and others.
Equity size: Small-company stocks were more heavily represented in the Fund than in the Index. The thesis behind this positioning was based on attractive small-cap valuations, insulation from economic weakness abroad, less sensitivity to dollar strength, and disproportionate exposure to domestic demand, which remained robust. This stance was helpful for much of the reporting period, but reversed abruptly in the spring of 2023 as small companies, which tend to be heavily dependent on bank financing, proved vulnerable to the aggressive, tightening lending standards implemented during the bank crisis mentioned above.
Geographic exposure: Following Russia’s invasion of Ukraine and the energy crisis that ensured, the Fund maintained underweight exposure to developed international markets. However, non-U.S. developed markets fared well during the reporting period, benefiting from both an unusually mild winter that reduced the strain on energy reserves, and the reopening of China following the end of the country’s zero-COVID-19 restrictions.
Energy: The Fund maintained exposure to upstream energy producers and oilfield/gas field service providers as a commodity
play to provide an additional inflation hedge. These holdings also positioned the Fund to take advantage of opportunities for domestic producers to benefit as Western nations revisit energy policy to source supplies from stable and friendly jurisdictions rather than autocratic petrostates that present national security risks. While the Fund’s position was small, it had a disproportionately positive impact on performance as oil and gas prices soared during the first half of the reporting period, although some of those gains were later reversed.
How did the Fund’s allocations change over the course of the reporting period?
The Fund’s cash position saw the largest allocation increase, as we trimmed both equity and fixed income positions. Allocations to full-duration investment-grade bonds also increased through additional exposure to iShares® Core U.S. Aggregate Bond ETF, Schwab U.S. Aggregate Bond ETF and iShares® Broad USD Investment Grade Corporate Bond ETF. The Fund also added several new holdings. The Fund established a stake in iShares® Core S&P® Mid-Cap ETF, reflecting our favorable view of the mid-cap asset class’s attractive relative valuations and reduced sensitivity to bank lending conditions compared to the small cap universe; the position also offset a reduction in the Fund’s position in Schwab U.S. Mid-Cap ETF. The Fund took a position in The Materials Select Sector SPDR® Fund as a hedge against stubborn inflation, protection against a potentially weakening dollar and as a way to benefit from supply-chain reengineering and the desire of manufacturers to source raw materials from more friendly, reliable geographies. The Fund also initiated a position in iShares® MSCI Japan ETF, since we viewed Japanese equity valuations as attractive, export conditions as favorable and we believe the Japanese yen is likely to appreciate should the country’s central bank further relax, or even abandon, its existing yield curve4 control policy. These positions were funded in large part from Vanguard Mega Cap ETF.
A reduced position in iShares® Core MSCI EAFE ETF reflected the Fund’s shift away from non-U.S. developed equity markets. We trimmed holdings of Schwab U.S. Small-Cap ETF in response to the ongoing bank crisis. Sales of iShares® 0–5 Year High Yield Corp Bond ETF and Invesco Senior Loan ETF were prompted by our strategy of shifting Fund assets away from lower-credit-quality fixed-income instruments in preparation for a potentially fast-approaching recession.
During the reporting period, which Underlying Equity ETFs had the highest total returns and which Underlying Equity ETFs had the lowest total returns?
The Fund’s top-performing Underlying Equity ETFs that were held for the entire reporting period included iShares® Core MSCI EAFE
| 4. | The yield curve is a line that plots the yields of various securities of similar quality—typically U.S. Treasury issues—across a range of maturities. The U.S. Treasury yield curve serves as a benchmark for other debt and is used in economic forecasting. |
ETF, VanEck Oil Services ETF and Health Care Select SPDR® Fund. The lowest total returns were seen in iShares® Core MSCI Emerging Markets ETF, iShares® Core S&P® Small-Cap ETF and Schwab U.S. Small-Cap ETF.
Which Underlying Equity ETFs were the strongest positive contributors to the Fund’s performance and which Underlying Equity ETFs were particularly weak?
Contribution to return is a function not only of Underlying ETF performance and average allocation, but also the variation in that allocation across time. The Underlying Equity ETFs making the largest positive contributions to return included Vanguard Mega Cap ETF, iShares® Core MSCI EAFE ETF and VanEck Oil Services ETF. The most significant detractors were iShares® Core MSCI Emerging Markets ETF, VanEck Gold Miners ETF and iShares® Core S&P® Small Cap ETF.
During the reporting period, which Underlying Fixed-Income ETFs had the highest total returns and which Underlying Fixed-ETFs Funds had the lowest total returns?
The only three Underlying Fixed-Income ETFs held for the entire period all posted gains. They were iShares® 0–5 Year High Yield Corporate Bond ETF, Invesco Senior Loan ETF and iShares® Broad USD High Yield Corporate Bond ETF.
Which Underlying Fixed-Income ETFs were the strongest positive contributors to the Fund’s performance and which Underlying Fixed-Income ETFs were particularly weak?
The Underlying Fixed-Income ETFs making the largest contributions to return were Invesco Senior Loan ETF, iShares® Core U.S. Aggregate Bond ETF and iShares® 0–5 Year High Yield Corporate Bond ETF. The only Underlying Fixed-Income ETFs to detract from absolute performance was iShares® 20+ Year Treasury Bond ETF, which was used for duration management. The smallest positive contributions came from Vanguard Short-Term Bond ETF and iShares® Broad USD Investment Grade Bond ETF.
How was the Fund positioned at the end of the reporting period?
As of April 30, 2023, we believe a near-term recession looks highly probable. Our opinion is based on a wide range of
variables, including, but not limited to, the shape of the yield curve, trends in business surveys, a decline in money supply, tightening credit conditions and the steady drawdown of savings accumulated during the pandemic. We expect corporate profits to decline over the next several quarters, eventually driving stock prices lower while pushing credit spreads out. Accordingly, we continue to position the Fund defensively.
The Fund’s defensive posture begins at the top of the portfolio, with a modest tilt away from equities. We generally avoid underweight equity allocations, as they usually stand on the wrong side of history—stocks rise more often than not. However, we firmly believe that current valuations are rich given the daunting array of risks the economy and the markets face, including an historically extreme rise in rates, the looming debt ceiling, the unresolved bank crisis and geopolitical uncertainty, to name a few. We maintain that caution is the better part of valor under these circumstances.
Defensive positioning is clearly visible within asset classes as well. On the equity side, the Fund favors sectors—such as consumer staples, utilities and healthcare—that have generally exhibited lower volatility and retained their value better during drawdowns. Additionally, the Fund’s bias toward historically higher-beta, small-cap stocks, in place for the past several quarters, has been effectively removed. Within fixed income, the Fund now holds a below-Index-weight position in bank loans, and holdings of high yield bonds are skewed to favor lower-duration instruments, which tend to exhibit less volatility and smaller losses than longer maturity bonds.
Energy stocks tend to be more cyclical. The Fund’s overweight allocation to the sector may seem inconsistent with the otherwise cautious posture of the portfolio, although relative valuation is attractive, and we believe supply/demand dynamics will prove supportive of pricing over time for both the underlying commodities and the stock prices of companies involved in the production, processing and distribution of these resources.
None of Schwab Strategic Trust, Schwab® U.S. Aggregate Bond ETF, Schwab U.S. Mid-Cap ETF, Schwab U.S. Small Cap ETF or Charles Schwab Investment Management, Inc. make any representations regarding the advisability of investing in MainStay Growth ETF Allocation Fund.
iShares® is a registered trademark of BlackRock (BlackRock, Inc. and its subsidiaries). Neither BlackRock nor the iShares® Funds make any representations regarding the advisability of investing in MainStay Growth ETF Allocation Fund.
The opinions expressed are those of the portfolio managers as of the date of this report and are subject to change. There is no guarantee that any forecasts will come to pass. This material does not constitute investment advice and is not intended as an endorsement of any specific investment.
| 60 | MainStay Growth ETF Allocation Fund |
Portfolio of Investments April 30, 2023†^
| | Shares | Value |
| Investment Companies 90.6% |
| Equity Funds 77.9% |
| Health Care Select Sector SPDR Fund (a) | 5,885 | $ 785,824 |
| Invesco S&P 500 Low Volatility ETF | 12,432 | 794,902 |
| iShares Core MSCI EAFE ETF | 161,793 | 11,126,505 |
| iShares Core MSCI Emerging Markets ETF | 31,983 | 1,553,734 |
| iShares Core S&P Mid-Cap ETF | 12,731 | 3,159,834 |
| iShares Core S&P Small-Cap ETF | 41,883 | 3,937,002 |
| iShares MSCI Japan ETF | 13,448 | 791,280 |
| Materials Select Sector SPDR Fund | 9,720 | 782,946 |
| Schwab U.S. Mid-Cap ETF | 30,639 | 2,065,375 |
| Schwab U.S. Small-Cap ETF | 134,277 | 5,529,527 |
| SPDR S&P Oil & Gas Exploration & Production ETF (a) | 6,073 | 771,939 |
| VanEck Oil Services ETF (a) | 1,366 | 374,462 |
| Vanguard Mega Cap ETF | 137,093 | 19,992,272 |
| Vanguard Mega Cap Value ETF | 19,110 | 1,966,801 |
| Vanguard Mid-Cap ETF (a) | 39,226 | 8,209,610 |
Total Equity Funds
(Cost $58,467,407) | | 61,842,013 |
| Fixed Income Funds 12.7% |
| Invesco Senior Loan ETF (a) | 150,663 | 3,145,844 |
| iShares 0-5 Year High Yield Corporate Bond ETF (a) | 43,029 | 1,787,855 |
| iShares Broad USD High Yield Corporate Bond ETF | 56,095 | 1,988,007 |
| iShares Broad USD Investment Grade Corporate Bond ETF | 9,424 | 479,587 |
| iShares Core U.S. Aggregate Bond ETF | 9,600 | 959,616 |
| Schwab U.S. Aggregate Bond ETF (a) | 20,403 | 960,165 |
| Vanguard Short-Term Bond ETF | 10,380 | 795,523 |
Total Fixed Income Funds
(Cost $10,242,185) | | 10,116,597 |
Total Investment Companies
(Cost $68,709,592) | | 71,958,610 |
| Short-Term Investments 17.4% |
| Affiliated Investment Company 9.3% |
| MainStay U.S. Government Liquidity Fund, 3.98% (b) | 7,400,311 | 7,400,311 |
| Unaffiliated Investment Companies 8.1% |
| Goldman Sachs Financial Square Government Fund, 4.865% (b)(c) | 2,000,000 | 2,000,000 |
The notes to the financial statements are an integral part of, and should be read in conjunction with, the financial statements.
61
Portfolio of Investments April 30, 2023†^ (continued)
| | Shares | | Value |
| Short-Term Investments (continued) |
| Unaffiliated Investment Companies (continued) |
| Invesco Government & Agency Portfolio, 4.857% (b)(c) | 4,401,824 | | $ 4,401,824 |
Total Unaffiliated Investment Companies
(Cost $6,401,824) | | | 6,401,824 |
Total Short-Term Investments
(Cost $13,802,135) | | | 13,802,135 |
Total Investments
(Cost $82,511,727) | 108.0% | | 85,760,745 |
| Other Assets, Less Liabilities | (8.0) | | (6,327,947) |
| Net Assets | 100.0% | | $ 79,432,798 |
| † | Percentages indicated are based on Fund net assets. |
| ^ | Industry classifications may be different than those used for compliance monitoring purposes. |
| (a) | All or a portion of this security was held on loan. As of April 30, 2023, the aggregate market value of securities on loan was $6,655,125; the total market value of collateral held by the Fund was $6,764,188. The market value of the collateral held included non-cash collateral in the form of U.S. Treasury securities with a value of $362,364. The Fund received cash collateral with a value of $6,401,824. (See Note 2(G)) |
| (b) | Current yield as of April 30, 2023. |
| (c) | Represents a security purchased with cash collateral received for securities on loan. |
Investments in Affiliates (in 000's)
Investments in issuers considered to be affiliate(s) of the Fund during the year ended April 30, 2023 for purposes of Section 2(a)(3) of the Investment Company Act of 1940, as amended, were as follows:
| Affiliated Investment Companies | Value,
Beginning
of Year | Purchases
at Cost | Proceeds
from
Sales | Net
Realized
Gain/(Loss)
on Sales | Change in
Unrealized
Appreciation/
(Depreciation) | Value,
End of
Year | Dividend
Income | Other
Distributions | Shares
End of
Year |
| MainStay U.S. Government Liquidity Fund | $ 1,514 | $ 24,891 | $ (19,005) | $ — | $ — | $ 7,400 | $ 121 | $ — | 7,400 |
| Abbreviation(s): |
| EAFE—Europe, Australasia and Far East |
| ETF—Exchange-Traded Fund |
| MSCI—Morgan Stanley Capital International |
| SPDR—Standard & Poor’s Depositary Receipt |
| USD—United States Dollar |
The notes to the financial statements are an integral part of, and should be read in conjunction with, the financial statements.
| 62 | MainStay Growth ETF Allocation Fund |
The following is a summary of the fair valuations according to the inputs used as of April 30, 2023, for valuing the Fund’s assets:
| Description | Quoted
Prices in
Active
Markets for
Identical
Assets
(Level 1) | | Significant
Other
Observable
Inputs
(Level 2) | | Significant
Unobservable
Inputs
(Level 3) | | Total |
| Asset Valuation Inputs | | | | | | | |
| Investments in Securities (a) | | | | | | | |
| Investment Companies | | | | | | | |
| Equity Funds | $ 61,842,013 | | $ — | | $ — | | $ 61,842,013 |
| Fixed Income Funds | 10,116,597 | | — | | — | | 10,116,597 |
| Total Investment Companies | 71,958,610 | | — | | — | | 71,958,610 |
| Short-Term Investments | | | | | | | |
| Affiliated Investment Company | 7,400,311 | | — | | — | | 7,400,311 |
| Unaffiliated Investment Companies | 6,401,824 | | — | | — | | 6,401,824 |
| Total Short-Term Investments | 13,802,135 | | — | | — | | 13,802,135 |
| Total Investments in Securities | $ 85,760,745 | | $ — | | $ — | | $ 85,760,745 |
| (a) | For a complete listing of investments, see the Portfolio of Investments. |
The notes to the financial statements are an integral part of, and should be read in conjunction with, the financial statements.
63
Statement of Assets and Liabilities as of April 30, 2023
| Assets |
Investment in unaffiliated securities, at value
(identified cost $75,111,416) including securities on loan of $6,655,125 | $78,360,434 |
Investment in affiliated investment companies, at value
(identified cost $7,400,311) | 7,400,311 |
| Due from custodian | 20,860 |
| Receivables: | |
| Fund shares sold | 147,031 |
| Dividends | 22,697 |
| Securities lending | 11,986 |
| Other assets | 19,807 |
| Total assets | 85,983,126 |
| Liabilities |
| Cash collateral received for securities on loan | 6,401,824 |
| Payables: | |
| Investment securities purchased | 90,381 |
| NYLIFE Distributors (See Note 3) | 17,975 |
| Transfer agent (See Note 3) | 16,579 |
| Manager (See Note 3) | 10,461 |
| Custodian | 5,785 |
| Fund shares redeemed | 3,567 |
| Shareholder communication | 3,300 |
| Professional fees | 443 |
| Accrued expenses | 13 |
| Total liabilities | 6,550,328 |
| Net assets | $79,432,798 |
| Composition of Net Assets |
| Shares of beneficial interest outstanding (par value of $.001 per share) unlimited number of shares authorized | $ 6,681 |
| Additional paid-in-capital | 79,791,787 |
| | 79,798,468 |
| Total distributable earnings (loss) | (365,670) |
| Net assets | $79,432,798 |
| Class A | |
| Net assets applicable to outstanding shares | $68,880,279 |
| Shares of beneficial interest outstanding | 5,793,211 |
| Net asset value per share outstanding | $ 11.89 |
| Maximum sales charge (3.00% of offering price) | 0.37 |
| Maximum offering price per share outstanding | $ 12.26 |
| Class C | |
| Net assets applicable to outstanding shares | $ 313,624 |
| Shares of beneficial interest outstanding | 26,500 |
| Net asset value and offering price per share outstanding | $ 11.83 |
| Class I | |
| Net assets applicable to outstanding shares | $ 106,902 |
| Shares of beneficial interest outstanding | 9,016 |
| Net asset value and offering price per share outstanding | $ 11.86 |
| Class R3 | |
| Net assets applicable to outstanding shares | $ 685,176 |
| Shares of beneficial interest outstanding | 57,713 |
| Net asset value and offering price per share outstanding | $ 11.87 |
| SIMPLE Class | |
| Net assets applicable to outstanding shares | $ 9,446,817 |
| Shares of beneficial interest outstanding | 795,000 |
| Net asset value and offering price per share outstanding | $ 11.88 |
The notes to the financial statements are an integral part of, and should be read in conjunction with, the financial statements.
| 64 | MainStay Growth ETF Allocation Fund |
Statement of Operations for the year ended April 30, 2023
| Investment Income (Loss) |
| Income | |
| Dividends-unaffiliated | $ 1,453,203 |
| Securities lending, net | 151,174 |
| Dividends-affiliated | 120,639 |
| Total income | 1,725,016 |
| Expenses | |
| Distribution/Service—Class A (See Note 3) | 142,949 |
| Distribution/Service—Class C (See Note 3) | 3,097 |
| Distribution/Service—Class R3 (See Note 3) | 2,771 |
| Distribution/Service—SIMPLE Class (See Note 3) | 31,615 |
| Manager (See Note 3) | 128,885 |
| Registration | 93,875 |
| Transfer agent (See Note 3) | 76,845 |
| Professional fees | 34,715 |
| Custodian | 19,086 |
| Shareholder communication | 8,805 |
| Trustees | 1,497 |
| Shareholder service (See Note 3) | 554 |
| Miscellaneous | 5,516 |
| Total expenses before waiver/reimbursement | 550,210 |
| Expense waiver/reimbursement from Manager (See Note 3) | (14,790) |
| Reimbursement from prior custodian(a) | (140) |
| Net expenses | 535,280 |
| Net investment income (loss) | 1,189,736 |
| Realized and Unrealized Gain (Loss) |
| Net realized gain (loss) on unaffiliated investments | (3,507,501) |
| Net change in unrealized appreciation (depreciation) on unaffiliated investments | 3,790,020 |
| Net realized and unrealized gain (loss) | 282,519 |
| Net increase (decrease) in net assets resulting from operations | $ 1,472,255 |
| (a) | Represents a refund for overbilling of custody fees. |
The notes to the financial statements are an integral part of, and should be read in conjunction with, the financial statements.
65
Statements of Changes in Net Assets
for the years ended April 30, 2023 and April 30, 2022
| | 2023 | 2022 |
| Increase (Decrease) in Net Assets |
| Operations: | | |
| Net investment income (loss) | $ 1,189,736 | $ 656,387 |
| Net realized gain (loss) | (3,507,501) | (352,275) |
| Net change in unrealized appreciation (depreciation) | 3,790,020 | (4,308,393) |
| Net increase (decrease) in net assets resulting from operations | 1,472,255 | (4,004,281) |
| Distributions to shareholders: | | |
| Class A | (904,515) | (591,463) |
| Class C | (2,440) | (1,516) |
| Class I | (1,696) | (635) |
| Class R3 | (7,027) | (2,146) |
| SIMPLE Class | (91,952) | (28,130) |
| Total distributions to shareholders | (1,007,630) | (623,890) |
| Capital share transactions: | | |
| Net proceeds from sales of shares | 29,043,850 | 36,077,108 |
| Net asset value of shares issued to shareholders in reinvestment of distributions | 1,007,165 | 623,525 |
| Cost of shares redeemed | (8,232,844) | (6,073,472) |
| Increase (decrease) in net assets derived from capital share transactions | 21,818,171 | 30,627,161 |
| Net increase (decrease) in net assets | 22,282,796 | 25,998,990 |
| Net Assets |
| Beginning of year | 57,150,002 | 31,151,012 |
| End of year | $79,432,798 | $57,150,002 |
The notes to the financial statements are an integral part of, and should be read in conjunction with, the financial statements.
| 66 | MainStay Growth ETF Allocation Fund |
Financial Highlights selected per share data and ratios
| | Year Ended April 30, | | June 30, 2020^ through
April 30, |
| Class A | 2023 | | 2022 | | 2021 |
| Net asset value at beginning of period | $ 11.92 | | $ 12.79 | | $ 10.00 |
| Net investment income (loss) (a) | 0.22 | | 0.18 | | 0.09 |
| Net realized and unrealized gain (loss) | (0.07) | | (0.89) | | 2.76 |
| Total from investment operations | 0.15 | | (0.71) | | 2.85 |
| Less distributions: | | | | | |
| From net investment income | (0.18) | | (0.15) | | (0.05) |
| From net realized gain on investments | (0.00)‡ | | (0.01) | | (0.01) |
| Total distributions | (0.18) | | (0.16) | | (0.06) |
| Net asset value at end of period | $ 11.89 | | $ 11.92 | | $ 12.79 |
| Total investment return (b) | 1.32% | | (5.69)% | | 28.56% |
| Ratios (to average net assets)/Supplemental Data: | | | | | |
| Net investment income (loss) | 1.88% | | 1.41% | | 0.90%†† |
| Net expenses (c) | 0.80% | | 0.80% | | 0.80%†† |
| Expenses (before waiver/reimbursement) (c) | 0.82% | | 0.85% | | 1.41%†† |
| Portfolio turnover rate | 57% | | 54% | | 47% |
| Net assets at end of period (in 000’s) | $ 68,880 | | $ 52,475 | | $ 29,705 |
| ^ | Inception date. |
| ‡ | Less than one cent per share. |
| †† | Annualized. |
| (a) | Per share data based on average shares outstanding during the period. |
| (b) | Total investment return is calculated exclusive of sales charges and assumes the reinvestment of dividends and distributions. For periods of less than one year, total return is not annualized. |
| (c) | In addition to the fees and expenses which the Fund bears directly, it also indirectly bears a pro-rata share of the fees and expenses of the underlying funds in which it invests. Such indirect expenses are not included in the above expense ratios. |
The notes to the financial statements are an integral part of, and should be read in conjunction with, the financial statements.
67
Financial Highlights selected per share data and ratios
| | Year Ended April 30, | | June 30, 2020^ through
April 30, |
| Class C | 2023 | | 2022 | | 2021 |
| Net asset value at beginning of period | $ 11.86 | | $ 12.73 | | $ 10.00 |
| Net investment income (loss) (a) | 0.13 | | 0.09 | | 0.03 |
| Net realized and unrealized gain (loss) | (0.07) | | (0.90) | | 2.74 |
| Total from investment operations | 0.06 | | (0.81) | | 2.77 |
| Less distributions: | | | | | |
| From net investment income | (0.09) | | (0.05) | | (0.03) |
| From net realized gain on investments | (0.00)‡ | | (0.01) | | (0.01) |
| Total distributions | (0.09) | | (0.06) | | (0.04) |
| Net asset value at end of period | $ 11.83 | | $ 11.86 | | $ 12.73 |
| Total investment return (b) | 0.54% | | (6.40)% | | 27.72% |
| Ratios (to average net assets)/Supplemental Data: | | | | | |
| Net investment income (loss) | 1.15% | | 0.67% | | 0.28%†† |
| Net expenses (c) | 1.55% | | 1.55% | | 1.55%†† |
| Expenses (before waiver/reimbursement) (c) | 1.60% | | 1.64% | | 2.12%†† |
| Portfolio turnover rate | 57% | | 54% | | 47% |
| Net assets at end of period (in 000’s) | $ 314 | | $ 310 | | $ 288 |
| ^ | Inception date. |
| ‡ | Less than one cent per share. |
| †† | Annualized. |
| (a) | Per share data based on average shares outstanding during the period. |
| (b) | Total investment return is calculated exclusive of sales charges and assumes the reinvestment of dividends and distributions. For periods of less than one year, total return is not annualized. |
| (c) | In addition to the fees and expenses which the Fund bears directly, it also indirectly bears a pro-rata share of the fees and expenses of the underlying funds in which it invests. Such indirect expenses are not included in the above expense ratios. |
The notes to the financial statements are an integral part of, and should be read in conjunction with, the financial statements.
| 68 | MainStay Growth ETF Allocation Fund |
Financial Highlights selected per share data and ratios
| | Year Ended April 30, | | June 30, 2020^ through
April 30, |
| Class I | 2023 | | 2022 | | 2021 |
| Net asset value at beginning of period | $ 11.89 | | $ 12.75 | | $ 10.00 |
| Net investment income (loss) (a) | 0.22 | | 0.22 | | 0.12 |
| Net realized and unrealized gain (loss) | (0.05) | | (0.89) | | 2.75 |
| Total from investment operations | 0.17 | | (0.67) | | 2.87 |
| Less distributions: | | | | | |
| From net investment income | (0.20) | | (0.18) | | (0.11) |
| From net realized gain on investments | (0.00)‡ | | (0.01) | | (0.01) |
| Total distributions | (0.20) | | (0.19) | | (0.12) |
| Net asset value at end of period | $ 11.86 | | $ 11.89 | | $ 12.75 |
| Total investment return (b) | 1.58% | | (5.41)% | | 28.79% |
| Ratios (to average net assets)/Supplemental Data: | | | | | |
| Net investment income (loss) | 1.95% | | 1.70% | | 1.23%†† |
| Net expenses (c) | 0.55% | | 0.55% | | 0.55%†† |
| Expenses (before waiver/reimbursement) (c) | 0.57% | | 0.60% | | 1.16%†† |
| Portfolio turnover rate | 57% | | 54% | | 47% |
| Net assets at end of period (in 000’s) | $ 107 | | $ 40 | | $ 40 |
| ^ | Inception date. |
| ‡ | Less than one cent per share. |
| †† | Annualized. |
| (a) | Per share data based on average shares outstanding during the period. |
| (b) | Total investment return is calculated exclusive of sales charges and assumes the reinvestment of dividends and distributions. Class I shares are not subject to sales charges. For periods of less than one year, total return is not annualized. |
| (c) | In addition to the fees and expenses which the Fund bears directly, it also indirectly bears a pro-rata share of the fees and expenses of the underlying funds in which it invests. Such indirect expenses are not included in the above expense ratios. |
The notes to the financial statements are an integral part of, and should be read in conjunction with, the financial statements.
69
Financial Highlights selected per share data and ratios
| | Year Ended April 30, | | June 30, 2020^ through
April 30, |
| Class R3 | 2023 | | 2022 | | 2021 |
| Net asset value at beginning of period | $ 11.90 | | $ 12.77 | | $ 10.00 |
| Net investment income (loss) (a) | 0.18 | | 0.11 | | 0.05 |
| Net realized and unrealized gain (loss) | (0.08) | | (0.87) | | 2.76 |
| Total from investment operations | 0.10 | | (0.76) | | 2.81 |
| Less distributions: | | | | | |
| From net investment income | (0.13) | | (0.10) | | (0.03) |
| From net realized gain on investments | (0.00)‡ | | (0.01) | | (0.01) |
| Total distributions | (0.13) | | (0.11) | | (0.04) |
| Net asset value at end of period | $ 11.87 | | $ 11.90 | | $ 12.77 |
| Total investment return (b) | 0.96% | | (6.01)% | | 28.16% |
| Ratios (to average net assets)/Supplemental Data: | | | | | |
| Net investment income (loss) | 1.54% | | 0.83% | | 0.48%†† |
| Net expenses (c) | 1.15% | | 1.15% | | 1.15%†† |
| Expenses (before waiver/reimbursement) (c) | 1.17% | | 1.20% | | 1.76%†† |
| Portfolio turnover rate | 57% | | 54% | | 47% |
| Net assets at end of period (in 000’s) | $ 685 | | $ 486 | | $ 158 |
| ^ | Inception date. |
| ‡ | Less than one cent per share. |
| †† | Annualized. |
| (a) | Per share data based on average shares outstanding during the period. |
| (b) | Total investment return is calculated exclusive of sales charges and assumes the reinvestment of dividends and distributions. Class R3 shares are not subject to sales charges. For periods of less than one year, total return is not annualized. |
| (c) | In addition to the fees and expenses which the Fund bears directly, it also indirectly bears a pro-rata share of the fees and expenses of the underlying funds in which it invests. Such indirect expenses are not included in the above expense ratios. |
The notes to the financial statements are an integral part of, and should be read in conjunction with, the financial statements.
| 70 | MainStay Growth ETF Allocation Fund |
Financial Highlights selected per share data and ratios
| | Year Ended April 30, | | August 31, 2020^ through
April 30, |
| SIMPLE Class | 2023 | | 2022 | | 2021 |
| Net asset value at beginning of period | $ 11.91 | | $ 12.78 | | $ 10.86 |
| Net investment income (loss) (a) | 0.18 | | 0.14 | | 0.07 |
| Net realized and unrealized gain (loss) | (0.06) | | (0.89) | | 1.90 |
| Total from investment operations | 0.12 | | (0.75) | | 1.97 |
| Less distributions: | | | | | |
| From net investment income | (0.15) | | (0.11) | | (0.04) |
| From net realized gain on investments | (0.00)‡ | | (0.01) | | (0.01) |
| Total distributions | (0.15) | | (0.12) | | (0.05) |
| Net asset value at end of period | $ 11.88 | | $ 11.91 | | $ 12.78 |
| Total investment return (b) | 1.06% | | (5.92)% | | 18.11% |
| Ratios (to average net assets)/Supplemental Data: | | | | | |
| Net investment income (loss) | 1.57% | | 1.11% | | 0.71%†† |
| Net expenses (c) | 1.05% | | 1.05% | | 1.05%†† |
| Expenses (before waiver/reimbursement) (c) | 1.10% | | 1.14% | | 1.62%†† |
| Portfolio turnover rate | 57% | | 54% | | 47% |
| Net assets at end of period (in 000’s) | $ 9,447 | | $ 3,838 | | $ 962 |
| ^ | Inception date. |
| ‡ | Less than one cent per share. |
| †† | Annualized. |
| (a) | Per share data based on average shares outstanding during the period. |
| (b) | Total investment return is calculated exclusive of sales charges and assumes the reinvestment of dividends and distributions. SIMPLE Class shares are not subject to sales charges. For periods of less than one year, total return is not annualized. |
| (c) | In addition to the fees and expenses which the Fund bears directly, it also indirectly bears a pro-rata share of the fees and expenses of the underlying funds in which it invests. Such indirect expenses are not included in the above expense ratios. |
The notes to the financial statements are an integral part of, and should be read in conjunction with, the financial statements.
71
MainStay Equity ETF Allocation Fund
Investment and Performance Comparison (Unaudited)
Performance data quoted represents past performance. Past performance is no guarantee of future results. Because of market volatility and other factors, current performance may be lower or higher than the figures shown. Investment return and principal value will fluctuate, and as a result, when shares are redeemed, they may be worth more or less than their original cost. The graph below depicts the historical performance of Class I shares of the Fund. Performance will vary from class to class based on differences in class-specific expenses and sales charges. For performance information current to the most recent month-end, please call 800-624-6782 or visit newyorklifeinvestments.com.
The performance table and graph do not reflect the deduction of taxes that a shareholder would pay on distributions or Fund share redemptions. Total returns reflect maximum applicable sales charges as indicated in the table below, if any, changes in share price, and reinvestment of dividend and capital gain distributions. The graph assumes the initial investment amount shown below and reflects the deduction of all sales charges that would have applied for the period of investment. Performance figures may reflect certain fee waivers and/or expense limitations, without which total returns may have been lower. For more information on share classes and current fee waivers and/or expense limitations (if any), please refer to the Notes to Financial Statements.

| Average Annual Total Returns for the Year-Ended April 30, 2023 |
| Class | Sales Charge | | Inception
Date | One
Year | Since
Inception | Gross
Expense
Ratio1 |
| Class A Shares | Maximum 3.00% Initial Sales Charge | With sales charges | 6/30/2020 | -2.47% | 7.89% | 0.99% |
| | | Excluding sales charges | | 0.54 | 9.06 | 0.99 |
| Class C Shares | Maximum 1.00% CDSC | With sales charges | 6/30/2020 | -1.16 | 8.24 | 1.82 |
| | if redeemed Within One Year of Purchase | Excluding sales charges | | -0.16 | 8.24 | 1.82 |
| Class I Shares | No Sales Charge | | 6/30/2020 | 0.73 | 9.31 | 0.71 |
| Class R3 Shares | No Sales Charge | | 6/30/2020 | 0.18 | 8.69 | 1.34 |
| SIMPLE Class Shares | No Sales Charge | | 8/31/2020 | 0.28 | 5.23 | 1.32 |
| 1. | The gross expense ratios presented reflect the Fund’s “Total Annual Fund Operating Expenses” from the most recent Prospectus, as supplemented, and may differ from other expense ratios disclosed in this report. |
The footnotes on the next page are an integral part of the table and graph and should be carefully read in conjunction with them.
| 72 | MainStay Equity ETF Allocation Fund |
| Benchmark Performance* | One
Year | Since
Inception |
| S&P 500® Index1 | 2.66% | 12.77% |
| MSCI EAFE® Index (Net)2 | 8.42 | 9.43 |
| Equity Allocation Composite Index3 | 4.17 | 12.01 |
| Morningstar Aggressive Allocation Category Average4 | -0.50 | 8.10 |
| * | Returns for indices reflect no deductions for fees, expenses or taxes, except for foreign withholding taxes where applicable. Results assume reinvestment of all dividends and capital gains. An investment cannot be made directly in an index. |
| 1. | The S&P 500® Index is the Fund’s primary broad-based securities market index for comparison purposes. S&P 500® is a trademark of The McGraw-Hill Companies, Inc. The S&P 500® Index is widely regarded as the standard index for measuring large-cap U.S. stock market performance. |
| 2. | The MSCI EAFE® Index (Net) is the Fund's secondary benchmark. The MSCI EAFE® Index (Net) consists of international stocks representing the developed world outside of North America. |
| 3. | The Fund has selected the Equity Allocation Composite Index as an additional benchmark. The Equity Allocation Composite Index consists of the S&P 500® Index and the MSCI EAFE® Index weighted 75% and 25%, respectively. |
| 4. | The Morningstar Aggressive Allocation Category Average is representative of funds in allocation categories that seek to provide both income and capital appreciation by primarily investing in multiple asset classes, including stocks, bonds, and cash. These aggressive strategies typically allocate at least 10% to equities of foreign companies and prioritize capital appreciation over preservation. They typically expect volatility similar to a strategic equity exposure of more than 85%. Results are based on average total returns of similar funds with all dividends and capital gain distributions reinvested. |
The footnotes on the preceding page are an integral part of the table and graph and should be carefully read in conjunction with them.
Cost in Dollars of a $1,000 Investment in MainStay Equity ETF Allocation Fund (Unaudited)
The example below is intended to describe the fees and expenses borne by shareholders during the six-month period from November 1, 2022 to April 30, 2023, and the impact of those costs on your investment.
Example
As a shareholder of the Fund you incur two types of costs: (1) transaction costs, including exchange fees and sales charges (loads) on purchases (as applicable), and (2) ongoing costs, including management fees, distribution and/or service (12b-1) fees and other Fund expenses (as applicable). This example is intended to help you understand your ongoing costs (in dollars) of investing in the Fund and to compare these costs with the ongoing costs of investing in other mutual funds. The example is based on an investment of $1,000 made at the beginning of the six-month period and held for the entire period from November 1, 2022 to April 30, 2023.
This example illustrates your Fund’s ongoing costs in two ways:
Actual Expenses
The second and third data columns in the table below provide information about actual account values and actual expenses. You may use the information in these columns, together with the amount you invested, to estimate the expenses that you paid during the six months ended April 30, 2023. Simply divide your account value by $1,000 (for example, an
$8,600 account value divided by $1,000 = 8.6), then multiply the result by the number under the heading entitled “Expenses Paid During Period” to estimate the expenses you paid on your account during this period.
Hypothetical Example for Comparison Purposes
The fourth and fifth data columns in the table below provide information about hypothetical account values and hypothetical expenses based on the Fund’s actual expense ratio and an assumed rate of return of 5% per year before expenses, which is not the Fund’s actual return. The hypothetical account values and expenses may not be used to estimate the actual ending account balances or expenses you paid for the six-month period shown. You may use this information to compare the ongoing costs of investing in the Fund with the ongoing costs of investing in other mutual funds. To do so, compare this 5% hypothetical example with the 5% hypothetical examples that appear in the shareholder reports of the other mutual funds.
Please note that the expenses shown in the table are meant to highlight your ongoing costs only and do not reflect any transactional costs, such as exchange fees or sales charges (loads). Therefore, the fourth and fifth data columns of the table are useful in comparing ongoing costs only and will not help you determine the relative total costs of owning different funds. In addition, if these transactional costs were included, your costs would have been higher.
| Share Class | Beginning
Account
Value
11/1/22 | Ending Account
Value (Based
on Actual
Returns and
Expenses)
4/30/23 | Expenses
Paid
During
Period1 | Ending Account
Value (Based
on Hypothetical
5% Annualized
Return and
Actual Expenses)
4/30/23 | Expenses
Paid
During
Period1 | Net Expense
Ratio
During
Period2 |
| Class A Shares | $1,000.00 | $1,078.50 | $4.12 | $1,020.83 | $4.01 | 0.80% |
| Class C Shares | $1,000.00 | $1,075.20 | $7.98 | $1,017.11 | $7.75 | 1.55% |
| Class I Shares | $1,000.00 | $1,080.00 | $2.84 | $1,022.07 | $2.76 | 0.55% |
| Class R3 Shares | $1,000.00 | $1,077.60 | $5.92 | $1,019.09 | $5.76 | 1.15% |
| SIMPLE Class Shares | $1,000.00 | $1,077.80 | $5.41 | $1,019.59 | $5.26 | 1.05% |
| 1. | Expenses are equal to the Fund’s annualized expense ratio of each class multiplied by the average account value over the period, divided by 365 and multiplied by 181 (to reflect the six-month period). The table above represents the actual expenses incurred during the six-month period. In addition to the fees and expenses which the Fund bears directly, it also indirectly bears a pro rata share of the fees and expenses of the underlying funds in which it invests. Such indirect expenses are not included in the above-reported expense figures. |
| 2. | Expenses are equal to the Fund's annualized expense ratio to reflect the six-month period. |
| 74 | MainStay Equity ETF Allocation Fund |
Asset Diversification as of April 30, 2023 (Unaudited)
| Equity Funds | 97.8 % |
| Short-Term Investments | 5.4 |
| Other Assets, Less Liabilities | (3.2) |
See Portfolio of Investments beginning on page 78 for specific holdings within these categories. The Fund’s holdings are subject to change.
Portfolio Management Discussion and Analysis (Unaudited)
Questions answered by portfolio managers Jae S. Yoon, CFA, Jonathan Swaney, Poul Kristensen, CFA, and Amit Soni, CFA, of New York Life Investment Management LLC, the Fund’s Manager.
How did MainStay Equity ETF Allocation Fund perform relative to its benchmarks and peer group during the 12 months ended April 30, 2023?
For the 12 months ended April 30, 2023, Class I shares of MainStay Equity ETF Allocation Fund returned 0.73%, underperforming the 2.66% return of the Fund’s primary benchmark, the S&P 500® Index, (the “Index”) and the 8.42% return of the MSCI EAFE® Index (Net), which is the Fund’s secondary benchmark. Over the same period, Class I shares of the Fund underperformed the 4.17% return of the Equity Allocation Composite Index, which is an additional benchmark of the Fund, and outperformed the −0.50% return of the Morningstar Aggressive Allocation Category Average.1
What factors affected the Fund’s relative performance during the reporting period?
The Fund is a “fund of funds" that seeks to achieve its investment objective by investing in unaffiliated, passively-managed, exchange-traded funds (“Underlying ETFs”). The Underlying ETFs may invest in U.S. equities, international equities and fixed-income instruments that span a range of capitalizations and geographies, making comparisons to any single index generally less suitable than a weighted combination of indices, which is a more useful yardstick by which to measure performance. During the reporting period, asset class policy was the primary determinant of the Fund’s relative performance.
Fund management internally maintains a blend of indices that are taken into consideration when managing the Fund. During the reporting period, the Fund’s performance trailed that of the internally maintained blend of indices, largely due to asset class policy decisions, although frictions between the Underlying ETFs that were held and the indices that comprise the Index also played a role. A persistent bias toward small-cap names, expressed through exposure to the S&P SmallCap 600™ Index,2 detracted materially from performance. While relative valuations for small-cap stocks were much more attractive than the historical norm, smaller companies are significantly more sensitive to changes in bank financing conditions than larger companies that can issue bonds. Fast-rising costs on bank loans, coupled with concerns about future credit availability in the wake of the bank crisis that emerged in March and April 2023, weighed heavily on the smaller end of the capitalization spectrum. In contrast, mega-cap technology and technology-related companies—including Microsoft, Apple, Tesla, Meta Platforms and Amazon.com—performed well.
Significantly underweight exposure to non-U.S. developed markets also detracted materially from relative performance. In our estimation, Europe was particularly vulnerable to disruption, owing largely to the Russian invasion of Ukraine and the accompanying strain on energy supplies. An unusually mild winter, however, granted a reprieve, and these markets ultimately performed quite well.
The news was not universally negative, however. Exposure to energy stocks, for example, proved helpful, as gains in the first half of the reporting period more than offset the underperformance experienced during the second half. We believe energy remains a compelling strategic opportunity, particularly among producers and firms that provide extraction services.
How did you allocate the Fund’s assets during the reporting period and why?
Equity style: In the same way that inflation threatens long-duration3 bonds, equities with values disproportionately reflected in more distant cash flows (i.e., growth stocks with high prices relative to current earnings) are likewise vulnerable. Accordingly, the Fund remained tilted to emphasize value stocks that offered more attractive near-term cash flows, placing particular focus on traditionally defensive sectors: real estate, utilities, consumer staples and (most of all) health care. While this positioning made a modest, positive contribution to the Fund’s return during the first half of the reporting period, the opposite was true during the second half; the market performance was dominated by a handful of large, high-growth companies, including NVDIA, Tesla, Apple and others. (Contributions take weightings and total returns into account.)
Equity size: Small-company stocks were more heavily represented in the Fund than in the Index. The thesis behind this positioning was based on attractive small-cap valuations, insulation from economic weakness abroad, less sensitivity to dollar strength and disproportionate exposure to domestic demand, which remained robust. This stance was helpful for much of the reporting period, but reversed abruptly in the spring of 2023 as small companies, which tend to be heavily dependent on bank financing, proved vulnerable to the aggressive, tightening lending standards implemented during the bank crisis mentioned above.
Geographic exposure: Following Russia’s invasion of Ukraine and the energy crisis that provoked, the Fund maintained underweight exposure to developed international markets. However, non-U.S. developed markets fared well during the reporting period, benefiting from both an unusually mild winter that reduced the strain on energy reserves, and the reopening of China following the end of the country’s zero-COVID-19 restrictions.
Energy: The Fund maintained exposure to upstream energy producers and oilfield/gas field service providers as a commodity play to provide an additional inflation hedge. These holdings also positioned the Fund to take advantage of opportunities for domestic producers to benefit as Western nations revisit energy policy to source supplies from stable and friendly jurisdictions rather than autocratic petrostates that present national security risks. While the Fund’s position was small, it had a disproportionately positive impact on performance as oil and gas prices soared during the first half of the reporting period, although some of those gains were later reversed.
| 1. | See "Investment and Performance Comparison" for other share class returns, which may be higher or lower than Class I share returns, and for more information on benchmark and peer group returns. |
| 2. | The S&P SmallCap 600™ Index covers roughly the small-cap range of American stocks, using a capitalization-weighted index. Capitalization range is from $850 million to $3.7 billion. |
| 3. | Duration is a measure of the price sensitivity of a fixed-income investment to changes in interest rates. Duration is expressed as a number of years and is considered a more accurate sensitivity gauge than average maturity. |
| 76 | MainStay Equity ETF Allocation Fund |
How did the Fund’s allocations change over the course of the reporting period?
The Fund added several new holdings during the reporting period. The Fund established a stake in iShares® Core S&P® Mid-Cap ETF, reflecting our favorable view of the mid-cap asset class’s attractive relative valuations and reduced sensitivity to bank lending conditions compared to the small cap universe; the position also offset a reduction in the Fund’s position in Schwab U.S. Mid-Cap ETF. The Fund took a position in The Materials Select Sector SPDR® Fund as a hedge against stubborn inflation, protection against a potentially weakening dollar and as a way to benefit from supply-chain reengineering and the desire of manufacturers to source raw materials from more friendly, reliable geographies. The Fund also initiated a position in iShares® MSCI Japan ETF, since we viewed Japanese equity valuations as attractive, export conditions as favorable and we believe the Japanese yen is likely to appreciate should the country’s central bank further relax, or even abandon, its existing yield curve4 control policy. These positions were funded in large part from Vanguard Mega Cap ETF.
A reduced position in iShares® Core MSCI EAFE ETF reflected the Fund’s shift away from non- U.S. developed equity markets. We also trimmed holdings of Schwab U.S. Small-Cap ETF in response to the ongoing bank crisis.
During the reporting period, which Underlying Equity ETFs had the highest total returns and which Underlying Equity ETFs had the lowest total returns?
Among the Underlying Equity ETFs held for the entire reporting period, top performers included iShares® Core MSCI EAFE ETF, VanEck Oil Services ETF and Health Care Select SPDR® Fund. The lowest total returns were seen in iShares® Core MSCI Emerging Markets ETF, iShares® Core S&P® Small-Cap ETF and Schwab U.S. Small-Cap ETF.
Which Underlying Equity ETFs were the strongest positive contributors to the Fund’s performance and which Underlying Equity ETFs were particularly weak?
Contribution to return is a function not only of Underlying ETF performance and average allocation, but also the variation in that allocation across time. The Underlying Equity ETFs making the largest positive contributions to return included Vanguard Mega Cap ETF, iShares® Core MSCI EAFE ETF and Vanguard Mega Cap Value ETF. The most significant detractors were iShares® Core MSCI Emerging Markets ETF, iShares® Core S&P® Small Cap ETF and The Materials Select Sector SPDR® Fund.
How was the Fund positioned at the end of the reporting period?
As of April 30, 2023, we believe a near-term recession looks highly probable. Our opinion is based on a wide range of variables, including, but not limited to, the shape of the yield curve, trends in business surveys, a decline in money supply, tightening credit conditions and the steady drawdown of savings accumulated during the pandemic. We expect corporate profits to decline over the next several quarters, eventually driving stock prices lower while pushing credit spreads out. Accordingly, we continue to position the Fund defensively.
The Fund favors sectors—such as consumer staples, utilities and healthcare—that have generally exhibited lower volatility and retained their value better during drawdowns. Additionally, the Fund’s bias toward historically higher-beta, small-cap stocks, in place for the past several quarters, has been effectively removed.
Energy stocks tend to be more cyclical. The Fund’s overweight allocation to the sector may seem inconsistent with the otherwise cautious posture of the portfolio, although relative valuation is attractive, and we believe supply/demand dynamics will prove supportive of pricing over time for both the underlying commodities and the stock prices of companies involved in the production, processing and distribution of these resources.
| 4. | The yield curve is a line that plots the yields of various securities of similar quality—typically U.S. Treasury issues—across a range of maturities. The U.S. Treasury yield curve serves as a benchmark for other debt and is used in economic forecasting. |
None of Schwab Strategic Trust, Schwab U.S. Mid-Cap ETF, Schwab U.S. Small Cap ETF or Charles Schwab Investment Management, Inc. make any representations regarding the advisability of investing in MainStay Equity ETF Allocation Fund.
iShares® is a registered trademark of BlackRock (BlackRock, Inc. and its subsidiaries). Neither BlackRock nor the iShares® Funds make any representations regarding the advisability of investing in MainStay Equity ETF Allocation Fund.
The opinions expressed are those of the portfolio managers as of the date of this report and are subject to change. There is no guarantee that any forecasts will come to pass. This material does not constitute investment advice and is not intended as an endorsement of any specific investment.
Portfolio of Investments April 30, 2023†^
| | Shares | | Value |
| Investment Companies 97.8% |
| Equity Funds 97.8% |
| Health Care Select Sector SPDR Fund (a) | 4,200 | | $ 560,826 |
| Invesco S&P 500 Low Volatility ETF | 8,886 | | 568,171 |
| iShares Core MSCI EAFE ETF | 144,183 | | 9,915,465 |
| iShares Core MSCI Emerging Markets ETF | 40,473 | | 1,966,178 |
| iShares Core S&P Mid-Cap ETF | 9,078 | | 2,253,160 |
| iShares Core S&P Small-Cap ETF | 29,724 | | 2,794,056 |
| iShares MSCI Japan ETF (a) | 9,623 | | 566,217 |
| Materials Select Sector SPDR Fund (a) | 6,900 | | 555,795 |
| Schwab U.S. Mid-Cap ETF | 21,873 | | 1,474,459 |
| Schwab U.S. Small-Cap ETF | 164,496 | | 6,773,945 |
| SPDR S&P Oil & Gas Exploration & Production ETF (a) | 4,419 | | 561,699 |
| VanEck Oil Services ETF (a) | 1,000 | | 274,130 |
| Vanguard Mega Cap ETF | 137,283 | | 20,019,981 |
| Vanguard Mega Cap Value ETF (a) | 13,712 | | 1,411,239 |
| Vanguard Mid-Cap ETF | 27,887 | | 5,836,470 |
Total Investment Companies
(Cost $53,587,813) | | | 55,531,791 |
| Short-Term Investments 5.4% |
| Affiliated Investment Company 2.1% |
| MainStay U.S. Government Liquidity Fund, 3.98% (b) | 1,198,896 | | 1,198,896 |
| Unaffiliated Investment Company 3.3% |
| Invesco Government & Agency Portfolio, 4.857% (b)(c) | 1,898,485 | | 1,898,485 |
Total Short-Term Investments
(Cost $3,097,381) | | | 3,097,381 |
Total Investments
(Cost $56,685,194) | 103.2% | | 58,629,172 |
| Other Assets, Less Liabilities | (3.2) | | (1,840,091) |
| Net Assets | 100.0% | | $ 56,789,081 |
| † | Percentages indicated are based on Fund net assets. |
| ^ | Industry classifications may be different than those used for compliance monitoring purposes. |
| (a) | All or a portion of this security was held on loan. As of April 30, 2023, the aggregate market value of securities on loan was $1,860,604. The Fund received cash collateral with a value of $1,898,485. (See Note 2(G)) |
| (b) | Current yield as of April 30, 2023. |
| (c) | Represents a security purchased with cash collateral received for securities on loan. |
The notes to the financial statements are an integral part of, and should be read in conjunction with, the financial statements.
| 78 | MainStay Equity ETF Allocation Fund |
Investments in Affiliates (in 000's)
Investments in issuers considered to be affiliate(s) of the Fund during the year ended April 30, 2023 for purposes of Section 2(a)(3) of the Investment Company Act of 1940, as amended, were as follows:
| Affiliated Investment Companies | Value,
Beginning
of Year | Purchases
at Cost | Proceeds
from
Sales | Net
Realized
Gain/(Loss)
on Sales | Change in
Unrealized
Appreciation/
(Depreciation) | Value,
End of
Year | Dividend
Income | Other
Distributions | Shares
End of
Year |
| MainStay U.S. Government Liquidity Fund | $ 342 | $ 9,342 | $ (8,485) | $ — | $ — | $ 1,199 | $ 12 | $ — | 1,199 |
| Abbreviation(s): |
| EAFE—Europe, Australasia and Far East |
| ETF—Exchange-Traded Fund |
| MSCI—Morgan Stanley Capital International |
| SPDR—Standard & Poor’s Depositary Receipt |
The following is a summary of the fair valuations according to the inputs used as of April 30, 2023, for valuing the Fund’s assets:
| Description | Quoted
Prices in
Active
Markets for
Identical
Assets
(Level 1) | | Significant
Other
Observable
Inputs
(Level 2) | | Significant
Unobservable
Inputs
(Level 3) | | Total |
| Asset Valuation Inputs | | | | | | | |
| Investments in Securities (a) | | | | | | | |
| Investment Companies | | | | | | | |
| Equity Funds | $ 55,531,791 | | $ — | | $ — | | $ 55,531,791 |
| Short-Term Investments | | | | | | | |
| Affiliated Investment Company | 1,198,896 | | — | | — | | 1,198,896 |
| Unaffiliated Investment Company | 1,898,485 | | — | | — | | 1,898,485 |
| Total Short-Term Investments | 3,097,381 | | — | | — | | 3,097,381 |
| Total Investments in Securities | $ 58,629,172 | | $ — | | $ — | | $ 58,629,172 |
| (a) | For a complete listing of investments, see the Portfolio of Investments. |
The notes to the financial statements are an integral part of, and should be read in conjunction with, the financial statements.
79
Statement of Assets and Liabilities as of April 30, 2023
| Assets |
Investment in unaffiliated securities, at value
(identified cost $55,486,298) including securities on loan of $1,860,604 | $57,430,276 |
Investment in affiliated investment companies, at value
(identified cost $1,198,896) | 1,198,896 |
| Receivables: | |
| Fund shares sold | 113,383 |
| Dividends | 3,957 |
| Securities lending | 704 |
| Other assets | 18,368 |
| Total assets | 58,765,584 |
| Liabilities |
| Cash collateral received for securities on loan | 1,898,485 |
| Payables: | |
| Investment securities purchased | 40,309 |
| NYLIFE Distributors (See Note 3) | 13,084 |
| Transfer agent (See Note 3) | 11,844 |
| Custodian | 5,523 |
| Shareholder communication | 4,002 |
| Manager (See Note 3) | 2,666 |
| Professional fees | 326 |
| Fund shares redeemed | 264 |
| Total liabilities | 1,976,503 |
| Net assets | $56,789,081 |
| Composition of Net Assets |
| Shares of beneficial interest outstanding (par value of $.001 per share) unlimited number of shares authorized | $ 4,552 |
| Additional paid-in-capital | 57,702,130 |
| | 57,706,682 |
| Total distributable earnings (loss) | (917,601) |
| Net assets | $56,789,081 |
| Class A | |
| Net assets applicable to outstanding shares | $48,992,195 |
| Shares of beneficial interest outstanding | 3,925,604 |
| Net asset value per share outstanding | $ 12.48 |
| Maximum sales charge (3.00% of offering price) | 0.39 |
| Maximum offering price per share outstanding | $ 12.87 |
| Class C | |
| Net assets applicable to outstanding shares | $ 171,532 |
| Shares of beneficial interest outstanding | 13,825 |
| Net asset value and offering price per share outstanding | $ 12.41 |
| Class I | |
| Net assets applicable to outstanding shares | $ 113,480 |
| Shares of beneficial interest outstanding | 9,148 |
| Net asset value and offering price per share outstanding | $ 12.40 |
| Class R3 | |
| Net assets applicable to outstanding shares | $ 334,134 |
| Shares of beneficial interest outstanding | 26,841 |
| Net asset value and offering price per share outstanding | $ 12.45 |
| SIMPLE Class | |
| Net assets applicable to outstanding shares | $ 7,177,740 |
| Shares of beneficial interest outstanding | 576,557 |
| Net asset value and offering price per share outstanding | $ 12.45 |
The notes to the financial statements are an integral part of, and should be read in conjunction with, the financial statements.
| 80 | MainStay Equity ETF Allocation Fund |
Statement of Operations for the year ended April 30, 2023
| Investment Income (Loss) |
| Income | |
| Dividends-unaffiliated | $ 861,209 |
| Securities lending, net | 21,187 |
| Dividends-affiliated | 12,177 |
| Total income | 894,573 |
| Expenses | |
| Distribution/Service—Class A (See Note 3) | 104,292 |
| Distribution/Service—Class C (See Note 3) | 1,672 |
| Distribution/Service—Class R3 (See Note 3) | 2,252 |
| Distribution/Service—SIMPLE Class (See Note 3) | 24,140 |
| Registration | 104,708 |
| Manager (See Note 3) | 94,581 |
| Transfer agent (See Note 3) | 55,665 |
| Professional fees | 33,740 |
| Custodian | 18,179 |
| Shareholder communication | 8,104 |
| Trustees | 1,103 |
| Shareholder service (See Note 3) | 450 |
| Miscellaneous | 5,101 |
| Total expenses before waiver/reimbursement | 453,987 |
| Expense waiver/reimbursement from Manager (See Note 3) | (61,084) |
| Reimbursement from prior custodian(a) | (103) |
| Net expenses | 392,800 |
| Net investment income (loss) | 501,773 |
| Realized and Unrealized Gain (Loss) |
| Net realized gain (loss) on unaffiliated investments | (2,533,214) |
| Net change in unrealized appreciation (depreciation) on unaffiliated investments | 2,796,287 |
| Net realized and unrealized gain (loss) | 263,073 |
| Net increase (decrease) in net assets resulting from operations | $ 764,846 |
| (a) | Represents a refund for overbilling of custody fees. |
The notes to the financial statements are an integral part of, and should be read in conjunction with, the financial statements.
81
Statements of Changes in Net Assets
for the years ended April 30, 2023 and April 30, 2022
| | 2023 | 2022 |
| Increase (Decrease) in Net Assets |
| Operations: | | |
| Net investment income (loss) | $ 501,773 | $ 363,970 |
| Net realized gain (loss) | (2,533,214) | (332,770) |
| Net change in unrealized appreciation (depreciation) | 2,796,287 | (3,768,943) |
| Net increase (decrease) in net assets resulting from operations | 764,846 | (3,737,743) |
| Distributions to shareholders: | | |
| Class A | (428,787) | (362,336) |
| Class C | (386) | (590) |
| Class I | (1,373) | (2,163) |
| Class R3 | (3,242) | (3,445) |
| SIMPLE Class | (41,309) | (17,161) |
| Total distributions to shareholders | (475,097) | (385,695) |
| Capital share transactions: | | |
| Net proceeds from sales of shares | 21,075,269 | 29,127,682 |
| Net asset value of shares issued to shareholders in reinvestment of distributions | 470,614 | 381,517 |
| Cost of shares redeemed | (6,921,340) | (7,847,877) |
| Increase (decrease) in net assets derived from capital share transactions | 14,624,543 | 21,661,322 |
| Net increase (decrease) in net assets | 14,914,292 | 17,537,884 |
| Net Assets |
| Beginning of year | 41,874,789 | 24,336,905 |
| End of year | $56,789,081 | $41,874,789 |
The notes to the financial statements are an integral part of, and should be read in conjunction with, the financial statements.
| 82 | MainStay Equity ETF Allocation Fund |
Financial Highlights selected per share data and ratios
| | Year Ended April 30, | | June 30, 2020^ through
April 30, |
| Class A | 2023 | | 2022 | | 2021 |
| Net asset value at beginning of period | $ 12.54 | | $ 13.64 | | $ 10.00 |
| Net investment income (loss) (a) | 0.13 | | 0.15 | | 0.07 |
| Net realized and unrealized gain (loss) | (0.07) | | (1.10) | | 3.62 |
| Total from investment operations | 0.06 | | (0.95) | | 3.69 |
| Less distributions: | | | | | |
| From net investment income | (0.12) | | (0.14) | | (0.04) |
| From net realized gain on investments | (0.00)‡ | | (0.01) | | (0.01) |
| Total distributions | (0.12) | | (0.15) | | (0.05) |
| Net asset value at end of period | $ 12.48 | | $ 12.54 | | $ 13.64 |
| Total investment return (b) | 0.54% | | (7.21)% | | 37.04% |
| Ratios (to average net assets)/Supplemental Data: | | | | | |
| Net investment income (loss) | 1.10% | | 1.08% | | 0.63%†† |
| Net expenses (c) | 0.80% | | 0.80% | | 0.80%†† |
| Expenses (before waiver/reimbursement) (c) | 0.92% | | 0.92% | | 1.90%†† |
| Portfolio turnover rate | 35% | | 43% | | 24% |
| Net assets at end of period (in 000’s) | $ 48,992 | | $ 38,162 | | $ 20,221 |
| ^ | Inception date. |
| ‡ | Less than one cent per share. |
| †† | Annualized. |
| (a) | Per share data based on average shares outstanding during the period. |
| (b) | Total investment return is calculated exclusive of sales charges and assumes the reinvestment of dividends and distributions. For periods of less than one year, total return is not annualized. |
| (c) | In addition to the fees and expenses which the Fund bears directly, it also indirectly bears a pro-rata share of the fees and expenses of the underlying funds in which it invests. Such indirect expenses are not included in the above expense ratios. |
The notes to the financial statements are an integral part of, and should be read in conjunction with, the financial statements.
83
Financial Highlights selected per share data and ratios
| | Year Ended April 30, | | June 30, 2020^ through
April 30, |
| Class C | 2023 | | 2022 | | 2021 |
| Net asset value at beginning of period | $ 12.46 | | $ 13.57 | | $ 10.00 |
| Net investment income (loss) (a) | 0.05 | | 0.05 | | (0.02) |
| Net realized and unrealized gain (loss) | (0.07) | | (1.11) | | 3.63 |
| Total from investment operations | (0.02) | | (1.06) | | 3.61 |
| Less distributions: | | | | | |
| From net investment income | (0.03) | | (0.04) | | (0.03) |
| From net realized gain on investments | (0.00)‡ | | (0.01) | | (0.01) |
| Total distributions | (0.03) | | (0.05) | | (0.04) |
| Net asset value at end of period | $ 12.41 | | $ 12.46 | | $ 13.57 |
| Total investment return (b) | (0.16)% | | (7.92)% | | 36.13% |
| Ratios (to average net assets)/Supplemental Data: | | | | | |
| Net investment income (loss) | 0.39% | | 0.38% | | (0.20)%†† |
| Net expenses (c) | 1.55% | | 1.55% | | 1.55%†† |
| Expenses (before waiver/reimbursement) (c) | 1.72% | | 1.75% | | 2.61%†† |
| Portfolio turnover rate | 35% | | 43% | | 24% |
| Net assets at end of period (in 000’s) | $ 172 | | $ 177 | | $ 175 |
| ^ | Inception date. |
| ‡ | Less than one cent per share. |
| †† | Annualized. |
| (a) | Per share data based on average shares outstanding during the period. |
| (b) | Total investment return is calculated exclusive of sales charges and assumes the reinvestment of dividends and distributions. For periods of less than one year, total return is not annualized. |
| (c) | In addition to the fees and expenses which the Fund bears directly, it also indirectly bears a pro-rata share of the fees and expenses of the underlying funds in which it invests. Such indirect expenses are not included in the above expense ratios. |
The notes to the financial statements are an integral part of, and should be read in conjunction with, the financial statements.
| 84 | MainStay Equity ETF Allocation Fund |
Financial Highlights selected per share data and ratios
| | Year Ended April 30, | | June 30, 2020^ through
April 30, |
| Class I | 2023 | | 2022 | | 2021 |
| Net asset value at beginning of period | $ 12.47 | | $ 13.56 | | $ 10.00 |
| Net investment income (loss) (a) | 0.17 | | 0.07 | | 0.08 |
| Net realized and unrealized gain (loss) | (0.09) | | (0.98) | | 3.62 |
| Total from investment operations | 0.08 | | (0.91) | | 3.70 |
| Less distributions: | | | | | |
| From net investment income | (0.15) | | (0.17) | | (0.13) |
| From net realized gain on investments | (0.00)‡ | | (0.01) | | (0.01) |
| Total distributions | (0.15) | | (0.18) | | (0.14) |
| Net asset value at end of period | $ 12.40 | | $ 12.47 | | $ 13.56 |
| Total investment return (b) | 0.73% | | (6.96)% | | 37.30% |
| Ratios (to average net assets)/Supplemental Data: | | | | | |
| Net investment income (loss) | 1.42% | | 0.49% | | 0.80%†† |
| Net expenses (c) | 0.55% | | 0.48% | | 0.55%†† |
| Expenses (before waiver/reimbursement) (c) | 0.67% | | 0.60% | | 1.65%†† |
| Portfolio turnover rate | 35% | | 43% | | 24% |
| Net assets at end of period (in 000’s) | $ 113 | | $ 152 | | $ 2,684 |
| ^ | Inception date. |
| ‡ | Less than one cent per share. |
| †† | Annualized. |
| (a) | Per share data based on average shares outstanding during the period. |
| (b) | Total investment return is calculated exclusive of sales charges and assumes the reinvestment of dividends and distributions. Class I shares are not subject to sales charges. For periods of less than one year, total return is not annualized. |
| (c) | In addition to the fees and expenses which the Fund bears directly, it also indirectly bears a pro-rata share of the fees and expenses of the underlying funds in which it invests. Such indirect expenses are not included in the above expense ratios. |
The notes to the financial statements are an integral part of, and should be read in conjunction with, the financial statements.
85
Financial Highlights selected per share data and ratios
| | Year Ended April 30, | | June 30, 2020^ through
April 30, |
| Class R3 | 2023 | | 2022 | | 2021 |
| Net asset value at beginning of period | $ 12.51 | | $ 13.61 | | $ 10.00 |
| Net investment income (loss) (a) | 0.09 | | 0.10 | | 0.04 |
| Net realized and unrealized gain (loss) | (0.07) | | (1.10) | | 3.62 |
| Total from investment operations | 0.02 | | (1.00) | | 3.66 |
| Less distributions: | | | | | |
| From net investment income | (0.08) | | (0.09) | | (0.04) |
| From net realized gain on investments | (0.00)‡ | | (0.01) | | (0.01) |
| Total distributions | (0.08) | | (0.10) | | (0.05) |
| Net asset value at end of period | $ 12.45 | | $ 12.51 | | $ 13.61 |
| Total investment return (b) | 0.18% | | (7.47)% | | 36.62% |
| Ratios (to average net assets)/Supplemental Data: | | | | | |
| Net investment income (loss) | 0.78% | | 0.74% | | 0.39%†† |
| Net expenses (c) | 1.15% | | 1.15% | | 1.15%†† |
| Expenses (before waiver/reimbursement) (c) | 1.27% | | 1.27% | | 2.25%†† |
| Portfolio turnover rate | 35% | | 43% | | 24% |
| Net assets at end of period (in 000’s) | $ 334 | | $ 472 | | $ 445 |
| ^ | Inception date. |
| ‡ | Less than one cent per share. |
| †† | Annualized. |
| (a) | Per share data based on average shares outstanding during the period. |
| (b) | Total investment return is calculated exclusive of sales charges and assumes the reinvestment of dividends and distributions. Class R3 shares are not subject to sales charges. For periods of less than one year, total return is not annualized. |
| (c) | In addition to the fees and expenses which the Fund bears directly, it also indirectly bears a pro-rata share of the fees and expenses of the underlying funds in which it invests. Such indirect expenses are not included in the above expense ratios. |
The notes to the financial statements are an integral part of, and should be read in conjunction with, the financial statements.
| 86 | MainStay Equity ETF Allocation Fund |
Financial Highlights selected per share data and ratios
| | Year Ended April 30, | | August 31, 2020^ through
April 30, |
| SIMPLE Class | 2023 | | 2022 | | 2021 |
| Net asset value at beginning of period | $ 12.51 | | $ 13.61 | | $ 11.08 |
| Net investment income (loss) (a) | 0.09 | | 0.11 | | 0.06 |
| Net realized and unrealized gain (loss) | (0.06) | | (1.10) | | 2.52 |
| Total from investment operations | 0.03 | | (0.99) | | 2.58 |
| Less distributions: | | | | | |
| From net investment income | (0.09) | | (0.10) | | (0.04) |
| From net realized gain on investments | (0.00)‡ | | (0.01) | | (0.01) |
| Total distributions | (0.09) | | (0.11) | | (0.05) |
| Net asset value at end of period | $ 12.45 | | $ 12.51 | | $ 13.61 |
| Total investment return (b) | 0.28% | | (7.38)% | | 23.32% |
| Ratios (to average net assets)/Supplemental Data: | | | | | |
| Net investment income (loss) | 0.77% | | 0.78% | | 0.51%†† |
| Net expenses (c) | 1.05% | | 1.05% | | 1.05%†† |
| Expenses (before waiver/reimbursement) (c) | 1.22% | | 1.25% | | 2.11%†† |
| Portfolio turnover rate | 35% | | 43% | | 24% |
| Net assets at end of period (in 000’s) | $ 7,178 | | $ 2,911 | | $ 811 |
| ^ | Inception date. |
| ‡ | Less than one cent per share. |
| †† | Annualized. |
| (a) | Per share data based on average shares outstanding during the period. |
| (b) | Total investment return is calculated exclusive of sales charges and assumes the reinvestment of dividends and distributions. SIMPLE Class shares are not subject to sales charges. For periods of less than one year, total return is not annualized. |
| (c) | In addition to the fees and expenses which the Fund bears directly, it also indirectly bears a pro-rata share of the fees and expenses of the underlying funds in which it invests. Such indirect expenses are not included in the above expense ratios. |
The notes to the financial statements are an integral part of, and should be read in conjunction with, the financial statements.
87
MainStay ESG Multi-Asset Allocation Fund
Investment and Performance Comparison (Unaudited)
Performance data quoted represents past performance. Past performance is no guarantee of future results. Because of market volatility and other factors, current performance may be lower or higher than the figures shown. Investment return and principal value will fluctuate, and as a result, when shares are redeemed, they may be worth more or less than their original cost. The graph below depicts the historical performance of Class I shares of the Fund. Performance will vary from class to class based on differences in class-specific expenses and sales charges. For performance information current to the most recent month-end, please call 800-624-6782 or visit newyorklifeinvestments.com.
The performance table and graph do not reflect the deduction of taxes that a shareholder would pay on distributions or Fund share redemptions. Total returns reflect maximum applicable sales charges as indicated in the table below, if any, changes in share price, and reinvestment of dividend and capital gain distributions. The graph assumes the initial investment amount shown below and reflects the deduction of all sales charges that would have applied for the period of investment. Performance figures may reflect certain fee waivers and/or expense limitations, without which total returns may have been lower. For more information on share classes and current fee waivers and/or expense limitations (if any), please refer to the Notes to Financial Statements.

| Average Annual Total Returns for the Year-Ended April 30, 2023 |
| Class | Sales Charge | | Inception
Date | One
Year | Since
Inception | Gross
Expense
Ratio1 |
| Class A Shares | Maximum 3.00% Initial Sales Charge | With sales charges | 9/30/2021 | -2.44% | -6.60% | 2.53% |
| | | Excluding sales charges | | 0.58 | -4.79 | 2.53 |
| Class C Shares | Maximum 1.00% CDSC | With sales charges | 9/30/2021 | -1.19 | -5.50 | 3.28 |
| | if redeemed Within One Year of Purchase | Excluding sales charges | | -0.20 | -5.50 | 3.28 |
| Class I Shares | No Sales Charge | | 9/30/2021 | 0.73 | -4.59 | 2.28 |
| Class R3 Shares | No Sales Charge | | 9/30/2021 | 0.22 | -5.12 | 2.88 |
| SIMPLE Class Shares | No Sales Charge | | 9/30/2021 | 0.31 | -5.05 | 2.78 |
| 1. | The gross expense ratios presented reflect the Fund’s “Total Annual Fund Operating Expenses” from the most recent Prospectus, as supplemented, and may differ from other expense ratios disclosed in this report. |
The footnotes on the next page are an integral part of the table and graph and should be carefully read in conjunction with them.
| 88 | MainStay ESG Multi-Asset Allocation Fund |
| Benchmark Performance* | One
Year | Since
Inception |
| S&P 500® Index1 | 2.66% | -0.47% |
| MSCI EAFE® Index (Net)2 | 8.42 | -1.28 |
| Bloomberg U.S. Aggregate Bond Index3 | -0.43 | -6.36 |
| Multi-Asset Allocation Composite Index4 | 2.58 | -2.68 |
| Morningstar Moderate Allocation Category Average5 | -0.20 | -3.56 |
| * | Returns for indices reflect no deductions for fees, expenses or taxes, except for foreign withholding taxes where applicable. Results assume reinvestment of all dividends and capital gains. An investment cannot be made directly in an index. |
| 1. | The S&P 500® Index is the Fund’s primary broad-based securities market index for comparison purposes. S&P 500® is a trademark of The McGraw-Hill Companies, Inc. The S&P 500® Index is widely regarded as the standard index for measuring large-cap U.S. stock market performance. |
| 2. | The MSCI EAFE® Index (Net) is the Fund's secondary benchmark. The MSCI EAFE® Index (Net) consists of international stocks representing the developed world outside of North America. |
| 3. | The Fund has selected the Bloomberg U.S. Aggregate Bond Index as an additional benchmark. The Bloomberg U.S. Aggregate Bond Index is a broad-based benchmark that measures the performance of the investment grade, U.S. dollar-denominated, fixed-rate taxable bond market, including Treasuries, government-related and corporate securities, mortgage-backed securities (agency fixed-rate and hybrid adjustable rate mortgage pass-throughs), asset-backed securities, and commercial mortgage-backed securities. |
| 4. | The Fund has selected the Multi-Asset Allocation Composite Index as an additional benchmark. The Multi-Asset Allocation Composite Index consists of the S&P 500® Index, the MSCI EAFE® Index (Net) and the Bloomberg U.S. Aggregate Bond Index weighted 45%, 15% and 40%, respectively. |
| 5. | The Morningstar Moderate Allocation Category Average is representative of funds in allocation categories that seek to provide both income and capital appreciation by primarily investing in multiple asset classes, including stocks, bonds, and cash. These moderate strategies seek to balance preservation of capital with appreciation. They typically expect volatility similar to a strategic equity exposure between 50% and 70%. Results are based on average total returns of similar funds with all dividends and capital gain distributions reinvested. |
The footnotes on the preceding page are an integral part of the table and graph and should be carefully read in conjunction with them.
Cost in Dollars of a $1,000 Investment in MainStay ESG Multi-Asset Allocation Fund (Unaudited)
The example below is intended to describe the fees and expenses borne by shareholders during the six-month period from November 1, 2022 to April 30, 2023, and the impact of those costs on your investment.
Example
As a shareholder of the Fund you incur two types of costs: (1) transaction costs, including exchange fees and sales charges (loads) on purchases (as applicable), and (2) ongoing costs, including management fees, distribution and/or service (12b-1) fees and other Fund expenses (as applicable). This example is intended to help you understand your ongoing costs (in dollars) of investing in the Fund and to compare these costs with the ongoing costs of investing in other mutual funds. The example is based on an investment of $1,000 made at the beginning of the six-month period and held for the entire period from November 1, 2022 to April 30, 2023.
This example illustrates your Fund’s ongoing costs in two ways:
Actual Expenses
The second and third data columns in the table below provide information about actual account values and actual expenses. You may use the information in these columns, together with the amount you invested, to estimate the expenses that you paid during the six months ended April 30, 2023. Simply divide your account value by $1,000 (for example, an
$8,600 account value divided by $1,000 = 8.6), then multiply the result by the number under the heading entitled “Expenses Paid During Period” to estimate the expenses you paid on your account during this period.
Hypothetical Example for Comparison Purposes
The fourth and fifth data columns in the table below provide information about hypothetical account values and hypothetical expenses based on the Fund’s actual expense ratio and an assumed rate of return of 5% per year before expenses, which is not the Fund’s actual return. The hypothetical account values and expenses may not be used to estimate the actual ending account balances or expenses you paid for the six-month period shown. You may use this information to compare the ongoing costs of investing in the Fund with the ongoing costs of investing in other mutual funds. To do so, compare this 5% hypothetical example with the 5% hypothetical examples that appear in the shareholder reports of the other mutual funds.
Please note that the expenses shown in the table are meant to highlight your ongoing costs only and do not reflect any transactional costs, such as exchange fees or sales charges (loads). Therefore, the fourth and fifth data columns of the table are useful in comparing ongoing costs only and will not help you determine the relative total costs of owning different funds. In addition, if these transactional costs were included, your costs would have been higher.
| Share Class | Beginning
Account
Value
11/1/22 | Ending Account
Value (Based
on Actual
Returns and
Expenses)
4/30/23 | Expenses
Paid
During
Period1 | Ending Account
Value (Based
on Hypothetical
5% Annualized
Return and
Actual Expenses)
4/30/23 | Expenses
Paid
During
Period1 | Net Expense
Ratio
During
Period2 |
| Class A Shares | $1,000.00 | $1,075.30 | $3.91 | $1,021.03 | $3.81 | 0.76% |
| Class C Shares | $1,000.00 | $1,071.00 | $7.96 | $1,017.11 | $7.75 | 1.55% |
| Class I Shares | $1,000.00 | $1,075.60 | $2.83 | $1,022.07 | $2.76 | 0.55% |
| Class R3 Shares | $1,000.00 | $1,072.80 | $5.91 | $1,019.09 | $5.76 | 1.15% |
| SIMPLE Class Shares | $1,000.00 | $1,072.50 | $5.40 | $1,019.59 | $5.26 | 1.05% |
| 1. | Expenses are equal to the Fund’s annualized expense ratio of each class multiplied by the average account value over the period, divided by 365 and multiplied by 181 (to reflect the six-month period). The table above represents the actual expenses incurred during the six-month period. In addition to the fees and expenses which the Fund bears directly, it also indirectly bears a pro rata share of the fees and expenses of the underlying funds in which it invests. Such indirect expenses are not included in the above-reported expense figures. |
| 2. | Expenses are equal to the Fund's annualized expense ratio to reflect the six-month period. |
| 90 | MainStay ESG Multi-Asset Allocation Fund |
Asset Diversification as of April 30, 2023 (Unaudited)
| Unaffiliated Investment Companies | 85.0 % |
| Affiliated Investment Companies | 5.9 |
| Short-Term Investments | 21.8 |
| Other Assets, Less Liabilities | (12.7) |
See Portfolio of Investments beginning on page 95 for specific holdings within these categories. The Fund’s holdings are subject to change.
Portfolio Management Discussion and Analysis (Unaudited)
Questions answered by portfolio managers Jae S. Yoon, CFA, Jonathan Swaney, Poul Kristensen, CFA, and Amit Soni, CFA, of New York Life Investment Management LLC, the Fund’s Manager.
How did MainStay ESG Multi-Asset Allocation Fund perform relative to its benchmarks and peer group during the 12 months ended April 30, 2023?
For the 12 months ended April 30, 2023, Class I shares of MainStay ESG Multi-Asset Allocation Fund returned 0.73%, underperforming the 2.66% return of the Fund’s primary benchmark, the S&P 500® Index (the “Index”), and the 8.42% return of the MSCI EAFE® Index (Net), which is the Fund’s secondary benchmark. Over the same period, Class I shares of the Fund outperformed the −0.43% return of the Bloomberg U.S. Aggregate Bond Index, and underperformed the 2.58% return of the Multi-Asset Allocation Composite Index, both of which are additional benchmarks of the Fund. For the 12 months ended April 30, 2023, Class I shares outperformed the −0.20% return of the Morningstar Moderate Allocation Category Average.1
What factors affected the Fund’s relative performance during the reporting period?
The Fund is a “fund of funds" that seeks to achieve its investment objective by investing in both affiliated and unaffiliated exchange-traded funds (“Underlying ETFs”) where the consideration of environmental, social and governance (“ESG”) factors is a significant part of the investment strategy and that meet the Fund’s overall investment criteria. The Underlying ETFs may invest in U.S. equities, international equities and fixed-income instruments, making comparisons to any single index generally less suitable than a weighted combination of indices, which is a more useful yardstick by which to measure performance. During the reporting period, asset class policy was the primary determinant of the Fund’s relative performance.
Fund management internally maintains a blend of indices that are taken into consideration when managing the Fund. During the reporting period, the Fund’s performance trailed that of the internally maintained blend of indices, driven mostly by the emphasis placed on ESG factors, as ESG has fallen out of favor of late. Using average returns for ESG-focused funds in the different asset classes included in the Fund, and comparing them to the broad market indices that represent those same asset classes, suggests that the ESG orientation likely detracted almost a full percent from Fund performance over the reporting period. Underperformance during 2022, when traditional energy firms led the market, comes as little surprise. It is more difficult to determine the cause of the continuing shortfall in the first four months of 2023, when large technology-related and consumer discretionary companies outperformed energy producers, although we suspect it may be related to the political environment, with some investors effectively boycotting ESG-branded strategies.
Asset class policy decisions netted out to have little aggregate impact. Management of the stock/bond blend itself proved helpful, as positive returns were generated in the process of controlling the mix. The allocation was held near neutral for much of the reporting period, although capital was added to equities during periods of softness in pricing and removed again as the market recovered. This tactical “buy the dip, sell the rally” practice boosted returns at the margin.
These gains were fully offset by performance within asset classes. A persistent bias toward small-cap names detracted materially from performance. While relative valuations for small-cap stocks were more attractive than the historical norm, smaller companies are significantly more sensitive to changes in bank financing conditions than larger companies that can issue bonds. Fast-rising costs on bank loans, coupled with concerns about future credit availability in the wake of the bank crisis that emerged in March and April 2023, weighed heavily on the smaller end of the capitalization spectrum. In contrast, mega-cap technology and technology-related companies—including Microsoft, Apple, Tesla, Meta Platforms and Amazon.com—performed well.
Underweight exposure to non-US developed markets also detracted materially from relative performance. In our estimation, Europe was particularly vulnerable to disruption, owing in large part to the Russian invasion of Ukraine and the accompanying strain on energy supplies. An unusually mild winter, however, granted a reprieve, and these markets ultimately performed quite well.
On the upside, maintaining a large cash position within the fixed-income portion of the Fund made a substantial positive contribution to performance, as bond yields climbed in response to persistent inflation and aggressive policy tightening by the U.S. Federal Reserve. (Contributions take weightings and total returns into account.)
How did you allocate the Fund’s assets during the reporting period and why?
Stock/bond blend: Equity exposure within the Fund was held relatively close to neutral during the reporting period, with the exception of a modest bias favoring stocks that we implemented tactically in response to swings in pricing (adding on drawdowns and trimming on rallies). We are generally reluctant to position the Fund with underweight equity exposure, as stocks tend to perform well over time and anticipating drawdowns is challenging. The opposite is less true. We are happy to lean into equities when we believe they are well-supported fundamentally or when a correction has run further than we believe appropriate. This strategy worked well during the reporting period, producing a modestly positive contribution to performance. The policy stance
| 1. | See "Investment and Performance Comparison" for other share class returns, which may be higher or lower than Class I share returns, and for more information on benchmark and peer group returns. |
| 92 | MainStay ESG Multi-Asset Allocation Fund |
shifted slightly in 2023, however, when the Fund adopted a small underweight position in equities following a sharp rally in January. We increased this underweight posture later in the reporting period as turmoil among banks increased the likelihood of a near-term recession.
Duration:2 Believing inflationary pressures to be at least partially structural in nature and likely to persist at elevated levels for the foreseeable future, we skewed the Fund’s fixed-income holdings to favor shorter-maturity instruments less sensitive to rising bond yields, although duration was added as yields rose. Over the latter half of the reporting period, duration was slightly shorter than that of the Bloomberg U.S. Aggregate Bond Index.
Equity style: In the same way that inflation threatens long-duration bonds, equities with values disproportionately reflected in more distant cash flows (i.e., growth stocks with high prices relative to current earnings) are likewise vulnerable. Accordingly, the Fund remained tilted to emphasize value stocks that offered more attractive near-term cash flows.
Equity size: Small-company stocks were more heavily represented in the Fund than in the Index. The thesis behind this positioning was based on attractive small-cap valuations, insulation from economic weakness abroad, less sensitivity to dollar strength and disproportionate exposure to domestic demand, which remained robust. This stance was helpful for much of the reporting period, but reversed abruptly in the spring of 2023 as small companies, which tend to be heavily dependent on bank financing, proved vulnerable to the aggressive, tightening lending standards implemented during the bank crisis mentioned above.
Geographic exposure: Following Russia’s invasion of Ukraine and the energy crisis that ensued, the Fund maintained underweight exposure to developed international markets. However, non-U.S. developed markets fared well during the reporting period, benefiting from both an unusually mild winter that reduced the strain on energy reserves, and the reopening of China following the end of the country’s zero-COVID-19 restrictions.
ESG: We seek to find Underlying ETFs with favorable ESG metrics, that carry low expense ratios, offer sufficient liquidity and most effectively capture the return potential of the asset class in which they invest, as evidenced by a low tracking error to a respective market index.
How did the Fund’s allocations change over the course of the reporting period?
Many of the larger shifts in the Fund’s allocations tie back to evolving ESG scores, as we regularly adjust holdings to maintain elevated ESG ratings. For example, a significant reduction in holdings of iShares® ESG Screened S&P 500® ETF was largely
offset by an increased position in SPDR® S&P 500® ESG ETF. At the same time, exiting a position in iShares® ESG Aware U.S. Aggregate Bond ETF was similarly offset by reallocating the assets to iShares® ESG Advanced Total USD Bond Market ETF. While these were large allocation changes, they had little impact on performance, since the Underlying Equity ETFs were quite similar to one another.
In terms of shifts that more directly affect Fund performance, the most consequential involved an accumulation of cash holdings as both equity and fixed income positions were trimmed. We reduced the Fund’s position in Nuveen ESG Small-Cap ETF in response to the ongoing bank crisis and sold shares of iShares® ESG Advanced High Yield Corporate Bond ETF to reduce the Fund’s exposure to lower-credit-quality fixed income instruments ahead of a potentially fast-approaching recession.
During the reporting period, which Underlying Equity ETFs had the highest total returns and which Underlying Equity ETFs had the lowest total returns?
The Fund held few Underlying Equity ETFs for the entire reporting period. Of those that were held, three generated positive returns: iShares® ESG Aware MSCI EAFE ETF, iShares® ESG Screened S&P 500® ETF and IQ Candriam ESG U.S. Large Cap Equity ETF. Those generating losses included Nuveen ESG Mid-Cap Value ETF, iShares® ESG Aware MSCI EM ETF and Nuveen ESG Mid-Cap Growth ETF.
Which Underlying Equity ETFs were the strongest positive contributors to the Fund’s performance and which Underlying Equity ETFs were particularly weak?
Contribution to return is a function not only of Underlying ETF performance and average allocation, but also the variation in that allocation across time. The Underlying Equity ETFs making the largest contributors to returns over the reporting period included iShares® ESG Screened S&P 500® ETF, IQ Candriam ESG U.S. Large Cap Equity ETF and iShares® ESG Aware MSCI EAFE ETF. The most significant detractors were Nuveen ESG Mid-Cap Value ETF, iShares® ESG Aware MSCI EM ETF and Nuveen ESG Small-Cap ETF.
During the reporting period, which Underlying Fixed-Income ETFs had the highest total returns and which Underlying Fixed-Income ETFs had the lowest total returns?
The Underlying Fixed-Income ETFs posting the highest total returns included iShares® ESG Aware 1–5 Year USD Corporate Bond ETF, Vanguard ESG U.S. Corporate Bond ETF and iShares® ESG Advanced High Yield Corporate Bond ETF. The only Underlying Fixed-Income ETF held for the entire reporting period that posted
| 2. | Duration is a measure of the price sensitivity of a fixed-income investment to changes in interest rates. Duration is expressed as a number of years and is considered a more accurate sensitivity gauge than average maturity. |
a loss was iShares® ESG Advanced Total USD Bond ETF. The smallest gain came from Nuveen ESG High Yield Corporate Bond ETF.
Which Underlying Fixed-Income ETFs were the strongest positive contributors to the Fund’s performance and which Underlying Fixed-Income ETFs were particularly weak?
The Underlying Fixed-Income ETFs making the largest contributions to return were iShares® ESG Aware U.S. Aggregate Bond ETF, Vanguard ESG U.S. Corporate Bond ETF and iShares® ESG Advanced High Yield Bond ETF. The only fixed income investment to detract (barely) from absolute performance was Nuveen ESG U.S. Aggregate Bond ETF. The smallest positive contributions came from Nuveen ESG High Yield Corporate Bond ETF and iShares® ESG Aware 1–5 Year USD Corporate Bond ETF.
How was the Fund positioned at the end of the reporting period?
As of April 30, 2023, we believe a near-term recession looks highly probable. Our opinion is based on a wide range of variables, including, but not limited to, the shape of the yield curve,3 trends in business surveys, a decline in money supply, tightening credit conditions and the steady drawdown of savings accumulated during the pandemic. We expect corporate profits to decline over the next several quarters, eventually driving stock prices lower while pushing credit spreads out. Accordingly, we continue to position the Fund defensively.
The Fund’s defensive posture begins at the top of the portfolio, with a modest tilt away from equities. We generally avoid underweight equity allocations, as they usually stand on the wrong side of history—stocks rise more often than not. However, we firmly believe that current valuations are rich given the daunting array of risks the economy and the markets face, including an historically extreme rise in rates, the looming debt ceiling, the unresolved bank crisis and geopolitical uncertainty, to name a few. We maintain that caution is the better part of valor under these circumstances.
Defensive positioning is clearly visible within asset classes as well. On the equity side, the Fund the portfolio shies away from growth stocks, which historically tend to exhibit higher volatility. Additionally, the Fund’s bias toward historically higher-beta, small-cap stocks, in place for the past several quarters, has been
effectively removed. Within fixed income, the Fund now holds a slightly below-Index-weight position in lower-quality credits.
| 3. | The yield curve is a line that plots the yields of various securities of similar quality—typically U.S. Treasury issues—across a range of maturities. The U.S. Treasury yield curve serves as a benchmark for other debt and is used in economic forecasting. |
iShares® is a registered trademark of BlackRock (BlackRock, Inc. and its subsidiaries). Neither BlackRock nor the iShares® Funds make any representations regarding the advisability of investing in MainStay ESG Multi-Asset Allocation Fund.
The opinions expressed are those of the portfolio managers as of the date of this report and are subject to change. There is no guarantee that any forecasts will come to pass. This material does not constitute investment advice and is not intended as an endorsement of any specific investment.
| 94 | MainStay ESG Multi-Asset Allocation Fund |
Portfolio of Investments April 30, 2023†^
| | Shares | Value |
| Affiliated Investment Companies 5.9% |
| Equity Funds 5.9% |
| IQ Candriam ESG International Equity ETF (a) | 13,468 | $ 369,293 |
| IQ Candriam ESG U.S. Large Cap Equity ETF (a) | 9,821 | 350,241 |
Total Affiliated Investment Companies
(Cost $661,191) | | 719,534 |
| Unaffiliated Investment Companies 85.0% |
| Equity Funds 52.0% |
| American Century Sustainable Equity ETF | 8,966 | 464,410 |
| iShares ESG Advanced MSCI EM ETF (a) | 692 | 24,023 |
| iShares ESG Aware MSCI EAFE ETF (a) | 13,430 | 991,000 |
| iShares ESG Aware MSCI EM ETF | 3,018 | 93,890 |
| iShares ESG Aware MSCI USA Small-Cap ETF | 5,753 | 192,725 |
| iShares ESG Screened S&P 500 ETF | 14,951 | 468,005 |
| Nuveen ESG Large-Cap Value ETF (a) | 14,212 | 487,898 |
| Nuveen ESG Mid-Cap Growth ETF | 12,735 | 464,700 |
| Nuveen ESG Mid-Cap Value ETF | 34,797 | 1,002,850 |
| Nuveen ESG Small-Cap ETF (a) | 18,693 | 655,377 |
| SPDR S&P 500 ESG ETF (a) | 38,850 | 1,562,935 |
Total Equity Funds
(Cost $6,507,749) | | 6,407,813 |
| Fixed Income Funds 33.0% |
| iShares ESG Advanced High Yield Corporate Bond ETF (a) | 13,727 | 608,106 |
| iShares ESG Advanced Total USD Bond Market ETF (a) | 37,214 | 1,612,483 |
| iShares ESG Aware 1-5 Year USD Corporate Bond ETF | 19,155 | 462,976 |
| Nuveen ESG High Yield Corporate Bond ETF (a) | 13,297 | 275,713 |
| Nuveen ESG U.S. Aggregate Bond ETF (a) | 24,948 | 558,960 |
| Vanguard ESG U.S. Corporate Bond ETF | 8,618 | 541,393 |
Total Fixed Income Funds
(Cost $4,151,543) | | 4,059,631 |
Total Unaffiliated Investment Companies
(Cost $10,659,292) | | 10,467,444 |
| Short-Term Investments 21.8% |
| Affiliated Investment Company 8.9% |
| MainStay U.S. Government Liquidity Fund, 3.98% (b) | 1,098,637 | 1,098,637 |
| Unaffiliated Investment Companies 12.9% |
| Invesco Government & Agency Portfolio, 4.857% (b)(c) | 1,067,645 | 1,067,645 |
The notes to the financial statements are an integral part of, and should be read in conjunction with, the financial statements.
95
Portfolio of Investments April 30, 2023†^ (continued)
| | Shares | | Value |
| Short-Term Investments (continued) |
| Unaffiliated Investment Companies (continued) |
| RBC U.S. Government Money Market Fund, 4.829% (b)(c) | 523,600 | | $ 523,600 |
Total Unaffiliated Investment Companies
(Cost $1,591,245) | | | 1,591,245 |
Total Short-Term Investments
(Cost $2,689,882) | 21.8% | | 2,689,882 |
Total Investments
(Cost $14,010,365) | 112.7% | | 13,876,860 |
| Other Assets, Less Liabilities | (12.7) | | (1,560,364) |
| Net Assets | 100.0% | | $ 12,316,496 |
| † | Percentages indicated are based on Fund net assets. |
| ^ | Industry classifications may be different than those used for compliance monitoring purposes. |
| (a) | All or a portion of this security was held on loan. As of April 30, 2023, the aggregate market value of securities on loan was $1,585,213; the total market value of collateral held by the Fund was $1,610,479. The market value of the collateral held included non-cash collateral in the form of U.S. Treasury securities with a value of $19,234. The Fund received cash collateral with a value of $1,591,245. (See Note 2(G)) |
| (b) | Current yield as of April 30, 2023. |
| (c) | Represents a security purchased with cash collateral received for securities on loan. |
Investments in Affiliates (in 000's)
Investments in issuers considered to be affiliate(s) of the Fund during the year ended April 30, 2023 for purposes of Section 2(a)(3) of the Investment Company Act of 1940, as amended, were as follows:
| Affiliated Investment Companies | Value,
Beginning
of Year | Purchases
at Cost | Proceeds
from
Sales | Net
Realized
Gain/(Loss)
on Sales | Change in
Unrealized
Appreciation/
(Depreciation) | Value,
End of
Year | Dividend
Income | Other
Distributions | Shares
End of
Year |
| IQ Candriam ESG International Equity ETF | $ 152 | $ 342 | $ (147) | $ (19) | $ 41 | $ 369 | $ 2 | $ — | 13 |
| IQ Candriam ESG U.S. Large Cap Equity ETF (a) | 73 | 1,767 | (1,536) | 9 | 37 | 350 | 11 | — | 10 |
| MainStay U.S. Government Liquidity Fund | 362 | 7,119 | (6,382) | — | — | 1,099 | 20 | — | 1,099 |
| | $ 587 | $9,228 | $(8,065) | $ (10) | $ 78 | $1,818 | $ 33 | $ — | |
| | |
| (a) | Prior to August 31, 2022, known as IQ Candriam ESG U.S. Equity ETF. |
| Abbreviation(s): |
| EAFE—Europe, Australasia and Far East |
| EM—Emerging Markets |
| ETF—Exchange-Traded Fund |
| MSCI—Morgan Stanley Capital International |
| SPDR—Standard & Poor’s Depositary Receipt |
| USD—United States Dollar |
The notes to the financial statements are an integral part of, and should be read in conjunction with, the financial statements.
| 96 | MainStay ESG Multi-Asset Allocation Fund |
The following is a summary of the fair valuations according to the inputs used as of April 30, 2023, for valuing the Fund’s assets:
| Description | Quoted
Prices in
Active
Markets for
Identical
Assets
(Level 1) | | Significant
Other
Observable
Inputs
(Level 2) | | Significant
Unobservable
Inputs
(Level 3) | | Total |
| Asset Valuation Inputs | | | | | | | |
| Investments in Securities (a) | | | | | | | |
| Affiliated Investment Companies | | | | | | | |
| Equity Funds | $ 719,534 | | $ — | | $ — | | $ 719,534 |
| Unaffiliated Investment Companies | | | | | | | |
| Equity Funds | 6,407,813 | | — | | — | | 6,407,813 |
| Fixed Income Funds | 4,059,631 | | — | | — | | 4,059,631 |
| Total Unaffiliated Investment Companies | 10,467,444 | | — | | — | | 10,467,444 |
| Short-Term Investments | | | | | | | |
| Affiliated Investment Company | 1,098,637 | | — | | — | | 1,098,637 |
| Unaffiliated Investment Companies | 1,591,245 | | — | | — | | 1,591,245 |
| Total Short-Term Investments | 2,689,882 | | — | | — | | 2,689,882 |
| Total Investments in Securities | $ 13,876,860 | | $ — | | $ — | | $ 13,876,860 |
| (a) | For a complete listing of investments, see the Portfolio of Investments. |
The notes to the financial statements are an integral part of, and should be read in conjunction with, the financial statements.
97
Statement of Assets and Liabilities as of April 30, 2023
| Assets |
Investment in unaffiliated securities, at value
(identified cost $12,250,537) including securities on loan of $1,585,213 | $12,058,689 |
Investment in affiliated investment companies, at value
(identified cost $1,759,828) | 1,818,171 |
| Receivables: | |
| Manager (See Note 3) | 14,496 |
| Securities lending | 6,301 |
| Dividends | 3,358 |
| Fund shares sold | 550 |
| Other assets | 31,127 |
| Total assets | 13,932,692 |
| Liabilities |
| Cash collateral received for securities on loan | 1,591,245 |
| Payables: | |
| Transfer agent (See Note 3) | 13,025 |
| Custodian | 5,622 |
| Shareholder communication | 5,307 |
| NYLIFE Distributors (See Note 3) | 704 |
| Professional fees | 293 |
| Total liabilities | 1,616,196 |
| Net assets | $12,316,496 |
| Composition of Net Assets |
| Shares of beneficial interest outstanding (par value of $.001 per share) unlimited number of shares authorized | $ 1,385 |
| Additional paid-in-capital | 13,538,134 |
| | 13,539,519 |
| Total distributable earnings (loss) | (1,223,023) |
| Net assets | $12,316,496 |
| Class A | |
| Net assets applicable to outstanding shares | $2,747,011 |
| Shares of beneficial interest outstanding | 308,993 |
| Net asset value per share outstanding | $ 8.89 |
| Maximum sales charge (3.00% of offering price) | 0.27 |
| Maximum offering price per share outstanding | $ 9.16 |
| Class C | |
| Net assets applicable to outstanding shares | $ 22,861 |
| Shares of beneficial interest outstanding | 2,577 |
| Net asset value and offering price per share outstanding | $ 8.87 |
| Class I | |
| Net assets applicable to outstanding shares | $9,209,183 |
| Shares of beneficial interest outstanding | 1,035,317 |
| Net asset value and offering price per share outstanding | $ 8.90 |
| Class R3 | |
| Net assets applicable to outstanding shares | $ 64,350 |
| Shares of beneficial interest outstanding | 7,245 |
| Net asset value and offering price per share outstanding | $ 8.88 |
| SIMPLE Class | |
| Net assets applicable to outstanding shares | $ 273,091 |
| Shares of beneficial interest outstanding | 30,742 |
| Net asset value and offering price per share outstanding | $ 8.88 |
The notes to the financial statements are an integral part of, and should be read in conjunction with, the financial statements.
| 98 | MainStay ESG Multi-Asset Allocation Fund |
Statement of Operations for the year ended April 30, 2023
| Investment Income (Loss) |
| Income | |
| Dividends-unaffiliated | $ 225,289 |
| Securities lending, net | 48,817 |
| Dividends-affiliated | 32,926 |
| Total income | 307,032 |
| Expenses | |
| Registration | 51,828 |
| Offering (See Note 2) | 44,673 |
| Professional fees | 30,139 |
| Manager (See Note 3) | 22,238 |
| Custodian | 15,645 |
| Distribution/Service—Class A (See Note 3) | 5,018 |
| Distribution/Service—Class C (See Note 3) | 222 |
| Distribution/Service—Class R3 (See Note 3) | 195 |
| Distribution/Service—SIMPLE Class (See Note 3) | 807 |
| Shareholder communication | 6,180 |
| Transfer agent (See Note 3) | 2,361 |
| Trustees | 103 |
| Shareholder service (See Note 3) | 39 |
| Miscellaneous | 3,706 |
| Total expenses before waiver/reimbursement | 183,154 |
| Expense waiver/reimbursement from Manager (See Note 3) | (116,244) |
| Reimbursement from prior custodian(a) | (23) |
| Net expenses | 66,887 |
| Net investment income (loss) | 240,145 |
| Realized and Unrealized Gain (Loss) |
| Net realized gain (loss) on: | |
| Unaffiliated investments | (861,974) |
| Affiliated investments | (10,126) |
| Net realized gain (loss) | (872,100) |
| Net change in unrealized appreciation (depreciation) on: | |
| Unaffiliated investments | 703,557 |
| Affiliated investments | 77,613 |
| Net change in unrealized appreciation (depreciation) | 781,170 |
| Net realized and unrealized gain (loss) | (90,930) |
| Net increase (decrease) in net assets resulting from operations | $ 149,215 |
| (a) | Represents a refund for overbilling of custody fees. |
The notes to the financial statements are an integral part of, and should be read in conjunction with, the financial statements.
99
Statements of Changes in Net Assets
for the year ended April 30, 2023 and the period September 30, 2021 (inception date) through April 30, 2022
| | 2023 | 2022 |
| Increase (Decrease) in Net Assets |
| Operations: | | |
| Net investment income (loss) | $ 240,145 | $ 82,549 |
| Net realized gain (loss) | (872,100) | (66,802) |
| Net change in unrealized appreciation (depreciation) | 781,170 | (914,675) |
| Net increase (decrease) in net assets resulting from operations | 149,215 | (898,928) |
| Distributions to shareholders: | | |
| Class A | (33,195) | (18,787) |
| Class C | (152) | (605) |
| Class I | (151,197) | (265,161) |
| Class R3 | (423) | (1,096) |
| SIMPLE Class | (2,415) | (637) |
| Total distributions to shareholders | (187,382) | (286,286) |
| Capital share transactions: | | |
| Net proceeds from sales of shares | 1,918,429 | 11,393,208 |
| Net asset value of shares issued to shareholders in reinvestment of distributions | 187,382 | 286,286 |
| Cost of shares redeemed | (183,624) | (61,804) |
| Increase (decrease) in net assets derived from capital share transactions | 1,922,187 | 11,617,690 |
| Net increase (decrease) in net assets | 1,884,020 | 10,432,476 |
| Net Assets |
| Beginning of year | 10,432,476 | — |
| End of year | $12,316,496 | $10,432,476 |
The notes to the financial statements are an integral part of, and should be read in conjunction with, the financial statements.
| 100 | MainStay ESG Multi-Asset Allocation Fund |
Financial Highlights selected per share data and ratios
| | Year Ended April 30, | | September 30, 2021^ through
April 30, |
| Class A | 2023 | | 2022 |
| Net asset value at beginning of period | $ 8.97 | | $ 10.00 |
| Net investment income (loss) (a) | 0.18 | | 0.05 |
| Net realized and unrealized gain (loss) | (0.13) | | (0.82) |
| Total from investment operations | 0.05 | | (0.77) |
| Less distributions: | | | |
| From net investment income | (0.13) | | (0.26) |
| From net realized gain on investments | — | | (0.00)‡ |
| Net asset value at end of period | $ 8.89 | | $ 8.97 |
| Total investment return (b) | 0.58% | | (7.99)% |
| Ratios (to average net assets)/Supplemental Data: | | | |
| Net investment income (loss) | 2.06% | | 0.93%†† |
| Net expenses (c) | 0.77% | | 0.80%†† |
| Expenses (before waiver/reimbursement) (c) | 1.82% | | 2.40%†† |
| Portfolio turnover rate | 142% | | 70% |
| Net assets at end of period (in 000’s) | $ 2,747 | | $ 1,161 |
| ^ | Inception date. |
| ‡ | Less than one cent per share. |
| †† | Annualized. |
| (a) | Per share data based on average shares outstanding during the period. |
| (b) | Total investment return is calculated exclusive of sales charges and assumes the reinvestment of dividends and distributions. For periods of less than one year, total return is not annualized. |
| (c) | In addition to the fees and expenses which the Fund bears directly, it also indirectly bears a pro-rata share of the fees and expenses of the underlying funds in which it invests. Such indirect expenses are not included in the above expense ratios. |
| | Year Ended April 30, | | September 30, 2021^ through
April 30, |
| Class C | 2023 | | 2022 |
| Net asset value at beginning of period | $ 8.95 | | $ 10.00 |
| Net investment income (loss) (a) | 0.10 | | 0.02 |
| Net realized and unrealized gain (loss) | (0.12) | | (0.83) |
| Total from investment operations | (0.02) | | (0.81) |
| Less distributions: | | | |
| From net investment income | (0.06) | | (0.24) |
| From net realized gain on investments | — | | (0.00)‡ |
| Net asset value at end of period | $ 8.87 | | $ 8.95 |
| Total investment return (b) | (0.20)% | | (8.37)% |
| Ratios (to average net assets)/Supplemental Data: | | | |
| Net investment income (loss) | 1.20% | | 0.36%†† |
| Net expenses (c) | 1.55% | | 1.55%†† |
| Expenses (before waiver/reimbursement) (c) | 2.70% | | 3.15%†† |
| Portfolio turnover rate | 142% | | 70% |
| Net assets at end of period (in 000’s) | $ 23 | | $ 23 |
| ^ | Inception date. |
| ‡ | Less than one cent per share. |
| †† | Annualized. |
| (a) | Per share data based on average shares outstanding during the period. |
| (b) | Total investment return is calculated exclusive of sales charges and assumes the reinvestment of dividends and distributions. For periods of less than one year, total return is not annualized. |
| (c) | In addition to the fees and expenses which the Fund bears directly, it also indirectly bears a pro-rata share of the fees and expenses of the underlying funds in which it invests. Such indirect expenses are not included in the above expense ratios. |
The notes to the financial statements are an integral part of, and should be read in conjunction with, the financial statements.
101
Financial Highlights selected per share data and ratios
| | Year Ended April 30, | | September 30, 2021^ through
April 30, |
| Class I | 2023 | | 2022 |
| Net asset value at beginning of period | $ 8.98 | | $ 10.00 |
| Net investment income (loss) (a) | 0.19 | | 0.08 |
| Net realized and unrealized gain (loss) | (0.12) | | (0.84) |
| Total from investment operations | 0.07 | | (0.76) |
| Less distributions: | | | |
| From net investment income | (0.15) | | (0.26) |
| From net realized gain on investments | — | | (0.00)‡ |
| Net asset value at end of period | $ 8.90 | | $ 8.98 |
| Total investment return (b) | 0.73% | | (7.83)% |
| Ratios (to average net assets)/Supplemental Data: | | | |
| Net investment income (loss) | 2.19% | | 1.36%†† |
| Net expenses (c) | 0.55% | | 0.55%†† |
| Expenses (before waiver/reimbursement) (c) | 1.59% | | 2.15%†† |
| Portfolio turnover rate | 142% | | 70% |
| Net assets at end of period (in 000’s) | $ 9,209 | | $ 9,135 |
| ^ | Inception date. |
| ‡ | Less than one cent per share. |
| †† | Annualized. |
| (a) | Per share data based on average shares outstanding during the period. |
| (b) | Total investment return is calculated exclusive of sales charges and assumes the reinvestment of dividends and distributions. Class I shares are not subject to sales charges. For periods of less than one year, total return is not annualized. |
| (c) | In addition to the fees and expenses which the Fund bears directly, it also indirectly bears a pro-rata share of the fees and expenses of the underlying funds in which it invests. Such indirect expenses are not included in the above expense ratios. |
| | Year Ended April 30, | | September 30, 2021^ through
April 30, |
| Class R3 | 2023 | | 2022 |
| Net asset value at beginning of period | $ 8.96 | | $ 10.00 |
| Net investment income (loss) (a) | 0.14 | | 0.03 |
| Net realized and unrealized gain (loss) | (0.12) | | (0.82) |
| Total from investment operations | 0.02 | | (0.79) |
| Less distributions: | | | |
| From net investment income | (0.10) | | (0.25) |
| From net realized gain on investments | — | | (0.00)‡ |
| Net asset value at end of period | $ 8.88 | | $ 8.96 |
| Total investment return (b) | 0.22% | | (8.17)% |
| Ratios (to average net assets)/Supplemental Data: | | | |
| Net investment income (loss) | 1.58% | | 0.52%†† |
| Net expenses (c) | 1.15% | | 1.15%†† |
| Expenses (before waiver/reimbursement) (c) | 2.20% | | 2.75%†† |
| Portfolio turnover rate | 142% | | 70% |
| Net assets at end of period (in 000’s) | $ 64 | | $ 40 |
| ^ | Inception date. |
| ‡ | Less than one cent per share. |
| †† | Annualized. |
| (a) | Per share data based on average shares outstanding during the period. |
| (b) | Total investment return is calculated exclusive of sales charges and assumes the reinvestment of dividends and distributions. Class R3 shares are not subject to sales charges. For periods of less than one year, total return is not annualized. |
| (c) | In addition to the fees and expenses which the Fund bears directly, it also indirectly bears a pro-rata share of the fees and expenses of the underlying funds in which it invests. Such indirect expenses are not included in the above expense ratios. |
The notes to the financial statements are an integral part of, and should be read in conjunction with, the financial statements.
| 102 | MainStay ESG Multi-Asset Allocation Fund |
Financial Highlights selected per share data and ratios
| | Year Ended April 30, | | September 30, 2021^ through
April 30, |
| SIMPLE Class | 2023 | | 2022 |
| Net asset value at beginning of period | $ 8.96 | | $ 10.00 |
| Net investment income (loss) (a) | 0.15 | | 0.03 |
| Net realized and unrealized gain (loss) | (0.13) | | (0.82) |
| Total from investment operations | 0.02 | | (0.79) |
| Less distributions: | | | |
| From net investment income | (0.10) | | (0.25) |
| From net realized gain on investments | — | | (0.00)‡ |
| Net asset value at end of period | $ 8.88 | | $ 8.96 |
| Total investment return (b) | 0.31% | | (8.15)% |
| Ratios (to average net assets)/Supplemental Data: | | | |
| Net investment income (loss) | 1.75% | | 0.57%†† |
| Net expenses (c) | 1.05% | | 1.05%†† |
| Expenses (before waiver/reimbursement) (c) | 2.20% | | 2.65%†† |
| Portfolio turnover rate | 142% | | 70% |
| Net assets at end of period (in 000’s) | $ 273 | | $ 74 |
| ^ | Inception date. |
| ‡ | Less than one cent per share. |
| †† | Annualized. |
| (a) | Per share data based on average shares outstanding during the period. |
| (b) | Total investment return is calculated exclusive of sales charges and assumes the reinvestment of dividends and distributions. SIMPLE Class shares are not subject to sales charges. For periods of less than one year, total return is not annualized. |
| (c) | In addition to the fees and expenses which the Fund bears directly, it also indirectly bears a pro-rata share of the fees and expenses of the underlying funds in which it invests. Such indirect expenses are not included in the above expense ratios. |
The notes to the financial statements are an integral part of, and should be read in conjunction with, the financial statements.
103
Notes to Financial Statements
Note 1-Organization and Business
MainStay Funds Trust (the “Trust”) was organized as a Delaware statutory trust on April 28, 2009. The Trust is registered under the Investment Company Act of 1940, as amended (the “1940 Act”), as an open-end management investment company, and is comprised of thirty-three funds (collectively referred to as the “Funds” and each individually, referred to as a “Fund"). These financial statements and notes relate to the MainStay Defensive ETF Allocation Fund, MainStay Conservative ETF Allocation Fund, MainStay Moderate ETF Allocation Fund, MainStay Growth ETF Allocation Fund, MainStay Equity ETF Allocation Fund and MainStay ESG Multi-Asset Allocation Fund (commenced operations September 30, 2021) (collectively referred to as the "ETF Allocation Funds" and each individually referred to as an "ETF Allocation Fund"). Each is a “diversified” fund, as that term is defined in the 1940 Act, as interpreted or modified by regulatory authorities having jurisdiction, from time to time.
The following table lists each ETF Allocation Fund's share classes that have been registered and commenced operations:
| Fund | Share Classes Commenced Operations1 |
| MainStay Defensive ETF Allocation Fund | Class A, Class C, Class I, Class R3, SIMPLE Class |
| MainStay Conservative ETF Allocation Fund | Class A, Class C, Class I, Class R3, SIMPLE Class |
| MainStay Moderate ETF Allocation Fund | Class A, Class C, Class I, Class R3, SIMPLE Class |
| MainStay Growth ETF Allocation Fund | Class A, Class C, Class I, Class R3, SIMPLE Class |
| MainStay Equity ETF Allocation Fund | Class A, Class C, Class I, Class R3, SIMPLE Class |
| MainStay ESG Multi-Asset Allocation Fund | Class A, Class C, Class I, Class R3, SIMPLE Class |
| 1. | For each ETF Allocation Fund, other than MainStay ESG Multi-Asset Allocation Fund, Investor Class and Class R6 shares were registered for sale as of June 30, 2020, but as of April 30, 2023 were not yet offered for sale. For MainStay ESG Multi-Asset Allocation Fund, Investor Class and Class R6 shares were registered for sale as of September 30, 2021, but as of April 30, 2023 were not yet offered for sale. |
Class A shares are offered at net asset value (“NAV”) per share plus an initial sales charge. No initial sales charge applies to investments of $250,000 or more (and certain other qualified purchases) in Class A shares. However, a contingent deferred sales charge (“CDSC”) of 0.50% may be imposed on certain redemptions made within 18 months of the date of purchase on shares that were purchased without an initial sales charge. Class C shares are offered at NAV without an initial sales charge, although a CDSC of 1.00% may be imposed on certain redemptions of such shares made within one year of the date of purchase of Class C shares. Class I, Class R3 and SIMPLE Class shares are offered at NAV without a sales charge. Depending upon eligibility, Class C shares convert to Class A shares at the end of the calendar quarter eight years after the date they were purchased. SIMPLE Class shares convert to Class A shares, or Investor Class shares if you are not eligible to hold Class A shares, at the end of the calendar quarter, ten years after the date they were purchased. Share class conversions are based on the relevant NAVs of the two classes at the time of the conversion, and no sales load or
other charge is imposed. Under certain circumstances and as may be permitted by the Trust’s multiple class plan pursuant to Rule 18f-3 under the 1940 Act, specified share classes of an ETF Allocation Fund may be converted to one or more other share classes of the ETF Allocation Fund as disclosed in the capital share transactions within these Notes. The classes of shares have the same voting (except for issues that relate solely to one class), dividend, liquidation and other rights, and the same terms and conditions, except that under distribution plans pursuant to Rule 12b-1 under the 1940 Act, Class C shares are subject to higher distribution and/or service fees than Class A, Class R3 and SIMPLE Class shares. Class I shares are not subject to a distribution and/or service fee. Class R3 shares are subject to a shareholder service fee, which is in addition to fees paid under the distribution plans for Class R3 shares.
The investment objective for each of the ETF Allocation Funds is as follows:
The MainStay Defensive ETF Allocation Fund seeks current income.
The MainStay Conservative ETF Allocation Fund seeks current income and, secondarily, long-term growth of capital.
The MainStay Moderate ETF Allocation Fund seeks long-term growth of capital and, secondarily, current income.
The MainStay Growth ETF Allocation Fund seeks long-term growth of capital and, secondarily, current income.
The MainStay Equity ETF Allocation Fund seeks long-term growth of capital.
The MainStay ESG Multi-Asset Allocation Fund seeks long-term growth of capital and, secondarily, current income.
The ETF Allocation Funds are "funds-of-funds" that seek to achieve their investment objectives by investing in passively-managed exchange-traded funds (the “Underlying ETFs”).
Note 2–Significant Accounting Policies
The ETF Allocation Funds are investment companies and accordingly follow the investment company accounting and reporting guidance of the Financial Accounting Standards Board (“FASB”) Accounting Standards Codification Topic 946 Financial Services—Investment Companies. The ETF Allocation Funds prepare their financial statements in accordance with generally accepted accounting principles (“GAAP”) in the United States of America and follow the significant accounting policies described below.
(A) Securities Valuation. Investments are usually valued as of the close of regular trading on the New York Stock Exchange (the "Exchange") (usually 4:00 p.m. Eastern time) on each day the ETF Allocation Funds are open for business ("valuation date").
Pursuant to Rule 2a-5 under the 1940 Act, the Board of Trustees of the Trust (the "Board") has designated New York Life Investment Management LLC (“New York Life Investments” or the "Manager") as its
| 104 | Mainstay ETF Asset Allocation Funds |
Valuation Designee (the "Valuation Designee"). The Valuation Designee is responsible for performing fair valuations relating to all investments in each ETF Allocation Fund’s portfolio for which market quotations are not readily available; periodically assessing and managing material valuation risks; establishing and applying fair value methodologies; testing fair valuation methodologies; evaluating and overseeing pricing services; ensuring appropriate segregation of valuation and portfolio management functions; providing quarterly, annual and prompt reporting to the Board, as appropriate; identifying potential conflicts of interest; and maintaining appropriate records. The Valuation Designee has established a valuation committee ("Valuation Committee") to assist in carrying out the Valuation Designee’s responsibilities and establish prices of securities for which market quotations are not readily available. The ETF Allocation Funds' and the Valuation Designee's policies and procedures ("Valuation Procedures") govern the Valuation Designee’s selection and application of methodologies for determining and calculating the fair value of ETF Allocation Fund investments. The Valuation Designee may value the ETF Allocation Funds' portfolio securities for which market quotations are not readily available and other ETF Allocation Fund assets utilizing inputs from pricing services and other third-party sources. The Valuation Committee meets (in person, via electronic mail or via teleconference) on an ad-hoc basis to determine fair valuations and on a quarterly basis to review fair value events with respect to certain securities for which market quotations are not readily available, including valuation risks and back-testing results, and preview reports to the Board.
The Valuation Committee establishes prices of securities for which market quotations are not readily available based on such methodologies and measurements on a regular basis after considering information that is reasonably available and deemed relevant by the Valuation Committee. The Board shall oversee the Valuation Designee and review fair valuation materials on a prompt, quarterly and annual basis and approve proposed revisions to the Valuation Procedures.
Investments for which market quotations are not readily available are valued at fair value as determined in good faith pursuant to the Valuation Procedures. A market quotation is readily available only when that quotation is a quoted price (unadjusted) in active markets for identical investments that each ETF Allocation Fund can access at the measurement date, provided that a quotation will not be readily available if it is not reliable. "Fair value" is defined as the price the ETF Allocation Fund would reasonably expect to receive upon selling an asset or liability in an orderly transaction to an independent buyer in the principal or most advantageous market for the asset or liability. Fair value measurements are determined within a framework that establishes a three-tier hierarchy that maximizes the use of observable market data and minimizes the use of unobservable inputs to establish a classification of fair value measurements for disclosure purposes. "Inputs" refer broadly to the assumptions that market participants would use in pricing the asset or liability, including assumptions about risk, such as the risk inherent in a particular valuation technique used to measure fair value using a pricing model and/or the risk inherent in the inputs for the valuation technique. Inputs may be observable or unobservable. Observable inputs reflect the
assumptions market participants would use in pricing the asset or liability based on market data obtained from sources independent of each ETF Allocation Fund. Unobservable inputs reflect each ETF Allocation Fund’s own assumptions about the assumptions market participants would use in pricing the asset or liability based on the information available. The inputs or methodology used for valuing assets or liabilities may not be an indication of the risks associated with investing in those assets or liabilities. The three-tier hierarchy of inputs is summarized below.
| • | Level 1—quoted prices (unadjusted) in active markets for an identical asset or liability |
| • | Level 2—other significant observable inputs (including quoted prices for a similar asset or liability in active markets, interest rates and yield curves, prepayment speeds, credit risk, etc.) |
| • | Level 3—significant unobservable inputs (including each ETF Allocation Fund's own assumptions about the assumptions that market participants would use in measuring fair value of an asset or liability) |
The level of an asset or liability within the fair value hierarchy is based on the lowest level of an input, both individually and in the aggregate, that is significant to the fair value measurement. The aggregate value by input level of each ETF Allocation Fund’s assets and liabilities as of April 30, 2023, is included at the end of each ETF Allocation Fund’s Portfolio of Investments.
Exchange-traded funds (“ETFs”) are valued at the last quoted sales prices as of the close of regular trading on the relevant exchange on each valuation date. Securities that are not traded on the valuation date are valued at the mean of the last quoted bid and ask prices. Prices are normally taken from the principal market in which each security trades. These securities are generally categorized as Level 1 in the hierarchy.
Investments in mutual funds, including money market funds, are valued at their respective NAVs at the close of business each day on the valuation date. These securities are generally categorized as Level 1 in the hierarchy.
Temporary cash investments acquired in excess of 60 days to maturity at the time of purchase are valued using the latest bid prices or using valuations based on a matrix system (which considers such factors as security prices, yields, maturities and ratings), both as furnished by independent pricing services. Temporary cash investments that mature in 60 days or less at the time of purchase ("Short-Term Investments") are valued using the amortized cost method of valuation, unless the use of such method would be inappropriate. The amortized cost method involves valuing a security at its cost on the date of purchase and thereafter assuming a constant amortization to maturity of the difference between such cost and the value on maturity date. Amortized cost approximates the current fair value of a security. Securities valued using the amortized cost method are not valued using quoted prices in an active market and are generally categorized as Level 2 in the hierarchy.
The information above is not intended to reflect an exhaustive list of the methodologies that may be used to value portfolio investments. The
Notes to Financial Statements (continued)
Valuation Procedures permit the use of a variety of valuation methodologies in connection with valuing portfolio investments. The methodology used for a specific type of investment may vary based on the market data available or other considerations. The methodologies summarized above may not represent the specific means by which portfolio investments are valued on any particular business day.
(B) Income Taxes. Each ETF Allocation Fund is treated as a separate entity for federal income tax purposes. The ETF Allocation Funds' policy is to comply with the requirements of the Internal Revenue Code of 1986, as amended (the “Internal Revenue Code”), applicable to regulated investment companies and to distribute all of its taxable income to the shareholders of each ETF Allocation Fund within the allowable time limits. Therefore, no federal, state and local income tax provisions are required.
Management evaluates each ETF Allocation Fund’s tax positions to determine if the tax positions taken meet the minimum recognition threshold in connection with accounting for uncertainties in income tax positions taken or expected to be taken for the purposes of measuring and recognizing tax liabilities in the financial statements. Recognition of tax benefits of an uncertain tax position is permitted only to the extent the position is “more likely than not” to be sustained assuming examination by taxing authorities. Management has analyzed the ETF Allocation Funds' tax positions taken on federal, state and local income tax returns for all open tax years (for up to three tax years) and has concluded that no provisions for federal, state and local income tax are required in the ETF Allocation Funds' financial statements. The ETF Allocation Funds' federal, state and local income tax and federal excise tax returns for tax years for which the applicable statutes of limitations have not expired are subject to examination by the Internal Revenue Service and state and local departments of revenue.
(C) Dividends and Distributions to Shareholders. Dividends and distributions are recorded on the ex-dividend date. The MainStay Moderate ETF Allocation Fund, MainStay Growth ETF Allocation Fund and MainStay Equity ETF Allocation Fund and MainStay ESG Multi-Asset Allocation Fund each intends to declare and pay dividends from net investment income, if any, at least annually. The MainStay Conservative ETF Allocation Fund and MainStay Defensive ETF Allocation Fund each intends to declare and pay dividends from net investment income, if any, at least quarterly. Each MainStay ETF Allocation Fund declare and distribute capital gains, if any, at least annually. Unless a shareholder elects otherwise, all dividends and distributions are reinvested in the same class of shares of the respective ETF Allocation Fund at NAV. Dividends and distributions to shareholders are determined in accordance with federal income tax regulations and may differ from determinations using GAAP.
(D) Security Transactions and Investment Income. The ETF Allocation Funds record security transactions on the trade date. Realized gains and losses on security transactions are determined using the identified cost method. Dividends and distributions received by the ETF Allocation Funds from the Underlying ETFs are recorded on the ex-dividend date.
Investment income and realized and unrealized gains and losses on investments of the ETF Allocation Funds are allocated pro rata to the separate classes of shares based upon their relative net assets on the date the income is earned or realized and unrealized gains and losses are incurred.
(E) Expenses. Expenses of the Trust are allocated to the individual Funds in proportion to the net assets of the respective Funds when the expenses are incurred, except where direct allocations of expenses can be made. Expenses (other than transfer agent expenses and fees incurred under the shareholder services plans and/or the distribution plans further discussed in Note 3(B)) are allocated to separate classes of shares pro rata based upon their relative net assets on the date the expenses are incurred. The expenses borne by the ETF Allocation Funds, including those of related parties to the ETF Allocation Funds, are shown in the Statement of Operations.
In addition, the ETF Allocation Funds bear a pro rata share of the fees and expenses of the Underlying ETFs in which they invest. Because the Underlying ETFs have varied expense and fee levels and the ETF Allocation Funds may own different proportions of the Underlying ETFs at different times, the amount of fees and expenses incurred indirectly by each ETF Allocation Fund may vary. Shares of the Underlying ETFs are subject to management fees and other fees that may cause the costs of investing in Underlying ETFs to be greater than the costs of owning the underlying securities directly. These indirect expenses of the Underlying ETFs are not included in the amounts shown in the Statement of Operations or in the expense ratios included in the Financial Highlights.
(F) Use of Estimates. In preparing financial statements in conformity with GAAP, the Manager makes estimates and assumptions that affect the reported amounts and disclosures in the financial statements. Actual results could differ from those estimates and assumptions.
(G) Securities Lending. In order to realize additional income, the ETF Allocation Funds may engage in securities lending, subject to the limitations set forth in the 1940 Act and relevant guidance by the staff of the Securities and Exchange Commission (“SEC”). If the ETF Allocation Funds engage in securities lending, the ETF Allocation Funds will lend through their custodian, JPMorgan Chase Bank, N.A., ("JPMorgan"), acting as securities lending agent on behalf of the ETF Allocation Funds. Under the current arrangement, JPMorgan will manage the ETF Allocation Funds' collateral in accordance with the securities lending agency agreement between the ETF Allocation Funds and JPMorgan, and indemnify the ETF Allocation Funds against counterparty risk. The loans will be collateralized by cash (which may be invested in a money market fund) and/or non-cash collateral (which may include U.S. Treasury securities and/or U.S. government agency securities issued or guaranteed by the United States government or its agencies or instrumentalities) at least equal at all times to the market value of the securities loaned. Non-cash collateral held at year end is segregated and cannot be transferred by the ETF Allocation Funds. The ETF Allocation Funds bear the risk of delay in recovery of, or loss of rights in, the securities loaned. The ETF Allocation Funds may also record a realized gain or loss on
| 106 | Mainstay ETF Asset Allocation Funds |
securities deemed sold due to a borrower’s inability to return securities on loan. The ETF Allocation Funds bear the risk of any loss on investment of cash collateral. The ETF Allocation Funds will receive compensation for lending its securities in the form of fees or it will retain a portion of interest earned on the investment of any cash collateral. The ETF Allocation Funds will also continue to receive interest and dividends on the securities loaned and any gain or loss in the market price of the securities loaned that may occur during the term of the loan will be for the account of the ETF Allocation Funds. Income earned from securities lending activities, if any, is reflected in the Statement of Operations. Securities on loan as of April 30, 2023, are shown in the Portfolio of Investments.
(H) Indemnifications. Under the Trust’s organizational documents, its officers and trustees are indemnified against certain liabilities that may arise out of performance of their duties to the Trust. Additionally, in the normal course of business, the ETF Allocation Funds enter into contracts with third-party service providers that contain a variety of representations and warranties and that may provide general indemnifications. The ETF Allocation Funds' maximum exposure under these arrangements is unknown, as this would involve future claims that may be made against the ETF Allocation Funds that have not yet occurred. The Manager believes that the risk of loss in connection with these potential indemnification obligations is remote. However, there can be no assurance that material liabilities related to such obligations will not arise in the future, which could adversely impact the ETF Allocation Funds.
Note 3–Fees and Related Party Transactions
(A) Manager. New York Life Investments, a registered investment adviser and an indirect, wholly-owned subsidiary of New York Life Insurance Company (“New York Life”), serves as the ETF Allocation Funds' Manager pursuant to an Amended and Restated Management Agreement (“Management Agreement”) and is responsible for the day-to-day portfolio management of the ETF Allocation Funds. The Manager provides offices, conducts clerical, recordkeeping and bookkeeping services, and keeps most of the financial and accounting records required to be maintained by the ETF Allocation Funds. Except for the portion of salaries and expenses that are the responsibility of the ETF Allocation Funds, the Manager pays the salaries and expenses of all personnel affiliated with the ETF Allocation Funds and certain operational expenses of the ETF Allocation Funds. The ETF Allocation Funds reimburse New York Life Investments in an amount equal to the portion of the compensation of the Chief Compliance Officer attributable to the ETF Allocation Funds.
Pursuant to the Management Agreement, each ETF Allocation Fund pays the Manager a monthly fee for the services performed and facilities furnished at an annual rate of 0.20% of each ETF Allocation Fund's average daily net assets.
Notes to Financial Statements (continued)
New York Life Investments has contractually agreed to waive fees and/or reimburse expenses so that Total Annual Fund Operating Expenses (excluding taxes, interest, litigation, extraordinary expenses, brokerage and other transaction expenses relating to the purchase and sale of portfolio investments, and acquired (underlying) fund fees and expenses) of a class do not exceed the following percentages of average daily net assets for each class:
| Fund | Class A | Class C | Class I | Class R3 | SIMPLE Class |
| MainStay Defensive ETF Allocation Fund | 0.80% | 1.55% | 0.55% | 1.15% | 1.05% |
| MainStay Conservative ETF Allocation Fund | 0.80 | 1.55 | 0.55 | 1.15 | 1.05 |
| MainStay Moderate ETF Allocation Fund | 0.80 | 1.55 | 0.55 | 1.15 | 1.05 |
| MainStay Growth ETF Allocation Fund | 0.80 | 1.55 | 0.55 | 1.15 | 1.05 |
| MainStay Equity ETF Allocation Fund | 0.80 | 1.55 | 0.55 | 1.15 | 1.05 |
| MainStay ESG Multi-Asset Allocation Fund | 0.80 | 1.55 | 0.55 | 1.15 | 1.05 |
This agreement will remain in effect until August 31, 2023, and shall renew automatically for one-year terms unless New York Life Investments provides written notice of termination prior to the start of the next term or upon approval of the Board.
During the period ended April 30, 2023, New York Life Investments earned fees from the ETF Allocation Funds and waived fees and/or reimbursed expenses as follows:
| Fund | Earned | Waived/Reimbursed |
| MainStay Defensive ETF Allocation Fund | $ 20,134 | $(119,414) |
| MainStay Conservative ETF Allocation Fund | 71,076 | (58,419) |
| MainStay Moderate ETF Allocation Fund | 189,214 | — |
| MainStay Growth ETF Allocation Fund | 128,885 | (14,790) |
| MainStay Equity ETF Allocation Fund | 94,581 | (61,084) |
| MainStay ESG Multi-Asset Allocation Fund | 22,238 | (116,244) |
JPMorgan provides sub-administration and sub-accounting services to the ETF Allocation Funds pursuant to an agreement with New York Life Investments. These services include calculating the daily NAVs of the ETF Allocation Funds, maintaining the general ledger and sub-ledger accounts for the calculation of the ETF Allocation Funds' respective NAVs, and assisting New York Life Investments in conducting various aspects of the ETF Allocation Funds' administrative operations. For providing these services to the ETF Allocation Funds, JPMorgan is compensated by New York Life Investments.
Pursuant to an agreement between the Trust and New York Life Investments, New York Life Investments is responsible for providing or procuring certain regulatory reporting services for the ETF Allocation Funds. The ETF Allocation Funds will reimburse New York Life Investments for the actual costs incurred by New York Life Investments in connection with providing or procuring these services for the ETF Allocation Funds.
(B) Distribution, Service and Shareholder Service Fees. The Trust, on behalf of the ETF Allocation Funds, has entered into a distribution agreement with NYLIFE Distributors LLC (the “Distributor”), an affiliate of New York Life Investments. The ETF Allocation Funds have
adopted distribution plans (the “Plans”) in accordance with the provisions of Rule 12b-1 under the 1940 Act.
Pursuant to the Class A Plan, the Distributor receives a monthly fee from the Class A shares at an annual rate of 0.25% of the average daily net assets of the Class A shares for distribution and/or service activities as designated by the Distributor. Pursuant to the Class C Plan, Class C shares pay the Distributor a monthly distribution fee at an annual rate of 0.75% of the average daily net assets of the Class C shares, along with a service fee at an annual rate of 0.25% of the average daily net assets of the Class C shares, for a total 12b-1 fee of 1.00%. Pursuant to the Class R3 and SIMPLE Class Plans, Class R3 and SIMPLE Class shares pay the Distributor a monthly distribution fee at an annual rate of 0.25% of the average daily net assets of the Class R3 and SIMPLE Class shares, along with a service fee at an annual rate of 0.25% of the average daily net assets of the Class R3 and SIMPLE Class shares, for a total 12b-1 fee of 0.50%. Class I shares are not subject to a distribution and/or service fee.
The Plans provide that the distribution and service fees are payable to the Distributor regardless of the amounts actually expended by the Distributor for distribution of the ETF Allocation Funds' shares and service activities.
In accordance with the Shareholder Services Plans for the Class R3 shares, the Manager has agreed to provide, through its affiliates or independent third parties, various shareholder and administrative support services to shareholders of the Class R3 shares. For its services, the Manager, its affiliates or independent third-party service providers are entitled to a shareholder service fee accrued daily and paid monthly at an annual rate of 0.10% of the average daily net assets of the Class R3 shares. This is in addition to any fees paid under the Class R3 Plan.
During the year ended April 30, 2023, shareholder service fees incurred by the Fund were as follows:
| MainStay Defensive ETF Allocation Fund |
| Class R3 | $ 44 |
| |
| MainStay Conservative ETF Allocation Fund |
| Class R3 | $ 340 |
| |
| 108 | Mainstay ETF Asset Allocation Funds |
| MainStay Moderate ETF Allocation Fund |
| Class R3 | $1,211 |
|
| MainStay Growth ETF Allocation Fund |
| Class R3 | $ 554 |
| |
| MainStay Equity ETF Allocation Fund |
| Class R3 | $ 450 |
| |
| MainStay ESG Multi-Asset Allocation Fund |
| Class R3 | $ 39 |
(C) Sales Charges. The ETF Allocation Funds were advised by the Distributor that the amount of initial sales charges retained on sales of each class of shares during the year ended April 30, 2023, was as follows:
| MainStay Defensive ETF Allocation Fund | |
| Class A | $ 4,275 |
| |
| MainStay Conservative ETF Allocation Fund | |
| Class A | $ 14,206 |
| |
| MainStay Moderate ETF Allocation Fund | |
| Class A | $ 42,266 |
| |
| MainStay Growth ETF Allocation Fund | |
| Class A | $ 41,451 |
| |
| MainStay Equity ETF Allocation Fund | |
| Class A | $ 34,627 |
| |
| MainStay ESG Multi-Asset Allocation Fund | |
| Class A | $ 1,150 |
The ETF Allocation Funds were also advised that the Distributor retained CDSCs on redemptions of Class A shares during the year ended April 30, 2023, as follows:
| MainStay Defensive ETF Allocation Fund | |
| Class A | $ 673 |
| |
| MainStay Conservative ETF Allocation Fund | |
| Class A | $ 450 |
| |
| MainStay Moderate ETF Allocation Fund | |
| Class A | $ 3,611 |
| |
| MainStay Growth ETF Allocation Fund | |
| Class A | $ 2,625 |
| Class C | 17 |
| |
| MainStay Equity ETF Allocation Fund | |
| Class A | $ 1,139 |
| Class C | 11 |
(D) Transfer, Dividend Disbursing and Shareholder Servicing Agent. NYLIM Service Company LLC, an affiliate of New York Life Investments, is the ETF Allocation Funds' transfer, dividend disbursing and shareholder servicing agent pursuant to an agreement between NYLIM Service Company LLC and the Trust. NYLIM Service Company LLC has entered into an agreement with SS&C Global Investor & Distribution Solutions, Inc. ("SS&C"), pursuant to which SS&C performs certain transfer agent services on behalf of NYLIM Service Company LLC. Effective June 30, 2020, New York Life Investments has contractually agreed to limit the transfer agency expenses charged to each of the Fund’s share classes to a maximum of 0.35% of that share class’s average daily net assets on an annual basis after deducting any applicable Fund or class-level expense reimbursement or small account fees. This agreement will remain in effect until August 31, 2023, and shall renew automatically for one-year terms unless New York Life Investments provides written notice of termination prior to the start of the next term or upon approval of the Board. During the year ended April 30, 2023, transfer agent expenses incurred by the ETF Allocation Funds and any reimbursements, pursuant to the aforementioned Transfer Agency expense limitation agreement, were as follows:
| MainStay Defensive ETF Allocation Fund | Expense | Waived |
| Class A | $ 7,347 | $ — |
| Class C | 242 | — |
| Class I | 31 | — |
| Class R3 | 36 | — |
| SIMPLE Class | 674 | — |
| MainStay Conservative ETF Allocation Fund | Expense | Waived |
| Class A | $ 26,969 | $ — |
| Class C | 509 | — |
| Class I | 27 | — |
| Class R3 | 272 | — |
| SIMPLE Class | 2,179 | — |
| MainStay Moderate ETF Allocation Fund | Expense | Waived |
| Class A | $ 73,251 | $ — |
| Class C | 526 | — |
| Class I | 61 | — |
| Class R3 | 1,007 | — |
| SIMPLE Class | 7,972 | — |
Notes to Financial Statements (continued)
| MainStay Growth ETF Allocation Fund | Expense | Waived |
| Class A | $ 66,188 | $ — |
| Class C | 462 | — |
| Class I | 88 | — |
| Class R3 | 643 | — |
| SIMPLE Class | 9,464 | — |
| MainStay Equity ETF Allocation Fund | Expense | Waived |
| Class A | $ 47,115 | $ — |
| Class C | 266 | — |
| Class I | 143 | — |
| Class R3 | 505 | — |
| SIMPLE Class | 7,636 | — |
| MainStay ESG Multi-Asset Allocation Fund | Expense | Waived |
| Class A | $ 269 | $ — |
| Class C | 27 | — |
| Class I | 1,833 | — |
| Class R3 | 8 | — |
| SIMPLE Class | 224 | — |
(E) Capital. As of April 30, 2023, New York Life and its affiliates beneficially held shares of the ETF Allocation Funds with the values and percentages of net assets as follows:
| MainStay Defensive ETF Allocation Fund | | |
| Class C | $ 24,297 | 10.6% |
| Class I | 24,726 | 60.1 |
| Class R3 | 24,540 | 32.4 |
| |
| MainStay Conservative ETF Allocation Fund | | |
| Class C | $ 26,052 | 7.1% |
| Class I | 33,769 | 100.0 |
| Class R3 | 26,330 | 6.1 |
| |
| MainStay Moderate ETF Allocation Fund | | |
| Class I | $ 29,623 | 40.1% |
| Class R3 | 28,305 | 2.3 |
| |
| MainStay Growth ETF Allocation Fund | | |
| Class C | $ 30,048 | 9.6% |
| Class I | 29,734 | 27.8 |
| Class R3 | 30,401 | 4.4 |
| |
| MainStay Equity ETF Allocation Fund | | |
| Class C | $ 31,285 | 18.2% |
| Class I | 17,342 | 15.3 |
| Class R3 | 31,660 | 9.5 |
| |
| MainStay ESG Multi-Asset Allocation Fund | | |
| Class A | $ 23,135 | 0.8% |
| Class C | 22,861 | 100.0 |
| Class I | 9,191,908 | 99.8 |
| Class R3 | 23,007 | 35.8 |
| SIMPLE Class | 23,034 | 8.4 |
Note 4-Federal Income Tax
As of April 30, 2023, the cost and unrealized appreciation (depreciation) of each ETF Allocation Fund’s investment portfolio, including applicable derivative contracts and other financial instruments, as determined on a federal income tax basis, were as follows:
| MainStay Defensive ETF Allocation Fund |
| | Federal Tax
Cost | Gross
Unrealized
Appreciation | Gross
Unrealized
(Depreciation) | Net
Unrealized
Appreciation/
(Depreciation) |
| Investments in Securities | $13,044,057 | $65,869 | $(963,185) | $(897,316) |
| MainStay Conservative ETF Allocation Fund |
| | Federal Tax
Cost | Gross
Unrealized
Appreciation | Gross
Unrealized
(Depreciation) | Net
Unrealized
Appreciation/
(Depreciation) |
| Investments in Securities | $44,597,957 | $1,285,191 | $(2,792,882) | $(1,507,691) |
| MainStay Moderate ETF Allocation Fund |
| | Federal Tax
Cost | Gross
Unrealized
Appreciation | Gross
Unrealized
(Depreciation) | Net
Unrealized
Appreciation/
(Depreciation) |
| Investments in Securities | $116,987,786 | $1,986,114 | $(2,526,451) | $(540,337) |
| 110 | Mainstay ETF Asset Allocation Funds |
| MainStay Growth ETF Allocation Fund |
| | Federal Tax
Cost | Gross
Unrealized
Appreciation | Gross
Unrealized
(Depreciation) | Net
Unrealized
Appreciation/
(Depreciation) |
| Investments in Securities | $84,934,860 | $1,592,534 | $(766,649) | $825,885 |
| MainStay Equity ETF Allocation Fund |
| | Federal Tax
Cost | Gross
Unrealized
Appreciation | Gross
Unrealized
(Depreciation) | Net
Unrealized
Appreciation/
(Depreciation) |
| Investments in Securities | $58,683,545 | $2,470,581 | $(2,524,954) | $(54,373) |
| MainStay ESG Multi-Asset Allocation Fund |
| | Federal Tax
Cost | Gross
Unrealized
Appreciation | Gross
Unrealized
(Depreciation) | Net
Unrealized
Appreciation/
(Depreciation) |
| Investments in Securities | $14,351,395 | $246,376 | $(720,911) | $(474,535) |
As of April 30, 2023, the components of accumulated gain (loss) on a tax basis were as follows:
| Fund | Ordinary
Income | Accumulated
Capital
and Other
Gain (Loss) | Other
Temporary
Differences | Unrealized
Appreciation
(Depreciation) | Total
Accumulated
Gain (Loss) |
| MainStay Defensive ETF Allocation Fund | $ 23,136 | $ (86,624) | $ — | $ (897,316) | $ (960,804) |
| MainStay Conservative ETF Allocation Fund | 33,938 | (811,117) | — | (1,507,691) | (2,284,870) |
| MainStay Moderate ETF Allocation Fund | 719,918 | (2,905,279) | — | (540,337) | (2,725,698) |
| MainStay Growth ETF Allocation Fund | 312,594 | (1,504,149) | — | 825,885 | (365,670) |
| MainStay Equity ETF Allocation Fund | 31,711 | (894,939) | — | (54,373) | (917,601) |
| MainStay ESG Multi-Asset Allocation Fund | 55,324 | (718,337) | (85,475) | (474,535) | (1,223,023) |
The difference between book-basis and tax-basis unrealized appreciation (depreciation) is primarily due to wash sales adjustments.
As of April 30, 2023, for federal income tax purposes, capital loss carryforwards of $86,624, as shown in the table below, were available to the extent provided by the regulations to offset future realized gains of MainStay Defensive ETF Allocation Fund. Accordingly, no capital gains distributions are expected to be paid to shareholders until net gains have been realized in excess of such amounts.
Capital Loss
Available Through | Short-Term
Capital Loss
Amounts (000’s) | Long-Term
Capital Loss
Amounts (000’s) |
| Unlimited | $49 | $37 |
As of April 30, 2023, for federal income tax purposes, capital loss carryforwards of $811,117, as shown in the table below, were available to the extent provided by the regulations to offset future realized gains of MainStay Conservative ETF Allocation Fund. Accordingly, no capital gains distributions are expected to be paid to shareholders until net gains have been realized in excess of such amounts.
Capital Loss
Available Through | Short-Term
Capital Loss
Amounts (000’s) | Long-Term
Capital Loss
Amounts (000’s) |
| Unlimited | $402 | $409 |
As of April 30, 2023, for federal income tax purposes, capital loss carryforwards of $2,905,279, as shown in the table below, were available to the extent provided by the regulations to offset future realized gains of MainStay Moderate ETF Allocation Fund. Accordingly, no capital gains distributions are expected to be paid to shareholders until net gains have been realized in excess of such amounts.
Capital Loss
Available Through | Short-Term
Capital Loss
Amounts (000’s) | Long-Term
Capital Loss
Amounts (000’s) |
| Unlimited | $1,467 | $1,438 |
As of April 30, 2023, for federal income tax purposes, capital loss carryforwards of $1,504,149, as shown in the table below, were available to the extent provided by the regulations to offset future realized gains of MainStay Growth ETF Allocation Fund. Accordingly, no capital gains distributions are expected to be paid to shareholders until net gains have been realized in excess of such amounts.
Capital Loss
Available Through | Short-Term
Capital Loss
Amounts (000’s) | Long-Term
Capital Loss
Amounts (000’s) |
| Unlimited | $870 | $634 |
Notes to Financial Statements (continued)
As of April 30, 2023, for federal income tax purposes, capital loss carryforwards of $894,939, as shown in the table below, were available to the extent provided by the regulations to offset future realized gains of MainStay Equity ETF Allocation Fund. Accordingly, no capital gains distributions are expected to be paid to shareholders until net gains have been realized in excess of such amounts.
Capital Loss
Available Through | Short-Term
Capital Loss
Amounts (000’s) | Long-Term
Capital Loss
Amounts (000’s) |
| Unlimited | $474 | $421 |
As of April 30, 2023, for federal income tax purposes, capital loss carryforwards of $718,337, as shown in the table below, were available to the extent provided by the regulations to offset future realized gains of MainStay ESG Multi-Asset Allocation Fund. Accordingly, no capital gains distributions are expected to be paid to shareholders until net gains have been realized in excess of such amounts.
Capital Loss
Available Through | Short-Term
Capital Loss
Amounts (000’s) | Long-Term
Capital Loss
Amounts (000’s) |
| Unlimited | $492 | $226 |
During the period ended April 30, 2023 the tax character of distributions paid as reflected in the Statements of Changes in Net Assets was as follows:
| | 2023 | | 2022 |
| Fund | Ordinary
Income | Long-Term
Capital Gains | Total | | Ordinary
Income | Long-Term
Capital Gains | Total |
| MainStay Defensive ETF Allocation Fund | $ 292,414 | $ 70,089 | $ 362,503 | | $ 255,743 | $ 901 | $ 256,644 |
| MainStay Conservative ETF Allocation Fund | 911,176 | 114,302 | 1,025,478 | | 737,286 | — | 737,286 |
| MainStay Moderate ETF Allocation Fund | 1,538,434 | 172,753 | 1,711,187 | | 1,226,137 | — | 1,226,137 |
| MainStay Growth ETF Allocation Fund | 990,454 | 17,176 | 1,007,630 | | 623,890 | — | 623,890 |
| MainStay Equity ETF Allocation Fund | 470,068 | 5,029 | 475,097 | | 384,052 | 1,643 | 385,695 |
| MainStay ESG Multi-Asset Allocation Fund | 187,382 | — | 187,382 | | 286,286 | — | 286,286 |
Note 5–Custodian
JPMorgan is the custodian of cash and securities held by the ETF Allocation Funds. Custodial fees are charged to each ETF Allocation Fund based on each ETF Allocation Fund's net assets and/or the market value of securities held by each ETF Allocation Fund and the number of certain transactions incurred by each ETF Allocation Fund.
Note 6–Line of Credit
The ETF Allocation Funds and certain other funds managed by New York Life Investments maintain a line of credit with a syndicate of banks in order to secure a source of funds for temporary purposes to meet unanticipated or excessive redemption requests.
Effective July 26, 2022, under the credit agreement (the “Credit Agreement”), the aggregate commitment amount is $600,000,000 with an additional uncommitted amount of $100,000,000. The commitment fee is an annual rate of 0.15% of the average commitment amount payable quarterly, regardless of usage, to JPMorgan, who serves as the agent to the syndicate. The commitment fee is allocated among the ETF Allocation Funds and certain other funds managed by New York Life Investments based upon their respective net assets and other factors. Interest on any revolving credit loan is charged based upon the Federal Funds Rate, Daily Simple Secured Overnight Financing Rate ("SOFR") + 0.10%, or the Overnight Bank Funding Rate, whichever is higher. The Credit Agreement expires on July 25, 2023, although the ETF Allocation Funds, certain other funds managed by New York Life Investments and
the syndicate of banks may renew the Credit Agreement for an additional year on the same or different terms or enter into a credit agreement with a different syndicate of banks. Prior to July 26, 2022, the aggregate commitment amount and the commitment fee were the same as those under the current Credit Agreement. During the year ended April 30, 2023, there were no borrowings made or outstanding with respect to the ETF Allocation Funds under the Credit Agreement.
Note 7–Interfund Lending Program
Pursuant to an exemptive order issued by the SEC, the ETF Allocation Funds, along with certain other funds managed by New York Life Investments, may participate in an interfund lending program. The interfund lending program provides an alternative credit facility that permits the ETF Allocation Funds and certain other funds managed by New York Life Investments to lend or borrow money for temporary purposes directly to or from one another, subject to the conditions of the exemptive order. During the year ended April 30, 2023, there were no interfund loans made or outstanding with respect to the ETF Allocation Funds.
| 112 | Mainstay ETF Asset Allocation Funds |
Note 8–Purchases and Sales of Securities (in 000’s)
During the year ended April 30, 2023, purchases and sales of securities were as follows:
| Fund | Purchases | Sales |
| MainStay Defensive ETF Allocation Fund | $ 6,093 | $ 6,038 |
| MainStay Conservative ETF Allocation Fund | 23,326 | 21,743 |
| MainStay Moderate ETF Allocation Fund | 62,920 | 56,260 |
| MainStay Growth ETF Allocation Fund | 50,556 | 35,034 |
| MainStay Equity ETF Allocation Fund | 30,083 | 16,387 |
| MainStay ESG Multi-Asset Allocation Fund | 16,094 | 14,919 |
Note 9–Capital Share Transactions
Transactions in capital shares for the period ended April 30, 2023, were as follows:
MainStay Defensive ETF Allocation Fund
| Class A | Shares | Amount |
| Year ended April 30, 2023: | | |
| Shares sold | 310,910 | $ 2,857,044 |
| Shares issued to shareholders in reinvestment of distributions | 37,215 | 336,689 |
| Shares redeemed | (315,645) | (2,899,248) |
| Net increase (decrease) in shares outstanding before conversion | 32,480 | 294,485 |
| Shares converted into Class A (See Note 1) | 702 | 6,430 |
| Net increase (decrease) | 33,182 | $ 300,915 |
| Year ended April 30, 2022: | | |
| Shares sold | 467,406 | $ 4,822,274 |
| Shares issued to shareholders in reinvestment of distributions | 23,782 | 246,509 |
| Shares redeemed | (328,586) | (3,404,083) |
| Net increase (decrease) in shares outstanding before conversion | 162,602 | 1,664,700 |
| Shares converted into Class A (See Note 1) | 2,196 | 22,510 |
| Net increase (decrease) | 164,798 | $ 1,687,210 |
| |
| Class C | Shares | Amount |
| Year ended April 30, 2023: | | |
| Shares sold | 16,427 | $ 150,140 |
| Shares issued to shareholders in reinvestment of distributions | 596 | 5,417 |
| Shares redeemed | (3,878) | (35,650) |
| Net increase (decrease) in shares outstanding before conversion | 13,145 | 119,907 |
| Shares converted from Class C (See Note 1) | (703) | (6,430) |
| Net increase (decrease) | 12,442 | $ 113,477 |
| Year ended April 30, 2022: | | |
| Shares sold | 115 | $ 1,200 |
| Shares issued to shareholders in reinvestment of distributions | 252 | 2,623 |
| Shares redeemed | (1,322) | (13,767) |
| Net increase (decrease) in shares outstanding before conversion | (955) | (9,944) |
| Shares converted from Class C (See Note 1) | (2,198) | (22,510) |
| Net increase (decrease) | (3,153) | $ (32,454) |
| |
| Class I | Shares | Amount |
| Year ended April 30, 2023: | | |
| Shares sold | 623 | $ 5,793 |
| Shares issued to shareholders in reinvestment of distributions | 165 | 1,493 |
| Net increase (decrease) | 788 | $ 7,286 |
| Year ended April 30, 2022: | | |
| Shares issued to shareholders in reinvestment of distributions | 108 | $ 1,116 |
| Shares redeemed | (191,795) | (2,002,016) |
| Net increase (decrease) | (191,687) | $(2,000,900) |
| |
| Class R3 | Shares | Amount |
| Year ended April 30, 2023: | | |
| Shares sold | 4,693 | $ 43,058 |
| Shares issued to shareholders in reinvestment of distributions | 168 | 1,517 |
| Net increase (decrease) | 4,861 | $ 44,575 |
| Year ended April 30, 2022: | | |
| Shares sold | 762 | $ 8,000 |
| Shares issued to shareholders in reinvestment of distributions | 73 | 758 |
| Shares redeemed | — | (1) |
| Net increase (decrease) | 835 | $ 8,757 |
| |
Notes to Financial Statements (continued)
| SIMPLE Class | Shares | Amount |
| Year ended April 30, 2023: | | |
| Shares sold | 44,509 | $ 411,778 |
| Shares issued to shareholders in reinvestment of distributions | 1,779 | 16,132 |
| Shares redeemed | (2,700) | (24,586) |
| Net increase (decrease) | 43,588 | $ 403,324 |
| Year ended April 30, 2022: | | |
| Shares sold | 23,576 | $ 242,000 |
| Shares issued to shareholders in reinvestment of distributions | 353 | 3,645 |
| Shares redeemed | (3,023) | (31,532) |
| Net increase (decrease) | 20,906 | $ 214,113 |
MainStay Conservative ETF Allocation Fund
| Class A | Shares | Amount |
| Year ended April 30, 2023: | | |
| Shares sold | 873,450 | $ 8,657,169 |
| Shares issued to shareholders in reinvestment of distributions | 98,111 | 952,780 |
| Shares redeemed | (660,115) | (6,526,437) |
| Net increase (decrease) in shares outstanding before conversion | 311,446 | 3,083,512 |
| Shares converted into Class A (See Note 1) | 5,356 | 53,415 |
| Net increase (decrease) | 316,802 | $ 3,136,927 |
| Year ended April 30, 2022: | | |
| Shares sold | 1,692,280 | $18,824,810 |
| Shares issued to shareholders in reinvestment of distributions | 62,856 | 704,321 |
| Shares redeemed | (685,361) | (7,574,739) |
| Net increase (decrease) in shares outstanding before conversion | 1,069,775 | 11,954,392 |
| Shares converted into Class A (See Note 1) | 408 | 4,556 |
| Net increase (decrease) | 1,070,183 | $11,958,948 |
| |
| Class C | Shares | Amount |
| Year ended April 30, 2023: | | |
| Shares sold | 2,612 | $ 26,020 |
| Shares issued to shareholders in reinvestment of distributions | 809 | 7,847 |
| Shares redeemed | (2,009) | (19,773) |
| Net increase (decrease) in shares outstanding before conversion | 1,412 | 14,094 |
| Shares converted from Class C (See Note 1) | (5,042) | (50,072) |
| Net increase (decrease) | (3,630) | $ (35,978) |
| Year ended April 30, 2022: | | |
| Shares sold | 2,366 | $ 26,521 |
| Shares issued to shareholders in reinvestment of distributions | 608 | 6,833 |
| Shares redeemed | (4,591) | (51,480) |
| Net increase (decrease) in shares outstanding before conversion | (1,617) | (18,126) |
| Shares converted from Class C (See Note 1) | (409) | (4,556) |
| Net increase (decrease) | (2,026) | $ (22,682) |
| |
| Class I | Shares | Amount |
| Year ended April 30, 2023: | | |
| Shares issued to shareholders in reinvestment of distributions | 107 | $ 1,028 |
| Net increase (decrease) | 107 | $ 1,028 |
| Year ended April 30, 2022: | | |
| Shares issued to shareholders in reinvestment of distributions | 137 | $ 1,541 |
| Shares redeemed | (2,385) | (25,619) |
| Net increase (decrease) | (2,248) | $ (24,078) |
| |
| Class R3 | Shares | Amount |
| Year ended April 30, 2023: | | |
| Shares sold | 33,419 | $ 324,331 |
| Shares issued to shareholders in reinvestment of distributions | 1,008 | 9,791 |
| Net increase (decrease) | 34,427 | $ 334,122 |
| Year ended April 30, 2022: | | |
| Shares sold | 2,565 | $ 28,919 |
| Shares issued to shareholders in reinvestment of distributions | 149 | 1,667 |
| Net increase (decrease) | 2,714 | $ 30,586 |
| |
| 114 | Mainstay ETF Asset Allocation Funds |
| SIMPLE Class | Shares | Amount |
| Year ended April 30, 2023: | | |
| Shares sold | 146,265 | $ 1,445,904 |
| Shares issued to shareholders in reinvestment of distributions | 4,700 | 45,801 |
| Shares redeemed | (19,775) | (195,239) |
| Net increase (decrease) in shares outstanding before conversion | 131,190 | 1,296,466 |
| Shares converted from SIMPLE Class (See Note 1) | (336) | (3,343) |
| Net increase (decrease) | 130,854 | $ 1,293,123 |
| Year ended April 30, 2022: | | |
| Shares sold | 92,080 | $ 1,019,656 |
| Shares issued to shareholders in reinvestment of distributions | 1,200 | 13,388 |
| Shares redeemed | (5,244) | (58,363) |
| Net increase (decrease) | 88,036 | $ 974,681 |
MainStay Moderate ETF Allocation Fund
| Class A | Shares | Amount |
| Year ended April 30, 2023: | | |
| Shares sold | 1,931,302 | $ 20,758,714 |
| Shares issued to shareholders in reinvestment of distributions | 151,908 | 1,594,972 |
| Shares redeemed | (1,196,225) | (12,811,527) |
| Net increase (decrease) in shares outstanding before conversion | 886,985 | 9,542,159 |
| Shares converted into Class A (See Note 1) | 4,114 | 43,271 |
| Net increase (decrease) | 891,099 | $ 9,585,430 |
| Year ended April 30, 2022: | | |
| Shares sold | 4,186,889 | $ 50,473,072 |
| Shares issued to shareholders in reinvestment of distributions | 96,219 | 1,188,297 |
| Shares redeemed | (1,080,298) | (13,019,569) |
| Net increase (decrease) in shares outstanding before conversion | 3,202,810 | 38,641,800 |
| Shares converted into Class A (See Note 1) | 11,038 | 130,131 |
| Net increase (decrease) | 3,213,848 | $ 38,771,931 |
| |
| Class C | Shares | Amount |
| Year ended April 30, 2023: | | |
| Shares sold | 3,362 | $ 35,869 |
| Shares issued to shareholders in reinvestment of distributions | 294 | 3,083 |
| Shares redeemed | (3,751) | (39,764) |
| Net increase (decrease) in shares outstanding before conversion | (95) | (812) |
| Shares converted from Class C (See Note 1) | (4,140) | (43,271) |
| Net increase (decrease) | (4,235) | $ (44,083) |
| Year ended April 30, 2022: | | |
| Shares sold | 14,807 | $ 177,884 |
| Shares issued to shareholders in reinvestment of distributions | 288 | 3,546 |
| Shares redeemed | (11,428) | (135,584) |
| Net increase (decrease) in shares outstanding before conversion | 3,667 | 45,846 |
| Shares converted from Class C (See Note 1) | (11,079) | (130,131) |
| Net increase (decrease) | (7,412) | $ (84,285) |
| |
| Class I | Shares | Amount |
| Year ended April 30, 2023: | | |
| Shares sold | 2,321 | $ 25,321 |
| Shares issued to shareholders in reinvestment of distributions | 139 | 1,463 |
| Shares redeemed | (2,354) | (25,251) |
| Net increase (decrease) | 106 | $ 1,533 |
| Year ended April 30, 2022: | | |
| Shares sold | 2,979 | $ 36,029 |
| Shares issued to shareholders in reinvestment of distributions | 91 | 1,128 |
| Shares redeemed | (850) | (10,430) |
| Net increase (decrease) | 2,220 | $ 26,727 |
| |
| Class R3 | Shares | Amount |
| Year ended April 30, 2023: | | |
| Shares sold | 67,966 | $ 715,346 |
| Shares issued to shareholders in reinvestment of distributions | 1,930 | 20,241 |
| Shares redeemed | (34,261) | (373,494) |
| Net increase (decrease) | 35,635 | $ 362,093 |
| Year ended April 30, 2022: | | |
| Shares sold | 42,794 | $ 519,787 |
| Shares issued to shareholders in reinvestment of distributions | 733 | 9,056 |
| Shares redeemed | (141) | (1,748) |
| Net increase (decrease) | 43,386 | $ 527,095 |
| |
Notes to Financial Statements (continued)
| SIMPLE Class | Shares | Amount |
| Year ended April 30, 2023: | | |
| Shares sold | 476,351 | $ 5,096,795 |
| Shares issued to shareholders in reinvestment of distributions | 8,448 | 88,534 |
| Shares redeemed | (29,925) | (321,359) |
| Net increase (decrease) | 454,874 | $ 4,863,970 |
| Year ended April 30, 2022: | | |
| Shares sold | 258,797 | $ 3,089,423 |
| Shares issued to shareholders in reinvestment of distributions | 1,785 | 22,031 |
| Shares redeemed | (13,574) | (159,897) |
| Net increase (decrease) | 247,008 | $ 2,951,557 |
MainStay Growth ETF Allocation Fund
| Class A | Shares | Amount |
| Year ended April 30, 2023: | | |
| Shares sold | 1,965,632 | $22,781,235 |
| Shares issued to shareholders in reinvestment of distributions | 79,943 | 904,151 |
| Shares redeemed | (656,085) | (7,574,788) |
| Net increase (decrease) in shares outstanding before conversion | 1,389,490 | 16,110,598 |
| Shares converted into Class A (See Note 1) | 1,891 | 21,668 |
| Net increase (decrease) | 1,391,381 | $16,132,266 |
| Year ended April 30, 2022: | | |
| Shares sold | 2,481,741 | $32,173,386 |
| Shares issued to shareholders in reinvestment of distributions | 43,915 | 591,099 |
| Shares redeemed | (446,604) | (5,771,438) |
| Net increase (decrease) in shares outstanding before conversion | 2,079,052 | 26,993,047 |
| Shares converted into Class A (See Note 1) | 339 | 4,447 |
| Shares converted from Class A (See Note 1) | (283) | (3,802) |
| Net increase (decrease) | 2,079,108 | $26,993,692 |
| |
| Class C | Shares | Amount |
| Year ended April 30, 2023: | | |
| Shares sold | 2,576 | $ 29,341 |
| Shares issued to shareholders in reinvestment of distributions | 216 | 2,440 |
| Shares redeemed | (561) | (6,530) |
| Net increase (decrease) in shares outstanding before conversion | 2,231 | 25,251 |
| Shares converted from Class C (See Note 1) | (1,900) | (21,668) |
| Net increase (decrease) | 331 | $ 3,583 |
| Year ended April 30, 2022: | | |
| Shares sold | 5,581 | $ 72,514 |
| Shares issued to shareholders in reinvestment of distributions | 113 | 1,516 |
| Shares redeemed | (1,785) | (23,688) |
| Net increase (decrease) in shares outstanding before conversion | 3,909 | 50,342 |
| Shares converted from Class C (See Note 1) | (342) | (4,447) |
| Net increase (decrease) | 3,567 | $ 45,895 |
| |
| Class I | Shares | Amount |
| Year ended April 30, 2023: | | |
| Shares sold | 5,656 | $ 64,602 |
| Shares issued to shareholders in reinvestment of distributions | 151 | 1,696 |
| Shares redeemed | (196) | (2,291) |
| Net increase (decrease) | 5,611 | $ 64,007 |
| Year ended April 30, 2022: | | |
| Shares sold | 249 | $ 3,250 |
| Shares issued to shareholders in reinvestment of distributions | 47 | 635 |
| Net increase (decrease) | 296 | $ 3,885 |
| |
| Class R3 | Shares | Amount |
| Year ended April 30, 2023: | | |
| Shares sold | 21,476 | $ 247,926 |
| Shares issued to shareholders in reinvestment of distributions | 622 | 7,027 |
| Shares redeemed | (5,214) | (60,043) |
| Net increase (decrease) | 16,884 | $ 194,910 |
| Year ended April 30, 2022: | | |
| Shares sold | 28,331 | $ 367,189 |
| Shares issued to shareholders in reinvestment of distributions | 160 | 2,146 |
| Net increase (decrease) | 28,491 | $ 369,335 |
| |
| 116 | Mainstay ETF Asset Allocation Funds |
| SIMPLE Class | Shares | Amount |
| Year ended April 30, 2023: | | |
| Shares sold | 514,843 | $ 5,920,746 |
| Shares issued to shareholders in reinvestment of distributions | 8,121 | 91,851 |
| Shares redeemed | (50,203) | (589,192) |
| Net increase (decrease) | 472,761 | $ 5,423,405 |
| Year ended April 30, 2022: | | |
| Shares sold | 266,287 | $ 3,460,769 |
| Shares issued to shareholders in reinvestment of distributions | 2,090 | 28,129 |
| Shares redeemed | (21,687) | (278,346) |
| Net increase (decrease) in shares outstanding before conversion | 246,690 | 3,210,552 |
| Shares converted into SIMPLE Class (See Note 1) | 283 | 3,802 |
| Net increase (decrease) | 246,973 | $ 3,214,354 |
MainStay Equity ETF Allocation Fund
| Class A | Shares | Amount |
| Year ended April 30, 2023: | | |
| Shares sold | 1,356,954 | $16,425,863 |
| Shares issued to shareholders in reinvestment of distributions | 36,098 | 425,944 |
| Shares redeemed | (512,629) | (6,190,399) |
| Net increase (decrease) in shares outstanding before conversion | 880,423 | 10,661,408 |
| Shares converted into Class A (See Note 1) | 1,808 | 21,760 |
| Net increase (decrease) | 882,231 | $10,683,168 |
| Year ended April 30, 2022: | | |
| Shares sold | 1,900,803 | $26,331,795 |
| Shares issued to shareholders in reinvestment of distributions | 24,833 | 360,078 |
| Shares redeemed | (366,165) | (5,060,167) |
| Net increase (decrease) in shares outstanding before conversion | 1,559,471 | 21,631,706 |
| Shares converted into Class A (See Note 1) | 1,883 | 25,918 |
| Net increase (decrease) | 1,561,354 | $21,657,624 |
| |
| Class C | Shares | Amount |
| Year ended April 30, 2023: | | |
| Shares sold | 2,381 | $ 28,448 |
| Shares issued to shareholders in reinvestment of distributions | 33 | 386 |
| Shares redeemed | (998) | (11,796) |
| Net increase (decrease) in shares outstanding before conversion | 1,416 | 17,038 |
| Shares converted from Class C (See Note 1) | (1,824) | (21,760) |
| Net increase (decrease) | (408) | $ (4,722) |
| Year ended April 30, 2022: | | |
| Shares sold | 4,078 | $ 56,581 |
| Shares issued to shareholders in reinvestment of distributions | 41 | 590 |
| Shares redeemed | (904) | (12,511) |
| Net increase (decrease) in shares outstanding before conversion | 3,215 | 44,660 |
| Shares converted from Class C (See Note 1) | (1,894) | (25,918) |
| Net increase (decrease) | 1,321 | $ 18,742 |
| |
| Class I | Shares | Amount |
| Year ended April 30, 2023: | | |
| Shares sold | 389 | $ 4,804 |
| Shares issued to shareholders in reinvestment of distributions | 117 | 1,373 |
| Shares redeemed | (3,552) | (40,820) |
| Net increase (decrease) | (3,046) | $ (34,643) |
| Year ended April 30, 2022: | | |
| Shares sold | 7,559 | $ 104,738 |
| Shares issued to shareholders in reinvestment of distributions | 150 | 2,163 |
| Shares redeemed | (193,413) | (2,596,830) |
| Net increase (decrease) | (185,704) | $ (2,489,929) |
| |
| Class R3 | Shares | Amount |
| Year ended April 30, 2023: | | |
| Shares sold | 7,075 | $ 85,264 |
| Shares issued to shareholders in reinvestment of distributions | 141 | 1,664 |
| Shares redeemed | (18,147) | (223,350) |
| Net increase (decrease) | (10,931) | $ (136,422) |
| Year ended April 30, 2022: | | |
| Shares sold | 4,977 | $ 70,234 |
| Shares issued to shareholders in reinvestment of distributions | 106 | 1,525 |
| Shares redeemed | — | (13) |
| Net increase (decrease) | 5,083 | $ 71,746 |
| |
Notes to Financial Statements (continued)
| SIMPLE Class | Shares | Amount |
| Year ended April 30, 2023: | | |
| Shares sold | 377,568 | $ 4,530,890 |
| Shares issued to shareholders in reinvestment of distributions | 3,502 | 41,247 |
| Shares redeemed | (37,224) | (454,975) |
| Net increase (decrease) | 343,846 | $ 4,117,162 |
| Year ended April 30, 2022: | | |
| Shares sold | 184,935 | $ 2,564,334 |
| Shares issued to shareholders in reinvestment of distributions | 1,185 | 17,161 |
| Shares redeemed | (13,008) | (178,356) |
| Net increase (decrease) | 173,112 | $ 2,403,139 |
MainStay ESG Multi-Asset Allocation Fund
| Class A | Shares | Amount |
| Year ended April 30, 2023: | | |
| Shares sold | 195,321 | $ 1,692,800 |
| Shares issued to shareholders in reinvestment of distributions | 3,919 | 33,195 |
| Shares redeemed | (19,676) | (173,318) |
| Net increase (decrease) | 179,564 | $ 1,552,677 |
| Year ended April 30, 2022:(a) | | |
| Shares sold | 134,088 | $ 1,332,493 |
| Shares issued to shareholders in reinvestment of distributions | 1,853 | 18,787 |
| Shares redeemed | (6,512) | (61,804) |
| Net increase (decrease) | 129,429 | $ 1,289,476 |
| |
| Class C | Shares | Amount |
| Year ended April 30, 2023: | | |
| Shares issued to shareholders in reinvestment of distributions | 17 | $ 152 |
| Net increase (decrease) | 17 | $ 152 |
| Year ended April 30, 2022:(a) | | |
| Shares sold | 2,501 | $ 24,999 |
| Shares issued to shareholders in reinvestment of distributions | 59 | 605 |
| Net increase (decrease) | 2,560 | $ 25,604 |
| |
| Class I | Shares | Amount |
| Year ended April 30, 2023: | | |
| Shares issued to shareholders in reinvestment of distributions | 17,851 | $ 151,197 |
| Net increase (decrease) | 17,851 | $ 151,197 |
| Year ended April 30, 2022:(a) | | |
| Shares sold | 991,316 | $ 9,913,000 |
| Shares issued to shareholders in reinvestment of distributions | 26,150 | 265,161 |
| Net increase (decrease) | 1,017,466 | $10,178,161 |
| |
| Class R3 | Shares | Amount |
| Year ended April 30, 2023: | | |
| Shares sold | 2,737 | $ 23,980 |
| Shares issued to shareholders in reinvestment of distributions | 50 | 423 |
| Net increase (decrease) | 2,787 | $ 24,403 |
| Year ended April 30, 2022:(a) | | |
| Shares sold | 4,350 | $ 43,898 |
| Shares issued to shareholders in reinvestment of distributions | 108 | 1,096 |
| Net increase (decrease) | 4,458 | $ 44,994 |
| |
| SIMPLE Class | Shares | Amount |
| Year ended April 30, 2023: | | |
| Shares sold | 23,250 | $ 201,649 |
| Shares issued to shareholders in reinvestment of distributions | 285 | 2,415 |
| Shares redeemed | (1,080) | (10,306) |
| Net increase (decrease) | 22,455 | $ 193,758 |
| Year ended April 30, 2022:(a) | | |
| Shares sold | 8,224 | $ 78,818 |
| Shares issued to shareholders in reinvestment of distributions | 63 | 637 |
| Net increase (decrease) | 8,287 | $ 79,455 |
| (a) | The inception date of the class was September 30, 2021. |
Note 10–Other Matters
As of the date of this report, interest rates in the United States and many parts of the world, including certain European countries, continue to ascend from historically low levels. Thus, the ETF Allocation Funds currently face a heightened level of risk associated with rising interest rates. This could be driven by a variety of factors, including but not limited to central bank monetary policies, changing inflation or real growth rates, general economic conditions, increasing bond issuances or reduced market demand for low yielding investments.
Social, political, economic and other conditions and events, such as war, natural disasters, health emergencies (e.g., epidemics and pandemics), terrorism, conflicts, social unrest, recessions, inflation, rapid interest rate changes and supply chain disruptions, may occur and could significantly impact the ETF Allocation Funds, issuers, industries, governments and other systems, including the financial markets. Developments that disrupt global economies and financial markets, such as COVID-19, the conflict in Ukraine, and the failures of certain U.S. and non-U.S. banks, may magnify factors that affect the ETF Allocation Funds' performance.
Note 11–Subsequent Events
In connection with the preparation of the financial statements of the ETF Allocation Funds as of and for the year ended April 30, 2023, events and transactions subsequent to April 30, 2023, through the date the financial statements were issued have been evaluated by the Manager for possible adjustment and/or disclosure. No subsequent events requiring financial statement adjustment or disclosure have been identified.
| 118 | Mainstay ETF Asset Allocation Funds |
Report of Independent Registered Public Accounting Firm
To the Shareholders of the Funds and Board of Trustees
MainStay Funds Trust:
Opinion on the Financial Statements
We have audited the accompanying statements of assets and liabilities of MainStay Defensive ETF Allocation Fund, MainStay Conservative ETF Allocation Fund, MainStay Moderate ETF Allocation Fund, MainStay Growth ETF Allocation Fund, MainStay Equity ETF Allocation Fund and MainStay ESG Multi-Asset Allocation Fund (the Funds), six of the funds constituting MainStay Funds Trust, including the portfolios of investments, as of April 30, 2023, the related statements of operations for the year then ended, the statements of changes in net assets for each of the years in the two-year period then ended, except for the MainStay ESG Multi-Asset Allocation Fund which is for the year ended April 30, 2023 and the period from September 30, 2021 (commencement of operations) through April 30, 2022, and the related notes (collectively, the financial statements) and the financial highlights for each of the years or periods in the three-year period ended April 30, 2023. In our opinion, the financial statements and financial highlights present fairly, in all material respects, the financial position of the Funds as of April 30, 2023, the results of their operations for the year then ended, the changes in their net assets for each of the years in the two-year period then ended, except for the MainStay ESG Multi-Asset Allocation Fund which is for the year ended April 30, 2023 and the period from September 30, 2021 through April 30, 2022, and the financial highlights for each of the years or periods in the three-year period ended April 30, 2023, in conformity with U.S. generally accepted accounting principles.
Basis for Opinion
These financial statements and financial highlights are the responsibility of the Funds' management. Our responsibility is to express an opinion on these financial statements and financial highlights based on our audits. We are a public accounting firm registered with the Public Company Accounting Oversight Board (United States) (PCAOB) and are required to be independent with respect to the Funds in accordance with the U.S. federal securities laws and the applicable rules and regulations of the Securities and Exchange Commission and the PCAOB.
We conducted our audits in accordance with the standards of the PCAOB. Those standards require that we plan and perform the audit to obtain reasonable assurance about whether the financial statements and financial highlights are free of material misstatement, whether due to error or fraud. Our audits included performing procedures to assess the risks of material misstatement of the financial statements and financial highlights, whether due to error or fraud, and performing procedures that respond to those risks. Such procedures included examining, on a test basis, evidence regarding the amounts and disclosures in the financial statements and financial highlights. Such procedures also included confirmation of securities owned as of April 30, 2023, by correspondence with the custodians, transfer agent, and brokers; when replies were not received from brokers, we performed other auditing procedures. Our audits also included evaluating the accounting principles used and significant estimates made by management, as well as evaluating the overall presentation of the financial statements and financial highlights. We believe that our audits provide a reasonable basis for our opinion.

We have served as the auditor of one or more New York Life Investment Management investment companies since 2003.
Philadelphia, Pennsylvania
June 23, 2023
Board Consideration and Approval of Management Agreement (Unaudited)
The continuation of the Management Agreement with respect to the MainStay Conservative ETF Allocation Fund, MainStay Defensive ETF Allocation Fund, MainStay Equity ETF Allocation Fund, MainStay Growth ETF Allocation Fund, MainStay Moderate ETF Allocation Fund and MainStay ESG Multi-Asset Allocation Fund (“Funds”) and New York Life Investment Management LLC (“New York Life Investments”) is subject to annual review and approval by the Board of Trustees of MainStay Funds Trust (“Board” of the “Trust”) in accordance with Section 15 of the Investment Company Act of 1940, as amended (“1940 Act”). At its December 6–7, 2022 meeting, the Board, which is comprised solely of Trustees who are not an “interested person” (as such term is defined in the 1940 Act) of the Trust (“Independent Trustees”), unanimously approved the continuation of the Management Agreement for a one-year period.
In reaching the decision to approve the continuation of the Management Agreement, the Board considered information and materials furnished by New York Life Investments in connection with an annual contract review process undertaken by the Board that took place at meetings of the Board and its Contracts Committee during October 2022 through December 2022, including information and materials furnished by New York Life Investments in response to requests prepared on behalf of the Board, and in consultation with the Board, by independent legal counsel to the Independent Trustees, which encompassed a variety of topics, including those summarized below. Information and materials requested by and furnished to the Board for consideration in connection with the contract review process included, among other items, reports on each Fund and “peer funds” prepared by Institutional Shareholder Services Inc. (“ISS”), an independent third-party service provider engaged by the Board to report objectively on each Fund’s investment performance, management fee and total expenses. The Board also considered information on the fees charged to other investment advisory clients of New York Life Investments that follow investment strategies similar to those of each Fund, if any, and, when applicable, the rationale for any differences in each Fund’s management fee and the fees charged to those other investment advisory clients. In addition, the Board considered information regarding the legal standards and fiduciary obligations applicable to its consideration of the continuation of the Management Agreement. The contract review process, including the structure and format for information and materials provided to the Board, has been developed in consultation with the Board. The Independent Trustees also met in executive sessions with their independent legal counsel and, for portions thereof, with senior management of New York Life Investments.
The Board’s deliberations with respect to the continuation of the Management Agreement reflect a year-long process, and the Board also took into account information furnished to the Board and its Committees throughout the year, as deemed relevant and appropriate by the Trustees, including, among other items, reports on investment performance of each Fund and investment-related matters for each Fund as well as presentations from New York Life Investments personnel. In addition, the Board took into account other information provided by New York Life Investments throughout the year, including, among other items, periodic
reports on legal and compliance matters, risk management, portfolio turnover, brokerage commissions and non-advisory services provided to each Fund by New York Life Investments, as deemed relevant and appropriate by the Trustees.
In addition to information provided to the Board throughout the year, the Board received information in connection with its June 2022 meeting provided specifically in response to requests prepared on behalf of the Board, and in consultation with the Board, by independent legal counsel to the Independent Trustees regarding each Fund’s distribution arrangements. In addition, the Board received information regarding each Fund’s asset levels, share purchase and redemption activity and the payment of Rule 12b-1 and/or certain other fees by the applicable share classes of each Fund, among other information.
In considering the continuation of the Management Agreement, the Trustees reviewed and evaluated the information and factors they believed to reasonably be necessary and appropriate in light of legal advice furnished to them by independent legal counsel to the Independent Trustees and through the exercise of their own business judgment. Although individual Trustees may have weighed certain factors or information differently and the Board did not consider any single factor or information controlling in reaching its decision, the factors that figured prominently in the Board’s consideration of the continuation of the Management Agreement are summarized in more detail below and include, among other factors: (i) the nature, extent and quality of the services provided to each Fund by New York Life Investments; (ii) the qualifications of the portfolio managers of each Fund and the historical investment performance of each Fund and New York Life Investments; (iii) the costs of the services provided, and profits realized, by New York Life Investments with respect to its relationship with each Fund; (iv) the extent to which economies of scale have been realized or may be realized if each Fund grows and the extent to which any economies of scale have been shared, have benefited or may benefit each Fund’s shareholders; and (v) the reasonableness of each Fund’s management fee and total ordinary operating expenses. Although the Board recognized that comparisons between each Fund’s fees and expenses and those of other funds are imprecise given different terms of agreements, variations in fund strategies and other factors, the Board considered the reasonableness of each Fund’s management fee and total ordinary operating expenses as compared to the peer funds identified by ISS. Throughout their considerations, the Trustees acknowledged the commitment of New York Life Investments and its affiliates to serve the MainStay Group of Funds, as well as their capacity, experience, resources, financial stability and reputations. The Trustees also acknowledged the entrepreneurial and other risks assumed by New York Life Investments in sponsoring and managing each Fund.
The Trustees noted that, throughout the year, the Trustees are afforded an opportunity to ask questions of, and request additional information or materials from, New York Life Investments. The Board’s decision with respect to the Management Agreement may have also been based, in part, on the Board’s knowledge of New York Life Investments resulting from, among other things, the Board’s consideration of the Management
| 120 | Mainstay ETF Asset Allocation Funds |
Agreement in prior years, the advisory agreements for other funds in the MainStay Group of Funds, the Board’s review throughout the year of the performance and operations of other funds in the MainStay Group of Funds and each Trustee’s business judgment and industry experience. In addition to considering the above-referenced factors, the Board observed that in the marketplace there are a range of investment options available to investors and that each Fund’s shareholders, having had the opportunity to consider other investment options, have chosen to invest in the Fund.
The factors that figured prominently in the Board’s decision to approve the continuation of the Management Agreement during its December 6–7, 2022 meeting are summarized in more detail below. The Board considered on a Fund-by-Fund basis the factors and information deemed relevant and appropriate by the Trustees to evaluate the continuation of the Management Agreement, and the Board’s decision was made separately with respect to each Fund.
Nature, Extent and Quality of Services Provided by New York Life Investments
The Board examined the nature, extent and quality of the services that New York Life Investments provides to each Fund. The Board evaluated New York Life Investments’ experience and capabilities in serving as manager of each Fund. The Board noted that New York Life Investments manages other mutual funds, serves a variety of other investment advisory clients, including other pooled investment vehicles, and has experience overseeing mutual fund service providers. The Board considered the experience of senior personnel at New York Life Investments providing management and administrative and other non-advisory services to each Fund. The Board observed that New York Life Investments devotes significant resources and time to providing management and administrative and other non-advisory services to each Fund.
The Board also considered the range of services that New York Life Investments provides to the Funds under the terms of the Management Agreement, including: (i) fund accounting and ongoing supervisory services provided by New York Life Investments’ Fund Administration and Accounting Group; (ii) investment supervisory and analytical services provided by New York Life Investments’ Investment Consulting Group; (iii) compliance services provided by the Trust’s Chief Compliance Officer as well as New York Life Investments’ compliance department, including supervision and implementation of the Funds’ compliance program; (iv) legal services provided by New York Life Investments’ Office of the General Counsel; and (v) risk management monitoring and analysis by compliance and investment personnel. In addition, the Board considered New York Life Investments’ willingness to invest in personnel and other resources, such as cyber security, information security and business continuity planning, designed to benefit the Funds and noted that New York Life Investments is responsible for compensating the Trust’s officers, except for a portion of the salary of the Trust’s Chief Compliance Officer. The Board recognized that New York Life Investments provides certain other non-advisory services to the Funds and has provided an
increasingly broad array of non-advisory services to the MainStay Group of Funds as a result of regulatory and other developments, including in connection with the implementation of the MainStay Group of Funds’ derivatives risk management program and policies and procedures adopted pursuant to Rule 18f-4 under the 1940 Act. The Board considered benefits to each Fund’s shareholders from the Fund being part of the MainStay Group of Funds, including the ability to exchange investments between the same class of shares of funds in the MainStay Group of Funds, including without the imposition of a sales charge (if any).
The Board also examined the range, and the nature, extent and quality, of the investment advisory services that New York Life Investments provides to each Fund and considered the terms of the Management Agreement. The Board evaluated New York Life Investments’ experience and performance in serving as investment adviser to the Funds and advising other portfolios and New York Life Investments’ track record and experience in providing investment advisory services as well as the experience of investment advisory, senior management and administrative personnel at New York Life Investments. The Board considered New York Life Investments’ overall resources, legal and compliance environment, capabilities, reputation, financial condition and history. In addition to information provided in connection with quarterly meetings with the Trust’s Chief Compliance Officer, the Board considered information regarding the compliance policies and procedures of New York Life Investments and acknowledged New York Life Investments’ commitment to further developing and strengthening compliance programs relating to the Funds. The Board also considered New York Life Investments’ ability to recruit and retain qualified investment professionals and willingness to invest in personnel and other resources to service and support the Funds. In this regard, the Board considered the qualifications and experience of each Fund’s portfolio managers, the number of accounts managed by the portfolio managers and the method for compensating the portfolio managers.
Because the Funds invest substantially all their assets in exchange-traded funds (“ETFs”), the Board considered information from New York Life Investments regarding the investment rationale and process for the allocation among and selection of the underlying ETFs in which the Funds invest.
In addition, the Board considered information provided by New York Life Investments regarding the operations of its business continuity plans in response to the COVID-19 pandemic and the continued remote work environment.
Based on these considerations, among others, the Board concluded that each Fund would likely continue to benefit from the nature, extent and quality of these services.
Investment Performance
In evaluating each Fund’s investment performance, the Board considered investment performance results over various periods in light of each Fund’s investment objective, strategies and risks. The Board considered
Board Consideration and Approval of Management Agreement (Unaudited) (continued)
investment reports on, and analysis of, each Fund’s performance provided to the Board throughout the year. These reports include, among other items, information on each Fund’s gross and net returns, each Fund’s investment performance compared to a relevant investment category and each Fund’s benchmarks, each Fund’s risk-adjusted investment performance and each Fund’s investment performance as compared to peer funds, as appropriate, as well as portfolio attribution information and commentary on the effect of market conditions. The Board also considered information provided by ISS showing the investment performance of each Fund as compared to peer funds. In addition, the Board reviewed the methodology used by ISS to construct the group of peer funds for comparative purposes.
The Board also took into account its discussions with senior management at New York Life Investments concerning each Fund’s investment performance over various periods as well as discussions between each Fund’s portfolio management team and the members of the Board’s Investment Committee, which generally occur on an annual basis. In addition, the Board considered any specific actions that New York Life Investments had taken, or had agreed to take, to seek to enhance each Fund’s investment performance and the results of those actions.
Based on these considerations, among others, the Board concluded that its review of each Fund’s investment performance and related information supported a determination to approve the continuation of the Management Agreement.
Costs of the Services Provided, and Profits and Other Benefits Realized, by New York Life Investments
The Board considered the costs of the services provided under the Management Agreement. The Board also considered the profits realized by New York Life Investments and its affiliates due to their relationships with the Funds as well as the MainStay Group of Funds.
With respect to the MainStay ESG Multi-Asset Allocation Fund, the Board considered that the Fund’s investments in underlying funds managed by New York Life Investments or its affiliates indirectly benefit New York Life Investments or its affiliates.
In addition, the Board acknowledged the difficulty in obtaining reliable comparative data about mutual fund managers’ profitability because such information generally is not publicly available and may be impacted by numerous factors, including the structure of a fund manager’s organization, the types of funds it manages, the methodology used to allocate certain fixed costs to specific funds and the manager’s capital structure and costs of capital.
In evaluating the costs of the services provided by New York Life Investments and profits realized by New York Life Investments and its affiliates, the Board considered, among other factors, New York Life Investments’ and its affiliates’ continuing investments in, or willingness to invest in, personnel and other resources to support and further enhance the management of each Fund. The Board also considered the financial resources of New York Life Investments and acknowledged that New York
Life Investments must be in a position to recruit and retain experienced professional personnel and to maintain a strong financial position for New York Life Investments to continue to provide high-quality services to the Funds. The Board recognized that each Fund benefits from the allocation of certain fixed costs among the funds in the MainStay Group of Funds, among other expected benefits resulting from its relationship with New York Life Investments.
The Board considered information regarding New York Life Investments’ methodology for calculating profitability and allocating costs provided by New York Life Investments in connection with the fund profitability analysis presented to the Board. The Board noted it had previously engaged an independent consultant to review the methods used to allocate costs among the funds in the MainStay Group of Funds. The Board also noted that the independent consultant had concluded that New York Life Investments’ methods for allocating costs and procedures for estimating overall profitability of the relationship with the funds in the MainStay Group of Funds are reasonable and that New York Life Investments continued to use the same method of calculating profit and allocating costs since the independent consultant’s review. The Board recognized the difficulty in calculating and evaluating a manager’s profitability with respect to each Fund and considered that other profitability methodologies may also be reasonable.
The Board also considered certain fall-out benefits that may be realized by New York Life Investments and its affiliates due to their relationships with each Fund, including reputational and other indirect benefits. In addition, the Board considered its review of the management agreement for a money market fund advised by New York Life Investments and an affiliated subadvisor that serves as an investment option for the Funds, including the potential rationale for and costs associated with investments in this money market fund by the Funds, if any, and considered information from New York Life Investments that the nature and type of specific investment advisory services provided to this money market fund are distinct from, or in addition to, the investment advisory services provided to the Funds.
The Board observed that, in addition to fees earned by New York Life Investments under the Management Agreement for managing each Fund, New York Life Investments’ affiliates also earn revenues from serving each Fund in various other capacities, including as each Fund’s transfer agent and distributor. The Board considered information about these other revenues and their impact on the profitability of the relationship with each Fund to New York Life Investments and its affiliates. The Board noted that, although it assessed the overall profitability of the relationship with each Fund to New York Life Investments and its affiliates as part of the contract review process, when considering the reasonableness of the fee paid to New York Life Investments under the Management Agreement, the Board considered the profitability of New York Life Investments’ relationship with the Funds on a pre-tax basis and without regard to distribution expenses incurred by New York Life Investments from its own resources.
| 122 | Mainstay ETF Asset Allocation Funds |
After evaluating the information deemed relevant by the Trustees, the Board concluded that any profits realized by New York Life Investments and its affiliates due to their relationships with each Fund were not excessive.
Management Fees and Total Ordinary Operating Expenses
The Board evaluated the reasonableness of the fee paid under the Management Agreement and each Fund’s total ordinary operating expenses.
In assessing the reasonableness of each Fund’s fees and expenses, the Board primarily considered comparative data provided by ISS on the fees and expenses charged by similar mutual funds managed by other investment advisers. The Board reviewed the methodology used by ISS to construct the group of peer funds for comparative purposes. With respect to the MainStay ESG Multi-Asset Allocation Fund, the Board considered New York Life Investments’ process for monitoring and addressing potential conflicts of interest in the selection of underlying funds. In addition, the Board considered information provided by New York Life Investments on fees charged to other investment advisory clients, including institutional separate accounts and/or other funds that follow investment strategies similar to those of each Fund, if any. The Board considered the contractual management fee schedules of each Fund as compared to those of such other investment advisory clients, taking into account the rationale for any differences in fee schedules. The Board also took into account information provided by New York Life Investments about the more extensive scope of services provided to registered investment companies, such as the Funds, as compared with other investment advisory clients. Additionally, the Board considered the impact of voluntary waivers and expense limitation arrangements on each Fund’s net management fee and expenses. The Board also considered that in proposing fees for each Fund, New York Life Investments considers the competitive marketplace for mutual funds.
Because the Funds invest substantially all their assets in ETFs, the Board also considered information provided by New York Life Investments regarding the fees and expenses associated with the Funds’ investments in ETFs.
The Board took into account information from New York Life Investments, as provided in connection with the Board’s June 2022 meeting, regarding the reasonableness of each Fund’s transfer agent fee schedule, including industry data demonstrating that the fees that NYLIM Service Company LLC, an affiliate of New York Life Investments and each Fund’s transfer agent, charges each Fund are within the range of fees charged by transfer agents to other mutual funds. In addition, the Board considered NYLIM Service Company LLC’s profitability in connection with the transfer agent services it provides to the Funds. The Board also took into account information provided by NYLIM Service Company LLC regarding the sub-transfer agency payments it made to intermediaries in connection with the provision of sub-transfer agency services to the Funds.
The Board considered the extent to which transfer agent fees contributed to the total expenses of each Fund. The Board acknowledged the role that the MainStay Group of Funds historically has played in serving the investment needs of New York Life Insurance Company customers, who often maintain smaller account balances than other shareholders of funds, and the impact of small accounts on the expense ratios of Fund share classes. The Board also recognized measures that it and New York Life Investments have taken intended to mitigate the effect of small accounts on the expense ratios of Fund share classes, including through the imposition of an expense limitation on net transfer agency expenses. The Board also considered that NYLIM Service Company LLC had waived its contractual cost of living adjustments during the seven years prior to 2021.
Based on the factors outlined above, among other considerations, the Board concluded that each Fund’s management fee and total ordinary operating expenses are within a range that is competitive and support a conclusion that these fees and expenses are reasonable.
Economies of Scale
The Board considered information regarding economies of scale, including whether economies of scale may exist for each Fund and whether each Fund’s expense structure permits any economies of scale to be appropriately shared with each Fund’s shareholders. The Board also considered a report from New York Life Investments, previously prepared at the request of the Board, that addressed economies of scale, including with respect to the mutual fund business generally, and the various ways in which the benefits of economies of scale may be shared with the funds in the MainStay Group of Funds. Although the Board recognized the difficulty of determining economies of scale with precision, the Board acknowledged that economies of scale may be shared with each Fund in a number of ways, including, for example, through the imposition of fee breakpoints, initially setting management fee rates at scale or making additional investments to enhance the services provided to each Fund. The Board reviewed information from New York Life Investments showing how each Fund’s management fee schedule compared to fee schedules of other funds and accounts managed by New York Life Investments. The Board also reviewed information from ISS showing how each Fund’s management fee schedule compared with fees paid for similar services by peer funds at varying asset levels.
Based on this information, the Board concluded that economies of scale are appropriately shared for the benefit of each Fund’s shareholders through each Fund’s expense structure and other methods to share benefits from economies of scale.
Conclusion
On the basis of the information and factors summarized above, among other information and factors deemed relevant by the Trustees, and the evaluation thereof, the Board unanimously voted to approve the continuation of the Management Agreement.
Discussion of the Operation and Effectiveness of the ETF Allocation Funds' Liquidity Risk Management Program (Unaudited)
In compliance with Rule 22e-4 under the Investment Company Act of 1940, as amended (the “Liquidity Rule”), the ETF Allocation Funds have adopted and implemented a liquidity risk management program (the “Program”), which New York Life Investment Management LLC believes is reasonably designed to assess and manage the ETF Allocation Funds' liquidity risk. The ETF Allocation Funds' liquidity risk is the risk that the ETF Allocation Funds could not meet requests to redeem shares issued by the ETF Allocation Funds without significant dilution of the remaining investors’ interests in the ETF Allocation Funds. The Board of Trustees of MainStay Funds Trust (the "Board") previously approved the designation of New York Life Investment Management LLC as administrator of the Program (the “Administrator”). The Administrator has established a Liquidity Risk Management Committee to assist the Administrator in the implementation and day-to-day administration of the Program and to otherwise support the Administrator in fulfilling its responsibilities under the Program.
At a meeting of the Board held on February 28, 2023, the Administrator provided the Board with a written report addressing the Program’s operation and assessing the adequacy and effectiveness of its implementation for the period from January 1, 2022, through December 31, 2022 (the "Review Period"), as required under the Liquidity Rule. The report noted that the Administrator concluded that (i) the Program operated effectively to assess and manage the ETF Allocation Funds' liquidity risk, (ii) the Program has been and continues to be adequately and effectively implemented to monitor and, as applicable, respond to the ETF Allocation Funds' liquidity developments and (iii) the ETF Allocation Funds' investment strategy continues to be appropriate for an open-end fund. In addition, the report summarized the operation of the Program and the information and factors considered by the Administrator in its assessment of the Program’s implementation, such as the liquidity risk assessment framework and the liquidity classification methodologies, and discussed notable geopolitical, market and other economic events that impacted liquidity risk during the Review Period.
In accordance with the Program, the ETF Allocation Funds' liquidity risk is assessed no less frequently than annually taking into consideration certain factors, as applicable, such as (i) investment strategy and liquidity of portfolio investments, (ii) short-term and long-term cash flow projections, and (iii) holdings of cash and cash equivalents, as well as borrowing arrangements and other funding sources. Certain factors are considered under both normal and reasonably foreseeable stressed conditions.
Each ETF Allocation Fund's portfolio investment is classified into one of four liquidity categories. The classification is based on a determination of the number of days it is reasonably expected to take to convert the investment into cash, or sell or dispose of the investment, in current market conditions without significantly changing the market value of the investment. The Administrator's liquidity classification determinations are made by taking into account the ETF Allocation Funds' reasonably anticipated trade size, various market, trading and investment-specific considerations, as well as market depth, and, in certain cases, third-party vendor data.
The Liquidity Rule requires funds that do not primarily hold assets that are highly liquid investments to adopt a minimum amount of net assets that must be invested in highly liquid investments that are assets (an “HLIM”). In addition, the Liquidity Rule limits a fund's investments in illiquid investments. Specifically, the Liquidity Rule prohibits acquisition of illiquid investments if, immediately after acquisition, doing so would result in a fund holding more than 15% of its net assets in illiquid investments that are assets. The Program includes provisions reasonably designed to determine, periodically review and comply with the HLIM requirement, as applicable, and to comply with the 15% limit on illiquid investments.
There can be no assurance that the Program will achieve its objectives under all circumstances in the future. Please refer to the ETF Allocation Funds' prospectus for more information regarding the ETF Allocation Funds' exposure to liquidity risk and other risks to which it may be subject.
| 124 | Mainstay ETF Asset Allocation Funds |
Federal Income Tax
Information (Unaudited)
The ETF Allocation Funds are required under the Internal Revenue Code to advise shareholders in a written statement as to the federal tax status of dividends paid by the ETF Allocation Funds during such fiscal years.
Accordingly, the ETF Allocation Funds paid the following as long term capital gain distributions.
| MainStay Defensive ETF Allocation Fund | $ 70,089 |
| MainStay Conservative ETF Allocation Fund | 114,316 |
| MainStay Moderate ETF Allocation Fund | 172,797 |
| MainStay Growth ETF Allocation Fund | 17,176 |
| MainStay Equity ETF Allocation Fund | 5,043 |
| MainStay ESG Multi-Asset Allocation Fund | 0 |
For the fiscal period ended April 30, 2023, the ETF Allocation Funds designated approximately the following amounts under the Internal Revenue Code as qualified dividend income eligible for reduced tax rates.
| | QDI$ |
| MainStay Defensive ETF Allocation Fund | $ 29,670 |
| MainStay Conservative ETF Allocation Fund | 188,525 |
| MainStay Moderate ETF Allocation Fund | 405,869 |
| MainStay Growth ETF Allocation Fund | 580,888 |
| MainStay Equity ETF Allocation Fund | 470,068 |
| MainStay ESG Multi-Asset Allocation Fund | 56,664 |
The dividends paid by the following ETF Allocation Funds during the fiscal period ended April 30, 2023 which are not designated as capital gain distributions should be multiplied by the following percentages to arrive at the amount eligible for the corporate dividend received deduction.
| | DRD% |
| MainStay Defensive ETF Allocation Fund | 4.21% |
| MainStay Conservative ETF Allocation Fund | 5.79% |
| MainStay Moderate ETF Allocation Fund | 7.79% |
| MainStay Growth ETF Allocation Fund | 14.42% |
| MainStay Equity ETF Allocation Fund | 24.36% |
| MainStay ESG Multi-Asset Allocation Fund | 23.37% |
In February 2024, shareholders will receive an IRS Form 1099-DIV or substitute Form 1099, which will show the federal tax status of the distributions received by shareholders in calendar year 2023. The amounts that will be reported on such 1099-DIV or substitute Form 1099 will be the amounts you are to use on your federal income tax return and will differ from the amounts which we must report for the ETF Allocation Funds' fiscal period ended April 30, 2023.
Proxy Voting Policies and Procedures and Proxy Voting Record
Each ETF Allocation Fund is required to file with the SEC its proxy voting record for the 12-month period ending June 30 on Form N-PX. A description of the policies and procedures that are used to vote proxies relating to portfolio securities of each ETF Allocation Fund is available free of charge upon request by calling 800-624-6782 or visiting the SEC’s website at www.sec.gov. The most recent Form N-PX or proxy voting record is available free of charge upon request by calling 800-624-6782; visiting newyorklifeinvestments.com; or visiting the SEC’s website at www.sec.gov.
Shareholder Reports and Quarterly Portfolio Disclosure
Each ETF Allocation Fund is required to file its complete schedule of portfolio holdings with the SEC 60 days after its first and third fiscal quarter on Form N-PORT. The ETF Allocation Funds' holdings report is available free of charge upon request by calling New York Life Investments at 800-624-6782.
Board of Trustees and Officers (Unaudited)
The Trustees and officers of the Fund are listed below. The Board oversees the MainStay Group of Funds (which consists of MainStay Funds and MainStay Funds Trust), MainStay VP Funds Trust, MainStay MacKay DefinedTerm Municipal Opportunities Fund, MainStay CBRE Global Infrastructure Megatrends Fund, the Manager and the Subadvisors, and elects the officers of the Funds who are responsible for the day-to-day operations of the Fund. Information pertaining to the Trustees and officers is set forth below. Each Trustee serves until his or her successor is elected and qualified or until his or her resignation, death or removal.
Under the Board’s retirement policy, unless an exception is made, a Trustee must tender his or her resignation by the end of the calendar year during which he or she reaches the age of 75. Officers are elected annually by the Board. The business address of each Trustee and officer listed below is 51 Madison Avenue, New York, New York 10010. A majority of the Trustees are not “interested persons” (as defined by the 1940 Act and rules adopted by the SEC thereunder) of the Fund (“Independent Trustees”).
| | Name and
Year of Birth | Term of Office,
Position(s) Held and
Length of Service | Principal Occupation(s)
During Past Five Years | Number of
Portfolios in
Fund Complex
Overseen by
Trustee | Other Directorships
Held by Trustee |
| | | | | | |
| | Naïm Abou-Jaoudé*
1966 | MainStay Funds: Trustee
since June 2023;
MainStay Funds Trust:
Trustee since June 2023 | Chief Executive Officer of New York Life Investment Management LLC since 2023. Previously, Abou-Jaoudé was the Chief Executive Officer of Candriam (an affiliate of New York Life Investment Management LLC) from 2007 to 2023. | 79 | MainStay VP Funds Trust:
Trustee since June 2023 (31 portfolios);
MainStay MacKay DefinedTerm Municipal Opportunities Fund: Trustee
since June 2023;
MainStay CBRE Global Infrastructure Megatrends Fund: Trustee
since June 2023; and
New York Life Investment Management International: Chair since 2015 |
| * | This Trustee is considered to be an “interested person” of the MainStay Group of Funds, MainStay VP Funds Trust, MainStay CBRE Global Infrastructure Megatrends Fund and MainStay MacKay DefinedTerm Municipal Opportunities Fund, within the meaning of the 1940 Act because of his affiliation with New York Life Insurance Company, New York Life Investment Management LLC, Candriam, IndexIQ Advisors LLC, MacKay Shields LLC, NYL Investors LLC, NYLIFE Securities LLC and/or NYLIFE Distributors LLC, as described in detail above in the column entitled “Principal Occupation(s) During Past Five Years.” |
| | |
| 126 | Mainstay ETF Asset Allocation Funds |
| | Name and
Year of Birth | Term of Office,
Position(s) Held and
Length of Service | Principal Occupation(s)
During Past Five Years | Number of
Portfolios in
Fund Complex
Overseen by
Trustee | Other Directorships
Held by Trustee |
| | | | | | |
| | David H. Chow
1957 | MainStay Funds: Trustee since January 2016, Advisory Board Member (June 2015 to December 2015);MainStay Funds Trust:
Trustee since January 2016, Advisory Board Member (June 2015 to December 2015) | Founder and CEO, DanCourt Management, LLC (since 1999) | 79 | MainStay VP Funds Trust: Trustee since January 2016, Advisory Board Member (June 2015 to December 2015) (31 portfolios);
MainStay MacKay DefinedTerm Municipal Opportunities Fund: Trustee since January 2016, Advisory Board Member (June 2015 to December 2015);
MainStay CBRE Global Infrastructure Megatrends Fund: Trustee since June 2021; VanEck Vectors Group of Exchange-Traded Funds: Trustee since 2006 and Independent Chairman of the Board of Trustees from 2008 to 2022 (57 portfolios); Berea College of Kentucky: Trustee since 2009, Chair of the Investment Committee since 2018 |
| | Karen Hammond
1956 | MainStay Funds: Trustee since December 2021, Advisory Board Member (June 2021 to December 2021);MainStay Funds Trust:
Trustee since December 2021, Advisory Board Member (June 2021 to December 2021)
| Retired, Managing Director, Devonshire Investors (2007 to 2013); Senior Vice President, Fidelity Management & Research Co. (2005 to 2007); Senior Vice President and Corporate Treasurer, FMR Corp. (2003 to 2005); Chief Operating Officer, Fidelity Investments Japan (2001 to 2003) | 79 | MainStay VP Funds Trust: Trustee since December 2021, Advisory Board Member (June 2021 to December 2021) (31 portfolios);
MainStay MacKay DefinedTerm Municipal Opportunities Fund: Trustee since December 2021, Advisory Board Member (June 2021 to December 2021);
MainStay CBRE Global Infrastructure Megatrends Fund: Trustee since December 2021, Advisory Board Member (June 2021 to December 2021);
Two Harbors Investment Corp.: Director since 2018;
Rhode Island State Investment Commission: Member since 2017; and
Blue Cross Blue Shield of Rhode Island: Director since 2019 |
| | Susan B. Kerley
1951 | MainStay Funds: Chairman since January 2017 and Trustee since 2007;MainStay Funds Trust:
Chairman since January 2017 and Trustee since 1990** | President, Strategic Management Advisors LLC (since 1990) | 79 | MainStay VP Funds Trust: Chairman since January 2017 and Trustee since 2007 (31 portfolios)*;
MainStay MacKay DefinedTerm Municipal Opportunities Fund: Chairman since January 2017 and Trustee since 2011;
MainStay CBRE Global Infrastructure Megatrends Fund: Trustee since June 2021; and Legg Mason Partners Funds: Trustee since 1991 (45 portfolios) |
| | Alan R. Latshaw
1951 | MainStay Funds: Trusteesince 2006;MainStay Funds Trust:
Trustee since 2007** | Retired; Partner, Ernst & Young LLP (2002 to 2003); Partner, Arthur Andersen LLP (1989 to 2002); Consultant to the MainStay Funds Audit and Compliance Committee (2004 to 2006) | 79 | MainStay VP Funds Trust: Trustee since 2007 (31 portfolios)*;
MainStay MacKay DefinedTerm Municipal Opportunities Fund: Trustee since 2011; and
MainStay CBRE Global Infrastructure Megatrends Fund: Trustee since June 2021 |
Board of Trustees and Officers (Unaudited) (continued)
| | Name and
Year of Birth | Term of Office,
Position(s) Held and
Length of Service | Principal Occupation(s)
During Past Five Years | Number of
Portfolios in
Fund Complex
Overseen by
Trustee | Other Directorships
Held by Trustee |
| | | | | | |
| | Jacques P. Perold
1958 | MainStay Funds: Trustee since January 2016, Advisory Board Member (June 2015to December 2015);MainStay Funds Trust:
Trustee since January 2016, Advisory Board Member (June 2015 to December 2015) | Founder and Chief Executive Officer, CapShift Advisors LLC (since 2018); President, Fidelity Management & Research Company (2009 to 2014); President and Chief Investment Officer, Geode Capital Management, LLC (2001 to 2009) | 79 | MainStay VP Funds Trust: Trustee since January 2016, Advisory Board Member (June 2015 to December 2015) (31 portfolios);
MainStay MacKay DefinedTerm Municipal Opportunities Fund: Trustee since January 2016, Advisory Board Member (June 2015 to December 2015);
MainStay CBRE Global Infrastructure Megatrends Fund: Trustee since June 2021; Allstate Corporation: Director since 2015; and MSCI Inc.: Director since 2017 |
| | Richard S. Trutanic
1952 | MainStay Funds: Trustee since 1994;MainStay Funds Trust:
Trustee since 2007** | Chairman and Chief Executive Officer, Somerset & Company (financial advisory firm) (since 2004); Managing Director, The Carlyle Group (private investment firm) (2002 to 2004); Senior Managing Director, Partner and Board Member, Groupe Arnault S.A. (private investment firm) (1999 to 2002) | 79 | MainStay VP Funds Trust: Trustee since 2007 (31 portfolios)*;
MainStay MacKay DefinedTerm Municipal Opportunities Fund: Trustee since 2011; and MainStay CBRE Global Infrastructure Megatrends Fund: Trustee since June 2021 |
| * | Includes prior service as a Director of MainStay VP Series Fund, Inc., the predecessor to MainStay VP Funds Trust. |
| ** | Includes prior service as a Director/Trustee of certain predecessor entities to MainStay Funds Trust. |
| 128 | Mainstay ETF Asset Allocation Funds |
| | Name and
Year of Birth | Position(s) Held and
Length of Service | Principal Occupation(s)
During Past Five Years | |
| | | | | |
| | Kirk C. Lehneis
1974 | President, MainStay Funds, MainStay Funds Trust (since 2017) | Chief Operating Officer and Senior Managing Director (since 2016), New York Life Investment Management LLC and New York Life Investment Management Holdings LLC; Member of the Board of Managers (since 2017) and Senior Managing Director (since 2018), NYLIFE Distributors LLC; Chairman of the Board and Senior Managing Director, NYLIM Service Company LLC (since 2017); Trustee, President and Principal Executive Officer of IndexIQ Trust, IndexIQ ETF Trust and IndexIQ Active ETF Trust (since January 2018); President, MainStay CBRE Global Infrastructure Megatrends Fund (since 2021), MainStay MacKay DefinedTerm Municipal Opportunities Fund and MainStay VP Funds Trust (since 2017); Senior Managing Director, Global Product Development (2015-2016); Managing Director, Product Development (2010 to 2015), New York Life Investment Management LLC | |
| | Jack R. Benintende
1964 | Treasurer and Principal Financial and Accounting Officer, MainStay Funds (since 2007), MainStay Funds Trust (since 2009) | Managing Director, New York Life Investment Management LLC (since 2007); Treasurer and Principal Financial and Accounting Officer, MainStay CBRE Global Infrastructure Megatrends Fund (since 2021), MainStay MacKay DefinedTerm Municipal Opportunities Fund (since 2011) and MainStay VP Funds Trust (since 2007)**; and Assistant Treasurer, New York Life Investment Management Holdings LLC (2008 to 2012) | |
| | J. Kevin Gao
1967 | Secretary and Chief Legal Officer, MainStay Funds and MainStay Funds Trust (since 2010) | Managing Director and Associate General Counsel, New York Life Investment Management LLC (since 2010); Secretary and Chief Legal Officer, MainStay CBRE Global Infrastructure Megatrends Fund (since 2021), MainStay MacKay DefinedTerm Municipal Opportunities Fund (since 2011) and MainStay VP Funds Trust (since 2010)** | |
| | Scott T. Harrington
1959 | Vice President— Administration, MainStay Funds (since 2005), MainStay Funds Trust (since 2009) | Managing Director, New York Life Investment Management LLC (including predecessor advisory organizations) (since 2000); Member of the Board of Directors, New York Life Trust Company (since 2009); Vice President—Administration, MainStay CBRE Global Infrastructure Megatrends Fund (since 2021), MainStay MacKay DefinedTerm Municipal Opportunities Fund (since 2011) and MainStay VP Funds Trust (since 2005)** | |
| | Kevin M. Gleason
1967 | Vice President and Chief Compliance Officer, MainStay Funds and MainStay Funds Trust (since June 2022) | Vice President and Chief Compliance Officer, IndexIQ Trust, IndexIQ ETF Trust and Index IQ Active ETF Trust (since June 2022); Vice President and Chief Compliance Officer, MainStay CBRE Global Infrastructure Megatrends Fund, MainStay VP Funds Trust and MainStay MacKay DefinedTerm Municipal Opportunities Fund (since June 2022); Senior Vice President, Voya Investment Management and Chief Compliance Officer, Voya Family of Funds (2012-2022) | |
| * | The officers listed above are considered to be “interested persons” of the MainStay Group of Funds, MainStay VP Funds Trust, MainStay CBRE Global Infrastructure Megatrends Fund and MainStay MacKay DefinedTerm Municipal Opportunities Fund within the meaning of the 1940 Act because of their affiliation with the MainStay Group of Funds, New York Life Insurance Company and/or its affiliates, including New York Life Investment Management LLC, New York Life Insurance Company, NYLIM Service Company LLC, NYLIFE Securities LLC and/or NYLIFE Distributors LLC, as described in detail in the column captioned “Principal Occupation(s) During Past Five Years.” Officers are elected annually by the Board. |
| ** | Includes prior service as an Officer of MainStay VP Series Fund, Inc., the predecessor to MainStay VP Funds Trust. |
Officers of the Trust (Who are not Trustees)*
This page intentionally left blank.
Equity
U.S. Equity
MainStay Epoch U.S. Equity Yield Fund
MainStay Fiera SMID Growth Fund
MainStay S&P 500 Index Fund
MainStay Winslow Large Cap Growth Fund
MainStay WMC Enduring Capital Fund
MainStay WMC Growth Fund
MainStay WMC Small Companies Fund
MainStay WMC Value Fund
International Equity
MainStay Epoch International Choice Fund
MainStay MacKay International Equity Fund
MainStay WMC International Research Equity Fund
Emerging Markets Equity
MainStay Candriam Emerging Markets Equity Fund
Global Equity
MainStay Epoch Capital Growth Fund
MainStay Epoch Global Equity Yield Fund
Fixed Income
Taxable Income
MainStay Candriam Emerging Markets Debt Fund
MainStay Floating Rate Fund
MainStay MacKay High Yield Corporate Bond Fund
MainStay MacKay Short Duration High Yield Fund
MainStay MacKay Strategic Bond Fund
MainStay MacKay Total Return Bond Fund
MainStay MacKay U.S. Infrastructure Bond Fund
MainStay Short Term Bond Fund
Tax-Exempt Income
MainStay MacKay California Tax Free Opportunities Fund1
MainStay MacKay High Yield Municipal Bond Fund
MainStay MacKay New York Tax Free Opportunities Fund2
MainStay MacKay Short Term Municipal Fund
MainStay MacKay Strategic Municipal Allocation Fund
MainStay MacKay Tax Free Bond Fund
Money Market
MainStay Money Market Fund
Mixed Asset
MainStay Balanced Fund
MainStay Income Builder Fund
MainStay MacKay Convertible Fund
Speciality
MainStay CBRE Global Infrastructure Fund
MainStay CBRE Real Estate Fund
MainStay Cushing MLP Premier Fund
Asset Allocation
MainStay Conservative Allocation Fund
MainStay Conservative ETF Allocation Fund
MainStay Defensive ETF Allocation Fund
MainStay Equity Allocation Fund
MainStay Equity ETF Allocation Fund
MainStay ESG Multi-Asset Allocation Fund
MainStay Growth Allocation Fund
MainStay Growth ETF Allocation Fund
MainStay Moderate Allocation Fund
MainStay Moderate ETF Allocation Fund
Manager
New York Life Investment Management LLC
New York, New York
Subadvisors
Candriam3
Strassen, Luxembourg
CBRE Investment Management Listed Real Assets LLC
Radnor, Pennsylvania
Cushing Asset Management, LP
Dallas, Texas
Epoch Investment Partners, Inc.
New York, New York
Fiera Capital Inc.
New York, New York
IndexIQ Advisors LLC3
New York, New York
MacKay Shields LLC3
New York, New York
NYL Investors LLC3
New York, New York
Wellington Management Company LLP
Boston, Massachusetts
Winslow Capital Management, LLC
Minneapolis, Minnesota
Legal Counsel
Dechert LLP
Washington, District of Columbia
Independent Registered Public Accounting Firm
KPMG LLP
Philadelphia, Pennsylvania
Distributor
NYLIFE Distributors LLC3
Jersey City, New Jersey
Custodian
JPMorgan Chase Bank, N.A.
New York, New York
1.
This Fund is registered for sale in AZ, CA, NV, OR, TX, UT, WA and MI (Class A and Class I shares only), and CO, FL, GA, HI, ID, MA, MD, NH, NJ and NY (Class I shares only).
| 2. | This Fund is registered for sale in CA, CT, DE, FL, MA, NJ, NY and VT. |
| 3. | An affiliate of New York Life Investment Management LLC. |
Not part of the Annual Report
For more information
800-624-6782
newyorklifeinvestments.com
“New York Life Investments” is both a service mark, and the common trade name, of certain investment advisors affiliated with New York Life Insurance Company. The MainStay Funds® are managed by New York Life Investment Management LLC and distributed by NYLIFE Distributors LLC, 30 Hudson Street, Jersey City, NJ 07302, a wholly owned subsidiary of New York Life Insurance Company. NYLIFE Distributors LLC is a Member FINRA/SIPC.
©2023 NYLIFE Distributors LLC. All rights reserved.
| 5022157MS043-23 | MSAAETF11-06/23 |
(NYLIM) NL486
Item 2. Code of Ethics.
As of the end of the period covered by this report, the Registrant has adopted a code of ethics (the “Code”) that applies to the Registrant’s principal executive officer (“PEO”) and principal financial officer (“PFO”). During the period covered by this report, no amendments were made to the provisions of the Code. The Registrant did not grant any waivers, including implicit waivers, from any provisions of the Code to the PEO or PFO during the period covered by this report. A copy of the Code is filed herewith.
| Item 3. | Audit Committee Financial Expert. |
The Board of Trustees has determined that the Registrant has “three audit committee financial experts” (as defined by Item 3 of Form N-CSR) serving on its Audit Committee. The Audit Committee financial experts are Alan R. Latshaw, Karen Hammond and Susan B. Kerley. Mr. Latshaw, Ms. Hammond and Ms. Kerley are “independent” as defined by Item 3 of Form N-CSR.
| Item 4. | Principal Accountant Fees and Services. |
(a) Audit Fees
The aggregate fees billed for the fiscal year ended April 30, 2023 for professional services rendered by KPMG LLP (“KPMG”) for the audit of the Registrant’s annual financial statements or services that are normally provided by KPMG in connection with statutory and regulatory filings or engagements for that fiscal year were $405,200.
The aggregate fees billed for the fiscal year ended April 30, 2022 for professional services rendered by KPMG LLP (“KPMG”) for the audit of the Registrant’s annual financial statements or services that are normally provided by KPMG in connection with statutory and regulatory filings or engagements for that fiscal year were $370,400.
(b) Audit-Related Fees
The aggregate fees billed for assurance and related services by KPMG that are reasonably related to the performance of the audit of the Registrant’s financial statements and are not reported under paragraph (a) of this Item were (i) $0 for the fiscal year ended April 30, 2023; and (ii) $0 for the fiscal year ended April 30, 2022.
(c) Tax Fees
The aggregate fees billed for professional services rendered by KPMG for tax compliance, tax advice, and tax planning were (i) $0 during the fiscal year ended April 30, 2023; and (ii) $0 during the fiscal year ended April 30, 2022. These services primarily included preparation of federal, state and local income tax returns and excise tax returns, as well as services relating to excise tax distribution requirements.
(d) All Other Fees
The aggregate fees billed for products and services provided by KPMG, other than the services reported in paragraphs (a) through (c) of this Item were (i) $0 during the fiscal year ended April 30, 2023; and (ii) $0 during the fiscal year ended April 30, 2022.
(e) Pre-Approval Policies and Procedures
| | (1) | The Registrant’s Audit Committee has adopted pre-approval policies and procedures (the “Procedures”) to govern the Committee’s pre-approval of (i) all audit services and permissible non-audit services to be provided to the Registrant by its independent accountant, and (ii) all permissible non-audit services to be provided by such independent accountant to the Registrant’s investment adviser and to any entity controlling, controlled by or under common control with the investment adviser that provides ongoing services to the Registrant (collectively, the “Service Affiliates”) if the services directly relate to the Registrant’s operations and financial reporting. In accordance with the Procedures, the Audit Committee is responsible for the engagement of the independent accountant to certify the Registrant’s financial statements for each fiscal year. With respect to the pre-approval of non-audit services provided to the Registrant and its Service Affiliates, the Procedures provide that the Audit Committee may annually pre-approve a list of the types of services that may be provided to the Registrant or its Service Affiliates, or the Audit Committee may pre-approve such services on a project-by-project basis as they arise. Unless a type of service has received general pre-approval, it will require specific pre-approval by the Audit Committee if it is to be provided by the independent accountant. The Procedures also permit the Audit Committee to delegate authority to one or more of its members to pre-approve any proposed non-audit services that have not been previously pre-approved by the Audit Committee, subject to the ratification by the full Audit Committee no later than its next scheduled meeting. To date, the Audit Committee has not delegated such authority. |
| | (2) | With respect to the services described in paragraphs (b) through (d) of this Item 4, no amount was approved by the Audit Committee pursuant to paragraph (c)(7)(i)(C) of Rule 2-01 of Regulation S-X. |
(f) There were no hours expended on KPMG’s engagement to audit the Registrant’s financial statements for the most recent fiscal year was attributable to work performed by persons other than KPMG’s full-time, permanent employees.
(g) All non-audit fees billed by KPMG for services rendered to the Registrant for the fiscal years ended April 30, 2023 and April 30, 2022 are disclosed in 4(b)-(d) above.
The aggregate non-audit fees billed by KPMG for services rendered to the Registrant’s investment adviser (not including any sub-adviser whose role is primarily portfolio management and is subcontracted with or overseen by another investment adviser), and any entity controlling, controlled by, or under common control with the adviser that provides ongoing services to the Registrant were approximately (i) $369,972 for the fiscal year ended April 30, 2023; and (ii) $32,255 for the fiscal year ended April 30, 2022.
(h) The Registrant’s Audit Committee has determined that the non-audit services rendered by KPMG for the fiscal year ended April 30, 2023 to the Registrant’s investment adviser and any entity controlling, controlled by, or under common control with the Registrant’s investment adviser that provides ongoing services to the Registrant that were not required to be pre-approved by the Audit Committee because they did not relate directly to the operations and financial reporting of the registrant were compatible with maintaining the respective independence of KPMG during the relevant time period.
| Item 5. | Audit Committee of Listed Registrants. |
Not applicable.
The Schedule of Investments is included as part of Item 1 of this report.
| Item 7. | Disclosure of Proxy Voting Policies and Procedures for Closed-End Management Investment Companies. |
Not applicable.
| Item 8. | Portfolio Managers of Closed-End Management Investment Companies. |
Not applicable.
| Item 9. | Purchases of Equity Securities by Closed-End Management Investment Company and Affiliated Purchasers. |
Not applicable.
| Item 10. | Submission of Matters to a Vote of Security Holders. |
Since the Registrant’s last response to this Item, there have been no material changes to the procedures by which shareholders may recommend nominees to the Registrant’s Board of Trustees.
| Item 11. | Controls and Procedures. |
(a) Based on an evaluation of the Registrant’s Disclosure Controls and Procedures (as defined in Rule 30a-3(c) under the Investment Company Act of 1940) (the “Disclosure Controls”), as of a date within 90 days prior to the filing date (the “Filing Date”) of this Form N-CSR (the “Report”), the Registrant’s principal executive officer and principal financial officer have concluded that the Disclosure Controls are reasonably designed to ensure that information required to be disclosed by the Registrant in the Report is recorded, processed, summarized and reported by the Filing Date, including ensuring that information required to be disclosed in the Report is accumulated and communicated to the Registrant’s management, including the Registrant’s principal executive officer and principal financial officer, as appropriate to allow timely decisions regarding required disclosure.
(b) There were no changes in the Registrant’s internal control over financial reporting (as defined in Rule 30a-3(d)) under the Investment Company Act of 1940 that occurred during the period covered by this report that has materially affected, or is reasonably likely to materially affect, the Registrant’s internal control over financial reporting.
| Item 12. | Disclosure of Securities Lending Activities for Closed-End Management Investment Companies. |
Not applicable.
SIGNATURES
Pursuant to the requirements of the Securities Exchange Act of 1934 and the Investment Company Act of 1940, the Registrant has duly caused this Report to be signed on its behalf by the undersigned, thereunto duly authorized.
MAINSTAY FUNDS TRUST
| | |
| By: | | /s/ Kirk C. Lehneis |
| | Kirk C. Lehneis President and Principal Executive Officer |
| |
| Date: | | July 6, 2023 |
Pursuant to the requirements of the Securities Exchange Act of 1934 and the Investment Company Act of 1940, this Report has been signed below by the following persons on behalf of the Registrant and in the capacities and on the dates indicated.
| | |
| By: | | /s/ Kirk C. Lehneis |
| | Kirk C. Lehneis President and Principal Executive Officer |
| |
| Date: | | July 6, 2023 |
| |
| By: | | /s/ Jack Benintende |
| | Jack R. Benintende Treasurer and Principal Financial and Accounting Officer |
| |
| Date: | | July 6, 2023 |


